Embed Size (px)
Citation preview

DOI 101111j1472-4642200700379x copy 2007 The Authors
608
Journal compilation copy 2007 Blackwell Publishing Ltd wwwblackwellpublishingcomddi
Diversity and Distributions (Diversity Distrib)
(2007)
13
608ndash619
BIODIVERSITYRESEARCH
ABSTRACT
South Africarsquos first national assessment of spatial priorities for biodiversity conservationreleased in 2005 aimed to identify conservation priority areas for mainstreaminginto all sectors at national and provincial scales This National Spatial BiodiversityAssessment (NSBA) was based on a planning for implementation approach in orderto deliver defensible products useful to decision-makers The NSBA aimed toproduce a map of broad-scale priority areas for future finer-scale assessment andconservation action This map summarized information on species ecosystemsecological processes and the pressures they face from human activities Owing to thecomplexity of the priority area map two additional user-friendly products mdash mapsof ecosystem status and protection levels mdash were developed These productsrepresented the habitat loss and protected area coverage of South Africarsquos ecosystemsrelative to their conservation targets A year after release we reflect on the NSBAprocess products and uptake by implementing agencies (with a specific focus on theterrestrial biodiversity assessment) in order to contribute to the growing body ofdocumented best practice in conservation planning The ecosystem status producthas been widely used at national and provincial scales due in large to its clear andcompelling message The protection level and overall priority map have alsowitnessed uptake the former in guiding the expansion of protected areas and thelatter as an integrated map of national biodiversity status The strong collaborationof local planners and implementers with in-depth experience of biodiversity assess-ment using a systematic approach and focusing on communicating a few high levelmessages appears to have contributed to the initial successful uptake of the NSBAWe conclude with a call to address data and monitoring shortcomings before thenext NSBA in 2010
Keywords
National Spatial Biodiversity Assessment conservation planning mainstreaming
implementation
INTRODUCTION
The development of a National Biodiversity Strategy and Action
Plan (NBSAP) forms part of the obligations of signatories to the
Convention on Biological Diversity (CBD) (United Nations
1992 Article 6 Glowka
et al
1994) This should provide an
overarching framework for the conservation and sustainable use
of national biodiversity and equitable sharing of benefits from
the use of genetic resources In order to inform and provide a
spatial focus for the NBSAP the South African National
Biodiversity Institute led a comprehensive spatial assessment of
biodiversity termed the National Spatial Biodiversity Assessment
(NSBA Driver
et al
2005) The NSBA is South Africarsquos first
national assessment of spatial priorities for conservation action
in terrestrial (this study) river (Nel
et al
2007) estuarine
(Driver
et al
2005) and marine (Lombard
et al
2004) eco-
systems A national biodiversity assessment is intended to be broad
and will not identify specific sites (eg properties) requiring
conservation action nor will it yield information about how to
manage these landscape features Instead it provides a national
overview of the status of biodiversity and points to broad spatial
priority areas where further finer-scale assessment planning and
action are warranted A major challenge for the NSBA is the
mainstreaming of these broad priority areas into the activities
1
CSIR Natural Resources and the Environment
PO Box 320 Stellenbosch 7599 South Africa
2
South African National Biodiversity Institute
Private Bag X101 Pretoria 0001 South Africa
3
Department of Botany Nelson Mandela
Metropolitan University PO Box 77000 Port
Elizabeth 6031 South Africa
4
Leslie Hill
Institute for Plant Conservation University of
Cape Town Private Bag 7701 Cape Town
South Africa
Correspondence B Reyers CSIR Natural Resources and the Environment PO Box 320 Stellenbosch 7599 South Africa E-mail breyerscsircoza
Blackwell Publishing Ltd
Developing products for conservation decision-making lessons from a spatial biodiversity assessment for South Africa
B Reyers
1
M Rouget
2
Z Jonas
2
R M Cowling
3
A Driver
2
K Maze
2
and
P Desmet
4
Products for conservation decisions
copy 2007 The Authors
Diversity and Distributions
13
608ndash619 Journal compilation copy 2007 Blackwell Publishing Ltd
609
plans and policies of a wide range of national and provincial
decision-makers (Pierce
et al
2002)
Conducting and mainstreaming such assessments present
the dual challenges of performing an integrated rigorous and
comprehensive spatial assessment of biodiversity that produces
defensible outputs (Margules amp Pressey 2000 Rodrigues
et al
2000 Noss 2003) while at the same time ensuring that products
are user-useful user-friendly (Driver
et al
2003) and compelling
to their broad target audience of high level government officials
from a variety of sectors including agriculture conservation
water forestry and land-use planning (Theobald
et al
2000
Salafsky
et al
2002 Pierce
et al
2005) The principles tools and
techniques of the field of conservation planning hold much
potential for meeting these dual challenges and were the
approach adopted by the NSBA This field has evolved through
several phases in the last few decades from historic
ad hoc
approaches through scoring techniques to systematic methods
that focus on the representation and persistence of biodiversity
and more recently to conservation assessments and strategies
geared for implementation (Margules amp Pressey 2000
Pierce
et al
2005 Wilson
et al
2005 Knight
et al
2006a) The
last-mentioned approach focuses on techniques that operation-
alize and implement the outputs of conservation assessments
We follow Knight
et al
(2006b) in distinguishing between a
conservation assessment that involves identifying spatial priorities
for conservation action (ie area selection) and a conservation
plan that is an assessment complemented with an implementation
strategy
Very little documented information on the effective use of
these conservation
planning
techniques exists in the peer-
reviewed literature however this is slowly changing (Prendergast
et al
1999 Theobald
et al
2000 Salafsky
et al
2002 Noss
2003 Knight
et al
2006b) Based on current best practice key
ingredients of planning for implementation have been suggested
these include following a systematic approach conducting a
needs assessment with relevant stakeholders and implementers
identifying assessment goals paying attention to project design
and interpreting and mainstreaming results (Knight
et al
2006b) The documentation of experiences and key ingredients is
essential for the advancement of conservation planning
(Prendergast
et al
1999 Pullin amp Knight 2001 Sutherland
et al
2004 Ferraro amp Pattanayak 2006 Knight
et al
2006b) This
paper therefore aims to contribute to this need through describing
and evaluating the outputs generated by a national-scale assessment
of terrestrial biodiversity that aimed to produce defensible yet
usable products By so doing we hope that it will prove useful
for studies aimed at delivering defensible user-useful and
user-friendly products to ensure effective mainstreaming and
implementation of conservation actions at national scales
METHODS AND RESULTS
Study area
The area included in the terrestrial component of the NSBA
included the nations of South Africa Lesotho and Swaziland an
area of approximately 126 million ha South Africa contains a
wealth of biodiversity within its borders unequalled by other
temperate regions is home to three of the worldrsquos 34 global
biodiversity hotspots (Mittermeier
et al
2005) and includes a
total of seven biomes (Fig 1) The countryrsquos human population is
expanding at a moderate rate (106 2005ndash06 wwwstatssagovza)
and approximately 80 of the country is covered with natural
or semi-natural vegetation (Fairbanks
et al
2000 Reyers
et al
2001) Habitat degradation is estimated to be significant and
expanding (Scholes amp Biggs 2004) however data that provide
an accurate estimate of the extent of degradation are currently
not available Although South Africarsquos responsibility to global
biodiversity conservation is significant current efforts aimed
at strict conservation are largely inadequate less than 6 of the
land is under formally recognized and legally entrenched conserva-
tion management (Scholes amp Biggs 2004) Existing conservation
areas are largely biased towards land with a low production
potential or a high tourism value and are therefore not adequately
representative of the countryrsquos biodiversity (Freitag
et al
1998
Reyers
et al
2001 Rouget
et al
2003b)
Planning for implementation
The NSBA was based on the recommendations of Knight
et al
(2006a) for undertaking conservation assessments that fit within
a
planning for implementation
approach Following these recom-
mendations the NSBA comprised the following components
described below
1
The involvement of key implementing agencies in the
planning process
2
A systematic conservation assessment approach
3
A focus on delivery interpretation and mainstreaming of
conservation planning products
Involvement of key implementing agencies
The NSBA was led by the South African National Biodiversity
Institute (SANBI) which is mandated by South Africarsquos National
Environmental Management Biodiversity Act 2004 (No 10 of
2004 DEAT 2004) to play a crucial role independently and in
partnership with the National Department of Environmental
Affairs and Tourism (DEAT) in the conservation and sustainable
use of South Africarsquos biodiversity This leadership role in the
NSBA as well as the close alignment of the NSBA with the
NBSAP (DEAT 2005) and the National Biodiversity Framework
(currently being developed) ensured a strong implementation
focus throughout the entire NSBA The NSBA was conducted as
a large collaboration of lead agencies (SANBI DEAT) and con-
servation planning scientists (from SANBI universities science
councils conservation agencies and independent consultants) In
order to align implementation strategies with the broad-scale
focus of the NSBA key implementing agencies were identified as
national and provincial conservation and resource manage-
ment departments These agencies (South African National
Parks provincial conservation agencies conservation NGOs
Department of Water Affairs and Forestry National Department of
B Reyers
et al
copy 2007 The Authors
610
Diversity and Distributions
13
608ndash619 Journal compilation copy 2007 Blackwell Publishing Ltd
Agriculture and Marine and Coastal Management) were involved
in the NSBA through a series of consultative workshops A full
list of participants is available in Driver
et al
(2005)
A systematic approach
A systematic conservation assessment which ensures the
identification of priority areas for conservation action in a
rigorous target-driven and defensible fashion (Margules amp Pressey
2000) was the approach adopted by the NSBA The assessment
consisted of four stages data collation conservation target setting
review of existing conservation areas and the identification of
spatially explicit priority areas (Margules amp Pressey 2000) The
systematic approach followed is detailed in Rouget
et al
(2004)
and is only briefly summarized here
Data were collated on the distribution of biodiversity pattern
and processes protected areas and irreversible habitat loss
Biodiversity pattern data included the distribution and extent of
ecosystems including 441 vegetation types (Mucina
et al
2005)
259 estuaries and 17 wetlands as well as presence data for 449
animal (vertebrate and invertebrate) and 11572 plant species of
special concern at a quarter degree square (~700 km
2
) resolu-
tion Sources and data descriptions can be found in Rouget
et al
(2004) Species of special concern are defined as threatened and
endemic species based on National Red Data Lists national
conservation assessments and expert opinion Spatial surrogates
of ecological and evolutionary processes included high water
yield areas (Schulze
et al
1997) carbon sequestration (Scholes amp
Noble 2001) climate change resilience (Midgley
et al
2001)
biogeographical nodes (Heads 2004) and the Great Escarpment
The last-mentioned feature is a product of post-Gondwanan
erosive forces that separates a coastal and upland plain throughout
southern Africa and harbours a related biota that is distinct from
these adjacent plains It is a major migratory pathway for a
temperate biota includes numerous biotic refugia and owing to
its varied topography is home to a rich flora and fauna (Acocks
1953 Werger 1978 van Wyk amp Smith 2001)
Areas of current habitat loss were extracted from land cover
and road coverage data Only type 1 protected areas which
include national parks provincial nature reserves local authority
nature reserves and DWAF Forest Nature Reserves were used in
the assessment as the degree of protection of biodiversity in the
other types of protected areas is less certain
Conservation targets were set for vegetation types wetlands
estuaries and species For vegetation types we used the method-
ology developed by Desmet amp Cowling (2004) that uses actual
plant biodiversity data to estimate targets This approach uses the
extrapolated speciesndasharea relationship derived from an analysis
of phytosociological releveacute data within each vegetation type
Owing to the absence of sufficient releveacute data for all vegetation
types in South African the 438 types were classified into 47
higher-order groups comprising floristically and structurally
similar vegetation types and the targets extrapolated to allied
vegetation types within these groupings Vegetation targets
Figure 1 Map of the study area showing the seven biomes provincial boundaries and provincial capital cities Waterbodies and infrastructure are not depicted in this figure
Products for conservation decisions
copy 2007 The Authors
Diversity and Distributions
13
608ndash619 Journal compilation copy 2007 Blackwell Publishing Ltd
611
ranged from 16 to 36 of the original extent of each vegetation
type based on an agreed upon conservation goal of representing
at least 75 of species that occur in each vegetation type For
forest vegetation types targets were set in consultation with
experts based on an independent forest biome assessment
(Berliner amp Benn 2004) and ranged from 30 to 100
A target of 20 or three occurrences (whichever was greatest)
was set for each estuary and wetland type In addition a target of
100 was set for the wetlands and estuaries listed as being of
international importance Targets for species data were set as one
locality per species and 100 of localities for critically en-
dangered species (more sophisticated targets were not possible
due to the coarse resolution of the data and the lack of abundance
information)
Spatial surrogates of ecological processes are more difficult
when it comes to setting targets In many cases an ecological
process ideally needs all or most of the area to remain in a natural
or near-natural state to continue functioning although not
necessarily formally protected (Pressey
et al
2003) The NSBA
integrated the spatial surrogates of ecological processes using a
scoring system (explained below) without setting explicit targets
for them The systematic conservation assessment was con-
ducted in a Geographic Information Systems environment using
33 (ESRI Redlands CA USA) and
(Pressey
1999) software
Developing and interpreting conservation planning products
The NSBA aimed to produce as an end product an overall map
of broad-scale priority areas for conservation action in South
Africa The map integrates information on several levels of
biodiversity (species ecosystems and processes) existing
conservation efforts gaps in target achievement and pressures
facing biodiversity Although a single map of priorities is useful
for directing future conservation actions its complexity in terms
of inputs and analyses makes it difficult to interpret for strategy
development and subsequent implementation Consequently
it was decided to develop two additional user-useful and user-
friendly products maps of ecosystem status and protection levels
Products of systematic conservation assessments usually
include measures of conservation value (eg irreplaceability
Ferrier
et al
2000) expressed per planning unit (grid cells or
cadastral units) Although meaningful to conservation scientists
and an essential tool for implementing conservation action these
products are dynamic and require simplification explanation
and interpretation before they become useful to implementers
(Prendergast
et al
1999 Theobald
et al
2000 Driver
et al
2003 Pierce
et al
2005) Thus in the development of outputs
the NSBA followed Driver
et al
(2003) and Pierce
et al
(2005) by
displaying the static conservation value and priority status
of actual biodiversity features (see also Olson amp Dinerstein
2002)
These ecosystem status and protection level products were
based on ecosystem level features (eg vegetation types) the
coarse-scale resolution of the species data and the absence of
abundance information rendered the species level unsuitable for
product development For each of these products a list of possible
applications and actions was developed together with the
implementing agencies The development of the ecosystem
status protection level and overall priority map products is
described below
Ecosystem status product
The first spatial product mdash ecosystem
status mdash aims to identify threatened ecosystems (here vegetation
types as defined by Mucina
et al
2005) Consistent with the
approach of Ricketts
et al
(1999) Olson amp Dinerstein (2002)
and Burgess
et al
(2004) the assessment of ecosystem status is
based on the classification scheme developed by IUCN to categorize
species into among other categories critically endangered
endangered and vulnerable (Mace amp Lande 1991 IUCN 1994
2001) The assessment by Ricketts
et al
(1999) Olson amp
Dinerstein (2002) and Burgess
et al
(2004) uses a weighted
scoring system for each ecosystem (measured as ecoregions)
based on the extent of habitat loss degradation and fragmen-
tation This status is then combined with a measure of biological
distinctiveness per ecoregion to allocate ecoregions to conservation
management classes
The NSBA based their approach on Pierce
et al
(2005) who
classified vegetation types into ecosystem status categories of
critically endangered endangered and vulnerable based on the
difference between the conservation target and the extant habitat
of each vegetation type This approach takes into consideration
plant species richness and turnover (through conservation
targets described above) as well as habitat loss It classifies vegetation
types into endangerment categories in terms of the predicted
persistence of their biodiversity based on the extensive yet largely
theoretical literature on ecological thresholds (Andreacuten 1994
Franklin amp Forman 1987 Fahrig 2001 Flather amp Bevers 2002
see Huggett 2005 for review) Although data on the degree of
fragmentation and degradation of the remaining natural habitat
would have been valuable supplementary information in an
analysis of ecosystem status the land cover data mapped at a
1 250000 scale and 1 km
2
grid cell size were considered
inappropriate for a fragmentation analysis Future iterations of
this assessment will take both fragmentation and degradation
into account as newer land cover products are mapped at finer
resolutions
Vegetation types with extant habitat of
ge
80 were classified
as least threatened (LT) and were assumed to have no significant
disruption of ecosystem functioning and minimal species loss As
extant habitat dropped to lt 80 some ecosystem functions
become impaired and species start to disappear These vegetation
types were classified as vulnerable (VU) If the amount of extant
habitat drops below 60 these losses become more severe and
the vegetation type is recognized as endangered (EN) Once the
extant habitat was
le
the conservation target of the vegetation
type it was classified as critically endangered (CR) These vegeta-
tion types have been transformed to such an extent that not only
is their ecosystem function severely disrupted but the remaining
habitat is less than that needed to support 75 of plant diversity
this category represents ecosystems with marked acceleration of
biodiversity loss (Andren 1994)
B Reyers
et al
copy 2007 The Authors
612
Diversity and Distributions
13
608ndash619 Journal compilation copy 2007 Blackwell Publishing Ltd
Figure 2 illustrates the ecosystem status map Owing to the
spatial pattern of habitat transformation in South Africa
critically endangered vegetation types with the exception of
forest types are mostly concentrated in the fynbos biome
(Fig 1) The forest and fynbos biomes have the greatest propor-
tion of critically endangered vegetation types The grasslands
have been considerably impacted by habitat transformation and
as a result most grassland vegetation types are classified as
endangered or vulnerable The desert Nama-karoo and succulent
karoo biomes have the highest proportion of least threatened
vegetation types Of the 438 vegetation types classified (lagoons
and lake systems were excluded) 21 (5) were critically en-
dangered 58 (13) were endangered 70 (16) were vulnerable
and 289 (66) were least threatened More detailed results can
be found in Rouget
et al
(2004) and Driver
et al
(2005)
Protection level product
Since South Africarsquos protected areas are
not distributed evenly over the landscape there are substantial
gaps in the countryrsquos protected area network (Edwards 1974) A
gap analysis (Scott
et al
1993) is often a useful way to identify
ecosystems without adequate protection and can either compute
the proportion of each ecosystem protected (Scott
et al
1993
Walker
et al
2006) or quantify the proportion relative to the
conservation targets for the ecosystem (Margules amp Pressey
2000) The latter approach was followed in the NSBA in order to
develop a spatial product that demonstrated the protection level
of the vegetation type in relation to differential biodiversity
pattern incorporated via the conservation target This product
differs from ecosystem status in that vegetation types without
adequate protection levels are mapped and prioritized irrespective
of the extent of habitat loss Well-protected ecosystems are
defined as vegetation types with 100 of their target area
conserved similarly moderately protected ecosystems poorly
protected and hardly protected ecosystems have at least 50
25 and 5 of their target areas conserved respectively
The forest fynbos desert and savanna biomes are the best
protected in terms of percentage of target area while the Nama-
karoo and grasslands are the least protected biomes (Fig 3) An
assessment of ecosystem protection level reveals that 110 (25)
vegetation types are not protected at all Furthermore an
additional 90 (21) vegetation types with only lt 5 of their
biodiversity target protected are hardly protected More than
300 (68) vegetation types have less than half of their biodiversity
target conserved in statutory protected areas Only 67 (15)
vegetation types are adequately conserved (in relation to their
conservation targets) in statutory protected areas 22 types of
fynbos 18 of savanna and seven of forest
Overall priority map
In the production of an overall priority
map we decided not to go the route of a single lsquoirreplaceabilityrsquo
(Pressey
et al
1993) assessment based on ecosystems species
and processes (Cowling
et al
2003) Although a powerful
conservation assessment tool the implementation constraints
associated with products that express dynamic conservation
values per planning unit (see Driver
et al
2003 Pierce
et al
2005) as well as the scale mismatch between the species and
other data sets and the lack of targets for processes made a single
irreplaceability assessment not feasible The NSBA therefore
used separate analyses to identify priorities at the ecosystem
and species levels as well as priorities for the conservation of
Figure 2 Ecosystem status map demonstrating the distribution and extent of vegetation types belonging to four classes of endangerment Least threatened (LT) vegetation types with ge 80 extant habitat are assumed to have no significant disruption of ecosystem functioning and minimal species loss When natural habitat extent is lt 80 some ecosystem functions become impaired and species start to disappear These vegetation types are classified as vulnerable (VU) When extant habitat is lt 60 losses become more severe and the vegetation type is recognized as endangered (EN) Types where extant habitat is le the conservation target are classified as critically endangered (CR) These vegetation types have been transformed to such an extent that not only is their ecosystem function severely disrupted but the remaining habitat is less than that needed to support 75 of plant diversity this category represents ecosystems with marked acceleration of biodiversity loss
Products for conservation decisions
copy 2007 The Authors
Diversity and Distributions
13
608ndash619 Journal compilation copy 2007 Blackwell Publishing Ltd
613
processes These analyses included the ecosystem status and
protection level assessments outlined above an irreplaceability
analysis of the species and ecosystem data and the expert
mapping of important national-scale ecological and evolutionary
processes The outputs of these separate analyses were then
scored standardized overlaid and summed to be integrated into
a single GIS layer of priority values (for more detail see Rouget
et al
2004) Based on this layer priority areas were delineated
as areas very important to one of the underlying analyses or
important to several
Figure 4 illustrates these final nine priority areas the bounda-
ries between which were delimited subjectively on the basis of
biome boundaries and topographical and climatic factors
Owing to the coarse scale of the data and various assessment
Figure 3 Ecosystem protection level based on the target achievement () of each vegetation type by type 1 protected areas Well-protected ecosystems are defined as vegetation types with 100 of their target area conserved similarly moderately protected ecosystems poorly protected and hardly protected ecosystems have at least 50 25 and 5 of their target areas conserved
Figure 4 Terrestrial biodiversity priority areas of South Africa identified through a multi-criteria analysis of species ecosystem ecological process and land cover data (see Rouget et al 2004 for details)
B Reyers
et al
copy 2007 The Authors
614
Diversity and Distributions
13
608ndash619 Journal compilation copy 2007 Blackwell Publishing Ltd
outputs priority areas defined here could not be identified at the
level of property boundaries Therefore the boundaries of the
final priority areas are rough estimates and should not be used
for decision-making at the local scale These priority areas
comprise 5497 million ha occupying 4336 of South Africa
The nine priority areas are North-eastern Escarpment Bushveld-
Bankenveld Moist Grasslands Central Grasslands South-eastern
Escarpment Maputaland-Pondoland Albany Thicket and Wild
Coast Cape Floristic Region and the Succulent Karoo
DISCUSSION
The NSBA a critique of the process and products
The NSBA set out to accomplish the dual challenges of developing
defensible products while at the same time ensuring these
products were user-useful and user-friendly (Driver
et al
2003)
The NSBA was released in April 2005 so it is perhaps too early to
assess the full extent to which it has achieved these aims We can
however review the process products and current uptake in an
effort to contribute to the growing body of conservation action
evaluation best practice and lessons learnt (Sutherland
et al
2004 Ferraro amp Pattanayak 2006 Knight
et al
2006b) Below
we review the defensibility and usability of the products and
conclude by proposing a way forward in the development of
products for national-scale conservation decision-making
Defensible products
Defensible products are those that have the support of the
conservation science community can withstand the peer review
process and are based on current best practice The NSBA
appears to exhibit these characteristics in that it (1) was
conducted by a large collaboration of conservation planning
scientists from universities science councils conservation agencies
and independent consultants generating broad support of the
products by the scientific community (see Driver
et al
2005 for
a full list of participants) (2) was submitted as a contribution to
this journal so that it could be subjected to international peer
review and (3) was based on a systematic approach reflecting
current best practice (Margules amp Pressey 2000)
The systematic approach involved the inclusion of species
(plant and animal) ecosystems and processes in the assessment
thereby ensuring that the priority areas identified cater for all
elements essential to the persistence of national biodiversity
(Balmford
et al
1998 Cowling
et al
1999 2004) while a focus
on representation complementarity and conservation targets
guaranteed accountable repeatable and defensible outputs
(Margules amp Pressey 2000 Rodrigues
et al 2000) This form of
national biodiversity assessment moves beyond approaches
based on a one or a limited number of taxa eg Important Bird
Areas (Barnes 1998) Centres of Plant Endemism (van Wyk amp
Smith 2001) and Key Biodiversity Areas (Eken et al 2004)
scoring eg biodiversity hotspots (Myers et al 2000 Mitter-
meier et al 2005) and entirely expert-derived priority areas
(Olivieri et al 1995 Hannah et al 1998 Kaltenborn et al
1999) The NSBA approach comprised the complementarity-
driven identification of priority areas which make measurable
contributions to national-scale conservation goals of biodiversity
representation and persistence This ability to objectively calculate
and defend the contribution each priority area makes to national
conservation goals sets this approach apart from other forms of
national biodiversity assessment It is important to emphasize
that the NSBA was not a reserve selection exercise used to
identify specific parcels of land for conservation action instead it
was based on a multi-criteria approach that allowed for the
integration of a suite of biodiversity assessment outputs at a
variety of scales into a single map of broad spatial conservation
priorities in South Africa
There are some data-related shortcomings in the NSBA that
may impact on its defensibility These shortcomings include
inadequate data on species distributions and pressures facing
biodiversity This resulted in products that are biased towards the
ecosystem level and do not adequately reflect status and priori-
ties at the species level Furthermore the land cover data used as
a measure of the pressures facing biodiversity are limited in that
they (1) are over 10 years old (2) do not incorporate habitat
degradation or fragmentation and (3) do not reflect pressures
like hunting collecting pollution and climate change This
implies that the results of the NSBA may underestimate the
degree of pressure and therefore the conservation status of South
Africarsquos biodiversity However the products of this assessment
are of broad-scale nature that may alleviate the impacts of data
inaccuracies it is at fine scale that these limitations become a
significant impediment and must be addressed Additional
shortcomings include a lack of spatially explicit information on
processes (eg major migratory pathways) as well as the thresholds
used in the ecosystem status and protection level assessments
The former reflects current (albeit flawed) practice of relying on
expert mapping of process components (eg Rouget et al
2003a) while the latter is constrained by thresholds derived from
theoretical modelling studies (see Huggett 2005 for review)
instead of field data
Useable products
The NBSA was conceived developed and conducted with a
strong focus on uptake by national and provincial resource
management agencies as a means of ensuring implementation It
was hoped that the NSBA would streamline the challenging
implementation of the NBSAP (DEAT 2005) through providing
a spatial focus that was easy to understand and use From a
review of policies and plans currently under development (see
below) in these national and provincial agencies as well as
anecdotal evidence the ecosystem status map appears most use-
ful and popular The protection levels of ecosystems and overall
priority areas are currently less widely used
Evidence of the popularity and uses of the NSBA products
particularly the ecosystem status products include the following
1 National policies and plans have made use of the NSBA
products (generally ecosystem status maps) eg National Spatial
Development Perspective (httpwwwidporgza) South African
Products for conservation decisions
copy 2007 The AuthorsDiversity and Distributions 13 608ndash619 Journal compilation copy 2007 Blackwell Publishing Ltd 615
Environmental Outlook 2005 (wwwenvironmentgovza)
National Strategy for Sustainable Development (DEAT 2006)
The National Biodiversity Framework currently under develop-
ment is based on the NBSAP and NSBA particularly the overall
priority areas
2 Many of the requirements of the National Environmental
Management Biodiversity Act (Act 10 of 2004) will rely on the
NSBA approach and products including the listing of national
threatened and protected ecosystems and the development of
norms and standards for bioregional plans (DEAT 2004)
3 National level decisions regarding protected area expansion
made by DEAT and the South African National Parks Board will
be guided by the protection level product (T Smith pers
comm)
4 The NSBA provides useful headline indicators (ecosystem
status and protection level) that can be tracked over time as part
of South Africarsquos national monitoring and evaluation framework
These indicators also correspond well with the monitoring
requirements of some of the headline indicators of the CBDrsquos
2010 Target (UNEP 2003 Balmford et al 2005 Reyers amp
McGeoch in press) This correspondence is highlighted in the
NBSAP (DEAT 2005) and will streamline South Africarsquos reporting
requirements to the CBD
5 At the provincial level the Western Cape Province has already
used the ecosystem status product as part of its Provincial Spatial
Development Framework for determining spatial planning
categories and guidelines for land-use decision-making across
the province (DEADP 2005a) Furthermore the Western Cape
State of Environment Report draws heavily on the NSBA for
biodiversity-related information and indicators (DEADP 2005b)
6 The Mpumalanga Provincial Conservation plan uses the
concept of ecosystem status applied to their ecosystem level data
The Free State North-west and Limpopo provinces have
adopted the NSBA approach and products for their planned
bioregional programmes (T Smith pers comm)
7 The need for a National Grasslands Biodiversity Programme
was supported by the overall priority map and a biome wide
priority area assessment used the outputs of the NSBA as an
input (Reyers et al 2005)
8 Anecdotal evidence suggests that good use is being made of the
ecosystem status layer for informing Environmental Impact
Assessments (EIA)
9 The popularity and rapid uptake of the ecosystem status
product appears to be largely due to it being a compelling and
accessible product that makes easier the work of implementing
agencies These strengths include the following
bull Ecosystem status maps were developed for all environments
(terrestrial river marine and estuarine) in a consistent way
using the same terminology and principles allowing for com-
parisons between the environments
bull Ecosystem status is an easy concept for most people to
understand including politicians and officials who have no
background or experience in biodiversity This understanding
is promoted by the similarity of conservation status categories
used in species assessments for Red Data Lists (IUCN 2001)
The maps have a strong visual logic using a sequence of
colours from red to green to reflect most threatened through
to least threatened ecosystems (Fig 2)
bull Ecosystem status can be assessed at all scales by a variety of
conservation practitioners The assessment of ecosystem
status is relatively simple requiring data on ecosystem extent
habitat loss a conservation target per ecosystem and some
basic GIS and conservation planning expertise and is thus not
limited to the domain of academics
Figure 5 Congruence of existing bioregional and provincial conservation plans and programmes in South Africa with the identified overall priority areas The high levels of congruence indicate that many of these priority areas have been previously identified in other sub-national or global assessments prior to the NSBA
CAPE Cape Action Plan for People and the
Environment STEP Subtropical Thicket
Ecosystem Planning Program
SKEP Succulent Karoo Ecosystem Plan
NGBP National Grasslands Biodiversity
Program
B Reyers et al
copy 2007 The Authors616 Diversity and Distributions 13 608ndash619 Journal compilation copy 2007 Blackwell Publishing Ltd
The protection level product has not witnessed similar broad
uptake This however is to be expected as it is of interest to only
a small group of national and provincial conservation agencies
with the mandate to establish statutory protected areas
Currently these agencies are making use of the product to guide
protected area expansion
Although not used as widely as the ecosystem status product
the map of overall priority areas has been received with great
interest by DEAT and forms the basis for the National Biodiversity
Framework It integrates information on the status of national
biodiversity in a single product that confirms that existing
bioregional programmes [Fig 5 such as the Subtropical Thicket
Ecosystem Programme (STEP) and the Cape Action Plan for
People and the Environment (CAPE)] are focusing their efforts
on national priority areas while identifying gaps in this bio-
regional coverage [eg providing motivation for the development
of the National Grasslands Biodiversity Programme (NGBP)] Its
popularity with some implementing agencies suggests that maps
of broad priority areas can be useful but if they are to be used to
maximum effect they need to be interpreted and accompanied by
clear explanations that point to their practical implications for
implementing agencies The next iteration of the NSBA in 5 years
time will have to address this challenge of conceptualizing more
effective and clear key messages for the overall priority map
CONCLUSION
In the short time since its release South Africarsquos first NSBA has
begun to achieve the desired uptake by implementing agencies
It was described by South Africarsquos Minister of Environmental
Affairs and Tourism as lsquogroundbreakingrsquo and a lsquouseful tool in
policy- and decision-making across all spheres of governmentrsquo
The existence within the NSBA team of significant conservation
planning expertise from several subnational conservation plans
and a strong spirit of collaboration between planners and
implementers played a significant role in ensuring that we based
this assessment on the lessons we have learnt from previous con-
servation plans (see Knight et al 2006b) Perhaps one of the
most important aspects of the NSBA is that it was conducted by
local conservation scientists who understood the institutional
context for the assessment and could communicate effectively
with implementing agencies The fact that this was an assessment
done by South Africans for South Africans promoted a sense of
ownership of the products and helped promote uptake
Despite these strengths the need to repeat this assessment
every 5 years and to contribute to the growing body of evalua-
tion and best practice for conservation implies that we need to
take a critical look at the process and products in an effort to
improve them and their effectiveness in the future We have
highlighted some of the data and information shortcomings that
should be addressed before the next iteration Furthermore this
evaluation of the NSBA products has supported the call being
made by many conservation scientists to go beyond implementa-
tion to the design of programme monitoring and evaluation
systems (Hockings 2003 Stem et al 2005) As Ferraro amp Pattanayak
(2006) point out the limited resources for conservation make the
assessment of the effectiveness of conservation interventions
essential if these resources are to stretch as far as possible One of
the biggest challenges in this paper was the evaluation of the
uptake and effectiveness of the NSBA we had to rely largely on
draft publications and anecdotal evidence from conversations
with implementing agency staff This may be due to the short
time period that has elapsed since the NSBA was released but it
is also a result of the lack of a monitoring programme with which
to assess and report on the effectiveness of the NSBA Several
frameworks exist for the monitoring of conservation effectiveness
(eg adaptive management frameworks Margoluis amp Salafsky
1998) and should certainly be reviewed and implemented before
the next NSBA iteration perhaps as part of the National
Biodiversity Monitoring and Reporting Framework currently
under development
REFERENCES
Acocks JPH (1953) Veld types of South Africa Memoirs of the
Botanical Society of South Africa 28 1ndash192
Andreacuten H (1994) Effects of habitat fragmentation on birds and
mammals in landscapes with different proportions of suitable
habitat a review Oikos 71 355ndash366
Balmford A Crane P Dobson A Green RE amp Mace GM
(2005) The 2010 challenge data availability information
needs and extraterrestrial insights Philosophical Transactions
of the Royal Society of London Series B Biological Sciences 360
221ndash228
Balmford A Mace GM amp Ginsberg JR (1998) The challenges
to conservation in a changing world putting processes on the
map Conservation in a changing world (ed by GM Mace A
Balmford and JR Ginsberg) pp 1ndash28 Cambridge University
Press Cambridge UK
Barnes KN ed (1998) The important bird areas of southern
Africa BirdLife Johannesburg South Africa
Berliner D amp Benn G (2004) Protected area planning for the forest
biome Prepared for DWAF WFSP Forestry Programme Depart-
ment of Water Affairs and Forestry Pretoria South Africa
Burgess N DrsquoAmico Hales J Underwood E Dinerstein E
Olson DM Itoua I Shipper J Ricketts TH amp Newman K
(2004) The terrestrial ecoregions of Africa and Madagascar
Island Press Washington DC
Cowling RM Knight AT Faith DP Ferrier S Lombard
AT Driver A Rouget M Maze K amp Desmet PG (2004)
Nature conservation requires more than a passion for species
Conservation Biology 18 1674ndash1677
Cowling RM Pressey RL Lombard AT Desmet PG amp
Ellis AG (1999) From representation to persistence require-
ments for a sustainable reserve system in the species-rich
Mediterranean-climate deserts of southern Africa Diversity
and Distributions 5 51ndash71
Cowling RM Pressey RL Rouget M amp Lombard AT
(2003) A conservation plan for a global biodiversity hotspot mdash
the Cape Floristic Region South Africa Biological Conservation
112 191ndash216
DEADP (2005a) Western Cape provincial spatial development
Products for conservation decisions
copy 2007 The AuthorsDiversity and Distributions 13 608ndash619 Journal compilation copy 2007 Blackwell Publishing Ltd 617
framework Provincial Government of the Western Cape
Department of Environmental Affairs and Development
Planning Cape Town httpwwwcapegatewaygovzaeng
pubsguidesW120505
DEADP (2005b) Western Cape state of the environment report
Provincial Government of the Western Cape Department of
Environmental Affairs and Development Planning Cape
Town httpwwwcapegatewaygovzaengpublications
reports_researchW120813
DEAT (2004) The National Environmental Management Biodiver-
sity Act No 10 of 2004 Department of Environmental Affairs and
Tourism Pretoria South Africa httpwwwenvironmentgovza
DEAT (2005) South Africarsquos National Biodiversity Strategy and
Action Plan Department of Environmental Affairs and Tourism
Pretoria South Africa
DEAT (2006) South Africarsquos National Strategy for Sustainable
Development Draft for Review Department of Environmental
Affairs and Tourism httpwwwenvironmentgovza
nssd_2005draft_intergrated_strat
Desmet P amp Cowling RM (2004) Using the speciesndasharea
relationship to set baseline targets for conservation Ecology
and Society 9 (11) httpwwwecologyandsocietyorgvol9
iss2art11
Driver A Cowling RM amp Maze K (2003) Planning for living
landscapes perspectives and lessons from South Africa Center
for Applied Biodiversity Science at Conservation Interna-
tional Washington DC and the Botanical Society of South
Africa Cape Town httpwwwbotanicalsocietyorgza
defaultphppageID=ccuccu_downloadshtm
Driver A Maze K Rouget M Lombard AT Nel J Turpie
JK Cowling RM Desmet P Goodman P Harris J Jonas
Z Reyers B Sink K amp Strauss T (2005) National Spatial
Biodiversity Assessment 2004 priorities for biodiversity con-
servation in South Africa Strelitzia 17 South African National
Biodiversity Institute Pretoria South Africa http
wwwsanbiorgbiodiversitynsbahtm
Edwards D (1974) Survey to determine the adequacy of existing
conserved areas in relation to vegetation types A preliminary
report Koedoe 17 3ndash38
Eken G Bennun L Brooks TM Darwall W Fishpool
LDC Foster M Knox D Langhammer P Matiku P
Radford E Salaman P Sechrest W Smith ML Spector S
amp Tordoff A (2004) Key biodiversity areas as site conservation
targets Bioscience 54 1110ndash1118
Fahrig L (2001) How much habitat is enough Biological
Conservation 100 65ndash74
Fairbanks DHK Thompson MW Vink DE Newby
TS van den Berg HM amp Everard DA (2000) The
South African land-cover characteristics database a synopsis of
the landscape South African Journal of Science 96 69ndash82
Ferraro PJ amp Pattanayak SK (2006) Money for nothing A
call for empirical evaluation of biodiversity conservation
investments PloS Biology 4 (4) e105
Ferrier S Pressey RL amp Barrett TW (2000) A new predictor
of the irreplaceability of areas for achieving a conservation
goal its application to real-world planning and a research
agenda for further refinement Biological Conservation 93
303ndash325
Flather CH amp Bevers M (2002) Patchy reaction-diffusion and
population abundance The relative importance of habitat
amount and arrangement The American Naturalist 159 40ndash
56
Franklin JF amp Forman RTT (1987) Creating landscape
patterns by forest cutting ecological consequences and principles
Landscape Ecology 1 5ndash18
Freitag S Nicholls AO amp van Jaarsveld AS (1998) Dealing
with established reserve networks and incomplete distribution
data sets in conservation planning South African Journal of
Science 94 79ndash86
Glowka L Burhenne-Guilmin S Synge H McNeely JA amp
Guumlndling L (1994) A guide to the convention on biological
diversity Environmental Policy and Law Paper no 30 IUCN
Gland and Cambridge
Hannah L Rakotosamimanana B Ganzhorn J Mittermeier
RA Olivieri S Iyer L Rajaobelina S Hough J Andriami-
alisoa F Bowles I amp Tilken G (1998) Participatory plan-
ning scientific priorities and landscape conservation in
Madagascar Environmental Conservation 25 30ndash36
Heads M (2004) What is a node Journal of Biogeography 31
1883ndash1891
Hockings M (2003) Systems for assessing the effectiveness of
management in protected areas Bioscience 53 823ndash832
Huggett AJ (2005) The concept and utility of lsquoecological
thresholdsrsquo in biodiversity conservation Biological Conserva-
tion 124 301ndash310
IUCN (1994) IUCN red list categories IUCN Gland Switzer-
land
IUCN (2001) IUCN red list categories and criteria version 31
IUCN Species Survival Commission Gland Switzerland and
Cambridge UK
Kaltenborn BK Hanse R amp Hundeinde M (1999) National
park planning and local participation from a mountain region
in southern Norway Mountain Research and Development 19
51ndash61
Knight AT Cowling RM amp Campbell BM (2006a) Planning
for implementation an operational model for implementing
conservation action Conservation Biology 20 408ndash419
Knight AT Driver A Cowling RM Maze K Desmet PG
Lombard AT Rouget M Botha MA Boshoff AF
Castley JG Goodman PS MacKinnon K Pierce SM
Sims-Castley R Stewart WI amp von Hase A (2006b) Design-
ing systematic conservation assessments that promote effective
implementation best practice from South Africa Conservation
Biology 20 739ndash750
Lombard AT Strauss T Harris J Sink K Attwood C amp
Hutchings L (2004) South African National Biodiversity
Assessment 2004 technical report Volume 4 marine component
South African National Biodiversity Institute Pretoria South
Africa httpwwwsanbiorgza
Mace GM amp Lande R (1991) Assessing extinction threats
towards a reevaluation of IUCN threatened species categories
Conservation Biology 5 148ndash157
B Reyers et al
copy 2007 The Authors618 Diversity and Distributions 13 608ndash619 Journal compilation copy 2007 Blackwell Publishing Ltd
Margoluis R amp Salafsky N (1998) Measuring success designing
managing and monitoring conservation and development
projects Island Press Washington DC
Margules CR amp RLPressey (2000) Systematic conservation
planning Nature 405 37ndash47
Midgley G Rutherford M amp Bond W (2001) The heat is on
impacts of climate change on plant diversity in south Africa
National Botanic Institute Cape Town South Africa
Mittermeier RA Hoffmann M Pilgrim JD Brooks TB
Mittermeier CG Lamoreux JL amp Fonseca G (ed) (2005)
Hotspots revisited Earthrsquos biologically richest and most endangered
ecoregions Cemex Mexico City
Mucina L Rutherford MC amp Powrie LW (ed) (2005)
Vegetation map of South Africa Lesotho and Swaziland
1 1000000 scale sheet maps South African National Biodiver-
sity Institute Pretoria South Africa ISBN 1-919976-22-1
Myers N Mittermeier RA Mittermeier CG da Fonseca
GAB amp Kent J (2000) Biodiversity hotspots for conservation
priorities Nature 4032 853ndash858
Nel JL Roux DJ Maree G Kleynhans CJ Moolman J
Reyers B Rouget M amp Cowling RM (2007) A systematic
conservation assessment of the ecosystem status and protection
levels of main rivers Diversity and Distributions 13 341ndash352
Noss R (2003) A checklist for wildlands network designs
Conservation Biology 17 (5) 1ndash7
Olivieri S Bowles I Cavalcanti RB Fonseca GAB
Mittermeier RA amp Rostrom C (1995) A participatory
approach to biodiversity conservation the regional priority
setting workshop Conservation International Washington DC
Olson DM amp Dinerstein E (2002) The Global 200 priority
ecoregions for global conservation Annals of the Missouri
Botanical Garden 89 199ndash224
Pierce SM Cowling RM Knight AT Lombard AT
Rouget M amp Wolf T (2005) Systematic conservation
assessment products for landuse planning interpretation for
implementation Biological Conservation 125 441ndash548
Pierce SM Cowling RM Sandwith T amp MacKinnon K ed
(2002) Mainstreaming biodiversity in development case studies
from South Africa World Bank Washington DC
Prendergast JR Quinn RM amp Lawton JH (1999) The gaps
between theory and practice in selecting nature reserves
Conservation Biology 13 484ndash492
Pressey RL (1999) Applications of irreplaceability analysis to
planning and management problems Parks 9 42ndash51
Pressey RL Cowling RM amp Rouget M (2003) Formulating
conservation targets for biodiversity pattern and process in the
Cape Floristic Region South Africa Biological Conservation
112 99ndash127
Pressey RL Humphries CJ Margules CR Vane-Wright RI
amp Williams PH (1993) Beyond opportunism key principles
for systematic reserve selection Trends in Ecology amp Evolution
8 124ndash128
Pullin AS amp Knight TM (2001) Effectiveness in conservation
practice Pointers from medicine and public health Conserva-
tion Biology 15 50ndash54
Reyers B Fairbanks DHK van Jaarsveld AS amp Thompson
M (2001) Priority areas for the conservation of South African
vegetation a coarse filter approach Diversity and Distribu-
tions 7 77ndash96
Reyers B amp McGeoch M (in press) A biodiversity monitoring
framework for South Africa progress and directions South
African Journal of Science
Reyers B Nel J Egoh B Rouget M amp Jonas Z (2005) A
conservation assessment of South Africarsquos grassland biome
integrating terrestrial river ecosystem services and fine scale
priorities CSIR Report Number ENV-S-C 2005-102 CSIR
Stellenbosch Cape Town
Ricketts TH Dinerstein E Olson D Loucks CJ Eichbaum
W DellaSala D Kavanagh K Hedao P Hurley PT
Carney KM Abell R amp Walters S (1999) Terrestrial ecore-
gions of North America a conservation assessment Island Press
Washington DC
Rodrigues AS Cerdeira JO amp Gaston KJ (2000) Flexibility
efficiency and accountability adapting reserve selection
algorithms to more complex conservation problems Ecography
23 (5) 565ndash574
Rouget M Cowling RM Pressey RL amp Richardson DM
(2003a) Identifying the spatial components of ecological and
evolutionary processes for regional conservation planning in the
Cape Floristic Region Diversity and Distributions 9 191ndash210
Rouget M Richardson DM amp Cowling RM (2003b) The
current configuration of protected areas in the Cape Floristic
Region mdash reservation bias and representation of biodiversity
patterns and processes Biological Conservation 112 129ndash145
Rouget M Reyers B Jonas Z Desmet P Driver A Maze K
Egoh B amp Cowling RM (2004) South African National
Spatial Biodiversity Assessment 2004 Technical report Volume
1 terrestrial component South African National Biodiversity
Institute Pretoria httpwwwsanbiorgbiodiversitynsbahtm
Salafsky N Margoluis R Redford KH amp Robinson JG
(2002) Improving the practice of conservation a conceptual
framework and research agenda for conservation science
Conservation Biology 16 1469ndash1479
Scholes RJ amp Biggs R (ed) (2004) Ecosystem services in southern
Africa a regional assessment Council for Scientific and Indus-
trial Research Pretoria South Africa
Scholes RJ amp Noble IR (2001) Storing carbon on land Science
294 1012
Schulze RE Maharaj M Lynch SD Howe BJ amp Melvil-
Thomson B (1997) South African atlas of agrohydrology and
climatology Water Research Commission Report Pretoria
South Africa
Scott JM Davis F Csuti B Noss RF Butterfield B Groves C
Anderson H Caicco S DrsquoErchia F Edwards TC Uliman J
amp Wright G (1993) Gap analysis a geographic approach to
protection of biological diversity Wildlife Monographs 123 1ndash41
Stem C Margoluis R Salafsky N amp Brown M (2005)
Monitoring and evaluation in conservation A review of trends
and approaches Conservation Biology 19 295ndash309
Sutherland WJ Pullin AS Dolman PM amp Knight TM
(2004) The need for evidence-based conservation Trends in
Ecology amp Evolution 19 305ndash308
Products for conservation decisions
copy 2007 The AuthorsDiversity and Distributions 13 608ndash619 Journal compilation copy 2007 Blackwell Publishing Ltd 619
Theobald DM Hobbs NT Bearly T Zack JA Shenk T amp
Riebsame WE (2000) Incorporating biological information
in local land-use decision making designing a system for
conservation planning Landscape Ecology 15 35ndash45
UNEP (2003) Proposed biodiversity indicators relevant to the 2010
target UNEPCBDSBSTTA9INF26 httpwwwbiodivorgdoc
meetingssbsttasbstta-09informationsbstta-09-inf-26-enpdf
Walker S Price R Rutledge D Stephens T amp Lee WG
(2006) Recent loss of indigenous cover in New Zealand New
Zealand Journal of Ecology 30 (20) 169ndash177
Werger MJA (1978) Biogeographical division of southern
Africa Biogeography and ecology of southern Africa (ed by
MJA Werger) pp 147ndash170 Junk The Hague
Wilson KA Westphal MI Possingham HP amp Elith J (2005)
Sensitivity of conservation planning to different approaches to
using predicted species distribution data Biological Conserva-
tion 122 99ndash112
van Wyk AE amp Smith GF (2001) Regions of floristic endemism
in southern Africa a review with emphasis on succulents
Umdaus Press Pretoria South Africa

Products for conservation decisions
copy 2007 The Authors
Diversity and Distributions
13
608ndash619 Journal compilation copy 2007 Blackwell Publishing Ltd
609
plans and policies of a wide range of national and provincial
decision-makers (Pierce
et al
2002)
Conducting and mainstreaming such assessments present
the dual challenges of performing an integrated rigorous and
comprehensive spatial assessment of biodiversity that produces
defensible outputs (Margules amp Pressey 2000 Rodrigues
et al
2000 Noss 2003) while at the same time ensuring that products
are user-useful user-friendly (Driver
et al
2003) and compelling
to their broad target audience of high level government officials
from a variety of sectors including agriculture conservation
water forestry and land-use planning (Theobald
et al
2000
Salafsky
et al
2002 Pierce
et al
2005) The principles tools and
techniques of the field of conservation planning hold much
potential for meeting these dual challenges and were the
approach adopted by the NSBA This field has evolved through
several phases in the last few decades from historic
ad hoc
approaches through scoring techniques to systematic methods
that focus on the representation and persistence of biodiversity
and more recently to conservation assessments and strategies
geared for implementation (Margules amp Pressey 2000
Pierce
et al
2005 Wilson
et al
2005 Knight
et al
2006a) The
last-mentioned approach focuses on techniques that operation-
alize and implement the outputs of conservation assessments
We follow Knight
et al
(2006b) in distinguishing between a
conservation assessment that involves identifying spatial priorities
for conservation action (ie area selection) and a conservation
plan that is an assessment complemented with an implementation
strategy
Very little documented information on the effective use of
these conservation
planning
techniques exists in the peer-
reviewed literature however this is slowly changing (Prendergast
et al
1999 Theobald
et al
2000 Salafsky
et al
2002 Noss
2003 Knight
et al
2006b) Based on current best practice key
ingredients of planning for implementation have been suggested
these include following a systematic approach conducting a
needs assessment with relevant stakeholders and implementers
identifying assessment goals paying attention to project design
and interpreting and mainstreaming results (Knight
et al
2006b) The documentation of experiences and key ingredients is
essential for the advancement of conservation planning
(Prendergast
et al
1999 Pullin amp Knight 2001 Sutherland
et al
2004 Ferraro amp Pattanayak 2006 Knight
et al
2006b) This
paper therefore aims to contribute to this need through describing
and evaluating the outputs generated by a national-scale assessment
of terrestrial biodiversity that aimed to produce defensible yet
usable products By so doing we hope that it will prove useful
for studies aimed at delivering defensible user-useful and
user-friendly products to ensure effective mainstreaming and
implementation of conservation actions at national scales
METHODS AND RESULTS
Study area
The area included in the terrestrial component of the NSBA
included the nations of South Africa Lesotho and Swaziland an
area of approximately 126 million ha South Africa contains a
wealth of biodiversity within its borders unequalled by other
temperate regions is home to three of the worldrsquos 34 global
biodiversity hotspots (Mittermeier
et al
2005) and includes a
total of seven biomes (Fig 1) The countryrsquos human population is
expanding at a moderate rate (106 2005ndash06 wwwstatssagovza)
and approximately 80 of the country is covered with natural
or semi-natural vegetation (Fairbanks
et al
2000 Reyers
et al
2001) Habitat degradation is estimated to be significant and
expanding (Scholes amp Biggs 2004) however data that provide
an accurate estimate of the extent of degradation are currently
not available Although South Africarsquos responsibility to global
biodiversity conservation is significant current efforts aimed
at strict conservation are largely inadequate less than 6 of the
land is under formally recognized and legally entrenched conserva-
tion management (Scholes amp Biggs 2004) Existing conservation
areas are largely biased towards land with a low production
potential or a high tourism value and are therefore not adequately
representative of the countryrsquos biodiversity (Freitag
et al
1998
Reyers
et al
2001 Rouget
et al
2003b)
Planning for implementation
The NSBA was based on the recommendations of Knight
et al
(2006a) for undertaking conservation assessments that fit within
a
planning for implementation
approach Following these recom-
mendations the NSBA comprised the following components
described below
1
The involvement of key implementing agencies in the
planning process
2
A systematic conservation assessment approach
3
A focus on delivery interpretation and mainstreaming of
conservation planning products
Involvement of key implementing agencies
The NSBA was led by the South African National Biodiversity
Institute (SANBI) which is mandated by South Africarsquos National
Environmental Management Biodiversity Act 2004 (No 10 of
2004 DEAT 2004) to play a crucial role independently and in
partnership with the National Department of Environmental
Affairs and Tourism (DEAT) in the conservation and sustainable
use of South Africarsquos biodiversity This leadership role in the
NSBA as well as the close alignment of the NSBA with the
NBSAP (DEAT 2005) and the National Biodiversity Framework
(currently being developed) ensured a strong implementation
focus throughout the entire NSBA The NSBA was conducted as
a large collaboration of lead agencies (SANBI DEAT) and con-
servation planning scientists (from SANBI universities science
councils conservation agencies and independent consultants) In
order to align implementation strategies with the broad-scale
focus of the NSBA key implementing agencies were identified as
national and provincial conservation and resource manage-
ment departments These agencies (South African National
Parks provincial conservation agencies conservation NGOs
Department of Water Affairs and Forestry National Department of
B Reyers
et al
copy 2007 The Authors
610
Diversity and Distributions
13
608ndash619 Journal compilation copy 2007 Blackwell Publishing Ltd
Agriculture and Marine and Coastal Management) were involved
in the NSBA through a series of consultative workshops A full
list of participants is available in Driver
et al
(2005)
A systematic approach
A systematic conservation assessment which ensures the
identification of priority areas for conservation action in a
rigorous target-driven and defensible fashion (Margules amp Pressey
2000) was the approach adopted by the NSBA The assessment
consisted of four stages data collation conservation target setting
review of existing conservation areas and the identification of
spatially explicit priority areas (Margules amp Pressey 2000) The
systematic approach followed is detailed in Rouget
et al
(2004)
and is only briefly summarized here
Data were collated on the distribution of biodiversity pattern
and processes protected areas and irreversible habitat loss
Biodiversity pattern data included the distribution and extent of
ecosystems including 441 vegetation types (Mucina
et al
2005)
259 estuaries and 17 wetlands as well as presence data for 449
animal (vertebrate and invertebrate) and 11572 plant species of
special concern at a quarter degree square (~700 km
2
) resolu-
tion Sources and data descriptions can be found in Rouget
et al
(2004) Species of special concern are defined as threatened and
endemic species based on National Red Data Lists national
conservation assessments and expert opinion Spatial surrogates
of ecological and evolutionary processes included high water
yield areas (Schulze
et al
1997) carbon sequestration (Scholes amp
Noble 2001) climate change resilience (Midgley
et al
2001)
biogeographical nodes (Heads 2004) and the Great Escarpment
The last-mentioned feature is a product of post-Gondwanan
erosive forces that separates a coastal and upland plain throughout
southern Africa and harbours a related biota that is distinct from
these adjacent plains It is a major migratory pathway for a
temperate biota includes numerous biotic refugia and owing to
its varied topography is home to a rich flora and fauna (Acocks
1953 Werger 1978 van Wyk amp Smith 2001)
Areas of current habitat loss were extracted from land cover
and road coverage data Only type 1 protected areas which
include national parks provincial nature reserves local authority
nature reserves and DWAF Forest Nature Reserves were used in
the assessment as the degree of protection of biodiversity in the
other types of protected areas is less certain
Conservation targets were set for vegetation types wetlands
estuaries and species For vegetation types we used the method-
ology developed by Desmet amp Cowling (2004) that uses actual
plant biodiversity data to estimate targets This approach uses the
extrapolated speciesndasharea relationship derived from an analysis
of phytosociological releveacute data within each vegetation type
Owing to the absence of sufficient releveacute data for all vegetation
types in South African the 438 types were classified into 47
higher-order groups comprising floristically and structurally
similar vegetation types and the targets extrapolated to allied
vegetation types within these groupings Vegetation targets
Figure 1 Map of the study area showing the seven biomes provincial boundaries and provincial capital cities Waterbodies and infrastructure are not depicted in this figure
Products for conservation decisions
copy 2007 The Authors
Diversity and Distributions
13
608ndash619 Journal compilation copy 2007 Blackwell Publishing Ltd
611
ranged from 16 to 36 of the original extent of each vegetation
type based on an agreed upon conservation goal of representing
at least 75 of species that occur in each vegetation type For
forest vegetation types targets were set in consultation with
experts based on an independent forest biome assessment
(Berliner amp Benn 2004) and ranged from 30 to 100
A target of 20 or three occurrences (whichever was greatest)
was set for each estuary and wetland type In addition a target of
100 was set for the wetlands and estuaries listed as being of
international importance Targets for species data were set as one
locality per species and 100 of localities for critically en-
dangered species (more sophisticated targets were not possible
due to the coarse resolution of the data and the lack of abundance
information)
Spatial surrogates of ecological processes are more difficult
when it comes to setting targets In many cases an ecological
process ideally needs all or most of the area to remain in a natural
or near-natural state to continue functioning although not
necessarily formally protected (Pressey
et al
2003) The NSBA
integrated the spatial surrogates of ecological processes using a
scoring system (explained below) without setting explicit targets
for them The systematic conservation assessment was con-
ducted in a Geographic Information Systems environment using
33 (ESRI Redlands CA USA) and
(Pressey
1999) software
Developing and interpreting conservation planning products
The NSBA aimed to produce as an end product an overall map
of broad-scale priority areas for conservation action in South
Africa The map integrates information on several levels of
biodiversity (species ecosystems and processes) existing
conservation efforts gaps in target achievement and pressures
facing biodiversity Although a single map of priorities is useful
for directing future conservation actions its complexity in terms
of inputs and analyses makes it difficult to interpret for strategy
development and subsequent implementation Consequently
it was decided to develop two additional user-useful and user-
friendly products maps of ecosystem status and protection levels
Products of systematic conservation assessments usually
include measures of conservation value (eg irreplaceability
Ferrier
et al
2000) expressed per planning unit (grid cells or
cadastral units) Although meaningful to conservation scientists
and an essential tool for implementing conservation action these
products are dynamic and require simplification explanation
and interpretation before they become useful to implementers
(Prendergast
et al
1999 Theobald
et al
2000 Driver
et al
2003 Pierce
et al
2005) Thus in the development of outputs
the NSBA followed Driver
et al
(2003) and Pierce
et al
(2005) by
displaying the static conservation value and priority status
of actual biodiversity features (see also Olson amp Dinerstein
2002)
These ecosystem status and protection level products were
based on ecosystem level features (eg vegetation types) the
coarse-scale resolution of the species data and the absence of
abundance information rendered the species level unsuitable for
product development For each of these products a list of possible
applications and actions was developed together with the
implementing agencies The development of the ecosystem
status protection level and overall priority map products is
described below
Ecosystem status product
The first spatial product mdash ecosystem
status mdash aims to identify threatened ecosystems (here vegetation
types as defined by Mucina
et al
2005) Consistent with the
approach of Ricketts
et al
(1999) Olson amp Dinerstein (2002)
and Burgess
et al
(2004) the assessment of ecosystem status is
based on the classification scheme developed by IUCN to categorize
species into among other categories critically endangered
endangered and vulnerable (Mace amp Lande 1991 IUCN 1994
2001) The assessment by Ricketts
et al
(1999) Olson amp
Dinerstein (2002) and Burgess
et al
(2004) uses a weighted
scoring system for each ecosystem (measured as ecoregions)
based on the extent of habitat loss degradation and fragmen-
tation This status is then combined with a measure of biological
distinctiveness per ecoregion to allocate ecoregions to conservation
management classes
The NSBA based their approach on Pierce
et al
(2005) who
classified vegetation types into ecosystem status categories of
critically endangered endangered and vulnerable based on the
difference between the conservation target and the extant habitat
of each vegetation type This approach takes into consideration
plant species richness and turnover (through conservation
targets described above) as well as habitat loss It classifies vegetation
types into endangerment categories in terms of the predicted
persistence of their biodiversity based on the extensive yet largely
theoretical literature on ecological thresholds (Andreacuten 1994
Franklin amp Forman 1987 Fahrig 2001 Flather amp Bevers 2002
see Huggett 2005 for review) Although data on the degree of
fragmentation and degradation of the remaining natural habitat
would have been valuable supplementary information in an
analysis of ecosystem status the land cover data mapped at a
1 250000 scale and 1 km
2
grid cell size were considered
inappropriate for a fragmentation analysis Future iterations of
this assessment will take both fragmentation and degradation
into account as newer land cover products are mapped at finer
resolutions
Vegetation types with extant habitat of
ge
80 were classified
as least threatened (LT) and were assumed to have no significant
disruption of ecosystem functioning and minimal species loss As
extant habitat dropped to lt 80 some ecosystem functions
become impaired and species start to disappear These vegetation
types were classified as vulnerable (VU) If the amount of extant
habitat drops below 60 these losses become more severe and
the vegetation type is recognized as endangered (EN) Once the
extant habitat was
le
the conservation target of the vegetation
type it was classified as critically endangered (CR) These vegeta-
tion types have been transformed to such an extent that not only
is their ecosystem function severely disrupted but the remaining
habitat is less than that needed to support 75 of plant diversity
this category represents ecosystems with marked acceleration of
biodiversity loss (Andren 1994)
B Reyers
et al
copy 2007 The Authors
612
Diversity and Distributions
13
608ndash619 Journal compilation copy 2007 Blackwell Publishing Ltd
Figure 2 illustrates the ecosystem status map Owing to the
spatial pattern of habitat transformation in South Africa
critically endangered vegetation types with the exception of
forest types are mostly concentrated in the fynbos biome
(Fig 1) The forest and fynbos biomes have the greatest propor-
tion of critically endangered vegetation types The grasslands
have been considerably impacted by habitat transformation and
as a result most grassland vegetation types are classified as
endangered or vulnerable The desert Nama-karoo and succulent
karoo biomes have the highest proportion of least threatened
vegetation types Of the 438 vegetation types classified (lagoons
and lake systems were excluded) 21 (5) were critically en-
dangered 58 (13) were endangered 70 (16) were vulnerable
and 289 (66) were least threatened More detailed results can
be found in Rouget
et al
(2004) and Driver
et al
(2005)
Protection level product
Since South Africarsquos protected areas are
not distributed evenly over the landscape there are substantial
gaps in the countryrsquos protected area network (Edwards 1974) A
gap analysis (Scott
et al
1993) is often a useful way to identify
ecosystems without adequate protection and can either compute
the proportion of each ecosystem protected (Scott
et al
1993
Walker
et al
2006) or quantify the proportion relative to the
conservation targets for the ecosystem (Margules amp Pressey
2000) The latter approach was followed in the NSBA in order to
develop a spatial product that demonstrated the protection level
of the vegetation type in relation to differential biodiversity
pattern incorporated via the conservation target This product
differs from ecosystem status in that vegetation types without
adequate protection levels are mapped and prioritized irrespective
of the extent of habitat loss Well-protected ecosystems are
defined as vegetation types with 100 of their target area
conserved similarly moderately protected ecosystems poorly
protected and hardly protected ecosystems have at least 50
25 and 5 of their target areas conserved respectively
The forest fynbos desert and savanna biomes are the best
protected in terms of percentage of target area while the Nama-
karoo and grasslands are the least protected biomes (Fig 3) An
assessment of ecosystem protection level reveals that 110 (25)
vegetation types are not protected at all Furthermore an
additional 90 (21) vegetation types with only lt 5 of their
biodiversity target protected are hardly protected More than
300 (68) vegetation types have less than half of their biodiversity
target conserved in statutory protected areas Only 67 (15)
vegetation types are adequately conserved (in relation to their
conservation targets) in statutory protected areas 22 types of
fynbos 18 of savanna and seven of forest
Overall priority map
In the production of an overall priority
map we decided not to go the route of a single lsquoirreplaceabilityrsquo
(Pressey
et al
1993) assessment based on ecosystems species
and processes (Cowling
et al
2003) Although a powerful
conservation assessment tool the implementation constraints
associated with products that express dynamic conservation
values per planning unit (see Driver
et al
2003 Pierce
et al
2005) as well as the scale mismatch between the species and
other data sets and the lack of targets for processes made a single
irreplaceability assessment not feasible The NSBA therefore
used separate analyses to identify priorities at the ecosystem
and species levels as well as priorities for the conservation of
Figure 2 Ecosystem status map demonstrating the distribution and extent of vegetation types belonging to four classes of endangerment Least threatened (LT) vegetation types with ge 80 extant habitat are assumed to have no significant disruption of ecosystem functioning and minimal species loss When natural habitat extent is lt 80 some ecosystem functions become impaired and species start to disappear These vegetation types are classified as vulnerable (VU) When extant habitat is lt 60 losses become more severe and the vegetation type is recognized as endangered (EN) Types where extant habitat is le the conservation target are classified as critically endangered (CR) These vegetation types have been transformed to such an extent that not only is their ecosystem function severely disrupted but the remaining habitat is less than that needed to support 75 of plant diversity this category represents ecosystems with marked acceleration of biodiversity loss
Products for conservation decisions
copy 2007 The Authors
Diversity and Distributions
13
608ndash619 Journal compilation copy 2007 Blackwell Publishing Ltd
613
processes These analyses included the ecosystem status and
protection level assessments outlined above an irreplaceability
analysis of the species and ecosystem data and the expert
mapping of important national-scale ecological and evolutionary
processes The outputs of these separate analyses were then
scored standardized overlaid and summed to be integrated into
a single GIS layer of priority values (for more detail see Rouget
et al
2004) Based on this layer priority areas were delineated
as areas very important to one of the underlying analyses or
important to several
Figure 4 illustrates these final nine priority areas the bounda-
ries between which were delimited subjectively on the basis of
biome boundaries and topographical and climatic factors
Owing to the coarse scale of the data and various assessment
Figure 3 Ecosystem protection level based on the target achievement () of each vegetation type by type 1 protected areas Well-protected ecosystems are defined as vegetation types with 100 of their target area conserved similarly moderately protected ecosystems poorly protected and hardly protected ecosystems have at least 50 25 and 5 of their target areas conserved
Figure 4 Terrestrial biodiversity priority areas of South Africa identified through a multi-criteria analysis of species ecosystem ecological process and land cover data (see Rouget et al 2004 for details)
B Reyers
et al
copy 2007 The Authors
614
Diversity and Distributions
13
608ndash619 Journal compilation copy 2007 Blackwell Publishing Ltd
outputs priority areas defined here could not be identified at the
level of property boundaries Therefore the boundaries of the
final priority areas are rough estimates and should not be used
for decision-making at the local scale These priority areas
comprise 5497 million ha occupying 4336 of South Africa
The nine priority areas are North-eastern Escarpment Bushveld-
Bankenveld Moist Grasslands Central Grasslands South-eastern
Escarpment Maputaland-Pondoland Albany Thicket and Wild
Coast Cape Floristic Region and the Succulent Karoo
DISCUSSION
The NSBA a critique of the process and products
The NSBA set out to accomplish the dual challenges of developing
defensible products while at the same time ensuring these
products were user-useful and user-friendly (Driver
et al
2003)
The NSBA was released in April 2005 so it is perhaps too early to
assess the full extent to which it has achieved these aims We can
however review the process products and current uptake in an
effort to contribute to the growing body of conservation action
evaluation best practice and lessons learnt (Sutherland
et al
2004 Ferraro amp Pattanayak 2006 Knight
et al
2006b) Below
we review the defensibility and usability of the products and
conclude by proposing a way forward in the development of
products for national-scale conservation decision-making
Defensible products
Defensible products are those that have the support of the
conservation science community can withstand the peer review
process and are based on current best practice The NSBA
appears to exhibit these characteristics in that it (1) was
conducted by a large collaboration of conservation planning
scientists from universities science councils conservation agencies
and independent consultants generating broad support of the
products by the scientific community (see Driver
et al
2005 for
a full list of participants) (2) was submitted as a contribution to
this journal so that it could be subjected to international peer
review and (3) was based on a systematic approach reflecting
current best practice (Margules amp Pressey 2000)
The systematic approach involved the inclusion of species
(plant and animal) ecosystems and processes in the assessment
thereby ensuring that the priority areas identified cater for all
elements essential to the persistence of national biodiversity
(Balmford
et al
1998 Cowling
et al
1999 2004) while a focus
on representation complementarity and conservation targets
guaranteed accountable repeatable and defensible outputs
(Margules amp Pressey 2000 Rodrigues
et al 2000) This form of
national biodiversity assessment moves beyond approaches
based on a one or a limited number of taxa eg Important Bird
Areas (Barnes 1998) Centres of Plant Endemism (van Wyk amp
Smith 2001) and Key Biodiversity Areas (Eken et al 2004)
scoring eg biodiversity hotspots (Myers et al 2000 Mitter-
meier et al 2005) and entirely expert-derived priority areas
(Olivieri et al 1995 Hannah et al 1998 Kaltenborn et al
1999) The NSBA approach comprised the complementarity-
driven identification of priority areas which make measurable
contributions to national-scale conservation goals of biodiversity
representation and persistence This ability to objectively calculate
and defend the contribution each priority area makes to national
conservation goals sets this approach apart from other forms of
national biodiversity assessment It is important to emphasize
that the NSBA was not a reserve selection exercise used to
identify specific parcels of land for conservation action instead it
was based on a multi-criteria approach that allowed for the
integration of a suite of biodiversity assessment outputs at a
variety of scales into a single map of broad spatial conservation
priorities in South Africa
There are some data-related shortcomings in the NSBA that
may impact on its defensibility These shortcomings include
inadequate data on species distributions and pressures facing
biodiversity This resulted in products that are biased towards the
ecosystem level and do not adequately reflect status and priori-
ties at the species level Furthermore the land cover data used as
a measure of the pressures facing biodiversity are limited in that
they (1) are over 10 years old (2) do not incorporate habitat
degradation or fragmentation and (3) do not reflect pressures
like hunting collecting pollution and climate change This
implies that the results of the NSBA may underestimate the
degree of pressure and therefore the conservation status of South
Africarsquos biodiversity However the products of this assessment
are of broad-scale nature that may alleviate the impacts of data
inaccuracies it is at fine scale that these limitations become a
significant impediment and must be addressed Additional
shortcomings include a lack of spatially explicit information on
processes (eg major migratory pathways) as well as the thresholds
used in the ecosystem status and protection level assessments
The former reflects current (albeit flawed) practice of relying on
expert mapping of process components (eg Rouget et al
2003a) while the latter is constrained by thresholds derived from
theoretical modelling studies (see Huggett 2005 for review)
instead of field data
Useable products
The NBSA was conceived developed and conducted with a
strong focus on uptake by national and provincial resource
management agencies as a means of ensuring implementation It
was hoped that the NSBA would streamline the challenging
implementation of the NBSAP (DEAT 2005) through providing
a spatial focus that was easy to understand and use From a
review of policies and plans currently under development (see
below) in these national and provincial agencies as well as
anecdotal evidence the ecosystem status map appears most use-
ful and popular The protection levels of ecosystems and overall
priority areas are currently less widely used
Evidence of the popularity and uses of the NSBA products
particularly the ecosystem status products include the following
1 National policies and plans have made use of the NSBA
products (generally ecosystem status maps) eg National Spatial
Development Perspective (httpwwwidporgza) South African
Products for conservation decisions
copy 2007 The AuthorsDiversity and Distributions 13 608ndash619 Journal compilation copy 2007 Blackwell Publishing Ltd 615
Environmental Outlook 2005 (wwwenvironmentgovza)
National Strategy for Sustainable Development (DEAT 2006)
The National Biodiversity Framework currently under develop-
ment is based on the NBSAP and NSBA particularly the overall
priority areas
2 Many of the requirements of the National Environmental
Management Biodiversity Act (Act 10 of 2004) will rely on the
NSBA approach and products including the listing of national
threatened and protected ecosystems and the development of
norms and standards for bioregional plans (DEAT 2004)
3 National level decisions regarding protected area expansion
made by DEAT and the South African National Parks Board will
be guided by the protection level product (T Smith pers
comm)
4 The NSBA provides useful headline indicators (ecosystem
status and protection level) that can be tracked over time as part
of South Africarsquos national monitoring and evaluation framework
These indicators also correspond well with the monitoring
requirements of some of the headline indicators of the CBDrsquos
2010 Target (UNEP 2003 Balmford et al 2005 Reyers amp
McGeoch in press) This correspondence is highlighted in the
NBSAP (DEAT 2005) and will streamline South Africarsquos reporting
requirements to the CBD
5 At the provincial level the Western Cape Province has already
used the ecosystem status product as part of its Provincial Spatial
Development Framework for determining spatial planning
categories and guidelines for land-use decision-making across
the province (DEADP 2005a) Furthermore the Western Cape
State of Environment Report draws heavily on the NSBA for
biodiversity-related information and indicators (DEADP 2005b)
6 The Mpumalanga Provincial Conservation plan uses the
concept of ecosystem status applied to their ecosystem level data
The Free State North-west and Limpopo provinces have
adopted the NSBA approach and products for their planned
bioregional programmes (T Smith pers comm)
7 The need for a National Grasslands Biodiversity Programme
was supported by the overall priority map and a biome wide
priority area assessment used the outputs of the NSBA as an
input (Reyers et al 2005)
8 Anecdotal evidence suggests that good use is being made of the
ecosystem status layer for informing Environmental Impact
Assessments (EIA)
9 The popularity and rapid uptake of the ecosystem status
product appears to be largely due to it being a compelling and
accessible product that makes easier the work of implementing
agencies These strengths include the following
bull Ecosystem status maps were developed for all environments
(terrestrial river marine and estuarine) in a consistent way
using the same terminology and principles allowing for com-
parisons between the environments
bull Ecosystem status is an easy concept for most people to
understand including politicians and officials who have no
background or experience in biodiversity This understanding
is promoted by the similarity of conservation status categories
used in species assessments for Red Data Lists (IUCN 2001)
The maps have a strong visual logic using a sequence of
colours from red to green to reflect most threatened through
to least threatened ecosystems (Fig 2)
bull Ecosystem status can be assessed at all scales by a variety of
conservation practitioners The assessment of ecosystem
status is relatively simple requiring data on ecosystem extent
habitat loss a conservation target per ecosystem and some
basic GIS and conservation planning expertise and is thus not
limited to the domain of academics
Figure 5 Congruence of existing bioregional and provincial conservation plans and programmes in South Africa with the identified overall priority areas The high levels of congruence indicate that many of these priority areas have been previously identified in other sub-national or global assessments prior to the NSBA
CAPE Cape Action Plan for People and the
Environment STEP Subtropical Thicket
Ecosystem Planning Program
SKEP Succulent Karoo Ecosystem Plan
NGBP National Grasslands Biodiversity
Program
B Reyers et al
copy 2007 The Authors616 Diversity and Distributions 13 608ndash619 Journal compilation copy 2007 Blackwell Publishing Ltd
The protection level product has not witnessed similar broad
uptake This however is to be expected as it is of interest to only
a small group of national and provincial conservation agencies
with the mandate to establish statutory protected areas
Currently these agencies are making use of the product to guide
protected area expansion
Although not used as widely as the ecosystem status product
the map of overall priority areas has been received with great
interest by DEAT and forms the basis for the National Biodiversity
Framework It integrates information on the status of national
biodiversity in a single product that confirms that existing
bioregional programmes [Fig 5 such as the Subtropical Thicket
Ecosystem Programme (STEP) and the Cape Action Plan for
People and the Environment (CAPE)] are focusing their efforts
on national priority areas while identifying gaps in this bio-
regional coverage [eg providing motivation for the development
of the National Grasslands Biodiversity Programme (NGBP)] Its
popularity with some implementing agencies suggests that maps
of broad priority areas can be useful but if they are to be used to
maximum effect they need to be interpreted and accompanied by
clear explanations that point to their practical implications for
implementing agencies The next iteration of the NSBA in 5 years
time will have to address this challenge of conceptualizing more
effective and clear key messages for the overall priority map
CONCLUSION
In the short time since its release South Africarsquos first NSBA has
begun to achieve the desired uptake by implementing agencies
It was described by South Africarsquos Minister of Environmental
Affairs and Tourism as lsquogroundbreakingrsquo and a lsquouseful tool in
policy- and decision-making across all spheres of governmentrsquo
The existence within the NSBA team of significant conservation
planning expertise from several subnational conservation plans
and a strong spirit of collaboration between planners and
implementers played a significant role in ensuring that we based
this assessment on the lessons we have learnt from previous con-
servation plans (see Knight et al 2006b) Perhaps one of the
most important aspects of the NSBA is that it was conducted by
local conservation scientists who understood the institutional
context for the assessment and could communicate effectively
with implementing agencies The fact that this was an assessment
done by South Africans for South Africans promoted a sense of
ownership of the products and helped promote uptake
Despite these strengths the need to repeat this assessment
every 5 years and to contribute to the growing body of evalua-
tion and best practice for conservation implies that we need to
take a critical look at the process and products in an effort to
improve them and their effectiveness in the future We have
highlighted some of the data and information shortcomings that
should be addressed before the next iteration Furthermore this
evaluation of the NSBA products has supported the call being
made by many conservation scientists to go beyond implementa-
tion to the design of programme monitoring and evaluation
systems (Hockings 2003 Stem et al 2005) As Ferraro amp Pattanayak
(2006) point out the limited resources for conservation make the
assessment of the effectiveness of conservation interventions
essential if these resources are to stretch as far as possible One of
the biggest challenges in this paper was the evaluation of the
uptake and effectiveness of the NSBA we had to rely largely on
draft publications and anecdotal evidence from conversations
with implementing agency staff This may be due to the short
time period that has elapsed since the NSBA was released but it
is also a result of the lack of a monitoring programme with which
to assess and report on the effectiveness of the NSBA Several
frameworks exist for the monitoring of conservation effectiveness
(eg adaptive management frameworks Margoluis amp Salafsky
1998) and should certainly be reviewed and implemented before
the next NSBA iteration perhaps as part of the National
Biodiversity Monitoring and Reporting Framework currently
under development
REFERENCES
Acocks JPH (1953) Veld types of South Africa Memoirs of the
Botanical Society of South Africa 28 1ndash192
Andreacuten H (1994) Effects of habitat fragmentation on birds and
mammals in landscapes with different proportions of suitable
habitat a review Oikos 71 355ndash366
Balmford A Crane P Dobson A Green RE amp Mace GM
(2005) The 2010 challenge data availability information
needs and extraterrestrial insights Philosophical Transactions
of the Royal Society of London Series B Biological Sciences 360
221ndash228
Balmford A Mace GM amp Ginsberg JR (1998) The challenges
to conservation in a changing world putting processes on the
map Conservation in a changing world (ed by GM Mace A
Balmford and JR Ginsberg) pp 1ndash28 Cambridge University
Press Cambridge UK
Barnes KN ed (1998) The important bird areas of southern
Africa BirdLife Johannesburg South Africa
Berliner D amp Benn G (2004) Protected area planning for the forest
biome Prepared for DWAF WFSP Forestry Programme Depart-
ment of Water Affairs and Forestry Pretoria South Africa
Burgess N DrsquoAmico Hales J Underwood E Dinerstein E
Olson DM Itoua I Shipper J Ricketts TH amp Newman K
(2004) The terrestrial ecoregions of Africa and Madagascar
Island Press Washington DC
Cowling RM Knight AT Faith DP Ferrier S Lombard
AT Driver A Rouget M Maze K amp Desmet PG (2004)
Nature conservation requires more than a passion for species
Conservation Biology 18 1674ndash1677
Cowling RM Pressey RL Lombard AT Desmet PG amp
Ellis AG (1999) From representation to persistence require-
ments for a sustainable reserve system in the species-rich
Mediterranean-climate deserts of southern Africa Diversity
and Distributions 5 51ndash71
Cowling RM Pressey RL Rouget M amp Lombard AT
(2003) A conservation plan for a global biodiversity hotspot mdash
the Cape Floristic Region South Africa Biological Conservation
112 191ndash216
DEADP (2005a) Western Cape provincial spatial development
Products for conservation decisions
copy 2007 The AuthorsDiversity and Distributions 13 608ndash619 Journal compilation copy 2007 Blackwell Publishing Ltd 617
framework Provincial Government of the Western Cape
Department of Environmental Affairs and Development
Planning Cape Town httpwwwcapegatewaygovzaeng
pubsguidesW120505
DEADP (2005b) Western Cape state of the environment report
Provincial Government of the Western Cape Department of
Environmental Affairs and Development Planning Cape
Town httpwwwcapegatewaygovzaengpublications
reports_researchW120813
DEAT (2004) The National Environmental Management Biodiver-
sity Act No 10 of 2004 Department of Environmental Affairs and
Tourism Pretoria South Africa httpwwwenvironmentgovza
DEAT (2005) South Africarsquos National Biodiversity Strategy and
Action Plan Department of Environmental Affairs and Tourism
Pretoria South Africa
DEAT (2006) South Africarsquos National Strategy for Sustainable
Development Draft for Review Department of Environmental
Affairs and Tourism httpwwwenvironmentgovza
nssd_2005draft_intergrated_strat
Desmet P amp Cowling RM (2004) Using the speciesndasharea
relationship to set baseline targets for conservation Ecology
and Society 9 (11) httpwwwecologyandsocietyorgvol9
iss2art11
Driver A Cowling RM amp Maze K (2003) Planning for living
landscapes perspectives and lessons from South Africa Center
for Applied Biodiversity Science at Conservation Interna-
tional Washington DC and the Botanical Society of South
Africa Cape Town httpwwwbotanicalsocietyorgza
defaultphppageID=ccuccu_downloadshtm
Driver A Maze K Rouget M Lombard AT Nel J Turpie
JK Cowling RM Desmet P Goodman P Harris J Jonas
Z Reyers B Sink K amp Strauss T (2005) National Spatial
Biodiversity Assessment 2004 priorities for biodiversity con-
servation in South Africa Strelitzia 17 South African National
Biodiversity Institute Pretoria South Africa http
wwwsanbiorgbiodiversitynsbahtm
Edwards D (1974) Survey to determine the adequacy of existing
conserved areas in relation to vegetation types A preliminary
report Koedoe 17 3ndash38
Eken G Bennun L Brooks TM Darwall W Fishpool
LDC Foster M Knox D Langhammer P Matiku P
Radford E Salaman P Sechrest W Smith ML Spector S
amp Tordoff A (2004) Key biodiversity areas as site conservation
targets Bioscience 54 1110ndash1118
Fahrig L (2001) How much habitat is enough Biological
Conservation 100 65ndash74
Fairbanks DHK Thompson MW Vink DE Newby
TS van den Berg HM amp Everard DA (2000) The
South African land-cover characteristics database a synopsis of
the landscape South African Journal of Science 96 69ndash82
Ferraro PJ amp Pattanayak SK (2006) Money for nothing A
call for empirical evaluation of biodiversity conservation
investments PloS Biology 4 (4) e105
Ferrier S Pressey RL amp Barrett TW (2000) A new predictor
of the irreplaceability of areas for achieving a conservation
goal its application to real-world planning and a research
agenda for further refinement Biological Conservation 93
303ndash325
Flather CH amp Bevers M (2002) Patchy reaction-diffusion and
population abundance The relative importance of habitat
amount and arrangement The American Naturalist 159 40ndash
56
Franklin JF amp Forman RTT (1987) Creating landscape
patterns by forest cutting ecological consequences and principles
Landscape Ecology 1 5ndash18
Freitag S Nicholls AO amp van Jaarsveld AS (1998) Dealing
with established reserve networks and incomplete distribution
data sets in conservation planning South African Journal of
Science 94 79ndash86
Glowka L Burhenne-Guilmin S Synge H McNeely JA amp
Guumlndling L (1994) A guide to the convention on biological
diversity Environmental Policy and Law Paper no 30 IUCN
Gland and Cambridge
Hannah L Rakotosamimanana B Ganzhorn J Mittermeier
RA Olivieri S Iyer L Rajaobelina S Hough J Andriami-
alisoa F Bowles I amp Tilken G (1998) Participatory plan-
ning scientific priorities and landscape conservation in
Madagascar Environmental Conservation 25 30ndash36
Heads M (2004) What is a node Journal of Biogeography 31
1883ndash1891
Hockings M (2003) Systems for assessing the effectiveness of
management in protected areas Bioscience 53 823ndash832
Huggett AJ (2005) The concept and utility of lsquoecological
thresholdsrsquo in biodiversity conservation Biological Conserva-
tion 124 301ndash310
IUCN (1994) IUCN red list categories IUCN Gland Switzer-
land
IUCN (2001) IUCN red list categories and criteria version 31
IUCN Species Survival Commission Gland Switzerland and
Cambridge UK
Kaltenborn BK Hanse R amp Hundeinde M (1999) National
park planning and local participation from a mountain region
in southern Norway Mountain Research and Development 19
51ndash61
Knight AT Cowling RM amp Campbell BM (2006a) Planning
for implementation an operational model for implementing
conservation action Conservation Biology 20 408ndash419
Knight AT Driver A Cowling RM Maze K Desmet PG
Lombard AT Rouget M Botha MA Boshoff AF
Castley JG Goodman PS MacKinnon K Pierce SM
Sims-Castley R Stewart WI amp von Hase A (2006b) Design-
ing systematic conservation assessments that promote effective
implementation best practice from South Africa Conservation
Biology 20 739ndash750
Lombard AT Strauss T Harris J Sink K Attwood C amp
Hutchings L (2004) South African National Biodiversity
Assessment 2004 technical report Volume 4 marine component
South African National Biodiversity Institute Pretoria South
Africa httpwwwsanbiorgza
Mace GM amp Lande R (1991) Assessing extinction threats
towards a reevaluation of IUCN threatened species categories
Conservation Biology 5 148ndash157
B Reyers et al
copy 2007 The Authors618 Diversity and Distributions 13 608ndash619 Journal compilation copy 2007 Blackwell Publishing Ltd
Margoluis R amp Salafsky N (1998) Measuring success designing
managing and monitoring conservation and development
projects Island Press Washington DC
Margules CR amp RLPressey (2000) Systematic conservation
planning Nature 405 37ndash47
Midgley G Rutherford M amp Bond W (2001) The heat is on
impacts of climate change on plant diversity in south Africa
National Botanic Institute Cape Town South Africa
Mittermeier RA Hoffmann M Pilgrim JD Brooks TB
Mittermeier CG Lamoreux JL amp Fonseca G (ed) (2005)
Hotspots revisited Earthrsquos biologically richest and most endangered
ecoregions Cemex Mexico City
Mucina L Rutherford MC amp Powrie LW (ed) (2005)
Vegetation map of South Africa Lesotho and Swaziland
1 1000000 scale sheet maps South African National Biodiver-
sity Institute Pretoria South Africa ISBN 1-919976-22-1
Myers N Mittermeier RA Mittermeier CG da Fonseca
GAB amp Kent J (2000) Biodiversity hotspots for conservation
priorities Nature 4032 853ndash858
Nel JL Roux DJ Maree G Kleynhans CJ Moolman J
Reyers B Rouget M amp Cowling RM (2007) A systematic
conservation assessment of the ecosystem status and protection
levels of main rivers Diversity and Distributions 13 341ndash352
Noss R (2003) A checklist for wildlands network designs
Conservation Biology 17 (5) 1ndash7
Olivieri S Bowles I Cavalcanti RB Fonseca GAB
Mittermeier RA amp Rostrom C (1995) A participatory
approach to biodiversity conservation the regional priority
setting workshop Conservation International Washington DC
Olson DM amp Dinerstein E (2002) The Global 200 priority
ecoregions for global conservation Annals of the Missouri
Botanical Garden 89 199ndash224
Pierce SM Cowling RM Knight AT Lombard AT
Rouget M amp Wolf T (2005) Systematic conservation
assessment products for landuse planning interpretation for
implementation Biological Conservation 125 441ndash548
Pierce SM Cowling RM Sandwith T amp MacKinnon K ed
(2002) Mainstreaming biodiversity in development case studies
from South Africa World Bank Washington DC
Prendergast JR Quinn RM amp Lawton JH (1999) The gaps
between theory and practice in selecting nature reserves
Conservation Biology 13 484ndash492
Pressey RL (1999) Applications of irreplaceability analysis to
planning and management problems Parks 9 42ndash51
Pressey RL Cowling RM amp Rouget M (2003) Formulating
conservation targets for biodiversity pattern and process in the
Cape Floristic Region South Africa Biological Conservation
112 99ndash127
Pressey RL Humphries CJ Margules CR Vane-Wright RI
amp Williams PH (1993) Beyond opportunism key principles
for systematic reserve selection Trends in Ecology amp Evolution
8 124ndash128
Pullin AS amp Knight TM (2001) Effectiveness in conservation
practice Pointers from medicine and public health Conserva-
tion Biology 15 50ndash54
Reyers B Fairbanks DHK van Jaarsveld AS amp Thompson
M (2001) Priority areas for the conservation of South African
vegetation a coarse filter approach Diversity and Distribu-
tions 7 77ndash96
Reyers B amp McGeoch M (in press) A biodiversity monitoring
framework for South Africa progress and directions South
African Journal of Science
Reyers B Nel J Egoh B Rouget M amp Jonas Z (2005) A
conservation assessment of South Africarsquos grassland biome
integrating terrestrial river ecosystem services and fine scale
priorities CSIR Report Number ENV-S-C 2005-102 CSIR
Stellenbosch Cape Town
Ricketts TH Dinerstein E Olson D Loucks CJ Eichbaum
W DellaSala D Kavanagh K Hedao P Hurley PT
Carney KM Abell R amp Walters S (1999) Terrestrial ecore-
gions of North America a conservation assessment Island Press
Washington DC
Rodrigues AS Cerdeira JO amp Gaston KJ (2000) Flexibility
efficiency and accountability adapting reserve selection
algorithms to more complex conservation problems Ecography
23 (5) 565ndash574
Rouget M Cowling RM Pressey RL amp Richardson DM
(2003a) Identifying the spatial components of ecological and
evolutionary processes for regional conservation planning in the
Cape Floristic Region Diversity and Distributions 9 191ndash210
Rouget M Richardson DM amp Cowling RM (2003b) The
current configuration of protected areas in the Cape Floristic
Region mdash reservation bias and representation of biodiversity
patterns and processes Biological Conservation 112 129ndash145
Rouget M Reyers B Jonas Z Desmet P Driver A Maze K
Egoh B amp Cowling RM (2004) South African National
Spatial Biodiversity Assessment 2004 Technical report Volume
1 terrestrial component South African National Biodiversity
Institute Pretoria httpwwwsanbiorgbiodiversitynsbahtm
Salafsky N Margoluis R Redford KH amp Robinson JG
(2002) Improving the practice of conservation a conceptual
framework and research agenda for conservation science
Conservation Biology 16 1469ndash1479
Scholes RJ amp Biggs R (ed) (2004) Ecosystem services in southern
Africa a regional assessment Council for Scientific and Indus-
trial Research Pretoria South Africa
Scholes RJ amp Noble IR (2001) Storing carbon on land Science
294 1012
Schulze RE Maharaj M Lynch SD Howe BJ amp Melvil-
Thomson B (1997) South African atlas of agrohydrology and
climatology Water Research Commission Report Pretoria
South Africa
Scott JM Davis F Csuti B Noss RF Butterfield B Groves C
Anderson H Caicco S DrsquoErchia F Edwards TC Uliman J
amp Wright G (1993) Gap analysis a geographic approach to
protection of biological diversity Wildlife Monographs 123 1ndash41
Stem C Margoluis R Salafsky N amp Brown M (2005)
Monitoring and evaluation in conservation A review of trends
and approaches Conservation Biology 19 295ndash309
Sutherland WJ Pullin AS Dolman PM amp Knight TM
(2004) The need for evidence-based conservation Trends in
Ecology amp Evolution 19 305ndash308
Products for conservation decisions
copy 2007 The AuthorsDiversity and Distributions 13 608ndash619 Journal compilation copy 2007 Blackwell Publishing Ltd 619
Theobald DM Hobbs NT Bearly T Zack JA Shenk T amp
Riebsame WE (2000) Incorporating biological information
in local land-use decision making designing a system for
conservation planning Landscape Ecology 15 35ndash45
UNEP (2003) Proposed biodiversity indicators relevant to the 2010
target UNEPCBDSBSTTA9INF26 httpwwwbiodivorgdoc
meetingssbsttasbstta-09informationsbstta-09-inf-26-enpdf
Walker S Price R Rutledge D Stephens T amp Lee WG
(2006) Recent loss of indigenous cover in New Zealand New
Zealand Journal of Ecology 30 (20) 169ndash177
Werger MJA (1978) Biogeographical division of southern
Africa Biogeography and ecology of southern Africa (ed by
MJA Werger) pp 147ndash170 Junk The Hague
Wilson KA Westphal MI Possingham HP amp Elith J (2005)
Sensitivity of conservation planning to different approaches to
using predicted species distribution data Biological Conserva-
tion 122 99ndash112
van Wyk AE amp Smith GF (2001) Regions of floristic endemism
in southern Africa a review with emphasis on succulents
Umdaus Press Pretoria South Africa

B Reyers
et al
copy 2007 The Authors
610
Diversity and Distributions
13
608ndash619 Journal compilation copy 2007 Blackwell Publishing Ltd
Agriculture and Marine and Coastal Management) were involved
in the NSBA through a series of consultative workshops A full
list of participants is available in Driver
et al
(2005)
A systematic approach
A systematic conservation assessment which ensures the
identification of priority areas for conservation action in a
rigorous target-driven and defensible fashion (Margules amp Pressey
2000) was the approach adopted by the NSBA The assessment
consisted of four stages data collation conservation target setting
review of existing conservation areas and the identification of
spatially explicit priority areas (Margules amp Pressey 2000) The
systematic approach followed is detailed in Rouget
et al
(2004)
and is only briefly summarized here
Data were collated on the distribution of biodiversity pattern
and processes protected areas and irreversible habitat loss
Biodiversity pattern data included the distribution and extent of
ecosystems including 441 vegetation types (Mucina
et al
2005)
259 estuaries and 17 wetlands as well as presence data for 449
animal (vertebrate and invertebrate) and 11572 plant species of
special concern at a quarter degree square (~700 km
2
) resolu-
tion Sources and data descriptions can be found in Rouget
et al
(2004) Species of special concern are defined as threatened and
endemic species based on National Red Data Lists national
conservation assessments and expert opinion Spatial surrogates
of ecological and evolutionary processes included high water
yield areas (Schulze
et al
1997) carbon sequestration (Scholes amp
Noble 2001) climate change resilience (Midgley
et al
2001)
biogeographical nodes (Heads 2004) and the Great Escarpment
The last-mentioned feature is a product of post-Gondwanan
erosive forces that separates a coastal and upland plain throughout
southern Africa and harbours a related biota that is distinct from
these adjacent plains It is a major migratory pathway for a
temperate biota includes numerous biotic refugia and owing to
its varied topography is home to a rich flora and fauna (Acocks
1953 Werger 1978 van Wyk amp Smith 2001)
Areas of current habitat loss were extracted from land cover
and road coverage data Only type 1 protected areas which
include national parks provincial nature reserves local authority
nature reserves and DWAF Forest Nature Reserves were used in
the assessment as the degree of protection of biodiversity in the
other types of protected areas is less certain
Conservation targets were set for vegetation types wetlands
estuaries and species For vegetation types we used the method-
ology developed by Desmet amp Cowling (2004) that uses actual
plant biodiversity data to estimate targets This approach uses the
extrapolated speciesndasharea relationship derived from an analysis
of phytosociological releveacute data within each vegetation type
Owing to the absence of sufficient releveacute data for all vegetation
types in South African the 438 types were classified into 47
higher-order groups comprising floristically and structurally
similar vegetation types and the targets extrapolated to allied
vegetation types within these groupings Vegetation targets
Figure 1 Map of the study area showing the seven biomes provincial boundaries and provincial capital cities Waterbodies and infrastructure are not depicted in this figure
Products for conservation decisions
copy 2007 The Authors
Diversity and Distributions
13
608ndash619 Journal compilation copy 2007 Blackwell Publishing Ltd
611
ranged from 16 to 36 of the original extent of each vegetation
type based on an agreed upon conservation goal of representing
at least 75 of species that occur in each vegetation type For
forest vegetation types targets were set in consultation with
experts based on an independent forest biome assessment
(Berliner amp Benn 2004) and ranged from 30 to 100
A target of 20 or three occurrences (whichever was greatest)
was set for each estuary and wetland type In addition a target of
100 was set for the wetlands and estuaries listed as being of
international importance Targets for species data were set as one
locality per species and 100 of localities for critically en-
dangered species (more sophisticated targets were not possible
due to the coarse resolution of the data and the lack of abundance
information)
Spatial surrogates of ecological processes are more difficult
when it comes to setting targets In many cases an ecological
process ideally needs all or most of the area to remain in a natural
or near-natural state to continue functioning although not
necessarily formally protected (Pressey
et al
2003) The NSBA
integrated the spatial surrogates of ecological processes using a
scoring system (explained below) without setting explicit targets
for them The systematic conservation assessment was con-
ducted in a Geographic Information Systems environment using
33 (ESRI Redlands CA USA) and
(Pressey
1999) software
Developing and interpreting conservation planning products
The NSBA aimed to produce as an end product an overall map
of broad-scale priority areas for conservation action in South
Africa The map integrates information on several levels of
biodiversity (species ecosystems and processes) existing
conservation efforts gaps in target achievement and pressures
facing biodiversity Although a single map of priorities is useful
for directing future conservation actions its complexity in terms
of inputs and analyses makes it difficult to interpret for strategy
development and subsequent implementation Consequently
it was decided to develop two additional user-useful and user-
friendly products maps of ecosystem status and protection levels
Products of systematic conservation assessments usually
include measures of conservation value (eg irreplaceability
Ferrier
et al
2000) expressed per planning unit (grid cells or
cadastral units) Although meaningful to conservation scientists
and an essential tool for implementing conservation action these
products are dynamic and require simplification explanation
and interpretation before they become useful to implementers
(Prendergast
et al
1999 Theobald
et al
2000 Driver
et al
2003 Pierce
et al
2005) Thus in the development of outputs
the NSBA followed Driver
et al
(2003) and Pierce
et al
(2005) by
displaying the static conservation value and priority status
of actual biodiversity features (see also Olson amp Dinerstein
2002)
These ecosystem status and protection level products were
based on ecosystem level features (eg vegetation types) the
coarse-scale resolution of the species data and the absence of
abundance information rendered the species level unsuitable for
product development For each of these products a list of possible
applications and actions was developed together with the
implementing agencies The development of the ecosystem
status protection level and overall priority map products is
described below
Ecosystem status product
The first spatial product mdash ecosystem
status mdash aims to identify threatened ecosystems (here vegetation
types as defined by Mucina
et al
2005) Consistent with the
approach of Ricketts
et al
(1999) Olson amp Dinerstein (2002)
and Burgess
et al
(2004) the assessment of ecosystem status is
based on the classification scheme developed by IUCN to categorize
species into among other categories critically endangered
endangered and vulnerable (Mace amp Lande 1991 IUCN 1994
2001) The assessment by Ricketts
et al
(1999) Olson amp
Dinerstein (2002) and Burgess
et al
(2004) uses a weighted
scoring system for each ecosystem (measured as ecoregions)
based on the extent of habitat loss degradation and fragmen-
tation This status is then combined with a measure of biological
distinctiveness per ecoregion to allocate ecoregions to conservation
management classes
The NSBA based their approach on Pierce
et al
(2005) who
classified vegetation types into ecosystem status categories of
critically endangered endangered and vulnerable based on the
difference between the conservation target and the extant habitat
of each vegetation type This approach takes into consideration
plant species richness and turnover (through conservation
targets described above) as well as habitat loss It classifies vegetation
types into endangerment categories in terms of the predicted
persistence of their biodiversity based on the extensive yet largely
theoretical literature on ecological thresholds (Andreacuten 1994
Franklin amp Forman 1987 Fahrig 2001 Flather amp Bevers 2002
see Huggett 2005 for review) Although data on the degree of
fragmentation and degradation of the remaining natural habitat
would have been valuable supplementary information in an
analysis of ecosystem status the land cover data mapped at a
1 250000 scale and 1 km
2
grid cell size were considered
inappropriate for a fragmentation analysis Future iterations of
this assessment will take both fragmentation and degradation
into account as newer land cover products are mapped at finer
resolutions
Vegetation types with extant habitat of
ge
80 were classified
as least threatened (LT) and were assumed to have no significant
disruption of ecosystem functioning and minimal species loss As
extant habitat dropped to lt 80 some ecosystem functions
become impaired and species start to disappear These vegetation
types were classified as vulnerable (VU) If the amount of extant
habitat drops below 60 these losses become more severe and
the vegetation type is recognized as endangered (EN) Once the
extant habitat was
le
the conservation target of the vegetation
type it was classified as critically endangered (CR) These vegeta-
tion types have been transformed to such an extent that not only
is their ecosystem function severely disrupted but the remaining
habitat is less than that needed to support 75 of plant diversity
this category represents ecosystems with marked acceleration of
biodiversity loss (Andren 1994)
B Reyers
et al
copy 2007 The Authors
612
Diversity and Distributions
13
608ndash619 Journal compilation copy 2007 Blackwell Publishing Ltd
Figure 2 illustrates the ecosystem status map Owing to the
spatial pattern of habitat transformation in South Africa
critically endangered vegetation types with the exception of
forest types are mostly concentrated in the fynbos biome
(Fig 1) The forest and fynbos biomes have the greatest propor-
tion of critically endangered vegetation types The grasslands
have been considerably impacted by habitat transformation and
as a result most grassland vegetation types are classified as
endangered or vulnerable The desert Nama-karoo and succulent
karoo biomes have the highest proportion of least threatened
vegetation types Of the 438 vegetation types classified (lagoons
and lake systems were excluded) 21 (5) were critically en-
dangered 58 (13) were endangered 70 (16) were vulnerable
and 289 (66) were least threatened More detailed results can
be found in Rouget
et al
(2004) and Driver
et al
(2005)
Protection level product
Since South Africarsquos protected areas are
not distributed evenly over the landscape there are substantial
gaps in the countryrsquos protected area network (Edwards 1974) A
gap analysis (Scott
et al
1993) is often a useful way to identify
ecosystems without adequate protection and can either compute
the proportion of each ecosystem protected (Scott
et al
1993
Walker
et al
2006) or quantify the proportion relative to the
conservation targets for the ecosystem (Margules amp Pressey
2000) The latter approach was followed in the NSBA in order to
develop a spatial product that demonstrated the protection level
of the vegetation type in relation to differential biodiversity
pattern incorporated via the conservation target This product
differs from ecosystem status in that vegetation types without
adequate protection levels are mapped and prioritized irrespective
of the extent of habitat loss Well-protected ecosystems are
defined as vegetation types with 100 of their target area
conserved similarly moderately protected ecosystems poorly
protected and hardly protected ecosystems have at least 50
25 and 5 of their target areas conserved respectively
The forest fynbos desert and savanna biomes are the best
protected in terms of percentage of target area while the Nama-
karoo and grasslands are the least protected biomes (Fig 3) An
assessment of ecosystem protection level reveals that 110 (25)
vegetation types are not protected at all Furthermore an
additional 90 (21) vegetation types with only lt 5 of their
biodiversity target protected are hardly protected More than
300 (68) vegetation types have less than half of their biodiversity
target conserved in statutory protected areas Only 67 (15)
vegetation types are adequately conserved (in relation to their
conservation targets) in statutory protected areas 22 types of
fynbos 18 of savanna and seven of forest
Overall priority map
In the production of an overall priority
map we decided not to go the route of a single lsquoirreplaceabilityrsquo
(Pressey
et al
1993) assessment based on ecosystems species
and processes (Cowling
et al
2003) Although a powerful
conservation assessment tool the implementation constraints
associated with products that express dynamic conservation
values per planning unit (see Driver
et al
2003 Pierce
et al
2005) as well as the scale mismatch between the species and
other data sets and the lack of targets for processes made a single
irreplaceability assessment not feasible The NSBA therefore
used separate analyses to identify priorities at the ecosystem
and species levels as well as priorities for the conservation of
Figure 2 Ecosystem status map demonstrating the distribution and extent of vegetation types belonging to four classes of endangerment Least threatened (LT) vegetation types with ge 80 extant habitat are assumed to have no significant disruption of ecosystem functioning and minimal species loss When natural habitat extent is lt 80 some ecosystem functions become impaired and species start to disappear These vegetation types are classified as vulnerable (VU) When extant habitat is lt 60 losses become more severe and the vegetation type is recognized as endangered (EN) Types where extant habitat is le the conservation target are classified as critically endangered (CR) These vegetation types have been transformed to such an extent that not only is their ecosystem function severely disrupted but the remaining habitat is less than that needed to support 75 of plant diversity this category represents ecosystems with marked acceleration of biodiversity loss
Products for conservation decisions
copy 2007 The Authors
Diversity and Distributions
13
608ndash619 Journal compilation copy 2007 Blackwell Publishing Ltd
613
processes These analyses included the ecosystem status and
protection level assessments outlined above an irreplaceability
analysis of the species and ecosystem data and the expert
mapping of important national-scale ecological and evolutionary
processes The outputs of these separate analyses were then
scored standardized overlaid and summed to be integrated into
a single GIS layer of priority values (for more detail see Rouget
et al
2004) Based on this layer priority areas were delineated
as areas very important to one of the underlying analyses or
important to several
Figure 4 illustrates these final nine priority areas the bounda-
ries between which were delimited subjectively on the basis of
biome boundaries and topographical and climatic factors
Owing to the coarse scale of the data and various assessment
Figure 3 Ecosystem protection level based on the target achievement () of each vegetation type by type 1 protected areas Well-protected ecosystems are defined as vegetation types with 100 of their target area conserved similarly moderately protected ecosystems poorly protected and hardly protected ecosystems have at least 50 25 and 5 of their target areas conserved
Figure 4 Terrestrial biodiversity priority areas of South Africa identified through a multi-criteria analysis of species ecosystem ecological process and land cover data (see Rouget et al 2004 for details)
B Reyers
et al
copy 2007 The Authors
614
Diversity and Distributions
13
608ndash619 Journal compilation copy 2007 Blackwell Publishing Ltd
outputs priority areas defined here could not be identified at the
level of property boundaries Therefore the boundaries of the
final priority areas are rough estimates and should not be used
for decision-making at the local scale These priority areas
comprise 5497 million ha occupying 4336 of South Africa
The nine priority areas are North-eastern Escarpment Bushveld-
Bankenveld Moist Grasslands Central Grasslands South-eastern
Escarpment Maputaland-Pondoland Albany Thicket and Wild
Coast Cape Floristic Region and the Succulent Karoo
DISCUSSION
The NSBA a critique of the process and products
The NSBA set out to accomplish the dual challenges of developing
defensible products while at the same time ensuring these
products were user-useful and user-friendly (Driver
et al
2003)
The NSBA was released in April 2005 so it is perhaps too early to
assess the full extent to which it has achieved these aims We can
however review the process products and current uptake in an
effort to contribute to the growing body of conservation action
evaluation best practice and lessons learnt (Sutherland
et al
2004 Ferraro amp Pattanayak 2006 Knight
et al
2006b) Below
we review the defensibility and usability of the products and
conclude by proposing a way forward in the development of
products for national-scale conservation decision-making
Defensible products
Defensible products are those that have the support of the
conservation science community can withstand the peer review
process and are based on current best practice The NSBA
appears to exhibit these characteristics in that it (1) was
conducted by a large collaboration of conservation planning
scientists from universities science councils conservation agencies
and independent consultants generating broad support of the
products by the scientific community (see Driver
et al
2005 for
a full list of participants) (2) was submitted as a contribution to
this journal so that it could be subjected to international peer
review and (3) was based on a systematic approach reflecting
current best practice (Margules amp Pressey 2000)
The systematic approach involved the inclusion of species
(plant and animal) ecosystems and processes in the assessment
thereby ensuring that the priority areas identified cater for all
elements essential to the persistence of national biodiversity
(Balmford
et al
1998 Cowling
et al
1999 2004) while a focus
on representation complementarity and conservation targets
guaranteed accountable repeatable and defensible outputs
(Margules amp Pressey 2000 Rodrigues
et al 2000) This form of
national biodiversity assessment moves beyond approaches
based on a one or a limited number of taxa eg Important Bird
Areas (Barnes 1998) Centres of Plant Endemism (van Wyk amp
Smith 2001) and Key Biodiversity Areas (Eken et al 2004)
scoring eg biodiversity hotspots (Myers et al 2000 Mitter-
meier et al 2005) and entirely expert-derived priority areas
(Olivieri et al 1995 Hannah et al 1998 Kaltenborn et al
1999) The NSBA approach comprised the complementarity-
driven identification of priority areas which make measurable
contributions to national-scale conservation goals of biodiversity
representation and persistence This ability to objectively calculate
and defend the contribution each priority area makes to national
conservation goals sets this approach apart from other forms of
national biodiversity assessment It is important to emphasize
that the NSBA was not a reserve selection exercise used to
identify specific parcels of land for conservation action instead it
was based on a multi-criteria approach that allowed for the
integration of a suite of biodiversity assessment outputs at a
variety of scales into a single map of broad spatial conservation
priorities in South Africa
There are some data-related shortcomings in the NSBA that
may impact on its defensibility These shortcomings include
inadequate data on species distributions and pressures facing
biodiversity This resulted in products that are biased towards the
ecosystem level and do not adequately reflect status and priori-
ties at the species level Furthermore the land cover data used as
a measure of the pressures facing biodiversity are limited in that
they (1) are over 10 years old (2) do not incorporate habitat
degradation or fragmentation and (3) do not reflect pressures
like hunting collecting pollution and climate change This
implies that the results of the NSBA may underestimate the
degree of pressure and therefore the conservation status of South
Africarsquos biodiversity However the products of this assessment
are of broad-scale nature that may alleviate the impacts of data
inaccuracies it is at fine scale that these limitations become a
significant impediment and must be addressed Additional
shortcomings include a lack of spatially explicit information on
processes (eg major migratory pathways) as well as the thresholds
used in the ecosystem status and protection level assessments
The former reflects current (albeit flawed) practice of relying on
expert mapping of process components (eg Rouget et al
2003a) while the latter is constrained by thresholds derived from
theoretical modelling studies (see Huggett 2005 for review)
instead of field data
Useable products
The NBSA was conceived developed and conducted with a
strong focus on uptake by national and provincial resource
management agencies as a means of ensuring implementation It
was hoped that the NSBA would streamline the challenging
implementation of the NBSAP (DEAT 2005) through providing
a spatial focus that was easy to understand and use From a
review of policies and plans currently under development (see
below) in these national and provincial agencies as well as
anecdotal evidence the ecosystem status map appears most use-
ful and popular The protection levels of ecosystems and overall
priority areas are currently less widely used
Evidence of the popularity and uses of the NSBA products
particularly the ecosystem status products include the following
1 National policies and plans have made use of the NSBA
products (generally ecosystem status maps) eg National Spatial
Development Perspective (httpwwwidporgza) South African
Products for conservation decisions
copy 2007 The AuthorsDiversity and Distributions 13 608ndash619 Journal compilation copy 2007 Blackwell Publishing Ltd 615
Environmental Outlook 2005 (wwwenvironmentgovza)
National Strategy for Sustainable Development (DEAT 2006)
The National Biodiversity Framework currently under develop-
ment is based on the NBSAP and NSBA particularly the overall
priority areas
2 Many of the requirements of the National Environmental
Management Biodiversity Act (Act 10 of 2004) will rely on the
NSBA approach and products including the listing of national
threatened and protected ecosystems and the development of
norms and standards for bioregional plans (DEAT 2004)
3 National level decisions regarding protected area expansion
made by DEAT and the South African National Parks Board will
be guided by the protection level product (T Smith pers
comm)
4 The NSBA provides useful headline indicators (ecosystem
status and protection level) that can be tracked over time as part
of South Africarsquos national monitoring and evaluation framework
These indicators also correspond well with the monitoring
requirements of some of the headline indicators of the CBDrsquos
2010 Target (UNEP 2003 Balmford et al 2005 Reyers amp
McGeoch in press) This correspondence is highlighted in the
NBSAP (DEAT 2005) and will streamline South Africarsquos reporting
requirements to the CBD
5 At the provincial level the Western Cape Province has already
used the ecosystem status product as part of its Provincial Spatial
Development Framework for determining spatial planning
categories and guidelines for land-use decision-making across
the province (DEADP 2005a) Furthermore the Western Cape
State of Environment Report draws heavily on the NSBA for
biodiversity-related information and indicators (DEADP 2005b)
6 The Mpumalanga Provincial Conservation plan uses the
concept of ecosystem status applied to their ecosystem level data
The Free State North-west and Limpopo provinces have
adopted the NSBA approach and products for their planned
bioregional programmes (T Smith pers comm)
7 The need for a National Grasslands Biodiversity Programme
was supported by the overall priority map and a biome wide
priority area assessment used the outputs of the NSBA as an
input (Reyers et al 2005)
8 Anecdotal evidence suggests that good use is being made of the
ecosystem status layer for informing Environmental Impact
Assessments (EIA)
9 The popularity and rapid uptake of the ecosystem status
product appears to be largely due to it being a compelling and
accessible product that makes easier the work of implementing
agencies These strengths include the following
bull Ecosystem status maps were developed for all environments
(terrestrial river marine and estuarine) in a consistent way
using the same terminology and principles allowing for com-
parisons between the environments
bull Ecosystem status is an easy concept for most people to
understand including politicians and officials who have no
background or experience in biodiversity This understanding
is promoted by the similarity of conservation status categories
used in species assessments for Red Data Lists (IUCN 2001)
The maps have a strong visual logic using a sequence of
colours from red to green to reflect most threatened through
to least threatened ecosystems (Fig 2)
bull Ecosystem status can be assessed at all scales by a variety of
conservation practitioners The assessment of ecosystem
status is relatively simple requiring data on ecosystem extent
habitat loss a conservation target per ecosystem and some
basic GIS and conservation planning expertise and is thus not
limited to the domain of academics
Figure 5 Congruence of existing bioregional and provincial conservation plans and programmes in South Africa with the identified overall priority areas The high levels of congruence indicate that many of these priority areas have been previously identified in other sub-national or global assessments prior to the NSBA
CAPE Cape Action Plan for People and the
Environment STEP Subtropical Thicket
Ecosystem Planning Program
SKEP Succulent Karoo Ecosystem Plan
NGBP National Grasslands Biodiversity
Program
B Reyers et al
copy 2007 The Authors616 Diversity and Distributions 13 608ndash619 Journal compilation copy 2007 Blackwell Publishing Ltd
The protection level product has not witnessed similar broad
uptake This however is to be expected as it is of interest to only
a small group of national and provincial conservation agencies
with the mandate to establish statutory protected areas
Currently these agencies are making use of the product to guide
protected area expansion
Although not used as widely as the ecosystem status product
the map of overall priority areas has been received with great
interest by DEAT and forms the basis for the National Biodiversity
Framework It integrates information on the status of national
biodiversity in a single product that confirms that existing
bioregional programmes [Fig 5 such as the Subtropical Thicket
Ecosystem Programme (STEP) and the Cape Action Plan for
People and the Environment (CAPE)] are focusing their efforts
on national priority areas while identifying gaps in this bio-
regional coverage [eg providing motivation for the development
of the National Grasslands Biodiversity Programme (NGBP)] Its
popularity with some implementing agencies suggests that maps
of broad priority areas can be useful but if they are to be used to
maximum effect they need to be interpreted and accompanied by
clear explanations that point to their practical implications for
implementing agencies The next iteration of the NSBA in 5 years
time will have to address this challenge of conceptualizing more
effective and clear key messages for the overall priority map
CONCLUSION
In the short time since its release South Africarsquos first NSBA has
begun to achieve the desired uptake by implementing agencies
It was described by South Africarsquos Minister of Environmental
Affairs and Tourism as lsquogroundbreakingrsquo and a lsquouseful tool in
policy- and decision-making across all spheres of governmentrsquo
The existence within the NSBA team of significant conservation
planning expertise from several subnational conservation plans
and a strong spirit of collaboration between planners and
implementers played a significant role in ensuring that we based
this assessment on the lessons we have learnt from previous con-
servation plans (see Knight et al 2006b) Perhaps one of the
most important aspects of the NSBA is that it was conducted by
local conservation scientists who understood the institutional
context for the assessment and could communicate effectively
with implementing agencies The fact that this was an assessment
done by South Africans for South Africans promoted a sense of
ownership of the products and helped promote uptake
Despite these strengths the need to repeat this assessment
every 5 years and to contribute to the growing body of evalua-
tion and best practice for conservation implies that we need to
take a critical look at the process and products in an effort to
improve them and their effectiveness in the future We have
highlighted some of the data and information shortcomings that
should be addressed before the next iteration Furthermore this
evaluation of the NSBA products has supported the call being
made by many conservation scientists to go beyond implementa-
tion to the design of programme monitoring and evaluation
systems (Hockings 2003 Stem et al 2005) As Ferraro amp Pattanayak
(2006) point out the limited resources for conservation make the
assessment of the effectiveness of conservation interventions
essential if these resources are to stretch as far as possible One of
the biggest challenges in this paper was the evaluation of the
uptake and effectiveness of the NSBA we had to rely largely on
draft publications and anecdotal evidence from conversations
with implementing agency staff This may be due to the short
time period that has elapsed since the NSBA was released but it
is also a result of the lack of a monitoring programme with which
to assess and report on the effectiveness of the NSBA Several
frameworks exist for the monitoring of conservation effectiveness
(eg adaptive management frameworks Margoluis amp Salafsky
1998) and should certainly be reviewed and implemented before
the next NSBA iteration perhaps as part of the National
Biodiversity Monitoring and Reporting Framework currently
under development
REFERENCES
Acocks JPH (1953) Veld types of South Africa Memoirs of the
Botanical Society of South Africa 28 1ndash192
Andreacuten H (1994) Effects of habitat fragmentation on birds and
mammals in landscapes with different proportions of suitable
habitat a review Oikos 71 355ndash366
Balmford A Crane P Dobson A Green RE amp Mace GM
(2005) The 2010 challenge data availability information
needs and extraterrestrial insights Philosophical Transactions
of the Royal Society of London Series B Biological Sciences 360
221ndash228
Balmford A Mace GM amp Ginsberg JR (1998) The challenges
to conservation in a changing world putting processes on the
map Conservation in a changing world (ed by GM Mace A
Balmford and JR Ginsberg) pp 1ndash28 Cambridge University
Press Cambridge UK
Barnes KN ed (1998) The important bird areas of southern
Africa BirdLife Johannesburg South Africa
Berliner D amp Benn G (2004) Protected area planning for the forest
biome Prepared for DWAF WFSP Forestry Programme Depart-
ment of Water Affairs and Forestry Pretoria South Africa
Burgess N DrsquoAmico Hales J Underwood E Dinerstein E
Olson DM Itoua I Shipper J Ricketts TH amp Newman K
(2004) The terrestrial ecoregions of Africa and Madagascar
Island Press Washington DC
Cowling RM Knight AT Faith DP Ferrier S Lombard
AT Driver A Rouget M Maze K amp Desmet PG (2004)
Nature conservation requires more than a passion for species
Conservation Biology 18 1674ndash1677
Cowling RM Pressey RL Lombard AT Desmet PG amp
Ellis AG (1999) From representation to persistence require-
ments for a sustainable reserve system in the species-rich
Mediterranean-climate deserts of southern Africa Diversity
and Distributions 5 51ndash71
Cowling RM Pressey RL Rouget M amp Lombard AT
(2003) A conservation plan for a global biodiversity hotspot mdash
the Cape Floristic Region South Africa Biological Conservation
112 191ndash216
DEADP (2005a) Western Cape provincial spatial development
Products for conservation decisions
copy 2007 The AuthorsDiversity and Distributions 13 608ndash619 Journal compilation copy 2007 Blackwell Publishing Ltd 617
framework Provincial Government of the Western Cape
Department of Environmental Affairs and Development
Planning Cape Town httpwwwcapegatewaygovzaeng
pubsguidesW120505
DEADP (2005b) Western Cape state of the environment report
Provincial Government of the Western Cape Department of
Environmental Affairs and Development Planning Cape
Town httpwwwcapegatewaygovzaengpublications
reports_researchW120813
DEAT (2004) The National Environmental Management Biodiver-
sity Act No 10 of 2004 Department of Environmental Affairs and
Tourism Pretoria South Africa httpwwwenvironmentgovza
DEAT (2005) South Africarsquos National Biodiversity Strategy and
Action Plan Department of Environmental Affairs and Tourism
Pretoria South Africa
DEAT (2006) South Africarsquos National Strategy for Sustainable
Development Draft for Review Department of Environmental
Affairs and Tourism httpwwwenvironmentgovza
nssd_2005draft_intergrated_strat
Desmet P amp Cowling RM (2004) Using the speciesndasharea
relationship to set baseline targets for conservation Ecology
and Society 9 (11) httpwwwecologyandsocietyorgvol9
iss2art11
Driver A Cowling RM amp Maze K (2003) Planning for living
landscapes perspectives and lessons from South Africa Center
for Applied Biodiversity Science at Conservation Interna-
tional Washington DC and the Botanical Society of South
Africa Cape Town httpwwwbotanicalsocietyorgza
defaultphppageID=ccuccu_downloadshtm
Driver A Maze K Rouget M Lombard AT Nel J Turpie
JK Cowling RM Desmet P Goodman P Harris J Jonas
Z Reyers B Sink K amp Strauss T (2005) National Spatial
Biodiversity Assessment 2004 priorities for biodiversity con-
servation in South Africa Strelitzia 17 South African National
Biodiversity Institute Pretoria South Africa http
wwwsanbiorgbiodiversitynsbahtm
Edwards D (1974) Survey to determine the adequacy of existing
conserved areas in relation to vegetation types A preliminary
report Koedoe 17 3ndash38
Eken G Bennun L Brooks TM Darwall W Fishpool
LDC Foster M Knox D Langhammer P Matiku P
Radford E Salaman P Sechrest W Smith ML Spector S
amp Tordoff A (2004) Key biodiversity areas as site conservation
targets Bioscience 54 1110ndash1118
Fahrig L (2001) How much habitat is enough Biological
Conservation 100 65ndash74
Fairbanks DHK Thompson MW Vink DE Newby
TS van den Berg HM amp Everard DA (2000) The
South African land-cover characteristics database a synopsis of
the landscape South African Journal of Science 96 69ndash82
Ferraro PJ amp Pattanayak SK (2006) Money for nothing A
call for empirical evaluation of biodiversity conservation
investments PloS Biology 4 (4) e105
Ferrier S Pressey RL amp Barrett TW (2000) A new predictor
of the irreplaceability of areas for achieving a conservation
goal its application to real-world planning and a research
agenda for further refinement Biological Conservation 93
303ndash325
Flather CH amp Bevers M (2002) Patchy reaction-diffusion and
population abundance The relative importance of habitat
amount and arrangement The American Naturalist 159 40ndash
56
Franklin JF amp Forman RTT (1987) Creating landscape
patterns by forest cutting ecological consequences and principles
Landscape Ecology 1 5ndash18
Freitag S Nicholls AO amp van Jaarsveld AS (1998) Dealing
with established reserve networks and incomplete distribution
data sets in conservation planning South African Journal of
Science 94 79ndash86
Glowka L Burhenne-Guilmin S Synge H McNeely JA amp
Guumlndling L (1994) A guide to the convention on biological
diversity Environmental Policy and Law Paper no 30 IUCN
Gland and Cambridge
Hannah L Rakotosamimanana B Ganzhorn J Mittermeier
RA Olivieri S Iyer L Rajaobelina S Hough J Andriami-
alisoa F Bowles I amp Tilken G (1998) Participatory plan-
ning scientific priorities and landscape conservation in
Madagascar Environmental Conservation 25 30ndash36
Heads M (2004) What is a node Journal of Biogeography 31
1883ndash1891
Hockings M (2003) Systems for assessing the effectiveness of
management in protected areas Bioscience 53 823ndash832
Huggett AJ (2005) The concept and utility of lsquoecological
thresholdsrsquo in biodiversity conservation Biological Conserva-
tion 124 301ndash310
IUCN (1994) IUCN red list categories IUCN Gland Switzer-
land
IUCN (2001) IUCN red list categories and criteria version 31
IUCN Species Survival Commission Gland Switzerland and
Cambridge UK
Kaltenborn BK Hanse R amp Hundeinde M (1999) National
park planning and local participation from a mountain region
in southern Norway Mountain Research and Development 19
51ndash61
Knight AT Cowling RM amp Campbell BM (2006a) Planning
for implementation an operational model for implementing
conservation action Conservation Biology 20 408ndash419
Knight AT Driver A Cowling RM Maze K Desmet PG
Lombard AT Rouget M Botha MA Boshoff AF
Castley JG Goodman PS MacKinnon K Pierce SM
Sims-Castley R Stewart WI amp von Hase A (2006b) Design-
ing systematic conservation assessments that promote effective
implementation best practice from South Africa Conservation
Biology 20 739ndash750
Lombard AT Strauss T Harris J Sink K Attwood C amp
Hutchings L (2004) South African National Biodiversity
Assessment 2004 technical report Volume 4 marine component
South African National Biodiversity Institute Pretoria South
Africa httpwwwsanbiorgza
Mace GM amp Lande R (1991) Assessing extinction threats
towards a reevaluation of IUCN threatened species categories
Conservation Biology 5 148ndash157
B Reyers et al
copy 2007 The Authors618 Diversity and Distributions 13 608ndash619 Journal compilation copy 2007 Blackwell Publishing Ltd
Margoluis R amp Salafsky N (1998) Measuring success designing
managing and monitoring conservation and development
projects Island Press Washington DC
Margules CR amp RLPressey (2000) Systematic conservation
planning Nature 405 37ndash47
Midgley G Rutherford M amp Bond W (2001) The heat is on
impacts of climate change on plant diversity in south Africa
National Botanic Institute Cape Town South Africa
Mittermeier RA Hoffmann M Pilgrim JD Brooks TB
Mittermeier CG Lamoreux JL amp Fonseca G (ed) (2005)
Hotspots revisited Earthrsquos biologically richest and most endangered
ecoregions Cemex Mexico City
Mucina L Rutherford MC amp Powrie LW (ed) (2005)
Vegetation map of South Africa Lesotho and Swaziland
1 1000000 scale sheet maps South African National Biodiver-
sity Institute Pretoria South Africa ISBN 1-919976-22-1
Myers N Mittermeier RA Mittermeier CG da Fonseca
GAB amp Kent J (2000) Biodiversity hotspots for conservation
priorities Nature 4032 853ndash858
Nel JL Roux DJ Maree G Kleynhans CJ Moolman J
Reyers B Rouget M amp Cowling RM (2007) A systematic
conservation assessment of the ecosystem status and protection
levels of main rivers Diversity and Distributions 13 341ndash352
Noss R (2003) A checklist for wildlands network designs
Conservation Biology 17 (5) 1ndash7
Olivieri S Bowles I Cavalcanti RB Fonseca GAB
Mittermeier RA amp Rostrom C (1995) A participatory
approach to biodiversity conservation the regional priority
setting workshop Conservation International Washington DC
Olson DM amp Dinerstein E (2002) The Global 200 priority
ecoregions for global conservation Annals of the Missouri
Botanical Garden 89 199ndash224
Pierce SM Cowling RM Knight AT Lombard AT
Rouget M amp Wolf T (2005) Systematic conservation
assessment products for landuse planning interpretation for
implementation Biological Conservation 125 441ndash548
Pierce SM Cowling RM Sandwith T amp MacKinnon K ed
(2002) Mainstreaming biodiversity in development case studies
from South Africa World Bank Washington DC
Prendergast JR Quinn RM amp Lawton JH (1999) The gaps
between theory and practice in selecting nature reserves
Conservation Biology 13 484ndash492
Pressey RL (1999) Applications of irreplaceability analysis to
planning and management problems Parks 9 42ndash51
Pressey RL Cowling RM amp Rouget M (2003) Formulating
conservation targets for biodiversity pattern and process in the
Cape Floristic Region South Africa Biological Conservation
112 99ndash127
Pressey RL Humphries CJ Margules CR Vane-Wright RI
amp Williams PH (1993) Beyond opportunism key principles
for systematic reserve selection Trends in Ecology amp Evolution
8 124ndash128
Pullin AS amp Knight TM (2001) Effectiveness in conservation
practice Pointers from medicine and public health Conserva-
tion Biology 15 50ndash54
Reyers B Fairbanks DHK van Jaarsveld AS amp Thompson
M (2001) Priority areas for the conservation of South African
vegetation a coarse filter approach Diversity and Distribu-
tions 7 77ndash96
Reyers B amp McGeoch M (in press) A biodiversity monitoring
framework for South Africa progress and directions South
African Journal of Science
Reyers B Nel J Egoh B Rouget M amp Jonas Z (2005) A
conservation assessment of South Africarsquos grassland biome
integrating terrestrial river ecosystem services and fine scale
priorities CSIR Report Number ENV-S-C 2005-102 CSIR
Stellenbosch Cape Town
Ricketts TH Dinerstein E Olson D Loucks CJ Eichbaum
W DellaSala D Kavanagh K Hedao P Hurley PT
Carney KM Abell R amp Walters S (1999) Terrestrial ecore-
gions of North America a conservation assessment Island Press
Washington DC
Rodrigues AS Cerdeira JO amp Gaston KJ (2000) Flexibility
efficiency and accountability adapting reserve selection
algorithms to more complex conservation problems Ecography
23 (5) 565ndash574
Rouget M Cowling RM Pressey RL amp Richardson DM
(2003a) Identifying the spatial components of ecological and
evolutionary processes for regional conservation planning in the
Cape Floristic Region Diversity and Distributions 9 191ndash210
Rouget M Richardson DM amp Cowling RM (2003b) The
current configuration of protected areas in the Cape Floristic
Region mdash reservation bias and representation of biodiversity
patterns and processes Biological Conservation 112 129ndash145
Rouget M Reyers B Jonas Z Desmet P Driver A Maze K
Egoh B amp Cowling RM (2004) South African National
Spatial Biodiversity Assessment 2004 Technical report Volume
1 terrestrial component South African National Biodiversity
Institute Pretoria httpwwwsanbiorgbiodiversitynsbahtm
Salafsky N Margoluis R Redford KH amp Robinson JG
(2002) Improving the practice of conservation a conceptual
framework and research agenda for conservation science
Conservation Biology 16 1469ndash1479
Scholes RJ amp Biggs R (ed) (2004) Ecosystem services in southern
Africa a regional assessment Council for Scientific and Indus-
trial Research Pretoria South Africa
Scholes RJ amp Noble IR (2001) Storing carbon on land Science
294 1012
Schulze RE Maharaj M Lynch SD Howe BJ amp Melvil-
Thomson B (1997) South African atlas of agrohydrology and
climatology Water Research Commission Report Pretoria
South Africa
Scott JM Davis F Csuti B Noss RF Butterfield B Groves C
Anderson H Caicco S DrsquoErchia F Edwards TC Uliman J
amp Wright G (1993) Gap analysis a geographic approach to
protection of biological diversity Wildlife Monographs 123 1ndash41
Stem C Margoluis R Salafsky N amp Brown M (2005)
Monitoring and evaluation in conservation A review of trends
and approaches Conservation Biology 19 295ndash309
Sutherland WJ Pullin AS Dolman PM amp Knight TM
(2004) The need for evidence-based conservation Trends in
Ecology amp Evolution 19 305ndash308
Products for conservation decisions
copy 2007 The AuthorsDiversity and Distributions 13 608ndash619 Journal compilation copy 2007 Blackwell Publishing Ltd 619
Theobald DM Hobbs NT Bearly T Zack JA Shenk T amp
Riebsame WE (2000) Incorporating biological information
in local land-use decision making designing a system for
conservation planning Landscape Ecology 15 35ndash45
UNEP (2003) Proposed biodiversity indicators relevant to the 2010
target UNEPCBDSBSTTA9INF26 httpwwwbiodivorgdoc
meetingssbsttasbstta-09informationsbstta-09-inf-26-enpdf
Walker S Price R Rutledge D Stephens T amp Lee WG
(2006) Recent loss of indigenous cover in New Zealand New
Zealand Journal of Ecology 30 (20) 169ndash177
Werger MJA (1978) Biogeographical division of southern
Africa Biogeography and ecology of southern Africa (ed by
MJA Werger) pp 147ndash170 Junk The Hague
Wilson KA Westphal MI Possingham HP amp Elith J (2005)
Sensitivity of conservation planning to different approaches to
using predicted species distribution data Biological Conserva-
tion 122 99ndash112
van Wyk AE amp Smith GF (2001) Regions of floristic endemism
in southern Africa a review with emphasis on succulents
Umdaus Press Pretoria South Africa
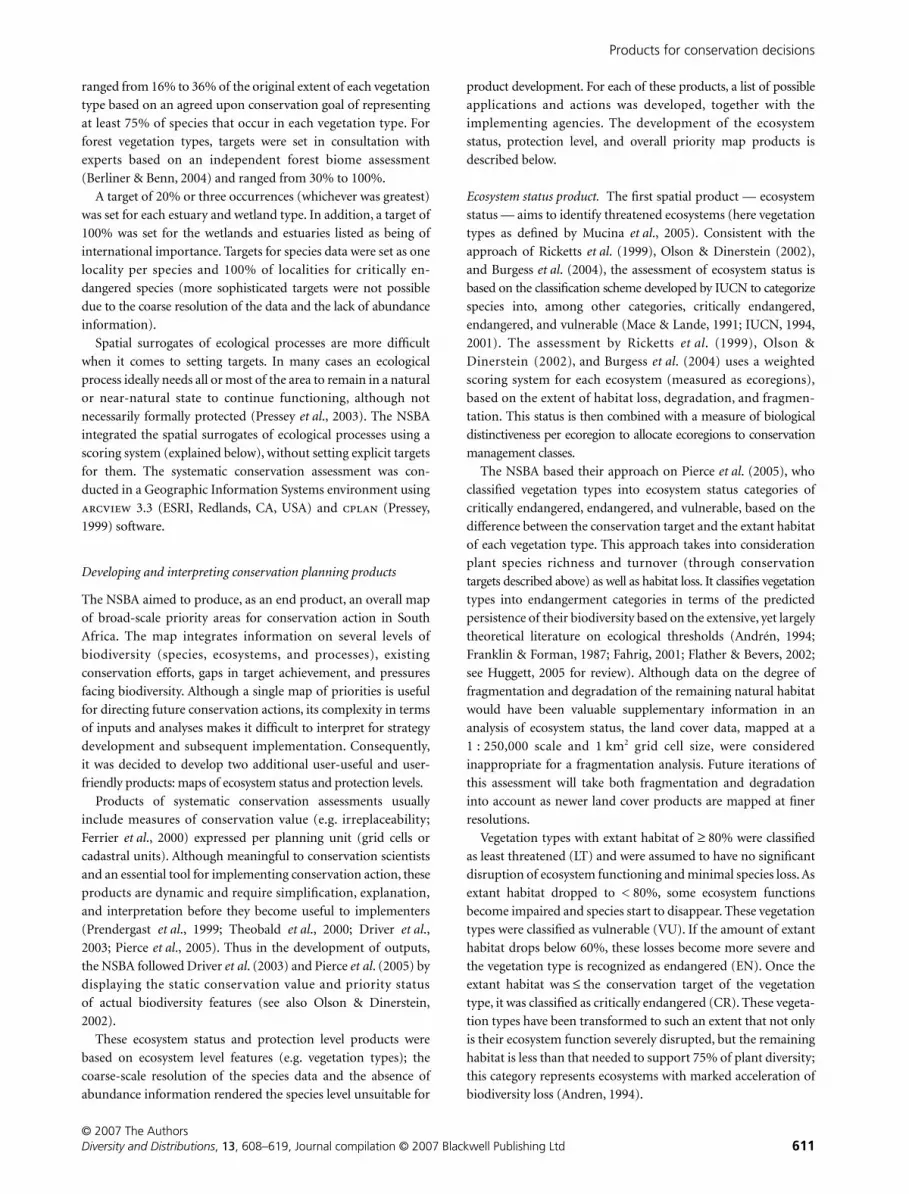
Products for conservation decisions
copy 2007 The Authors
Diversity and Distributions
13
608ndash619 Journal compilation copy 2007 Blackwell Publishing Ltd
611
ranged from 16 to 36 of the original extent of each vegetation
type based on an agreed upon conservation goal of representing
at least 75 of species that occur in each vegetation type For
forest vegetation types targets were set in consultation with
experts based on an independent forest biome assessment
(Berliner amp Benn 2004) and ranged from 30 to 100
A target of 20 or three occurrences (whichever was greatest)
was set for each estuary and wetland type In addition a target of
100 was set for the wetlands and estuaries listed as being of
international importance Targets for species data were set as one
locality per species and 100 of localities for critically en-
dangered species (more sophisticated targets were not possible
due to the coarse resolution of the data and the lack of abundance
information)
Spatial surrogates of ecological processes are more difficult
when it comes to setting targets In many cases an ecological
process ideally needs all or most of the area to remain in a natural
or near-natural state to continue functioning although not
necessarily formally protected (Pressey
et al
2003) The NSBA
integrated the spatial surrogates of ecological processes using a
scoring system (explained below) without setting explicit targets
for them The systematic conservation assessment was con-
ducted in a Geographic Information Systems environment using
33 (ESRI Redlands CA USA) and
(Pressey
1999) software
Developing and interpreting conservation planning products
The NSBA aimed to produce as an end product an overall map
of broad-scale priority areas for conservation action in South
Africa The map integrates information on several levels of
biodiversity (species ecosystems and processes) existing
conservation efforts gaps in target achievement and pressures
facing biodiversity Although a single map of priorities is useful
for directing future conservation actions its complexity in terms
of inputs and analyses makes it difficult to interpret for strategy
development and subsequent implementation Consequently
it was decided to develop two additional user-useful and user-
friendly products maps of ecosystem status and protection levels
Products of systematic conservation assessments usually
include measures of conservation value (eg irreplaceability
Ferrier
et al
2000) expressed per planning unit (grid cells or
cadastral units) Although meaningful to conservation scientists
and an essential tool for implementing conservation action these
products are dynamic and require simplification explanation
and interpretation before they become useful to implementers
(Prendergast
et al
1999 Theobald
et al
2000 Driver
et al
2003 Pierce
et al
2005) Thus in the development of outputs
the NSBA followed Driver
et al
(2003) and Pierce
et al
(2005) by
displaying the static conservation value and priority status
of actual biodiversity features (see also Olson amp Dinerstein
2002)
These ecosystem status and protection level products were
based on ecosystem level features (eg vegetation types) the
coarse-scale resolution of the species data and the absence of
abundance information rendered the species level unsuitable for
product development For each of these products a list of possible
applications and actions was developed together with the
implementing agencies The development of the ecosystem
status protection level and overall priority map products is
described below
Ecosystem status product
The first spatial product mdash ecosystem
status mdash aims to identify threatened ecosystems (here vegetation
types as defined by Mucina
et al
2005) Consistent with the
approach of Ricketts
et al
(1999) Olson amp Dinerstein (2002)
and Burgess
et al
(2004) the assessment of ecosystem status is
based on the classification scheme developed by IUCN to categorize
species into among other categories critically endangered
endangered and vulnerable (Mace amp Lande 1991 IUCN 1994
2001) The assessment by Ricketts
et al
(1999) Olson amp
Dinerstein (2002) and Burgess
et al
(2004) uses a weighted
scoring system for each ecosystem (measured as ecoregions)
based on the extent of habitat loss degradation and fragmen-
tation This status is then combined with a measure of biological
distinctiveness per ecoregion to allocate ecoregions to conservation
management classes
The NSBA based their approach on Pierce
et al
(2005) who
classified vegetation types into ecosystem status categories of
critically endangered endangered and vulnerable based on the
difference between the conservation target and the extant habitat
of each vegetation type This approach takes into consideration
plant species richness and turnover (through conservation
targets described above) as well as habitat loss It classifies vegetation
types into endangerment categories in terms of the predicted
persistence of their biodiversity based on the extensive yet largely
theoretical literature on ecological thresholds (Andreacuten 1994
Franklin amp Forman 1987 Fahrig 2001 Flather amp Bevers 2002
see Huggett 2005 for review) Although data on the degree of
fragmentation and degradation of the remaining natural habitat
would have been valuable supplementary information in an
analysis of ecosystem status the land cover data mapped at a
1 250000 scale and 1 km
2
grid cell size were considered
inappropriate for a fragmentation analysis Future iterations of
this assessment will take both fragmentation and degradation
into account as newer land cover products are mapped at finer
resolutions
Vegetation types with extant habitat of
ge
80 were classified
as least threatened (LT) and were assumed to have no significant
disruption of ecosystem functioning and minimal species loss As
extant habitat dropped to lt 80 some ecosystem functions
become impaired and species start to disappear These vegetation
types were classified as vulnerable (VU) If the amount of extant
habitat drops below 60 these losses become more severe and
the vegetation type is recognized as endangered (EN) Once the
extant habitat was
le
the conservation target of the vegetation
type it was classified as critically endangered (CR) These vegeta-
tion types have been transformed to such an extent that not only
is their ecosystem function severely disrupted but the remaining
habitat is less than that needed to support 75 of plant diversity
this category represents ecosystems with marked acceleration of
biodiversity loss (Andren 1994)
B Reyers
et al
copy 2007 The Authors
612
Diversity and Distributions
13
608ndash619 Journal compilation copy 2007 Blackwell Publishing Ltd
Figure 2 illustrates the ecosystem status map Owing to the
spatial pattern of habitat transformation in South Africa
critically endangered vegetation types with the exception of
forest types are mostly concentrated in the fynbos biome
(Fig 1) The forest and fynbos biomes have the greatest propor-
tion of critically endangered vegetation types The grasslands
have been considerably impacted by habitat transformation and
as a result most grassland vegetation types are classified as
endangered or vulnerable The desert Nama-karoo and succulent
karoo biomes have the highest proportion of least threatened
vegetation types Of the 438 vegetation types classified (lagoons
and lake systems were excluded) 21 (5) were critically en-
dangered 58 (13) were endangered 70 (16) were vulnerable
and 289 (66) were least threatened More detailed results can
be found in Rouget
et al
(2004) and Driver
et al
(2005)
Protection level product
Since South Africarsquos protected areas are
not distributed evenly over the landscape there are substantial
gaps in the countryrsquos protected area network (Edwards 1974) A
gap analysis (Scott
et al
1993) is often a useful way to identify
ecosystems without adequate protection and can either compute
the proportion of each ecosystem protected (Scott
et al
1993
Walker
et al
2006) or quantify the proportion relative to the
conservation targets for the ecosystem (Margules amp Pressey
2000) The latter approach was followed in the NSBA in order to
develop a spatial product that demonstrated the protection level
of the vegetation type in relation to differential biodiversity
pattern incorporated via the conservation target This product
differs from ecosystem status in that vegetation types without
adequate protection levels are mapped and prioritized irrespective
of the extent of habitat loss Well-protected ecosystems are
defined as vegetation types with 100 of their target area
conserved similarly moderately protected ecosystems poorly
protected and hardly protected ecosystems have at least 50
25 and 5 of their target areas conserved respectively
The forest fynbos desert and savanna biomes are the best
protected in terms of percentage of target area while the Nama-
karoo and grasslands are the least protected biomes (Fig 3) An
assessment of ecosystem protection level reveals that 110 (25)
vegetation types are not protected at all Furthermore an
additional 90 (21) vegetation types with only lt 5 of their
biodiversity target protected are hardly protected More than
300 (68) vegetation types have less than half of their biodiversity
target conserved in statutory protected areas Only 67 (15)
vegetation types are adequately conserved (in relation to their
conservation targets) in statutory protected areas 22 types of
fynbos 18 of savanna and seven of forest
Overall priority map
In the production of an overall priority
map we decided not to go the route of a single lsquoirreplaceabilityrsquo
(Pressey
et al
1993) assessment based on ecosystems species
and processes (Cowling
et al
2003) Although a powerful
conservation assessment tool the implementation constraints
associated with products that express dynamic conservation
values per planning unit (see Driver
et al
2003 Pierce
et al
2005) as well as the scale mismatch between the species and
other data sets and the lack of targets for processes made a single
irreplaceability assessment not feasible The NSBA therefore
used separate analyses to identify priorities at the ecosystem
and species levels as well as priorities for the conservation of
Figure 2 Ecosystem status map demonstrating the distribution and extent of vegetation types belonging to four classes of endangerment Least threatened (LT) vegetation types with ge 80 extant habitat are assumed to have no significant disruption of ecosystem functioning and minimal species loss When natural habitat extent is lt 80 some ecosystem functions become impaired and species start to disappear These vegetation types are classified as vulnerable (VU) When extant habitat is lt 60 losses become more severe and the vegetation type is recognized as endangered (EN) Types where extant habitat is le the conservation target are classified as critically endangered (CR) These vegetation types have been transformed to such an extent that not only is their ecosystem function severely disrupted but the remaining habitat is less than that needed to support 75 of plant diversity this category represents ecosystems with marked acceleration of biodiversity loss
Products for conservation decisions
copy 2007 The Authors
Diversity and Distributions
13
608ndash619 Journal compilation copy 2007 Blackwell Publishing Ltd
613
processes These analyses included the ecosystem status and
protection level assessments outlined above an irreplaceability
analysis of the species and ecosystem data and the expert
mapping of important national-scale ecological and evolutionary
processes The outputs of these separate analyses were then
scored standardized overlaid and summed to be integrated into
a single GIS layer of priority values (for more detail see Rouget
et al
2004) Based on this layer priority areas were delineated
as areas very important to one of the underlying analyses or
important to several
Figure 4 illustrates these final nine priority areas the bounda-
ries between which were delimited subjectively on the basis of
biome boundaries and topographical and climatic factors
Owing to the coarse scale of the data and various assessment
Figure 3 Ecosystem protection level based on the target achievement () of each vegetation type by type 1 protected areas Well-protected ecosystems are defined as vegetation types with 100 of their target area conserved similarly moderately protected ecosystems poorly protected and hardly protected ecosystems have at least 50 25 and 5 of their target areas conserved
Figure 4 Terrestrial biodiversity priority areas of South Africa identified through a multi-criteria analysis of species ecosystem ecological process and land cover data (see Rouget et al 2004 for details)
B Reyers
et al
copy 2007 The Authors
614
Diversity and Distributions
13
608ndash619 Journal compilation copy 2007 Blackwell Publishing Ltd
outputs priority areas defined here could not be identified at the
level of property boundaries Therefore the boundaries of the
final priority areas are rough estimates and should not be used
for decision-making at the local scale These priority areas
comprise 5497 million ha occupying 4336 of South Africa
The nine priority areas are North-eastern Escarpment Bushveld-
Bankenveld Moist Grasslands Central Grasslands South-eastern
Escarpment Maputaland-Pondoland Albany Thicket and Wild
Coast Cape Floristic Region and the Succulent Karoo
DISCUSSION
The NSBA a critique of the process and products
The NSBA set out to accomplish the dual challenges of developing
defensible products while at the same time ensuring these
products were user-useful and user-friendly (Driver
et al
2003)
The NSBA was released in April 2005 so it is perhaps too early to
assess the full extent to which it has achieved these aims We can
however review the process products and current uptake in an
effort to contribute to the growing body of conservation action
evaluation best practice and lessons learnt (Sutherland
et al
2004 Ferraro amp Pattanayak 2006 Knight
et al
2006b) Below
we review the defensibility and usability of the products and
conclude by proposing a way forward in the development of
products for national-scale conservation decision-making
Defensible products
Defensible products are those that have the support of the
conservation science community can withstand the peer review
process and are based on current best practice The NSBA
appears to exhibit these characteristics in that it (1) was
conducted by a large collaboration of conservation planning
scientists from universities science councils conservation agencies
and independent consultants generating broad support of the
products by the scientific community (see Driver
et al
2005 for
a full list of participants) (2) was submitted as a contribution to
this journal so that it could be subjected to international peer
review and (3) was based on a systematic approach reflecting
current best practice (Margules amp Pressey 2000)
The systematic approach involved the inclusion of species
(plant and animal) ecosystems and processes in the assessment
thereby ensuring that the priority areas identified cater for all
elements essential to the persistence of national biodiversity
(Balmford
et al
1998 Cowling
et al
1999 2004) while a focus
on representation complementarity and conservation targets
guaranteed accountable repeatable and defensible outputs
(Margules amp Pressey 2000 Rodrigues
et al 2000) This form of
national biodiversity assessment moves beyond approaches
based on a one or a limited number of taxa eg Important Bird
Areas (Barnes 1998) Centres of Plant Endemism (van Wyk amp
Smith 2001) and Key Biodiversity Areas (Eken et al 2004)
scoring eg biodiversity hotspots (Myers et al 2000 Mitter-
meier et al 2005) and entirely expert-derived priority areas
(Olivieri et al 1995 Hannah et al 1998 Kaltenborn et al
1999) The NSBA approach comprised the complementarity-
driven identification of priority areas which make measurable
contributions to national-scale conservation goals of biodiversity
representation and persistence This ability to objectively calculate
and defend the contribution each priority area makes to national
conservation goals sets this approach apart from other forms of
national biodiversity assessment It is important to emphasize
that the NSBA was not a reserve selection exercise used to
identify specific parcels of land for conservation action instead it
was based on a multi-criteria approach that allowed for the
integration of a suite of biodiversity assessment outputs at a
variety of scales into a single map of broad spatial conservation
priorities in South Africa
There are some data-related shortcomings in the NSBA that
may impact on its defensibility These shortcomings include
inadequate data on species distributions and pressures facing
biodiversity This resulted in products that are biased towards the
ecosystem level and do not adequately reflect status and priori-
ties at the species level Furthermore the land cover data used as
a measure of the pressures facing biodiversity are limited in that
they (1) are over 10 years old (2) do not incorporate habitat
degradation or fragmentation and (3) do not reflect pressures
like hunting collecting pollution and climate change This
implies that the results of the NSBA may underestimate the
degree of pressure and therefore the conservation status of South
Africarsquos biodiversity However the products of this assessment
are of broad-scale nature that may alleviate the impacts of data
inaccuracies it is at fine scale that these limitations become a
significant impediment and must be addressed Additional
shortcomings include a lack of spatially explicit information on
processes (eg major migratory pathways) as well as the thresholds
used in the ecosystem status and protection level assessments
The former reflects current (albeit flawed) practice of relying on
expert mapping of process components (eg Rouget et al
2003a) while the latter is constrained by thresholds derived from
theoretical modelling studies (see Huggett 2005 for review)
instead of field data
Useable products
The NBSA was conceived developed and conducted with a
strong focus on uptake by national and provincial resource
management agencies as a means of ensuring implementation It
was hoped that the NSBA would streamline the challenging
implementation of the NBSAP (DEAT 2005) through providing
a spatial focus that was easy to understand and use From a
review of policies and plans currently under development (see
below) in these national and provincial agencies as well as
anecdotal evidence the ecosystem status map appears most use-
ful and popular The protection levels of ecosystems and overall
priority areas are currently less widely used
Evidence of the popularity and uses of the NSBA products
particularly the ecosystem status products include the following
1 National policies and plans have made use of the NSBA
products (generally ecosystem status maps) eg National Spatial
Development Perspective (httpwwwidporgza) South African
Products for conservation decisions
copy 2007 The AuthorsDiversity and Distributions 13 608ndash619 Journal compilation copy 2007 Blackwell Publishing Ltd 615
Environmental Outlook 2005 (wwwenvironmentgovza)
National Strategy for Sustainable Development (DEAT 2006)
The National Biodiversity Framework currently under develop-
ment is based on the NBSAP and NSBA particularly the overall
priority areas
2 Many of the requirements of the National Environmental
Management Biodiversity Act (Act 10 of 2004) will rely on the
NSBA approach and products including the listing of national
threatened and protected ecosystems and the development of
norms and standards for bioregional plans (DEAT 2004)
3 National level decisions regarding protected area expansion
made by DEAT and the South African National Parks Board will
be guided by the protection level product (T Smith pers
comm)
4 The NSBA provides useful headline indicators (ecosystem
status and protection level) that can be tracked over time as part
of South Africarsquos national monitoring and evaluation framework
These indicators also correspond well with the monitoring
requirements of some of the headline indicators of the CBDrsquos
2010 Target (UNEP 2003 Balmford et al 2005 Reyers amp
McGeoch in press) This correspondence is highlighted in the
NBSAP (DEAT 2005) and will streamline South Africarsquos reporting
requirements to the CBD
5 At the provincial level the Western Cape Province has already
used the ecosystem status product as part of its Provincial Spatial
Development Framework for determining spatial planning
categories and guidelines for land-use decision-making across
the province (DEADP 2005a) Furthermore the Western Cape
State of Environment Report draws heavily on the NSBA for
biodiversity-related information and indicators (DEADP 2005b)
6 The Mpumalanga Provincial Conservation plan uses the
concept of ecosystem status applied to their ecosystem level data
The Free State North-west and Limpopo provinces have
adopted the NSBA approach and products for their planned
bioregional programmes (T Smith pers comm)
7 The need for a National Grasslands Biodiversity Programme
was supported by the overall priority map and a biome wide
priority area assessment used the outputs of the NSBA as an
input (Reyers et al 2005)
8 Anecdotal evidence suggests that good use is being made of the
ecosystem status layer for informing Environmental Impact
Assessments (EIA)
9 The popularity and rapid uptake of the ecosystem status
product appears to be largely due to it being a compelling and
accessible product that makes easier the work of implementing
agencies These strengths include the following
bull Ecosystem status maps were developed for all environments
(terrestrial river marine and estuarine) in a consistent way
using the same terminology and principles allowing for com-
parisons between the environments
bull Ecosystem status is an easy concept for most people to
understand including politicians and officials who have no
background or experience in biodiversity This understanding
is promoted by the similarity of conservation status categories
used in species assessments for Red Data Lists (IUCN 2001)
The maps have a strong visual logic using a sequence of
colours from red to green to reflect most threatened through
to least threatened ecosystems (Fig 2)
bull Ecosystem status can be assessed at all scales by a variety of
conservation practitioners The assessment of ecosystem
status is relatively simple requiring data on ecosystem extent
habitat loss a conservation target per ecosystem and some
basic GIS and conservation planning expertise and is thus not
limited to the domain of academics
Figure 5 Congruence of existing bioregional and provincial conservation plans and programmes in South Africa with the identified overall priority areas The high levels of congruence indicate that many of these priority areas have been previously identified in other sub-national or global assessments prior to the NSBA
CAPE Cape Action Plan for People and the
Environment STEP Subtropical Thicket
Ecosystem Planning Program
SKEP Succulent Karoo Ecosystem Plan
NGBP National Grasslands Biodiversity
Program
B Reyers et al
copy 2007 The Authors616 Diversity and Distributions 13 608ndash619 Journal compilation copy 2007 Blackwell Publishing Ltd
The protection level product has not witnessed similar broad
uptake This however is to be expected as it is of interest to only
a small group of national and provincial conservation agencies
with the mandate to establish statutory protected areas
Currently these agencies are making use of the product to guide
protected area expansion
Although not used as widely as the ecosystem status product
the map of overall priority areas has been received with great
interest by DEAT and forms the basis for the National Biodiversity
Framework It integrates information on the status of national
biodiversity in a single product that confirms that existing
bioregional programmes [Fig 5 such as the Subtropical Thicket
Ecosystem Programme (STEP) and the Cape Action Plan for
People and the Environment (CAPE)] are focusing their efforts
on national priority areas while identifying gaps in this bio-
regional coverage [eg providing motivation for the development
of the National Grasslands Biodiversity Programme (NGBP)] Its
popularity with some implementing agencies suggests that maps
of broad priority areas can be useful but if they are to be used to
maximum effect they need to be interpreted and accompanied by
clear explanations that point to their practical implications for
implementing agencies The next iteration of the NSBA in 5 years
time will have to address this challenge of conceptualizing more
effective and clear key messages for the overall priority map
CONCLUSION
In the short time since its release South Africarsquos first NSBA has
begun to achieve the desired uptake by implementing agencies
It was described by South Africarsquos Minister of Environmental
Affairs and Tourism as lsquogroundbreakingrsquo and a lsquouseful tool in
policy- and decision-making across all spheres of governmentrsquo
The existence within the NSBA team of significant conservation
planning expertise from several subnational conservation plans
and a strong spirit of collaboration between planners and
implementers played a significant role in ensuring that we based
this assessment on the lessons we have learnt from previous con-
servation plans (see Knight et al 2006b) Perhaps one of the
most important aspects of the NSBA is that it was conducted by
local conservation scientists who understood the institutional
context for the assessment and could communicate effectively
with implementing agencies The fact that this was an assessment
done by South Africans for South Africans promoted a sense of
ownership of the products and helped promote uptake
Despite these strengths the need to repeat this assessment
every 5 years and to contribute to the growing body of evalua-
tion and best practice for conservation implies that we need to
take a critical look at the process and products in an effort to
improve them and their effectiveness in the future We have
highlighted some of the data and information shortcomings that
should be addressed before the next iteration Furthermore this
evaluation of the NSBA products has supported the call being
made by many conservation scientists to go beyond implementa-
tion to the design of programme monitoring and evaluation
systems (Hockings 2003 Stem et al 2005) As Ferraro amp Pattanayak
(2006) point out the limited resources for conservation make the
assessment of the effectiveness of conservation interventions
essential if these resources are to stretch as far as possible One of
the biggest challenges in this paper was the evaluation of the
uptake and effectiveness of the NSBA we had to rely largely on
draft publications and anecdotal evidence from conversations
with implementing agency staff This may be due to the short
time period that has elapsed since the NSBA was released but it
is also a result of the lack of a monitoring programme with which
to assess and report on the effectiveness of the NSBA Several
frameworks exist for the monitoring of conservation effectiveness
(eg adaptive management frameworks Margoluis amp Salafsky
1998) and should certainly be reviewed and implemented before
the next NSBA iteration perhaps as part of the National
Biodiversity Monitoring and Reporting Framework currently
under development
REFERENCES
Acocks JPH (1953) Veld types of South Africa Memoirs of the
Botanical Society of South Africa 28 1ndash192
Andreacuten H (1994) Effects of habitat fragmentation on birds and
mammals in landscapes with different proportions of suitable
habitat a review Oikos 71 355ndash366
Balmford A Crane P Dobson A Green RE amp Mace GM
(2005) The 2010 challenge data availability information
needs and extraterrestrial insights Philosophical Transactions
of the Royal Society of London Series B Biological Sciences 360
221ndash228
Balmford A Mace GM amp Ginsberg JR (1998) The challenges
to conservation in a changing world putting processes on the
map Conservation in a changing world (ed by GM Mace A
Balmford and JR Ginsberg) pp 1ndash28 Cambridge University
Press Cambridge UK
Barnes KN ed (1998) The important bird areas of southern
Africa BirdLife Johannesburg South Africa
Berliner D amp Benn G (2004) Protected area planning for the forest
biome Prepared for DWAF WFSP Forestry Programme Depart-
ment of Water Affairs and Forestry Pretoria South Africa
Burgess N DrsquoAmico Hales J Underwood E Dinerstein E
Olson DM Itoua I Shipper J Ricketts TH amp Newman K
(2004) The terrestrial ecoregions of Africa and Madagascar
Island Press Washington DC
Cowling RM Knight AT Faith DP Ferrier S Lombard
AT Driver A Rouget M Maze K amp Desmet PG (2004)
Nature conservation requires more than a passion for species
Conservation Biology 18 1674ndash1677
Cowling RM Pressey RL Lombard AT Desmet PG amp
Ellis AG (1999) From representation to persistence require-
ments for a sustainable reserve system in the species-rich
Mediterranean-climate deserts of southern Africa Diversity
and Distributions 5 51ndash71
Cowling RM Pressey RL Rouget M amp Lombard AT
(2003) A conservation plan for a global biodiversity hotspot mdash
the Cape Floristic Region South Africa Biological Conservation
112 191ndash216
DEADP (2005a) Western Cape provincial spatial development
Products for conservation decisions
copy 2007 The AuthorsDiversity and Distributions 13 608ndash619 Journal compilation copy 2007 Blackwell Publishing Ltd 617
framework Provincial Government of the Western Cape
Department of Environmental Affairs and Development
Planning Cape Town httpwwwcapegatewaygovzaeng
pubsguidesW120505
DEADP (2005b) Western Cape state of the environment report
Provincial Government of the Western Cape Department of
Environmental Affairs and Development Planning Cape
Town httpwwwcapegatewaygovzaengpublications
reports_researchW120813
DEAT (2004) The National Environmental Management Biodiver-
sity Act No 10 of 2004 Department of Environmental Affairs and
Tourism Pretoria South Africa httpwwwenvironmentgovza
DEAT (2005) South Africarsquos National Biodiversity Strategy and
Action Plan Department of Environmental Affairs and Tourism
Pretoria South Africa
DEAT (2006) South Africarsquos National Strategy for Sustainable
Development Draft for Review Department of Environmental
Affairs and Tourism httpwwwenvironmentgovza
nssd_2005draft_intergrated_strat
Desmet P amp Cowling RM (2004) Using the speciesndasharea
relationship to set baseline targets for conservation Ecology
and Society 9 (11) httpwwwecologyandsocietyorgvol9
iss2art11
Driver A Cowling RM amp Maze K (2003) Planning for living
landscapes perspectives and lessons from South Africa Center
for Applied Biodiversity Science at Conservation Interna-
tional Washington DC and the Botanical Society of South
Africa Cape Town httpwwwbotanicalsocietyorgza
defaultphppageID=ccuccu_downloadshtm
Driver A Maze K Rouget M Lombard AT Nel J Turpie
JK Cowling RM Desmet P Goodman P Harris J Jonas
Z Reyers B Sink K amp Strauss T (2005) National Spatial
Biodiversity Assessment 2004 priorities for biodiversity con-
servation in South Africa Strelitzia 17 South African National
Biodiversity Institute Pretoria South Africa http
wwwsanbiorgbiodiversitynsbahtm
Edwards D (1974) Survey to determine the adequacy of existing
conserved areas in relation to vegetation types A preliminary
report Koedoe 17 3ndash38
Eken G Bennun L Brooks TM Darwall W Fishpool
LDC Foster M Knox D Langhammer P Matiku P
Radford E Salaman P Sechrest W Smith ML Spector S
amp Tordoff A (2004) Key biodiversity areas as site conservation
targets Bioscience 54 1110ndash1118
Fahrig L (2001) How much habitat is enough Biological
Conservation 100 65ndash74
Fairbanks DHK Thompson MW Vink DE Newby
TS van den Berg HM amp Everard DA (2000) The
South African land-cover characteristics database a synopsis of
the landscape South African Journal of Science 96 69ndash82
Ferraro PJ amp Pattanayak SK (2006) Money for nothing A
call for empirical evaluation of biodiversity conservation
investments PloS Biology 4 (4) e105
Ferrier S Pressey RL amp Barrett TW (2000) A new predictor
of the irreplaceability of areas for achieving a conservation
goal its application to real-world planning and a research
agenda for further refinement Biological Conservation 93
303ndash325
Flather CH amp Bevers M (2002) Patchy reaction-diffusion and
population abundance The relative importance of habitat
amount and arrangement The American Naturalist 159 40ndash
56
Franklin JF amp Forman RTT (1987) Creating landscape
patterns by forest cutting ecological consequences and principles
Landscape Ecology 1 5ndash18
Freitag S Nicholls AO amp van Jaarsveld AS (1998) Dealing
with established reserve networks and incomplete distribution
data sets in conservation planning South African Journal of
Science 94 79ndash86
Glowka L Burhenne-Guilmin S Synge H McNeely JA amp
Guumlndling L (1994) A guide to the convention on biological
diversity Environmental Policy and Law Paper no 30 IUCN
Gland and Cambridge
Hannah L Rakotosamimanana B Ganzhorn J Mittermeier
RA Olivieri S Iyer L Rajaobelina S Hough J Andriami-
alisoa F Bowles I amp Tilken G (1998) Participatory plan-
ning scientific priorities and landscape conservation in
Madagascar Environmental Conservation 25 30ndash36
Heads M (2004) What is a node Journal of Biogeography 31
1883ndash1891
Hockings M (2003) Systems for assessing the effectiveness of
management in protected areas Bioscience 53 823ndash832
Huggett AJ (2005) The concept and utility of lsquoecological
thresholdsrsquo in biodiversity conservation Biological Conserva-
tion 124 301ndash310
IUCN (1994) IUCN red list categories IUCN Gland Switzer-
land
IUCN (2001) IUCN red list categories and criteria version 31
IUCN Species Survival Commission Gland Switzerland and
Cambridge UK
Kaltenborn BK Hanse R amp Hundeinde M (1999) National
park planning and local participation from a mountain region
in southern Norway Mountain Research and Development 19
51ndash61
Knight AT Cowling RM amp Campbell BM (2006a) Planning
for implementation an operational model for implementing
conservation action Conservation Biology 20 408ndash419
Knight AT Driver A Cowling RM Maze K Desmet PG
Lombard AT Rouget M Botha MA Boshoff AF
Castley JG Goodman PS MacKinnon K Pierce SM
Sims-Castley R Stewart WI amp von Hase A (2006b) Design-
ing systematic conservation assessments that promote effective
implementation best practice from South Africa Conservation
Biology 20 739ndash750
Lombard AT Strauss T Harris J Sink K Attwood C amp
Hutchings L (2004) South African National Biodiversity
Assessment 2004 technical report Volume 4 marine component
South African National Biodiversity Institute Pretoria South
Africa httpwwwsanbiorgza
Mace GM amp Lande R (1991) Assessing extinction threats
towards a reevaluation of IUCN threatened species categories
Conservation Biology 5 148ndash157
B Reyers et al
copy 2007 The Authors618 Diversity and Distributions 13 608ndash619 Journal compilation copy 2007 Blackwell Publishing Ltd
Margoluis R amp Salafsky N (1998) Measuring success designing
managing and monitoring conservation and development
projects Island Press Washington DC
Margules CR amp RLPressey (2000) Systematic conservation
planning Nature 405 37ndash47
Midgley G Rutherford M amp Bond W (2001) The heat is on
impacts of climate change on plant diversity in south Africa
National Botanic Institute Cape Town South Africa
Mittermeier RA Hoffmann M Pilgrim JD Brooks TB
Mittermeier CG Lamoreux JL amp Fonseca G (ed) (2005)
Hotspots revisited Earthrsquos biologically richest and most endangered
ecoregions Cemex Mexico City
Mucina L Rutherford MC amp Powrie LW (ed) (2005)
Vegetation map of South Africa Lesotho and Swaziland
1 1000000 scale sheet maps South African National Biodiver-
sity Institute Pretoria South Africa ISBN 1-919976-22-1
Myers N Mittermeier RA Mittermeier CG da Fonseca
GAB amp Kent J (2000) Biodiversity hotspots for conservation
priorities Nature 4032 853ndash858
Nel JL Roux DJ Maree G Kleynhans CJ Moolman J
Reyers B Rouget M amp Cowling RM (2007) A systematic
conservation assessment of the ecosystem status and protection
levels of main rivers Diversity and Distributions 13 341ndash352
Noss R (2003) A checklist for wildlands network designs
Conservation Biology 17 (5) 1ndash7
Olivieri S Bowles I Cavalcanti RB Fonseca GAB
Mittermeier RA amp Rostrom C (1995) A participatory
approach to biodiversity conservation the regional priority
setting workshop Conservation International Washington DC
Olson DM amp Dinerstein E (2002) The Global 200 priority
ecoregions for global conservation Annals of the Missouri
Botanical Garden 89 199ndash224
Pierce SM Cowling RM Knight AT Lombard AT
Rouget M amp Wolf T (2005) Systematic conservation
assessment products for landuse planning interpretation for
implementation Biological Conservation 125 441ndash548
Pierce SM Cowling RM Sandwith T amp MacKinnon K ed
(2002) Mainstreaming biodiversity in development case studies
from South Africa World Bank Washington DC
Prendergast JR Quinn RM amp Lawton JH (1999) The gaps
between theory and practice in selecting nature reserves
Conservation Biology 13 484ndash492
Pressey RL (1999) Applications of irreplaceability analysis to
planning and management problems Parks 9 42ndash51
Pressey RL Cowling RM amp Rouget M (2003) Formulating
conservation targets for biodiversity pattern and process in the
Cape Floristic Region South Africa Biological Conservation
112 99ndash127
Pressey RL Humphries CJ Margules CR Vane-Wright RI
amp Williams PH (1993) Beyond opportunism key principles
for systematic reserve selection Trends in Ecology amp Evolution
8 124ndash128
Pullin AS amp Knight TM (2001) Effectiveness in conservation
practice Pointers from medicine and public health Conserva-
tion Biology 15 50ndash54
Reyers B Fairbanks DHK van Jaarsveld AS amp Thompson
M (2001) Priority areas for the conservation of South African
vegetation a coarse filter approach Diversity and Distribu-
tions 7 77ndash96
Reyers B amp McGeoch M (in press) A biodiversity monitoring
framework for South Africa progress and directions South
African Journal of Science
Reyers B Nel J Egoh B Rouget M amp Jonas Z (2005) A
conservation assessment of South Africarsquos grassland biome
integrating terrestrial river ecosystem services and fine scale
priorities CSIR Report Number ENV-S-C 2005-102 CSIR
Stellenbosch Cape Town
Ricketts TH Dinerstein E Olson D Loucks CJ Eichbaum
W DellaSala D Kavanagh K Hedao P Hurley PT
Carney KM Abell R amp Walters S (1999) Terrestrial ecore-
gions of North America a conservation assessment Island Press
Washington DC
Rodrigues AS Cerdeira JO amp Gaston KJ (2000) Flexibility
efficiency and accountability adapting reserve selection
algorithms to more complex conservation problems Ecography
23 (5) 565ndash574
Rouget M Cowling RM Pressey RL amp Richardson DM
(2003a) Identifying the spatial components of ecological and
evolutionary processes for regional conservation planning in the
Cape Floristic Region Diversity and Distributions 9 191ndash210
Rouget M Richardson DM amp Cowling RM (2003b) The
current configuration of protected areas in the Cape Floristic
Region mdash reservation bias and representation of biodiversity
patterns and processes Biological Conservation 112 129ndash145
Rouget M Reyers B Jonas Z Desmet P Driver A Maze K
Egoh B amp Cowling RM (2004) South African National
Spatial Biodiversity Assessment 2004 Technical report Volume
1 terrestrial component South African National Biodiversity
Institute Pretoria httpwwwsanbiorgbiodiversitynsbahtm
Salafsky N Margoluis R Redford KH amp Robinson JG
(2002) Improving the practice of conservation a conceptual
framework and research agenda for conservation science
Conservation Biology 16 1469ndash1479
Scholes RJ amp Biggs R (ed) (2004) Ecosystem services in southern
Africa a regional assessment Council for Scientific and Indus-
trial Research Pretoria South Africa
Scholes RJ amp Noble IR (2001) Storing carbon on land Science
294 1012
Schulze RE Maharaj M Lynch SD Howe BJ amp Melvil-
Thomson B (1997) South African atlas of agrohydrology and
climatology Water Research Commission Report Pretoria
South Africa
Scott JM Davis F Csuti B Noss RF Butterfield B Groves C
Anderson H Caicco S DrsquoErchia F Edwards TC Uliman J
amp Wright G (1993) Gap analysis a geographic approach to
protection of biological diversity Wildlife Monographs 123 1ndash41
Stem C Margoluis R Salafsky N amp Brown M (2005)
Monitoring and evaluation in conservation A review of trends
and approaches Conservation Biology 19 295ndash309
Sutherland WJ Pullin AS Dolman PM amp Knight TM
(2004) The need for evidence-based conservation Trends in
Ecology amp Evolution 19 305ndash308
Products for conservation decisions
copy 2007 The AuthorsDiversity and Distributions 13 608ndash619 Journal compilation copy 2007 Blackwell Publishing Ltd 619
Theobald DM Hobbs NT Bearly T Zack JA Shenk T amp
Riebsame WE (2000) Incorporating biological information
in local land-use decision making designing a system for
conservation planning Landscape Ecology 15 35ndash45
UNEP (2003) Proposed biodiversity indicators relevant to the 2010
target UNEPCBDSBSTTA9INF26 httpwwwbiodivorgdoc
meetingssbsttasbstta-09informationsbstta-09-inf-26-enpdf
Walker S Price R Rutledge D Stephens T amp Lee WG
(2006) Recent loss of indigenous cover in New Zealand New
Zealand Journal of Ecology 30 (20) 169ndash177
Werger MJA (1978) Biogeographical division of southern
Africa Biogeography and ecology of southern Africa (ed by
MJA Werger) pp 147ndash170 Junk The Hague
Wilson KA Westphal MI Possingham HP amp Elith J (2005)
Sensitivity of conservation planning to different approaches to
using predicted species distribution data Biological Conserva-
tion 122 99ndash112
van Wyk AE amp Smith GF (2001) Regions of floristic endemism
in southern Africa a review with emphasis on succulents
Umdaus Press Pretoria South Africa

B Reyers
et al
copy 2007 The Authors
612
Diversity and Distributions
13
608ndash619 Journal compilation copy 2007 Blackwell Publishing Ltd
Figure 2 illustrates the ecosystem status map Owing to the
spatial pattern of habitat transformation in South Africa
critically endangered vegetation types with the exception of
forest types are mostly concentrated in the fynbos biome
(Fig 1) The forest and fynbos biomes have the greatest propor-
tion of critically endangered vegetation types The grasslands
have been considerably impacted by habitat transformation and
as a result most grassland vegetation types are classified as
endangered or vulnerable The desert Nama-karoo and succulent
karoo biomes have the highest proportion of least threatened
vegetation types Of the 438 vegetation types classified (lagoons
and lake systems were excluded) 21 (5) were critically en-
dangered 58 (13) were endangered 70 (16) were vulnerable
and 289 (66) were least threatened More detailed results can
be found in Rouget
et al
(2004) and Driver
et al
(2005)
Protection level product
Since South Africarsquos protected areas are
not distributed evenly over the landscape there are substantial
gaps in the countryrsquos protected area network (Edwards 1974) A
gap analysis (Scott
et al
1993) is often a useful way to identify
ecosystems without adequate protection and can either compute
the proportion of each ecosystem protected (Scott
et al
1993
Walker
et al
2006) or quantify the proportion relative to the
conservation targets for the ecosystem (Margules amp Pressey
2000) The latter approach was followed in the NSBA in order to
develop a spatial product that demonstrated the protection level
of the vegetation type in relation to differential biodiversity
pattern incorporated via the conservation target This product
differs from ecosystem status in that vegetation types without
adequate protection levels are mapped and prioritized irrespective
of the extent of habitat loss Well-protected ecosystems are
defined as vegetation types with 100 of their target area
conserved similarly moderately protected ecosystems poorly
protected and hardly protected ecosystems have at least 50
25 and 5 of their target areas conserved respectively
The forest fynbos desert and savanna biomes are the best
protected in terms of percentage of target area while the Nama-
karoo and grasslands are the least protected biomes (Fig 3) An
assessment of ecosystem protection level reveals that 110 (25)
vegetation types are not protected at all Furthermore an
additional 90 (21) vegetation types with only lt 5 of their
biodiversity target protected are hardly protected More than
300 (68) vegetation types have less than half of their biodiversity
target conserved in statutory protected areas Only 67 (15)
vegetation types are adequately conserved (in relation to their
conservation targets) in statutory protected areas 22 types of
fynbos 18 of savanna and seven of forest
Overall priority map
In the production of an overall priority
map we decided not to go the route of a single lsquoirreplaceabilityrsquo
(Pressey
et al
1993) assessment based on ecosystems species
and processes (Cowling
et al
2003) Although a powerful
conservation assessment tool the implementation constraints
associated with products that express dynamic conservation
values per planning unit (see Driver
et al
2003 Pierce
et al
2005) as well as the scale mismatch between the species and
other data sets and the lack of targets for processes made a single
irreplaceability assessment not feasible The NSBA therefore
used separate analyses to identify priorities at the ecosystem
and species levels as well as priorities for the conservation of
Figure 2 Ecosystem status map demonstrating the distribution and extent of vegetation types belonging to four classes of endangerment Least threatened (LT) vegetation types with ge 80 extant habitat are assumed to have no significant disruption of ecosystem functioning and minimal species loss When natural habitat extent is lt 80 some ecosystem functions become impaired and species start to disappear These vegetation types are classified as vulnerable (VU) When extant habitat is lt 60 losses become more severe and the vegetation type is recognized as endangered (EN) Types where extant habitat is le the conservation target are classified as critically endangered (CR) These vegetation types have been transformed to such an extent that not only is their ecosystem function severely disrupted but the remaining habitat is less than that needed to support 75 of plant diversity this category represents ecosystems with marked acceleration of biodiversity loss
Products for conservation decisions
copy 2007 The Authors
Diversity and Distributions
13
608ndash619 Journal compilation copy 2007 Blackwell Publishing Ltd
613
processes These analyses included the ecosystem status and
protection level assessments outlined above an irreplaceability
analysis of the species and ecosystem data and the expert
mapping of important national-scale ecological and evolutionary
processes The outputs of these separate analyses were then
scored standardized overlaid and summed to be integrated into
a single GIS layer of priority values (for more detail see Rouget
et al
2004) Based on this layer priority areas were delineated
as areas very important to one of the underlying analyses or
important to several
Figure 4 illustrates these final nine priority areas the bounda-
ries between which were delimited subjectively on the basis of
biome boundaries and topographical and climatic factors
Owing to the coarse scale of the data and various assessment
Figure 3 Ecosystem protection level based on the target achievement () of each vegetation type by type 1 protected areas Well-protected ecosystems are defined as vegetation types with 100 of their target area conserved similarly moderately protected ecosystems poorly protected and hardly protected ecosystems have at least 50 25 and 5 of their target areas conserved
Figure 4 Terrestrial biodiversity priority areas of South Africa identified through a multi-criteria analysis of species ecosystem ecological process and land cover data (see Rouget et al 2004 for details)
B Reyers
et al
copy 2007 The Authors
614
Diversity and Distributions
13
608ndash619 Journal compilation copy 2007 Blackwell Publishing Ltd
outputs priority areas defined here could not be identified at the
level of property boundaries Therefore the boundaries of the
final priority areas are rough estimates and should not be used
for decision-making at the local scale These priority areas
comprise 5497 million ha occupying 4336 of South Africa
The nine priority areas are North-eastern Escarpment Bushveld-
Bankenveld Moist Grasslands Central Grasslands South-eastern
Escarpment Maputaland-Pondoland Albany Thicket and Wild
Coast Cape Floristic Region and the Succulent Karoo
DISCUSSION
The NSBA a critique of the process and products
The NSBA set out to accomplish the dual challenges of developing
defensible products while at the same time ensuring these
products were user-useful and user-friendly (Driver
et al
2003)
The NSBA was released in April 2005 so it is perhaps too early to
assess the full extent to which it has achieved these aims We can
however review the process products and current uptake in an
effort to contribute to the growing body of conservation action
evaluation best practice and lessons learnt (Sutherland
et al
2004 Ferraro amp Pattanayak 2006 Knight
et al
2006b) Below
we review the defensibility and usability of the products and
conclude by proposing a way forward in the development of
products for national-scale conservation decision-making
Defensible products
Defensible products are those that have the support of the
conservation science community can withstand the peer review
process and are based on current best practice The NSBA
appears to exhibit these characteristics in that it (1) was
conducted by a large collaboration of conservation planning
scientists from universities science councils conservation agencies
and independent consultants generating broad support of the
products by the scientific community (see Driver
et al
2005 for
a full list of participants) (2) was submitted as a contribution to
this journal so that it could be subjected to international peer
review and (3) was based on a systematic approach reflecting
current best practice (Margules amp Pressey 2000)
The systematic approach involved the inclusion of species
(plant and animal) ecosystems and processes in the assessment
thereby ensuring that the priority areas identified cater for all
elements essential to the persistence of national biodiversity
(Balmford
et al
1998 Cowling
et al
1999 2004) while a focus
on representation complementarity and conservation targets
guaranteed accountable repeatable and defensible outputs
(Margules amp Pressey 2000 Rodrigues
et al 2000) This form of
national biodiversity assessment moves beyond approaches
based on a one or a limited number of taxa eg Important Bird
Areas (Barnes 1998) Centres of Plant Endemism (van Wyk amp
Smith 2001) and Key Biodiversity Areas (Eken et al 2004)
scoring eg biodiversity hotspots (Myers et al 2000 Mitter-
meier et al 2005) and entirely expert-derived priority areas
(Olivieri et al 1995 Hannah et al 1998 Kaltenborn et al
1999) The NSBA approach comprised the complementarity-
driven identification of priority areas which make measurable
contributions to national-scale conservation goals of biodiversity
representation and persistence This ability to objectively calculate
and defend the contribution each priority area makes to national
conservation goals sets this approach apart from other forms of
national biodiversity assessment It is important to emphasize
that the NSBA was not a reserve selection exercise used to
identify specific parcels of land for conservation action instead it
was based on a multi-criteria approach that allowed for the
integration of a suite of biodiversity assessment outputs at a
variety of scales into a single map of broad spatial conservation
priorities in South Africa
There are some data-related shortcomings in the NSBA that
may impact on its defensibility These shortcomings include
inadequate data on species distributions and pressures facing
biodiversity This resulted in products that are biased towards the
ecosystem level and do not adequately reflect status and priori-
ties at the species level Furthermore the land cover data used as
a measure of the pressures facing biodiversity are limited in that
they (1) are over 10 years old (2) do not incorporate habitat
degradation or fragmentation and (3) do not reflect pressures
like hunting collecting pollution and climate change This
implies that the results of the NSBA may underestimate the
degree of pressure and therefore the conservation status of South
Africarsquos biodiversity However the products of this assessment
are of broad-scale nature that may alleviate the impacts of data
inaccuracies it is at fine scale that these limitations become a
significant impediment and must be addressed Additional
shortcomings include a lack of spatially explicit information on
processes (eg major migratory pathways) as well as the thresholds
used in the ecosystem status and protection level assessments
The former reflects current (albeit flawed) practice of relying on
expert mapping of process components (eg Rouget et al
2003a) while the latter is constrained by thresholds derived from
theoretical modelling studies (see Huggett 2005 for review)
instead of field data
Useable products
The NBSA was conceived developed and conducted with a
strong focus on uptake by national and provincial resource
management agencies as a means of ensuring implementation It
was hoped that the NSBA would streamline the challenging
implementation of the NBSAP (DEAT 2005) through providing
a spatial focus that was easy to understand and use From a
review of policies and plans currently under development (see
below) in these national and provincial agencies as well as
anecdotal evidence the ecosystem status map appears most use-
ful and popular The protection levels of ecosystems and overall
priority areas are currently less widely used
Evidence of the popularity and uses of the NSBA products
particularly the ecosystem status products include the following
1 National policies and plans have made use of the NSBA
products (generally ecosystem status maps) eg National Spatial
Development Perspective (httpwwwidporgza) South African
Products for conservation decisions
copy 2007 The AuthorsDiversity and Distributions 13 608ndash619 Journal compilation copy 2007 Blackwell Publishing Ltd 615
Environmental Outlook 2005 (wwwenvironmentgovza)
National Strategy for Sustainable Development (DEAT 2006)
The National Biodiversity Framework currently under develop-
ment is based on the NBSAP and NSBA particularly the overall
priority areas
2 Many of the requirements of the National Environmental
Management Biodiversity Act (Act 10 of 2004) will rely on the
NSBA approach and products including the listing of national
threatened and protected ecosystems and the development of
norms and standards for bioregional plans (DEAT 2004)
3 National level decisions regarding protected area expansion
made by DEAT and the South African National Parks Board will
be guided by the protection level product (T Smith pers
comm)
4 The NSBA provides useful headline indicators (ecosystem
status and protection level) that can be tracked over time as part
of South Africarsquos national monitoring and evaluation framework
These indicators also correspond well with the monitoring
requirements of some of the headline indicators of the CBDrsquos
2010 Target (UNEP 2003 Balmford et al 2005 Reyers amp
McGeoch in press) This correspondence is highlighted in the
NBSAP (DEAT 2005) and will streamline South Africarsquos reporting
requirements to the CBD
5 At the provincial level the Western Cape Province has already
used the ecosystem status product as part of its Provincial Spatial
Development Framework for determining spatial planning
categories and guidelines for land-use decision-making across
the province (DEADP 2005a) Furthermore the Western Cape
State of Environment Report draws heavily on the NSBA for
biodiversity-related information and indicators (DEADP 2005b)
6 The Mpumalanga Provincial Conservation plan uses the
concept of ecosystem status applied to their ecosystem level data
The Free State North-west and Limpopo provinces have
adopted the NSBA approach and products for their planned
bioregional programmes (T Smith pers comm)
7 The need for a National Grasslands Biodiversity Programme
was supported by the overall priority map and a biome wide
priority area assessment used the outputs of the NSBA as an
input (Reyers et al 2005)
8 Anecdotal evidence suggests that good use is being made of the
ecosystem status layer for informing Environmental Impact
Assessments (EIA)
9 The popularity and rapid uptake of the ecosystem status
product appears to be largely due to it being a compelling and
accessible product that makes easier the work of implementing
agencies These strengths include the following
bull Ecosystem status maps were developed for all environments
(terrestrial river marine and estuarine) in a consistent way
using the same terminology and principles allowing for com-
parisons between the environments
bull Ecosystem status is an easy concept for most people to
understand including politicians and officials who have no
background or experience in biodiversity This understanding
is promoted by the similarity of conservation status categories
used in species assessments for Red Data Lists (IUCN 2001)
The maps have a strong visual logic using a sequence of
colours from red to green to reflect most threatened through
to least threatened ecosystems (Fig 2)
bull Ecosystem status can be assessed at all scales by a variety of
conservation practitioners The assessment of ecosystem
status is relatively simple requiring data on ecosystem extent
habitat loss a conservation target per ecosystem and some
basic GIS and conservation planning expertise and is thus not
limited to the domain of academics
Figure 5 Congruence of existing bioregional and provincial conservation plans and programmes in South Africa with the identified overall priority areas The high levels of congruence indicate that many of these priority areas have been previously identified in other sub-national or global assessments prior to the NSBA
CAPE Cape Action Plan for People and the
Environment STEP Subtropical Thicket
Ecosystem Planning Program
SKEP Succulent Karoo Ecosystem Plan
NGBP National Grasslands Biodiversity
Program
B Reyers et al
copy 2007 The Authors616 Diversity and Distributions 13 608ndash619 Journal compilation copy 2007 Blackwell Publishing Ltd
The protection level product has not witnessed similar broad
uptake This however is to be expected as it is of interest to only
a small group of national and provincial conservation agencies
with the mandate to establish statutory protected areas
Currently these agencies are making use of the product to guide
protected area expansion
Although not used as widely as the ecosystem status product
the map of overall priority areas has been received with great
interest by DEAT and forms the basis for the National Biodiversity
Framework It integrates information on the status of national
biodiversity in a single product that confirms that existing
bioregional programmes [Fig 5 such as the Subtropical Thicket
Ecosystem Programme (STEP) and the Cape Action Plan for
People and the Environment (CAPE)] are focusing their efforts
on national priority areas while identifying gaps in this bio-
regional coverage [eg providing motivation for the development
of the National Grasslands Biodiversity Programme (NGBP)] Its
popularity with some implementing agencies suggests that maps
of broad priority areas can be useful but if they are to be used to
maximum effect they need to be interpreted and accompanied by
clear explanations that point to their practical implications for
implementing agencies The next iteration of the NSBA in 5 years
time will have to address this challenge of conceptualizing more
effective and clear key messages for the overall priority map
CONCLUSION
In the short time since its release South Africarsquos first NSBA has
begun to achieve the desired uptake by implementing agencies
It was described by South Africarsquos Minister of Environmental
Affairs and Tourism as lsquogroundbreakingrsquo and a lsquouseful tool in
policy- and decision-making across all spheres of governmentrsquo
The existence within the NSBA team of significant conservation
planning expertise from several subnational conservation plans
and a strong spirit of collaboration between planners and
implementers played a significant role in ensuring that we based
this assessment on the lessons we have learnt from previous con-
servation plans (see Knight et al 2006b) Perhaps one of the
most important aspects of the NSBA is that it was conducted by
local conservation scientists who understood the institutional
context for the assessment and could communicate effectively
with implementing agencies The fact that this was an assessment
done by South Africans for South Africans promoted a sense of
ownership of the products and helped promote uptake
Despite these strengths the need to repeat this assessment
every 5 years and to contribute to the growing body of evalua-
tion and best practice for conservation implies that we need to
take a critical look at the process and products in an effort to
improve them and their effectiveness in the future We have
highlighted some of the data and information shortcomings that
should be addressed before the next iteration Furthermore this
evaluation of the NSBA products has supported the call being
made by many conservation scientists to go beyond implementa-
tion to the design of programme monitoring and evaluation
systems (Hockings 2003 Stem et al 2005) As Ferraro amp Pattanayak
(2006) point out the limited resources for conservation make the
assessment of the effectiveness of conservation interventions
essential if these resources are to stretch as far as possible One of
the biggest challenges in this paper was the evaluation of the
uptake and effectiveness of the NSBA we had to rely largely on
draft publications and anecdotal evidence from conversations
with implementing agency staff This may be due to the short
time period that has elapsed since the NSBA was released but it
is also a result of the lack of a monitoring programme with which
to assess and report on the effectiveness of the NSBA Several
frameworks exist for the monitoring of conservation effectiveness
(eg adaptive management frameworks Margoluis amp Salafsky
1998) and should certainly be reviewed and implemented before
the next NSBA iteration perhaps as part of the National
Biodiversity Monitoring and Reporting Framework currently
under development
REFERENCES
Acocks JPH (1953) Veld types of South Africa Memoirs of the
Botanical Society of South Africa 28 1ndash192
Andreacuten H (1994) Effects of habitat fragmentation on birds and
mammals in landscapes with different proportions of suitable
habitat a review Oikos 71 355ndash366
Balmford A Crane P Dobson A Green RE amp Mace GM
(2005) The 2010 challenge data availability information
needs and extraterrestrial insights Philosophical Transactions
of the Royal Society of London Series B Biological Sciences 360
221ndash228
Balmford A Mace GM amp Ginsberg JR (1998) The challenges
to conservation in a changing world putting processes on the
map Conservation in a changing world (ed by GM Mace A
Balmford and JR Ginsberg) pp 1ndash28 Cambridge University
Press Cambridge UK
Barnes KN ed (1998) The important bird areas of southern
Africa BirdLife Johannesburg South Africa
Berliner D amp Benn G (2004) Protected area planning for the forest
biome Prepared for DWAF WFSP Forestry Programme Depart-
ment of Water Affairs and Forestry Pretoria South Africa
Burgess N DrsquoAmico Hales J Underwood E Dinerstein E
Olson DM Itoua I Shipper J Ricketts TH amp Newman K
(2004) The terrestrial ecoregions of Africa and Madagascar
Island Press Washington DC
Cowling RM Knight AT Faith DP Ferrier S Lombard
AT Driver A Rouget M Maze K amp Desmet PG (2004)
Nature conservation requires more than a passion for species
Conservation Biology 18 1674ndash1677
Cowling RM Pressey RL Lombard AT Desmet PG amp
Ellis AG (1999) From representation to persistence require-
ments for a sustainable reserve system in the species-rich
Mediterranean-climate deserts of southern Africa Diversity
and Distributions 5 51ndash71
Cowling RM Pressey RL Rouget M amp Lombard AT
(2003) A conservation plan for a global biodiversity hotspot mdash
the Cape Floristic Region South Africa Biological Conservation
112 191ndash216
DEADP (2005a) Western Cape provincial spatial development
Products for conservation decisions
copy 2007 The AuthorsDiversity and Distributions 13 608ndash619 Journal compilation copy 2007 Blackwell Publishing Ltd 617
framework Provincial Government of the Western Cape
Department of Environmental Affairs and Development
Planning Cape Town httpwwwcapegatewaygovzaeng
pubsguidesW120505
DEADP (2005b) Western Cape state of the environment report
Provincial Government of the Western Cape Department of
Environmental Affairs and Development Planning Cape
Town httpwwwcapegatewaygovzaengpublications
reports_researchW120813
DEAT (2004) The National Environmental Management Biodiver-
sity Act No 10 of 2004 Department of Environmental Affairs and
Tourism Pretoria South Africa httpwwwenvironmentgovza
DEAT (2005) South Africarsquos National Biodiversity Strategy and
Action Plan Department of Environmental Affairs and Tourism
Pretoria South Africa
DEAT (2006) South Africarsquos National Strategy for Sustainable
Development Draft for Review Department of Environmental
Affairs and Tourism httpwwwenvironmentgovza
nssd_2005draft_intergrated_strat
Desmet P amp Cowling RM (2004) Using the speciesndasharea
relationship to set baseline targets for conservation Ecology
and Society 9 (11) httpwwwecologyandsocietyorgvol9
iss2art11
Driver A Cowling RM amp Maze K (2003) Planning for living
landscapes perspectives and lessons from South Africa Center
for Applied Biodiversity Science at Conservation Interna-
tional Washington DC and the Botanical Society of South
Africa Cape Town httpwwwbotanicalsocietyorgza
defaultphppageID=ccuccu_downloadshtm
Driver A Maze K Rouget M Lombard AT Nel J Turpie
JK Cowling RM Desmet P Goodman P Harris J Jonas
Z Reyers B Sink K amp Strauss T (2005) National Spatial
Biodiversity Assessment 2004 priorities for biodiversity con-
servation in South Africa Strelitzia 17 South African National
Biodiversity Institute Pretoria South Africa http
wwwsanbiorgbiodiversitynsbahtm
Edwards D (1974) Survey to determine the adequacy of existing
conserved areas in relation to vegetation types A preliminary
report Koedoe 17 3ndash38
Eken G Bennun L Brooks TM Darwall W Fishpool
LDC Foster M Knox D Langhammer P Matiku P
Radford E Salaman P Sechrest W Smith ML Spector S
amp Tordoff A (2004) Key biodiversity areas as site conservation
targets Bioscience 54 1110ndash1118
Fahrig L (2001) How much habitat is enough Biological
Conservation 100 65ndash74
Fairbanks DHK Thompson MW Vink DE Newby
TS van den Berg HM amp Everard DA (2000) The
South African land-cover characteristics database a synopsis of
the landscape South African Journal of Science 96 69ndash82
Ferraro PJ amp Pattanayak SK (2006) Money for nothing A
call for empirical evaluation of biodiversity conservation
investments PloS Biology 4 (4) e105
Ferrier S Pressey RL amp Barrett TW (2000) A new predictor
of the irreplaceability of areas for achieving a conservation
goal its application to real-world planning and a research
agenda for further refinement Biological Conservation 93
303ndash325
Flather CH amp Bevers M (2002) Patchy reaction-diffusion and
population abundance The relative importance of habitat
amount and arrangement The American Naturalist 159 40ndash
56
Franklin JF amp Forman RTT (1987) Creating landscape
patterns by forest cutting ecological consequences and principles
Landscape Ecology 1 5ndash18
Freitag S Nicholls AO amp van Jaarsveld AS (1998) Dealing
with established reserve networks and incomplete distribution
data sets in conservation planning South African Journal of
Science 94 79ndash86
Glowka L Burhenne-Guilmin S Synge H McNeely JA amp
Guumlndling L (1994) A guide to the convention on biological
diversity Environmental Policy and Law Paper no 30 IUCN
Gland and Cambridge
Hannah L Rakotosamimanana B Ganzhorn J Mittermeier
RA Olivieri S Iyer L Rajaobelina S Hough J Andriami-
alisoa F Bowles I amp Tilken G (1998) Participatory plan-
ning scientific priorities and landscape conservation in
Madagascar Environmental Conservation 25 30ndash36
Heads M (2004) What is a node Journal of Biogeography 31
1883ndash1891
Hockings M (2003) Systems for assessing the effectiveness of
management in protected areas Bioscience 53 823ndash832
Huggett AJ (2005) The concept and utility of lsquoecological
thresholdsrsquo in biodiversity conservation Biological Conserva-
tion 124 301ndash310
IUCN (1994) IUCN red list categories IUCN Gland Switzer-
land
IUCN (2001) IUCN red list categories and criteria version 31
IUCN Species Survival Commission Gland Switzerland and
Cambridge UK
Kaltenborn BK Hanse R amp Hundeinde M (1999) National
park planning and local participation from a mountain region
in southern Norway Mountain Research and Development 19
51ndash61
Knight AT Cowling RM amp Campbell BM (2006a) Planning
for implementation an operational model for implementing
conservation action Conservation Biology 20 408ndash419
Knight AT Driver A Cowling RM Maze K Desmet PG
Lombard AT Rouget M Botha MA Boshoff AF
Castley JG Goodman PS MacKinnon K Pierce SM
Sims-Castley R Stewart WI amp von Hase A (2006b) Design-
ing systematic conservation assessments that promote effective
implementation best practice from South Africa Conservation
Biology 20 739ndash750
Lombard AT Strauss T Harris J Sink K Attwood C amp
Hutchings L (2004) South African National Biodiversity
Assessment 2004 technical report Volume 4 marine component
South African National Biodiversity Institute Pretoria South
Africa httpwwwsanbiorgza
Mace GM amp Lande R (1991) Assessing extinction threats
towards a reevaluation of IUCN threatened species categories
Conservation Biology 5 148ndash157
B Reyers et al
copy 2007 The Authors618 Diversity and Distributions 13 608ndash619 Journal compilation copy 2007 Blackwell Publishing Ltd
Margoluis R amp Salafsky N (1998) Measuring success designing
managing and monitoring conservation and development
projects Island Press Washington DC
Margules CR amp RLPressey (2000) Systematic conservation
planning Nature 405 37ndash47
Midgley G Rutherford M amp Bond W (2001) The heat is on
impacts of climate change on plant diversity in south Africa
National Botanic Institute Cape Town South Africa
Mittermeier RA Hoffmann M Pilgrim JD Brooks TB
Mittermeier CG Lamoreux JL amp Fonseca G (ed) (2005)
Hotspots revisited Earthrsquos biologically richest and most endangered
ecoregions Cemex Mexico City
Mucina L Rutherford MC amp Powrie LW (ed) (2005)
Vegetation map of South Africa Lesotho and Swaziland
1 1000000 scale sheet maps South African National Biodiver-
sity Institute Pretoria South Africa ISBN 1-919976-22-1
Myers N Mittermeier RA Mittermeier CG da Fonseca
GAB amp Kent J (2000) Biodiversity hotspots for conservation
priorities Nature 4032 853ndash858
Nel JL Roux DJ Maree G Kleynhans CJ Moolman J
Reyers B Rouget M amp Cowling RM (2007) A systematic
conservation assessment of the ecosystem status and protection
levels of main rivers Diversity and Distributions 13 341ndash352
Noss R (2003) A checklist for wildlands network designs
Conservation Biology 17 (5) 1ndash7
Olivieri S Bowles I Cavalcanti RB Fonseca GAB
Mittermeier RA amp Rostrom C (1995) A participatory
approach to biodiversity conservation the regional priority
setting workshop Conservation International Washington DC
Olson DM amp Dinerstein E (2002) The Global 200 priority
ecoregions for global conservation Annals of the Missouri
Botanical Garden 89 199ndash224
Pierce SM Cowling RM Knight AT Lombard AT
Rouget M amp Wolf T (2005) Systematic conservation
assessment products for landuse planning interpretation for
implementation Biological Conservation 125 441ndash548
Pierce SM Cowling RM Sandwith T amp MacKinnon K ed
(2002) Mainstreaming biodiversity in development case studies
from South Africa World Bank Washington DC
Prendergast JR Quinn RM amp Lawton JH (1999) The gaps
between theory and practice in selecting nature reserves
Conservation Biology 13 484ndash492
Pressey RL (1999) Applications of irreplaceability analysis to
planning and management problems Parks 9 42ndash51
Pressey RL Cowling RM amp Rouget M (2003) Formulating
conservation targets for biodiversity pattern and process in the
Cape Floristic Region South Africa Biological Conservation
112 99ndash127
Pressey RL Humphries CJ Margules CR Vane-Wright RI
amp Williams PH (1993) Beyond opportunism key principles
for systematic reserve selection Trends in Ecology amp Evolution
8 124ndash128
Pullin AS amp Knight TM (2001) Effectiveness in conservation
practice Pointers from medicine and public health Conserva-
tion Biology 15 50ndash54
Reyers B Fairbanks DHK van Jaarsveld AS amp Thompson
M (2001) Priority areas for the conservation of South African
vegetation a coarse filter approach Diversity and Distribu-
tions 7 77ndash96
Reyers B amp McGeoch M (in press) A biodiversity monitoring
framework for South Africa progress and directions South
African Journal of Science
Reyers B Nel J Egoh B Rouget M amp Jonas Z (2005) A
conservation assessment of South Africarsquos grassland biome
integrating terrestrial river ecosystem services and fine scale
priorities CSIR Report Number ENV-S-C 2005-102 CSIR
Stellenbosch Cape Town
Ricketts TH Dinerstein E Olson D Loucks CJ Eichbaum
W DellaSala D Kavanagh K Hedao P Hurley PT
Carney KM Abell R amp Walters S (1999) Terrestrial ecore-
gions of North America a conservation assessment Island Press
Washington DC
Rodrigues AS Cerdeira JO amp Gaston KJ (2000) Flexibility
efficiency and accountability adapting reserve selection
algorithms to more complex conservation problems Ecography
23 (5) 565ndash574
Rouget M Cowling RM Pressey RL amp Richardson DM
(2003a) Identifying the spatial components of ecological and
evolutionary processes for regional conservation planning in the
Cape Floristic Region Diversity and Distributions 9 191ndash210
Rouget M Richardson DM amp Cowling RM (2003b) The
current configuration of protected areas in the Cape Floristic
Region mdash reservation bias and representation of biodiversity
patterns and processes Biological Conservation 112 129ndash145
Rouget M Reyers B Jonas Z Desmet P Driver A Maze K
Egoh B amp Cowling RM (2004) South African National
Spatial Biodiversity Assessment 2004 Technical report Volume
1 terrestrial component South African National Biodiversity
Institute Pretoria httpwwwsanbiorgbiodiversitynsbahtm
Salafsky N Margoluis R Redford KH amp Robinson JG
(2002) Improving the practice of conservation a conceptual
framework and research agenda for conservation science
Conservation Biology 16 1469ndash1479
Scholes RJ amp Biggs R (ed) (2004) Ecosystem services in southern
Africa a regional assessment Council for Scientific and Indus-
trial Research Pretoria South Africa
Scholes RJ amp Noble IR (2001) Storing carbon on land Science
294 1012
Schulze RE Maharaj M Lynch SD Howe BJ amp Melvil-
Thomson B (1997) South African atlas of agrohydrology and
climatology Water Research Commission Report Pretoria
South Africa
Scott JM Davis F Csuti B Noss RF Butterfield B Groves C
Anderson H Caicco S DrsquoErchia F Edwards TC Uliman J
amp Wright G (1993) Gap analysis a geographic approach to
protection of biological diversity Wildlife Monographs 123 1ndash41
Stem C Margoluis R Salafsky N amp Brown M (2005)
Monitoring and evaluation in conservation A review of trends
and approaches Conservation Biology 19 295ndash309
Sutherland WJ Pullin AS Dolman PM amp Knight TM
(2004) The need for evidence-based conservation Trends in
Ecology amp Evolution 19 305ndash308
Products for conservation decisions
copy 2007 The AuthorsDiversity and Distributions 13 608ndash619 Journal compilation copy 2007 Blackwell Publishing Ltd 619
Theobald DM Hobbs NT Bearly T Zack JA Shenk T amp
Riebsame WE (2000) Incorporating biological information
in local land-use decision making designing a system for
conservation planning Landscape Ecology 15 35ndash45
UNEP (2003) Proposed biodiversity indicators relevant to the 2010
target UNEPCBDSBSTTA9INF26 httpwwwbiodivorgdoc
meetingssbsttasbstta-09informationsbstta-09-inf-26-enpdf
Walker S Price R Rutledge D Stephens T amp Lee WG
(2006) Recent loss of indigenous cover in New Zealand New
Zealand Journal of Ecology 30 (20) 169ndash177
Werger MJA (1978) Biogeographical division of southern
Africa Biogeography and ecology of southern Africa (ed by
MJA Werger) pp 147ndash170 Junk The Hague
Wilson KA Westphal MI Possingham HP amp Elith J (2005)
Sensitivity of conservation planning to different approaches to
using predicted species distribution data Biological Conserva-
tion 122 99ndash112
van Wyk AE amp Smith GF (2001) Regions of floristic endemism
in southern Africa a review with emphasis on succulents
Umdaus Press Pretoria South Africa
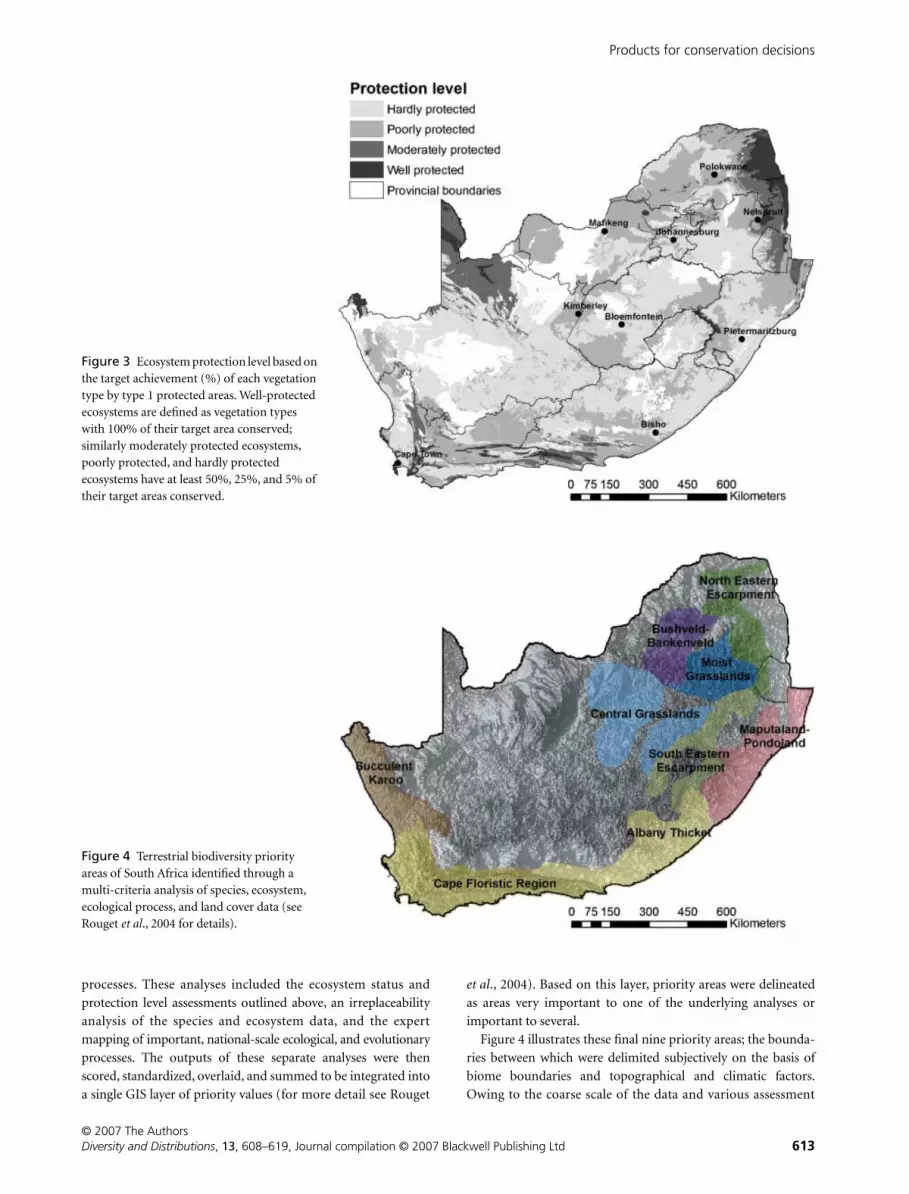
Products for conservation decisions
copy 2007 The Authors
Diversity and Distributions
13
608ndash619 Journal compilation copy 2007 Blackwell Publishing Ltd
613
processes These analyses included the ecosystem status and
protection level assessments outlined above an irreplaceability
analysis of the species and ecosystem data and the expert
mapping of important national-scale ecological and evolutionary
processes The outputs of these separate analyses were then
scored standardized overlaid and summed to be integrated into
a single GIS layer of priority values (for more detail see Rouget
et al
2004) Based on this layer priority areas were delineated
as areas very important to one of the underlying analyses or
important to several
Figure 4 illustrates these final nine priority areas the bounda-
ries between which were delimited subjectively on the basis of
biome boundaries and topographical and climatic factors
Owing to the coarse scale of the data and various assessment
Figure 3 Ecosystem protection level based on the target achievement () of each vegetation type by type 1 protected areas Well-protected ecosystems are defined as vegetation types with 100 of their target area conserved similarly moderately protected ecosystems poorly protected and hardly protected ecosystems have at least 50 25 and 5 of their target areas conserved
Figure 4 Terrestrial biodiversity priority areas of South Africa identified through a multi-criteria analysis of species ecosystem ecological process and land cover data (see Rouget et al 2004 for details)
B Reyers
et al
copy 2007 The Authors
614
Diversity and Distributions
13
608ndash619 Journal compilation copy 2007 Blackwell Publishing Ltd
outputs priority areas defined here could not be identified at the
level of property boundaries Therefore the boundaries of the
final priority areas are rough estimates and should not be used
for decision-making at the local scale These priority areas
comprise 5497 million ha occupying 4336 of South Africa
The nine priority areas are North-eastern Escarpment Bushveld-
Bankenveld Moist Grasslands Central Grasslands South-eastern
Escarpment Maputaland-Pondoland Albany Thicket and Wild
Coast Cape Floristic Region and the Succulent Karoo
DISCUSSION
The NSBA a critique of the process and products
The NSBA set out to accomplish the dual challenges of developing
defensible products while at the same time ensuring these
products were user-useful and user-friendly (Driver
et al
2003)
The NSBA was released in April 2005 so it is perhaps too early to
assess the full extent to which it has achieved these aims We can
however review the process products and current uptake in an
effort to contribute to the growing body of conservation action
evaluation best practice and lessons learnt (Sutherland
et al
2004 Ferraro amp Pattanayak 2006 Knight
et al
2006b) Below
we review the defensibility and usability of the products and
conclude by proposing a way forward in the development of
products for national-scale conservation decision-making
Defensible products
Defensible products are those that have the support of the
conservation science community can withstand the peer review
process and are based on current best practice The NSBA
appears to exhibit these characteristics in that it (1) was
conducted by a large collaboration of conservation planning
scientists from universities science councils conservation agencies
and independent consultants generating broad support of the
products by the scientific community (see Driver
et al
2005 for
a full list of participants) (2) was submitted as a contribution to
this journal so that it could be subjected to international peer
review and (3) was based on a systematic approach reflecting
current best practice (Margules amp Pressey 2000)
The systematic approach involved the inclusion of species
(plant and animal) ecosystems and processes in the assessment
thereby ensuring that the priority areas identified cater for all
elements essential to the persistence of national biodiversity
(Balmford
et al
1998 Cowling
et al
1999 2004) while a focus
on representation complementarity and conservation targets
guaranteed accountable repeatable and defensible outputs
(Margules amp Pressey 2000 Rodrigues
et al 2000) This form of
national biodiversity assessment moves beyond approaches
based on a one or a limited number of taxa eg Important Bird
Areas (Barnes 1998) Centres of Plant Endemism (van Wyk amp
Smith 2001) and Key Biodiversity Areas (Eken et al 2004)
scoring eg biodiversity hotspots (Myers et al 2000 Mitter-
meier et al 2005) and entirely expert-derived priority areas
(Olivieri et al 1995 Hannah et al 1998 Kaltenborn et al
1999) The NSBA approach comprised the complementarity-
driven identification of priority areas which make measurable
contributions to national-scale conservation goals of biodiversity
representation and persistence This ability to objectively calculate
and defend the contribution each priority area makes to national
conservation goals sets this approach apart from other forms of
national biodiversity assessment It is important to emphasize
that the NSBA was not a reserve selection exercise used to
identify specific parcels of land for conservation action instead it
was based on a multi-criteria approach that allowed for the
integration of a suite of biodiversity assessment outputs at a
variety of scales into a single map of broad spatial conservation
priorities in South Africa
There are some data-related shortcomings in the NSBA that
may impact on its defensibility These shortcomings include
inadequate data on species distributions and pressures facing
biodiversity This resulted in products that are biased towards the
ecosystem level and do not adequately reflect status and priori-
ties at the species level Furthermore the land cover data used as
a measure of the pressures facing biodiversity are limited in that
they (1) are over 10 years old (2) do not incorporate habitat
degradation or fragmentation and (3) do not reflect pressures
like hunting collecting pollution and climate change This
implies that the results of the NSBA may underestimate the
degree of pressure and therefore the conservation status of South
Africarsquos biodiversity However the products of this assessment
are of broad-scale nature that may alleviate the impacts of data
inaccuracies it is at fine scale that these limitations become a
significant impediment and must be addressed Additional
shortcomings include a lack of spatially explicit information on
processes (eg major migratory pathways) as well as the thresholds
used in the ecosystem status and protection level assessments
The former reflects current (albeit flawed) practice of relying on
expert mapping of process components (eg Rouget et al
2003a) while the latter is constrained by thresholds derived from
theoretical modelling studies (see Huggett 2005 for review)
instead of field data
Useable products
The NBSA was conceived developed and conducted with a
strong focus on uptake by national and provincial resource
management agencies as a means of ensuring implementation It
was hoped that the NSBA would streamline the challenging
implementation of the NBSAP (DEAT 2005) through providing
a spatial focus that was easy to understand and use From a
review of policies and plans currently under development (see
below) in these national and provincial agencies as well as
anecdotal evidence the ecosystem status map appears most use-
ful and popular The protection levels of ecosystems and overall
priority areas are currently less widely used
Evidence of the popularity and uses of the NSBA products
particularly the ecosystem status products include the following
1 National policies and plans have made use of the NSBA
products (generally ecosystem status maps) eg National Spatial
Development Perspective (httpwwwidporgza) South African
Products for conservation decisions
copy 2007 The AuthorsDiversity and Distributions 13 608ndash619 Journal compilation copy 2007 Blackwell Publishing Ltd 615
Environmental Outlook 2005 (wwwenvironmentgovza)
National Strategy for Sustainable Development (DEAT 2006)
The National Biodiversity Framework currently under develop-
ment is based on the NBSAP and NSBA particularly the overall
priority areas
2 Many of the requirements of the National Environmental
Management Biodiversity Act (Act 10 of 2004) will rely on the
NSBA approach and products including the listing of national
threatened and protected ecosystems and the development of
norms and standards for bioregional plans (DEAT 2004)
3 National level decisions regarding protected area expansion
made by DEAT and the South African National Parks Board will
be guided by the protection level product (T Smith pers
comm)
4 The NSBA provides useful headline indicators (ecosystem
status and protection level) that can be tracked over time as part
of South Africarsquos national monitoring and evaluation framework
These indicators also correspond well with the monitoring
requirements of some of the headline indicators of the CBDrsquos
2010 Target (UNEP 2003 Balmford et al 2005 Reyers amp
McGeoch in press) This correspondence is highlighted in the
NBSAP (DEAT 2005) and will streamline South Africarsquos reporting
requirements to the CBD
5 At the provincial level the Western Cape Province has already
used the ecosystem status product as part of its Provincial Spatial
Development Framework for determining spatial planning
categories and guidelines for land-use decision-making across
the province (DEADP 2005a) Furthermore the Western Cape
State of Environment Report draws heavily on the NSBA for
biodiversity-related information and indicators (DEADP 2005b)
6 The Mpumalanga Provincial Conservation plan uses the
concept of ecosystem status applied to their ecosystem level data
The Free State North-west and Limpopo provinces have
adopted the NSBA approach and products for their planned
bioregional programmes (T Smith pers comm)
7 The need for a National Grasslands Biodiversity Programme
was supported by the overall priority map and a biome wide
priority area assessment used the outputs of the NSBA as an
input (Reyers et al 2005)
8 Anecdotal evidence suggests that good use is being made of the
ecosystem status layer for informing Environmental Impact
Assessments (EIA)
9 The popularity and rapid uptake of the ecosystem status
product appears to be largely due to it being a compelling and
accessible product that makes easier the work of implementing
agencies These strengths include the following
bull Ecosystem status maps were developed for all environments
(terrestrial river marine and estuarine) in a consistent way
using the same terminology and principles allowing for com-
parisons between the environments
bull Ecosystem status is an easy concept for most people to
understand including politicians and officials who have no
background or experience in biodiversity This understanding
is promoted by the similarity of conservation status categories
used in species assessments for Red Data Lists (IUCN 2001)
The maps have a strong visual logic using a sequence of
colours from red to green to reflect most threatened through
to least threatened ecosystems (Fig 2)
bull Ecosystem status can be assessed at all scales by a variety of
conservation practitioners The assessment of ecosystem
status is relatively simple requiring data on ecosystem extent
habitat loss a conservation target per ecosystem and some
basic GIS and conservation planning expertise and is thus not
limited to the domain of academics
Figure 5 Congruence of existing bioregional and provincial conservation plans and programmes in South Africa with the identified overall priority areas The high levels of congruence indicate that many of these priority areas have been previously identified in other sub-national or global assessments prior to the NSBA
CAPE Cape Action Plan for People and the
Environment STEP Subtropical Thicket
Ecosystem Planning Program
SKEP Succulent Karoo Ecosystem Plan
NGBP National Grasslands Biodiversity
Program
B Reyers et al
copy 2007 The Authors616 Diversity and Distributions 13 608ndash619 Journal compilation copy 2007 Blackwell Publishing Ltd
The protection level product has not witnessed similar broad
uptake This however is to be expected as it is of interest to only
a small group of national and provincial conservation agencies
with the mandate to establish statutory protected areas
Currently these agencies are making use of the product to guide
protected area expansion
Although not used as widely as the ecosystem status product
the map of overall priority areas has been received with great
interest by DEAT and forms the basis for the National Biodiversity
Framework It integrates information on the status of national
biodiversity in a single product that confirms that existing
bioregional programmes [Fig 5 such as the Subtropical Thicket
Ecosystem Programme (STEP) and the Cape Action Plan for
People and the Environment (CAPE)] are focusing their efforts
on national priority areas while identifying gaps in this bio-
regional coverage [eg providing motivation for the development
of the National Grasslands Biodiversity Programme (NGBP)] Its
popularity with some implementing agencies suggests that maps
of broad priority areas can be useful but if they are to be used to
maximum effect they need to be interpreted and accompanied by
clear explanations that point to their practical implications for
implementing agencies The next iteration of the NSBA in 5 years
time will have to address this challenge of conceptualizing more
effective and clear key messages for the overall priority map
CONCLUSION
In the short time since its release South Africarsquos first NSBA has
begun to achieve the desired uptake by implementing agencies
It was described by South Africarsquos Minister of Environmental
Affairs and Tourism as lsquogroundbreakingrsquo and a lsquouseful tool in
policy- and decision-making across all spheres of governmentrsquo
The existence within the NSBA team of significant conservation
planning expertise from several subnational conservation plans
and a strong spirit of collaboration between planners and
implementers played a significant role in ensuring that we based
this assessment on the lessons we have learnt from previous con-
servation plans (see Knight et al 2006b) Perhaps one of the
most important aspects of the NSBA is that it was conducted by
local conservation scientists who understood the institutional
context for the assessment and could communicate effectively
with implementing agencies The fact that this was an assessment
done by South Africans for South Africans promoted a sense of
ownership of the products and helped promote uptake
Despite these strengths the need to repeat this assessment
every 5 years and to contribute to the growing body of evalua-
tion and best practice for conservation implies that we need to
take a critical look at the process and products in an effort to
improve them and their effectiveness in the future We have
highlighted some of the data and information shortcomings that
should be addressed before the next iteration Furthermore this
evaluation of the NSBA products has supported the call being
made by many conservation scientists to go beyond implementa-
tion to the design of programme monitoring and evaluation
systems (Hockings 2003 Stem et al 2005) As Ferraro amp Pattanayak
(2006) point out the limited resources for conservation make the
assessment of the effectiveness of conservation interventions
essential if these resources are to stretch as far as possible One of
the biggest challenges in this paper was the evaluation of the
uptake and effectiveness of the NSBA we had to rely largely on
draft publications and anecdotal evidence from conversations
with implementing agency staff This may be due to the short
time period that has elapsed since the NSBA was released but it
is also a result of the lack of a monitoring programme with which
to assess and report on the effectiveness of the NSBA Several
frameworks exist for the monitoring of conservation effectiveness
(eg adaptive management frameworks Margoluis amp Salafsky
1998) and should certainly be reviewed and implemented before
the next NSBA iteration perhaps as part of the National
Biodiversity Monitoring and Reporting Framework currently
under development
REFERENCES
Acocks JPH (1953) Veld types of South Africa Memoirs of the
Botanical Society of South Africa 28 1ndash192
Andreacuten H (1994) Effects of habitat fragmentation on birds and
mammals in landscapes with different proportions of suitable
habitat a review Oikos 71 355ndash366
Balmford A Crane P Dobson A Green RE amp Mace GM
(2005) The 2010 challenge data availability information
needs and extraterrestrial insights Philosophical Transactions
of the Royal Society of London Series B Biological Sciences 360
221ndash228
Balmford A Mace GM amp Ginsberg JR (1998) The challenges
to conservation in a changing world putting processes on the
map Conservation in a changing world (ed by GM Mace A
Balmford and JR Ginsberg) pp 1ndash28 Cambridge University
Press Cambridge UK
Barnes KN ed (1998) The important bird areas of southern
Africa BirdLife Johannesburg South Africa
Berliner D amp Benn G (2004) Protected area planning for the forest
biome Prepared for DWAF WFSP Forestry Programme Depart-
ment of Water Affairs and Forestry Pretoria South Africa
Burgess N DrsquoAmico Hales J Underwood E Dinerstein E
Olson DM Itoua I Shipper J Ricketts TH amp Newman K
(2004) The terrestrial ecoregions of Africa and Madagascar
Island Press Washington DC
Cowling RM Knight AT Faith DP Ferrier S Lombard
AT Driver A Rouget M Maze K amp Desmet PG (2004)
Nature conservation requires more than a passion for species
Conservation Biology 18 1674ndash1677
Cowling RM Pressey RL Lombard AT Desmet PG amp
Ellis AG (1999) From representation to persistence require-
ments for a sustainable reserve system in the species-rich
Mediterranean-climate deserts of southern Africa Diversity
and Distributions 5 51ndash71
Cowling RM Pressey RL Rouget M amp Lombard AT
(2003) A conservation plan for a global biodiversity hotspot mdash
the Cape Floristic Region South Africa Biological Conservation
112 191ndash216
DEADP (2005a) Western Cape provincial spatial development
Products for conservation decisions
copy 2007 The AuthorsDiversity and Distributions 13 608ndash619 Journal compilation copy 2007 Blackwell Publishing Ltd 617
framework Provincial Government of the Western Cape
Department of Environmental Affairs and Development
Planning Cape Town httpwwwcapegatewaygovzaeng
pubsguidesW120505
DEADP (2005b) Western Cape state of the environment report
Provincial Government of the Western Cape Department of
Environmental Affairs and Development Planning Cape
Town httpwwwcapegatewaygovzaengpublications
reports_researchW120813
DEAT (2004) The National Environmental Management Biodiver-
sity Act No 10 of 2004 Department of Environmental Affairs and
Tourism Pretoria South Africa httpwwwenvironmentgovza
DEAT (2005) South Africarsquos National Biodiversity Strategy and
Action Plan Department of Environmental Affairs and Tourism
Pretoria South Africa
DEAT (2006) South Africarsquos National Strategy for Sustainable
Development Draft for Review Department of Environmental
Affairs and Tourism httpwwwenvironmentgovza
nssd_2005draft_intergrated_strat
Desmet P amp Cowling RM (2004) Using the speciesndasharea
relationship to set baseline targets for conservation Ecology
and Society 9 (11) httpwwwecologyandsocietyorgvol9
iss2art11
Driver A Cowling RM amp Maze K (2003) Planning for living
landscapes perspectives and lessons from South Africa Center
for Applied Biodiversity Science at Conservation Interna-
tional Washington DC and the Botanical Society of South
Africa Cape Town httpwwwbotanicalsocietyorgza
defaultphppageID=ccuccu_downloadshtm
Driver A Maze K Rouget M Lombard AT Nel J Turpie
JK Cowling RM Desmet P Goodman P Harris J Jonas
Z Reyers B Sink K amp Strauss T (2005) National Spatial
Biodiversity Assessment 2004 priorities for biodiversity con-
servation in South Africa Strelitzia 17 South African National
Biodiversity Institute Pretoria South Africa http
wwwsanbiorgbiodiversitynsbahtm
Edwards D (1974) Survey to determine the adequacy of existing
conserved areas in relation to vegetation types A preliminary
report Koedoe 17 3ndash38
Eken G Bennun L Brooks TM Darwall W Fishpool
LDC Foster M Knox D Langhammer P Matiku P
Radford E Salaman P Sechrest W Smith ML Spector S
amp Tordoff A (2004) Key biodiversity areas as site conservation
targets Bioscience 54 1110ndash1118
Fahrig L (2001) How much habitat is enough Biological
Conservation 100 65ndash74
Fairbanks DHK Thompson MW Vink DE Newby
TS van den Berg HM amp Everard DA (2000) The
South African land-cover characteristics database a synopsis of
the landscape South African Journal of Science 96 69ndash82
Ferraro PJ amp Pattanayak SK (2006) Money for nothing A
call for empirical evaluation of biodiversity conservation
investments PloS Biology 4 (4) e105
Ferrier S Pressey RL amp Barrett TW (2000) A new predictor
of the irreplaceability of areas for achieving a conservation
goal its application to real-world planning and a research
agenda for further refinement Biological Conservation 93
303ndash325
Flather CH amp Bevers M (2002) Patchy reaction-diffusion and
population abundance The relative importance of habitat
amount and arrangement The American Naturalist 159 40ndash
56
Franklin JF amp Forman RTT (1987) Creating landscape
patterns by forest cutting ecological consequences and principles
Landscape Ecology 1 5ndash18
Freitag S Nicholls AO amp van Jaarsveld AS (1998) Dealing
with established reserve networks and incomplete distribution
data sets in conservation planning South African Journal of
Science 94 79ndash86
Glowka L Burhenne-Guilmin S Synge H McNeely JA amp
Guumlndling L (1994) A guide to the convention on biological
diversity Environmental Policy and Law Paper no 30 IUCN
Gland and Cambridge
Hannah L Rakotosamimanana B Ganzhorn J Mittermeier
RA Olivieri S Iyer L Rajaobelina S Hough J Andriami-
alisoa F Bowles I amp Tilken G (1998) Participatory plan-
ning scientific priorities and landscape conservation in
Madagascar Environmental Conservation 25 30ndash36
Heads M (2004) What is a node Journal of Biogeography 31
1883ndash1891
Hockings M (2003) Systems for assessing the effectiveness of
management in protected areas Bioscience 53 823ndash832
Huggett AJ (2005) The concept and utility of lsquoecological
thresholdsrsquo in biodiversity conservation Biological Conserva-
tion 124 301ndash310
IUCN (1994) IUCN red list categories IUCN Gland Switzer-
land
IUCN (2001) IUCN red list categories and criteria version 31
IUCN Species Survival Commission Gland Switzerland and
Cambridge UK
Kaltenborn BK Hanse R amp Hundeinde M (1999) National
park planning and local participation from a mountain region
in southern Norway Mountain Research and Development 19
51ndash61
Knight AT Cowling RM amp Campbell BM (2006a) Planning
for implementation an operational model for implementing
conservation action Conservation Biology 20 408ndash419
Knight AT Driver A Cowling RM Maze K Desmet PG
Lombard AT Rouget M Botha MA Boshoff AF
Castley JG Goodman PS MacKinnon K Pierce SM
Sims-Castley R Stewart WI amp von Hase A (2006b) Design-
ing systematic conservation assessments that promote effective
implementation best practice from South Africa Conservation
Biology 20 739ndash750
Lombard AT Strauss T Harris J Sink K Attwood C amp
Hutchings L (2004) South African National Biodiversity
Assessment 2004 technical report Volume 4 marine component
South African National Biodiversity Institute Pretoria South
Africa httpwwwsanbiorgza
Mace GM amp Lande R (1991) Assessing extinction threats
towards a reevaluation of IUCN threatened species categories
Conservation Biology 5 148ndash157
B Reyers et al
copy 2007 The Authors618 Diversity and Distributions 13 608ndash619 Journal compilation copy 2007 Blackwell Publishing Ltd
Margoluis R amp Salafsky N (1998) Measuring success designing
managing and monitoring conservation and development
projects Island Press Washington DC
Margules CR amp RLPressey (2000) Systematic conservation
planning Nature 405 37ndash47
Midgley G Rutherford M amp Bond W (2001) The heat is on
impacts of climate change on plant diversity in south Africa
National Botanic Institute Cape Town South Africa
Mittermeier RA Hoffmann M Pilgrim JD Brooks TB
Mittermeier CG Lamoreux JL amp Fonseca G (ed) (2005)
Hotspots revisited Earthrsquos biologically richest and most endangered
ecoregions Cemex Mexico City
Mucina L Rutherford MC amp Powrie LW (ed) (2005)
Vegetation map of South Africa Lesotho and Swaziland
1 1000000 scale sheet maps South African National Biodiver-
sity Institute Pretoria South Africa ISBN 1-919976-22-1
Myers N Mittermeier RA Mittermeier CG da Fonseca
GAB amp Kent J (2000) Biodiversity hotspots for conservation
priorities Nature 4032 853ndash858
Nel JL Roux DJ Maree G Kleynhans CJ Moolman J
Reyers B Rouget M amp Cowling RM (2007) A systematic
conservation assessment of the ecosystem status and protection
levels of main rivers Diversity and Distributions 13 341ndash352
Noss R (2003) A checklist for wildlands network designs
Conservation Biology 17 (5) 1ndash7
Olivieri S Bowles I Cavalcanti RB Fonseca GAB
Mittermeier RA amp Rostrom C (1995) A participatory
approach to biodiversity conservation the regional priority
setting workshop Conservation International Washington DC
Olson DM amp Dinerstein E (2002) The Global 200 priority
ecoregions for global conservation Annals of the Missouri
Botanical Garden 89 199ndash224
Pierce SM Cowling RM Knight AT Lombard AT
Rouget M amp Wolf T (2005) Systematic conservation
assessment products for landuse planning interpretation for
implementation Biological Conservation 125 441ndash548
Pierce SM Cowling RM Sandwith T amp MacKinnon K ed
(2002) Mainstreaming biodiversity in development case studies
from South Africa World Bank Washington DC
Prendergast JR Quinn RM amp Lawton JH (1999) The gaps
between theory and practice in selecting nature reserves
Conservation Biology 13 484ndash492
Pressey RL (1999) Applications of irreplaceability analysis to
planning and management problems Parks 9 42ndash51
Pressey RL Cowling RM amp Rouget M (2003) Formulating
conservation targets for biodiversity pattern and process in the
Cape Floristic Region South Africa Biological Conservation
112 99ndash127
Pressey RL Humphries CJ Margules CR Vane-Wright RI
amp Williams PH (1993) Beyond opportunism key principles
for systematic reserve selection Trends in Ecology amp Evolution
8 124ndash128
Pullin AS amp Knight TM (2001) Effectiveness in conservation
practice Pointers from medicine and public health Conserva-
tion Biology 15 50ndash54
Reyers B Fairbanks DHK van Jaarsveld AS amp Thompson
M (2001) Priority areas for the conservation of South African
vegetation a coarse filter approach Diversity and Distribu-
tions 7 77ndash96
Reyers B amp McGeoch M (in press) A biodiversity monitoring
framework for South Africa progress and directions South
African Journal of Science
Reyers B Nel J Egoh B Rouget M amp Jonas Z (2005) A
conservation assessment of South Africarsquos grassland biome
integrating terrestrial river ecosystem services and fine scale
priorities CSIR Report Number ENV-S-C 2005-102 CSIR
Stellenbosch Cape Town
Ricketts TH Dinerstein E Olson D Loucks CJ Eichbaum
W DellaSala D Kavanagh K Hedao P Hurley PT
Carney KM Abell R amp Walters S (1999) Terrestrial ecore-
gions of North America a conservation assessment Island Press
Washington DC
Rodrigues AS Cerdeira JO amp Gaston KJ (2000) Flexibility
efficiency and accountability adapting reserve selection
algorithms to more complex conservation problems Ecography
23 (5) 565ndash574
Rouget M Cowling RM Pressey RL amp Richardson DM
(2003a) Identifying the spatial components of ecological and
evolutionary processes for regional conservation planning in the
Cape Floristic Region Diversity and Distributions 9 191ndash210
Rouget M Richardson DM amp Cowling RM (2003b) The
current configuration of protected areas in the Cape Floristic
Region mdash reservation bias and representation of biodiversity
patterns and processes Biological Conservation 112 129ndash145
Rouget M Reyers B Jonas Z Desmet P Driver A Maze K
Egoh B amp Cowling RM (2004) South African National
Spatial Biodiversity Assessment 2004 Technical report Volume
1 terrestrial component South African National Biodiversity
Institute Pretoria httpwwwsanbiorgbiodiversitynsbahtm
Salafsky N Margoluis R Redford KH amp Robinson JG
(2002) Improving the practice of conservation a conceptual
framework and research agenda for conservation science
Conservation Biology 16 1469ndash1479
Scholes RJ amp Biggs R (ed) (2004) Ecosystem services in southern
Africa a regional assessment Council for Scientific and Indus-
trial Research Pretoria South Africa
Scholes RJ amp Noble IR (2001) Storing carbon on land Science
294 1012
Schulze RE Maharaj M Lynch SD Howe BJ amp Melvil-
Thomson B (1997) South African atlas of agrohydrology and
climatology Water Research Commission Report Pretoria
South Africa
Scott JM Davis F Csuti B Noss RF Butterfield B Groves C
Anderson H Caicco S DrsquoErchia F Edwards TC Uliman J
amp Wright G (1993) Gap analysis a geographic approach to
protection of biological diversity Wildlife Monographs 123 1ndash41
Stem C Margoluis R Salafsky N amp Brown M (2005)
Monitoring and evaluation in conservation A review of trends
and approaches Conservation Biology 19 295ndash309
Sutherland WJ Pullin AS Dolman PM amp Knight TM
(2004) The need for evidence-based conservation Trends in
Ecology amp Evolution 19 305ndash308
Products for conservation decisions
copy 2007 The AuthorsDiversity and Distributions 13 608ndash619 Journal compilation copy 2007 Blackwell Publishing Ltd 619
Theobald DM Hobbs NT Bearly T Zack JA Shenk T amp
Riebsame WE (2000) Incorporating biological information
in local land-use decision making designing a system for
conservation planning Landscape Ecology 15 35ndash45
UNEP (2003) Proposed biodiversity indicators relevant to the 2010
target UNEPCBDSBSTTA9INF26 httpwwwbiodivorgdoc
meetingssbsttasbstta-09informationsbstta-09-inf-26-enpdf
Walker S Price R Rutledge D Stephens T amp Lee WG
(2006) Recent loss of indigenous cover in New Zealand New
Zealand Journal of Ecology 30 (20) 169ndash177
Werger MJA (1978) Biogeographical division of southern
Africa Biogeography and ecology of southern Africa (ed by
MJA Werger) pp 147ndash170 Junk The Hague
Wilson KA Westphal MI Possingham HP amp Elith J (2005)
Sensitivity of conservation planning to different approaches to
using predicted species distribution data Biological Conserva-
tion 122 99ndash112
van Wyk AE amp Smith GF (2001) Regions of floristic endemism
in southern Africa a review with emphasis on succulents
Umdaus Press Pretoria South Africa

Products for conservation decisions
copy 2007 The AuthorsDiversity and Distributions 13 608ndash619 Journal compilation copy 2007 Blackwell Publishing Ltd 615
Environmental Outlook 2005 (wwwenvironmentgovza)
National Strategy for Sustainable Development (DEAT 2006)
The National Biodiversity Framework currently under develop-
ment is based on the NBSAP and NSBA particularly the overall
priority areas
2 Many of the requirements of the National Environmental
Management Biodiversity Act (Act 10 of 2004) will rely on the
NSBA approach and products including the listing of national
threatened and protected ecosystems and the development of
norms and standards for bioregional plans (DEAT 2004)
3 National level decisions regarding protected area expansion
made by DEAT and the South African National Parks Board will
be guided by the protection level product (T Smith pers
comm)
4 The NSBA provides useful headline indicators (ecosystem
status and protection level) that can be tracked over time as part
of South Africarsquos national monitoring and evaluation framework
These indicators also correspond well with the monitoring
requirements of some of the headline indicators of the CBDrsquos
2010 Target (UNEP 2003 Balmford et al 2005 Reyers amp
McGeoch in press) This correspondence is highlighted in the
NBSAP (DEAT 2005) and will streamline South Africarsquos reporting
requirements to the CBD
5 At the provincial level the Western Cape Province has already
used the ecosystem status product as part of its Provincial Spatial
Development Framework for determining spatial planning
categories and guidelines for land-use decision-making across
the province (DEADP 2005a) Furthermore the Western Cape
State of Environment Report draws heavily on the NSBA for
biodiversity-related information and indicators (DEADP 2005b)
6 The Mpumalanga Provincial Conservation plan uses the
concept of ecosystem status applied to their ecosystem level data
The Free State North-west and Limpopo provinces have
adopted the NSBA approach and products for their planned
bioregional programmes (T Smith pers comm)
7 The need for a National Grasslands Biodiversity Programme
was supported by the overall priority map and a biome wide
priority area assessment used the outputs of the NSBA as an
input (Reyers et al 2005)
8 Anecdotal evidence suggests that good use is being made of the
ecosystem status layer for informing Environmental Impact
Assessments (EIA)
9 The popularity and rapid uptake of the ecosystem status
product appears to be largely due to it being a compelling and
accessible product that makes easier the work of implementing
agencies These strengths include the following
bull Ecosystem status maps were developed for all environments
(terrestrial river marine and estuarine) in a consistent way
using the same terminology and principles allowing for com-
parisons between the environments
bull Ecosystem status is an easy concept for most people to
understand including politicians and officials who have no
background or experience in biodiversity This understanding
is promoted by the similarity of conservation status categories
used in species assessments for Red Data Lists (IUCN 2001)
The maps have a strong visual logic using a sequence of
colours from red to green to reflect most threatened through
to least threatened ecosystems (Fig 2)
bull Ecosystem status can be assessed at all scales by a variety of
conservation practitioners The assessment of ecosystem
status is relatively simple requiring data on ecosystem extent
habitat loss a conservation target per ecosystem and some
basic GIS and conservation planning expertise and is thus not
limited to the domain of academics
Figure 5 Congruence of existing bioregional and provincial conservation plans and programmes in South Africa with the identified overall priority areas The high levels of congruence indicate that many of these priority areas have been previously identified in other sub-national or global assessments prior to the NSBA
CAPE Cape Action Plan for People and the
Environment STEP Subtropical Thicket
Ecosystem Planning Program
SKEP Succulent Karoo Ecosystem Plan
NGBP National Grasslands Biodiversity
Program
B Reyers et al
copy 2007 The Authors616 Diversity and Distributions 13 608ndash619 Journal compilation copy 2007 Blackwell Publishing Ltd
The protection level product has not witnessed similar broad
uptake This however is to be expected as it is of interest to only
a small group of national and provincial conservation agencies
with the mandate to establish statutory protected areas
Currently these agencies are making use of the product to guide
protected area expansion
Although not used as widely as the ecosystem status product
the map of overall priority areas has been received with great
interest by DEAT and forms the basis for the National Biodiversity
Framework It integrates information on the status of national
biodiversity in a single product that confirms that existing
bioregional programmes [Fig 5 such as the Subtropical Thicket
Ecosystem Programme (STEP) and the Cape Action Plan for
People and the Environment (CAPE)] are focusing their efforts
on national priority areas while identifying gaps in this bio-
regional coverage [eg providing motivation for the development
of the National Grasslands Biodiversity Programme (NGBP)] Its
popularity with some implementing agencies suggests that maps
of broad priority areas can be useful but if they are to be used to
maximum effect they need to be interpreted and accompanied by
clear explanations that point to their practical implications for
implementing agencies The next iteration of the NSBA in 5 years
time will have to address this challenge of conceptualizing more
effective and clear key messages for the overall priority map
CONCLUSION
In the short time since its release South Africarsquos first NSBA has
begun to achieve the desired uptake by implementing agencies
It was described by South Africarsquos Minister of Environmental
Affairs and Tourism as lsquogroundbreakingrsquo and a lsquouseful tool in
policy- and decision-making across all spheres of governmentrsquo
The existence within the NSBA team of significant conservation
planning expertise from several subnational conservation plans
and a strong spirit of collaboration between planners and
implementers played a significant role in ensuring that we based
this assessment on the lessons we have learnt from previous con-
servation plans (see Knight et al 2006b) Perhaps one of the
most important aspects of the NSBA is that it was conducted by
local conservation scientists who understood the institutional
context for the assessment and could communicate effectively
with implementing agencies The fact that this was an assessment
done by South Africans for South Africans promoted a sense of
ownership of the products and helped promote uptake
Despite these strengths the need to repeat this assessment
every 5 years and to contribute to the growing body of evalua-
tion and best practice for conservation implies that we need to
take a critical look at the process and products in an effort to
improve them and their effectiveness in the future We have
highlighted some of the data and information shortcomings that
should be addressed before the next iteration Furthermore this
evaluation of the NSBA products has supported the call being
made by many conservation scientists to go beyond implementa-
tion to the design of programme monitoring and evaluation
systems (Hockings 2003 Stem et al 2005) As Ferraro amp Pattanayak
(2006) point out the limited resources for conservation make the
assessment of the effectiveness of conservation interventions
essential if these resources are to stretch as far as possible One of
the biggest challenges in this paper was the evaluation of the
uptake and effectiveness of the NSBA we had to rely largely on
draft publications and anecdotal evidence from conversations
with implementing agency staff This may be due to the short
time period that has elapsed since the NSBA was released but it
is also a result of the lack of a monitoring programme with which
to assess and report on the effectiveness of the NSBA Several
frameworks exist for the monitoring of conservation effectiveness
(eg adaptive management frameworks Margoluis amp Salafsky
1998) and should certainly be reviewed and implemented before
the next NSBA iteration perhaps as part of the National
Biodiversity Monitoring and Reporting Framework currently
under development
REFERENCES
Acocks JPH (1953) Veld types of South Africa Memoirs of the
Botanical Society of South Africa 28 1ndash192
Andreacuten H (1994) Effects of habitat fragmentation on birds and
mammals in landscapes with different proportions of suitable
habitat a review Oikos 71 355ndash366
Balmford A Crane P Dobson A Green RE amp Mace GM
(2005) The 2010 challenge data availability information
needs and extraterrestrial insights Philosophical Transactions
of the Royal Society of London Series B Biological Sciences 360
221ndash228
Balmford A Mace GM amp Ginsberg JR (1998) The challenges
to conservation in a changing world putting processes on the
map Conservation in a changing world (ed by GM Mace A
Balmford and JR Ginsberg) pp 1ndash28 Cambridge University
Press Cambridge UK
Barnes KN ed (1998) The important bird areas of southern
Africa BirdLife Johannesburg South Africa
Berliner D amp Benn G (2004) Protected area planning for the forest
biome Prepared for DWAF WFSP Forestry Programme Depart-
ment of Water Affairs and Forestry Pretoria South Africa
Burgess N DrsquoAmico Hales J Underwood E Dinerstein E
Olson DM Itoua I Shipper J Ricketts TH amp Newman K
(2004) The terrestrial ecoregions of Africa and Madagascar
Island Press Washington DC
Cowling RM Knight AT Faith DP Ferrier S Lombard
AT Driver A Rouget M Maze K amp Desmet PG (2004)
Nature conservation requires more than a passion for species
Conservation Biology 18 1674ndash1677
Cowling RM Pressey RL Lombard AT Desmet PG amp
Ellis AG (1999) From representation to persistence require-
ments for a sustainable reserve system in the species-rich
Mediterranean-climate deserts of southern Africa Diversity
and Distributions 5 51ndash71
Cowling RM Pressey RL Rouget M amp Lombard AT
(2003) A conservation plan for a global biodiversity hotspot mdash
the Cape Floristic Region South Africa Biological Conservation
112 191ndash216
DEADP (2005a) Western Cape provincial spatial development
Products for conservation decisions
copy 2007 The AuthorsDiversity and Distributions 13 608ndash619 Journal compilation copy 2007 Blackwell Publishing Ltd 617
framework Provincial Government of the Western Cape
Department of Environmental Affairs and Development
Planning Cape Town httpwwwcapegatewaygovzaeng
pubsguidesW120505
DEADP (2005b) Western Cape state of the environment report
Provincial Government of the Western Cape Department of
Environmental Affairs and Development Planning Cape
Town httpwwwcapegatewaygovzaengpublications
reports_researchW120813
DEAT (2004) The National Environmental Management Biodiver-
sity Act No 10 of 2004 Department of Environmental Affairs and
Tourism Pretoria South Africa httpwwwenvironmentgovza
DEAT (2005) South Africarsquos National Biodiversity Strategy and
Action Plan Department of Environmental Affairs and Tourism
Pretoria South Africa
DEAT (2006) South Africarsquos National Strategy for Sustainable
Development Draft for Review Department of Environmental
Affairs and Tourism httpwwwenvironmentgovza
nssd_2005draft_intergrated_strat
Desmet P amp Cowling RM (2004) Using the speciesndasharea
relationship to set baseline targets for conservation Ecology
and Society 9 (11) httpwwwecologyandsocietyorgvol9
iss2art11
Driver A Cowling RM amp Maze K (2003) Planning for living
landscapes perspectives and lessons from South Africa Center
for Applied Biodiversity Science at Conservation Interna-
tional Washington DC and the Botanical Society of South
Africa Cape Town httpwwwbotanicalsocietyorgza
defaultphppageID=ccuccu_downloadshtm
Driver A Maze K Rouget M Lombard AT Nel J Turpie
JK Cowling RM Desmet P Goodman P Harris J Jonas
Z Reyers B Sink K amp Strauss T (2005) National Spatial
Biodiversity Assessment 2004 priorities for biodiversity con-
servation in South Africa Strelitzia 17 South African National
Biodiversity Institute Pretoria South Africa http
wwwsanbiorgbiodiversitynsbahtm
Edwards D (1974) Survey to determine the adequacy of existing
conserved areas in relation to vegetation types A preliminary
report Koedoe 17 3ndash38
Eken G Bennun L Brooks TM Darwall W Fishpool
LDC Foster M Knox D Langhammer P Matiku P
Radford E Salaman P Sechrest W Smith ML Spector S
amp Tordoff A (2004) Key biodiversity areas as site conservation
targets Bioscience 54 1110ndash1118
Fahrig L (2001) How much habitat is enough Biological
Conservation 100 65ndash74
Fairbanks DHK Thompson MW Vink DE Newby
TS van den Berg HM amp Everard DA (2000) The
South African land-cover characteristics database a synopsis of
the landscape South African Journal of Science 96 69ndash82
Ferraro PJ amp Pattanayak SK (2006) Money for nothing A
call for empirical evaluation of biodiversity conservation
investments PloS Biology 4 (4) e105
Ferrier S Pressey RL amp Barrett TW (2000) A new predictor
of the irreplaceability of areas for achieving a conservation
goal its application to real-world planning and a research
agenda for further refinement Biological Conservation 93
303ndash325
Flather CH amp Bevers M (2002) Patchy reaction-diffusion and
population abundance The relative importance of habitat
amount and arrangement The American Naturalist 159 40ndash
56
Franklin JF amp Forman RTT (1987) Creating landscape
patterns by forest cutting ecological consequences and principles
Landscape Ecology 1 5ndash18
Freitag S Nicholls AO amp van Jaarsveld AS (1998) Dealing
with established reserve networks and incomplete distribution
data sets in conservation planning South African Journal of
Science 94 79ndash86
Glowka L Burhenne-Guilmin S Synge H McNeely JA amp
Guumlndling L (1994) A guide to the convention on biological
diversity Environmental Policy and Law Paper no 30 IUCN
Gland and Cambridge
Hannah L Rakotosamimanana B Ganzhorn J Mittermeier
RA Olivieri S Iyer L Rajaobelina S Hough J Andriami-
alisoa F Bowles I amp Tilken G (1998) Participatory plan-
ning scientific priorities and landscape conservation in
Madagascar Environmental Conservation 25 30ndash36
Heads M (2004) What is a node Journal of Biogeography 31
1883ndash1891
Hockings M (2003) Systems for assessing the effectiveness of
management in protected areas Bioscience 53 823ndash832
Huggett AJ (2005) The concept and utility of lsquoecological
thresholdsrsquo in biodiversity conservation Biological Conserva-
tion 124 301ndash310
IUCN (1994) IUCN red list categories IUCN Gland Switzer-
land
IUCN (2001) IUCN red list categories and criteria version 31
IUCN Species Survival Commission Gland Switzerland and
Cambridge UK
Kaltenborn BK Hanse R amp Hundeinde M (1999) National
park planning and local participation from a mountain region
in southern Norway Mountain Research and Development 19
51ndash61
Knight AT Cowling RM amp Campbell BM (2006a) Planning
for implementation an operational model for implementing
conservation action Conservation Biology 20 408ndash419
Knight AT Driver A Cowling RM Maze K Desmet PG
Lombard AT Rouget M Botha MA Boshoff AF
Castley JG Goodman PS MacKinnon K Pierce SM
Sims-Castley R Stewart WI amp von Hase A (2006b) Design-
ing systematic conservation assessments that promote effective
implementation best practice from South Africa Conservation
Biology 20 739ndash750
Lombard AT Strauss T Harris J Sink K Attwood C amp
Hutchings L (2004) South African National Biodiversity
Assessment 2004 technical report Volume 4 marine component
South African National Biodiversity Institute Pretoria South
Africa httpwwwsanbiorgza
Mace GM amp Lande R (1991) Assessing extinction threats
towards a reevaluation of IUCN threatened species categories
Conservation Biology 5 148ndash157
B Reyers et al
copy 2007 The Authors618 Diversity and Distributions 13 608ndash619 Journal compilation copy 2007 Blackwell Publishing Ltd
Margoluis R amp Salafsky N (1998) Measuring success designing
managing and monitoring conservation and development
projects Island Press Washington DC
Margules CR amp RLPressey (2000) Systematic conservation
planning Nature 405 37ndash47
Midgley G Rutherford M amp Bond W (2001) The heat is on
impacts of climate change on plant diversity in south Africa
National Botanic Institute Cape Town South Africa
Mittermeier RA Hoffmann M Pilgrim JD Brooks TB
Mittermeier CG Lamoreux JL amp Fonseca G (ed) (2005)
Hotspots revisited Earthrsquos biologically richest and most endangered
ecoregions Cemex Mexico City
Mucina L Rutherford MC amp Powrie LW (ed) (2005)
Vegetation map of South Africa Lesotho and Swaziland
1 1000000 scale sheet maps South African National Biodiver-
sity Institute Pretoria South Africa ISBN 1-919976-22-1
Myers N Mittermeier RA Mittermeier CG da Fonseca
GAB amp Kent J (2000) Biodiversity hotspots for conservation
priorities Nature 4032 853ndash858
Nel JL Roux DJ Maree G Kleynhans CJ Moolman J
Reyers B Rouget M amp Cowling RM (2007) A systematic
conservation assessment of the ecosystem status and protection
levels of main rivers Diversity and Distributions 13 341ndash352
Noss R (2003) A checklist for wildlands network designs
Conservation Biology 17 (5) 1ndash7
Olivieri S Bowles I Cavalcanti RB Fonseca GAB
Mittermeier RA amp Rostrom C (1995) A participatory
approach to biodiversity conservation the regional priority
setting workshop Conservation International Washington DC
Olson DM amp Dinerstein E (2002) The Global 200 priority
ecoregions for global conservation Annals of the Missouri
Botanical Garden 89 199ndash224
Pierce SM Cowling RM Knight AT Lombard AT
Rouget M amp Wolf T (2005) Systematic conservation
assessment products for landuse planning interpretation for
implementation Biological Conservation 125 441ndash548
Pierce SM Cowling RM Sandwith T amp MacKinnon K ed
(2002) Mainstreaming biodiversity in development case studies
from South Africa World Bank Washington DC
Prendergast JR Quinn RM amp Lawton JH (1999) The gaps
between theory and practice in selecting nature reserves
Conservation Biology 13 484ndash492
Pressey RL (1999) Applications of irreplaceability analysis to
planning and management problems Parks 9 42ndash51
Pressey RL Cowling RM amp Rouget M (2003) Formulating
conservation targets for biodiversity pattern and process in the
Cape Floristic Region South Africa Biological Conservation
112 99ndash127
Pressey RL Humphries CJ Margules CR Vane-Wright RI
amp Williams PH (1993) Beyond opportunism key principles
for systematic reserve selection Trends in Ecology amp Evolution
8 124ndash128
Pullin AS amp Knight TM (2001) Effectiveness in conservation
practice Pointers from medicine and public health Conserva-
tion Biology 15 50ndash54
Reyers B Fairbanks DHK van Jaarsveld AS amp Thompson
M (2001) Priority areas for the conservation of South African
vegetation a coarse filter approach Diversity and Distribu-
tions 7 77ndash96
Reyers B amp McGeoch M (in press) A biodiversity monitoring
framework for South Africa progress and directions South
African Journal of Science
Reyers B Nel J Egoh B Rouget M amp Jonas Z (2005) A
conservation assessment of South Africarsquos grassland biome
integrating terrestrial river ecosystem services and fine scale
priorities CSIR Report Number ENV-S-C 2005-102 CSIR
Stellenbosch Cape Town
Ricketts TH Dinerstein E Olson D Loucks CJ Eichbaum
W DellaSala D Kavanagh K Hedao P Hurley PT
Carney KM Abell R amp Walters S (1999) Terrestrial ecore-
gions of North America a conservation assessment Island Press
Washington DC
Rodrigues AS Cerdeira JO amp Gaston KJ (2000) Flexibility
efficiency and accountability adapting reserve selection
algorithms to more complex conservation problems Ecography
23 (5) 565ndash574
Rouget M Cowling RM Pressey RL amp Richardson DM
(2003a) Identifying the spatial components of ecological and
evolutionary processes for regional conservation planning in the
Cape Floristic Region Diversity and Distributions 9 191ndash210
Rouget M Richardson DM amp Cowling RM (2003b) The
current configuration of protected areas in the Cape Floristic
Region mdash reservation bias and representation of biodiversity
patterns and processes Biological Conservation 112 129ndash145
Rouget M Reyers B Jonas Z Desmet P Driver A Maze K
Egoh B amp Cowling RM (2004) South African National
Spatial Biodiversity Assessment 2004 Technical report Volume
1 terrestrial component South African National Biodiversity
Institute Pretoria httpwwwsanbiorgbiodiversitynsbahtm
Salafsky N Margoluis R Redford KH amp Robinson JG
(2002) Improving the practice of conservation a conceptual
framework and research agenda for conservation science
Conservation Biology 16 1469ndash1479
Scholes RJ amp Biggs R (ed) (2004) Ecosystem services in southern
Africa a regional assessment Council for Scientific and Indus-
trial Research Pretoria South Africa
Scholes RJ amp Noble IR (2001) Storing carbon on land Science
294 1012
Schulze RE Maharaj M Lynch SD Howe BJ amp Melvil-
Thomson B (1997) South African atlas of agrohydrology and
climatology Water Research Commission Report Pretoria
South Africa
Scott JM Davis F Csuti B Noss RF Butterfield B Groves C
Anderson H Caicco S DrsquoErchia F Edwards TC Uliman J
amp Wright G (1993) Gap analysis a geographic approach to
protection of biological diversity Wildlife Monographs 123 1ndash41
Stem C Margoluis R Salafsky N amp Brown M (2005)
Monitoring and evaluation in conservation A review of trends
and approaches Conservation Biology 19 295ndash309
Sutherland WJ Pullin AS Dolman PM amp Knight TM
(2004) The need for evidence-based conservation Trends in
Ecology amp Evolution 19 305ndash308
Products for conservation decisions
copy 2007 The AuthorsDiversity and Distributions 13 608ndash619 Journal compilation copy 2007 Blackwell Publishing Ltd 619
Theobald DM Hobbs NT Bearly T Zack JA Shenk T amp
Riebsame WE (2000) Incorporating biological information
in local land-use decision making designing a system for
conservation planning Landscape Ecology 15 35ndash45
UNEP (2003) Proposed biodiversity indicators relevant to the 2010
target UNEPCBDSBSTTA9INF26 httpwwwbiodivorgdoc
meetingssbsttasbstta-09informationsbstta-09-inf-26-enpdf
Walker S Price R Rutledge D Stephens T amp Lee WG
(2006) Recent loss of indigenous cover in New Zealand New
Zealand Journal of Ecology 30 (20) 169ndash177
Werger MJA (1978) Biogeographical division of southern
Africa Biogeography and ecology of southern Africa (ed by
MJA Werger) pp 147ndash170 Junk The Hague
Wilson KA Westphal MI Possingham HP amp Elith J (2005)
Sensitivity of conservation planning to different approaches to
using predicted species distribution data Biological Conserva-
tion 122 99ndash112
van Wyk AE amp Smith GF (2001) Regions of floristic endemism
in southern Africa a review with emphasis on succulents
Umdaus Press Pretoria South Africa

B Reyers et al
copy 2007 The Authors616 Diversity and Distributions 13 608ndash619 Journal compilation copy 2007 Blackwell Publishing Ltd
The protection level product has not witnessed similar broad
uptake This however is to be expected as it is of interest to only
a small group of national and provincial conservation agencies
with the mandate to establish statutory protected areas
Currently these agencies are making use of the product to guide
protected area expansion
Although not used as widely as the ecosystem status product
the map of overall priority areas has been received with great
interest by DEAT and forms the basis for the National Biodiversity
Framework It integrates information on the status of national
biodiversity in a single product that confirms that existing
bioregional programmes [Fig 5 such as the Subtropical Thicket
Ecosystem Programme (STEP) and the Cape Action Plan for
People and the Environment (CAPE)] are focusing their efforts
on national priority areas while identifying gaps in this bio-
regional coverage [eg providing motivation for the development
of the National Grasslands Biodiversity Programme (NGBP)] Its
popularity with some implementing agencies suggests that maps
of broad priority areas can be useful but if they are to be used to
maximum effect they need to be interpreted and accompanied by
clear explanations that point to their practical implications for
implementing agencies The next iteration of the NSBA in 5 years
time will have to address this challenge of conceptualizing more
effective and clear key messages for the overall priority map
CONCLUSION
In the short time since its release South Africarsquos first NSBA has
begun to achieve the desired uptake by implementing agencies
It was described by South Africarsquos Minister of Environmental
Affairs and Tourism as lsquogroundbreakingrsquo and a lsquouseful tool in
policy- and decision-making across all spheres of governmentrsquo
The existence within the NSBA team of significant conservation
planning expertise from several subnational conservation plans
and a strong spirit of collaboration between planners and
implementers played a significant role in ensuring that we based
this assessment on the lessons we have learnt from previous con-
servation plans (see Knight et al 2006b) Perhaps one of the
most important aspects of the NSBA is that it was conducted by
local conservation scientists who understood the institutional
context for the assessment and could communicate effectively
with implementing agencies The fact that this was an assessment
done by South Africans for South Africans promoted a sense of
ownership of the products and helped promote uptake
Despite these strengths the need to repeat this assessment
every 5 years and to contribute to the growing body of evalua-
tion and best practice for conservation implies that we need to
take a critical look at the process and products in an effort to
improve them and their effectiveness in the future We have
highlighted some of the data and information shortcomings that
should be addressed before the next iteration Furthermore this
evaluation of the NSBA products has supported the call being
made by many conservation scientists to go beyond implementa-
tion to the design of programme monitoring and evaluation
systems (Hockings 2003 Stem et al 2005) As Ferraro amp Pattanayak
(2006) point out the limited resources for conservation make the
assessment of the effectiveness of conservation interventions
essential if these resources are to stretch as far as possible One of
the biggest challenges in this paper was the evaluation of the
uptake and effectiveness of the NSBA we had to rely largely on
draft publications and anecdotal evidence from conversations
with implementing agency staff This may be due to the short
time period that has elapsed since the NSBA was released but it
is also a result of the lack of a monitoring programme with which
to assess and report on the effectiveness of the NSBA Several
frameworks exist for the monitoring of conservation effectiveness
(eg adaptive management frameworks Margoluis amp Salafsky
1998) and should certainly be reviewed and implemented before
the next NSBA iteration perhaps as part of the National
Biodiversity Monitoring and Reporting Framework currently
under development
REFERENCES
Acocks JPH (1953) Veld types of South Africa Memoirs of the
Botanical Society of South Africa 28 1ndash192
Andreacuten H (1994) Effects of habitat fragmentation on birds and
mammals in landscapes with different proportions of suitable
habitat a review Oikos 71 355ndash366
Balmford A Crane P Dobson A Green RE amp Mace GM
(2005) The 2010 challenge data availability information
needs and extraterrestrial insights Philosophical Transactions
of the Royal Society of London Series B Biological Sciences 360
221ndash228
Balmford A Mace GM amp Ginsberg JR (1998) The challenges
to conservation in a changing world putting processes on the
map Conservation in a changing world (ed by GM Mace A
Balmford and JR Ginsberg) pp 1ndash28 Cambridge University
Press Cambridge UK
Barnes KN ed (1998) The important bird areas of southern
Africa BirdLife Johannesburg South Africa
Berliner D amp Benn G (2004) Protected area planning for the forest
biome Prepared for DWAF WFSP Forestry Programme Depart-
ment of Water Affairs and Forestry Pretoria South Africa
Burgess N DrsquoAmico Hales J Underwood E Dinerstein E
Olson DM Itoua I Shipper J Ricketts TH amp Newman K
(2004) The terrestrial ecoregions of Africa and Madagascar
Island Press Washington DC
Cowling RM Knight AT Faith DP Ferrier S Lombard
AT Driver A Rouget M Maze K amp Desmet PG (2004)
Nature conservation requires more than a passion for species
Conservation Biology 18 1674ndash1677
Cowling RM Pressey RL Lombard AT Desmet PG amp
Ellis AG (1999) From representation to persistence require-
ments for a sustainable reserve system in the species-rich
Mediterranean-climate deserts of southern Africa Diversity
and Distributions 5 51ndash71
Cowling RM Pressey RL Rouget M amp Lombard AT
(2003) A conservation plan for a global biodiversity hotspot mdash
the Cape Floristic Region South Africa Biological Conservation
112 191ndash216
DEADP (2005a) Western Cape provincial spatial development
Products for conservation decisions
copy 2007 The AuthorsDiversity and Distributions 13 608ndash619 Journal compilation copy 2007 Blackwell Publishing Ltd 617
framework Provincial Government of the Western Cape
Department of Environmental Affairs and Development
Planning Cape Town httpwwwcapegatewaygovzaeng
pubsguidesW120505
DEADP (2005b) Western Cape state of the environment report
Provincial Government of the Western Cape Department of
Environmental Affairs and Development Planning Cape
Town httpwwwcapegatewaygovzaengpublications
reports_researchW120813
DEAT (2004) The National Environmental Management Biodiver-
sity Act No 10 of 2004 Department of Environmental Affairs and
Tourism Pretoria South Africa httpwwwenvironmentgovza
DEAT (2005) South Africarsquos National Biodiversity Strategy and
Action Plan Department of Environmental Affairs and Tourism
Pretoria South Africa
DEAT (2006) South Africarsquos National Strategy for Sustainable
Development Draft for Review Department of Environmental
Affairs and Tourism httpwwwenvironmentgovza
nssd_2005draft_intergrated_strat
Desmet P amp Cowling RM (2004) Using the speciesndasharea
relationship to set baseline targets for conservation Ecology
and Society 9 (11) httpwwwecologyandsocietyorgvol9
iss2art11
Driver A Cowling RM amp Maze K (2003) Planning for living
landscapes perspectives and lessons from South Africa Center
for Applied Biodiversity Science at Conservation Interna-
tional Washington DC and the Botanical Society of South
Africa Cape Town httpwwwbotanicalsocietyorgza
defaultphppageID=ccuccu_downloadshtm
Driver A Maze K Rouget M Lombard AT Nel J Turpie
JK Cowling RM Desmet P Goodman P Harris J Jonas
Z Reyers B Sink K amp Strauss T (2005) National Spatial
Biodiversity Assessment 2004 priorities for biodiversity con-
servation in South Africa Strelitzia 17 South African National
Biodiversity Institute Pretoria South Africa http
wwwsanbiorgbiodiversitynsbahtm
Edwards D (1974) Survey to determine the adequacy of existing
conserved areas in relation to vegetation types A preliminary
report Koedoe 17 3ndash38
Eken G Bennun L Brooks TM Darwall W Fishpool
LDC Foster M Knox D Langhammer P Matiku P
Radford E Salaman P Sechrest W Smith ML Spector S
amp Tordoff A (2004) Key biodiversity areas as site conservation
targets Bioscience 54 1110ndash1118
Fahrig L (2001) How much habitat is enough Biological
Conservation 100 65ndash74
Fairbanks DHK Thompson MW Vink DE Newby
TS van den Berg HM amp Everard DA (2000) The
South African land-cover characteristics database a synopsis of
the landscape South African Journal of Science 96 69ndash82
Ferraro PJ amp Pattanayak SK (2006) Money for nothing A
call for empirical evaluation of biodiversity conservation
investments PloS Biology 4 (4) e105
Ferrier S Pressey RL amp Barrett TW (2000) A new predictor
of the irreplaceability of areas for achieving a conservation
goal its application to real-world planning and a research
agenda for further refinement Biological Conservation 93
303ndash325
Flather CH amp Bevers M (2002) Patchy reaction-diffusion and
population abundance The relative importance of habitat
amount and arrangement The American Naturalist 159 40ndash
56
Franklin JF amp Forman RTT (1987) Creating landscape
patterns by forest cutting ecological consequences and principles
Landscape Ecology 1 5ndash18
Freitag S Nicholls AO amp van Jaarsveld AS (1998) Dealing
with established reserve networks and incomplete distribution
data sets in conservation planning South African Journal of
Science 94 79ndash86
Glowka L Burhenne-Guilmin S Synge H McNeely JA amp
Guumlndling L (1994) A guide to the convention on biological
diversity Environmental Policy and Law Paper no 30 IUCN
Gland and Cambridge
Hannah L Rakotosamimanana B Ganzhorn J Mittermeier
RA Olivieri S Iyer L Rajaobelina S Hough J Andriami-
alisoa F Bowles I amp Tilken G (1998) Participatory plan-
ning scientific priorities and landscape conservation in
Madagascar Environmental Conservation 25 30ndash36
Heads M (2004) What is a node Journal of Biogeography 31
1883ndash1891
Hockings M (2003) Systems for assessing the effectiveness of
management in protected areas Bioscience 53 823ndash832
Huggett AJ (2005) The concept and utility of lsquoecological
thresholdsrsquo in biodiversity conservation Biological Conserva-
tion 124 301ndash310
IUCN (1994) IUCN red list categories IUCN Gland Switzer-
land
IUCN (2001) IUCN red list categories and criteria version 31
IUCN Species Survival Commission Gland Switzerland and
Cambridge UK
Kaltenborn BK Hanse R amp Hundeinde M (1999) National
park planning and local participation from a mountain region
in southern Norway Mountain Research and Development 19
51ndash61
Knight AT Cowling RM amp Campbell BM (2006a) Planning
for implementation an operational model for implementing
conservation action Conservation Biology 20 408ndash419
Knight AT Driver A Cowling RM Maze K Desmet PG
Lombard AT Rouget M Botha MA Boshoff AF
Castley JG Goodman PS MacKinnon K Pierce SM
Sims-Castley R Stewart WI amp von Hase A (2006b) Design-
ing systematic conservation assessments that promote effective
implementation best practice from South Africa Conservation
Biology 20 739ndash750
Lombard AT Strauss T Harris J Sink K Attwood C amp
Hutchings L (2004) South African National Biodiversity
Assessment 2004 technical report Volume 4 marine component
South African National Biodiversity Institute Pretoria South
Africa httpwwwsanbiorgza
Mace GM amp Lande R (1991) Assessing extinction threats
towards a reevaluation of IUCN threatened species categories
Conservation Biology 5 148ndash157
B Reyers et al
copy 2007 The Authors618 Diversity and Distributions 13 608ndash619 Journal compilation copy 2007 Blackwell Publishing Ltd
Margoluis R amp Salafsky N (1998) Measuring success designing
managing and monitoring conservation and development
projects Island Press Washington DC
Margules CR amp RLPressey (2000) Systematic conservation
planning Nature 405 37ndash47
Midgley G Rutherford M amp Bond W (2001) The heat is on
impacts of climate change on plant diversity in south Africa
National Botanic Institute Cape Town South Africa
Mittermeier RA Hoffmann M Pilgrim JD Brooks TB
Mittermeier CG Lamoreux JL amp Fonseca G (ed) (2005)
Hotspots revisited Earthrsquos biologically richest and most endangered
ecoregions Cemex Mexico City
Mucina L Rutherford MC amp Powrie LW (ed) (2005)
Vegetation map of South Africa Lesotho and Swaziland
1 1000000 scale sheet maps South African National Biodiver-
sity Institute Pretoria South Africa ISBN 1-919976-22-1
Myers N Mittermeier RA Mittermeier CG da Fonseca
GAB amp Kent J (2000) Biodiversity hotspots for conservation
priorities Nature 4032 853ndash858
Nel JL Roux DJ Maree G Kleynhans CJ Moolman J
Reyers B Rouget M amp Cowling RM (2007) A systematic
conservation assessment of the ecosystem status and protection
levels of main rivers Diversity and Distributions 13 341ndash352
Noss R (2003) A checklist for wildlands network designs
Conservation Biology 17 (5) 1ndash7
Olivieri S Bowles I Cavalcanti RB Fonseca GAB
Mittermeier RA amp Rostrom C (1995) A participatory
approach to biodiversity conservation the regional priority
setting workshop Conservation International Washington DC
Olson DM amp Dinerstein E (2002) The Global 200 priority
ecoregions for global conservation Annals of the Missouri
Botanical Garden 89 199ndash224
Pierce SM Cowling RM Knight AT Lombard AT
Rouget M amp Wolf T (2005) Systematic conservation
assessment products for landuse planning interpretation for
implementation Biological Conservation 125 441ndash548
Pierce SM Cowling RM Sandwith T amp MacKinnon K ed
(2002) Mainstreaming biodiversity in development case studies
from South Africa World Bank Washington DC
Prendergast JR Quinn RM amp Lawton JH (1999) The gaps
between theory and practice in selecting nature reserves
Conservation Biology 13 484ndash492
Pressey RL (1999) Applications of irreplaceability analysis to
planning and management problems Parks 9 42ndash51
Pressey RL Cowling RM amp Rouget M (2003) Formulating
conservation targets for biodiversity pattern and process in the
Cape Floristic Region South Africa Biological Conservation
112 99ndash127
Pressey RL Humphries CJ Margules CR Vane-Wright RI
amp Williams PH (1993) Beyond opportunism key principles
for systematic reserve selection Trends in Ecology amp Evolution
8 124ndash128
Pullin AS amp Knight TM (2001) Effectiveness in conservation
practice Pointers from medicine and public health Conserva-
tion Biology 15 50ndash54
Reyers B Fairbanks DHK van Jaarsveld AS amp Thompson
M (2001) Priority areas for the conservation of South African
vegetation a coarse filter approach Diversity and Distribu-
tions 7 77ndash96
Reyers B amp McGeoch M (in press) A biodiversity monitoring
framework for South Africa progress and directions South
African Journal of Science
Reyers B Nel J Egoh B Rouget M amp Jonas Z (2005) A
conservation assessment of South Africarsquos grassland biome
integrating terrestrial river ecosystem services and fine scale
priorities CSIR Report Number ENV-S-C 2005-102 CSIR
Stellenbosch Cape Town
Ricketts TH Dinerstein E Olson D Loucks CJ Eichbaum
W DellaSala D Kavanagh K Hedao P Hurley PT
Carney KM Abell R amp Walters S (1999) Terrestrial ecore-
gions of North America a conservation assessment Island Press
Washington DC
Rodrigues AS Cerdeira JO amp Gaston KJ (2000) Flexibility
efficiency and accountability adapting reserve selection
algorithms to more complex conservation problems Ecography
23 (5) 565ndash574
Rouget M Cowling RM Pressey RL amp Richardson DM
(2003a) Identifying the spatial components of ecological and
evolutionary processes for regional conservation planning in the
Cape Floristic Region Diversity and Distributions 9 191ndash210
Rouget M Richardson DM amp Cowling RM (2003b) The
current configuration of protected areas in the Cape Floristic
Region mdash reservation bias and representation of biodiversity
patterns and processes Biological Conservation 112 129ndash145
Rouget M Reyers B Jonas Z Desmet P Driver A Maze K
Egoh B amp Cowling RM (2004) South African National
Spatial Biodiversity Assessment 2004 Technical report Volume
1 terrestrial component South African National Biodiversity
Institute Pretoria httpwwwsanbiorgbiodiversitynsbahtm
Salafsky N Margoluis R Redford KH amp Robinson JG
(2002) Improving the practice of conservation a conceptual
framework and research agenda for conservation science
Conservation Biology 16 1469ndash1479
Scholes RJ amp Biggs R (ed) (2004) Ecosystem services in southern
Africa a regional assessment Council for Scientific and Indus-
trial Research Pretoria South Africa
Scholes RJ amp Noble IR (2001) Storing carbon on land Science
294 1012
Schulze RE Maharaj M Lynch SD Howe BJ amp Melvil-
Thomson B (1997) South African atlas of agrohydrology and
climatology Water Research Commission Report Pretoria
South Africa
Scott JM Davis F Csuti B Noss RF Butterfield B Groves C
Anderson H Caicco S DrsquoErchia F Edwards TC Uliman J
amp Wright G (1993) Gap analysis a geographic approach to
protection of biological diversity Wildlife Monographs 123 1ndash41
Stem C Margoluis R Salafsky N amp Brown M (2005)
Monitoring and evaluation in conservation A review of trends
and approaches Conservation Biology 19 295ndash309
Sutherland WJ Pullin AS Dolman PM amp Knight TM
(2004) The need for evidence-based conservation Trends in
Ecology amp Evolution 19 305ndash308
Products for conservation decisions
copy 2007 The AuthorsDiversity and Distributions 13 608ndash619 Journal compilation copy 2007 Blackwell Publishing Ltd 619
Theobald DM Hobbs NT Bearly T Zack JA Shenk T amp
Riebsame WE (2000) Incorporating biological information
in local land-use decision making designing a system for
conservation planning Landscape Ecology 15 35ndash45
UNEP (2003) Proposed biodiversity indicators relevant to the 2010
target UNEPCBDSBSTTA9INF26 httpwwwbiodivorgdoc
meetingssbsttasbstta-09informationsbstta-09-inf-26-enpdf
Walker S Price R Rutledge D Stephens T amp Lee WG
(2006) Recent loss of indigenous cover in New Zealand New
Zealand Journal of Ecology 30 (20) 169ndash177
Werger MJA (1978) Biogeographical division of southern
Africa Biogeography and ecology of southern Africa (ed by
MJA Werger) pp 147ndash170 Junk The Hague
Wilson KA Westphal MI Possingham HP amp Elith J (2005)
Sensitivity of conservation planning to different approaches to
using predicted species distribution data Biological Conserva-
tion 122 99ndash112
van Wyk AE amp Smith GF (2001) Regions of floristic endemism
in southern Africa a review with emphasis on succulents
Umdaus Press Pretoria South Africa

Products for conservation decisions
copy 2007 The AuthorsDiversity and Distributions 13 608ndash619 Journal compilation copy 2007 Blackwell Publishing Ltd 617
framework Provincial Government of the Western Cape
Department of Environmental Affairs and Development
Planning Cape Town httpwwwcapegatewaygovzaeng
pubsguidesW120505
DEADP (2005b) Western Cape state of the environment report
Provincial Government of the Western Cape Department of
Environmental Affairs and Development Planning Cape
Town httpwwwcapegatewaygovzaengpublications
reports_researchW120813
DEAT (2004) The National Environmental Management Biodiver-
sity Act No 10 of 2004 Department of Environmental Affairs and
Tourism Pretoria South Africa httpwwwenvironmentgovza
DEAT (2005) South Africarsquos National Biodiversity Strategy and
Action Plan Department of Environmental Affairs and Tourism
Pretoria South Africa
DEAT (2006) South Africarsquos National Strategy for Sustainable
Development Draft for Review Department of Environmental
Affairs and Tourism httpwwwenvironmentgovza
nssd_2005draft_intergrated_strat
Desmet P amp Cowling RM (2004) Using the speciesndasharea
relationship to set baseline targets for conservation Ecology
and Society 9 (11) httpwwwecologyandsocietyorgvol9
iss2art11
Driver A Cowling RM amp Maze K (2003) Planning for living
landscapes perspectives and lessons from South Africa Center
for Applied Biodiversity Science at Conservation Interna-
tional Washington DC and the Botanical Society of South
Africa Cape Town httpwwwbotanicalsocietyorgza
defaultphppageID=ccuccu_downloadshtm
Driver A Maze K Rouget M Lombard AT Nel J Turpie
JK Cowling RM Desmet P Goodman P Harris J Jonas
Z Reyers B Sink K amp Strauss T (2005) National Spatial
Biodiversity Assessment 2004 priorities for biodiversity con-
servation in South Africa Strelitzia 17 South African National
Biodiversity Institute Pretoria South Africa http
wwwsanbiorgbiodiversitynsbahtm
Edwards D (1974) Survey to determine the adequacy of existing
conserved areas in relation to vegetation types A preliminary
report Koedoe 17 3ndash38
Eken G Bennun L Brooks TM Darwall W Fishpool
LDC Foster M Knox D Langhammer P Matiku P
Radford E Salaman P Sechrest W Smith ML Spector S
amp Tordoff A (2004) Key biodiversity areas as site conservation
targets Bioscience 54 1110ndash1118
Fahrig L (2001) How much habitat is enough Biological
Conservation 100 65ndash74
Fairbanks DHK Thompson MW Vink DE Newby
TS van den Berg HM amp Everard DA (2000) The
South African land-cover characteristics database a synopsis of
the landscape South African Journal of Science 96 69ndash82
Ferraro PJ amp Pattanayak SK (2006) Money for nothing A
call for empirical evaluation of biodiversity conservation
investments PloS Biology 4 (4) e105
Ferrier S Pressey RL amp Barrett TW (2000) A new predictor
of the irreplaceability of areas for achieving a conservation
goal its application to real-world planning and a research
agenda for further refinement Biological Conservation 93
303ndash325
Flather CH amp Bevers M (2002) Patchy reaction-diffusion and
population abundance The relative importance of habitat
amount and arrangement The American Naturalist 159 40ndash
56
Franklin JF amp Forman RTT (1987) Creating landscape
patterns by forest cutting ecological consequences and principles
Landscape Ecology 1 5ndash18
Freitag S Nicholls AO amp van Jaarsveld AS (1998) Dealing
with established reserve networks and incomplete distribution
data sets in conservation planning South African Journal of
Science 94 79ndash86
Glowka L Burhenne-Guilmin S Synge H McNeely JA amp
Guumlndling L (1994) A guide to the convention on biological
diversity Environmental Policy and Law Paper no 30 IUCN
Gland and Cambridge
Hannah L Rakotosamimanana B Ganzhorn J Mittermeier
RA Olivieri S Iyer L Rajaobelina S Hough J Andriami-
alisoa F Bowles I amp Tilken G (1998) Participatory plan-
ning scientific priorities and landscape conservation in
Madagascar Environmental Conservation 25 30ndash36
Heads M (2004) What is a node Journal of Biogeography 31
1883ndash1891
Hockings M (2003) Systems for assessing the effectiveness of
management in protected areas Bioscience 53 823ndash832
Huggett AJ (2005) The concept and utility of lsquoecological
thresholdsrsquo in biodiversity conservation Biological Conserva-
tion 124 301ndash310
IUCN (1994) IUCN red list categories IUCN Gland Switzer-
land
IUCN (2001) IUCN red list categories and criteria version 31
IUCN Species Survival Commission Gland Switzerland and
Cambridge UK
Kaltenborn BK Hanse R amp Hundeinde M (1999) National
park planning and local participation from a mountain region
in southern Norway Mountain Research and Development 19
51ndash61
Knight AT Cowling RM amp Campbell BM (2006a) Planning
for implementation an operational model for implementing
conservation action Conservation Biology 20 408ndash419
Knight AT Driver A Cowling RM Maze K Desmet PG
Lombard AT Rouget M Botha MA Boshoff AF
Castley JG Goodman PS MacKinnon K Pierce SM
Sims-Castley R Stewart WI amp von Hase A (2006b) Design-
ing systematic conservation assessments that promote effective
implementation best practice from South Africa Conservation
Biology 20 739ndash750
Lombard AT Strauss T Harris J Sink K Attwood C amp
Hutchings L (2004) South African National Biodiversity
Assessment 2004 technical report Volume 4 marine component
South African National Biodiversity Institute Pretoria South
Africa httpwwwsanbiorgza
Mace GM amp Lande R (1991) Assessing extinction threats
towards a reevaluation of IUCN threatened species categories
Conservation Biology 5 148ndash157
B Reyers et al
copy 2007 The Authors618 Diversity and Distributions 13 608ndash619 Journal compilation copy 2007 Blackwell Publishing Ltd
Margoluis R amp Salafsky N (1998) Measuring success designing
managing and monitoring conservation and development
projects Island Press Washington DC
Margules CR amp RLPressey (2000) Systematic conservation
planning Nature 405 37ndash47
Midgley G Rutherford M amp Bond W (2001) The heat is on
impacts of climate change on plant diversity in south Africa
National Botanic Institute Cape Town South Africa
Mittermeier RA Hoffmann M Pilgrim JD Brooks TB
Mittermeier CG Lamoreux JL amp Fonseca G (ed) (2005)
Hotspots revisited Earthrsquos biologically richest and most endangered
ecoregions Cemex Mexico City
Mucina L Rutherford MC amp Powrie LW (ed) (2005)
Vegetation map of South Africa Lesotho and Swaziland
1 1000000 scale sheet maps South African National Biodiver-
sity Institute Pretoria South Africa ISBN 1-919976-22-1
Myers N Mittermeier RA Mittermeier CG da Fonseca
GAB amp Kent J (2000) Biodiversity hotspots for conservation
priorities Nature 4032 853ndash858
Nel JL Roux DJ Maree G Kleynhans CJ Moolman J
Reyers B Rouget M amp Cowling RM (2007) A systematic
conservation assessment of the ecosystem status and protection
levels of main rivers Diversity and Distributions 13 341ndash352
Noss R (2003) A checklist for wildlands network designs
Conservation Biology 17 (5) 1ndash7
Olivieri S Bowles I Cavalcanti RB Fonseca GAB
Mittermeier RA amp Rostrom C (1995) A participatory
approach to biodiversity conservation the regional priority
setting workshop Conservation International Washington DC
Olson DM amp Dinerstein E (2002) The Global 200 priority
ecoregions for global conservation Annals of the Missouri
Botanical Garden 89 199ndash224
Pierce SM Cowling RM Knight AT Lombard AT
Rouget M amp Wolf T (2005) Systematic conservation
assessment products for landuse planning interpretation for
implementation Biological Conservation 125 441ndash548
Pierce SM Cowling RM Sandwith T amp MacKinnon K ed
(2002) Mainstreaming biodiversity in development case studies
from South Africa World Bank Washington DC
Prendergast JR Quinn RM amp Lawton JH (1999) The gaps
between theory and practice in selecting nature reserves
Conservation Biology 13 484ndash492
Pressey RL (1999) Applications of irreplaceability analysis to
planning and management problems Parks 9 42ndash51
Pressey RL Cowling RM amp Rouget M (2003) Formulating
conservation targets for biodiversity pattern and process in the
Cape Floristic Region South Africa Biological Conservation
112 99ndash127
Pressey RL Humphries CJ Margules CR Vane-Wright RI
amp Williams PH (1993) Beyond opportunism key principles
for systematic reserve selection Trends in Ecology amp Evolution
8 124ndash128
Pullin AS amp Knight TM (2001) Effectiveness in conservation
practice Pointers from medicine and public health Conserva-
tion Biology 15 50ndash54
Reyers B Fairbanks DHK van Jaarsveld AS amp Thompson
M (2001) Priority areas for the conservation of South African
vegetation a coarse filter approach Diversity and Distribu-
tions 7 77ndash96
Reyers B amp McGeoch M (in press) A biodiversity monitoring
framework for South Africa progress and directions South
African Journal of Science
Reyers B Nel J Egoh B Rouget M amp Jonas Z (2005) A
conservation assessment of South Africarsquos grassland biome
integrating terrestrial river ecosystem services and fine scale
priorities CSIR Report Number ENV-S-C 2005-102 CSIR
Stellenbosch Cape Town
Ricketts TH Dinerstein E Olson D Loucks CJ Eichbaum
W DellaSala D Kavanagh K Hedao P Hurley PT
Carney KM Abell R amp Walters S (1999) Terrestrial ecore-
gions of North America a conservation assessment Island Press
Washington DC
Rodrigues AS Cerdeira JO amp Gaston KJ (2000) Flexibility
efficiency and accountability adapting reserve selection
algorithms to more complex conservation problems Ecography
23 (5) 565ndash574
Rouget M Cowling RM Pressey RL amp Richardson DM
(2003a) Identifying the spatial components of ecological and
evolutionary processes for regional conservation planning in the
Cape Floristic Region Diversity and Distributions 9 191ndash210
Rouget M Richardson DM amp Cowling RM (2003b) The
current configuration of protected areas in the Cape Floristic
Region mdash reservation bias and representation of biodiversity
patterns and processes Biological Conservation 112 129ndash145
Rouget M Reyers B Jonas Z Desmet P Driver A Maze K
Egoh B amp Cowling RM (2004) South African National
Spatial Biodiversity Assessment 2004 Technical report Volume
1 terrestrial component South African National Biodiversity
Institute Pretoria httpwwwsanbiorgbiodiversitynsbahtm
Salafsky N Margoluis R Redford KH amp Robinson JG
(2002) Improving the practice of conservation a conceptual
framework and research agenda for conservation science
Conservation Biology 16 1469ndash1479
Scholes RJ amp Biggs R (ed) (2004) Ecosystem services in southern
Africa a regional assessment Council for Scientific and Indus-
trial Research Pretoria South Africa
Scholes RJ amp Noble IR (2001) Storing carbon on land Science
294 1012
Schulze RE Maharaj M Lynch SD Howe BJ amp Melvil-
Thomson B (1997) South African atlas of agrohydrology and
climatology Water Research Commission Report Pretoria
South Africa
Scott JM Davis F Csuti B Noss RF Butterfield B Groves C
Anderson H Caicco S DrsquoErchia F Edwards TC Uliman J
amp Wright G (1993) Gap analysis a geographic approach to
protection of biological diversity Wildlife Monographs 123 1ndash41
Stem C Margoluis R Salafsky N amp Brown M (2005)
Monitoring and evaluation in conservation A review of trends
and approaches Conservation Biology 19 295ndash309
Sutherland WJ Pullin AS Dolman PM amp Knight TM
(2004) The need for evidence-based conservation Trends in
Ecology amp Evolution 19 305ndash308
Products for conservation decisions
copy 2007 The AuthorsDiversity and Distributions 13 608ndash619 Journal compilation copy 2007 Blackwell Publishing Ltd 619
Theobald DM Hobbs NT Bearly T Zack JA Shenk T amp
Riebsame WE (2000) Incorporating biological information
in local land-use decision making designing a system for
conservation planning Landscape Ecology 15 35ndash45
UNEP (2003) Proposed biodiversity indicators relevant to the 2010
target UNEPCBDSBSTTA9INF26 httpwwwbiodivorgdoc
meetingssbsttasbstta-09informationsbstta-09-inf-26-enpdf
Walker S Price R Rutledge D Stephens T amp Lee WG
(2006) Recent loss of indigenous cover in New Zealand New
Zealand Journal of Ecology 30 (20) 169ndash177
Werger MJA (1978) Biogeographical division of southern
Africa Biogeography and ecology of southern Africa (ed by
MJA Werger) pp 147ndash170 Junk The Hague
Wilson KA Westphal MI Possingham HP amp Elith J (2005)
Sensitivity of conservation planning to different approaches to
using predicted species distribution data Biological Conserva-
tion 122 99ndash112
van Wyk AE amp Smith GF (2001) Regions of floristic endemism
in southern Africa a review with emphasis on succulents
Umdaus Press Pretoria South Africa


