Embed Size (px)
Citation preview
Abstract—Despite the availability of natural disaster related time
series data for last 110 years, there is no forecasting tool available to humanitarian relief organizations to determine forecasts for emergency logistics planning. This study develops a forecasting tool based on identifying probability distributions. The estimates of the parameters are used to calculate natural disaster forecasts. Further, the determination of aggregate forecasts leads to efficient pre-disaster planning. Based on the research findings, the relief agencies can optimize the various resources allocation in emergency logistics planning.
Keywords—Humanitarian logistics, relief agencies, probability distribution.
I. INTRODUCTION HERE has been a marked increase in the occurrence of natural disasters such as earthquakes, tsunami, floods,
bushfires, hurricanes, droughts and so on globally during the last ten years along with exposure to greater levels of loss of life, and property damage. The number of natural disasters is increasing every year. For instance, during 1980s the average number of disasters per year was 180, in 1990s increased to 300, and in 2000 to 2010 it was 384, indicating a dramatic increase. As the number of disasters increases every year, more people are affected by these disasters. Comparing 2011 with the previous decade indicates that the number of victims increased from annual average number of 232.0 million for years 2001 to 2010, to 244.7 million victims worldwide.
In 2011, economic damages from the natural disasters were the highest ever registered, with an estimated US$366.1 billion, and increased by 235% compared to the annual average damages from 2001 to 2010 (US$109.3 billion). Because of the population growth and new developments in risk prone regions, the exposure of the human kind to the natural disasters is increasing even more. A total of 101 countries were hit by these disasters last year.
Arun Kumar is with the School of Aerospace, Mechanical and
Manufacturing Eng., RMIT University, Melbourne, VIC3000, Australia (phone:+61 3 9925 4328; e-mail: [email protected]).
Yousef L.A. Latif is with the School of Aerospace, Mechanical and Manufacturing Eng., RMIT University, Melbourne, VIC3000, Australia (phone:+61 3 9925 6226; e-mail: [email protected]).
Fugen Daver is with the School of Aerospace, Mechanical and Manufacturing Eng., RMIT University, Melbourne, VIC3000, Australia (phone:+61 3 9925 6008; e-mail: [email protected]).
Over the last decade, China, the United States, the Philippines, India and Indonesia constitute the top five countries that are most frequently hit by natural disasters [14]. Asia was the most often hit by natural disasters in 2011 (44%), followed by Americas (28%), Africa (19.3%), Europe (5.4%) and Oceania (3.3%). Moreover, Asia accounted for 86.3 of victims affected, followed by Africa (9.2%). In 2011, Asia also suffered the most damages (75.4% of global disaster damages), followed by the Americas (18.4%) and Oceania (5.6%). The earthquake and tsunami in Japan was the most expensive disaster ever recorded, with estimated economic losses of US$210 billion. Floods in Thailand caused a loss of US$40 billion, followed by earthquake in New Zealand (US$15 billion), storms in the USA (US$14 billion). In terms of Gross Domestic Product (GDP), damages in Japan represented 3.0% of the country’s GDP, whereas damages from natural disasters in El Salvador and Cambodia – a low-middle income and low-income country, respectively – represented 4.7% and 4.6% of the countries’ GDPs. New Zealand and Thailand also suffered great economic losses amounting to 12.8% and 12.7% of their GDPs respectively [14],[36].
Immediately after the disaster, there is a huge surge of demand of relief materials with a short notice and the humanitarian relief organizations often face significant problems of emergency logistics management such as transporting large amounts of many different commodities including food, clothing, medicine, medical supplies, machinery, and personnel from several origins to several destinations inside the disaster area. The transportation of supplies and relief personnel must be done quickly and efficiently to maximize the survival rate of the affected population and minimize the cost of such operations. The demands in the relief chain occur in irregular amounts and at irregular intervals and occur suddenly, such that the locations are often completely unknown until the demand occurs.
Humanitarian relief organizations and NGO’s are mostly non-profit organizations with the idea of providing critical services to the public in order to minimize the pain and sufferings after a natural disaster. According to UN Office for Humanitarian Affairs, there is increasing human vulnerability in natural disasters, 244.7 million affected in 2011, and in complex emergencies 54 million in need of life-saving assistance in 2011. Furthermore, emergency management involves preparing for disaster before it happens, responding to disasters immediately, as well as supporting, and rebuilding societies after the natural or human-made disasters have
Developing Forecasting Tool for Humanitarian Relief Organizations in Emergency Logistics
Planning Arun Kumar, Yousef L. A. Latif, and Fugen Daver
T
World Academy of Science, Engineering and Technology 71 2012
1687

occurred. It is essential to have comprehensive emergency plans and evaluate and improve the plans continuously.
Where emergencies are sudden, roads unusable or ground conditions dangerous, or where much of the infrastructure has been damaged or destroyed, helicopters are used to deliver food and non-food items. Emergency logistics carries out helicopter airlifts to reach areas where fixed-wing aircraft cannot land.
Helicopters have become an indispensable aid for dealing with disasters. People who have fallen victim to a catastrophe or are endangered by disaster cannot afford to wait until a “clearer picture” of the damage has been established. Helicopters can contribute towards establishing this picture, and are promptly called out as soon as “a major occurrence” has taken place.
The global increase in the number of natural disasters highlights the need for a better planning and operation of the responding agencies. It is very difficult, if not impossible, to efficiently operate such a complex system without comprehensive mathematical models and forecasting tools. The existing academic literature is relatively light on disaster management articles that used operations research techniques to deal with the problem.
Most humanitarian relief organizations are unable to plan an efficient and effective relief work or prepare for large disaster due to difficulty in accurately guessing the location of disaster. These agencies need to plan for huge surge in demand with a short notice under most difficult scenarios such as damaged roadways and rail lines, chaotic behaviour of victims, breakdown of infrastructure, short lead time and so on. A review of the existing literature indicates that in majority of the situations, the emergency logistics planning and distribution of relief goods from source to the victims take place during post-disaster period [35]. Shortage of relief goods have been experienced by the donor organizations. In order to develop useful emergency plan and respond to the natural disasters, humanitarian relief organizations, governments and NGOs need to estimate the number of people affected, number of people killed and the economic damages from disasters. Therefore, there is a need to develop a mathematical or probabilistic forecasting tool to predict global annual demand of relief goods. To the best of our knowledge no work has yet addressed the development of a probabilistic model for the relief agencies’ use. This research develops a probabilistic tool to predict the number of natural disasters, bulk economic losses, potential number of victims affected, and the number of people killed and subsequently the demand of certain commodities. The forecasts will be beneficial to the relief organizations, governments and NGOs if they are able to foresee before-hand the demand pattern for the forthcoming years and make emergency logistics plans in advance to handle any possible surge in demand. Knowledge on their current stocks and flows for each type of relief commodities will also aid them in making informed decisions to minimize delay in the arrival of commodities from aid centres and distribution and rescue effort.
II. LITERATURE REVIEW One of the earliest studies for logistics management in relief
operations was addressed by Reference [18] for the increasing refugee population in Somalia. Subsequently, Reference [2] addressed the need of logistics management in relief operations for the 1985 Mexico City earthquake. Some specific features of the emergency logistics problem were studied in the routing literature by numerous References [6],[10]-[13],[16],[19],[20],[24],[25],[28]; however, the general logistics problem involving relief supplies distribution characteristics received far less attention. The mathematical formulations for commodities transportation in emergency can be found in References [7],[8],[15],[27]. Reference [34] extends the commodity logistics model to integrate the wounded evacuation and emergency medical centre location problems and the logistics operations are illustrated by a concrete application on earthquake scenario. Further, Reference [35] presents a meta-heuristic of ant colony optimization (ACO) for solving the logistics problem arising in disaster relief activities. The logistics planning involves dispatching commodities to distribution centres in the affected areas and evacuating the wounded people to medical centres. Furthermore, Reference [3] proposed a model to determine the number and locations of distribution centres to be used in relief operations.
Humanitarian logistics, also called relief supply chain management, have gained attention due to an increasing number of natural and man-made disasters and the recognition of the central role of logistics in responding to these [17]. The needs are expected to increase another five-fold over the next fifty years’ [31]. However, the literature in the area of humanitarian logistics is largely focused on handbooks and general procedures [5]. Reference [1] has made a literature review on disaster operations management, resulting in only 109 academic articles published in operations management related journals, indicating needs for more research on the subject. The analytical techniques used in the field of operations research and management include mainly simulation, optimization and statistics. They concluded that most of the disaster management research was related to social sciences and humanities literature. References [21],[29] discuss the need for speed and better coordination between those involved in the humanitarian logistics network. Logistics in humanitarian aid operations are highly dynamic, innovative and characterized by complexity of operational conditions and often politically volatile climate, high level of uncertainties in terms of demand and supplies, pressure of time and high staff turnover [26],[32]. Some studies such as References [4],[26],[30]-[33], emphasized that some supply chain concepts share similarities to emergency logistics and therefore can be successfully adapted in emergency response logistics. Reference [9] discussed the food security and humanitarian assistance among displaced Iraqi populations in Jordan and Syria. In a recent study, Reference [23] highlighted pre-storm emergency supplies inventory planning. More research is needed to develop new models or new variants of
World Academy of Science, Engineering and Technology 71 2012
1688

old ones, especially in preparedness, response and recovery stages of the disaster management.
This study develops a forecasting tool to assess the logistic and supply needs, and the population’s needs as a consequence of a disaster, as well as the available local capacity and complementary requirements to meet those needs. It is important to determine not only the needs of the affected population, but also the needs of the relief organizations that perform the relief tasks. A disaster scenario is usually a dynamic and changing situation, thus the tool must help not only to identify the current situation, but also to anticipate future needs.
III. MODEL DEVELOPMENT
There are many standard statistical distributions which may be used to model the number of natural disasters, economic losses, number of people affected, and number of people killed over time. It has been found that a relatively small number of statistical distributions satisfy most needs in emergency logistics planning. The particular distribution used depends upon the nature of the data, in each case.
The probability distribution of a random variable may be defined empirically or through one of many well-known probability distributions. In many cases the analyst may fail in an attempt to describe the behaviour of a random variable through a well-known distribution and thus be forced to use an empirically derived probability distribution. However, where the behaviour of the random variable can be adequately characterized by a well-known probability distribution it will be convenient and useful to do so. In this paper, we present the properties of relevant well known random variables and their probability distributions.
A. Exponential Distribution This is probably the most important distribution in engineering and lifetime work. It has the advantages of a single, easily estimated parameter (λ), mathematically very tractable, and fairly wide applicability.
The probability density function is λe for t ≥ 0 where λ is the parameter.
B. Weibull Distribution The Weibull random variable finds its most frequent application in engineering. It is a general distribution and by adjustment of the distribution parameters, it can be made to model a wide range of the distribution characteristics.
The probability density function of a two parameter Weibull distribution is for t ≥ 0, α > 0, β > 0.
where β is referred to as a shape parameter and α a scale parameter.
There are several methods by which one can obtain good point estimates of the unknown parameters, α and β of the two parameter Weibull distribution. The methods include the iterative solution of the maximum-likelihood equations,
moment estimators, and several types of linear estimation techniques. A discussion of these methods is presented in [22].
Data has been collected from the Centre for Research on the Epidemiology of Disasters (CRED)’s EM-DAT worldwide database for natural disasters. This has been sponsored by the United States Agency for International Development’s Office of Foreign Disaster Assistance (USAID/OFDA). It contains data from year 1900 to 2011. CRED has compiled the data from numerous sources including UN agencies, NGOs, insurance companies and research institutes [14]. Systematic collection and analysis of these data provides invaluable information to governments and relief agencies in charge of relief and recovery activities. EM-DAT provides an objective basis for vulnerability assessment and rational decision-making in disaster situations. In addition to providing information on the human impact of disasters, such as the number of people killed, injured or affected, EM-DAT provides disaster-related economic damage estimates and disaster-specific international aid contributions.
We have used the Minitab Statistical Software’s built-in “trend analysis plot” option, where we can add trend lines to data sets (from year 1900 to 2011 for different variables) after the charts have been generated. Figures 1 thru 4 illustrate the charts and trend lines. Subsequently, we have used Minitab’s Individual Distribution Identification tool to find the distribution of data. The tool generates probability plot and assesses the fit. A given distribution is a good fit if the plotted points roughly follow a straight line and the goodness of fit test p-value is greater than 0.05 for an alpha level of 5% or confidence interval of 95%. The tool allows us to easily compare how well our data fit 16 different probability distributions. There are three measures generated in the output: AD, p-value and ‘LRT P’; and we have considered all three while identifying the best fit distribution. Lower AD values indicate a better fit. It is generally valid to compare AD values between different distributions and go with the lowest. Additionally, a high p-value is required. A low p-value (< 0.05) indicates that the data do not follow that distribution. Moreover, for 3-parameter distributions only, a low ‘LRT P’ value indicates that adding the third parameter is a significant improvement over the 2-parameter version. A higher value of ‘LRT P’ suggests that one should stick with the 2-parameter version.
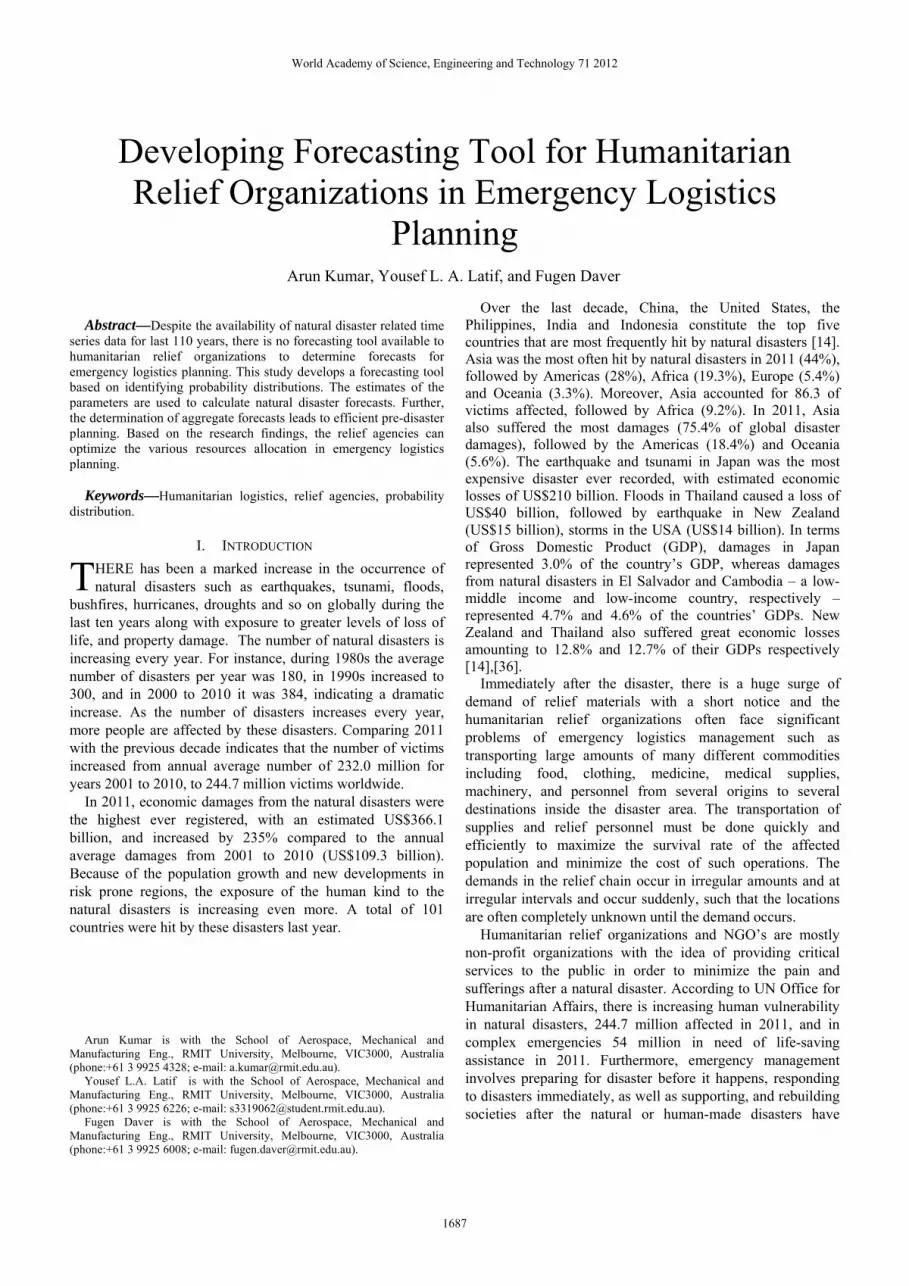
After identifying the best fit probability distribution for each data set, estimates of distribution parameters are read from the Minitab output. Subsequently, the probability distribution function is used to calculate the values of the variables of interest for future periods such as year 2012 thru 2016. Relief agencies need to know the future aggregate demand of relief goods much in advance to plan for supply and distribution. Figure 1 illustrates the number of disasters reported from year 1900 to 2011. The trend indicates that the number of disasters is exponentially increasing with respect to time as shown in (1). Identifying the best fit curve indicates that the aggregate number of natural disasters is Weibull distributed with shape and scale parameters values as 0.6548 and 126.6.
World Academy of Science, Engineering and Technology 71 2012
1689
wfo
glMafshagdianca
wfo
da1919loecSiloduinex
Fitted trend e
where Ft is theor time period
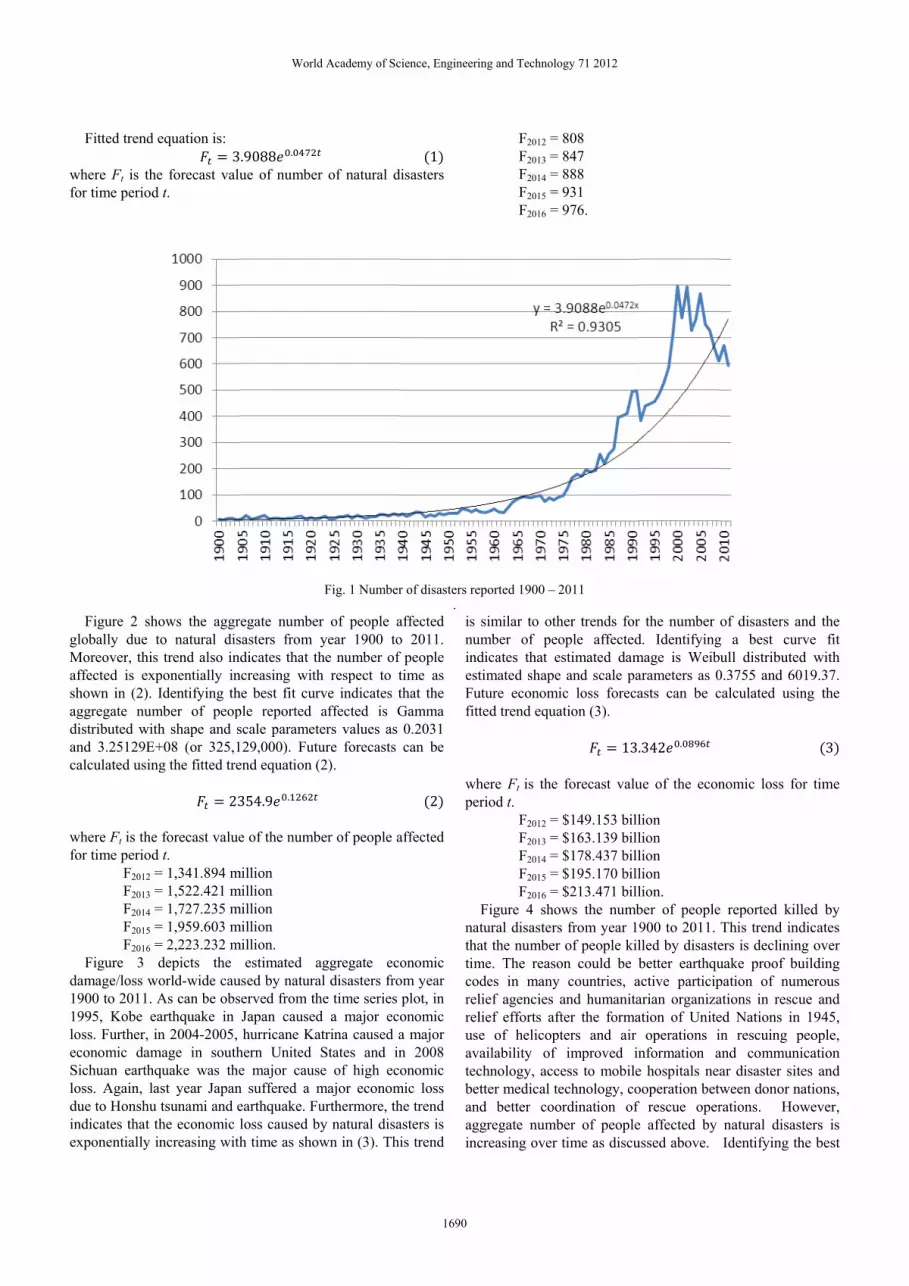
Figure 2 sholobally due t
Moreover, this ffected is exphown in (2). Iggregate numistributed withnd 3.25129E+alculated using
where Ft is the or time period
F2012 =F2013 =F2014 =F2015 =F2016 =
Figure 3 damage/loss wo900 to 2011. A995, Kobe eaoss. Further, inconomic damichuan earthq
oss. Again, laue to Honshu ndicates that thxponentially in
equation is: 3
e forecast valut.
ows the aggro natural distrend also in
ponentially inIdentifying th
mber of peoph shape and s+08 (or 325,1g the fitted tre
23
forecast valuet.
= 1,341.894 m= 1,522.421 m= 1,727.235 m= 1,959.603 m= 2,223.232 mdepicts the orld-wide cauAs can be obsarthquake in n 2004-2005,
mage in southquake was thest year Japantsunami and ehe economic ncreasing with
.9088 .
ue of number
regate numbersasters from dicates that th
ncreasing withhe best fit curple reported scale paramet129,000). Futuend equation (
354.9 .
e of the numb
million million million million million.
estimated aused by naturaserved from thJapan causedhurricane Ka
hern United e major caus
n suffered a mearthquake. Fuloss caused bh time as show
r of natural d
Fig. 1 Number
r of people ayear 1900 tohe number ofh respect to trve indicates taffected is Gers values as ure forecasts (2).
ber of people a
aggregate ecal disasters frohe time series d a major ecatrina caused aStates and ine of high ec
major economurthermore, thy natural disawn in (3). Th
1 disasters
r of disasters re.
affected o 2011. f people time as that the Gamma 0.2031 can be
2
affected
onomic om year plot, in onomic a major n 2008 onomic
mic loss he trend asters is is trend
is nuindestFufitt
whper
natthatimcorelreluseavtecbetanaginc
F2012 = F2013 = F2014 = F2015 = F2016 =
eported 1900 – 2
similar to othumber of peodicates that etimated shape
uture economited trend equa
here Ft is the riod t.
F2012 = F2013 = F2014 = F2015 = F2016 =
Figure 4 shotural disastersat the numberme. The reasodes in manylief agencies lief efforts afe of helicopailability of chnology, acctter medical ted better coogregate numbcreasing over
808 847 888 931 976.
2011
her trends forople affectedestimated dame and scale paic loss forecaation (3).
13.
forecast valu
$149.153 bill$163.139 bill$178.437 bill$195.170 bill$213.471 bill
ows the numbs from year 1r of people kilon could be b
y countries, aand humanita
fter the formaters and air improved in
cess to mobileechnology, coordination of ber of peopletime as discu
r the number d. Identifyingmage is Weibarameters as 0asts can be c
.342 .
ue of the econ
lion lion lion lion lion. ber of people900 to 2011. lled by disastebetter earthqu
active participarian organizaation of Unite
operations information ae hospitals neooperation betf rescue opere affected by ussed above.
of disasters ag a best curbull distribute0.3755 and 60calculated usi
nomic loss fo
e reported kilThis trend iners is declininuake proof bupation of numations in rescued Nations inin rescuing pand communar disaster sit
tween donor nrations. Honatural disasIdentifying th
and the rve fit d with
019.37. ing the
3
or time
lled by dicates
ng over uilding merous ue and
n 1945, people,
nication tes and nations, owever, sters is he best
World Academy of Science, Engineering and Technology 71 2012
1690

fit curve indicates that the number of people reported killed is Weibull distributed with shape and scale parameters values as 0.8711 and 1.54607E+06 (or 1,546,070). Future forecasts for the number of people reported killed by natural disasters can be calculated using the fitted trend equation (4).
2591366 0.9105 4
where Ft is the forecast value of the number of people reported killed for time period t (a five years average interval used in plotting the curve).
F2012 = 44,891 F2013 = 44,721 F2014 = 44,551 F2015 = 44,382 F2016 = 44,214
Fig. 2 Number of people reported affected by natural disasters 1900-2011
Fig. 3 Estimated damage (US$ billion) caused by reported natural disasters 1900-2011
Table I summarizes the results of goodness of fit test and the estimates of parameters of probability distribution. These findings are used in selecting the appropriate probability distribution functions to determine the future aggregate
forecasts. The relief organizations can use the aggregate forecast values of number of disasters, number of affected people, economic loss and the number of people killed in the coming years to assess the future global demand of relief
y = 2354.9e0.1262x
R² = 0.87
0
20000000
40000000
60000000
80000000
1E+09
1.2E+09
1.4E+09
1903
1910
1917
1924
1931
1937
1944
1950
1956
1962
1968
1974
1980
1986
1992
1998
2004
2010
Sum of Tot. Affected
Expon. (Sum of Tot. Affected )
y = 13.34e0.089x
R² = 0.842
0
50000
100000
150000
200000
250000
300000
350000
400000
1900
1912
1918
1926
1932
1938
1945
1951
1957
1963
1969
1975
1981
1987
1993
1999
2005
2011
Estim
ated
dam
age $ billion
Sum of Est. Damage (US$ Million)
Expon. (Sum of Est. Damage (US$ Million) )
World Academy of Science, Engineering and Technology 71 2012
1691

goods as part of the pre-disaster planning. It will assist in determining the logistical needs.
TABLE I RESULTS OF PROBABILITY DISTRIBUTION IDENTIFICATION
Random Variable Best fit Distribution Identified
Estimates of Parameters
Number of disasters
Weibull
Shape parameter = 0.6548 Scale parameter = 126.6
Number of people affected by natural disasters
Gamma Shape parameter = 0.2399 Scale parameter = 1.2447x10⁹
Estimated damage caused by disasters
Weibull Shape parameter = 0.3755 Scale parameter = 6019.3707
Number of people killed by disasters
Weibull Shape parameter = 0.8711 Scale parameter = 1.54607x10⁶
IV. CONCLUSION In disaster response actions, the survival rate among
affected people depends on the effectiveness of search and rescue operations and this requires, in turn, a good pre-disaster planning. Despite availability of annual natural disaster related data from 1900 to 2011, there is no forecasting tool available to humanitarian relief organizations to forecast the aggregate number of people affected, economic losses, number of natural disasters, and the number of people killed in the coming years. Using the past time series data, a trend analysis of the data has been conducted and the best fit curve or probability distribution has been identified. The estimates of the parameters of probability distribution are used to calculate the forecasts. These forecasts are used by the various international and national humanitarian organizations in emergency logistics planning. This leads to better coordination of search and rescue activities and efficient evacuation of injured people. Furthermore, overall health conditions of everyone in the affected area depend on the timely availability of commodities such as food shelter and medicine.
222018161412108642
9000000
8000000
7000000
6000000
5000000
4000000
3000000
2000000
1000000
0
Index
Sum
of
Kille
d 5
yea
r
MAPE 1.34761E+02MAD 1.14471E+06MSD 3.87654E+12
Accuracy Measures
ActualFits
Variable
Trend Analysis Plot for Sum of Killed 5 yearGrowth Curve Model
Yt = 2591366 * (0.9105**t)
Fig. 4 Number of people reported killed by natural disasters 1900 – 2011
World Academy of Science, Engineering and Technology 71 2012
1692

REFERENCES [1] Altay, Altay, N., and Green, W. G., 2006. OR/MS research in disaster
operations management. European Journal of Operational Research, 175, p475-493.
[2] Ardekani S. A. and Hobeika A. (1988) Logistics problems in the aftermath of the1985 Mexico City earthquake. Transportation Quarterly. 42(1), 107-124.
[3] Balcik, B. and Beamon, B. 2008. Facility location in humanitarian relief. International Journal of Logistics: Research and Applications. Vol. 11, No. 2, 101-121.
[4] Beamon, B., Humanitarian relief chains: Issues and challenges, in Proceedings of the 34th International Conference on Computers and Industrial Engineering, San Francisco, CA, 2004.
[5] Beamon, B. and Kotleba, S., Inventory Modeling for complex emergencies in humanitarian relief operations. International Journal of Logistics. Vol. 9, No. 1, March 2006, 1-18.
[6] Ben-Tal, A., Chung, B.D., Mandala, S.R., Yao,T. (2011). Robust optimization for emergency logistics planning: Risk mitigation in humanitarian relief supply chains. Transportation Research Part B.
[7] Chang, M.S., Chen, S.R. and Hsueh, C.F., (2003), “Real-time vehicle routing problem with time windows and simultaneous delivery/pickup demands,” Journal of the Eastern Asia Society for Transportation Studies, Vol. 5, pp. 2273-2286.
[8] Chen, H.K., C.F. Hsueh and M.S. Chang, 2006, “The real-time time-dependent vehicle routing problem,” Transportation Research Part E. (Accepted)
[9] Doocy, S., Sirois, A., Anderson, J. (2011). Food security and humanitarian assistance among displaced Iraqi populations in Jordan and Syria. Social Science & Medicine, 72(2), 273-282.
[10] Dror, M., Trudeau, P., 1989. Savings by split delivery routing. Transportation Science 23, 141–149.
[11] Frizzell, P.W., Giffin, J.W., 1995. The split delivery vehicle scheduling problem with time windows and grid network distances. Computers and Operational Research 22, 655–667.
[12] Gendreau, M., Laporte, G., Vigo, D., 1999. Heuristics for the traveling salesman problem with pickup and delivery. Computers and Operations Research 26, 699–714.
[13] Golden, B.L., Baker, E.K., Alfaro, J.L., Schaffer, J.R., 1985. The vehicle routing problem with backhauling: two approaches. In: Proceedings of the Twenty-First Annual Meeting of the S.E. TIMS, Myrtle Beach, SC, USA.
[14] Guha-Sapir, D., Vos, F., Below, R., Ponserre, S., 2011. Annual Disaster Statistical Review 2011, The numbers and trends, CRED, IRSS, Universite Catholique de Louvain, Brussels, Belgium.
[15] Haghani, A. and Oh, S.C., Formulation and solution of a multi-commodity, multimodal network flow model for disaster relief operations. Transportation Research: Part A, Policy and Practice, 1996, 30(3), 231–250.
[16] Hu, Z.H., (2011). A container multimodal transportation scheduling approach based on immune affinity model for emergency relief. Expert Systems with Applications, 38(3), 2632–2639.
[17] Jahre, M., 2008, Researcher project: HUMLOG-NET – Humanitarian Logistics Networks, Norway.
[18] Kemball-Cook, D., Stephenson, R. (1984), "Lessons in logistics from Somalia", Disasters, Vol. 8, 57-66.
[19] Knott R. (1987) The logistics of bulk relief supplies. Disasters 11, 113-115.
[20] Kontoravdis, G., Bard, J.F., 1995. A GRASP for the vehicle routing problem with time windows. ORSA Journal on Computing 7, 10–23.
[21] Kovács, G. and Spens, K.M. 2006. Humanitarian logistics in disaster relief operations. In Jahre, Marianne (ed.): Logistics in the New Valley. CD-ROM Proceedings of the 18th Annual Conference for Nordic Researchers in Logistics, NOFOMA 2006, Oslo, Norway.
[22] Kumar, A. 1988. Reliability estimation using doubly censored field data. PhD dissertation, Department of Industrial Engineering, Virginia Tech, Blacksburg, Virginia, USA.
[23] Lodree, Emmett J., 2011. "Pre-storm emergency supplies inventory planning", Journal of Humanitarian Logistics and Supply Chain Management, Vol. 1 Iss: 1, pp.50 – 77.
[24] Min, H., 1989. The multiple vehicle routing problem with simultaneous delivery and pickup points. International Journal of Management Science 3, 1–14.
[25] Nagy, G., Salhi, S., 2005. Heuristic algorithms for single and multi-depot vehicle routing problems with pickups and deliveries. European Journal of Operational Research 162, 126–141.
[26] Oloruntoba, R. and Gray, R., Humanitarian aid: an agile supply chain, Supply Chain Management, 2006, 11(2), 115–120.
[27] Özdamar, L., Ekinci, E. and Küçükyazaci, B., 2004, “Emergency logistics planning in natural disasters,” Annals of Operations Research, Vol. 129, pp. 217-245.
[28] Tatham, P., Kova´cs, G., 2010. The application of ‘‘swift trust’’ to humanitarian logistics. International Journal of Production Economics, 126(1),35–45.
[29] Thomas, A. (2003) Why logistics? Forced Migration Review, Vol. 18, p.4.
[30] Thomas, A.S., Humanitarian logistics: enabling disaster response, Fritz Institute, 2007.
[31] Thomas, A.S. and Kopczak. L.R., 2005.From logistics to supply chain management: The path forward in the humanitarian sector. Fritz Institute.
[32] Van Wassenhove, L.N., 2006. Humanitarian aid logistics: supply chain management in high gear. Journal of Operational Research Society, 57(5), 475–489.
[33] Ye, Y., Liu, N., (2011). A Bayesian Group-Information-Updated sequential approach for humanitarian logistics planning in natural disasters, Report, Institution of Logistics and Decision Optimization, School of Management, Zhejiang University, China.
[34] Yi, W. and Ozdamar, L., 2007. A dynamic logistics coordination model for evacuation and support in disaster response activities. European Journal of Operations Research, 179, 1177-1193.
[35] Yi, W. and Kumar, A., 2007. Ant colony optimization for disaster relief operations. Transportation Research Part E, 43, 660-672.
[36] World Bank Report, 2012.
World Academy of Science, Engineering and Technology 71 2012
1693


