Embed Size (px)
Citation preview

Journal of Economics and Sustainable Development www.iiste.org
ISSN 2222-1700 (Paper) ISSN 2222-2855 (Online) DOI: 10.7176/JESD
Vol.10, No.3, 2019
50
Determinants of Smallholder Farmers Teff Market Supply, in
Jimma Arjo District, Western Oromia Regional State, Ethiopia: A
Two Stage Least Square Approach
Temesgen Kabeta
Gambella University, Department of Agricultural economics, Gambella, Ethiopia.
POBOX: 126, Gambella University, Gambella, Ethiopia
Jema Haji
Haramaya University, School of Agricultural economics and Agribusiness, Dire Dawa, Ethiopia.
P.O.BOX: 116, Haramaya University, Dire Dawa , Ethiopia
Rijalu Negash
Jimma University, Department of Agricultural economics and Agribusiness, Jimma, Ethiopia.
P.O.BOX:307, Jimma University, Ethiopia
Abstract
This study attempted to analyze teff value chain in Jimma Arjo district of Eastern Wollega zone with the objectives
of analyzing the determinants volume of teff supplied to the market. Two stages random sampling technique was
employed. First 3 kebeles were selected from 12 teff producers randomly and second 122 teff producers were
selected randomly at 9% precision level. Primary data were collected from 122 farmers using structured and semi-
structured questionnaire for both quantitative and qualitative datas. Descriptive statistics and 2SLS model were
used to analyze the collected data. The result of 2SLS indicated that size of landholding, quantity of teff produced,
credit service, and distance from the nearest market influenced amount of teff supplied to market at 5%, 1%, 10%
and 5% significantly respectively. Recommendation drawn from the study findings include the need to improve
the land productivity by utilizing land, increasing productivity of teff per acre of land by providing essential inputs,
providing credit service for producers and constructing social infrastructure to solve the problem of distance from
the market, strengthening the linkage/interaction among teff traders, training producers how to produce for surplus
and strengthening supportive institutions.
Keywords: Teff, Market supply, Two Stage Least Square, Jimma Arjo District
DOI: 10.7176/JESD/10-3-06
1. Introduction
1.1 Background
According to the world cereal production in the year 2007 was increased by 4.8 percent from previous year
production. In the same year, Africa’s contribution to the world output was 6.35 percent (about 133.1 million tons).
Cereal crops are the most important food crop of the world. They are staple foods in the diets of most population.
In the year 2007, 2029 million metric tons of cereals were produced globally from 658.5 million hectares of land
with an average productivity of 30.83 quintals per hectares (FAO, 2007). The majority of Ethiopia’s population
earns its livelihood primarily from agriculture. The agricultural sector, which is stunned by subsistence smallholder
farmers, is the primary source of livelihood for the majority of the population and the basis of the national economy.
Agriculture accounts for 42.9 percent of GDP (MoFED, 2014), it contributes to nearly 80 percent of export
earnings, provides employment to 73 percent of the population (EATA, 2014).
The scientific name of teff is Eragrostistef (Zucc.) and is believed to have originated in Ethiopia (Vavilov,
1951). Teff is a tiny, round, khaki-colored grain closely resembling millet. “Teffa”, the Amharic word for “lost”,
is so named because of teff small size. It is the smallest grain in the world and often is lost in the harvesting and
threshing process because of its size. From teff the preferred staple diet made in the Ethiopian and Eritrean is injera
(pronounced en-ger-a, and sometimes spelled injera), a flat sour-like fermented pancake that is used with “wot”,
a stew made with spices, meats and pulses, such as lentils, beans and split peas (Piccinin, 2002).
Teff is grown mainly in Amhara and Oromia, which together accounted for 84 and 86 percent of the total
cultivated area and production in 2011. East and West Gojjam of Amhara and East and West Shoa and Eastern
Wollega of Oromiya are particularly known teff producing areas in the country. Among cereals, teff accounts for
the largest share of the cultivated area (28.5 percent in 2011), followed by maize (with 20.3 percent). Even though
teff production is expanded by 72 percent between 2004/05 and 2010/11 (CSA, 2012), it is second (to maize) in
terms of quantity of production. Similarly, with only 1.3 tons per hectare, teff yield is the lowest among cereal
crops.
In Ethiopia land used for teff production during 2017 production year were estimated 3.02 million hectars and

Journal of Economics and Sustainable Development www.iiste.org
ISSN 2222-1700 (Paper) ISSN 2222-2855 (Online) DOI: 10.7176/JESD
Vol.10, No.3, 2019
51
50.2 million quintals was produced with productivity of 16.64 quintal per hectar of land. In Oromia regional state
441,029.78 hectars of land was allocated for teff production and 24.74 million quintals of teff was produced with
productivity of 17.17 quintals per hectars of land. And also in Eastern Wollega Zone 77,455.03 hectars of land
used for teff production and 1.4 million quintals of teff will produced with productivity of 18.02 quintals per hectar
of land. In Jimma Arjo district there are 11,995 farms household and among those 7,512 households (6,783 and
729 male and female household headed) are teff producer. Land allocated for teff production during the year (2017)
is 4630 hectar (16.54 percent of total land holdings) from 27,991 total hectar of land. In the district 56,717 quintals
of teff was produced during current production year and productivity of teff were 12.25 quintals per hectar of land
which was below national standard (BoDARD, 2017).
According to Wolday (1994), Agricultural marketing is a very important factor in economic development and
lack of a well-functioning agricultural market and marketing system severely hinders the increase of social welfare,
income distribution, and food security of developing countries. Moreover, markets and marketing system and value
chains do not develop simultaneously with economic growth. Development policy of Ethiopia has placed emphasis
on increasing agricultural production to serve as a base for rural development. Even though there has been an
increase in agricultural production, there were drawbacks with regards to many households limited participation
in the markets. According to Best et al. (2005), the limited market participation of many agricultural households
face is considered to be a major constraint to eradicate poverty. This shows that an efficient, integrated and
responsive market that is marked with good performance is of crucial importance for optimal allocation of scarced
resources and stimulating households to increase produce (FAO, 2003).
Bezabih (2010) indicated that, agriculture continues to face a number of constraints and obstacles in Ethiopia.
The major ones are adverse climatic conditions; lack of appropriate land use system resulting in soil and other
natural resources degradation; limited use of improved agricultural technologies; the predominance of subsistence
agriculture and lack and/or absence of business oriented agricultural production system; limited or no access to
market facilities resulting in low participation of the smallholder farmers in value chain. In comparison to this, the
study by Jifara and Amsalu (2017) indicates that, Agricultural marketing is a very important factor in economic
development and lack of a well market and marketing system severely hinders developing countries. In Ethiopia
there is a great market fluctuation from time to time, however, production increased from year 2009 to 2016. Price
and standard of teff in the study areas is entirely determined by teff traders. Teff farmers’ production and marketing
constraints were shortage of fertilizer and seed supply, price setting and access to credit whereas that of teff traders
were double taxation, absence of infrastructure, capital shortage, inadequate of credit service, farmer reluctance
to sell, lack of demand, absence of storage facility and absence of government support(Efa ,2016).
The study area is known by production of cereal crops such as Wheat, Maize, teff, and Sorghum mainly for
market and family consumption. However market aspects of those crops were not undertaken in this district and
undertaken in an other areas by different authors such as Efa et al. (2016) the case of Dawo and Bacho District of
Oromia Region, Mohammad (2011) the case of Halaba District of SNNP region, Tadele et al., (2016) and Birara
(2017). To examine factors affecting market supply previous researchers was used OLS, but the way they tested
is not correct that means concept endogeneity was not checked and re runned by 2SLS. This study is designed to
address the prevailing information gap on the way variables of study are defined, measured, and hypothesized,
model employed for data analysis and contribute to proper understanding of the determinants of teff supply, market
outlet selection and stake holders of teff value chain for the benefit of smallholder farmers, traders, supporters in
study area and contributions of the researchers knowledge. The objective of the study is to examine determinants
of volume of teff supplied to the market in Jimma Arjo District of Eastern Wollega zone, Oromia regional state of
Ethiopia.
2. Methods
2.1 Description of the Study Area
The major part of the study area can be described as rolling and undulating topography with dendrite drainage
pattern. The elevation of the study area ranges from 1500-2600m a.s.l. The common physiographic features are
mountains ridges plateaus and basins. The total study area is highly vegetated and type of vegetation cover depends
on the physiographic and climatic condition. It is mainly covered by large trees, grass and bushes. Jimma Arjo is
found in East Wollega zone of Oromia region and is 379 Km to West of Finfinne/Addis Ababa. It is bordered on
the southwest by the Didessa river which separate it from the Bunno Beddele zone, on the North West by Diga
lake, on the north east by Guto Wayu, and on the south east by Nunu Kumba district.
According to the agro-climatic classification of Ethiopia, the relief/land form of the study area can be grouped
into three major physiographic units based on their elevation. The lowlands with <1500m a.s.l which is suitable
for maize, sorghum, sesame, nouge and Daguja production, mid altitude with 1500-2300m a.s.l which is suitable
for all types of crop production, and highlands with >2300m a.s.l which is strongly suitable for teff, wheat, bean,
pea, with 30%,58% and 12% coverage respectively. According to the annual rainfall mapping the study area gets
annual rainfall up to 2800mm. Types of crops produced in the study area are teff, wheat, maize, sorghum, nouge,

Journal of Economics and Sustainable Development www.iiste.org
ISSN 2222-1700 (Paper) ISSN 2222-2855 (Online) DOI: 10.7176/JESD
Vol.10, No.3, 2019
52
sesame, pea, bean, lettuce, sugarcane, potato, tomato, faba bean, barley, onion, Garlic, and others horticultural
products. Not only crops and also livestock’s are produced includes sheep, horse around highland and mule,
donkey, goat and cows are produced around lowland areas of the district. Teff is produced once a year because of
agricultural activities of the district is rainfall based, that means no irrigation activities employed for teff production.
In the district teff is only produced on high land and midlands areas.
Figure 1: GIS Map of study area
2.2 Data Sources and Methods of Data Collection
2.2.1 Data types and sources
The data for this study were both qualitative and quantitative collected from primary and secondary sources. A
qualitative method was used to collect the qualitative data such as data collected through focus group discussion
and key informant interview. A quantitative method was used to collect information that has been transformed into
numbers such as demographic, institutional, and socioeconomic factors. Primary datas were collected directly from
farmers and traders while secondary datas are data which were taken from written documents of district agriculture
and rural development offices, district trade and industry, internets and published articles.
2.2.2 Methods of data collection
Primary data: The data were collected formally by the method of individual interview using semi-structured
interview schedule, questionnaire, focus group discussion and key informants using checklists and observations
from concerned agents and model farmers.
Secondary Data: were gathered from published materials, district agriculture and rural development offices,
farmers’ organizations, input suppliers, marketing agencies i.e. districts industry and trade office and from different
development organizations of the study area.
2.3 Sampling Procedure and Sample Size
Farmers sampling
Two stages random sampling technique was used to select sampled kebeles and respondents because of all sampled
kebeles and respondents are homogeneous. There are 20 rural and 2 urban kebele administrations in the district.
From 20 rural kebele administrations only 12 rural kebeles are teff producers. At first stage from those teff
producing kebeles 3 kebeles were selected by using simple random sampling technique and at second stage
appropriate numbers of sample farmers from teff producing kebeles was selected randomly in Proportional to
Population Size (PPS) using Yemane (1967) formula.
= 1 + () (1)
Where, n = sample size, N= Number of household heads that are teff producers in the district (7512) and e = level
of precision assumed 9%. Sultan (2016) and Addisu (2016) were also used this level of precision. Accordingly,
the required sample size at 91% confidence level with level of precision equal to 9% was used to obtain a sample
size required which represent a true population.
= 75121 + 7512(0.09) = 122

Journal of Economics and Sustainable Development www.iiste.org
ISSN 2222-1700 (Paper) ISSN 2222-2855 (Online) DOI: 10.7176/JESD
Vol.10, No.3, 2019
53
Table 15: Sample distribution of producer kebeles (PPS)
Selected Kebeles Total Households(N) Proportion Sample(n)
Hindhe 880 0.44 53
Tibe Caffe 506 0.25 31
Hara 626 0.31 38
Total 2012 1.00 122
Source: Survey result computation
2.4 Methods of Data Analysis
Descriptive statistics and econometric analysis was employed to analyze the data collected from all actors involved
in teff value chain and marketing of the study area.
2.4.1 Descriptive statistics
Employed to analyze and describe mean, maximum, minimum, standard deviation, frequencies and percentages
in the process of examining and describing demographic outputs were calculated.
2.4.2 Econometric models
Econometric models was employed to analyze the impact of one unit changes in explanatory variable on dependent
variables i.e. factors affecting volume of teff supplied to the market,
Determinants of teff market supply
Multiple linear regressions employed to analyze the determinants of teff market supply since all teff producer
farmers are teff market participants. However, when some of the assumptions of the Classical Linear Regression
(CLR) model are violated, the parameter estimates of the above model may not be Best Linear Unbiased Estimator
(BLUE). Thus, it is important to check the presence of hetrocedasticity, multicollinearity and endogeneity problem
before fitting important variables into the regression models for analysis.
The problem of endogeneity occurs when an explanatory variable is correlated with the error term in the
population data generating process which causes, the ordinary least squares estimators of the relevant model
parameters to be biased and inconsistent. The source of endogeneity could be omitted variables, measurement
error and simultaneity (Maddala, 2001). Both Hausman test and Durbin-Wu-Hausman (DWH) test were applied
to check the presence of endogeneity. In this study, there was a potentially endogenous variable, which was
quantity of teff produced, included in the explanatory variables that could cause endogeneity bias if OLS is applied.
Therefore, in identifying the determinants of teff supplied, a two-stage least square (2SLS) model was used. Two-
stage least square is similar to OLS except that uses two completely separate stages during the analysis phase in
order to avoid problems of endogeneity (Wooldridge, 2010).Econometric model specification of supply function
in matrix notation is as follows:
= + + + (2)
Where Y is vector of quantity of teff supplied to market, X’ is exogenous variable that is assumed to affect market
supply of teff, Y1 is vector of endogenous variables which is quantity produced of teff, while β0, β1 and δ are a
vector of parameters to be estimated and U a vector of disturbance term. As the name suggests 2SLS involves
using OLS regression in two stages, in the first stage a reduced form of the structural equations is estimated where
the endogenous variable productivity of teff regressed on all the exogenous variables. Reduced form is here below:
1 = Ω0 + Ω1 + Ω2 + (3) Where Y1i is endogenous variable (quantity of teff produced), Xi vector of explanatory variables, Zi is a vector of
excluded instrumental variables Ω is coefficients to be estimated and v is error terms and systematically surrounded
around zero. Multicollinearity problem arises due to a linear relationship among explanatory variables; and
becomes difficult to identify the separate effect of independent variables on the dependent variable because there
exists strong relationship among them (Gujarati, 2003). Two ways to check multicollinearity, Variance Inflation
Factors (VIF) is used to check for continuous variables and Contingent Coefficient for discrete variables. When
value of VIF is greater than 10 (R2>0.90), there is strong multicollinearity between continuous explanatory
variables and specified as:
!"#$%& = 11 − (% (4)
Contingency coefficient (CC) was used to investigate multicollinearity problem among discrete variables and
specified as;
** = + ,-./,- (5)
CC= Contingent Coefficient and when its value exceeds 75 percent variables are collinear. In order to check the
existence of hetrocedasticity problem in the data set, the parameter estimates of the coefficients of the independent
variables cannot be BLUE. We check problem of hetrocedasticity by using STATA13 software using Breusch
Pagan test.
Journal of Economics and Sustainable Development www.iiste.org
ISSN 2222-1700 (Paper) ISSN 2222-2855 (Online) DOI: 10.7176/JESD
Vol.10, No.3, 2019
54
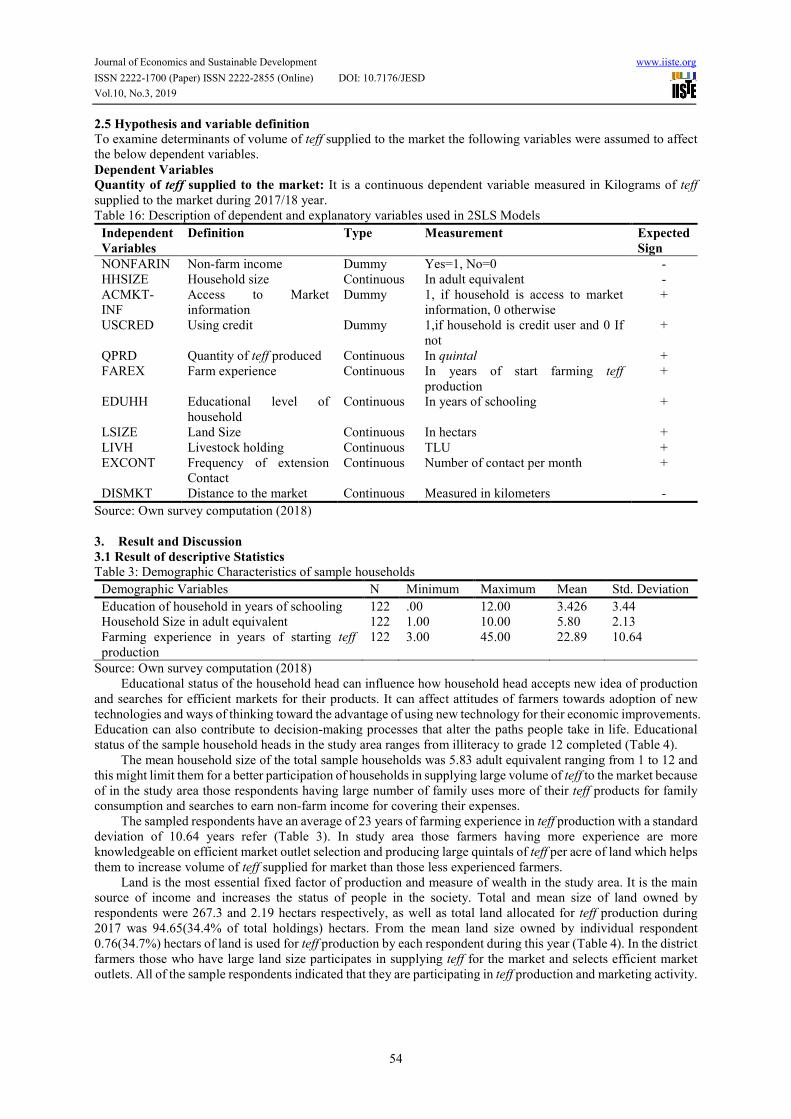
2.5 Hypothesis and variable definition
To examine determinants of volume of teff supplied to the market the following variables were assumed to affect
the below dependent variables.
Dependent Variables
Quantity of teff supplied to the market: It is a continuous dependent variable measured in Kilograms of teff
supplied to the market during 2017/18 year.
Table 16: Description of dependent and explanatory variables used in 2SLS Models
Independent
Variables
Definition Type Measurement Expected
Sign
NONFARIN Non-farm income Dummy Yes=1, No=0 -
HHSIZE Household size Continuous In adult equivalent -
ACMKT-
INF
Access to Market
information
Dummy 1, if household is access to market
information, 0 otherwise
+
USCRED Using credit Dummy 1,if household is credit user and 0 If
not
+
QPRD Quantity of teff produced Continuous In quintal +
FAREX Farm experience Continuous In years of start farming teff
production
+
EDUHH Educational level of
household
Continuous In years of schooling +
LSIZE Land Size Continuous In hectars +
LIVH Livestock holding Continuous TLU +
EXCONT Frequency of extension
Contact
Continuous Number of contact per month +
DISMKT Distance to the market Continuous Measured in kilometers -
Source: Own survey computation (2018)
3. Result and Discussion
3.1 Result of descriptive Statistics
Table 3: Demographic Characteristics of sample households
Demographic Variables N Minimum Maximum Mean Std. Deviation
Education of household in years of schooling 122 .00 12.00 3.426 3.44
Household Size in adult equivalent 122 1.00 10.00 5.80 2.13
Farming experience in years of starting teff
production
122 3.00 45.00 22.89 10.64
Source: Own survey computation (2018)
Educational status of the household head can influence how household head accepts new idea of production
and searches for efficient markets for their products. It can affect attitudes of farmers towards adoption of new
technologies and ways of thinking toward the advantage of using new technology for their economic improvements.
Education can also contribute to decision-making processes that alter the paths people take in life. Educational
status of the sample household heads in the study area ranges from illiteracy to grade 12 completed (Table 4).
The mean household size of the total sample households was 5.83 adult equivalent ranging from 1 to 12 and
this might limit them for a better participation of households in supplying large volume of teff to the market because
of in the study area those respondents having large number of family uses more of their teff products for family
consumption and searches to earn non-farm income for covering their expenses.
The sampled respondents have an average of 23 years of farming experience in teff production with a standard
deviation of 10.64 years refer (Table 3). In study area those farmers having more experience are more
knowledgeable on efficient market outlet selection and producing large quintals of teff per acre of land which helps
them to increase volume of teff supplied for market than those less experienced farmers.
Land is the most essential fixed factor of production and measure of wealth in the study area. It is the main
source of income and increases the status of people in the society. Total and mean size of land owned by
respondents were 267.3 and 2.19 hectars respectively, as well as total land allocated for teff production during
2017 was 94.65(34.4% of total holdings) hectars. From the mean land size owned by individual respondent
0.76(34.7%) hectars of land is used for teff production by each respondent during this year (Table 4). In the district
farmers those who have large land size participates in supplying teff for the market and selects efficient market
outlets. All of the sample respondents indicated that they are participating in teff production and marketing activity.

Journal of Economics and Sustainable Development www.iiste.org
ISSN 2222-1700 (Paper) ISSN 2222-2855 (Online) DOI: 10.7176/JESD
Vol.10, No.3, 2019
55
Table 4: Land holdings and area of land allocated for teff production during 2017
Land (hectars) N Sum Mean Std. Deviation
Land size in hectars 122 267.31 2.19 2.36
Area of land allocated for teff production in hectars 122 94.65 .76 .67
Yield (Q/hectar)
National Standard (Q/hectar)
122 897.86 9.49
16.64
3.71
Source: Own survey computation (2018)
Besides of teff production farmers in study area were uses part of their land for production of other major
crops such as maize, sorghum, wheat, Daguja, bean, pea ,fruits, vegetables, tuber and root crops, nouge, and spice
crops are produced simultaneously.
The availability of adequate financial sources for credit is crucial for farmers. Farmer’s uses money they gets
from credit to buy inputs such as improved seed, fertilizers, weed killers and livestock which directly contributes
in increasing of teff products per hectars and enables farmers to raise quantity of teff supplied to the market. The
most important services that are expected to promote production and marketing of teff in study area includes
provision of credit services, extension service, and market information. In study area the major source of credit
service is Oromia Credit and Saving Institution and others sources such as cooperatives, local money lenders and
microfinance are less contributors of credit provision for farmers in study area in comparison to Oromia Credit
and Saving Institutions. Among sampled household heads 41.8% of respondents are non-users and 58.2% are users
of credit service from the available sources (Table 6). However, the credit provision is based on group collateral
but farmers are not much interested in this way in order not to pay for defaulters in their group.
Marketing information are essential factors in promoting competitive markets and improving agricultural
sector development. A well-organized market intelligence information system helps all the producers and traders
freely interact with one another in arriving at prices. Existence of reliable market information help farmers sell
their surpluses of teff and choose modes of transaction, each of which yields a different benefit. It has been
postulated that farmers will choose a profitable mode of transaction if they can receive reliable market information
on the prevailing market conditions. Among sampled households 24.6% of household heads are not accesses to
market information while 75.4% has access to market information from neighbors, radios, and traders on prices,
quality, and market demands for their teff products(Table:5). Most of farmers were raised problem of lack of
market information regarding price of teff that means there is information asymmetry problem between traders and
farmers. Always traders are price informed and farmers are not informed, this means according to response of
farmer’s teff is not market driven which leads price fluctuations and provides unfair price for farmers.
Provision of adequate Extension service for agriculture provides assistance for farmers in improvement of
production and productivity; it also enables flow of information and transfer of knowledge and scientific findings
to practice. Making contact with agricultural information services makes farmers to be aware of and get better
understanding and ultimately leads to decision to take risk for improved agricultural practices. It helps in
disseminating new innovations and ideas that emerges from research findings and improves better understanding
of technologies that benefit farmer’s production and productivity. In addition, proper contact with agricultural
extension agents helps to facilitate dissemination and adoption of improved technologies and ensure the local
availability of these technologies for the majority of smallholders.
Non-farm income generating activities of farmers in the study area were sheep and oxen fattening, daily labor,
petty trade, brokers, were found to be some of the off/non-farm income generating activities in which sampled
farmers were participating. Sampled households earns about means of non-farm income of 3206.23 birr by
participating on off/non-farm income activities with standard deviation of 4517.49 (Table 5). Those farmers earns
non-farm income by participating in non-farm activities supplies less amount of their teff products i.e. they prefers
to store, expects its future price increases, and uses more of it for family consumption and prefers for efficient
markets.
Livestock is the main source of household farm income in study area, that means those household owned
large number of animals were earned income by selling livestock and their products which directly contributes for
purchasing agricultural input and family expenses and leads farmers to produce teff in large amount and supply
for the market in large quantity. Having large number of livestock in study area is seen as a dignity or store of
value and easy for those households to prepare their own organic fertilizer from dung’s of livestock which
contributes to increase teff productivity and increases the amount of teff supplied to the market. From sampled
households the maximum and mean of TLU owned is 21.64 and 4.91 respectively and shown in (Table 5).
The study result indicated that sample producers in the study area travels average Kilo meters with ranging
from 1 to 16.5 to the market center (district market) with mean distance from district market of 8.56 Kilometers
shown in (Table 6). Distance from producer’s house to district market was also the factor which determines
producer’s teff supply to the market and outlet choice. The study result showed that the more the farmer is nearest
to the district market the more farmer is able to select better channel outlet, they gets price and quality information
and earns better price. District market is taken as market center because of almost all of sampled farmers sold their

Journal of Economics and Sustainable Development www.iiste.org
ISSN 2222-1700 (Paper) ISSN 2222-2855 (Online) DOI: 10.7176/JESD
Vol.10, No.3, 2019
56
teff product at district market due to price difference with other market center existing in the district.
Quantity of teff sold determines the farmer to which market outlet he/she must sell teff products. The study
result indicates that those farmers who produce large quantity of teff sold their teff product in large quantity (the
more producer is the more supplier of teff to the market) and has a possibility of selling teff at more than one market
outlet. In the case of this survey those farmers who produces teff in large amount prefers to sell for wholesalers
than consumers, retailers and for local collectors and has the possibility to sell for all market outlets (four outlets)
within the district. The quantity of teff sold by sampled households to different actors (LC, WS,RT,and CS) are
34,545 kilograms and quantity of sold for local collectors, wholesalers, retailers and consumers were 3,735, 19,465,
1,770 and 9,900 kilograms respectively and shown in (Table 5).
The survey result shows that quantity of teff produced affects quantity of teff supplied to the market. From
sampled households those who produces many quintals of teff searches for better market outlet and gathers
information on price charged for their products and quality expected by traders from them. In the study area
quantity of teff produced during 2017 by sample household were 578.65 with average of 4.74 quintals. And also
the study shows that the productivity of teff per hectar of land in the study area was 9.49 quintals which is below
national, regional, zone standard because of farmers are still using local seed which distributed before many years
repetitively and need huge modification to equalize with the set standard. So from total quantity produced
345.45(59.9%) quintals of teff was sold to the market (Table 3).
Table 5: Institutional and socio-economic factors
Variables N Mean Std. Deviation
Quantity of teff produced in quintal 122 4.74 4.17
Total livestock holdings in Tropical livestock unit 122 4.91 4.58
Non- farm income 122 3206.23 4519.49
Distance from the nearest market in kilo metres 122 8.56 3.31
Variables Frequency Percent
Credit using
Not credit users 51 41.8
Credit users 71 58.2
Not access to market information 30 24.6
Access to market information 92 75.4
Source: own survey Computation (2018)
3.2 Econometric Results
Determinants of Teff market Supply
Factors that affects supply of teff to the market was estimated by using OLS model since all respondents used for
this study supplied their teff to the market. Eleven explanatory variables (nine independent variables and two
instrumental variables those which are not correlated with both endogenous and exogenous variables) were
analyzed to know their effects on quantity of teff supplied to the market in study area. Those hypothesized variables
were: Access to market information, Frequency of extension contact, User of credit, land holding size, livestock
holdings in Tropical Livestock Unit (TLU), farming experience in years of teff production, quantity of teff
produced, educational level of household head in years of formal schooling, household size in adult equivalent,
distance from the nearest market centre in kilometer and quantity of teff produced in quintals.
Robust regression option was used in STATA13 software to correct hetrocedasticity problem.
Multicollinearity problem was also tested using VIF (Variance Inflation Factors) and the result showed that there
was no multicollinearity problem since VIF value 1.66 is less than 10 and no series multicollinearity (appendix).
Coefficient of multiple determinations (R2) was used to check goodness of fit for the regression model. Hence, R2
indicates that 85.66 % of the variation in the quantity of teff supplied to the market was explained by the variables
included in the model as shown in (Table 6). Test of endogeneity indicated that the quantity of teff produced was
endogenous to the model.
To overcome the problem of endogeneity we have to apply two stages least squares (2SLS) estimations
method because instrumental variables are used to cut correlations between the error term and independent
variables. The method involves two successive applications. The first stage is made by regressing the suspected
endogenous variables over the pre-determined or pure exogenous variables to get their predicted values. Then the
predicted values of the endogenous variables in the first stage are used to estimate the supply equation. Here non-
farm income and education year of household head were used as instrument to quantity of teff produced. The
instrumental variable should fulfill two requirements to be used as instrument. One of the requirements were
instruments must be uncorrelated with error term and second requires the linear projection of endogenous variable
onto all the exogenous variables. So for this study both instrumental variables were checked and not correlated
with both endogenous and exogenous variables. Secondly there were linear projection between endogenous
Journal of Economics and Sustainable Development www.iiste.org
ISSN 2222-1700 (Paper) ISSN 2222-2855 (Online) DOI: 10.7176/JESD
Vol.10, No.3, 2019
57
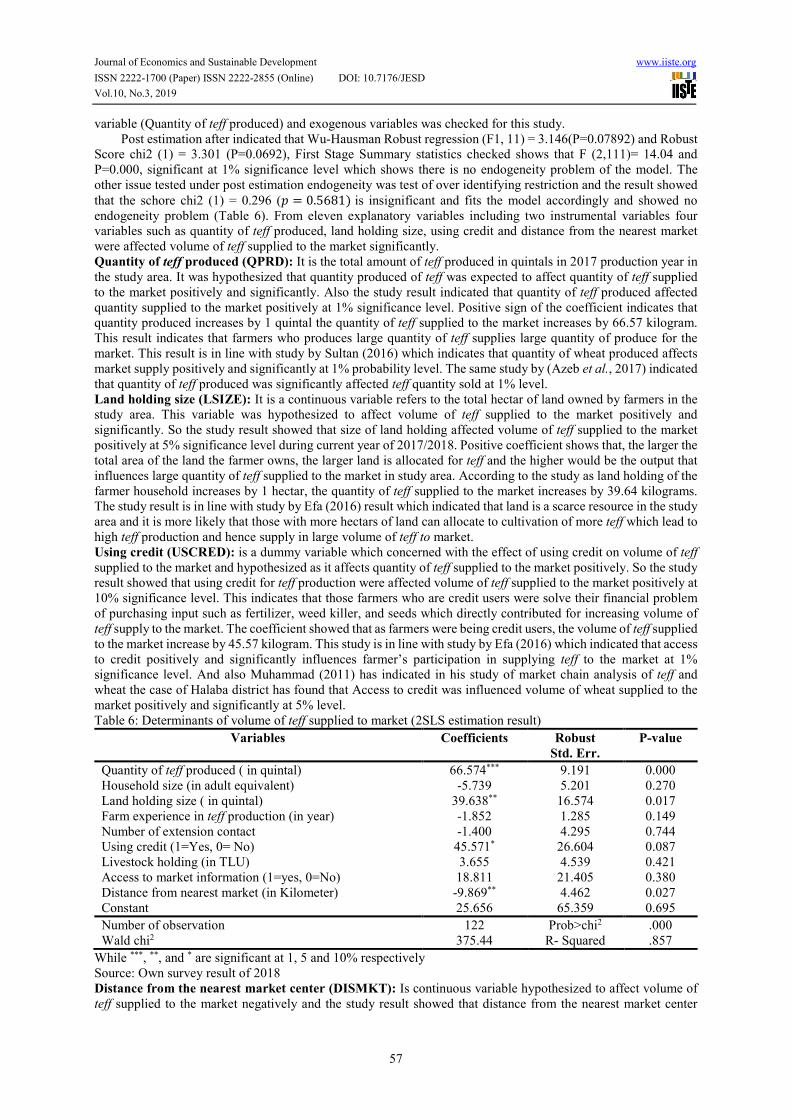
variable (Quantity of teff produced) and exogenous variables was checked for this study.
Post estimation after indicated that Wu-Hausman Robust regression (F1, 11) = 3.146(P=0.07892) and Robust
Score chi2 (1) = 3.301 (P=0.0692), First Stage Summary statistics checked shows that F (2,111)= 14.04 and
P=0.000, significant at 1% significance level which shows there is no endogeneity problem of the model. The
other issue tested under post estimation endogeneity was test of over identifying restriction and the result showed
that the schore chi2 (1) = 0.296 (0 = 0.5681) is insignificant and fits the model accordingly and showed no
endogeneity problem (Table 6). From eleven explanatory variables including two instrumental variables four
variables such as quantity of teff produced, land holding size, using credit and distance from the nearest market
were affected volume of teff supplied to the market significantly.
Quantity of teff produced (QPRD): It is the total amount of teff produced in quintals in 2017 production year in
the study area. It was hypothesized that quantity produced of teff was expected to affect quantity of teff supplied
to the market positively and significantly. Also the study result indicated that quantity of teff produced affected
quantity supplied to the market positively at 1% significance level. Positive sign of the coefficient indicates that
quantity produced increases by 1 quintal the quantity of teff supplied to the market increases by 66.57 kilogram.
This result indicates that farmers who produces large quantity of teff supplies large quantity of produce for the
market. This result is in line with study by Sultan (2016) which indicates that quantity of wheat produced affects
market supply positively and significantly at 1% probability level. The same study by (Azeb et al., 2017) indicated
that quantity of teff produced was significantly affected teff quantity sold at 1% level.
Land holding size (LSIZE): It is a continuous variable refers to the total hectar of land owned by farmers in the
study area. This variable was hypothesized to affect volume of teff supplied to the market positively and
significantly. So the study result showed that size of land holding affected volume of teff supplied to the market
positively at 5% significance level during current year of 2017/2018. Positive coefficient shows that, the larger the
total area of the land the farmer owns, the larger land is allocated for teff and the higher would be the output that
influences large quantity of teff supplied to the market in study area. According to the study as land holding of the
farmer household increases by 1 hectar, the quantity of teff supplied to the market increases by 39.64 kilograms.
The study result is in line with study by Efa (2016) result which indicated that land is a scarce resource in the study
area and it is more likely that those with more hectars of land can allocate to cultivation of more teff which lead to
high teff production and hence supply in large volume of teff to market.
Using credit (USCRED): is a dummy variable which concerned with the effect of using credit on volume of teff
supplied to the market and hypothesized as it affects quantity of teff supplied to the market positively. So the study
result showed that using credit for teff production were affected volume of teff supplied to the market positively at
10% significance level. This indicates that those farmers who are credit users were solve their financial problem
of purchasing input such as fertilizer, weed killer, and seeds which directly contributed for increasing volume of
teff supply to the market. The coefficient showed that as farmers were being credit users, the volume of teff supplied
to the market increase by 45.57 kilogram. This study is in line with study by Efa (2016) which indicated that access
to credit positively and significantly influences farmer’s participation in supplying teff to the market at 1%
significance level. And also Muhammad (2011) has indicated in his study of market chain analysis of teff and
wheat the case of Halaba district has found that Access to credit was influenced volume of wheat supplied to the
market positively and significantly at 5% level.
Table 6: Determinants of volume of teff supplied to market (2SLS estimation result)
Variables Coefficients Robust
Std. Err.
P-value
Quantity of teff produced ( in quintal) 66.574*** 9.191 0.000
Household size (in adult equivalent) -5.739 5.201 0.270
Land holding size ( in quintal) 39.638** 16.574 0.017
Farm experience in teff production (in year) -1.852 1.285 0.149
Number of extension contact -1.400 4.295 0.744
Using credit (1=Yes, 0= No) 45.571* 26.604 0.087
Livestock holding (in TLU) 3.655 4.539 0.421
Access to market information (1=yes, 0=No) 18.811 21.405 0.380
Distance from nearest market (in Kilometer) -9.869** 4.462 0.027
Constant 25.656 65.359 0.695
Number of observation 122 Prob>chi2 .000
Wald chi2 375.44 R- Squared .857
While ***, **, and * are significant at 1, 5 and 10% respectively
Source: Own survey result of 2018
Distance from the nearest market center (DISMKT): Is continuous variable hypothesized to affect volume of
teff supplied to the market negatively and the study result showed that distance from the nearest market center
Journal of Economics and Sustainable Development www.iiste.org
ISSN 2222-1700 (Paper) ISSN 2222-2855 (Online) DOI: 10.7176/JESD
Vol.10, No.3, 2019
58
affected volume of teff supplied to the market negatively at 5% significance level. Negative coefficient shows that
as the distance from the nearest market center increases by one kilometer the volume of teff supplied to the market
decreases by 9.87 Kilogram. The same study by Efa (2016) indicated that, distance from the nearest market were
negatively and significantly influences the intensity of marketed surplus at 10% significant level. When the
household is located one Kilometer away from the market, the quantity of teff sold decreases by 2%. And also
consistent with study by Zamasiya et al., (2014) which indicated that, soybean market participation by smallholder
farmers in Zimbabwe in which distance to the market negatively affected smallholder farmers’ extent of market
participation and quantity sold.
4. Conclusion
Generally diversifying land uses, using inputs, getting training, making extension contact with agents, using credit,
improved seed and weed killers were used to increase productivity of teff which contributes for surplus increment
and leads farmers to choose appropriate channel. The financial sector can fund the production of teff products
whilst the government can provide subsidized inputs to the small holder farmer. This multispectral approach will
definitely yield the required result of increasing income for the smallholder farmer. The government can also
incorporate technology in the curriculum of institutions of higher learning.
The private sector can also contract the smallholder farmer by equipping them with the inputs and credit and
thus later buy the products to distribute it for the area where this product has shortage. There is need to reduce over
reliance in the importing of key production inputs such as fertilizer and weed killers. Imported inputs have meant
that the domestic farmer inputs costs has risen and remained higher. There is need to reduce the cost of inputs by
importing it without tariff for teff production and boost local production to encourage more smallholder farmers.
The question that now arises and needs to be addressed in order for the productive farmers to become profitable is
do they have the business idea, access to finance, infrastructural support and access to transport and market? One
of the most practical solutions to this dilemma is the division of responsibilities between the private sector and
Non-government Organizations. NGOs can aware farmers through capacity building activities such as farmer
group strengthening and business training activities. One aspect of value chain implementation might be enhancing
access to mechanization or other means of enhancing the resource that smallholders have to manage their land.
The farmer needs adequate financing on the farm and marketing operations. The farmer needs a special bank to
address their particular needs of through specialized concessionary interest rates to promote the expansion of
production. In addition they are needed to upgrade production and consistent input supply to improve teff.
5. REFERENCE
Addisu Hailu. 2016. Value chain analysis of vegetables: the case of Ejere District, West Shoa Zone, Oromia
National Regional State of Ethiopia (MSc. Thesis, Haramaya University).
Amha Wolday. 1994. Food grain marketing development in Ethiopia after the market reform 1990: a case study
of Alaba Siraro District. Berlin (Germany), Verlag Koster, 1994.
Ashenafi Ali, Abayneh Esayas, and Sheleme Beyene.2010."Characterizing soils of Delbo Wegene watershed,
Wolaita Zone, Southern Ethiopia for planning appropriate land management."Journal of Soil Science and
Environmental Management 1, no. 8 (2010): 184-199.
Azeb Bekele, Tadele Melaku and Latha, D.A. 2017. Determinants of smallholder farmers in teff market supply in
Ambo district, West Shoa Zone of Oromia, Ethiopia. International Journal of Advanced Research in
Management and Social Sciences, 6(2), pp.133-140.
Berhanu Gebremedhin, and Hoekstra, D. 2007, August. Cereal marketing and household market participation in
Ethiopia: the case of teff, Wheat and rice. In AAAE Conference Proceedings (Vol. 2007, pp. 243-252).
Best, R., Ferris, S. and Schiavine, A., 2005. Building linkages and enhancing trust between small-scale rural
producers, buyers in growing markets and suppliers of critical inputs. In Beyond agriculture making markets
work for the poor. Proceedings of an international seminar (Vol. 28, pp. 19-50).
Beza Erko, Degye Goshu, and Moti Jaleta. 2016. Value Chain Analysis of Maize: The Case of Bako Tibe and
Gobu Sayo Districts in Central West Ethiopia. Journal of Economics and Sustainable Development
www.iiste.org.ISSN 2222-1700 (Paper) ISSN 2222-2855 (Online).
Bezabih Emana. 2010. Market assessment and value chain analysis in Benishangul Gumuz regional state, Ethiopia.
Unpublished final report, Addis Ababa.
BoDANR (Bureau of District Agriculture and Natural Resource). 2017. Total area of land for teff production,
population size, and quantity estimated from hectar of land during the current year. Jimma Arjo, Western
Oromia, Ethiopia.
CSA (Central Statistical Agency). 2017. Agricultural Sample Survey 2016/2017. Report on Area and Production
of Major Crops. Addis Ababa, Ethiopia
CSA (Central Statistical Agency).2012. Agricultural Sample Survey 2011/2012: Report on area and production of
major crops. Addis Ababa: Central Statistical Agency.
Journal of Economics and Sustainable Development www.iiste.org
ISSN 2222-1700 (Paper) ISSN 2222-2855 (Online) DOI: 10.7176/JESD
Vol.10, No.3, 2019
59
EATA (Ethiopia Agricultural Transformation Agency). 2014. Annual Report TRANSFORMING
AGRICULTURE IN ETHIOPIA (EATA) Addis Ababa.
Efa Gobena, Degye Goshu, Tinsae Demissie and Tadese Kenea.2016. Analysis of Teff Value Chain in Bacho and
Dawo Districts of South West Shewa, Ethiopia. American Research Journal of Business and Management
(ARJBM) ISSN (Online): 2379-1047 Volume 2016.
Endalew Birara. 2017. Teff Production and Marketing in Ethiopia. A Journal of Radix
International Educational and Research Consortium, Volume 6, Issue 4 (April, 2017) ISSN: 2250 – 3994.
FAO (International Food and Agriculture Organization). 2003. FAO action program for the prevention of food
loses. Milk and dairy products, post harvest loses and food safety in sub-Saharan Africa and the near east.
Regional approaches to national challenges. Synthesis report. ILRI, Nairobi, Kenya.
Jifara Teshale and Amsalu Solomon. 2017. Assessment of Cereal Crops (teff, wheat and barley) market constraints
in Dandi, Ambo and Toke kutaye districts of Oromia region, Ethiopia.
PALGO Journal of Agriculture: ISSN 2476-8359, Volume 4 Issue 1, February 2017.Page 225-234.
Maddala, G.S. 2001. Introduction to Econometrics. Third Edition, John Will.
MoFED (Ministry of Finance and Economic Development). 2014. Growth and Transformation Plan Annual
Progress Report for F.Y. 2012/13, Addis Ababa.
Mohammed Urgessa. 2011. Market chain analysis of teff and wheat production in Halaba Special Woreda,
southern Ethiopia (MSc. Thesis, Haramaya University).
Storck H., Bezabih Emana, Berhanu Adenew, A. Borowiecki and Shemelis W/Hawariate. 1991. Farming systems
and farm management practices of smallholders in the Hararghe Highlands. Farming system in practices of
resource economics in the Tropics, Vol. 11, Wissenschaftsverlag, Vauk, Keil KG, Germany.
Sultan Usman. 2016. "Analysis of wheat value chain: The case of Sinana District, Bale Zone, Oromia Region,
Ethiopia." MSc. Thesis, Haramaya University, 2016.
Tadese Kenea, Efa Gobena, Gebresenbet Gebregzihabher and Ljungberg, D. 2016.Exploring value chain and post-
harvest losses of Teff in Bacho and Dawo districts of central Ethiopia. Journal of Stored Products and
Postharvest Research, 7(1), pp.11-28.
Vavilov, N.I. 1951. The origin, variation, immunity and breeding of cultivated plants (Vol. 72, No. 6, p. 482).LWW.
Wooldridge, J.M. 2010. Econometric Analysis of Cross Section and Panel Data, 2nd Edition. Cambridge, MA:
MIT Press.
Yamane, Taro. (1967). Statistics: An Introductory Analysis, 2nd Edition, and New York: Harper and Row.
Zamasiya, B., Mango, N., Nyikahadzoi, K. and Siziba, S. 2014. Determinants of soybean market participation by
smallholder farmers in Zimbabwe. Journal of Development and Agricultural Economics, 6(2), pp.49-58.


