Embed Size (px)
Citation preview

Electronic copy available at: http://ssrn.com/abstract=1389519Electronic copy available at: http://ssrn.com/abstract=1389519

Electronic copy available at: http://ssrn.com/abstract=1389519Electronic copy available at: http://ssrn.com/abstract=1389519
Studies & Analyses No 354
Materials published here have a working paper character. They can be subject tofurther publication. The views and opinions expressed here reflect the author point ofview and not necessarily those of CASE Network.
This work has been prepared within the framework of the ENEPO project (EU EasternNeighbourhood: Economic Potential and Future Development), financed within theSixth Framework Programme of the European CommissionThe content of this publication is the sole responsibility of the authors and can in noway be taken to reflect the views of the European Union, CASE or other institutions theauthor may be affiliated to.
Keywords: portfolio investment, CIS, the Russian crisis, emerging markets.
Jel codes: E44, F3, F32
Graphic Design: Agnieszka Natalia Bury
© CASE – Center for Social and Economic Research, Warsaw, 2007
ISBN 978-83-7178-447-7EAN 9788371784477
Publisher:CASE – Center for Social and Economic Research on behalf of CASE Network12 Sienkiewicza, 00-010 Warsaw, Polandtel.: (48 22) 622 66 27, 828 61 33, fax: (48 22) 828 60 69e-mail: [email protected]://www.case-research.eu
Electronic copy available at: http://ssrn.com/abstract=1389519Electronic copy available at: http://ssrn.com/abstract=1389519
This report is part of the CASE Network Studies and Analyses series.
The CASE Network is a group of economic and social research centers in Poland, Kyrgyzstan,Ukraine, Georgia, Moldova, and Belarus. Organizations in the network regularly conductjoint research and advisory projects. The research covers a wide spectrum of economic andsocial issues, including economic effects of the European integration process, economicrelations between the EU and CIS, monetary policy and euro-accession, innovation andcompetitiveness, and labour markets and social policy. The network aims to increase therange and quality of economic research and information available to policy-makers and civilsociety, and takes an active role in on-going debates on how to meet the economic challengesfacing the EU, post-transition countries and the global economy.
The CASE network consists of:
• CASE – Center for Social and Economic Research, Warsaw, est. 1991,
www.case-research.eu
• CASE – Center for Social and Economic Research – Kyrgyzstan, est. 1998,
www.case.elcat.kg
• Center for Social and Economic Research – CASE Ukraine, est. 1999,
www.case-ukraine.kiev.ua
• CASE – Transcaucasus Center for Social and Economic Research, est. 2000,
www.case-transcaucasus.org.ge
• Foundation for Social and Economic Research CASE Moldova, est. 2003,
www.case.com.md
• CASE Belarus – Center for Social and Economic Research Belarus, est. 2007.
3Studies & Analyses No 354

Contents
Introduction . . . . . . . . . . . . . . . . . . . . . . . . . . . . . . . . . . . . . . . . . . . . . . . . . . . . . . . . . . . 7
1. Portfolio Investment Flows in the CIS . . . . . . . . . . . . . . . . . . . . . . . . . . . . . . . . . . . . 9
1.1. Portfolio Flows: 1996 until the Russian crisis (3Q1998). . . . . . . . . . . . . . . 111.2. Portfolio Flows: 3Q1998-3Q2003 . . . . . . . . . . . . . . . . . . . . . . . . . . . . . . . . . 131.3. Portfolio Flows: 4Q2003-3Q2006 . . . . . . . . . . . . . . . . . . . . . . . . . . . . . . . . . 14
2. Literature Review . . . . . . . . . . . . . . . . . . . . . . . . . . . . . . . . . . . . . . . . . . . . . . . . . . . . 15
2.1. Capital flows in the developed countries . . . . . . . . . . . . . . . . . . . . . . . . . . . 162.2. Capital flows in the developing countries . . . . . . . . . . . . . . . . . . . . . . . . . . 182.3. Capital flows into the CIS countries . . . . . . . . . . . . . . . . . . . . . . . . . . . . . . 20
3. Methodology . . . . . . . . . . . . . . . . . . . . . . . . . . . . . . . . . . . . . . . . . . . . . . . . . . . . . . . . 21
4. Data . . . . . . . . . . . . . . . . . . . . . . . . . . . . . . . . . . . . . . . . . . . . . . . . . . . . . . . . . . . 25
5. Results . . . . . . . . . . . . . . . . . . . . . . . . . . . . . . . . . . . . . . . . . . . . . . . . . . . . . . . . . . . 26
6. Discussion . . . . . . . . . . . . . . . . . . . . . . . . . . . . . . . . . . . . . . . . . . . . . . . . . . . . . . . . . . 29
7. Conclusions . . . . . . . . . . . . . . . . . . . . . . . . . . . . . . . . . . . . . . . . . . . . . . . . . . . . . . . . . 30
References . . . . . . . . . . . . . . . . . . . . . . . . . . . . . . . . . . . . . . . . . . . . . . . . . . . . . . . . . . . 32
4
Oleksandr Lozovyi and Alina Kudina
Studies & Analyses No 354

Abstract
This paper employs a standard Tobin-Markowitz framework to analyse thedeterminants of capital flows into the CIS countries. Using data from 1996-2006, wefind that the Russian financial crisis of 1998 has had a profound impact on capitalflows into the CIS (both directly and indirectly). Firstly, it introduced a structural shiftin the investors' behaviour by shifting the focus from the external factors to the internalones, e.g. domestic interest and GDP growth rates. Secondly, it also drasticallychanged the impact of a number of explanatory variables on capital flows into the CIS.Political risk was found to be the second most important determinant of capital flowsinto the CIS. Additionally, we report some strong evidence of co-movement betweenportfolio flows into the CIS and CEEC, coupled with strong complementarity betweenglobal stock market activity and portfolio inflows into the CIS. Interestingly, externalfactors tend to be of a higher significance than internal factors for the largest members(Russia, Ukraine and Kazakhstan) of the CIS; whereas domestic variables tend to havea greater impact on the capital flows into the smaller CIS countries.
5
DETERMINANTS OF PORTFOLIO FLOWS INTO CIS COUNTRIES
Studies & Analyses No 354

Alexander Lozovyi is an economist at CASE Ukraine. He specializes in issues relatedto monetary policy, inflation, financial markets and foreign exchange markets.Alexander holds a Master's degree in Economics from the Economic Education andResearch Consortium (EERC). His research interests are primarily related tomonetary policy, international capital movements, and transition economics.
Alina Kudina is a lecturer of International Business at Warwick Business School(University of Warwick), and an Associate of CASE and the U.K.'s Advanced Instituteof Management Research. After finishing her PhD at Sa?d Business School, Universityof Oxford, she was a lecturer at University College London before coming to Warwick.Alina has also held fixed term appointments with the International Monetary Fundand the World Bank. Alina's research focuses on the issues related to public policy,foreign direct investment, portfolio investment and internationalisation strategies ofmultinational corporations.
6
Oleksandr Lozovyi and Alina Kudina
Studies & Analyses No 354

Introduction
Private capital flows to developing countries have massively increased in recentyears. From 2002-2005 alone, total private capital flows to the emerging markets anddeveloping economies increased roughly 2.7 times as compared with 1998-20011.Some of this capital has been heading to the CIS, a region whose prospects haveimproved considerably since the 1998 Russian financial crisis. Although the amountof capital flows into the CIS had been largely insignificant before the crisis and shortlythereafter, the share of the CIS countries in global private capital flows has averageda more impressive 13% from 2002-2005. Attracted by strong economic growth in themajority of the CIS countries in the new millennium, international investors havebegun investing in the CIS to exploit potentially lucrative investment opportunities.Yet this investment has been primarily direct investment, due to the undeveloped CISfinancial markets coupled with a poor governance environment, Li (2005).
The focus of this paper, nevertheless, is on portfolio flows to the CIS, which are lessresearched (as compared to direct flows), yet are not a less important component ofcapital flows. Although short-term capital flows might have a destabilising impact onthe economy (as in the case of the Asian crisis), the benefits of the influx of foreigncapital are also numerous. Fortunately, the portfolio flows into the CIS have picked upconsiderably since 2005, launching a healthier trend in the region. Nevertheless, theCIS economies are still highly vulnerable to sudden changes in investors’ sentiments.An abrupt withdrawal of capital from the region may bring severe consequences to theemerging CIS markets given the small relative size of all CIS economies (excludingRussia) coupled with low market capitalization. Hypothetically, the consequences ofcapital withdrawal could be even more severe than those that occurred late in 1998, asfinancial sectors now account for larger portions of the respective economies.Therefore, it is of vital importance to understand what guides portfolio investors, aswell as the corresponding risks, if any, faced by the host economies.
Consequently, the main goal of this research is to identify factors which driveportfolio flows in the CIS countries, as well as to assess their relative importance. Instudies on developing countries, the authors typically include a wide range of possibleexplanatory variables which are assumed to be important for portfolio flows(Garibaldi et al, 2001). However, this research uses a more concise set of factors.According to the standard Tobin-Markowitz framework, the determinants of portfolioinflows may be divided into four broad categories (Calderon, Loayza and Serven,2003): (i) investment return in home country relative to abroad, (ii) perceived risk of
7Studies & Analyses No 354
DETERMINANTS OF PORTFOLIO FLOWS INTO CIS COUNTRIES
1 World Economic Outlook: a survey by the staff of the International Monetary Fund, September 2006, IMF.

investments, (iii) degree of co-movement between international returns (whichsometimes may take the form of a contagion effect), and (iv) diversification motive.While being short, this set of factors will enable us to produce a comprehensiveanalysis of determinants of portfolio flows in the CIS.
Equivalently, these determinants may be grouped into global and country-specificfactors. The relative importance of these determinants is an important indicator for policydecision making. Specifically, the sensitivity of portfolio flows to external factors willindicate the vulnerability of the CIS economies to global capital market developments. Ifthis reliance is high, shocks in the world financial markets will require an appropriateadjustment plan to be developed in order to keep the target economic indicators withintheir ranges. At the same time, higher independence of a country from global financialswings will point towards strong domestic fundamentals and sound economic policy.
Special attention in this paper is paid to contagion effects, as their significance wasevident in the aftermath of the Russian crisis of 1998. Given that the CIS region is stillclosely integrated (as can be seen from individual countries’ growth patterns), weneed to be able to better understand the potential impact of regional contagion onportfolio investment. Hence, the paper tests for the possibility of contagion effects byconsidering trade-related contagion channels and channels based on macroeconomicsimilarities between the countries.
Apart from the above-mentioned objectives, this paper enlarges the existing bodyof research on the determinants of portfolio investment in developing countries (asmost of the attention of empirical literature on capital flows is largely devoted todeveloped countries). In the developed countries setting, scholars have been focusingon either optimal portfolio theory, in which the return and risk were the main factorsdetermining allocation of portfolio flows (Grubel, 1968), or the stock-equilibriumapproach (Miller and Whitman, 1970; Kreicher, 1981), which assumes that thereexists an optimal allocation of portfolio flows among countries and that actual flowsreflect adjustment to the equilibrium.
In the context of developing countries, however, much of the attention is devoted tothe analysis of capital flows during the currency crises. Calvo (1993) launched anexploration of determinants responsible for capital flows into developing countries,while Chuhan, Claessens and Mamingi (1993) split the determinants of short-termcapital flows in the developing countries into domestic and external, or global.However, there is still no empirical agreement with respect to the relative significanceof domestic and global factors for capital flows into developing countries.Unsurprisingly, different factors come into play in various country/time contexts. Forexample, in the CIS countries, portfolio flows have been identified as moving inaccordance with a limited number of factors, e.g. LIBOR and foreign currency reserves(Claessens, Oks, Polastri, 1998; Garibaldi, Mora, Sahay and Zettlemeyer, 2001).
8
Oleksandr Lozovyi and Alina Kudina
Studies & Analyses No 354

As a result, this paper not only contributes to our understanding of portfolioinvestment in the CIS countries, but it is also set to offer some insights in a broader,developing countries context in a non-currency crisis setting.
The paper is organized in the following way. We begin by giving a brief overviewof the capital flows into the CIS region after the break-up of the Soviet Union. Thenwe discuss theoretical and empirical work devoted to the analysis of capital flows inthe context of developed and developing/emerging economies. Later, we present themethods we use in our analysis, followed by a discussion of the data employed.Econometric results are presented in the subsequent section, which are discussed inmore detail in the final section. Some concluding remarks close the study.
1. Portfolio Investment Flows in the CIS
Since the breakdown of the Soviet Union and the beginning of integration with theglobal economy, the CIS countries have experienced swings in their short-termforeign capital flows. While the period from the mid-1990s to 1998 can becharacterized by a net capital inflow, the Russian financial crisis that quickly spilledover to neighbouring countries significantly altered the overall pattern. Capital flighthad persisted for a few years and the CIS countries were cut-off from foreignresources for some time. However, following strong growth in the CIS region andfurther development of its financial markets, portfolio capital flows slowly beganpicking up in 2002 (please see Figure 1).
9
DETERMINANTS OF PORTFOLIO FLOWS INTO CIS COUNTRIES
Studies & Analyses No 354
Source: International Financial Statistics.
Figure 1. Portfolio investment inflows in the CIS countries, million USD
0
3000
6000
9000
12000
15000
1996 1997 1998 1999 2000 2001 2002 2003 2004 2005 2006

At the beginning of the 1990s, official capital flows were crucial for CISdevelopment, whereas the volume of private investments was negligible. Officialcapital flows were primarily the result of borrowing from international financialinstitutions (e.g. the IMF and World Bank) and were aimed to assist the CIS countriesin reforming their economies.
The major obstacles to portfolio flows in the CIS region were as follows:underdeveloped financial systems, poor protection of property rights, capital accountrestrictions, and lack of reliable financial instruments for foreign investors to investin. Portfolio flows began to increase once some basic financial institutions andlegislative systems were put in place (see Figure 2). First, the bond market begandeveloping (government borrowings and later corporate borrowing), followed by thedeveloping of the stock market.
National stock exchanges in the CIS were created in the second half of the 1990s.The Russian stock market index RTS was launched in September of 1995, while thecorresponding Ukrainian equivalent (PFTS) was brought into existence in November1997. Still, despite the creation of stock exchanges, the equity flows into the CIS wereextremely small, particularly due to the underdeveloped financial markets anddominance of the banking sector among other financial institutions. Equity flowsincreased considerably in 2005-2006. Beginning in the first quarter of 2005 and untilthe third quarter of 2006, total equity liabilities of CIS countries were augmented byUSD 10bn, while debt liabilities grew by USD 6bn. Almost all equity flows into the CISfrom 2005-2006 were directed to Russia. The share directed to other CIS countrieswas minor and amounted to only 0.7% of the total flows.
10
Oleksandr Lozovyi and Alina Kudina
Studies & Analyses No 354
Source: International Financial Statistics.
Figure 2. Private Portfolio flows to Emerging Markets and Developing Countries, USD bn
-110
-90
-70
-50
-30
-10
10
30
50
70
1998 1999 2000 2001 2002 2003 2004 2005 2006
Emerging and Developing Countries CEEC CIS

The total amount of capital inflows into the CIS economies since the beginning of1995 and until the first half of 2006 adds up to a sizeable USD 83.2bn, which, however,falls short of the capital inflows into other Central and Eastern European countries.Figure 2 offers a comparison of portfolio flows to Central and Eastern Europeancountries, the CIS, and other emerging markets in the after-crises period (1998-2006).
Unsurprisingly, Kazakhstan, Russia and Ukraine account for almost all portfolioflows into the CIS region, with Russia standing out considerably (see Figure 3). Giventhat these countries are the largest economies in the region, with Russia andKazakhstan enjoying considerable endowments of natural resources, their lead inattracting capital inflows is in line with conventional logic. The relative weight ofother CIS members has been very small.
When describing the evolution of portfolio flows into the CIS, three distinct timeperiods may be distinguished: 1) 1996 up to the Russian currency crisis (3Q1998) --period of large portfolio inflows, mainly debt; 2) 3Q1998 up to 3Q2003 – no significantcapital inflows took place; and 3) 2004 to the present - equity flows have grown insignificance. We shall discuss these three periods consecutively.
1.1. Portfolio Flows: 1996 until the Russian crisis (3Q1998)
The first period was marked by impressive debt inflows. The equity flows weretiny since the stock market activity had only just been launched (see Figure 4). Theoverall amount of debt flows into the CIS during the period up to the third quarterof 1998 amounted to USD 28.8 billion2. Unsurprisingly, the majority of capitalflowed to Russia. The share of all CIS countries, excluding Russia, constituted only5.7%; whereas the relative size of the respective economies (measured by GDPratios) was 19.6%.
11
DETERMINANTS OF PORTFOLIO FLOWS INTO CIS COUNTRIES
Studies & Analyses No 354
2 International Financial Statistics.
Source: International Financial Statistics.
Figure 3. Portfolio flows to CIS countries, million USD
1996 1997 1998 1999 2000 2001 2002 2003 2004 2005 2006
Armenia 7.2 15.9 -16.6 1.6 0.3 0.0 -1.9 0.2 -2.4 1.1 9.3Belarus 3.2 41.8 -13.4 -5.2 50.1 -45.4 -6.7 5.3 59.6 -38.6 -25.1Georgia n.a. 2.4 0.0 6.2 2.7 2.9 0.0 1.0 13.1 15.6 3.6Kazakhstan 223.5 405.4 66.2 -39.9 30.4 31.4 -182.9 182.1 675.0 1225.0 578.7Kyrgyzstan -1.8 5.0 -4.1 0.2 0.3 0.0 -9.5 5.0 0.0 0.0 n.a.Moldova 30.8 18.6 -59.1 -7.3 -4.0 -3.9 -25.9 -24.2 -8.3 -5.8 -1.5Russia 4584.0 17794.5 6293.3 -1882.0 -12808.4 -730.0 3756.1 -2328.6 4406.2 -828.0 12272.2Ukraine 199.0 1605.0 -1379.0 -75.0 -197.0 -867.0 -1718.0 -923.0 2073.0 2757.0 102.0

During the period directly prior to the crisis of 1998, return on investment in theCIS countries was huge when compared with other developing countries. Russian T-bills were offering an average yield of 50.4%. Yield on T-bills in Kazakhstan equalled23.3% on average. Consequently, the excessive volumes of portfolio flows weredirected into government bonds. The remarkably high rate of return on investment inthe CIS was the principal factor responsible for debt inflows before the crisis. The risk
12
Oleksandr Lozovyi and Alina Kudina
Studies & Analyses No 354
Source: International Financial Statistics.
Figure 4. Debt and Equity Flows into the CIS countries, billion USD
-12
-9
-6
-3
0
3
6
91
99
5Q
1
19
95
Q4
19
96
Q3
19
97Q
2
19
98
Q1
19
98
Q4
19
99
Q3
200
0Q
2
20
01
Q1
20
01
Q4
20
02
Q3
20
03
Q2
20
04
Q1
20
04
Q4
20
05
Q3
20
06
Q2
equity flows debt flows
Source: www.cbonds.info
Figure 5. EMBI+ indices for Emerging Markets and Russia, 1998-2006
0
1000
2000
3000
4000
5000
6000
7000
1998 1999 2000 2001 2002 2003 2004 2005 2006
EMBI + spread EMBI + Russia spread

premium on the total number of traded Russian external debt instruments measuredby EMBI+ Russia spread3 rose to 44.2% by the end of 2Q1998 from 6.6% in the verybeginning of 1998 (See Figure 5). Such a dramatic increase of the EMBI+ Russiaspread index was a clear signal of a forthcoming crisis.
A major share of capital inflows was used for government consumption, which hadincreased substantially. The Russian quarterly budget deficit during 1Q1995-2Q1998peaked at 6.2% of nominal GDP on average. Disorderly government expendituresundermined the creditworthiness of the external government borrowings. The budgetdeficit was one of the factors that triggered the crisis in 1998.
1.2. Portfolio Flows: 3Q1998-3Q2003
The period of capital influx in the first time period considered was reversed bypersistent capital outflows after the 1998 crisis. For almost five years, the CIScountries were cut off from external financing. The yield on debt instrumentsskyrocketed. The index EMBI + Russia spread surged to 6890 points in October, 1998(See Figure 5). Obviously, no considerable external borrowings were possible undersuch circumstances.
Although it was only the Russian Federation which defaulted on its externalgovernment debt obligations, all other CIS countries experienced disruptive
13
DETERMINANTS OF PORTFOLIO FLOWS INTO CIS COUNTRIES
Studies & Analyses No 354
3 The EMBI+ index measures the spread of the bonds yield on the traded external debt instruments of theemerging markets and the yield on risk-less US government debt securities.
Source: International Financial Statistics
Figure 6. Accumulated portfolio capital flows in the CIS, billion USD
-20 -10 0 10 20 30
4Q2003-3Q2006
3Q1998-3Q2003
1Q1996-2Q1998
Russia Ukraine Kazakhstan Other CIS

consequences of the crisis. The accumulated volume of outflows from the CIScountries (except Russia), during the second time period, totalled USD 4.8bn (SeeFigure 6). Ukrainian capital outflow was the highest among the remaining CIScountries. Besides, as in the period up to the crisis, the equity flows in the second timeperiod were quite modest with no significant inflows having been observed.
Despite its disruptive effects, the Russian crisis motivated major improvements inpublic finances in the CIS countries. The Russian quarterly budget deficit shrank to1.3% of nominal GDP on average in 1999 and became positive in 2000. In Ukraine,the budget was nearly balanced in 1999, as well as in 2000.
Since the crisis, the rate of return on government securities has declineddramatically. The yield on T-bills fell to 4.3% in 3Q2003, from 89.6% in 1Q1996, inRussia and to 5.9% from 40.3% in Kazakhstan. The creditworthiness of the CISexternal debt borrowings experienced significant improvements. The EMBI+ spreadindex for Russia and Ukraine declined to 277 points and 255 points respectively.Furthermore, the spread on external debt instruments for Russia and Ukraine hadbecome smaller than the overall EMBI+ spread (which comprises the emergingmarkets and developing countries).
1.3. Portfolio Flows: 4Q2003-3Q2006
The third time period can be roughly distinguished beginning from the substantialportfolio capital influx in the fourth quarter of 2003, which was followed by a year anda half of persistent inflows. The equity flows gained considerable importance in thisperiod. Although the volume of accumulated debt flows was still larger, the equityflows showed great potential for growth.
The CIS stock market activity experienced impressive growth records. The MSCIRussia equity index4 grew by 69.5% in 2005 (See Figure 7). The Russian stock marketperformance over 2005-2006 significantly outpaced the average performance ofemerging markets. The same can be ascribed to the stock markets in Ukraine which,however, lagged somewhat in development as compared to Russia. In 2005. theUkrainian stock market index PFTS grew up by 35.7%.
The stock market development in the third period considered was greatlyenhanced by a number of IPO (initial public offering) deals conducted in Russia, aswell as other CIS countries. The IPO process in the CIS was launched in 1996 whenthe first deal came through. However, only since 2005 have initial public offeringsincreased significantly in volume. During 1996-2004 only seven companies wentpublic in Russia and raised USD 1.1bn. Yet, 2005 witnessed nine IPOs of Russian
14
Oleksandr Lozovyi and Alina Kudina
Studies & Analyses No 354
4 For index description see http://www.mscibarra.com

companies, which raised USD 4.6bn. In Kazakhstan and Ukraine, the funds attractedby means of IPOs in 2005 stood at USD 1.4bn and USD 0.15bn respectively.Furthermore, in 2006 the IPO market in the CIS showed tremendous growth. The IPOof “Rosneft” in July 2006 resulted in USD 10.4bn of capital raised. The total amountof IPO deals conducted in Kazakhstan and Ukraine in 2006 amounted to USD 4.6bnand USD 30.6mn respectively.
A number of previously conducted IPO deals of CIS companies are bound to stimulatefurther expansion of stock market activity in the CIS. Furthermore, the IPO market isexpected to preserve impressive growth henceforth. The increase of volume ofoutstanding shares is expected to lessen overall risks and liquidity risk in particular.However, portfolio flows into the CIS are still projected to be volatile and highlydependent on the IPOs of large companies. Besides, as long as there is little progress withmajor economic and political reforms (e.g. further liberalization of the economy andcapital account, property rights protection, improvement of legal system), the portfolioflows into the CIS are likely to be highly susceptible to global financial sentiments.
2. Literature Review
The existing literature on portfolio flows may be divided into two broad categories.The first group looks at portfolio flows in developed countries. This part of the
15
DETERMINANTS OF PORTFOLIO FLOWS INTO CIS COUNTRIES
Studies & Analyses No 354
Source: www.mscibarra.com
Figure 7. MSCI indices: Emerging Markets and Russia, 1996-2006
0
200
400
600
800
1000
1200
1400
1996 1997 1998 1999 2000 2001 2002 2003 2004 2005 2006
MSCI Emerging Markets MSCI Russia

literature analyzes portfolio capital flows in the context of the portfolio equilibriumframework. The second group focuses on portfolio flows into the developingcountries. Scholarly interest in this area was revived following a series of currencycrises, which hit a number of emerging markets in the 1990s. These studies payspecial attention to external (push) and domestic (pull) determinants of capital flows.The following section provides an overview of research on the topic, whereas Annex1 provides a more detailed account of the studies discussed below.
2.1 Capital flows in the developed countries
One of the most popular approaches used to analyse international capitalmovements is the stock-equilibrium model developed by Miller and Whitman (1970).The authors treat capital flows as a combination of stock adjustment and flowadjustment components. Based on U.S. quarterly data, they show interest ratedifferentials to be highly important determinants of international capital movements.The speed of adjustment coefficient suggests that approximately 1/3 of adjustmentbetween foreign and domestic assets holdings takes place within one quarter.
The same approach was also used by Kreicher (1981). However, his model assumesthat there is some desired stock of capital that economic agents would like to have.However, as the actual stock differs from the desired stock, it induces investments toflow. The author argues that the desired stock of capital depends on a set of countryspecific variables (such as real interest rate and industrial production indices). Themodel was estimated for both capital inflows (liability equation) and outflows (assetequation) for four developed countries. Industrial production indices were found to bestatistically insignificant in all of the asset flow equations; however, they arestatistically significant in the liability equations. For all countries there is at least onereal interest rate being statistically significant. Hence, an increase in the externalmarket return leads to an increase in portfolio flows into the country. However, thedomestic real interest rate turned out to be statistically significant for only twocountries, which suggests some independence in investment decisions concerningcapital allocation between the domestic economy and the rest of the world.
Further, development to the stock equilibrium approach was undertaken by Kouriand Porter (1974), who combined the stock equilibrium approach with balance-of-payments theory. The authors assume the capital flows to be the means foreliminating excess money demand. Thus, it is believed that income and interest ratesshould have a significant impact on capital flows. The authors find that the primarymotive for capital flows is real disposable income which, in turn, is an importantdeterminant of money demand. Therefore, they conclude that money demand andsupply forces determine the capital flows between countries.
16
Oleksandr Lozovyi and Alina Kudina
Studies & Analyses No 354

The next important approach in the analysis of international capital movements isthe portfolio equilibrium approach. It is often regarded as more suitable for estimationof portfolio flows because it captures the effect of the two most important factors, suchas market return and risks associated with investments (Kraay et. al., 2000).
A complication to the portfolio equilibrium models arises when informationalasymmetries between international investors are taken into account (Brennan andCao, 1997). In this case, investors may not act in line with portfolio equilibrium theorylogic. Brennan and Cao (1997) developed a model of international capital flows basedon the differences in knowledge about foreign markets. The authors moved away frombarriers to investments, and interest rate differentials. The only independent variablesthat enter the equation are market returns and foreign market indices measured in USdollars. The authors conclude that while US investors have an informationaldisadvantage in the foreign market (apart from the UK), investors from developed anddeveloping countries do not have any informational shortages in the US market.
Brennan and Cao’s (1997) informational disadvantages hypothesis found littlesupport in the study by Froot, O’Connell and Seasholes (1998). High frequency dataemployed in the paper allowed for a more comprehensive analysis of portfolio flows.Daily international portfolio flows for 46 countries were used to estimate a structuralequation by employing the vector auto-regression (VAR) methodology. It was foundthat portfolio flows had been highly persistent over time. For developing countries,current portfolio inflows are good predictors of future returns. However, fordeveloped economies, this is not the case. Thus, inflows of capital to emergingmarkets contain some information about their future value.
Another popular approach for analysis of portfolio flows has been borrowed frominternational trade theory. More precisely, the gravity model has been successfullyemployed by, for example, Portes and Rey (1999). An augmented gravity equationproduced a very good fit for equity flows into the 14 developed countries. As ameasure of market size, Portes and Rey (1999) used market capitalization. To proxythe cost of investing they included a distance variable. The authors found that marketreturns do not play any significant role in equity flows. Measures of market size anddistance were found to be the key determinants of capital flows. Also, the informationasymmetry explanation of equity flows found strong support in their results.
Siouronis (2002) employs a similar model to Portes and Rey (1999). Specifically, theauthor uses the volatility augmented gravity equation model to estimate the influence ofmonetary variables on the composition of international capital flows. Contrary to Portesand Rey (1999), the distance proxy was found to be an insignificant determinant ofcross-border capital flows for developed economies. However, for developing countries,the distance was important in most of the cases. The capital flows were divided intothree broad categories: government bonds, corporate bonds and corporate equities. For
17
DETERMINANTS OF PORTFOLIO FLOWS INTO CIS COUNTRIES
Studies & Analyses No 354

all of the capital categories, market interest rate and inflation volatilities were found tobe significant with a negative sign. This is in line with the logic that as interest rate andinflation volatility increase, the riskiness of the investments increases as well.Interestingly, exchange rate volatility was found to have a positive impact, i.e. greatervolatility of exchange rate encourages all types of capital flows.
While consideration of domestic (or pull) and external (or push) factors is morewidely used in literature analysing developing countries, it was also applied in adeveloped country setting by Odedokun (2003). He used a push and pull factorsapproach to analyze the determinants of capital flows from the perspective of acapital-exporting country. Per capita income levels, interest rates, economic growthand the phase of the economic cycle are among the key explanatory variables in hisstudy. The author reports a significant and positive effect of income per capita oncapital flows. A relatively high interest rate in the destination country pulls theportfolio capital, while the increase of interest rates in other countries tends todiscourage capital flows. Economic growth, as well as the economic cycle, appearedto be insignificant factors in explaining capital flows. Thus, the only factors whichmatter are income and interest rate differentials.
A domestic interest rate has been found to be a significant determinant of portfolioflows into the developed countries by almost all authors. Hence, portfolio investmentflows were confirmed to be responsive to the changes in international market returns.Furthermore, gravity models confirmed a positive impact of the market size onportfolio flows, whereas the impact of distance and information cost had not alwaysbeen found statistically significant.
2.2 Capital flows in the developing countries
There is a significant body of research exploring the determinants of capital flowsinto the developing/emerging economies. Considerable attention is devoted to theanalysis of the causes of different currency crises. The Mexican crisis of 1994 and theAsian crisis of 1997 have spurred substantial interest by economists. Financial crisesare typically followed by significant exchange rate depreciation if a floating exchangerate is adopted, or a foreign reserves reduction if it is fixed. However, the Mexican andAsian crises have witnessed both processes. Large IMF loans were used to coverinternational capital imbalances during those periods.
Carlson and Hernandez (2002) analyzed the major factors that led to financialcrises in both regions. While in Mexico the low ratio of short term debt to reservescontributed to crisis aggravation, in Asia, an abrupt debt denomination was a majorcause of the crisis. In both cases, composition of capital flows affected the likelihood
18
Oleksandr Lozovyi and Alina Kudina
Studies & Analyses No 354

of a crisis occurring. A considerable part of capital inflows into these countries wasshort-term. As economic conditions in the countries began to deteriorate, short-termcapital was the first to leave the country. Thus, the government should haveimplemented some policies to balance the structure of capital flows. For example, byimposing capital controls the government could have increased the level of FDI in theeconomy and restricted the volume of short-term debt. A floating exchange rate tendsto encourage the share of short-term debt, while a fixed exchange rate promotes FDIand portfolio flows. It is generally assumed that portfolio flows behave similarly toshort-term debt because of its short-term nature. The authors concluded that portfolioflows behaved similarly to FDI. being encouraged by a fixed exchange rate regime.
The stock adjustment approach employed for developed countries has also beenused to investigate portfolio flows into developing countries. Hernandez and Rudolph(1995) employ a stock adjustment model by incorporating push (external) and pull(internal) determinants of capital flows. The estimation results support a propositionthat pull factors are of larger importance than push factors for portfolio flows totransition economies. In particular, the 12-month US Treasury bill rate was found tobe insignificant. Therefore, the paper infers that an adverse shock is very unlikely tohappen solely because of external factors.
The opposite findings have been reported in Fernandez-Arias (1994) where thepush explanation of capital flows received greater backing. Fernandez-Arias (1994)developed a model of international capital flows based on non-arbitrage conditionsbetween external and domestic measures of returns adjusted by country risk. Threekey variables of the model are the countries’ creditworthiness, domestic investmentreturn and opportunity costs represented by market return in developed countries.The results showed a larger influence of the international interest rate on capitalinflows into the country than improvements in the domestic investment climate. Acountry’s creditworthiness also appeared to be an important factor driving capitalinflows into the country. However, it is argued that creditworthiness is influenced byexternal sources to some extent. A country’s credit rating tends to improve when theinternational interest rate is low.
The relative importance of push and pull factors in determining capital flowsvaries by country. While for the CIS countries domestic factors were found to be themajor determinants of capital flows (Claessens, Oks and Polastri, 1998), both internaland external factors were found to be important for Latin American and Asiancountries (Taylor and Sarno, 1997). The authors use the same monthly data onportfolio flows from the USA to a group of Latin American and Asian countries, as inthe study by Chuhan, Claessens and Mamingi (1993). Taylor and Sarno (1997)estimate a seemingly unrelated error correction model to retrieve short-term effects,while cointegration techniques were employed to estimate long-term coefficients.
19
DETERMINANTS OF PORTFOLIO FLOWS INTO CIS COUNTRIES
Studies & Analyses No 354

Both methods testified of approximately equal importance of external and domesticdeterminants. However, for bond flows, global factors seem to have greaterimportance than domestic factors.
The proposition that the importance of push and pull factors is equal for emergingeconomies was challenged in other studies. Hernandez, Mellado and Valdes (2001),which analyzed portfolio flows to developing countries in Latin America, Asia, andEastern Europe, found that domestic determinants are much more important thanexternal ones. The authors pay special attention to the so-called contagion effectwhich occurs if capital flows exhibit strong co-movement. In this case, decisions bylarge investors tend to be followed by many relatively small players whose behaviourmimics the pattern of the leader. Three possible sources of contagion considered inthe paper: the neighbourhood effect, the trade related channel and the similarmacroeconomic indicators channel. The estimation results provided strong evidencethat macroeconomic similarities and trade linkages between countries tended tointensify the impact of external shocks for the countries.
On the other hand, support for pull factors in explaining international capital flowsin the developing country setting was offered in a study by Chuhan, Claessens andMamingi (1993). The authors explored the relative importance of global and domesticdeterminants of capital flows. They analyzed net equity and gross bond flows from theUSA to Latin American and Asian countries. While for Latin American countries theexternal and domestic factors were roughly equally important, for Asian countries,domestic fundamentals played a larger role. Interestingly, equity flows were shown tobe more sensitive to global factors than bond flows.
The pull factor explanation of capital flows has found considerable support inexisting literature on developing countries. There is also some evidence for the pushfactors explanation, although it is far less prevalent. Thus, reforming institutions andstrengthening the domestic economic environment are the key factors that shouldattract capital flows into developing countries.
2.3 Capital flows into the CIS countries
For the CIS countries except Russia, almost all capital flows have taken the formof foreign direct investment (FDI). Out of portfolio investment only, a considerableamount of capital flows took the form of government borrowings from internationalorganizations (mostly from the IMF and the World Bank) both long-term (in order toconduct structural reforms) and short-term (in order to cover rising fiscal deficits).
The studies of the CEE and CIS countries claim that the most important factors ofportfolio inflows tend to be domestic. Claessens, Oks and Polastri (1998) concluded
20
Oleksandr Lozovyi and Alina Kudina
Studies & Analyses No 354

that a country’s success in reforms and robust creditworthiness are the only importantdeterminants of capital inflows into the country (having considered a variety of bothexternal and internal factors). It is not surprising as the bulk of capital flows had beenin the form of government borrowing to conduct reforms. Thus, the primary goal ofthe capital inflows was to promote the reform process. Because of the relatively shorthistory of portfolio flows into the CEE and CIS countries, the authors speculate about“weak relationships” in a portfolio flow equation which limits the estimation options.
Another similar study, which analysed the portfolio flows into the CEE and CIScountries, has been conducted by Garibaldi, Mora, Sahay and Zettlemeyer (2001). Asin the previous paper, portfolio capital flows have been found to be much harder toproperly model than FDI. The authors found only a few explanatory variables to beresponsible for portfolio investment into the CIS and CEE. While macroeconomicvariables played a significant role for FDI, portfolio investment was found to beassociated with developments of financial market infrastructure and protection ofproperty rights only. Hence, such factors as interest rates and solvency indicatorswere not reported to be among important determinants of portfolio flows into thesecountries. Hence, again for CEE and CIS countries, domestic factors were shown tobe highly important in attracting capital inflows. Large sensitivity of investment tothese factors indicates that the CIS countries need to pay considerable attention to thedevelopment of a healthy institutional environment.
3. Methodology
According to the Tobin-Markowitz framework, as discussed in Calderon, Loayza,and Serven (2003), the determinants of portfolio flows into a country or a region maybe split into four categories:
(i) Expected investment return in host country relative to abroad.
(ii) Perceived risk of investments.
(iii) Co-movement between portfolio flows in given countries.
(iv) Diversification.
This set of comprehensive determinants encompasses the factors which areresponsible for portfolio flows to CIS countries. It is also easy to expand this approachto the one most frequently used in the literature on developing countries, specifically,the push-pull framework.
The four above-mentioned groups of portfolio flow determinants are essential inthe long-run. In the short-run, additional factors such as frictions and imperfections
21
DETERMINANTS OF PORTFOLIO FLOWS INTO CIS COUNTRIES
Studies & Analyses No 354

of financial (as well as real) markets, and changes in the regulatory framework mayplay a significant part too. Additionally, co-movement in capital flows over and abovea normal level can also be considered as determining portfolio flows in the short-run.
Despite being a widely applied framework, the Tobin-Markowitz approach,however, does not work accurately even for developed countries. Investors usuallytend to under-invest in foreign countries even after appropriately adjustinginvestment decisions by expected risk and return, and also over-invest in the domesticmarket, thus, causing home bias in portfolio investment (Tesar and Werner, 1995).Investors expect “return in their domestic equity markets to be several hundred basispoints higher than returns in other markets” (French and Poterba, 1991).
As for developing countries, a number of other factors play a significant part inaddition to the standard ones. One of these factors is restrictions on cross-bordercapital movements in developing countries which control various aspects offoreign investment. The ease of liquidation of an investment position in the localmarket tends to be the most important. In the CIS, the controls on capital flowshave not been lifted yet. This is definitely one of the reasons for the relativelymodest volumes of portfolio flows as compared to direct investment. The issue ofcapital account liberalization is an acute question for the CIS countries to address.All CIS countries, except for Azerbaijan, experience approximately the same levelof capital account restrictions.
Another important factor, which has been shaping the pattern of portfolio flowsinto the developing/transition economies and the CIS in particular, is a country’spolitical environment. The CIS countries have been characterized by constantlychanging political situations, which obviously had a detrimental impact on theinvestment climate. Hence, it is expected that an improvement in political stabilitywill have a considerable impact on portfolio flows into the CIS.
Underdeveloped financial markets were yet another restricting factor to portfolioflows into the CIS. The set of possible investment opportunities in a typical CIScountry was very narrow, mostly represented by debt instruments. Unsurprisingly, themajority of portfolio investment used to be of the debt type. A large part of debt flowswere government borrowings. Hence, during the first years of independence, portfolioflows were skewed toward government securities.
Following the approach used in literature on developing countries, in this paperwe split the determinants of portfolio flows into the CIS region into two large groups:global or push and domestic or pull factors. This division will help us to differentiatebetween domestic and global sensitivity of capital flows into the CIS region.Recognising the importance of domestic factors for capital flows into the developingcountries and the CIS, we also expect global factors to play a significant part in theCIS setting as was shown by Calvo et al. (1993). In this case, external or global factors
22
Oleksandr Lozovyi and Alina Kudina
Studies & Analyses No 354

will only be reflecting the return on investment. It is assumed that these investmentsare risk-free as compared to the investment in the CIS.
As a result, we employ the following external or push factors in this paper:
(i) short-term international interest rate measured by Market yield on U.S.
Treasury securities at 3-month constant maturity. The correlation of yield onthe 3-month US Treasury securities with the Euro-Dollar 3-month deposit rateis close to one. The correlation with yield on the 2-year US Treasury securitiesis also very high, which justifies the usage of the 3-month US T-bills rate.
(ii) yield on a world stock market index measured by S&P 500 (Standard &Poor’s 500).
(iii) yield on emerging markets price index from Morgan Stanley CapitalInternational (MSCI). This index should reflect more closely the risk structureof investments similar to those in the CIS (i.e. the emerging markets).
(iv) US real GDP growth, which is supposed to represent (be correlated with)world economic activity. The inclusion of this global explanatory variable willshed some light on whether portfolio flows to CIS countries follow globaleconomic cycles.
The determinants of portfolio flows considered in this research constitute only abackground or approximation to characteristics which are of primary interest to theinvestor. Largely, these are return and risk measures of investment into a particular asset.
Hence, the following internal pull factors are employed in this study to account forinvestment opportunities in the host country (CIS):
(i) domestic deposit rate (which is a good indicator of prevailing interest rate in acountry). In the CIS, the domestic deposit rate is strongly correlated with the T-billrate (the correlation coefficient equals 0.92 for Russia, and 0.86 for Kazakhstan).
(ii) real GDP growth rate.
At the same time, perceived risks of investing into the CIS countries areapproximated by several variables. Because the risks in the CIS countries werenumerous, a single measure of risk may not provide satisfactory results. The mostcommon risks faced by investors are currency, financial, and political risks. We willassess these risks with the following explanatory variables:
(i) exchange rate risk will be measured by the percentage change in the exchange
rate of the national currency against the US dollar,
(ii) financial risk will be estimated by employing corresponding indices from theInternational Country Risk Guide (ICRG).
(iii) political risk will be also approximated by corresponding indices from theInternational Country Risk Guide (ICRG).
23
DETERMINANTS OF PORTFOLIO FLOWS INTO CIS COUNTRIES
Studies & Analyses No 354

The ICRG financial risk index is comprised of the following components: foreigndebt as a percentage of GDP, foreign debt service as a percentage of exports of goodsand services, current account as a percentage of export of goods and services, netinternational liquidity as month of import cover, and exchange rate stability. Thenumerical values of the categories are then assigned specific risk points in order tocombine them into one index. The index is measured on a scale of 1 to 100, withhigher values being assigned to the most stable countries, hence, 100 points indicatesan absence of financial risk.
The ICRG political risk index is a weighted average of the values assigned to thefollowing categories (each one assessed independently): government stability,socioeconomic conditions, investment profile, internal and external conflicts,corruption, military in politics, religious tensions, law and order, ethnic tensions,democratic accountability, and bureaucracy quality. The maximum and minimumpoints of the index are similar to those of the financial index5.
We have already emphasized the importance of contagion for capital flows. Theliterature embraces different views with respect to the nature of the contagion effect.While Fiess (2003) does not distinguish contagion from global conditions, Forbes andRigobon (1999) proposed defining contagion as “a significant increase in cross-market linkages after a shock”. In this paper, we will follow the approach introducedby Forbes and Rigobon (1999). Specifically, they propose the use of the term ‘shift-contagion’ rather than ‘contagion’. Naturally, the Russian financial crisis of 1998 willbe investigated as a source of shift-contagion in the CIS countries. A test on stabilityof the effects of push and pull factors before and after the crisis will help to analysethe presence of the contagion after the crisis period. The analysis of the two timeperiods, before the crisis of 1998 and afterwards, will also help to better understandthe influence of the factors outlined above on portfolio flows into the CIS. Thebehaviour of the domestic variables differs substantially before and after the crisis,which prompts the hypothesis that there was a significant (structural) change in therelationship between explanatory and dependent variables in 1998.
Although Forbes and Rigobon (1999) introduced a more sophisticated way toaccount for contagion effects through the use of unconditional correlationcoefficients, it does not seem possible to apply in this paper due to the low frequencyof data on portfolio flows in the CIS (in this case, a correlation coefficient for theperiod before the crisis of 1998 will offer little insights).
Apart from the contagion effects, the literature also suggests being aware of thepresence of co-movements in the flows of capital to adjacent regions. To account forthis effect, we include portfolio investment flows to Central and Eastern European
24
Oleksandr Lozovyi and Alina Kudina
Studies & Analyses No 354
5 For more information on ICRG methodology please see http://www.prsgroup.com/ICRG_Methodology.aspx

countries as an additional explanatory variable. Furthermore, in line with the Tobin-Markowitz model, we test for a diversification motive in the CIS region throughinclusion of a country’s GDP share in the total GDP of the CIS countries.
Another factor that is hypothesised to have a significant impact on short-termcapital flows is capital account controls in the CIS. It is very important since capitalaccount restrictions are present in almost all CIS countries except Armenia. However,we were not able to construct an appropriate index due to low variation in the data forthe CIS countries (both across time and cross-sectional). There are plenty of controlsimposed on transactions with capital market securities and money market securitieswhich are still not abolished in the CIS6. Yet, it will only be possible to assess the effectof these restrictions when more countries start relaxing at least some of them.
The determinants of portfolio flows to the CIS countries will be estimated using apanel data regression. Using either the fixed or random effect method (as will besuggested by the Hausman specification test), the following model will be estimated:
,
where PILit
is portfolio investment liabilities in USD, mn; WRk,it
– is a set of globalvariables which measure return on investment in global markets. In particular, theyencompass the 3 month U.S. T-bills yield, MSCI emerging markets yield, S&P 500yield, and the US GDP growth rate. DR
j,it– is a set of variables measuring domestic
return on investment, which comprise the domestic deposit and GDP growth rates.RI
j,it– is a set of risk variables, comprised of the exchange rate changes, financial and
political risk indexes; COit
– a co-movement variable, operationalised by portfolioinvestment flows to the CEEC7; D
it– a diversification variable measured by a
country’s GDP share in the total GDP of the CIS countries, εit
– stochastic error termdistributed as N(0,σ2).
4. Data
The time span of balance of payments data on the CIS members8 is rather short (ifavailable at all) and that determined the time dimension of the sample under
ititititssitjjitkkit DCORIDRWRPIL εβββββα ++++++= 54,3,2,1
25
DETERMINANTS OF PORTFOLIO FLOWS INTO CIS COUNTRIES
Studies & Analyses No 354
6 See ‘Annual Report on Exchange Arrangements and Exchange Restrictions’, the International Monetary Fund.7 Central and Eastern European Countries (CEEC) in this research comprises the following countries: Bulgaria,
Czech Republic, Hungary, Poland, Romania, and Slovakia.8 CIS includes the following countries: Armenia, Azerbaijan, Belarus, Georgia, Kazakhstan, Kyrgyzstan, Moldova,
Russia, Tajikistan, Ukraine and Uzbekistan. Turkmenistan suspended participation in the CIS in 2005.

consideration. More specifically, the data is available beginning in the first quarter of1996 and ending in the second quarter of 2006.
The primary source of data is the International Financial Statistics (IFS) of theIMF. However, the IFS do not provide data on all countries that are members of theCIS. In particular, the data for Uzbekistan are not available in the IFS database at all,whereas the data on Tajikistan contain a highly limited number of series, which makesthem of no value for the purposes of this research. Hence, these countries will not beconsidered in this paper. Also, the two Caucasus countries – Azerbaijan and Georgia–are not included in the sample either. A number of series are unavailable forAzerbaijan, whereas portfolio flows to Georgia have very often been reported to bezero in magnitude. In the end, the final sample comprises the following countries:Armenia, Belarus, Kazakhstan, Kyrgyzstan, Moldova, Russia and Ukraine.
We use quarterly portfolio investment liabilities9 (which consist of the claims offoreigners on assets in the CIS) as a dependent variable in this paper. Quarterly seriesis the most frequent data format available for the CIS countries that defines thefrequency of the sample under study. Table 1 offers a more detailed description ofvariables and corresponding sources; whereas Appendix 2 provides summarystatistics and graphs.
5. Results
We employ a random effect Generalized Least Squares technique (with a correctionfor cross-country heteroskedasticity) to analyse the determinants of portfolio flows intothe CIS countries. The choice of the random effect technique was supported by theHausman specification test which rejected the use of a fixed effects model. The fixedeffects technique produces inefficient estimates when no correlation between fixedeffects and regressors are observed in the model. The random effects model, on theother hand, supplies lower estimates of the standard errors, hence, more preciseinferences can be made. The use of a random effects model for the CIS indicates thatspecific individual effects of each country are the realization of random processes andconstitute individually specific errors. The results are quite natural given the commonpast of the CIS member countries and that they all had approximately the same levelof economic development during the time period studied.
26
Oleksandr Lozovyi and Alina Kudina
Studies & Analyses No 354
9 Portfolio investments are divided into debt and equity securities. Debt securities are subdivided into bonds andnotes, money market instruments, and financial derivatives. Equity securities include shares, stocks,participation, preferred stocks or shares, mutual funds, and investment trusts.

Table 2 reports estimation results of the determinants of portfolio flows into theCIS countries. The estimates obtained are generally consistent with the theory ofallocation of international portfolio flows. Higher return in the host country attractsmore portfolio investment to the CIS countries, whereas higher risk (particularlypolitical risk) has a detrimental effect on the investment attractiveness of the region.We also found empirical support of co-movement between portfolio flows into the CISand CEE regions. Additionally, the size of the economy has been confirmed to induceportfolio flows to the CIS countries.
The following discussion of the results is organised according to the 4 categoriesof the Tobin-Markowitz framework on which we have based our analysis, i.e. relativereturn, risk, co-movement and diversification. As has been mentioned before, we haveemployed the following measures of the relative return: global and domestic GDPgrowth rates, the US T-bill yield, MSCI emerging markets yield, domestic interest rateand the S&P 500 yield.
Portfolio flows to the CIS countries were found to be independent of globaleconomic cycles and, to some extent, from domestic ones. The world economic cycles(as approximated by seasonally adjusted US GDP growth rate) do not have astatistically significant impact on portfolio investment in the CIS (see Table 2).
However, the impact of domestic economic activity (as measured by a hostcountry’s growth rate) changes over the period under consideration. Despite thevariable being insignificant over the whole time period, it becomes significant only ifan after-crisis period is considered. Before 1998, the GDP in the majority of CIScountries was declining, yet large portfolio (debt) inflows were reported. The situationreversed after the Russian default in 1998: both GDP and capital flows were growingshortly thereafter. Unsurprisingly, no relationship could be detected over the wholetime period. Yet, domestic GDP growth rate turns out to be statistically significant atthe 10% significance level after 1998. Consequently, portfolio flows in the after-crisisperiod have become sensitive to domestic economic activity which indicates astructural shift in the pattern of capital flows into the CIS.
The Russian crisis has also had a significant impact on the relationship betweenanother measure of return on investment, the interest (deposit) rate in the CIScountries and capital flows. Despite its significance in the baseline specification, thecoefficient loses its significance when the influence of the 1998 crisis is accounted for(See Table 2). This suggests that the crisis of 1998 had a crucial impact on therelationship between the deposit rate and portfolio flows into the CIS. Our estimatesshow that the influence of the deposit rate has changed over time. While for the periodbefore the Russian default, the coefficient of the deposit rate is significant at the 5%significance level and negative (a higher interest rate in that period was a reflectionof high domestic inflation and risk, rather than higher return on investment); the
27
DETERMINANTS OF PORTFOLIO FLOWS INTO CIS COUNTRIES
Studies & Analyses No 354

coefficient changes the sign to positive and becomes significant at the 1% level afterthe crisis (see Table 2). Before the crisis, a decline in the deposit rate meant not lowerprofits, but higher macroeconomic stability and lower risks in a country. The largestvalue for the deposit rate in CIS countries during 1996-2006 was 61.7%, whereas themean value is only 16%. After the crisis, the deposit rate has become more stable andits influence on portfolio flows has become more predictable.
The world interest rate, measured by US 3 month T-bill yield, did not appear to bea significant determinant of portfolio flows into the CIS.
Another measure of the relative return considered in this study is the yield on theS&P 500. The return on the global stock market is only important for equity flowswhich have been small in the CIS as compared to debt flows. But nevertheless, thecoefficient of yield on the S&P500 is statistically significant and positive (see Table 2).As mentioned above, measures of relative return and the influence of S&P 500 returnon portfolio flows have seen a considerable change in the aftermath of the Russiancrisis. Specifically, the magnitude of the coefficient declined strongly, though,remained positive (Table 2). A positive relationship between S&P 500 yield andportfolio flows to the CIS signals a larger willingness to invest in emerging marketswhen more liquidity in the developed markets is available. In this case, investmentinto the CIS is deemed complementary to investment in the global stock markets.
However, we find investment into stock markets in the emerging markets acts asa substitute to investment in the CIS (if measured by the yield on the emergingmarkets index (MSCI)). In a baseline scenario, the coefficient on the MSCI index turnsout to be significant with a negative sign, indicating a substitution effect. However,after inclusion of the dummy for the Russian crisis, the coefficient becomesinsignificant as the index (which was severely hit by the Asian/Russian crises) has thesame structure as the dummy. Therefore, we excluded it from specifications 2-4 toavoid potential multicollinearity.
Of the risk measures considered in this research, only political risk is statisticallysignificant and a robust determinant of portfolio flows. The other two risk variables,financial risk and exchange rate risk, were found to be insignificant. Exchange raterisk, which is essentially the risk of depreciation of the national currency, becomessignificant at the 10% level when a group of larger CIS countries is consideredseparately. We have already mentioned that political risk was found to be the mostsignificant risk variable. However, the value of the coefficient has declinedconsiderably since the Russian default in 1998 (See Table 3).
There is strong evidence of co-movement in portfolio flows between the CIS andCEE countries. The coefficients for portfolio flows into the CEE countries remainsignificant and positive in all specifications under consideration. Hence, investment
28
Oleksandr Lozovyi and Alina Kudina
Studies & Analyses No 354
into the CEEC and CIS are deemed complementary: the more capital flows into theCEE countries are recorded, the more likely capital is to flow into the CIS as well.
The diversification motive measured as the ratio of a host country’s GDP in totalGDP of CIS countries has also been reported to have a significant positive effect on theportfolio flows in the CIS. The value of the coefficient declined strongly after the crisisof 1998 (see Table 2). However, it remained positive, which means that investors tendto invest in larger CIS economies even after controlling for all other determinants.
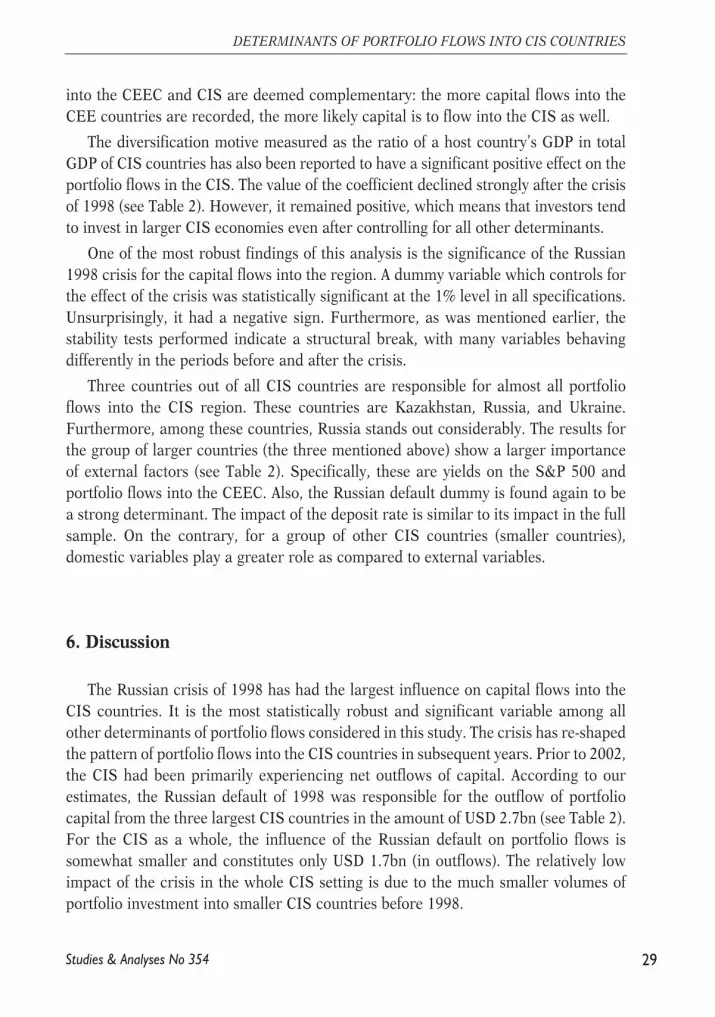
One of the most robust findings of this analysis is the significance of the Russian1998 crisis for the capital flows into the region. A dummy variable which controls forthe effect of the crisis was statistically significant at the 1% level in all specifications.Unsurprisingly, it had a negative sign. Furthermore, as was mentioned earlier, thestability tests performed indicate a structural break, with many variables behavingdifferently in the periods before and after the crisis.
Three countries out of all CIS countries are responsible for almost all portfolioflows into the CIS region. These countries are Kazakhstan, Russia, and Ukraine.Furthermore, among these countries, Russia stands out considerably. The results forthe group of larger countries (the three mentioned above) show a larger importanceof external factors (see Table 2). Specifically, these are yields on the S&P 500 andportfolio flows into the CEEC. Also, the Russian default dummy is found again to bea strong determinant. The impact of the deposit rate is similar to its impact in the fullsample. On the contrary, for a group of other CIS countries (smaller countries),domestic variables play a greater role as compared to external variables.
6. Discussion
The Russian crisis of 1998 has had the largest influence on capital flows into theCIS countries. It is the most statistically robust and significant variable among allother determinants of portfolio flows considered in this study. The crisis has re-shapedthe pattern of portfolio flows into the CIS countries in subsequent years. Prior to 2002,the CIS had been primarily experiencing net outflows of capital. According to ourestimates, the Russian default of 1998 was responsible for the outflow of portfoliocapital from the three largest CIS countries in the amount of USD 2.7bn (see Table 2).For the CIS as a whole, the influence of the Russian default on portfolio flows issomewhat smaller and constitutes only USD 1.7bn (in outflows). The relatively lowimpact of the crisis in the whole CIS setting is due to the much smaller volumes ofportfolio investment into smaller CIS countries before 1998.
29
DETERMINANTS OF PORTFOLIO FLOWS INTO CIS COUNTRIES
Studies & Analyses No 354
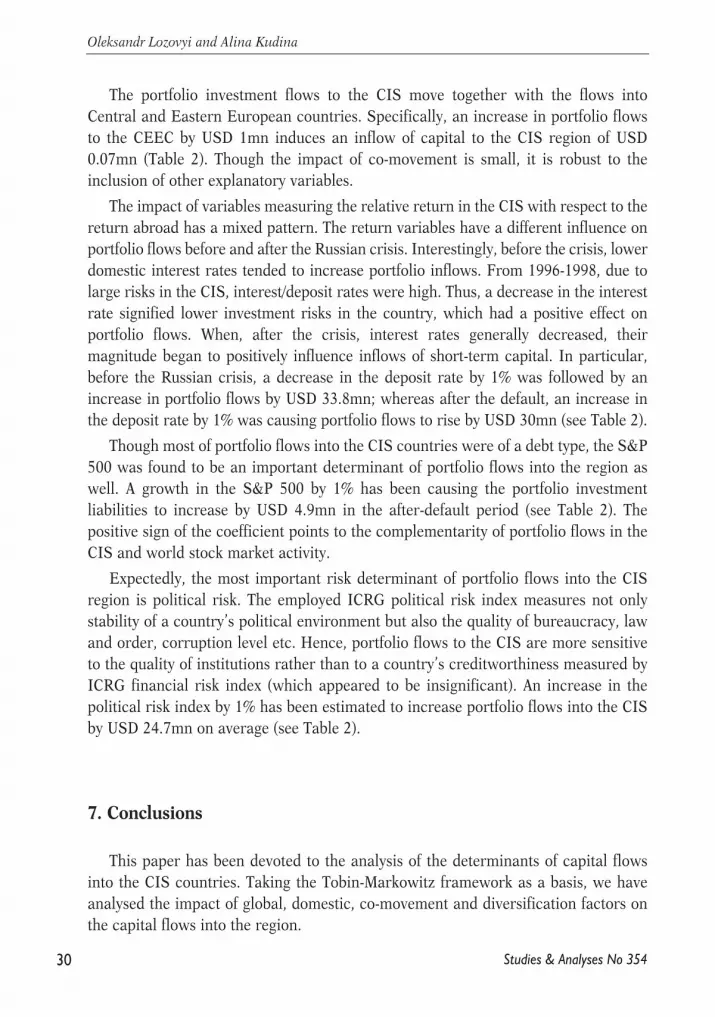
The portfolio investment flows to the CIS move together with the flows intoCentral and Eastern European countries. Specifically, an increase in portfolio flowsto the CEEC by USD 1mn induces an inflow of capital to the CIS region of USD0.07mn (Table 2). Though the impact of co-movement is small, it is robust to theinclusion of other explanatory variables.
The impact of variables measuring the relative return in the CIS with respect to thereturn abroad has a mixed pattern. The return variables have a different influence onportfolio flows before and after the Russian crisis. Interestingly, before the crisis, lowerdomestic interest rates tended to increase portfolio inflows. From 1996-1998, due tolarge risks in the CIS, interest/deposit rates were high. Thus, a decrease in the interestrate signified lower investment risks in the country, which had a positive effect onportfolio flows. When, after the crisis, interest rates generally decreased, theirmagnitude began to positively influence inflows of short-term capital. In particular,before the Russian crisis, a decrease in the deposit rate by 1% was followed by anincrease in portfolio flows by USD 33.8mn; whereas after the default, an increase inthe deposit rate by 1% was causing portfolio flows to rise by USD 30mn (see Table 2).
Though most of portfolio flows into the CIS countries were of a debt type, the S&P500 was found to be an important determinant of portfolio flows into the region aswell. A growth in the S&P 500 by 1% has been causing the portfolio investmentliabilities to increase by USD 4.9mn in the after-default period (see Table 2). Thepositive sign of the coefficient points to the complementarity of portfolio flows in theCIS and world stock market activity.
Expectedly, the most important risk determinant of portfolio flows into the CISregion is political risk. The employed ICRG political risk index measures not onlystability of a country’s political environment but also the quality of bureaucracy, lawand order, corruption level etc. Hence, portfolio flows to the CIS are more sensitiveto the quality of institutions rather than to a country’s creditworthiness measured byICRG financial risk index (which appeared to be insignificant). An increase in thepolitical risk index by 1% has been estimated to increase portfolio flows into the CISby USD 24.7mn on average (see Table 2).
7. Conclusions
This paper has been devoted to the analysis of the determinants of capital flowsinto the CIS countries. Taking the Tobin-Markowitz framework as a basis, we haveanalysed the impact of global, domestic, co-movement and diversification factors onthe capital flows into the region.
30
Oleksandr Lozovyi and Alina Kudina
Studies & Analyses No 354

The Russian crisis of 1998 has had the most considerable impact on portfolio flowsinto the CIS countries. It had influenced portfolio flows directly and indirectly,through its effect on other related factors. The behaviour of a number of capital flowdeterminants into the CIS changes significantly before and after the crisis of 1998. Inparticular, an important determinant of portfolio flows – the domestic interest(deposit) rate – has undergone serious changes in the aftermath of the Russianfinancial crisis. Having had a negative impact on portfolio flows into the CIS beforedefault, it has changed its impact to positive after the crisis.
Political stability is the second most important determinant of portfolio investmentinto the CIS. Apart from political risk, the employed ICRG political risk index alsoassesses the quality of institutions in a host country. Hence, the quality of institutionswas shown to shape considerably the attractiveness of the CIS region for privateinvestors.
Another interesting finding is that a growth in portfolio flows to Central andEastern European countries (which are now members of the EU) seems to have alsoenhanced capital flows to the CIS. It is likely that some investors expect the CIScountries to a have economic performances similar to the CEECs. Though thecoefficient measuring this influence is small, it is robust to the inclusion of otherexplanatory variables.
Our results also have implications for domestic economic policies in the CIScountries. As investors tend to link the actual investment with the performance of thecountry (as opposed to the pre-1998 period), the inadequate macro policies maytransmit faster into sudden capital flight in the case of bad economic policies. As wehave already mentioned, the consequences for the economy in general and thefinancial sector, in particular, may be even more pronounced than in 1998-1999.
However, there is also another, more positive side to the story. It is the fact thatinstitutional investors tend to notice positive domestic developments in the CISregion, and tend to react to them. Hence, if the CIS countries continue to grow,reform and integrate with global trading blocks, short term capital is expected to flow,thus contributing to the development of domestic financial markets. Large inflowsusually also mean that financing of the budget deficits can become cheaper over time.
From this perspective, a significant increase in capital inflows into the region isexpected in the future. If positive economic developments in the CIS region areaccompanied by lowering/abolishing the restrictions on the current account,persistent reform of domestic financial sectors and further integration with the globaleconomy, an upsurge in capital flows into the region is anticipated to be of a muchhigher magnitude.
31
DETERMINANTS OF PORTFOLIO FLOWS INTO CIS COUNTRIES
Studies & Analyses No 354

References
Brennan M. J. and Cao H. H. (1997), “International Portfolio Investments Flows,” The Journal of
Finance, Vol. 52, No. 5, 1851-1880.
Calderon C., Loayza N. and Serven L. (2003), “Do Capital Flows Respond to Risk and Return?” The
World Bank, Policy Research Working Paper, 3059.
Calvo G., Leonardo L., and Carmen M. R. (1993), “Capital Inflows and the Real Exchange Rate
Appreciation in Latin America: The Role of External Factors,” IMF Stuff Paper 40(1), 108-51.
Carlson M. and Hernandez L. (2002), “Determinants and Repercussions of the Composition of
Capital Inflows,” Board of Governors of the Federal Reserve System, International Finance
Discussion Paper 717.
Chuhan P., Claessens S., and Mamingi N. (1993), “Equity and Bonds Flows to Asia and Latin
America,” The World Bank, International Economics Department, WPS 1160.
Claessens S., Oks D., and Polastri R. (1998), “Capital Flows to Central and Eastern Europe and
Former Soviet Union,” World Bank 11/4/98.
Fedderke J. W. and Liu W. (2001), “Modelling the Determinants of Capital Flows and Capital Flight:
With the Application to South Africa data from 1960 to 1995,” ELEVIER, Economic Modelling
19, 419-444.
Fernandez-Arias E. (1994), “The new wave of Private Capital Inflows. Push or Pull?” The World
Bank, International Economics Department, Policy Research Working Paper 1312.
Fiess N. (2003), “Capital Flows, Country Risk, and Contagion”, The World Bank, Policy Research
Working Paper 2943.
Forbes K., Rigobon R. (1999), “Measuring Contagion: Conceptual and Empirical Issues,”
Preliminary Draft, NBER.
French K.R. and Poterba J. M. (1991), “International Diversification and International Equity
Markets”, The American Economic Review, Vol. 81, No. 2, pp. 222-226.
Froot K.A., O’Connell P. G., and Seasholes M. (1998), “The Portfolio Flows of International
Investors,” NBER Working Paper Series, Working Paper 6687.
Garibaldi P, Mora N., Sahay R., and Zettlemeyer J. (2001), “What Moves Capital to Transition
Economies?” IMF Stuff Papers, Vol. 48, Special Issue.
Grubel H. G. (1968), “Internationally diversified portfolios: Welfare Gaines and Capital Flows,” The
American Economic Review, Vol. 58, No. 5, 1299-1314.
Haynes E.S. (1988), “Identification of interest rates and International Capital Movements,” The
Review of Economics and Statistics, Vol. 70, No. 1, 103-111.
Hernandez L. and Rudolph H. (1995), “Sustainability of Private Capital Flows to Developing
Countries. Is Generalized Reversal Likely?” The World Bank, International Economics
Department, Policy Research Working Paper 1518.
Hernandez L., Mellado P., and Valdes R. (2001), “Determinants of Private Capital Flows in the
32
Oleksandr Lozovyi and Alina Kudina
Studies & Analyses No 354
1970s and 1990s: Is there Evidence of Contagion?” IMF Working Paper, WP/01/64.
Kouri P. J. K. and Porter M. G. (1974), “International Capital Flows and Portfolio Equilibrium,” The
Journal of Political Economy, Vol. 82, No. 3, 443-467.
Kraay A., Loayza N., Serven L., and Ventura J. (2000), “Country Portfolios,” NBER Working Paper
Series, Working Paper 7795.
Kreicher L. L. (1981), “International Portfolio Capital Flows and Real Rates of Interest,” The Review
of Economics and Statistics, Vol. 63, No. 1, 20-28.
Li, S (2005), “Why a poor governance environment does not deter foreign direct investment: The
case of China and its implications for investment protection,” Business Horizons, Vol. 48, No. 4,
297-302
Miller C. N. and Whitman M. (1970), “A Mean-Variance Analysis of United States Long-Term
Portfolio Foreign Investments,” The Quarterly Journal of Economics, Vol. 84, No. 2, 175-196.
Odedokun M. (2003), “The Pull and Push Factors in North-South Private Capital Flows,” United
Nation University, Discussion Paper No. 2003/43.
Portes R. and Rey H. (1999), “The Determinants of Cross-Border Equity Flows,” NBER Working
Paper Series, Working Paper 7336.
Siouronis G. D. (2002), “The Structure of Capital Flows under Monetary Macroeconomic Volatility:
an Empirical Analyses,” Athens University of Economics and Business, mimeo.
Taylor M. P. and Sarno L. (1997), “Capital Flows to Developing Countries: Long- and Short-Term
Determinants,” The World Bank Economic Review, Vol. 11, No. 3, pp. 451-470.
Tesar L. L., Werner I. M. (1995), “Home Bias and High Turnover”, Journal of International Money
and Finance, Vol. 14, No. 14, pp. 467-492.
33
DETERMINANTS OF PORTFOLIO FLOWS INTO CIS COUNTRIES
Studies & Analyses No 354

34
Oleksandr Lozovyi and Alina Kudina
Studies & Analyses No 354
Table 1. Description of Explanatory Variables
Variable Operationalization Data source Label
External explanatory variables
Market yield on U.S. Treasurysecurities at 3-month constant maturity, quoted on investmentbasis
Average yield over quarter, %Federal Reserve Board, Statistics:Releases and Historical Data,(www.federalreserve.org)
US T-bills yield
Yield on US stock market index,S&P 500
Yield on S&P 500 overthe quarter, % http://finance.yahoo.com S&P 500 yield
Yield on Emerging MarketsPrice Index
Average yield on MSCI EM PriceIndex over quarter, %
MSCI Barra,(http://www.mscibarra.com) EM Prices index
US Real GDP growthUS GDP percent change basedon chained 2000 dollars (seasonallyadjusted growth rates), %
Bureau of Economic Analysis,(http://www.bea.gov) US GDP growth
Portfolio flows to CEECPortfolio investment liabilitiesto CEEC, million USD IFS
Portfolio flowsto CEEC
Domestic explanatory variables
Domestic interest rate paidon deposit
Quarterly deposit rate, % IFSDomesticdeposit rate
Appreciation/Depreciationof the domestic exchangerate against US dollar
Quarterly decline/growthof exchange rate againstUS dollar, %
IFS/Authors calculationsExchangerate changes
Political Risk IndexAverage index values over quarter,points
International Country Risk Guide Political risk
Financial Risk IndexAverage index values over quarter,points International Country Risk Guide Financial Risk
Domestic GDP growth rate GDP growth rate, % IFS/Authors calculationsDomestic GDPgrowth
Relative size of economyRatio of domestic GDP to GDPof all CIS countries, % IFS/Authors calculations Ratio of GDP
Dummy to account for Russiandefault effect
Dummy takes value zero beforedefault and one afterwards
Russian defaultdummy

35
DETERMINANTS OF PORTFOLIO FLOWS INTO CIS COUNTRIES
Studies & Analyses No 354
*** - significant at 1% level** - significant at 5% level* - significant at 10% levelvalues in the brackets show standard errors
Table 2. The Determinants of Portfolio Flows into the CIS: Estimation Results
VariableGeneral
Specification
With dummy
for Russian default
Group of larger
countries
Group of smaller
countries
Constant -2282.9**
*(720.9)
-213.9(770.9)
11314(1380.1)
-40.7***(13.7)
US T-bills yield 52.6(54.5)
58.0(48.5)
106.7(87.9)
0.5(0.8)
S&P 500 yield 44.1***
(14.6) 24.2***
(8.8)38.0***(14.7)
0.08(0.1)
EM Price Index -19.4**
(9.5)- - -
Domestic deposit rate 16.5*(9.1)
1.5(8.9)
-28.9*(16.7)
0.5**(0.2)
Exchange rate changes-3.3(8.9)
1.7(8.3)
-20.3*(11.2) -
Political risk 28.1***
(10.4) 24.7***
(9.6)20.9
(17.8)0.3
(0.2)
Financial risk - - - 0.9***
(0.3)
Ratio of GDP 11.6***
(2.5) 6.3**
(2.5)-
-2.4*(1.2)
Portfolio flows to CEEC 0.05*(0.03)
0.07**(0.03)
0.1**(0.05)
-
US GDP growth-3.5
(38.6)-37.836.2 - -
Domestic GDP growth10.2
(13.9)14.9
(12.9) - -
Russian default dummy - -1686.2***
(303.4) -2725.5***
(477.7)-18.2*(9.4)
R2 0.22 0.32 0.39 0.14P-value for Wald testfor joint significance 0.00 0.01 0.00 0.04

36
Oleksandr Lozovyi and Alina Kudina
Studies & Analyses No 354
*** - significant at 1% level** - significant at 5% level* - significant at 10% levelvalues in the brackets show standard errors
Table 3. Testing stability of the influence of explanatory variables over time
Variable
Testing the stability
of influence
of GDP growth
Testing stability
of influence
of deposit rate
Testing stability
of world
interest rate
Testing stability
of yield
on SP500
Constant52.5
(764.6)797.0
(802.9)-57988***(13050.6)
747.8(698.0)
US T-bills rate48.1
(47.8)14.7
(48.7)11532.4***
(2588.3)21.9
(43.3)
S&P 500 rate18.3**(8.9)
24.5***(8.6)
12.5(8.8)
209.7***(28.1)
Domestic deposit rate-2.2(8.9)
-33.8**(13.4)
-6.8(8.7)
-8.4(8.1)
Exchange rate changes-1.2(8.3)
1.6(8.1)
0.9(7.9)
1.9(7.4)
Political risk 28.1***
(9.6)24.6***
(9.3) 15.5*
(9.4)11.7(8.7)
Ratio of GDP 6.1**
(2.5)9.7***(2.7)
3.1(2.5)
2.1(2.3)
Portfolio flows to CEEC 0.06**
(0.03)0.08***(0.03)
0.07**(0.03)
0.05**(0.03)
US GDP growth-27.9(35.8)
-38.7(35.1)
-17.4(34.6)
-12.8(32.3)
Domestic GDP growth65.4***(23.0)
21.5*(12.7)
6.1(12.5)
4.3(11.6)
Russian default dummy -2084.7***
(334.4) -3028.9***
(487.9) 56867.7***
(13209.1) -1551.8***
(269.8)Domestic GDP growthafter the crisis of 1998
-61.6***(23.4) - - -
Deposit rate afterthe crisis of 1998 -
63.7***(18.5) - -
World interest rateafter the crisis of 1998 - -
-14496.8***(2592.9) -
Yield on SP500after crisis of 1998
- - - -204.7***
(29.8)R2 0.35 0.37 0.39 0.47P-value for Wald testfor joint significance 0.00 0.00 0.00 0.00

37
DETERMINANTS OF PORTFOLIO FLOWS INTO CIS COUNTRIES
Studies & Analyses No 354
*** - significant at 1% level** - significant at 5% level* - significant at 10% levelvalues in the brackets show standard errors
Table 4. Testing stability of the influence of explanatory variables, cont.
VariableTesting stability of influence
of political risk
Testing stability of influence
of portfolio flows to CEEC
Constant-2007.7(1278.6)
-211.9(769.2)
US T-bills yield48.0
(48.5)48.1
(48.9)
S&P 500 yield22.8**(8.8)
21.0**(9.1)
Domestic deposit rate1.6
(8.9)2.3
(8.9)
Exchange rate changes3.0
(8.3)1.3
(8.3)
Political risk 56.3*(20.5)
23.4**(9.7)
Ratio of GDP 5.5**
(2.6) 6.2**
(2.5)
Portfolio flows to CEEC 0.07**
(0.03)0.4
(0.25)
US GDP growth-36.3(35.9)
-30.6(36.5)
Domestic GDP growth17.7
(13.0)13.0
(13.0)
Russian default dummy741.2
(1417.5)1598.6(309.6)
Political risk after the crisisof 1998
-41.3***(23.6) -
Portfolio flows to CEECof the crisis of 1998 -
-0.3(0.25)
R2 0.33 0.32
P-value for Wald test forjoint significance 0.00 0.00

38
Oleksandr Lozovyi and Alina Kudina
Studies & Analyses No 354
Appendix 1. Overview of Empirical Research on the Determinants of Portfolio Capital Flows
Study ModelDependent
VariablesIndependent Variables
Other independent
Variables
GordonandGupta(2003)
Portfolioallocationchoice.OLSestimates
Monthly ForeignInstitutionalInvestors equityflows in millionsof US dollarsand as a %of marketcapitalizationon the BSE
Global: 12 month % change in industrial production; mom %yield in NASDAQ, SP, DOW; 3 month LIBOR in USD, FederalFund Rate, Treasury bill rate. Regional; mom % change in MorganStanley Cap International (MSCI) emerging market index; dummyfor currency crises; industrial production growth in emergingmarkets. Domestic: 12 month % change, mom % yield in BSEindex; mom % change in exchange rate with respect to USD;sovereign credits ratings; dummies to capture political events,turnover at BSE/marcup.
Varianceand covariancereturns on the BSE,the NASDAQand the MSCIemerging marketindex, dummiesfor seasonal effects
Garibaldiet al.(2001)
OLS;Wide rangeof possibleexplanatoryvariables
Inward portfolioinvestmentsper capitaand per GDP
General to all flows: Natural log of average Inflation; fiscal balanceas a percent of GDP; lagged growth; pre-announced exchange rateregime dummy; multiple exchange rates; liberalization index fromDe Melo et al (1997); institutional quality indices from WDR.Specific to PI: security market index; PI restriction index;real Treasury bill rate; external debt per capita; international reserves per capita; ratio of short-term debt to total.
differentdummies
Claessenset al.(1998)
Fixedeffectmodel
Private capitalflows
Push factors: US dollar 6-month LIBOR interest rate; economicgrowth in OECD countries. Pull factors: liberalization index fromDe Melo et al. (1997) to account for reform efforts; GDP growthrates; inflation; fiscal balance; private savings; change in countriesreserves as an indicator for creditworthiness; nominal domesticinterest rate minus the rate of change in the local exchange rateminus US interest rate; domestic credit growth.
Dummies
Hernandezet al.(2001)
Panelregression
Privatecapital flows
Push factors: real ex-post international interest rate (US dollar3-month LIBOR minus the US CPI 3 month inflation); net privatecap flows available to all developing countries minus the flowsreceived by country j as a share of GDP of major industrialcountries; economic activity (GDP) in industrial countries.Domestic variables: real GDP growth; public sector balanceas a share of GDP; gross domestic investment as a share of GDP;total export as a share of GDP; foreign debt service as a shareof GDP; growth in banking sector nominal credit; real exchangerate appreciation during past year.
To test contagioneffect: inflation;CA balance;the stock of int.reserves; the stockof foreign debt,total export;similarity index
Chuhanet al.(1993)
Paneldataapproach
Gross bond flows;Net equity flows
Global factors: US i-rates; US industrial activity. Country-specificfactors: secondary market price of a countries debt; the country'scredit rating; the price-earning ratio; the return on domestic stockmarket; black market premium; first principal components.
Ahmedet al.(2005)
Dynamicpanel usingGMM
Ratio of portfolioflows to GDP
Domestic variables: lagged GDP per capita growth; index of lawand order from International Country Risk Guide; ratio of importsand exports to GDP; annual standard deviation of monthly changesin the real effective exchange rate; inflation volatility; three proxiesfor capital account controls from IMF's AREAER; # of telephonesper 1000 people; fuel export receipts as a % of export; domesticcredit to the private sector and domestic stock marketcapitalization as a % of GDP. Global factors: real short-termand long term US i-rates.
Lagged capitalinflow as a %of GDP to captureagglomeration effect
Fernandez-Arias(1994)
Fixed-effectmodel
Portfolio flowsboth equityand bonds
External returns were proxied by annualized 10-year US bondnominal yields; the countries capacity to pay index was proxied bythe debt secondary market price; stock of portfolio liabilitiesproxied by accumulating portfolio flows after 1988; the domesticinvestment climate parameter is indirectly measured as a residual.
All the variablesare expressedas deviationsfrom their 1989average level
HernandezandRudolph(1995)
Panel datafor1986-1993;A stock-adjustmentmodel
Total long-termprivate flowsas a ratio of GDP
Domestic variables: two year moving average of gross domesticinvestment as a ratio of GNP; two year moving averageof aggregate private consumption as a ratio of GNP; total externaldebt minus stock of international reserves as a ratio of GNP; totalstock of foreign liabilities; volatility of the real effective exchangerate; real export growth. Global: US i-rates (US three yeargovernment bond yield, twelve month US treasury bond rate,first principal component of five interest ratesand the US production index)
One lag ofthe dependentvariable
DasguptaandRatha(2000)
Time series;Panel dataestimation;Two stageprocessof investingint.
Factors specific to developing countries: real i-rate; lagged dep.Variable; GDP growth in developing countries; world GDP growthrate; dummy for financial crisis. Pull variables: creditworthinessindicator such as CA balance with one year lag; per capita income;three year MA of GDP growth rate; private net non-FDI flowsto all developing countries; net FDI as a % of GDP.
Regionaldummies;inflationand exchangerate appreciation;WB lendingcommitments
Calderonet al.(2003)
Dynamicpanelestimationprocedure(pooledmean groupestimatordevelopedby Pesaran,1999)
NFA positionnormalizedby wealth
Expected return proxied by composite index (real per capita GDPgrowth, inverse of black market premium, liquid liabilities to GDP,real imports plus exports to GDP, indices of governance, negativeof government consumption to FDP, population size) and alsoperceived risk measured by composite index (standard deviationof real per capita GDP growth, ratio of external debt to debt plusequity external liabilities, average and standard deviationof inflation, standard deviation of RER standard deviation of TT,standard deviation of import plus export to GDP, negatives of indices of governance, negative of quasi-liquid liabilities to GDP).
Co-movementwas measuredas correlationof the relevantreturn index in a countryand the restof the world

39
DETERMINANTS OF PORTFOLIO FLOWS INTO CIS COUNTRIES
Studies & Analyses No 354
Appendix 1. cd. Overview of Empirical Research on the Determinants of Portfolio Capital Flows
Study ModelDependent
VariablesIndependent Variables
Other independent
Variables
Calderonet al.(2003)
Dynamicpanelestimationprocedure(pooledmean groupestimatordevelopedby Pesaran,1999)
NFA positionnormalizedby wealth
Expected return based on real per capita GDP growthand perceived risk as standard deviation of real per capita GDPgrowth. Expected return as real stock market return and perceivedrisk as standard deviation of real stock market return.
Co-movementwas measuredas correlationof the relevantreturn index in a countryand the restof the world
TaylorandSarno(1997)
Errorcorrectionmodels
Monthly net USequity flows;Data the sameas in Chuhanet al (1993)
Country-specific: country credit rating; black market exchangerate premium. Global: treasury bill rate and government bondyield; level of real US industrial production
FedderkeandLiu(2001)
ARDL errorcorrectionversion
Four differentmeasures of capflows in annualform
Rate of return variables: exchange rate adjusted interestdifferentials; % change of GDP. Risk variables:over/undervaluation of the exchange rate in term of PPP, politicalrights index, political instability index.
Dummies
Fiess(2003)
Multivariatecointegration analysis
Cap flows datacomprisesmonthly recordsof bond, equityand syndicatedloan flows
Global factors: US long-term interest rates; first principalcomponent. Pull factors: residual from a regression of the countryEMBI component on the first principal component; ratio of totalpublic debt to GDP; primary balance to GDP ratio.
Alfaroet al.(2005)
Cross-countryregressions
Inflows of totalequity investmentsper capita
Domestic variables: years of total schooling in total population;International Country Risk Guide (ICRG) political safety variablesas a measure of institutional quality; distance using GDP sharesas weights; inflation volatility; capital controls; sovereign risk;corporate tax; share of credit provided by deposit money banks
Kim(2000)
Structuraldecompositionanalysis
Balance on capitaland currentaccounts
Domestic variable: terms of trade; domestic income; real exchangerate; real money supply; domestic price level. External factors:foreign income; foreign interest rate.
BekaertandHarvey(1998)
Net US equityflows
1) Cost of capital, correlation with world market return, volatility;2) Asset concentration ratios, market size and liquidity; 3) foreignexchange volatility, real exchange rate, real GDP per capita,inflation, interest rate, size of trade sector, fiscal deficit;4) Country risk.
CarlsonandHernandez(2002)
Panel dataregressionwith fixedeffects; SUR
Portfolio equityinvestment
Economic Fundamentals: GDP; GDP deflator; stock of international reserves; inflation rate; exchange rate; stockof domestic credit to Central Bank; interest rate paid on deposits;LIBOR; real exchange rate appreciation; yield on governmentUS bonds; growth rate of real GDP in USA, ratio of reserves to M2;expansion of bank credit;
Odedokun(2003)
Panelregressionwith fixedeffects
Total portfoli capital flowsas a fractionof GDP
Variables expressed for the source country, all developingcountries and destination country of cap flows: Per capita income;interest rate; economic growth; phase of economic cycle; openness
in the BOP cap account; inflation rate and monetary growth;private debt to GDP ratio; public debt to GDP ratio.

40
Oleksandr Lozovyi and Alina Kudina
Studies & Analyses No 354
Appendix 2. Sample Statistics
Valid N Mean Minimum Maximum Std.Dev.
Portfolio Investment Liabilities, million USD
Armenia 42 0.348 -12.120 9.130 3.058Belarus 42 0.662 -58.900 53.900 17.762Kazakhstan 42 79.142 -108.843 703.501 160.287Kyrgyzstan 42 4.695 -11.206 101.000 22.020Moldova 42 -2.174 -39.670 15.670 8.195Russia 42 481.045 -11426.100 8061.940 2952.543Ukraine 42 28.881 -825.000 1347.000 471.356 Portfolio Investment Liabilities as a Ratio of GDP, %
Armenia 42 0.076 -2.457 1.533 0.613Belarus 42 0.043 -2.079 2.516 0.599Kazakhstan 42 0.750 -1.665 6.513 1.756Kyrgyzstan 42 -0.031 -2.364 2.288 0.682Moldova 41 -0.594 -13.508 3.786 2.458Russia 42 0.191 -18.013 8.705 3.714Ukraine 42 -0.210 -7.229 8.118 3.635 Global Explanatory Variables, %
Yield on USTreasure securities 42 3.724 0.930 6.200 1.755
Yield on SP500 42 2.092 -17.634 20.867 8.509US GDP growth 42 3.310 -1.400 7.500 2.069Portfolio flowsto CEEC
39 1907.829 -1063.348 9790.267 2625.735
Domestic Deposit Interest Rate, %
Armenia 42 16.535 4.526 42.867 10.095Belarus 42 21.705 7.600 49.900 10.862Kazakhstan 39 11.959 5.400 31.900 6.067Kyrgyzstan 42 15.289 3.780 39.590 12.376Moldova 41 17.581 9.920 28.767 5.832Russia 42 12.680 3.367 61.700 15.276Ukraine 42 14.724 6.574 48.700 8.868 Exchange Rate Changes
Armenia 42 0.238 -5.939 7.959 2.829Belarus 42 15.623 -0.623 138.662 28.329Kazakhstan 42 1.796 -6.093 40.397 6.771Kyrgyzstan 42 3.433 -6.231 31.737 8.094Moldova 42 2.885 -7.466 51.134 9.183Russia 42 5.232 -3.853 90.543 16.212Ukraine 42 2.782 -4.219 45.326 8.017 Political Risk Index, points
Armenia 32 58.380 54.000 61.000 2.044Belarus 33 61.000 56.667 65.000 2.460Kazakhstan 31 70.720 68.000 74.500 1.613Kyrgyzstan 0 Moldova 31 65.468 55.333 69.000 3.521Russia 42 61.373 42.667 68.833 6.672Ukraine 33 62.227 56.167 69.000 4.254

41
DETERMINANTS OF PORTFOLIO FLOWS INTO CIS COUNTRIES
Studies & Analyses No 354
Appendix 2. cd. Sample Statistics
Valid N Mean Minimum Maximum Std.Dev.
Financial Risk Index, points
Armenia 33 31.616 9.833 39.500 6.965Belarus 33 34.828 28.500 40.500 4.129Kazakhstan 31 37.016 28.000 40.000 2.684 Valid N Mean Minimum Maximum Std.Dev.Kyrgyzstan 0 Moldova 31 29.667 20.000 36.500 5.037Russia 42 37.548 23.167 47.000 5.847Ukraine 33 36.859 25.833 42.000 4.919 Ratio of country GDP to total GDP of CIS, %
Armenia 42 0.519 0.182 1.271 0.229Belarus 42 3.109 2.130 4.275 0.416Kazakhstan 42 5.769 3.695 10.429 1.306Kyrgyzstan 42 0.372 0.179 0.742 0.127Moldova 41 0.436 0.261 2.347 0.324Russia 42 79.812 66.956 84.879 3.358Ukraine 42 9.993 7.729 15.621 1.748

42
Oleksandr Lozovyi and Alina Kudina
Studies & Analyses No 354
Ap
pen
dix
3.
Corr
elati
on
matr
ix
Port
foli
o
flow
s as
rati
o t
o G
DP
US
T-b
ills
yie
ld
S&
P 5
00
yie
ld
EM
Pri
ce
Ind
ex
Dom
est
ic
dep
osi
t
rate
Exch
an
ge
rate
ch
an
ges
Poli
tical
risk
Fin
an
cia
l
risk
Port
foli
o
flow
s
to C
EE
C
Rati
o
of
GD
P
Dom
est
ic
GD
P
gro
wth
US
GD
P
gro
wth
Por
tfol
iofl
ows
as r
atio
to G
DP
1.00
00
US
T-b
ills
yie
ld0.
0150
1.00
00S
&P
500
yie
ld0.
0615
-0.0
556
1.00
00E
M P
rice
Ind
ex0.
0403
-0.2
716
0.79
141.
0000
Dom
esti
cde
posi
t ra
te-0
.027
90.
4851
0.05
92-0
.055
21.
0000
Exc
han
ge r
ate
chan
ges
-0.1
660
0.28
860.
1726
0.09
040.
3202
1.00
00
Pol
itic
alri
sk
0.31
16-0
.268
4-0
.025
10.
0856
-0.1
939
-0.1
305
1.00
00
Fin
anci
al r
isk
0.24
11-0
.420
4-0
.122
80.
0133
-0.4
357
-0.3
086
0.43
651.
0000
Por
tfol
io fl
ows
to C
EE
C0.
1516
-0.3
606
-0.0
111
0.05
83-0
.351
3-0
.157
80.
1633
0.37
091.
0000
Rat
io o
f G
DP
0.18
810.
1063
0.06
43-0
.031
1-0
.068
0-0
.008
2-0
.047
60.
2914
-0.0
786
1.00
00D
omes
tic
GD
Pgr
owth
0.20
31-0
.343
1-0
.263
1-0
.158
3-0
.389
0-0
.871
50.
1478
0.36
060.
1846
-0.0
319
1.00
00
US
GD
P g
row
th0.
0768
0.05
230.
3876
0.33
210.
0964
0.11
18-0
.050
7-0
.158
4-0
.012
50.
0891
-0.1
280
1.00
00


![Oxidation of the cis,cis-[Ru(bpy)2(OH2)]2O “Blue Dimer”](https://img.dokumen.tips/doc/110x75/6318e3970255356abc080990/oxidation-of-the-ciscis-rubpy2oh22o-blue-dimer.jpg)


