Embed Size (px)
Citation preview

RESEARCH ARTICLE
Detection of Cerebral Hemorrhage in Rabbitsby Time-Difference Magnetic InductivePhase Shift SpectroscopyWencai Pan1‡, Qingguang Yan1,2‡, Mingxin Qin1*, Gui Jin1, Jian Sun1, Xu Ning1,Wei Zhuang1, Bin Peng3, Gen Li3
1 College of Biomedical Engineering, Third Military Medical University, Chongqing, China, 2 State KeyLaboratory of Trauma, Burns and Combined Injury, Daping Hospital, Surgery Institute of the Third MilitaryMedical University, Chongqing, China, 3 Department of Biomedical Engineering, Chongqing University,Chongqing, China
‡ These authors are co-first authors.* [email protected]
AbstractCerebral hemorrhage, a difficult issue in clinical practice, is often detected and studied with
computed tomography (CT), magnetic resonance imaging (MRI), and positron emission to-
mography (PET). However, these expensive devices are not readily available in economi-
cally underdeveloped regions, and hence are unable to provide bedside and emergency
on-site monitoring. The magnetic inductive phase shift (MIPS) is an emerging technology
that may become a new tool to detect cerebral hemorrhage and to serve as an inexpensive
partial substitute to medical imaging. In order to study a wider band of cerebral hemorrhage
MIPS and to provide more useful information for measuring cerebral hemorrhage, we estab-
lished a cerebral hemorrhage magnetic induction phase shift spectroscopy (MIPSS) detec-
tion system. Thirteen rabbits with five cerebral hemorrhage states were studied using a
single coil-coil within a 1 MHz-200 MHz frequency range in linear sweep. A feature band
(FB) with the highest detection sensitivity and the greatest stability was selected for further
analysis and processing. In addition, a maximum conductivity cerebrospinal fluid (CSF)
MRI was performed to verify and interpret the MIPSS result. The average phase shift
change induced by a 3 ml injection of autologous blood under FB was -7.7503° ± 1.4204°,
which was considerably larger than our previous work. Data analysis with a non-parametric
statistical Friedman M test showed that in the FB, MIPSS could distinguish the five states of
cerebral hemorrhage in rabbits, with a statistical significance of p<0.05. A B-F distribution
profile was designed according to the MIPSS under FB that can provide instantaneous diag-
nostic information about the cerebral hemorrhage severity from a single set of measure-
ments. The results illustrate that the MIPSS detection method is able to provide a new
possibility for real-time monitoring and diagnosis of the severity of cerebral hemorrhage.
PLOS ONE | DOI:10.1371/journal.pone.0128127 May 22, 2015 1 / 14
OPEN ACCESS
Citation: Pan W, Yan Q, Qin M, Jin G, Sun J, Ning X,et al. (2015) Detection of Cerebral Hemorrhage inRabbits by Time-Difference Magnetic InductivePhase Shift Spectroscopy. PLoS ONE 10(5):e0128127. doi:10.1371/journal.pone.0128127
Academic Editor: Marc Dhenain, CNRS, FRANCE
Received: October 14, 2014
Accepted: April 22, 2015
Published: May 22, 2015
Copyright: © 2015 Pan et al. This is an open accessarticle distributed under the terms of the CreativeCommons Attribution License, which permitsunrestricted use, distribution, and reproduction in anymedium, provided the original author and source arecredited.
Data Availability Statement: All relevant data arewithin the paper.
Funding: This work was supported by the NationalNatural Science Foundation of China (61372065), theScience and Technology Research Projects ofChongqing (cstc2012gg-yyjs10013) and theFoundation of the Third Military Medical University.The funders had no role in study design, datacollection and analysis, decision to publish, orpreparation of the manuscript.
Competing Interests: The authors have declaredthat no competing interests exist.
IntroductionCerebral hemorrhage is the second-largest cause of strokes, accounting for 10 to 15 percent ofall stroke patients [1]. It is accompanied by high incidence, high morbidity, high mortality andheavy economic burden. Van et al. reported that the overall incidence of cerebral hemorrhagewas 24.6 per 100,000 from 1980 to 2008, and that the incidence increases with age [2]. Cerebralhemorrhage poses a serious threat to human health and life, including primary and secondarybrain damage [1]. Nerve injury, caused by hematoma proliferation, is mainly associated withhematoma-induced physical injury at 0–4 h after cerebral hemorrhage [3]. Therefore, real-timemonitoring and assessment of the severity and developmental course of cerebral hemorrhage isa key to its treatment.
Currently, many detection methods are used to measure intracranial hemorrhage, includingdirect measurement of intracranial pressure (ICP) [4], computer tomography (CT), positronemission tomography (PET) and magnetic resonance imaging (MRI) [5]. In the ICP monitor-ing method, the sensor is inserted into the brain, which may cause injury and infection. TheCT, PET and MRI and other imaging methods have the shortcomings of large size and the in-ability to provide bedside and emergency on-site monitoring. Moreover, these devices are veryexpensive, thus limiting their use in economically underdeveloped regions.
The Magnetic Induction Phase Shift (MIPS), which is based upon detecting characteristicparameters such as the conductivity of diseased tissue, is non-contact, non-invasive, inexpen-sive, small and able to maintain continuous bedside monitoring, and is a new method for de-tecting cerebral hemorrhage [6–10]. There are two kinds of difference techniques in MIPSresearch—the time-difference method and the frequency-difference method. The time-differ-ence method is used to detect the phase shift differences between before and after a simulatedlesion occurs, and can be used for monitoring purposes [9, 11, 12]. The frequency-differencemethod is self-referencing and can be performed in a short time, providing instantaneous in-formation of cerebral hemorrhage [13].
When a traditional single excitation coil and a single receiving coil (single coil—coil) is usedto detect cerebral hemorrhage, the magnetic field sensed by the receiving coil can be dividedinto three parts: the primary field generated by excitation source, the perturbation field gener-ated by other brain tissues, and the perturbation field of interest generated by the bleeding orischemic infarction sites. Since the conductivity of the biological tissue is very small (σ< 3 s/m), the magnetic field disturbance generated by the brain tissues is very weak (for example, theperturbation field accounts for only 1% of the main magnetic field at the frequency of 10 MHz[6, 14]). Moreover, the target field accounts for a small proportion of the entire perturbationmagnetic field. Therefore, the signal of interest is extremely weak. In order to improve the mea-surement sensitivity, both the primary field and the perturbation field generated by other braintissues must be canceled.
In our previous work, we conducted simulation studies on magnetic induction tomography(MIT) measurement system [15], designed a new type excitation source, implemented the opti-mal excitation coil for MIT [16], adopted the MIPS method for detecting normal and edemanerve cells [17], carried out experimental study on simulated cerebral edema and cerebral hem-orrhage detection with MIPS [18–19], and detected the MIPS of cerebral hemorrhage in rabbits[20]. These works demonstrated the feasibility of detecting cerebral hemorrhage with the MIPSmethod. However, the detection sensitivity of cerebral hemorrhage was very limited. For betterdetection results, we re-established a new magnetic induction phase detection system, whichcould achieve phase noise as low as 6 m° and a 4-hour phase drift as low as 30 m° at 21.4 MHz[21], and studied the MIPS of cerebral hemorrhage in rabbits with a single coil-coil [22]. Fur-thermore, we designed a symmetric cancellation-type sensor detection system based on the
Detection of Cerebral Hemorrhage
PLOS ONE | DOI:10.1371/journal.pone.0128127 May 22, 2015 2 / 14

symmetry between the two brain hemispheres so as to offset the interference of the primaryfield and the perturbation field generated by other brain tissues [23]. Notwithstanding someimprovement in detection sensitivity, we were unable to achieve a desired result.
In the previous work (our team and other teams), we found that the excitation signals usedwere a single or a limited number of frequencies. Thus, we were unable to learn the MIPS infor-mation of other frequencies and could not select the frequency band with an optimal sensitivityfor the experimental analysis. In order to study a wider band of cerebral hemorrhage MIPS, weestablished a cerebral hemorrhage magnetic induction phase shift spectroscopy (MIPSS) detec-tion system. Thirteen rabbits with five cerebral hemorrhage states were studied by a single coil-coil within a 1 MHz-200 MHz frequency range in linear sweep. A feature band (FB) with anoptimal detection sensitivity and stability within the entire band was determined. Then thedata of MIPSS of five cerebral hemorrhage states under FB were analyzed. The results showedthat the MIPSS of cerebral hemorrhage under FB has high detection sensitivity, thus providingthe condition for subsequent data processing.
Materials and Methods
1. Detection PrincipleGriffiths et al. reported that the sinusoidal excitation signal (Iejωt) emits the sinusoidal alternat-ing main magnetic field by the excitation coil (B). The main magnetic field introduced an in-duction current into the brain tissue, and the current caused a perturbation in the magneticfield (ΔB). The induction coil then received the magnetic field (B + ΔB), which was obtainedby adding the main magnetic field to the perturbation magnetic field [6–7]. The phase shift dif-ference (Δθ) was produced between the received signal and the excitation signal. The size of thephase shift difference was associated with the brain tissue conductivity and the frequency ofthe excitation signal.
An equivalent circuit diagram of the magnetic induction detection for cerebral hemorrhagein rabbits is shown in Fig 1B. The phase shift difference Δθ caused by brain lesions was ob-tained by subtracting the phase shift of the induction coil signal from the phase shift of the ex-citation coil signal. Its formula was as follows:
Dy ¼ yind � yexc ð1ÞThis study represented a relative phase shift difference which was obtained by subtracting
Fig 1. Photograph of experimental setup (A) and equivalent circuit (B) of cerebral hemorrhagemagnetic induction detection system. The equivalent circuit is an inductive coupling of two RL serieselements by a conductive ellipsoid media. Zg represents source impedance. ZL represents transmission lineimpedance. Zexc (Zind) represents coil impedance which is composited by the resistance Rexc (Rind) andthe inductance Xexc (Xind).
doi:10.1371/journal.pone.0128127.g001
Detection of Cerebral Hemorrhage
PLOS ONE | DOI:10.1371/journal.pone.0128127 May 22, 2015 3 / 14
the phase shift induced by injecting different volumes of autoblood into the rabbits’ head fromthe baseline phase shift.
2. Experimental SystemThe cerebral hemorrhage magnetic induction detection system, shown in Fig 1A, was com-posed of two modules: a RF vector network analyzer (Agilent E5061A), and a two-coil structurecontaining a rabbit model of cerebral hemorrhage.
In this study, the RF vector network analyzer, a two-port network, was used to measure theamplitude and phase between the excitation coil signal and the induction coil signal. The sig-nals generated by the excitation coil (port 1) were sent to the induction coil (port 2). Duringthe transmission process, they were expressed as transmission parameters S21. Hence thetransmission parameters S21were the channel required for measurement. The vector networkanalyzer was set to simultaneously measure the amplitude and phase information of the trans-mission parameters S21. The output power of the signal source was 10 dBm. The excitation sig-nal frequency ranged from 1 MHz to 200 MHz, and its work mode was set as a linear scanningrun mode.
The coils were composed of the excitation coil and the induction coil, with radii R1 = R2 =5.2 cm. The two coils were twisted with a 1 mm-diameter copper wire in a special plexiglassmold, with N1 = N2 = 10. The two coils were symmetrical, and were placed in parallel, with dis-tance of d = 10.5 cm. A rabbit’s head was placed in the lower middle of the two coils. The twocoils were connected to a vector network analyzer by a high-frequency coaxial line.
The anesthetized rabbit was fixed on a non-magnetic material table. A 20 ml plastic syringecontaining 4 ml of fresh autologous blood was connected to the rabbit brain with a catheter.The injection rate was controlled by using an electronic syringe pump. A thermometer and hy-grometer were used for real time display of the temperature and humidity. An intracranialpressure monitor (CAMINOMPM-1, INTERGRA, USA) was used to measure the ICP of therabbits. A multi-channel physiological signal acquisition instrument (RM6280C, Chengdu In-strument Factory, China) was used to continuously monitor the rabbit’s ECG and heart ratevariability (HRV).
3. Experimental Design3.1. Cerebral hemorrhage model in rabbits. Thirteen rabbits (2.3 ± 0.2 kg) in the MIPSS
measurement group and five rabbits (2.2 ± 0.2 kg) in the MRI measurement group were ob-tained from DaPing Hospital, ChongQing, China. They received humane care from a properlytrained professional in compliance with the Management Regulations for Laboratory Animals,formulated and published by the State Scientific and Technological Commission of China. TheAnimal Experiments and Ethics Committee of Third Military Medical University approved allexperimental protocols, and care of the animals was carried out in accordance with the Decla-ration of Helsinki and IASP guidelines [24, 25].
The rabbit cerebral hemorrhage model was established by the autologous blood injectionmethod [26]. The model started with anesthetization via ear injection of urethane (25%, 5 ml/kg). A total of 4 ml blood was extracted from the femoral vein, after which a stereotaxic instru-ment (ZH-LanXingD, HuaibeiZhenghua Bio Equipment Co., Ltd., China) was used to performcranial drilling. The brain “cross stitch” intersection was set as the starting point, and a punc-ture needle point was inserted 6 mm to the right of the coronal suture, 1mm posterior to thesagittal suture (Fig 2). A needle tube with a diameter of 0.7 mm was inserted into the brain to adepth of 13 mm. Dental cement was used to seal the crack between the needle tube and cranialhole to prevent the injected blood flowing along the needle.
Detection of Cerebral Hemorrhage
PLOS ONE | DOI:10.1371/journal.pone.0128127 May 22, 2015 4 / 14

Different states of brain hemorrhage were simulated by controlling the amount of blood(step-wise increments of 1ml blood were injected at the rate of 0.5 ml / min). The rabbitcerebral hemorrhage model simulated five states: pre-operative condition, 0 ml of cerebralhemorrhage, 1 ml of cerebral hemorrhage, 2 ml of cerebral hemorrhage and 3 ml of cerebralhemorrhage.
3.2. MIPSS measurements. First, the MIPSS of the healthy rabbit under anesthesia wasmeasured before the cranial drilling surgery. Next, the MIPSS of the four model states (includ-ing 0 ml, 1 ml, 2 ml, 3 ml) were measured after cranial drilling surgery. The state of 0 ml includ-ed two measurement sections (post-operative phase shift baseline section and 0 ml phase shiftmeasurement section). The states of 1 ml, 2 ml, and 3 ml executed one measurement section,respectively. A section took 5 min 22 sto complete 20 measurements. The average value of the20 measurements was taken as the phase shift.
During the measurement process, the rabbits’ heads and the locations of the two coils werestationary. The temperature was controlled to within 22°C–24°C, and the humidity around50%. Since rabbits may exhibit other reactions following cranial drilling surgery, we performedthe measurement as soon as possible after surgery. After completion of the MIPSS measure-ments, 1 ml of 1.5 mol/L KCL solution was injected via ear vein to euthanize the rabbits.
3.3. MR images of cerebrospinal fluid. The maximum conductivity of the cerebrospinalfluid (CSF) was 1.7 times the conductivity of the blood, 4 times that of the gray matter, and 7times that of the white matter at frequency of 65.5647 MHz (see Table 1). Hence we think thatthe CSF parameters which changed during cerebral hemorrhage had the greatest effect on theparameters. In order to better verify and explain the results, MR imaging of the rabbit head wasperformed, which showed the changes in the CSF of the five cerebral hemorrhage states. Thesteps of MRI measurements are same with the steps of MIPSS measurements, and using thesame approach to euthanize rabbits after the experiment was completed.
Table 1. Electricalconductivity of brain tissues at frequency of 65.5647 MHza.
Tissue name Conductivity[S/m]
Cerebrospinal Fluid 2.0687
Blood 1.2083
Brain Grey Matter 0.5139
Brain White Matter 0.2936
aThe data refer to Italian National Research Council Institute for Applied Physics, Calculation of the
Dielectric Properties of Body Tissues in the frequency range 10 Hz-100GHz.
doi:10.1371/journal.pone.0128127.t001
Fig 2. Determining position of drilling hole with stereotaxic instrument(A). Schematic of drill hole(B).
doi:10.1371/journal.pone.0128127.g002
Detection of Cerebral Hemorrhage
PLOS ONE | DOI:10.1371/journal.pone.0128127 May 22, 2015 5 / 14
CSF MRI was performed using a 3.0T MRI scanner (Magnetom Spectra with A Tim + DotSystem, Siemens, Germany) and an extremity 18 knee coil in Southwest Hospital, Chongqing,China. CSF MR images acquisition utilized SPACE (Sampling Perfection with Application op-timized Contrast using different flip-angle Evolution) sequence. SPACE was T2-weightedturbo-spin-echo sequence, which can be clearly distinguished CSF from the surrounding tissue.MRI scanner parameters were set as follows: TR = 1300 ms, ETL = 49, TE = 44 ms, ma-trix = 320 × 275, FOV = 160 mm × 160 mm, number of slices = 192, slice thickness = 0.5 mm,slice spacing = 0 mm total scanning time = 5 min 22 s.
4. Experimental Data Analysis and ProcessingTo demonstrate the significant difference of MIPSS under the five cerebral hemorrhage states,a non-parametric statistical multiple comparison rank sum test (Friedman M Test) was utilizedfor the MIPSS data analysis. The statistical analysis utilized the program SPSS12.0 (SPSS Inc.)and the significance level criterion was p<0.05.
According to the characteristics of the cerebral hemorrhage phase shift spectroscopy underFB, as shown in Fig 3C, an effective method for assessing cerebral hemorrhage severity reflectsthe severity of a single sample of cerebral hemorrhage and its overall trends. The phase shiftspectroscopy under FB was divided into two sections: pre-characteristic frequency and post-characteristic frequency. Five phase shifts were taken at equal intervals from each section, thesum of five phase shift data of former section and latter section were defined as Bij and Fij, re-spectively. i represented the i-th sample, i2{1,2,3. . .13}; j represented the blood injection vol-ume, j2{+0,0,1,2,3}, and the "+" sign indicated status before cranial drilling surgery. Thecorrection coefficient Kij was defined as follows:
Kij ¼ Vsj=Vij ð2Þ
Vij was the phase shift value corresponding to jml volume of blood injection of the i-th sampleunder characteristic frequency, and Vsjwas the average value of Vij of all the samples.
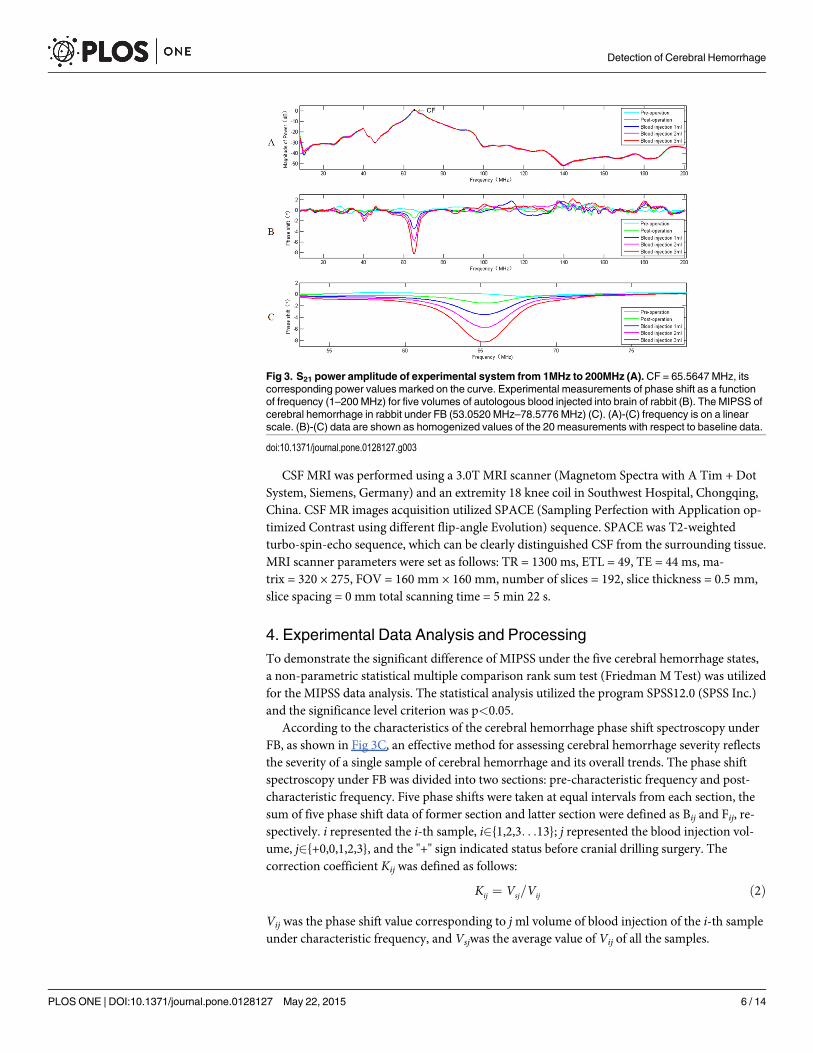
Fig 3. S21 power amplitude of experimental system from 1MHz to 200MHz (A). CF = 65.5647 MHz, itscorresponding power values marked on the curve. Experimental measurements of phase shift as a functionof frequency (1–200 MHz) for five volumes of autologous blood injected into brain of rabbit (B). The MIPSS ofcerebral hemorrhage in rabbit under FB (53.0520 MHz–78.5776 MHz) (C). (A)-(C) frequency is on a linearscale. (B)-(C) data are shown as homogenized values of the 20 measurements with respect to baseline data.
doi:10.1371/journal.pone.0128127.g003
Detection of Cerebral Hemorrhage
PLOS ONE | DOI:10.1371/journal.pone.0128127 May 22, 2015 6 / 14
�Bij value and �Fij value were obtained by multiplying the correction coefficient Kij with Bijand Fij.
�Bij ¼ Kij�Bij ð3Þ
�Fij ¼ Kij�Fij ð4Þ
The B-F distribution profile was drawn by taking �Bij value as the horizontal axis and �Fij
value as the vertical axis in the rectangular coordinate. In the B-F profile, the locations aroundthe coordinate indicated the pre-operation state, and the points at greater distance representeda more severe degree of cerebral hemorrhage. The formulas above showed that a larger samplewas associated with a more accurate �Bij and �Fij correction value. Hence the B-F distribution
profile was more meaningful.
ResultsIn one of the animals, the ICP from 15mmHg rose to 52mmHg, and the HRV decreasedmarkedly from 300 to 226 after the injection of 3-ml of blood. We selected this rabbit's resultsas an analysis example. Fig 3A showed the relationship between the power amplitude of cere-bral bleeding volumes and frequency, with the five states of the power amplitude spectrum al-most overlapping, thus indicating that the power amplitude was insensitive to the change inbrain hemorrhage; Fig 3B showed the relationship between the phase shift of cerebral bleedingvolumes and frequency, which was detected by the cerebral hemorrhage MIPSS method. Theresults of Fig 3A and 3B showed that the amplitude of the transmission parameter S21 wasclosely related to the detection sensitivity of the phase shift. A higher power of the frequencyband corresponded to a greater phase shift. By using the power amplitude information to de-fine the peak power point, its corresponding frequency was defined as the characteristic fre-quency (CF). The MIPSS under FB with the highest detection sensitivity and the greateststability was selected (Fig 3C), which reflected the phase shift spectroscopy of each level of cere-bral hemorrhage. Compared to the preoperative phase shift spectroscopy, after drawing bloodand performing cranial drilling surgery, excursion occurred in the phase shift spectroscopywhen blood injection was not applied. The phase shift increased with the successive increase ofblood injection volume, indicating a positive relationship. This finding is similar to the resultsreported by Jin G, et al. [21–23] and Gonzalez et al. [27].
The non-parametric statistical Friedman M test was applied to the MIPSS data analysis. Thehighlight of the analysis is displayed in Table 2. The non-parametric statistical Friedman Mtest detected statistically significant differences among the five states of cerebral hemorrhageMIPSS measurements, with a significance level of P<0.05, and the frequency ranged from CF-5 MHz to CF+5 MHz. The test results showed statistically significant differences among theMIPSS data of the five states of cerebral hemorrhage under FB.
Average phase shift data were taken from 13 rabbits with 5 states of cerebral hemorrhage atthe CF (see Fig 4). The average phase shift of 3 ml of brain hemorrhage reached -7.7503°±1.4204°. Its sensitivity was increased by 12.5-fold when compared with the previous workwith the single coil—coil method in which the frequency of the excitation signal was 10.7 MHzand the average phase shift of 3 ml of brain hemorrhage was 0.6173° ± 0.1976°[22]. Moreover,its sensitivity was increased by 4-fold when compared with symmetric cancellation-type sensordetection method based on the symmetry between the two brain hemispheres in which the ex-citation frequency was 7.5 MHz and the average phase shift of 3 ml of brain hemorrhage was1.885° ± 0.242°[23]. The average phase shift caused by pre-operation, post-operation, 1ml
Detection of Cerebral Hemorrhage
PLOS ONE | DOI:10.1371/journal.pone.0128127 May 22, 2015 7 / 14
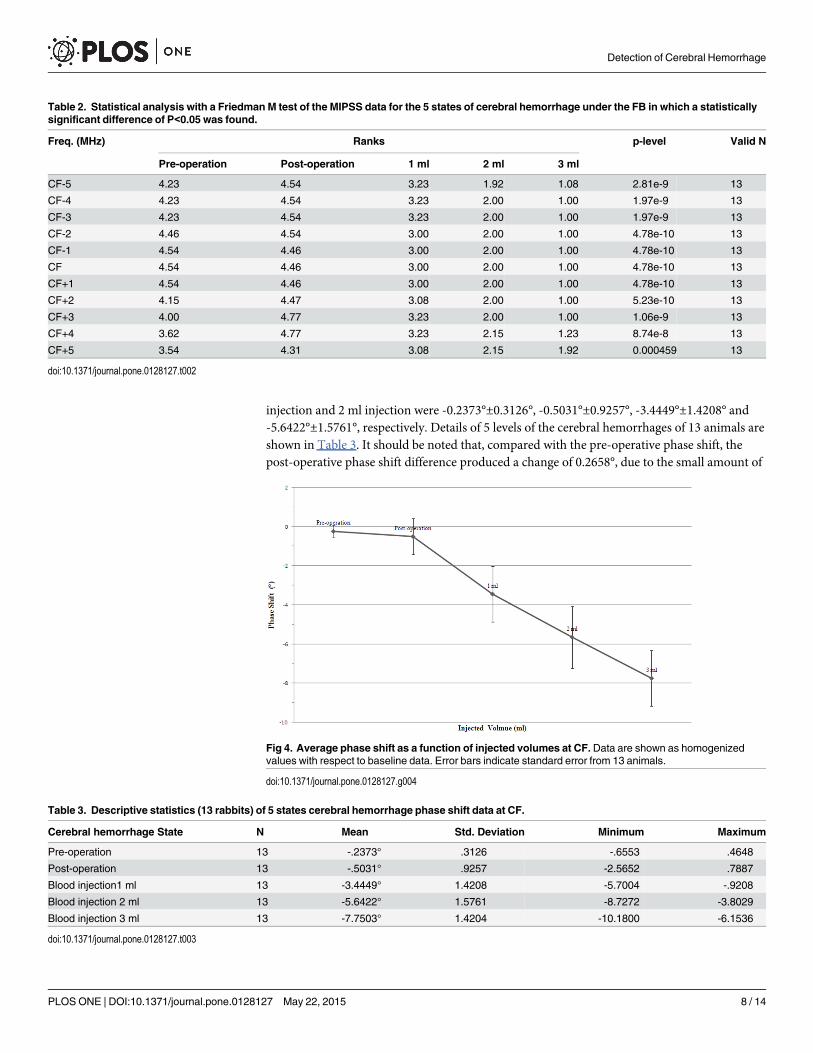
injection and 2 ml injection were -0.2373°±0.3126°, -0.5031°±0.9257°, -3.4449°±1.4208° and-5.6422°±1.5761°, respectively. Details of 5 levels of the cerebral hemorrhages of 13 animals areshown in Table 3. It should be noted that, compared with the pre-operative phase shift, thepost-operative phase shift difference produced a change of 0.2658°, due to the small amount of
Table 2. Statistical analysis with a FriedmanM test of the MIPSS data for the 5 states of cerebral hemorrhage under the FB in which a statisticallysignificant difference of P<0.05 was found.
Freq. (MHz) Ranks p-level Valid N
Pre-operation Post-operation 1 ml 2 ml 3 ml
CF-5 4.23 4.54 3.23 1.92 1.08 2.81e-9 13
CF-4 4.23 4.54 3.23 2.00 1.00 1.97e-9 13
CF-3 4.23 4.54 3.23 2.00 1.00 1.97e-9 13
CF-2 4.46 4.54 3.00 2.00 1.00 4.78e-10 13
CF-1 4.54 4.46 3.00 2.00 1.00 4.78e-10 13
CF 4.54 4.46 3.00 2.00 1.00 4.78e-10 13
CF+1 4.54 4.46 3.00 2.00 1.00 4.78e-10 13
CF+2 4.15 4.47 3.08 2.00 1.00 5.23e-10 13
CF+3 4.00 4.77 3.23 2.00 1.00 1.06e-9 13
CF+4 3.62 4.77 3.23 2.15 1.23 8.74e-8 13
CF+5 3.54 4.31 3.08 2.15 1.92 0.000459 13
doi:10.1371/journal.pone.0128127.t002
Fig 4. Average phase shift as a function of injected volumes at CF.Data are shown as homogenizedvalues with respect to baseline data. Error bars indicate standard error from 13 animals.
doi:10.1371/journal.pone.0128127.g004
Table 3. Descriptive statistics (13 rabbits) of 5 states cerebral hemorrhage phase shift data at CF.
Cerebral hemorrhage State N Mean Std. Deviation Minimum Maximum
Pre-operation 13 -.2373° .3126 -.6553 .4648
Post-operation 13 -.5031° .9257 -2.5652 .7887
Blood injection1 ml 13 -3.4449° 1.4208 -5.7004 -.9208
Blood injection 2 ml 13 -5.6422° 1.5761 -8.7272 -3.8029
Blood injection 3 ml 13 -7.7503° 1.4204 -10.1800 -6.1536
doi:10.1371/journal.pone.0128127.t003
Detection of Cerebral Hemorrhage
PLOS ONE | DOI:10.1371/journal.pone.0128127 May 22, 2015 8 / 14
blood after cranial drilling surgery. It should also be noted that the first, second and third injec-tions of 1 ml of blood produced phase shift difference changes of 2.9418°, 2.1973° and 2.1081°,respectively. This indicates that the relative phase shift between two consecutive injection statesis decreased by a larger volume of blood present in the brain.
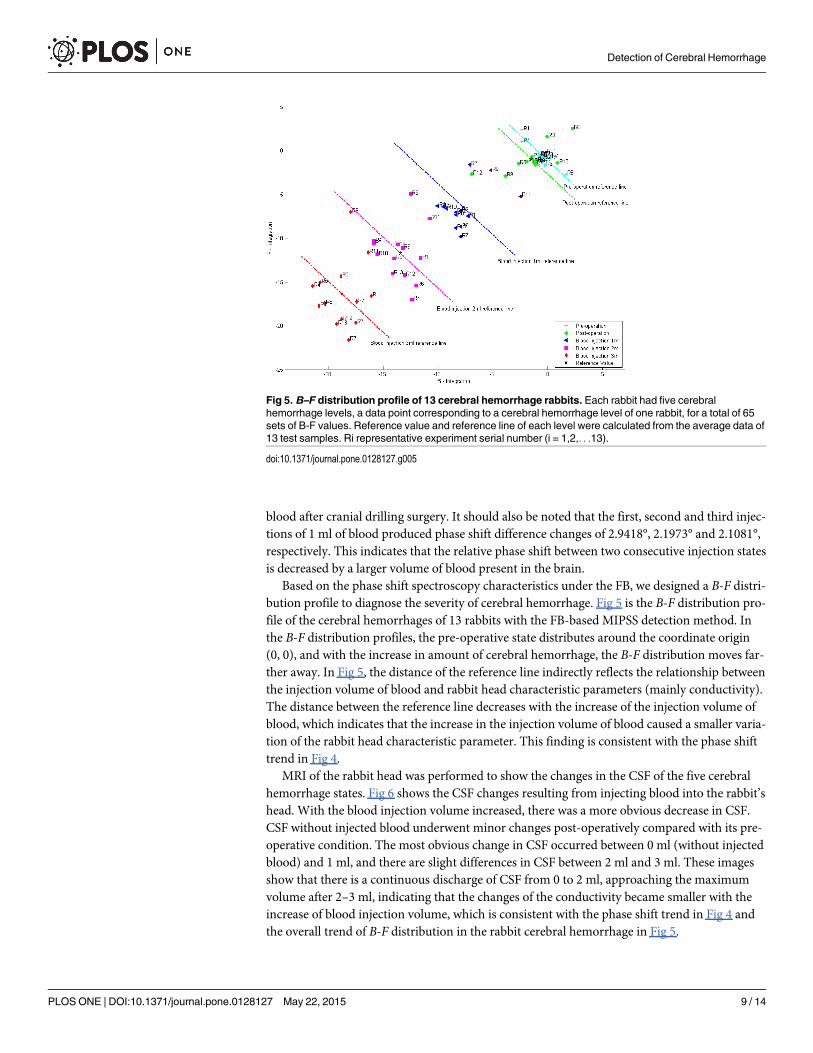
Based on the phase shift spectroscopy characteristics under the FB, we designed a B-F distri-bution profile to diagnose the severity of cerebral hemorrhage. Fig 5 is the B-F distribution pro-file of the cerebral hemorrhages of 13 rabbits with the FB-based MIPSS detection method. Inthe B-F distribution profiles, the pre-operative state distributes around the coordinate origin(0, 0), and with the increase in amount of cerebral hemorrhage, the B-F distribution moves far-ther away. In Fig 5, the distance of the reference line indirectly reflects the relationship betweenthe injection volume of blood and rabbit head characteristic parameters (mainly conductivity).The distance between the reference line decreases with the increase of the injection volume ofblood, which indicates that the increase in the injection volume of blood caused a smaller varia-tion of the rabbit head characteristic parameter. This finding is consistent with the phase shifttrend in Fig 4.
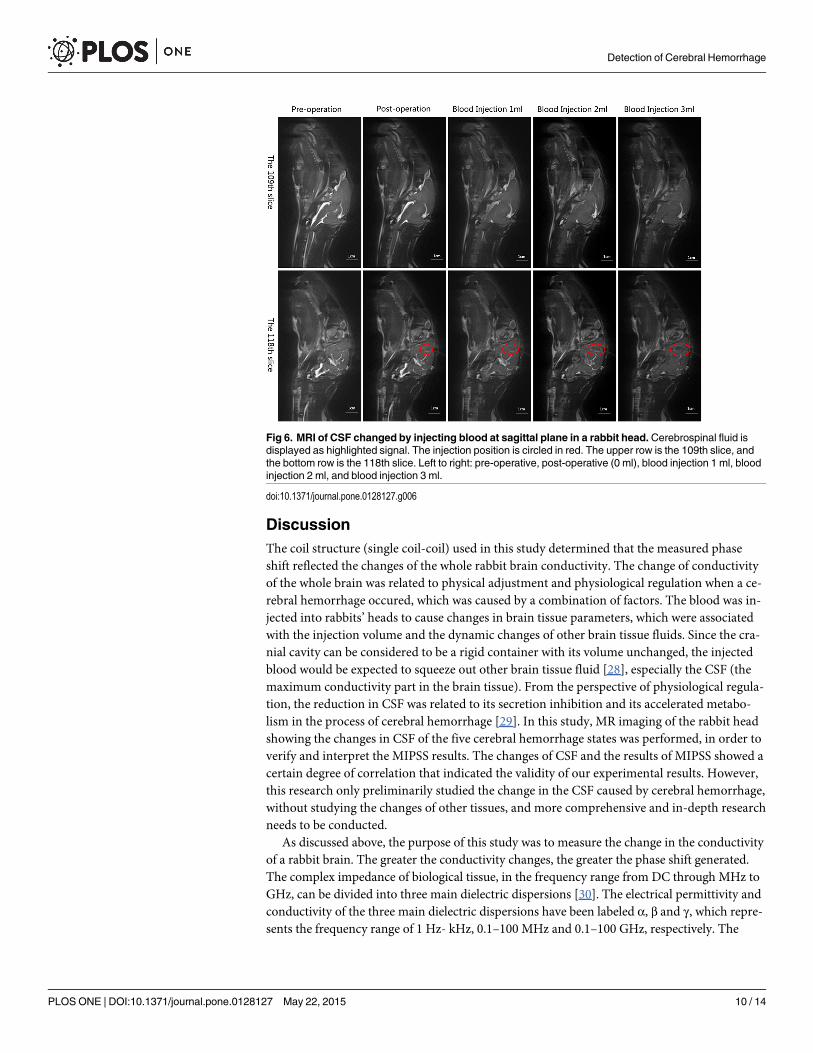
MRI of the rabbit head was performed to show the changes in the CSF of the five cerebralhemorrhage states. Fig 6 shows the CSF changes resulting from injecting blood into the rabbit’shead. With the blood injection volume increased, there was a more obvious decrease in CSF.CSF without injected blood underwent minor changes post-operatively compared with its pre-operative condition. The most obvious change in CSF occurred between 0 ml (without injectedblood) and 1 ml, and there are slight differences in CSF between 2 ml and 3 ml. These imagesshow that there is a continuous discharge of CSF from 0 to 2 ml, approaching the maximumvolume after 2–3 ml, indicating that the changes of the conductivity became smaller with theincrease of blood injection volume, which is consistent with the phase shift trend in Fig 4 andthe overall trend of B-F distribution in the rabbit cerebral hemorrhage in Fig 5.
Fig 5. B–F distribution profile of 13 cerebral hemorrhage rabbits. Each rabbit had five cerebralhemorrhage levels, a data point corresponding to a cerebral hemorrhage level of one rabbit, for a total of 65sets of B-F values. Reference value and reference line of each level were calculated from the average data of13 test samples. Ri representative experiment serial number (i = 1,2,. . .13).
doi:10.1371/journal.pone.0128127.g005
Detection of Cerebral Hemorrhage
PLOS ONE | DOI:10.1371/journal.pone.0128127 May 22, 2015 9 / 14
DiscussionThe coil structure (single coil-coil) used in this study determined that the measured phaseshift reflected the changes of the whole rabbit brain conductivity. The change of conductivityof the whole brain was related to physical adjustment and physiological regulation when a ce-rebral hemorrhage occured, which was caused by a combination of factors. The blood was in-jected into rabbits’ heads to cause changes in brain tissue parameters, which were associatedwith the injection volume and the dynamic changes of other brain tissue fluids. Since the cra-nial cavity can be considered to be a rigid container with its volume unchanged, the injectedblood would be expected to squeeze out other brain tissue fluid [28], especially the CSF (themaximum conductivity part in the brain tissue). From the perspective of physiological regula-tion, the reduction in CSF was related to its secretion inhibition and its accelerated metabo-lism in the process of cerebral hemorrhage [29]. In this study, MR imaging of the rabbit headshowing the changes in CSF of the five cerebral hemorrhage states was performed, in order toverify and interpret the MIPSS results. The changes of CSF and the results of MIPSS showed acertain degree of correlation that indicated the validity of our experimental results. However,this research only preliminarily studied the change in the CSF caused by cerebral hemorrhage,without studying the changes of other tissues, and more comprehensive and in-depth researchneeds to be conducted.
As discussed above, the purpose of this study was to measure the change in the conductivityof a rabbit brain. The greater the conductivity changes, the greater the phase shift generated.The complex impedance of biological tissue, in the frequency range from DC through MHz toGHz, can be divided into three main dielectric dispersions [30]. The electrical permittivity andconductivity of the three main dielectric dispersions have been labeled α, β and γ, which repre-sents the frequency range of 1 Hz- kHz, 0.1–100 MHz and 0.1–100 GHz, respectively. The
Fig 6. MRI of CSF changed by injecting blood at sagittal plane in a rabbit head. Cerebrospinal fluid isdisplayed as highlighted signal. The injection position is circled in red. The upper row is the 109th slice, andthe bottom row is the 118th slice. Left to right: pre-operative, post-operative (0 ml), blood injection 1 ml, bloodinjection 2 ml, and blood injection 3 ml.
doi:10.1371/journal.pone.0128127.g006
Detection of Cerebral Hemorrhage
PLOS ONE | DOI:10.1371/journal.pone.0128127 May 22, 2015 10 / 14

α-dispersion is caused by the relaxation in the counter-ion atmosphere surrounding thecharged cell membrane surface; the β-dispersion is produced by Maxwell—Wagner effects, aninterfacial relaxation process occurring in materials containing boundaries between two differ-ent dielectrics; and the γ-dispersion is caused by the relaxation of free water within tissues [31].Since the rabbit brain is a complex electrical conductor constructed by a number of tissue ma-terials with different dielectric properties, the conductivity changes caused by the brain tissueinterfacial relaxation should be maximum under FB. During the injection of blood into the rab-bits’ heads, different levels of brain tissues deform under different pressures because of the un-even distribution of stress. This changes the dielectric properties of different interface tissues,increasing the tissue interface, the interfacial relaxation effects, and the conductivity variation,thus resulting in a greater phase shift.
As can be seen in Fig 3A, five cerebral hemorrhage states of power amplitude spectrum al-most overlap. This indicates that while the power amplitude is insensitive to the change inbrain hemorrhage, the phase shift shows more sensitivity. Furthermore, Fig 3A and 3B showsthat at the CF, the response amplitude of the power transmission parameter S21 is maximum,corresponding to the biggest phase shift of the cerebral hemorrhage. This indicates that themagnetic energy coupling within the two coils, with frequency-dependent properties, has agreater impact on the sensitivity of the detection system. An equivalent circuit diagram of themagnetic induction detection for cerebral hemorrhage is shown in Fig 1B. It can be equivalentto two RL series circuits [32],which contain the source impedance (Zg), transmission line im-pedance (ZL1 and ZL2) and load impedance (Zexc and Zind). The impedance matching betweencircuit elements is particularly important at higher frequencies, which determines the sensitivi-ty of the detection system and the accuracy of the experimental results. Coil impedance varieswith frequency, which approximatively matches the characteristic impedance of the coaxialline at the CF. With the impedance matching between circuit elements, the excitation signal isin the state of a traveling wave, allowing the most accurate measurement results. At the sametime, the power transfer efficiency of the detection system is maximum, and the stronger mainmagnetic field stimulates the stronger disturbance magnetic field of the brain lesions, resultingin a greater measured phase shift. In addition, the stronger the magnetic field energy, the betterthe system stability and anti-jamming capability.
The results of MIPSS data analysis and processing under the FB, shown in Table 2, Table 3,Fig 4 and Fig 5, fully demonstrate the feasibility of using the MIPSS method to measure cere-bral hemorrhage in rabbits. The MIPSS data of whole band shows that MIPS detection sensitiv-ity has frequency-dependent properties, which indicates that the operating frequency of theexcitation signal is particularly important while using the MIPS detection method to measurecerebral hemorrhage, and that the CF with the highest detection sensitivity and the greatest sta-bility should be selected so as to ensure good results detected. It should be noted that the use ofdifferent coils obtained different MIPSS results. This is because the circuit parameters were notthe same, and show different FB. It is certain that, no matter which coils are used, the sensitivityof cerebral hemorrhage detection system is highest at CF, and the most accurate results aremeasured under FB.
The cerebral hemorrhage B-F distribution is a typical two-parameter scalar collator, whichcan provide instantaneous diagnostic information about the severity of the cerebral hemor-rhage from a single set of measurements. A similar two-parameter scalar classifier appears inGonzalez et al. [10]. They diagnosed the condition of the brain, including healthy volunteersand patients with hemorrhage and edema, as a function of two volumetric electromagneticphase-shift spectroscopy (VEPS) parameters in the β and γ ranges of frequency. Apparently,the B-F distribution profile is able not only to clearly distinguish the pre-operative state andvarious levels of cerebral hemorrhage but also to reflect the overall trend of the cerebral
Detection of Cerebral Hemorrhage
PLOS ONE | DOI:10.1371/journal.pone.0128127 May 22, 2015 11 / 14
hemorrhage. We can determine the severity of cerebral hemorrhage and its progression ac-cording to the two-dimensional coordinate information. In Fig 5, the valid point represents theinformation deviation, which is due to the individual differences of each rabbit and the surgicalprocedure error.
This study used a single coil-coil to detect the time-difference MIPSS between before- andafter- haemorrhage states and between two haemorrhagic states with different volumes ofblood. Although the time-difference phase shift may allow the possibility of monitoring theprogression of a hemorrhagic stroke, it is unlikely to be of use in making an initial diagnosissince a before-stroke data will not be available in clinic [11]. The frequency-difference method,which depends on the ability to distinguish the ‘frequency signature’ of a lesion from that ofthe surrounding tissues, is being explored to overcome this limitation. However, the phase shiftof the hemorrhage by this method is significantly more difficult given that the conductivity ofall of the tissues of the head changes with the frequency [13]. The results of this study showthat the MIPSS detection method is able to provide a new possibility for real-time monitoringand diagnosis of the severity of cerebral hemorrhage. It is known from clinical studies that thechanges in the cerebral hemorrhage are complex. Therefore more comprehensive and in-depthresearch needs to be conducted in our future work.
ConclusionThis study employed the MIPSS method for detecting cerebral hemorrhage in rabbits. A rabbitmodel of cerebral hemorrhage was studied within 1MHz- 200MHz, and the optimal featureband was selected for analysis. When compared with a conventional single coil-coil detectionmethod [22], and the method of a symmetric cancellation-type sensor detection system [23],the sensitivity of the FB-based MIPSS increases by 12.5 times and 4 times. Furthermore, theB-F profile design based on the MIPSS method can effectively distinguish the degree of severityof cerebral hemorrhage, showing the potential application value of the MIPSS detection tech-nology. Since this study is mainly based on animal experiments, its clinical application requiresmore in-depth study based on animal experiments and clinical research, so as to improve thevalidity and reliability of the MIPSS method for detecting cerebral hemorrhage.
Author ContributionsConceived and designed the experiments: WP QYMQ. Performed the experiments: WP GJ JSBP. Analyzed the data: WP QY XN. Contributed reagents/materials/analysis tools: WZ BP GL.Wrote the paper: WP QYMQ.
References1. Keep RF, Hua Y, Xi G.Intracerebral haemorrhage: mechanisms of injury and therapeutic targets. The
Lancet Neurology.2012; 11(8):720–731. doi: 10.1016/S1474-4422(12)70104-7 PMID: 22698888
2. van Asch CJ, Luitse MJ, Rinkel GJ, van der Tweel I, Algra A, Kliin CJ.Incidence, case fatality, and func-tional outcome of intracerebral haemorrhage over time, according to age, sex, and ethnic origin: a sys-tematic review and meta-analysis. The Lancet Neurology.2010; 9(2):167–176. doi: 10.1016/S1474-4422(09)70340-0 PMID: 20056489
3. Qureshi AI, Mendelow AD, Hanley DF. Intracerebral haemorrhage. The Lancet.2009; 373:1632–1644.doi: 10.1016/S0140-6736(09)60371-8 PMID: 19427958
4. Ropper AH, King RB. Intracranial pressure monitoring in comatose patients with cerebral hemorrhage.Archives of neurology.1984; 41(7):725–728. PMID: 6743063
5. Kidwell CS, Chalela JA, Saver JL, Starkman S, Hill MD,Demchuk AM, et al. Comparison of MRI and CTfor detection of acute intracerebral hemorrhage. Jama.2004; 292(15): 1823–1830. PMID: 15494579
6. Griffiths H, Steward WR, GoughW. Magnetic induction tomography: a measuring system for biologicalmaterials. Ann NY AcadSci.1999; 873: 335–345. PMID: 10372181
Detection of Cerebral Hemorrhage
PLOS ONE | DOI:10.1371/journal.pone.0128127 May 22, 2015 12 / 14
7. Griffiths H. Magnetic induction tomography. MeasSciTechnol.2001; 12: 1126–1131. PMID: 11740674
8. Gonzalez CA, Rubinsky B. A theoretical study on magnetic induction frequency dependence of phaseshift in oedema and haematoma. PhysiolMeas.2006; 27(9): 829–838. PMID: 16868349
9. Gonzalez CA, Rubinsky B. Detection of brain oedema with frequency dependent phase shift electro-magnetic induction. PhysiolMeas.2006; 27(6): 539–552. PMID: 16603802
10. Gonzalez CA, Valencia JA, Mora A, Gonzalez F, Velasco B, Porras MA,et al. Volumetric electromag-netic phase-shift spectroscopy of brain edema and hematoma. PloS one. 2013; 8(5): e63223. doi: 10.1371/journal.pone.0063223 PMID: 23691001
11. Zolgharni M, Ledger PD, Armitage DW, Holder DS, Griffiths H. Imaging cerebral haemorrhage withmagnetic induction tomography: numerical modelling. PhysiolMeas.2009; 30: S187–S200. doi: 10.1088/0967-3334/30/6/S13 PMID: 19491437
12. Liu R, Li Y, Fu F, You F, Shi X, Dong X, et al. Time-difference imaging of magnetic induction tomogra-phy in a three-layer brain physical phantom. MeasSciTechnol. 2014; 25: 065402. doi: 10.1186/1687-9856-2014-25 PMID: 25584047
13. Zolgharni M, Griffiths H, Ledger PD. Frequency-difference MIT imaging of cerebral haemorrhage with ahemispherical coil array: numerical modelling. PhysiolMeas. 2010; 31: S111–S125. doi: 10.1088/0967-3334/31/8/S09 PMID: 20647622
14. Watson S, Morris A, Williams RJ, Griffiths H, GoughW. A primary field compensation scheme for planararray magnetic induction tomography. PhysiolMeas. 2004; 25(1): 271–279. PMID: 15005321
15. Qin M, Wang Y, Hu X, Jiao M, LiangW,Zhang H, et al. Study of MIT phase sensitivity for detecting abrain edema based on FDTDmethod. Bioinformatics and Biomedical Engineering, 2007. ICBBE 2007.The 1st International Conference on. IEEE (ICBBE 2007): 660–663 10.1109/ICBBE.2007.172.
16. Jiao M, Qin M, LiangW, Zhang H, Li K, ZhouW, et al. Design and implementation of a new type excita-tion source and the optimal excitation coil for MIT. Bioinformatics and Biomedical Engineering, 2008.ICBBE 2008. The 2nd International Conference on. IEEE (ICBBE 2008): 2345–2348 10.1109/ICBBE.2008.919.
17. LiangW, Qin M, Jiao M, Li K, Jiao T, Bai L, et al. Phase Detection Based on the Lock-in AmplifierSR844 and Experiments of Brain Neuron Cells in MIT System. BioMedical Engineering and Informatics,2008. BMEI 2008. International Conference on. IEEE 1: 638–642 10.1109/BMEI.2008.103.
18. Jin G, Qin M, Wang C, GuoW, Xu L, Ning X, et al. Experimental study on simulated cerebral edema de-tection with PSSMI. Communication Systems and Information Technology. Springer Berlin Heidelberg.2011; 4: 361–367 doi: 10.1007/978-3-642-21762-3_47
19. Xu L, Qin M, Jin G, Ning X, Xu J, Wang C, et al. Study of PSSMI for cerebral hemorrhage detection: anexperimental simulation. Image and Signal Processing (CISP), 2011 4th International Congress on.IEEE 1: 266–268 10.1109/CISP.2011.6099912
20. Sun J, Jin G, Qin M, Wan Z, Wang J, GuoW, et al. The detection of chronic cerebral hemorrhage in rab-bits with magnetic induction. Journal of Physics: Conference Series. IOP Publishing. 2012; 407(1):012014.
21. Jin G, Sun J, Qin M, Wang C, GuoW, Yan Q, et al. A Special Phase Detector for Magnetic InductiveMeasurement of Cerebral Hemorrhage. PloS one. 2014; 9(5): e97179. doi: 10.1371/journal.pone.0097179 PMID: 24816470
22. Sun J, Jin G, Qin MX, Wan ZB, Wang JB, Wang C, et al. Detection of acute cerebral hemorrhage in rab-bits by magnetic induction. Brazilian Journal of Medical and Biological Research. 2014; 47(2):144–150. doi: 10.1590/1414-431X20132978 PMID: 24519130
23. Jin G, Sun J, Qin MX, Tang Q, Xu L, Ning X,et al. A newmethod for detecting cerebral hemorrhage inrabbits by magnetic inductive phase shift. Biosensors and Bioelectronics.2014; 52:374–378. doi: 10.1016/j.bios.2013.09.019 PMID: 24084165
24. Helsinki F. Declaration of helsinki. Brit Med J.1996; 313: 1448–1449.
25. ZimmermannM. Ethical guidelines for investigations of experimental pain in conscious animals.Pain.1983; 16: 109–110. PMID: 6877845
26. Yang GY, Betz AL, Chenevert TL, Brunberg JA, Hoff JT. Experimental intracerebralhemorrhage: rela-tionship between brain edema, blood flow, and bloodbrainbarrier permeability in rats. Journal of neuro-surgery.1994; 81(1):93–102. PMID: 8207532
27. Gonzalez CA, Horowitz L, Rubinsky B.In vivo inductive phase shift measurements to detect intraperito-neal fluid. IEEE Trans on Biomedical Engineering.2007; 54(5): 953–956.
28. Cushing H. The Third Circulation in Studies in Intracranial Physiology and Surgery. Oxford UniversityPress London UK;1926.
29. Wang ZC. Neurosurgery. Hubei Science and Technology Press China;2005.
Detection of Cerebral Hemorrhage
PLOS ONE | DOI:10.1371/journal.pone.0128127 May 22, 2015 13 / 14

30. Grimnes S, Martinsen OG.Bioimpedance and Bioelectricity Basics. Academic Press USA; 2008.
31. Schurer L, Grogaard B, Arfors KE, Gerbin B.Is postischaemicwateraccumulation related to delayedpostischaemichypoperfusion in rat brain?.ActaNeurochirurgica.1988; 94(3–4):150–154.
32. Gonzalez CA, Rojas R, Villanueva C, Rubinsky B. Inductive phase shift spectroscopy for volumetricbrain edema detection: An experimental simulation. Engineering in Medicine and Biology Society,2007. EMBS 2007. 29th Annual International Conference of the IEEE (EMBS 2007): 2346–234910.1109/IEMBS.2007.4352797.
Detection of Cerebral Hemorrhage
PLOS ONE | DOI:10.1371/journal.pone.0128127 May 22, 2015 14 / 14