Embed Size (px)
Citation preview
Design Guidelines for Reliability Communication inAutonomous Vehicles
Sarah Faltaous1,2, Martin Baumann3, Stefan Schneegass1, Lewis L. Chuang2,4
1University of Duisburg-Essen – HCI Group – {firstname.lastname}@uni-due.de2Max Planck Institute for Biological Cybernetics – {firstname.lastname}@tuebingen.mpg.de
3Ulm University – {firstname.lastname}@tuebingen.mpg.de4LMU Munich – {firstname.lastname}@um.ifi.lmu.de
ABSTRACTCurrently offered autonomous vehicles still require thehuman intervention. For instance, when the system failsto perform as expected or adapts to unanticipated sit-uations. Given that reliability of autonomous systemscan fluctuate across conditions, this work is a first steptowards understanding how this information ought tobe communicated to users. We conducted a user studyto investigate the effect of communicating the system’sreliability through a feedback bar. Subjective feedbackwas solicited from participants with questionnaires andsemi-structured interviews. Based on the qualitative re-sults, we derived guidelines that serve as a foundationfor the design of how autonomous systems could providecontinuous feedback on their reliability.
CCS Concepts•Human-centered computing → Human com-puter interaction (HCI); HCI design and evalu-ation methods; User studies; Laboratory experi-ments;
Author Keywordssituation awareness; interface design; autonomousvehicles; reliability display; human-machine partnership.
INTRODUCTIONRecent advances in automotive technologies allow tasksthat were previously performed by drivers to be carriedout by a constellation of sensors and artificial intelli-gence [33] (e.g., autopilot). Most of these currently avail-able technologies and most of the near future technolo-gies require the user’s intervention when the automationfails [6, 16, 38]. At the same time with these technologiesthe driver is granted features that can perform complexPermission to make digital or hard copies of all or part of this work for personal orclassroom use is granted without fee provided that copies are not made or distributedfor profit or commercial advantage and that copies bear this notice and the full citationon the first page. Copyrights for components of this work owned by others than theauthor(s) must be honored. Abstracting with credit is permitted. To copy otherwise, orrepublish, to post on servers or to redistribute to lists, requires prior specific permissionand/or a fee. Request permissions from [email protected].
AutomotiveUI ’18, September 23–25, 2018, Toronto, ON, Canada
© 2018 Copyright held by the owner/author(s). Publication rights licensed to ACM.ISBN 978-1-4503-5946-7/18/09. . . $15.00
DOI: https://doi.org/10.1145/3239060.3239072
perception and decision-making tasks [3] (e.g. sign recog-nition). These features allow the driver to be engagedin different tasks other than driving [12]. Consequently,the driver becomes a supervisory operator [3, 28, 35],who is barely involved in the driving task [16] and mostlyidentified as being out-of-loop [3].To date, much research has been performed on how tobring the driver back into the loop when vehicle automa-tion encounters a situation that it cannot handle safely,that is if it reaches a system limit situation [8, 17]. Suchresearch implicit assume that autonomous vehicle sys-tems are entirely reliable partners; they can either handlea situation or are able to recognize when they are not,subsequently issuing a notification to introduce the driverback into the loop to handle the situation instead. In re-ality life, vehicle automation is more likely to operate onthe basis of probabilistic certainty. In other words, theirreliability will vary in accordance with their changinglevels of certainty in coping with driving conditions thatcan be expected to vary continuously. Variability in anautomated vehicle’s reliability could result from at leasttwo factors. First, it could be related to technologicallimitations (e.g., sensors’ imprecise input registration,imperfections of the signal transmission in electronic cir-cuits, analogue to digital conversions, etc) [20]. Second,it could result from the unpredictable behaviour of fellowdrivers (e.g., sudden lane changing) [9]. These factorswill undoubtedly influence the reliability (or certainty)of vehicle automation in safe vehicle handling. To someextent, automated vehicles will have access to understand-ing their current levels of reliability. For example, inputssuch as the accident statistics of a given road or the con-fidence bounds of sensor readings. Therefore, users couldbenefit from being informed of an autonomous vehicle’scurrent level of reliability. This could allow users to adapttheir supervision strategy and level of secondary task en-gagement, so as to be able to intervene should vehicleautomation fail. To the best of our knowledge, the topicof reliability communication in autonomous vehicles hasyet to be investigated in depth.In this paper, we explore how autonomous vehicles cancommunicate it’s current level of system reliability to the
Proceedings of the 10th International ACM Conference on Automotive User Interfaces and Interactive VehicularApplications (AutomotiveUI ’18), September 23–25, 2018, Toronto, Canada .
258
user. We investigate how users might perceive the useful-ness of such a communication system, using a simulationscenario that focuses on an automated collision avoid-ance system. The level of automation simulated could beloosely described as SAE L2/L3 given that our partici-pants were expected to perform a primary non-drivingtask but were expected to intervene when automationfailed. We developed a continuous visual feedback systemthat communicated the levels of automation reliability inorder to understand how users responded to such commu-nication. Through implementing it in a realistic drivingsimulation scenario, we elicited user feedback via ques-tionnaires, and semi-structured interviews, which serveas a basis for general guidelines and recommendationsfor communicating a system’s reliability to users of au-tonomous vehicle systems.
RELATED WORKIn the real world, no system is perfect. It means thatany system can and will fail at some point. As it isnot feasible for the engineering of automated systems toexhautively consider the infinite possibilities that couldtranspire across different use scenarios, designing for ef-fective human intervention will continue to be a crucialcomponent of automated systems [37]. To understandhow humans interact with automated systems (i.e., au-tonomous vehicles), it is necessary to first consider howuser trust engenders reliance on automation.
Trust and Reliance in Autonomous SystemsReliance is categorized as a behavior, while trust is anattitude [5] carried out by the human towards automa-tion [36]. Both are different sides of the same coin, whichcan determine how users interact with a given system [32].User trust in a Human-Machine Interaction (HMI) canbe considered by comparisons to a Human-Human Inter-action (HHI) [14, 25, 30]. To realize a certain task [36, 5,41], for example, driving safely [16], both the human andthe autonomous vehicle should form a team [14].Muir stated that trust in HHI and HMI is comparable [31],in terms of predictability (i.e., action anticipation), de-pendability (i.e., action execution consistency) and faith(i.e., system’s reliability) [25, 36]. For instance, whenevera driver turns an automatic parking feature on, he orshe knows that the final target is entering the selectedparking spot. The driver also knows that the car is goingto be performing a specific sequence of maneuvers toachieve that. By using this feature, drivers entrust thesystem to do this task on their behalf.Both the autonomous system and the user possess abili-ties and knowledge that the other may not. Therefore,each of them receives the changes occurring in the driv-ing environment with different variance [39]. Drivers aremore likely to rely on automated aid if they trust it toperform more reliably than their own performance (e.g.back-parking sensors in estimating the distance to col-lide). However, the converse could also be true. If theybelieve that their performance is likely to be superior,
given their experience with this automated feature, theyare unlikely to rely on automation [14, 30]. In both cases,they cautiously choose whom to rely on and trust (e.g.,their performance vs. the system’s) [14].
Reliability CommunicationIn a changeable precarious world, alerting systems anddecision aids can be expected to fail in providing correctfeedback. This leaves room for uncertainty and risk [22].Flawed alerting systems may result in two different typesof errors [27, 40, 42]. First of all, errors that result froman over-reliance on automation, which results in a lack ofdriver attention to the road and how vehicle automationis functioning. Consequently, this could prevent the drivefrom intervening appropriately [40]. A commonplaceand relatively benign example would be when the drivermisses to exit the highway as a result of over-reliance ona navigation system that does not update reliably [42].Another type of error occurs from over-compliance, thatis when the operator accepts the false alarms and rec-ommendations of an automated system. For instance,entering a one-way road from the wrong direction basedon the navigation system recommendations [42]. In bothcases, the consequence of system error is problematic.However, it has been noticed that the latter is moregrievous, as it eventually leads to total ignorance of thealert [40].In general, people tend to invest more trust in au-tonomous systems that show more collaboration in ahelpful and understandable manner, regardless of theiractual level of reliability [5]. Dzindolet and colleaguesshowed that people did not refrain from using an unreli-able system even though they were aware of its unrelia-bility [13]. Another study reported similar findings whenuser interventions during system failures, varied withpresenting alarm rates of changing reliabilities (e.g., 20,25 and 70% true alarms). As the researchers showed thatmost of the participants (90%) response rates matchedthat of the expected probability of true alarms (e.g.,probability matching) [7].Communicating the changing reliability of an automatedsystem can be expected to improve user interactions withautomated vehicles, if users are able to accept and effec-tively interpret this information. In order for users torely on autonomous vehicles, it is important for them tocontinuously moderate their levels of reliance and allo-cate their available resources according to the changingcircumstances and capability of vehicle automation [5,39]. The work of Parasuraman and colleagues [31] sug-gests that users are sensitive to variable feedback byevaluating the reaction times of system failure detections.Specifically, users were faster to respond to system fail-ures when confronted with variable feedback as opposedto constant feedback. These results agree with thosereported by Helldin and colleagues who showed that par-ticipants were able to shift to manual control faster whenpresented with variable feedback compared to when nofeedback was issued [21].
Session 7: Special Approaches AutomotiveUI ’18, Toronto, Canada
259
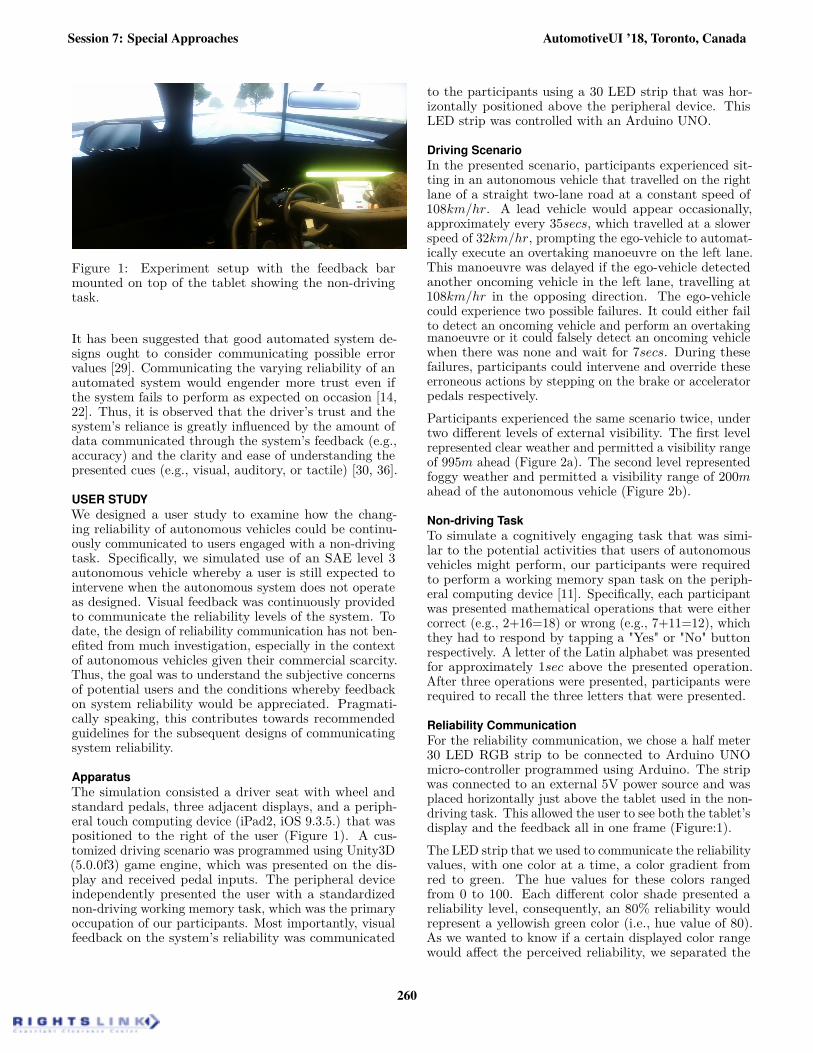
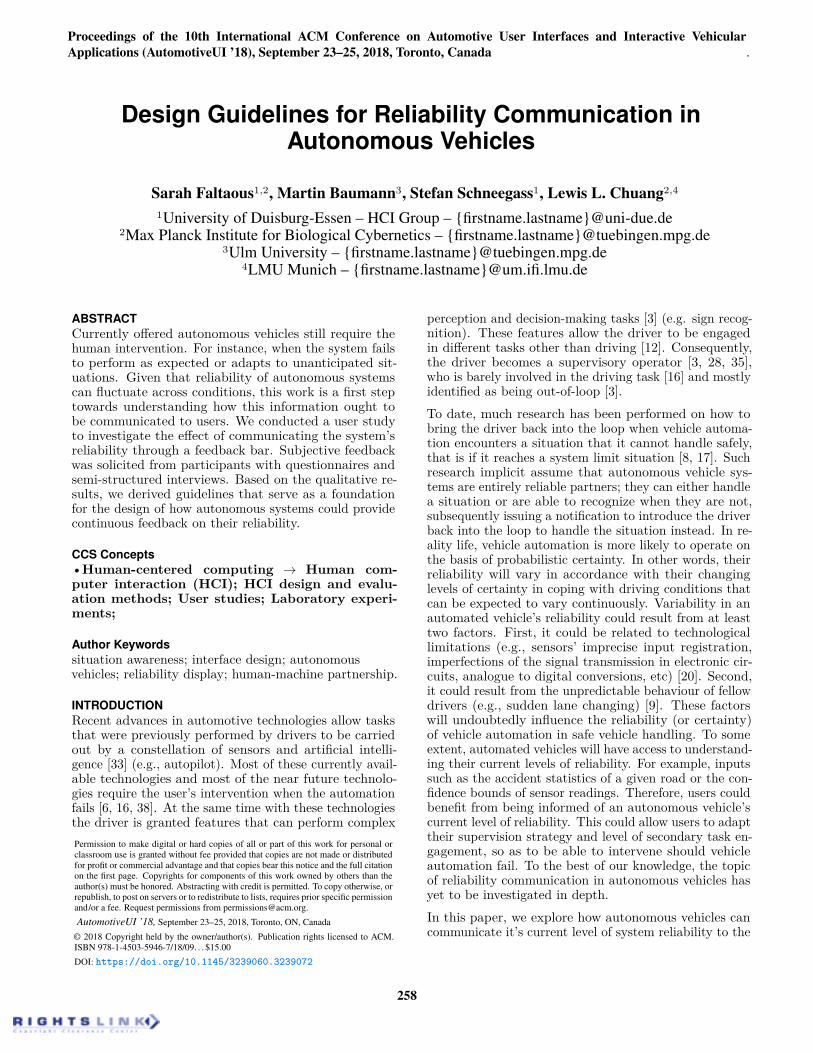
Figure 1: Experiment setup with the feedback barmounted on top of the tablet showing the non-drivingtask.
It has been suggested that good automated system de-signs ought to consider communicating possible errorvalues [29]. Communicating the varying reliability of anautomated system would engender more trust even ifthe system fails to perform as expected on occasion [14,22]. Thus, it is observed that the driver’s trust and thesystem’s reliance is greatly influenced by the amount ofdata communicated through the system’s feedback (e.g.,accuracy) and the clarity and ease of understanding thepresented cues (e.g., visual, auditory, or tactile) [30, 36].
USER STUDYWe designed a user study to examine how the chang-ing reliability of autonomous vehicles could be continu-ously communicated to users engaged with a non-drivingtask. Specifically, we simulated use of an SAE level 3autonomous vehicle whereby a user is still expected tointervene when the autonomous system does not operateas designed. Visual feedback was continuously providedto communicate the reliability levels of the system. Todate, the design of reliability communication has not ben-efited from much investigation, especially in the contextof autonomous vehicles given their commercial scarcity.Thus, the goal was to understand the subjective concernsof potential users and the conditions whereby feedbackon system reliability would be appreciated. Pragmati-cally speaking, this contributes towards recommendedguidelines for the subsequent designs of communicatingsystem reliability.
ApparatusThe simulation consisted a driver seat with wheel andstandard pedals, three adjacent displays, and a periph-eral touch computing device (iPad2, iOS 9.3.5.) that waspositioned to the right of the user (Figure 1). A cus-tomized driving scenario was programmed using Unity3D(5.0.0f3) game engine, which was presented on the dis-play and received pedal inputs. The peripheral deviceindependently presented the user with a standardizednon-driving working memory task, which was the primaryoccupation of our participants. Most importantly, visualfeedback on the system’s reliability was communicated
to the participants using a 30 LED strip that was hor-izontally positioned above the peripheral device. ThisLED strip was controlled with an Arduino UNO.
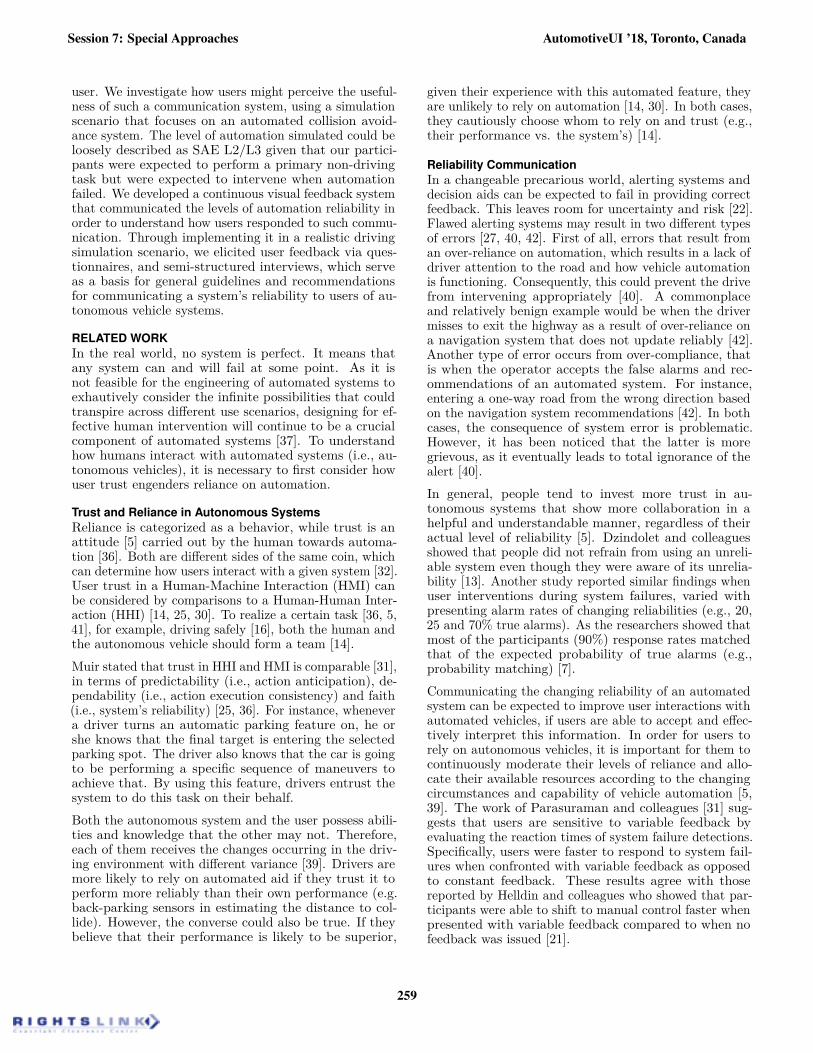
Driving ScenarioIn the presented scenario, participants experienced sit-ting in an autonomous vehicle that travelled on the rightlane of a straight two-lane road at a constant speed of108km/hr. A lead vehicle would appear occasionally,approximately every 35secs, which travelled at a slowerspeed of 32km/hr, prompting the ego-vehicle to automat-ically execute an overtaking manoeuvre on the left lane.This manoeuvre was delayed if the ego-vehicle detectedanother oncoming vehicle in the left lane, travelling at108km/hr in the opposing direction. The ego-vehiclecould experience two possible failures. It could either failto detect an oncoming vehicle and perform an overtakingmanoeuvre or it could falsely detect an oncoming vehiclewhen there was none and wait for 7secs. During thesefailures, participants could intervene and override theseerroneous actions by stepping on the brake or acceleratorpedals respectively.Participants experienced the same scenario twice, undertwo different levels of external visibility. The first levelrepresented clear weather and permitted a visibility rangeof 995m ahead (Figure 2a). The second level representedfoggy weather and permitted a visibility range of 200mahead of the autonomous vehicle (Figure 2b).
Non-driving TaskTo simulate a cognitively engaging task that was simi-lar to the potential activities that users of autonomousvehicles might perform, our participants were requiredto perform a working memory span task on the periph-eral computing device [11]. Specifically, each participantwas presented mathematical operations that were eithercorrect (e.g., 2+16=18) or wrong (e.g., 7+11=12), whichthey had to respond by tapping a "Yes" or "No" buttonrespectively. A letter of the Latin alphabet was presentedfor approximately 1sec above the presented operation.After three operations were presented, participants wererequired to recall the three letters that were presented.
Reliability CommunicationFor the reliability communication, we chose a half meter30 LED RGB strip to be connected to Arduino UNOmicro-controller programmed using Arduino. The stripwas connected to an external 5V power source and wasplaced horizontally just above the tablet used in the non-driving task. This allowed the user to see both the tablet’sdisplay and the feedback all in one frame (Figure:1).The LED strip that we used to communicate the reliabilityvalues, with one color at a time, a color gradient fromred to green. The hue values for these colors rangedfrom 0 to 100. Each different color shade presented areliability level, consequently, an 80% reliability wouldrepresent a yellowish green color (i.e., hue value of 80).As we wanted to know if a certain displayed color rangewould affect the perceived reliability, we separated the
Session 7: Special Approaches AutomotiveUI ’18, Toronto, Canada
260
(a) Non-foggy condition with a visibility range of 995m. (b) Foggy condition with a visibility range of 200m.
Figure 2: The two weather conditions, which permit different visibility ranges ahead of the autonomous vehicles
Figure 3: Sample of the waves generated from using themean of seven sinusoidal signals across 1000s. The valuesrange from 10 to 50.
communicated reliability values into two levels. The firstlevel is with low values ranging between 10% to 50% (i.e.,red to yellowish orange). The second level is with highvalues ranging between 50% to 90% (i.e., yellowish orangeto green). The displayed value (i.e., color) was updatedeach 1s. This was implemented to match the real-worldcontinuous uncertainty values change.The presented values were generated from an algorithm,in which we calculate the mean value of seven sinusoidalwaves having different phases and frequencies. We usedprime numbers for phase shifts and frequencies to avoidany harmonic wave generation (Figure 3). We imple-mented the signal approach to avoid any sudden jump ifa random representation was picked and to give the usersa sense of the system’s reliability in a consistent smoothway. It is important to mention that the displayed val-ues were not linked to the real system’s accuracy. Thegoal was just to detect whether or not the drivers wouldbe affected by the reliability communication, as well asexamining a new design approach to do so.
Study DesignWe designed two experimental simulation blocks, in whichwe displayed the two weather conditions separately. Wewanted to further examine the effect of communicatingdifferent color ranges in the reliability feedback. We di-vided each block into five intervals, where we manipulated
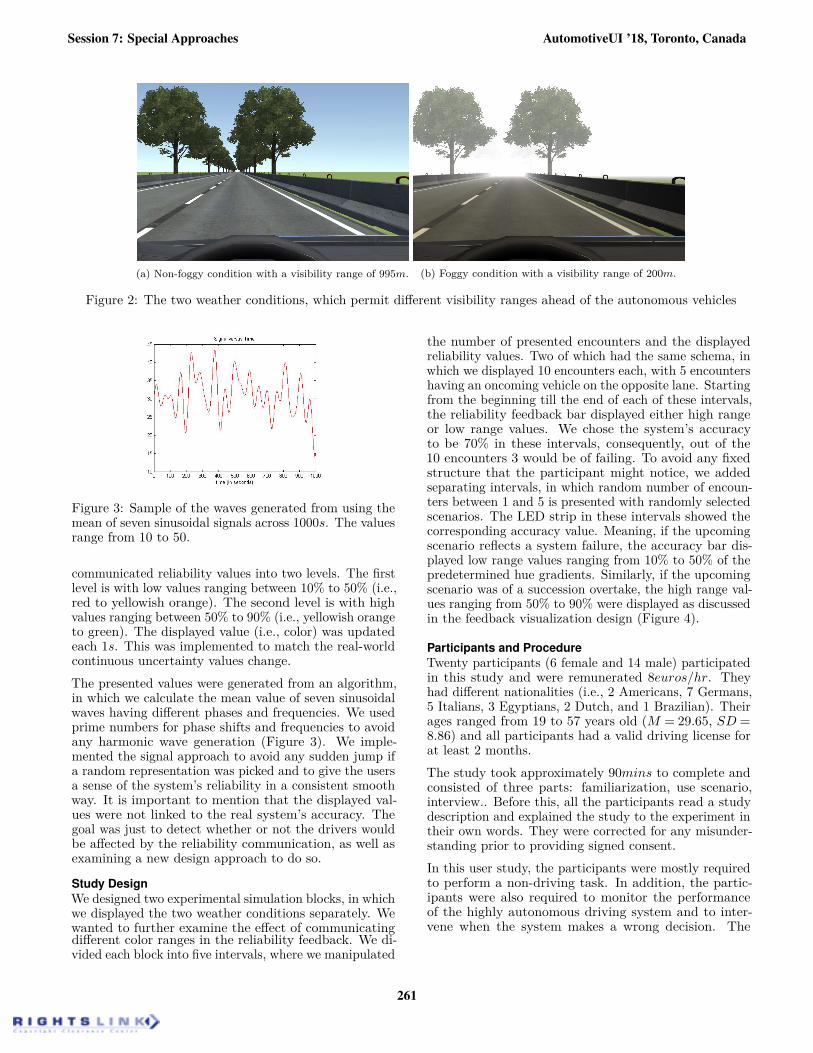
the number of presented encounters and the displayedreliability values. Two of which had the same schema, inwhich we displayed 10 encounters each, with 5 encountershaving an oncoming vehicle on the opposite lane. Startingfrom the beginning till the end of each of these intervals,the reliability feedback bar displayed either high rangeor low range values. We chose the system’s accuracyto be 70% in these intervals, consequently, out of the10 encounters 3 would be of failing. To avoid any fixedstructure that the participant might notice, we addedseparating intervals, in which random number of encoun-ters between 1 and 5 is presented with randomly selectedscenarios. The LED strip in these intervals showed thecorresponding accuracy value. Meaning, if the upcomingscenario reflects a system failure, the accuracy bar dis-played low range values ranging from 10% to 50% of thepredetermined hue gradients. Similarly, if the upcomingscenario was of a succession overtake, the high range val-ues ranging from 50% to 90% were displayed as discussedin the feedback visualization design (Figure 4).
Participants and ProcedureTwenty participants (6 female and 14 male) participatedin this study and were remunerated 8euros/hr. Theyhad different nationalities (i.e., 2 Americans, 7 Germans,5 Italians, 3 Egyptians, 2 Dutch, and 1 Brazilian). Theirages ranged from 19 to 57 years old (M = 29.65, SD =8.86) and all participants had a valid driving license forat least 2 months.The study took approximately 90mins to complete andconsisted of three parts: familiarization, use scenario,interview.. Before this, all the participants read a studydescription and explained the study to the experiment intheir own words. They were corrected for any misunder-standing prior to providing signed consent.In this user study, the participants were mostly requiredto perform a non-driving task. In addition, the partic-ipants were also required to monitor the performanceof the highly autonomous driving system and to inter-vene when the system makes a wrong decision. The
Session 7: Special Approaches AutomotiveUI ’18, Toronto, Canada
261
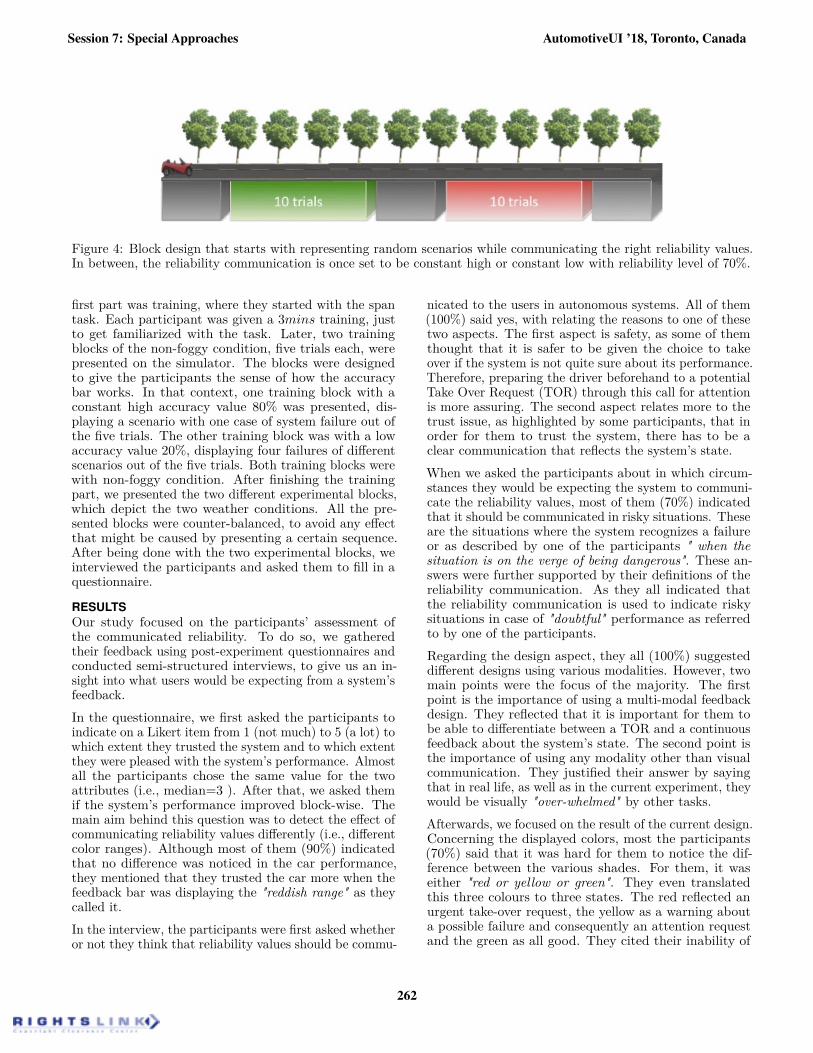
Figure 4: Block design that starts with representing random scenarios while communicating the right reliability values.In between, the reliability communication is once set to be constant high or constant low with reliability level of 70%.
first part was training, where they started with the spantask. Each participant was given a 3mins training, justto get familiarized with the task. Later, two trainingblocks of the non-foggy condition, five trials each, werepresented on the simulator. The blocks were designedto give the participants the sense of how the accuracybar works. In that context, one training block with aconstant high accuracy value 80% was presented, dis-playing a scenario with one case of system failure out ofthe five trials. The other training block was with a lowaccuracy value 20%, displaying four failures of differentscenarios out of the five trials. Both training blocks werewith non-foggy condition. After finishing the trainingpart, we presented the two different experimental blocks,which depict the two weather conditions. All the pre-sented blocks were counter-balanced, to avoid any effectthat might be caused by presenting a certain sequence.After being done with the two experimental blocks, weinterviewed the participants and asked them to fill in aquestionnaire.
RESULTSOur study focused on the participants’ assessment ofthe communicated reliability. To do so, we gatheredtheir feedback using post-experiment questionnaires andconducted semi-structured interviews, to give us an in-sight into what users would be expecting from a system’sfeedback.In the questionnaire, we first asked the participants toindicate on a Likert item from 1 (not much) to 5 (a lot) towhich extent they trusted the system and to which extentthey were pleased with the system’s performance. Almostall the participants chose the same value for the twoattributes (i.e., median=3 ). After that, we asked themif the system’s performance improved block-wise. Themain aim behind this question was to detect the effect ofcommunicating reliability values differently (i.e., differentcolor ranges). Although most of them (90%) indicatedthat no difference was noticed in the car performance,they mentioned that they trusted the car more when thefeedback bar was displaying the "reddish range" as theycalled it.In the interview, the participants were first asked whetheror not they think that reliability values should be commu-
nicated to the users in autonomous systems. All of them(100%) said yes, with relating the reasons to one of thesetwo aspects. The first aspect is safety, as some of themthought that it is safer to be given the choice to takeover if the system is not quite sure about its performance.Therefore, preparing the driver beforehand to a potentialTake Over Request (TOR) through this call for attentionis more assuring. The second aspect relates more to thetrust issue, as highlighted by some participants, that inorder for them to trust the system, there has to be aclear communication that reflects the system’s state.When we asked the participants about in which circum-stances they would be expecting the system to communi-cate the reliability values, most of them (70%) indicatedthat it should be communicated in risky situations. Theseare the situations where the system recognizes a failureor as described by one of the participants " when thesituation is on the verge of being dangerous". These an-swers were further supported by their definitions of thereliability communication. As they all indicated thatthe reliability communication is used to indicate riskysituations in case of "doubtful" performance as referredto by one of the participants.Regarding the design aspect, they all (100%) suggesteddifferent designs using various modalities. However, twomain points were the focus of the majority. The firstpoint is the importance of using a multi-modal feedbackdesign. They reflected that it is important for them tobe able to differentiate between a TOR and a continuousfeedback about the system’s state. The second point isthe importance of using any modality other than visualcommunication. They justified their answer by sayingthat in real life, as well as in the current experiment, theywould be visually "over-whelmed" by other tasks.Afterwards, we focused on the result of the current design.Concerning the displayed colors, most the participants(70%) said that it was hard for them to notice the dif-ference between the various shades. For them, it waseither "red or yellow or green". They even translatedthis three colours to three states. The red reflected anurgent take-over request, the yellow as a warning abouta possible failure and consequently an attention requestand the green as all good. They cited their inability of
Session 7: Special Approaches AutomotiveUI ’18, Toronto, Canada
262
perceiving the various colors to the high workload of thenon-driving task that required most of their attention.They also mentioned that the high update rate of thedisplayed colours confused them about the communicatedvalue.In an attempt to know what would be a suitable updaterate for them. They pointed that it’s a situation depen-dent value. All of them said that it definitely needs to bein a real-time continuous form in risky situations, thatis predefined by a specific reliability threshold value. Ingeneral, as they stated before it is good to have this clearcommunication. However, "Not much, otherwise I willnot trust the car at all" as one of the participants said.Second, positioning the LED strip over the tablet didn’tserve the purpose of easy-reach communication as weexpected. One participant said: "It was easier to shiftmy eyes directly to the road if I’m to shift my eyes any-way". Another comment was: "the bar position was on adifferent level not where I am focusing. It was an unre-liable non-noticeable thing. It could be embedded in thewind-shield for example".The last point that we were interested in knowing, wastheir opinion about granting the driver the option ofturning the automation off. Some of them answered asper their own personal preference, it is a direct yes. Asthey would first need time to trust the system beforethey totally hand it the ultimate control. Second, theywould like to feel superior to the system, in other words,controlling it not being controlled by it. For the generalgood, their answer was no, the automation feature shouldnever be turned off. From the legal aspect, who wouldbe the person to blame in fatal failing scenarios (i.e., anaccident in case of off collision avoidance feature in a fullyautonomous vehicle.). Another aspect is the fairness ofthe driving performance under different circumstances(i.e., reaction time in manual driving versus autonomoussystem).
IMPLICATIONSUser experience and acceptance.When asked about the liberty of automation use anddisuse, most participants indicated that they want to begiven the chance to either turn it on or off., as they don’tlike to be forced to use a new technology, especially if theydon’t have any previous experience with it. They fur-ther elaborated that they lacked experience with systembehaviour and the provided feedback. Therefore, theyrequired more time before they were ready to grant theautomated system "ultimate control of their lives". Thisagrees with what Dzindolet et al. discussed, namely thatdistrust in automation can arise from a lack of experienceand understanding of how a given system behaves andoperates. This can lead to system disuse, particularlywhen system failures occur that the operator cannot ex-plain [14]. Based on that, we recommend applying oneof the following approaches: (a) Providing tutorial pro-grammes that include multiple scenarios that users are
already familiar with in order to increase the intuitive-ness of the communication display. This could familiarisetargeted users with new technologies, (b) Monitoring atraining phase whenever a new technology is offered. Inthis regard, users will have to use the technology in anincremental scale (e.g., using it for 20% of the time inthe first week, 40% in the second week .... etc.). Inbrief, applying any training approach is highly favouredas it would grant the users (i.e., old generations) morefamiliarity with an automated system’s performance andinterface. As for new generations, part of passing a driv-ing test could be examining their awareness with theautonomous system feedback.Although the presented research showed the importanceof communicating the autonomous’ system reliabilityvalue, the question whether the car manufacturers wouldwant to communicate the system’s reliability at all stillneeds to be investigated. Communicating the reliabilityvalues would highlight the system’s limitations, whichcould also affect the users’ trust in the system and in aspecific manufacturer. As a result, the use (i.e., buying)or disuse of such systems might highly depend on theuser acceptance of such a new system. This puts thecar manufacturers at risk, in-case of being the first tooffer. Furthermore, it induces high pressure, in-case ofcompeting with the other manufacturers, to achieve thebest performance credibility.
Categorical perception of reliability levels.Participants’ feedback from the interview revealed thatthey perceived far fewer discrete levels of system reliabil-ity than the full spectrum that we strove to communicate,given the availability of the color levels of our visual dis-play. In other words, they perceived color ranges categor-ically instead of continuously. In fact, research in colorperception has demonstrated that our visual system sepa-rates colors into discrete categories rather as a continuousfunction of luminance [18]. Nonetheless, system reliabil-ity is a continuous parameter that automated systemscompute and can provide as output. Therefore, moreresearch is necessary to bridge this continuous measureof system reliability that is available to the categoricalperception of what humans can perceive in the first place.Two options are available that are not mutually exclu-sive: (a) the use of a display parameter that humanscan perceive continuously, (b) assessing the resolutionof system reliability that users are able to understandand appreciate being informed about. To sum up, wefind that just because system reliability is available as acontinuous and high-resolution measure does not meanthat humans need to or can perceive this information.
Feedback modalities.On the one hand, several observations of the users be-haviour towards the study indicated that our participantspreferred to have multi-modal communication in criticalsituations that required their immediate attention. Onthe other hand, our participants also mentioned thatthey preferred a single modality for reliability commu-nication and opined that visual communication was the
Session 7: Special Approaches AutomotiveUI ’18, Toronto, Canada
263
least "annoying" display modality, particularly for longjourneys. A separate early study arrived at a similarconclusion [26], which investigated driver’s workload vari-ability when presented with warning information acrossdifferent modalities (visual vs. auditory vs. multi-modal).Their result, based on the SWAT workload assessment,indicated that the perceived workload was least in themulti-modal, with a higher value in the auditory andthe highest value was scored in the visual (i.e., 4.96 vs.5.00 vs. 5.73 respectively.). Burke et al. [10], showedsimilar conclusion when they examined the driver’s per-formance presented visual-tactile (VT) vs. visual only(V) and visual-auditory (VA) vs. visual only (V). Theydemonstrated that the performance was improved in thetwo examined multi-modalities compared to visual only(For effect size g in VT-V = 0.38 and g in VA-V = 0.42).These findings are further supported with an interna-tional survey carried out by Bazinlinsky et al. [4], as theyshowed that the participants’ preference in the used TOR(Take-Over Request) modality was related to the situa-tion urgency. They highlighted that multi-modal TORs(i.e., auditory, visual and vibrotactile) were most favouredin the high-urgency situations. Hence, we suggest a multi-modal design for TORs and visual communication forcontinuous system’s reliability.
Adaptive to the non-driving task.When asked about the different display modalities thatcould be employed to communicate system reliability, par-ticipants pointed out that the feedback modality shoulddiffer from that of the non-driving task. In a previousstudy [34], no significant effect was found relating thereaction times to the modality of the communicated feed-back and that of the non-driving task. Nonetheless, theyrecommended further research on understanding potentialinteractions between situation urgency and the nature ofthe non-driving task (e.g., hands-free task). This goes inline with the findings of Gold and colleagues who showedthat the take-over performance in an autonomous vehiclewas affected by the non-driving task nature (e.g., highdemanding cognitive task) and the situation severity [15].More specifically, the cognitive demanding tasks hin-dered the take-over performance in the case of cognitivedemanding take-over situations, more than the situationswhere a take-over was easy well practiced. Based on pre-vious findings and the current feedback, we conclude thatadapting the communicated feedback to the nature of thenon-driving task—for example, in terms of its cognitivedemands—could result in a better overall performance.However, we do not recommend adapting feedback modal-ities to situation severity, as this could lead to even moreconfusion from the users’ perspective.
Reliability update rate.Our user feedback highlighted that there should be aclearly communicated threshold that defines the criti-cality of the situation. Previous studies on autonomoussystems have shown that reliability values depend on theprobabilistic error values that can be computed from dif-
ferent approaches (e.g., stochastic reachability approachfor separate time zones based on the traffic participants’behaviour [2]). A simple example is an autonomous ve-hicle that drives in the right lane and turning left ina two opposite-direction road [2]. On the one hand, ifthe stochastic reachable set indicated a close intersectingrange to the planned path of the autonomous vehicle, thesituation should be marked as unclear and, therefore, thesystem’s actual reliability should have a high-reliabilityupdate rate that changes with the proximity range tothis computed set. On the other hand, if the plannedpath is marked as clear and safe, a slower update rateshould be communicated, which would be granted lessattention. Therefore, we recommend investigating theminimum threshold, for different systems (e.g., activecruise control), after which the participants should havea continuous update rate of the system’s reliability values.
LIMITATIONSWe acknowledge the following limitations to our work.To begin, we generated specific reliability values using analgorithm. Although we aimed at creating a realistic val-ues, we based these values on the results of an algorithmand not on real world data. Thus, the reliability valuescommunicated to the participants were not linked to thereal system certainty. Nevertheless, we opted for using analgorithm to be able to show a wider range of reliabilityvalues without creating a simulation environment thatwas too complex, which could lead to further distractionin the user.Next, we provided a single display of system reliabil-ity that is presumably aggregated automatically frommultiple sensor inputs (e.g., LIDAR, vehicle-vehicle com-munications, stereo cameras, traffic statistics, etc). Itcould be possible that users might prefer multiple reli-ability displays, each related to a given sensor. Recentresearch has shown that users prefer automatic aggrega-tion of multiple data sources with related uncertainty,but that this preference varies with the perceived im-portance of the information that is presented [19]. It isworth noting that single-sensor-single-indicator displaysare associated with a higher mental workload that can befurther compromised in situations that induce high stateanxiety [1]. Therefore, attempts to introduce more relia-bility indicators for different sensors should be justifiedfor their expected utility.Finally, we used a highly controlled driving simulationwith a specific driving situation. This was deliberatelydesigned to minimize influences from the driving scene.However, due to the relatively fixed timing used in thestudy, participants could predict the next occurrence ofan overtaking situation. This could lead to a reducedattention towards the reliability communication duringthe times in-between the overtaking situations. Also,the limited number and type of possible encounteredscenarios (i.e., four) could have affected the amount ofattention paid to and the judgement of importance ofthe reliability communication.
Session 7: Special Approaches AutomotiveUI ’18, Toronto, Canada
264
GUIDELINESThe current work has revealed some important user find-ings with regards to how human-users of automated ve-hicles might respond to the communication of systemreliability. We summarise the results in terms of fiveguidelines as follows:• Guideline 1: Providing training sessions to increasethe user experience with the system behaviour andinterface. As providing the chance for the old genera-tion to gain experience in a controlled condition, wouldovercome the fear of modern technology use.
• Guideline 2: Minimalistic color design in visualisingspecific system states. As using distinctively differentcolors to represent various values would be noticeablyperceived.
• Guideline 3: Employ multi-modal system feedback,whereas reliability is preferred as visual and TORs ashaptic or auditory.
• Guideline 4: Adapting different feedback modalitiesaccording to the nature of the non-driving task. Thisis inline with the work of Large and colleagues, whoshowed that the drivers’ posture in an autonomousvehicle is relevant to the nature of the non-drivingtask [24].
• Guideline 5: Reflecting the situation criticalitythrough the communicated reliability values update-rate. In that sense, slow update rate would relateto a stable and certain driving performance. While,fast update rate would indicate an uncertain and riskyperformance.
CONCLUSIONThe introduction of autonomous vehicles into our dailylife routines will give rise to more design challenges. Howcan we design communication systems that allow humanusers that are no longer “in-the-loop” to be aware not onlyof the operational environment but also of the changingreliability of the systems that they rely on? In this paper,we conducted a user study to investigate the effect of usingvisual feedback in communicating the system’s reliabilityvalues to the user. Our qualitative results (e.g., basedon questionnaires and semi-structured interviews) implysome basic guidelines that serve as bases for reliabilitycommunication design for autonomous vehicles.More empirical work should be conducted around theseguidelines to evaluate their generalizability and robust-ness to the complex and ever-changing landscape of au-tonomous driving [23]. These findings provide new ev-idence and a base for future inspection concerning thereliability communication design in autonomous systems.
ACKNOWLEDGEMENTSThis work is financially supported by the DFG withinproject SFB-TRR161 C03.
REFERENCES1. Jonathan Allsop, Rob Gray, Heinrich Bülthoff, and
Lewis Chuang. 2017. Eye movement planning onSingle-Sensor-Single-Indicator displays is vulnerableto user anxiety and cognitive load. Journal of EyeMovement Research 10, 5 (2017).
2. Matthias Althoff. 2010. Reachability analysis and itsapplication to the safety assessment of autonomouscars. Ph.D. Dissertation. Technische UniversitätMünchen.
3. J Elin Bahner, Anke-Dorothea Hüper, and DietrichManzey. 2008. Misuse of automated decision aids:Complacency, automation bias and the impact oftraining experience. International Journal ofHuman-Computer Studies 66, 9 (2008), 688–699.
4. P Bazilinskyy, SM Petermeijer, V Petrovych, DDodou, and JCF De Winter. 2018. Take-overrequests in highly automated driving: Acrowdsourcing survey on auditory, vibrotactile, andvisual displays. Transportation Research Part F:Traffic Psychology and Behaviour 56 (2018), 82–98.
5. Johannes Beller, Matthias Heesen, and MarkVollrath. 2013. Improving the driver–automationinteraction an approach using automationuncertainty. Human Factors: The Journal of theHuman Factors and Ergonomics Society (2013),0018720813482327.
6. Myra Blanco, Jon Atwood, Holland M. Vasquez,Tammy E. Trimble, Vikki L. Fitchett, JoshuaRadlbeck, Gregory M. Fitch, Sheldon M. Russell,Charles A. Green, Brian Cullinane, and Justin F.Morgan. 2015. Human Factors Evaluation of Level 2and Level 3 Automated Driving Concepts. (ReportNo. DOT HS 812 182) August (2015), 300. DOI:http://dx.doi.org/10.13140/RG.2.1.1874.7361
7. James P Bliss, Richard D Gilson, and John EDeaton. 1995. Human probability matchingbehaviour in response to alarms of varying reliability.Ergonomics 38, 11 (1995), 2300–2312.
8. Shadan Sadeghian Borojeni, Lewis Chuang, WilkoHeuten, and Susanne Boll. 2016. Assisting driverswith ambient take-over requests in highly automateddriving. In Proceedings of the 8th InternationalConference on Automotive User Interfaces andInteractive Vehicular Applications. ACM, 237–244.
9. Sebastian Brechtel, Tobias Gindele, and RüdigerDillmann. 2014. Probabilistic decision-making underuncertainty for autonomous driving using continuousPOMDPs. In Intelligent Transportation Systems(ITSC), 2014 IEEE 17th International Conferenceon. IEEE, 392–399.
10. Jennifer L Burke, Matthew S Prewett, Ashley AGray, Liuquin Yang, Frederick RB Stilson,Michael D Coovert, Linda R Elliot, and ElizabethRedden. 2006. Comparing the effects ofvisual-auditory and visual-tactile feedback on user
Session 7: Special Approaches AutomotiveUI ’18, Toronto, Canada
265
performance: a meta-analysis. In Proceedings of the8th international conference on Multimodalinterfaces. ACM, 108–117.
11. Andrew R Conway, Michael J Kane, Michael FBunting, D. Zach Hambrick, Oliver Wilhelm, andRandall W. Engle. 2005. Working memory spantasks : A methodological review and user ’ s guide.Psychonomic Bulletin & Review 12, 5 (2005),769–786. DOI:http://dx.doi.org/10.3758/BF03196772
12. Stephen R Dixon and Christopher D Wickens. 2006.Automation reliability in unmanned aerial vehiclecontrol: A reliance-compliance model of automationdependence in high workload. Human Factors 48, 3(2006), 474–486.
13. Mary T Dzindolet, Hall P Beck, and Linda G Pierce.2000. Encouraging human operators to appropriatelyrely on automated decision aids. Technical Report.ARMY RESEARCH LAB FORT SILL OK HUMANRESEARCH AND ENGINEERING DIR.
14. Mary T Dzindolet, Scott A Peterson, Regina APomranky, Linda G Pierce, and Hall P Beck. 2003.The role of trust in automation reliance.International Journal of Human-Computer Studies58, 6 (2003), 697–718.
15. Christian Gold, Ilirjan Berisha, and Klaus Bengler.2015. Utilization of drivetime–performingnon-driving related tasks while driving highlyautomated. In Proceedings of the Human Factorsand Ergonomics Society Annual Meeting, Vol. 59.SAGE Publications Sage CA: Los Angeles, CA,1666–1670.
16. Christian Gold, Daniel Damböck, Lutz Lorenz, andKlaus Bengler. 2013. “Take over!” How long does ittake to get the driver back into the loop?. InProceedings of the Human Factors and ErgonomicsSociety Annual Meeting, Vol. 57. SAGE PublicationsSage CA: Los Angeles, CA, 1938–1942.
17. Christian Gold, Moritz Körber, David Lechner, andKlaus Bengler. 2016. Taking over control fromhighly automated vehicles in complex trafficsituations: the role of traffic density. Human factors58, 4 (2016), 642–652.
18. Robert L Goldstone and Andrew T Hendrickson.2010. Categorical perception. Wiley InterdisciplinaryReviews: Cognitive Science 1, 1 (2010), 69–78.
19. Miriam Greis, Emre Avci, Albrecht Schmidt, andTonja Machulla. 2017. Increasing Users’ Confidencein Uncertain Data by Aggregating Data fromMultiple Sources. In Proceedings of the 2017 CHIConference on Human Factors in ComputingSystems. ACM, 828–840.
20. Miriam Greis, Aditi Joshi, Ken Singer, AlbrechtSchmidt, and Tonja Machulla. 2018. UncertaintyVisualization Influences how Humans AggregateDiscrepant Information. In Proceedings of the 2018
CHI Conference on Human Factors in ComputingSystems. ACM, 505.
21. Tove Helldin, Göran Falkman, Maria Riveiro, andStaffan Davidsson. 2013. Presenting systemuncertainty in automotive UIs for supporting trustcalibration in autonomous driving. In Proceedings ofthe 5th International Conference on AutomotiveUser Interfaces and Interactive VehicularApplications. ACM, 210–217.
22. Kevin Anthony Hoff and Masooda Bashir. 2015.Trust in automation integrating empirical evidenceon factors that influence trust. Human Factors: TheJournal of the Human Factors and ErgonomicsSociety 57, 3 (2015), 407–434.
23. Andrew L Kun, Susanne Boll, and Albrecht Schmidt.2016. Shifting gears: User interfaces in the age ofautonomous driving. IEEE Pervasive Computing 15,1 (2016), 32–38.
24. David R Large, Gary Burnett, Andrew Morris, ArunMuthumani, and Rebecca Matthias. 2017. Alongitudinal simulator study to explore drivers’behaviour during highly-automated driving. InInternational Conference on Applied Human Factorsand Ergonomics. Springer, 583–594.
25. John D Lee and Katrina A See. 2004. Trust inautomation: Designing for appropriate reliance.Human Factors: The Journal of the Human Factorsand Ergonomics Society 46, 1 (2004), 50–80.
26. Yung-Ching Liu. 2001. Comparative study of theeffects of auditory, visual and multimodality displayson drivers’ performance in advanced travellerinformation systems. Ergonomics 44, 4 (2001),425–442.
27. Masha Maltz and David Shinar. 2007. Imperfectin-vehicle collision avoidance warning systems canaid distracted drivers. Transportation research partF: traffic psychology and behaviour 10, 4 (2007),345–357.
28. Neville Moray and T Inagaki. 1999. Laboratorystudies of trust between humans and machines inautomated systems. Transactions of the Institute ofMeasurement and Control 21, 4-5 (1999), 203–211.
29. Donald A Norman. 1990. The’problem’withautomation: inappropriate feedback and interaction,not’over-automation’. Philosophical Transactions ofthe Royal Society of London B: Biological Sciences327, 1241 (1990), 585–593.
30. Raja Parasuraman and Christopher A Miller. 2004.Trust and etiquette in high-criticality automatedsystems. Commun. ACM 47, 4 (2004), 51–55.
31. Raja Parasuraman, Robert Molloy, and Indramani LSingh. 1993. Performance consequences ofautomation-induced’complacency’. The InternationalJournal of Aviation Psychology 3, 1 (1993), 1–23.
Session 7: Special Approaches AutomotiveUI ’18, Toronto, Canada
266
32. Raja Parasuraman, Thomas B Sheridan, andChristopher D Wickens. 2008. Situation awareness,mental workload, and trust in automation: Viable,empirically supported cognitive engineeringconstructs. Journal of Cognitive Engineering andDecision Making 2, 2 (2008), 140–160.
33. Raja Parasuraman and Christopher D Wickens.2008. Humans: Still vital after all these years ofautomation. Human Factors: The Journal of theHuman Factors and Ergonomics Society 50, 3(2008), 511–520.
34. Sebastiaan Petermeijer, Fabian Doubek, and Joostde Winter. 2017. Driver response times to auditory,visual, and tactile take-over requests: A simulatorstudy with 101 participants. In Systems, Man, andCybernetics (SMC), 2017 IEEE InternationalConference on. IEEE, 1505–1510.
35. Nadine B Sarter, David D Woods, and Charles EBillings. 1997. Automation surprises. Handbook ofhuman factors and ergonomics 2 (1997), 1926–1943.
36. Kristin E Schaefer, Jessie YC Chen, James LSzalma, and Peter A Hancock. 2016. Ameta-analysis of factors influencing the developmentof trust in automation: Implications forunderstanding autonomy in future systems. Humanfactors 58, 3 (2016), 377–400.
37. Albrecht Schmidt and Thomas Herrmann. 2017.Intervention User Interfaces: A New InteractionParadigm for Automated Systems. interactions 24, 5(Aug. 2017), 40–45. DOI:http://dx.doi.org/10.1145/3121357
38. Society of Automotive Engineers. 2014. Automateddriving levels of driving automation are defined innew SAE international standard J3016. (January2014). [Online].
39. Robert D Sorkin, Barry H Kantowitz, and Susan CKantowitz. 1988. Likelihood alarm displays. HumanFactors 30, 4 (1988), 445–459.
40. Richard I Thackray and R MARK TOUCHSTONE.1989. Effects of high visual taskload on thebehaviours involved in complex monitoring.Ergonomics 32, 1 (1989), 27–38.
41. Guy H Walker, Neville A Stanton, and Paul Salmon.2016. Trust in vehicle technology. Internationaljournal of vehicle design 70, 2 (2016), 157–182.
42. Christopher D Wickens, Benjamin A Clegg, Alex ZVieane, and Angelia L Sebok. 2015. Complacencyand automation bias in the use of imperfectautomation. Human Factors: The Journal of theHuman Factors and Ergonomics Society (2015),0018720815581940.
Session 7: Special Approaches AutomotiveUI ’18, Toronto, Canada
267


