Embed Size (px)
Citation preview

This article was downloaded by: [Universidad Autonoma de Barcelona]On: 19 January 2012, At: 06:55Publisher: Taylor & FrancisInforma Ltd Registered in England and Wales Registered Number: 1072954 Registered office: Mortimer House,37-41 Mortimer Street, London W1T 3JH, UK
International Journal of Human-Computer InteractionPublication details, including instructions for authors and subscription information:http://www.tandfonline.com/loi/hihc20
Designing Inclusive Interfaces Through User Modelingand SimulationPradipta Biswas a , Peter Robinson b & Patrick Langdon aa Department of Engineering, University of Cambridge, UKb Computer Laboratory, University of Cambridge, UK
Available online: 24 Jun 2011
To cite this article: Pradipta Biswas, Peter Robinson & Patrick Langdon (2012): Designing Inclusive Interfaces Through UserModeling and Simulation, International Journal of Human-Computer Interaction, 28:1, 1-33
To link to this article: http://dx.doi.org/10.1080/10447318.2011.565718
PLEASE SCROLL DOWN FOR ARTICLE
Full terms and conditions of use: http://www.tandfonline.com/page/terms-and-conditions
This article may be used for research, teaching, and private study purposes. Any substantial or systematicreproduction, redistribution, reselling, loan, sub-licensing, systematic supply, or distribution in any form toanyone is expressly forbidden.
The publisher does not give any warranty express or implied or make any representation that the contentswill be complete or accurate or up to date. The accuracy of any instructions, formulae, and drug doses shouldbe independently verified with primary sources. The publisher shall not be liable for any loss, actions, claims,proceedings, demand, or costs or damages whatsoever or howsoever caused arising directly or indirectly inconnection with or arising out of the use of this material.
Intl. Journal of Human–Computer Interaction, 28: 1–33, 2012Copyright © Taylor & Francis Group, LLCISSN: 1044-7318 print / 1532-7590 onlineDOI: 10.1080/10447318.2011.565718
Designing Inclusive Interfaces Through User Modelingand Simulation
Pradipta Biswas1, Peter Robinson2, and Patrick Langdon1
1Department of Engineering, University of Cambridge, UK2Computer Laboratory, University of Cambridge, UK
Elderly and disabled people can be hugely benefited throughthe advancement of modern electronic devices, as those can helpthem to engage more fully with the world. However, existing designpractices often isolate elderly or disabled users by consideringthem as users with special needs. This article presents a simula-tor that can reflect problems faced by elderly and disabled userswhile they use computer, television, and similar electronic devices.The simulator embodies both the internal state of an applicationand the perceptual, cognitive, and motor processes of its user.It can help interface designers to understand, visualize, and mea-sure the effect of impairment on interaction with an interface.Initially a brief survey of different user modeling techniques ispresented, and then the existing models are classified into dif-ferent categories. In the context of existing modeling approachesthe work on user modeling is presented for people with a widerange of abilities. A few applications of the simulator, which showsthe predictions are accurate enough to make design choices andpoint out the implication and limitations of the work, are alsodiscussed.
Not only do physically disabled people have experiences whichare not available to the able bodied, they are in a better position totranscend cultural mythologies about the body, because they cannotdo things the able-bodied feel they must do in order to be happy,“normal,” and sane. If disabled people were truly heard, an explosionof knowledge of the human body and psyche would take place. —Susan Wendell (1996, p. 77)
1. INTRODUCTIONThe World Health Organization (2011) states that the num-
ber of people aged 60 and older will be 1.2 billion by 2025 and2 billion by 2050. The very old (age 80 or older) is the fastest
The work is funded by a Gates Cambridge Scholarship andthe European Union FP7, Accessible and Assistive Information andCommunication Technologies grant: “GUIDE–Gentle User Interfacesfor Disabled and Elderly Citizens.” We thank the editor and review-ers for their insightful comments in preparing the manuscript and ourparticipants for taking part in our studies.
Address correspondence to Pradipta Biswas, Departmentof Engineering, University of Cambridge, Trumpington Street,Cambridge, CB2 1PZ United Kingdom. E-mail: [email protected]
growing population group in the developed world. Many ofthese elderly people have disabilities that make it difficultfor them to use computers. The definition of the term “dis-ability” differs across countries and cultures, but the WorldBank (2011) estimates a rate of 10 to 12% of the popula-tion worldwide having a condition that inhibits their use ofstandard computer systems. The Americans with DisabilitiesAct in the United States and the Disability Discrimination Actin the United Kingdom prohibit any discrimination betweenable-bodied and disabled people with respect to education,service, and employment. There are also ethical and socialreasons for designing products and services for this vastpopulation.
However, existing design practices often isolate elderly ordisabled users by considering them users with special needs anddo not consider their problems during the design phase. Laterthey try to solve the problem by providing a few accessibil-ity features. Considering any part of the society as “special”can never solve the accessibility problems of interactive sys-tems. Unfortunately, existing accessibility guidelines are alsonot adequate to analyze the effects of impairment on interac-tion with devices. So designers should consider the range ofabilities of users from the early design process so that anyapplication they develop can either adapt to users with a widerange of abilities or specify the minimum capability of usersit requires. For example a smartphone should either automat-ically adapt the screen content for different zooming levelsor specify the minimum visual acuity required to read thescreen.
In this article we have presented a simulation system thathelps to develop inclusive systems by
• helping designers in understanding the problems facedby people with different range of abilities, knowledge,and skill;
• providing designers a tool to make interactive systemsinclusive;
• assisting designers in evaluating systems with respectto people with a wide range of abilities; and
1
Dow
nloa
ded
by [
Uni
vers
idad
Aut
onom
a de
Bar
celo
na]
at 0
6:55
19
Janu
ary
2012

2 P. BISWAS ET AL.
• modifying the design process of interactive system to
◦ evaluate the scope of it with respect to the range ofabilities of users and
◦ investigate the possibilities of adaptation of theinterfaces for catering users with different ranges ofabilities.
The simulator can predict the likely interaction patterns whenundertaking a task using a variety of input devices and esti-mate the time to complete the task in the presence of differentdisabilities and for different levels of skill. Figure 1 shows theintended use of the simulator. We aim to help evaluate existingsystems and different design alternatives with respect to manytypes of disability. The evaluation process would be used toselect a particular interface, which can then be validated by aformal user trial. The user trials also provide feedback to themodels to increase their accuracy. As each alternative designdoes not need to be evaluated by a user trial, it will reduce thedevelopment time significantly.
The article is organized as follows. In the next section, wepresent a detailed survey on existing works on human behaviorsimulation. In the context of earlier works, we have presentedthe simulator in section 3. The rest part of the article describesthree applications of the simulator. Each application simulates aparticular task (like icon searching or menu selection) and thenvalidates the simulation with user trials involving users with andwithout disabilities. Section 6 introduces the GUIDE Project,which is currently using the simulation. Finally we discuss theimplications and limitations of this work in section 7 and drawnour conclusion in section 8.
2. USER MODELSA model can be defined as a simplified representation
of a system or phenomenon with any hypotheses requiredto describe the system or explain the phenomenon, oftenmathematically. The concept of modeling is widely used indifferent disciplines of science and engineering, ranging frommodels of neurons or different brain regions in neurologyto construction model in architecture or model of universe
in theoretical physics. Modeling human or human systems iswidely used in different branches of physiology, psychology,and ergonomics. A few of these models are termed as user mod-els when their purpose is to design better consumer products.By definition a user model is a representation of the knowledgeand preferences of users (Benyon & Murray, 1993).
Research on simulating user behavior to predict machineperformance was originally started during the Second WorldWar. Researchers tried to simulate operators’ performanceto explore their limitations while operating different militaryhardware. During the same time, computational psycholo-gists were trying to model the mind by considering it asan ensemble of processes or programs. McCulloch and Pitts’(1943) model of the neuron and subsequent models of neuralnetworks and Marr’s (1980) model of vision are two influentialworks in this discipline. Boden (1985) presented a detaileddiscussion of such computational mental models. In the late1970s, as interactive computer systems became cheaper andaccessible to more people, modeling human–computer inter-action (HCI) also gained much attention. However, modelslike Hick’s Law (Hick, 1952) or Fitts’ Law (Fitt, 1954),which predict visual search time and movement time, respec-tively, were individually not enough to simulate a wholeinteraction.
The Command Language Grammar developed by Moran(1981) at Xerox PARC could be considered the first HCImodel. It took a top-down approach to decompose an interac-tion task and gave a conceptual view of the interface beforeits implementation. However it completely ignored the humanaspect of the interaction and did not model the capabilities andlimitations of users. Card, Moran, and Newell’s (1983) ModelHuman Processor was an important milestone in modelingHCI because it introduced the concept of simulating HCI fromthe perspective of users. It gave birth to the GOMS familyof models (Card et al., 1983) that are still the most popularmodeling tools in HCI.
There is another kind of model for simulating human behav-ior that not only works for HCI but also aims to establish aunified theory of cognition. These types of models originatedfrom the earlier work of computational psychologists. Allen
Best Alternative
PrototypeSystems
ExistingSystems
SimulationUser
TestingNew
Systems
Interaction Patterns
FIG. 1. Use of the simulator.
Dow
nloa
ded
by [
Uni
vers
idad
Aut
onom
a de
Bar
celo
na]
at 0
6:55
19
Janu
ary
2012

DESIGNING INCLUSIVE INTERFACES 3
Newell (1973) pioneered the idea of unifying existing theoriesin cognition in his famous paper “You Can’t Play 20 QuestionsWith Nature and Win” at the 1973 Carnegie Symposium. Sincethen, a plethora of systems have been developed that are termedas cognitive architectures, and they simulate the results ofdifferent experiments conducted in psychological laboratories.Because these models are capable (or at least demanded to becapable) of simulating any type of user behavior, they are alsooften used to simulate the behavior of users while interact-ing with a computer. Gray, Young, and Kirschenbaum (1997)asserted that cognitive architectures ensure the development ofconsistent models over a range of behavioural phenomena dueto their rigorous theoretical basis.
So there are two main approaches of user modeling: TheGOMS family of models was developed only for HCI, whereasthe models involving cognitive architectures took a moredetailed view of human cognition. Based on the accuracy,detail, and completeness of these models, Kieras (2005) classi-fied them as low-fidelity and high-fidelity models, respectively.These two types of model can be roughly mapped to twodifferent types of knowledge representation. The GOMS fam-ily of models is based on goal-action pairs and correspondsto the Sequence/Method representation, whereas cognitivearchitectures aim to represent the users’ mental model (Carroll& Olson, 1990). The Sequence/Method representation assumesthat all interactions consist of a sequence of operations orgeneralized methods, whereas the mental model representationassumes that users have an underlying model of the wholesystem.
There is a third kind of model in HCI that evaluates aninterface by predicting users’ expectations, rather than theirperformance (e.g., Task Action Language [Reisner, 1981], TaskAction Grammar [Payne & Green, 1986], etc.). These modelsrepresent an interaction by using formal grammar where eachaction is modeled by a sentence. They can be used to com-pare users’ performance based on standard sentence complexitymeasures; however, they have not yet been used and testedextensively for simulating users’ behavior (Carroll & Olson,1990).
In the following sections, we briefly describe these differenttypes of user model, followed by a critical review of existingmodels, and set out the objectives of this research.
2.1. The GOMS Family of ModelsGOMS stands for Goals, Operators, Method and Selection.
It was inspired by the GPS system developed by Newell (Newell& Simon, 1995). It assumes that people interact with a com-puter to achieve a goal by selecting a method, which consistsof a sequence of basic operations. The GOMS model enablesa designer to simulate the sequence of actions of a user whileundertaking a task by decomposing the task into goals and sub-goals (John & Kieras, 1996). There are many variations of theoriginal GOMS model.
The keystroke level (KLM) model (Card et al., 1983) sim-plifies the GOMS model by eliminating the goals, methods, andselection rules, leaving only six primitive operators:
1. Pressing a key2. Moving the pointing device to a specific location.3. Making pointer drag movements.4. Performing mental preparation.5. Moving hands to appropriate locations.6. Waiting for the computer to execute a command.
The durations of these six operations have been empiricallydetermined. The task completion time is predicted by the num-ber of times each type of operation must occur to accomplishthe task.
Kieras developed a structured language representation ofGOMS model, called Natural GOMS Language (NGOMSL;Kieras, 1994). Originally, it was an attempt to represent the con-tent of a cognitive complexity theory (CCT) model (Johnson,1992) at a higher level of notation. CCT is a rule-based systemdeveloped by Bovaria, Kieras, and Polson (1990) to modelthe knowledge of users of an interactive computer system. InNGOMSL, the methods of the original GOMS model are repre-sented in terms of production rules of the CCT model. Kieras,Wood, Abotel, and Hornof (1995) also developed a modelingtool, GLEAN (GOMS Language Evaluation and Analysis),to execute NGOMSL. It simulates the interaction between asimulated user with a simulated device for undertaking a task.
John and Kieras (1996) proposed a new version of theGOMS model, called CPM-GOMS, to explore the parallelismin users’ actions. This model decomposes a task into an activ-ity network (instead of a serial stream) of basic operations (asdefined by KLM) and predicts the task completion time basedon the Critical Path Method.
2.2. Cognitive ArchitecturesAllen Newell (1990) developed the State Operator And
Result (SOAR) architecture as a possible candidate for his uni-fied theories of cognition. According to Newell (1990) andJohnson-Laird (1988), the vast variety of human response func-tions for different stimuli in the environment can be explainedby a symbolic system. So the SOAR system models human cog-nition as a rule-based system and any task is carried out bya search in a problem space. The heart of the SOAR systemis its chunking mechanism. Chunking is “a way of convertinggoal-based problem solving into accessible long-term memory(productions)” (Newell, 1990). It operates in the following way.During a problem-solving task, whenever the system cannotdetermine a single operator for achieving a task and thus cannotmove to a new state, an impasse is said to occur. An impassemodels a situation where a user does not have sufficient knowl-edge to carry out a task. At this stage SOAR explores allpossible operators and selects the one that brings it nearest tothe goal. It then learns a rule that can solve a similar situation
Dow
nloa
ded
by [
Uni
vers
idad
Aut
onom
a de
Bar
celo
na]
at 0
6:55
19
Janu
ary
2012

4 P. BISWAS ET AL.
in future. Laird, Rosenbloom, and Newell (1994) successfullyexplained the power law of practice through the chunkingmechanism.
However, there are certain aspects of human cognition(such as perception, recognition, motor action) that can bet-ter be explained by a connectionist approach than a symbolicone (Oka, 1991). It is believed that initially conscious pro-cesses control our responses to any situation and after suffi-cient practice, automatic processes are in charge for the sameset of responses (Hampson & Morris, 1996). Lallement andAlexandre (1997) classified all cognitive processes into syn-thetic or analytical processes. Synthetic operations are con-cerned with low-level, nondecomposable, unconscious, percep-tual tasks. In contrast, analytical operations signify high-level,conscious, decomposable, reasoning tasks. From the modelingpoint of view, synthetic operations can be mapped on toconnectionist models, whereas analytic operations correspondto symbolic models. Considering these facts, the AdaptiveControl of Thought–Rational (ACT–R) system (Anderson &Lebiere, 1998) does not follow the pure symbolic modelingstrategy of the SOAR; rather, it was developed as a hybridmodel, which has both symbolic and subsymbolic levels ofprocessing. At the symbolic level, ACT–R operates as a rule-based system. It divides the long-term memory into declarativeand procedural memory. Declarative memory is used to storefacts in the form of “chunks” and the procedural memorystores production rules. The system works to achieve a goalby firing appropriate productions from the production mem-ory and retrieving relevant facts from the declarative memory.However, the variability of human behavior is modeled atthe subsymbolic level. The long-term memory is implementedas a semantic network. Calculation of the retrieval time ofa fact and conflict resolution among rules is done based onthe activation values of the nodes and links of the semanticnetwork.
The Executive-Process/Interactive Control (Kieras &Meyer, 1990), or EPIC, architecture pioneers to incorporateseparate perception and motor behavior modules in a cognitivearchitecture. It mainly concentrates on modeling the capabilityof simultaneous multiple task performance of users. It alsoinspired the ACT–R architecture to install separate perceptionand motor modules and developing the ACT–R/PM system.A few examples of their usage in HCI are the modeling ofmenu searching and icon searching tasks (Byrne, 2001; Hornof& Kieras 1997).
The Constraint-based Optimizing Reasoning Engine (Enget al., 2006; Howes, Vera, Lewis, & McCurdy, 2004; Tollingeret al., 2005), or CORE, system takes a different approach tomodel cognition. Instead of a rule-based system, it modelscognition as a set of constraints and an objective function.Constraints are specified in terms of the relationship betweenevents in the environment, tasks, and psychological processes.Unlike the other systems, it does not execute a task hierarchy;rather, prediction is obtained by solving a constraint satisfactionproblem. The objective function of the problem can be tuned tosimulate the flexibility in human behavior.
There exist additional cognitive architectures (such asInteractive Cognitive Subsystems [Barnard, 2011], Apex,DUAL, CLARION [“Cognitive Architecture,” n.d.], etc.), butthey are not yet as extensively used as the previously discussedsystems.
2.3. Grammar-Based ModelsThe grammar-based model (such as task action grammar
[Payne & Green, 1986] and task action language [Reisner,1981]) simulates an interaction in the form of grammaticalrules. As for example, task action language models
• Operations by Terminal symbols• Interaction by a Set of rules• Knowledge by Sentences
This type of modeling is quite useful to compare different inter-action techniques. However, they are more relevant to modelknowledge and competence of a user than performance.
2.4. Application-Specific ModelsA lot of work has been done on user modeling for develop-
ing customizable applications. These models have the followinggeneric structure (Figure 2). They maintain a user profile anduse different types of Artificial Intelligence systems to pre-dict performance. The user profile section stores detail aboutuser relevant for a particular application and inference machineuse this information to personalize the system. A plethora ofexamples of such models can be found in the User Modelingand User-Adapted Interaction journal and the proceedings ofthe User Modeling, Adaptation and Personalization conference.This type of models is particularly popular in online recom-mender or help systems. A few representative applications ofsuch models are as follows.
FIG. 2. Application-specific user models (color figure available online).
Dow
nloa
ded
by [
Uni
vers
idad
Aut
onom
a de
Bar
celo
na]
at 0
6:55
19
Janu
ary
2012

DESIGNING INCLUSIVE INTERFACES 5
The generative user model (Motomura, Yoshida, &Fujimoto, 2000) was developed for personalized informationretrieval. In this model, input query words are related to user’smental state and retrieved object using latent probabilistic vari-ables. Norcio (1989) used fuzzy logic to classify users of anintelligent tutoring system. The fuzzy groups are used to derivecertain characteristic of the user and thus deriving new rules foreach class of user. Norcio and Chen (1992) also used an artificialneural network for the same purpose as in their previous work(Norcio, 1989). In their model, users’ characteristics are storedas an image, and neural networks are used to find patterns inusers’ knowledge, goals, and so on. Yoshida and Motoda (1996)similarly developed the Clipboard system to automate complextask execution using a single command based on previouslyexecuted commands.
The Lumiere Convenience Project (Horovitz, Breese,Heckerman, Hovel, & Rommelse, 1998) used influence dia-gram in modeling users. The Lumiere project is the backgroundtheory of the Office Assistant shipped with the MicrosoftOffice application. The influence diagram models the relation-ships among users’ needs, goals, user background, and so on.However, all these models are developed by keeping only a sin-gle application in mind and so they are hardly usable to modelhuman performance in general.
2.5. ReviewThe GOMS family of models is mainly suitable for modeling
the optimal behavior (skilled behavior) of users (John & Kieras,1996). These models assume that for each instance of a task exe-cution, the goal and the plan of a user are determined before theexecution is started. During execution of a task, a novice firsttime user or a knowledgeable intermittent user may not havea fixed plan beforehand and can even change goals (or sub-goals) during execution of the task. Even expert users do notfollow a fixed sequence of actions every time. So the assump-tions of the GOMS model may not hold true for many real-lifeinteractions. In actuality, these models do not have probabilisticcomponents beyond the feature of selecting the execution timeof primitive operators from a statistical distribution in order tomodel the uncertainty involved in the suboptimal behaviour ofusers. As it fails to model the suboptimal behavior, it cannot beused to predict the occurrences of different errors during inter-action. These problems are common for any Sequence/Methodrepresentations as these ways of representations overlook theunderlying mental models of users (Caroll & Olson, 1990).
On the other hand, cognitive architectures model the uncer-tainty of human behavior in detail but they are not easilyaccessible to nonpsychologists, and this causes problem asinterface designers are rarely psychologist as well. For exam-ple, the ACT–R architecture models the content of a long-termmemory in the form of a semantic network, but it is very difficultfor an interface designer to develop a semantic network of therelated concepts of a moderately complex interface. Developing
a sequence of production rules for SOAR or a set of constraintsfor CORE is equally difficult. The problem in usability issues ofcognitive architectures is also supported by the development ofthe X-PRT system (Tollinger et al., 2005) for the CORE archi-tecture. In addition, Kieras (2005) has shown that a high-fidelitymodel cannot always outperform a low-fidelity one, though it isexpected to do so.
Researchers have already attempted to combine the GOMSfamily of models and cognitive architectures to develop moreusable and accurate models. Salvucci and Lee (2003) developedthe ACT–Simple model by translating basic GOMS operations(such as move hand, move mouse, press key) into ACT–R pro-duction rules. However they do not model the “think” operatorin detail, which corresponds to the thinking action of users anddifferentiates novices from experts. The model works well inpredicting expert performance but does not work for novices.
Blandford, Butterworth, and Curzon (2004) implemented theProgrammable User Model (PUM; Young, Green, & Simon,1989) by using the SOAR architecture. They developed a pro-gram, the SOAR Translation from Instruction Language madeEasy (or STILE), to convert the PUM Instruction Language intoSOAR production rules. However, this approach also demandsgood knowledge of SOAR on the part of an interface designer.Later, the PUM team identified additional problems with run-able user models, and they are now investigating abstractmathematical models (Butterworth & Blandford, 1997).
The CogTool system (http://cogtool.hcii.cs.cmu.edu/) com-bines GOMS models and ACT–R system for providing quan-titative prediction on interaction. The system simulates expertperformance through GOMS modeling, whereas the ACT–Rsystem helps to simulate exploratory behavior of novice users(John, Prevas, Salvucci, & Koedinger, 2004). The system alsoprovides graphical user interfaces to quickly prototype inter-faces and to evaluate different design alternatives based onquantitative prediction (John, 2010). However, it does not yetseem to be used for users with disability or assistive interactiontechniques.
There also exist some application-specific models that com-bine GOMS models with a cognitive architecture. For example,Gray and Sabnani (Gray & Sabnani, 1994) combined GOMSwith ACT–R to model a VCR programming task, whereasPeck and John (1992) used SOAR to model interaction with ahelp-browser, which ultimately turned out to be a GOMS model.
Another problem of existing modeling approaches stemsfrom issues related to disability. Researchers have concentratedon designing assistive interfaces for many different applications,including
• Web browsers• Augmentative and alternative communication aids• New interaction techniques• Scanning interfaces• Gravity wells• Novel hardware interfaces
Dow
nloa
ded
by [
Uni
vers
idad
Aut
onom
a de
Bar
celo
na]
at 0
6:55
19
Janu
ary
2012
6 P. BISWAS ET AL.
• Head-mounted switches• Eye gaze trackers• Brain–computer interfaces
Most of these works concentrate on a particular applicationor a set of users, which reduces the scalability of the overallapproach. Furthermore, developing systems for a small segmentof market often makes the system very costly.
There is not much reported work on systematic modellingof assistive interfaces. McMillan (1992) felt the need to useHCI models to unify different research streams in assistive tech-nology, but his work aimed to model the system rather thanthe user. The AVANTI project (Stephanidis & Constantinou,2003; Stephanidis et al., 1998) modeled an assistive interfacefor a web browser based on static and dynamic characteristicsof users. The interface is initialized according to static charac-teristics (such as age, expertise, type of disability, etc.) of theuser. During interaction, the interface records users’ interactionand adapts itself based on dynamic characteristics (such as idletime, error rate, etc.) of the user. This model works based ona rule-based system and does not address the basic perceptual,cognitive, and motor behavior of users, so it is hard to generalizeto other applications.
The EASE tool (Mankoff, Fait, & Juang, 2005) simulateseffects of interaction for a few visual and mobility impairments.However the model is demonstrated for a sample applicationof using word prediction software but not yet validated forbasic pointing or visual search tasks performed by people withdisabilities.
Keates, Clarkson, and Robinson (2000) measured the dif-ference between able-bodied and motor-impaired users withrespect to the Model Human Processor (Card et al., 1983), andmotor impaired users were found to have a greater motor actiontime than their able-bodied counterparts. The finding is obvi-ously important, but the KLM model itself is too primitive tomodel complex interaction and especially the performance ofnovice users.
Serna, Pigot, and Rialle (2007) used ACT–R cognitive archi-tecture (Anderson & Libiere, 1998) to model progress ofdementia in Alzheimer’s patients. They simulated the loss ofmemory and increase in error for a representative task at kitchenby changing different ACT–R parameters (Anderson & Libiere,1998). The technique is interesting, but their model still needsrigorous validation through other tasks and user communities.
Our previous user model (Biswas, Bhattacharyya, &Samanta, 2005) also took a more generalized approach thanthe AVANTI project. It broke down the task of user modelinginto several steps that included clustering users based on theirphysical and cognitive ability, customizing interfaces based onuser characteristics, and logging user interactions to update themodel itself. However, the objective of this model was to designadaptable interfaces and not to simulate users’ performance.
Gajos, Wobbrock, and Weld (2007) developed a model topredict pointing time of users with mobility impairment and
adapt interfaces based on the prediction. They estimated themovement time by selecting a set of features from a pool ofseven functions of movement amplitude and target width, andthen using the selected features in a linear regression model.This model shows interesting characteristics of movement pat-terns among different users but fails to develop a single modelfor all. Movement patterns of different users are found to beinclined to different functions of distance and width of targets.
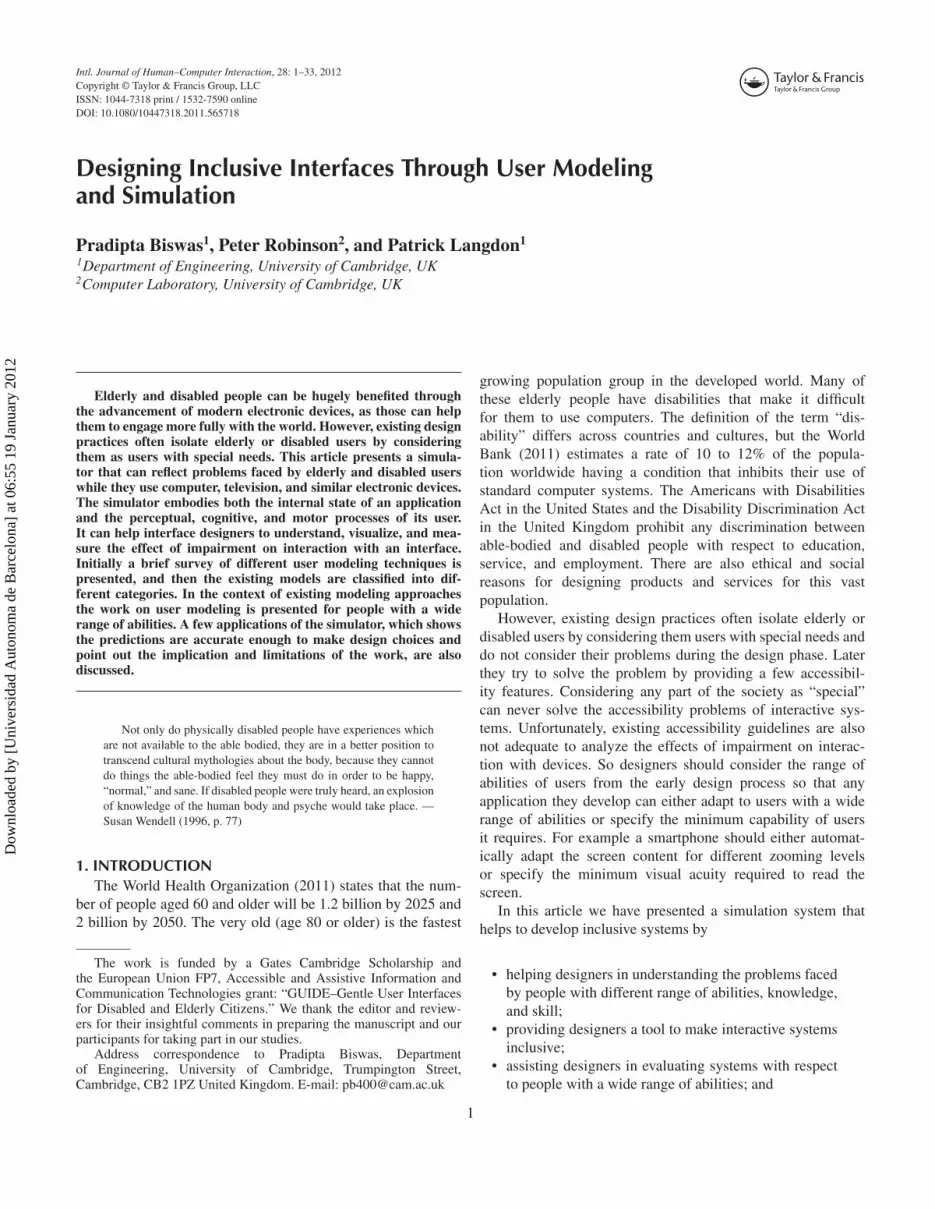
3. THE SIMULATORBased on the previous discussion, Figure 3 plots the existing
general purpose HCI models in a space defined by the skill andphysical ability of users. To cover most of the blank spaces inthe diagram, we need models that can
• Simulate HCI of both able-bodied and disabled users.• Work for users with different levels of skill.• Be easy to use and comprehend for an interface
designer.
To address the limitations of existing user modeling systems,we have developed the simulator (Biswas, 2010) as shown inFigure 4. It consists of the following three components:
The Application model represents the task currently under-taken by the user by breaking it up into a set of simpleatomic tasks following KLM model (Card et al., 1983).
The Interface model decides the type of input and outputdevices to be used by a particular user and sets parametersfor an interface.
The User model simulates the interaction patterns of usersfor undertaking a task analyzed by the task model underthe configuration set by the interface model. It uses thesequence of phases defined by Model Human Processor(Card et al., 1983).
• The perception model simulates the visual perceptionof interface objects. It is based on the theories of visualattention.
Physical Ability
KLM for Disabled
Skilllevel
Novice
Expert
Disabled Able-bodied
SOARACT-R
Core
GOMS
CPM-GOMS EPIC
FIG. 3. Existing human–computer interaction models with respect to skill andphysical ability of users (color figure available online).
Dow
nloa
ded
by [
Uni
vers
idad
Aut
onom
a de
Bar
celo
na]
at 0
6:55
19
Janu
ary
2012

DESIGNING INCLUSIVE INTERFACES 7
FIG. 4. Architecture of the simulator (color figure available online).
• The cognitive model determines an action to accom-plish the current task. It is more detailed than theGOMS model (John & Kieras, 1996) but not as com-plex as other cognitive architectures.
• The motor behavior model predicts the completiontime and possible interaction patterns for performingthat action. It is based on statistical analysis of screennavigation paths of disabled users.
The details about users are store in xml format in the user profilefollowing the ontology shown in Figure 5. The ontology storesdemographic detail of users like age and sex and divide the func-tional abilities in perception, cognition, and motor action. Theperception, cognitive, and motor behavior models takes inputfrom the respective functional abilities of users.
The perception model (Biswas & Robinson, 2009a) simu-lates the phenomenon of visual perception (like focusing andshifting attention). We have investigated eye gaze patterns(using a Tobii X120 eye tracker) of people with and withoutvisual impairment. The model uses a backpropagation neuralnetwork to predict eye gaze fixation points and can also sim-ulate the effects of different visual impairments (like Maccular
Degeneration, color blindness, Diabetic Retinopathy, etc.) usingimage processing algorithms. Figure 6 shows the actual and pre-dicted eye movement paths (green line for actual, black line forpredicted) and points of eye gaze fixations (overlapping greencircles) during a visual search task. The figure shows the pre-diction for a protanope (a type of color blindness) participant,and so the right-hand figure is different from the left hand oneas the effect of protanopia was simulated on the input image.
The cognitive model (Biswas & Robinson, 2008) breaks upa high-level task specification into a set of atomic tasks to beperformed on the application in question. The operation of itis illustrated in Figure 7. At any stage, users have a fixed policybased on the current task in hand. The policy produces an action,which in turn is converted into a device operation (e.g., clickingon a button, selecting a menu item, etc.). After application ofthe operation, the device moves to a new state. Users have tomap this state to one of the states in the user space. Then theyagain decide a new action until the goal state is achieved.
Besides performance simulation, the model also has the abil-ity to learn new techniques for interactions. Learning can occureither offline or online. The offline learning takes place whenthe user of the model (such as an interface designer) adds new
FIG. 5. User ontology. Note. STM = short-term memory; EIQ = emotional intelligent quotient; CS = Contrast Sensitivity; CB = Colour Blindness; GS = GripStrength, ROM = Range of Motion (color figure available online).
Dow
nloa
ded
by [
Uni
vers
idad
Aut
onom
a de
Bar
celo
na]
at 0
6:55
19
Janu
ary
2012

8 P. BISWAS ET AL.
FIG. 6. Eye movement trajectory for a user with color blindness (color figure available online).
OperationOld User
State
Action toOperationMapping
New UserState
Old DeviceState
New DeviceState
State Mapping
Action
User Space Device Space Mapping
FIG. 7. Sequence of events in an interaction (color figure available online).
states or operations to the user space. The model can also learnnew states and operations itself. During execution, whenever themodel cannot map the intended action of the user into an opera-tion permissible by the device, it tries to learn a new operation.To do so, it first asks for instructions from outside. The interfacedesigner is provided with the information about previous, cur-rent, and future states, and he can choose an operation on behalfof the model. If the model does not get any external instruc-tions, then it searches the state transition matrix of the devicespace and selects an operation according to the label matchingprinciple (Rieman & Young, 1996). If the label matching prin-ciple cannot return a prospective operation, it randomly selectsan operation that can change the device state in a favorable way.It then adds this new operation to the user space and updates thestate transition matrix of the user space accordingly. In the sameway, the model can also learn a new device state. Whenever itarrives in a device state unknown to the user space, it adds thisnew state to the user space. It then selects or learns an opera-tion that can bring the device into a state desirable to the user.If it cannot reach a desirable state, it simply selects or learnsan operation that can bring the device into a state known tothe user.
The model can also simulate the practice effect of users.Initially the mapping between the user space and the device
space remains uncertain. It means that the probabilities for eachpair of state/action in the user space and state/operation in thedevice space are less than 1. After each successful completionof a task the model increases the probabilities of those mappingsthat lead to the successful completion of the task, and after suf-ficient practice the probability values of certain mappings reach1. At this stage the user can map his space unambiguously tothe device space and thus behave optimally.
The motor behavior model (Biswas & Robinson, 2009b)is developed by statistical analysis of cursor traces frommotor-impaired users. We have evaluated hand strength (using aBaseline 7-pc Hand Evaluation Kit) of able-bodied and motor-impaired people and investigated how hand strength affectsHCI. Based on the analysis, we have developed a regressionmodel to predict pointing time. Figure 8 shows an example ofthe output from the model. The thin purple line shows a sampletrajectory of mouse movement of a motor-impaired user. It canbe seen that the trajectory contains random movements near thesource and the target. The thick red and black lines encircle thecontour of these random movements. The area under the con-tour has a high probability of missed clicks as the movement israndom there and thus lacks control.
These models do not need detailed knowledge of psychologyor programming to operate. They have graphical user interfaces
Dow
nloa
ded
by [
Uni
vers
idad
Aut
onom
a de
Bar
celo
na]
at 0
6:55
19
Janu
ary
2012

DESIGNING INCLUSIVE INTERFACES 9
FIG. 8. Mouse movement trajectory for a user with cerebral palsy (color figure available online).
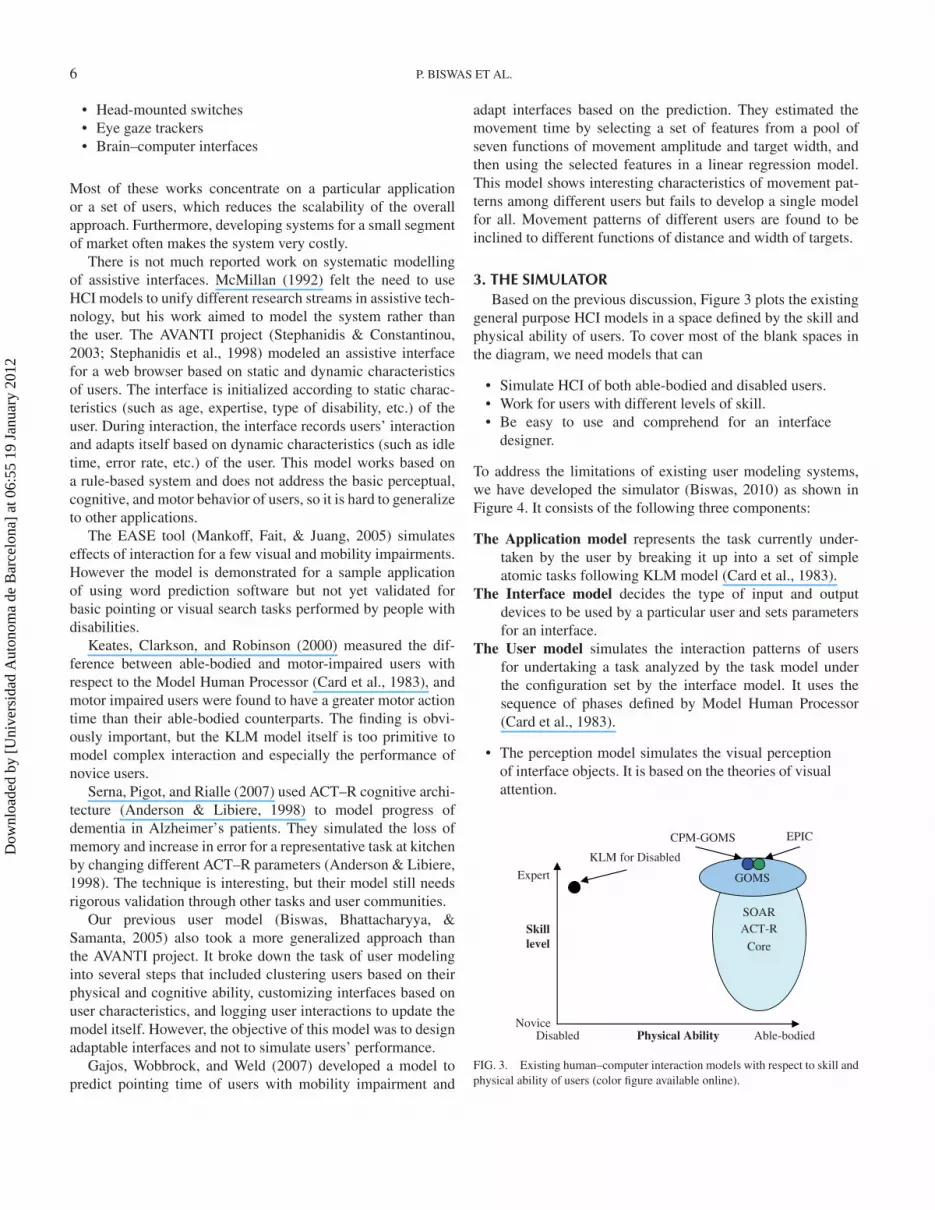
to provide input parameters and showing output of simulation.Figure 9 shows a few interfaces of the simulator.
At present it supports a few types of visual and mobil-ity impairments. For both visual and mobility impairment,we have developed the user interfaces in three differentlevels:
• In the first level (Figure 9a) the system simulatesdifferent diseases.
• In the next level (Figure 9b) the system simulatesthe effect of change in different visual functions (likevisual acuity, contrast sensitivity, visual field loss, etc.)and hand strength metrics (like grip strength, range ofmotion of forearm, wrist, etc.).
• In the third level (Figure 9c), the system allows dif-ferent image-processing algorithms to be run (such ashigh pass filtering, blurring, etc.) on input images andto set demographic detail of users.
The simulator can show the effects of a particular disease onvisual functions and hand strength metrics and in turn theireffect on interaction. For example, it can demonstrate howthe progress of dry macular degeneration increases the num-ber and sizes of scotoma (dark spots in eyes) and converts aslight peripheral visual field loss into total central vision loss.Similarly it can show the perception of an elderly color-blinduser, or in other words the combined effect of visual acuity lossand color blindness. We have modeled the effects of age andgender on hand strength, and the system can show the effectsof cerebral palsy or Parkinson’s disease for different age groupand gender. A few sample screenshots can be found at http://www.cl.cam.ac.uk/~pb400/Demo.htm.
3.1. Validation of the ModelsEach of the perception, cognitive, and motor behavior mod-
els were calibrated and validated separately involving peoplewith and without visual and mobility impairment (Biswas,2010).
The perception model was validated through an eye gazetracking study for a visual search task. We compared the cor-relation between actual and predicted visual search time, eyegaze, and investigated the error in prediction. The actual andpredicted visual search time correlated statistically significantlywith less than 40% error rate for more than half of the trials(Biswas & Robinson, 2009a).
The cognitive model was used to simulate interaction forfirst-time users, and it can simulate the effect of learning as well(Biswas & Robinson, 2008).
The motor behavior model was validated through ISO9241 pointing task. The actual and predicted movement timecorrelated statistically significantly with less than 40% error ratefor more than half of the trials (Biswas & Robinson, 2009b).
3.2. Working PrincipleThe simulator works in the following three steps.
1. While a task is undertaken by participants, a monitor pro-gram records the interaction. This monitor program records
a. A list of key presses and mouse clicks (operations),b. A sequence of bitmap images of the interfaces (low-level
snapshot), andc. Locations of windows, icons, buttons and other controls
in the screen (high-level snapshot).
2. Initially, the cognitive model analyzes the task and producesa list of atomic tasks (detailed task specification).
Dow
nloa
ded
by [
Uni
vers
idad
Aut
onom
a de
Bar
celo
na]
at 0
6:55
19
Janu
ary
2012
10 P. BISWAS ET AL.
a. Interfaces to simulate the effects of different diseases
b. Interfaces to simulate the effects of different visual functions and hand strength metrics
c. Interfaces to run image processing algorithms and set demographic detail of users
FIG. 9. A few interfaces of a prototype of the toolbox (color figure available online).
3. If an atomic task involves perception, the perception modeloperates on the event list and the sequence of bitmap images.Similarly, if an atomic task involves movement, the motorbehavior model operates on the event list and the high-levelsnapshot.
In the remaining sections of this article, we demonstrate the useof the simulator through an icon-searching and menu selectiontask. In the first application, the simulation accurately pre-dicts performance of users with visual and mobility impairment.In the second case, the simulator is used to identify the acces-sibility problems of menus and thus redesign a menu selectioninterface.
4. CASE STUDY 1—ICON SEARCHING TASKIn graphical user interfaces, searching and pointing con-
stitute a significant portion of HCI. Users search for manydifferent artifacts like information in a web page, button witha particular caption in an application, e-mail from a list of
mails, and so on. We can broadly classify searching in twocategories.
Text searching includes any search that only involves search-ing for text and not any other visual artifact. Examplesinclude menu searching, keyword searching in a document,mailbox searching, and so on.
Icon searching includes searching for a visual artifact (such asan icon or a button) along with text search for its caption.The search is mainly guided by the visual artifact, and thetext is generally used to confirm the target.
In this section, we present a study involving an icon search-ing task. We simulated the task using the simulator and eval-uated the predictive power of the model by comparing actualtask completion time with prediction in terms of correlation andpercentage error in prediction.
Dow
nloa
ded
by [
Uni
vers
idad
Aut
onom
a de
Bar
celo
na]
at 0
6:55
19
Janu
ary
2012
DESIGNING INCLUSIVE INTERFACES 11
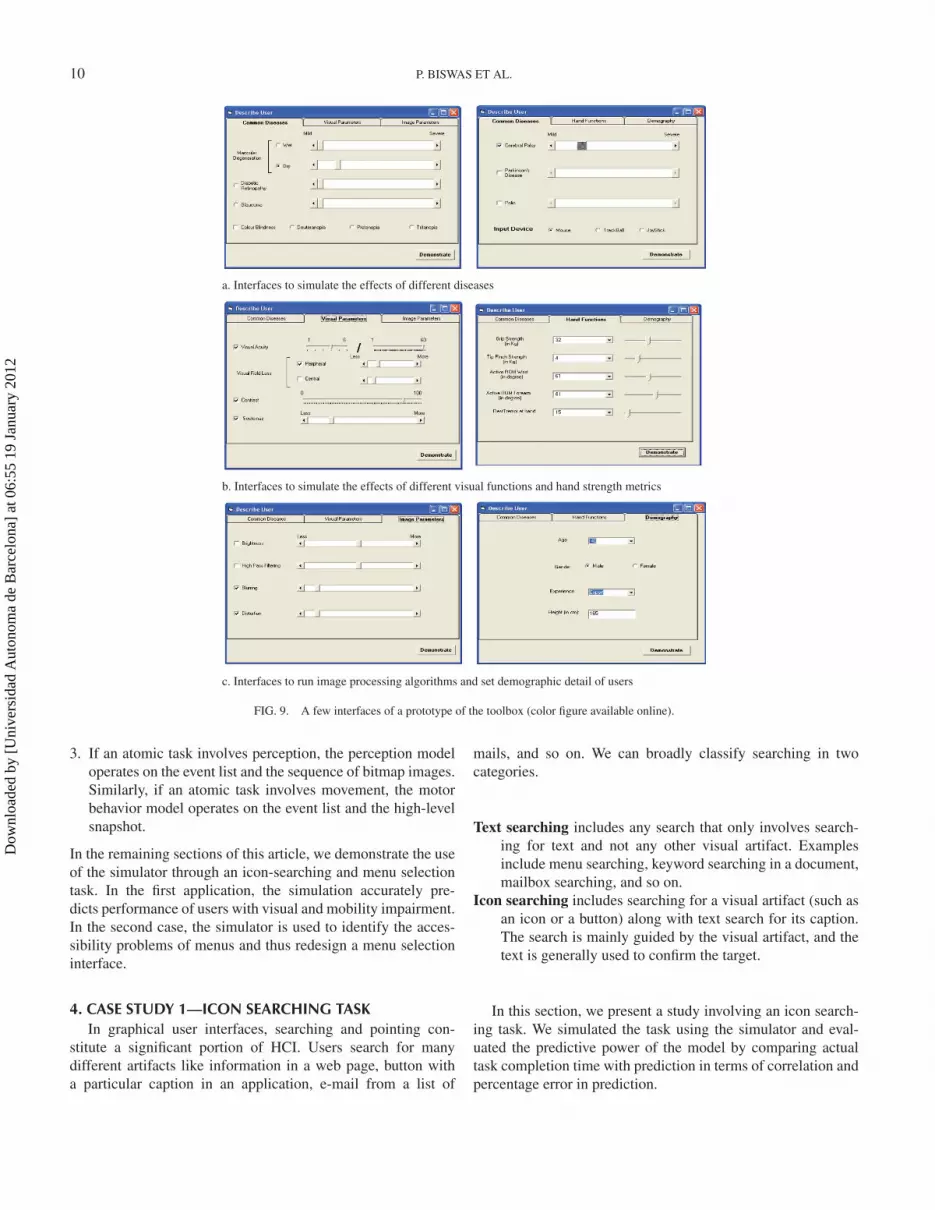
FIG. 10. Corpus of shapes (color figure available online).
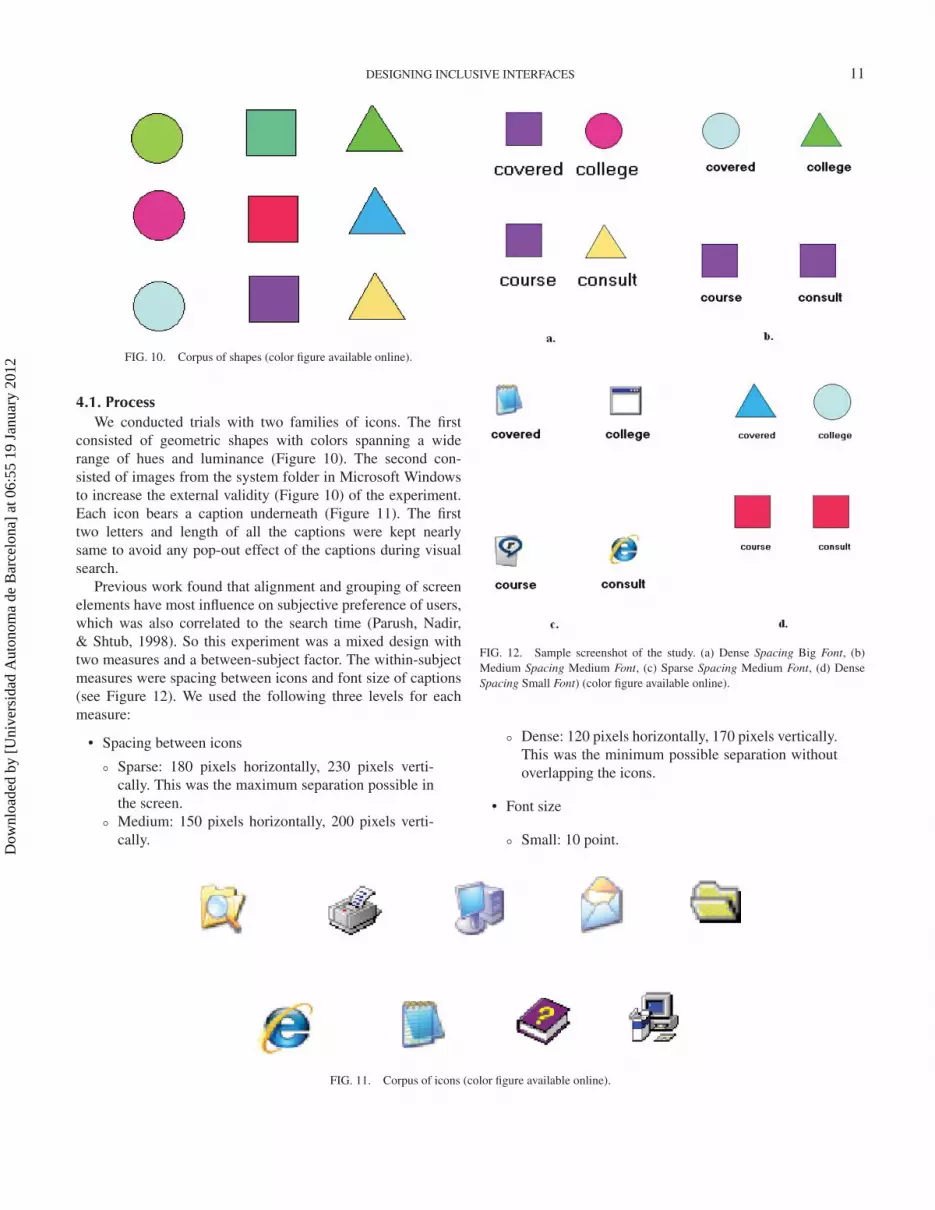
4.1. ProcessWe conducted trials with two families of icons. The first
consisted of geometric shapes with colors spanning a widerange of hues and luminance (Figure 10). The second con-sisted of images from the system folder in Microsoft Windowsto increase the external validity (Figure 10) of the experiment.Each icon bears a caption underneath (Figure 11). The firsttwo letters and length of all the captions were kept nearlysame to avoid any pop-out effect of the captions during visualsearch.
Previous work found that alignment and grouping of screenelements have most influence on subjective preference of users,which was also correlated to the search time (Parush, Nadir,& Shtub, 1998). So this experiment was a mixed design withtwo measures and a between-subject factor. The within-subjectmeasures were spacing between icons and font size of captions(see Figure 12). We used the following three levels for eachmeasure:
• Spacing between icons
◦ Sparse: 180 pixels horizontally, 230 pixels verti-cally. This was the maximum separation possible inthe screen.
◦ Medium: 150 pixels horizontally, 200 pixels verti-cally.
FIG. 12. Sample screenshot of the study. (a) Dense Spacing Big Font, (b)Medium Spacing Medium Font, (c) Sparse Spacing Medium Font, (d) DenseSpacing Small Font) (color figure available online).
◦ Dense: 120 pixels horizontally, 170 pixels vertically.This was the minimum possible separation withoutoverlapping the icons.
• Font size
◦ Small: 10 point.
FIG. 11. Corpus of icons (color figure available online).
Dow
nloa
ded
by [
Uni
vers
idad
Aut
onom
a de
Bar
celo
na]
at 0
6:55
19
Janu
ary
2012
12 P. BISWAS ET AL.
◦ Medium: 14 point (as suggested by the RoyalNational Institute of Blind People; http://www.rnib.org.uk/Pages/Home.aspx).
◦ Large: 20 point.
The between-subjects factor is
• Group
◦ Able bodied◦ Visually impaired◦ Motor impaired
The experimental task consisted of shape searching and iconsearching tasks. The task was as follows:
• A particular target (shape or icon with a caption) wasshown.
• A set of 18 candidates for matching was shown.• Participants were asked to click on the candidate,
which was same as the target both in terms of icon andcaption.
The sequence of the trials was randomized using a Latin square.Each participant undertook eight trials for each combinationof the within-subject measures. Each participant performed72 searching and pointing tasks in total. They were trained forthe task before start of the actual trial. However one of theparticipants (P4) retired after undertaking 40 trials.
4.2. MaterialWe used a 1280 × 800 LCD color display driven by a
1.7 GHz Pentium 4 PC running the Microsoft Windows XPoperating system. We also used a standard computer Mouse(Microsoft IntelliMouse® Optical Mouse) for clicking on thetarget.
4.3. ParticipantsWe collected data from two able-bodied, two visually
impaired, and three motor-impaired participants (Table 1). Allwere expert computer users and used computers more than oncea week.
4.4. SimulationInitially we analyzed the task in light of the cognitive model.
Because the users undertook preliminary training, we consid-ered them as expert users. We followed the GOMS analysistechnique and identified two subtasks:
• Searching for the target.• Pointing and clicking on the target.
The prediction is obtained by sequentially running the percep-tion model and the motor behavior model. The predicted task
TABLE 1List of participants
Age Gender Impairment
C1 27 M Able-bodiedC2 30 MP1 27 M Myopia (–4.5 / –4.5 Dioptre)P2 26 M Myopia (–5.5 / –5.5 Dioptre)P3 30 M Hypokinetic motor impairment resulted
from cerebral palsy, restricted handmovement, wheelchair user
P4 42 M Cerebral palsy, restricted hand movement,also suffering tremor in hand, wheelchairuser
P5 45 M Hyperkinetic motor impairment resultedfrom stroke, significant tremor in fingers,wheelchair user
completion time is the summation of the visual search time (out-put by the perception model) and the pointing time (output bythe motor behavior model).
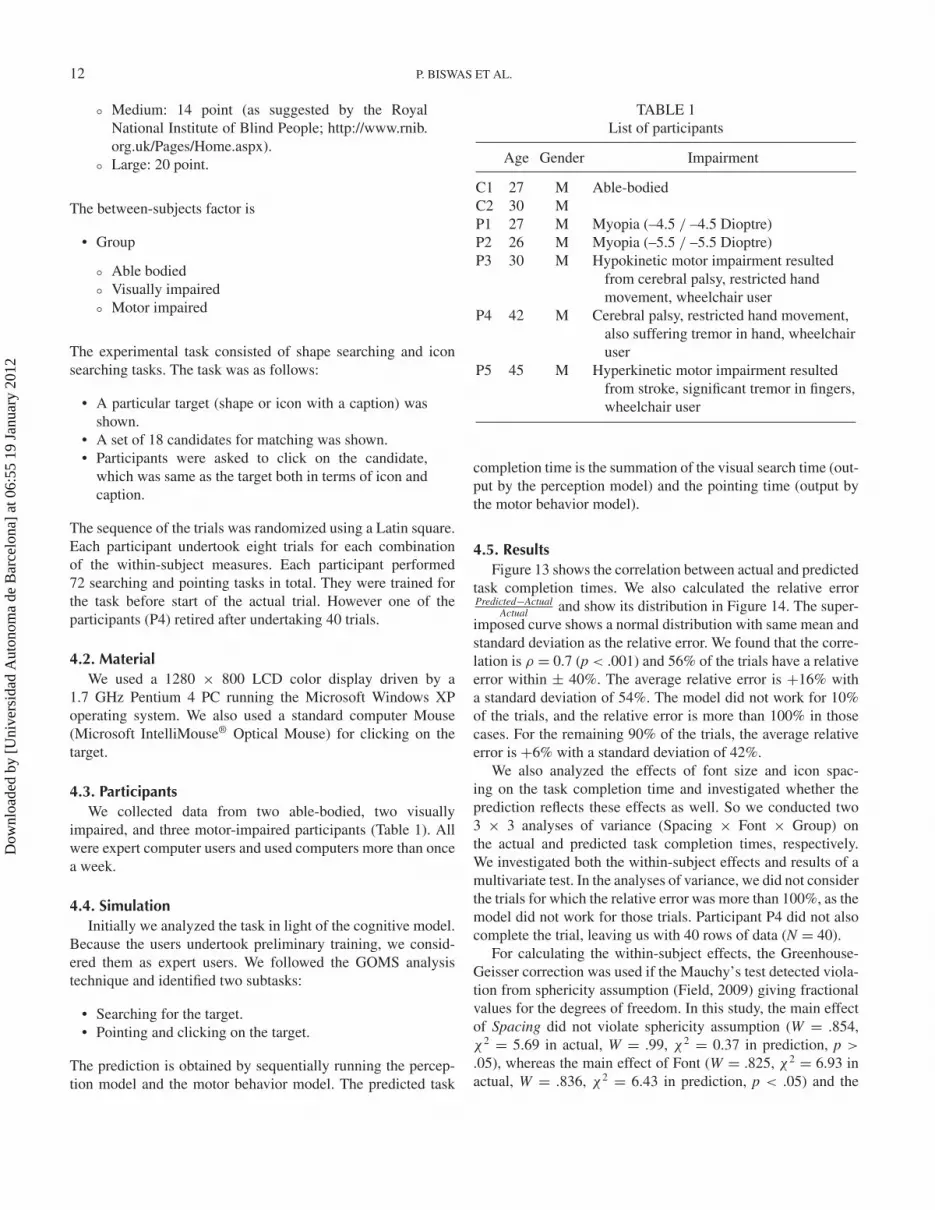
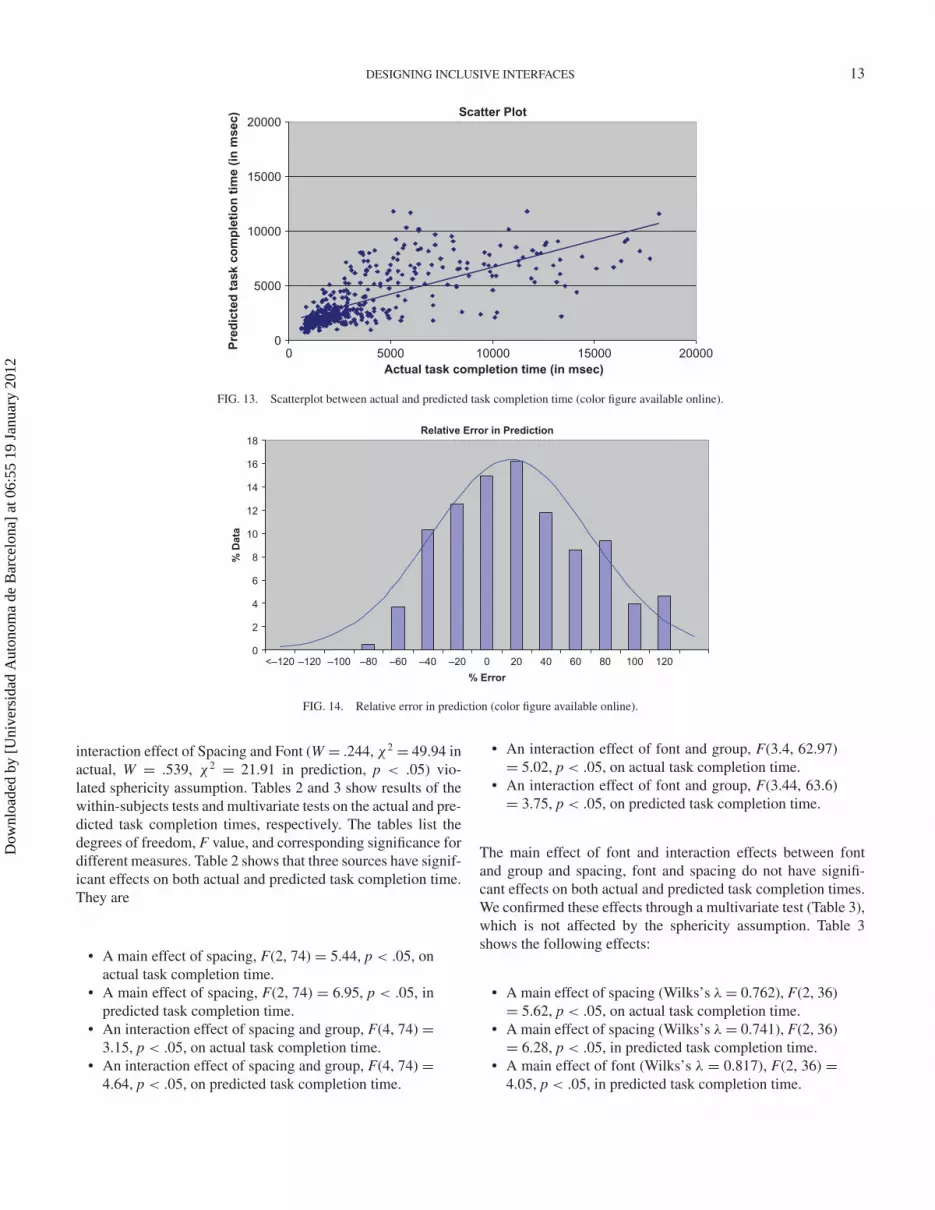
4.5. ResultsFigure 13 shows the correlation between actual and predicted
task completion times. We also calculated the relative errorPredicted−Actual
Actual and show its distribution in Figure 14. The super-imposed curve shows a normal distribution with same mean andstandard deviation as the relative error. We found that the corre-lation is ρ = 0.7 (p < .001) and 56% of the trials have a relativeerror within ± 40%. The average relative error is +16% witha standard deviation of 54%. The model did not work for 10%of the trials, and the relative error is more than 100% in thosecases. For the remaining 90% of the trials, the average relativeerror is +6% with a standard deviation of 42%.
We also analyzed the effects of font size and icon spac-ing on the task completion time and investigated whether theprediction reflects these effects as well. So we conducted two3 × 3 analyses of variance (Spacing × Font × Group) onthe actual and predicted task completion times, respectively.We investigated both the within-subject effects and results of amultivariate test. In the analyses of variance, we did not considerthe trials for which the relative error was more than 100%, as themodel did not work for those trials. Participant P4 did not alsocomplete the trial, leaving us with 40 rows of data (N = 40).
For calculating the within-subject effects, the Greenhouse-Geisser correction was used if the Mauchy’s test detected viola-tion from sphericity assumption (Field, 2009) giving fractionalvalues for the degrees of freedom. In this study, the main effectof Spacing did not violate sphericity assumption (W = .854,χ2 = 5.69 in actual, W = .99, χ2 = 0.37 in prediction, p >
.05), whereas the main effect of Font (W = .825, χ2 = 6.93 inactual, W = .836, χ2 = 6.43 in prediction, p < .05) and the
Dow
nloa
ded
by [
Uni
vers
idad
Aut
onom
a de
Bar
celo
na]
at 0
6:55
19
Janu
ary
2012
DESIGNING INCLUSIVE INTERFACES 13
Scatter Plot
0
5000
10000
15000
20000
0 5000 10000 15000 20000
Actual task completion time (in msec)
Pre
dic
ted
task c
om
ple
tio
n t
ime (
in m
sec)
FIG. 13. Scatterplot between actual and predicted task completion time (color figure available online).
Relative Error in Prediction
0
2
4
6
8
10
12
14
16
18
<–120 –120 –100 –80 –60 –40 –20 0 20 40 60 80 100 120
% Error
% D
ata
FIG. 14. Relative error in prediction (color figure available online).
interaction effect of Spacing and Font (W = .244, χ2 = 49.94 inactual, W = .539, χ2 = 21.91 in prediction, p < .05) vio-lated sphericity assumption. Tables 2 and 3 show results of thewithin-subjects tests and multivariate tests on the actual and pre-dicted task completion times, respectively. The tables list thedegrees of freedom, F value, and corresponding significance fordifferent measures. Table 2 shows that three sources have signif-icant effects on both actual and predicted task completion time.They are
• A main effect of spacing, F(2, 74) = 5.44, p < .05, onactual task completion time.
• A main effect of spacing, F(2, 74) = 6.95, p < .05, inpredicted task completion time.
• An interaction effect of spacing and group, F(4, 74) =3.15, p < .05, on actual task completion time.
• An interaction effect of spacing and group, F(4, 74) =4.64, p < .05, on predicted task completion time.
• An interaction effect of font and group, F(3.4, 62.97)= 5.02, p < .05, on actual task completion time.
• An interaction effect of font and group, F(3.44, 63.6)= 3.75, p < .05, on predicted task completion time.
The main effect of font and interaction effects between fontand group and spacing, font and spacing do not have signifi-cant effects on both actual and predicted task completion times.We confirmed these effects through a multivariate test (Table 3),which is not affected by the sphericity assumption. Table 3shows the following effects:
• A main effect of spacing (Wilks’s λ = 0.762), F(2, 36)= 5.62, p < .05, on actual task completion time.
• A main effect of spacing (Wilks’s λ = 0.741), F(2, 36)= 6.28, p < .05, in predicted task completion time.
• A main effect of font (Wilks’s λ = 0.817), F(2, 36) =4.05, p < .05, in predicted task completion time.
Dow
nloa
ded
by [
Uni
vers
idad
Aut
onom
a de
Bar
celo
na]
at 0
6:55
19
Janu
ary
2012

14 P. BISWAS ET AL.
TABLE 2Test of within-subjects effects on task completion time
Actual Predicted
Source df F Sig. df F Sig.
Spacing 2.0 5.44 .006 2.0 6.95 .002Spacing × Group 4.0 3.15 .019 4.0 4.64 .002Error(Spacing) 74.0 74.0Font 1.7 0.22 .770 1.7 2.89 .071Font × Group 3.4 5.02 .002 3.4 3.75 .012Error(Font) 63.0 63.6Spacing × Font 2.3 1.03 .370 3.3 1.54 .204Spacing × Font × Group 4.7 0.83 .528 6.5 1.32 .250Error(Spacing × Font) 86.3 121.0
Note: Significant values are in boldface
TABLE 3Multivariate test on completion time
Actual Predicted
Effect df F Sig. df F Sig.
Spacing 2 5.62 .008 2 6.28 .005Spacing × Group 4 2.78 .033 4 3.97 .006Font 2 0.31 .739 2 4.05 .026Font × Group 4 6.39 0 4 5.05 .001Spacing × Font 4 1.41 .253 4 2.18 .093Spacing × Font × Group 8 2.15 .043 8 1.74 .106
Note: Significant values are in boldface
• An interaction effect of spacing and group (Wilks’sλ = 0.750), F(4, 72) = 2.78, p < .05, on actual taskcompletion time.
• An interaction effect of spacing and group (Wilks’sλ = 0.671), F(4, 72) = 3.97, p < .05, on predictedtask completion time.
• An interaction effect of font and group (Wilks’sλ = 0.545), F(4, 72) = 6.39, p < .05, on actual taskcompletion time.
• An interaction effect of font and group (Wilks’sλ = 0.610, F(4, 72) = 5.05, p < .05, on predicted taskcompletion time.
It can be seen from Tables 2 and 3 that the prediction capturesall effects at 99.95% confidence level in both within-subject testand multivariate test. Figures 15 and 16 show that the effectsizes (η2) are also fairly similar in the prediction as in the actual.The maximum difference is below 10% in within-subject testand below 20% in multivariate test. This suggests that the sim-ulator successfully explained the variance in task completiontime for different factors. As these factors include both interface
parameters and physical characteristics of users, we can inferthat the simulator has successfully explained the effects of dif-ferent interface layouts on task completion time for people withvisual and motor impairment.
Figures 17 and 18 show the effects of font size and spac-ing for different user groups. In Figures 17 and 18, the pointsdepict the average task completion time and the bars showthe standard error at a 95% confidence level. It can be seenfrom Figures 17 and 18 that the prediction is in line with theactual task completion times for different font sizes and iconspacing.
However the prediction is less accurate in one of the nineconditions - the medium font size and medium spacing for themotor impaired users (see Figures 19, 20). We found that, inthese cases, the model underestimates the task completion timesand fails to capture the variability in it. We have further ana-lyzed the effects of spacing and font size for each user groupseparately (Table 4).
It can be seen from Table 4 that in terms of significance atp < .05, the prediction deviates from the actual in the followingtwo cases (highlighted in bold):
Dow
nloa
ded
by [
Uni
vers
idad
Aut
onom
a de
Bar
celo
na]
at 0
6:55
19
Janu
ary
2012

DESIGNING INCLUSIVE INTERFACES 15
Effect Size Comparison in Within-Subject Test
0
0.05
0.1
0.15
0.2
0.25
SPACING SPACING *
GROUP
FONTSIZE FONTSIZE
* GROUP
SPACING *
FONTSIZE
SPACING *
FONTSIZE
* GROUP
Measures
Eta
Sq
uare
d
Actual
Predicted
FIG. 15. Effect size comparison in analysis of variance (color figure available online).
Effect Size Comparison in Multivariate Test
0
0.05
0.1
0.15
0.2
0.25
0.3
SPACING SPACING *
GROUP
FONTSIZE FONTSIZE
* GROUPSPACING *
FONTSIZE
SPACING *
FONTSIZE
* GROUP
Measures
Eta
Sq
ua
red
Actual
Predicted
FIG. 16. Effect size comparison in multivariate analysis of variance (color figure available online).
Effect of Font size
0
2000
4000
6000
8000
10000
12000
14000
small
meidu
mlarg
e
small
med
ium
larg
e
small
med
ium
larg
e
Task c
om
ple
tio
n t
ime (
in m
sec)
Actual
Predicted
Able bodied Visually impaired Motor impaired
FIG. 17. Effect of font size in different user groups (color figure available online).
• Interaction effect of spacing and font for able-bodied users: F(4, 60) = 1.78, p > .05 foractual, F(4, 60) = 2.69, p < .05, for predic-tion.
• Effect of spacing for motor-impaired users: F(2, 14) =2.93, p > .05, for actual, F(2, 14) = 3.78, p < .05, forprediction.
Finally we compared the mean and standard deviation of theactual and predicted task completion times for each condition.Table 5 lists the relative difference Predicted−Actual
Actual in mean andstandard deviations between actual and predicted task comple-tion time.
It can be seen from Table 5 that only in four conditions (high-lighted in bold) is the average predicted time different from the
Dow
nloa
ded
by [
Uni
vers
idad
Aut
onom
a de
Bar
celo
na]
at 0
6:55
19
Janu
ary
2012

16 P. BISWAS ET AL.
Effect of Spacing
0
2000
4000
6000
8000
10000
12000
14000
spar
se
med
ium
dens
e
spar
se
med
ium
dens
e
spar
se
med
ium
dens
e
Task c
om
ple
tio
n t
ime (
in m
sec)
Actual
Predicted
Able bodied Visually impaired Motor impaired
FIG. 18. Effect of spacing in different user groups (color figure available online).
Effect of fontsize for medium spacing with motor impaired users
0
2000
4000
6000
8000
10000
12000
14000
16000
18000
Small Medium Large
Conditions
Task c
om
ple
tio
n t
ime (
in
msec)
Actual
Predicted
FIG. 19. Effect of medium spacing in motor-impaired users (color figure available online).
Effect of spacing for medium font size with motor impaired
users
0
2000
4000
6000
8000
10000
12000
14000
16000
18000
Sparse Medium Dense
Conditions
Task c
om
ple
tio
n t
ime (
in
msec)
Actual
Predicted
FIG. 20. Effect of medium font size in motor-impaired users (color figure available online).
actual predicted time by more than ±40%. However the stan-dard deviation is predicted quite less than in actual in manyoccasions. The difference is less severe for visually impairedusers than the other two groups. One possible reason for the
difference may be the effects of learning and fatigue as able-bodied users might work quickly due to learning effect andmotor impaired users might feel fatigue. So, we have analyzedthe effects of usage time through a regression model.
Dow
nloa
ded
by [
Uni
vers
idad
Aut
onom
a de
Bar
celo
na]
at 0
6:55
19
Janu
ary
2012

DESIGNING INCLUSIVE INTERFACES 17
TABLE 4Analysis of variance for each user group
Actual Predicted
Source df F Sig. η2 df F Sig. η2
Able bodiedSpacing 2 0.21 .815 0.014 2 0.38 .688 0.025Error(Spacing) 30 30Font 2 0.72 .495 0.046 2 2.73 .081 0.154Error(Font) 30 30Spacing × Font 4 1.78 .144 0.106 4 2.69 .039 0.152Error(Spacing × Font) 60 60
Visually impairedSpacing 1.4 0.52 .54 0.034 2 0.81 453 0.051Error(Spacing) 21.3 30Font 1.4 8.39 .004 0.359 2 5.72 .008 0.276Error(Font) 21.5 30Spacing × Font 1.5 2.90 .089 0.162 4 0.21 .933 0.014Error(Spacing × Font) 22.3 60
Motor impairedSpacing 2 2.93 .087 0.295 2 3.78 .049 0.350Error(Spacing) 14 14Font 2 1.53 .251 0.179 2 1.56 .245 0.182Error(Font) 14 14Spacing × Font 4 0.26 .904 0.035 4 0.67 .62 0.087Error(Spacing × Font) 28 28
Note: Significant values are in boldface
Analyzing effect of usage time. We have considered the pre-dicted task completion time and the usage time as independentvariables and the actual task completion time as the dependentvariable. The usage time for each trial measures the total timespent (in seconds) from beginning of the session to the end ofthe trial. Table 6 shows the regression coefficients.
It seems that usage time can significantly (p < .005) affectthe actual time though the improvement in �R2 is only 2%. Theinclusion of usage time in the regression model also reducesthe change in R2 from .39 to .01, which means it increases thegenralizability of the model (Biswas & Robinson, 2009b). Thepositive value of coefficient B indicates that the task comple-tion time was directly proportional to the usage time. Figure 21shows a weak positive correlation (ρ = 0.42) between usagetime and task completion time. Perhaps it means that users feltfatigue or bored as the session went on and took more time tocomplete the task in later trials.
4.6. DiscussionChoosing a particular interface from a set of alternatives is a
significant task for both design and evaluation. In this study, weconsidered a representative task and the results showed that theeffects of both factors (separation between icons and font size)
were the same in the prediction as for actual trials with differentuser groups. The prediction from the simulator can be reliablyused to capture the main effects of different design alternativesfor people with a wide range of abilities.
However, the model did not work accurately for about 30%of the trials where the relative error is more than 50%. Thesetrials also accounted for an increase in the average relative errorfrom zero to 16%. In particular, the predicted variance in taskcompletion times for motor impaired users was smaller than theactual variance. This can be attributed to many factors; the mostimportant ones are as follows.
Effect of usage time. Fatigue and learning effects: The trialcontinued for about 15 to 20 minutes. A few participants (espe-cially one user in the motor impaired group) felt fatigue. On theother hand, some users worked more quickly as the trial pro-ceeded. The model did not consider these effects of fatigue andlearning. It seems from the analysis that the usage time can sig-nificantly affect the total task completion time. In the future wewould like to analyze the effect of usage time in more detail andplan to incorporate it into the input parameters of the model.
User characteristics. The variance in the task completiontime can be attributed to various factors such as expertise, usagetime, type of motor impairment (hypokinetic vs. hyperkinetic),
Dow
nloa
ded
by [
Uni
vers
idad
Aut
onom
a de
Bar
celo
na]
at 0
6:55
19
Janu
ary
2012

18 P. BISWAS ET AL.
TABLE 5Relative differences in mean and standard deviation
% Difference in
Spacing Font M SD
Able bodied Sparse Small −7.58 −55.65Medium 21.25 −27.62Large −21.29 −83.04
Medium Small −11.16 −66.72Medium 12.80 −45.72Large −9.61 −24.4
Dense Small −7.93 −76.85Medium −4.94 −44.12Large −7.34 −1.27
Visually impaired Sparse Small −26.97 −69.06Medium 12.70 −1.19Large 32.51 17.21
Medium Small −41.33 −78.7Medium 58.14 21.87Large 14.93 −20.11
Dense Small 28.62 7.59Medium 0.01 −19.48Large −5.84 −13.97
Motor impaired Sparse Small 6.19 −48.68Medium −35.31 −76.38Large −24.97 −80.72
Medium Small −40.10 −67.8Medium −43.22 −71.32Large −36.46 −83.7
Dense Small 9.52 −61.08Medium −29.82 −74.52Large 4.23 7.57
Note: errors higher than 40% are in boldface
TABLE 6Effect of usage time
Model B SE Beta
1 (Constant) 502.56 212.43Predicted Time 0.67 0.04 0.62∗
2 (Constant) 372.16 214.53Predicted Time 0.59 0.05 0.55∗Usage Time 2.77 0.91 0.14∗
Note. �R2 = 0.62∗ for Model 1, �R2 = 0.64∗ for Model 2(∗p < .005).
interest of the participant, and so on. Currently, the modelcharacterizes the extent of motor impairment of the user onlyby measuring the grip strength (Bernard, Mills, Peterson, &Storrer, 2001); in the future more input parameters may beconsidered.
5. CASE STUDY 2—MENU SELECTION TASKIn this study, we have investigated the accessibility of pro-
gram selection menus for a digital TV interface. Previouswork on menu selection investigated selection time of differentmenu items based on their position (Nilsen, 1992) and menu-searching strategies (Hornof & Kieras, 1997) for able-bodiedusers. Researchers worked on menu interaction for cell phones(Mardsen & Jones, 2001; Ruiz & Lank, 2010)), but there is notmuch reported work on accessibility issues of menus, in par-ticular for digital TV interfaces. Existing approaches like targetexpansion (McGuffin & Balakrishnan, 2005) or target identifi-cation (Hurst, Hudson, & Mankoff, 2010) are not very suitablefor menu selection as menu items are more densely spaced thanother types of targets like buttons or icons in a screen. Ruiz’sapproach (Ruiz & Lank, 2010) of expanding target region hasalso not been found to reduce menu selection time significantly.There is also not much reported work on the legibility issuesof menu captions. Most researchers do not find difference in
Dow
nloa
ded
by [
Uni
vers
idad
Aut
onom
a de
Bar
celo
na]
at 0
6:55
19
Janu
ary
2012

DESIGNING INCLUSIVE INTERFACES 19
Effect of Usage Time
0
2
4
6
8
10
12
0 50 100 150 200
Usage Time (in sec)
Ta
sk
Co
mp
leti
on
Tim
e (
in s
ec
)
FIG. 21. Effect of usage time (color figure available online).
FIG. 22. Interface used in the study (color figure available online).
terms of reading time due to font types with respect to onlinereading tasks (Bernard, Liao, & Mills, 2001; Beymer, Russell,& Orton, 2007; Boyarski, Neuwirth, Forlizzi, & Regli, 1998).Although Bernard and colleagues (Bernard, Liao, et al., 2001;Bernard, Mills, et al., 2001) reported significant difference inreading times between Tahoma and Corsiva fonts for a read-ing task of two pages, but the difference may turn insignificantduring reading short captions. However, there is significant dif-ference in reading time and legibility due to font size. Beymerand colleagues (2007) preferred the 12-point size, whereas theRoyal National Institute of Blind People and Bernard, Liao,et al. (2009a) preferred the 14-point size.
We take help from the simulator in identifying the accessibil-ity problems of program selection menu with respect to visuallyand mobility impaired users. Based on the results of the simula-tion we have designed new interfaces. The study consists of thefollowing three stages:
• Problem identification through simulation• New interface evaluation through simulation• Validation of the simulation through a controlled
experiment
5.1. The StudyInitially we designed the following interface (Figure 22),
which looks similar to existing systems (Figure 23). In thisparticular work, we investigated
• Sensory problems of
◦ People with less visual acuity◦ People having color blindness
• Interaction problems of
◦ People with motor impairment using a pointingdevice
In this particular study, the simulator takes a sample task ofselecting a menu item and the screenshot of the interface asinput and shows the perception of visually impaired users andcursor trajectory of motor-impaired users as output. In the sim-ulation study, we did not bother with the particular words usedas captions because the simulation results are not to be used byparticipants. We used captions like Channel 1, Program 1, orTime 1 as captions. However in the validation study we used
Dow
nloa
ded
by [
Uni
vers
idad
Aut
onom
a de
Bar
celo
na]
at 0
6:55
19
Janu
ary
2012

20 P. BISWAS ET AL.
FIG. 23. Representative of an actual interface (color figure available online).
FIG. 24. Perception of people having color blindness. (a) Original interface. (b) Interface perceived by Potanopia. (c) Interface perceived by Deuteranopia. (d)Interface perceived by Tritanopia (color figure available online).
different words as captions and discussed it in detail in a latersection.
Problem identification. Initially the output from the simu-lator is used to identify accessibility problems. Figure 24 showsthe perception of the interface for three different types of colorblindness. Details about the simulation can be found in Biswas(2010). It can be seen that although the colors look different, theparticular color combination of the interface does not reduce thelegibility.
Figure 25 shows the perception of the interface ofpeople with mild (less than approximately –3.5 Dioptre)and severe (more than approximately –4 Dioptre) acuityloss. Details about the simulation can be found in Biswas
(2010). It can be seen from the figure that the captions(which are in 14 point) become illegible for severe acuityloss.
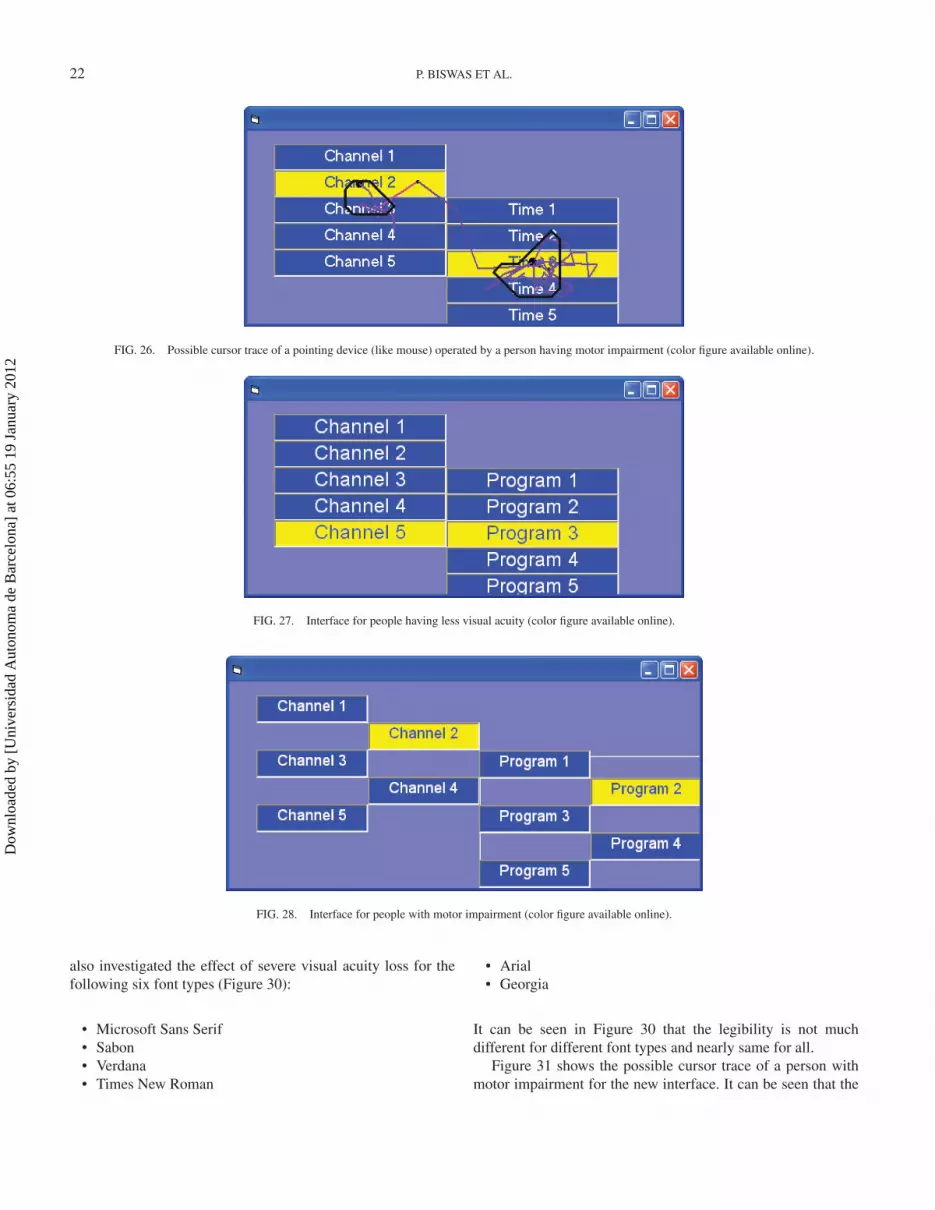
Figure 26 shows a possible cursor trace of a pointing device(like mouse) operated by a person having motor impairment.The thin purple line shows a sample trajectory of mousemovement of a motor-impaired user. It can be seen that thetrajectory contains random movements near the source andthe target. The thick black lines encircle the contour of theserandom movements. The area under the contour has a highprobability of missed clicks as the movement is random thereand thus lacks control. Details about the simulation can befound in Biswas (2010). It can be seen that as the buttons
Dow
nloa
ded
by [
Uni
vers
idad
Aut
onom
a de
Bar
celo
na]
at 0
6:55
19
Janu
ary
2012

DESIGNING INCLUSIVE INTERFACES 21
FIG. 25. Perception of people having less visual acuity. (a) Original interface. (b) Interface perceived by mild visual acuity loss. (c) Interface perceived by severevisual acuity loss (color figure available online).
are closely spaced, there is a significant probability of missedclick in a wrong button, which would surely frustrate anyuser.
Based on the simulation results we identified the followingtwo accessibility issues
• Legibility of captions• Spacing between menu items
New interface. Based on the previous discussion, we haveredesigned the interfaces. We have increased the font size of
captions for users with visual impairment. For people withmotor impairment, we have changed the size of the buttonswithout changing the screen size such that no couple of but-tons shares a common boundary. This should reduce chancesof missed clicks. Figures 27 and 28 show the new interfaces.We have not designed anything new to cater to color-blind users,as the present interface seems perfect for them.
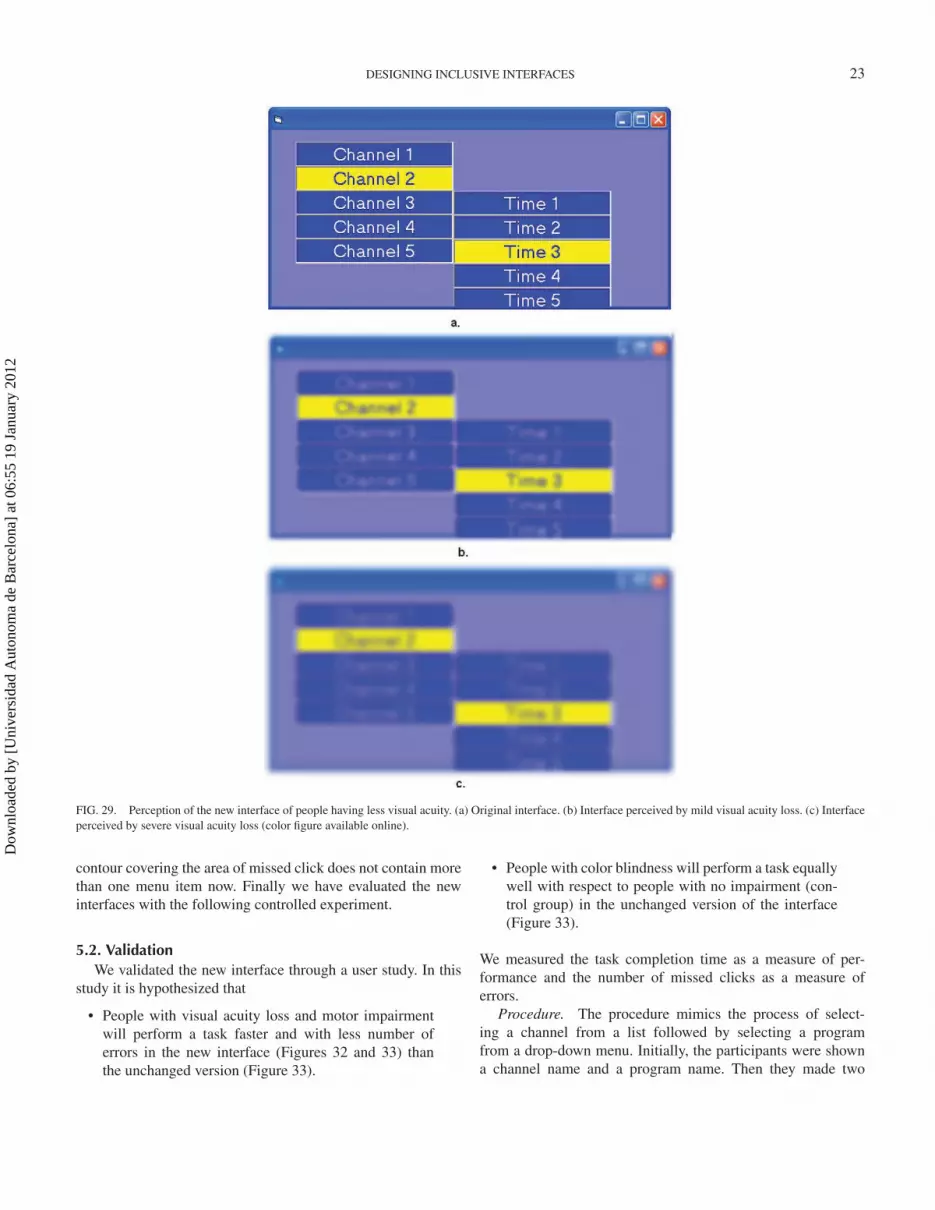
Figure 29 shows the perception of the new interface forpeople with mild and severe acuity loss. It can be seen thatthe modified captions (now at 18 point) has better legibilitythan the previous case even for severe acuity loss. We have
Dow
nloa
ded
by [
Uni
vers
idad
Aut
onom
a de
Bar
celo
na]
at 0
6:55
19
Janu
ary
2012
22 P. BISWAS ET AL.
FIG. 26. Possible cursor trace of a pointing device (like mouse) operated by a person having motor impairment (color figure available online).
FIG. 27. Interface for people having less visual acuity (color figure available online).
FIG. 28. Interface for people with motor impairment (color figure available online).
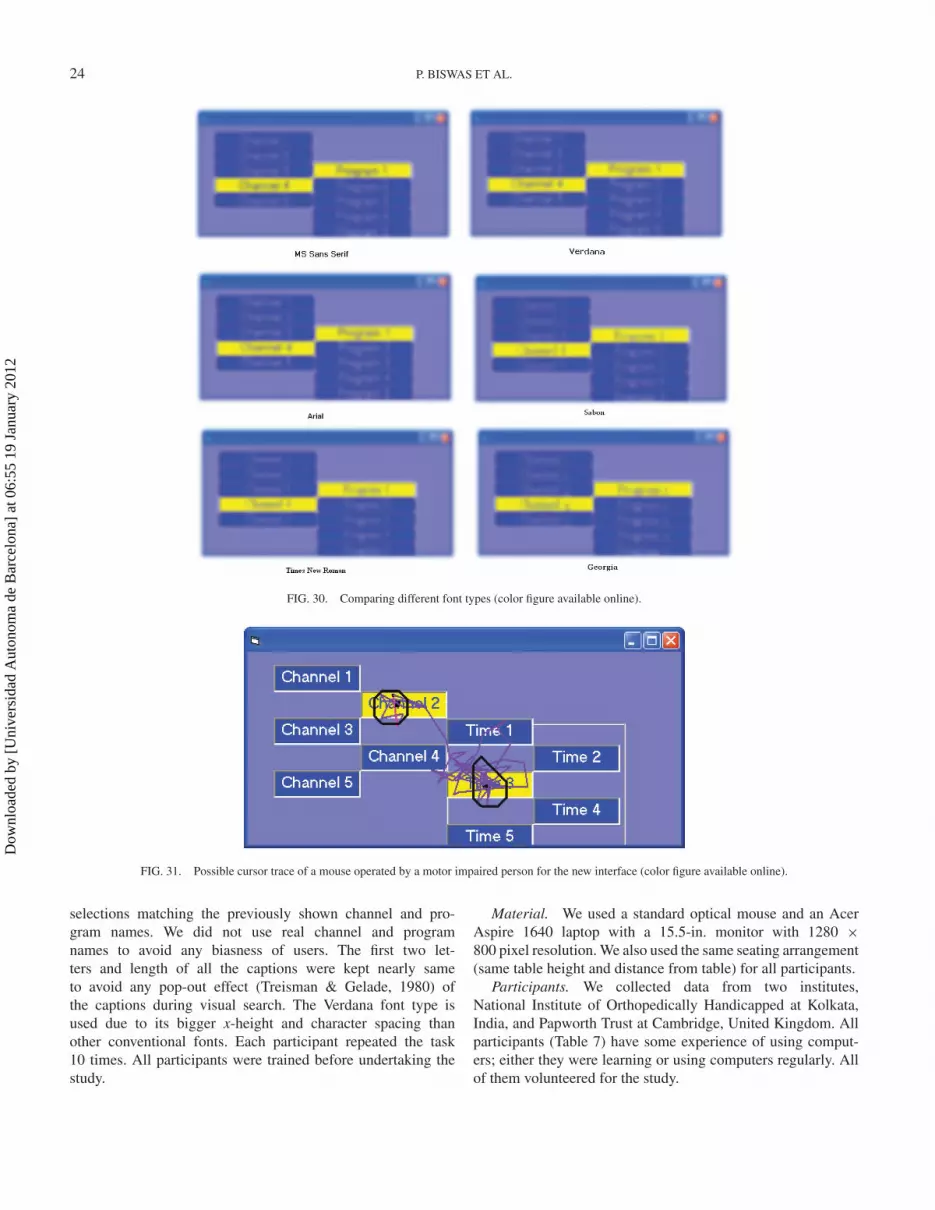
also investigated the effect of severe visual acuity loss for thefollowing six font types (Figure 30):
• Microsoft Sans Serif• Sabon• Verdana• Times New Roman
• Arial• Georgia
It can be seen in Figure 30 that the legibility is not muchdifferent for different font types and nearly same for all.
Figure 31 shows the possible cursor trace of a person withmotor impairment for the new interface. It can be seen that the
Dow
nloa
ded
by [
Uni
vers
idad
Aut
onom
a de
Bar
celo
na]
at 0
6:55
19
Janu
ary
2012
DESIGNING INCLUSIVE INTERFACES 23
FIG. 29. Perception of the new interface of people having less visual acuity. (a) Original interface. (b) Interface perceived by mild visual acuity loss. (c) Interfaceperceived by severe visual acuity loss (color figure available online).
contour covering the area of missed click does not contain morethan one menu item now. Finally we have evaluated the newinterfaces with the following controlled experiment.
5.2. ValidationWe validated the new interface through a user study. In this
study it is hypothesized that
• People with visual acuity loss and motor impairmentwill perform a task faster and with less number oferrors in the new interface (Figures 32 and 33) thanthe unchanged version (Figure 33).
• People with color blindness will perform a task equallywell with respect to people with no impairment (con-trol group) in the unchanged version of the interface(Figure 33).
We measured the task completion time as a measure of per-formance and the number of missed clicks as a measure oferrors.
Procedure. The procedure mimics the process of select-ing a channel from a list followed by selecting a programfrom a drop-down menu. Initially, the participants were showna channel name and a program name. Then they made two
Dow
nloa
ded
by [
Uni
vers
idad
Aut
onom
a de
Bar
celo
na]
at 0
6:55
19
Janu
ary
2012
24 P. BISWAS ET AL.
FIG. 30. Comparing different font types (color figure available online).
FIG. 31. Possible cursor trace of a mouse operated by a motor impaired person for the new interface (color figure available online).
selections matching the previously shown channel and pro-gram names. We did not use real channel and programnames to avoid any biasness of users. The first two let-ters and length of all the captions were kept nearly sameto avoid any pop-out effect (Treisman & Gelade, 1980) ofthe captions during visual search. The Verdana font type isused due to its bigger x-height and character spacing thanother conventional fonts. Each participant repeated the task10 times. All participants were trained before undertaking thestudy.
Material. We used a standard optical mouse and an AcerAspire 1640 laptop with a 15.5-in. monitor with 1280 ×800 pixel resolution. We also used the same seating arrangement(same table height and distance from table) for all participants.
Participants. We collected data from two institutes,National Institute of Orthopedically Handicapped at Kolkata,India, and Papworth Trust at Cambridge, United Kingdom. Allparticipants (Table 7) have some experience of using comput-ers; either they were learning or using computers regularly. Allof them volunteered for the study.
Dow
nloa
ded
by [
Uni
vers
idad
Aut
onom
a de
Bar
celo
na]
at 0
6:55
19
Janu
ary
2012

DESIGNING INCLUSIVE INTERFACES 25
Comparing Reaction Times
0.00
5000.00
10000.00
15000.00
20000.00
25000.00
30000.00
35000.00
RT ExpRT Ctrl
Reacti
on
Tim
e (
in m
sec)
FIG. 32. Comparing reaction times for all participants (color figure available online).
Comparing Number of Missed Clicks
0.00
0.50
1.00
1.50
2.00
2.50
3.00
3.50
4.00
4.50
MissedClk ExpMissedClk Ctrl
Avera
ge n
um
ber
of
mis
sed
cli
cks p
er
tria
l
FIG. 33. Comparing number of missed clicks times for all participants (color figure available online).
Results. The average reaction time (total time needed toselect the channel and program) was less in the new design thanthe control design (Figure 34) though the difference was not sta-tistically significant in an independent sample two-tailed t test,t(120) = 0.64, p > .05. The average number of missed clickswere also less (Figure 33) in the new design than the controldesign, though the difference tends to statistical significance in aWilcoxon ranked test, W(120) = 163, p = .1. In the experimen-tal condition (new design), missed clicks occurred in 21 trials,whereas missed clicks occurred 31 times in control condition.
We have also analyzed the reaction times and missed clicksfor each individual participant. Table 8 and Figures 34 and 35show the average reaction time and total number of missedclicks for each participant. It can be seen that only four of12 participants (P4, P5, P8, and P9) have an average reac-tion time greater for the experimental condition and only twoof 12 participants (P8 and P12) missed clicked more in theexperimental condition than the control condition.
Unfortunately we did not get any participants with colorblindness. So we collected data from two able-bodied userswith no visual impairment using a color-blindness filter (fromCambridge Research Systems, http://www.crsltd.com) to sim-ulate the effect of dichromatic color blindness. In this case aswell we did not find any significant difference in reaction times(Figure 36) in an independent sample two-tailed t test, t(20) =0.81, p > .05, and did not record any missed clicks.
Discussion. The reaction time and number of missed clickswere both less in the new design, though we failed to find anystatistical significance of the difference. Most participants didnot have any problem in moving hands, and thus they couldcontrol the mouse movement pretty well. Except participant P1,the visual acuity loss was also not severe. In addition, in thepresent experimental setup, a missed click did not waste time,whereas in a real interface a missed click will take the user to anundesired channel and getting back to the previous screen willincur additional time. So a higher number of missed clicks in the
Dow
nloa
ded
by [
Uni
vers
idad
Aut
onom
a de
Bar
celo
na]
at 0
6:55
19
Janu
ary
2012
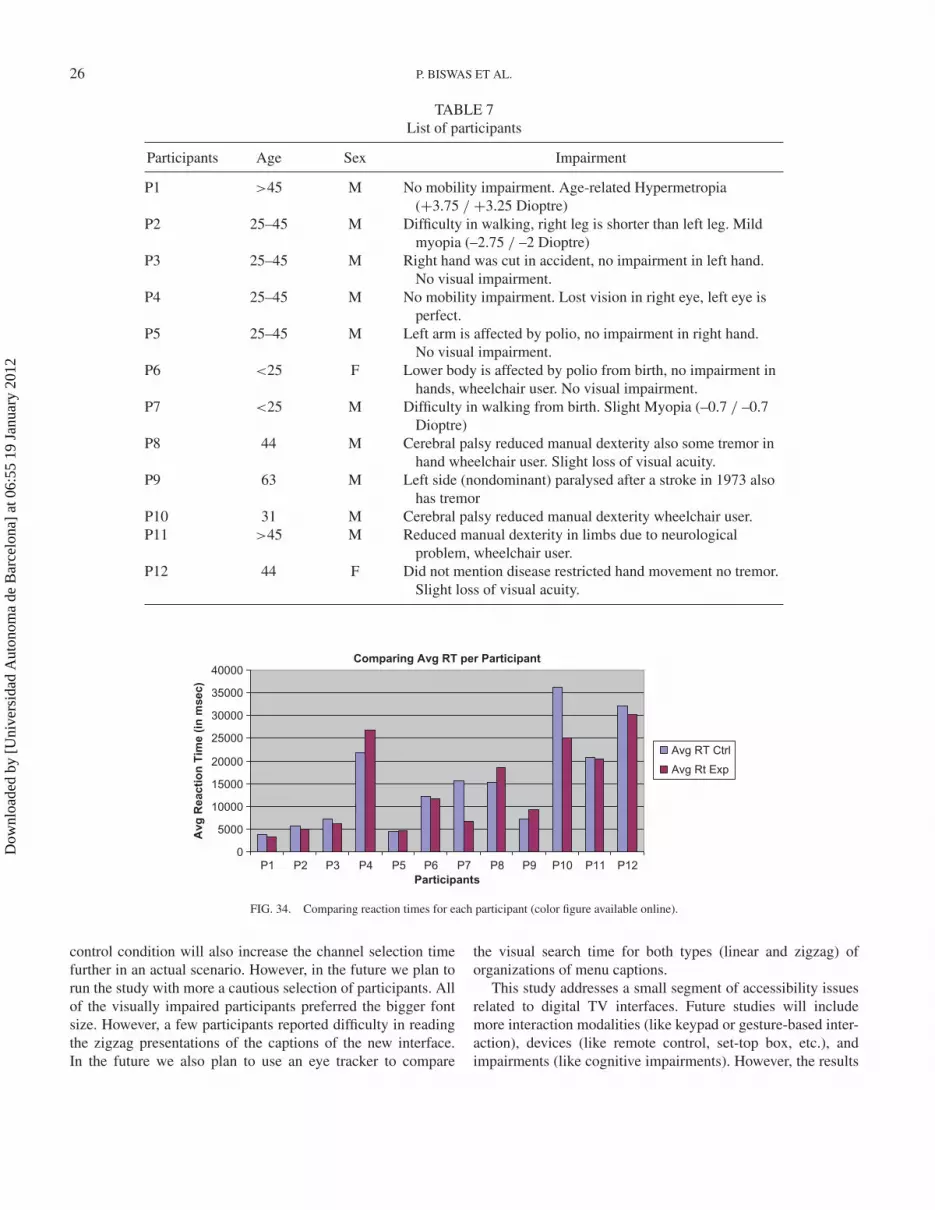
26 P. BISWAS ET AL.
TABLE 7List of participants
Participants Age Sex Impairment
P1 >45 M No mobility impairment. Age-related Hypermetropia(+3.75 / +3.25 Dioptre)
P2 25–45 M Difficulty in walking, right leg is shorter than left leg. Mildmyopia (–2.75 / –2 Dioptre)
P3 25–45 M Right hand was cut in accident, no impairment in left hand.No visual impairment.
P4 25–45 M No mobility impairment. Lost vision in right eye, left eye isperfect.
P5 25–45 M Left arm is affected by polio, no impairment in right hand.No visual impairment.
P6 <25 F Lower body is affected by polio from birth, no impairment inhands, wheelchair user. No visual impairment.
P7 <25 M Difficulty in walking from birth. Slight Myopia (–0.7 / –0.7Dioptre)
P8 44 M Cerebral palsy reduced manual dexterity also some tremor inhand wheelchair user. Slight loss of visual acuity.
P9 63 M Left side (nondominant) paralysed after a stroke in 1973 alsohas tremor
P10 31 M Cerebral palsy reduced manual dexterity wheelchair user.P11 >45 M Reduced manual dexterity in limbs due to neurological
problem, wheelchair user.P12 44 F Did not mention disease restricted hand movement no tremor.
Slight loss of visual acuity.
Comparing Avg RT per Participant
0
5000
10000
15000
20000
25000
30000
35000
40000
P1 P2 P3 P4 P5 P6 P7 P8 P9 P10 P11 P12
Participants
Avg
Re
ac
tio
n T
ime
(in
ms
ec
)
Avg RT Ctrl
Avg Rt Exp
FIG. 34. Comparing reaction times for each participant (color figure available online).
control condition will also increase the channel selection timefurther in an actual scenario. However, in the future we plan torun the study with more a cautious selection of participants. Allof the visually impaired participants preferred the bigger fontsize. However, a few participants reported difficulty in readingthe zigzag presentations of the captions of the new interface.In the future we also plan to use an eye tracker to compare
the visual search time for both types (linear and zigzag) oforganizations of menu captions.
This study addresses a small segment of accessibility issuesrelated to digital TV interfaces. Future studies will includemore interaction modalities (like keypad or gesture-based inter-action), devices (like remote control, set-top box, etc.), andimpairments (like cognitive impairments). However, the results
Dow
nloa
ded
by [
Uni
vers
idad
Aut
onom
a de
Bar
celo
na]
at 0
6:55
19
Janu
ary
2012

DESIGNING INCLUSIVE INTERFACES 27
TABLE 8Result per participant
AvgRT Ctrl (in msec) AvgRT Exp (in msec) TotalMC Ctrl TotalMC Exp
P1 3,886 3,259 0 0P2 5,755 5,033 0 0P3 7,230 6,149 0 0P4 21,777 26,838 72 56P5 4,481 4,611 0 0P6 12,195 11,739 11 4P7 15,628 6,747 13 0P8 15,394 18,628 20 28P9 7,213 9,184 0 0P10 36,160 25,084 11 0P11 20,752 20,550 14 8P12 32,228 30,223 0 6Avg 15,225 14,004 11.8 8.5
Comparing Total Number of Missed Clicks per Participant
0
10
20
30
40
50
60
70
80
P1 P2 P3 P4 P5 P6 P7 P8 P9 P10 P11 P12
Participants
No
. o
f M
iss
ed
Clic
ks
Missed Clk Ctrl
Missed Clk Exp
FIG. 35. Comparing number of missed clicks for each participant (color figure available online).
Comparing RT for Colour Blindness
0
1000
2000
3000
4000
5000
6000
Avg RT with CBAvg RT without CB
Reacti
on
Tim
e (
in m
sec)
FIG. 36. Comparing reaction times for effect of color blindness (color figure available online).
of this study can be extended beyond program menu interfacesof digital televisions. For example, the font size of captionsin absolute terms (x-height ≈ 0.5 cm.) indicates the minimumfont size required for any text in an interface for serving peo-ple with severe visual acuity loss. Similarly the particular color
combination of the screen (white text on a blue background) canbe used in any other interface as well to cater people with colorblindness. Finally, the modified menu structure can be used incomputers or other digital devices to make the menus accessibleto people with mobility impairment.
Dow
nloa
ded
by [
Uni
vers
idad
Aut
onom
a de
Bar
celo
na]
at 0
6:55
19
Janu
ary
2012
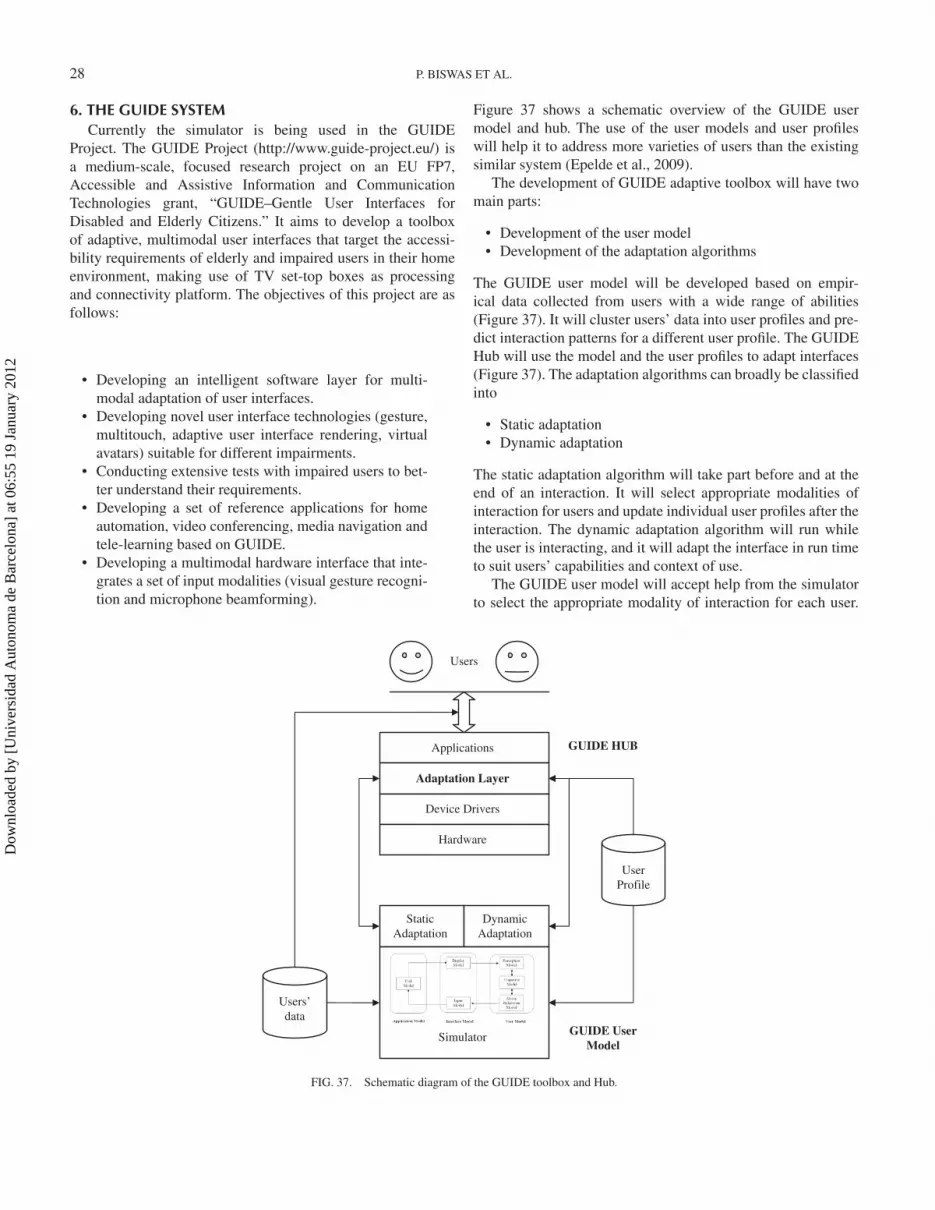
28 P. BISWAS ET AL.
6. THE GUIDE SYSTEMCurrently the simulator is being used in the GUIDE
Project. The GUIDE Project (http://www.guide-project.eu/) isa medium-scale, focused research project on an EU FP7,Accessible and Assistive Information and CommunicationTechnologies grant, “GUIDE–Gentle User Interfaces forDisabled and Elderly Citizens.” It aims to develop a toolboxof adaptive, multimodal user interfaces that target the accessi-bility requirements of elderly and impaired users in their homeenvironment, making use of TV set-top boxes as processingand connectivity platform. The objectives of this project are asfollows:
• Developing an intelligent software layer for multi-modal adaptation of user interfaces.
• Developing novel user interface technologies (gesture,multitouch, adaptive user interface rendering, virtualavatars) suitable for different impairments.
• Conducting extensive tests with impaired users to bet-ter understand their requirements.
• Developing a set of reference applications for homeautomation, video conferencing, media navigation andtele-learning based on GUIDE.
• Developing a multimodal hardware interface that inte-grates a set of input modalities (visual gesture recogni-tion and microphone beamforming).
Figure 37 shows a schematic overview of the GUIDE usermodel and hub. The use of the user models and user profileswill help it to address more varieties of users than the existingsimilar system (Epelde et al., 2009).
The development of GUIDE adaptive toolbox will have twomain parts:
• Development of the user model• Development of the adaptation algorithms
The GUIDE user model will be developed based on empir-ical data collected from users with a wide range of abilities(Figure 37). It will cluster users’ data into user profiles and pre-dict interaction patterns for a different user profile. The GUIDEHub will use the model and the user profiles to adapt interfaces(Figure 37). The adaptation algorithms can broadly be classifiedinto
• Static adaptation• Dynamic adaptation
The static adaptation algorithm will take part before and at theend of an interaction. It will select appropriate modalities ofinteraction for users and update individual user profiles after theinteraction. The dynamic adaptation algorithm will run whilethe user is interacting, and it will adapt the interface in run timeto suit users’ capabilities and context of use.
The GUIDE user model will accept help from the simulatorto select the appropriate modality of interaction for each user.
Users
Applications
Adaptation Layer
Device Drivers
Hardware
Static Adaptation
Dynamic Adaptation
Simulator
Users’data
UserProfile
GUIDE HUB
GUIDE User Model
FIG. 37. Schematic diagram of the GUIDE toolbox and Hub.
Dow
nloa
ded
by [
Uni
vers
idad
Aut
onom
a de
Bar
celo
na]
at 0
6:55
19
Janu
ary
2012

DESIGNING INCLUSIVE INTERFACES 29
The simulator will also change the interface layout based on thecontext of use and the interaction patterns of users. For example,if a user has less visual acuity, the font size of the screen willautomatically be increased. If someone has a spasm or tremor ina finger, as with cerebral palsy, one may find the remote controlhard to use and the simulator will invoke alternative interactiondevices for that person. The personalization will also be invokedby change in context of use. For example, if the simulatordetects a higher level of background noise, it may automaticallyincrease the volume. The following two subsections elaboratethe ideas of static and dynamic adaptation.
6.1. Static AdaptationThis example demonstrates a case study of using the simu-
lator within the context of the GUIDE Project to select inputand output modalities of interaction and personalizing inter-faces from user profile. Initially we selected a set of usercharacteristics and modalities of interaction. Then we pre-sented conditions for selecting different modalities for differenttypes of users. In the last part of the document, we extendedthe idea of modality selection to interface personalization ingeneral.
User profile
• Visual Acuity after correction (VA)• Presence and type of Colour Blindness (CB)• Grip Strength (GS)• Range of Motion of Forearm (ROM)• Capacity of Short Term Memory (STM)
Input modalities
• Physical Keys like Remote Control (K)• Pointing Device (P)• Pointing with Haptic feedback (PH)• Gesture based (G)• Voice based (V)
Output modalities
• Screen (S)• Audio (A)
AssumptionsWe have considered the following assumptions based on the
results obtained from our simulator (Biswas, 2010).
• People having less than –5.5 Dioptre Visual Acuitywill not prefer to use screen and thus pointing devices.
• People having less than 20 kg Grip Strength will preferto use the pointing device with haptic feedback morethan the ordinary one.
• People with color blindness (especially red–greencolor blindness) will prefer white text on a blue back-ground on the screen.
• People having less capacity of short-term memory willprefer to use a reduced command set for gesture-basedand voice-based input.
Flow chartThese assumptions are diagrammatically represented in
Figure 38. The Yes/No options of the flowchart can be replacedwith probability values after collecting enough data to calculatethe prior probabilities. Then the flow chart can be imple-mented using a probabilistic rule-based system (like CLIPS) orcan be converted to a Bayesian Network (Griffiths, Kemp, &Tenenbaum, 2008).
6.2. Dynamic AdaptationThe predicted cursor trace (Figure 8) from the simulator
helps in developing dynamic adaptation algorithms. Figure 39shows cursor traces on three different buttons in an interface.It can be seen that if the user aims to click at the middle ofthe button, then in spite of the random movements, there is nochance of miss-clicking neighboring buttons. However, if theuser aims to click at the edge of the button, as in the case of
FIG. 38. Flowchart to select interaction modalities.
Dow
nloa
ded
by [
Uni
vers
idad
Aut
onom
a de
Bar
celo
na]
at 0
6:55
19
Janu
ary
2012

30 P. BISWAS ET AL.
FIG. 39. An example of missed clicking (color figure available online).
FIG. 40. An example of the gravity well (color figure available online).
the rightmost button labeled “Disconnect,” the user may end upclicking on a neighboring button—in this case the right arrowkey (marked with dotted red circle). We can alleviate this prob-lem by employing an adaptation principle called gravity well(Hwang, Langdon, Keates, Clarkson, & Robinson, 2002). Thegravity well will attract the pointer in the middle of a button,if it is in vicinity of the button. So even if the user pointstoward the edge of a button, the pointer will automatically moveto the center of the button. The thick blue line in Figure 40shows the modified cursor traces after employing the gravitywell, and the dotted red circle highlights how the cursor hasbeen attracted to the middle of the Disconnect button influ-enced by the gravity well. Similar analysis can also be done for
other adaptation algorithms like cursor path averaging, damping(Hwang et al., 2002), and setting parameters for those algo-rithms. In fact, we have already used the simulator to designand evaluate accessible interfaces and interaction techniques(Biswas, 2010).
7. IMPLICATIONS AND LIMITATIONS OF USERMODELING
User trials are always expensive in terms of both timeand cost. A design evolves through an iteration of prototypes,and if each prototype is to be evaluated by a user trial, thewhole design process will be slowed down. Buxton (1994)
Dow
nloa
ded
by [
Uni
vers
idad
Aut
onom
a de
Bar
celo
na]
at 0
6:55
19
Janu
ary
2012

DESIGNING INCLUSIVE INTERFACES 31
also noted that “while we believe strongly in user testingand iterative design. However, each iteration of a design isexpensive. The effective use of such models means that weget the most out of each iteration that we do implement.”In addition, user trials are not representative in certain cases,especially for designing inclusive interfaces for people withspecial needs. A good simulation with a principled theoreti-cal foundation can be more useful than a user trial in suchcases. Exploratory use of modeling can also help designers tounderstand the problems and requirements of users, which maynot always easily be found through user trials or controlledexperiments.
This work shows that it is possible to develop engineeringmodels to simulate HCI of people with a wide range of abili-ties and that the prediction is useful in designing and evaluatinginterfaces. According to Allen Newell’s time scale of humanaction, our model works in the cognitive band and predictsactivity in the millisecond to second range. It cannot modelactivities outside the cognitive band like microsaccadic eye gazemovements, response characteristics of different brain regions(in biological band; Newell, 1990), affective state, social inter-action, consciousness (in rational and social band; Newell,1990), and so on. Simulations of each individual band have theirown implications and limitations. However, the cognitive bandis particularly important because models working in this bandare technically feasible, experimentally verifiable, and practi-cally usable. Research in computational psychology and morerecently in cognitive architectures supports this claim. We haveadded a new dimension in cognitive modeling by includingusers with special needs. Thus it helps to implement UniversalDesign or Inclusive Design processes by helping to visualize,understand, and measure the effect of different impairments oninteraction.
However, this system should not be used in isolation. It is notdesigned to capture subjective choice or preference of users; thesimulator should complement existing qualitative techniques(Springett, 2008) or participatory designs (Ellis & Kurniawan,2000) for assessing users’ experience.
8. CONCLUSIONIn this article we have presented a literature survey on
human behavior simulation and their applications on modelingusers in HCI. The review of the current state-of-the-art workshows a deficiency of modeling tools for users with disabilities.We have developed a simulator to address the problems inexisting modeling techniques. It should be evident that theuse of modeling and the type of model to be used dependon many factors like the application, the designers, avail-ability of time and cost for design, and so on. However,we hope this article will give system analysts an under-standing of different modeling paradigms, which in turnmay help them to select the proper type of model for theirapplications.
REFERENCESAnderson, J. R., & Lebiere C. (1998). The atomic components of thought.
Hillsdale, NJ: Erlbaum.Barnard, P. (2011). The Emotion Research Group website, MRC Cognition
and Brain Sciences Unit. Retrieved from http://www.mrc-cbu.cam.ac.uk/research/emotion/
Benyon, D., & Murray D. (1993). Applying user modeling to human computerinteraction design. Artificial Intelligence Review, 7,199–225.
Bernard, M., Liao, C. H., & Mills, M. (2001). The effects of font type andsize on the legibility and reading time of online text by older adults.ACM/SIGCHI Conference on Human Factors in Computing Systems 2001,175–176.
Bernard, M., Mills, M., Peterson, M., & Storrer, K. A. (2001, July). A compari-son of popular online fonts: Which is best and when? Usability News, 3(2).Retrieved from http://www.surl.org/usabilitynews/32/font.asp
Beymer, D., Russell, D. M., & Orton, P. Z. (2007). An eye tracking study ofhow font size, font type, and pictures influence online reading. Proceedingsof the 22nd British Computer Society Conference on Human–ComputerInteraction 2007, 15–18.
Biswas, P. (2010). Inclusive user modelling. Unpublished doctoral dissertation,University of Cambridge, England.
Biswas, P., Bhattacharyya, S., & Samanta, D. (2005). User model to designadaptable interfaces for motor-impaired users. Tencon ’05 - IEEE Region10 Conferences 2005. 1801–1844.
Biswas, P., & Robinson, P. (2008). Automatic evaluation of assistive inter-faces. Proceedings of the ACM International Conference on Intelligent UserInterfaces (IUI) 2008, 247–256.
Biswas, P., & Robinson, P. (2009a). Modelling perception using image pro-cessing algorithms. Proceedings of the 23rd British HCI Group AnnualConference on People and Computers: Celebrating People and Technology,pp. 494–503.
Biswas, P., & Robinson, P. (2009b). Predicting pointing time from handstrength. Proceedings of the Usability & HCI for e-Inclusion, 5thSymposium of the Austrian Computer Society (USAB 2009), LNCS 5889,428–447.
Blandford, A., Butterworth, R., & Curzon, P. (2004). Models of interactive sys-tems: A case study on programmable user modelling. International Journalof Human-Computer Studies, 60, 149–200.
Boden, M. A. (1985). Computer models of mind: Computational approaches intheoretical psychology. Cambridge, UK: Cambridge University Press.
Bovaria, S., Kieras, D. E., & Polson, P. G. (1990). The acquisition andperformance of text-editing skill: A cognitive complexity analysis. Human-Computer Interaction, 5, 1–48.
Boyarski, D., Neuwirth, C., Forlizzi, J., & Regli, S. H. (1998). A study of fontsdesigned for screen display. ACM/SIGCHI Conference on Human Factorsin Computing Systems 1998, 87–94.
Butterworth, R., & Blandford, A. (1997). Programmable user models: The storyso far. Retrieved from http://www.cs.mdx.ac.uk/puma/wp8.pdf
Buxton, W., with Billinghurst, M., Guiard, Y., Sellen, A., & Zhai, S. (1994).Human input to computer systems: Theories, techniques and technology.Unpublished manuscript. Retrieved October 27, 2009, from http://www.billbuxton.com/inputManuscript.html
Byrne M. D. (2001). ACT–R/PM and menu selection: Applying a cognitivearchitecture to HCI. International Journal of Human–Computer Studies, 55,41–84.
Card, S., Moran, T., & Newell, A. (1983). The psychology of human–computerinteraction. Hillsdale, NJ: Erlbaum.
Carroll, J. M., & Olson, J. M. (1990). Mental models in human–computer inter-action. In M. Helander (Ed.), Handbook of human-computer interaction (pp.135–158). Amsterdam, the Netherlands: Elsevier.
Cognitive architecture. (2007). In Wikipedia. Retrieved July 1, 2007, from http://en.wikipedia.org/wiki/Cognitive_ architecture
Ellis, R. D., & Kurniawan, S. (2000). Increasing the usability of online infor-mation for older users: A case study in participatory design. InternationalJournal of Human–Computer Interaction, 12, 263–276.
Eng, K., Lewis, R. L., Tollinger, I., Chu, A., Howes, A., & Vera, A. (2006).Generating automated predictions of behavior strategically adapted to spe-cific performance objectives. ACM/SIGCHI Conference on Human Factorsin Computing Systems 2006, 621–630.
Dow
nloa
ded
by [
Uni
vers
idad
Aut
onom
a de
Bar
celo
na]
at 0
6:55
19
Janu
ary
2012
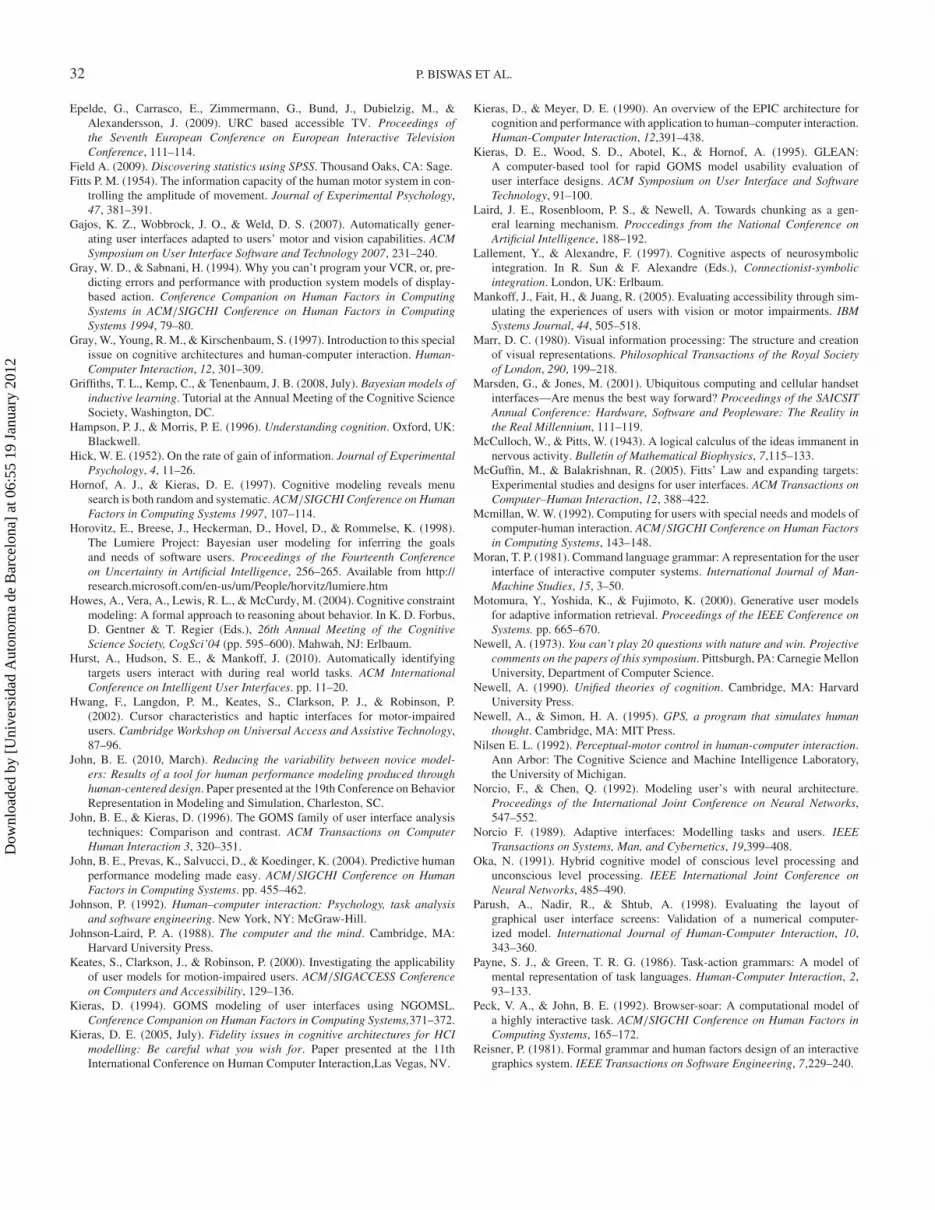
32 P. BISWAS ET AL.
Epelde, G., Carrasco, E., Zimmermann, G., Bund, J., Dubielzig, M., &Alexandersson, J. (2009). URC based accessible TV. Proceedings ofthe Seventh European Conference on European Interactive TelevisionConference, 111–114.
Field A. (2009). Discovering statistics using SPSS. Thousand Oaks, CA: Sage.Fitts P. M. (1954). The information capacity of the human motor system in con-
trolling the amplitude of movement. Journal of Experimental Psychology,47, 381–391.
Gajos, K. Z., Wobbrock, J. O., & Weld, D. S. (2007). Automatically gener-ating user interfaces adapted to users’ motor and vision capabilities. ACMSymposium on User Interface Software and Technology 2007, 231–240.
Gray, W. D., & Sabnani, H. (1994). Why you can’t program your VCR, or, pre-dicting errors and performance with production system models of display-based action. Conference Companion on Human Factors in ComputingSystems in ACM/SIGCHI Conference on Human Factors in ComputingSystems 1994, 79–80.
Gray, W., Young, R. M., & Kirschenbaum, S. (1997). Introduction to this specialissue on cognitive architectures and human-computer interaction. Human-Computer Interaction, 12, 301–309.
Griffiths, T. L., Kemp, C., & Tenenbaum, J. B. (2008, July). Bayesian models ofinductive learning. Tutorial at the Annual Meeting of the Cognitive ScienceSociety, Washington, DC.
Hampson, P. J., & Morris, P. E. (1996). Understanding cognition. Oxford, UK:Blackwell.
Hick, W. E. (1952). On the rate of gain of information. Journal of ExperimentalPsychology, 4, 11–26.
Hornof, A. J., & Kieras, D. E. (1997). Cognitive modeling reveals menusearch is both random and systematic. ACM/SIGCHI Conference on HumanFactors in Computing Systems 1997, 107–114.
Horovitz, E., Breese, J., Heckerman, D., Hovel, D., & Rommelse, K. (1998).The Lumiere Project: Bayesian user modeling for inferring the goalsand needs of software users. Proceedings of the Fourteenth Conferenceon Uncertainty in Artificial Intelligence, 256–265. Available from http://research.microsoft.com/en-us/um/People/horvitz/lumiere.htm
Howes, A., Vera, A., Lewis, R. L., & McCurdy, M. (2004). Cognitive constraintmodeling: A formal approach to reasoning about behavior. In K. D. Forbus,D. Gentner & T. Regier (Eds.), 26th Annual Meeting of the CognitiveScience Society, CogSci’04 (pp. 595–600). Mahwah, NJ: Erlbaum.
Hurst, A., Hudson, S. E., & Mankoff, J. (2010). Automatically identifyingtargets users interact with during real world tasks. ACM InternationalConference on Intelligent User Interfaces. pp. 11–20.
Hwang, F., Langdon, P. M., Keates, S., Clarkson, P. J., & Robinson, P.(2002). Cursor characteristics and haptic interfaces for motor-impairedusers. Cambridge Workshop on Universal Access and Assistive Technology,87–96.
John, B. E. (2010, March). Reducing the variability between novice model-ers: Results of a tool for human performance modeling produced throughhuman-centered design. Paper presented at the 19th Conference on BehaviorRepresentation in Modeling and Simulation, Charleston, SC.
John, B. E., & Kieras, D. (1996). The GOMS family of user interface analysistechniques: Comparison and contrast. ACM Transactions on ComputerHuman Interaction 3, 320–351.
John, B. E., Prevas, K., Salvucci, D., & Koedinger, K. (2004). Predictive humanperformance modeling made easy. ACM/SIGCHI Conference on HumanFactors in Computing Systems. pp. 455–462.
Johnson, P. (1992). Human–computer interaction: Psychology, task analysisand software engineering. New York, NY: McGraw-Hill.
Johnson-Laird, P. A. (1988). The computer and the mind. Cambridge, MA:Harvard University Press.
Keates, S., Clarkson, J., & Robinson, P. (2000). Investigating the applicabilityof user models for motion-impaired users. ACM/SIGACCESS Conferenceon Computers and Accessibility, 129–136.
Kieras, D. (1994). GOMS modeling of user interfaces using NGOMSL.Conference Companion on Human Factors in Computing Systems,371–372.
Kieras, D. E. (2005, July). Fidelity issues in cognitive architectures for HCImodelling: Be careful what you wish for. Paper presented at the 11thInternational Conference on Human Computer Interaction,Las Vegas, NV.
Kieras, D., & Meyer, D. E. (1990). An overview of the EPIC architecture forcognition and performance with application to human–computer interaction.Human-Computer Interaction, 12,391–438.
Kieras, D. E., Wood, S. D., Abotel, K., & Hornof, A. (1995). GLEAN:A computer-based tool for rapid GOMS model usability evaluation ofuser interface designs. ACM Symposium on User Interface and SoftwareTechnology, 91–100.
Laird, J. E., Rosenbloom, P. S., & Newell, A. Towards chunking as a gen-eral learning mechanism. Proccedings from the National Conference onArtificial Intelligence, 188–192.
Lallement, Y., & Alexandre, F. (1997). Cognitive aspects of neurosymbolicintegration. In R. Sun & F. Alexandre (Eds.), Connectionist-symbolicintegration. London, UK: Erlbaum.
Mankoff, J., Fait, H., & Juang, R. (2005). Evaluating accessibility through sim-ulating the experiences of users with vision or motor impairments. IBMSystems Journal, 44, 505–518.
Marr, D. C. (1980). Visual information processing: The structure and creationof visual representations. Philosophical Transactions of the Royal Societyof London, 290, 199–218.
Marsden, G., & Jones, M. (2001). Ubiquitous computing and cellular handsetinterfaces—Are menus the best way forward? Proceedings of the SAICSITAnnual Conference: Hardware, Software and Peopleware: The Reality inthe Real Millennium, 111–119.
McCulloch, W., & Pitts, W. (1943). A logical calculus of the ideas immanent innervous activity. Bulletin of Mathematical Biophysics, 7,115–133.
McGuffin, M., & Balakrishnan, R. (2005). Fitts’ Law and expanding targets:Experimental studies and designs for user interfaces. ACM Transactions onComputer–Human Interaction, 12, 388–422.
Mcmillan, W. W. (1992). Computing for users with special needs and models ofcomputer-human interaction. ACM/SIGCHI Conference on Human Factorsin Computing Systems, 143–148.
Moran, T. P. (1981). Command language grammar: A representation for the userinterface of interactive computer systems. International Journal of Man-Machine Studies, 15, 3–50.
Motomura, Y., Yoshida, K., & Fujimoto, K. (2000). Generative user modelsfor adaptive information retrieval. Proceedings of the IEEE Conference onSystems. pp. 665–670.
Newell, A. (1973). You can’t play 20 questions with nature and win. Projectivecomments on the papers of this symposium. Pittsburgh, PA: Carnegie MellonUniversity, Department of Computer Science.
Newell, A. (1990). Unified theories of cognition. Cambridge, MA: HarvardUniversity Press.
Newell, A., & Simon, H. A. (1995). GPS, a program that simulates humanthought. Cambridge, MA: MIT Press.
Nilsen E. L. (1992). Perceptual-motor control in human-computer interaction.Ann Arbor: The Cognitive Science and Machine Intelligence Laboratory,the University of Michigan.
Norcio, F., & Chen, Q. (1992). Modeling user’s with neural architecture.Proceedings of the International Joint Conference on Neural Networks,547–552.
Norcio F. (1989). Adaptive interfaces: Modelling tasks and users. IEEETransactions on Systems, Man, and Cybernetics, 19,399–408.
Oka, N. (1991). Hybrid cognitive model of conscious level processing andunconscious level processing. IEEE International Joint Conference onNeural Networks, 485–490.
Parush, A., Nadir, R., & Shtub, A. (1998). Evaluating the layout ofgraphical user interface screens: Validation of a numerical computer-ized model. International Journal of Human-Computer Interaction, 10,343–360.
Payne, S. J., & Green, T. R. G. (1986). Task-action grammars: A model ofmental representation of task languages. Human-Computer Interaction, 2,93–133.
Peck, V. A., & John, B. E. (1992). Browser-soar: A computational model ofa highly interactive task. ACM/SIGCHI Conference on Human Factors inComputing Systems, 165–172.
Reisner, P. (1981). Formal grammar and human factors design of an interactivegraphics system. IEEE Transactions on Software Engineering, 7,229–240.
Dow
nloa
ded
by [
Uni
vers
idad
Aut
onom
a de
Bar
celo
na]
at 0
6:55
19
Janu
ary
2012
DESIGNING INCLUSIVE INTERFACES 33
Rieman, J., & Young, R. M. (1996). A dual-space model of iteratively deepeningexploratory learning. International Journal of Human-Computer Studies,44, 743–775.
Ruiz, J., & Lank, E. (2010). Speeding pointing in tiled widgets: Understandingthe effects of target expansion and misprediction. ACM InternationalConference on Intelligent User Interfaces, 229–238.
Salvucci, D. D., & Lee, F. J. (2003). Simple cognitive modelling in a com-plex cognitive architecture. ACM/SIGCHI Conference on Human Factorsin Computing Systems, 265–272.
Serna, A., Pigot, H., & Rialle, V. (2007). Modeling the progression ofAlzheimer’s disease for cognitive assistance in smart homes. User Modelingand User-Adapted Interaction, 17, 415–438.
Springett, M. (2008). Assessing user experiences within interaction: Experienceas a qualitative state and experience as a causal event. Proceedingsof Meaningful Measures: Valid Useful User Experience Measurement(VUUM).
Stephanidis, C., & Constantinou, P. (2003). Designing human–computer inter-faces for quadriplegic people. ACM Transactions on Computer-HumanInteraction, 10, 87–118.
Stephanidis, C., Paramythis, A., Sfyrakis, M., Stergiou, A., Maou, N., Leventis,A., . . . Karagiannidis, C. (1998). Adaptable and adaptive user interfacesfor disabled users in the AVANTI Project. Intelligence in Services andNetworks, LNCS-1430, 153–166.
Tollinger, I., Lewis, R. L., McCurdy, M., Tollinger, P., Vera, A., Howes, A.,& Pelton, L. (2005). Supporting efficient development of cognitive mod-els at multiple skill levels: Exploring recent advances in constraint-basedmodeling. ACM/SIGCHI Conference on Human Factors in ComputingSystems, 411–420.
Treisman, A., & Gelade, G. (1980). A feature integration theory of attention.Cognitive Psychology, 12, 97–136.
Wendell, S. (1996). The rejected body: Feminist philosophical reflections ondisability. New York, NY: Routledge.
World Bank. (2011). Retrieved from http://web.worldbank.orgWorld Health Organization. (2011). Our ageing world [Web page]. Retrieved
from http://www.who.int/ageing/enYoshida, K., & Motoda, H. (1996). Automated user modeling for intelli-
gent interface. International Journal of Human-Computer Interaction, 8,237–258.
Young, R. M., Green, T. R. G., & Simon, T. (1989). Programmable user modelsfor predictive evaluation of interface designs. ACM/SIGCHI Conference onHuman Factors in Computing Systems, 15–19.
ABOUT THE AUTHORSPradipta Biswas is a Research Associate at the EngineeringDesign Centre and Trinity Hall of University of Cambridge.He is member of the British Computer Society, Royal Societyof Medicine, the EU Task Force on Standardization of UserModels and a working group coordinator of the ITU focus groupon Audiovisual Media Accessibility.
Peter Robinson is Professor of Computer Technology andDeputy Head of Department at the University of CambridgeComputer Laboratory in England and a Fellow, Praelector andDirector of Studies in Computer Science at Gonville & CaiusCollege.
Pat Langdon is a Senior Research Associate at theEngineering Design Centre of University of Cambridge. He iscurrently External Examiner for the Kings College London andGuy’s Hospital Intercollegiate MSc in Assistive Technology.
Dow
nloa
ded
by [
Uni
vers
idad
Aut
onom
a de
Bar
celo
na]
at 0
6:55
19
Janu
ary
2012


