Embed Size (px)
Citation preview

Design of a Resource Allocation Planning System
Kelly O’Hargan and Stephanie Guerlain
University of Virginia, Charlottesville, VA, USA [email protected]
Abstract.
This paper proposes a generic human-computer software user interface design, called the Resource Allocation Planning System (RAPS), designed to support a person making resource allocation decisions. Although there are many algorithms for automatically solving resource allocation problems, it is often the case that human judgment is also required. Also, while there are software user interfaces to support decision-making for specific resource allocation problems, most of them serve more as organizational charts than as decision-support systems, and most of them become increasingly difficult to use as the size of the resource allocation problem increases. This paper discusses the design and rationale for RAPS and gives an example of how RAPS can be adapted to a specific resource allocation problem.
Rationale and Objectives
Resource allocation is a common type of task that requires complex cognitive reasoning; it requires assigning assets to demands given a set of constraints. A decision-support system (DSS) can reduce cognitive demands by organizing information effectively and making aspects of a task that are always true automatically executable, therefore allowing a decision maker to focus cognitive resources on those aspects of the task that require human input and judgment. For example, when a user is trying to make a decision based on a set of options, the cognitive workload on the decision-maker can be reduced by limiting the options presented to only those options that are feasible. Furthermore, the difficulty of a cognitive task can be decreased (or increased) depending on the tools and representations available to the decision maker for tracking information and task completion. Effective representations provide decision makers with an “external memory” (e.g., information is represented directly “in the world”), thereby eliminating the need to remember that information “in the head”. Ineffective representations, on the other hand, require the operator to remember important constraints, relations, procedures, etc. “in the head’ while working on a problem, adding cognitive burden and increasing the likelihood of errors. This is known as the Representational Effect (Zhang and Norman, 1994).
2
Complex domains with a large set of tasks and task situations that must be managed have the propensity to increase in complexity to a point that a single representation cannot reasonably embody all of the necessary information (relationships, details, constraints, task progress, etc.). Therefore, a complete user interface design must include a set of corresponding representations and offer the functionality for a user to easily switch from one task to another, while maintaining situational awareness of the complete system. This is known as Workspace Navigation (Woods, 1995).
The above discussion now frames the research described in this paper: the creation of a Resource Allocation Planning System (RAPS), a user interface and associated information organization functions for medium to large-scale (25 to 100+ entities) resource allocation problems The intended benefit of RAPS is to provide the user interface design community with a clear methodology for how to design resource allocation information displays, along with associated information organization functions, to enable a human decision maker to be included in the decision making process and make informed judgments without becoming overwhelmed. The possible applications of RAPS are extensive. The design is specified such that it can be easily adapted to fit generic resource allocation problems. As a demonstration of its applicability, this paper gives an example of specific instantiation of RAPS.
Resource Allocation
According to the Encarta dictionary, resource allocation is “the activity of deciding how resources such as money, assets, and personnel should be used in order to achieve a particular aim.” This means that a decision-maker has a set of resources and goals, and the problem is determining the best way to assign those resources to meet those goals. A common set of characteristics for resource allocation problems are shown in Table 1.
In addition to the constraints defined by the generic requirements of the system, there may also be run-time constraints associated with the problem. These constraints may be created by: new information the decision-maker receives, known information that is not included within the model, special circumstances, or changes to the system. Run-time constraints can also simply be the unconscious opinions that affect a decision-maker’s judgment calls. Take the example of someone assigning shifts for a group of nurses at a hospital. The resources are the nurses and the demands are the shifts that need to have nurses assigned to them, (see Table 2). If run-time constraints are not met, perhaps because the scheduling system does not take personal preference into account, then the nurses will receive the schedule and switch between themselves until everyone is happy with the shifts they are covering. However, if the scheduler had been able to take all of the individual’s preferences into account, then there would be no need for swapping shifts.
3
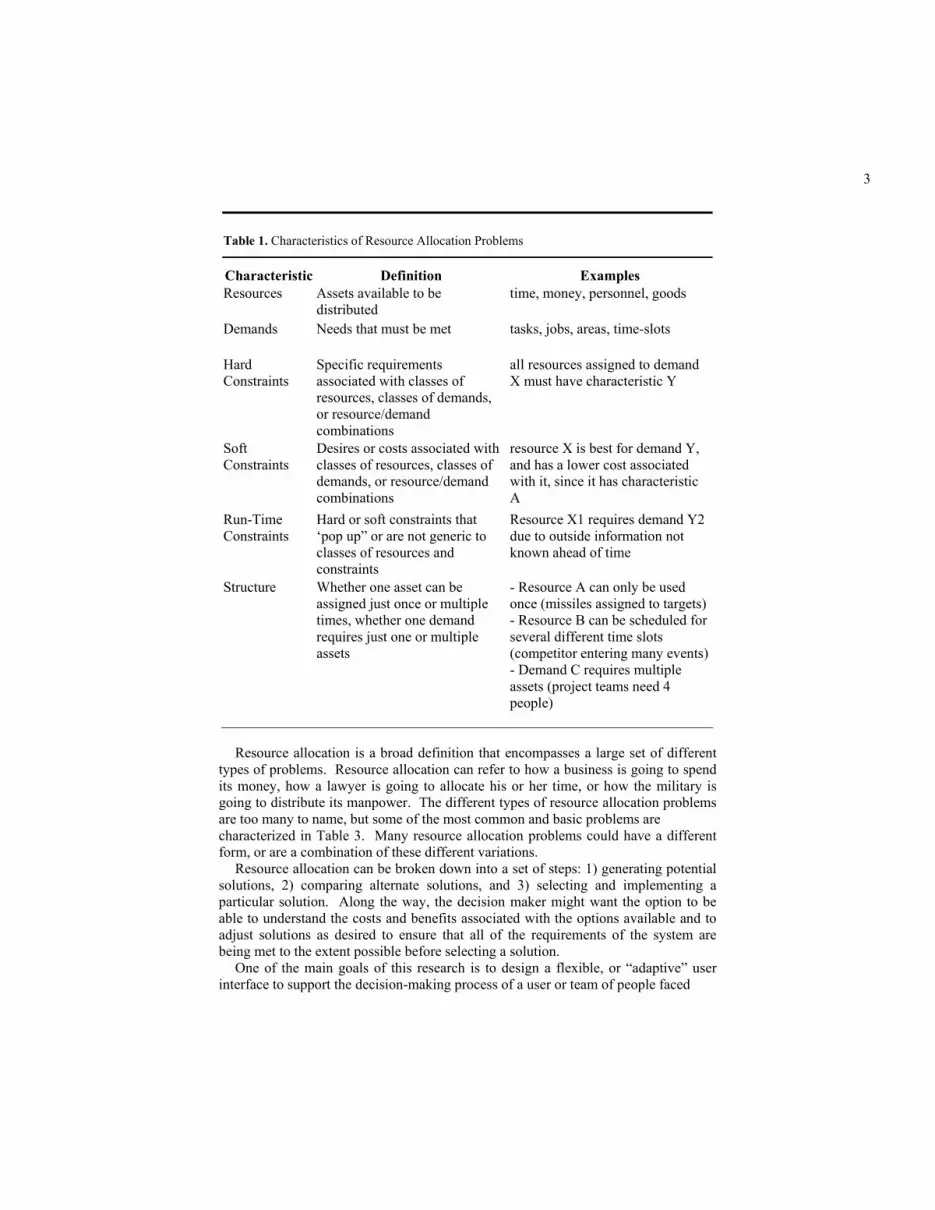
Table 1. Characteristics of Resource Allocation Problems
Characteristic Definition Examples Resources Assets available to be
distributed time, money, personnel, goods
Demands Needs that must be met tasks, jobs, areas, time-slots
Hard Constraints
Specific requirements associated with classes of resources, classes of demands, or resource/demand combinations
all resources assigned to demand X must have characteristic Y
Soft Constraints
Desires or costs associated with classes of resources, classes of demands, or resource/demand combinations
resource X is best for demand Y, and has a lower cost associated with it, since it has characteristic A
Run-Time Constraints
Hard or soft constraints that ‘pop up” or are not generic to classes of resources and constraints
Resource X1 requires demand Y2 due to outside information not known ahead of time
Structure Whether one asset can be assigned just once or multiple times, whether one demand requires just one or multiple assets
- Resource A can only be used once (missiles assigned to targets) - Resource B can be scheduled for several different time slots (competitor entering many events) - Demand C requires multiple assets (project teams need 4 people)
Resource allocation is a broad definition that encompasses a large set of different
types of problems. Resource allocation can refer to how a business is going to spend its money, how a lawyer is going to allocate his or her time, or how the military is going to distribute its manpower. The different types of resource allocation problems are too many to name, but some of the most common and basic problems are characterized in Table 3. Many resource allocation problems could have a different form, or are a combination of these different variations.
Resource allocation can be broken down into a set of steps: 1) generating potential solutions, 2) comparing alternate solutions, and 3) selecting and implementing a particular solution. Along the way, the decision maker might want the option to be able to understand the costs and benefits associated with the options available and to adjust solutions as desired to ensure that all of the requirements of the system are being met to the extent possible before selecting a solution.
One of the main goals of this research is to design a flexible, or “adaptive” user interface to support the decision-making process of a user or team of people faced

4
Table 2. Characteristics of Resource Allocation of Nursing Shift
Characteristic Nursing Shifts Example Resources Nurses Demands Shifts at a hospital Hard Constraints -each shift is covered by X nurses
-each nurse receives Y-Z hours -no nurse works more than A hours in a 24 hour period
Soft Constraints -no nurse works more than X hours in a week -each nurse gets Z hours between shifts
Run-Time Constraints
-nurse X can only work nights -nurse Y doesn’t work on Sundays
with a resource allocation problem. A Decision Support System (DSS) manages the data essential for decision-making and translates the data into information that once presented to the decision-maker provides the information needed to make accurate decisions (Laudon, 2003). There are two main kinds of DSS: cognitive prostheses, in which the computer makes a decision that the user has to approve; and cognitive tools, in which the user is supported in his or her own decision making process by a comprehensive display of all of the essential information (Wickens, et al., 2004).
Cognitive Prostheses put the human in a subservient role by having the computer automatically make decisions that are then interpreted and approved by the user (Wickens, et al., 2004). However, if a user developed his or her own solution to the problem, there is rarely any way for him or her to effectively compare his or her answer with the one found by the model (Guerlain, 2000). Thus, the user is restricted to the solution set defined by the algorithm. Also, since the algorithm is based on numeric values that represent different aspects of the problem space, it is often difficult to see the logical progression of the model and how particular solutions are determined. This makes it hard for a decision-maker to understand the factors driving a particular solution to the problem or how adjustments may affect the solution. Similarly, using an algorithm as the chief decision-maker limits the user’s ability to include additional user-defined, “run-time” constraints. User defined constraints can be important since the user may have additional information that was not available when the model was built, he or she may want to adjust the weights associated with the importance of different factors, or he or she may simply want to include his or her opinion in the decision-making process. Often resource allocation problems will have a number of “close” solutions where all of the demands are met and the mathematically calculated cost is the same for a number of different options. This is a case where human-judgment can be used to choose the best solution, if the DSS supported that functionality.

5
Table 3. Typical Resource Allocation Problem Classifications
Classification Resources Demands Hard Constraints
Soft Constraints
Structure
Temporal assests that need to be scheduled
times during which demands need to be met
all resources are scheduled for all of the times needed, if possible only one resource scheduled at a time
certain resources must be assigned to particular time-slotscertain time-slots must be met by particular resources
time-slots with at most one demand assigned to each
Spatial assests that are in a certain location
locations where demands need to be met
the minimal amounts of required resources are allocated to designated areas
the consequences of certain areas not receiving the resources they need
multiple resources assigned to multiple areas
Dynamic assets that move over time
locations where demands need to be met at particular times
a particular set of resource characteristics are needed in order to satisfy a demand
there are different costs associated with different resource/demand assignment combinations
particular resources assigned to particular demands based on efficiency of resource/demand combinations
Due to the limitations of the Cognitive Prosthesis approach, effort has been focused
on providing decision-support through Cognitive Tools approach. Cognitive tools are decision-aids that have been developed to provide support to decision-makers by presenting information to the decision-maker in an effective way and allowing users to track their own decision making progress, often using information visualization techniques.
Information Visualization uses graphical means such as information placement, size and color to communicate ideas and information and to relate and compare entities of a system (Card, et al., 1999). The purpose of information visualization is to represent relationships between entities comprehensively, and use visual representations that model the physical system in a way that is intuitive to the user. Effective information visualization allows a user to understand how different aspects of a system are related, simply by how the information is presented.
Information Visualization for Resource Allocation Problems
There are a number of visualization methods that have been developed for different types of resource allocation problems, such as: matrix displays, time-line displays, spatial displays, and combination displays. The basic idea of a matrix is for the options to represent rows down the left side, and the columns to represent either particular characteristics or items the options can be applied to meet. The cells within the matrix represent the relationships between the intersecting rows and columns. A matrix is particularly useful for multiple objective functions since the result of each possible row/column combination is summarized in the intersecting cell of the matrix.

6
Unfortunately, in a matrix design, the visual representation increases in size as more entities need to be represented, so the user is forced to scroll through multiple windows or page through multiple screens to find the information he or she needs (Woods and Watts, 1997). One approach for combating this problem is to use the Table Lens approach (Rao and Card in 1994), which allows a user to visualize a larger table than could normally be displayed by expanding the cells of interest, while minimizing the size of the remaining cells. This type of interface permits the user to view the detailed information he or she is considering, while maintaining situational awareness of the complete system.
Temporal resource allocation problems are generally scheduling problems. Information visualizations for scheduling problems are typically set up like calendars with the days of the week listed along the top with more specific times listed down the left side, see Figure 1; or time-slots listed along the top and ways to fill the time-slots listed down the left side, see Figure 2. Within each time-slot for each day, the information is presented within the cell, indicating what will be happening during that time period, i.e. who will be working, what will be on TV, who will have an appointment, etc. The example of scheduling nurses for hospital shifts is a temporal resource allocation problem.
Fig. 1. Weekly Schedule Example
Fig. 2. Time-Slot Example
For temporal resource allocation problems it is common for things, such as shifts, tasks, appointments, etc. to overlap. When items overlap the matrix becomes more graphical (and potentially dynamic if things are changing over time) to enable seeing those overlaps.
If the characteristics and decision-making criteria of a system are geo-spatially oriented, then it is logical to organize the information onto a map. A map orientation allows the decision-maker to visually interpret the spatial relationships within the system.
7
For resource allocation problems that have temporal and spatial aspects, one might see a combination system that represents this information using all of the features just described.
Designing a Generic Resource Allocation Interface
The Resource Allocation Planning System (RAPS) is designed to be a generic user interface to allow a person to visualize resource allocation problems and support a user in reallocation situations and optimization problems, especially for medium to large-scale (25 to 100+ entity) environments. The main RAPS interface is set up as a matrix that automatically adjusts in scale to allow the user to view the entire system at all times.
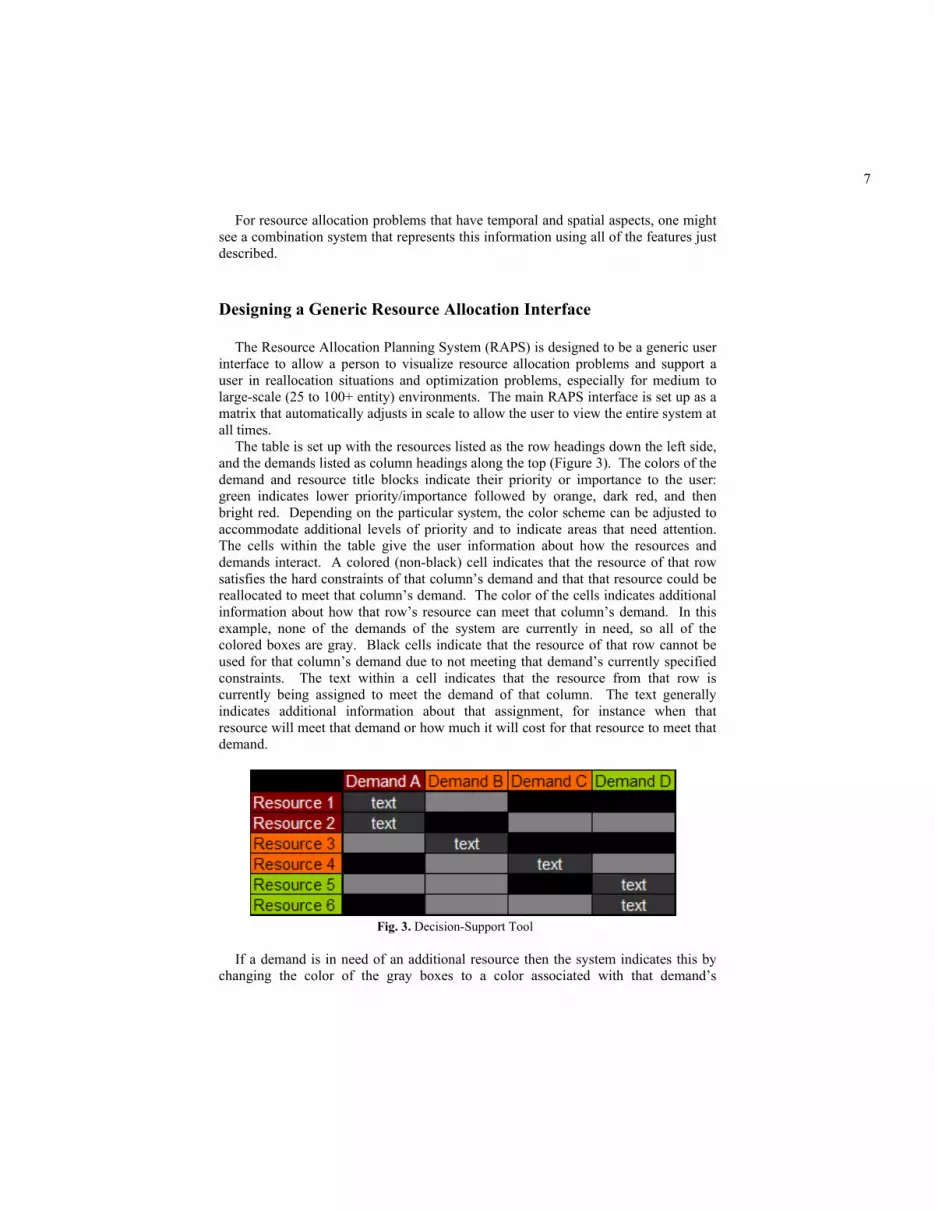
The table is set up with the resources listed as the row headings down the left side, and the demands listed as column headings along the top (Figure 3). The colors of the demand and resource title blocks indicate their priority or importance to the user: green indicates lower priority/importance followed by orange, dark red, and then bright red. Depending on the particular system, the color scheme can be adjusted to accommodate additional levels of priority and to indicate areas that need attention. The cells within the table give the user information about how the resources and demands interact. A colored (non-black) cell indicates that the resource of that row satisfies the hard constraints of that column’s demand and that that resource could be reallocated to meet that column’s demand. The color of the cells indicates additional information about how that row’s resource can meet that column’s demand. In this example, none of the demands of the system are currently in need, so all of the colored boxes are gray. Black cells indicate that the resource of that row cannot be used for that column’s demand due to not meeting that demand’s currently specified constraints. The text within a cell indicates that the resource from that row is currently being assigned to meet the demand of that column. The text generally indicates additional information about that assignment, for instance when that resource will meet that demand or how much it will cost for that resource to meet that demand.
If a demand is in need of an additional resource then the system indicates this by
changing the color of the gray boxes to a color associated with that demand’s
Fig. 3. Decision-Support Tool

8
importance. In the example shown in Figure 3 none of the demands of the system are currently in need, so all of the colored boxes within the matrix are gray. If it was determined that an additional resource was needed for Demand C, which is an orange, or medium level demand, then the gray cells indicating resources that could meet that demand would turn orange, (see Figure 4). Using this example, the user has two options for resources that could meet Demand C: resources 2 and 6. Resource 4 is already allocated to Demand C, but Demand C requires an additional resource at this time. When making this reallocation decision, the user wants to choose the resource with the least amount of cost associated with it. In this case, Resource 2 is currently meeting Demand A, which is of high importance, while Resource 6 is currently meeting Demand D, which is of low importance. If the user desires, he or she can retrieve additional information about either the resources or the demands involved. If Resource 6 is reallocated to meet Demand C, the decision-support tool will adjust to show the needs of Demand C being met and the needs of Demand D not being met, since Demand D has lost the incorporation of Resource 6 (Figure 5).
Fig. 4. Demand C in Need
Fig. 5. Demand D in Need
Selection Function
One of the main benefits of RAPS is allowing the user to visualize the entire state of the system at once, while being able to quickly retrieve necessary information and quickly determine if there are areas of the system that need attention. In Figure 6, 38 demands and 58 resources are displayed, and even with all of this information the user can quickly see what areas of the system need attention. In this example, there are two demands that need resources: one demand of medium (orange) importance, and one of high (dark red) importance.

9
As the user seeks to address these demands, the display adjusts to provide the user with all of the necessary information. When a user selects a demand, the column expands, as well as the rows of the resources that could be reallocated to it (Figure 7). Similarly, when the user selects a resource the row expands, as well as the columns of the demands that the resource could meet (Figure 8).
It is the intention of this feature for the display to adjust such that the information text displayed in the cells would be easily legible to the user, allowing him or her to make informed decisions. A search function is included within the system, to assist the user in selecting particular entities.
Information Windows
Information Windows are used to provide the detailed information concerning a particular demand or resource and how it is related to the rest of the system.
Fig. 6. Basic Overview with Unmet Demands

10
Fig. 8. Basic Overview with Resource 32 Selected
Resource Information Window The Resource Information Window provides the user with all of the vital
information related to a particular resource (Figure 9). The window displays all the important information about the resource: the name of the resource, a description of the resource, all of the important general characteristics about the resource, any additional information the user may want to be aware of, where the resource is currently allocated, and where the resource could be allocated, including information concerning how the resource would meet the desired characteristics of those demands. The list includes all of the possible demands the resource could be reallocated to, presented in a ranked order, with the demands in greatest need and the demands that the resource could most effectively meet listed at the top. In order for a demand to be listed, the resource must be able to meet the “hard constraints” of the demand. The
Fig. 7. Basic Overview with Demand A Selected

11
ranking in the list is an indication of how well the resource would meet the “soft constraints” or desired characteristics of the demands.
Fig. 9. Resource Information Window
Demand Information Window The Demand Information Window is similar to the Resource Information Window,
except the information is related to the demand rather than the resource in question (Figure 10). The Demand Information Window includes: the demand’s name, the demand’s description, the general characteristics about the demand and any additional information which may be important to the user, the resource(s) currently allocated to it, whether it needs an additional resource, and a list of the optional resources that could meet the requirements of that demand. Again, the resources listed are those that can meet the “hard constraints” of the demand, and the order of the resources indicates how well the resources meet the desired characteristics for that demand.
Fig. 10. Demand Information Window
Filtering and Sorting
In addition to displaying all of the information necessary to monitor the system, RAPS has a number of sorting methods to assist the users in organizing the information to best suit their desires and/or needs. The organization methods vary between different systems depending on the characteristics associated with different

12
resources. For example, typical organization methods include: by priority/importance (either high-to-low or low-to-high), by name, by number, or by areas that need the most attention. The different organization methods are typically included in a tool-bar, and the current organization method is highlighted. In the example shown in Figure 11, the attention method (depicted by a yellow exclamation point sign), of organization is being used, instead of organizing the information by high-to-low importance or an element of time. In all of these organization methods, the demands are re-ordered from left to right and then the resources currently assigned to them reorganize to line up with the demands in a diagonal manner, see Figures 6-8, which are in a high-to-low priority organization. If a user makes a change to the assignments, the display will adjust to indicate the change, but it will not reorganize. A user can reorganize RAPS or switch organization methods by clicking on the organization method of choice from the toolbar.
RAPS also includes multiple filtering options to hide information relating to resources or demands that the user cannot affect or does not want to change, in order to reduce the number of entities viewed by the user. Filtering options can vary greatly between the different systems due to the range of characteristics that different systems would filter by. If there is a characteristic that some demands possess that requires an associated characteristic of the resources, then those demands and resources that do not contain those characteristics could be filtered out. The filtering options are designed to remove unnecessary information from the display to limit the options presented in a decision-making situation. For example, for the two filtering options shown in Figure 12, the filtering option with the number sign “#” and the number 4 is used to filter how many levels of preference are presented to the user. The check mark is used to minimize information from resources and demands that have already been effectively assigned.
RAPS Optimization Tools
Another helpful aspect of RAPS is the Multiple Reallocation De-confliction Feature, which allows the user to select a group of demands that still need resources and receive a Multiple Reallocation De-confliction Window. The Multiple Reallocation De-confliction Window is an organized table of the demands, and the best set of resources to meet those demands (Figure 13). The user is presented with the algorithm defined “best options” and all of the characteristics of those options which could influence how those options could best be allocated to meet the needs of the demands. Generally the name cells for the resources and demands are color-coded to indicate their importance. Also, the indication of fit is generally color-coded to help the user visually make reassignment decisions. Using this tool it is easier for the user to choose between a set of resources and demands and how they should be assigned to each other. The user can select the cells of the intersecting resources and
Fig. 11. Sorting Example Fig. 12. Filtering Example

13
Fig. 11. Multiple Reallocation De-confliction Window
demands, and then, after all of the demands have the needed resources allocated to them, the user can reassign all of the selected resources to the indicated demands at the same time.
RAPS Special Circumstances Tool
Often in decision-making problems there are additional characteristics that should be taken into account that do not fit into the predetermined factors of the system. There may be a characteristic that only affects a particular resource or demand, so to include it in a decision-making algorithm and to appropriately weight the importance of this characteristic can be difficult. This is a problem that RAPS is particularly able to address, since RAPS allows a person to be within the decision-making loop, able to make decisions regarding factors that do not have particular weights assigned to them.
This additional information is generally presented through written statements included within the information windows and is also indicated by an alert note that appears in the corner of the resource or demand name cell, indicating to the user that there is important information he or she needs to know about this particular entity (Figure 14).
Fig. 12. Unique Information
14
Users can also create their own alert notes to help them remember why they have made a particular decision, or to prevent themselves from making a particular decision.
RAPS State of the System Indicator
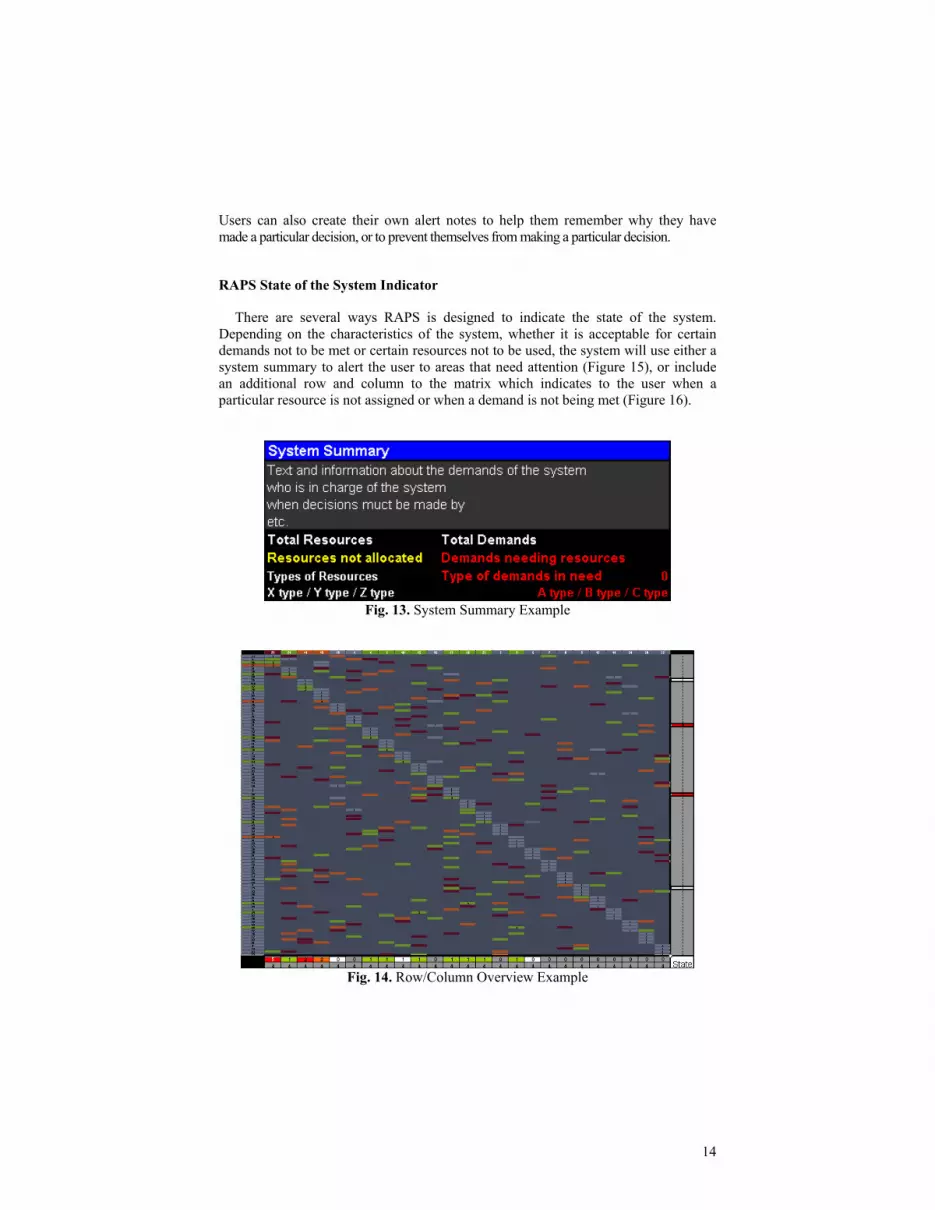
There are several ways RAPS is designed to indicate the state of the system. Depending on the characteristics of the system, whether it is acceptable for certain demands not to be met or certain resources not to be used, the system will use either a system summary to alert the user to areas that need attention (Figure 15), or include an additional row and column to the matrix which indicates to the user when a particular resource is not assigned or when a demand is not being met (Figure 16).
Fig. 13. System Summary Example
Fig. 14. Row/Column Overview Example

15
Application of RAPS
An example of the applications of RAPS is discussed next. The example is designed to assist the University of Virginia Department of Systems and Information Engineering when assigning 4th year engineering undergraduate students to “capstone” research project teams. Students rank projects in order, based on their preference of the projects they would like to work on, but the number of students on each project needs to be distributed evenly, so it is necessary to sometimes “add” students to less popular projects, preferably removing them from teams that are too large, while not moving a student to a project that is ranked below his or her 3rd or 4th choice project.
The Capstone (C-RAPS) Design
Each year all of the (70-100) 4th year Systems Engineering students at the University of Virginia are assigned to Capstone projects. Each of the students ranks all of the (15-30) Capstone projects available from their first to their last choice, then all of the rankings are organized into a min-cost flow problem. In this example, the Capstones are the demands and the students are the resources to be assigned. The hard-constraints for the assignments are that each student is only assigned to one project and that each Capstone project has a certain number of students assigned to it. The soft constraints of the system are to try to minimize the total ranked preferences for all of the Capstone assignments. A student’s ranking of a Capstone project is treated as the cost associated with a student/Capstone combination. There is currently a Relax IV-based algorithm called RelaxWin.exe that is used to solve this problem and arranges the students such that the total of the ranked preferences, i.e. the total of the ranks of the student’s preferences, is minimized. The Pareto optimal solution for the assignments is found by minimizing the total cost of all of the students’ rankings for the Capstone projects they are assigned to, while assigning a particular number of students to each Capstone. Here, we show how one can apply the RAPS design to the Capstone assignment problem. The resulting design is called the Capstone Resource Allocation Planning System (C-RAPS) interface.
16
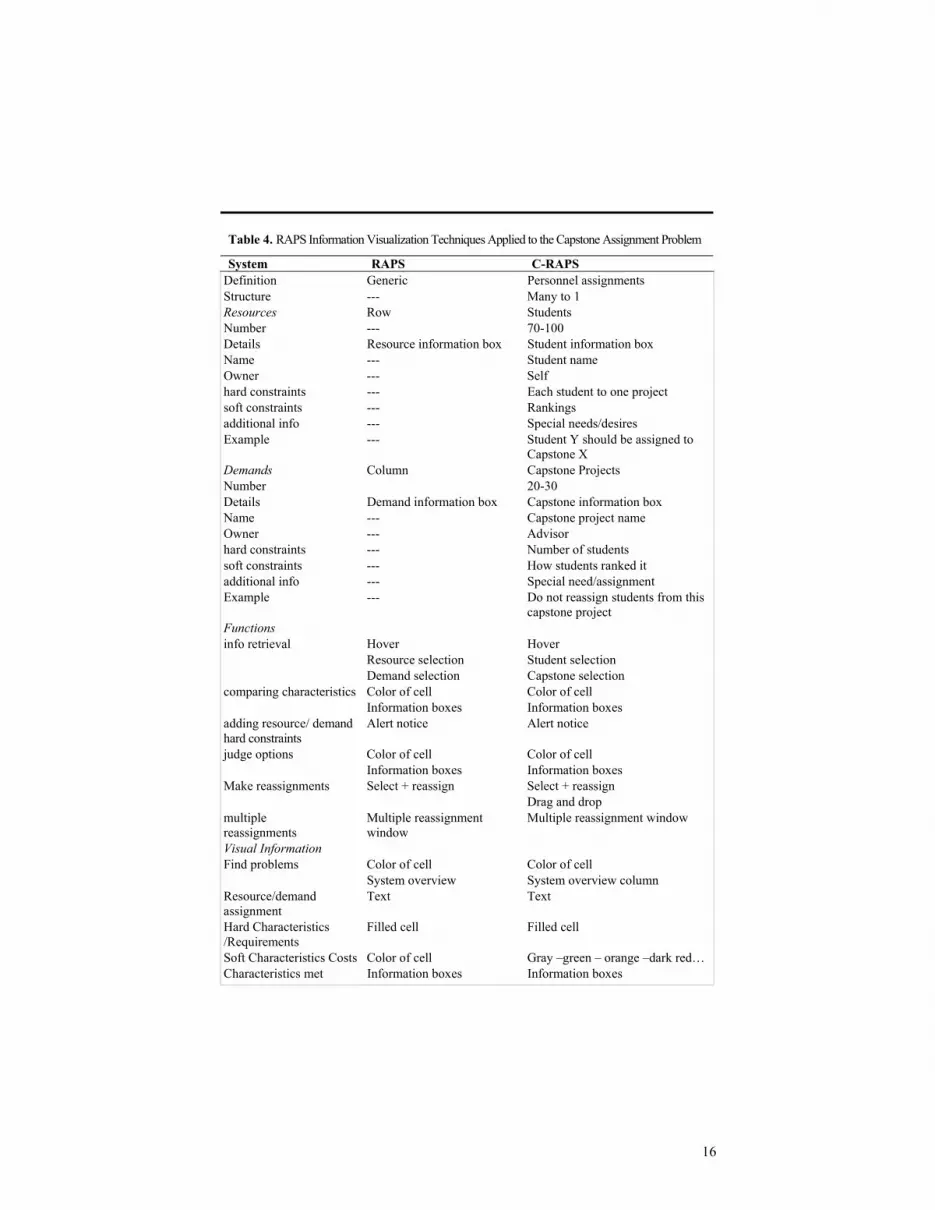
Table 4. RAPS Information Visualization Techniques Applied to the Capstone Assignment Problem
System RAPS C-RAPS Definition Generic Personnel assignments Structure --- Many to 1 Resources Row Students Number --- 70-100 Details Resource information box Student information box Name --- Student name Owner --- Self hard constraints --- Each student to one project soft constraints --- Rankings additional info --- Special needs/desires Example --- Student Y should be assigned to
Capstone X Demands Column Capstone Projects Number 20-30 Details Demand information box Capstone information box Name --- Capstone project name Owner --- Advisor hard constraints --- Number of students soft constraints --- How students ranked it additional info --- Special need/assignment Example --- Do not reassign students from this
capstone project Functions info retrieval Hover Hover Resource selection Student selection Demand selection Capstone selection comparing characteristics Color of cell Color of cell Information boxes Information boxes adding resource/ demand hard constraints
Alert notice Alert notice
judge options Color of cell Color of cell Information boxes Information boxes Make reassignments Select + reassign Select + reassign Drag and drop multiple reassignments
Multiple reassignment window
Multiple reassignment window
Visual Information Find problems Color of cell Color of cell System overview System overview column Resource/demand assignment
Text Text
Hard Characteristics /Requirements
Filled cell Filled cell
Soft Characteristics Costs Color of cell Gray –green – orange –dark red… Characteristics met Information boxes Information boxes

17
Fig. 15. C-RAPS Layout
The layout of the C-RAPS decision-support tool follows the basic RAPS design. The Capstone projects are considered the demands and are listed as the column names across the top, and the students are considered the resources and are listed as the row names down the left side (Figure 17). The figure displays 100 students, 25 Capstone projects, and the top four choices for each of the students. A number within a cell indicates that the student associated with the row of that cell is assigned to Capstone project associated with the column of that cell. The color of the cells indicates the ranking or cost associated with that cell’s student/Capstone combination; the gray cells indicate a first choice, the green cells indicate a second choice, the orange cells indicate a third choice, and the dark red indicates a fourth choice. This color scheme was chosen to map the priority of desired assignments to the salience of the cells’ color. The gray is the most desirable, and therefore the most salient. The dark red is the least desirable, and therefore the least salient. All of the cells that are black indicate that student/Capstone rankings for those projects are greater than the student’s fourth choice. It is up to the decision-maker how many ranking preferences are presented at a time. In the figure, only the top four choices of the students are displayed, and an even less salient color than dark red would be used to represent any cell which is beyond the student’s fourth choice.
18
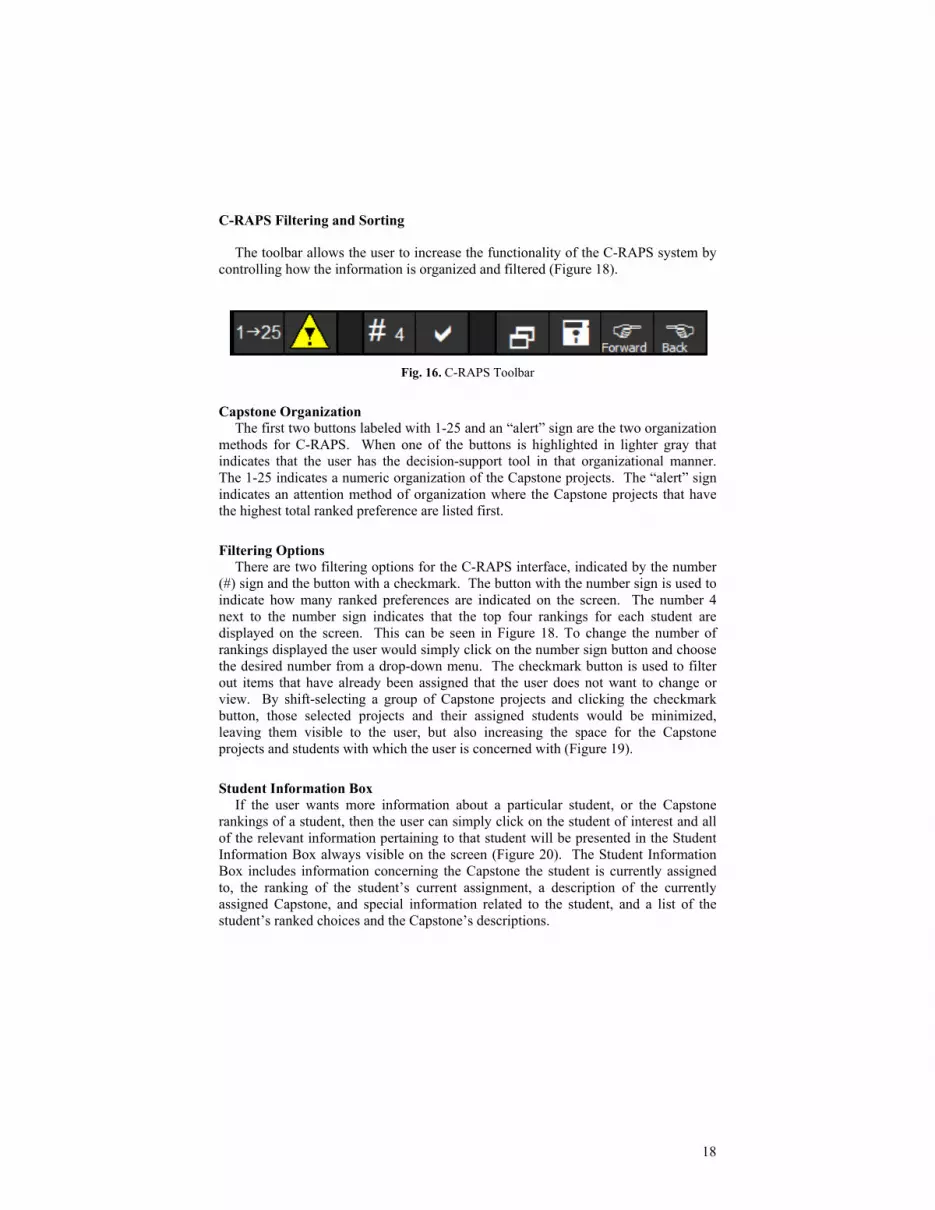
C-RAPS Filtering and Sorting The toolbar allows the user to increase the functionality of the C-RAPS system by
controlling how the information is organized and filtered (Figure 18).
Fig. 16. C-RAPS Toolbar
Capstone Organization The first two buttons labeled with 1-25 and an “alert” sign are the two organization
methods for C-RAPS. When one of the buttons is highlighted in lighter gray that indicates that the user has the decision-support tool in that organizational manner. The 1-25 indicates a numeric organization of the Capstone projects. The “alert” sign indicates an attention method of organization where the Capstone projects that have the highest total ranked preference are listed first.
Filtering Options There are two filtering options for the C-RAPS interface, indicated by the number
(#) sign and the button with a checkmark. The button with the number sign is used to indicate how many ranked preferences are indicated on the screen. The number 4 next to the number sign indicates that the top four rankings for each student are displayed on the screen. This can be seen in Figure 18. To change the number of rankings displayed the user would simply click on the number sign button and choose the desired number from a drop-down menu. The checkmark button is used to filter out items that have already been assigned that the user does not want to change or view. By shift-selecting a group of Capstone projects and clicking the checkmark button, those selected projects and their assigned students would be minimized, leaving them visible to the user, but also increasing the space for the Capstone projects and students with which the user is concerned with (Figure 19).
Student Information Box If the user wants more information about a particular student, or the Capstone
rankings of a student, then the user can simply click on the student of interest and all of the relevant information pertaining to that student will be presented in the Student Information Box always visible on the screen (Figure 20). The Student Information Box includes information concerning the Capstone the student is currently assigned to, the ranking of the student’s current assignment, a description of the currently assigned Capstone, and special information related to the student, and a list of the student’s ranked choices and the Capstone’s descriptions.
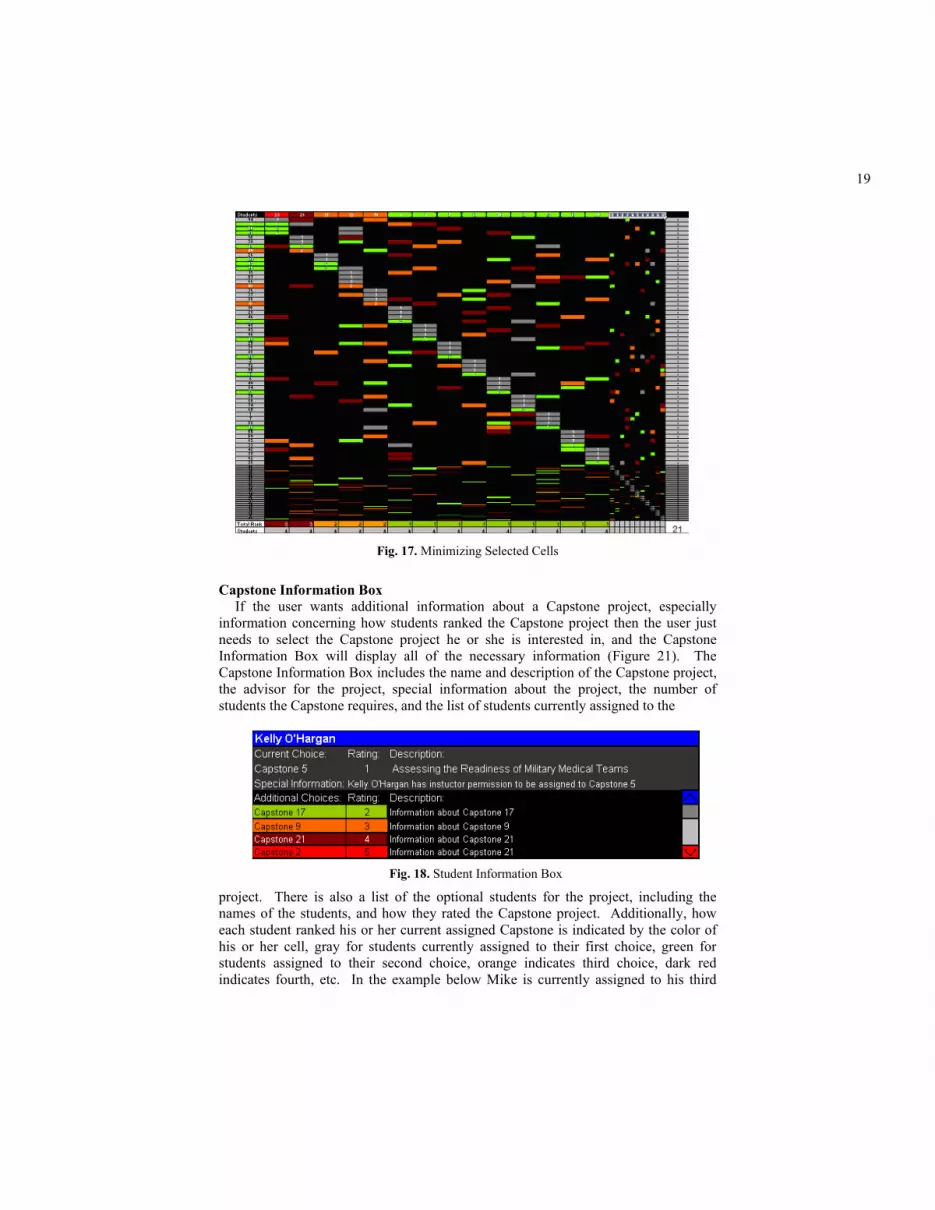
19
Fig. 17. Minimizing Selected Cells
Capstone Information Box If the user wants additional information about a Capstone project, especially
information concerning how students ranked the Capstone project then the user just needs to select the Capstone project he or she is interested in, and the Capstone Information Box will display all of the necessary information (Figure 21). The Capstone Information Box includes the name and description of the Capstone project, the advisor for the project, special information about the project, the number of students the Capstone requires, and the list of students currently assigned to the
Fig. 18. Student Information Box
project. There is also a list of the optional students for the project, including the names of the students, and how they rated the Capstone project. Additionally, how each student ranked his or her current assigned Capstone is indicated by the color of his or her cell, gray for students currently assigned to their first choice, green for students assigned to their second choice, orange indicates third choice, dark red indicates fourth, etc. In the example below Mike is currently assigned to his third

20
choice project and Jeanna is assigned to her second choice project. If the user wanted Mike could replace Jeanna’s spot by grabbing Mike’s cell and dragging it over to Jeanna’s position. If the user just wanted to add Mike to the list of current students the user would just drag Mike to the bottom of the list.
Fig. 19. Capstone Information Box
C-RAPS Optimization Tools
The last four buttons on the toolbar are used to help the user improve upon the Capstone assignment situation (Figure 18). When a Capstone assignment problem is created there are steps that the user goes through to find the optimal answer for the system. When the assignment tool in C-RAPS is first opened all of the students are assigned to their first choice projects, therefore some projects generally have too many students assigned to them while others do not have enough (Figure 22). Note that in Figure 36 the total ranked preference is 0, as shown in the bottom right-hand corner of the screen, but all of the needs of the Capstone projects are not being met. The total ranked preference (TRP) is the total cost, or in this case, the total number of ranks greater than 1. Since currently all of the students are assigned to their first choice the TRP is 0. For every student who is assigned to his or her second choice the TRP is increased by one, increased by two for third choices, and so on. The multiple reassignment window helps the user to de-conflict students that could fit the needs of different projects.
Next, the user should select all of the Capstone projects that need students assigned to them and click on the multiple reassignment tool. Students and their Current Capstone assignments are displayed in the first and second columns, (see Figure 23). The color coding in the second column helps the user decide which students are in oversubscribed projects and are thus good candidates for reassignment. After the user has selected how to best meet the needs of all of the projects and students, the user selects the reassignment button and all of the selected students will be reassigned to the associated projects. Note that at this point the total ranked preference is 14 with one Capstone and one student still in need of an assignment (Figure 24).
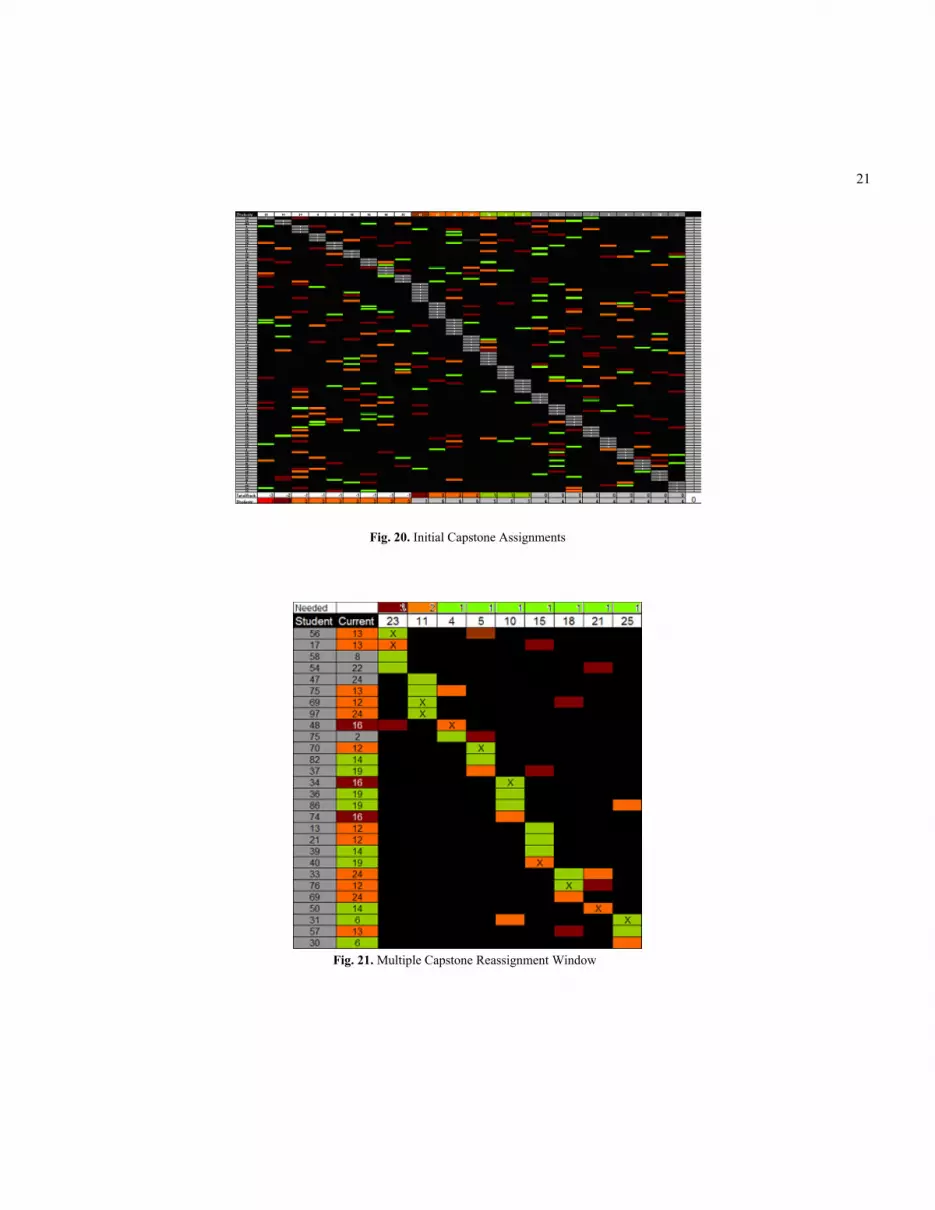
21
Fig. 21. Multiple Capstone Reassignment Window
Fig. 20. Initial Capstone Assignments

22
Fig. 22. Overview After Multiple Reassignment Window
The last three buttons on the toolbar are used to allow a user to “play” with the system and assignments and be able to go back to previous states of the system, (see Figure 18). At the point of the TRP being 14 the user should save the current state by clicking the button with a “floppy disk” on it. Then the user can click through and reassign students to different projects until all of the Capstone projects have the appropriate number of students assigned to them, and every student is assigned to a project (Figure 25). Note that the TRP is 21 and all of the demands of the system have been satisfied.
The user probably wants to save the system again at this point since a solution to the problem has been reached. Then if the user wishes to try to optimize the system further, he or she can continue to “play” with the system by clicking through the interface reassigning student A from Capstone X to Capstone Y, and then finding a different student B to take student A’s position in Capstone X, and choosing a student C from Capstone Y to remove such that the appropriate number of students are included. In this example, by “playing” with the system for 15 minutes the first author was able to bring the total ranked preference from 21 to 18; further exploration revealed that there were multiple ways in which the students could be assigned to projects with a total ranked preference of 18, (see Figures 26 and 27). At this point the author saved for a last time and considered the system optimized.

23
Fig. 23. C-RAPS With Complete Allocation
Fig. 24. C-RAPS Solution 18 (1) Fig. 25. C-RAPS Solution 18 (2)
C-RAPS Accuracy
In order to establish how effective the C-RAPS interface is, the accuracy of the optimal solution was compared with the optimal solution found with the use of a mathematical optimization algorithm. The current method of assigning students to Capstone projects is for the data to be input into an algorithm and the solution that is output is the student assignments. If a user wanted to change the position of one student the entire optimization algorithm would have to be run again. The optimal solution the algorithm computed had a total ranked preference of 17, which was one TRP better than the C-RAPS solution of 18. Looking at the C-RAPS solution again, it would only take five reassignments to find the solution found by the algorithm, with a TRP of 17.
24
C-RAPS Utilization
Although it may seem as if a less optimal solution discounts the use of the C-RAPS interface, there are additional advantages to the C-RAPS interface that must be considered. First of all, there is a human decision-maker allowing that person to rate each change based on personal experience and the additional information included in the Student and Capstone Information Boxes. Secondly, the C-RAPS system is more flexible and easily adaptable to new information or preferences. For instance, if it turns out that three students need their assignments changed to put them in a particular Capstone project, the C-RAPS interface would allow the user to go back into the system manually and find the best way to adjust those three students without disrupting the rest of the assignments. However, if the same problem were to be solved by the algorithm it is unlikely that a similar output, disrupting as few students as possible, would be the result. Also, perhaps C-RAPS could be applied as an assistant to the current algorithm. For instance after a solution was found the C-RAPS interface could be used to go through the assignments to make judgment calls. If changes had to be made after the initial assignments, the C-RAPS interface could help with the decision-making process. Furthermore, there are generally a number of ways assignments can be made that have the same TRP optimal decision. C-RAPS could be used to find those other optimal decisions and then make a more informed decision about which solution to choose. These are just some of the reasons why the C-RAPS interface may be a useful tool for a decision-maker.
Size The RAPS decision support tool allows the user to easily view more than 40
columns and 60 rows at a time, technically there is no limit as to how many resources and demands a user can be monitoring, since the system automatically adjusts to the size of the problem. With larger problems, some of the text can be hard for the user to read, but the hover function and select feature that expands the selected row helps the user navigate larger information spaces and the user can filter the data shown, and then use an attention-mode organization to help him or her more quickly determine the optimal resources to be reallocated. Additionally, the summary rows and columns allow the user to quickly assess the state of the problem solving, regardless of the size of the problem or what view the system is currently in.
Information Retrieval There are a number of ways that the RAPS system makes information retrieval
easier for the user. First, the system is designed to eliminate the need to manually search the decision-support tool by the incorporation of text search features, copy and drag-and-drop functions and hyperlinks. Also, since the interface may represent too much information to be able to be seen legibly, information retrieval is improved through the hover utility and the row/column expansion function associated with selecting a resource or demand.

25
Future Development
There are still many areas for further research and development of the RAPS interface. The basic RAPS design should be prototyped and improved through a heuristic evaluation and usability test of the complete system. An interactive prototype with real data and a back end simulation engine enables more realistic usability studies with domain practitioners as subjects trying to solve realistic scenarios.
Further work also needs to be done to determine how best to integrate the RAPS front end with algorithms that determine the options available and the rankings of those options automatically, such that the two systems could work together to make resource allocation assignments. Once one or more implemented versions of RAPS applied to specific domain problems exist, then such research could be conducted using the simulation as a test-bed for human-in-the-loop design experiments.
Conclusion
This paper provides the design community with a “generic” user interface design which can be adapted to several types of resource allocation domains. The features of the design include the ability to adapt to different size resource allocation problems, allow the user to vary the presentation of the information based on task demands, and to add in custom information about a problem. The design case study demonstrated how RAPS can be applied to the allocation of manpower (the capstone assignment problem). Further work remains to implement and test the designs in more realistic scenarios and to examine how/when resource allocation planning algorithms should be included in the system.
Acknowledgements
This research was funded by the Naval Surface Warfare Center, Dahlgren Division, under the guidance of Alan Thomas, through a grant from the Office of Naval Research Knowledge and Superiority Future Navy Capability Program
References
Card, S. K., Mackinlay, J. D., and Shneiderman, B. Readings in Information Visualization Using Vision to Think. California: Morgan Kaufmann Publishers, Inc. 1999.
Guerlain, S. Interactive advisory systems. Human Performance, Situation Awareness and Automation: User-Centered Design for the New Millennium, Savannah, GA, 166-171. 2000.
Laudon, K. C. and Laudon, J. P. Management Information Systems. 7th ed. New Jersey: Prentice-Hall Inc., 2002.

26
Rao, R. and Card, S. K. “A Table Lens: Merging Graphical and Symbolic Representations in an Interactive Focus + Context Visualization for Tabular Information.” Proceedings of CHI’94, ACM Conference on Human Factors in Computing Systems, New York. 1994.
“Resource Allocation.” Encarta Dictionary Online. World English Dictionary [North American Edition.] Microsoft Corporation. 2005.
Wickens, C., Lee, J., Liu, Y. and Becker, S. An Introduction to Human Factors Engineering, 2nd Ed. New Jersey: Prentice-Hall, 2004.
Woods, D. (1995). Towards a theoretical base for representation design in the computer medium: Ecological perception and aiding human cognition. In J. Flach, P. Hancock, J. Caird, & K. Vicente (Eds.), Global Perspectives on the Ecology of Human-Machine Systems (pp. 157-188). Hillsdale, NJ: Lawrence Erlbaum Associates.
Zhang, J. and Norman, D. “Representations in Distributed Cognitive Tasks”. Cognitive Science. Vol.18. No. 1 Jan-Mar 1994.
Woods, D., Watts, J. How not to have to navigate through too many displays Handbook of Human-Computer Interaction, Second Edition, Elsevier Science, Amsterdam, 617-650, 1997.


