Embed Size (px)
Citation preview

IEEE TRANSACTIONS ON ELECTRON DEVICES, VOL. 60, NO. 11, NOVEMBER 2013 3799
Design Methodology for Light-Emitting DiodeSystems by Considering an Electrothermal Model
Vitor Cristiano Bender, Odirlan Iaronka, William Dotto Vizzotto, Marco Antônio Dalla Costa, Member, IEEE,Ricardo Nederson do Prado, Member, IEEE, and Tiago Bandeira Marchesan, Member, IEEE
Abstract— The knowledge about thermal, electrical, andphotometrical characteristics of Light-Emitting Diodes (LEDs)is essential to achieve a good performance to the lighting system.This paper presents a methodology for designing LED systems.The main purpose is to provide an optimal operating point,considering the electrothermal design to achieve the maximumluminous flux for a given LED system. Based on two designroutines, the proposed methodology brings the possibility toconsider driver output current, heatsink size, and LED junctiontemperature in the system design. A mathematical analysistaking into account an LED electrothermal model is presented.Computational fluid dynamics simulation employing finite ele-ment method and experimental results validate the proposedmethodology.
Index Terms— Computational fluid dynamics, electrothermalmodel, finite element method, heat transfer, light-emitting diodes,thermal design.
I. INTRODUCTION
L IGHT-emitting diodes (LEDs) are semiconductor devicesthat have great potential for lighting [1]. One of the
targets of lighting designers is to get the desired luminous fluxwith a minimal variation during all device lifetime. However,to get a good LED performance, the relationship amongforward current, forward voltage, electrical power, photometry,and operation temperature should be considered. The mainissue is to understand the influence of these parameters in theLED system design.
Applications where heat dissipation is an issue, as forexample, automotive lighting and lighting clusters, the designof the LED system may be a hard task [2]–[4]. Furthermore,the effect caused by operation temperature has been a barrierto popularization of LED in general lighting [5]. The thermalconditions must be evaluated for choosing the device operationpoint, considering the temperature influence into the lightoutput [6]. An important theory was proposed for determiningthe optimal operation point for an LED system for a giventhermal design in [7] and [8].
Manuscript received May 9, 2013; revised June 16, 2013, July 9, 2013,August 7, 2013, and September 13, 2013; accepted September 16, 2013. Dateof publication October 4, 2013; date of current version October 18, 2013.This work was supported in part by CNPq under Grant proc 473200/2011-2,in part by CAPES, in part by the Federal University of Santa Maria, and inpart by the Brazilian Government. The review of this paper was arranged byEditor R. Venkatasubramanian.
The authors are with Electronic Ballast Research Group, Federal Universityof Santa Maria, Santa Maria 97105, Brazil (e-mail: [email protected]; [email protected]; [email protected]; [email protected]; [email protected]; [email protected]).
Color versions of one or more of the figures in this paper are availableonline at http://ieeexplore.ieee.org.
Digital Object Identifier 10.1109/TED.2013.2282901
The optimal operation point to power LEDs represents oneof the challenges for designers, because light output of an LEDis directly influenced by its forward current. When the drivercurrent increases, the LED power consumption also increases,which will, in turn, generate additional heat in the junction.
Increasing the driver current, the forward voltage willincrease. As the power consumption of an LED is a directproduct between forward current and forward voltage, it willalso increase the power, which will in turn increase thejunction temperature. An increase in LED junction temperaturedecreases its light output and forward voltage.
Therefore, if the electrothermal design has not been consid-ered properly in the LED system, the LED devices would notgenerate the desired photometrical requirements.
This paper presents the interaction among different factorsthat affect the LED performance. Based on an electrothermalmodel, a mathematical analysis is performed considering theforward current as independent variable and the dependencyof forward voltage with temperature to predict an optimalphotometrical operating point of LED system. The electrother-mal methodology allows, based on two design routines, tomaximize the use of the LED lighting system, providing thenumber of LEDs and the optimal heatsink. Simulations usingfinite element method (FEM) have been carried out, in order toverify the methodology results. Experimental results are usedto validate the mathematical and simulation analysis.
II. MATHEMATICAL ANALYSIS
LED electrical behavior is effected by high ohmic losses,normally represented as parasitic resistances [9]. The voltagebehavior of an LED is described by Shockley equation,including the parasitic series resistance (Rs) effect, as shownin (1)
V f (I f , Tj ) = ni kB Tj
qeIn
(I f
Is
)+ Eg(Tj )
qe+ Rs I f (1)
where V f is the forward voltage, I f is the forward current,Is is the reverse saturation current, qe is the electron charge,ni is the ideality factor, kB is the Boltzmann constant, Tj isthe junction temperature, and Eg is the band gap energy.The LED voltage is expressed as the sum of a linear andlogarithmic function of the current, as shown in (1). This isphysically represented by an ideal diode and an independentvoltage source (Vo), in series with a parasitic resistance (Rs),representing the simplified electrical model [10].
Electrical parameters may be obtained by linear regressionof the V –I curve provided by LED manufacturer in the device
0018-9383 © 2013 IEEE

3800 IEEE TRANSACTIONS ON ELECTRON DEVICES, VOL. 60, NO. 11, NOVEMBER 2013
Fig. 1. Simplified steady-state electrothermal model for an LED assembledon heatsink.
datasheet. The angular coefficient represents Rs and the linearcoefficient represents Vo, as expressed in (2) [10]
V f (I f ) = Vo + Rs I f . (2)
The electrical analysis commonly used considers a constantLED drop voltage [10]. However, as may be observed in (1),the voltage reduces with the increase of junction temperature.
The decrease rate of forward voltage with the increasein the operation temperature (kv), measured in (mV/°C) isgiven by the difference between junction temperature (Tj ),and reference temperature (To) (normally 25 °C). This relationis often linear, and may be obtained from the LED datasheet[11], [12]. The voltage drop is represented by a voltage sourcedependent on junction temperature, as shown in Fig. 1.
Equation 3 describes the forward voltage with Tj effect
V f (I f , T f ) = Vo + Rs I f + kv (Tj − To). (3)
Due to interaction between electrical and thermal domain,many researchers proposed models [7], [13]–[15]. Consideringthe interdependence between thermal and electrical character-istics, it is convenient to evaluate all effects involved in theLED system, as shown in the electrothermal model of Fig. 1.
Thermal domain presents the thermal resistances of thejunction to case (Rjc) and heatsink (Rhs). In practice, theLED package is assembled on a heatsink using thermal grease.This grease has a thermal resistance (Rch) much smaller thanRjc and Rhs and, for this reason, its resistance is neglectedin the following theoretical analysis. The heat source (Q) isdependent on forward current, voltage, and the kh coefficient,which represents the portion of LED power converted to heat,given by (4) [16], [17]
Q(I f , T f ) = V f I f kh . (4)
Based on electrothermal model of Fig. 1, the heatsink tem-perature (Ths) and junction temperature (Tj ) are expressed in(5) and (6), respectively. Where Ta is the ambient temperatureand n the number of LEDs disposed on the same heatsink
Ths = Ta + n RhsV f I f kh (5)
Tj = Ths + RjcV f I j kh. (6)
Inserting (5) and (6) into (3), the forward voltage in functionon the system thermal characteristics may be determined.This feature may be utilized as a tool to estimate junction
temperature and is expressed by (7) [11]
V f = Vo + Rs I f + kv (Ta − To)
1 − I f khkv (Rjc + n Rhs). (7)
A. Luminous Flux
High luminous flux and efficacy are needed to make theLEDs competitive with other light sources. The LED forwardcurrents have increased to levels above 350 mA with the objec-tive of increasing the luminous flux and efficacy. However,when the injection current increases, the efficiency decreasesgradually and consequently affect the luminous flux [18]–[20].
Luminous flux is a parameter strongly dependent on twovariables: forward current and junction temperature. Thisdependency presents a quasi-linear behavior and the man-ufacturers show graphically this dependency in the LEDdatasheets.
The mathematical description of luminous flux behavioras function on the junction temperature may be performed,with good agreement, using first order regression as presentedin (8). A higher order regression function may be used, butthe gain in the accuracy of obtained results is not significant[6], [21]
F(Tj ) = co + c1Tj (8)
where F represents the luminous flux, c0 is the linear coeffi-cient of luminous flux dependency with junction temperature,and c1 is the angular coefficient obtained by curve regression.
The luminous flux dependency with forward current maybe represented mathematically by the same procedure ofregression, expressed by (9) [6], [21]
F(I f ) = do + d1 I f (9)
where d0 is the dependency coefficient of the luminous fluxwith the forward current, typically null, because the luminousflux is zero when the forward current also is zero. The d1 is theangular coefficient and represents the increasing of luminousflux with the current, typically equal or greater than unit.
These coefficients describe the LED luminous flux behavior.Since the light output is a function on two variables (Tj andI f ), assuming that they influence individually, the behaviorof total luminous flux (Ft ) is given by the F(Tj ) and F(I f )multiplication, as shown in (10), where Fo is the LED nominalluminous flux [6]
Ft (Tj , I f ) = nFo(co + c1Tj )(do + di I f ). (10)
By substituting (5) and (6) into (10), result in (11)
Ft = nFo
×⎧⎨⎩⎡⎣co + c1
⎛⎝Ta + Rja
I f
Ifokh
Vo+ RsI fIfo
+kv (Ta − To)
1− I fIfo
khkv Rja
⎞⎠⎤⎦
[do + d1
I f
Ifo
]⎫⎬⎭ (11)
where
Rja = (Rjc + n Rhs). (11a)
BENDER et al.: DESIGN METHODOLOGY FOR LED SYSTEMS 3801
Fig. 2. Typical curve of the total luminous flux in function on the forwardcurrent with thermal effect.
Some important observations may be made about (11). Thisexpression relates the total luminous flux (Ft ) considering theforward current and the junction temperature, as a result ofthermal resistances (Rjc) and (Rhs). It is an equation thatcombines the electrical, thermal, and photometric aspects ofthe LED lighting system.
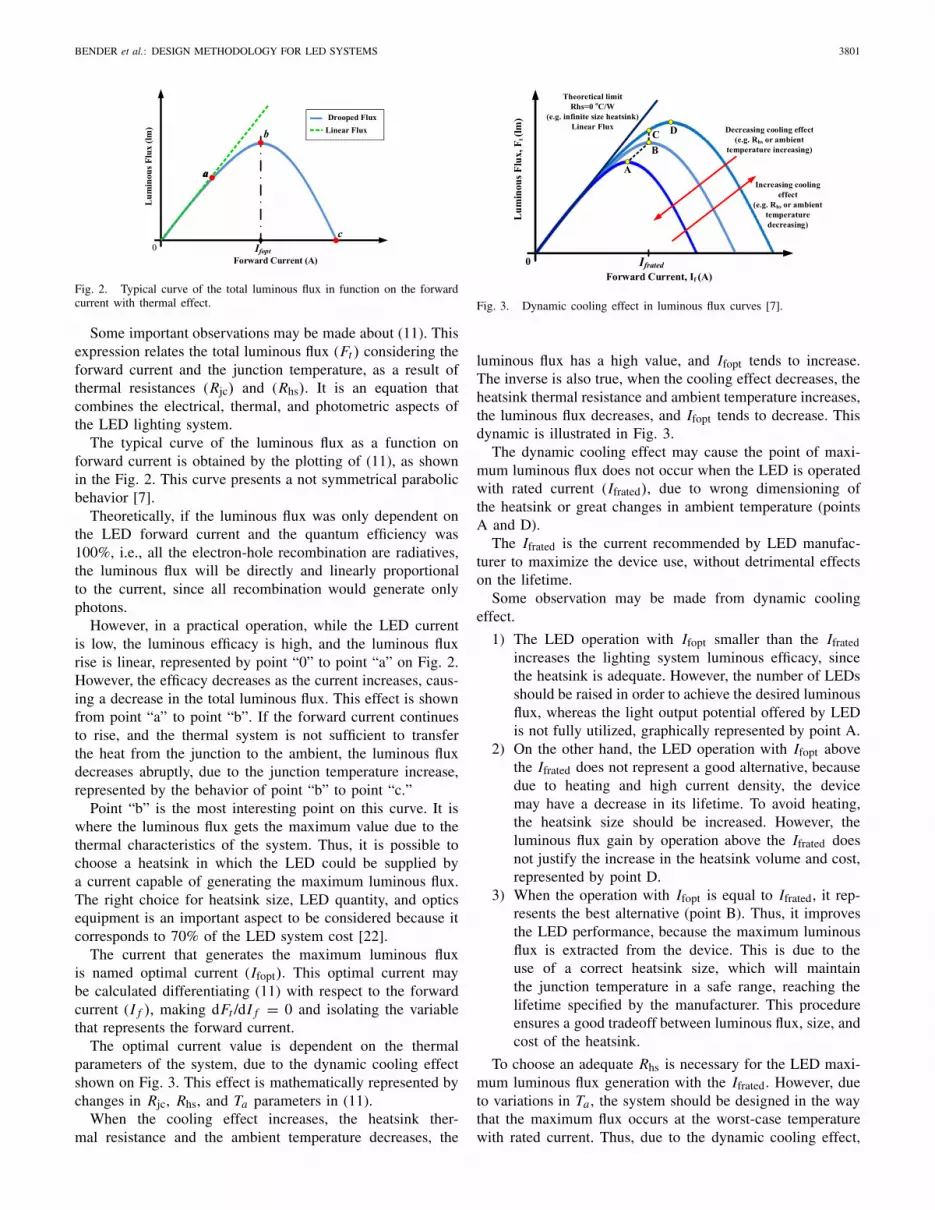
The typical curve of the luminous flux as a function onforward current is obtained by the plotting of (11), as shownin the Fig. 2. This curve presents a not symmetrical parabolicbehavior [7].
Theoretically, if the luminous flux was only dependent onthe LED forward current and the quantum efficiency was100%, i.e., all the electron-hole recombination are radiatives,the luminous flux will be directly and linearly proportionalto the current, since all recombination would generate onlyphotons.
However, in a practical operation, while the LED currentis low, the luminous efficacy is high, and the luminous fluxrise is linear, represented by point “0” to point “a” on Fig. 2.However, the efficacy decreases as the current increases, caus-ing a decrease in the total luminous flux. This effect is shownfrom point “a” to point “b”. If the forward current continuesto rise, and the thermal system is not sufficient to transferthe heat from the junction to the ambient, the luminous fluxdecreases abruptly, due to the junction temperature increase,represented by the behavior of point “b” to point “c.”
Point “b” is the most interesting point on this curve. It iswhere the luminous flux gets the maximum value due to thethermal characteristics of the system. Thus, it is possible tochoose a heatsink in which the LED could be supplied bya current capable of generating the maximum luminous flux.The right choice for heatsink size, LED quantity, and opticsequipment is an important aspect to be considered because itcorresponds to 70% of the LED system cost [22].
The current that generates the maximum luminous fluxis named optimal current (Ifopt). This optimal current maybe calculated differentiating (11) with respect to the forwardcurrent (I f ), making dFt /dI f = 0 and isolating the variablethat represents the forward current.
The optimal current value is dependent on the thermalparameters of the system, due to the dynamic cooling effectshown on Fig. 3. This effect is mathematically represented bychanges in Rjc, Rhs, and Ta parameters in (11).
When the cooling effect increases, the heatsink ther-mal resistance and the ambient temperature decreases, the
Fig. 3. Dynamic cooling effect in luminous flux curves [7].
luminous flux has a high value, and Ifopt tends to increase.The inverse is also true, when the cooling effect decreases, theheatsink thermal resistance and ambient temperature increases,the luminous flux decreases, and Ifopt tends to decrease. Thisdynamic is illustrated in Fig. 3.
The dynamic cooling effect may cause the point of maxi-mum luminous flux does not occur when the LED is operatedwith rated current (Ifrated), due to wrong dimensioning ofthe heatsink or great changes in ambient temperature (pointsA and D).
The Ifrated is the current recommended by LED manufac-turer to maximize the device use, without detrimental effectson the lifetime.
Some observation may be made from dynamic coolingeffect.
1) The LED operation with Ifopt smaller than the Ifratedincreases the lighting system luminous efficacy, sincethe heatsink is adequate. However, the number of LEDsshould be raised in order to achieve the desired luminousflux, whereas the light output potential offered by LEDis not fully utilized, graphically represented by point A.
2) On the other hand, the LED operation with Ifopt abovethe Ifrated does not represent a good alternative, becausedue to heating and high current density, the devicemay have a decrease in its lifetime. To avoid heating,the heatsink size should be increased. However, theluminous flux gain by operation above the Ifrated doesnot justify the increase in the heatsink volume and cost,represented by point D.
3) When the operation with Ifopt is equal to Ifrated, it rep-resents the best alternative (point B). Thus, it improvesthe LED performance, because the maximum luminousflux is extracted from the device. This is due to theuse of a correct heatsink size, which will maintainthe junction temperature in a safe range, reaching thelifetime specified by the manufacturer. This procedureensures a good tradeoff between luminous flux, size, andcost of the heatsink.
To choose an adequate Rhs is necessary for the LED maxi-mum luminous flux generation with the Ifrated. However, dueto variations in Ta , the system should be designed in the waythat the maximum flux occurs at the worst-case temperaturewith rated current. Thus, due to the dynamic cooling effect,

3802 IEEE TRANSACTIONS ON ELECTRON DEVICES, VOL. 60, NO. 11, NOVEMBER 2013
Fig. 4. Flowchart of routines A and B for LED system design.
when the Ta decreases, the system will enter the linear regionof the luminous flux (point C), with only a small reduction inits value, but increasing the luminous efficacy.
Observing Fig. 3, the optimal region for LED systemoperation is characterized by connection of A, B, and Cpoints (dashed line) depending on the ambient temperatureand heatsink thermal resistance conditions.
III. ELECTROTHERMAL METHODOLOGY
FOR LED SYSTEMS
This section presents a methodology based on two routinesfor LED lighting systems design. The first one considersthe total luminous flux and the second the heatsink thermalresistance. These routines are useful to predict importantinformation for the LED systems designer.
A. Routine Based on Total Luminous Flux (Routine A)
The flowchart of this routine is presented in Fig. 4. In thisroutine, the designer provides the desired total luminous flux(Ft (desired)), characteristics of the chosen LED (Rjc, To, Vo,Fo, Rs , c0, c1, d0, d1, kh , kv , Tjmax, Ifrated), and ambienttemperature.
TABLE I
CHARACTERISTICS COEFFICIENTS LED PHILIPS
LUMILEDS LXML-PWN1
The initial parameters are configured to n = 0, Ft = 0,Ifopt = 0, and Rhs = 0. After that, a conditional test isperformed Ft < Ft (desired). While Ft < Ft (desired), the numberof LEDs is increased (n = n + 1), and the size of heatsinkis adjusted through the variation of Rhs parameter, in order toguarantee that the maximum luminous flux will occur in theIfrated. The number of LEDs and the heatsink size is adjusteduntil the decision Ft < Ft (desired) is not more satisfied. Thefinal result returns all parameters necessary for the project,such as luminous efficacy, Ifopt, Rhs, Ths, Tj , V f , the maximumluminous flux, the total electrical power consumption, and thenecessary number of LEDs for the application.
In terms, it could be said that this routine provides thenumber of LEDs and the heatsink thermal resistance to reachthe desired total luminous flux with rated forward current.
B. Routine Based on Heatsink Thermal Resistance(Routine B)
The heatsink thermal resistance (Rhs) is sometimes limitedby space, relative position, and material costs. So, optimizingthe use of the heatsink, in accordance to the luminous features,is desirable. Based on that, the purpose of the second routineis to optimize all lighting system parameters considering analready chosen heatsink (fixed Rhs value). Fig. 4 shows theflowchart of routine B. In this routine, the designer fixes theRhs(desired) value, the datasheet LED parameters (Rjc, To, Vo,Fo, Rs , c0, c1, d0, d1, kh , kv , Tjmax, and Ifrated), and ambienttemperature. The initial parameters values are the same ofroutine A.
The decision block will test if Rhs < Rhs(desired). If it is true,Rhs value is increased and the number of LEDs is adjusted tothe best use of the heatsink, with LEDs operating in the Ifrated.
The number of LEDs is adjusted until the decision Rhs <Rhs(desired) is not confirmed anymore. Then, all parameters forthis design are presented, as in the first routine.
Routine B provides the maximum number of LEDs that givethe best project to a fixed heatsink, considering a safe LEDsjunction operation temperature.
A similar procedure was proposed in [23] considering thenumber of LEDs as an input parameter and LED power as anindependent variable. In this paper, the proposed methodologyenables the designer to inform the luminous flux or heatsinksize, and at the end, to have the number of LEDs and the Ifoptequal to the Ifrated.
IV. METHODOLOGY EXPERIMENTAL VALIDATION
To verify the methodology applicability in the design ofLED systems, two design examples are presented. The first

BENDER et al.: DESIGN METHODOLOGY FOR LED SYSTEMS 3803
TABLE II
COMPARATIVE RESULTS FOR FOUR TESTS AT 0.7 A
one, considers Routine A, and the second uses Routine B.A Philips Lumileds LED device LXML-PWN1 is used fortwo examples.
The LED characterization was performed by linear regres-sion curves (V f xI f ), (FxI f ), and (FxT j ) provided graphicallyby the datasheet [24]. Table I shows the obtained coefficients.
Experimental results were obtained using an integratingsphere with spectrophotocolorimeter, a current source and twothermometers. The experiments consist in checking and/oradjusting the test laboratory ambient temperature. The LEDmodule (LEDs plus heatsink) is inserted into the integratingsphere, and a controlled forward current is applied.
Measurements are taken after that steady-state thermal con-ditions have been reached. The heatsink temperature measure-ment was obtained with a thermocouple set in the heatsink, andthe junction temperature was estimated using the Rjc constantparameter in (6). The forward voltage was measured directlyby the value provided by the current source. Simulations wereperformed using the FEM [25]. After design, the LED moduleswere characterized according to their dimensions and materialcomposition. In the FEM, the module is divided into finiteelements, forming a mesh that was simulated considering thecomputational fluid dynamics (CFD), in order to verify theheat transfer on the LED module.
Tests results are presented in comparison with theoreticaland simulation results for methodology evaluation. Errors wereevaluated at rated operating point, with Ifrated = 0.7 A, consid-ering Error(%) = [(Vmeasured − Vcalculated)/(Vmeasured)]*100%.Table II shows the evaluated parameters and the obtainederrors.
A. Test 1: Routine A With High Ambient Temperature
Following the flowchart in Fig. 4 and considering theRoutine A, the first test was performed. The desired luminousflux is 1400 lumens (design input). The characteristics ofchosen LED are on Table I, and the ambient temperature forthe worst-case was considered to be 35 °C.
According to Routine A flowchart, the maximum luminousflux in rated forward current is reached. It is done adjustingthe heatsink size and LED number.
The routine results presents: n = 6 LEDs and Rhs = 5 °C/W.Thus, it is possible to reach 1400 lm in the rated forwardcurrent (Ifrated = 0.7 A).
For experimental validation, it was assembled a laboratoryprototype using the results given by routine A. The LED mod-ule consists of six LEDs disposed on an aluminum heatsink
Fig. 5. Luminous flux versus current. (a) Tests 1 and 2. (b) Tests 2 and 3.
Fig. 6. Luminous efficacy versus current. (a) Tests 1 and 2. (b) Tests 2 and 3.
(Rhs = 4.39 °C/W) using a thermal grease (Rch = 0.8 °C/W).Experimental results are compared with calculated results inFigs. 5(a), 6(a), 7(a), 8(a), and Table II.
B. Test 2: Routine A With Low Ambient Temperature
The ambient temperature is a parameter that influencessignificantly on the LED system performance, mainly becauseit is an independent variable and difficult to control. Test 1 wasperformed again, in order to verify the influence of ambient
3804 IEEE TRANSACTIONS ON ELECTRON DEVICES, VOL. 60, NO. 11, NOVEMBER 2013
Fig. 7. Junction temperature versus forward current. (a) Tests 1 and 2.(b) Tests 2 and 3.
Fig. 8. Heatsink temperature versus forward current. (a) Tests 1 and 2.(b) Tests 2 and 3.
temperature on the LED system. In this test, the ambienttemperature is 25 °C different from Test 1 where ambienttemperature was 35 °C. Results are shown in Figs. 5(a), 6(a),7(a), 8(a), and Table II.
The change in the peak operation point (point “B,” Fig. 3)to the quasi-linear region (point “C,” Fig. 3) is showed byexperimental results in Figs. 5(a) and 6(a), where the incre-ment is clear in luminous flux and luminous efficacy, whenthe ambient temperature decreases.
C. Test 3: Routine B With High Ambient Temperature
In order to validate Routine B, a limited heatsink size(Rhs = 10.2 °C/W) was used. The employed LED (Table I)and the ambient temperature (35 °C) considered are the sameof Test 1.
According to Routine B flowchart (Fig. 4), the maximumluminous flux in rated forward current is reached. It is doneadjusting the LED number and heatsink size until it reachesthe desired heatsink.
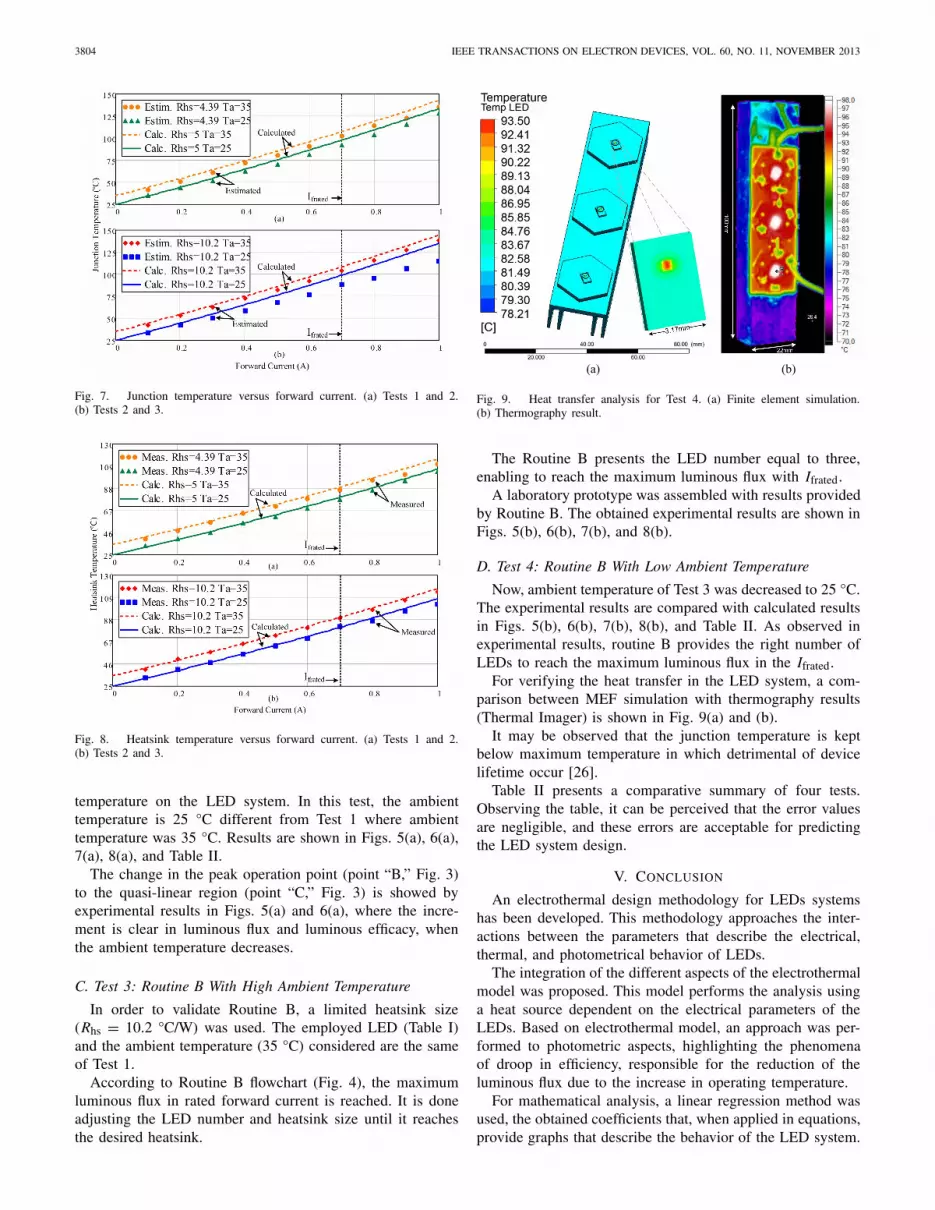
Fig. 9. Heat transfer analysis for Test 4. (a) Finite element simulation.(b) Thermography result.
The Routine B presents the LED number equal to three,enabling to reach the maximum luminous flux with Ifrated.
A laboratory prototype was assembled with results providedby Routine B. The obtained experimental results are shown inFigs. 5(b), 6(b), 7(b), and 8(b).
D. Test 4: Routine B With Low Ambient Temperature
Now, ambient temperature of Test 3 was decreased to 25 °C.The experimental results are compared with calculated resultsin Figs. 5(b), 6(b), 7(b), 8(b), and Table II. As observed inexperimental results, routine B provides the right number ofLEDs to reach the maximum luminous flux in the Ifrated.
For verifying the heat transfer in the LED system, a com-parison between MEF simulation with thermography results(Thermal Imager) is shown in Fig. 9(a) and (b).
It may be observed that the junction temperature is keptbelow maximum temperature in which detrimental of devicelifetime occur [26].
Table II presents a comparative summary of four tests.Observing the table, it can be perceived that the error valuesare negligible, and these errors are acceptable for predictingthe LED system design.
V. CONCLUSION
An electrothermal design methodology for LEDs systemshas been developed. This methodology approaches the inter-actions between the parameters that describe the electrical,thermal, and photometrical behavior of LEDs.
The integration of the different aspects of the electrothermalmodel was proposed. This model performs the analysis usinga heat source dependent on the electrical parameters of theLEDs. Based on electrothermal model, an approach was per-formed to photometric aspects, highlighting the phenomenaof droop in efficiency, responsible for the reduction of theluminous flux due to the increase in operating temperature.
For mathematical analysis, a linear regression method wasused, the obtained coefficients that, when applied in equations,provide graphs that describe the behavior of the LED system.

BENDER et al.: DESIGN METHODOLOGY FOR LED SYSTEMS 3805
The parabolic behavior of the luminous flux as a functionon I f and Tj was observed, which presents the point ofmaximum. By determining the I f in which the maximumluminous flux occurs, it is possible to choose a heatsinkin which the lighting system will operate at the maximumluminous flux that the LED can provide, for a given thermalsystem.
The optimal operation point occurs when the maximumluminous flux coincides with rated current of LED. Tworoutines of design were proposed, in order to reach thisoperation point. The first one provides the optimal Rhs andoptimal number of LEDs to reach the desired luminous flux.The second routine provides the luminous flux and LEDnumber that may be used in a fixed heatsink.
When the LED lighting system is designed using theproposed routines, it is possible to obtain the maximumluminous flux of the system, resulting in a good tradeoffamong luminous flux, heatsink size and, consequently, designcost.
Four different situations were studied to validate the pro-posed methodology. The theoretical results were comparedwith the FEM simulations and experimental results. Althoughthe electrothermal model used is simplified, the theoreticalresults obtained are accurate enough when compared withexperimental results for the development lighting systems thatuse LEDs.
REFERENCES
[1] M. R. Krames, O. B. Shchekin, R. Mueller-Mach, G. O. Mueller,Z. Ling, G. Harbers, and M. G. Craford, “Status and future ofhigh-power light-emitting diodes for solid-state lighting,” J. DisplayTechnol., vol. 3, no. 2, pp. 160–175, 2007.
[2] D. Gacio, J. Cardesin, E. L. Corominas, J. M. Alonso, M. Dalla-Costa,and A. J. Calleja, “Comparison among power LEDs for automotivelighting applications,” in Proc. IEEE Ind. Appl. Soc. Annu. Meeting,Oct. 2008, pp. 1–5.
[3] J. Bielecki, A. Jwania, F. El Khatib, and T. Poorman, “Thermal con-siderations for LED components in an automotive lamp,” in Proc. 23thIEEE Semicond. Thermal Meas. Manag. Symp., Mar. 2007, pp. 37–43.
[4] C. P. Wang, T. T. Chen, H. K. Fu, T. L. Chang, and P. T. Chou,“Transient analysis of partial thermal characteristics of multistructurepower LEDs,” IEEE Trans. Electron Devices, vol. 60, no. 5, pp. 1668–1672, May 2013.
[5] Z. Jianmin and Y. Wei, “Experimental investigation on the perfor-mance characteristics of white LEDs used in illumination applica-tion,” in Proc. IEEE Power Electron. Specialists Conf., Jun. 2007,pp. 1436–1440.
[6] C. Biber, “LED light emission as a function of thermal conditions,”in Proc. 24th Annu. IEEE Semicond. Thermal Meas. Manag. Symp.,Mar. 2008, pp. 180–184.
[7] S. Y. Hui and Y. X. Qin, “A general photo-electro-thermal theory forlight emitting diode (LED) systems,” IEEE Trans. Power Electron.,vol. 24, no. 8, pp. 1967–1976, Aug. 2009.
[8] T. Xuehui and S. Y. R. Hui, “Dynamic photoelectrothermal theoryfor light-emitting diode systems,” IEEE Trans. Ind. Electron., vol. 59,no. 4, pp. 1751–1759, Apr. 2012.
[9] E. F. Schubert, Light-Emitting Diodes, 1th ed. New York, NY, USA:Cambridge Univ. Press, 2003.
[10] L. Ray-Lee and C. Yi-Fan, “Equivalent circuit model of light-emitting-diode for system analyses of lighting drivers,” in Proc. IEEE Ind. Appl.Soc. Annu. Meeting, Oct. 2009, pp. 1–5.
[11] Y. Xi and E. F. Schubert, “Junction-temperature measurements inGaN UV light-emitting diodes using the diode forward voltage,” inProc. IEEE Lester Eastman Conf. High Perform. Devices, Aug. 2004,pp. 84–89.
[12] W. Biqing, L. Siqi, S. Tien-Mo, G. Yulin, L. Yijun, Z. Lihong,C. Guolong, and C. Zhong, “Junction-temperature determination inInGaN light-emitting diodes using reverse current method,” IEEETrans. Electron Devices, vol. 60, no. 1, pp. 241–245, Jan. 2013.
[13] G. Farkas, S. Haque, F. Wall, P. S. Martin, A. Poppe, Q. van VoorstVader, and G. Bognar, “Electric and thermal transient effects in highpower optical devices,” in Proc. 20th Annu. IEEE Semicond. ThermalMeas. Manag. Symp., Mar. 2004, pp. 168–176.
[14] P. Baureis, “Compact modeling of electrical, thermal and optical LEDbehavior,” in Proc. 35th Eur. Solid-State Device Res. Conf., 2005,pp. 145–148.
[15] T. Xuehui and Z. Dongli, “Thermal parameter extraction method forlight-emitting diode (LED) systems,” IEEE Trans. Electron Devices,vol. 60, no. 6, pp. 1931–1937, Jun. 2013.
[16] Y. X. Qin, D. Y. Lin, and S. Y. R. Hui, “A simple method forcomparative study on the thermal performance of light emitting diodes(LED) and fluorescent lamps,” in Proc. 24th Annu. IEEE Appl. PowerElectron. Conf. Exposit., Feb. 2009, pp. 152–158.
[17] H. T. Chen, X. H. Tao, and S. Y. R. Hui, “Estimation of opticalpower and heat-dissipation coefficient for the photo-electro-thermaltheory for LED systems,” IEEE Trans. Power Electron., vol. 27, no. 4,pp. 2176–2183, Apr. 2012.
[18] M.-H. Kim, M. F. Schubert, Q. Dai, J. K. Kim, E. F. Schubert, J. Piprek,and Y. Park, “Origin of efficiency droop in GaN-based light-emittingdiodes,” Appl. Phys. Lett., vol. 91, no. 18, pp. 183507-1–183507-3,2007.
[19] D. Saguatti, L. Bidinelli, G. Verzellesi, M. Meneghini, G. Meneghesso,E. Zanoni, R. Butendeich, and B. Hahn, “Investigation of efficiency-droop mechanisms in multi-quantum-well InGaN/GaN blue light-emitting diodes,” IEEE Trans. Electron Devices, vol. 59, no. 5,pp. 1402–1409, May 2012.
[20] A. Laubsch, M. Sabathil, J. Baur, M. Peter, and B. Hahn, “High-powerand high-efficiency InGaN-based light emitters,” IEEE Trans. ElectronDevices, vol. 57, no. 1, pp. 79–87, Jan. 2010.
[21] J. Garcia, M. A. Dalla-Costa, J. Cardesin, J. M. Alonso, andM. Rico-Secades, “Dimming of high-brightness LEDs by means ofluminous flux thermal estimation,” IEEE Trans. Power Electron.,vol. 24, no. 4, pp. 1107–1114, Apr. 2009.
[22] Solid-State Lighting Research and Development: ManufacturingRoadmap, United States Department of Energy, Washington, DC, USA,2012.
[23] S. Y. R. Hui, H. T. Chen, and X. H. Tao, “An extended photoelectrother-mal theory for LED systems: A tutorial from device characteristicto system design for general lighting,” IEEE Trans. Power Electron.,vol. 27, no. 11, pp. 4571–4583, Nov. 2012.
[24] Philips Lumileds. (2011). Luxeon Rebel General Purpose WhitePortfolio—Technical Datasheet DS64, San Jose, CA, USA [Online].Available: http://www.philipslumileds.com/pdfs/DS64.pdf
[25] R. Lewis, P. Nithiarasu, and K. Seetharamu, Fundamentals of the FiniteElement Method for Heat and Fluid Flow. Chichester, U.K.: Wiley,2004.
[26] Philips Lumileds. (2007). Reliability Datasheet RD07, San Jose,CA, USA [Online]. Available: http://www.philipslumileds.com/support/documentation/reliability-data
Vitor Cristiano Bender is currently pursuing theDoctoral degree with the Group of Intelligence inLighting.
His current research interests include solid statelighting systems.

3806 IEEE TRANSACTIONS ON ELECTRON DEVICES, VOL. 60, NO. 11, NOVEMBER 2013
Odirlan Iaronka is currently pursuing the Degreein electrical engineering with the Federal Universityof Santa Maria, Santa Maria, Brazil.
He is a Researcher with the Group of Intelligencein Lighting.
William Dotto Vizzotto is currently pursuing theDegree in electrical engineering.
He carries out the activities of scientific initiationwith the Group of Intelligence in Lighting.
Marco Antônio Dalla Costa (S’03–M’09) receivedthe Ph.D. (Hons.) degree in electrical engineeringfrom the University of Oviedo, Gijón, Spain, in2008.
He has been an Associate Professor with the Fed-eral University of Santa Maria, Santa Maria, Brazil,since 2009.
Ricardo Nederson do Prado (M’00) received thePh.D. degree in electrical engineering from the Fed-eral University of Santa Catarina, Santa Catarina,Brazil, in 1993.
He is currently an Associate Professor with theFederal University of Santa Maria, Santa Maria,Brazil.
Tiago Bandeira Marchesan (S’03–M’08) receivedthe Ph.D. degree in electrical engineering from theFederal University of Santa Maria (UFSM), SantaMaria, Brazil, in 2008.
He has been a Full Professor with UFSM,since 2011.


