Embed Size (px)
Citation preview

IRES2012-014
IRES Working Paper Series
Empirical Evaluation of Procedures to Generate Flexibility in Engineering Systems
and Improve Lifecycle Performance
Michel-Alexandre Cardin Gwendolyn L. Kolfschoten
Daniel D. Frey Richard de Neufville
Olivier L. de Weck David M. Geltner
March 2012

Draft submitted to Research in Engineering Design for review
1
Empirical Evaluation of Procedures to Generate Flexibility in
Engineering Systems and Improve Lifecycle Performance
Michel-Alexandre Cardin1
Department of Industrial and Systems Engineering, National University of Singapore
Block E1A, #06-25, 1 Engineering Drive 2, 117576, Singapore
Gwendolyn L. Kolfschoten
Faculty of Technology, Policy, and Management, Delft University of Technology
5 Jaffalaan, a2.270, Delft, 2628BX, Netherlands
Daniel D. Frey
Department of Mechanical Engineering, Massachusetts Institute of Technology
77 Massachusetts Avenue, 3-449D, Cambridge, MA, 02139, United States
Richard de Neufville
Engineering Systems Division, Massachusetts Institute of Technology
77 Massachusetts Avenue, E40-245, Cambridge, MA, 02139, United States
Olivier L. de Weck
Department of Aeronautics and Astronautics, Massachusetts Institute of Technology
77 Massachusetts Avenue, 33-410, Cambridge, MA, 02139, United States
David M. Geltner
Department of Urban Studies and Planning, Massachusetts Institute of Technology
77 Massachusetts Avenue, W31-310, Cambridge, MA, 02139, United States
1 Corresponding author. Phone: +65 6516 5387. Email : [email protected]

Draft submitted to Research in Engineering Design for review
2
Abstract
The design of engineering systems like airports, communication infrastructures, and real estate projects today is
growing in complexity. Designers need to consider socio-technical uncertainties, intricacies, and processes in
the long-term strategic deployment and operations of these systems. Flexibility in engineering design provides
ways to deal with this complexity. It enables engineering systems to change easily in the face of uncertainty to
reduce the impact of downside scenarios (e.g. unfavorable market conditions) while capitalizing on upside
opportunities (e.g. new technology, favorable regulations). Many case studies have shown that flexibility can
improve anticipated lifecycle performance (e.g. expected economic value) compared to current design and
evaluation approaches. It is a difficult process requiring guidance, and must be done at an early conceptual
stage. The literature offers little guidance on procedures helping designers do this systematically in a
collaborative context. The paper investigated the effects of two educational training procedures on flexibility
(current vs. explicit) and two ideation procedures (free undirected brainstorming vs. prompting) to guide this
process and improve anticipated lifecycle performance. Controlled experiments were conducted with ninety
participants working on a simplified engineering systems design problem. Results suggest that a prompting
mechanism for flexibility can help generate more flexible design concepts than free undirected brainstorming. In
turn these concepts can improve performance significantly (by up to 36%) compared to a benchmark design –
even though users did not expect improved quality of results. Explicit training on flexibility can improve user
satisfaction with the process, results, and results quality in comparison to current engineering and design
training on flexibility. These findings give insights into the crafting of simple, intuitive, and efficient procedures
to improve performance of engineering systems systematically via flexibility; performance that may be left
aside with current approaches.
Keywords: conceptual design; design procedures; empirical evaluation; flexibility in engineering design; real
options

Draft submitted to Research in Engineering Design for review
3
1 Introduction “We created a marvelous technological achievement. Then, we asked […] how to make money on it.”
(Leibovich 1999) These words from the CEO of Iridium explained the bankruptcy of the largest commercial
satellite communication system ever engineered. The 77 Low Earth Orbit (LEO) satellite infrastructure
developed for U.S.$4 billions enabled phone calls anywhere on the planet. The design and management
processes were centered on very optimistic demand projections. The technology was working beautifully. This
led to the rapid deployment of the entire constellation between May 1997 and May 1998 (MacCormack and
Herman 2001). This inflexible design and rigid deployment strategy, combined with underestimation of demand
for land-based cell phone technology, might have however caused this engineering system to fail.
This case demonstrates that the design and management of engineering systems today – e.g. airports,
communication infrastructures, real estate projects – need to go beyond considerations of technology alone.
Engineering systems are characterized by a high degree of technical complexity, social intricacy, and elaborate
processes, aimed at fulfilling important functions in society (ESD 2011). Dynamic socio-technical elements like
markets, operational environment, regulations, and technology play a significant role in their success – and
failure (Braha et al. 2006). Crucial decisions have to be made in early conceptual phases of the system design,
regarding its strategic and long-term evolution.
de Weck et al. (2004) revisited the Iridium case after its downfall and suggested a flexible design concept – a
flexible strategy and enabler in design – that would have saved up to 20% in expected development cost. The
flexibility would have protected the organization from lower demand scenarios by reducing the initial capital
expenditure. Simultaneously, it would have positioned the system to expand as needed to capitalize on high
demand opportunities. The strategy involved a flexible staged deployment of the constellation, contrasting with
Iridium’s rigid “all at once” strategy. The idea was to start with fewer satellites, observe how demand evolved,
and continue deploying the constellation only when and if demand was higher than installed capacity. This
approach, however, would have required radically different satellite designs. Each satellite would have to be
designed to change orbital configuration. This would enable the constellation to reorganize, and expand
coverage area as demand would grow. This contrasts to designing satellites meant to reach and stay in specific
orbits and elevations angles.
This flexible design concept raises the question whether considering explicitly a range of scenarios in the early
conceptual design could have helped designers create more flexibility, resilience, and ultimately a more
successful system. This approach would have differed to centering the entire management and design effort on a
limited set of projections. It would have forced explicit considerations of downside, loss-generating scenarios,
as well as unexpected upside opportunities. In hindsight, it is easy to criticize and suggest better approaches.
The question however is to determine the main learning points for future engineering education and practice.
What would have been the best approaches to generate efficiently flexibility early on in this engineering
system? How could decision-makers and senior engineers evaluate an opportunity like the one above,
considering its benefits and drawbacks? These questions are at the heart of this paper.

Draft submitted to Research in Engineering Design for review
4
There are many challenges to developing simple, intuitive, and efficient procedures to support early generation
of flexibility in engineering systems. The benefits of flexibility may be difficult to quantify relative to the
additional costs and design efforts sometimes required. Minai et al. (2006) outline the cultural issue that
engineering thinking often relies on linear, deterministic projections of future operating conditions. The design
is then optimized for a set of forecasted market conditions, requirements and constraints, even though those are
prone to change (Eckert et al. 2009). The “Groupthink” phenomenon may cause engineers to be so enthusiast
about an innovative design (as for Iridium) that they ignore problems with it, or oversee alternative designs
(Janis 1972). Financial evaluation tools based on Discounted Cash Flow (DCF) and Net Present Value (NPV)
do not integrate adaptive management over time, assuming the future and system will remain static as of t = 0
(Amram and Kulatilaka 1999; Trigeorgis 1996; Dixit and Pindyck 1994). Murman et al. (2002) identifies a
“silo” culture (i.e. task division) in enterprises as possibly hindering flexibility thinking. The curse of
dimensionality in design variables and parameters makes it difficult to design systems for a range of scenarios
(Braha et al. 2006). It is not clear where to focus the engineering effort for flexibility.
The paper aims to address some of these challenges. It investigates empirically the effects of simple, intuitive,
and efficient collaborative procedures to guide and stimulate early generation of flexibility in engineering
systems. Current educational training and professional experience as it relates to flexibility is compared to an
explicit training session on this topic. The widely used approach of free undirected brainstorming is compared to
a prompting ideation mechanism geared towards flexibility. These procedures are evaluated in a controlled
experiment where participants tackle a simplified real estate design problem – an example engineering system
(ESD 2011).
The paper addresses the following research question: “What are the main and interaction effects of the proposed
procedures on the quantity of flexible design concepts, anticipated lifecycle performance (e.g. expected
economic value of the system) of an engineering system, user satisfaction with the process and results, and
anticipated quality of results?” The hypothesis explored here is that explicit training combined with a prompting
mechanism specifically geared towards flexibility will produce main effects, and help generate more flexible
design concepts in an engineering system of choice. In turn the design concepts are expected to improve
anticipated lifecycle performance compared to current training and free undirected brainstorming. These
procedures should improve user satisfaction with the process and results, and anticipated quality of results.
Such results would provide empirical support for new concept generation procedures that can effectively help
designers improve lifecycle performance by means of flexibility. These would also show that current
engineering training and a widely used ideation approach like free undirected brainstorming may not be
sufficient to do this in the early phases of engineering systems design. These would show that it is necessary to
focus explicitly and understand flexibility as a design concept to stimulate such thinking. These results would
also suggest the proposed procedures would provide a user-friendly experience. This is essential to favor
dissemination in engineering education and real-world practice.

Draft submitted to Research in Engineering Design for review
5
The remainder of the paper is organized as follows. Related work is presented in Section 2. The procedures are
presented in Section 3. The experimental methodology is explained in Section 4. Results are presented and
discussed in Section 5. Section 6 concludes and proposes future avenues for research on flexibility in design.
2 Related Work
2.1 Flexibility in Engineering Design/Real Options
2.1.1 Definition and Examples
Flexibility in engineering design enables a system to change easily in the face of uncertainty (Fricke and Schulz
2005). It is associated to the concept of Real Option, which provides the “right, but not the obligation, to change
a project in the face of uncertainty” (Trigeorgis 1996). Real Options exist “on” a project, involving higher-level
managerial decisions like abandoning, deferring until favorable market conditions,
expanding/contracting/reducing capacity, deploying capacity over time, switching inputs/outputs, and/or mixing
the above (Trigeorgis 1996). Real Options “in” a system are technical engineering and design components
enabling options in operations (Wang and de Neufville 2005). Real Options – referred here interchangeably as
flexible design concepts – can be characterized by a strategy (or type) and enabler (or mechanism) (Mikaelian et
al. 2011).
The Real Options Analysis (ROA) literature focuses on the economic valuation of flexibility (Dixit and Pindyck
1994; Myers 1977; Trigeorgis 1996). It builds upon work in financial options by Black and Scholes (1973) and
Cox et al. (1979). Many studies have shown that flexibility in engineering projects brings expected performance
improvements ranging between 10% and 30% compared to standard design and evaluation approaches (de
Neufville and Scholtes 2011; Copeland and Antikarov 2003; Amram and Kulatilaka 1999). Flexibility improves
expected performance by affecting the distribution of possible outcomes. It reduces the effect from downside,
risky scenarios, while positioning the system to capitalize on upside, favorable opportunities. Examples in
engineering systems design abound: strategically phasing the development of airport terminals over time (de
Neufville and Odoni 2003), designing offshore platforms for future capacity expansion (Jablonowski et al.
2008), investing strategically in new nuclear plant construction (Rothwell 2006), adapting supply chains flexibly
to uncertain exchange rates (Nembhard et al. 2005), etc.
One example of flexibility in real estate is the ability to expand a building vertically (Guma et al. 2009). The
HCSC Building in Chicago exploited the strategy to “build small and expand later if needed” (Fig. 1). This
strategy reduced exposure to losses because less capital was required upfront. It also gave access to more profits
under favorable market conditions to build more offices, hire personnel, and ultimately generate more profits.
This strategy was enabled by carefully engineering the infrastructure for expansion in the early 1990s (e.g.
larger elevator shafts, stronger structure). The company exercised the flexibility a few years ago. The expansion
phase should be completed by 2011. Other examples in real estate include designing buildings that can be later
appropriated for multiple purposes, or anticipating future coupling with other buildings.

Draft submitted to Research in Engineering Design for review
6
Fig. 1 Example flexible engineering system: the HCSC Building in Chicago (Guma et al. 2009)
2.1.2 Overview of Design Procedures
A process supporting the design of engineering systems for flexibility/Real Options is shown in Fig. 2. It
encompasses the set of issues to address systematically to enable flexibility. The process starts from an initial
design, obtained by means of an existing or standard design process. It then explicitly recognizes and
incorporates the main uncertainty sources affecting future performance. Flexibility strategies are then elicited to
handle these uncertainties. The design space is then explored systematically for the best flexible design
configurations. Design tools and procedures assisting designers with this process are described.
1. Initial/!Standard!
Design!
3. Concept!Generation/!Identification!
4. Design !Space!
Exploration!
2. Uncertainty!Recognition!
Fig. 2 Overview of conceptual design process for flexibility/Real Options
Uncertainty Recognition. Recognizing uncertainty involves identification, quantification, and modeling of the
major uncertainty sources (de Weck and Eckert 2007). It relies on probability modeling (e.g. Bayes’ Theorem),
data regression and statistical analysis (Fisher 1922; Pearson et al. 1903; Yule 1897), and expert elicitation
(Helmer-Hirschberg 1967). Stochastic uncertainty modeling relies on decision trees, binomial lattices, and
Monte Carlo simulations (Metropolis and Ulam 1949; Cox et al. 1979; Howard 1966).
Identification/Generation of Flexibility. This involves either 1) identifying existing areas to embed flexibility,
or 2) generating new opportunities for flexibility in response to the main uncertainties identified in step 2. In the

Draft submitted to Research in Engineering Design for review
7
literature, identification methods mainly rely on Design Structure Matrix (DSM) and platform methodologies –
see reviews by Browning (2001) and Simpson (2004). Suh et al. (2007) suggested the Change Propagation
Analysis (CPA) algorithm to look for change multipliers as areas to embed flexibility. Kalligeros (2006)
suggested the sensitivity DSM (sDSM) to identify design variables most sensitive to changes as indicators of
subsystem or components to insert flexibility. For flexibility generation, Mikaelian et al. (2011) suggested a
systematic approach based on the [type, mechanism] characterization of real options. Industry guidelines were
suggested to support design for flexibility. Fricke and Schulz (2005) suggested changeability principles (e.g.
ideality, simplicity, modularity). Rajan et al. (2005) suggested principles from product development (e.g. design
standard components, partition the design). Trigeorgis (1996) introduced canonical strategies: defer investment
until favorable market conditions, stage asset deployment over time, alter production capacity, abandon a loser
project, switch production output and/or input, and grow by investing in Research and Development (R&D).
Other approaches involve customers and stakeholders directly in the design process to safeguard against
requirements changes and misunderstandings (Boehm et al. 2001; Bandecchi et al. 2000; Herder and Bruijn
2009; Piirianen et al. 2009).
Design Space Exploration. This involves developing efficient computational methods and search algorithms to
explore and find the most valuable flexible design configurations. This assumes flexible design concepts have
been generated in step 3. Methods incorporate ROA valuation tools based on dynamic programming (Bellman
1952; Dixit and Pindyck 1994; Cox et al. 1979) and Monte Carlo simulations (Longstaff and Schwartz 2001).
Mid-fidelity optimization (Jacoby and Loucks 1972), utility-based (Hazelrigg 1998), and Design Of Experiment
(DOE) techniques (Frey and Wang 2006) are also used. Wang (2005) suggested a mid-fidelity screening model
approach to explore the design space efficiently. Lin (2009) and Y Yang (2009) extended the approach by
incorporating DOE techniques. Hassan and de Neufville (2005) used a genetic optimization algorithm to
structure the search. Cardin et al. (2008) used representative operating plans and DOE to speed up the
evaluation process. Olewnik and Lewis (2006) extended a utility-based framework to the context of flexibility.
Ross (2006) proposed a Multi-Attribute Trade space Exploration (MATE) process also based on utility theory.
The overview in step 3 suggests there is currently no simple, efficient, and intuitive procedure to help designers
generate flexibility early in engineering systems (Cardin 2011). This is a crucial step bridging uncertainties
recognized in step 2 and the systematic design space exploration phase in step 4. The real option [type,
mechanism] characterization by Mikaelian et al. (2011) is a good start in this direction. The creative steps to
identifying and generating the real options are however not systematically stated. This is an issue the authors
leave as future work, which is addressed in this paper. Industry guidelines above do not necessarily prescribe
designers directly how to stimulate creativity and how to organize collaborative design activities. DSM and
screening techniques identify opportunities for flexibility already embedded within a system. They however
require a detailed DSM and/or system model to be built before flexibility areas can be identified. Building such
models can be time-consuming, and is not a simple task. Furthermore, focusing attention on a pre-defined
representation of the system via DSM may prevent identifying opportunities lying outside the model boundaries.

Draft submitted to Research in Engineering Design for review
8
2.2 Concept and Idea Generation Procedures
2.2.1 Definition and Categories
Concept and idea generation is a human process bringing designers together to develop both practical as well as
unconventional design concepts in an engineering setting (Kurtoglu et al. 2009). Shaw et al. (2000; 2002)
classified Idea Generation (IG) techniques either as intuitive or logical. Free undirected brainstorming (Osborn
1957) is an example intuitive germinal technique, while TRIZ (Altshuller 1973) is a logical, history-based
approach. The review by Knoll and Horton (2010) shows that ideation techniques can be classified based on
three cognitive principles: Analogy, Provocation, and Random changes of perspective. Analogy uses existing
knowledge to generate new ideas. Provocation challenges the underlying assumptions of the creative task.
Random relies on external stimuli unrelated to the task. Each of these principles can stimulate designers to
explore different perspectives on the design and its potential uses.
2.2.2 Experimental Evaluation
Many studies have been done to evaluate concept and idea generation procedures in an experimental setting.
Kolfschoten et al. (2009) studied different moderation techniques to help generate ideas. Reinig et al. (2007)
studied different invocation of social comparisons to stimulate creativity (e.g. based on comments like “you are
doing great!” or “have you fallen asleep?”). Santanen et al. (2004) studied the effects of different prompting
rates on ideation quality. Kurtoglu et al. (2009) evaluated an online design library procedure integrating
artificial intelligence principles to support concept generation. Linsey et al. (2010) evaluated a procedure to
mitigate fixation in design sketching (producing concepts based on previously seen solutions). Linsey et al.
(2005) studied functional modeling to help designers generate new concepts. Shah et al. (2001) compared the
performance of the C-sketch procedure (altering a sketch one designer at a time) to the Gallery (VanGundy
1988) and 6-3-5 methods (Rhorbach 1969). van der Lugt (2002) compared brain sketching (brainstorming using
sketches) to traditional brainstorming (Osborn 1957). M Yang (2009) studied correlations between concept
quantity and quality for the brainstorming, morphology charts, and sketching concept generation procedures.
Other studies have focused on the effects of education and pedagogy on engineering design. Daly et al. (2011)
looked at the effects of teaching predefined design heuristics on concept quality. White et al. (2010) studied how
teaching “principles of historical innovators” affect student creativity. Eppinger et al. (1990) studied how an
interdisciplinary classroom environment affects product design and development. Robie et al. (1992) observed
how different teaching methods affect designers’ ability to form design abstractions. Buchal (2002) compared
the effects of teaching Computer Aided Design (CAD) versus sketches on concept generation. Okudan et al.
(2010) compared the effects of teaching TRIZ versus design sketching on concept generation. Bender and
Blessing (2003) studied how teaching systematic design methodologies affect concept performance.
This overview demonstrates that contributions are needed to understand the effects of educational training and
ideation procedures on the ability to improve lifecycle performance by means of flexibility. The studies above
do not focus explicitly on these issues. Many procedures could be used for this purpose however (e.g. free
undirected brainstorming). Others could be adapted (e.g. prompting). This observation motivates this approach

Draft submitted to Research in Engineering Design for review
9
of studying combinations of current procedures (e.g. current training and free undirected brainstorming) with
modified procedures (e.g. explicit training and prompting) in the context of flexibility.
2.3 Empirical Procedure Evaluation
Evaluation metrics in empirical studies are often qualitative and subjective in nature. They may not support well
quantitative assessment of anticipated lifecycle performance as needed here. For instance, Hazelrigg (1998), and
Hevner et al. (2004) used concept attributes like cost and weight, which are matched to subjective participants’
utility preferences. Kurtoglu et al. (2009) introduced completeness, the level at which a concept variant
addresses a sub-function depicted in the function structure. Linsey et al. (2005) used technical feasibility, the
degree to which a concept can be implemented practically. Shah et al. (2000; 2002) suggested quality, quantity,
novelty, and variety to assess creativity and how much the design space is explored (Guilford 1959; Mullen et
al. 1991). For example, an expert may assess quality for each concept using a 1-10 scale, and the weights are
based on the importance of the concept given the design phase, and intended functions. Nelson et al. (2009)
integrated these metrics to assess the quality of design space exploration. Briggs et al. (2006) used user
satisfaction with the process and results.
As stressed in the real options literature, evaluating procedures for flexibility should be based on objective
quantitative measurements of anticipated lifecycle performance. Most metrics above however rely on expert
assessments of qualitative nature. Assessing performance in this context can be challenging, even for an expert.
So many design variables, parameters, decision rules, long-term strategies and scenarios should be considered.
Relying on metrics like cost, weight, and linkography may not indicate how a concept will perform in
operations. A concept can be rated as highly complete, feasible, novel or of high quality, but there is no
guarantee it will perform as expected once launched. It is not clear whether high quantity and variety of
concepts necessarily improves performance. As an indicator however, positive correlations have been found
between outcome quantity and quality (M Yang 2009). It is possible though that focusing the design effort on
fewer but good flexible design concepts may improve performance significantly. Also, it is not clear whether
procedures providing good user satisfaction with the process and results lead to better performance. These
observations motivate the computer-based modeling approach in Section 4.6. Objective and quantitative
evaluation of the concepts in operations can be based on financial economics, and explicit scenario modeling.
3 Choice of Procedures Table 1 summarizes the four procedures – or treatments – evaluated experimentally. To craft simple, efficient,
and intuitive procedures, only two factors were considered: educational training received on flexibility (E), and
ideation mechanism (I) used to stimulate creativity. More factors could have been studied following the same
methodology, left as an opportunity for future work. Each factor studied has two levels, described below.

Draft submitted to Research in Engineering Design for review
10
Table 1 Setup for 2 x 2 Design Of Experiment (DOE)
Educational Training
on Flexibility (E)
Ideation Mechanism (I)
Brainstorming (–1) Prompting (+1)
Current (–1) Treatment 1 Treatment 2
Explicit (+1) Treatment 3 Treatment 4
3.1 Educational Training (E)
The studies summarized in Section 2.2.2 show that educational training and pedagogy play a role in the ability
to generate design concepts. A short explicit training program may therefore help designers generate flexibility
in engineering systems. This is captured by level E = +1. The treatment is a short 15-20 minutes lecture on
flexibility in large-scale infrastructure systems – a class of engineering systems (ESD 2011). The lecture is
expected to help designers become aware of the effects of uncertainty on lifecycle performance. It should open
their mind to the potential of flexibility to deal with uncertainty. It describes generic sources of uncertainty
affecting performance, why flexibility can improve performance, and why it must be considered in the early
phases of design. It also discusses what important elements form a complete2 flexible design concept. It
provides real-world example applications of these principles in the aerospace and oil industries. The slides are
provided in Appendix 1.
In reality, engineering designers may or may not have received explicit training on flexibility during their
educational training and professional experience. This reality is more likely to represent the wider population of
designers. It is captured by factor level E = –1, and called current training. In experiments, this treatment leaves
participants address the design problem without emphasis on flexibility. Participants generate concepts with the
goal of improving performance based on their background and experience. This treatment serves as the baseline
from which to compare the effect of explicit training on flexibility. It assumes that if participants had such
training and thought flexibility could improve performance, they would incorporate it naturally in their thinking.
3.2 Ideation Mechanism (I)
Design is inherently a social, creative, interdisciplinary, and collaborative process (Warr and O’Neill 2005;
Simpson et al. 2010). Generating flexibility in engineering systems is however challenging, and requires
guidance to focus the design effort on key parameters and uncertainty sources (de Neufville and Scholtes 2011).
A prompting procedure may help scaffold the thought process systematically, as captured by level I = +1.
Prompting is simple, intuitive, and useful to stimulate creativity in collaborative activities (Santanen et al.
2004). Asking direct questions may trigger collective discussions more effectively than relying on industry
guidelines alone. Also, prompting is similar to the approach used by researchers working with senior engineers
and decision-makers in industrial case studies. Interviews were necessary to elicit sources of uncertainty and
flexibility, prior to interpretation, modeling and economic evaluation (Lin 2009; Y Yang 2009; Suh et al. 2007;
Mikaelian et al. 2011). The prompting mechanism in Appendix 2 builds upon industry and real option
2 Definition is provided in Section 4.6.4.

Draft submitted to Research in Engineering Design for review
11
guidelines summarized in Section 2.1.2. It is also loosely based on the systematic processes shown in Fig. 2, and
inspired by the work of Babajide et al. (2009), de Neufville and Scholtes (2011), and Walker et al. (2001).
Free undirected brainstorming is a simple and intuitive approach to stimulate creativity based on the work of
Osborn (1957). It is widely used in industry and academia, as demonstrated by a survey of U.S. academics and
practicing engineers (Yang 2007). Captured in experiments by level I = –1, it encourages designers to avoid any
barriers to creativity, to express ideas freely and without any influence from a moderator. Free undirected
brainstorming represents a good alternative to stimulate flexible concept generation. Given it is widely used, it
represents an appropriate baseline for comparison with the prompting mechanism.
4 Experimental Methodology
4.1 Overview The methodology focused on valuing objectively and quantitatively the flexible design concepts generated in
experiments. The real options literature stresses the importance of doing this. It is necessary to decide
objectively whether flexibility is worth the additional cost and design effort. Flexibility may mean different
things for different systems and contexts (Fricke and Schulz 2005; Ross 2006; Saleh et al. 2008). Quantifying its
value helps designers and decision-makers compare different alternatives objectively. It helps designers
engineer the appropriate mechanisms enabling the best strategies in operations.
The approach was inspired from case studies quantifying the anticipated lifecycle performance (i.e. economic
value) of flexible engineering systems – e.g. (Suh et al. 2007; de Weck et al. 2004; Zhang and Babovic 2011).
The steps loosely involve the following:
1. Describing a design problem, and initial benchmark/standard solution;
2. Interviewing and/or discussing with designers/engineers/managers to elicit major uncertainty sources,
and potential flexible design concepts;
3. Developing a computer/analytical model to quantify the anticipated lifecycle performance (e.g.
economic value) of flexible designs;
4. Comparing between flexible design concepts, and the initial benchmark design solutions to
demonstrate whether or not flexibility improves performance.
The experimental approach enabled efficient replication of these steps in a controlled setting. The quantity of
complete and good flexible design concepts were measured to assess creativity. The anticipated lifecycle
performance of these concepts was also measured. User impressions of satisfaction with the process and results,
as well as anticipated quality of results were also measured. This helped determine whether the procedures are
simple and user-friendly enough to favor later dissemination in industry practice and engineering education.

Draft submitted to Research in Engineering Design for review
12
4.2 Participants
Table 2 Participant demographics
Group Characteristics Category Percent (%)
Age
< 25 14
25-34 67
> 35 19
Highest Education Level
Bachelor 49
Master 49
PhD 2
Gender Female 19
Male 81
Work Experience (years)
< 5 years 36
5-9 years 39
> 10 years 25
Ninety participants were recruited from professional masters and doctoral programs in engineering systems,
design, and management at a U.S. engineering institution. Table 2 summarizes their demographics. They were
recruited via class and electronic email announcements at the beginning of two courses on systems design and
engineering analysis. The announcement invited voluntary participation to an experiment (off class hours) on
flexibility in engineering design. Most participants were mature graduate students with training in engineering,
science, and/or management, and many years of industry experience.
4.3 Design Problem One challenge was to select a design problem representative of engineering systems that could be handled by a
large number of participants, and in a short time. A large-scale multi-family residential design problem was
selected from the real estate sector. Engineering systems typically show high levels of technical complexity,
social intricacy, and elaborate processes fulfilling important functions for society (ESD 2011). Large-scale real
estate housing projects require technical expertise in engineering, but also in management of human assets for
developing, financing, and maintaining such infrastructures given prevailing social and market forces. They are
central to the development and planning of new cities. Their design and finance are intricate components of the
world economy (HBS 2011; UN 2008). They face significant socio-technical uncertainties in demand, prices,
materials/construction costs, technology, and regulations. Designing these systems for uncertainty and flexibility
could be a looking-forward, bottom-up approach to dealing with these concerns.
Many of the flexibility principles applicable to this engineering system also apply to even more complex
systems. For instance, the phasing and capacity expansion strategies explored for the HCSC building (Guma et
al. 2009) were also explored by de Weck et al. (2004) for the Iridium communication system. Given this multi-
family residential design problem is relatively accessible, it serves as an excellent platform for testing the

Draft submitted to Research in Engineering Design for review
13
proposed procedures in an experimental setting. Selecting a more specialized system (e.g. satellite, offshore
oilrig, car manufacturing plant) could have biased results in favor of participants with such expertise, or simply
prevented others to provide useful responses.
The design problem consisted of how to best develop and deploy over three years the 309 units of the multi-
family residential development project. One issue was to decide what kind of unit to develop in each phase –
either condo (short for condominium) or apartment. Another issue was the number of units to deploy in each
phase, and whether to develop/sell these units in each phase. The distinction between unit types was explained
as different levels of quality, prices, and construction costs. A condo is typically more luxurious, built from
expensive materials, and targets business professionals. Sales price and construction costs are typically higher.
An apartment unit is functional, less luxurious, and for students and middle-class families. The sales price and
construction costs are lower. Design details, market assumptions, and preliminary benchmark NPV analysis
were shown to participants as in Appendix 3.
Even though the problem was simplified, there was ample room for creativity about the engineering design and
development. Participants could discuss the unit type and allocation in each phase, the phasing strategy (e.g.
horizontal vs. vertical), the engineering impact on the infrastructure (e.g. buying land, versus building a stronger
structure for vertical elevation), what infrastructures to share between units and buildings (e.g. electricity, water,
heating systems, ventilation), what materials to use, etc. Different strategies would produce different cash flows
in each phase, and different NPVs depending on market conditions, as explained in Section 4.6.
The benchmark design was set as a condo-only residential project, with all 309 units developed in year/phase 1.
There was no specification how this design was achieved (i.e. how many buildings and units per building, etc.),
to minimize fixation issues (Linsey et al. 2010). This choice was justified by providing the highest NPV
between a condo-only and an apartment-only project. Even though this choice appears simplistic and rigid, it
represents best practices in the real estate industry (Guma et al. 2009; Kronenburg 2007).
4.4 Experimental Manipulations
4.4.1 Sessions Structure
Fig. 3 shows the structure of each experimental session. The moderator welcomed participants, and described
the design problem and context as in Appendix 3. The participating team was told to represent an internal
consulting firm at a renowned multi-family residential real estate firm. The task was assigned to brainstorm and
suggest alternative design and development plans potentially improving anticipated lifecycle performance
compared to the benchmark design (i.e. NPV). There was no emphasis to complete this task by means of
flexibility – although participants were aware the experiment was about flexibility in engineering design.
Participants were given 25 minutes to generate concepts in session 1 under baseline procedures. For reasons
explained in Section 3, the baselines were current educational training related to flexibility (E = –1), and free
undirected brainstorming (I = –1). Participants then had 5 minutes to vote on the quality of each design concept,

Draft submitted to Research in Engineering Design for review
14
using a 1 (low) to 10 (high) Likert scale. When two seemingly opposite concepts were suggested, quality scores
were used in coding analysis to discriminate between them.
Design Problem
Description
Session 1 + Voting
Session 2 + Voting
Debrief + Survey
Fig. 3 Pretest-posttest experimental structure used in experiments
Participants repeated the exercise in session 2 for 25 minutes under one of the treatments in Table 1, then
followed by another 5 minutes for voting. Treatments 1 and 3 used free undirected brainstorming. Treatments 2
and 4 used the prompting mechanism in Appendix 2, allocating 5 minutes for discussions on each question. In
treatments 3 and 4 only, the short lecture slides from Appendix 1 were presented before the session began. A
debrief explained the purpose of the study after all experiments. Demographics information, as well as
subjective impressions of satisfaction with the process, results, and quality of results were collected based on the
questionnaire validated by Briggs et al. (2006). Sample questions are in Appendix 4. Collected data were written
ideation transcripts describing conceptual design solutions in plain text, with voting scores, and surveys scores.
4.4.2 Control Conditions
Creativity: each experiment was structured following a pretest-posttest design (Campbell and Stanley 1966)
(Fig. 3). This approach provided another control safeguard for an inherent creativity variable (Shah et al. 2000).
It was possible that some teams would be naturally more creative than others, thus making signal measurements
more difficult compared to noise. Creative teams generating more ideas would contribute towards larger within-
group variability (i.e. the noise or unexplained variability). This could wash out between-groups variability (i.e.
the signal or explained variability), thus making a small signal more difficult to detect compared to noise.
Flexibility training: participants were screened to control for prior knowledge about flexibility. They could not
participate if they attended a course on this topic within the last 5 years. This control ensured that participants
would not have a biased view before experiments. This could have biased their contributions compared to other
participants who did not have such training some time before experiments.
Location: all experiments were conducted in the same room to control for the effect of location, which may
offer different lighting conditions, noise levels, etc. The large conference room had a capacity of fifty people
sitting around a U-shaped table, and had a screen for computer projection. A different room was used three or
four times due to booking logistic issues. At most nine people (three teams) could participate in an experiment
simultaneously, although most often one or two teams participated together.
Procedure repeat: providing the exact same content in all activities (i.e. introductions, task definitions,
lectures, prompting sessions, debriefs, and surveys) controlled for information variability. Giving different
information or formulating questions differently could have biased participants’ views on the design problem
(Morgan and Henrion 1990).

Draft submitted to Research in Engineering Design for review
15
Team size: the same number of three participants was used in each experiment to control for the effect that team
size might have on the creative process. A few last-minute cancellations forced six teams of two participants.
Time: the same time was allocated for each activity to control for the possible effects of time on quantity and
quality of concepts. It is possible that more time would naturally help teams generate more and better concepts.
The time effect most likely contributed to the baseline response observed for all dependent variables under the
General Linear Model (GLM) (see the non-zero β0 coefficients in Sections 5.1 to 5.6). Modeling responses
using GLM quantified this baseline response separately from the main and interaction effects (coefficients βE,
βI, and βEI). This discriminated between the potential effects caused by time, and the effects caused by the
factors of interest E and I.
4.5 Data Collection
4.5.1 Online Group Support System Interface
Collaboration may put barriers to creativity, resulting in productivity loss (Mullen et al. 1991; Diehl and Stroebe
1987; Taylor et al. 1958). Evaluation apprehension (fear of being judged), free riding (letting others do the
work), and production blocking (losing an idea because someone else is talking) are among potential causes
(Camacho and Paulus 1995; Mullen et al. 1991; Karau and Williams 1993; Nijstad et al. 2003).
Group Support System (GSS) technology minimizes productivity loss and stimulates creativity in collaborative
activities (Bostrom and Nagasundaram 1998; Nunamaker et al. 1997; Dennis and Valacich 1993; Warr and
O’Neill 2005; Kolfschoten et al. 2009). GSS is defined as “socio-technical systems consisting of software,
hardware, meeting procedures, facilitation support, and a group of meeting participants engaged in intellectual
collaborative work.” (de Vreede et al. 2003) GSS is useful to capture discussion content, record data efficiently,
structure the collaborative design process, and help with moderation.
Participants type ideas here!
Ideation topic posted here!
Structured agenda here!
Fig. 4 Online GSS interface used in experiments (adapted from ThinkTank® by GroupSystems).
The ThinkTank® GSS online software by GroupSystems® was used (Fig. 4). It enabled participants to type in
real-time descriptions of their design solutions, similar to that of chatting software. It worked with any standard
Internet browser. After the problem description, the moderator posted the brainstorming task (i.e. ideation topic)
of improving performance compared to the benchmark design. Each member described their solutions, which

Draft submitted to Research in Engineering Design for review
16
were displayed to other members to stimulate creativity and engage discussions. Each member could reply,
comment, and append new ideas to a thread. The software also provided the voting module to rate concept
quality. The interface provided an easy and efficient way to record participants’ creative responses to the design
problem – instead of manual transcription. The online feature allowed a few distance students to participate.
4.5.2 Raw Data Description
Raw data consisted of written descriptions of the design and development plans in a Word® document, together
with quality scores for each idea/concept. The GSS software produced the transcript automatically at the end of
each session, ready for coding analysis. In treatments 2 and 4, written descriptions included answers to the
prompts in Appendix 2. This data was analogous to the raw interview data obtained after interviewing an
engineer, manager, or decision-maker in order to elicit sources of uncertainty and flexibility in case studies (Suh
et al. 2007; Kalligeros 2006).
4.6 Computer Model Fig. 5 shows the computer-based Excel® DCF model used to measure lifecycle performance objectively and
quantitatively. A risk-neutral Expected NPV (ENPV) – or average NPV – metric was used because it balances
risk-seeking and risk-averse design decisions. Other metrics could have been used to suit different preference
utilities – e.g. standard deviation of the response, as in the Taguchi method (1987). It is left as for future work to
replicate this study using different performance metrics.
Fig. 5 NPV model for the real estate development design problem
DCF valuation was motivated by the need to quantify the value of flexibility objectively. Also, NPV is often
used for large-scale project valuation in industry (de Neufville and Scholtes 2011; Geltner et al. 2010). Excel®
was chosen because it is transparent, ubiquitous, and a good communication tool. Decision-makers and
designers can understand the implementation and evaluations more easily.
Assumptions about the design, development plan, engineering, and market conditions are provided in Appendix
5. The effects of design and development plans were quantified at the conceptual phase using this model, by
considering the revenues and costs generated in the future. No detailed embodiment of the concepts was
necessary. Design and engineering tradeoffs were in terms of the unit type (i.e. condo vs. apartment),
deployment strategy (staged vs. all at once vs. deferred), and unit capacity allocation in each phase. These
decisions affected the cash flows and NPV generated, discriminating between different design alternatives. For

Draft submitted to Research in Engineering Design for review
17
example, the decision to select condo versus apartments could affect the sales price and construction cost, as
they were both higher for condo units than apartments. Also, discounting cash flows would imply that timing
and unit allocation in each phase mattered from a managerial standpoint. Later cash flows would be more
heavily discounted in the model, and weigh less in the NPV. These decisions had engineering and cost
implications affecting later phases of the design process. They were modeled and evaluated at the conceptual
level.
4.6.1 Notation
Ct = total construction and sales cost at time t
CCtS = stochastic construction cost at time t
CFt = cash flow at time t
dZt = standard Wiener process random variable at time t
DtS = stochastic unit demand at time t
ENPV = Expected Net Present Value
gP = projected annual growth rate for unit price
gPtS = stochastic growth rate for unit price at time t
Kt = planned capacity deployment at time t
KtTot = total capacity deployment at time t
M = maximum number of samples in Monte Carlo simulation
NPV = Net Present Value
Pt = unit price at time t
PtS = stochastic unit price at time t
PVt = present value of cash flow at time t
r = discount rate or opportunity cost of capital
Rt = revenue at time t
σP = uncertainty factor around annual unit price projections
T = maximum time value t
Ut = number of units sold at time t
4.6.2 Mathematical Formulation
The DCF model in Fig. 5 is explained row by row from top to bottom. Each row is a vector X= [X0, …, XT],
where X takes on numerical values for the variables above, or textual values, and t = 0, 1, …, 3 years. The row
“Next Phase Developed As:” specified the unit type developed next phase, either “CONDO” or “APT”. The
decision rule for a switching flexibility strategy could be implemented here. An example decision rule elicited
by participants was “if current cash flows are higher for condos than for apartments, then develop next phase as
condo, else develop next phase as apartments”. Following Excel®’s programming language =IF(logical test,
value if true, value if false), this could be implemented as:
= IF(CFt-condo >CFt-apt,"CONDO","APT ")

Draft submitted to Research in Engineering Design for review
18
The rows “Sales Price/Unit”, “Units Demand”, and “Construction & Sales/Unit” were modeled as random
variables. The price, demand, and cost values were associated with the choices of unit developed as per the
decision rule above. The row “Planned Capacity Deployment” represented the planned capacity deployment.
Under the benchmark K = [309, 0, 0], meaning all units would be developed in year 1. Teams could modify the
planned deployment to explore other phasing strategies over time (e.g. K = [100, 103, 106]). Stochastic
evolution of the random variables was modeled using Geometric Brownian Motion (GBM):3
P1S = P1! PdZ1
gPtS = gPdt +! PdZt
PtS = Pt!1
S (1+ gPtS )
The growth parameter gPtS was modeled according to the standard Itô’s lemma (1951). The parameter σP
represented the uncertainty around annual price projections, and dt a small time increment of one period (e.g. gP
= 3%, dt = 1 year, σP = 20%). The random variable dZt captured the standard Wiener variable modeling the
stochastic error at time t around the projected growth rate gP. For simplification and computational efficiency,
dZt was sampled from a uniform distribution ~U(–1, 1) instead of a standard normal distribution ~N(0, 1).
Stochastic unit demand (DtS) and construction cost (CCt
S) random variables were modeled in a similar fashion.
The row “Develop Current Phase?” determined whether a phase would be developed or not. The values “YES”
or “NO” could represent deferral or abandonment flexibility strategies if market conditions were unfavorable. A
decision rule elicited was “if total construction cost per unit was lower than sales price in the current phase,
develop (i.e. print “YES”), else do not develop (i.e. print “NO”)”. This could be implemented as:
= IF(CCtS < Pt
S,"YES","NO")
The row “Expand Capacity this Phase?” adjusted the number of units compared to planned capacity
deployment. The values could be either “YES” or “NO”, representing capacity expansion, reduction, or “just in
time”. For example, “if demand was higher than planned capacity, add more units to match exactly observed
demand (i.e. print “YES”), else build according to planned capacity (i.e. print “NO”)”:
= IF(DtS > Kt,"YES","NO")
The row “Additional Capacity” determined unit allocation in each phase. The decision rule above could be
implemented as:
3 t = 2, 3 for the last two equations.

Draft submitted to Research in Engineering Design for review
19
= IF(Expansion value = "YES", KtTot = Dt
S,KtTot = Kt )
“Total Capacity Added” accounted for the planned capacity deployment, plus any additional unit added or
removed within a phase. The row “Units Sold” determined how many units were sold within each phase. It was
the minimum between total existing capacity KtTot and demand Dt
S:
Ut =MIN(DtS,Kt
Tot )
The sales revenue (Rt), total construction and sales cost (Ct), net cash flow (CFt), present value of cash flow
(PVt), and “NPV (excluding land cost)” were calculated as:
Rt =UtPtS
Ct = KtTotCCt
S
CFt = Rt !Ct
PVt =CFt 1+ r( )t
NPV = PVtt=0
T
!
4.6.3 Anticipated Performance Measurements
Anticipated lifecycle performance was measured using ENPV for each flexible design concept by simulating
stochastically M = 2,000 combined scenarios of price, demand, and cost. Each scenario combination would
produce different cash flows based on the flexibility strategy and decision rules implemented, and one NPV
measurement. ENPV was calculated as:
ENPV = E NPV[ ] = 1M
NPVmm=1
M
!
Each run took ~1 second on a standard 2.4 GHz Intel Core 2 Duo MacBook with 4 GB of RAM, running
Excel® 2004 on an OSX 10.6 platform.
4.6.4 Coding Analysis
Written ideation transcripts were analyzed to extract complete flexible design concepts using a coding procedure
(Strauss and Corbin 1990; Trauth and Jessup 2000). A design concept was considered complete if it contained
coherent information about the following elements (using the switching example):
1. An uncertainty source affecting anticipated performance.
o E.g. unit demand.

Draft submitted to Research in Engineering Design for review
20
2. A flexible strategy to adapt to the above uncertainties in design and operations.
o E.g. switch between condo and apartments.
3. A conceptual but concrete description of the flexibility enabler, considering engineering design, legal,
management, and/or financial aspects.
o E.g. design each unit as empty shells to be finished later as condo or apartments.
4. A decision rule, “if” statement, or “trigger mechanism” based on observations of the uncertainty
sources, determining when it is appropriate to exercise the flexibilities.
o E.g. if demand is higher for apartments than condos, switch to finishing and selling units as
apartments, if not finish and sell as condos.
The switching strategy above contrasts with the benchmark inflexible plan where all units are developed at once
as condos. It requires developing units as empty shells to be finished later. This is radically different than
designing all units as condos. It is not clear at the conceptual stage what design and decision rules are most
profitable given the uncertainties, hence the need for explicit modeling.
Other examples of complete concepts from ideation transcripts are summarized in Appendix 6. They exemplify
strategies evaluated using the computer model: phase the development and deploy capacity over time, expand or
reduce unit capacity in each phase whenever appropriate, temporarily abandon the project if market conditions
were not suitable, and do not develop a phase if market conditions are unfavorable. Appendix 7 shows an
example transcript analyzed using the coding procedure.
Two independent treatment-blind coders reviewed each ideation transcript to extract and count complete
concepts, with average inter-rater agreement of 95%. The inter-rater agreement was the average percentage
agreement between raters on all thirty-two ideation transcripts. Concepts retained for implementation,
evaluation, and statistical analysis, were the ones agreed upon by both reviewers.
4.6.5 Dependent Variables
Experimental evaluation tested the null hypothesis of no main and interaction effect of factors E and I on the
following dependent variables:
1. Quantity of complete flexible design concepts generated (C);
2. Quantity of good flexible design concepts generated (G);
3. Anticipated lifecycle performance of flexible design concepts (ENPV);
4. Subjective impressions of satisfaction with the procedures/processes (PS);
5. Subjective impression of satisfaction with the results (RS);
6. Subjective anticipated quality of results (i.e. quality assessment) (QA).
A response Δy = y2 – y1 was measured for each experiment, where y1 is the response of interest in session 1
only, and y2 is the response of interest in both sessions combined. For instance, if one complete concept was

Draft submitted to Research in Engineering Design for review
21
generated in session 1 (C1 = 1), and two new concepts were generated in session 2 (C2 = 3), then ΔC= 3 – 1 = 2.
A simpler approach would be to count the number of new complete concepts generated in session 2.
Each complete concept was implemented using the computer model. A complete concept was counted as good if
and only if the ENPV was higher than the benchmark under simulations (i.e. ENPV = $9.3 million). For
example, if one good design concept was generated in session 1 (G1 = 1), but only one of the two new complete
concepts was higher than $9.3 million (G2 = 2), then ΔG= 2 – 1 = 1.
Only good flexible design concepts were considered to measure ΔENPV (see complete dataset in Appendix 8).
The best combination of concepts producing the highest ENPV was used. Because some concepts could interact
(e.g. an early abandonment strategy could prevent future capacity expansion), it was not possible to simply add
up the ENPV obtained for each independent concept. It was necessary to run the simulations with each possible
combination of concepts generated over sessions 1 and 2. For example, in treatment 1 replicate 1, no complete
concept was generated (ENPV1 = $0 as compared to the benchmark). A switching strategy in session 2
generated value $10.5 million (ENPV2 = $10.5 – 9.3$ = $1.2 million). This led to measurement ΔENPV = $1.2
– $0 = $1.2 million. In treatment 2 replicate 2, a switching concept led to ENPV1 = $3.0 million. Two new
concepts generated in session 2 and combined with switching led to ENPV2 = $3.9 million. Therefore ΔENPV =
$0.9 million.
4.6.6 Survey Analysis
Survey responses were analyzed to measure improvements in constructs ΔPS, ΔRS, and ΔQA. Questions are in
Appendix 4. Responses recorded the differences in user impressions between sessions 1 and 2, using a discrete
7-scale Likert mechanism. Each construct was evaluated using five or six questions (maximum score 35 or 42).
A positive (negative) score meant improvement (worsening) from session 1 to 2. For example, an individual
scoring PS1 = 27/35 and PS2 = 28/35 in session 2 meant a slight positive improvement from session 1 to 2,
leading to ΔPS = +1. Responses ΔRS and ΔQA were measured similarly.
4.6.7 Statistical Analysis
Each response Δy was modeled assuming the GLM presented in Milton and Arnold (1990). Coefficient β0
approximated the total (i.e. baseline) mean response, βE and βI modeled the main effects, while βEI modeled the
first order two-way interaction between factors E and I. Variable ε accounted for the mean experimental error:
!y = !0 +!EE +!I I +!EIEI +"
Standard least-square regression was used to calculate the main and interaction effects in Matlab®. The null
hypothesis was H0: βE = βI = βEI = 0. The p-values of the main and interaction effects were calculated using a
non-parametric permutations test (i.e. randomization or exact test) (Fisher 1935; Pitman 1937; Welch 1990).
Because Δy≥ 0 for ΔC, ΔG, and ΔENPV, sample distributions were truncated about zero. This could not satisfy
normality assumptions for standard parametric tests, hence the suggestion to use the non-parametric test.

Draft submitted to Research in Engineering Design for review
22
5 Results and Discussion
5.1 Improvement in Complete Concepts (ΔC)
Fig. 6 shows the mean plots for ΔC under the four treatment conditions. The ideation mechanism (I) produced a
significant main effect (βI = 0.75, p = 0.00). This means that the prompting mechanism helped participants
generate more new complete concepts after two sessions than free undirected brainstorming.4 It shows that the
form of the questions, and the concepts referred to in prompting – even though abstract – were useful and
effective. The GLM response was:
!C =1.25+ 0.25E + 0.75I
For example, treatment 1 generated a total improvement of ΔC = 2 concepts among eight teams/replicates (see
Appendix 8). This corresponds to the mean value 0.25 plotted in Fig. 6 and to the value obtained in the GLM
equation if one inserts variable value E = –1 and I = –1. The mean values for the three remaining treatments are
calculated accordingly.
0.00
0.50
1.00
1.50
2.00
2.50
Brainstorming (-1) Prompting (+1)
!C
(com
plet
e co
ncep
ts)!
Ideation Mechanism (I)!Current training (-1) Explicit for flexibility (+1)
Fig. 6 Mean plots for ΔC (complete concepts). The lower curve shows mean results for current training
on flexibility (E = –1). The upper curve shows results for explicit training on flexibility (E = +1)
As expected, current flexibility training and free undirected brainstorming produced the lowest mean response
ΔC = 0.25. This shows however that some teams thought naturally and explored flexibility without guidance.
This is consistent with the real-world observation that flexibility is not necessarily prevalent in practice, but it
sometimes exploited in the real estate industry (Guma et al. 2009).
4 The positive sign of βI means prompting was responsible for the main effect. A negative sign would imply that free
undirected brainstorming was responsible for the effect.

Draft submitted to Research in Engineering Design for review
23
It is surprising that explicit training for flexibility did not produce an effect compared to current training. The
Cognitive Network Model of creativity by Santanen et al. (2004) suggests that perhaps the training caused
information overload, which reduced its positive effect on creativity. It is also possible that information was not
presented in a sequence that maximizes retention (Deese and Kaufman 1957). In contrast, prompting stimulated
frame activation consistently, helped to structure the thought process, and guided participants throughout each
session. This might explain why it produced a main effect, while explicit training did not.
A crucial argument put forward in this paper is that complete flexible design concepts can objectively improve
anticipated lifecycle performance. This section demonstrated that prompting effectively helps designers generate
more complete concepts. The following two sub-sections demonstrate that these concepts in turn improve
lifecycle performance.
5.2 Improvement in Good Concepts (ΔG)
Fig. 7 shows that prompting (I = +1) also had a main effect on ΔG (βI = 0.59, p = 0.00). The mean values were
typically lower than for ΔC, since a few complete concepts could not be counted as good; their ENPV was
lower than that of the benchmark design (i.e. $9.3 million). The GLM response was modeled as:
!G =1.09+ 0.22E + 0.59I " 0.03EI
0.00
0.50
1.00
1.50
2.00
2.50
Brainstorming (-1) Prompting (+1)
!G
(goo
d co
ncep
ts )!
Ideation Mechanism (I)!Current training (-1) Explicit for flexibility (+1)
Fig. 7 Mean plots for ΔG (good complete concepts). The lower curve shows mean results for current
training on flexibility (E = –1). The upper curve shows results for explicit training on flexibility (E = +1)
A complete concept did not improve performance when the decision rule was too conservative, or value
destructive. In the former case the flexibility strategy would never be exercised, so the infrastructure would
behave the same as the inflexible benchmark design. In the latter the ENPV would be lower than the
benchmark’s. For example, a team suggested deferring development if market demand went 80% below
projections. Given the problem constraints, this would never occur (σD = 20%). Another team suggested
expanding capacity when construction costs would increase, inevitably leading to value destruction. These

Draft submitted to Research in Engineering Design for review
24
examples showed the importance of implementing the decision rules using the computer model. It would have
been more difficult to catch these flaws relying purely on qualitative judgment.
Prompting was crafted around the four criteria of a complete concept. It seems natural that it helped generate
more flexible design concepts than any other procedure. The nuance however is that more concepts did not
guarantee better cash flows, and improved ENPV. The cash flows generated by the flexible strategies had to be
better on average than that of the benchmark, which could only be evaluated quantitatively via computer
modeling. The four criteria were guidelines/checklist necessary to evaluate flexible design concepts. They also
helped structure the thought process, which is why they were used in the prompting mechanism. While
unsuccessful concepts might not be viable real options, they might trigger further thinking ultimately generating
successful concepts. Exploring the sequence of successful and unsuccessful concepts is left for future research.
5.3 Improvement in ENPV (ΔENPV)
Fig. 8 shows that prompting had a significant main effect on ΔENPV (βI = 0.98, p = 0.00). The procedure
improved anticipated lifecycle performance compared to the benchmark by up to 36% percent (i.e. $3.34
million/$9.30 million) in combination with the lecture. These results are in line with those published in the real
options literature (Dixit and Pindyck 1994; Trigeorgis 1996; Amram and Kulatilaka 1999; de Neufville and
Scholtes 2011). The GLM response was:
!ENPV =1.88+ 0.48E + 0.98I
0.00
0.50
1.00
1.50
2.00
2.50
3.00
3.50
4.00
Brainstorming (-1) Prompting (+1)
!ENPV
(mill
ions
)!
Ideation Mechanism (I)!Current training (-1) Explicit for flexibility (+1)
Fig. 8 Mean plots for ΔENPV (anticipated lifecycle performance). The lower curve shows mean results
for current training on flexibility (E = –1). The upper curve shows results for explicit training on
flexibility (E = +1)
Flexibility improved expected performance by acting explicitly on the distribution of outcomes. For example,
capturing whichever condo or apartment markets with highest demand helped capitalize on better profit
opportunities. Deferring the first phase until favorable market conditions emerged reduced the impact of loss-

Draft submitted to Research in Engineering Design for review
25
generating scenarios. Expanding unit capacity within phases increased profits, while reducing it avoided
spending resources on units that may not sell.
The following observations are at the heart of this paper. Results show that the procedures introduced here may
help designers effectively improve anticipated lifecycle performance by means of flexibility. They also show
that current engineering training and a widely used concept generation procedure like free undirected
brainstorming may help, but may not be sufficient to generate valuable flexibility in early engineering systems
design. Current approaches may still leave aside significantly valuable design alternatives. Participants under
treatment 1 (E = –1, I = –1) generated ΔENPV= $0.41 million by means of flexibility under current training, and
free undirected brainstorming. This is nearly 5% improvement compared to the $9.3 million benchmark ENPV,
a significant amount for a real estate project. Treatment 4 (E = +1, I = +1) however produced ΔENPV= $3.34
million, nearly 36% improvement. This shows there is an opportunity to improve current training and widely
used concept generation procedures by integrating the simple, efficient, and intuitive lecture/prompting package
introduced here.
5.4 Improvement in Process Satisfaction (ΔPS)
Fig. 9 shows that explicit training on flexibility had a significant main effect on ΔPS (βE = 1.35, p = 0.06). This
suggests that participants receiving the lecture were significantly more satisfied with the process than
participants who did not. There was also a significant interaction (βEI = 1.37, p = 0.05) where participants using
prompting were significantly more satisfied with the process when they received the lecture. In contrast, there
was almost no satisfaction improvement when prompting alone was used. The GLM response was:
!PS = 2.40+1.35E + 0.28I +1.37EI
-1.00
0.00
1.00
2.00
3.00
4.00
5.00
6.00
Brainstorming (-1) Prompting (+1)
!PS
(poi
nts)!
Ideation Mechanism (I)!Current training (-1) Explicit for flexibility (+1)
Fig. 9 Mean plots for ΔPS (process satisfaction). The lower curve shows mean results for current training
on flexibility (E = –1). The upper curve shows results for explicit training on flexibility (E = +1)

Draft submitted to Research in Engineering Design for review
26
This finding demonstrates that the lecture was crucial for the acceptability of the prompting procedure. It should
favor dissemination of a packaged approach in industry practice. The interaction effect also supports this view.
Prompting alone led to almost zero ΔPS improvement, clearly below the results from other treatments. Perhaps
because participants were being taught a new skill, they did not see the purpose of the prompts. This observation
brings empirical support to an observation often made in GSS research, but not well documented. Participants
will not appreciate an intervention – and sometimes refuse to participate – if they are not explained the rationale
behind a procedure.
5.5 Improvement in Results Satisfaction (ΔRS)
Results in Fig. 10 show that explicit training on flexibility (E = +1) had a significant main effect on ΔRS (βE =
2.33, p = 0.00). Participants were more satisfied with the results after the short lecture on flexibility. The GLM
response was:
!RS = 4.19+ 2.33E " 0.38I +1.08EI
0.00
1.00
2.00
3.00
4.00
5.00
6.00
7.00
8.00
Brainstorming (-1) Prompting (+1)
!RS
(poi
nts)!
Ideation Mechanism (I)!Current training (-1) Explicit for flexibility (+1)
Fig. 10 Mean plots for ΔRS (results satisfaction). The lower curve shows mean results for current training
on flexibility (E = –1). The upper curve shows results for explicit training on flexibility (E = +1)
The results concur with those for process satisfaction, although there was no significant interaction effect here.
Using prompting without the lecture also produced near-zero improvement in results satisfaction. Participants
were significantly more satisfied with prompting after the lecture, perhaps because they could appreciate more
the benefits of flexibility.
Draft submitted to Research in Engineering Design for review
27
5.6 Improvement in Quality Assessment (ΔQA)
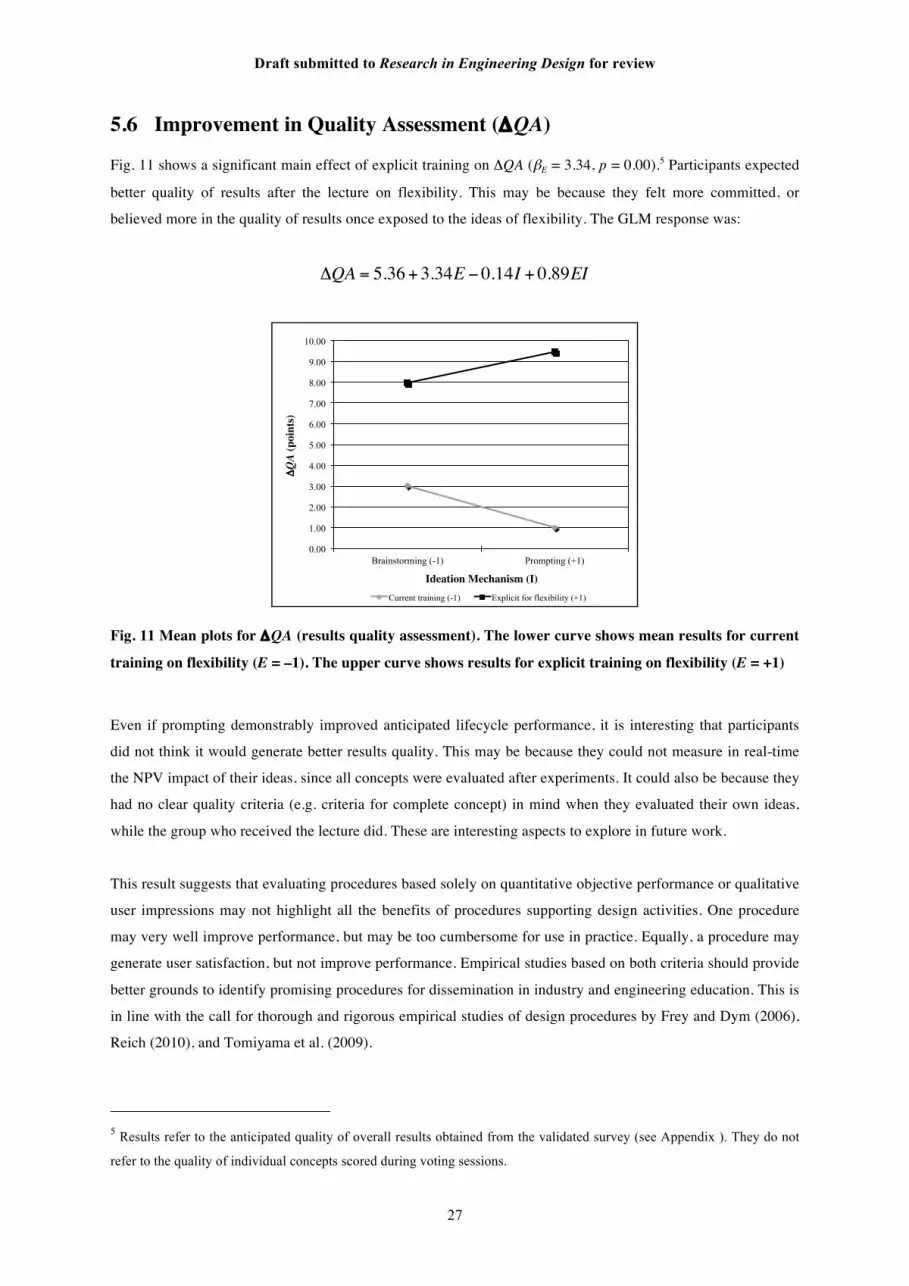
Fig. 11 shows a significant main effect of explicit training on ΔQA (βE = 3.34, p = 0.00).5 Participants expected
better quality of results after the lecture on flexibility. This may be because they felt more committed, or
believed more in the quality of results once exposed to the ideas of flexibility. The GLM response was:
!QA = 5.36+3.34E " 0.14I + 0.89EI
0.00
1.00
2.00
3.00
4.00
5.00
6.00
7.00
8.00
9.00
10.00
Brainstorming (-1) Prompting (+1)
!QA
(poi
nts)!
Ideation Mechanism (I)!Current training (-1) Explicit for flexibility (+1)
Fig. 11 Mean plots for ΔQA (results quality assessment). The lower curve shows mean results for current
training on flexibility (E = –1). The upper curve shows results for explicit training on flexibility (E = +1)
Even if prompting demonstrably improved anticipated lifecycle performance, it is interesting that participants
did not think it would generate better results quality. This may be because they could not measure in real-time
the NPV impact of their ideas, since all concepts were evaluated after experiments. It could also be because they
had no clear quality criteria (e.g. criteria for complete concept) in mind when they evaluated their own ideas,
while the group who received the lecture did. These are interesting aspects to explore in future work.
This result suggests that evaluating procedures based solely on quantitative objective performance or qualitative
user impressions may not highlight all the benefits of procedures supporting design activities. One procedure
may very well improve performance, but may be too cumbersome for use in practice. Equally, a procedure may
generate user satisfaction, but not improve performance. Empirical studies based on both criteria should provide
better grounds to identify promising procedures for dissemination in industry and engineering education. This is
in line with the call for thorough and rigorous empirical studies of design procedures by Frey and Dym (2006),
Reich (2010), and Tomiyama et al. (2009).
5 Results refer to the anticipated quality of overall results obtained from the validated survey (see Appendix ). They do not
refer to the quality of individual concepts scored during voting sessions.

Draft submitted to Research in Engineering Design for review
28
5.7 Results Validity and Study Limitations
5.7.1 Internal Validity
A controlled experimental approach was chosen to study cause-and-effect relationships. It enabled studying the
factors of interest efficiently and reliably (Summers et al. 2009). Easy replication of the treatments provided a
good amount of data on the same design problem. This contributed to calculating reliably the main effects and
their statistical significance. Such inferences would have been more difficult in meta-analyses of case and
protocol studies, because each system, context, and operating conditions would have been different. The
approach avoided difficulties often arising in case studies to access data due to poor or non-existent
documentation, and/or limited access for security or proprietary reasons (Shah et al. 2000).
The approach identified efficiently promising procedures for further application and studies in a real-world
context. Experiments and analysis were completed over a period of six weeks. This contrasts to typical durations
in case study fieldwork (i.e. months, years) at a firm or organization – e.g. (Ward et al. 1995). Also, experiments
did not require videotaping designers “thinking out loud” as in protocol studies (Goldschmidt and Weil 1998;
Ullman et al. 1989). Because no transcription was required – the online GSS software generated transcripts
automatically – it was therefore more efficient and less time consuming.
There were still many challenges to internal validity of results. The strategies described in Section 4.4.2 were
pursued to control undesired effects of external factors affecting the responses observed. A second qualified,
treatment-blind, and independent coder reviewed ideation transcripts to enhance interpretive validity. This also
alleviated concerns about researcher bias of “finding what was looked for” in the transcripts. Random
assignments to different treatment groups helped diffuse the possibility that some participants would try harder
to demonstrate that one treatment works better than another – especially since participants knew it was an
experiment about flexibility in engineering design.
Another internal validity issue is whether prompting was a valid design procedure, as it may seem like answers
were given away to participants. The first subtle argument addressing this concern is that researchers knew of
flexible strategies potentially improving performance, but did not know of all the possible strategies participants
could generate. The design problem left enough room for creativity, and participants identified strategies
researchers did not think of. One team suggested developing units “just in time”. Although the authors thought
about capacity expansion, the possibility of reducing capacity was not equally considered. It was necessary to
create and implement some flexible design solutions a priori to test and validate the computer model. This did
not imply that all possible flexible design concepts were identified and be packaged implicitly in the prompting
mechanism. The researchers did not know ahead what strategies, design enablers, and decision rules participants
would formulate. Second, as noticed in Appendix 2, the prompting mechanism was crafted to be general enough
to be usable directly for a different engineering system in a different domain. The level to which one has to
tailor prompting to a problem of interest, and provide different levels of direction is a topic for future research.
Third, the prompting mechanism was crafted carefully to provide some level of direction, but not complete
direction as to give away answers. Fig. 12 depicts conceptually a spectrum of “amount of direction”, ranging

Draft submitted to Research in Engineering Design for review
29
from no direction at all – e.g. Santanen et al. (2004) – to complete direction – e.g. Santanen and de Vreede
(2004). The prompting mechanism lies somewhere in-between, closer to complete direction. In this sense
prompting was similar to the provocation change of perspective defined by Knoll and Horton (2010). It
challenged the underlying assumptions of the design problem, and induced participants to consider alternatives
they may not have otherwise considered.
No direction!
Complete direction!
Some!direction!
Proposed procedures!
Fig. 12 “Amount of direction” spectrum for prompting-based ideation mechanisms
5.7.2 External Validity
This study cannot claim for external validity over the entire population of practicing engineers, and to all design
problems in a real-world setting. Participants were graduate students, and a direct comparison with practicing
engineers would not be fair. The controlled environment did not fully represent the realities of daily industrial
activities. Participants’ self-selection – the willingness to participate – could have biased results. It may not
reflect the natural resistance arising when new procedures are introduced. Also, the design problem does not
represent the full complexity of a real-world engineering system.
Experimental conditions and the sample population nonetheless represented some of the realities of engineering
practice. Participants were graduate students with many years of experience in industry. They represented the
next best sample available, given the difficulty of conducting controlled experiments with practitioners – whose
time and availability are limited. They represented a wide array of industries, expertise, and educational
backgrounds. This led to cultural and personality clashes in experiments, also seen in the real world. Even if the
engineering system problem was simplified, it was modeled through close interactions with real estate experts.
The benchmark solution represented some of the best practices in this field.
Empirical evidence suggest the explicit training and prompting procedures were effective and efficient,
providing further motivation for studying their effects in real-world practice. Procedures were identified without
months and years of close interactions with a company and/or organization.
5.7.3 Measurements Reliability
Two aspects contributed to measurement reliability in ΔC and ΔG. Two independent reviewers analyzed
ideation transcripts using the same systematic coding procedure, which is widely used in social sciences (Trauth
and Jessup 2000; Strauss and Corbin 1990). The inter-rater agreement showed that flexible concepts were the
same for 95% of all flexible concepts extracted independently. Two aspects contributed to reliability in ΔENPV
measurements. Under the same set of assumptions and decision rules, and for several runs of 2,000 simulations,

Draft submitted to Research in Engineering Design for review
30
the computer model generated ENPV values always falling within the same 95% confidence interval. The same
market assumptions detailed in Appendix 5 were used to evaluate all flexible design concepts, to ensure they
were all compared on an equivalent basis. Building upon a survey already validated experimentally by Briggs et
al. (2006) enhanced response reliability for ΔPS, ΔRS, and ΔQA. Cronbach α values were measured for each
session, treatment, and dependent variable. The twenty-four α values ranged between 0.91 and 0.99, with
maximum possible value α = 1. These results demonstrated the reliability of survey items in measuring the
constructs within and across participants (Nunnally 1978; Cortina 1993; Trochim 2006).
6 Conclusion This paper presented the results of a thorough and rigorous empirical evaluation of procedures to generate
flexibility in engineering systems. The effects of educational training about flexibility (current vs. explicit) and
ideation procedures (free undirected brainstorming vs. prompting) were studied. These procedures were chosen
because of their relative ease of use and simplicity, although other procedures could have been considered using
the same methodology. Measurements involved the quantity of flexible design concepts generated, anticipated
lifecycle performance improvements, user satisfaction with the process and results, and quality of results.
Current training assumed that participants may or may not have received training on flexibility. Explicit training
consisted of a short lecture on the topic of flexibility. Free undirected brainstorming represented a simple and
intuitive approach to generate ideas (Osborn 1957) widely used in U.S. engineering practice (Yang 2007).
Prompting stimulated creativity (Santanen et al. 2004; Santanen and de Vreede 2004), and structured the
thought process to generate valuable flexibility. The procedures were evaluated experimentally by having ninety
participants tackle a simplified design problem in real estate development – an accessible example of
engineering systems (ESD 2011).
Results showed that prompting helped participants generate more valuable flexible design concepts. In turn, the
concepts improved anticipated lifecycle performance significantly more than free-undirected brainstorming, by
up to 36%. Users however did not expect prompting to improve results quality. Providing explicit training on
flexibility improved user satisfaction with the process, results, and results quality.
Results show that the proposed lecture/prompting procedure package may be an effective and complementary
toolkit to help designers improve lifecycle performance of an engineering system by means of flexibility. They
also suggest that current engineering training and a widely used concept generation procedure like free
undirected brainstorming may not be sufficient to do this effectively in early design phases. Design alternatives
significantly improving lifecycle performance may be left aside via current approaches. Even though some
teams generated flexibility using current techniques, the new procedures generated even more flexible concepts,
which in turn improved lifecycle performance even more. Also, explicit training on flexibility proved crucial for
the acceptability of the prompting procedure. It provided participants with improved satisfaction with the
process and results, as well as anticipated quality of results. This is essential for future use in engineering
education and industry practice.

Draft submitted to Research in Engineering Design for review
31
This study showed that design procedures should be evaluated using both qualitative user impressions, and
objective quantitative performance measurements. A procedure providing good user impressions does not
guarantee the design concepts will perform well. Similarly, users may not appreciate a procedure that is too
complicated or cumbersome, even if it improves performance. Measuring both types of effects provides better
grounds for wider dissemination and real-world impact.
6.1 Future Work Many opportunities for future research exist by addressing the limitations of this work. One study could focus
on understanding the best sequence for presenting information in the lecture so as to maximize retention (Deese
and Kaufman 1957). Another study could evaluate the procedures in a real setting and on a real design problem
with industry practitioners. It could investigate the best ways to use the procedures in practice. Also, one study
could compare anticipated lifecycle performance at the conceptual stage, and compare it to actual performance
outcomes when the system is launched. Replicating the methodology with a different design problem, computer
model, and sample population would further validate the experimental methodology used here. Different
procedures for flexible design concept generation could be evaluated, recognizing the one proposed here are not
the only possibilities.

Draft submitted to Research in Engineering Design for review
32
Acknowledgments The authors would like to thank Rhonda Jordan, Alexander Verbraeck, Maria Yang, and Delft University of
Technology students at the Systems Engineering Section for their intellectual support. We are grateful for the
financial support provided by the Engineering Systems Division, Systems Design and Management program,
and Center for Real Estate at the Massachusetts Institute of Technology (MIT), the MITRE Corporation, the
National Science and Engineering Research Council of Canada, the Fonds Québécois de la Recherche sur la
Nature et les Technologies, the MIT Portugal Program, the Singapore-MIT International Design Center, the
Cambridge-MIT Institute, and the Fondation Desjardins.

Draft submitted to Research in Engineering Design for review
33
References Altshuller G (1973) The Innovation Algorithm. Technical Innovation Center, Worcester, MA, United States
Amram M, Kulatilaka N (1999) Real Options: Managing Strategic Investment in an Uncertain World. Harvard
Business School Press, Cambridge, MA, United States
Babajide A, de Neufville R, Cardin M-A (2009) Integrated Method for Designing Valuable Flexibility in Oil
Development Projects. SPE Projects, Facilities, and Construction 4:3-12
Bandecchi M, Melton B, Gardini B, Ongaro F (2000) The ESA/ESTEC Concurrent Design Facility. Paper
presented at the European Space Elevator Challenge (EuSEC),
Bellman R (1952) On the Theory of Dynamic Programming. Paper presented at the Proceedings of the National
Academy of Sciences of the United States of America, Santa Monica, CA, United States,
Bender B, Blessing LTM (2003) Re-Interpretation of Conceptualization: A Contribution to the Advance of
Design Theory. In: Lindemann U (ed) Human Behaviour in Design: Individuals, Teams, Tools. Springer-
Verlag, Berlin Heidelberg, Germany,
Black F, Scholes M (1973) The Pricing of Options and Corporate Liabilities. Journal of Political Economy 81
(3):637-654
Boehm B, Gruenbacher P, Briggs RO (2001) Developing Groupware for Requirements Negotiation: Lessons
Learned. IEEE Software 18 (3)
Bostrom RP, Nagasundaram M (1998) Research in Creativity and GSS. Paper presented at the Proceedings of
the 31st Annual Hawaii International Conference on System Sciences, Kohala Coast, HI, United States,
Braha D, Minai AA, Bar-Yam Y (2006) Complex Engineered Systems: Science Meets Technology. Springer,
Netherlands
Briggs RO, Reinig BA, de Vreede G-J (2006) Meeting Satisfaction for Technology-Supported Groups: An
Empirical Validation of a Goal Attainment Model. Small Group Research 37 (6):585-611
Browning TR (2001) Applying the Design Structure Matrix to System Decomposition and Integration
Problems: A Review and New Directions. IEEE Transactions on Engineering Management 48 (3):292-306

Draft submitted to Research in Engineering Design for review
34
Buchal RO (2002) Sketching and Computer-Aided Conceptual Design. Paper presented at the 7th International
Conference on Computer Supported Cooperative Work in Design,
Camacho IM, Paulus PB (1995) The Role of Social Anxiousness in Group Brainstorming. Journal of Personality
and Social Psychology 68 (6):1071-1080
Campbell DT, Stanley JC (1966) Experimental and Quasi-experimental Designs for Research. Houghton
Mifflin, United States
Cardin M-A (2011) Quantitative Performance-Based Evaluation of a Procedure for Flexible Design Concept
Generation. Doctoral Dissertation in Engineering Systems, Massachusetts Institute of Technology, Cambridge,
MA, United States
Cardin M-A, de Neufville R, Kazakidis V (2008) A Process to Improve Expected Value in Mining Operations.
Mining Technology: IMM Transactions, Section A 117 (2):65-70
Copeland T, Antikarov V (2003) Real Options: A Practitioner’s Guide. Thomson Texere, New York, NY,
United States
Cortina JM (1993) What is Coefficient alpha? An Examination of Theory and Applications. Journal of Applied
Psychology 78:98-104
Cox JC, Ross SA, Rubenstein M (1979) Options Pricing: A Simplified Approach. Journal of Financial
Economics 7 (3):229-263
Daly SR, Christian JL, Yilmaz S, Seifert CM, Gonzalez R (2011) Teaching Design Ideation. Paper presented at
the 118th ASEE Annual Conference and Exposition,
de Neufville R, Odoni A (2003) Airport Systems: Planning, Design, and Management. McGraw-Hill Companies
Inc., New York, NY, United States
de Neufville R, Scholtes S (2011) Flexibility In Engineering Design. Engineering Systems. MIT Press,
Cambridge, MA, United States
de Vreede G-J, Vogel D, Kolfschoten G, Wien J (2003) Fifteen Years of GSS in the Field: A Comparison
Across Time and National Boundaries. Paper presented at the 36th Annual Hawaii International Conference on
System Sciences, Big Island, HI, United States,
de Weck OL, de Neufville R, Chaize M (2004) Staged Deployment of Communications Satellite Constellations
in Low Earth Orbit. Journal of Aerospace Computing, Information, and Communication 1:119-136

Draft submitted to Research in Engineering Design for review
35
de Weck OL, Eckert C (2007) A Classification of Uncertainty for Early Product and System Design. ESD
Working Paper Series. Massachusetts Institute of Technology, Cambridge, MA, United States
Deese J, Kaufman RA (1957) Serial Effects in Recall of Unorganized and Sequentially Organized Verbal
Material. Journal of Experimental Psychology 54 (3):180-187
Dennis AR, Valacich JS (1993) Computer Brainstorms: More Heads Are Better Than One. Journal of Applied
Psychology 78 (4):531-536
Diehl M, Stroebe W (1987) Productivity Loss in Brainstorming Groups: Toward the Solution to a Riddle.
Journal of Personality and Social Psychology 53 (3):497-509
Dixit AK, Pindyck RS (1994) Investment under Uncertainty. Princeton University Press, NJ, United States
Eckert CM, de Weck OL, Keller R, Clarkson PJ (2009) Engineering Change: Drivers, Sources and Approaches
in Industry. Paper presented at the 17th International Conference on Engineering Design, Stanford, CA, United
States,
Eppinger SD, Fine CH, Ulrich KT (1990) Interdisciplinary Product Design Education. IEEE Transactions on
Engineering Management 37 (4):301-305
ESD (2011) Engineering Systems Division Strategic Report. Massachusetts Institute of Technology,
Cambridge, MA, United States
Fisher RA (1922) The Goodness of Fit of Regression Formulae, and the Distribution of Regression Coefficients.
Journal of the Royal Statistical Society 85 (4):597-612
Fisher RA (1935) The Design of Experiment. Hafner, New York, NY, United States
Frey DD, Dym CL (2006) Validation of Design Methods: Lessons from Medicine. Research in Engineering
Design 17:45-57
Frey DD, Wang H (2006) Adaptive One-Factor-at-a-Time Experimentation and Expected Value of
Improvement. Technometrics 48 (3):418-431
Fricke E, Schulz AP (2005) Design for Changeability (DfC): Principles to Enable Changes in Systems
Throughout Their Entire Lifecycle. Systems Engineering 8 (4):342-359
Geltner D, Miller N, Clayton J, Eichholtz P (2010) Commercial Real Estate Analysis and Investments. 2nd edn.
Cengage Learning Inc., United States

Draft submitted to Research in Engineering Design for review
36
Goldschmidt G, Weil M (1998) Contents and Structure in Design Reasoning. Design Issues 14 (3):85-100
Guilford JP (1959) Personality. McGraw-Hill, New York, NY, United States
Guma A, Pearson J, Wittels K, de Neufville R, Geltner D (2009) Vertical Phasing as a Corporate Real Estate
Strategy and Development Option. Journal of Corporate Real Estate 11 (3):144-157
Hassan R, de Neufville R, McKinnon D (2005) Value-At-Risk Analysis for Real Options in Complex
Engineered Systems. Paper presented at the IEEE International Conference on Systems, Man, and Cybernetics,
Hawaii, United States,
Hazelrigg GA (1998) A Framework for Decision-Based Engineering Design. Journal of Mechanical Design
120:653-658
HBS (2011) Executive Education in Real Estate Management Program - New Conditions, New Leaders.
Harvard Business School. http://www.exed.hbs.edu/programs/rem/print.aspx. Accessed October 6 2011
Helmer-Hirschberg O (1967) Analysis of the Future: The Delphi Method. RAND Corporation,
Herder PM, Bruijn HD (2009) System and Actor Perspectives on Sociotechnical Systems. IEEE Transactions on
Systems, Man, and Cybernetics 39 (5):981-992
Hevner AR, March ST, Park J, Ram S (2004) Design Science in Information Systems Research. Management
Information Systems Quarterly 28 (1):75-105
Howard RA (1966) Decision Analysis: Applied Decision Theory. Paper presented at the Proceedings of the 4th
International Conference on Operational Research,
Itô K (1951) On Stochastic Differential Equations. Memoirs, American Mathematical Society 4:1-51
Jablonowski C, Wiboonskij-Arphakul C, Neuhold M (2008) Estimating the Cost of Errors in Estimates Used
During Concept Selection. SPE Projects, Facilities, and Construction 3:1-6
Jacoby H, Loucks D (1972) The Combined Use of Optimization and Simulation Models in River Basin
Planning. Water Resources Research 8 (6):1401-1414
Janis IL (1972) Victims of Groupthink: A Psychological Study of Foreign-Policy Decisions and Fiascoes.
Houghton Mifflin Company, Boston, MA, United States

Draft submitted to Research in Engineering Design for review
37
Kalligeros K (2006) Platforms and Real Options in Large-Scale Engineering Systems. Doctoral Dissertation in
Engineering Systems, Massachusetts Institute of Technology, Cambridge, MA, United States
Karau SJ, Williams KD (1993) Social Loafing: A Meta-Analytic Review and Theoretical Integration. Journal of
Personality and Social Psychology 65 (4):681-706
Knoll SW, Horton G (2010) Changing the Perspective: Improving Generate ThinkLets for Ideation. Paper
presented at the 43rd Annual Hawaii International Conference on System Sciences, Koloa, Kauai, HI, United
States,
Kolfschoten G, Briggs RO, Duivenvoorde GPJ, de Vreede G-J (2009) Practitioners vs. Facilitators a
Comparison of Participant Perceptions on Success. Paper presented at the 42nd Annual Hawaii International
Conference on System Sciences, Big Island, HI, United States,
Kronenburg R (2007) Flexible - An Architecture that Responds to Change. Laurence King, London, United
Kingdom
Kurtoglu T, Campbell MI, Linsey JS (2009) An Experimental Study on the Effects of a Computational Design
Tool on Concept Generation. Design Studies 30:676-703
Leibovich M (1999) A Dream Come Back to Earth; Missteps, Shortfalls, Glitches Have Iridium Scaling Back
Expectations for Its Satellite Phone Service. The Washington Post, May 24,
Lin J (2009) Exploring Flexible Strategies in Engineering Systems Using Screening Models – Applications to
Offshore Petroleum Projects. Doctoral Dissertation in Engineering Systems, Massachusetts Institute of
Technology, Cambridge, MA, United States
Lin J, de Weck OL, de Neufville R, Robinson B, MacGowan D (2009) Designing Capital-Intensive Systems
with Architectural and Operational Flexibility Using a Screening Model. Paper presented at the First
International Conference in Complex Sciences: Theory and Applications, Shanghai, China, February 23-25
Linsey JS, Green MG, van Wie M, Wood KL, Stone R Functional Representations in Conceptual Design: A
First Study in Experimental Design and Evaluation. In: Proceedings of the American Society for Engineering
Education Annual Conference and Exposition, 2005.
Linsey JS, Tseng I, Fu K, Cagan J, Wood JL, Schunn C (2010) A Study of Design Fixation, Its Mitigation and
Perception in Engineering Design Faculty. Journal of Mechanical Design 132
Longstaff FA, Schwartz ES (2001) Valuing American Options by Simulation: A Simple Least-Squares
Approach. The Review of Financial Studies 14 (1):113-147

Draft submitted to Research in Engineering Design for review
38
MacCormack A, Herman K (2001) The Rise and Fall of Iridium. Harvard Business School, Cambridge, MA,
United States
Metropolis N, Ulam S (1949) The Monte Carlo Method. Journal of the American Statistical Association 44
(247):335-341
Mikaelian T, Nightingale DJ, Rhodes DH, Hastings DE (2011) Real Options in Enterprise Architecture: A
Holistic Mapping of Mechanisms and Types for Uncertainty Management. IEEE Transactions on Engineering
Management 54 (3):457-470
Milton JS, Arnold JC (1990) Introduction to Probability and Statistics – Principles and Applications for
Engineering and the Computing Sciences. McGraw-Hill, United States
Minai AA, Braha D, Bar-Yam Y (2006) Complex Engineered Systems: A New Paradigm. In: Minai AA, Braha
D, Bar-Yam Y (eds) Complex Engineered Systems: Science Meets Technology. Springer, Netherlands,
Morgan MG, Henrion M (1990) Uncertainty: A Guide to Dealing with Uncertainty in Quantitative Risk and
Policy Analysis. Cambridge University Press, United Kingdom
Mullen B, Johnson C, Salas E (1991) Productivity Loss in Brainstorming Groups: A Meta-Analytic Integration.
Basic and Applied Social Psychology 12 (1):3-23
Murman EM, Allen T, Bozdogan K, Cutcher-Gershenfeld J, McManus H, Nightingale DJ, Rebentisch E,
Shields T, Stahl F, Walton M, Warmkessel J, Weiss S, Widnall S (2002) Lean Enterprise Value: Insights from
MIT's Lean Aerospace Initiative. Palgrave, New York, NY, United States
Myers SC (1977) Determinants of Corporate Borrowing. Journal of Financial Economics 5:147-175
Nelson BA, Wilson JO, Rosen D (2009) Refined Metrics for Measuring Ideation Effectiveness. Design Studies
30:737-743
Nembhard HB, Shi L, Aktan M (2005) A Real-Options-Based Analysis for Supply Chain Decisions. IIE
Transactions 37:945-956
Nijstad BA, Stroebe W, Lodewijkx HFM (2003) Production Blocking and Idea Generation: Does Blocking
Interfere with Cognitive Processes? Journal of Experimental Social Psychology 39 (6):531-548
Nunamaker JF, Briggs RO, Mittleman DD, Vogel DR, Balthazard PA (1997) Lessons from a Dozen Years of
Group Support Systems Research: A Discussion of Lab and Field Findings. Journal of Management Information
Systems 13 (3):163-207

Draft submitted to Research in Engineering Design for review
39
Nunnally JC (1978) Psychometric Theory. McGraw-Hill, New York, NY, United States
Okudan GE, Ming-Chuan C, Schmidt LC, Hernandez NV, Linsey JS (2010) A Pilot Exploration of Systematic
Ideation Methods and Tools on Design Learning. Paper presented at the 9th International Conference on
Information Technology Based Higher Education and Training,
Olewnik A, Lewis K (2006) A Decision Support Framework for Flexible System Design. Journal of
Engineering Design 17 (1):75-97
Osborn AF (1957) Applied Imagination: Principles and Procedures of Creative Thinking. 1st edn. Scribeners
and Sons, New York, NY, United States
Pearson K, Yule GU, Blanchard N, Lee A (1903) The Law of Ancestral Heredity. Biometrika 2 (2):211-236
Piirianen K, Kolfschoten GL, Lukosch SG (2009) Unraveling Challenges in Collaborative Design: A Literature
Study. In: Carricio L, Baloian N, Fonseca B (eds) Groupware: Design, Implementation and Use. Springer, Peso
da Regua, Duoro, Portugal,
Pitman EJG (1937) Significance Tests which May Be Applied to Samples from Any Population. Royal
Statistical Society Supplement 4:119-130 (Part I) and 225-132 (Part II)
Rajan PK, Wie MV, Campbell MI, Wood KL, Otto KN (2005) An Empirical Foundation for Product Flexibility.
Design Studies 26 (4):405-438
Reich Y (2010) My Method is Better! [Editorial]. Research in Engineering Design (April)
Reinig BA, Briggs RO, Nunamaker JF (2007) On the Measurement of Ideation Quality. Journal of Management
Information Systems 23 (4):143-161
Rhorbach B (1969) Creative nach Regeln: Methode 635, eine neue Technik zum Losen von Problemen.
Absatzwirtschaft 12
Robie BH, Kicher TP, Wolfe D (1992) Factors Influencing Individual Results in Concept Generation. Paper
presented at the 4th International Conference on Design Theory and Methodology,
Ross A (2006) Managing Unarticulated Value: Changeability in Multi-Attribute Tradespace Exploration.
Doctoral Dissertation in Engineering Systems, Massachusetts Institute of Technology, Cambridge, MA, United
States

Draft submitted to Research in Engineering Design for review
40
Rothwell G (2006) A Real Options Approach to Evaluating New Nuclear Power Plants. Energy Journal 27:37-
54
Saleh JH, Mark G, Jordan NC (2008) Flexibility: a Multi-Disciplinary Literature Review and a Research
Agenda for Designing Flexible Engineering Systems. Journal of Engineering Design 1:1-17
Santanen EL, Briggs RO, de Vreede G-J (2004) Causal Relationships in Creative Problem Solving: Comparing
Facilitation Interventions for Ideation. Journal of Management Information Systems 20 (4):167-197
Santanen EL, de Vreede GJ (2004) Creative Approaches to Measuring Creativity: Comparing the Effectiveness
of Four Divergence Thinklets. Paper presented at the Hawaii International Conference on System Sciences, Los
Alamitos, CA, United States,
Shah JJ, Kulkarni SV, Vargas-Hernandez N (2000) Evaluation of Idea Generation Methods for Conceptual
Design: Effectiveness Metrics and Design of Experiments. Journal of Mechanical Design 122:377-384
Shah JJ, Vargas-Hernandez N, Smith SM (2002) Metrics for Measuring Ideation Effectiveness. Design Studies
24 (2):111-134
Shah JJ, Vargas-Hernandez N, Summers JD, Kulkarni S (2001) Collaborative Sketching (C-Sketch) - An Idea
Generation Technique for Engineering Design. Journal of Creative Behavior 35 (3):168-198
Simpson TW (2004) Product Platform Design and Customization: Status and Promise. Artificial Intelligence for
Engineering Design, Analysis and Manufacturing 18:3-20. doi:10.1017/S0890060404040028
Simpson TW, Parkinson M, Celento D, Chen W, McKenna A, Colgate E, Norman D, Papalambros P, Gonzalez
R, Roth B, Leifer L (2010) Navigating the Barriers to Interdisciplinary Design Education: Lessons Learned
From the NSF Design Workshop Series. ASME Conference Proceedings 2010 (44144):627-637
Strauss A, Corbin J (1990) Basic of Qualitative Research: Grounded Theory Procedures and Techniques. Sage
Publications, Newbury Park, CA, United States
Suh ES, de Weck OL, Chang D (2007) Flexible Product Platforms: Framework and Case Study. Research in
Engineering Design 18:67-89
Summers JD, Anandan S, Teegavarapu S (2009) Introduction of Design Enabling Tools: Development,
Validation, and Lessons Learned. In: Markman AB, Wood KL (eds) Tools for Innovation. Oxford University
Press, United Kingdom,

Draft submitted to Research in Engineering Design for review
41
Taguchi G (1987) The System of Experimental Design Engineering Methods to Optimize Quality and Minimize
Cost, vol 1 and 2. American Supplier Institute, Dearborn, MI, United States
Taylor DW, Berry PC, H. BC (1958) Does Group Participation When Using Brainstorming Facilitate or Inhibit
Creative Thinking? Administrative Science Quarterly 3 (1):23-47
Tomiyama T, Gu P, Jin Y, Lutters D, Kind C, Kimura F (2009) Design Methodologies: Industrial and
Educational Applications. CIRP Annals – Manufacturing Technology 58:543-565
Trauth EM, Jessup LM (2000) Understanding Computer-Mediated Discussions: Positivist and Interpretive
Analyses of Group Support System Use. Management Information System Quarterly 24 (1):43-79
Trigeorgis L (1996) Real Options. MIT Press, Cambridge, MA, United States
Trochim WMK (2006) Research Methods Knowledge Base
Ullman D, Wood. S, Craig D (1989) The Importance of Drawing in the Mechanical Design Process. Computer
and Graphics 14 (2):263-274
UN (2008) The Real Estate and Financial Crisis: Causes, Effects, and Impacts on Development. United Nations.
http://www.un.org/News/Press/docs/2008/note6186.doc.htm. Accessed October 6 2011
van der Lugt R (2002) Brainsketching and How it Differs from Brainstorming. Creativity and Innovation
Management 11 (1):43-54
VanGundy A (1988) Techniques of Structured Problem Solving. 2nd edn. Van Nostrand Reinhold Company,
New York, NY, United States
Walker WE, Rahman SA, Cave J (2001) Adaptive Policies, Policy Analysis, and Policy-Making. European
Journal of Operational Research 128:282-289
Wang T (2005) Real Options in Projects and Systems Design – Identification of Options and Solutions for Path
Dependency. Doctoral Dissertation in Engineering Systems, Massachusetts Institute of Technology, Cambridge,
MA, United States
Wang T, de Neufville R (2005) Real Options ‘In’ Projects. Paper presented at the Real Options Conference,
Paris, France,
Ward AC, Liker JK, Cristiano JJ, Sobeck DKI (1995) The Second Toyota Paradox: How Delaying Decisions
Can Make Better Cars Faster. Sloan Management Review 36 (3):43-61

Draft submitted to Research in Engineering Design for review
42
Warr A, O’Neill E (2005) Understanding Design as a Social Creative Process. Paper presented at the
Proceedings of the 5th Conference on Creativity and Cognition, London, United Kingdom,
Welch WJ (1990) Construction of Permutation Tests. Journal of American Statistical Association 85:693-698
White C, Talley A, Jensen D, Wood K, Szmerekovsky A, Crawford R (2010) From Brainstorming to C-Sketch
to Principles of Historical Innovators: Ideation Techniques to Enhance Student Creativity. Paper presented at the
2010 ASEE Annual Conference and Exposition,
Yang M (2007) Design Methods, Tools, and Outcome Measures: A Survey of Practitioners. Paper presented at
the ASME International Design Engineering Technical Conferences and Computers and Information in
Engineering Conference, Las Vegas, NV, United States,
Yang M (2009) Observations on Concept Generation and Sketching in Engineering Design. Research in
Engineering Design 20:1-11
Yang Y (2009) A Screening Model to Explore Planning Decisions in Automotive Manufacturing Systems
Under Demand Uncertainty. Doctoral Dissertation in Engineering Systems, Massachusetts Institute of
Technology, Cambridge, MA, United States
Yule GU (1897) On the Theory of Correlation. Journal of the Royal Statistical Society 60 (4):812-854
Zhang SX, Babovic V (2011) A Real Options Approach to the Design and Architecture of Water Supply
Systems Using Innovative Water Technologies Under Uncertainty. Journal of Hydrodynamics:In press

Draft submitted to Research in Engineering Design for review
43
Appendix 1
Lecture Slides
09/20/11
1
Flexibility In Infrastructure Design and Management
Spring 2011
2
Definitions of Uncertainty
“Anything that can impact promises or business objectives in the future” (Verbraeck, 2010)
Uncertainty types (McManus and Hasting, 2005) ! Exogenous: out of managerial control ! Endogenous: managers/designers can control ! Statistically characterized: price or demand ! Known unknowns: future budget, system
performance ! Unknown unknowns: hard to quantify, not
considered in design
3
Human (In-)ability to Forecast
Heavier-than-air flying machine are impossible. Lord Kelvin – British Mathematician, Physicist, and President of the British Royal Society, c. 1895
Everything that can be invented has been invented.
Charles H. Duell – Commissioner of the U.S. Patent Office, 1899
Reagan doesn’t have the presidential look.
United Artists Executive – dismissing Ronald Reagan for the starring role in the movie of THE BEST MAN, 1964
4
Environmental Uncertainty
http://www.jordoncooper.com
http://www.hurricanekatrinanews.org
http://www.washingtonpost.com
5
Market, Technology, and Others…
http://www.growthstock.com
http://images.angelpub.com
http://img.gsmarena.com
Stock Market
Crude Oil Price
Technology
6
Uncertainty and Design Forecast can be (severely) wrong ! No escape from this ! … infrastructure are long-lived, undergo much variations ! … analysis based on too many assumptions ! … inevitable surprises ! … typically over-optimistic about outcomes ! … over-confident about prediction errors
There are many design choices beyond obvious ones ! Typically, combining different characteristics ! … enabling different future designs ! … and are thus more flexible
modified from de Neufville, 2008
Fig. 13 Explicit training on flexibility slides 1-6

Draft submitted to Research in Engineering Design for review
44
09/20/11
2
7
Current Design Process
Very successful, BUT…
Based on deterministic forecasts, heuristics, point value estimates (e.g. $60/oil barrel, $1/pound of copper)
Optimized for limited set of conditions
Uncertainty considered ex post through sensitivity analysis “Compartmentalized” engin. and manag’t
Often focused on risk minimization
OPPORTUNITY TO DO BETTER!
http://www.orchardscotts.com.sg/
8
Issues with Current Process Uncertainty affects performance ! Downside scenarios ! risk of losses, lower performance ! Upside scenarios ! opportunities for additional gains
“Fixed” design and management miss opportunities to recognize additional value! ! Can be sub-optimal… when reality departs from forecast! ! Cannot “reduce” exposure to risk easily ! Cannot “seize” good opportunities easily ! Adapting project can be more costly ! Typical project valuation does not account for flexibility
9
Better Approach
Recognize uncertainty a priori ! Range, distribution of possible outcomes Plan for flexibility in design and management ! E.g. vertical building expansion in Chicago
Start smaller
Reduce exposure to
downside market risk
Expand when needed
Extra gains on upside
market opportunity
Guma, 2008
10
Better Approach (cont.)
Find designs acting on outcome distribution, rather than optimizing point forecast
Value Outcomes
Freq
uenc
y
Cut bad, downside outcomes
Improve on good, upside
outcomes
Aim at shifting whole distribution towards better value
http://www.useit.com
11
Why Better with Flexibility? Forces considering downsides explicitly ! And prepare for it ! Prevents over-optimism
Forces considering upsides as well ! Position to capture upside opportunities
Both improve expected (or “average”) performance compared to fixed design
No absolute best guaranteed, but can do BETTER THAN FIXED (INFLEXIBLE) DESIGN!
12
Example Flexible Strategies
Flexibility “on” system: managerial ! Defer investment until favorable conditions ! Growth through R&D investment ! Abandon temporarily or permanently
Flexibility “in” system: technical ! Phase asset deployment over time ! Alter operating scale (expand or reduce
capacity) ! Switch input/output
Fig. 14 Explicit training on flexibility slides 7-12

Draft submitted to Research in Engineering Design for review
45
09/20/11
3
13
Criteria for “Good” Flexibility 1. Identify major uncertainty source(s) affecting anticipated
performance
2. Suggest relevant flexible strategies to deal with uncertainties
3. Identify early on appropriate design variables and parameters enabling flexibility ! E.g. stronger structure to support expansion, additional piece of land,
legal/financial/contractual arrangements if necessary
4. Identify relevant management decision rule to “exercise” flexibility ! “Trigger” based on some observations ! E.g. if demand > capacity for 2 years, expand ! Price threshold, regulatory change, etc
14
Examples from Industry
Satellite communication network (de Weck et al., 2004) ! ‘90s award-winning system, $4BN development cost ! Wrong market forecasts: did not plan for land cell
phones. Led to over-capacity design! ! Sold for $25M in bankruptcy
Expected cost saved if used flexible phased deployment strategy: ~$0.8BN (~20%)
15
Examples from Industry (cont.)
Offshore oil platform (Lin, 2009) ! Multi-billion project off coast of Angola ! Typical design to “most likely” oil reserves
estimate ! Production capacity expansion flex.: connect
more sub sea tiebacks as more oil discovered
Study shows 80% expected NPV improvement!
http://www.offshore-technology.com http://msnmoney.brand.edgar-online.com
http://www.w-industries.com
Sub sea tiebacks
Lin, 2009
16
Take Aways
Uncertainty has downsides… BUT ALSO PROVIDES UPSIDE OPPORTUNITIES!
Flexibility in design and management = best approach to deal with uncertainty
Flexibility helps harvest EXTRA value from uncertainty
Not easy however to identify and value it…
Fig. 15 Explicit training on flexibility slides 13-16

Draft submitted to Research in Engineering Design for review
46
Appendix 2
Prompting Procedure
Uncertainty
What are the major sources of uncertainty affecting the future performance of this system? Examples:
- Exogenous uncertainties (e.g. demand markets, natural catastrophes, etc.)
- Endogenous uncertainties (e.g. technology failure rates, etc.)
- Scenarios where things go really bad (e.g. prices drop, economic crisis, etc.)
- Scenarios where things go really well (e.g. demand rises suddenly, etc.)
Flexibility
What flexible strategies would enable the system to change and adapt if the uncertainty scenarios you just
discussed occur during operations? Examples:
- Defer the initial capital investment until favorable market conditions
- Abandon the project to get out of bad, negative market situations
- Invest in R&D to support growth and future opportunities
- Phase capacity deployment over time instead of deploying initially all capacity at once
- Alter operating scale by expanding or reducing production capacity depending on market conditions
- Switch production output and/or input depending on observed demand
Design
How should you prepare, engineer, and design this particular system to enable the flexibilities you just
discussed? Think about how to best engineer the system so it can react to:
- Negative or bad scenarios (e.g. start with a smaller initial design, and reduce risk of over-capacity and
losses)
- Positive or good scenarios (e.g. engineer ability to switch product output easily, write legal contract to
enable physical expansion later on if needed)
- Completely unexpected scenario (e.g. plan ahead for emergency procedure in case of hurricane)
Management
How should you manage and decide when it is appropriate to use, or exercise, the flexibilities in this system?
Examples:
- If demand is lower than capacity for two years, I will shutdown operations for 6 months
- If market price gets above a certain threshold, I will expand production capacity

Draft submitted to Research in Engineering Design for review
47
Appendix 3
Design Problem Description
09/20/11
1
A Multi-Family Residential Development Project
Spring 2011
2
Introduction
Thanks for being here!
Personal background
About design experiments ! Test under different contexts ! Might wonder: “why this procedure?” ! Can’t answer all questions… unfortunately!
3
Example Project: Cambridge, MA
http://www.northpointcambridge.com
http://www.northpointcambridge.com
4
Setup
You are lead design team at renown real estate development firm
Specialize in multi-family residential real estate ! Condo and apartment buildings
Firm’s objective: sell building at highest profit ! Performance metric: Net Present Value (NPV)
Land already bought
Zoning obtained for either condos and/or apartments
Building permit for 310 units maximum over 3 years
5
Data and Assumptions
Current demand expectations: ! 100 condo units ! 100 apartment units
Current selling price expectations: ! $205,000/unit as condo ! $200,000/unit as apartment
Current construction cost estimate per unit (not inclusive of land) ! $152,000/unit as condo ! $150,000/unit as apartment
Demand, price, and construction cost all projected to increase linearly at 3%/year with annual volatility ~20%
6
Market Projections
LIGHT GREEN: condo
DARK RED: apart.
Fig. 16 Introduction and design problem description slides 1-6

Draft submitted to Research in Engineering Design for review
48
09/20/11
2
7
Analysis and Suggested Design
Go with condo building design ! NPV $12.4M > $11.6M (8% discounting)
All 309 units developed in phase 1 (incl. 3% growth) Sold over 3 years (1 year/phase)
8
The Situation
Management wants design offering best expected (or “average”) future performance over range of possible scenarios
Not convinced suggested design is best ! Market demand and price may change; differ from
projections ! Costs may increase, construction delayed
Your team is asked to investigate alternative design(s) that can improve expected performance compared to current design
9
Your Task Brainstorm collectively about design alternatives in this simplified infrastructure project ! Only conceptually, no quantitative assessment
necessary
Not much time, Management wants suggestions by the end of business day!
Plan two 25 minutes sessions using Group Support System software
GOOD LUCK!
Fig. 17 Introduction and design problem description slides 7-9

Draft submitted to Research in Engineering Design for review
49
Appendix 4
Survey Questions Answer scale for each question (1 to 7): 1 = Strongly disagree 4 = Neutral 7 = Strongly agree
Process Satisfaction (PS)
- I feel satisfied with the way the first/second session was conducted.
- I appreciated the techniques we used in the first/second session.
- I liked the way the first/second session progressed today.
- I feel satisfied with the methods we used in the first/second session.
- I feel satisfied about the way we carried out activities in the first/second session.
Results Satisfaction (RS)
- I feel happy with what we achieved in the first/second session.
- I feel satisfied with the things we achieved in the first/second session.
- I am happy with the results of the first/second session.
- Our accomplishments in the first/second session give me a feeling of satisfaction.
- When the first/second session was over, I felt satisfied with the results.
Quality Assessment (QA)
- The result of the first/second session had the required quality.
- What we achieved in the first/second session met the goal.
- We achieved what we intended to achieve in the first/second session.
- The result in the first/second session has the quality we intended to achieve.
- The result in the first/second session was in line with the goal set for this workshop.
- I feel confident the top five (5) design alternatives recommended in the first/second session provide
better anticipated performance than the current benchmark design

Draft submitted to Research in Engineering Design for review
50
Appendix 5
Computer Model Assumptions
Multi-Family Residential Development Project: All input parameters on this page! Assume zero time-to-build
RA - RB
Years per Phase 1.00
Construction Cost Expected Growth Rate (each phase) (gCC) 3%
Construction Cost Expectations (as of completion, each phase):
Phase 1 Phase 2 Phase 3
Base Cost (BCt) 130,000 133,900 137,917 per unit
Added Cost Expectation to Finish & Sell:
As Condos (FCCt) 22,000 22,660 23,340 per unit
As Apts (FCAt) 20,000 20,600 21,218 per unit
Total Construction and Sales Cost ExpectationsAs Condos (CCCt) 152,000 156,560 161,257 per unit
As Apts (CCAt) 150,000 154,500 159,135 per unit
Land Cost ExpectationUp-front Cost Expectation to Enable Switching Flexibility (Cswitch) 0 per unit
Up-front Cost Expectation to Enable Expansion Flexibility (Cexpand) 0 per unit
Selling Price Expected Growth Rate (each phase) (gP) 3%
Selling Price Expectations:
Phase 1 Phase 2 Phase 3As Condos (PCt) 205,000 211,150 217,485 per unit
As Apts (PAt) 200,000 206,000 212,180 per unit
Units Demand Expected Growth Rate (each phase) (gD) 3%
Units Demand Expectations (each phase) Phase 1 Phase 2 Phase 3
As Condos (DCt) 100 103 106
As Apts (DAt) 100 103 106
Planned capacity deployment strategy (each phase) Phase 1 Phase 2 Phase 3
As Condos (KCt) 309 0 0
As Apts (KAt) 309 0 0
Maximum capacity allowed (Kmax) 309
OCC Built Property (rP) 8.00% <== Note: Should include spec premium.
OCC Construction Costs (rC) 8.00% <== Note: Should be near riskfree rate.
Resulting Canonical OCC (r)* 8.00% <==Note: Devlpt project contains operational leverage. This rate will be used as discount rate (see GM Ch 29).
*Blended rate over all phases and uses (approximation of GM 29.4).
Overall Volatility Factor (!) 20%
Uncertainty Factor in Cost (!CC): Volatility factor around expectated growth rate
As Condos 20%
As Apts 20%
Uncertainty factor around initial cost value
As Condos 20%
As Apts 20%
Uncertainty Factor in Price (!P): Volatility factor around expectated growth rate
As Condos 20%
As Apts 20%
Uncertainty factor around initial selling price
As Condos 20%
As Apts 20%
Uncertainty Factor in Units Demand (!D) Volatility factor around expectated growth rate
As Condos 20%
As Apts 20%
Uncertainty factor around initial units demand
As Condos 20%
As Apts 20%
Fig. 18 DCF model assumptions

Draft submitted to Research in Engineering Design for review
51
Appendix 6 These examples summarize flexible design concepts elicited in experiments. They are all subject to the same
uncertainty sources: demand, price, and construction costs. Only enablers and decision rules are summarized.
Phase the development planning from one phase to another
- Enablers: phase horizontally by keeping land or preparing land, developing modular “blocks” of units,
keeping cash reserves for future expansion, and/or contracting agreements to have workers easily
hired/laid off if needed.
- Decision rule: if demand (price) is higher than planned capacity (observed cost) in this phase, build
next phase.
Expand unit capacity
- Enabler: expand vertically by reinforcing the structure, starting with small capacity to add more units,
preparing shared infrastructures (e.g. laundry, power, water, ventilation) for expansion, hedging
materials costs for expansion.
- Decision rule: expand if demand (observed price) is higher than capacity (observed cost) within the
same phase.
Reduce unit capacity
- Enabler: because this is managerial flexibility “on” the project, one can always reduce or slow down
unit capacity allocation. No specific enabler was needed.
- Decision rule: reduce capacity if demand (observed price) was lower than capacity (observed cost)
within the same phase.
Adjust unit capacity “just in time”
- Enabler: given this flexibility is very difficult to implement in practice, teams had to demonstrate
sufficient understanding of how to implement this in practice. This was typically a mixture of enablers
listed in the phasing and expansion strategies.
- Decision rule: if demand isdifferent than planned capacity, match capacity to demand exactly.
Temporarily abandon the project
- Enabler: because this is managerial flexibility “on” the project, one can always stop it, however with
the stated goal of resuming at some point.
- Decision rule: do not develop a phase if demand in the previous phase was lower than planned.
Completely abandon the project - Enabler: because this is managerial flexibility “on” the project, one can always stop it.
- Decision rule: abandon the project if demand in phase 1 is lower than a minimum threshold.

Draft submitted to Research in Engineering Design for review
52
Appendix 7
Transcript Analysis
3. Provocation CoP 2. Uncertainty
2.1. What are the major sources of uncertainty affecting the future performance of this system?
2.2. Examples: 2.2.1. Exogenous uncertainties (e.g. demand markets, natural catastrophes, etc) 2.2.2. Endogenous uncertainties (e.g. technology failure rates, etc) 2.2.3. Scenarios where things go really bad (e.g. prices drop, economic crisis, etc) 2.2.4. Scenarios where things go really well (e.g. demand rises suddenly, etc) 2.3. market demand 2.4. Volatility in the cost and demand. A sharp rise in the cost can affect the bottom
line of the firm. Change in market scenario like new competitor coming in the market.
2.5. New technology for construction 2.6. New technology in the real estate industry making depend of either condo and
apartment obsolete. 2.7. development of new public tranportation system or building a new road may
make the value of the location increase or decrease, which will change the demand and market price.
2.8. If the area is creating more job oppotunities, more people will move here, thus increase the demand and vice versa.
2.9. If the government is increasing real estate tax, more people may just prefer to rent an apartment instead of buying one, thus decrease the demand.
3. Flexibility
3.1. What flexible strategies would enable the system to change and adapt if the uncertainty scenarios you just discussed occur during operations?
3.2. Examples: 3.2.1. Defer the initial capital investment until favorable market conditions 3.2.2. Abandon the project to get out of bad, negative market situations 3.2.3. Invest in R&D to support growth and future opportunities 3.2.4. Phase capacity deployment over time instead of deploying initially all capacity at
once 3.2.5. Alter operating scale by expanding or reducing production capacity depending on
market conditions 3.2.6. Switch production output and/or input depending on observed demand 3.3. phase capacity deployment depending on observed demand 3.4. Hedge your risk by building combination of condo and apartments. 3.5. Try to build apartment in such a fashion that if required you can convert them
into condos. 3.6. Do market surveys before starting construction to understand the demand in the
market. 3.7. Keep cash and inventory in hand to do rapid construction in response to sharp
rise in market demand 3.8. Sign in future contracts to overcome the volatility in the market. 3.9. do more market research to have a better predication of demand. 3.10. keep enough cash and make alternative investment to hedge the real estate
investment.
Comment [9]: Demand uncertainty source
Comment [10]: Construction cost uncertainty source
Comment [11]: Technology uncertainty source
Comment [12]: Price uncertainty source
Comment [13]: Regulatory uncertainty source
Comment [14]: Phasing strategy
Comment [15]: Switching enabler in design
Comment [16]: Switching enabler in design
Comment [17]: Capacity expansion strategy
Comment [18]: Capacity expansion management/decision rule based on demand
Fig. 19 Example coding analysis for treatment 2 replicate R4 (page 1)

Draft submitted to Research in Engineering Design for review
53
4. Design 4.1. How should you prepare, engineer, and design this particular system to enable
the flexibilities you just discussed? 4.2. Think about how to best engineer the system so it can react to: 4.2.1. Negative or bad scenarios (e.g. start with a smaller initial design, and reduce risk
of over-capacity and losses) 4.2.2. Positive or good scenarios (e.g. engineer ability to switch product output easily,
write legal contract to enable physical expansion later on if needed) 4.2.3. Completely unexpected scenario (e.g. plan ahead for emergency procedure in
case of hurricane) 4.3. I will maintain an inventory to build both condo and apartment. 4.4. I will closely follow the changes in market so that I can chnage my strategies
according to the market 4.5. Design my apartmens such that it is possible to upgrade them to condo if
required. 4.6. Sign contracts with the suppliers to safeguard yourself against a sharpe price rise
in the cost. 4.7. Condo should be the major source of sales but use sales of apartment to
supplement that of condo. 4.8. make alternative investment, such as funds and stock, to hedge the real estate
investment. For example, if expecting the raw material cost will go up, we can buy related stock in advance.
4.9. research on the demand of condo and apartment seperately. 5. Management
5.1. How should you manage and decide when it is appropriate to use, or exercise, the flexibilities in this system?
5.2. Examples: 5.2.1. If demand is lower than capacity for two years, I will shutdown operations for 6
months 5.2.2. If market price gets above a certain threshold, I will expand production capacity 5.3. If you see the price rise is steady, stick to your strategy 5.4. If you see a shard rise in prices of condo and no change in the price of the
apartment then think about upgrading your apartment to condos. 5.5. 20% drop in apartment price will mean the selling price is ~$160,000 and 20%
rise in cost will mean construction cost is ~$180,000. This will mean loss. So if construction cost goes above $160,000 stop construction for a while unless you are sure that selling price and demand will remain intact.
5.6. React to any change in the government policy. 5.7. If the demand is less than 10% of expected, decrease the construction for next
year to 80% of original plan. 5.8. if demand is less than expected for a year than it might be possible that demand
can overshoot in the next year. We should build up our inventory and plan ourself to
5.9. face this situation. 5.10. If the demand is increasing, increase the proportion of condo construction, which
will bring more revenue.
Comment [19]: Switching enabler in design
Comment [20]: Switching management/decision rule based on price
Comment [21]: Temporary abandonment strategy
Comment [22]: Temporary abandonment management/decision rule
Comment [23]: Capacity reduction flexible strategy
Comment [24]: Capacity reduction management/decision rule
Fig. 20 Example coding analysis for treatment 2 replicate R4 (page 2)

Draft submitted to Research in Engineering Design for review
54
Appendix 8
Summary of Entire Dataset Expt Rep Complete Complete ENPV Good Total ENPV Total !ENPV Complete NEW Complete NEW Percent. total ENPV NEW good Percent. total Total ENPV Total !ENPV Change total Percentage
flex. ideas ideas? attained idea? flex.(millions) (millions) flex. Ideas idea? complete ideas attained idea? good ideas flex.(millions) (millions) !ENPV (millions) total !ENPVS1 S1 S1 S1 S1 S1 S2 S2 from S2 S2 S2 from S2 S2 S2 S1 to S2 from S2
1 1 NO 9.3 NO 9.3 0.0 switching YES 10.5 YES 10.5 1.2 1.2 100%TOTAL 0 0 1 100% 1 100%
1 2 switching YES 12.4 YES 12.4 3.1 NO 13.0 3.7 0.6 54%TOTAL 1 1 0 0% 0 0%
1 3 NO 9.3 NO 9.3 0.0 NO 9.3 NO 9.3 0.0 0.0 0%TOTAL 0 0 0 0% 0 0%
1 4 NO 9.3 NO 9.3 0.0 NO NO 9.3 0.0 0.0 0%TOTAL 0 0 0 0% 0 0%
1 5 NO 9.3 NO 9.3 0.0 switching YES 10.8 YES 10.8 1.5 1.5 100%TOTAL 0 0 1 100% 1 100%
1 6 NO 9.3 NO 9.3 0.0 NO NO 9.3 0.0 0.0 0%TOTAL 0 0 0 0% 0 0%
1 7 capacity "just in time" YES 12.7 YES 12.7 3.4 NO NO 12.7 3.4 0.0 0%TOTAL 1 1 0 0% 0 0%
1 8 NO 9.3 NO 9.3 0.0 NO NO 9.3 0.0 0.0 0%TOTAL 0 0 0 0% 0 0%
2 1 NO 9.3 NO 9.3 0.0 temp. abandonment YES 9.7 YES 11.3 2.0 2.0 100%capacity expansion YES 11.3 YES
TOTAL 0 0 2 100% 2 100%2 2 switching YES 12.3 YES 12.3 3.0 temp. abandonment YES 11.7 YES 13.2 3.9 0.9 57%
capacity expansion YES 11.6 YESTOTAL 1 1 2 67% 2 67%
2 3 switching YES 14.6 YES 14.6 5.3 capacity "just in time" YES 11.4 YES 14.6 5.3 0.0 50%TOTAL 1 1 1 50% 1 50%
2 4 NO 9.3 NO 9.3 0.0 temp. abandonment YES 10.5 YES 12.8 3.5 3.5 100%switching YES 12.8 YEScapacity reduction YES 0.0 NO
TOTAL 0 0 3 100% 2 100%2 5 NO 9.3 NO 9.3 0.0 switching YES 14.4 YES 14.4 5.1 5.1 100%
TOTAL 0 0 1 100% 1 100%2 6 NO 9.3 NO 9.3 0.0 temp.abandonment YES 12.0 YES 12.0 2.7 2.7 100%
TOTAL 0 0 1 100% 1 100%2 7 NO 9.3 NO 9.3 0.0 switching YES 12.5 YES 12.5 3.2 3.2 100%
TOTAL 0 0 1 100% 1 100%2 8 NO 9.3 NO 9.3 0.0 switching YES 9.3 NO 11.0 1.7 1.7 100%
capacity expansion YES 10.7 YEStemp. abandonment YES 10.1 YES
TOTAL 0 0 3 100% 2 100%3 1 NO 9.3 NO 9.3 0.0 phasing YES 12.3 YES 12.3 3.0 3.0 100%
TOTAL 0 0 1 100% 1 100%3 2 NO 9.3 NO 9.3 0.0 abandonment YES 10.2 YES 10.2 0.9 0.9 100%
TOTAL 0 0 1 100% 1 100%3 3 capacity reduction YES 11.3 YES 11.3 2.0 abandonment YES 10.9 YES 11.3 2.0 0.0 50%
TOTAL 1 1 1 50% 1 50%3 4 NO 9.3 NO 9.3 0.0 NO 9.3 NO 9.3 0.0 0.0 0%
TOTAL 0 0 0 0% 0 0%3 5 NO 9.3 NO 9.3 0.0 switching YES 14.7 YES 14.7 5.4 5.4 100%
TOTAL 0 0 1 100% 1 100%3 6 NO 9.3 NO 9.3 0.0 capacity "just in time" YES 11.0 YES 11.0 1.7 1.7 100%
TOTAL 0 0 1 100% 1 100%3 7 switching YES 13.2 YES 13.2 3.9 temp. abandonment YES 10.9 YES 13.2 3.9 0.0 50%
TOTAL 1 1 1 50% 1 50%3 8 NO 9.3 NO 9.3 0.0 NO 9.3 NO 9.3 0.0 0.0 0%
TOTAL 0 0 0 0% 0 0%4 1 NO 9.3 NO 9.3 0.0 capacity expansion YES 11.0 YES 13.0 3.7 3.7 100%
phasing/switching YES 12.6 YESTOTAL 0 0 2 100% 2 100%
4 2 NO 9.3 NO 9.3 0.0 phasing YES 9.3 NO 11.4 2.1 2.1 100%switching YES 11.4 YESabandonment YES 9.8 YES
TOTAL 0 0 3 100% 2 100%4 3 NO 9.3 NO 9.3 0.0 abandonment YES 12.2 YES 12.2 2.9 2.9 100%
TOTAL 0 0 1 0% 1 0%4 4 NO 9.3 NO 9.3 0.0 temp. abandonment YES 11.2 YES 11.4 2.1 2.1 100%
capacity expansion YES 11.4 YESswitching YES 9.3 NOphasing YES 11.1 YES
TOTAL 0 0 4 100% 3 100%4 5 perm. abandonment YES 10.2 YES 10.2 0.9 capacity "just in time" YES 11.0 YES 12.2 2.9 2.0 76%
TOTAL 1 1 1 50% 1 50%4 6 NO 9.3 NO 9.3 0.0 capacity expansion YES 11.2 YES 11.2 1.9 1.9 100%
phasing YES 11.1 YESTOTAL 0 0 2 100% 2 100%
4 7 NO 9.3 NO 9.3 0.0 switching YES 15.2 YES 16.0 6.7 6.7 100%phasing YES 12.2 YES
TOTAL 0 0 2 100% 2 100%4 8 NO 9.3 NO 9.3 0.0 capacity expansion YES 11.0 YES 14.6 5.3 5.3 100%
switching YES 14.6 YEStemp. abandonment YES 9.3 NO
TOTAL 0 0 3 100% 2 100%
Fig. 21 Dataset summary


