Embed Size (px)
Citation preview
ARTICLE IN PRESS
Deep-Sea Research II 55 (2008) 1348– 1359
Contents lists available at ScienceDirect
Deep-Sea Research II
0967-06
doi:10.1
� Corr
E-m
journal homepage: www.elsevier.com/locate/dsr2
Depth-stratified phytoplankton dynamics in Cyclone Opal, a subtropicalmesoscale eddy
Michael R. Landry a,�, Susan L. Brown b, Yoshimi M. Rii b, Karen E. Selph b, Robert R. Bidigare b,c,Eun Jin Yang d, Melinda P. Simmons e
a Scripps Institution of Oceanography, University of California at San Diego, La Jolla, CA 92093-0227, USAb Department of Oceanography, University of Hawaii at Manoa, Honolulu, HI 96822, USAc Hawaii Institute of Marine Biology, University of Hawaii at Manoa, Honolulu, HI 96822, USAd Marine Environment Research Department, Korea Ocean Research & Development Institute, Ansan P.O. Box 29, Seoul 425-600, South Koreae Gordon and Betty Moore Foundation, San Francisco, CA 94129-0910, USA
a r t i c l e i n f o
Article history:
Accepted 26 February 2008
As part of E-Flux III cruise studies in March 2005, we investigated phytoplankton community dynamics
in a cyclonic cold-core eddy (Cyclone Opal) in the lee of the Hawaiian Islands. Experimental incubations
Available online 5 May 2008Keywords:
Physical–biological coupling
Prochlorococcus
Diatom bloom
Microzooplankton grazing
Growth rate
45/$ - see front matter & 2008 Elsevier Ltd. A
016/j.dsr2.2008.02.001
esponding author. Tel.: +1858 534 4702; fax:
ail address: [email protected] (M.R. Landry)
a b s t r a c t
were conducted under in situ temperature and light conditions on a drift array using a two-treatment
dilution technique. Taxon-specific estimates of growth, grazing and production rates were obtained
from analyses of incubation results based on phytoplankton pigments, flow cytometry and microscopy.
Cyclone Opal was sampled at a biologically and physically mature state, with an 80–100 m doming of
isopycnal surfaces in its central region and a deep biomass maximum of large diatoms. Depth-profile
experimentation defined three main zones. The upper (mixed) zone (0–40 m), showed little
compositional or biomass response to eddy nutrient enrichment, but growth, grazing and production
rates were significantly enhanced in this layer relative to the ambient community outside of the eddy.
Prochlorococcus spp. dominated the upper mixed layer, accounting for 50–60% of its estimated primary
production both inside and outside of Opal. In contrast, the deep zone of 70–90 m showed little evidence
of growth rate enhancement and was principally defined by a �100-fold increase of large (420-mm)
diatoms and a shift from Prochlorococcus to diatom dominance (�80%) of production. The intermediate
layer of 50–60 m marked the transition between the upper and lower extremes but also contained an
elevated biomass of physiologically unhealthy diatoms with significantly depressed growth rates and
proportionately greater grazing losses relative to diatoms above or below. Microzooplankton grazers
consumed 58%, 65% and 55%, respectively, of the production of diatoms, Prochlorococcus and the total
phytoplankton community in Cyclone Opal. The substantial grazing impact on diatoms suggests that
efficient recycling was the major primary fate of diatom organic production, consistent with the low
export fluxes and selective export of biogenic silica, as empty diatom frustules, in Cyclone Opal.
& 2008 Elsevier Ltd. All rights reserved.
1. Introduction
Although general understanding of open-ocean biogeochem-istry and ecology has been greatly advanced by systematic studyover the past two decades, there are still major issues—e.g.,discrepancies in net system auto- or heterotrophy and nutrientsources for new production—that seem to defy explanation frommean system measurements (e.g., Michaels et al., 1996; McGilli-cuddy et al., 1998; Karl et al., 2003). Mesoscale eddies, as well aswaves and fronts of various kinds, have therefore emerged asmechanisms of interest for explaining pulsed nutrient delivery,
ll rights reserved.
+1858 534 6500.
.
cryptic production and flux anomalies at scales that are difficult toextract from classic sampling designs (e.g., McGillicuddy et al.,1999; Siegel et al., 1999; Sakamoto et al., 2004). Eddies, inparticular, are common and often long-lived features of oceancirculation with demonstrable, though highly variable, impacts onphytoplankton production, biomass and community structure(Allen et al., 1996; Froneman and Perissinotto, 1996; Tarran et al.,2001; Bidigare et al., 2003; Vaillancourt et al., 2003). Despitethese general findings, however, we know very little about theecology of eddies as perturbed ecosystems, or the comparativedynamics of component populations within their water columns.
The present study was designed to investigate the depth-stratified responses of a subtropical phytoplankton community tostrong nutrient perturbation in a cold-core, cyclonic eddy. Ineffect, the eddy was viewed as a large, relatively well-contained
ARTICLE IN PRESS
M.R. Landry et al. / Deep-Sea Research II 55 (2008) 1348–1359 1349
‘‘patch’’, not unlike those of open-ocean iron fertilization experi-ments (Coale et al., 1996; De Baar et al., 2005), except that thelimiting nutrients were different and delivered at depth ratherthan at the surface. In contrast to surface fertilizations, whichfocus entirely on mixed-layer community responses, deepnutrient delivery was expected to establish varying habitats inthe opposing gradients of light and nutrients that might selectdifferently for phytoplankton taxa according to their uniquepreferences and rate characteristics. The bottom layer was alsoof special biogeochemical interest since anticipated nutrientenhancements of community size structure and biomass deep inthe water column might reasonably translate to more efficientcarbon export than production at the surface. Whether this occursor not depends, however, on the coupling of production, grazingand remineralization processes (Landry et al., 2000b).
Our experiments were conducted in Cyclone Opal, a wind-forced, first-baroclinic mode, cold-core eddy that spun up in thelee of the Hawaiian Islands between the islands of Maui andHawaii and first appeared in satellite imagery on 18 February2005 (Benitez-Nelson et al., 2007; Dickey et al., 2008). At the timeof our study in March, Opal was a large mature feature ofapproximately 4–6 weeks age and 200–220 km diameter that wasmoving northeast to southwest at a mean translational speed of�8 km d�1. Isopycnal surfaces (sigma–t ¼ 24.1–24.4 kg m�3) in itscentral core region of �30-km diameter had been uplifted80–100 m relative to surrounding water (Nencioli et al., 2008),and the deep-euphotic zone was dominated by a bloom of largecentric diatoms (Brown et al., 2008; Rii et al., 2008). Cyclone Opal
therefore, represented, quite literally, a natural ‘‘bottom-up’’forcing of community structure and production of substantialmagnitude, and an excellent opportunity to compare the stimu-latory impact of the eddy on contrasting phytoplankton assem-blages in a stratified water column.
2. Materials and methods
2.1. In situ dilution experiments
In order to study the perturbation responses and dynamics ofthe microplankton community in Cyclone Opal under in situ
conditions of temperature and light, we designed and scaled ourexperiments so that they could be incubated attached to aweighted line hanging from a free-drifting surface float. For eacharray deployment, experimental incubations were conducted as adepth profile spanning the range of the euphotic zone (from 10 mto the depth representing an average of 0.5% of surface illumina-tion, as determined in daytime light profiles from a CTD-mountedPAR sensor; Rii et al., 2008). We conducted five sets of 24-hincubation experiments in the center region of Cyclone Opal (INstations) from 16 to 21 March 2005. For comparative purposes,three additional sets of experiments were conducted from 24 to26 March at ‘‘control’’ (OUT) stations far removed from the eddyinfluence.
The basic experimental design followed the two-treatmentdilution approach of Landry et al. (1984). For each set ofexperiments, we collected water at seven depths (from 10 to90–140 m) and prepared pairs of clear polycarbonate bottles (2.7or 2.2 L) with whole seawater (100%) and 37% whole seawater(diluted with 0.1-mm filtered seawater) at each depth. Seawaterwas filtered directly from the Niskin bottles using a peristalticpump, silicone tubing and an in-line Suporcap filter capsule thathad previously been acid washed (10% trace-metal grade HClfollowed by Milli-Q and seawater rinses). Dilution treatmentbottles received pre-measured volumes of filtered water fromthe collection depths, then both diluted and whole seawater
treatments were gently filled (silicone tubing below the waterlevel) with unscreened water from the Niskin bottles, alternatingflow into each bottle until they were both topped off at about thesame time. Each bottle was subsampled for flow cytometric (FCM)analysis to confirm initial concentrations and volume dilutions.The bottles were then tightly capped, placed in pairs into net bagsand clipped onto attached rings at the depth of collection on thearray line during deployment. For back-to-back array deploy-ments, we recovered the initial set of experiments first, placed thebottles and net bags in a dark, seawater-cooled deck incubator,and set-up and deployed the second set of experiments beforetaking final subsamples from the first set. All experiments werestarted in the early morning and deployed prior to sunrise, thetotal elapsed time from Niskin sampling to array deploymenttaking about 1.5 h.
Samples were taken for pigment, flow cytometry and micro-scopical analyses at the start and end of each experiment todetermine initial abundances and biomass concentrations forcomponent populations and to assess their rates of growth andgrazing losses in the dilution incubations. These analyses arefurther described below.
2.2. HPLC pigment analyses
Phytoplankton pigments were analyzed by high-performanceliquid chromatography (HPLC) according to the methods ofBidigare et al. (2005). Sample volumes of 1.7–2.1 L, dependingon other subsampling needs, were concentrated onto 25-mmWhatman GF/F glass fiber filters. The filters were wrapped inaluminum foil, frozen in liquid nitrogen and stored at �85 1C untilanalysis. Pigments were extracted in 3 mL of 100% acetone in thedark at 0 1C for 24 h. Canthaxanthin (50 mL in acetone) was addedas an internal standard in all samples. Prior to analysis, thepigment extracts were vortexed and centrifuged to removecellular debris.
Subsamples were injected into a Varian 9012 HPLC systemequipped with Varian 9300 autosampler, a Timberline columnheater (26 1C), and Spherisorb 5mm ODS2 analytical column(4.6�250 mm) and corresponding guard cartridge. Eluting peakswere monitored with a UV/vis absorption diode array detector(436 and 450 nm). Pigment identifications were based onabsorbance spectra, co-chromatography with standards andrelative retention time.
2.3. Community composition and biomass
FCM and microscopical assessments of microbial communityabundance and biomass were made as described by Brown et al.(2008). FCM analyses distinguished population abundances ofheterotrophic bacteria, photosynthetic bacteria (Prochlorococcus
and Synechococcus spp.) and photosynthetic eukaryotes. Epifluor-escence and inverted microscopy techniques were used to assessabundances, sizes and biovolumes of auto- and heterotrophicprotists.
FCM samples (1 mL) were preserved with paraformaldehyde(0.5% final concentration), flash frozen in liquid nitrogen and latertransferred to storage in a �85 1C freezer until analysis. Sampleswere thawed and stained with Hoechst 34442 (1mg mL�1, finalconcentration) for one hour at room temperature in the dark(Monger and Landry, 1993; Campbell and Vaulot, 1993). Internalstandards of auto-fluorescent polystyrene beads were added tonormalize scatter and fluorescence signals. Populations wereanalyzed with a Beckman–Coulter Altra flow cytometer equippedwith two argon ion lasers (1 W of 488 nm and 200 mW of UVexcitation). Scatter (side and forward), and fluorescence signals
ARTICLE IN PRESS
M.R. Landry et al. / Deep-Sea Research II 55 (2008) 1348–13591350
were collected using filters as appropriate, including those forHoechst-bound DNA, phycoerythrin and chlorophyll. Populationswere distinguished based on distinctive scatter and fluorescencesignals from listmode files (FCS 2.0 format, Expo32; Beckman–Coulter) using FlowJo software (Tree Star, Inc., www.flowjo.com).Carbon biomass estimates were computed from FCM measuredabundances using factors of 100 fg C cell�1 for Synechococcus and32 fg C cell�1 for Prochlorococcus in the upper euphotic zone(Landry and Kirchman, 2002), with up to a 2-fold increase in thelower euphotic zone in proportion to increasing side scatter.
Protists, including diatoms and other eukaryotic phytoplank-ton as well as non-pigmented single-cell heterotrophs (grazers),were enumerated microscopically by methods optimized fordifferent size classes and groups. Cells o10 mm were analyzedby epifluorescence microscopy (EPI at 400� ) on slides preparedwith paraformaldehyde-preserved samples (50 mL; 0.5% finalconcentration) filtered onto 0.8-mm black polycarbonate filters(Brown et al., 2003). Cells 410 mm also were analyzed by EPI(250� ) on 250-mL samples preserved according to Sherr andSherr (1993) and filtered onto 8.0-mm polycarbonate filters. Bothpreparations were stained with proflavin (0.33%) and the DNA-specific fluorochrome DAPI (50 mg mL�1). EPI slides were imagedand digitized on shipboard with an inverted Olympus IX71microscope and MacroFire color camera. Counting and sizingwas automated with ImagePro software, and length and widthmeasurements were converted to biovolumes by applying appro-priate geometric shapes. Cellular carbon estimates were calcu-lated from biovolumes according to Eppley et al. (1970).
Diatoms, ciliates and other 420-mm protists also wereenumerated and sized by bright-field inverted microscopy onsettled, acid Lugol’s preserved (1% final concentration) samples(Yang et al., 2004). For these analyses, biovolume-carbon conver-sions for diatoms and dinoflagellates were based on Menden-Deuer and Lessard (2000). Ciliate carbon estimates were based onVerity and Langdon (1984) and Putt and Stoecker (1989) forloricate and naked forms, respectively.
2.4. Growth, grazing and production estimates
Instantaneous rates of phytoplankton growth (m) and mortalitylosses (m) to microzooplankton grazing were estimated fromdilution incubations according to Landry et al. (1984). For theundiluted seawater treatment, the net rate of change (k) of anygiven measured parameter (pigment or FCM population) isk ¼ m–m. Assuming similar growth rate (m) in the dilutedtreatment, the net rate of change kd ¼ m–x�m, where ‘‘x’’ ¼ thefraction of natural grazer density in the dilute treatment (0.37 inthese experiments). From measured differences in the net rates ofpopulation change in the two treatments, the two equations weresolved for the two unknowns, m and m.
m ¼ ðkd � kÞ=ð1� xÞ and m ¼ kþm
Net growth rate estimates k exceeded kd on a few occasions inthese analyses, typically toward the base of the euphotic zonewhere the net rates and the population concentrations were bothlow and difficult to measure. For these results, m was set as themeasured rate of change in the undiluted bottle, which wasassumed to represent a minimal reliable estimate of m since itinvolved no experimental manipulation and had a highermeasurement signal than the dilute bottle. Using this alternativemeans of determining m introduced a very slight positive bias inthe mean estimates of growth rates (e.g., 0.009 d�1 for totalchlorophyll a). The lack of nutrient-added treatments in theexperimental design may also mean that the computed ratescould be underestimates. We, however, did not observe a
systematic bias in comparing the results from 2-bottle in situ
experiments to several full dilution experiments with nutrienttreatments (e.g., Landry et al., 1998) that were done on shipboard.
Experimental estimates of m and m were used to computecommunity and taxon-specific biomass rates of phytoplanktonproduction and grazing according to Landry et al. (2000b).Production estimates (mg C m�3 d�1) were calculated as
PP ¼ mnC0ðeðm�mÞt � 1Þ=ðm�mÞt
where C0 is initial biomass in mg C m�3 and t ¼ 1 day. Similarly,the biomass consumption of microzooplankton was computed as
PG ¼ mnC0ðeðm�mÞt � 1Þ=ðm�mÞt
From this, we estimated the biomass-specific ingestion rate ofmicrozooplankton feeding on phytoplankton (i.e., % body Cconsumed d�1) as PG�100/BH, where BH is the estimated carbonbiomass of heterotrophic protists (mg C m�3). Lastly, we deter-mined the biomass-specific clearance rate of heterotrophicprotists (volume cleared mg C�1 d�1) as m�BH
�1. Statistical testsof rate differences from the experiments were made by thenon-parametric Mann–Whitney U test, double-sided (Tate andClelland, 1957).
3. Results
3.1. Community rate profiles
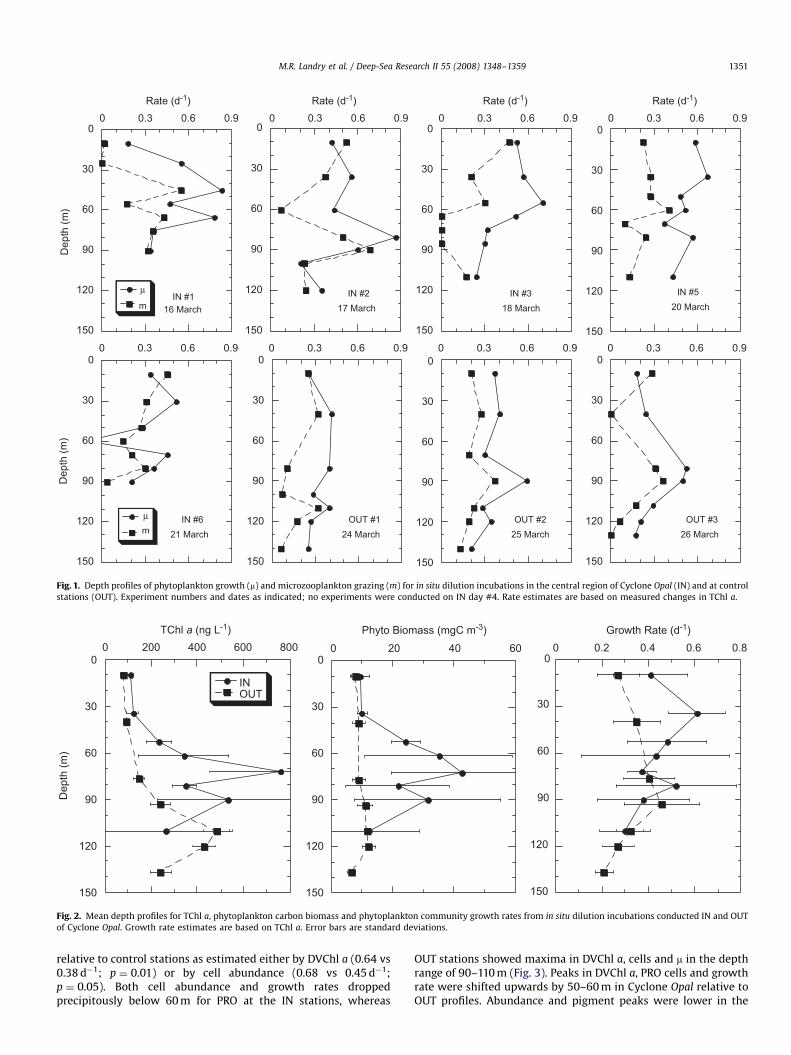
Community growth and grazing estimates from total chlor-ophyll a (TChl a) were quite variable within and betweenexperimental incubations (Fig. 1). Mean coefficients of variability(CV) were lower for OUT station estimates compared to INstations (e.g., CV ¼ 28% vs 40% for all experiments within depthrange averages of Fig. 2), and OUT stations were more coherent interms of mean estimates and pattern (e.g., m maxima in the lowereuphotic zone). Nonetheless, 4 of 5 IN profiles showed mid-euphotic zone minima in growth rates around 60 m. For both INand OUT profiles, growth was generally in excess of grazing in themid-euphotic zone with occasional balances in near-surface anddeep incubations (Fig. 1).
Because of the variability in individual profiles, the differencesamong IN and OUT stations are more fruitfully explored asaverages. In Fig. 2, for example, mean characteristics divide theeuphotic zone into upper and lower regions. The upper zoneincludes experiments conducted at 10 and 30–40 m, roughlydefining the surface mixed layer. There were slight IN–OUTdifferences in TChl a and phytoplankton biomass in this upperlayer, but growth rates were substantially and significantlyelevated at the IN stations (0.51 vs 0.31 d�1; 0.01opo0.05). Incontrast, growth rates showed little difference between IN andOUT profiles in the lower layer (50–110 m), whereas phytoplank-ton carbon and TChl a were both strongly elevated in the eddy.
3.2. Taxon-specific growth rates
Euphotic zone differences in growth versus biomass effects forthe phytoplankton community (Fig. 2) also extend to many of thecomponent populations. The photosynthetic bacterium Prochlor-
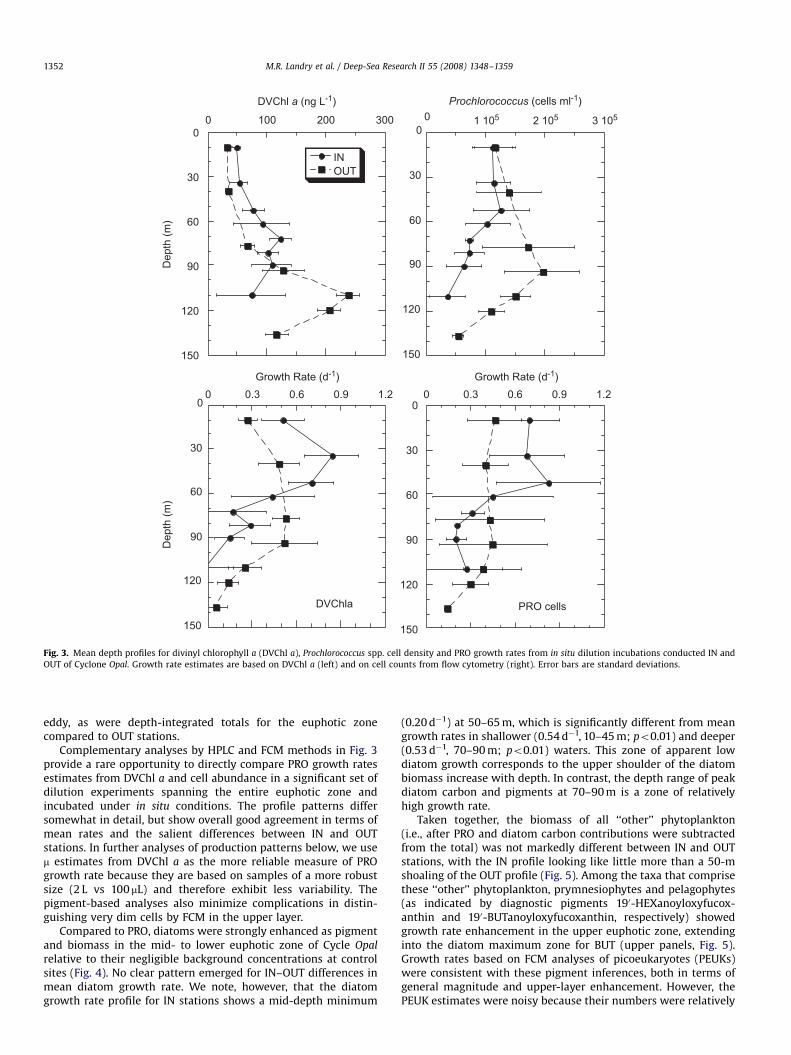
ococcus (PRO), for instance, showed an inconsistent biomassresponse in the upper 40 m, with cell abundance slightly lowerand divinyl chlorophyll a (DVChl a, a diagnostic pigment of PRO)slightly higher at IN versus OUT stations (Fig. 3). These differencessuggest an increase in cellular chlorophyll content at the INstations, one potential indicator of enhanced physiological state.As a further indication of physiological enhancement, growthrates (m) were clearly elevated within this upper zone in the eddy
ARTICLE IN PRESS
00
30
60
90
120
150
µ
m
Rate (d-1) Rate (d-1) Rate (d-1)
Dep
th (m
)
IN #116 March
0
30
60
90
120
150
IN #217 March
0
30
60
90
120
150
IN #318 March
0
30
60
90
120
150
µm
Dep
th (m
)
IN #621 March
0
30
60
90
120
150
OUT #124 March
0
30
60
90
120
150
OUT #225 March
0
30
60
90
120
150
IN #520 March
0
30
60
90
120
150
OUT #326 March
0.3 0.6 0.9 0 0.3 0.6 0.9 0 0.3 0.6 0.9Rate (d-1)
0 0.3 0.6 0.9
0 0.3 0.6 0.9 0 0.3 0.6 0.9 0 0.3 0.6 0.9 0 0.3 0.6 0.9
Fig. 1. Depth profiles of phytoplankton growth (m) and microzooplankton grazing (m) for in situ dilution incubations in the central region of Cyclone Opal (IN) and at control
stations (OUT). Experiment numbers and dates as indicated; no experiments were conducted on IN day #4. Rate estimates are based on measured changes in TChl a.
00
30
60
90
120
150
TChl a (ng L-1)
INOUT
Dep
th (m
)
00
30
60
90
120
150
Phyto Biomass (mgC m-3)0
0
30
60
90
120
150
Growth Rate (d-1)200 400 600 800 20 40 60 0.2 0.4 0.6 0.8
Fig. 2. Mean depth profiles for TChl a, phytoplankton carbon biomass and phytoplankton community growth rates from in situ dilution incubations conducted IN and OUT
of Cyclone Opal. Growth rate estimates are based on TChl a. Error bars are standard deviations.
M.R. Landry et al. / Deep-Sea Research II 55 (2008) 1348–1359 1351
relative to control stations as estimated either by DVChl a (0.64 vs0.38 d�1; p ¼ 0.01) or by cell abundance (0.68 vs 0.45 d�1;p ¼ 0.05). Both cell abundance and growth rates droppedprecipitously below 60 m for PRO at the IN stations, whereas
OUT stations showed maxima in DVChl a, cells and m in the depthrange of 90–110 m (Fig. 3). Peaks in DVChl a, PRO cells and growthrate were shifted upwards by 50–60 m in Cyclone Opal relative toOUT profiles. Abundance and pigment peaks were lower in the
ARTICLE IN PRESS
00
30
60
90
120
150
DVChl a (ng L-1)
INOUT
Dep
th (m
)
0 2 105 3 105
0
30
60
90
120
150
Prochlorococcus (cells ml-1)
00
30
60
90
120
150
Growth Rate (d-1)
Dep
th (m
)
DVChla
0
30
60
90
120
150
Growth Rate (d-1)
PRO cells
100 200 300 1 105
0.3 0.6 0.9 1.20 0.3 0.6 0.9 1.2
Fig. 3. Mean depth profiles for divinyl chlorophyll a (DVChl a), Prochlorococcus spp. cell density and PRO growth rates from in situ dilution incubations conducted IN and
OUT of Cyclone Opal. Growth rate estimates are based on DVChl a (left) and on cell counts from flow cytometry (right). Error bars are standard deviations.
M.R. Landry et al. / Deep-Sea Research II 55 (2008) 1348–13591352
eddy, as were depth-integrated totals for the euphotic zonecompared to OUT stations.
Complementary analyses by HPLC and FCM methods in Fig. 3provide a rare opportunity to directly compare PRO growth ratesestimates from DVChl a and cell abundance in a significant set ofdilution experiments spanning the entire euphotic zone andincubated under in situ conditions. The profile patterns differsomewhat in detail, but show overall good agreement in terms ofmean rates and the salient differences between IN and OUTstations. In further analyses of production patterns below, we usem estimates from DVChl a as the more reliable measure of PROgrowth rate because they are based on samples of a more robustsize (2 L vs 100 mL) and therefore exhibit less variability. Thepigment-based analyses also minimize complications in distin-guishing very dim cells by FCM in the upper layer.
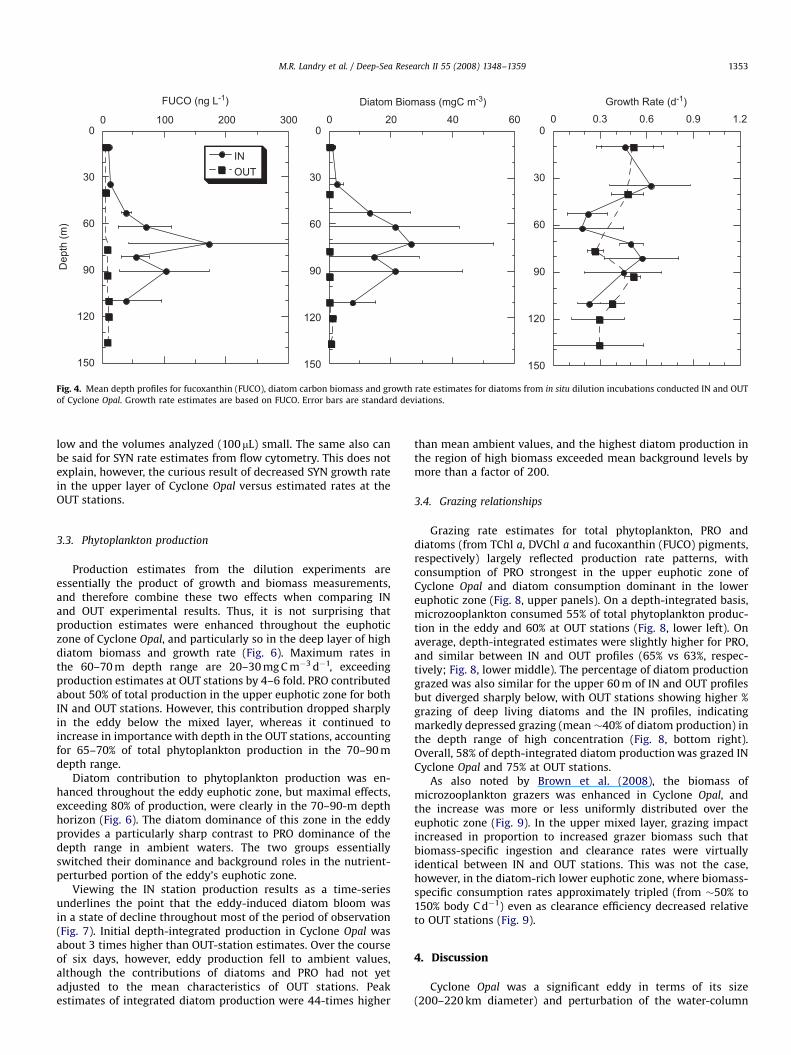
Compared to PRO, diatoms were strongly enhanced as pigmentand biomass in the mid- to lower euphotic zone of Cycle Opal
relative to their negligible background concentrations at controlsites (Fig. 4). No clear pattern emerged for IN–OUT differences inmean diatom growth rate. We note, however, that the diatomgrowth rate profile for IN stations shows a mid-depth minimum
(0.20 d�1) at 50–65 m, which is significantly different from meangrowth rates in shallower (0.54 d�1, 10–45 m; po0.01) and deeper(0.53 d�1, 70–90 m; po0.01) waters. This zone of apparent lowdiatom growth corresponds to the upper shoulder of the diatombiomass increase with depth. In contrast, the depth range of peakdiatom carbon and pigments at 70–90 m is a zone of relativelyhigh growth rate.
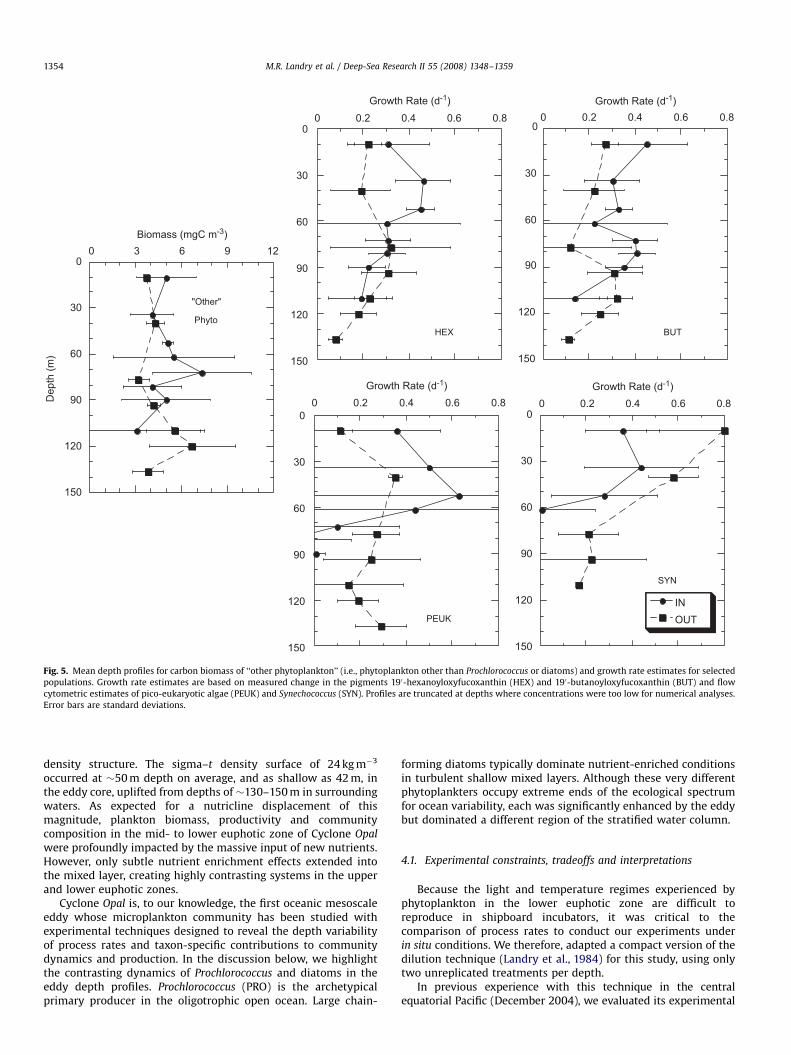
Taken together, the biomass of all ‘‘other’’ phytoplankton(i.e., after PRO and diatom carbon contributions were subtractedfrom the total) was not markedly different between IN and OUTstations, with the IN profile looking like little more than a 50-mshoaling of the OUT profile (Fig. 5). Among the taxa that comprisethese ‘‘other’’ phytoplankton, prymnesiophytes and pelagophytes(as indicated by diagnostic pigments 190-HEXanoyloxyfucox-anthin and 190-BUTanoyloxyfucoxanthin, respectively) showedgrowth rate enhancement in the upper euphotic zone, extendinginto the diatom maximum zone for BUT (upper panels, Fig. 5).Growth rates based on FCM analyses of picoeukaryotes (PEUKs)were consistent with these pigment inferences, both in terms ofgeneral magnitude and upper-layer enhancement. However, thePEUK estimates were noisy because their numbers were relatively
ARTICLE IN PRESS
00
30
60
90
120
150
FUCO (ng L-1)
INOUT
Dep
th (m
)
00
30
60
90
120
150
Diatom Biomass (mgC m-3)0
0
30
60
90
120
150
Growth Rate (d-1)
100 200 300 20 40 60 0.3 0.6 0.9 1.2
Fig. 4. Mean depth profiles for fucoxanthin (FUCO), diatom carbon biomass and growth rate estimates for diatoms from in situ dilution incubations conducted IN and OUT
of Cyclone Opal. Growth rate estimates are based on FUCO. Error bars are standard deviations.
M.R. Landry et al. / Deep-Sea Research II 55 (2008) 1348–1359 1353
low and the volumes analyzed (100 mL) small. The same also canbe said for SYN rate estimates from flow cytometry. This does notexplain, however, the curious result of decreased SYN growth ratein the upper layer of Cyclone Opal versus estimated rates at theOUT stations.
3.3. Phytoplankton production
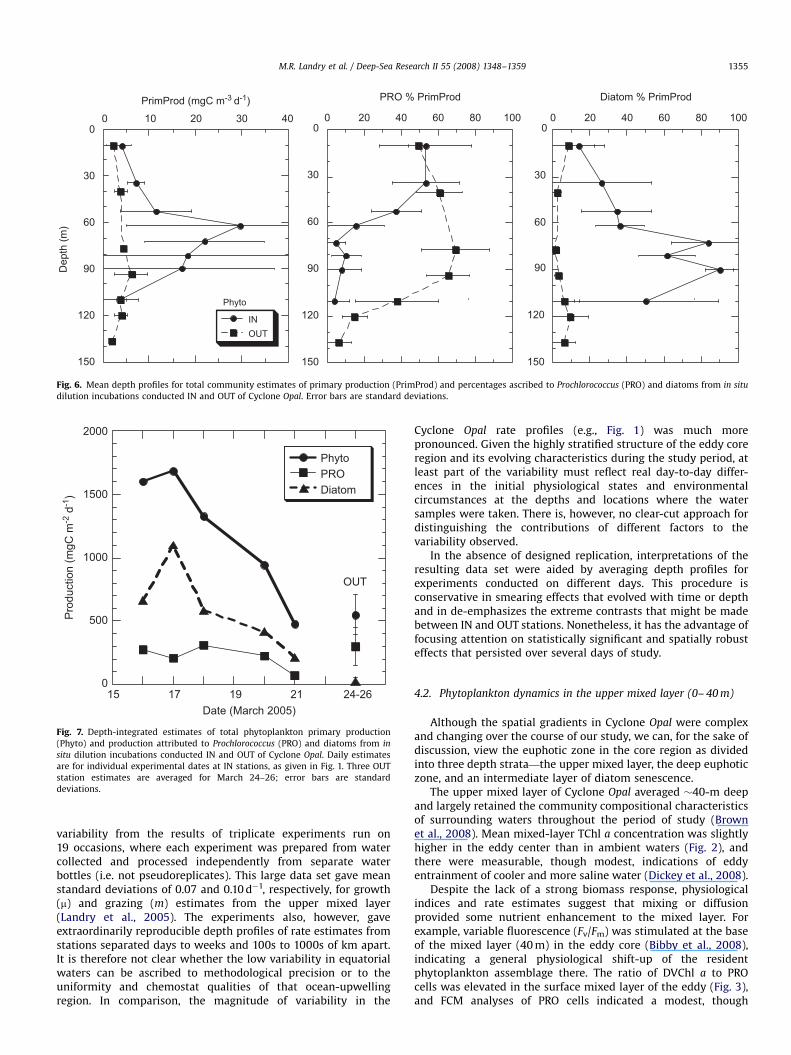
Production estimates from the dilution experiments areessentially the product of growth and biomass measurements,and therefore combine these two effects when comparing INand OUT experimental results. Thus, it is not surprising thatproduction estimates were enhanced throughout the euphoticzone of Cyclone Opal, and particularly so in the deep layer of highdiatom biomass and growth rate (Fig. 6). Maximum rates inthe 60–70 m depth range are 20–30 mg C m�3 d�1, exceedingproduction estimates at OUT stations by 4–6 fold. PRO contributedabout 50% of total production in the upper euphotic zone for bothIN and OUT stations. However, this contribution dropped sharplyin the eddy below the mixed layer, whereas it continued toincrease in importance with depth in the OUT stations, accountingfor 65–70% of total phytoplankton production in the 70–90 mdepth range.
Diatom contribution to phytoplankton production was en-hanced throughout the eddy euphotic zone, but maximal effects,exceeding 80% of production, were clearly in the 70–90-m depthhorizon (Fig. 6). The diatom dominance of this zone in the eddyprovides a particularly sharp contrast to PRO dominance of thedepth range in ambient waters. The two groups essentiallyswitched their dominance and background roles in the nutrient-perturbed portion of the eddy’s euphotic zone.
Viewing the IN station production results as a time-seriesunderlines the point that the eddy-induced diatom bloom wasin a state of decline throughout most of the period of observation(Fig. 7). Initial depth-integrated production in Cyclone Opal wasabout 3 times higher than OUT-station estimates. Over the courseof six days, however, eddy production fell to ambient values,although the contributions of diatoms and PRO had not yetadjusted to the mean characteristics of OUT stations. Peakestimates of integrated diatom production were 44-times higher
than mean ambient values, and the highest diatom production inthe region of high biomass exceeded mean background levels bymore than a factor of 200.
3.4. Grazing relationships
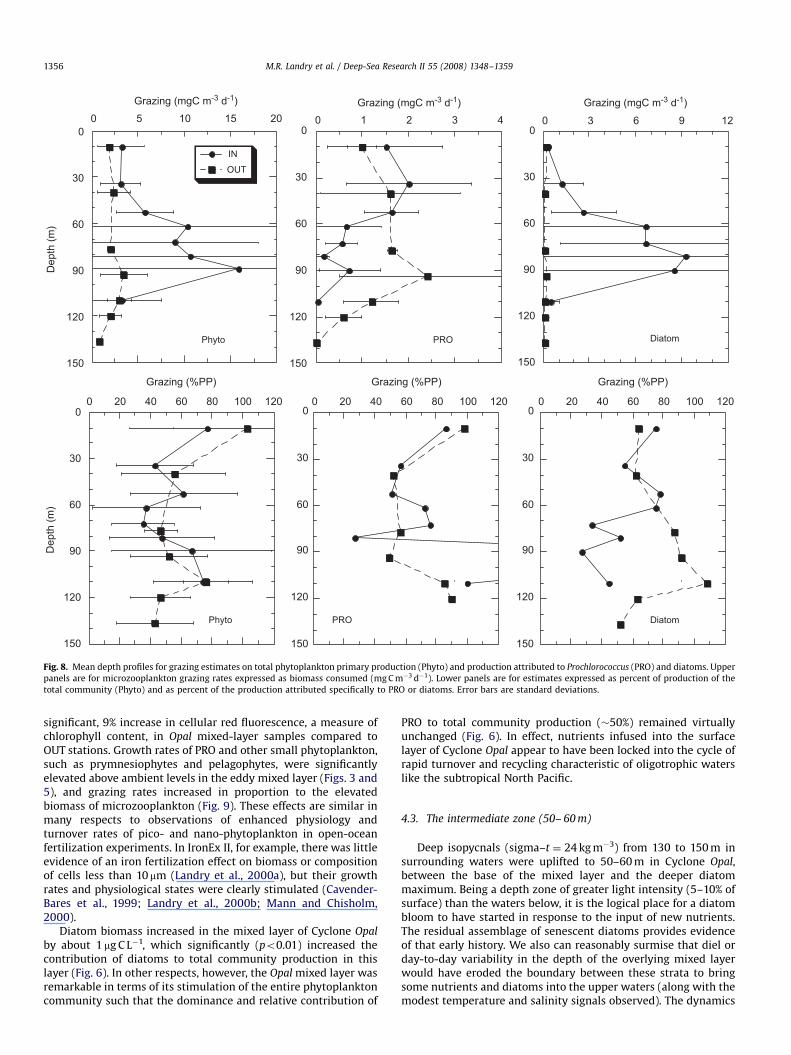
Grazing rate estimates for total phytoplankton, PRO anddiatoms (from TChl a, DVChl a and fucoxanthin (FUCO) pigments,respectively) largely reflected production rate patterns, withconsumption of PRO strongest in the upper euphotic zone ofCyclone Opal and diatom consumption dominant in the lowereuphotic zone (Fig. 8, upper panels). On a depth-integrated basis,microzooplankton consumed 55% of total phytoplankton produc-tion in the eddy and 60% at OUT stations (Fig. 8, lower left). Onaverage, depth-integrated estimates were slightly higher for PRO,and similar between IN and OUT profiles (65% vs 63%, respec-tively; Fig. 8, lower middle). The percentage of diatom productiongrazed was also similar for the upper 60 m of IN and OUT profilesbut diverged sharply below, with OUT stations showing higher %grazing of deep living diatoms and the IN profiles, indicatingmarkedly depressed grazing (mean �40% of diatom production) inthe depth range of high concentration (Fig. 8, bottom right).Overall, 58% of depth-integrated diatom production was grazed INCyclone Opal and 75% at OUT stations.
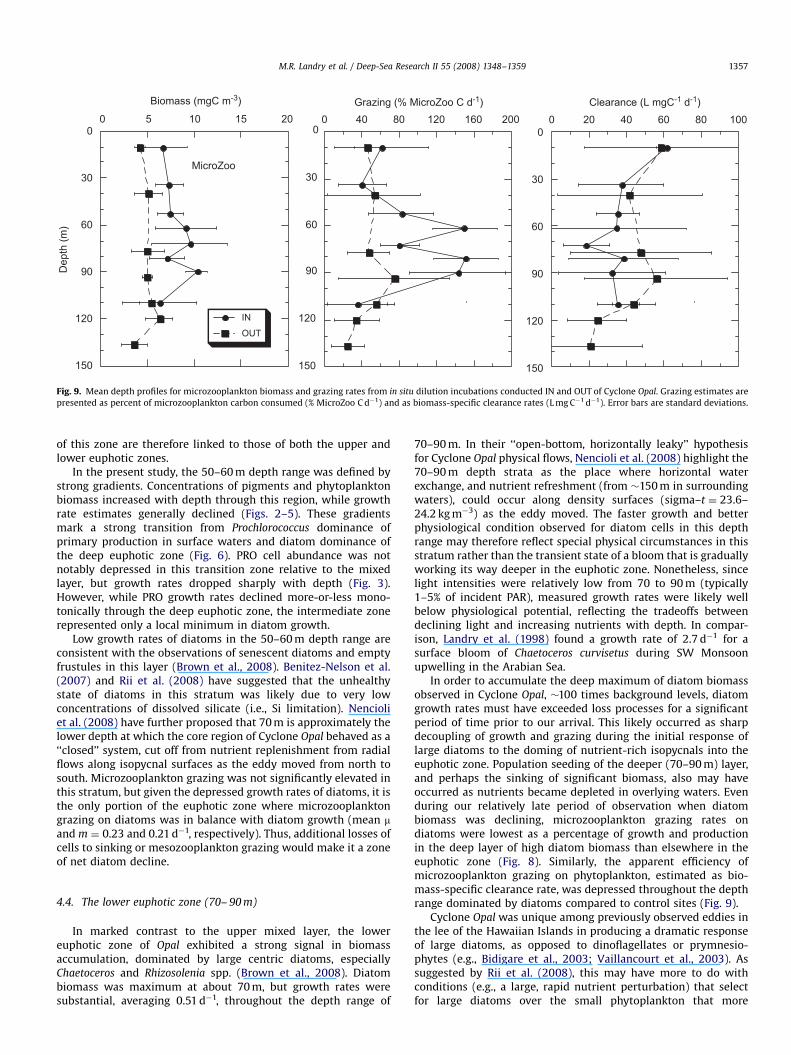
As also noted by Brown et al. (2008), the biomass ofmicrozooplankton grazers was enhanced in Cyclone Opal, andthe increase was more or less uniformly distributed over theeuphotic zone (Fig. 9). In the upper mixed layer, grazing impactincreased in proportion to increased grazer biomass such thatbiomass-specific ingestion and clearance rates were virtuallyidentical between IN and OUT stations. This was not the case,however, in the diatom-rich lower euphotic zone, where biomass-specific consumption rates approximately tripled (from �50% to150% body C d�1) even as clearance efficiency decreased relativeto OUT stations (Fig. 9).
4. Discussion
Cyclone Opal was a significant eddy in terms of its size(200–220 km diameter) and perturbation of the water-column
ARTICLE IN PRESS
00
30
60
90
120
150
Biomass (mgC m-3)
Dep
th (m
)
"Other"
Phyto
00
30
60
90
120
150
HEX
Growth Rate (d-1)0
0
30
60
90
120
150
BUT
Growth Rate (d-1)
00
30
60
90
120
150
SYN
INOUT
Growth Rate (d-1)0
0
30
60
90
120
150
PEUK
Growth Rate (d-1)
3 6 9 12
0.2 0.4 0.6 0.8
0.2 0.4 0.6 0.8 0.2 0.4 0.6 0.8
0.2 0.4 0.6 0.8
Fig. 5. Mean depth profiles for carbon biomass of ‘‘other phytoplankton’’ (i.e., phytoplankton other than Prochlorococcus or diatoms) and growth rate estimates for selected
populations. Growth rate estimates are based on measured change in the pigments 190-hexanoyloxyfucoxanthin (HEX) and 190-butanoyloxyfucoxanthin (BUT) and flow
cytometric estimates of pico-eukaryotic algae (PEUK) and Synechococcus (SYN). Profiles are truncated at depths where concentrations were too low for numerical analyses.
Error bars are standard deviations.
M.R. Landry et al. / Deep-Sea Research II 55 (2008) 1348–13591354
density structure. The sigma–t density surface of 24 kg m�3
occurred at �50 m depth on average, and as shallow as 42 m, inthe eddy core, uplifted from depths of �130–150 m in surroundingwaters. As expected for a nutricline displacement of thismagnitude, plankton biomass, productivity and communitycomposition in the mid- to lower euphotic zone of Cyclone Opal
were profoundly impacted by the massive input of new nutrients.However, only subtle nutrient enrichment effects extended intothe mixed layer, creating highly contrasting systems in the upperand lower euphotic zones.
Cyclone Opal is, to our knowledge, the first oceanic mesoscaleeddy whose microplankton community has been studied withexperimental techniques designed to reveal the depth variabilityof process rates and taxon-specific contributions to communitydynamics and production. In the discussion below, we highlightthe contrasting dynamics of Prochlorococcus and diatoms in theeddy depth profiles. Prochlorococcus (PRO) is the archetypicalprimary producer in the oligotrophic open ocean. Large chain-
forming diatoms typically dominate nutrient-enriched conditionsin turbulent shallow mixed layers. Although these very differentphytoplankters occupy extreme ends of the ecological spectrumfor ocean variability, each was significantly enhanced by the eddybut dominated a different region of the stratified water column.
4.1. Experimental constraints, tradeoffs and interpretations
Because the light and temperature regimes experienced byphytoplankton in the lower euphotic zone are difficult toreproduce in shipboard incubators, it was critical to thecomparison of process rates to conduct our experiments underin situ conditions. We therefore, adapted a compact version of thedilution technique (Landry et al., 1984) for this study, using onlytwo unreplicated treatments per depth.
In previous experience with this technique in the centralequatorial Pacific (December 2004), we evaluated its experimental
ARTICLE IN PRESS
00
30
60
90
120
150
PrimProd (mgC m-3 d-1)
INOUT
Dep
th (m
)
Phyto
00
30
60
90
120
150
PRO % PrimProd
00
30
60
90
120
150
Diatom % PrimProd
10 20 30 40 20 40 60 80 100 20 40 60 80 100
Fig. 6. Mean depth profiles for total community estimates of primary production (PrimProd) and percentages ascribed to Prochlorococcus (PRO) and diatoms from in situ
dilution incubations conducted IN and OUT of Cyclone Opal. Error bars are standard deviations.
0
500
1000
1500
2000
15
PhytoPRODiatom
Pro
duct
ion
(mgC
m-2
d-1
)
Date (March 2005)
OUT
24-26211917
Fig. 7. Depth-integrated estimates of total phytoplankton primary production
(Phyto) and production attributed to Prochlorococcus (PRO) and diatoms from in
situ dilution incubations conducted IN and OUT of Cyclone Opal. Daily estimates
are for individual experimental dates at IN stations, as given in Fig. 1. Three OUT
station estimates are averaged for March 24–26; error bars are standard
deviations.
M.R. Landry et al. / Deep-Sea Research II 55 (2008) 1348–1359 1355
variability from the results of triplicate experiments run on19 occasions, where each experiment was prepared from watercollected and processed independently from separate waterbottles (i.e. not pseudoreplicates). This large data set gave meanstandard deviations of 0.07 and 0.10 d�1, respectively, for growth(m) and grazing (m) estimates from the upper mixed layer(Landry et al., 2005). The experiments also, however, gaveextraordinarily reproducible depth profiles of rate estimates fromstations separated days to weeks and 100s to 1000s of km apart.It is therefore not clear whether the low variability in equatorialwaters can be ascribed to methodological precision or to theuniformity and chemostat qualities of that ocean-upwellingregion. In comparison, the magnitude of variability in the
Cyclone Opal rate profiles (e.g., Fig. 1) was much morepronounced. Given the highly stratified structure of the eddy coreregion and its evolving characteristics during the study period, atleast part of the variability must reflect real day-to-day differ-ences in the initial physiological states and environmentalcircumstances at the depths and locations where the watersamples were taken. There is, however, no clear-cut approach fordistinguishing the contributions of different factors to thevariability observed.
In the absence of designed replication, interpretations of theresulting data set were aided by averaging depth profiles forexperiments conducted on different days. This procedure isconservative in smearing effects that evolved with time or depthand in de-emphasizes the extreme contrasts that might be madebetween IN and OUT stations. Nonetheless, it has the advantage offocusing attention on statistically significant and spatially robusteffects that persisted over several days of study.
4.2. Phytoplankton dynamics in the upper mixed layer (0– 40 m)
Although the spatial gradients in Cyclone Opal were complexand changing over the course of our study, we can, for the sake ofdiscussion, view the euphotic zone in the core region as dividedinto three depth strata—the upper mixed layer, the deep euphoticzone, and an intermediate layer of diatom senescence.
The upper mixed layer of Cyclone Opal averaged �40-m deepand largely retained the community compositional characteristicsof surrounding waters throughout the period of study (Brownet al., 2008). Mean mixed-layer TChl a concentration was slightlyhigher in the eddy center than in ambient waters (Fig. 2), andthere were measurable, though modest, indications of eddyentrainment of cooler and more saline water (Dickey et al., 2008).
Despite the lack of a strong biomass response, physiologicalindices and rate estimates suggest that mixing or diffusionprovided some nutrient enhancement to the mixed layer. Forexample, variable fluorescence (Fv/Fm) was stimulated at the baseof the mixed layer (40 m) in the eddy core (Bibby et al., 2008),indicating a general physiological shift-up of the residentphytoplankton assemblage there. The ratio of DVChl a to PROcells was elevated in the surface mixed layer of the eddy (Fig. 3),and FCM analyses of PRO cells indicated a modest, though
ARTICLE IN PRESS
00
30
60
90
120
150
Grazing (mgC m-3 d-1)
IN
OUT
Dep
th (m
)
Phyto
00
30
60
90
120
150
Grazing (mgC m-3 d-1) Grazing (mgC m-3 d-1)
PRO
00
30
60
90
120
150
Diatom
00
30
60
90
120
150
Grazing (%PP)
Dep
th (m
)
Phyto
0
30
60
90
120
150
PRO
0
30
60
90
120
150
Diatom
5 10 15 20 1 2 3 4 3 6 9 12
20 40 60 80 100 120 0
Grazing (%PP)
20 40 60 80 100 120 0
Grazing (%PP)
20 40 60 80 100 120
Fig. 8. Mean depth profiles for grazing estimates on total phytoplankton primary production (Phyto) and production attributed to Prochlorococcus (PRO) and diatoms. Upper
panels are for microzooplankton grazing rates expressed as biomass consumed (mg C m�3 d�1). Lower panels are for estimates expressed as percent of production of the
total community (Phyto) and as percent of the production attributed specifically to PRO or diatoms. Error bars are standard deviations.
M.R. Landry et al. / Deep-Sea Research II 55 (2008) 1348–13591356
significant, 9% increase in cellular red fluorescence, a measure ofchlorophyll content, in Opal mixed-layer samples compared toOUT stations. Growth rates of PRO and other small phytoplankton,such as prymnesiophytes and pelagophytes, were significantlyelevated above ambient levels in the eddy mixed layer (Figs. 3 and5), and grazing rates increased in proportion to the elevatedbiomass of microzooplankton (Fig. 9). These effects are similar inmany respects to observations of enhanced physiology andturnover rates of pico- and nano-phytoplankton in open-oceanfertilization experiments. In IronEx II, for example, there was littleevidence of an iron fertilization effect on biomass or compositionof cells less than 10 mm (Landry et al., 2000a), but their growthrates and physiological states were clearly stimulated (Cavender-Bares et al., 1999; Landry et al., 2000b; Mann and Chisholm,2000).
Diatom biomass increased in the mixed layer of Cyclone Opal
by about 1 mg C L�1, which significantly (po0.01) increased thecontribution of diatoms to total community production in thislayer (Fig. 6). In other respects, however, the Opal mixed layer wasremarkable in terms of its stimulation of the entire phytoplanktoncommunity such that the dominance and relative contribution of
PRO to total community production (�50%) remained virtuallyunchanged (Fig. 6). In effect, nutrients infused into the surfacelayer of Cyclone Opal appear to have been locked into the cycle ofrapid turnover and recycling characteristic of oligotrophic waterslike the subtropical North Pacific.
4.3. The intermediate zone (50– 60 m)
Deep isopycnals (sigma–t ¼ 24 kg m�3) from 130 to 150 m insurrounding waters were uplifted to 50–60 m in Cyclone Opal,between the base of the mixed layer and the deeper diatommaximum. Being a depth zone of greater light intensity (5–10% ofsurface) than the waters below, it is the logical place for a diatombloom to have started in response to the input of new nutrients.The residual assemblage of senescent diatoms provides evidenceof that early history. We also can reasonably surmise that diel orday-to-day variability in the depth of the overlying mixed layerwould have eroded the boundary between these strata to bringsome nutrients and diatoms into the upper waters (along with themodest temperature and salinity signals observed). The dynamics
ARTICLE IN PRESS
00
30
60
90
120
150
Biomass (mgC m-3)
IN
OUT
Dep
th (m
)
MicroZoo
00
30
60
90
120
150
Grazing (% MicroZoo C d-1)0
0
30
60
90
120
150
Clearance (L mgC-1 d-1)5 10 15 20 40 80 120 160 200 20 40 60 80 100
Fig. 9. Mean depth profiles for microzooplankton biomass and grazing rates from in situ dilution incubations conducted IN and OUT of Cyclone Opal. Grazing estimates are
presented as percent of microzooplankton carbon consumed (% MicroZoo C d�1) and as biomass-specific clearance rates (L mg C�1 d�1). Error bars are standard deviations.
M.R. Landry et al. / Deep-Sea Research II 55 (2008) 1348–1359 1357
of this zone are therefore linked to those of both the upper andlower euphotic zones.
In the present study, the 50–60 m depth range was defined bystrong gradients. Concentrations of pigments and phytoplanktonbiomass increased with depth through this region, while growthrate estimates generally declined (Figs. 2–5). These gradientsmark a strong transition from Prochlorococcus dominance ofprimary production in surface waters and diatom dominance ofthe deep euphotic zone (Fig. 6). PRO cell abundance was notnotably depressed in this transition zone relative to the mixedlayer, but growth rates dropped sharply with depth (Fig. 3).However, while PRO growth rates declined more-or-less mono-tonically through the deep euphotic zone, the intermediate zonerepresented only a local minimum in diatom growth.
Low growth rates of diatoms in the 50–60 m depth range areconsistent with the observations of senescent diatoms and emptyfrustules in this layer (Brown et al., 2008). Benitez-Nelson et al.(2007) and Rii et al. (2008) have suggested that the unhealthystate of diatoms in this stratum was likely due to very lowconcentrations of dissolved silicate (i.e., Si limitation). Nencioliet al. (2008) have further proposed that 70 m is approximately thelower depth at which the core region of Cyclone Opal behaved as a‘‘closed’’ system, cut off from nutrient replenishment from radialflows along isopycnal surfaces as the eddy moved from north tosouth. Microzooplankton grazing was not significantly elevated inthis stratum, but given the depressed growth rates of diatoms, it isthe only portion of the euphotic zone where microzooplanktongrazing on diatoms was in balance with diatom growth (mean mand m ¼ 0.23 and 0.21 d�1, respectively). Thus, additional losses ofcells to sinking or mesozooplankton grazing would make it a zoneof net diatom decline.
4.4. The lower euphotic zone (70– 90 m)
In marked contrast to the upper mixed layer, the lowereuphotic zone of Opal exhibited a strong signal in biomassaccumulation, dominated by large centric diatoms, especiallyChaetoceros and Rhizosolenia spp. (Brown et al., 2008). Diatombiomass was maximum at about 70 m, but growth rates weresubstantial, averaging 0.51 d�1, throughout the depth range of
70–90 m. In their ‘‘open-bottom, horizontally leaky’’ hypothesisfor Cyclone Opal physical flows, Nencioli et al. (2008) highlight the70–90 m depth strata as the place where horizontal waterexchange, and nutrient refreshment (from �150 m in surroundingwaters), could occur along density surfaces (sigma–t ¼ 23.6–24.2 kg m�3) as the eddy moved. The faster growth and betterphysiological condition observed for diatom cells in this depthrange may therefore reflect special physical circumstances in thisstratum rather than the transient state of a bloom that is graduallyworking its way deeper in the euphotic zone. Nonetheless, sincelight intensities were relatively low from 70 to 90 m (typically1–5% of incident PAR), measured growth rates were likely wellbelow physiological potential, reflecting the tradeoffs betweendeclining light and increasing nutrients with depth. In compar-ison, Landry et al. (1998) found a growth rate of 2.7 d�1 for asurface bloom of Chaetoceros curvisetus during SW Monsoonupwelling in the Arabian Sea.
In order to accumulate the deep maximum of diatom biomassobserved in Cyclone Opal, �100 times background levels, diatomgrowth rates must have exceeded loss processes for a significantperiod of time prior to our arrival. This likely occurred as sharpdecoupling of growth and grazing during the initial response oflarge diatoms to the doming of nutrient-rich isopycnals into theeuphotic zone. Population seeding of the deeper (70–90 m) layer,and perhaps the sinking of significant biomass, also may haveoccurred as nutrients became depleted in overlying waters. Evenduring our relatively late period of observation when diatombiomass was declining, microzooplankton grazing rates ondiatoms were lowest as a percentage of growth and productionin the deep layer of high diatom biomass than elsewhere in theeuphotic zone (Fig. 8). Similarly, the apparent efficiency ofmicrozooplankton grazing on phytoplankton, estimated as bio-mass-specific clearance rate, was depressed throughout the depthrange dominated by diatoms compared to control sites (Fig. 9).
Cyclone Opal was unique among previously observed eddies inthe lee of the Hawaiian Islands in producing a dramatic responseof large diatoms, as opposed to dinoflagellates or prymnesio-phytes (e.g., Bidigare et al., 2003; Vaillancourt et al., 2003). Assuggested by Rii et al. (2008), this may have more to do withconditions (e.g., a large, rapid nutrient perturbation) that selectfor large diatoms over the small phytoplankton that more
ARTICLE IN PRESS
M.R. Landry et al. / Deep-Sea Research II 55 (2008) 1348–13591358
typically characterize the oligotrophic open ocean. The phyto-plankton dynamics of Hawaiian lee cyclones may therefore be setby spin-up conditions rather than following a fixed pattern ofsuccession defined by eddy age (Sweeney et al., 2003). The presentresults are relevant to this discussion because they show two verydistinct community responses existing at the same time in thesame eddy separated by only 30 m of water column.
4.5. Microzooplankton grazing and the fate of diatom production
Microzooplankton consumed 55% of total phytoplanktonproduction in Cyclone Opal and 59% at control (OUT) stations.Both estimates are low compared to the global average of grazingimpact from dilution experiments (67% of PP), and the mean foropen-ocean tropical systems (75% of PP; Calbet and Landry, 2004).It is significant, however, that grazing pressure was similar inmagnitude for large diatoms (58% of PP) as for the wholephytoplankton community and not very different, as a proportionof PP consumed, between IN and OUT stations. The relative role ofmicrozooplankton in the trophic ecology in Cyclone Opal wastherefore surprisingly similar to adjacent subtropical waters.Diatom growth was, however, more decoupled from grazing inthe deeper euphotic zone of Opal, with microzooplanktonconsuming only �40% of production at depths X70 m (Fig. 8).The higher water-column average included the substantialbiomass of slower-growing diatoms at 50–60 m (Fig. 4), wheremean growth and grazing rates were in reasonable balance (0.23versus 0.21 d�1).
Large (450mm) ciliates and dinoflagellates, the most likelyprotistan grazers of diatoms, were �3-times higher than ambientbiomass levels in the diatom-enriched regions of Cyclone Opal
(Brown et al., 2008). Such consumers capture and process theirfood as individual prey items and produce individual emptyfrustules as a by-product of grazing (Jacobson and Anderson,1993; Jeong et al., 2004). Their particulate egesta have thereforequite different implications for organic export of diatom produc-tion compared to alternative loss processes, such as the largeorganically dense fecal pellets of metazooplankton grazers or themass settling of intact cells as aggregates (e.g., Sarthou et al.,2005). The comparable grazing impacts of microzooplankton inOpal and ambient waters suggest that, even in its perturbed state,the eddy remained a system in which tight trophic coupling andefficient recycling may have suppressed export. As noted byBenitez-Nelson et al. (2007), this interpretation is consistent withlack of a strong export signal from the eddy as measured by 234Thand sediment trap methods, with the disproportionate export ofbiogenic silica as intact empty diatom frustules in sediment traps(Rii et al., 2008), and with the large accumulation of dissolvedorganic carbon in the deep euphotic zone. Since microzooplank-ton grazing does not account for all of the production measured inour experiments, or explain the substantial decline in diatomstanding stocks that was observed during our study (Fig. 7), wecannot exclude the possibility that more cryptic processes such asviral infection or autolysis (Brussard et al., 1997) may havecontributed to the bloom decline and thus also to more efficientrecycling within the eddy. However, if such processes dominated,significant net positive growth would not have been observed inour incubation bottles.
High microzooplankton grazing on diatoms is not a uniquefeature of Cyclone Opal. Comparable results (450% of diatomproduction or more) have been reported for diatom-favorableconditions such as SW Monsoon upwelling in the Arabian Sea(Brown et al., 2002), the iron-stimulated phytoplankton bloom ofIronEx II (Landry et al., 2000a, b) and retreating ice-edge blooms ofthe Antarctic Polar Front (Landry et al., 2002). Microzooplankton
protists as major grazers of diatom production therefore may bemore a general characteristic of open-ocean ecosystems than anovel result of this study. The difference in Cyclone Opal is thepresence of a significant biomass of large diatoms relatively deepin the euphotic zone. Whereas the vacant frustules of smalldiatoms may typically remain in suspension in well-mixed surfacelayers and be remineralized and reutilized in place (Bidle andAzam, 1999; Brzezinski et al., 2001), the frustules from Opal weresufficiently large and spatially detached from the mixed layer tomake their way into sediment traps at 150 m largely devoid ofaccompanying organic material (Rii et al., 2008). Assuming thatdissolved silicate ultimately serves as constraint to diatomproduction, the selective export of particulate biogenic silicagreatly diminishes the amount of organic matter that a systemsuch as Opal can export.
5. Conclusion
Experimental studies of microplankton community growthand grazing interactions in Cyclone Opal revealed both a richspatial complexity to the community response and unexpectedimplications for the coupling of rate processes. Hawaiian wind-generated, first-baroclinic mode eddies such as Cyclone Opal canclearly stimulate growth and production of dominant members ofthe ambient subtropical phytoplankton as well as large exoticdiatoms. These results are consistent with the hypothesis that therates and magnitudes of new nutrient delivery to the euphoticzone have more effect on the resulting community response thanthe chronological age or phase of an eddy (Rii et al., 2008). WithinCyclone Opal, alternative community responses co-existed in timeas spatially separated zones of the same water column. Thus, onecan imagine a spectrum of intermediate growth conditions thatwould select for other taxa, irrespective of eddy age. Althoughprotistan microzooplankton are known to graze heavily ondiatoms under certain conditions, their implied ability to causeinefficient export from a substantial accumulated biomass of largediatoms deep in the euphotic zone was an unexpected outcome ofthis study. We advance strong grazing coupling as a hypotheticalexplanation for the low export measured from Cyclone Opal, but afull understanding of the fate of production in Cyclone Opal needsto account for the observed rates of population decline, measuredgrowth rates and grazing contributions of micro- and mesozoo-plankton, direct sinking, and potential losses to lateral exchange.
Acknowledgments
This study was supported by NSF Grants 0241897 and 0324666and by the Post-doctoral Fellowship Program of Korea Science &Engineering Foundation (KOSEF). We gratefully acknowledge thecaptain and crew of the R.V. Wecoma, and all of the E-Flux IIIshipmates and colleagues whose efforts facilitated and contri-buted to our results.
References
Allen, C.B., Kanda, J., Laws, E.A., 1996. New production and photosynthetic rateswithin and outside a cyclonic mesoscale eddy in the North Pacific SubtropicalGyre. Deep-Sea Research I 43, 917–936.
Benitez-Nelson, C., Bidigare, R.R., Dickey, T.D., Landry, M.R., Leonard, C.L.,Brown, S.L., Nencioli, F., Rii, Y.M., Maiti, K., Becker, J.W., Bibby, T.S., Black, W.,Cai, W.J., Carlson, C., Chen, F.Z., Kuwahara, V.S., Mahaffey, C., McAndrew, P.M.,Quay, P.D., Rappe, M., Selph, K.E., Simmons, M.P., Yang, E.J., 2007. Mesoscaleeddies drive increased silica export in the subtropical Pacific Ocean. Science316, 1017–1021.
Bibby, T.S., Gorbunov, M.Y., Wyman, K.W., Falkowski, P.G., Brown, S.L., Rii, Y.M.,Bidigare, R.R., 2008. Photosynthetic community responses to upwelling
ARTICLE IN PRESS
M.R. Landry et al. / Deep-Sea Research II 55 (2008) 1348–1359 1359
mesoscale eddies in the subtropical north Atlantic and Pacific Oceans. Deep-Sea Research Part II, this volume [doi:10.1016/j.dsr2.2008.01.014].
Bidigare, R.R., Benitez-Nelson, C., Leonard, C.L., Quay, P.D., Parsons, M.L., Foley, D.G.,Seki, M.P., 2003. Influence of a cyclonic eddy on microheterotroph biomassand carbon export in the lee of Hawaii. Geophysical Research Letters 30,51–54.
Bidigare, R.R., Van Heukelem, L., Trees, C., 2005. Analysis of algal pigments by high-performance liquid chromatography. In: Andersen, R. (Ed.), Algal CulturingTechniques. Academic Press, New York, pp. 327–345.
Bidle, K.D., Azam, F., 1999. Accelerated dissolution of diatom silica by marinebacterial assemblages. Nature 397, 508–512.
Brown, S.L., Landry, M.R., Christensen, S., Garrison, D., Gowing, M.M., Bidigare, R.R.,Campbell, L., 2002. Taxon-specific community dynamics and production in theArabian Sea during the 1995 monsoon seasons. Deep-Sea Research II 49,2345–2376.
Brown, S.L., Landry, M.R., Neveux, J., Dupouy, C., 2003. Microbial communityabundance and biomass along a 1801 transect in the equatorial Pacific duringan El Nino-Southern Oscillation cold phase. Journal of Geophysical Research108, 8139.
Brown, S.L., Landry, M.R., Selph, K.E., Yang, E.J., Rii, Y.M., Bidigare, R.R., 2008.Diatoms in the desert: plankton community response to a subtropicalmesoscale eddy in the subtropical North Pacific. Deep-Sea Research Part II,this volume [doi:10.1016/j.dsr2.2008.02.012].
Brussard, C.P.D., Noordeloos, A.A.M., Riegman, R., 1997. Autolysis kinetics of themarine diatom Ditylum brightwellii (Bacillariophyceae) under nitrogen andphosphorus limitation. Journal of Phycology 33, 980–987.
Brzezinski, M.A., Nelson, D.M., Franck, V.M., Sigmon, D.E., 2001. Silicon dynamicswithin an intense open-ocean diatom bloom in the Pacific sector of theSouthern Ocean. Deep-Sea Research II 48, 3997–4018.
Calbet, A., Landry, M.R., 2004. Phytoplankton growth, microzooplankton grazingand carbon cycling in marine systems. Limnology and Oceanography 49,51–57.
Campbell, L., Vaulot, D., 1993. Photosynthetic picoplankton community structurein the subtropical North Pacific Ocean near Hawaii (station ALOHA). Deep-SeaResearch Part I 40, 2043–2060.
Cavender-Bares, K.K., Mann, E.L., Chisholm, S.W., Ondrusek, M.E., Bidigare, R.R.,1999. Differential response of equatorial Pacific phytoplankton to ironfertilization. Limnology and Oceanography 44, 237–246.
Coale, K.H., Johnson, K.S., Fitzwater, S.E., Gordon, R.M., Tanner, S., Chavez, F.P.,Ferioli, L., Sakamoto, C., Rogers, P., Millero, F., Steinberg, P., Nightingale, P.,Cooper, D., Cochlan, W.P., Landry, M.R., Constantinou, J., Rollwagen, G.,Trasvina, A., Kudela, R., 1996. A massive phytoplankton bloom induced by anecosystem-scale iron fertilization experiment in the equatorial Pacific Ocean.Nature 383, 495–501.
De Baar, H.J.W., Boyd, P.W., Coale, K.H., Landry, M.R., Tsuda, A., Assmy, P.,Bakker, D.C.E., Bozec, Y., Barber, R.T., Brzezinski, M.A., Buesseler, K.O.,Boye, M., Croot, P.L., Gervais, F., Gorbunov, M.Y., Harrison, P.J., Hiscock, W.T.,Laan, P., Lancelot, C., Law, C.S., Levasseur, M., Marchetti, A., Millero, F.J.,Nishioka, J., Nojiri, Y., van Oijen, T., Riebesell, U., Rijkenberg, M.J.A., Saito, H.,Takeda, S., Timmermans, K.R., Veldhuis, M.J.W., Waite, A.M., Wong, C.-S., 2005.Synthesis of 8 iron fertilization experiments: from the iron age in the age ofenlightenment. Journal of Geophysical Research 110, C09S16.
Dickey, T., Nencioli, F., Kuwahara, V., Leonard, C., Black, W., Bidigare, R., Rii, Y.,Zhang, Q., 2008. Physical and bio-optical observations of oceanic cyclones westof the island of Hawaii. Deep-Sea Research Part II, this volume [doi:10.1016/j.dsr2.2008.01.006].
Eppley, R.W., Reid, F.M.H., Strickland, J.D.H., 1970. Estimates of phytoplanktoncrop size, growth rate, and primary production. In: Strickland, H.J.D. (Ed.),The Ecology of the Plankton off La Jolla California in the Period Aprilthrough September 1967, vol. 17. Bull. Scripps Institution of Oceanography,pp. 33–42.
Froneman, P.W., Perissinotto, R., 1996. Structure and grazing of the microzoo-plankton communities of the Subtropical Convergence and a warm-core eddyin the Atlantic sector of the Southern Ocean. Marine Ecology Progress Series135, 237–245.
Jacobson, D.M., Anderson, D.M., 1993. Growth and grazing rates of Protoperidiniumhirobis Abe, a thecate heterotrophic dinoflagellate. Journal of PlanktonResearch 15, 723–736.
Jeong, H.J., Yoo, Y.D., Kim, E.T., Kang, N.S., 2004. Feeding by the heterotrophicdinoflagellate Protoperidinium bipes on the diatom Skeletonema costatum.Aquatic Microbial Ecology 36, 171–179.
Karl, D.M., Laws, E.A., Morris, P., Williams, P.J.L., Emerson, S., 2003. Metabolicbalance of the open sea. Nature 426, 32.
Landry, M.R., Kirchman, D.L., 2002. Microbial community structure and variabilityin the tropical Pacific. Deep-Sea Research II 49, 2669–2694.
Landry, M.R., Haas, L.W., Fagerness, V.L., 1984. Dynamics of microplanktoncommunities: experiments in Kaneohe Bay, Hawaii. Marine Ecology ProgressSeries 16, 127–133.
Landry, M.R., Brown, S.L., Campbell, L., Constantinou, J., Liu, H., 1998. Spatialpatterns in phytoplankton growth and microzooplankton grazing in theArabian Sea during monsoon forcing. Deep-Sea Research II 45, 2353–2368.
Landry, M.R., Ondrusek, M.E., Tanner, S.J., Brown, S.L., Constantinou, J., Bidigare,R.R., Coale, K.H., Fitzwater, S., 2000a. Biological response to iron fertilization inthe eastern equatorial Pacific (IronEx II): I. Microplankton communityabundances and biomass. Marine Ecology Progress Series 201, 27–42.
Landry, M.R., Constantinou, J., Latasa, M., Brown, S.L., Bidigare, R.R., Ondrusek, M.E.,2000b. Biological response to iron fertilization in the eastern equatorial Pacific(IronEx II). III: dynamics of phytoplankton growth and microzooplanktongrazing. Marine Ecology Progress Series 201, 57–72.
Landry, M.R., Selph, K.E., Brown, S.L., Abbott, M.R., Measures, C.I., Vink, S., Allen,C.B., Calbet, A., Christensen, S., Nolla, H., 2002. Seasonal dynamics ofphytoplankton in the Antarctic Polar Front region at 1701W. Deep-Sea ResearchII 49, 1843–1865.
Landry, M.R., Yang, E.J., Selph, K.E., Hodges, M., Bidigare, R.R., 2005. Depth-resolvedmicroplankton dynamics in the equatorial Pacific. ASLO Meeting, Santiago deCompostela, Spain, June 2005.
Mann, E.L., Chisholm, S.W., 2000. Iron limits the cell division rate of Prochlorococcusin the Eastern Equatorial Pacific. Limnology and Oceanography 45, 1067–1076.
McGillicuddy Jr., D.J., Robinson, A.R., Siegel, D.A., Jannasch, H.W., Johnson, R.,Dickey, T.D., McNeil, J., Michaels, A.F., Knap, A.H., 1998. Influence of mesoscaleeddies on new production in the Sargasso Sea. Nature 394, 263–266.
McGillicuddy Jr., D.J., Johnson, R., Siegel, D.A., Michaels, A.F., Bates, N.R., Knap, A.H.,1999. Mesoscale variations of biogeochemical properties in the Sargasso Sea.Journal of Geophysical Research 104, 13381–13394.
Menden-Deuer, S., Lessard, E.J., 2000. Carbon to volume relationships fordinoflagellates, diatoms, and other protist plankton. Limnology and Oceano-graphy 45, 569–579.
Michaels, A.F., Olson, D., Sarmiento, J.L., Ammerman, J.W., Fanning, K., Jahnke, R.,Knap, A.H., Lipschultz, F., Prospero, J.M., 1996. Inputs, losses and transforma-tions of nitrogen and phosphorus in the pelagic North Atlantic Ocean.Biogeochemistry 35, 181–226.
Monger, B.C., Landry, M.R., 1993. Flow cytometric analysis of marine bacteria withHoechst 33342. Applied and Environmental Microbiology 59, 905–911.
Nencioli, F., Dickey, T.D., Kuwahara, V.S., Black, W., Rii, Y.M., Bidigare, R.R., 2008.Physical dynamics and biological implications of a mesoscale cyclonic eddy inthe lee of Hawaii: Cyclone Opal observations during E-Flux III. Deep-SeaResearch Part II, this volume [doi:10.1016/j.dsr2.2008.02.003].
Putt, M., Stoecker, D., 1989. An experimentally determined carbon:volume ratio formarine ‘‘oligotrichus’’ ciliates from estuarine and coastal waters. Limnologyand Oceanography 34, 1097–1103.
Rii, Y.M., Brown, S.L., Nencioli, F., Kuwahara, V., Dickey, T., Karl, D.M., Bidigare, R.R.,2008. The transient oasis: nutrient–phytoplankton dynamics and particleexport in Hawaiian lee cyclones. Deep-Sea Research Part II, this volume[doi:10.1016/j.dsr2.2008.01.013].
Sakamoto, C.M., Karl, D.M., Jannasch, H.W., Bidigare, R.R., Letelier, R.M., Walz, P.M.,Ryan, J.P., Polito, P.S., Johnson, K.S., 2004. Influence of Rossby waves on nutrientdynamics and the plankton community structure in the North PacificSubtropical Gyre. Journal of Geophysical Research 109, C05032.
Sarthou, G., Timmermans, K.R., Blain, S., Treguer, P., 2005. Growth physiology andfate of diatoms in the ocean: a review. Journal of Sea Research 53, 25–42.
Sherr, E.B., Sherr, B.F., 1993. Preservation and storage of samples for enumeration ofheterotrophic protists. In: Kemp, P., Sherr, E., Sherr, B., Cole, J. (Eds.), Handbookof Methods in Aquatic Microbial Ecology. Lewis Publishers, Boca Raton, FL,pp. 207–212.
Siegel, D.A., McGillicuddy Jr., D.J., Fields, E.A., 1999. Mesoscale eddies, satellitealtimetry, and new production in the Sargasso Sea. Journal of GeophysicalResearch 104, 13359–13379.
Sweeney, E.N., McGillicuddy, D.J., Buesseler, K.O., 2003. Biogeochemical impacts dueto mesoscale eddy activity in the Sargasso Sea as measured at the BermudaAtlantic Time-series Study (BATS). Deep-Sea Research Part II 50, 3017–3039.
Tarran, G.A., Zubkov, M.V., Sleigh, M.A., Burkill, P.H., Yallop, M., 2001. Microbialcommunity structure and standing stocks in the NE Atlantic in June and July of1996. Deep-Sea Research II 48, 963–985.
Tate, M.W., Clelland, R.C., 1957. Nonparametric and Shortcut Statistics in the Social,Biological, and Medical Sciences. Interstate Printers and Publishers, Inc.,Danville, IL.
Vaillancourt, R.D., Marra, J., Seki, M.P., Parsons, M.L., Bidigare, R.R., 2003. Impact ofa cyclonic eddy on phytoplankton community structure and photosyntheticcompetency in the subtropical North Pacific Ocean. Deep-Sea Research Part I50, 829–847.
Verity, P., Langdon, C., 1984. Relationships between lorica volume, carbon, nitrogen,and ATP content of tintinnids in Narragansett Bay. Journal of Plankton Research66, 859–868.
Yang, E.J., Choi, J.K., Hyun, J.-H., 2004. Distribution and structure of heterotrophicprotist communities in the northeast equatorial Pacific Ocean. Marine Biology146, 1–15.


