Embed Size (px)
Citation preview
0
Department of Homeland Security U.S. Citizenship & Immigration Services
Small Entity Analysis for the U.S. Citizenship and Immigration Services Fee Schedule Final Rule
July 22, 2020
AILA Doc. No. 20073100. (Posted 8/4/20)
1
Table of Contents Table of Contents .......................................................................................................................................... 1
Forms I-129, I-140, I-910, and I-360 ........................................................................................................ 3
Forms I-924, G-1041 and G-1041A .......................................................................................................... 5
a. Petition for a Nonimmigrant Worker, Form I-129 Data ....................................................................... 5
Research Population and Sampling Statistics ........................................................................................... 5
Discussion of Impacts ............................................................................................................................... 9
Issues with Data ...................................................................................................................................... 11
b. Immigrant Petition for Alien Worker, Form I-140 Data ..................................................................... 11
Research Population and Sampling Statistics ......................................................................................... 11
Discussion of Impacts ............................................................................................................................. 15
Issues with Data ...................................................................................................................................... 15
Small Entity Classifications of Form I-129 and Form I-140 ...................................................................... 15
Cumulative Impact of Form I-129 and Form I-140 .................................................................................... 16
c. Civil Surgeon Designations, Form I-910 Data .................................................................................... 17
Research Population and Sampling Statistics ......................................................................................... 17
Discussion of Impacts ............................................................................................................................. 20
d. Petition for Amerasian, Widow(er), or Special Immigrant, Form I-360 ............................................. 21
Research Population and Sampling Statistics ......................................................................................... 21
Discussion of Impacts ............................................................................................................................. 24
e. Genealogy Requests, Form G-1041 (Index Search Request) and Form G-1041A (Record Request) 25
f. Regional Center Designation Under the Immigrant Investor Program, Form I-924 and I-924A ....... 26
Discussion of Impacts ............................................................................................................................. 27
Appendix A: SBA NAICS Size Standards for I-129, I-140, I-910 and I-360 Petitions in Sample Dataset .................................................................................................................................................................... 30
Appendix B: Form I-129 Sample with Petition Totals .............................................................................. 40
Appendix C: Form I-140 Sample with Petition Totals .............................................................................. 46
Appendix D: Form I-910 Sample with Petition Totals .............................................................................. 51
Appendix E: Form I-360 Sample with Petition Totals ............................................................................... 54
AILA Doc. No. 20073100. (Posted 8/4/20)
2
Introduction
The Department of Homeland Security’s (DHS) U.S. Citizenship and Immigration Services (USCIS), as a U.S. Government agency primarily funded by user fees, periodically revisits whether its fees are adequate to appropriately fund its operations. In advance of a revision to the fees it levies, USCIS has reviewed the fees that would potentially affect small entities as defined by the U.S. Small Business Administration (SBA) guidelines and in accordance with the Regulatory Flexibility Act (RFA).
The term small entity means a small business, small organization, or small governmental jurisdiction.1 The term “small business” has the same meaning as the term “small business concern” under section 3 of the Small Business Act, unless an agency, after consulting with the SBA’s Office of Advocacy and after opportunity for public comment, establishes one or more definitions of such term which are appropriate to the activities of the agency and publishes such definition(s) in the Federal Register.2 In addition:
• A “small business”: o is organized for profit, o has a place of business in the United States, o operates primarily within the United States or makes a significant contribution to
the U.S. economy through payment of taxes or use of American products, materials, or labor,
o is independently owned and operated, and o is not dominant in its field on a national basis.3
• A “small organization” is any not-for-profit enterprise that is independently owned and
operated and not dominant in its field, unless an agency establishes, after opportunity for public comment, one or more definitions of such term which are appropriate to the activities of the agency and publishes such definition(s) in the Federal Register.4
• A “small governmental jurisdiction” includes governments of cities, counties, towns, townships, villages, school districts, or special districts, with a population of less than 50,000, unless an agency establishes, after opportunity for public comment, one or more definitions of such term which are appropriate to the activities of the agency and which are based on such factors as location in rural or sparsely populated areas or limited revenues due to the population of such jurisdiction, and publishes such definition(s) in the Federal Register.5
1 The RFA in a Nutshell, page 18: https://www.sba.gov/sites/default/files/advocacy/RFA_in_a_Nutshell2010.pdf. 2 Ibid. 3 SBA small entity definition: The U.S. Small Business Administration operates in accordance with Public Law 85-536, called the "Small Business Act," (SBA) to help protect the interests of small businesses, strengthen the economy, and preserve free enterprise. The definition of a small business is available at https://www.sba.gov/content/am-i-small-business-concern. 4 The RFA in a Nutshell, p. 18. 5 Ibid.
AILA Doc. No. 20073100. (Posted 8/4/20)
3
According to SBA, for most industries a small business may be defined either in terms of the average number of employees over the past 12 months or the average annual receipts over the past 3 years.6
A majority of immigration benefit requests are submitted by individuals who do not meet
the definition of “entity” under SBA rules. Entities affected by this rule are those that file and pay fees for certain immigration benefit requests on behalf of a foreign national. The petitions or applications filed by entities include the following:
a. Petition for a Nonimmigrant Worker, Form I-129 – authorizes foreign workers for
temporary employment, services, or to receive training in the United States. b. Immigrant Petition for Alien Worker, Form I-140 – authorizes foreign workers to
become permanent residents in the United States. c. Application for Civil Surgeon Designation, Form I-910 – authorizes physicians to
become designated providers of medical exams for individuals in the United States applying for immigration benefits with DHS.
d. Petition for Amerasian, Widow(er), or Special Immigrant, Form I-360 – authorizes foreign workers for full time employment by a bona fide nonprofit religious organization in the United States.
e. Genealogy Requests, Form G-1041 (Index Search Request) and Form G-1041A (Record Request).
f. Application for Regional Center Designation Under the Immigrant Investor Program, Form I-9247 – authorizes designation as a Regional Center under the Immigrant Investor Program.
The goal of this review was to analyze the economic impact of fee changes by DHS on small entities. The forms mentioned above represent those entities that petition or file on behalf of individuals and therefore, were the focus of this analysis. Form I-129 and Form I-140 comprised the vast majority of the petitions applicable to this study. DHS also analyzed Forms I-910, I-360, G-1041, G-1041A, and I-924. Sources and Sample Methodology
Forms I-129, I-140, I-910, and I-360
DHS obtained petitioner data filed for Forms I-129, I-140, I-910, and I-360 from internal databases for fiscal year 2017 (FY 2017), spanning from October 1, 2016 to September 31, 2017.8 This petitioner data included the employer firm name, city, state, ZIP code, employer identification number (EIN)9, number/type of filing, and petitioner or beneficiary name.
6 SBA has developed size standards to carry out the purposes of the Small Business Act and those size standards can be found in 13 CFR 121.201. 7 Supplemental Form I-924A, Annual Certification of Regional Center, is discussed further in this section also. 8 Source: DHS, USCIS, Office of Performance and Quality. 9 An Employer Identification Number (EIN) is a nine-digit number that U.S. Internal Revenue Service assigns in the following format: XX-XXXXXXX. It is used to identify the tax accounts of employers. Employer Identification Number, p 2. https://www.irs.gov/pub/irs-pdf/p1635.pdf.
AILA Doc. No. 20073100. (Posted 8/4/20)
4
DHS devised a methodology to conduct the small entity analysis based on a
representative sample10 of the potentially impacted population. To create and test a sample, DHS followed this approach for each benefit request type:
• DHS aggregated a working database for each form type comprised of receipts from
FY 2017. • DHS identified unique EINs submitted with petitions and unique petitioner names
from petitions that did not include an EIN. • DHS used this list of unique identifiers as the population from which the sample was
taken. DHS determined the sample size using a standard statistical formula of the population total for each form type with a 95 percent confidence level and a 5 percent confidence interval.11
• DHS selected a random sample from the population by assigning a randomly generated identification (ID) number to each record.
• DHS then sorted the population so the entities with the smallest random ID numbers were selected as sample entities.
Filing data did not include information needed to classify the entity according to size
standards, such as revenue or number of employees, so DHS used third party sources to obtain this information. For the analysis of the effects on Forms I-129, I-140, I-910 and I-360, DHS used several data sources to capture information on the characteristics of entities required to pay these fees.
• Hoover’s online database of U.S. entities, a subscription service of Dun & Bradstreet http://www.hoovers.com/
• Open-access (free) databases of public and private entities http://www.cortera.com/ http://www.manta.com/ http://www.guidestar.org/
From these sources, DHS determined the North American Industry Classification System (NAICS) code,12 revenue, and employee count for each entity in the sample. A list of NAICS codes for each entity matched in Forms I-129, I-140, I-910 and I-360 can be found in Appendix A, along with the SBA threshold for each industry cluster.13 In order to determine an entity’s size, DHS first classified each entity by its NAICS code, and then used the SBA size standards to compare the requisite revenue or employee count threshold for each entity. Based on the NAICS code, some entities are classified as small based on their annual revenue and some based on the number of employees. In cases where the matched entity was a direct subsidiary, DHS recorded
10 DHS determined sample size using a standard statistical formula based on the population total for each form type with a 95 percent confidence level and a 5 percent confidence interval. This means that there is a 95 percent chance that parameters descriptive of the population (e.g. the percent of entities that are small) are no more than 5 percent different from the statistic obtained by the sample. 11 This means that there is a 95 percent chance that parameters descriptive of the population (e.g., the percent of entities that are small) are no more than 5 percent different from the statistic obtained by the sample. 12 U.S. Census Bureau, NAICS code listing: http://www.census.gov/eos/www/naics/. 13 SBA size standards effective October 2017. Visited April 2018. https://www.naics.com/wp-content/uploads/2017/10/SBA_Size_Standards_Table.pdf.
AILA Doc. No. 20073100. (Posted 8/4/20)
5
data for the parent organization. In cases where the entity was a single-location franchise, DHS recorded the single location’s data.
Once as many entities as possible were matched, those that had relevant data were
compared to the size standards provided by the SBA to determine whether they were small or not. Those that could not be matched or compared were assumed to be small under the presumption that non-small entities would have been identified by one of the databases at some point in their existence.
Forms I-924, G-1041 and G-1041A Data for Forms I-924, G-1041 and G-1041A were treated differently than the data for Forms I-129, I-140, I-910 and I-360 in this analysis. Although applicant data for Forms I-924, G-1041 and G-1041A were available for analysis, issues in identifying entities and obtaining revenue and employee count due to the structure of these entities made it difficult to conduct a similar analysis. The structure of these entities and issues with data are discussed further in this analysis.
a. Petition for a Nonimmigrant Worker, Form I-129 Data
Research Population and Sampling Statistics
DHS collected internal data for Form I-129 were provided by the USCIS Office of Performance and Quality (OPQ) from the Computer-Linked Application Information Management System (CLAIMS3)/Citizenship and Immigration Services Common Operational Repository (CISCOR) database. There were 530,442 Form I-129 petitions submitted in FY 2017. Of these, 525,138 (99 percent) were submitted with an EIN, also known as a petitioner tax number; the remaining 5,304 were recorded with a blank or incomplete EIN field.
Many employers submitted more than one petition over the course of the year. Those
petitions that were submitted with an EIN produced 90,726 unique EINs. DHS assumed that entities in the population without complete or with no EIN information could be small or not. These entities were removed before the sample was selected for this analysis.
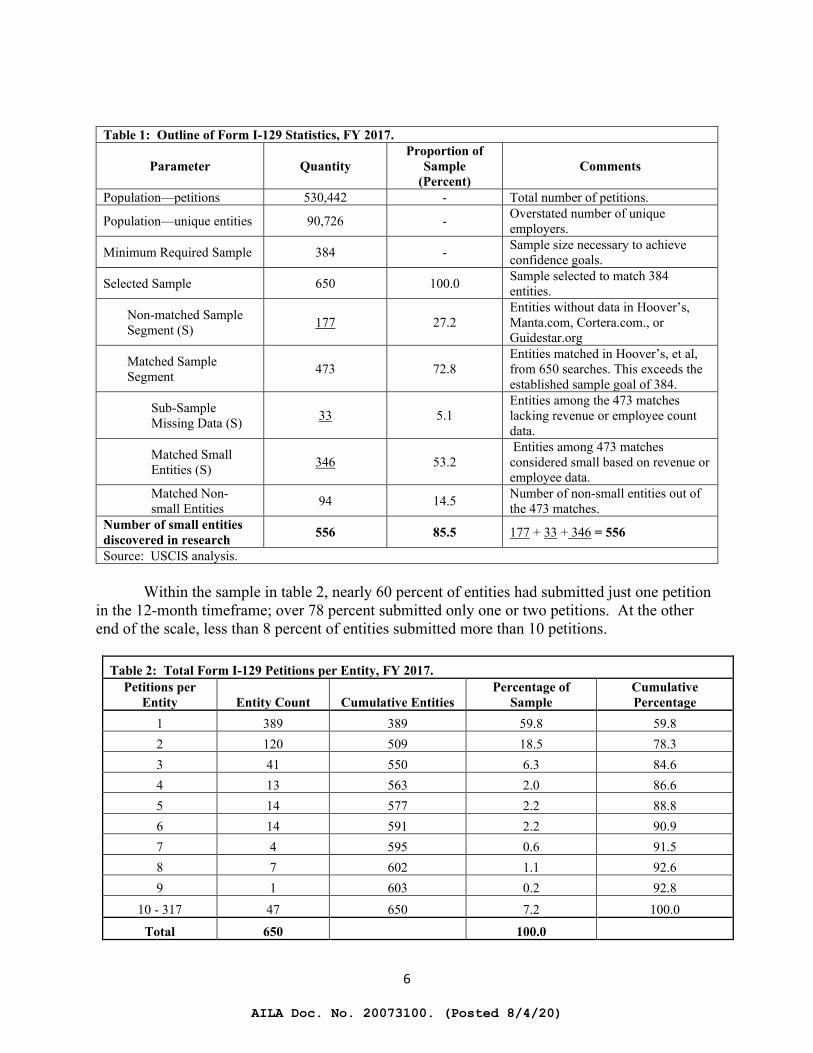
Table 1 outlines total receipts or population (530,442 petitions) for Form I-129 from FY
2017 represented a population of 90,726 unique petitioners requesting foreign workers, with many of these entities submitting multiple petitions. From this population, DHS drew a random sample of 650 petitioning entities. Using the subscription or public-use databases identified previously, DHS assembled revenue and employment information on these entities and determined that 556, or 85.5 percent, of these petitioners met the definition of small entities. Of those that we determined could be classified as small entities, 71 percent14 had annual revenues of less than a million and approximately 9 percent15 of them had petitioned for five or more workers over that year.
14 Calculation: 395 small entities with annual revenues of less than $1 million/ 556 total small entities = 71 percent. 15 Calculation: 51 small entities petitioning for five or more workers / 556 total small entities = 9 percent.
AILA Doc. No. 20073100. (Posted 8/4/20)
6
Table 1: Outline of Form I-129 Statistics, FY 2017.
Parameter Quantity Proportion of
Sample (Percent)
Comments
Population—petitions 530,442 - Total number of petitions.
Population—unique entities 90,726 - Overstated number of unique employers.
Minimum Required Sample 384 - Sample size necessary to achieve confidence goals.
Selected Sample 650 100.0 Sample selected to match 384 entities.
Non-matched Sample Segment (S) 177 27.2
Entities without data in Hoover’s, Manta.com, Cortera.com., or Guidestar.org
Matched Sample Segment 473 72.8
Entities matched in Hoover’s, et al, from 650 searches. This exceeds the established sample goal of 384.
Sub-Sample Missing Data (S) 33 5.1
Entities among the 473 matches lacking revenue or employee count data.
Matched Small Entities (S) 346 53.2
Entities among 473 matches considered small based on revenue or employee data.
Matched Non-small Entities 94 14.5 Number of non-small entities out of
the 473 matches. Number of small entities discovered in research 556 85.5 177 + 33 + 346 = 556
Source: USCIS analysis. Within the sample in table 2, nearly 60 percent of entities had submitted just one petition
in the 12-month timeframe; over 78 percent submitted only one or two petitions. At the other end of the scale, less than 8 percent of entities submitted more than 10 petitions.
Table 2: Total Form I-129 Petitions per Entity, FY 2017.
Petitions per Entity Entity Count Cumulative Entities
Percentage of Sample
Cumulative Percentage
1 389 389 59.8 59.8 2 120 509 18.5 78.3 3 41 550 6.3 84.6 4 13 563 2.0 86.6 5 14 577 2.2 88.8 6 14 591 2.2 90.9 7 4 595 0.6 91.5 8 7 602 1.1 92.6 9 1 603 0.2 92.8
10 - 317 47 650 7.2 100.0
Total 650 100.0
AILA Doc. No. 20073100. (Posted 8/4/20)
7
Table 2: Total Form I-129 Petitions per Entity, FY 2017. Petitions per
Entity Entity Count Cumulative Entities Percentage of
Sample Cumulative Percentage
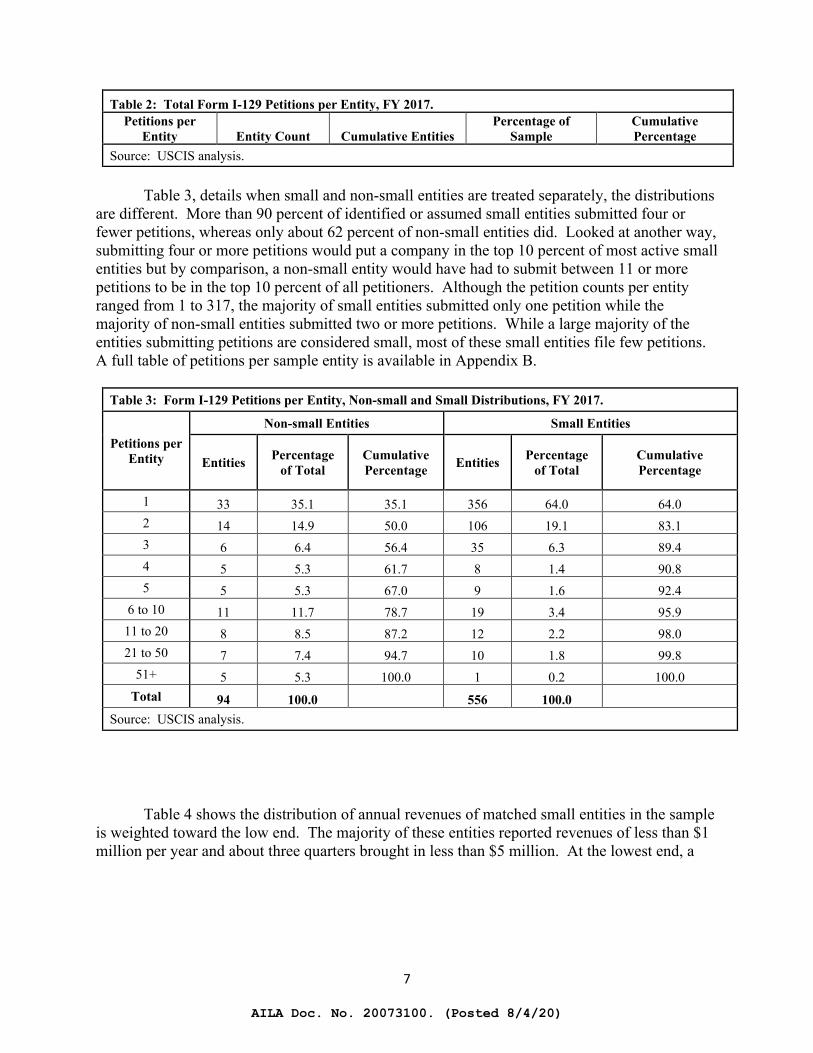
Source: USCIS analysis. Table 3, details when small and non-small entities are treated separately, the distributions
are different. More than 90 percent of identified or assumed small entities submitted four or fewer petitions, whereas only about 62 percent of non-small entities did. Looked at another way, submitting four or more petitions would put a company in the top 10 percent of most active small entities but by comparison, a non-small entity would have had to submit between 11 or more petitions to be in the top 10 percent of all petitioners. Although the petition counts per entity ranged from 1 to 317, the majority of small entities submitted only one petition while the majority of non-small entities submitted two or more petitions. While a large majority of the entities submitting petitions are considered small, most of these small entities file few petitions. A full table of petitions per sample entity is available in Appendix B.
Table 3: Form I-129 Petitions per Entity, Non-small and Small Distributions, FY 2017.
Petitions per Entity
Non-small Entities Small Entities
Entities Percentage of Total
Cumulative Percentage Entities Percentage
of Total Cumulative Percentage
1 33 35.1 35.1 356 64.0 64.0 2 14 14.9 50.0 106 19.1 83.1 3 6 6.4 56.4 35 6.3 89.4 4 5 5.3 61.7 8 1.4 90.8 5 5 5.3 67.0 9 1.6 92.4
6 to 10 11 11.7 78.7 19 3.4 95.9 11 to 20 8 8.5 87.2 12 2.2 98.0 21 to 50 7 7.4 94.7 10 1.8 99.8
51+ 5 5.3 100.0 1 0.2 100.0 Total 94 100.0 556 100.0
Source: USCIS analysis.
Table 4 shows the distribution of annual revenues of matched small entities in the sample
is weighted toward the low end. The majority of these entities reported revenues of less than $1 million per year and about three quarters brought in less than $5 million. At the lowest end, a
AILA Doc. No. 20073100. (Posted 8/4/20)
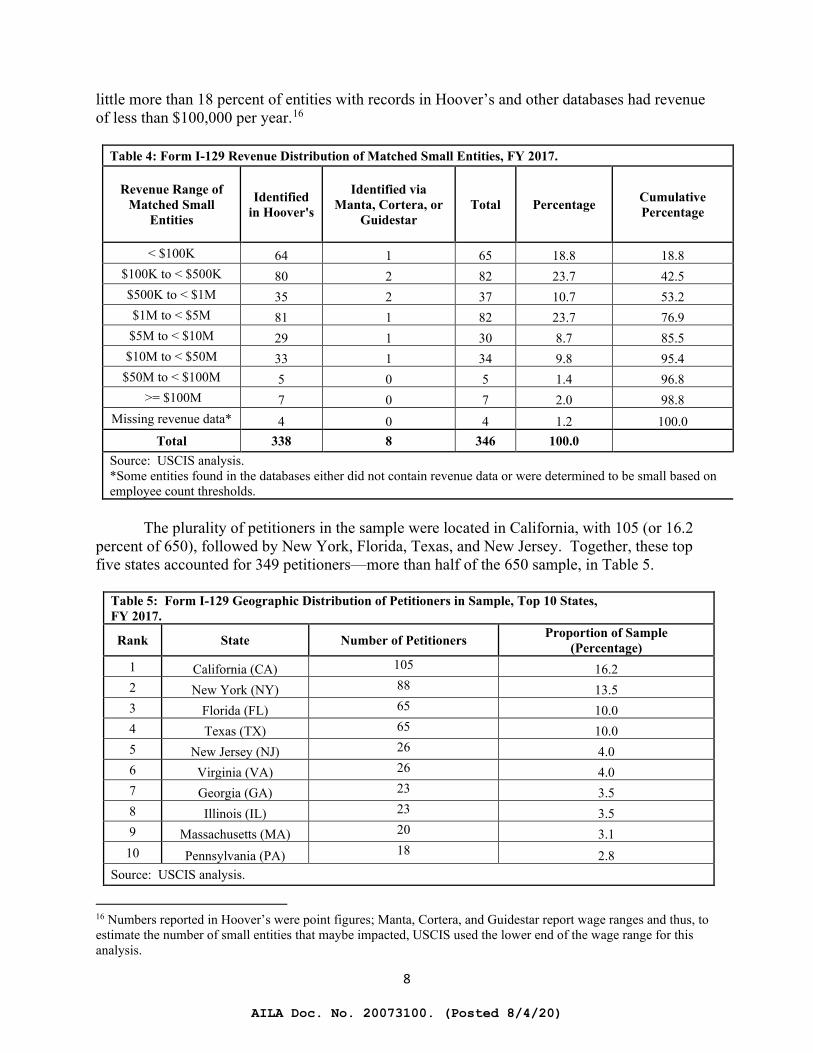
8
little more than 18 percent of entities with records in Hoover’s and other databases had revenue of less than $100,000 per year.16
Table 4: Form I-129 Revenue Distribution of Matched Small Entities, FY 2017.
Revenue Range of Matched Small
Entities
Identified in Hoover's
Identified via Manta, Cortera, or
Guidestar Total Percentage Cumulative
Percentage
< $100K 64 1 65 18.8 18.8 $100K to < $500K 80 2 82 23.7 42.5 $500K to < $1M 35 2 37 10.7 53.2 $1M to < $5M 81 1 82 23.7 76.9
$5M to < $10M 29 1 30 8.7 85.5 $10M to < $50M 33 1 34 9.8 95.4
$50M to < $100M 5 0 5 1.4 96.8 >= $100M 7 0 7 2.0 98.8
Missing revenue data* 4 0 4 1.2 100.0 Total 338 8 346 100.0
Source: USCIS analysis. *Some entities found in the databases either did not contain revenue data or were determined to be small based on employee count thresholds.
The plurality of petitioners in the sample were located in California, with 105 (or 16.2
percent of 650), followed by New York, Florida, Texas, and New Jersey. Together, these top five states accounted for 349 petitioners—more than half of the 650 sample, in Table 5.
Table 5: Form I-129 Geographic Distribution of Petitioners in Sample, Top 10 States, FY 2017.
Rank State Number of Petitioners Proportion of Sample (Percentage)
1 California (CA) 105 16.2 2 New York (NY) 88 13.5 3 Florida (FL) 65 10.0 4 Texas (TX) 65 10.0 5 New Jersey (NJ) 26 4.0 6 Virginia (VA) 26 4.0 7 Georgia (GA) 23 3.5 8 Illinois (IL) 23 3.5 9 Massachusetts (MA) 20 3.1
10 Pennsylvania (PA) 18 2.8 Source: USCIS analysis.
16 Numbers reported in Hoover’s were point figures; Manta, Cortera, and Guidestar report wage ranges and thus, to estimate the number of small entities that maybe impacted, USCIS used the lower end of the wage range for this analysis.
AILA Doc. No. 20073100. (Posted 8/4/20)
9
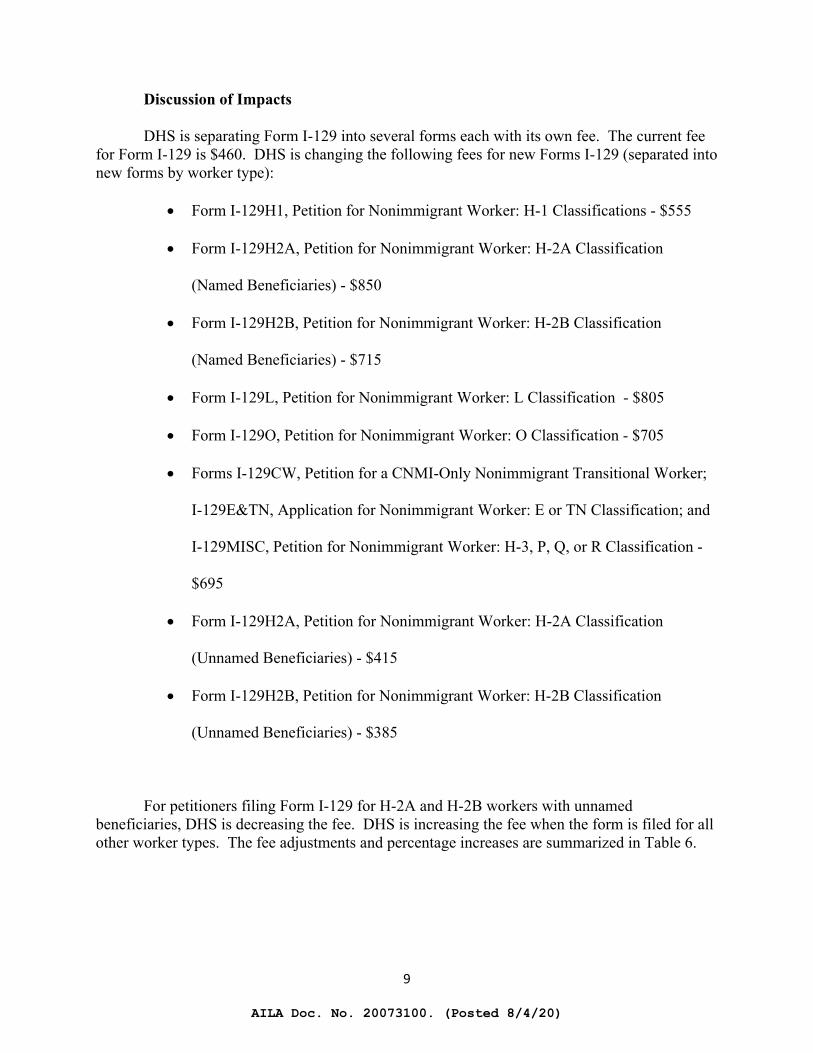
Discussion of Impacts DHS is separating Form I-129 into several forms each with its own fee. The current fee
for Form I-129 is $460. DHS is changing the following fees for new Forms I-129 (separated into new forms by worker type):
• Form I-129H1, Petition for Nonimmigrant Worker: H-1 Classifications - $555
• Form I-129H2A, Petition for Nonimmigrant Worker: H-2A Classification
(Named Beneficiaries) - $850
• Form I-129H2B, Petition for Nonimmigrant Worker: H-2B Classification
(Named Beneficiaries) - $715
• Form I-129L, Petition for Nonimmigrant Worker: L Classification - $805
• Form I-129O, Petition for Nonimmigrant Worker: O Classification - $705
• Forms I-129CW, Petition for a CNMI-Only Nonimmigrant Transitional Worker;
I-129E&TN, Application for Nonimmigrant Worker: E or TN Classification; and
I-129MISC, Petition for Nonimmigrant Worker: H-3, P, Q, or R Classification -
$695
• Form I-129H2A, Petition for Nonimmigrant Worker: H-2A Classification
(Unnamed Beneficiaries) - $415
• Form I-129H2B, Petition for Nonimmigrant Worker: H-2B Classification
(Unnamed Beneficiaries) - $385
For petitioners filing Form I-129 for H-2A and H-2B workers with unnamed
beneficiaries, DHS is decreasing the fee. DHS is increasing the fee when the form is filed for all other worker types. The fee adjustments and percentage increases are summarized in Table 6.
AILA Doc. No. 20073100. (Posted 8/4/20)
10
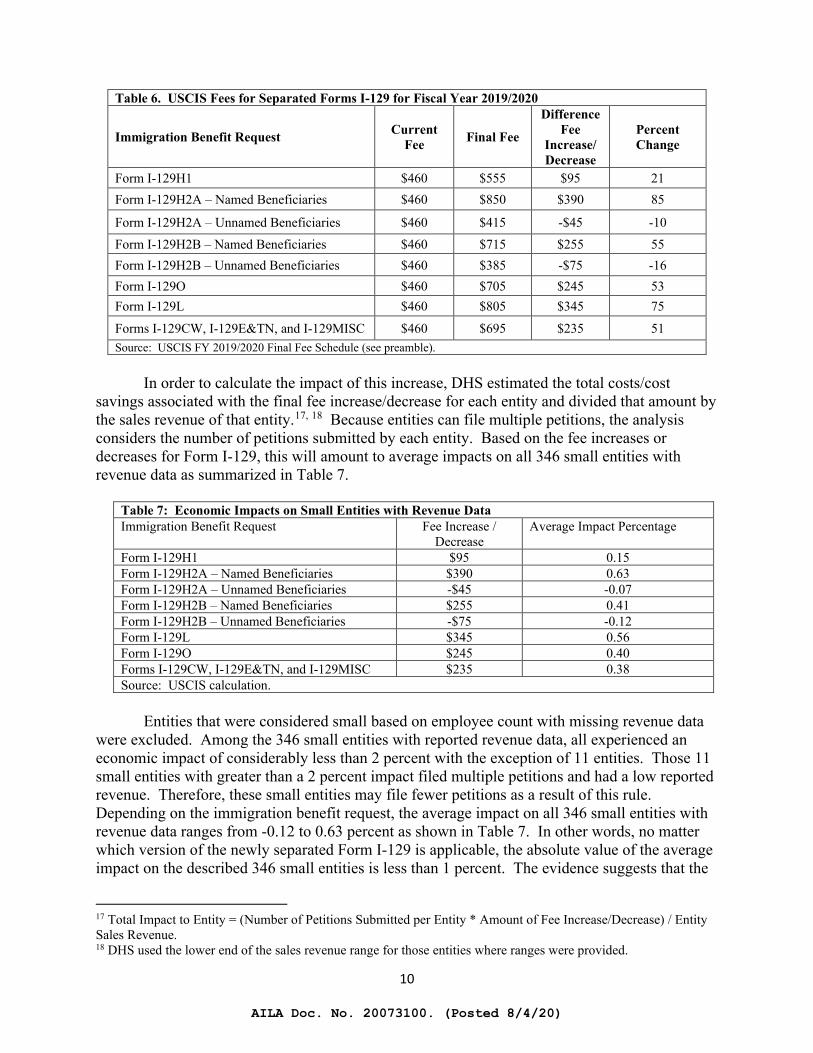
Table 6. USCIS Fees for Separated Forms I-129 for Fiscal Year 2019/2020
Immigration Benefit Request Current Fee Final Fee
Difference Fee
Increase/ Decrease
Percent Change
Form I-129H1 $460 $555 $95 21 Form I-129H2A – Named Beneficiaries $460 $850 $390 85
Form I-129H2A – Unnamed Beneficiaries $460 $415 -$45 -10 Form I-129H2B – Named Beneficiaries $460 $715 $255 55 Form I-129H2B – Unnamed Beneficiaries $460 $385 -$75 -16 Form I-129O $460 $705 $245 53 Form I-129L $460 $805 $345 75
Forms I-129CW, I-129E&TN, and I-129MISC $460 $695 $235 51 Source: USCIS FY 2019/2020 Final Fee Schedule (see preamble).
In order to calculate the impact of this increase, DHS estimated the total costs/cost
savings associated with the final fee increase/decrease for each entity and divided that amount by the sales revenue of that entity.17, 18 Because entities can file multiple petitions, the analysis considers the number of petitions submitted by each entity. Based on the fee increases or decreases for Form I-129, this will amount to average impacts on all 346 small entities with revenue data as summarized in Table 7.
Table 7: Economic Impacts on Small Entities with Revenue Data Immigration Benefit Request Fee Increase /
Decrease Average Impact Percentage
Form I-129H1 $95 0.15 Form I-129H2A – Named Beneficiaries $390 0.63 Form I-129H2A – Unnamed Beneficiaries -$45 -0.07 Form I-129H2B – Named Beneficiaries $255 0.41 Form I-129H2B – Unnamed Beneficiaries -$75 -0.12 Form I-129L $345 0.56 Form I-129O $245 0.40 Forms I-129CW, I-129E&TN, and I-129MISC $235 0.38 Source: USCIS calculation.
Entities that were considered small based on employee count with missing revenue data
were excluded. Among the 346 small entities with reported revenue data, all experienced an economic impact of considerably less than 2 percent with the exception of 11 entities. Those 11 small entities with greater than a 2 percent impact filed multiple petitions and had a low reported revenue. Therefore, these small entities may file fewer petitions as a result of this rule. Depending on the immigration benefit request, the average impact on all 346 small entities with revenue data ranges from -0.12 to 0.63 percent as shown in Table 7. In other words, no matter which version of the newly separated Form I-129 is applicable, the absolute value of the average impact on the described 346 small entities is less than 1 percent. The evidence suggests that the
17 Total Impact to Entity = (Number of Petitions Submitted per Entity * Amount of Fee Increase/Decrease) / Entity Sales Revenue. 18 DHS used the lower end of the sales revenue range for those entities where ranges were provided.
AILA Doc. No. 20073100. (Posted 8/4/20)
11
changes in fees imposed by this rule do not represent a significant economic impact on these entities.
Issues with Data
In selecting a sample, DHS intends to be as inclusive as possible of all petitioners. However, due to peculiarities in the database, some petitioners would necessarily be entered multiple times in the random sort. Some of this is due to error. Some of these variations featured digits that were transposed and others mis-keyed, while other petitions for this entity were submitted without an EIN.
Manual data-cleaning is impractical in a situation where hundreds of thousands of records
must be sorted; worse, it could lead to introducing new inaccuracy into the database if some duplicates are removed and others are not. Using employer names is not a better solution, as there is even less consistency in their formatting.
The data errors that may lead to overrepresentation of some petitioners do not clearly
favor either small or non-small entities. The best DHS can do is to construct a sample larger than necessary, eliminate any duplicates within that sample, and proceed with the analysis as normal. There were no duplicates detected within the sample, indicating that irregularities in the data received were not large enough as to skew understanding of the underlying parameters of the petitioner population.
b. Immigrant Petition for Alien Worker, Form I-140 Data
Research Population and Sampling Statistics
USCIS internal data for Form I-140 were provided by OPQ from the CLAIMS3/CISCOR database. There were 139,439 foreign worker Form I-140 petitions submitted in FY 2017. Of these, 121,659 (87 percent) were submitted with an EIN; the remaining 17,780 were recorded either with a blank or a “0” in the EIN field. Many employers submitted more than one petition over the course of the year, as each petition is for an individual worker. Those petitions that were submitted with an EIN provided 30,321 unique EINs.
Table 8 has data from the 12-month period submissions of I-140 petitions were
aggregated to create a total of 139,439 foreign worker petitions. This total represented a population of 30,321 entities petitioning for workers, with such entities submitting multiple petitions. From this population, DHS selected a random sample of 550 petitioning entities. Using the subscription or public-use databases identified previously, DHS assembled revenue and employment information on these entities and determined that 402, or 73.1 percent, of these petitioners met the definition of small entities, that over half of these small entities had annual
AILA Doc. No. 20073100. (Posted 8/4/20)
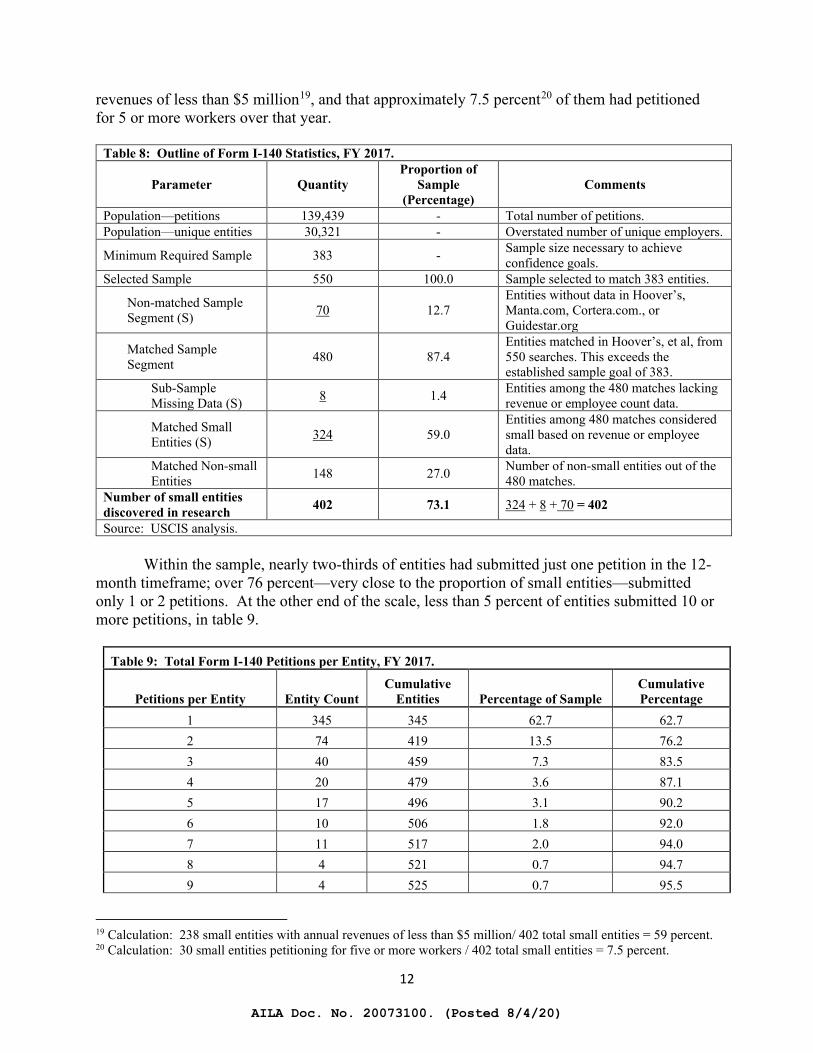
12
revenues of less than $5 million19, and that approximately 7.5 percent20 of them had petitioned for 5 or more workers over that year.
Table 8: Outline of Form I-140 Statistics, FY 2017.
Parameter Quantity Proportion of
Sample (Percentage)
Comments
Population—petitions 139,439 - Total number of petitions. Population—unique entities 30,321 - Overstated number of unique employers.
Minimum Required Sample 383 - Sample size necessary to achieve confidence goals.
Selected Sample 550 100.0 Sample selected to match 383 entities.
Non-matched Sample Segment (S) 70 12.7
Entities without data in Hoover’s, Manta.com, Cortera.com., or Guidestar.org
Matched Sample Segment 480 87.4
Entities matched in Hoover’s, et al, from 550 searches. This exceeds the established sample goal of 383.
Sub-Sample Missing Data (S) 8 1.4 Entities among the 480 matches lacking
revenue or employee count data.
Matched Small Entities (S) 324 59.0
Entities among 480 matches considered small based on revenue or employee data.
Matched Non-small Entities 148 27.0 Number of non-small entities out of the
480 matches. Number of small entities discovered in research 402 73.1 324 + 8 + 70 = 402
Source: USCIS analysis.
Within the sample, nearly two-thirds of entities had submitted just one petition in the 12-month timeframe; over 76 percent—very close to the proportion of small entities—submitted only 1 or 2 petitions. At the other end of the scale, less than 5 percent of entities submitted 10 or more petitions, in table 9.
Table 9: Total Form I-140 Petitions per Entity, FY 2017.
Petitions per Entity Entity Count Cumulative
Entities Percentage of Sample Cumulative Percentage
1 345 345 62.7 62.7 2 74 419 13.5 76.2 3 40 459 7.3 83.5 4 20 479 3.6 87.1 5 17 496 3.1 90.2 6 10 506 1.8 92.0 7 11 517 2.0 94.0 8 4 521 0.7 94.7 9 4 525 0.7 95.5
19 Calculation: 238 small entities with annual revenues of less than $5 million/ 402 total small entities = 59 percent. 20 Calculation: 30 small entities petitioning for five or more workers / 402 total small entities = 7.5 percent.
AILA Doc. No. 20073100. (Posted 8/4/20)
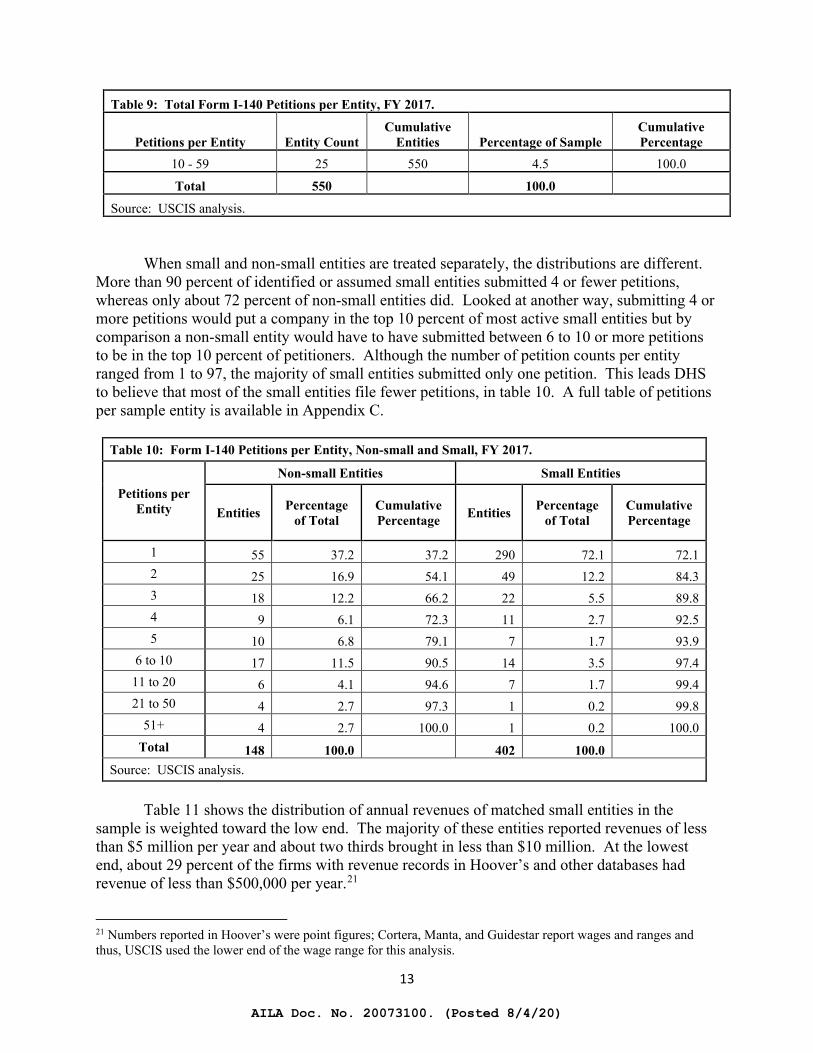
13
Table 9: Total Form I-140 Petitions per Entity, FY 2017.
Petitions per Entity Entity Count Cumulative
Entities Percentage of Sample Cumulative Percentage
10 - 59 25 550 4.5 100.0
Total 550 100.0
Source: USCIS analysis.
When small and non-small entities are treated separately, the distributions are different. More than 90 percent of identified or assumed small entities submitted 4 or fewer petitions, whereas only about 72 percent of non-small entities did. Looked at another way, submitting 4 or more petitions would put a company in the top 10 percent of most active small entities but by comparison a non-small entity would have to have submitted between 6 to 10 or more petitions to be in the top 10 percent of petitioners. Although the number of petition counts per entity ranged from 1 to 97, the majority of small entities submitted only one petition. This leads DHS to believe that most of the small entities file fewer petitions, in table 10. A full table of petitions per sample entity is available in Appendix C.
Table 10: Form I-140 Petitions per Entity, Non-small and Small, FY 2017.
Petitions per Entity
Non-small Entities Small Entities
Entities Percentage of Total
Cumulative Percentage Entities Percentage
of Total Cumulative Percentage
1 55 37.2 37.2 290 72.1 72.1 2 25 16.9 54.1 49 12.2 84.3 3 18 12.2 66.2 22 5.5 89.8 4 9 6.1 72.3 11 2.7 92.5 5 10 6.8 79.1 7 1.7 93.9
6 to 10 17 11.5 90.5 14 3.5 97.4 11 to 20 6 4.1 94.6 7 1.7 99.4 21 to 50 4 2.7 97.3 1 0.2 99.8
51+ 4 2.7 100.0 1 0.2 100.0 Total 148 100.0 402 100.0
Source: USCIS analysis.
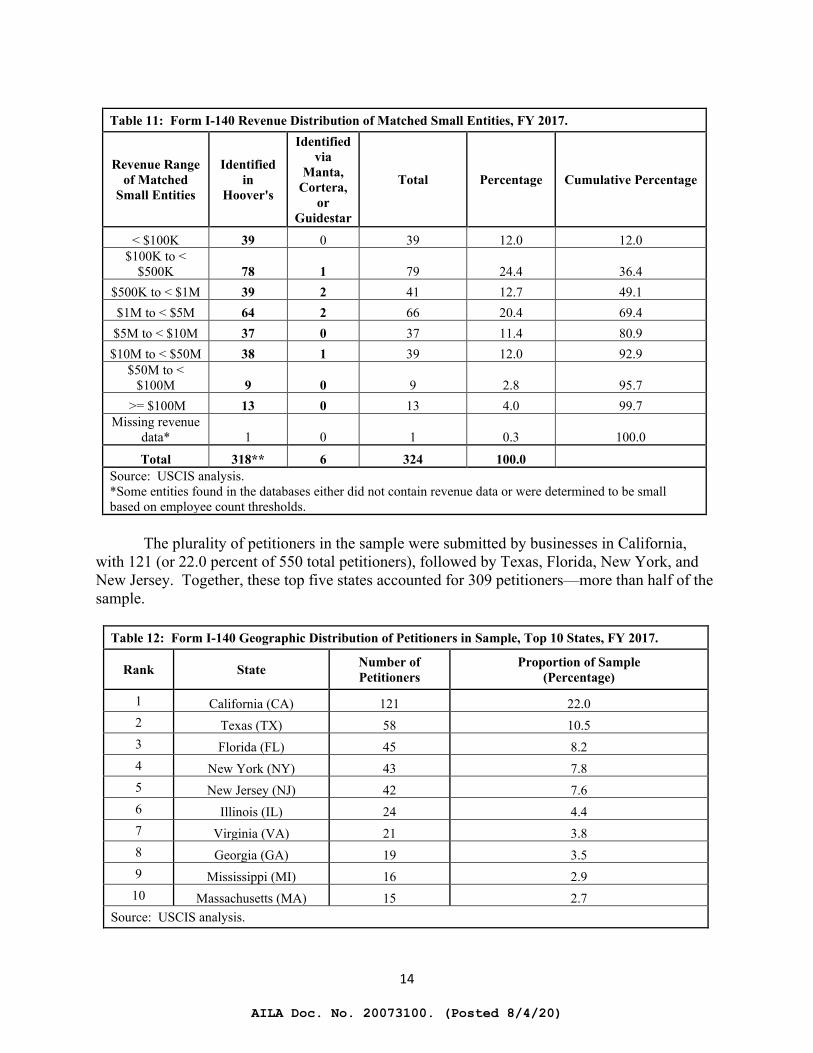
Table 11 shows the distribution of annual revenues of matched small entities in the
sample is weighted toward the low end. The majority of these entities reported revenues of less than $5 million per year and about two thirds brought in less than $10 million. At the lowest end, about 29 percent of the firms with revenue records in Hoover’s and other databases had revenue of less than $500,000 per year.21
21 Numbers reported in Hoover’s were point figures; Cortera, Manta, and Guidestar report wages and ranges and thus, USCIS used the lower end of the wage range for this analysis.
AILA Doc. No. 20073100. (Posted 8/4/20)
14
Table 11: Form I-140 Revenue Distribution of Matched Small Entities, FY 2017.
Revenue Range of Matched
Small Entities
Identified in
Hoover's
Identified via
Manta, Cortera,
or Guidestar
Total Percentage Cumulative Percentage
< $100K 39 0 39 12.0 12.0 $100K to <
$500K 78 1 79 24.4 36.4 $500K to < $1M 39 2 41 12.7 49.1 $1M to < $5M 64 2 66 20.4 69.4
$5M to < $10M 37 0 37 11.4 80.9 $10M to < $50M 38 1 39 12.0 92.9
$50M to < $100M 9 0 9 2.8 95.7
>= $100M 13 0 13 4.0 99.7 Missing revenue
data* 1 0 1 0.3 100.0
Total 318** 6 324 100.0 Source: USCIS analysis. *Some entities found in the databases either did not contain revenue data or were determined to be small based on employee count thresholds.
The plurality of petitioners in the sample were submitted by businesses in California,
with 121 (or 22.0 percent of 550 total petitioners), followed by Texas, Florida, New York, and New Jersey. Together, these top five states accounted for 309 petitioners—more than half of the sample.
Table 12: Form I-140 Geographic Distribution of Petitioners in Sample, Top 10 States, FY 2017.
Rank State Number of Petitioners
Proportion of Sample (Percentage)
1 California (CA) 121 22.0 2 Texas (TX) 58 10.5 3 Florida (FL) 45 8.2 4 New York (NY) 43 7.8 5 New Jersey (NJ) 42 7.6 6 Illinois (IL) 24 4.4 7 Virginia (VA) 21 3.8 8 Georgia (GA) 19 3.5 9 Mississippi (MI) 16 2.9
10 Massachusetts (MA) 15 2.7 Source: USCIS analysis.
AILA Doc. No. 20073100. (Posted 8/4/20)
15
Discussion of Impacts USCIS is decreasing the fee for Form I-140 to $555, a decrease of $145 (21 percent).
Current fees for this form are $700, meaning the decrease will remove $145 in fees per petition. In order to calculate the impact of this decrease, USCIS estimated the total cost savings associated with the fee decrease for each entity and divided that amount by the sales revenue of that entity.22,23 Because entities can file multiple petitions, the analysis considers the number of petitions submitted by each entity. Entities that were considered small based on employee count with missing revenue data were excluded. Among the 324 small entities with reported revenue data, all entities experienced an economic impact considerably less than -2 percent. As a result of the fee decrease, these small entities will see a cost savings ($145 per petition) in filing fees based on petitions. The higher the negative will have the greatest economic impact imposed by this fee change totaled -1.74 percent and the smallest totaled -0.00000006 percent, resulting in a cost savings. The negative number represents cost savings to the petitioner. Therefore, the larger it is, the greater the cost savings for the petitioners. The average impact on all 324 small entities with revenue data was -0.06 percent. The evidence suggests that the decreased fee does not represent a significant economic impact on these entities.
Issues with Data DHS attempted to be as inclusive as possible of all petitioners that filed Form I-140. However, the database contained some submitted petitions where the EIN number was left blank or “0.” Instructions for Form I-140 state that except for foreign workers of extraordinary ability or those petitioning under national interest waivers, all other Form I-140 petitions must require proof of a permanent job offer. Therefore, an EIN number must be coded on the form or it will be rejected. The blanks in the database could trace to these beneficiaries or not, many of those petitions submitted with a blank or “0” EIN did not provide an entity name. Manual data-cleaning was again impractical in a situation where thousands of records must be sorted.
The sample constructed was larger than necessary, weeding out any duplicates within that sample. There were no duplicates detected within the sample, indicating that irregularities in the data received were not large enough as to skew understanding of the underlying parameters of the petitioner population.
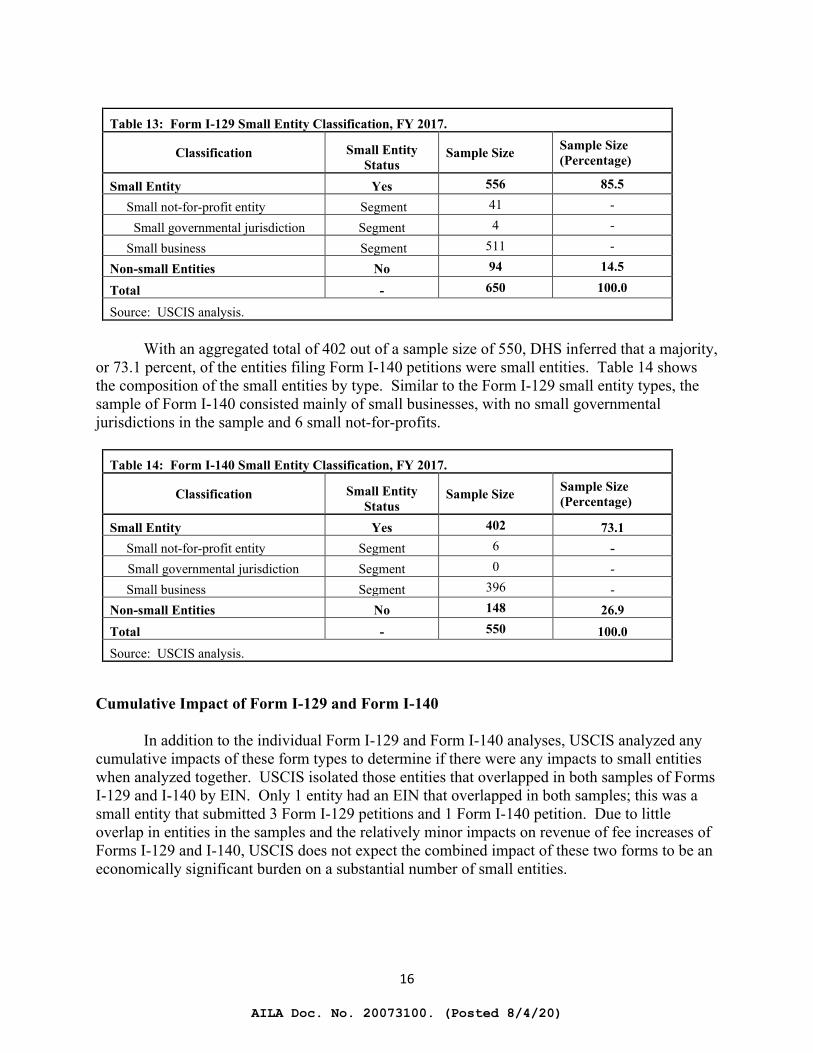
Small Entity Classifications of Form I-129 and Form I-140 With an aggregated total of 556 out of a sample size of 650, DHS inferred that a majority, or 85.5 percent, of the entities filing Form I-129 petitions were small entities. Table 13 shows the composition of the small entities by entity type. Most of the sample consisted of small businesses when looked at by type of small entity. There are 4 small governmental jurisdictions in the sample and 41 small not-for-profits.
22 Total Impact to Entity = (Number of Petitions Submitted per Entity * Amount of Fee Increase/Decrease) / Entity Sales Revenue. 23 USCIS used the lower end of the sales revenue range for those entities where ranges were provided.
AILA Doc. No. 20073100. (Posted 8/4/20)
16
Table 13: Form I-129 Small Entity Classification, FY 2017.
Classification Small Entity Status
Sample Size Sample Size (Percentage)
Small Entity Yes 556 85.5
Small not-for-profit entity Segment 41 -
Small governmental jurisdiction Segment 4 -
Small business Segment 511 -
Non-small Entities No 94 14.5
Total - 650 100.0
Source: USCIS analysis.
With an aggregated total of 402 out of a sample size of 550, DHS inferred that a majority, or 73.1 percent, of the entities filing Form I-140 petitions were small entities. Table 14 shows the composition of the small entities by type. Similar to the Form I-129 small entity types, the sample of Form I-140 consisted mainly of small businesses, with no small governmental jurisdictions in the sample and 6 small not-for-profits.
Table 14: Form I-140 Small Entity Classification, FY 2017.
Classification Small Entity Status
Sample Size Sample Size (Percentage)
Small Entity Yes 402 73.1 Small not-for-profit entity Segment 6 -
Small governmental jurisdiction Segment 0 - Small business Segment 396 - Non-small Entities No 148 26.9 Total - 550 100.0 Source: USCIS analysis.
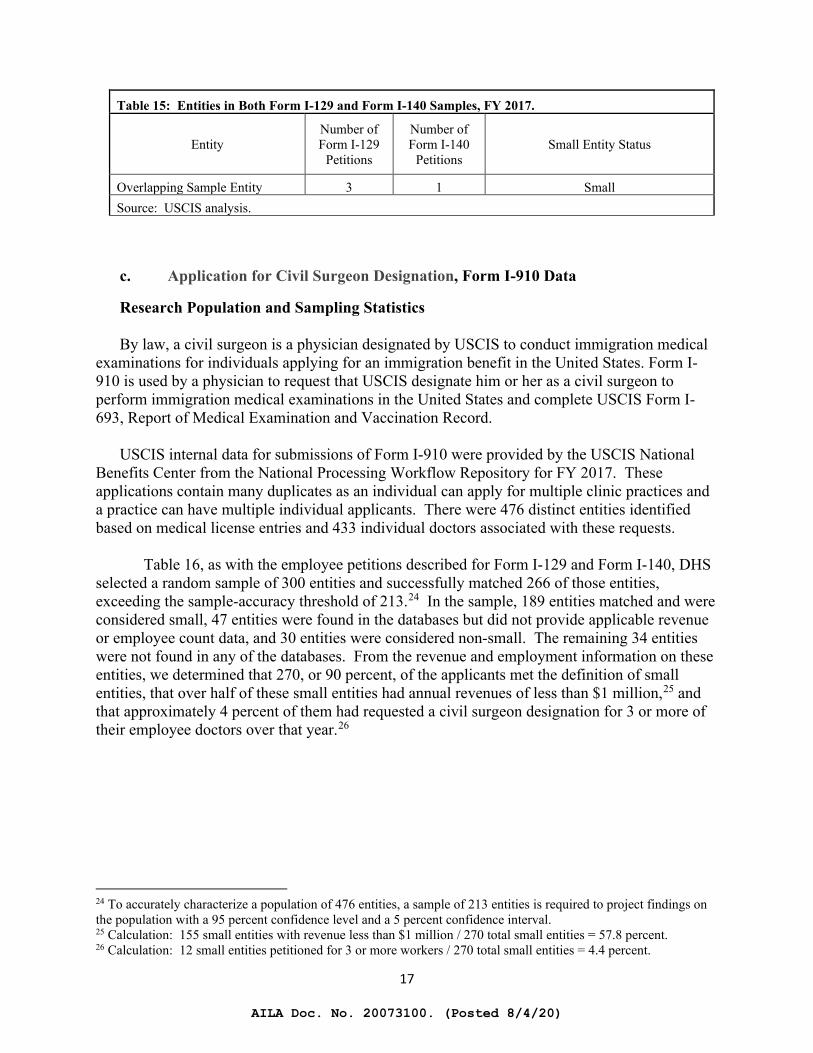
Cumulative Impact of Form I-129 and Form I-140 In addition to the individual Form I-129 and Form I-140 analyses, USCIS analyzed any cumulative impacts of these form types to determine if there were any impacts to small entities when analyzed together. USCIS isolated those entities that overlapped in both samples of Forms I-129 and I-140 by EIN. Only 1 entity had an EIN that overlapped in both samples; this was a small entity that submitted 3 Form I-129 petitions and 1 Form I-140 petition. Due to little overlap in entities in the samples and the relatively minor impacts on revenue of fee increases of Forms I-129 and I-140, USCIS does not expect the combined impact of these two forms to be an economically significant burden on a substantial number of small entities.
AILA Doc. No. 20073100. (Posted 8/4/20)
17
Table 15: Entities in Both Form I-129 and Form I-140 Samples, FY 2017.
Entity Number of Form I-129
Petitions
Number of Form I-140
Petitions Small Entity Status
Overlapping Sample Entity 3 1 Small Source: USCIS analysis.
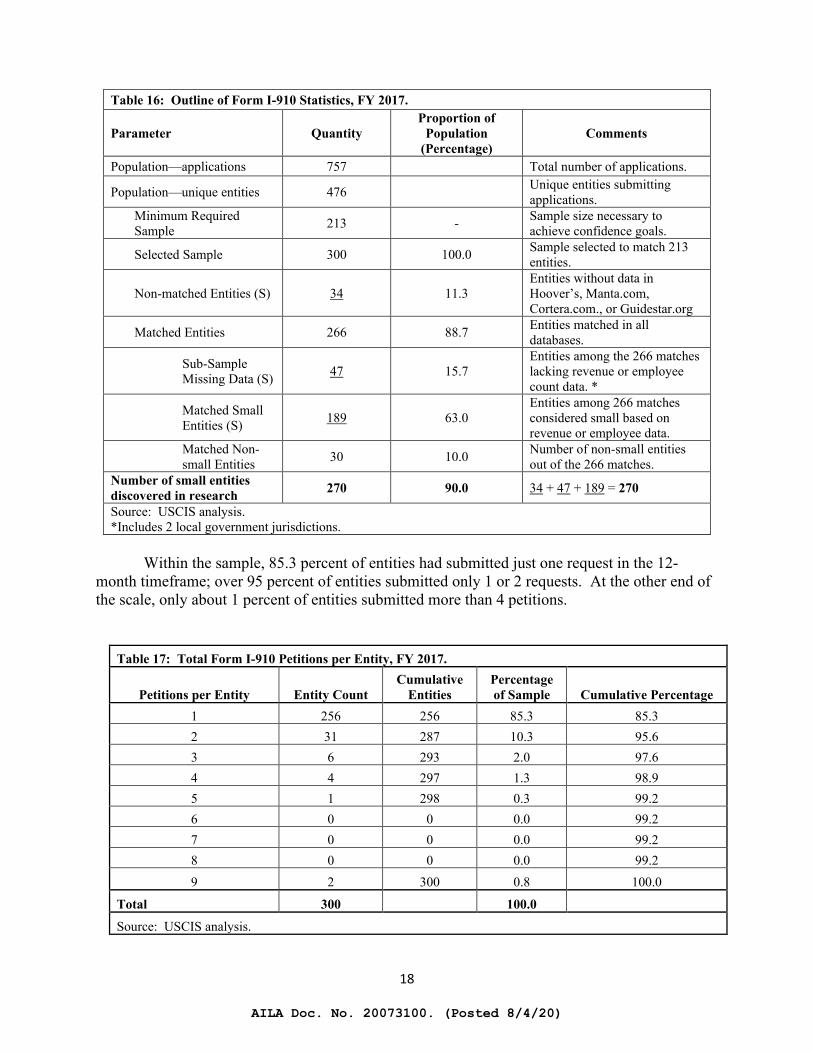
c. Application for Civil Surgeon Designation, Form I-910 Data
Research Population and Sampling Statistics
By law, a civil surgeon is a physician designated by USCIS to conduct immigration medical examinations for individuals applying for an immigration benefit in the United States. Form I-910 is used by a physician to request that USCIS designate him or her as a civil surgeon to perform immigration medical examinations in the United States and complete USCIS Form I-693, Report of Medical Examination and Vaccination Record.
USCIS internal data for submissions of Form I-910 were provided by the USCIS National
Benefits Center from the National Processing Workflow Repository for FY 2017. These applications contain many duplicates as an individual can apply for multiple clinic practices and a practice can have multiple individual applicants. There were 476 distinct entities identified based on medical license entries and 433 individual doctors associated with these requests.
Table 16, as with the employee petitions described for Form I-129 and Form I-140, DHS selected a random sample of 300 entities and successfully matched 266 of those entities, exceeding the sample-accuracy threshold of 213.24 In the sample, 189 entities matched and were considered small, 47 entities were found in the databases but did not provide applicable revenue or employee count data, and 30 entities were considered non-small. The remaining 34 entities were not found in any of the databases. From the revenue and employment information on these entities, we determined that 270, or 90 percent, of the applicants met the definition of small entities, that over half of these small entities had annual revenues of less than $1 million,25 and that approximately 4 percent of them had requested a civil surgeon designation for 3 or more of their employee doctors over that year.26
24 To accurately characterize a population of 476 entities, a sample of 213 entities is required to project findings on the population with a 95 percent confidence level and a 5 percent confidence interval. 25 Calculation: 155 small entities with revenue less than $1 million / 270 total small entities = 57.8 percent. 26 Calculation: 12 small entities petitioned for 3 or more workers / 270 total small entities = 4.4 percent.
AILA Doc. No. 20073100. (Posted 8/4/20)
18
Table 16: Outline of Form I-910 Statistics, FY 2017.
Parameter Quantity Proportion of
Population (Percentage)
Comments
Population—applications 757 Total number of applications.
Population—unique entities 476 Unique entities submitting applications.
Minimum Required Sample 213 - Sample size necessary to
achieve confidence goals.
Selected Sample 300 100.0 Sample selected to match 213 entities.
Non-matched Entities (S) 34 11.3 Entities without data in Hoover’s, Manta.com, Cortera.com., or Guidestar.org
Matched Entities 266 88.7 Entities matched in all databases.
Sub-Sample Missing Data (S) 47 15.7
Entities among the 266 matches lacking revenue or employee count data. *
Matched Small Entities (S) 189 63.0
Entities among 266 matches considered small based on revenue or employee data.
Matched Non-small Entities 30 10.0 Number of non-small entities
out of the 266 matches. Number of small entities discovered in research 270 90.0 34 + 47 + 189 = 270
Source: USCIS analysis. *Includes 2 local government jurisdictions.
Within the sample, 85.3 percent of entities had submitted just one request in the 12-
month timeframe; over 95 percent of entities submitted only 1 or 2 requests. At the other end of the scale, only about 1 percent of entities submitted more than 4 petitions.
Table 17: Total Form I-910 Petitions per Entity, FY 2017.
Petitions per Entity Entity Count Cumulative
Entities Percentage of Sample Cumulative Percentage
1 256 256 85.3 85.3 2 31 287 10.3 95.6 3 6 293 2.0 97.6 4 4 297 1.3 98.9 5 1 298 0.3 99.2 6 0 0 0.0 99.2 7 0 0 0.0 99.2 8 0 0 0.0 99.2 9 2 300 0.8 100.0
Total 300 100.0
Source: USCIS analysis.
AILA Doc. No. 20073100. (Posted 8/4/20)
19
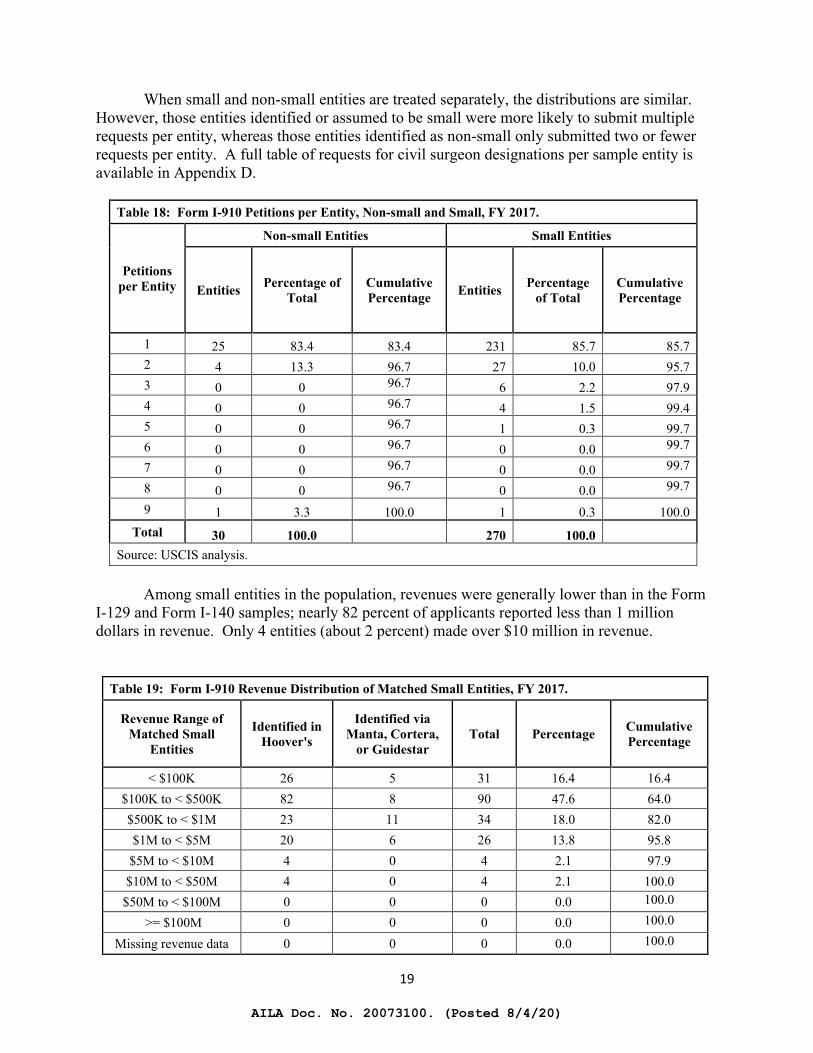
When small and non-small entities are treated separately, the distributions are similar. However, those entities identified or assumed to be small were more likely to submit multiple requests per entity, whereas those entities identified as non-small only submitted two or fewer requests per entity. A full table of requests for civil surgeon designations per sample entity is available in Appendix D.
Table 18: Form I-910 Petitions per Entity, Non-small and Small, FY 2017.
Petitions per Entity
Non-small Entities Small Entities
Entities Percentage of Total
Cumulative Percentage Entities Percentage
of Total Cumulative Percentage
1 25 83.4 83.4 231 85.7 85.7 2 4 13.3 96.7 27 10.0 95.7 3 0 0 96.7 6 2.2 97.9 4 0 0 96.7 4 1.5 99.4 5 0 0 96.7 1 0.3 99.7 6 0 0 96.7 0 0.0 99.7
7 0 0 96.7 0 0.0 99.7
8 0 0 96.7 0 0.0 99.7
9 1 3.3 100.0 1 0.3 100.0 Total 30 100.0 270 100.0
Source: USCIS analysis.
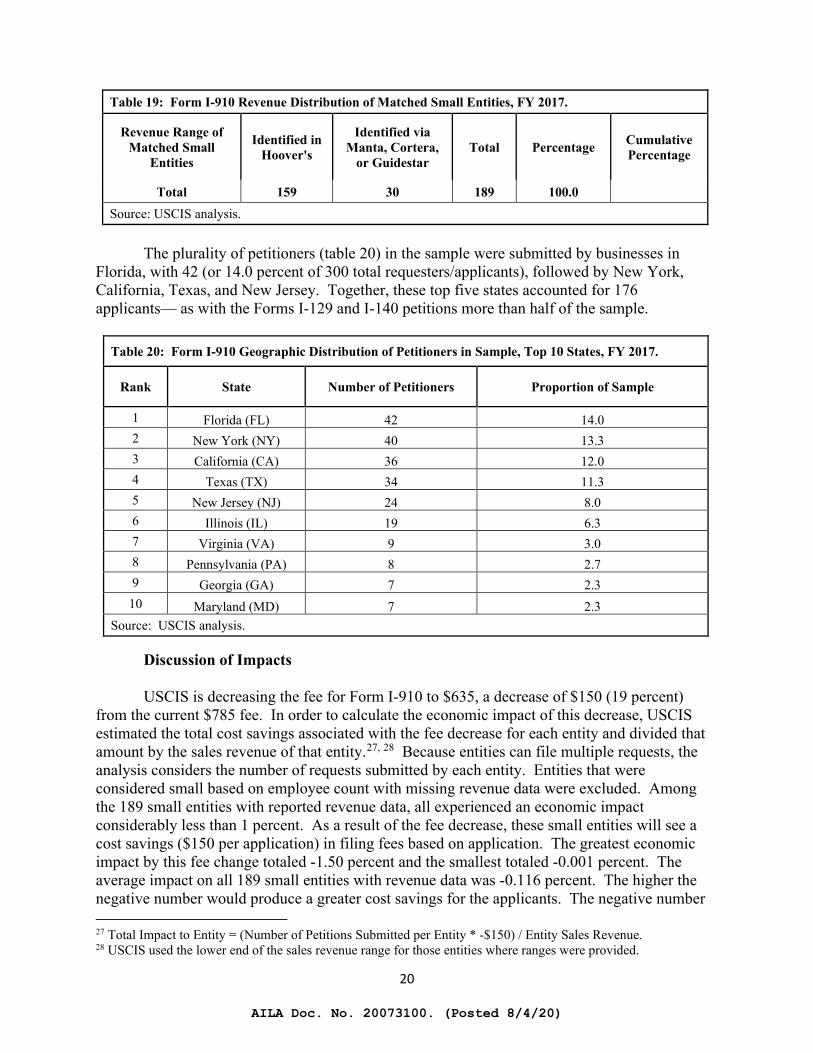
Among small entities in the population, revenues were generally lower than in the Form I-129 and Form I-140 samples; nearly 82 percent of applicants reported less than 1 million dollars in revenue. Only 4 entities (about 2 percent) made over $10 million in revenue.
Table 19: Form I-910 Revenue Distribution of Matched Small Entities, FY 2017.
Revenue Range of Matched Small
Entities
Identified in Hoover's
Identified via Manta, Cortera,
or Guidestar Total Percentage Cumulative
Percentage
< $100K 26 5 31 16.4 16.4 $100K to < $500K 82 8 90 47.6 64.0 $500K to < $1M 23 11 34 18.0 82.0 $1M to < $5M 20 6 26 13.8 95.8 $5M to < $10M 4 0 4 2.1 97.9
$10M to < $50M 4 0 4 2.1 100.0 $50M to < $100M 0 0 0 0.0 100.0
>= $100M 0 0 0 0.0 100.0
Missing revenue data 0 0 0 0.0 100.0
AILA Doc. No. 20073100. (Posted 8/4/20)
20
Table 19: Form I-910 Revenue Distribution of Matched Small Entities, FY 2017.
Revenue Range of Matched Small
Entities
Identified in Hoover's
Identified via Manta, Cortera,
or Guidestar Total Percentage Cumulative
Percentage
Total 159 30 189 100.0 Source: USCIS analysis.
The plurality of petitioners (table 20) in the sample were submitted by businesses in
Florida, with 42 (or 14.0 percent of 300 total requesters/applicants), followed by New York, California, Texas, and New Jersey. Together, these top five states accounted for 176 applicants— as with the Forms I-129 and I-140 petitions more than half of the sample.
Table 20: Form I-910 Geographic Distribution of Petitioners in Sample, Top 10 States, FY 2017.
Rank State Number of Petitioners Proportion of Sample
1 Florida (FL) 42 14.0 2 New York (NY) 40 13.3 3 California (CA) 36 12.0 4 Texas (TX) 34 11.3 5 New Jersey (NJ) 24 8.0 6 Illinois (IL) 19 6.3 7 Virginia (VA) 9 3.0 8 Pennsylvania (PA) 8 2.7 9 Georgia (GA) 7 2.3
10 Maryland (MD) 7 2.3 Source: USCIS analysis.
Discussion of Impacts USCIS is decreasing the fee for Form I-910 to $635, a decrease of $150 (19 percent)
from the current $785 fee. In order to calculate the economic impact of this decrease, USCIS estimated the total cost savings associated with the fee decrease for each entity and divided that amount by the sales revenue of that entity.27, 28 Because entities can file multiple requests, the analysis considers the number of requests submitted by each entity. Entities that were considered small based on employee count with missing revenue data were excluded. Among the 189 small entities with reported revenue data, all experienced an economic impact considerably less than 1 percent. As a result of the fee decrease, these small entities will see a cost savings ($150 per application) in filing fees based on application. The greatest economic impact by this fee change totaled -1.50 percent and the smallest totaled -0.001 percent. The average impact on all 189 small entities with revenue data was -0.116 percent. The higher the negative number would produce a greater cost savings for the applicants. The negative number
27 Total Impact to Entity = (Number of Petitions Submitted per Entity * -$150) / Entity Sales Revenue. 28 USCIS used the lower end of the sales revenue range for those entities where ranges were provided.
AILA Doc. No. 20073100. (Posted 8/4/20)
21
represents cost savings to the applicant. Therefore, the larger it is, the greater the cost savings for the applicants. The evidence suggests that the decreased fee does not represent a significant economic impact on these entities.
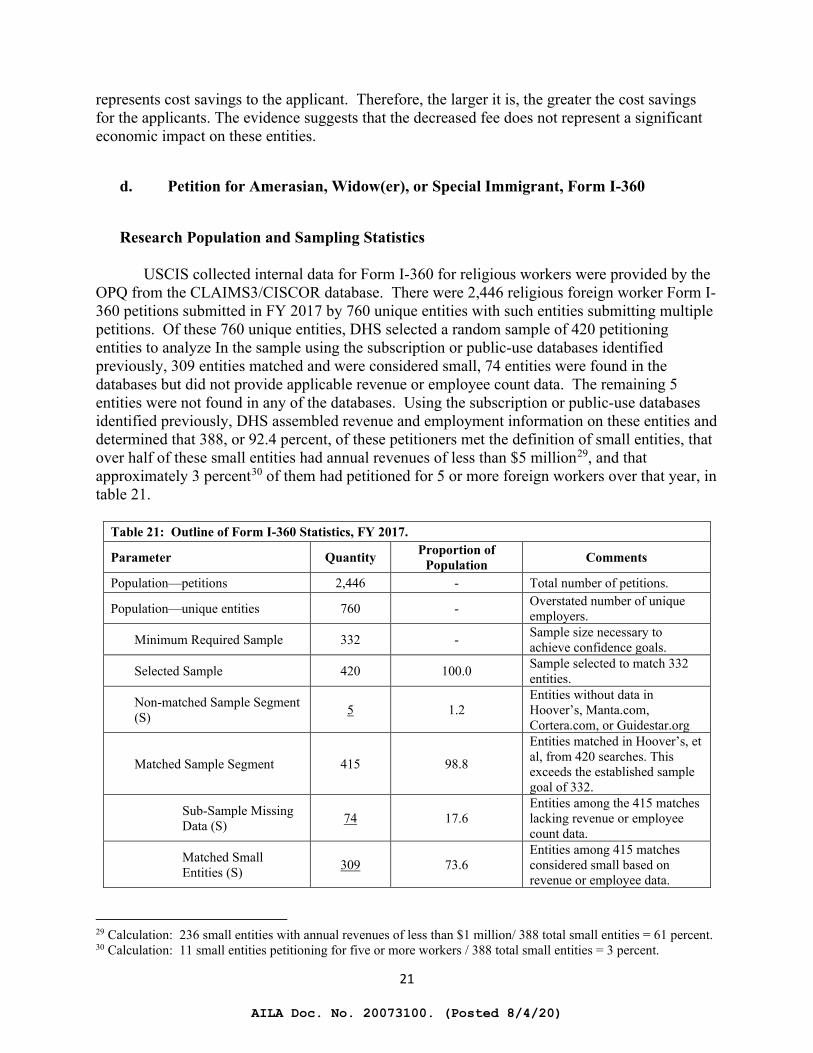
d. Petition for Amerasian, Widow(er), or Special Immigrant, Form I-360
Research Population and Sampling Statistics
USCIS collected internal data for Form I-360 for religious workers were provided by the OPQ from the CLAIMS3/CISCOR database. There were 2,446 religious foreign worker Form I-360 petitions submitted in FY 2017 by 760 unique entities with such entities submitting multiple petitions. Of these 760 unique entities, DHS selected a random sample of 420 petitioning entities to analyze In the sample using the subscription or public-use databases identified previously, 309 entities matched and were considered small, 74 entities were found in the databases but did not provide applicable revenue or employee count data. The remaining 5 entities were not found in any of the databases. Using the subscription or public-use databases identified previously, DHS assembled revenue and employment information on these entities and determined that 388, or 92.4 percent, of these petitioners met the definition of small entities, that over half of these small entities had annual revenues of less than $5 million29, and that approximately 3 percent30 of them had petitioned for 5 or more foreign workers over that year, in table 21.
Table 21: Outline of Form I-360 Statistics, FY 2017.
Parameter Quantity Proportion of Population Comments
Population—petitions 2,446 - Total number of petitions.
Population—unique entities 760 - Overstated number of unique employers.
Minimum Required Sample 332 - Sample size necessary to achieve confidence goals.
Selected Sample 420 100.0 Sample selected to match 332 entities.
Non-matched Sample Segment (S) 5 1.2
Entities without data in Hoover’s, Manta.com, Cortera.com, or Guidestar.org
Matched Sample Segment 415 98.8
Entities matched in Hoover’s, et al, from 420 searches. This exceeds the established sample goal of 332.
Sub-Sample Missing Data (S) 74 17.6
Entities among the 415 matches lacking revenue or employee count data.
Matched Small Entities (S) 309 73.6
Entities among 415 matches considered small based on revenue or employee data.
29 Calculation: 236 small entities with annual revenues of less than $1 million/ 388 total small entities = 61 percent. 30 Calculation: 11 small entities petitioning for five or more workers / 388 total small entities = 3 percent.
AILA Doc. No. 20073100. (Posted 8/4/20)
22
Table 21: Outline of Form I-360 Statistics, FY 2017.
Parameter Quantity Proportion of Population Comments
Matched Non-small Entities 32 7.6 Number of non-small entities
out of the 415 matches. Number of small entities discovered in research 388 92.4 309 + 74 + 5 = 388
Source: USCIS analysis.
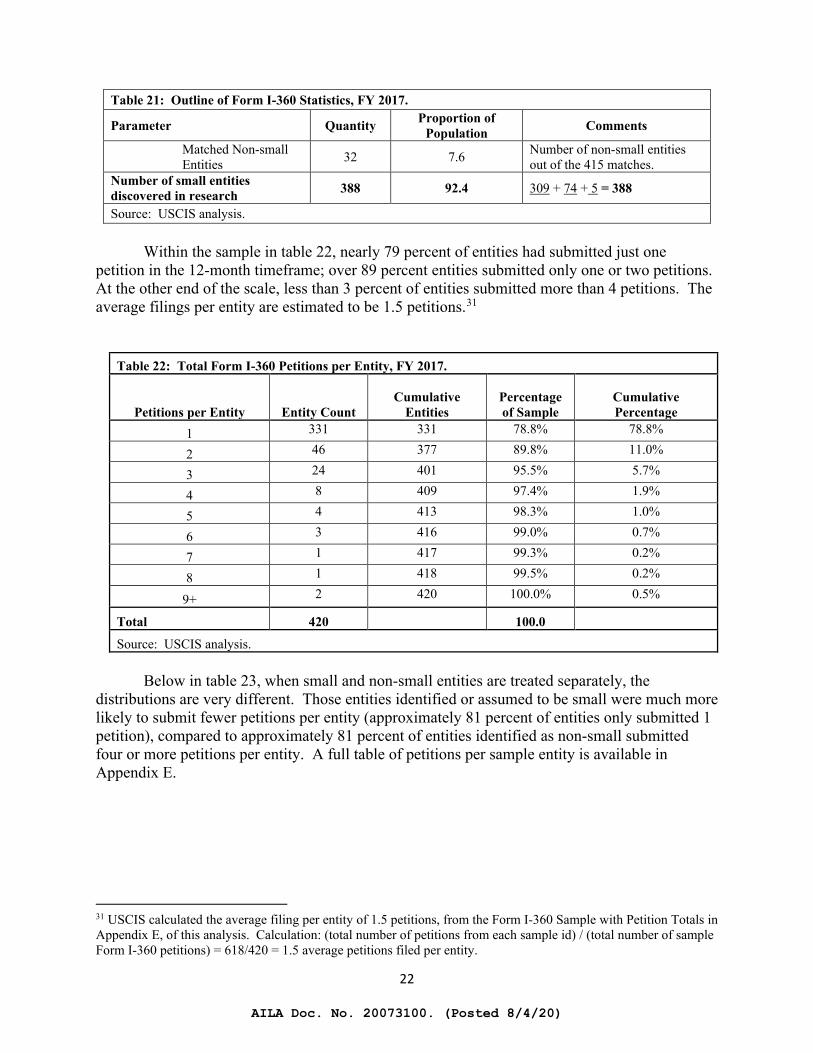
Within the sample in table 22, nearly 79 percent of entities had submitted just one petition in the 12-month timeframe; over 89 percent entities submitted only one or two petitions. At the other end of the scale, less than 3 percent of entities submitted more than 4 petitions. The average filings per entity are estimated to be 1.5 petitions.31
Table 22: Total Form I-360 Petitions per Entity, FY 2017.
Petitions per Entity Entity Count Cumulative
Entities Percentage of Sample
Cumulative Percentage
1 331 331 78.8% 78.8%
2 46 377 89.8% 11.0%
3 24 401 95.5% 5.7%
4 8 409 97.4% 1.9%
5 4 413 98.3% 1.0%
6 3 416 99.0% 0.7%
7 1 417 99.3% 0.2%
8 1 418 99.5% 0.2%
9+ 2 420 100.0% 0.5%
Total 420 100.0
Source: USCIS analysis. Below in table 23, when small and non-small entities are treated separately, the
distributions are very different. Those entities identified or assumed to be small were much more likely to submit fewer petitions per entity (approximately 81 percent of entities only submitted 1 petition), compared to approximately 81 percent of entities identified as non-small submitted four or more petitions per entity. A full table of petitions per sample entity is available in Appendix E.
31 USCIS calculated the average filing per entity of 1.5 petitions, from the Form I-360 Sample with Petition Totals in Appendix E, of this analysis. Calculation: (total number of petitions from each sample id) / (total number of sample Form I-360 petitions) = 618/420 = 1.5 average petitions filed per entity.
AILA Doc. No. 20073100. (Posted 8/4/20)
23
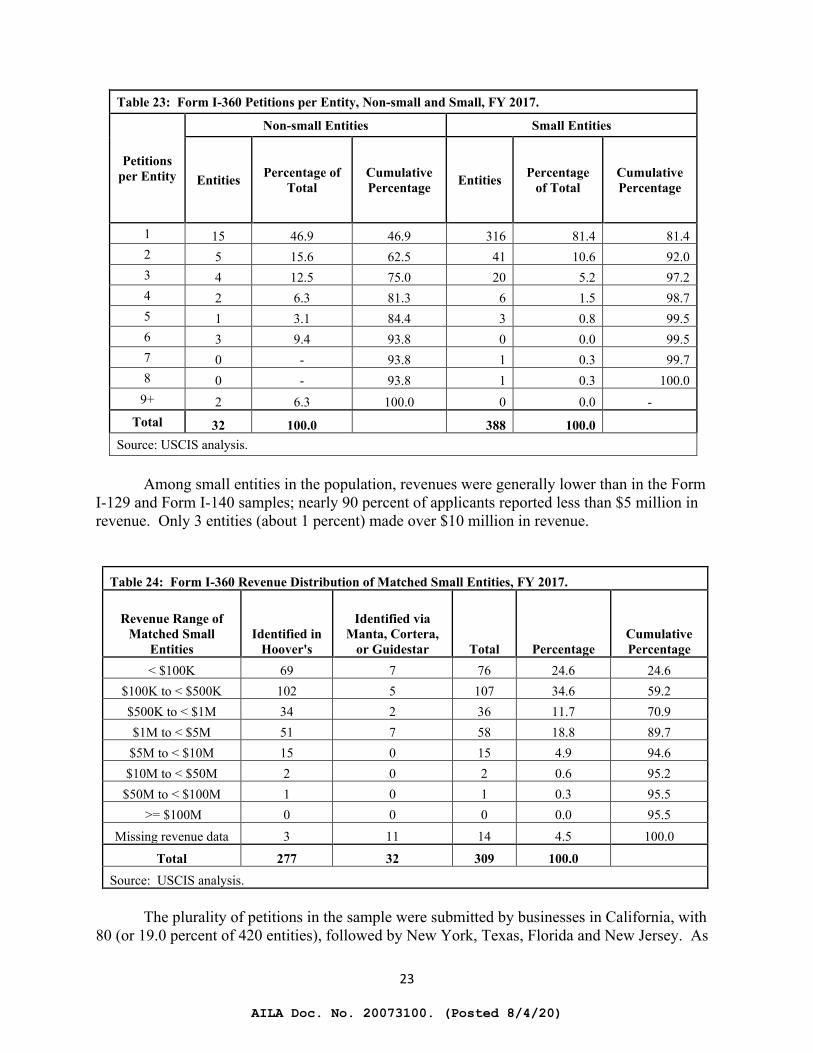
Table 23: Form I-360 Petitions per Entity, Non-small and Small, FY 2017.
Petitions per Entity
Non-small Entities Small Entities
Entities Percentage of Total
Cumulative Percentage Entities Percentage
of Total Cumulative Percentage
1 15 46.9 46.9 316 81.4 81.4 2 5 15.6 62.5 41 10.6 92.0 3 4 12.5 75.0 20 5.2 97.2 4 2 6.3 81.3 6 1.5 98.7 5 1 3.1 84.4 3 0.8 99.5 6 3 9.4 93.8 0 0.0 99.5 7 0 - 93.8 1 0.3 99.7 8 0 - 93.8 1 0.3 100.0
9+ 2 6.3 100.0 0 0.0 - Total 32 100.0 388 100.0
Source: USCIS analysis.
Among small entities in the population, revenues were generally lower than in the Form I-129 and Form I-140 samples; nearly 90 percent of applicants reported less than $5 million in revenue. Only 3 entities (about 1 percent) made over $10 million in revenue.
Table 24: Form I-360 Revenue Distribution of Matched Small Entities, FY 2017.
Revenue Range of Matched Small
Entities Identified in
Hoover's
Identified via Manta, Cortera,
or Guidestar Total Percentage Cumulative Percentage
< $100K 69 7 76 24.6 24.6 $100K to < $500K 102 5 107 34.6 59.2 $500K to < $1M 34 2 36 11.7 70.9 $1M to < $5M 51 7 58 18.8 89.7 $5M to < $10M 15 0 15 4.9 94.6
$10M to < $50M 2 0 2 0.6 95.2 $50M to < $100M 1 0 1 0.3 95.5
>= $100M 0 0 0 0.0 95.5 Missing revenue data 3 11 14 4.5 100.0
Total 277 32 309 100.0 Source: USCIS analysis.
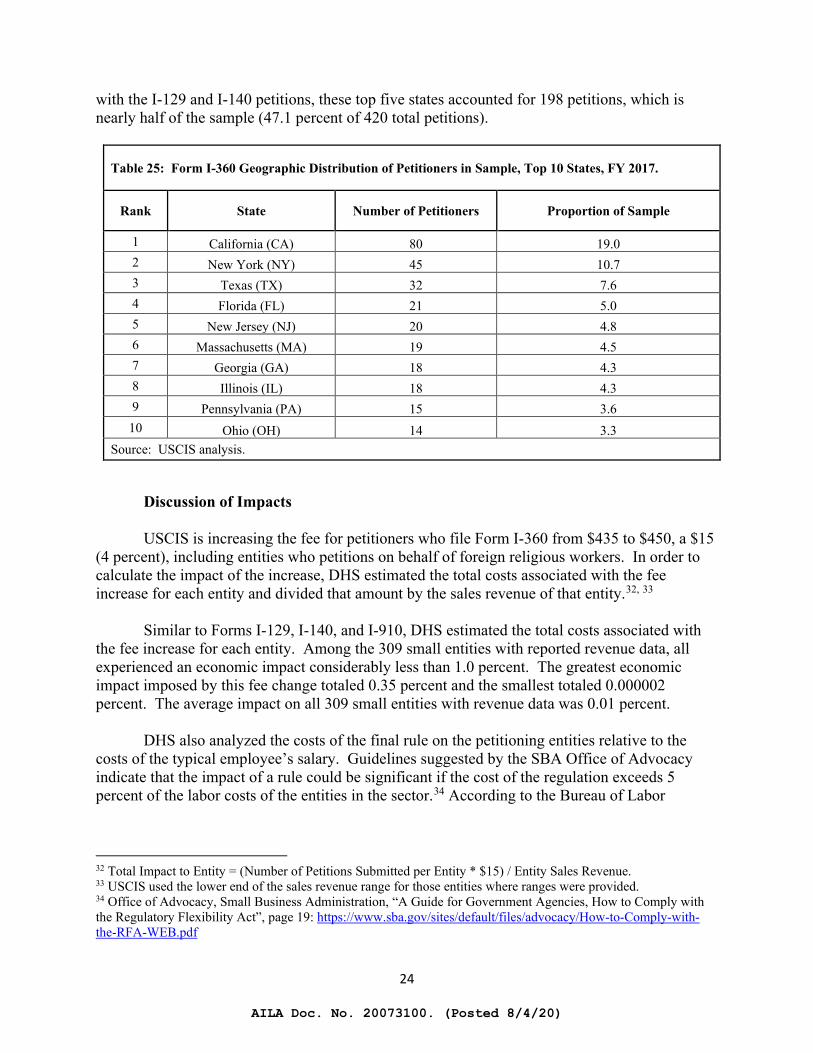
The plurality of petitions in the sample were submitted by businesses in California, with
80 (or 19.0 percent of 420 entities), followed by New York, Texas, Florida and New Jersey. As
AILA Doc. No. 20073100. (Posted 8/4/20)
24
with the I-129 and I-140 petitions, these top five states accounted for 198 petitions, which is nearly half of the sample (47.1 percent of 420 total petitions).
Table 25: Form I-360 Geographic Distribution of Petitioners in Sample, Top 10 States, FY 2017.
Rank State Number of Petitioners Proportion of Sample
1 California (CA) 80 19.0 2 New York (NY) 45 10.7 3 Texas (TX) 32 7.6 4 Florida (FL) 21 5.0 5 New Jersey (NJ) 20 4.8 6 Massachusetts (MA) 19 4.5 7 Georgia (GA) 18 4.3 8 Illinois (IL) 18 4.3 9 Pennsylvania (PA) 15 3.6
10 Ohio (OH) 14 3.3 Source: USCIS analysis.
Discussion of Impacts USCIS is increasing the fee for petitioners who file Form I-360 from $435 to $450, a $15
(4 percent), including entities who petitions on behalf of foreign religious workers. In order to calculate the impact of the increase, DHS estimated the total costs associated with the fee increase for each entity and divided that amount by the sales revenue of that entity.32, 33
Similar to Forms I-129, I-140, and I-910, DHS estimated the total costs associated with
the fee increase for each entity. Among the 309 small entities with reported revenue data, all experienced an economic impact considerably less than 1.0 percent. The greatest economic impact imposed by this fee change totaled 0.35 percent and the smallest totaled 0.000002 percent. The average impact on all 309 small entities with revenue data was 0.01 percent.
DHS also analyzed the costs of the final rule on the petitioning entities relative to the
costs of the typical employee’s salary. Guidelines suggested by the SBA Office of Advocacy indicate that the impact of a rule could be significant if the cost of the regulation exceeds 5 percent of the labor costs of the entities in the sector.34 According to the Bureau of Labor
32 Total Impact to Entity = (Number of Petitions Submitted per Entity * $15) / Entity Sales Revenue. 33 USCIS used the lower end of the sales revenue range for those entities where ranges were provided. 34 Office of Advocacy, Small Business Administration, “A Guide for Government Agencies, How to Comply with the Regulatory Flexibility Act”, page 19: https://www.sba.gov/sites/default/files/advocacy/How-to-Comply-with-the-RFA-WEB.pdf
AILA Doc. No. 20073100. (Posted 8/4/20)
25
Statistics (BLS), the mean annual salary is $53,290 for clergy,35 $46,980 for directors of religious activities and education,36 and $35,860 for other religious workers.37 Based on an average of 1.5 religious workers38 petitioned-for per entity, the additional average annual cost will be $22 per entity.39 The additional costs per entity in this rule represents only 0.04 percent of the average annual salary for clergy, 0.05 percent of the average annual salary for directors of religious activities and education, and 0.06 percent of the average annual salary for all other religious workers.40 Therefore, using average annual labor cost guidelines, the additional regulatory compliance costs in this final rule are not significant.
e. Genealogy Requests, Form G-1041 (Index Search Request) and Form G-1041A (Record Request)
In this final rule, DHS establishes a fee for the Genealogy Index Search Request, Form
G-1041 to increase from $65 to $170, an increase of $105 (162 percent) for those who mail in this request on paper. This rule increases the fee for requestors who use the online electronic Form G-1041 version from the current $65 to $160, an increase of $95 (146 percent).
In this final rule, DHS establishes a fee for Form G-1041A would increase from $65 to
$265, an increase of $200 (308 percent) for those who mail in this request on paper. In this rule, requestors who use the online electronic Form G-1041A will pay from the current $65 to $255, an increase of $190 (292 percent).
Based on DHS records in Table 26, an average of 3,840 requests were made annually for
an index search and an average of 2,152 records requests were made annually over the 5 calendar year span of 2013 to 2017. DHS does not have sufficient data on the requesters for the genealogy forms to determine if entities or individuals submitted these requests. The case management tracking system used by DHS for genealogy requests does not allow for requester’s data to be readily pulled.
35 Bureau of Labor Statistics, U.S. Department of Labor, “Occupational Employment Statistics, May 2018, “Clergy”: https://www.bls.gov/oes/2018/may/oes212011.htm. 36 Bureau of Labor Statistics, U.S. Department of Labor, “Occupational Employment Statistics, May 2018, “Directors of Religious Activities and Education”: https://www.bls.gov/oes/2018/may/oes212021.htm. 37 Bureau of Labor Statistics, U.S. Department of Labor, “Occupational Employment Statistics, May 2018, “Religious Workers, All Other”: https://www.bls.gov/oes/2018/may/oes212099.htm. 38 USCIS calculated the average filing per entity of 1.5 petitions, from the Form I-360 Sample with Petition Totals in Appendix E of this analysis. Calculation: (total number of petitions from each sample id) / (total number of sample Form I-360 petitions) = 618/420 = 1.5 average petitions filed per entity. 39 Calculation: 1.5 average petitions per entity * $15 increase in petition fees = approximately $22 additional total cost per entity. 40 Calculation: ($22 per entity / $53,290 clergy salary) x 100 =.04 percent;
($22 per entity / $46,980 directors of religious activities and education) x 100 =.05 percent; ($22 per entity / $35,860 other religious workers) x 100 =.06 percent.
AILA Doc. No. 20073100. (Posted 8/4/20)
26
Table 26: USCIS Genealogy Form Receipts (Calendar Year), 2015 – 2017.
Form Type 2013 2014 2015 2016 2017 5-year Total
5 – year Average
Genealogy Index Search Request, Form G-1041
3,662 4,167 4,897 3,164 3,310 19,200 3,840
Genealogy Records Request, Form G-1041A
2,219 2,036 2,344 1,534 2,626 10,759 2,152
Source: DHS, USCIS, Immigration Records and Identity Services (IRIS) Directorate, Records Information Systems Branch (RISB).
DHS has previously determined that requests for historical records are usually made by
individuals.41 If professional genealogists and researchers submitted such requests in the past, they did not identify themselves as commercial requesters and therefore could not be separated within the data. Genealogists typically advise clients on how to submit their own requests. For those that submit requests on behalf of clients, DHS does not know the extent to which they can pass along the fee increases to their individual clients. Therefore, DHS does not currently have sufficient data to definitively assess the impact on small entities for these requests. However, DHS must still recover the full costs of this program. As stated in the preamble to this rule, reducing the filing fee for any one benefit request submitted to DHS simply transfers the additional cost to process this request to other immigration and naturalization filing fees.
For this final rule, DHS is expanding the use of electronic genealogy requests to
encourage requesters to use the electronic versions of Form G-1041 and Form G–1041A. DHS is also changing the search request process so that USCIS may provide requesters with electronic records, if they exist, in response to the initial index request. These changes may reduce the time it takes to request and receive genealogy records, and, in some cases, it will eliminate the need to make multiple search requests and submit separate fees. Moreover, DHS notes that providing digital records in response to a Form G-1041 request may reduce the number of Form G-1041A requests that will be filed since there would already be a copy of the record if it was previously digitized. DHS recognizes that some small entities may be impacted by these proposed increased fees but cannot determine how many or the exact impact.
f. Regional Center Designation Under the Immigrant Investor Program, Form I-924 and I-924A
As part of the Immigration Act of 1990, Public Law 101-649, 104 Stat. 4978, Congress established the EB-5 immigrant visa classification to incentivize employment creation in the United States. Under the EB-5 program, lawful permanent resident (LPR) status is available to foreign nationals who invest the required amount in a new commercial enterprise (NCE) that will create at least 10 full-time jobs in the United States. See INA section 203(b)(5), 8 U.S.C.
41 See “Establishment of a Genealogy Program; Proposed Rule,” 71 FR 20357 – 20368 (April 20, 2006). Available at: https://www.regulations.gov/document?D=USCIS-2006-0013-0001.
AILA Doc. No. 20073100. (Posted 8/4/20)
27
1153(b)(5). A foreign national may also invest a lower amount in a targeted employment area (TEA), defined to include rural areas and areas of high unemployment. Id.; 8 CFR 204.6(f). The INA allots 9,940 immigrant visas each fiscal year for foreign nationals seeking to enter the United States under the EB-5 classification.42 See INA section 201(d), 8 U.S.C. 1151(d); INA section 203(b)(5), 8 U.S.C. 1153(b)(5). Not less than 3,000 of these visas must be reserved for foreign nationals investing in TEAs. See INA section 203(b)(5)(B), 8 U.S.C. 1153(b)(5)(B). Enacted in 1992, section 610 of the Departments of Commerce, Justice, and State, the Judiciary, and Related Agencies Appropriations Act, 1993, Public Law 102-395, 106 Stat. 1828 (Oct. 6, 1992), established a pilot program that requires the allocation of a limited number of EB-5 immigrant visas to individuals who invest through DHS-designated regional centers.43 Under the Regional Center Program, foreign nationals based their EB-5 petitions on investments in new commercial enterprises located within “regional centers.” DHS regulations define a regional center as an economic unit, public or private, that promotes economic growth, regional productivity, job creation, and increased domestic capital investment. See 8 CFR 204.6(e). As of August 12, 2019, there are 826 USCIS-approved Regional Centers.44 Requests for regional center designation must be filed with USCIS on Form I-924, Application for Regional Center Designation Under the Immigrant Investor Program. See 8 CFR 204.6(m)(3)-(4). Once designated, regional centers must provide USCIS with updated information to demonstrate continued eligibility for the designation by submitting Form I-924A, Annual Certification of Regional Center on an annual basis or as otherwise requested. See 8 CFR 204.6(m)(6)(i)(B).
DHS is not changing the $17,795 fee for entities seeking designation as a regional center under the Immigrant Investor Program, Form I-924. However, DHS is increasing the fee for the annual filings of Form I-924A from $3,035 to $4,465, an increase of $1,430 per filing (47 percent).45 The application process would require the same information from applicants that is currently required. During the 12-month period from October 1, 2016 to September 31, 2017, USCIS received a total of 280 Form I-924 applications and 847 Form I-924A applications.46
Discussion of Impacts
DHS is not changing the fee for the Application for Regional Center Designation Under the Immigrant Investor Program, Form I-924. However, DHS is increasing the filing fee for Form I-924A from $3,035 to $4,465.
42 An immigrant investor, his or her spouse, and children (if any) will each use a separate visa number. 43 Current law requires that DHS annually set aside 3,000 EB-5 immigrant visas for regional center investors. Section 116 of Public Law 105-119, 111 Stat. 2440 (Nov. 26, 1997). If this full annual allocation is not used, remaining visas may be allocated to foreign nationals who do not invest in regional centers. 44 USCIS Immigrant Investor Regional Centers: https://www.uscis.gov/working-united-states/permanent-workers/employment-based-immigration-fifth-preference-eb-5/immigrant-investor-regional-centers. 45 The Supplement to Form I-924A is used to certify a Regional Center’s continued eligibility for the Regional Center designation through an annual certification. Each designated Regional Center entity must file a Form I-924A for each fiscal year within 90 days after the end of the fiscal year of the calendar year in which the fiscal year ended. See http://www.uscis.gov/i-924a. 46 Department of Homeland Security, U.S. Citizenship and Immigration Services, Performance Reporting Tool, March 2018.
AILA Doc. No. 20073100. (Posted 8/4/20)
28
Regional centers are difficult to assess because there is a lack of official data on employment, income, and industry classification for these entities. It is difficult to determine the small entity status of regional centers without such data. Such a determination is also difficult because regional centers can be structured in a variety of different ways, and can involve multiple business and financial activities, some of which may play a direct or indirect role in linking investor funds to new commercial enterprises (NCEs) and job-creating projects or entities. Regional centers also pose a challenge for analysis as the structure is often complex and can involve many related business and financial activities not directly involved with EB-5 activities. Regional centers can be made up of several layers of business and financial activities that focus on matching foreign investor funds to development projects to capture above market return differentials. In the past, DHS has attempted to treat the regional centers similar to the other entities in this analysis. DHS was not able to identify most of the entities in any of the public or private databases. Furthermore, while regional centers are an integral component of the EB-5 program, DHS does not collect data on the administrative fees the regional centers charge to the foreign investors who are investing in one of their projects. DHS did not focus on the bundled capital investment amounts (either $900,000 for TEA projects or $1.8 million for a non-TEA projects per investor)47 that get invested into an NCE. Such investment amounts are not necessarily indicative of whether the regional center is appropriately characterized as a small entity for purposes of the RFA. Due to the lack of regional center revenue data, DHS assumes regional centers collect revenue primarily through the administrative fees charged to investors.
DHS did consider the information provided by regional center applicants as part of the Forms I-924 and I-924A, however, it does not include adequate data to allow DHS to reliably identify the small entity status of individual applicants. Although regional center applicants typically report the North American Industry Classification (NAICS) codes associated with the sectors they plan to direct investor funds toward, these codes do not necessarily apply to the regional centers themselves. In addition, information provided to DHS concerning regional centers generally does not include regional center revenues or employment.
DHS was able to obtain some information under some specific assumptions in an attempt
to analyze the small entity status of regional centers. In the DHS final rule “EB-5 Immigrant Investor Program Modernization,” DHS analyzed estimated administrative fees and revenue amounts for regional centers.48 DHS found both the mean and median for administrative fees to be $50,000 and the median revenue amount to be $1,250,000 over the period fiscal years 2014 to 2017. DHS does not know the extent to which these regional centers can pass along the fee increases to the individual investors. Passing along the costs from this rule can reduce or eliminate the economic impacts to the regional centers. While DHS cannot definitively claim there is no significant economic impact to these small entities based on existing information, DHS would assume existing regional centers with revenues equal to or less than $446,500 per year (some of which DHS assumes would be derived from administrative fees charged to individual investors) could experience a significant economic impact if DHS assumes a fee
47 U.S. Department of Homeland Security, USCIS – EB-5 Immigrant Investor Program Modernization, Final Rule. See 84 FR 35750. Dated July 24, 2019. Available at https://www.govinfo.gov/content/pkg/FR-2019-07-24/pdf/2019-15000.pdf. This amount by investor is determined between a designated Target Employment Area and non-Target Employment Area. 48 Ibid.
AILA Doc. No. 20073100. (Posted 8/4/20)
29
increase that represents 1 percent of annual revenue is a “significant” economic burden under the RFA.49
49 Calculation: 1 percent of $446,500 = $4,465 (the new fee for Form I-924A).
AILA Doc. No. 20073100. (Posted 8/4/20)
30
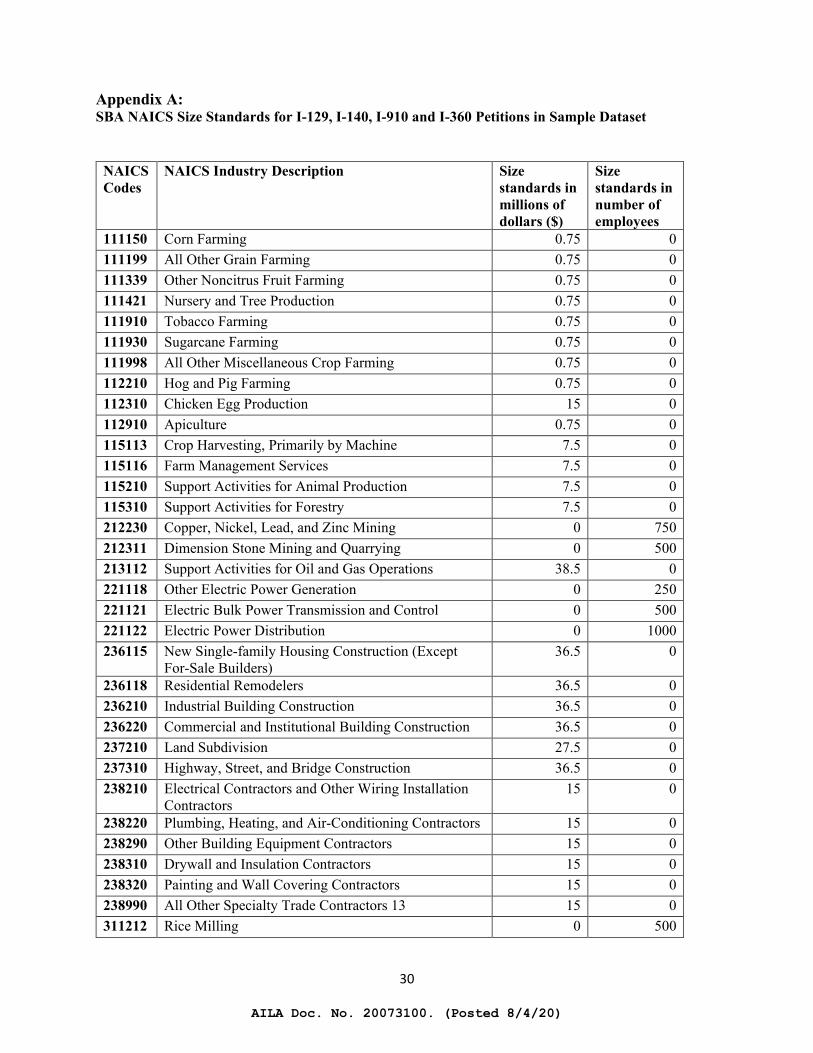
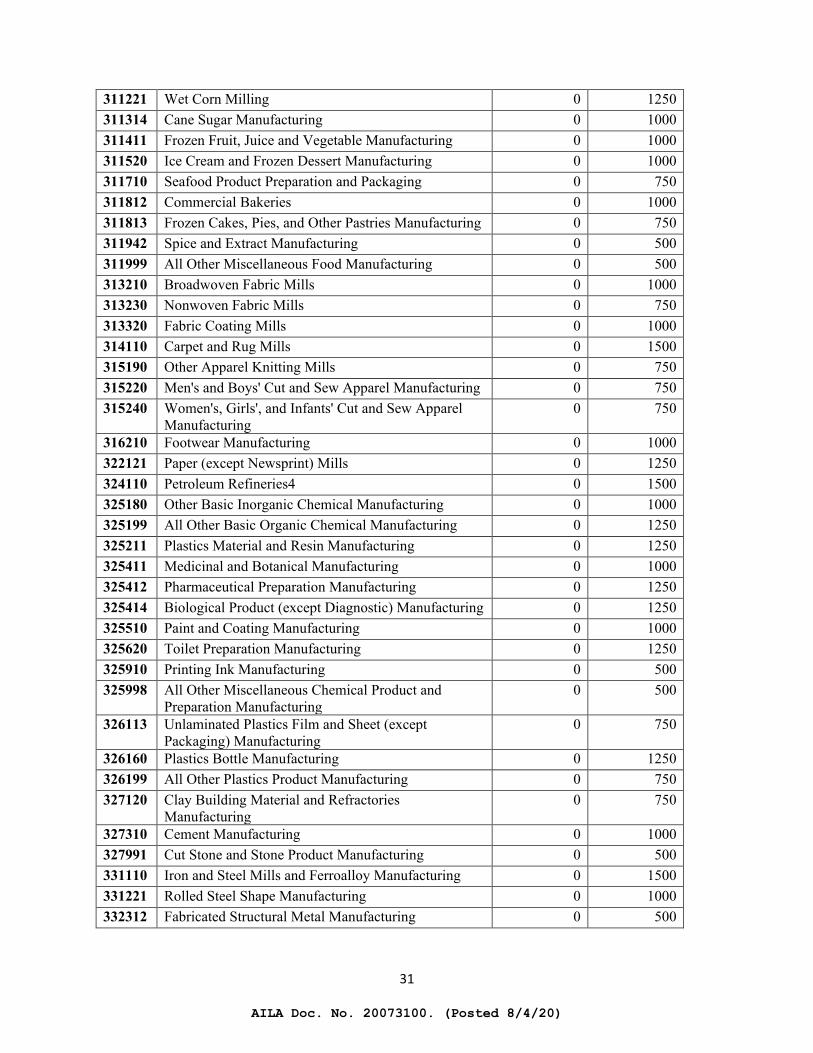
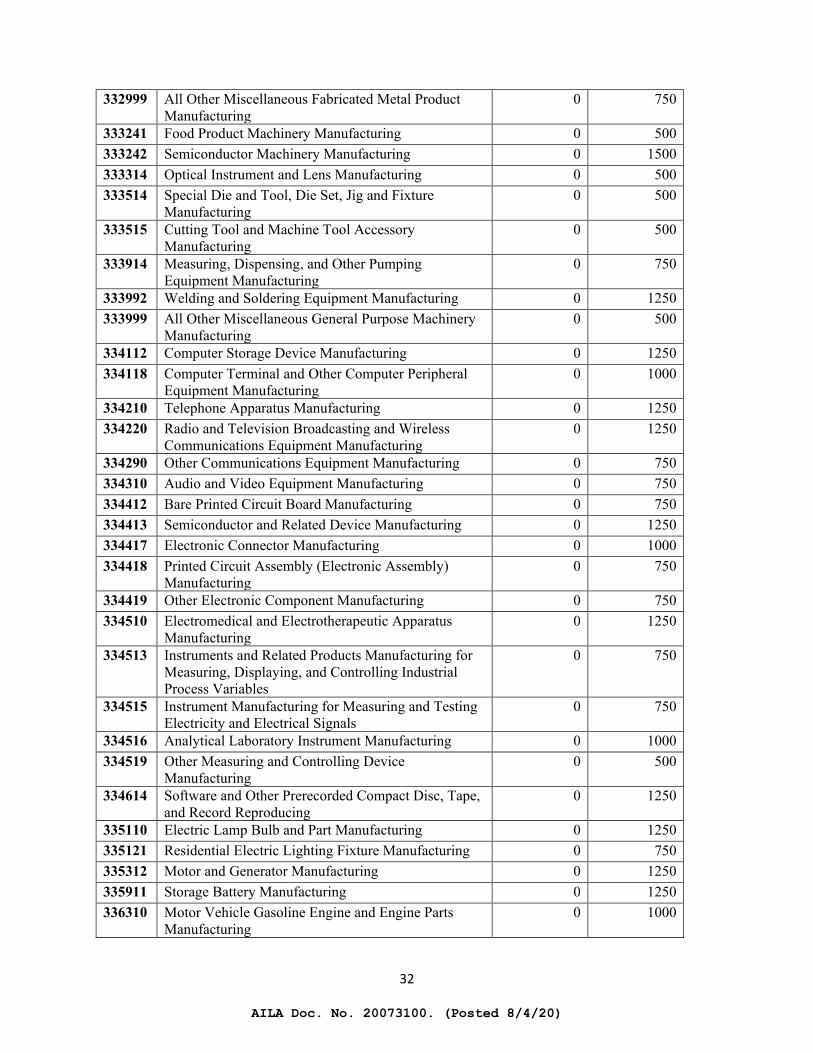
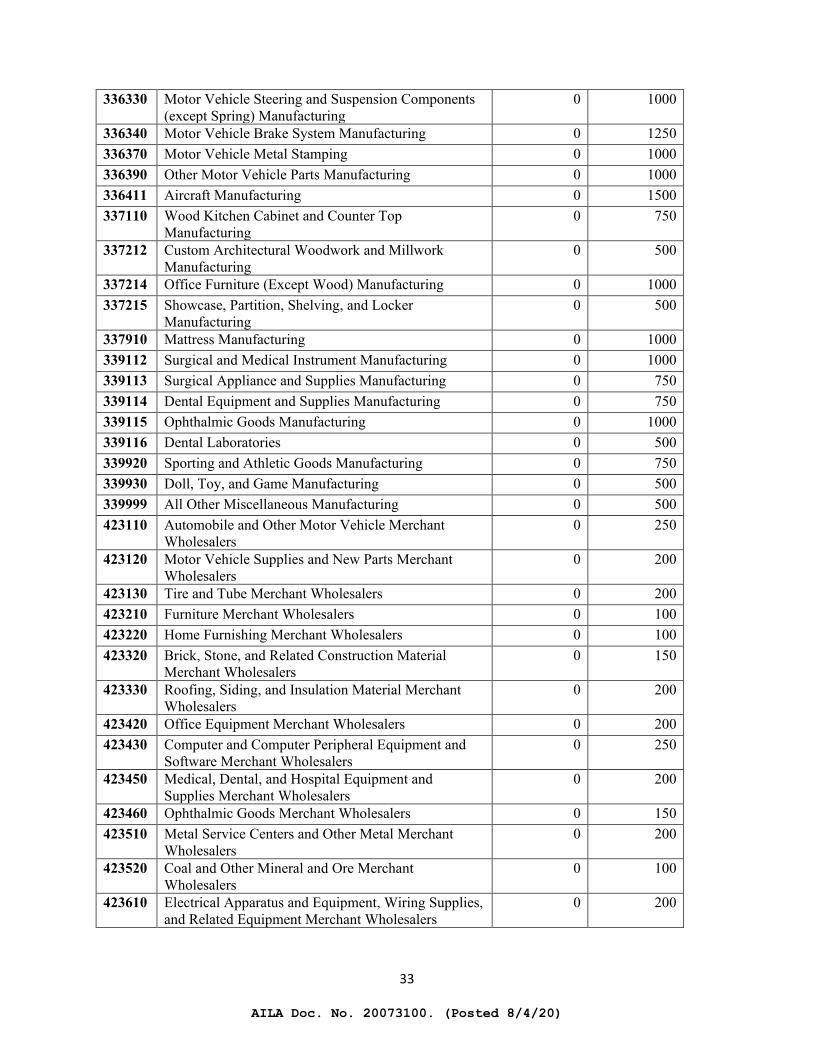
Appendix A: SBA NAICS Size Standards for I-129, I-140, I-910 and I-360 Petitions in Sample Dataset
NAICS Codes
NAICS Industry Description Size standards in millions of dollars ($)
Size standards in number of employees
111150 Corn Farming 0.75 0 111199 All Other Grain Farming 0.75 0 111339 Other Noncitrus Fruit Farming 0.75 0 111421 Nursery and Tree Production 0.75 0 111910 Tobacco Farming 0.75 0 111930 Sugarcane Farming 0.75 0 111998 All Other Miscellaneous Crop Farming 0.75 0 112210 Hog and Pig Farming 0.75 0 112310 Chicken Egg Production 15 0 112910 Apiculture 0.75 0 115113 Crop Harvesting, Primarily by Machine 7.5 0 115116 Farm Management Services 7.5 0 115210 Support Activities for Animal Production 7.5 0 115310 Support Activities for Forestry 7.5 0 212230 Copper, Nickel, Lead, and Zinc Mining 0 750 212311 Dimension Stone Mining and Quarrying 0 500 213112 Support Activities for Oil and Gas Operations 38.5 0 221118 Other Electric Power Generation 0 250 221121 Electric Bulk Power Transmission and Control 0 500 221122 Electric Power Distribution 0 1000 236115 New Single-family Housing Construction (Except
For-Sale Builders) 36.5 0
236118 Residential Remodelers 36.5 0 236210 Industrial Building Construction 36.5 0 236220 Commercial and Institutional Building Construction 36.5 0 237210 Land Subdivision 27.5 0 237310 Highway, Street, and Bridge Construction 36.5 0 238210 Electrical Contractors and Other Wiring Installation
Contractors 15 0
238220 Plumbing, Heating, and Air-Conditioning Contractors 15 0 238290 Other Building Equipment Contractors 15 0 238310 Drywall and Insulation Contractors 15 0 238320 Painting and Wall Covering Contractors 15 0 238990 All Other Specialty Trade Contractors 13 15 0 311212 Rice Milling 0 500
AILA Doc. No. 20073100. (Posted 8/4/20)
31
311221 Wet Corn Milling 0 1250 311314 Cane Sugar Manufacturing 0 1000 311411 Frozen Fruit, Juice and Vegetable Manufacturing 0 1000 311520 Ice Cream and Frozen Dessert Manufacturing 0 1000 311710 Seafood Product Preparation and Packaging 0 750 311812 Commercial Bakeries 0 1000 311813 Frozen Cakes, Pies, and Other Pastries Manufacturing 0 750 311942 Spice and Extract Manufacturing 0 500 311999 All Other Miscellaneous Food Manufacturing 0 500 313210 Broadwoven Fabric Mills 0 1000 313230 Nonwoven Fabric Mills 0 750 313320 Fabric Coating Mills 0 1000 314110 Carpet and Rug Mills 0 1500 315190 Other Apparel Knitting Mills 0 750 315220 Men's and Boys' Cut and Sew Apparel Manufacturing 0 750 315240 Women's, Girls', and Infants' Cut and Sew Apparel
Manufacturing 0 750
316210 Footwear Manufacturing 0 1000 322121 Paper (except Newsprint) Mills 0 1250 324110 Petroleum Refineries4 0 1500 325180 Other Basic Inorganic Chemical Manufacturing 0 1000 325199 All Other Basic Organic Chemical Manufacturing 0 1250 325211 Plastics Material and Resin Manufacturing 0 1250 325411 Medicinal and Botanical Manufacturing 0 1000 325412 Pharmaceutical Preparation Manufacturing 0 1250 325414 Biological Product (except Diagnostic) Manufacturing 0 1250 325510 Paint and Coating Manufacturing 0 1000 325620 Toilet Preparation Manufacturing 0 1250 325910 Printing Ink Manufacturing 0 500 325998 All Other Miscellaneous Chemical Product and
Preparation Manufacturing 0 500
326113 Unlaminated Plastics Film and Sheet (except Packaging) Manufacturing
0 750
326160 Plastics Bottle Manufacturing 0 1250 326199 All Other Plastics Product Manufacturing 0 750 327120 Clay Building Material and Refractories
Manufacturing 0 750
327310 Cement Manufacturing 0 1000 327991 Cut Stone and Stone Product Manufacturing 0 500 331110 Iron and Steel Mills and Ferroalloy Manufacturing 0 1500 331221 Rolled Steel Shape Manufacturing 0 1000 332312 Fabricated Structural Metal Manufacturing 0 500
AILA Doc. No. 20073100. (Posted 8/4/20)
32
332999 All Other Miscellaneous Fabricated Metal Product Manufacturing
0 750
333241 Food Product Machinery Manufacturing 0 500 333242 Semiconductor Machinery Manufacturing 0 1500 333314 Optical Instrument and Lens Manufacturing 0 500 333514 Special Die and Tool, Die Set, Jig and Fixture
Manufacturing 0 500
333515 Cutting Tool and Machine Tool Accessory Manufacturing
0 500
333914 Measuring, Dispensing, and Other Pumping Equipment Manufacturing
0 750
333992 Welding and Soldering Equipment Manufacturing 0 1250 333999 All Other Miscellaneous General Purpose Machinery
Manufacturing 0 500
334112 Computer Storage Device Manufacturing 0 1250 334118 Computer Terminal and Other Computer Peripheral
Equipment Manufacturing 0 1000
334210 Telephone Apparatus Manufacturing 0 1250 334220 Radio and Television Broadcasting and Wireless
Communications Equipment Manufacturing 0 1250
334290 Other Communications Equipment Manufacturing 0 750 334310 Audio and Video Equipment Manufacturing 0 750 334412 Bare Printed Circuit Board Manufacturing 0 750 334413 Semiconductor and Related Device Manufacturing 0 1250 334417 Electronic Connector Manufacturing 0 1000 334418 Printed Circuit Assembly (Electronic Assembly)
Manufacturing 0 750
334419 Other Electronic Component Manufacturing 0 750 334510 Electromedical and Electrotherapeutic Apparatus
Manufacturing 0 1250
334513 Instruments and Related Products Manufacturing for Measuring, Displaying, and Controlling Industrial Process Variables
0 750
334515 Instrument Manufacturing for Measuring and Testing Electricity and Electrical Signals
0 750
334516 Analytical Laboratory Instrument Manufacturing 0 1000 334519 Other Measuring and Controlling Device
Manufacturing 0 500
334614 Software and Other Prerecorded Compact Disc, Tape, and Record Reproducing
0 1250
335110 Electric Lamp Bulb and Part Manufacturing 0 1250 335121 Residential Electric Lighting Fixture Manufacturing 0 750 335312 Motor and Generator Manufacturing 0 1250 335911 Storage Battery Manufacturing 0 1250 336310 Motor Vehicle Gasoline Engine and Engine Parts
Manufacturing 0 1000
AILA Doc. No. 20073100. (Posted 8/4/20)
33
336330 Motor Vehicle Steering and Suspension Components (except Spring) Manufacturing
0 1000
336340 Motor Vehicle Brake System Manufacturing 0 1250 336370 Motor Vehicle Metal Stamping 0 1000 336390 Other Motor Vehicle Parts Manufacturing 0 1000 336411 Aircraft Manufacturing 0 1500 337110 Wood Kitchen Cabinet and Counter Top
Manufacturing 0 750
337212 Custom Architectural Woodwork and Millwork Manufacturing
0 500
337214 Office Furniture (Except Wood) Manufacturing 0 1000 337215 Showcase, Partition, Shelving, and Locker
Manufacturing 0 500
337910 Mattress Manufacturing 0 1000 339112 Surgical and Medical Instrument Manufacturing 0 1000 339113 Surgical Appliance and Supplies Manufacturing 0 750 339114 Dental Equipment and Supplies Manufacturing 0 750 339115 Ophthalmic Goods Manufacturing 0 1000 339116 Dental Laboratories 0 500 339920 Sporting and Athletic Goods Manufacturing 0 750 339930 Doll, Toy, and Game Manufacturing 0 500 339999 All Other Miscellaneous Manufacturing 0 500 423110 Automobile and Other Motor Vehicle Merchant
Wholesalers 0 250
423120 Motor Vehicle Supplies and New Parts Merchant Wholesalers
0 200
423130 Tire and Tube Merchant Wholesalers 0 200 423210 Furniture Merchant Wholesalers 0 100 423220 Home Furnishing Merchant Wholesalers 0 100 423320 Brick, Stone, and Related Construction Material
Merchant Wholesalers 0 150
423330 Roofing, Siding, and Insulation Material Merchant Wholesalers
0 200
423420 Office Equipment Merchant Wholesalers 0 200 423430 Computer and Computer Peripheral Equipment and
Software Merchant Wholesalers 0 250
423450 Medical, Dental, and Hospital Equipment and Supplies Merchant Wholesalers
0 200
423460 Ophthalmic Goods Merchant Wholesalers 0 150 423510 Metal Service Centers and Other Metal Merchant
Wholesalers 0 200
423520 Coal and Other Mineral and Ore Merchant Wholesalers
0 100
423610 Electrical Apparatus and Equipment, Wiring Supplies, and Related Equipment Merchant Wholesalers
0 200
AILA Doc. No. 20073100. (Posted 8/4/20)
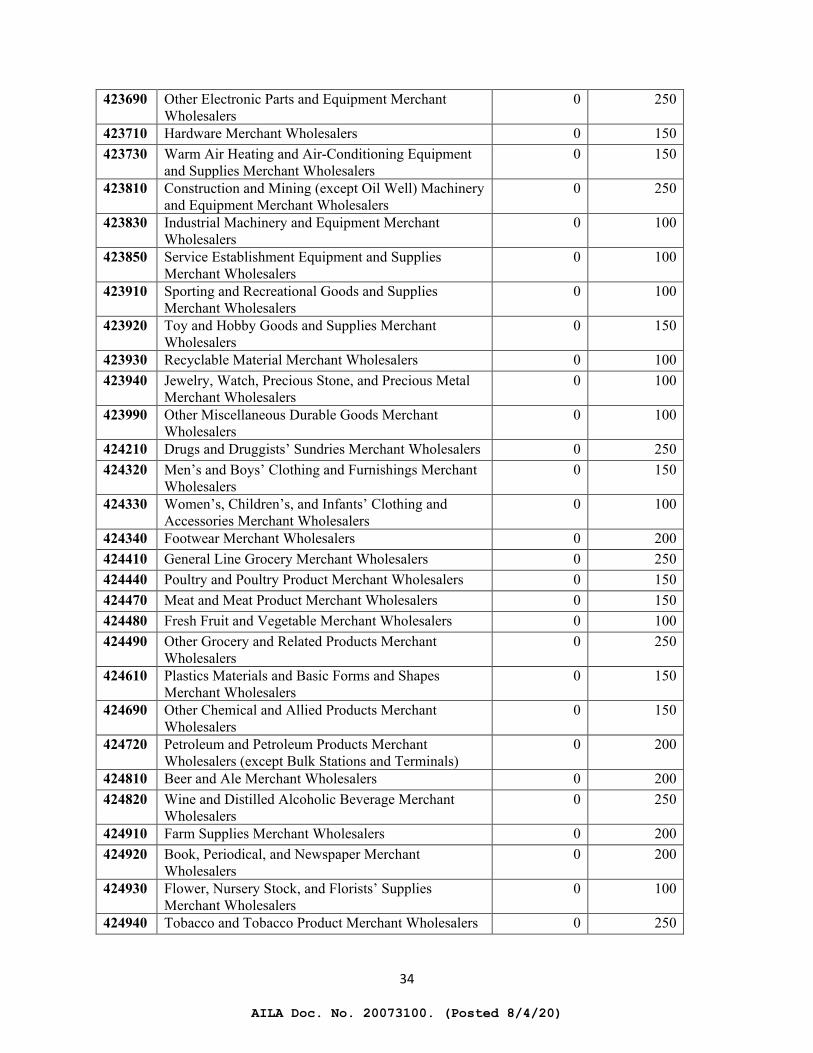
34
423690 Other Electronic Parts and Equipment Merchant Wholesalers
0 250
423710 Hardware Merchant Wholesalers 0 150 423730 Warm Air Heating and Air-Conditioning Equipment
and Supplies Merchant Wholesalers 0 150
423810 Construction and Mining (except Oil Well) Machinery and Equipment Merchant Wholesalers
0 250
423830 Industrial Machinery and Equipment Merchant Wholesalers
0 100
423850 Service Establishment Equipment and Supplies Merchant Wholesalers
0 100
423910 Sporting and Recreational Goods and Supplies Merchant Wholesalers
0 100
423920 Toy and Hobby Goods and Supplies Merchant Wholesalers
0 150
423930 Recyclable Material Merchant Wholesalers 0 100 423940 Jewelry, Watch, Precious Stone, and Precious Metal
Merchant Wholesalers 0 100
423990 Other Miscellaneous Durable Goods Merchant Wholesalers
0 100
424210 Drugs and Druggists’ Sundries Merchant Wholesalers 0 250 424320 Men’s and Boys’ Clothing and Furnishings Merchant
Wholesalers 0 150
424330 Women’s, Children’s, and Infants’ Clothing and Accessories Merchant Wholesalers
0 100
424340 Footwear Merchant Wholesalers 0 200 424410 General Line Grocery Merchant Wholesalers 0 250 424440 Poultry and Poultry Product Merchant Wholesalers 0 150 424470 Meat and Meat Product Merchant Wholesalers 0 150 424480 Fresh Fruit and Vegetable Merchant Wholesalers 0 100 424490 Other Grocery and Related Products Merchant
Wholesalers 0 250
424610 Plastics Materials and Basic Forms and Shapes Merchant Wholesalers
0 150
424690 Other Chemical and Allied Products Merchant Wholesalers
0 150
424720 Petroleum and Petroleum Products Merchant Wholesalers (except Bulk Stations and Terminals)
0 200
424810 Beer and Ale Merchant Wholesalers 0 200 424820 Wine and Distilled Alcoholic Beverage Merchant
Wholesalers 0 250
424910 Farm Supplies Merchant Wholesalers 0 200 424920 Book, Periodical, and Newspaper Merchant
Wholesalers 0 200
424930 Flower, Nursery Stock, and Florists’ Supplies Merchant Wholesalers
0 100
424940 Tobacco and Tobacco Product Merchant Wholesalers 0 250
AILA Doc. No. 20073100. (Posted 8/4/20)
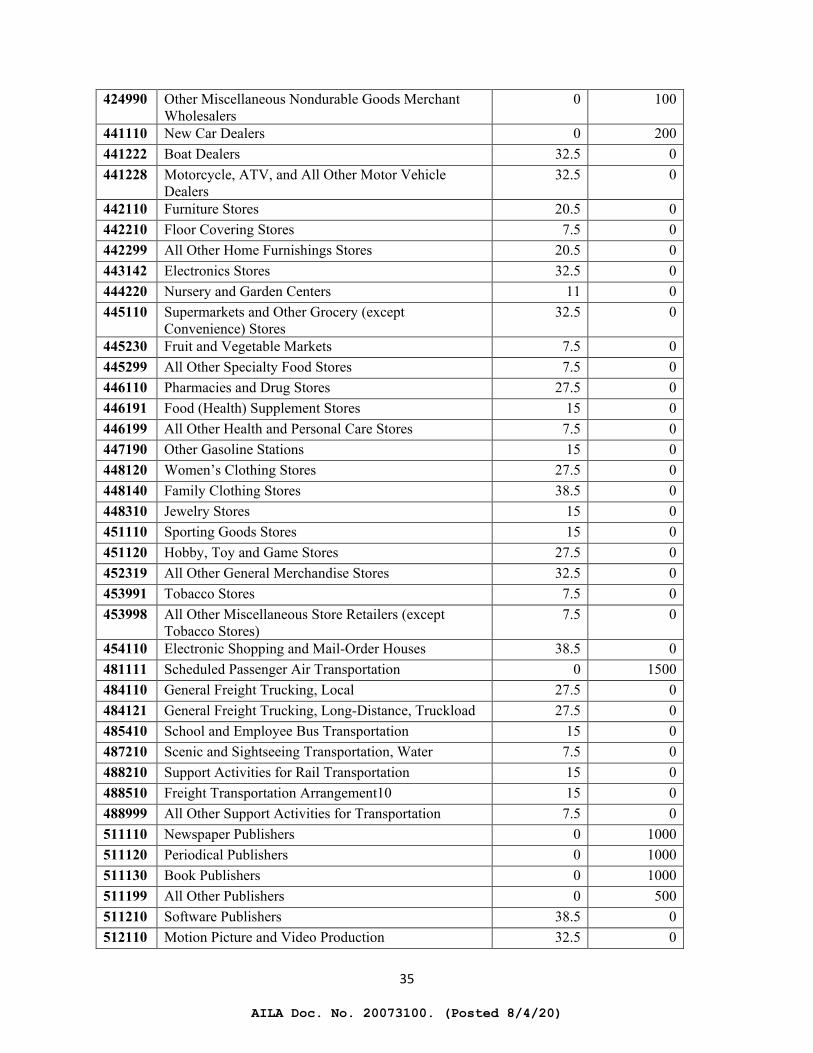
35
424990 Other Miscellaneous Nondurable Goods Merchant Wholesalers
0 100
441110 New Car Dealers 0 200 441222 Boat Dealers 32.5 0 441228 Motorcycle, ATV, and All Other Motor Vehicle
Dealers 32.5 0
442110 Furniture Stores 20.5 0 442210 Floor Covering Stores 7.5 0 442299 All Other Home Furnishings Stores 20.5 0 443142 Electronics Stores 32.5 0 444220 Nursery and Garden Centers 11 0 445110 Supermarkets and Other Grocery (except
Convenience) Stores 32.5 0
445230 Fruit and Vegetable Markets 7.5 0 445299 All Other Specialty Food Stores 7.5 0 446110 Pharmacies and Drug Stores 27.5 0 446191 Food (Health) Supplement Stores 15 0 446199 All Other Health and Personal Care Stores 7.5 0 447190 Other Gasoline Stations 15 0 448120 Women’s Clothing Stores 27.5 0 448140 Family Clothing Stores 38.5 0 448310 Jewelry Stores 15 0 451110 Sporting Goods Stores 15 0 451120 Hobby, Toy and Game Stores 27.5 0 452319 All Other General Merchandise Stores 32.5 0 453991 Tobacco Stores 7.5 0 453998 All Other Miscellaneous Store Retailers (except
Tobacco Stores) 7.5 0
454110 Electronic Shopping and Mail-Order Houses 38.5 0 481111 Scheduled Passenger Air Transportation 0 1500 484110 General Freight Trucking, Local 27.5 0 484121 General Freight Trucking, Long-Distance, Truckload 27.5 0 485410 School and Employee Bus Transportation 15 0 487210 Scenic and Sightseeing Transportation, Water 7.5 0 488210 Support Activities for Rail Transportation 15 0 488510 Freight Transportation Arrangement10 15 0 488999 All Other Support Activities for Transportation 7.5 0 511110 Newspaper Publishers 0 1000 511120 Periodical Publishers 0 1000 511130 Book Publishers 0 1000 511199 All Other Publishers 0 500 511210 Software Publishers 38.5 0 512110 Motion Picture and Video Production 32.5 0
AILA Doc. No. 20073100. (Posted 8/4/20)
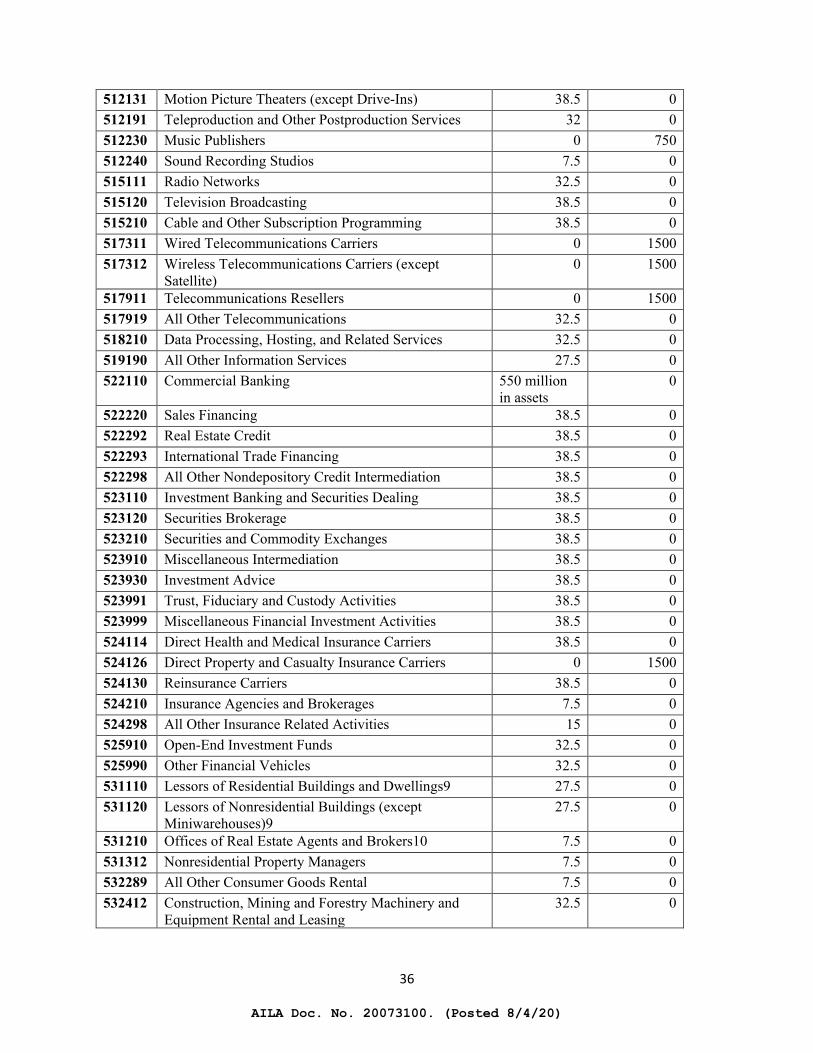
36
512131 Motion Picture Theaters (except Drive-Ins) 38.5 0 512191 Teleproduction and Other Postproduction Services 32 0 512230 Music Publishers 0 750 512240 Sound Recording Studios 7.5 0 515111 Radio Networks 32.5 0 515120 Television Broadcasting 38.5 0 515210 Cable and Other Subscription Programming 38.5 0 517311 Wired Telecommunications Carriers 0 1500 517312 Wireless Telecommunications Carriers (except
Satellite) 0 1500
517911 Telecommunications Resellers 0 1500 517919 All Other Telecommunications 32.5 0 518210 Data Processing, Hosting, and Related Services 32.5 0 519190 All Other Information Services 27.5 0 522110 Commercial Banking 550 million
in assets 0
522220 Sales Financing 38.5 0 522292 Real Estate Credit 38.5 0 522293 International Trade Financing 38.5 0 522298 All Other Nondepository Credit Intermediation 38.5 0 523110 Investment Banking and Securities Dealing 38.5 0 523120 Securities Brokerage 38.5 0 523210 Securities and Commodity Exchanges 38.5 0 523910 Miscellaneous Intermediation 38.5 0 523930 Investment Advice 38.5 0 523991 Trust, Fiduciary and Custody Activities 38.5 0 523999 Miscellaneous Financial Investment Activities 38.5 0 524114 Direct Health and Medical Insurance Carriers 38.5 0 524126 Direct Property and Casualty Insurance Carriers 0 1500 524130 Reinsurance Carriers 38.5 0 524210 Insurance Agencies and Brokerages 7.5 0 524298 All Other Insurance Related Activities 15 0 525910 Open-End Investment Funds 32.5 0 525990 Other Financial Vehicles 32.5 0 531110 Lessors of Residential Buildings and Dwellings9 27.5 0 531120 Lessors of Nonresidential Buildings (except
Miniwarehouses)9 27.5 0
531210 Offices of Real Estate Agents and Brokers10 7.5 0 531312 Nonresidential Property Managers 7.5 0 532289 All Other Consumer Goods Rental 7.5 0 532412 Construction, Mining and Forestry Machinery and
Equipment Rental and Leasing 32.5 0
AILA Doc. No. 20073100. (Posted 8/4/20)
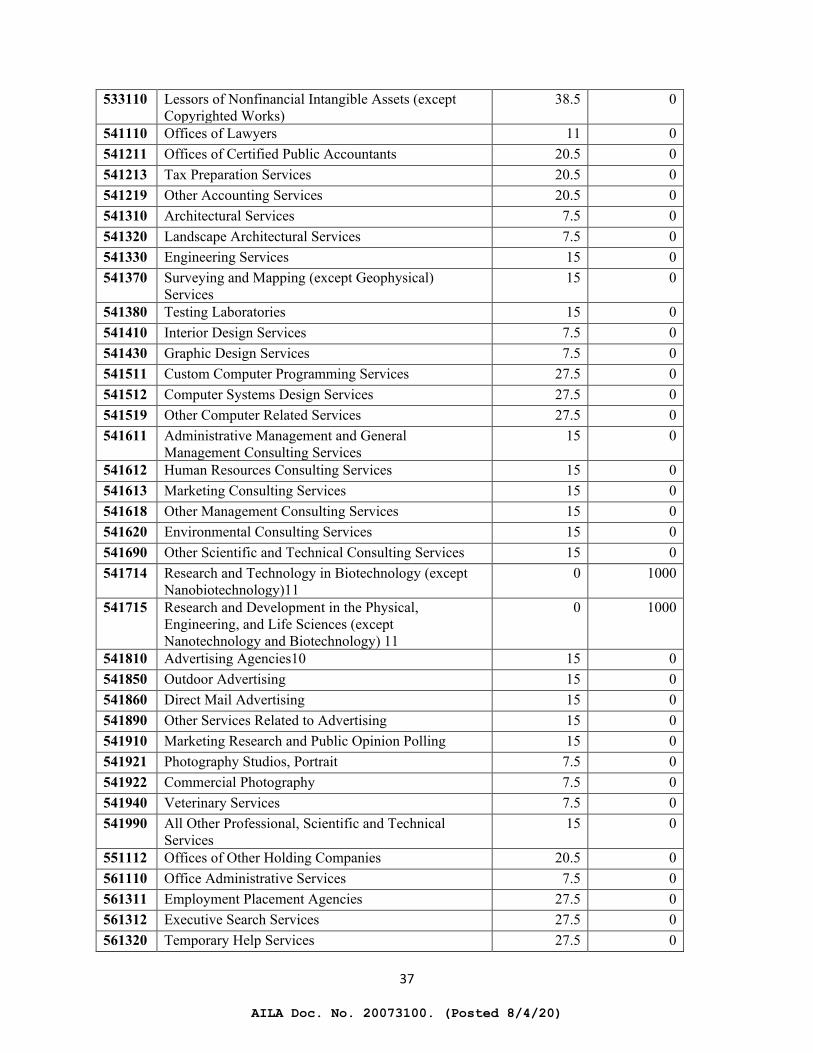
37
533110 Lessors of Nonfinancial Intangible Assets (except Copyrighted Works)
38.5 0
541110 Offices of Lawyers 11 0 541211 Offices of Certified Public Accountants 20.5 0 541213 Tax Preparation Services 20.5 0 541219 Other Accounting Services 20.5 0 541310 Architectural Services 7.5 0 541320 Landscape Architectural Services 7.5 0 541330 Engineering Services 15 0 541370 Surveying and Mapping (except Geophysical)
Services 15 0
541380 Testing Laboratories 15 0 541410 Interior Design Services 7.5 0 541430 Graphic Design Services 7.5 0 541511 Custom Computer Programming Services 27.5 0 541512 Computer Systems Design Services 27.5 0 541519 Other Computer Related Services 27.5 0 541611 Administrative Management and General
Management Consulting Services 15 0
541612 Human Resources Consulting Services 15 0 541613 Marketing Consulting Services 15 0 541618 Other Management Consulting Services 15 0 541620 Environmental Consulting Services 15 0 541690 Other Scientific and Technical Consulting Services 15 0 541714 Research and Technology in Biotechnology (except
Nanobiotechnology)11 0 1000
541715 Research and Development in the Physical, Engineering, and Life Sciences (except Nanotechnology and Biotechnology) 11
0 1000
541810 Advertising Agencies10 15 0 541850 Outdoor Advertising 15 0 541860 Direct Mail Advertising 15 0 541890 Other Services Related to Advertising 15 0 541910 Marketing Research and Public Opinion Polling 15 0 541921 Photography Studios, Portrait 7.5 0 541922 Commercial Photography 7.5 0 541940 Veterinary Services 7.5 0 541990 All Other Professional, Scientific and Technical
Services 15 0
551112 Offices of Other Holding Companies 20.5 0 561110 Office Administrative Services 7.5 0 561311 Employment Placement Agencies 27.5 0 561312 Executive Search Services 27.5 0 561320 Temporary Help Services 27.5 0
AILA Doc. No. 20073100. (Posted 8/4/20)
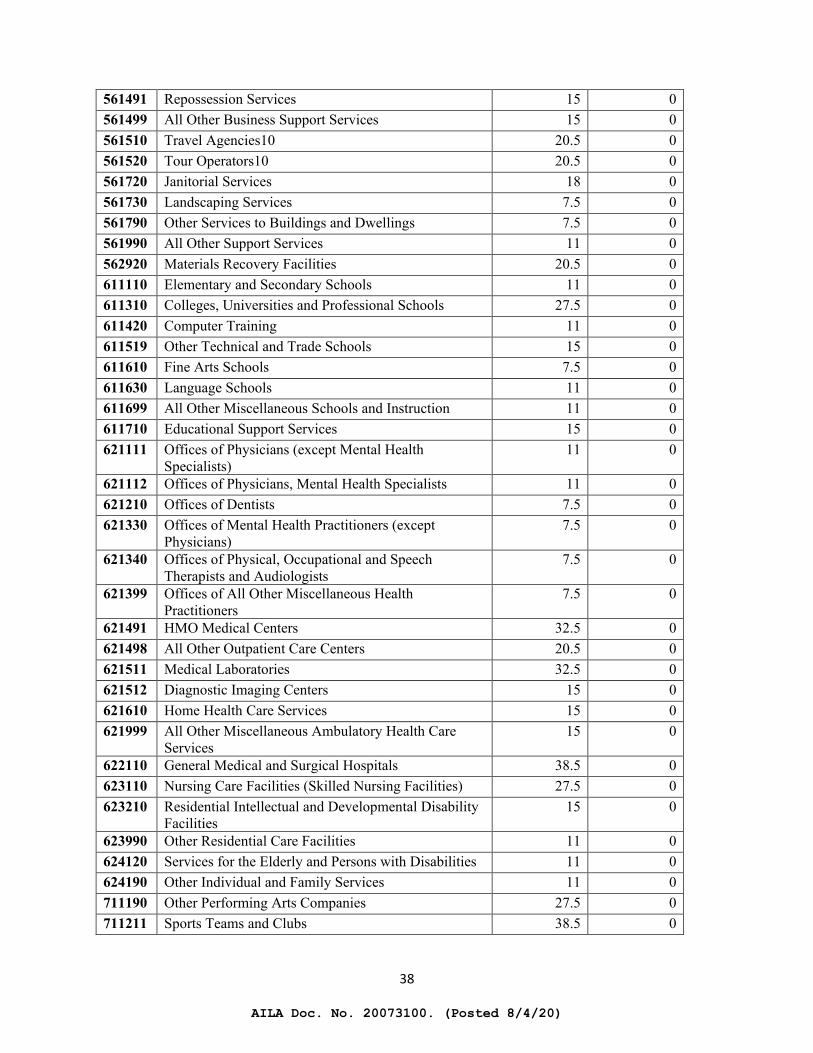
38
561491 Repossession Services 15 0 561499 All Other Business Support Services 15 0 561510 Travel Agencies10 20.5 0 561520 Tour Operators10 20.5 0 561720 Janitorial Services 18 0 561730 Landscaping Services 7.5 0 561790 Other Services to Buildings and Dwellings 7.5 0 561990 All Other Support Services 11 0 562920 Materials Recovery Facilities 20.5 0 611110 Elementary and Secondary Schools 11 0 611310 Colleges, Universities and Professional Schools 27.5 0 611420 Computer Training 11 0 611519 Other Technical and Trade Schools 15 0 611610 Fine Arts Schools 7.5 0 611630 Language Schools 11 0 611699 All Other Miscellaneous Schools and Instruction 11 0 611710 Educational Support Services 15 0 621111 Offices of Physicians (except Mental Health
Specialists) 11 0
621112 Offices of Physicians, Mental Health Specialists 11 0 621210 Offices of Dentists 7.5 0 621330 Offices of Mental Health Practitioners (except
Physicians) 7.5 0
621340 Offices of Physical, Occupational and Speech Therapists and Audiologists
7.5 0
621399 Offices of All Other Miscellaneous Health Practitioners
7.5 0
621491 HMO Medical Centers 32.5 0 621498 All Other Outpatient Care Centers 20.5 0 621511 Medical Laboratories 32.5 0 621512 Diagnostic Imaging Centers 15 0 621610 Home Health Care Services 15 0 621999 All Other Miscellaneous Ambulatory Health Care
Services 15 0
622110 General Medical and Surgical Hospitals 38.5 0 623110 Nursing Care Facilities (Skilled Nursing Facilities) 27.5 0 623210 Residential Intellectual and Developmental Disability
Facilities 15 0
623990 Other Residential Care Facilities 11 0 624120 Services for the Elderly and Persons with Disabilities 11 0 624190 Other Individual and Family Services 11 0 711190 Other Performing Arts Companies 27.5 0 711211 Sports Teams and Clubs 38.5 0
AILA Doc. No. 20073100. (Posted 8/4/20)
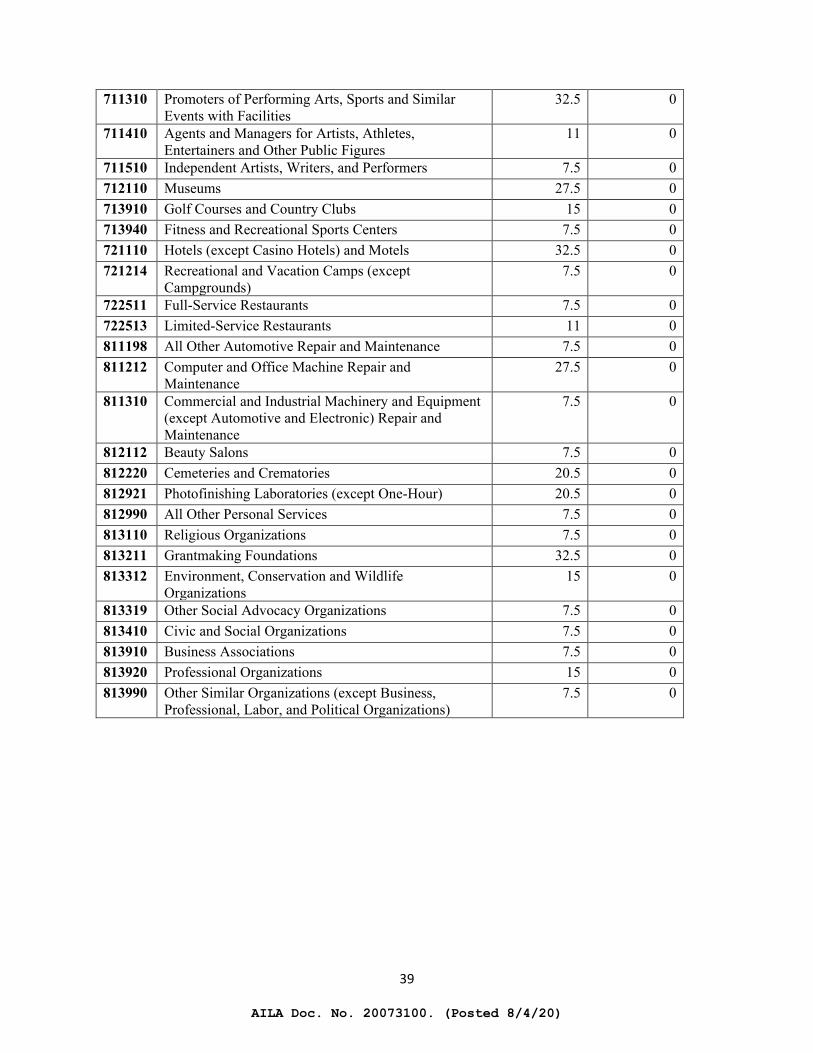
39
711310 Promoters of Performing Arts, Sports and Similar Events with Facilities
32.5 0
711410 Agents and Managers for Artists, Athletes, Entertainers and Other Public Figures
11 0
711510 Independent Artists, Writers, and Performers 7.5 0 712110 Museums 27.5 0 713910 Golf Courses and Country Clubs 15 0 713940 Fitness and Recreational Sports Centers 7.5 0 721110 Hotels (except Casino Hotels) and Motels 32.5 0 721214 Recreational and Vacation Camps (except
Campgrounds) 7.5 0
722511 Full-Service Restaurants 7.5 0 722513 Limited-Service Restaurants 11 0 811198 All Other Automotive Repair and Maintenance 7.5 0 811212 Computer and Office Machine Repair and
Maintenance 27.5 0
811310 Commercial and Industrial Machinery and Equipment (except Automotive and Electronic) Repair and Maintenance
7.5 0
812112 Beauty Salons 7.5 0 812220 Cemeteries and Crematories 20.5 0 812921 Photofinishing Laboratories (except One-Hour) 20.5 0 812990 All Other Personal Services 7.5 0 813110 Religious Organizations 7.5 0 813211 Grantmaking Foundations 32.5 0 813312 Environment, Conservation and Wildlife
Organizations 15 0
813319 Other Social Advocacy Organizations 7.5 0 813410 Civic and Social Organizations 7.5 0 813910 Business Associations 7.5 0 813920 Professional Organizations 15 0 813990 Other Similar Organizations (except Business,
Professional, Labor, and Political Organizations) 7.5 0
AILA Doc. No. 20073100. (Posted 8/4/20)
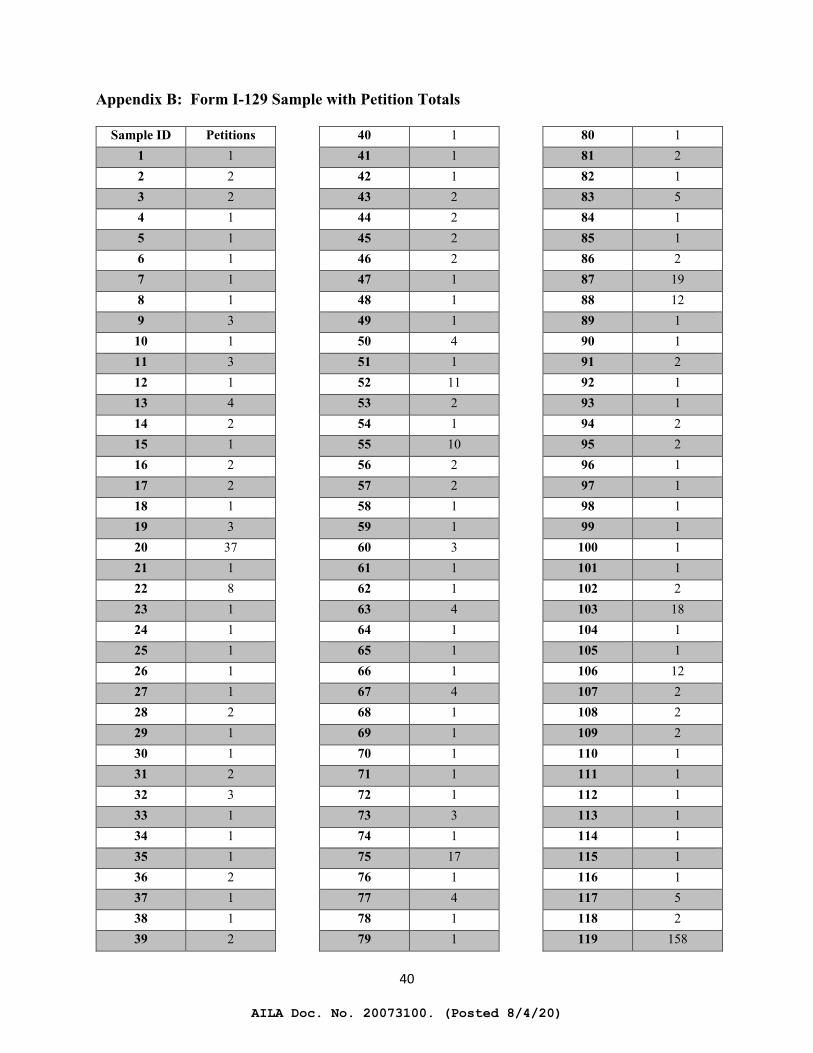
40
Appendix B: Form I-129 Sample with Petition Totals
Sample ID Petitions 1 1 2 2 3 2 4 1 5 1 6 1 7 1 8 1 9 3
10 1 11 3 12 1 13 4 14 2 15 1 16 2 17 2 18 1 19 3 20 37 21 1 22 8 23 1 24 1 25 1 26 1 27 1 28 2 29 1 30 1 31 2 32 3 33 1 34 1 35 1 36 2 37 1 38 1 39 2
40 1 41 1 42 1 43 2 44 2 45 2 46 2 47 1 48 1 49 1 50 4 51 1 52 11 53 2 54 1 55 10 56 2 57 2 58 1 59 1 60 3 61 1 62 1 63 4 64 1 65 1 66 1 67 4 68 1 69 1 70 1 71 1 72 1 73 3 74 1 75 17 76 1 77 4 78 1 79 1
80 1 81 2 82 1 83 5 84 1 85 1 86 2 87 19 88 12 89 1 90 1 91 2 92 1 93 1 94 2 95 2 96 1 97 1 98 1 99 1
100 1 101 1 102 2 103 18 104 1 105 1 106 12 107 2 108 2 109 2 110 1 111 1 112 1 113 1 114 1 115 1 116 1 117 5 118 2 119 158
AILA Doc. No. 20073100. (Posted 8/4/20)
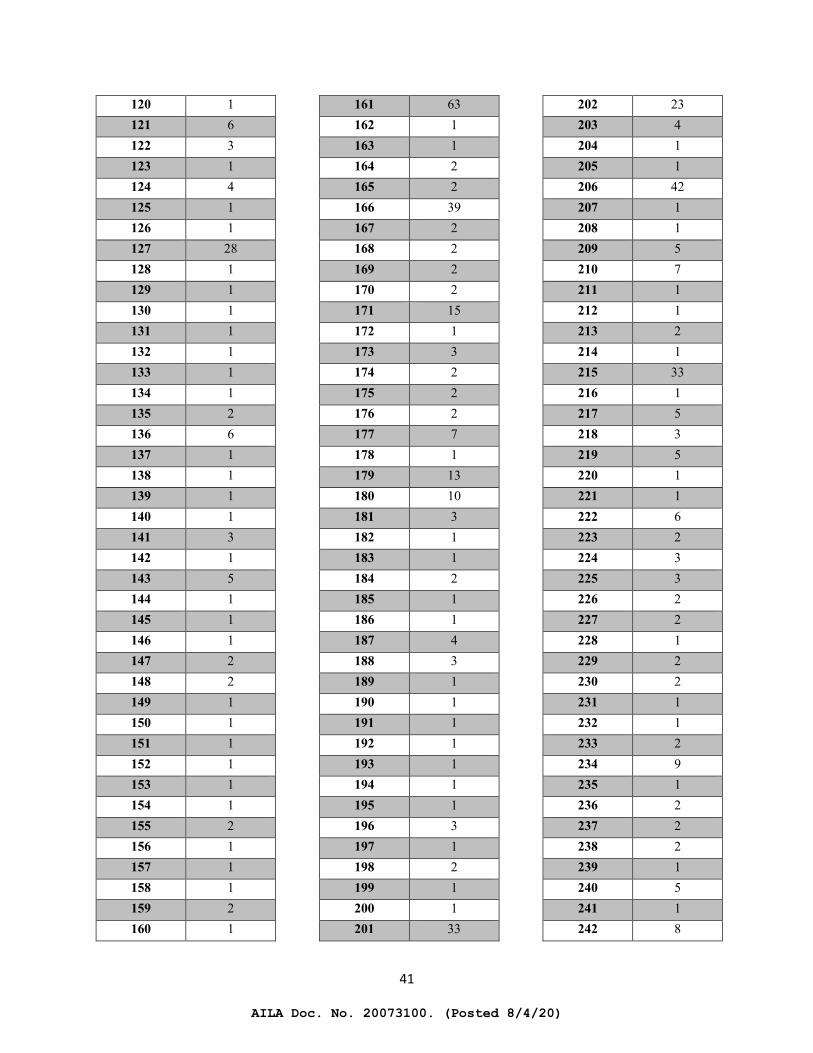
41
120 1 121 6 122 3 123 1 124 4 125 1 126 1 127 28 128 1 129 1 130 1 131 1 132 1 133 1 134 1 135 2 136 6 137 1 138 1 139 1 140 1 141 3 142 1 143 5 144 1 145 1 146 1 147 2 148 2 149 1 150 1 151 1 152 1 153 1 154 1 155 2 156 1 157 1 158 1 159 2 160 1
161 63 162 1 163 1 164 2 165 2 166 39 167 2 168 2 169 2 170 2 171 15 172 1 173 3 174 2 175 2 176 2 177 7 178 1 179 13 180 10 181 3 182 1 183 1 184 2 185 1 186 1 187 4 188 3 189 1 190 1 191 1 192 1 193 1 194 1 195 1 196 3 197 1 198 2 199 1 200 1 201 33
202 23 203 4 204 1 205 1 206 42 207 1 208 1 209 5 210 7 211 1 212 1 213 2 214 1 215 33 216 1 217 5 218 3 219 5 220 1 221 1 222 6 223 2 224 3 225 3 226 2 227 2 228 1 229 2 230 2 231 1 232 1 233 2 234 9 235 1 236 2 237 2 238 2 239 1 240 5 241 1 242 8
AILA Doc. No. 20073100. (Posted 8/4/20)
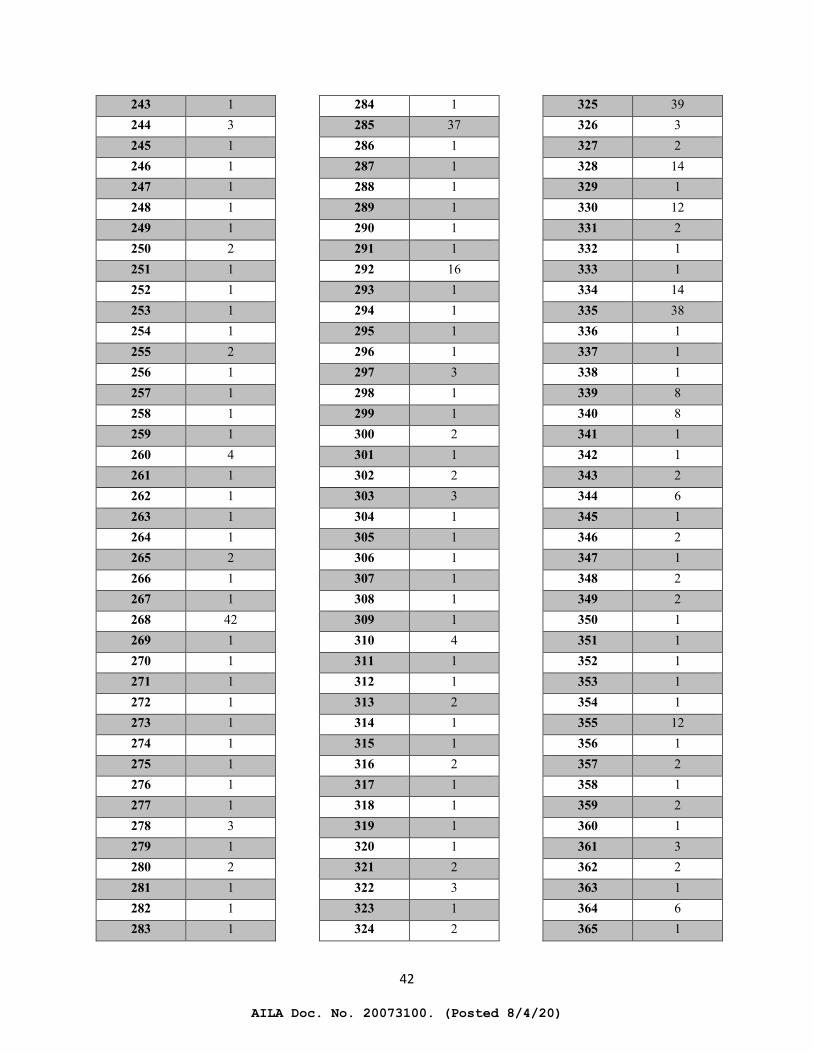
42
243 1 244 3 245 1 246 1 247 1 248 1 249 1 250 2 251 1 252 1 253 1 254 1 255 2 256 1 257 1 258 1 259 1 260 4 261 1 262 1 263 1 264 1 265 2 266 1 267 1 268 42 269 1 270 1 271 1 272 1 273 1 274 1 275 1 276 1 277 1 278 3 279 1 280 2 281 1 282 1 283 1
284 1 285 37 286 1 287 1 288 1 289 1 290 1 291 1 292 16 293 1 294 1 295 1 296 1 297 3 298 1 299 1 300 2 301 1 302 2 303 3 304 1 305 1 306 1 307 1 308 1 309 1 310 4 311 1 312 1 313 2 314 1 315 1 316 2 317 1 318 1 319 1 320 1 321 2 322 3 323 1 324 2
325 39 326 3 327 2 328 14 329 1 330 12 331 2 332 1 333 1 334 14 335 38 336 1 337 1 338 1 339 8 340 8 341 1 342 1 343 2 344 6 345 1 346 2 347 1 348 2 349 2 350 1 351 1 352 1 353 1 354 1 355 12 356 1 357 2 358 1 359 2 360 1 361 3 362 2 363 1 364 6 365 1
AILA Doc. No. 20073100. (Posted 8/4/20)
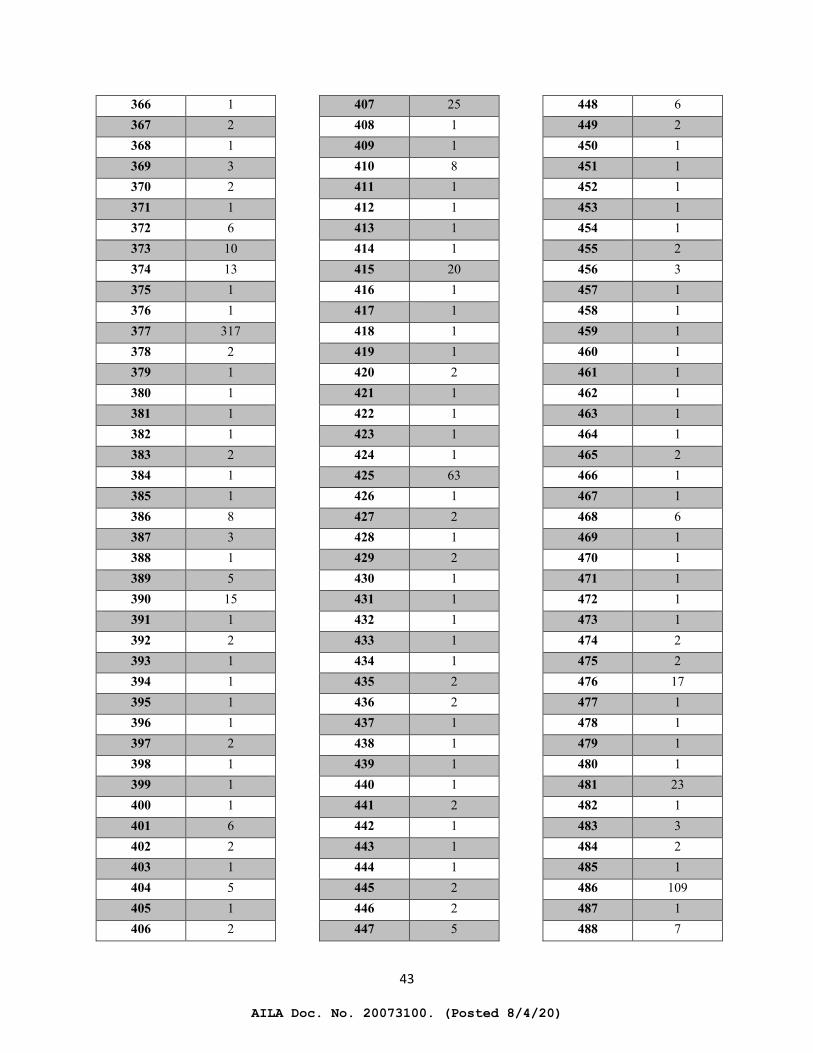
43
366 1 367 2 368 1 369 3 370 2 371 1 372 6 373 10 374 13 375 1 376 1 377 317 378 2 379 1 380 1 381 1 382 1 383 2 384 1 385 1 386 8 387 3 388 1 389 5 390 15 391 1 392 2 393 1 394 1 395 1 396 1 397 2 398 1 399 1 400 1 401 6 402 2 403 1 404 5 405 1 406 2
407 25 408 1 409 1 410 8 411 1 412 1 413 1 414 1 415 20 416 1 417 1 418 1 419 1 420 2 421 1 422 1 423 1 424 1 425 63 426 1 427 2 428 1 429 2 430 1 431 1 432 1 433 1 434 1 435 2 436 2 437 1 438 1 439 1 440 1 441 2 442 1 443 1 444 1 445 2 446 2 447 5
448 6 449 2 450 1 451 1 452 1 453 1 454 1 455 2 456 3 457 1 458 1 459 1 460 1 461 1 462 1 463 1 464 1 465 2 466 1 467 1 468 6 469 1 470 1 471 1 472 1 473 1 474 2 475 2 476 17 477 1 478 1 479 1 480 1 481 23 482 1 483 3 484 2 485 1 486 109 487 1 488 7
AILA Doc. No. 20073100. (Posted 8/4/20)
44
489 1 490 1 491 1 492 1 493 1 494 15 495 1 496 3 497 1 498 6 499 1 500 1 501 2 502 1 503 1 504 1 505 1 506 1 507 1 508 1 509 178 510 35 511 1 512 2 513 1 514 1 515 3 516 2 517 1 518 1 519 1 520 1 521 1 522 7 523 1 524 1 525 1 526 1 527 1 528 1 529 6
530 1 531 1 532 2 533 1 534 3 535 8 536 1 537 3 538 1 539 1 540 1 541 2 542 3 543 1 544 1 545 1 546 3 547 19 548 1 549 1 550 1 551 1 552 1 553 1 554 1 555 24 556 2 557 1 558 2 559 10 560 40 561 1 562 2 563 3 564 1 565 1 566 1 567 1 568 1 569 6 570 3
571 1 572 2 573 1 574 1 575 2 576 28 577 2 578 1 579 1 580 1 581 2 582 1 583 5 584 1 585 3 586 2 587 1 588 4 589 1 590 1 591 4 592 1 593 1 594 2 595 1 596 2 597 2 598 5 599 1 600 1 601 1 602 1 603 5 604 2 605 1 606 2 607 1 608 1 609 2 610 1 611 1
AILA Doc. No. 20073100. (Posted 8/4/20)
45
612 1 613 1 614 1 615 1 616 5 617 1 618 1 619 1 620 1 621 2 622 1 623 2 624 2
625 2 626 1 627 12 628 3 629 1 630 3 631 1 632 1 633 1 634 6 635 3 636 2 637 4
638 1 639 1 640 3 641 2 642 6 643 3 644 3 645 2 646 1 647 1 648 1 649 1 650 2
AILA Doc. No. 20073100. (Posted 8/4/20)
46
Appendix C: Form I-140 Sample with Petition Totals
Sample ID Petitions 1 1 2 5 3 1 4 5 5 1 6 1 7 1 8 9 9 1
10 1 11 1 12 1 13 1 14 1 15 1 16 1 17 1 18 1 19 1 20 1 21 1 22 1 23 5 24 4 25 2 26 1 27 1 28 7 29 1 30 1 31 1 32 1 33 1 34 1 35 2 36 1 37 1 38 2
39 1 40 1 41 1 42 3 43 1 44 1 45 1 46 17 47 1 48 1 49 1 50 2 51 3 52 20 53 1 54 1 55 1 56 25 57 7 58 1 59 1 60 4 61 3 62 1 63 2 64 1 65 1 66 7 67 1 68 4 69 1 70 2 71 3 72 1 73 11 74 1 75 1 76 1 77 1
78 1 79 2 80 2 81 1 82 1 83 3 84 1 85 1 86 3 87 1 88 4 89 2 90 3 91 1 92 1 93 1 94 1 95 1 96 8 97 1 98 2 99 1
100 1 101 1 102 3 103 6 104 1 105 1 106 2 107 1 108 5 109 2 110 8 111 2 112 1 113 1 114 1 115 1 116 6
AILA Doc. No. 20073100. (Posted 8/4/20)
47
117 7 118 2 119 3 120 4 121 1 122 9 123 2 124 1 125 2 126 1 127 1 128 1 129 2 130 20 131 2 132 1 133 1 134 97 135 5 136 2 137 1 138 1 139 3 140 4 141 1 142 1 143 1 144 1 145 1 146 1 147 1 148 1 149 1 150 4 151 1 152 1 153 1 154 1 155 1 156 1 157 1
158 2 159 1 160 1 161 8 162 1 163 1 164 7 165 1 166 1 167 2 168 1 169 1 170 1 171 1 172 3 173 5 174 3 175 1 176 1 177 1 178 1 179 2 180 1 181 4 182 1 183 1 184 2 185 4 186 1 187 1 188 13 189 1 190 1 191 5 192 1 193 1 194 5 195 3 196 1 197 1 198 1
199 1 200 3 201 1 202 1 203 1 204 1 205 4 206 2 207 1 208 1 209 5 210 2 211 1 212 1 213 2 214 2 215 1 216 2 217 2 218 1 219 4 220 2 221 1 222 1 223 1 224 2 225 1 226 1 227 1 228 14 229 4 230 1 231 1 232 6 233 1 234 1 235 1 236 1 237 1 238 1 239 1
AILA Doc. No. 20073100. (Posted 8/4/20)
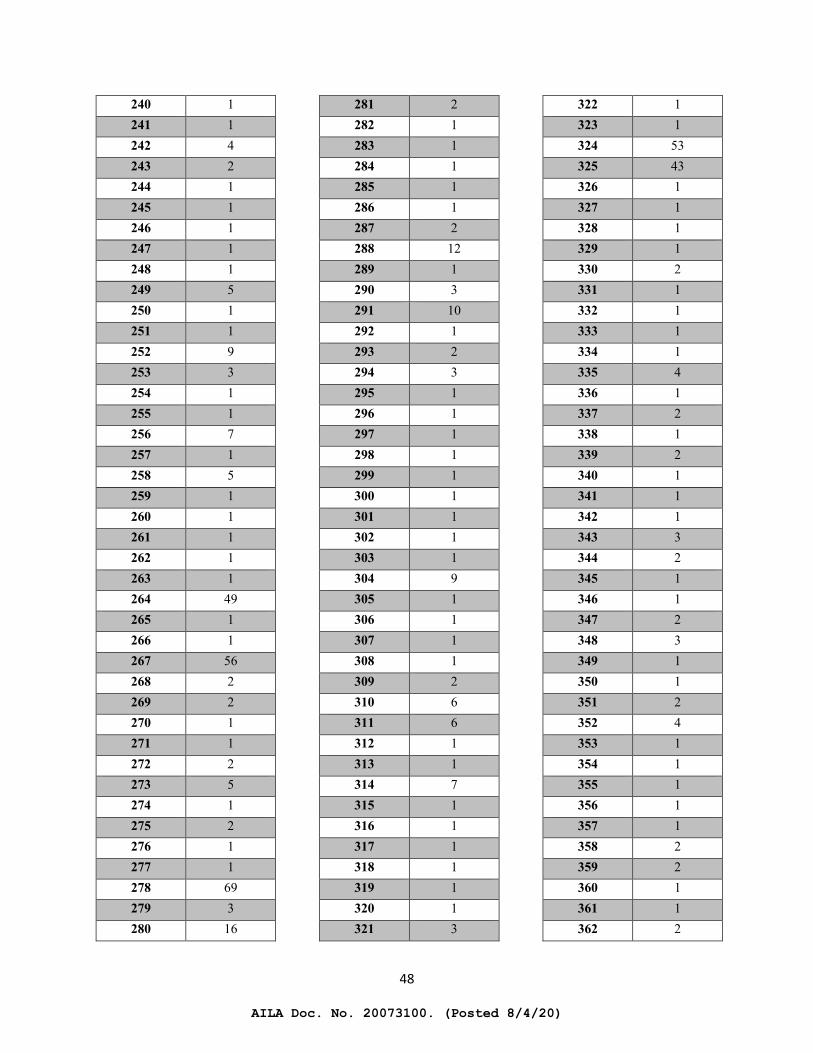
48
240 1 241 1 242 4 243 2 244 1 245 1 246 1 247 1 248 1 249 5 250 1 251 1 252 9 253 3 254 1 255 1 256 7 257 1 258 5 259 1 260 1 261 1 262 1 263 1 264 49 265 1 266 1 267 56 268 2 269 2 270 1 271 1 272 2 273 5 274 1 275 2 276 1 277 1 278 69 279 3 280 16
281 2 282 1 283 1 284 1 285 1 286 1 287 2 288 12 289 1 290 3 291 10 292 1 293 2 294 3 295 1 296 1 297 1 298 1 299 1 300 1 301 1 302 1 303 1 304 9 305 1 306 1 307 1 308 1 309 2 310 6 311 6 312 1 313 1 314 7 315 1 316 1 317 1 318 1 319 1 320 1 321 3
322 1 323 1 324 53 325 43 326 1 327 1 328 1 329 1 330 2 331 1 332 1 333 1 334 1 335 4 336 1 337 2 338 1 339 2 340 1 341 1 342 1 343 3 344 2 345 1 346 1 347 2 348 3 349 1 350 1 351 2 352 4 353 1 354 1 355 1 356 1 357 1 358 2 359 2 360 1 361 1 362 2
AILA Doc. No. 20073100. (Posted 8/4/20)
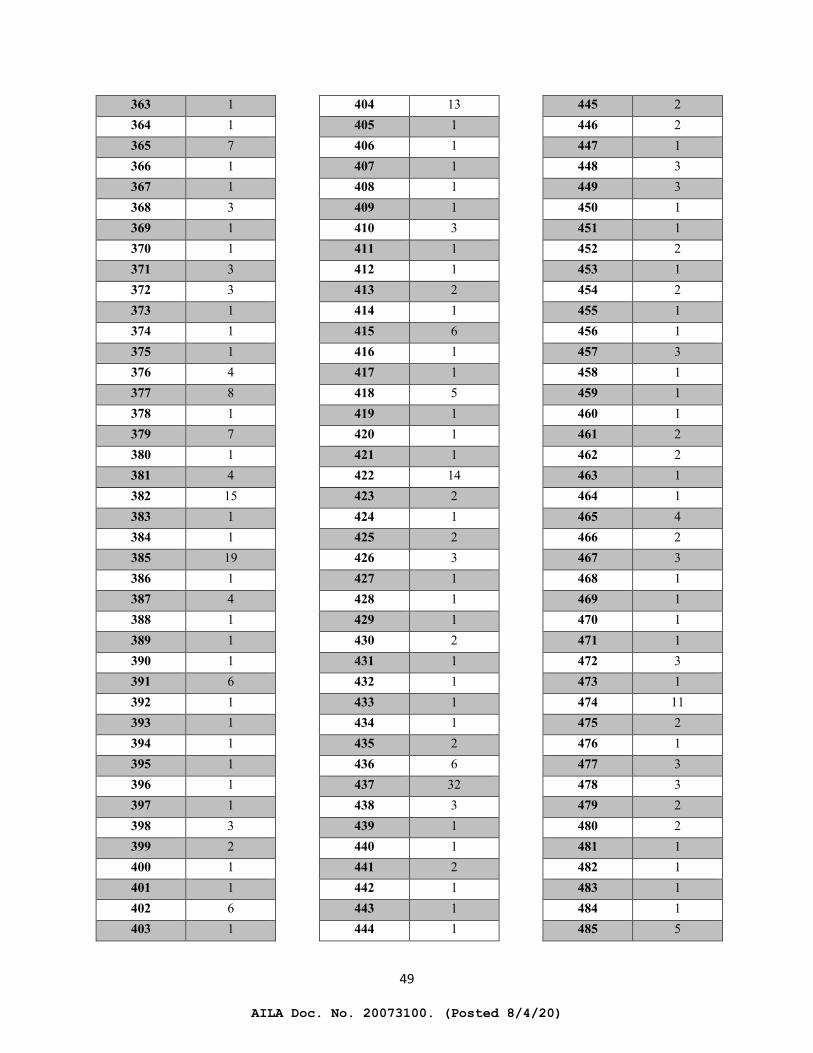
49
363 1 364 1 365 7 366 1 367 1 368 3 369 1 370 1 371 3 372 3 373 1 374 1 375 1 376 4 377 8 378 1 379 7 380 1 381 4 382 15 383 1 384 1 385 19 386 1 387 4 388 1 389 1 390 1 391 6 392 1 393 1 394 1 395 1 396 1 397 1 398 3 399 2 400 1 401 1 402 6 403 1
404 13 405 1 406 1 407 1 408 1 409 1 410 3 411 1 412 1 413 2 414 1 415 6 416 1 417 1 418 5 419 1 420 1 421 1 422 14 423 2 424 1 425 2 426 3 427 1 428 1 429 1 430 2 431 1 432 1 433 1 434 1 435 2 436 6 437 32 438 3 439 1 440 1 441 2 442 1 443 1 444 1
445 2 446 2 447 1 448 3 449 3 450 1 451 1 452 2 453 1 454 2 455 1 456 1 457 3 458 1 459 1 460 1 461 2 462 2 463 1 464 1 465 4 466 2 467 3 468 1 469 1 470 1 471 1 472 3 473 1 474 11 475 2 476 1 477 3 478 3 479 2 480 2 481 1 482 1 483 1 484 1 485 5
AILA Doc. No. 20073100. (Posted 8/4/20)
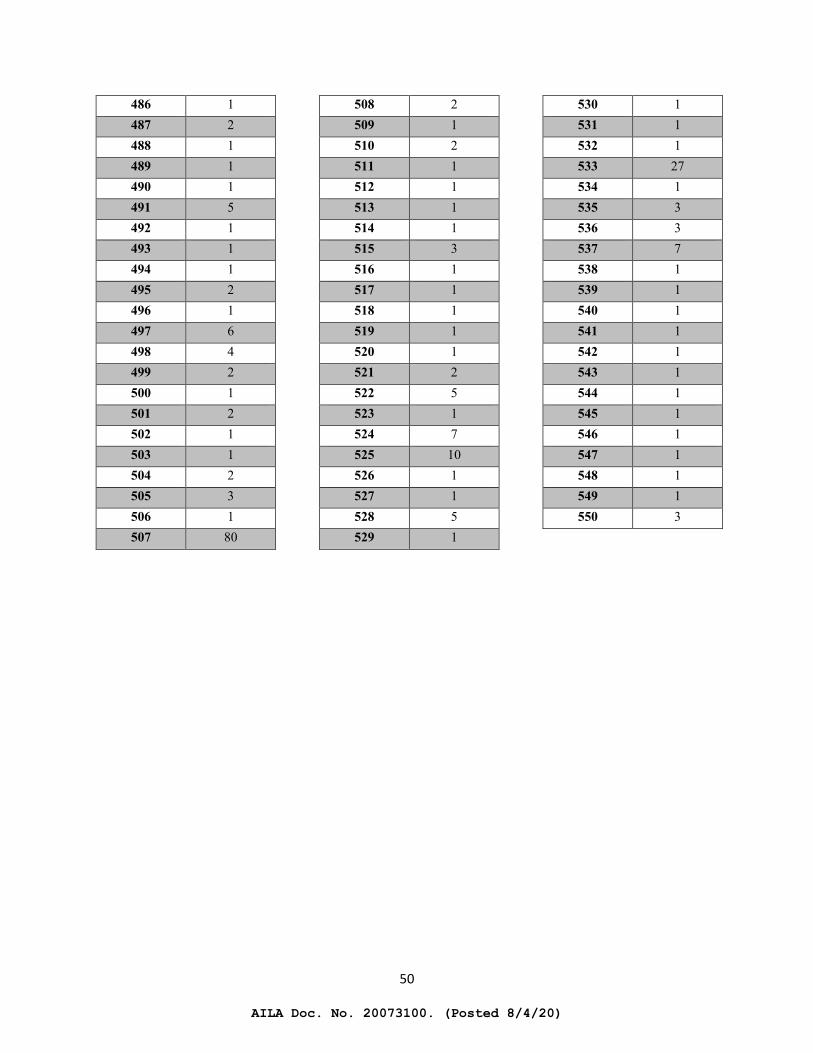
50
486 1 487 2 488 1 489 1 490 1 491 5 492 1 493 1 494 1 495 2 496 1 497 6 498 4 499 2 500 1 501 2 502 1 503 1 504 2 505 3 506 1 507 80
508 2 509 1 510 2 511 1 512 1 513 1 514 1 515 3 516 1 517 1 518 1 519 1 520 1 521 2 522 5 523 1 524 7 525 10 526 1 527 1 528 5 529 1
530 1 531 1 532 1 533 27 534 1 535 3 536 3 537 7 538 1 539 1 540 1 541 1 542 1 543 1 544 1 545 1 546 1 547 1 548 1 549 1 550 3
AILA Doc. No. 20073100. (Posted 8/4/20)
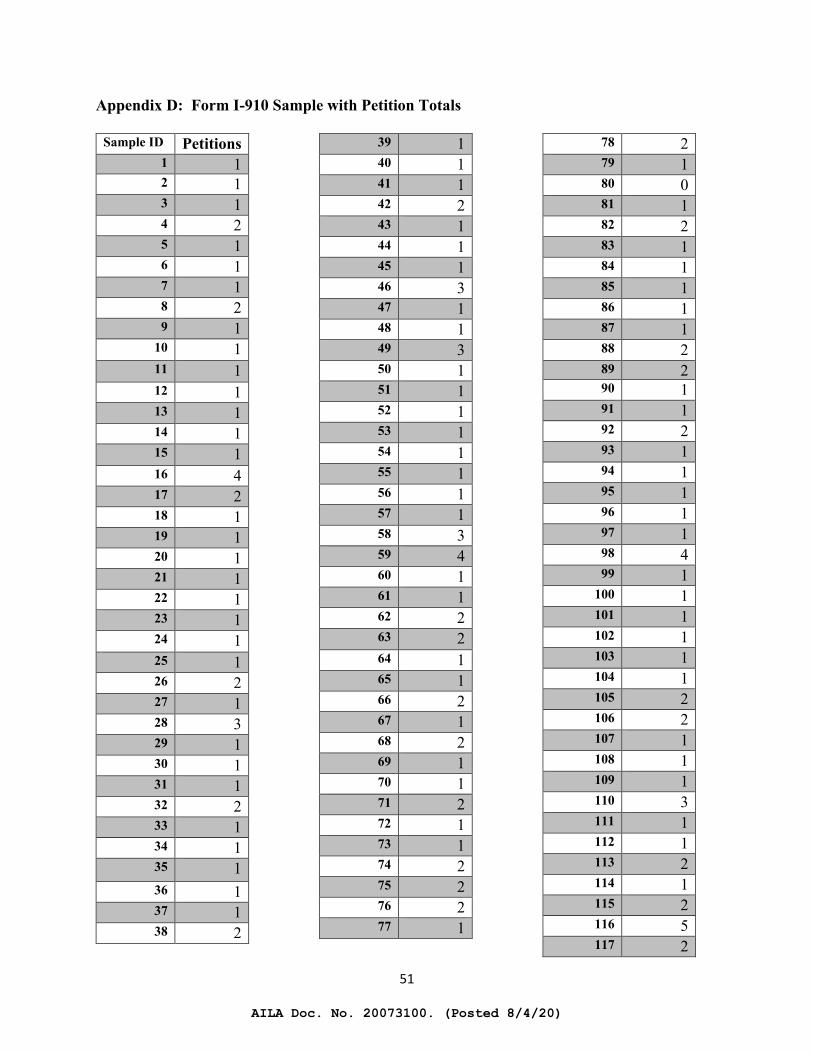
51
Appendix D: Form I-910 Sample with Petition Totals
Sample ID Petitions 1 1 2 1 3 1 4 2 5 1 6 1 7 1 8 2 9 1
10 1 11 1 12 1 13 1 14 1 15 1 16 4 17 2 18 1 19 1 20 1 21 1 22 1 23 1 24 1 25 1 26 2 27 1 28 3 29 1 30 1 31 1 32 2 33 1 34 1 35 1 36 1 37 1 38 2
39 1 40 1 41 1 42 2 43 1 44 1 45 1 46 3 47 1 48 1 49 3 50 1 51 1 52 1 53 1 54 1 55 1 56 1 57 1 58 3 59 4 60 1 61 1 62 2 63 2 64 1 65 1 66 2 67 1 68 2 69 1 70 1 71 2 72 1 73 1 74 2 75 2 76 2 77 1
78 2 79 1 80 0 81 1 82 2 83 1 84 1 85 1 86 1 87 1 88 2 89 2 90 1 91 1 92 2 93 1 94 1 95 1 96 1 97 1 98 4 99 1
100 1 101 1 102 1 103 1 104 1 105 2 106 2 107 1 108 1 109 1 110 3 111 1 112 1 113 2 114 1 115 2 116 5 117 2
AILA Doc. No. 20073100. (Posted 8/4/20)
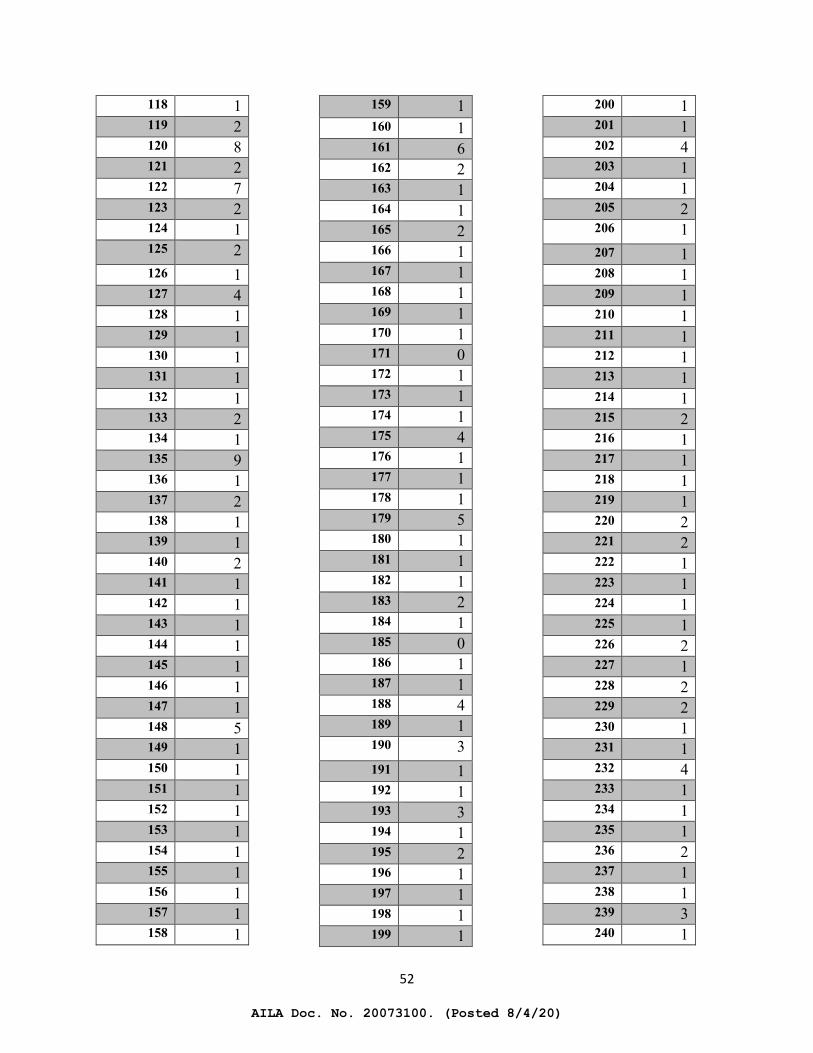
52
118 1 119 2 120 8 121 2 122 7 123 2 124 1 125 2 126 1 127 4 128 1 129 1 130 1 131 1 132 1 133 2 134 1 135 9 136 1 137 2 138 1 139 1 140 2 141 1 142 1 143 1 144 1 145 1 146 1 147 1 148 5 149 1 150 1 151 1 152 1 153 1 154 1 155 1 156 1 157 1 158 1
159 1 160 1 161 6 162 2 163 1 164 1 165 2 166 1 167 1 168 1 169 1 170 1 171 0 172 1 173 1 174 1 175 4 176 1 177 1 178 1 179 5 180 1 181 1 182 1 183 2 184 1 185 0 186 1 187 1 188 4 189 1 190 3 191 1 192 1 193 3 194 1 195 2 196 1 197 1 198 1 199 1
200 1 201 1 202 4 203 1 204 1 205 2 206 1 207 1 208 1 209 1 210 1 211 1 212 1 213 1 214 1 215 2 216 1 217 1 218 1 219 1 220 2 221 2 222 1 223 1 224 1 225 1 226 2 227 1 228 2 229 2 230 1 231 1 232 4 233 1 234 1 235 1 236 2 237 1 238 1 239 3 240 1
AILA Doc. No. 20073100. (Posted 8/4/20)
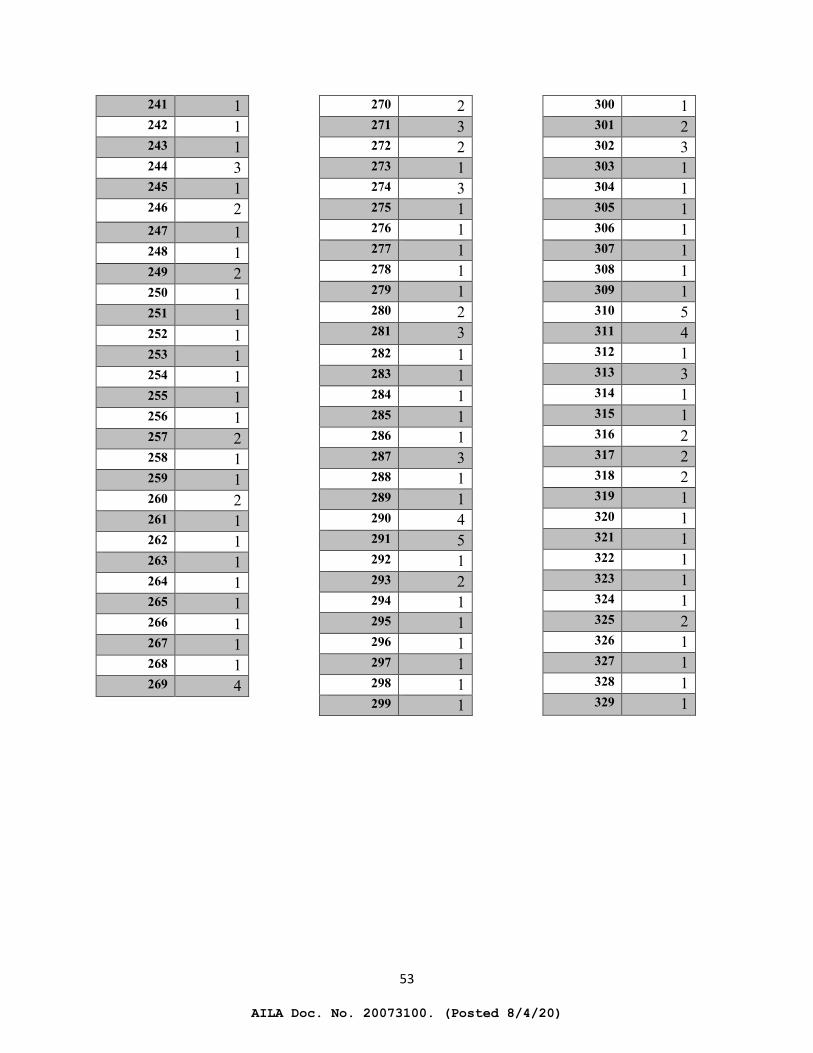
53
241 1 242 1 243 1 244 3 245 1 246 2 247 1 248 1 249 2 250 1 251 1 252 1 253 1 254 1 255 1 256 1 257 2 258 1 259 1 260 2 261 1 262 1 263 1 264 1 265 1 266 1 267 1 268 1 269 4
270 2 271 3 272 2 273 1 274 3 275 1 276 1 277 1 278 1 279 1 280 2 281 3 282 1 283 1 284 1 285 1 286 1 287 3 288 1 289 1 290 4 291 5 292 1 293 2 294 1 295 1 296 1 297 1 298 1 299 1
300 1 301 2 302 3 303 1 304 1 305 1 306 1 307 1 308 1 309 1 310 5 311 4 312 1 313 3 314 1 315 1 316 2 317 2 318 2 319 1 320 1 321 1 322 1 323 1 324 1 325 2 326 1 327 1 328 1 329 1
AILA Doc. No. 20073100. (Posted 8/4/20)
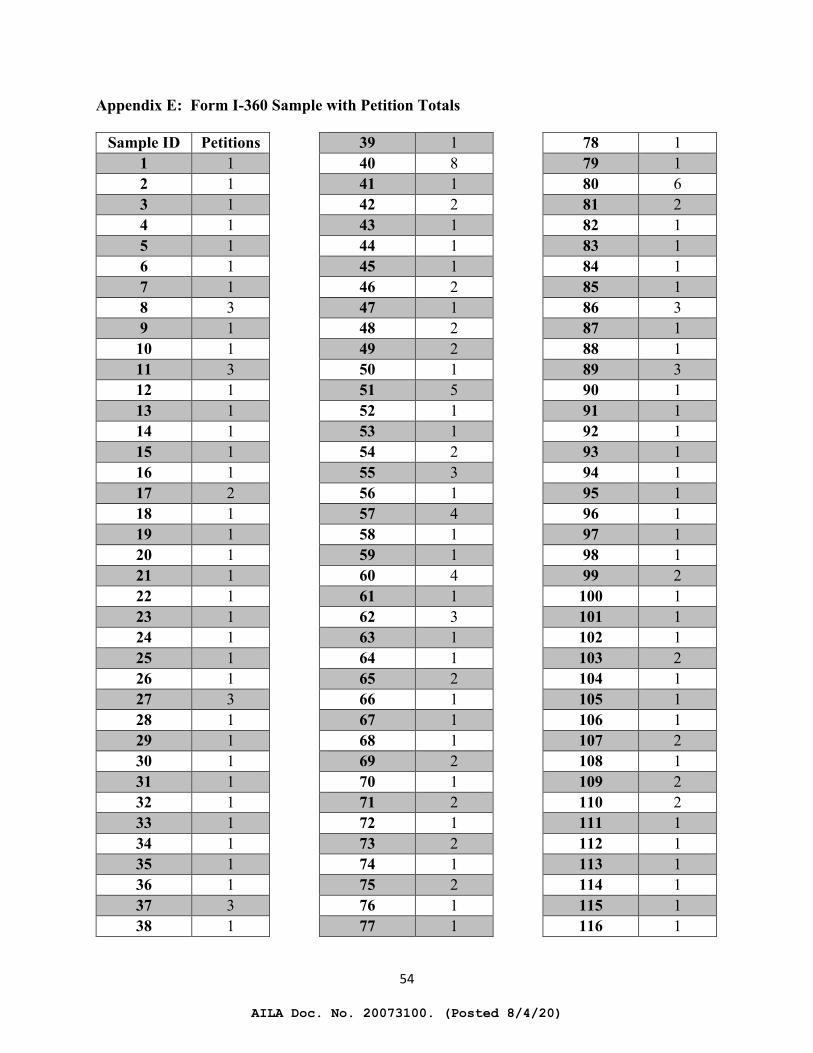
54
Appendix E: Form I-360 Sample with Petition Totals
Sample ID Petitions 1 1 2 1 3 1 4 1 5 1 6 1 7 1 8 3 9 1 10 1 11 3 12 1 13 1 14 1 15 1 16 1 17 2 18 1 19 1 20 1 21 1 22 1 23 1 24 1 25 1 26 1 27 3 28 1 29 1 30 1 31 1 32 1 33 1 34 1 35 1 36 1 37 3 38 1
39 1 40 8 41 1 42 2 43 1 44 1 45 1 46 2 47 1 48 2 49 2 50 1 51 5 52 1 53 1 54 2 55 3 56 1 57 4 58 1 59 1 60 4 61 1 62 3 63 1 64 1 65 2 66 1 67 1 68 1 69 2 70 1 71 2 72 1 73 2 74 1 75 2 76 1 77 1
78 1 79 1 80 6 81 2 82 1 83 1 84 1 85 1 86 3 87 1 88 1 89 3 90 1 91 1 92 1 93 1 94 1 95 1 96 1 97 1 98 1 99 2 100 1 101 1 102 1 103 2 104 1 105 1 106 1 107 2 108 1 109 2 110 2 111 1 112 1 113 1 114 1 115 1 116 1
AILA Doc. No. 20073100. (Posted 8/4/20)
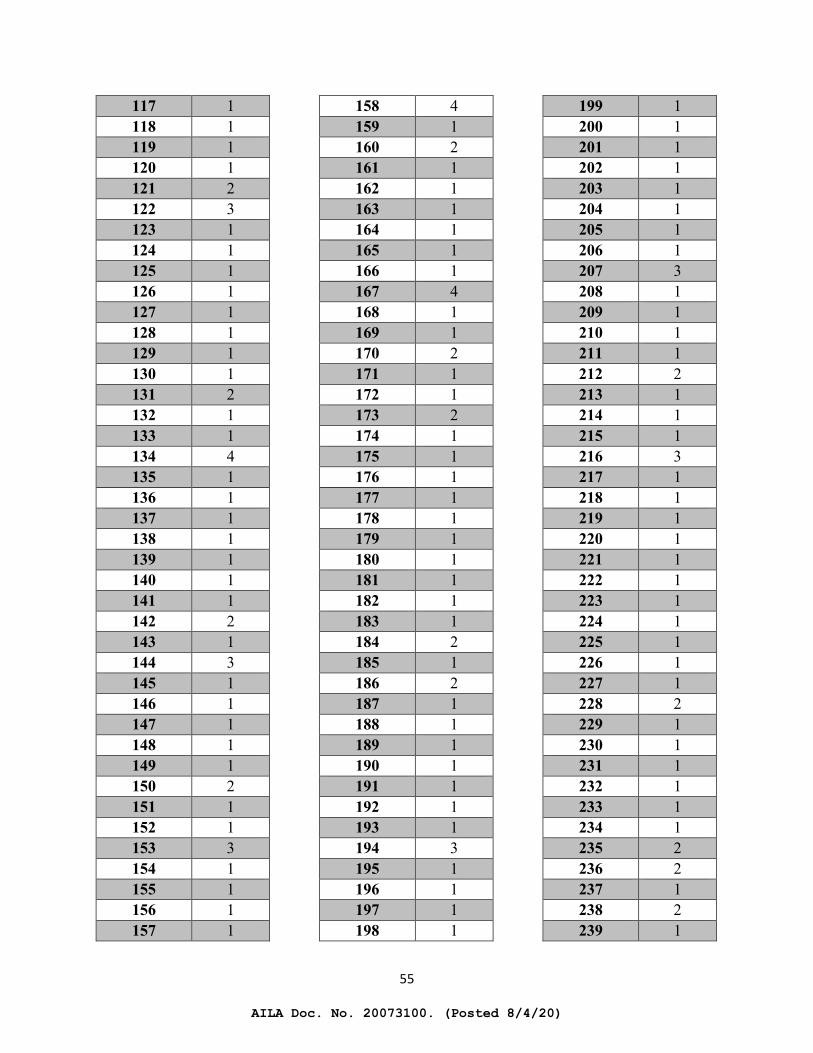
55
117 1 118 1 119 1 120 1 121 2 122 3 123 1 124 1 125 1 126 1 127 1 128 1 129 1 130 1 131 2 132 1 133 1 134 4 135 1 136 1 137 1 138 1 139 1 140 1 141 1 142 2 143 1 144 3 145 1 146 1 147 1 148 1 149 1 150 2 151 1 152 1 153 3 154 1 155 1 156 1 157 1
158 4 159 1 160 2 161 1 162 1 163 1 164 1 165 1 166 1 167 4 168 1 169 1 170 2 171 1 172 1 173 2 174 1 175 1 176 1 177 1 178 1 179 1 180 1 181 1 182 1 183 1 184 2 185 1 186 2 187 1 188 1 189 1 190 1 191 1 192 1 193 1 194 3 195 1 196 1 197 1 198 1
199 1 200 1 201 1 202 1 203 1 204 1 205 1 206 1 207 3 208 1 209 1 210 1 211 1 212 2 213 1 214 1 215 1 216 3 217 1 218 1 219 1 220 1 221 1 222 1 223 1 224 1 225 1 226 1 227 1 228 2 229 1 230 1 231 1 232 1 233 1 234 1 235 2 236 2 237 1 238 2 239 1
AILA Doc. No. 20073100. (Posted 8/4/20)
56
240 1 241 1 242 1 243 1 244 5 245 1 246 1 247 1 248 1 249 2 250 1 251 3 252 1 253 1 254 1 255 1 256 1 257 1 258 1 259 10 260 1 261 1 262 1 263 2 264 2 265 1 266 1 267 1 268 1 269 1 270 1 271 2 272 1 273 1 274 1 275 2 276 1 277 1 278 1 279 1 280 1
281 3 282 1 283 1 284 2 285 7 286 1 287 1 288 1 289 1 290 1 291 1 292 2 293 1 294 2 295 1 296 1 297 1 298 1 299 1 300 1 301 1 302 1 303 1 304 1 305 1 306 1 307 1 308 1 309 1 310 1 311 1 312 1 313 1 314 1 315 1 316 1 317 1 318 6 319 1 320 1 321 1
322 1 323 2 324 1 325 2 326 1 327 1 328 1 329 1 330 4 331 1 332 2 333 3 334 1 335 1 336 1 337 2 338 1 339 3 340 1 341 1 342 1 343 1 344 6 345 1 346 1 347 28 348 1 349 1 350 1 351 1 352 3 353 1 354 1 355 1 356 1 357 1 358 1 359 1 360 1 361 1 362 1
AILA Doc. No. 20073100. (Posted 8/4/20)
57
363 1 364 1 365 1 366 1 367 1 368 1 369 1 370 1 371 1 372 1 373 1 374 1 375 1 376 1 377 1 378 1 379 1 380 1 381 2 382 4
383 1 384 5 385 1 386 1 387 1 388 3 389 1 390 1 391 1 392 4 393 1 394 3 395 1 396 2 397 2 398 1 399 1 400 1 401 1 402 1
403 1 404 5 405 1 406 1 407 1 408 1 409 3 410 1 411 1 412 1 413 1 414 1 415 1 416 3 417 1 418 3 419 1 420 1
AILA Doc. No. 20073100. (Posted 8/4/20)


