Embed Size (px)
Citation preview
In Education, Health, Agriculture, And Water,
Delta State Development Performance
Sanitation and Hygiene (WASH) Sectors, 1991 - 2013
Assessment Report NIGERIA“Together for higher impact”
DELTA STATE...The Big Heart
In Education, Health, Agriculture, And Water,
Delta State Development Performance
Sanitation and Hygiene (WASH) Sectors, 1991 - 2013
Assessment Report
NIGERIA“Together for higher impact”
DELTA STATE...The Big Heart
© 2014
Published under the technical assistance of the
United Nations Country Office in NigeriaUN HousePlot 617/618Diplomatic DriveCentral Business DistrictAbuja, FCT
by the
Office of the Senior Adviser to the Governor on Foreign RelationsDelta State GovernmentGovernment HouseAsabaDelta State
All rights reserved. No part of this publication may be reproduced, stored in a retrieval system or transmitted, in any form or by any means, electronic, mechanical, photocopying, recording or otherwise, without prior permission.
ISBN: 978 -978-53358-0-4
1United Nations Development Programme (UNDP). 2003. Human Development Report 2003 Millennium Development Goals:
A Compact among Nations to End Human Poverty, p. 28. New York: Oxford University Press.
ForewordThis report, which was prepared by
independent consultants with the joint
technical assistance of UNDP, UNICEF, WHO
and FAO, is the UN's response to the request of
the Delta State Government to carry out an
assessment of its performance in four key
sectors: education, health, agriculture, and
water, sanitation and hygeine (WASH).
The analysis of each sector involved a careful
examination of the policies and strategies
adopted by the government, the governance
and regulatory framework put in place, as
well as identification of gaps and challenges in
performance. It also focuses on sectoral
performance using, among other things, the
MDG targets and indicators.
The aim of the report is to generate lessons to
strengthen the capacity of government for
effective stewardship and the development of
the State. The policy recommendations
presented at the end of each sector appraisal
provide the basis for evidence-based policy
formulation and implementation, as well as
for regulation and legislation which will
channel resources towards enhancing the
welfare of the people of Delta State.
Translating these policy recommendations
into action could mean reducing the incidence
of disease and providing the people with
better access to health care and education. In
a nutshell, it means ‘human development’,
which is about people; about expanding their
choices to live full creative lives with freedom
and dignity. Fundamental to expanding their
choices is building human capabilities: the
range of things that people can do to attain a
long and healthy life, education, a decent
standard of living and enjoy political and civil
freedoms to participate in the life of one's
community.1
The report highlights concerted efforts that
the state and federal governments, the
different communities, civil society organiza-
tions, and the private sector have helped to
make to expand the opportunities available to
people in Delta State. It also points out that
while substantial progress has been made in
meeting some of the targets, it is still
necessary to develop a bolder and focused
action plan where significant gaps and
disparities exist in order to address the
unfinished business of the MDGs and prepare
for the Post-2015 Development Agenda.
It is our sincere hope that this report will help
the Delta State Government build upon its
successes and have a self-reflection of the
progress made on the MDGs. These have
obvious implications on MDG budgeting,
policy directions, more targeted acceleration
initiatives, and localization of targets and
indicators. Achievement of the MDG targets in
Nigeria and even the post-2015 development
agenda depend on appropriate and effective
policies and public spending by both national
and subnational governments. This is
particularly true because the state and local
governments are closest to the people in
terms of providing basic services.
The United Nations System in Nigeria will
continue to partner with both states and the
federal government to use the analytical
evidence of what works – and what doesn't –
in local development to shape policy
formulation and adjustment, planning and
implementation.
Daouda ToureUnited Nations Resident Coordinator &UNDP Resident Representative in Nigeria
iv
ContentsForeword
Acknowledgements
Acronyms & Abbreviations
Overview
Chapter 1: Introduction
1.1 State Profile
1.2 Objectives of the Assessment
1.3 Methodology
1.4 Limitations of the Assessment
1.5 Organization of the Report
Chapter 2: Overview of Development Frameworks and Performance
2.1 Governance
2.2 Development Frameworks and Strategies
2.2.1 The Millennium Development Goals
2.2.2 Delta State Economic Empowerment and Development Strategy
2.2.3 Delta State Vision 2020 and 'Delta State beyond Oil’
2.2.4 The 3-Point Agenda
2.2.5 DESOPADEC
2.3 Fiscal Management
2.4 Growth and Development Performance
2.4.1 State's Economic Growth
2.4.2 Structure of State's Output
2.4.3 Development Outcomes
2.5 The Delta State Microcredit Programme and Poverty Reduction
2.6 Monitoring and Evaluation
2.7 Some Conclusions
Chapter 3: Education Sector
3.1 Institutional and Regulatory Frameworks for Policy and Programme Implementation
3.1.1 Institutional Arrangements
iii
xi
xiii
xvii
1
1
2
2
3
3
5
5
6
6
7
8
9
10
12
15
15
16
17
19
21
21
23
23
23
3.1.2 Regulatory Framework
3.2 Policies, Strategies and Programmes/Initiatives in the Education Sector
3.2.1 Objectives of the Education Sector
3.2.2 Policies
3.2.3 Strategies, Initiatives/Programmes in the Sector
3.3 Funding and Resource Allocation to Education
23
24
24
24
25
26
3.4 Performance Results and Impacts 27
v
4.5.1 Goal 4: Reduce Child Mortality by Two-Thirds of the 1990 Level by 2015
4.5.2 Goal 5: Improve Maternal Health
52
52
3.4.1 Infrastructural Development.
3.4.2 Free and Compulsory Education
3.4.3 Scholarships and Bursary
3.4.4 Impact of the Education Marshal Programme
3.4.5 Access to Education
3.4.6 Enabling Performance Factors
3.5. Performance of the Sector in Relation to the MDGS
3.5.1 Performance in Relation to MDGs 2 and 3
3.5.2 Gender Parity Trends in Basic and Higher Education
3.6 Efficiency and Effectiveness of the Measures Implemented
3.7 Monitoring and Evaluation
3.8 Gaps in Performance
3.9 Some Conclusions and Recommendations
Chapter 4: Health Sector
4.1 Governance and Regulatory Framework of the Health Sector
4.1.1 Institutional Arrangements
4.1.2 Regulatory Framework
4.2 Policies and Programmes in the Health Sector
4.2.1 Framework for Policies and Programmes
4.2.2 Health Programmes/Interventions
4.3 Resource Allocation to Finance Agreed Priorities
4.3.1 SMoH Financing
4.3.2 DESOPADEC Health Financing
4.3.3 MDG-CGS Health Financing
4.4 Health Sector Performance and Results of Policy/Programme Implementation
28
29
30
30
31
31
31
31
33
33
33
33
34
37
37
37
37
38
38
39
43
43
44
44
45
4.4.1 The Free Maternal Healthcare Programme (FMHCP)
4.4.2 The Free Under Five Healthcare Programme (FU-5HCP)
4.4.3 The Rural Health Scheme (RHS)
4.4.4 HIV & AIDS Programme
4.4.6 Tuberculosis Control Programme
4.4.8 The Delta State Strategic Health Development Programme (SSHDP), 2010-2015
4.4.7 Malaria Control Programme
4.4.9 Enabling Environment and Opportunities
4.5 Sectoral Performance in Relation to the MDGS and State Targets
45
46
46
46
48
49
49
52
52
4.5.3 Goal 6: Combat HIV & AIDS, Malaria and Other Diseases
4.6 Efficiency and Effectiveness of the Measures Implemented
53
55
vi
4.6.1 Utilization of PHCs
4.6.2 Formalizing Public Private Partnerships
4.6.3 The Cluster Approach to Health Service Delivery
4.7 Monitoring and Evaluation of Policies and Programmes in the Health Sector
4.8 Gaps in Performance
4.9 Some Conclusions and Policy Recommendations
Chapter 5: Water, Sanitation and Hygiene Sector
5.1 Governance and Regulatory Frameworks for Policies and Programmes
5.1.1 The Federal Framework
5.1.2 Institutional Arrangements
5.1.3 WASH Regulatory Framework and Legislation
5.1.4 Environment of WASH Programmes/Interventions
5.2. Policies, Strategies and Initiatives/Programmes in the WASH Sector
5.2.1 The WASH Sector Policy
5.2.2 Objectives, Policies and Strategies
5.2.3 Initiatives/Programmes in the WASH Sector
5.3 Public Investment and Resource Allocation in WASH
5.4 Sectoral Performance and Results of Policy/Programme Implementation
5.4.1 Sectoral Performance
55
55
56
56
57
58
61
61
61
62
63
63
64
64
64
65
67
68
68
5.4.2 Results of Policy/Programme Implementation
5.4.3 Factors Enabling Performance
5.4.4 Impact of WASH Programmes
5.5 WASH Sector Performance in Relation to the MDGS
5.5.1 Access to Potable Water
5.5.2 Access to Basic Sanitation
5.6 Efficiency and Effectiveness of the Measures Implemented
5.6.1 Effectiveness and Efficiency
5.6.2 Financial Sustainability
5.7 Monitoring and Evaluation of Policies and Programmes in the Sector
5.7.1 Monitoring of Projects
5.7.2 Assessment of M & E Activities
5.8 Gaps in Performance in the WASH Sector
5.8.1 Governance
5.8.2 Community and Private Sector Participation
5.8.3 Service Delivery
5.9 Some Conclusions and Policy Recommendations
69
70
70
71
71
71
72
72
72
72
73
73
73
73
74
74
74
Chapter 6: Agricultural Sector
6.1 Setting for Agricultural Activities
6.1.1 Policy Setting
77
77
77
vii
6.1.2 The Regulatory Framework
6.1.3 Institutional Framework
6.1.4 Rural Infrastructure
6.2 Programmes and Interventions
6.2.1 Programmes and Interventions Initiated
6.2.2 Relevance and Adequacy of Policies and Strategies
6.3 Public Spending on the Agricultural Sector
6.4 Effectiveness and Efficiency of Programmes and Projects
6.4.1 Trend of Sector-Level Indicators
6.4.2 Dimensions of Assessment of Programme Outcomes
6.4.3 Results of Programmes Initiated before the Creation of Delta State
78
79
80
80
80
81
82
83
83
84
86
6.4.4 Assessment Results of Programmes Initiated during 1991-1999
6.4.5 Assessment Results of Programmes Initiated during 1999-2014
6.4.6 Self-Assessment by Officials of the MANR
6.4.7 Challenges to Performance
6.5 Agricultural Sector Performance in Relation to the MDGs
6.6 Monitoring, Evaluation and Feedback
6.7 Gaps in Performance
6.8 Some Conclusions and Policy Recommendations
Chapter 7: Challenges, Constraints and Emerging Issues
7.1 Overview of the Challenges and Constraints
7.2 Sectoral Challenges/Constraints
7.2.1 Health Sector Challenges/Constraints
7.2.2 Education Sector Challenges/Constraints
7.2.3 WASH Sector Challenges/Constraints
7.2.4 Agricultural Sector Challenges/Constraints
7.3 Emerging Priorities and Issues
7.3.1 Health Sector Issues
7.3.2 Education Sector Priorities/Issues
7.3.3 WASH Sector Issues
7.3.4 Agricultural Sector Issues/Priorities
Chapter 8: Conclusions, Lessons and Recommendations
8.1 Conclusions
86
87
89
89
89
89
90
90
91
91
91
91
91
92
93
93
93
94
94
97
97
92
8.1.2 Conclusions from Sector Assessments
8.2 Lessons Learned from the Assessments
8.1.1 General Conclusions from the State Overview 97
99
102
viii
8.2.1 Health Sector Lessons
8.2.2 Education Sector Lessons
8.2.3WASH Sector Lessons
8.3 Policy Recommendations
8.3.1 General Recommendations
8.3.2 Sectoral Policy Recommendations
REFERENCES
102
102
102
103
103
104
109
ANNEXES
Delta State 2006 Census by Local Government Areas
A Summary of DESOPADEC's Performance on Education,
Distribution of Secondary Schools by LGAs in Delta State, 2012 / 2013
Delta State Distribution of Classrooms in Primary Schools as at 2012/2013
Abridged Responses / Comments on EDUMARSHAL
Pupil Enrolment in Basic Education by Sex, 1992 - 2013
Undergraduate Enrolment in the State Higher Institutions by Sex, 1999 - 2013
Departments and Parastatals of the Delta State Ministry of Health
Achievements of the FMHCP (2008-2012)
Summary of Achievements of the State TB Programme, 2009-2012
SSHDP Service Delivery-Achievements Indicator and Target
Bed and Facility Density by LGA
Summary of Observations from Wash Sector Field Visits, 21-23 May 2014
Brief on the WASH Sector Regulatory Commission/Framework
113
113
114
114
115
116
117
117
117
118
118
119
120
121
122
123Capital Projects Executed in 2007 and 2013 in the WASH Sector
List of Water Schemes Developed by MDGs Directorate& Handed over to
Delta State: Percentage of Households/Household Population Using
Water Schemes Visited by the Directorate of Project Monitoring,
Sources of Drinking Water by LGAs during the Dry Season
Delta State Ministry of Environment: Sewage Management from 1999-2013
127
129
130
131
133
Type of Toilet Facilities: Household Population by LGA
Agricultural Sector Projects and Programmes Implementation Features
Trend data on Area, Output and Yield of Major Arable Crops (1999-2012)
Self-Assessment of Implementation of Agricultural Policy, 2006,
134
135
148
149
Health and Water Projects
Small Town Water Supply and Sanitation Agency (STOWASSA), (2013/2014) - Status Report
Improved Water &Sanitation Facilities and Hygiene, 2006-2013.
18 November 2013 21 March 2014
Crop Output (metric tonnes)
by MANR Officials
Annex 1.1:
Annex 2.1:
Annex 3.1:
Annex 3.2:
Annex 3.3:
Annex 3.4:
Annex 3.5:
Annex 4.1:
Annex 4.2:
Annex 4.3:
Annex 4.4:
Annex 4.5:
Annex 5.1:
Annex 5.2:
Annex 5.3:
Annex 5.4:
Annex 5.5:
Annex 5.6:
Annex 5.7:
Annex 5.8:
Annex 5.9:
Annex 6.1 :
Annex 6.2:
Annex 6.3:
ix
BOXES
The Millennium Development Goals and the Relevant Sectors in the Study
Highlights of Key Policies, Programmes and Projects of the Uduaghan
Critical Infrastructure Developed/Being Developed
Milestones in the Education Sector
Key Programmes/Interventions in the Health Sector
Federalism and Water Service Delivery: Role and Responsibilities
8
11
12
28
40
62
FIGURES
Delta State's Revenue, Expenditure and Fiscal Balance
Sectoral Distribution of Delta State GDP, 2012
Absolute Poverty Incidence: Delta State and Nigeria (Original Estimates)
Absolute Poverty Incidence: Delta State and Nigeria (Revised Estimates, 2013)
Projects Monitored by the Directorate of Project Monitoring
Number of Secondary Schools in Delta State, 1994 - 2013
Number of Primary Schools in Delta State, 1999 - 2012
Primary School Enrolment in Delta State by Sex, 1992/1993; 2012/2013
Ministry of Environment's Actual Expenditure as a Percentage
Shares of Farmland Types in Total Arable Land ( per cent)
Actual Agricultural Sector Spending as a percentage of total Agricultural Sector Budget
Land Area Cultivated for Major Arable Crops during 1999-2012 (in hectares)
Crop Output ('000 MT), 1999-2012
Percentage Change in Crop Area, Output and Yield (1999-2012)
PLATES
A Completely Renovated St Patrick's College, Asaba
Students Running to School to Avoid Being Caught
13
16
18
18
21
29
29
30
66
78
83
84
85
85
28
31
Structure of Government Revenue and Expenditure ( per cent)
Delta State's GDP Performance
Absolute and Relative Poverty Incidence: Delta State and Nigeria
Income Inequality Index
Human Development Indicators: Delta State and Nigeria
Summary of Entrepreneurs Empowered under the DMCP, Dec. 2007 - May 2014
TABLES
Trend of Delta State's Revenue and Expenditure
14
15
17
18
19
20
13
Delta State's Annual Budget for the Education Sector, 2007 - 2013 26
Administration
of the Approved Budgetary Allocation by the State (2002 - 2013 )
for Lateness by EDUMARSHAL Officers.
Box 2.1:
Box 2.2:
Box 2.3:
Box 3.1:
Box 4.1:
Box 5.1:
Fig. 2.1:
Fig. 2.2:
Fig. 2.3(a):
Fig. 2.3(b):
Fig. 2.4:
Fig. 3.1:
Fig. 3.2:
Fig. 3.3:
Fig. 5.1:
Fig. 6.1:
Fig. 6.2:
Fig.6.3:
Fig. 6.4:
Fig. 6.5:
Plate 3.1:
Plate 3.2:
Table 2.1:
Table 2.2:
Table 2.3:
Table 2.4:
Table 2.5:
Table 2.6:
Table 2.7:
Table 3.1:
x
DESOPADEC's Public Investment and Resource Allocation to Education
School Enrolment for Basic and Secondary Schools in
Undergraduate Enrolment in the State’s Higher Institutions
Scholarship Scheme for Students of Delta State Origin
Net Enrolment, Literacy and Gender Parity in Basic Education
Completion Rates at the Basic and Secondary Education as at 2013
SMoH Health Budget as a Proportion of State Budget, 2006-2013
DESOPADEC's Budget Allocation to the Health Sector, 2007-2013
DESOPADEC's Health Budget Committed to Projects, 2007-2013
Proportion of Budget Spent on MDG-CGS Health Projects, 2008 2013
Hospital Data from the Free U-5 Healthcare Programme, 2010-2013
Rural Health Scheme Summary Statistics for 2008-2012
Free Rural Healthcare Scheme Data on HIV, 2008-2012
Health Worker Density by Category Per 100,000 population, 2009-2012
Goal 4 Performance by Indicators
Performance by Target 5A Indicators
Performance by Target 6A Indicators
Elements of WASH Sector Enabling Environment
MWRD Public Funding & Infrastructural Development (2003-2014)
Conditional Grants for Delta State Water, Sanitation and
DESOPADEC's Capital Budget for Water Sector, 2007-2013
Analysis of Executed Projects of MWRD, 2007-2014
Summary of Rural Water Supply Schemes
MDG Directorate's Water Supply and Sanitation & Hygiene Schemes
Completed and Ongoing Water Projects by DESOPADEC
Water Tariff Per Month Paid by Household Users, 2011
27
30
31
32
32
34
44
45
45
46
47
47
47
51
53
54
55
63
66
67
67
68
69
69
70
72
Summary of the Results of the Monitoring Visits to Water Schemes
Agricultural Sector Programmes/Projects According to Time of Initiation
Actual Government Expenditure on the Agricultural
73
79
82
Delta State, 2007/2008 2012/2013
in a Five-Year Cycle, from 1999-2014
Hygiene (WASH) Sector 2008-2013
Sector as a Percentage of Total Agricultural Sector Budget
Table 3.2:
Table 3.3:
Table 3.4:
Table 3.5:
Table 3.6:
Table 3.7:
Table 4.1:
Table 4.2:
Table 4.3:
Table 4.4:
Table 4.5:
Table 4.6:
Table 4.7:
Table 4.8:
Table 4.9:
Table 4.10:
Table 4.11:
Table 5.1:
Table 5.2:
Table 5.3:
Table 5.4:
Table 5.5:
Table 5.6:
Table 5.7:
Table 5.8:
Table 5.9:
Table 5.10:
Table 6.1:
Table 6.2:
xi
Acknowledgments
This report is the outcome of the technical assistance the United Nations Country Team in Nigeria gave to the Delta State Government towards the assessment of the performance of Delta State in four key sectors of development, namely, agriculture, education, health, and water, sanitation and hygiene. The preparation and completion of the report has therefore been done with the collaborative effort and technical lead of the United Nations Country Team.
The Senior Advisor to the Governor on Foreign Ralations wishes to thank the Governor, His Excellency Dr Emmanuel Eweta Uduaghan, for willingly consenting to the independent assessment of the performance of the state by an external body. His political support and the effective participation of all stakeholders in the state have made the exercise a fruitful and reliable one.
Similarly, the Office of the Governor deeply appreciates all the key stakeholders that made the exercise possible. In particular, the technical backstopping provided by the UNCT Technical Team has been outstanding. The Delta State Government, therefore, wishes to express its special thanks to the United Nations Resident Coordinator in Nigeria, Mr Daouda Toure and the UNDP Nigeria Country Director, Mr. Pa lamin Beyai. The same appreciation is due to Jean Cough, UNICEF Representative in Nigeria; Louise L. Setsh-waelo, FAO Representative in Nigeria; and Dr Vaz Rui, WHO Representative in Nigeria. The UNCT Technical Team chaired by Colleen Zamba, UNDP Economic Advisor, had on board Grace Arinze-Ononwu, UNDP Asso-ciate; George Igelegbai, UNICEF Education Specialist; Ajibade Olokun, UNICEF WASH Specialist; Precious Agbeso, FAO Asso-ciate Professional Officer, and Ogochukwu Chukwujekwu, WHO Health Economist.
We also would like to extend our appreciation to the expanded UNCT Technical Committee that provided comprehensive comments on the draft report. These included Samuel Momanyi, UNICEF Deputy Representative; Atsuko Toda, IFAD Nigeria Representative; Dennis Jobin, UNICEF Chief Planning, Monitoring & Evaluation and Field Coordina-tor; Rabe Mani, FAO Assistant Representative
– Programme; Kwasi Amankwaah, UN Coordination Specialist; Eva Ahlen, UNICEF Chief of Education; Enrique Delamonica, UNICEF Chief of Social Policy; Paul Okunlola, UN-Habitat National Programme Officer; Oluwafunke Ilesanmi, WHO HIV Officer; Mary Stephen, WHO Programme Officer, NCD; and Adeze Molokwu, IOM Programme Assistant.
We are also grateful to the team of independent consultants recruited by the United Nations Country Team to undertake the assessment. Led by Prof. Mike I. Obadan, the team included the following sector consultants: Prof Joshua Aisiku (Education); Dr Samuel Eremie (Agriculture); Prof Eric Eboh (Agriculture); Dr Klint Nyamuryekung'e (Health); and Prof Lekan Oyebande (WASH).
The secretariat team consisting of Daniel Iruegbukpe, Michael Uwaechie and Ugo Agbaji collated a myriad of documents from the relevant ministries, departments and agencies of Delta State Government for use by the consultants.
Similarly, we like to thank the Commissioners, Advisers, Permanent Secretaries, Directors and staff of the relevant ministries, depart-ments and agencies of the Delta State Government who participated in the various phases of the study, and provided assistance and helpful clarifications on policies, prog-rammes and projects under their purview.
We are further grateful for the participation of all stakeholders across the state at the sensitization and validation workshops. Their contributions reflected in the various pers-pectives and enriched the diversity and quality of the report. We appreciate Ambassa-dor Shola J. Omoregie and Ambassador Ejeviome Eloho Otobo who led the dialogue with the headquarters of three of the UN agencies in support of the study, as well as with the UN Country Team in Nigeria and the Delta State Government. They also provided guidance to the secretariat and facilitated the interactions between the secretariat and the team of consultants.
The study benefited greatly from the guidance of Mr. Paul Evuarherhe, the Head of Service, Delta State; Dr. Rukevwe Ugwumba, Special
xii
Adviser, Health Monitoring; Mr Tony Obuh, the Permanent Secretary, Government House; and Hon. Oma Djebah, Senior Adviser on Foreign Relations, who provided overall government perspective critical to the assessment. While Sir Paul chaired the Tech-nical Committee comprising the Permanent Secretaries of the Ministries of Health, Water, Education, Agriculture, Environment, and Economic Planning, Mr Obuh, and the entire team of Government House and Protocols gave us unqualified support throughout the exercise.
Finally, the vision and commitment of HE Dr. Emmanuel Uduaghan, the Governor of Delta State, towards improving the living condi-tions of Deltans was the driving force behind
this assessment. His support and readiness to cut through bureaucratic red tape greatly facilitated the work of the consultants in bringing this assessment to fruition. All the contributions are highly appreciated.
Hon. Oma Djebah Senior Adviser on Foreign Relations, Delta State
xiii
Acronyms & AbbreviationsACT Artemisinin Combination Therapy ANC Antenatal ClinicART Antiretroviral Therapy ARV Antiretroviral DrugsATM AIDS, Tuberculosis and MalariaCAADP NEPAD's Comprehensive Africa Agriculture Development Programme CAC Corporate Affairs CommissionCACS Commercial Agriculture Credit SchemeCAFOD The official Catholic aid agency for England and WalesCBN Central Bank of NigeriaCBOs Community-Based OrganizationsCCT Conditional Cash TransferCEmOC Comprehensive Emergency Obstetric CareCFS Child Friendly School EnvironmentCPT Co-trimoxazole Preventive TherapyCSOs Civil Society OrganizationsDAPA Delta State Agricultural Procurement AgencyDBS Dried Blood SpotsDCMP Delta State Micro-Credit ProgrammeDELSEPA Delta State Environmental Protection AgencyDELSU Delta State UniversityDELSUTH Delta State University Teaching HospitalDELTASEEDS Delta State Economic Empowerment and Development StrategyDESCC Delta Schools Climate Club DESERP Delta State Economic Reintegration ProgrammeDESOPADEC Delta State Oil Producing Areas Development CommissionDMIS Delta State Micro Insurance SchemeDOTS Directly Observed therapy Short CourseDPS Directorate of Planning and StatisticsDRF Drug Revolving FundDRS/MOEP Department of Research and Statistics of the State Ministry of Economic PlanningDSADP Delta State Agricultural Development ProgrammeDS-CCPITC Delta State Climate Change Policy and Integrated Territorial Climate PlanDSG Delta State GovernmentDSSTWSA Delta State Small Town Water Supply AgencyDS-UWB Delta State - Urban Water BoardECCDE Early Childhood Care and Development EducationEDP Essential Drugs ProjectEDUMASHAL Educational Marshal ProgrammeEFA Education For AllEID Early Infant DiagnosisELSS Elongated Life Saving SkillsEMIS Educational Management Information SystemEmOC Emergency Obstetric CareEU European UnionFADAMA III Third National FADAMA Development Project (World Bank)FDHs First Degree HoldersFDI Foreign Direct InvestmentFGD Focus Group DiscussionFGN Federal Government of NigeriaFMC Federal Medical CentreFMNDA Federal Ministry of Niger Delta AffairsFRHS Free Rural Healthcare Scheme
xiv
FRL Fiscal Responsibility LawFSP Farmers Support ProgrammeHiAP Health in All PoliciesHIV & AIDS Human Immunodeficiency virus/Acquired immunodeficiency SyndromeHRH Human Resource for HealthHSRP Health Sector Reform ProgrammeICT Information and Communication TechnologyIDSR Integrated Disease Surveillance and ResponseIGR Internally Generated RevenueIHVN Institute for Human Virology NigeriaIIGs In-depth Interview GuidesIMCI Integrated Management of Childhood IllnessesIPT Intermittent Prevention TherapyIPT Isonizide Preventive TherapyITN Insecticide Treated NetsIVM Integrated Vector ManagementJSS Junior Secondary SchoolKII Key Informant InterviewLEEDS Local Government Empowerment and Development StrategyLGA Local Government AuthorityLGAs Local Government AreasLGSC Local Government Service CommissionLLINs Long Lasting Insecticide Treated NetsLOAF Live and Own a FarmM&E Monitoring and EvaluationMANR Ministry of Agriculture and Natural ResourcesMCH Maternal and Child HealthMCI Ministry of Commerce and IndustryMDAs Ministries, Departments and AgenciesMDG Millennium Development GoalMDG-CGS Millennium Development Goals Conditional Grants SchemeMDGs Millennium Development GoalsMDGs Millennium Development GoalsMDR-TB Multi-drug Resistant TuberculosisMEP Ministry of Economic PlanningMEPI Ministry of Economic Planning and ImplementationMICS Multiple Indicator Cluster SurveyMoE Ministry of EnvironmentMORWSA Mobilization of Rural Women for Sustainable AgricultureMoU Memorandum of UnderstandingMSS Midwives Service SchemeMT Metric TonneMWRD Ministry of Water Resources DevelopmentNABCE National Business Certificate ExaminationNAFDAC National Agency for Food and Drug AdministrationNBS National Bureau of StatisticsNDDC Niger Delta Development CommissionNDES Niger Delta Environmental SurveyNDHS National Demographic and Health SurveyNDSP WS Niger Delta Support Programme - Water SupplyNECO National Examinations CouncilNEEDS National Economic Empowerment and Development StrategyNEPAD New Partnership for Africa's DevelopmentNGF Nigeria Governors Forum
xv
NGOs Non- Governmental OrganizationsNHIS National Health Information SystemNPE National Policy on EducationNPHCDA National Primary Health Care Development AgencyNSHDP National Strategic Health Development PlanNUT Nigerian Union of TeachersOOSC Out-of-School ChildrenOSSAP-MDG Office of the Senior Special Assistant to the President on MDGsPCR Polymerase Chain ReactionPeTR GS Prevention, Education, Training, Treatment & Research Global Solutions PHC Primary Health CarePM&E Planning, Monitoring and EvaluationPMTCT Prevention of Mother to Child Transmission of HIVPPM Private Partnership MixPPP Public Private Sector PartnershipPPPI Public Private Partnership InitiativePR & S Planning, Research and StatisticsPRM Peer Review MechanismPRSD Planning, Research and Statistics DepartmentPTA Parents, Teachers AssociationR & D Research and DevelopmentR/IFPP Rapid/Increased Food Production ProgrammeRapidSMS Rapid Short Message SystemRDA Rural Development AgencyRDT Rapid Diagnostic TestRHS Rural Healthcare SchemeRUWASA Rural Water Supply and Sanitation AgencySACA State Action Committee on HIV & AIDSSASCP State AIDS and STI Control ProgrammeSBMC School Board Management CommitteeSCA State Council on AgricultureSCP State Cassava ProgrammeSDGs Sustainable Development GoalsSEEDS State Economic Empowerment and Development StrategySEEFOR State Employment and Expenditure for ResultsSESSP State Education Sector Strategic Plan
SHCs Secondary Healthcare Centres SHMB State Health Medical BoardSMEP State Ministry of Economic PlanningSMoH State Ministry of HealthSMP Seed Multiplication Programme SON Standards organization of NigeriaSPDC Shell Petroleum Development CompanySPHCDA State Primary Health Care Development AgencySPPEB State Post- Primary Education BoardSSHDP State Strategic Health Development PlanSSS Senior Secondary SchoolSTI Sexually Transmitted InfectionsSTWSS Small Town Water Supply and SanitationSTOWASSA Small Town Water Supply and Sanitation Agency SUBEB State Universal Basic EducationSURE-P Subsidy Re-investment and Empowerment Programme
TACC Territorial Approach to Climate Change
xvi
TAT (EU) Technical Assistance Team (European Union)TB TuberculosisTHCs Tertiary Healthcare CentresUBE Universal Basic EducationUFW Unaccounted for WaterUHCs Urban Health CentresUNCT United Nations Country TeamUNDP United Nations Development ProgrammeUNESCO United Nations Education Scientific and Cultural OrganizationUNFPA United Nations Family Planning AgencyUNICEF United Nations Children's FundUNICEF United Nations Children's FundUNITAR United Nations Institute for Training and ResearchWAEC West African Examinations CouncilWASHCOMS Water Supply and Sanitation CommitteesWCA Water Users' Association WCAS Water Consumers' AssociationWDCs Ward Development CommitteesWHO World Health OrganizationWMHCP Ward Minimum Healthcare PackageWSDC Whole School Development ConceptWSSCE West African Senior School Certificate ExaminationWSSSRP (EU) Water Supply and Sanitation Sector Reform ProgrammeYETA Youth Empowerment Through Agriculture
xvii
Overview
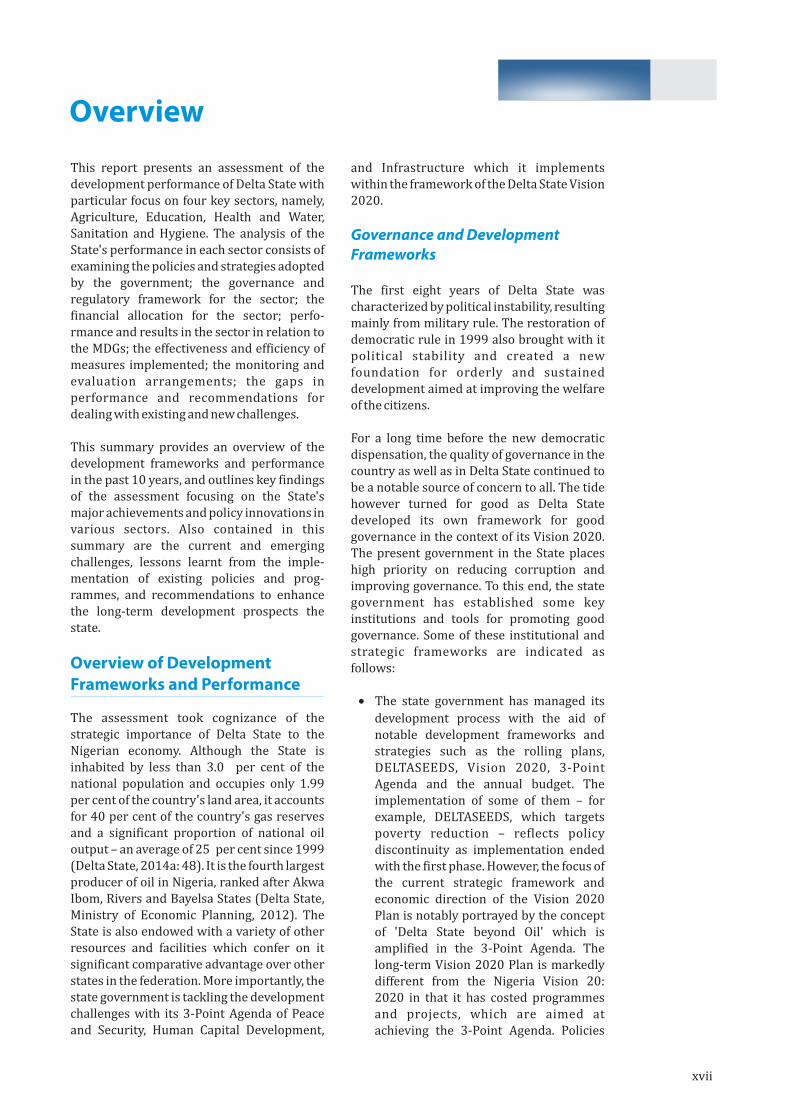
This report presents an assessment of the development performance of Delta State with particular focus on four key sectors, namely, Agriculture, Education, Health and Water, Sanitation and Hygiene. The analysis of the State's performance in each sector consists of examining the policies and strategies adopted by the government; the governance and regulatory framework for the sector; the financial allocation for the sector; perfo-rmance and results in the sector in relation to the MDGs; the effectiveness and efficiency of measures implemented; the monitoring and evaluation arrangements; the gaps in performance and recommendations for dealing with existing and new challenges.
This summary provides an overview of the development frameworks and performance in the past 10 years, and outlines key findings of the assessment focusing on the State's major achievements and policy innovations in various sectors. Also contained in this summary are the current and emerging challenges, lessons learnt from the imple-mentation of existing policies and prog-rammes, and recommendations to enhance the long-term development prospects the state.
Overview of Development Frameworks and Performance
The assessment took cognizance of the strategic importance of Delta State to the Nigerian economy. Although the State is inhabited by less than 3.0 per cent of the national population and occupies only 1.99 per cent of the country's land area, it accounts for 40 per cent of the country's gas reserves and a significant proportion of national oil output – an average of 25 per cent since 1999 (Delta State, 2014a: 48). It is the fourth largest producer of oil in Nigeria, ranked after Akwa Ibom, Rivers and Bayelsa States (Delta State, Ministry of Economic Planning, 2012). The State is also endowed with a variety of other resources and facilities which confer on it significant comparative advantage over other states in the federation. More importantly, the state government is tackling the development challenges with its 3-Point Agenda of Peace and Security, Human Capital Development,
and Infrastructure which it implements within the framework of the Delta State Vision 2020.
Governance and Development Frameworks
The first eight years of Delta State was characterized by political instability, resulting mainly from military rule. The restoration of democratic rule in 1999 also brought with it political stability and created a new foundation for orderly and sustained development aimed at improving the welfare of the citizens.
For a long time before the new democratic dispensation, the quality of governance in the country as well as in Delta State continued to be a notable source of concern to all. The tide however turned for good as Delta State developed its own framework for good governance in the context of its Vision 2020. The present government in the State places high priority on reducing corruption and improving governance. To this end, the state government has established some key institutions and tools for promoting good governance. Some of these institutional and strategic frameworks are indicated as follows:
· The state government has managed its
development process with the aid of notable development frameworks and strategies such as the rolling plans, DELTASEEDS, Vision 2020, 3-Point Agenda and the annual budget. The implementation of some of them – for example, DELTASEEDS, which targets poverty reduction – reflects policy discontinuity as implementation ended with the first phase. However, the focus of the current strategic framework and economic direction of the Vision 2020 Plan is notably portrayed by the concept of 'Delta State beyond Oil' which is amplified in the 3-Point Agenda. The long-term Vision 2020 Plan is markedly different from the Nigeria Vision 20: 2020 in that it has costed programmes and projects, which are aimed at achieving the 3-Point Agenda. Policies
xviii
undertaken by the state in the context of this Agenda has helped not only to accelerate the development of critical infrastructure, such as industrial parks, airports and power plants, but also assuaged agitation by various comm-unities culminating in the reduction of the incidence of hostage taking and kidnapping in the state.
· Also, Delta State has done appreciably
well in fiscal management with sign-ificant successes achieved in internal revenue generation. For instance, it ranks as the third highest collector of IGR in the country. Also, the state's prudence in fiscal management shows in its fiscal surpluses or low fiscal deficit ratios. However, the government should not relent in its IGR drive so as to reduce its heavy dependence on oil revenue; it should optimally tap the potentials in taxation, which is a credible and sustainable source of government reve-nue.
· The Delta State Government has taken
the commendable initiative to compute state level GDP. The figures provide an indication of the level of economic activity and income per head although they are not directly comparable with those of other states that have computed their GDP. But then, the available per capita GDP figures in Delta State are much higher than the national GDP per capita, suggesting much higher level of welfare for Deltans compared to the average Nigerian. Nevertheless, the implications of states computing GDPs with different approaches are strong enough to make them adopt a common approach under the guidance of the National Bureau of Statistics.
Development Outcomes
The development outcomes of the Delta State initiatives under the current government's leadership can be listed as follows:
· Available data suggests that the scenario
of improved economic growth without significant improvement in national development outcomes is also an issue of
concern in Delta State. The relatively good growth record of Delta State has apparently not translated into significant poverty and unemployment reduction. One contributory factor to the high poverty incidence in Delta State is the growing income inequality in the State, implying that a much smaller percentage of the population appropriate a larger share of the increase in state income and economic opportunities, thus pushing more people into poverty. The other notable factors are high level of unemployment and low agricultural productivity. There have, however, been significant improvements in other development outcomes relating to education and health. The maternal mortality rate stood at 188 per 100, 000 live births in 2013; under-5 mortality rate (per 1,000 live births) stood at 52 in 2012; and infant mortality rate per 1,000 live births was 37.0 in 2012. The related MDG targets have been achieved. On educational outcomes, the achievements are commendable in the areas of universal primary education, and gender parity.
! Besides, it is noteworthy that the Delta State Government has, in the last few years, implemented initiatives, policies and programmes aimed at significantly reducing poverty within the framework of the 3-Point Agenda. Of particular note is the establishment of the Ministry of Poverty Alleviation and the efforts it made through the Micro-Credit Prog-ramme to empower over 111,000 disadvantaged people. The Ministry did this by establishing and/or expanding cottage industries, agricultural produ-ction, trading, services, among other ventures. If sustained and vigorously implemented, it is expected that these poverty reduction strategies would have resulted in significant reduction in the poverty incidence by the next survey.
xix
Key Findings and Observations on the Education Sector
Major Policy Innovations and Achievements
The inclusion of human capital development in the 3-Point Agenda is a strong affirmation of the importance of education in the development of Delta State. The results of the implementation of educational programmes and initiatives by the government have been impressive in the following areas:
· School enrolment increase at all levels of
education and – very significantly – the positive gender parity enrolment trends;
· Infrastructural development and supply
of materials to educational institutions;· Increase in scholarship and bursary
awards for undergraduate and postgra-duate studies;
· Professionalization of teaching, attend-
ing to the welfare and boosting the morale of teachers, recruitment of more qualified teachers, training and retrain-ing, of teachers, payment of salaries as at when due, and building of teachers' quarters; and
· Implementation of existing and new
national curricula (adaptation/ domesti-cation as necessary).
Most significantly, there has been steady progress towards achieving the sector MDGs and other national and state goals, such as Education for All (EFA) and Vision 20:2020 goals. Among the significant points to note in this regard are the following:
· Available data (both primary and secon-
dary) indicate that Delta State is well-positioned to achieve MDG 2 targets, namely, ensuring that by 2015, children everywhere, boys and girls alike will be able to complete a full course of schoo-ling, as part of achieving universal primary school education; and achieving the targets of eliminating gender dispa-rity in primary and secondary education,
as part of Goal 3 on promoting gender equality by 2015.
· The prospect of 100 per cent attainment
of Goal 2 by the anticipated year 2015 will have a major impact in terms of creating an enlightened and literate citizenry with employable skills. This is the ultimate exemplification of Delta State's achieve-ments in the education sector.
· The progress towards attaining MDGs 2
and 3 in Delta State can be attributed to a number of policy initiatives and innova-tions, in particular the EDUMARSHAL initiative aimed at keeping school-age children out of the streets and in school; increased financial allocation for educ-ation; massive rehabilitation of schools; and free compulsory education policy which led to increased enrolment in basic and secondary education. In addition, the state implements a scholarship and bursary programme for all Deltans in tertiary educational institutions.
Current and Emerging Challenges
In spite of the progress made so far in the education sector, a number of challenges persist. These include the inadequate attention paid to the education needs of the rural and riverine areas of the state; continuing shortage of teachers in such subjects as physics, chemistry and civics; and mismatch between the stated commitment to advancing science and technology and inadequate funding for it. Also, the allocation of 14.7 per cent of the state budget to education in 2013, fell far below the UNESCO recommended target of 26 per cent.
Lessons Learnt
The lessons distilled from the review of the education sector include the need to:
· Keep adequate records and statistical
data/information on government poli-cies, projects and programmes imp-lementation.
· Remove bureaucratic bottlenecks which
tend to discourage stakeholders from contributing to school projects, thereby hindering community ownership, part-
xx
nership and augmentation of gover-nment efforts.
· Give more vigour and attention to quality
control and its related monitoring and evaluation functions in the sector.
· Pay adequate attention to EMIS in terms
of funding, equipment and personnel in order to avoid the negative impact on data generation, collation and analysis in the sector.
· Provide full attention, funding and back-
ing to M & E in the sector to enhance programme and project efficiency and effectiveness.
Policy Recommendations
It is recommended that the Delta State Government should extend the EDUM-ARSHAL policy to rural communities where school-age children are concentrated; ensure even provision and distribution of edu-cational infrastructure, especially in the rural and riverine areas; establish Teachers' Professional Development Centre for in-service training; and employ more teachers in key subjects such as physics, chemistry and civics.
Key Findings and Observations on the Health Sector
Major Policy Innovations and Achievements
· Generally, Delta State has recorded
positive results in the health sector by implementing several programmes and interventions which include: the Health Sector Reform Programme (HSRP); Free Maternal Healthcare Programme; Safe Motherhood; Child Health; HIV & AIDS, Tuberculosis and Malaria (ATM); and Delta State Strategic Health Development Programme (SSHDP). These have been implemented under the overall guidance of the National Health Policy (2004 revision). The State has also performed well in health infrastructural rehabi-litation and establishment.
· Beneficiaries of these programmes told
the assessment team that they were
satisfied with the government's health programmes, especially those initiatives specifically targeting the rural poor. They also offered suggestions on how to achieve better results.
· Significant achievements have been
made in many areas, including the foll-owing:
o Establishment of Free Maternal and
Under-5 Child Healthcare Progra-mmes based in 54 general hospitals and a Rural Healthcare Scheme that provides outreach services to rural communities in the State since 2008, resulting in improved preventive, dia-gnostic and treatment service utili-zation.
o Expansion of services in the HIV &
AIDS programme, resulting in 23 per cent coverage of PMTCT services and 25 per cent coverage of Antiretroviral Therapy (ART) services.
o Establishment of TB Control
Programmes of 106 DOTS sites and 22 operational microscopy centres, recording a steady increase in sputum smear positive rates 28/100,000 population (2009), 30/100,000 population (2010), 30/100,000 population (2011) and 34/100,000 population and TB cure rate of 59, 69, 75 and 75 per cent in 2009, 2010, 2011 and 2012, respectively.
o Improvement in the Malaria Control
Programme the results of which are as follows: 65 per cent of households have at least one ITN, 47 per cent of persons of all ages have access to ITN, 43 per cent of children under 5 slept under ITN the night prior to the survey; and 34 per cent of children under 5 with fever were examined and treated with Artemisinin Comb-ination Therapy (ACT) within 24 hours in 2013.
o Increase in infant mortality rate from
48/1,000 live births (2003) to 68/1,000 live births (2006), followed by a decline to 37/1,000 live births in 2012. The national 1990 baseline value and 2015 target are 91/1,000 live births and 30.6/1,000 live births.
xxi
o Keeping of Under-5 mortality rates at
102/1,000 live births (2003), 54.4/1,000 live births (2006), and 52/1,000 live births (2012). The national 1990 baseline value and 2015 target are 191/1,000 live births and 63.7/1,000 live births, respect-ively.
o Fluctuation of the percentage of one-
year-olds fully immunized against measles over several years. From 38.5 in 1999, it rose to 61.3 in 2008 and reduced marginally to 57.6 in 2012 before peaking at 60.4 in 2013. The national 1990 baseline value and 2015 target are 46 and 100 per cent, respectively.
o Lowering of maternal mortality rate
from 456 per 100,000 births (2005) to 188 per 100,000 live births (2013). The national 1990 baseline value and 2015 target are 1,000/100,000 live births and 250/100,000 live births, respectively.
o Fluctuation in the proportion of births
attended by skilled birth attendants from 49.1 to 61.5 to 73.2 and then 59.8 per cent in 1999, 2008, 2012 and 2013, respectively. The national 1990 baseline value stood at 45 per cent while the 2015 target is 100 per cent.
o Improvement in the percentage of
contraceptive prevalence rates. The figures rose from 18.7 in 1999, to 26.6 in 2008. It fell to 16 in 2012 before peaking at 28.7 per cent in 2013.
o Achievement of improved antenatal
care coverage (4 or more visits). The respective figures were 74.6 and 72.5 per cent in 2012 and 2013.
· Notable progress has also been made on
the achievement of the MDGs, as the following indications show.
o Indicator 4.1 – Infant mortality rate –
will be achieved by 2015, while the target for indicator 4.2 – Under-5 mortality rate – may already have been achieved.
o Targets for indicators 4.3 – Percen-
tage of one-year-olds fully immunized against measles; 5.2 – Proportion of
births attended by skilled birth attendants; 5.3 – contraceptive prevalence rate; 5.5 – antenatal care coverage (4 or more visits); 6.1 – prevalence of HIV among pregnant women aged 15-24 years are reducing or showing slow impro-vement over time. More concerted and targeted effort will be required to achieve them by 2015.
o Target 5.1 – Maternal mortality rate –
has progressively declined in the last ten years. It fell from 456 per 100,000 live births in 2005 to 188 per 100,000 live births in 2013, indicating that the 2015 target of 250 per 100,000 live births has already been achieved.
Note: The current data available for assessing achievement in the health targets is inade-quate.
Current and Emerging Issues and Challenges
· Despite the achievements recorded,
some critical issues and challenges need to be addressed. These include delivering a comprehensive and integrated heal-thcare package at PHC facilities; striving for universal health coverage; stren-gthening the health system in the context of the primary health care; raising adequate finance for the health sector; providing access to safe healthcare services and to efficacious medicines.
· The challenges hindering the timely
achievement of health outcomes in Delta State are many. Some of them relate to the weak health system characterized by inadequate numbers and uneven distribution of the health workforce, inadequate equipment and weak system for their repair and maintenance, inadequate health financing, a dysfu-nctional health referral system, inad-equate logistics for conducting regular supervision and a dearth of reliable, timely and accurate information for planning, monitoring and evaluating health programmes.
· Also important are the following: the
socio-cultural practices that negatively
xxii
influence health seeking behaviour; the social stigma related to HIV & AIDS that prevents people living with HIV & AIDS from disclosing their sero-status; inadequate community involvement and participation; and inadequate collab-oration between the government and private healthcare providers.
Lessons Learnt
The lessons learnt from this assessment include the following:
· Usefulness of the cluster model in imp-
roving efficiency, service delivery quality and strengthening the referral system.
· Health facility survey is critical for
determining facility readiness for service expansion.
· Public Private Partnership is important
for expanding service coverage. The approach has yielded good results in increasing the number of children being vaccinated.
· Mobile phone technology can improve
civil registration. The approach has significantly improved birth registration in the state.
· Provision of free health services
improves utilization. Provision of FMHCP and FU-5HP in Secondary Health facilities in Delta State has resulted in increased service utilization.
Policy Recommendations
These include the following:
· Organize meetings between the State
Ministry of Health (SMoH) and the Local Government authorities to discuss the modalities for providing free reprod-uctive, maternal and child health services in all PHCs;
· Expand the MSS to all LGAs in the State to
increase the number of PHCs that can deliver Basic Emergency Obstetric Care (EmOC) services and refer complicated cases to a nearby facility that can deliver Comprehensive EmOC services.
· Develop, cost and implement a Human
Resource for Health (HRH) Plan, which
will address all the current HRH issues identified;
· Establish a mechanism that provides
financial protection for all Delta citizens, especially the poor, by replacing all out-of-pocket payments for health services to a pre-payment mechanism that leads to universal health coverage; and
· Endeavour to allocate at least 15 per cent
of the state budget to the health sector in accordance with the target set by African leaders in Abuja in 2000. Between 2006 and 2013, total expenditure on health from the three sources of financing, namely, SMoH, DESOPADEC and MDG-CGS, accounted for only 5.4 per cent of the state's aggregate expenditure or 4.2 per cent of the state's budget.
· For quick implementation of these
recommendations, the SMoH, with technical support of the UN, should organize a workshop involving gove-rnment officials and stakeholders to discuss the findings and policy rec-ommendations contained in this rep-ort and develop a road map for imple-mentation.
Key Findings and Observations on the WASH Sector
Major Achievements and Policy Innovations
· The programme interventions in the
WASH sector of Delta State include those of DESOPADEC, European Union (EU), NDDC, OSSAP-MDGs, NDSP-WS, Solar-Powered Electricity with Skypower Energy of Canada and the State Government, in collaboration with UNDP (on Territorial Approach to Climate Change (TACC)) and with UNICEF (for RUWASSA).
· One of the important interventions is the
technical assistance for implementing the water component of the Niger Delta Support Programme (NDSP) which seeks to provide better access to safe water and basic sanitation facilities in Delta State and four other participating states. Another is the DESOPADEC initiatives
xxiii
which entail construction of solar-powered water supply schemes, reha-bilitation of dilapidated water schemes, and extension and distribution of water supply schemes.
· The various programmes and initiatives
have made tangible contributions to the realization of the sector's mandate and objectives.
· Of specific note are the significant
improvements in outputs and outcomes relating to water supply, reflected by the following:
o Existence of 691 water schemes
across the State. Out of these schemes, 480 or 70 per cent are functioning and delivering water to the communities in the State. By comparison, in 2006, there were 293 schemes of which 203 (69.3 percent) were functioning. Thus, the number of schemes has more than doubled since 2006. Water services might also have increased proportionately.
o The availability of water in many
urban areas, small towns and rural areas has raised the productivity of the people. Interviews and roun-dtable discussions with benefic-iaries indicated that the girl-child and women less now are burdened with travelling long distances to look for water for drinking and other hou-sehold uses.
o Going through many of the 23 streets
in Warri/Effurun where the regio-nal/urban water system has already brought water to the public squares and the front of the households, one could hear the consumers express joy and appreci-ation at having these services after decades of denial.
o The case of sanitation is different, as it
appears to be an orphan subsector with no one in charge. Only 24.3 per cent of the population has access to improved sanitation. And although 61.3 per cent of the households have a place for hand washing, only 48.7 per cent of such households have water and soap at such places.
· Considering the WASH sector perfor-
mance in relation to the MDGs, the Delta 2011 Household Survey indicates that 78.6 per cent of the population has access to safe drinking water. The MICS Survey recorded this as 75.1 per cent. However, the figure dropped to 70.1 in 2013. Most people still use borehole water especially in urban areas, and many of the households at the rural community level use either rainwater or water from streams and rivers.
· With the investments and programmes
implemented since 2011, Delta State is most likely to achieve the MDG target of 77 per cent access to potable water by 2015. The disparity between urban and rural areas remains high, however, and needs to be addressed. Greater efforts will need to be made to cater for small towns and rural communities, not only to provide the scheme in a central location, but to seek to extend the supply closer to the beneficiaries.
· As at 1999, the population with access to
improved sanitation was 35 per cent. By 2013, it had declined to 24.3 per cent. With less than 25 per cent access to improved sanitation, it is most unlikely that Delta State would meet the MDG target for basic sanitation of 63 per cent by 2015. However, numerous sensiti-zation campaigns (800 altogether, according to UNICEF) have been con-ducted in schools, markets and motor parks. These have helped to create the necessary awareness for users, policy makers and technocrats.
· One major factor that has made the
observed performance possible is the contribution of other sources of pro-grammes or investments which, though representing a relatively small propor-tion of total investment in the sector, has contributed to WASH service delivery. These other sources suppl-emented MWRD's efforts by adding new water schemes and some even undertook rehabilitation and extension of ailing or limited schemes. The Ministry's new strategy of repairing and activating non-functioning schemes and maintaining them on a regular basis also contributed much to the progress made. An under-
xxiv
lying factor in all these is the observed commitment of the sector leadership which has a strong desire to reduce the suffering of the masses.
Current and Emerging Issues and Challenges
· Notwithstanding the progress made in
this sector, some gaps in performance are noticeable in the areas of governance, community and private sector partici-pation, and service delivery. Of particular importance is the disparity in service delivery between urban and rural areas which has remained high. Greater efforts will be needed to cater for small towns and rural communities to provide the scheme in a central location and seek to extend the supply closer to the bene-ficiaries.
· Related to the above are a number of
emerging issues that will have to be addressed. These include climate change and vulnerability, regional cooperation, including River Basin shared mana-gement, level of service in contrast to access, and rapid population growth which results every year in more Deltans who need to be watered, bathed, and fed.
Lessons Learnt
A number of lessons have emerged from the WASH sector assessment. The most impor-tant of these are as follows:
· Availability of multiple sources of funds
for investing in the WASH sector is an enabling factor for significant progress in service delivery. The sources have been critical.
· Proactive planning to mitigate the fright-
ening risks associated with climate change in the coming decades is crucial. The State has already taken some commendable proactive steps to combat climate change; these would need to be carried forward.
· Global best practice can provide useful
guides on approaches to water supply development. The regional approach to
water supply development is in line with global best practice. It should be extended to include rural communities.
· It is necessary to ensure effective
maintenance of WASH infrastructure and reticulation networks through contri-bution by water users, particularly those residing in urban areas. This would release capital funds for extension of existing services and construction of new ones.
· Concerted efforts should be made to
attract private sector investments into the sector, as some states have been doing. This will be in accord with the vision of 'Delta beyond Oil'.
Policy Recommendations
The important policy recommendations that emerge from the WASH assessment derive from a consideration of technical, mana-gement, financial and institutional strategies. The following are the key recommendations:
· Select appropriate water supply type,
including financial and viability analysis of options. A thorough assessment will have to be done to reach the right decision.
· Consider the standards of supply appro-
priate for the needs and cons-traints of communities. For example, hand pumps may be given greater priority in view of chronic power problems. Also, MWRD may need to convert more of its motorized pumps to solar pumps until the power supply improves or the plan for an alternative power materializes.
· Hand over service provision to com-
munities and/or the private sector for community-managed schemes. This should apply not only to rural and small town schemes, but also ultimately to urban schemes.
· Establish water regulators to monitor,
control and support water issues. This has been stressed many times already.
· Articulate and implement clear strategies
for cost recovery.· Use revenue from water fees directly to
support operation and maintenance, otherwise both the service providers and
xxv
water users will be frustrated by the diversion.
· Make the procedures for water fee
collection and financial management robust and professionally designed and carried out.
· Increase coordination between RBDAs
(Benin-Owena, Anambra-Imo and Niger Delta RBDAs), State Water, STOWASSA and RUWASSA in water scheme planning.
Key Findings and Policy Innovations on the Agricultural Sector
Major Achievements and Policy Innovations
· Delta State is well endowed with natural,
human and financial resources for the development of a robust agricultural sector to meet a substantial part of the food needs of the state, generate income, and provide employment to help the state reduce poverty and enhance food security (MDG1).
· To realize the potentials of agriculture in
the state, the government has formulated and/or implemented, either singly or in collaboration with the federal gover-nment, development partners and the private sector about 38 agricultural programmes and projects. A total of 29 programmes (76 per cent) were initiated between 1999 and 2014. Most of these programmes generally address the agri-culture-related development needs of the state, including poverty reduction, food security and employment generation. However, the programme designs were often not robust, and some were based largely on administrative pronoun-cements without a rigorous feasibility analysis.
· Key growth in the agricultural sector has
been attributed to the expansion in cultivated areas rather than to a more sustainable growth in productivity. Nevertheless, the overall performance of the sector is deemed to have contributed substantially to the relative progress of Delta State against the MDG1 targets
compared with other states. · From 1999-2012, there was an increase
in the land area cultivated for each of the major arable crops, namely, cassava, yam and maize. The land area used for cassava cultivation, for instance, increased by 87 per cent from 72,000 ha in 1999 to 135,000 ha in 2010-2012. In comparison, the land area under maize cultivation plateaued from 2006 onwards.
· The output trend during 1999-2012 for
the major arable crops was strongly correlated with the trend for area under cultivation for crops, a reflection of the predominantly low-input-low-output agriculture still practised in most of the states. The yield of cassava and yam increased by only 36 per cent and 33 per cent, respectively, between 1999 and 2012. This is a pointer to the need for increased adoption of high-yielding planting materials and for increased use of more efficient farm inputs. The yield of maize has been flat over the past ten years. Maize is a high fertilizer-intensive crop and the apparently inadequate supply of fertilizers to farmers in the state over the years has had its toll on the yields of the crop.
· Like many other states in Nigeria,
although Delta State, is lagging behind on the MDG1 target relating to poverty reduction, progress is being made, given that the revised absolute poverty incidence reduced from 70.6 per cent in 2003/2004 to 53.8 per cent in 2009/2010.
· The estimated proportion of under-5
children who are underweight in Delta State is 13.4 per cent, which is less than half of the national rate of 27.4 per cent. This means that Delta State has posted higher figures than the overall national average on reducing extreme hunger.
· The observed reduction in extreme pove-
rty between 2003/2004 and 2009/2010 partly reflects in some outcome from the agricultural development efforts of the DSG considering that the majority of the poor are engaged in the agricultural sector.
xxvi
Current and Emerging Issues and Challenges
Despite the progress already made, it is necessary to draw attention to a number of performance gaps that should be addressed to sustain the progress in this sector. Notably, these include:
· (i) Productivity gaps associated with
poor quality of inputs, limited access to production inputs, extension services, and financial services; (ii) Lag in MDG1 achievement, associated with low prod-uctivity and weak linkages of agricultural production and food security; (iii) Weak monitoring and feedback system; (iv) Inadequate mainstreaming of gender in agricultural policy, leading to inadequate strategies for harnessing the full poten-tial of women in agricultural develop-ment; (v) Not paying adequate attention to agricultural impacts of the environ-ment and the imperative of climate change adaptation; and (vi) Gaps in funding of programmes. There was no year during which agricultural sector spending surpassed 3 per cent of total spending. This spending performance is far short of the Maputo Declaration on NEPAD Comprehensive Africa Agricul-ture Development Programme (CAADP) that up to 10 per cent of total spending should be devoted to the agricultural sector.
· Related to the performance gaps are a
number of opportunities and emerging priorities, among which are:
o Scope of efforts to address climate
change adaptation in current and future policy reviews;
o Encouragement of public private
partnerships to bring much needed technical and financial services to small-scale farmers;
o Development of youth population to
transform into young agricultural entrepreneurs;
o Innovative tapping of ICTs for service
delivery, as with e-wallet; o Farmer documentation and database
development for improved targeting
of farmers; o Payment of closer attention to the
value chain approach to catalyse lin-kages between agriculture and industry;
o Relative advantage of channelling
more public resources to develop agri-culture; and
o Linkage of production to food security
to achieve MDG1 targets.
· However, it is important to address the
following implementation challenges: (i) Inadequate and irregular funding of MANR and agricultural programmes; (ii) Asymmetry of plan, budget and spending; (iii) Weak inter-agency coordination; (iv) weak programme monitoring and lack of follow-through and feedback arrang-ements; (v) Poor attention to selection of programme beneficiaries; (vi) Poor rural infrastructure, especially roads and electricity, for value addition and access to markets; (vii) Limited access to sustainable financial services; and (viii) Weak communication between govern-ment departments and small farmers in programme implementation.
Lessons Learnt
· Need to pay attention to details of key
processes in programme implement-ation, such as the development of robust criteria for selection of programme beneficiaries and close monitoring of implementation.
· The direct supply/delivery of subsidized
agricultural inputs by government agen-cies is very risky. Government should find a best-practice mode of delivering its intervention effectively while limiting its role to facilitation, funding and moni-toring.
· Full-scale rollout of intervention progra-
mmes without prior piloting does not allow for cumulative learning. Sequ-encing of programme implement-ation in terms of scale and content is critical for effective outcomes.
xxvii
Policy Recommendations
To address the challenges and pertinent issues and enable the sector to realize its potentials and goals, government needs to consider the following:
· Undertake a strategic stakeholder dialo-
gue and stocktaking on previous inter-ventions to internalize the lessons;
· Remove the public sector from involv-
ement in services and activities that are more efficiently and effectively under-taken by the private sector;
· Develop and operationalize policy and
programme linkages between the agri-cultural production interventions and food security goals and targeting commodity enhancement based on the value chain approach;
· Strengthen the MANR to become more
capable to design, execute and monitor agricultural and food security policies and programmes;
· Provide adequate budgetary resources to
the agricultural sector in line with the 'priority' status accorded the sector in current development plans and in 'Delta beyond Oil'; and
· Include in the enhanced funding provi-
sions for the agricultural sector a strategic plan for the provision of critical infrastructure for agricultural develo-pment, especially access roads and electric power.
Conclusion
The commitment of the Delta State govern-ment to improve the living conditions of Deltans is reflected in the formulation and implementation of policies, programmes and projects that stakeholders have described as laudable. Notable progress has been made on many fronts, considering the results of programme and project implementation in the four key sectors under focus. The assessment, however, revealed some gaps in performance and emerging issues which need to be addressed. The prospects are bright for improving performance on some lagging MDG targets so as to achieve them by 2015 or not long after. For example, the recent poverty
reduction strategies and measures, including the micro-credit scheme, would result in significant reduction in the poverty incidence by the time of the next survey. To achieve this, however, government would need to address the critical constraints identified.
To further improve overall development performance, it is important for government to do the following: enhance transparency in budget presentation relating to fiscal balance and the methods of financing it; continue the IGR drive, especially with a view to tapping the high potentials in taxation; and compute state-level GDP with a methodology that will confer credibility, comparability and accept-ability on the computed figures. Also, not only will growth have to be speeded up in Delta State, its quality has to improve in terms of being employment-generating, broad-based and shared. Conscious pro-poor policies that channel resources towards sectors with maximum poverty reducing impact and ensure the participation of the poor in the growth process are indispensable.

xxviii
1
IntroductionIn its desire to improve development performance in Delta State, the state government considered it important to have an independent and objective assessment of where the state had been, where it currently stands and how it can significantly improve the welfare of the citizens in the future, especially through the achievement of the Millennium Development Goals (MDGs). This report is the result of the assessment carried out under the auspices and guidance of the United Nations Country Team (UNCT) in Nigeria. It contains the findings and recommendations from the assessment. The rest of this introductory chapter provides the necessary context by first reviewing the Delta State profile. It then outlines the objectives of the assessment, as well as the methodology adopted, and concludes with an explanation of how the entire report is organized.
1
State Profile
Delta is one of the 36 states in the Federal Re-public of Nigeria. It was created on 27 August 1991 by the Babangida admini-stration out of the former Bendel State. Bendel State covered the entire territory formerly known as the Midwest Region after it was excised from the then Western Region in August 1963. Consequently, the Midwest Region became a state among the 12 new states created by the military regime of General Gowon on 2 May 1967. The name was changed to Bendel State in February 1976 in light of the two provinces – Benin and Delta – that constituted the state. In the state creation exercise of 1991, the Asaba Division of the old Benin Province was finally emerged with Delta province to constitute Delta State. Its capital city is Asaba, located on the western bank of the River Niger.
0Delta State lies roughly between latitudes 5 000' and 6 00' north of the Equator and
0 0longitudes 5 00' and 6 45' east of the Greenwich Meridian. The State covers a land
2mass of about 18,050 km of which about 60 per cent is land while the rest is swampy and waterlogged. This means that the State's development policies and programmes have to take due cognizance of the peculiar geography whereby 40 per cent of the geogra-phic area is riverine, which renders many communities inaccessible all the year round and locked in the informal sector of the economy. Delta State is bounded in the North by Edo State, on the Eastern front by Anambra and Rivers States, and on the Southern front by Bayelsa State. The Bight of Benin of the Atlantic Ocean forms the western boundary
while the northwest boundary is Ondo State.
At present, Delta State is made up of 25 Local Government Areas (LGAs). Besides the political division of the State into LGAs, it is further divided into three senatorial districts – Delta North, Delta South and Delta Central – and nine federal constituencies, for the purpose of electing representatives into the National Assembly in Abuja. The State has been administered by both military admi-nistrators and civilian governors: six military administrators and one civilian Governor, Olorogun Ovuodoroye Felix Ibru, between 28 August 1991 and 29 May 1999, and two civilian governors, Chief James Onanefe Ibori, 29 May 1999 – 29 May 2007 and Dr Emmanuel Eweta Uduaghan, 29 May 2007 – the present.
As would be expected, the population of the State has grown steadily. The 1991 census estimated it at 2,590,491. This figure rose to 4,112,445 by the 2006 population census, indicating a growth rate of 3.92 per cent per year compared to 3.85 per cent for the nation (Delta State, Vision 2020:6). The 2012 estimate of the population was 4,802,480. While the 1991 census indicated more females (1,318,559) than males (1,271,932), the 2006 exercise showed a structural change with males (2,069,309) being slightly more than females (2,043,136). Annex 1.1 shows the population distribution by sex and across the LGAs.
Delta State is of great strategic importance to the Nigerian economy. Although peopled by less than 3.0 per cent of the national population and occupying only 1.99 per cent
2
of the country's land area, it has been a major producer of oil and gas in Nigeria since 1958 when the first wells were drilled by Shell Petroleum Development Corporation (SPDC). The State accounts for 40 per cent of the country's gas reserves and a significant proportion of its national oil output – an average of 25 per cent since 1999 (Delta State, 2014a: 48)). It is the fourth largest producer of oil in Nigeria, ranking after Akwa Ibom, Rivers and Bayelsa States (Delta State, Ministry of Economic Planning, 2012). The State's natural gas reserve is even more abundant than its crude oil: it boasts about 66.8 trillion cubic feet reserve out of the nation's 167 trillion cubic feet gas reserves.
Besides abundant oil and gas, the State has a variety of other resources and facilities which gives it significant comparative advantage over other states in the Federation. These resources include: solid minerals such as silica, lignite and kaolin; abundant land for cropping and plantation agriculture; forest resources; water bodies for recreation and tourism; aquatic resources with vast poten-tial for aquaculture; several ports, etc. The State has diverse areas of investment potentials. Some of these were outlined by Governor Emmanuel Uduaghan's presen-tation entitled 'Investment and Development: The Key Drivers for Delta State' which he made at the First South-South Nigeria Economic Summit held in Calabar in 2009.
Although the State is richly endowed with various resources, especially oil, the resources are yet to be fully harnessed to significantly improve the welfare of the people. The Delta State Vision 2020 (p. 9) has similarly observed that 'in spite of the(se) rich endowments, the State is yet to fully realize its full potential'. Knowing the implications of the State's overdependence on oil and gas revenues, the government of Dr Emmanuel Uduaghan has outlined a vision of 'Delta State beyond Oil'. The policy aims at diversifying the economy and enhancing the welfare of the citizens. It is also tackling subsisting challe-nges with its 3-Point Agenda of Peace and Security, Human Capital, and Infrastructural Development. This is being implemented within the framework of Delta State Vision 2020. The programmes relating to human capital development are particularly relevant for the attainment of the State's MDGs and targets.
Objectives of the Assessment
The broad objective of the assessment is to review the Delta State development performance in the four areas of education, health, agriculture, and water, sanitation and hygiene; identify the gaps in performance and challenges within each sector, and indexing the performance using, among other things, the MDG targets and indicators. In the words of Governor Uduaghan, 'our aim is to document the outcome of an objective review of our developmental trajectory and present a template that may help guide and inform policies of subsequent administrations'. The specific objectives of the assessment were to:
· Assess the performance and results of
policy implementation in each of the sec-tors, by identifying the bottlenecks, con-straints and enabling factors;
· Identify measures to address the perfor-
mance gaps and challenges in each of the sectors;
· Review the MDGs and State targets and
indicators for each of the sectors;· Identify the unfinished business of the
MDGs and determine priority areas of focus for development of the sectors in the future;
· Make recommendations on the way for-
ward to achieve the desired goals in each of the sectors.
The assessment is thus significant in that it provides an evidence-based framework for improving development performance in Delta State. The results of performance and the gaps indicated will clearly provide a basis to focus policy making on enhancing the welfare of the people of Delta State.
Methodology
Although the assessment covers the entire period of its existence (from its creation in 1991 to 2014), but there were no data for most part of the earlier period. Furthermore, the MDGs were adopted from the early 2000s following Nigeria's assent to the 2000 Millennium Declaration of the United Nations. Assessment of the performance on the MDGs is thus possible for the period, which coincides with the current democratic dispe-nsation.
A major plank of the approach used is desk
3
review of available documents and data. Such data were largely obtained from various publications of the Delta State Government, Federal Ministries, Departments and Agen-cies (MDAs), particularly those of the National Bureau of Statistics, and intern-ational organizations. Supplementary data were obtained through field survey cond-ucted by the team of consultants who interacted with stakeholders, especially the beneficiaries of government programmes and projects and used instruments such as round-table discussions, interviews, focused group discussions and town-hall meetings to elicit information from them. The field work was undertaken from 21-30 May 2014.
For effective take-off of the assessment, a three-day preparatory workshop, opened by His Excellency, Governor Emmanuel Uduaghan and chaired by Ambassador Shola J. Omoregie, was attended by the team of consultants, UNCT officials and State Government officials, including the Hon-ourable Commissioners. At the workshop, the Honourable Commissioners in charge of the relevant sectors made PowerPoint presen-tations of the policy directions, programmes, strategies and activities of their various min-istries/sectors. The consultants interacted extensively with the government officials and agreed on a work plan and the inform-ation/data requirements for the assessment.
The consultants also relied on a secretariat that was set up to facilitate its work and act as interface between the technical experts, the state's bureaucratic channels and the sectors being assessed. This Secretariat, which was located in the Office of the Senior Adviser on Foreign Relations, Hon. Oma Djebah, had the following members: Hon. Oma Djebah, Sir Paul Evuarherhe, Michael Uwaechie, Daniel Iruegbukpe, Saturday Nukueye and Ugo-chukwu Agbaji. The secretariat provided support to the Assessment Team throughout the process, particularly during the prepa-ratory workshop, review meeting/workshop, fieldwork and search for and distribution of relevant documents.
Finally, as a policy-oriented study, this report stresses the key messages from the trends and observations coupled with the impli-cations with a view to coming up with key lessons and recommendations. Tables, charts and boxes are used where necessary for
illustration and better appreciation of the data presented.
Limitations of the Assessment
The assessment clearly provides useful insights into the development performance of Delta State, particularly in Education, Health, Agriculture, and Water, Sanitation and Hygiene. However, data challenges tended to limit the assessment to the period under the current democratic dispensation, especially the recent years. Thus, for example, although the Terms of Reference specify that assessment of the health sector (and, indeed, the other three sectors) should extend from 1991 to 2013, documented information was only available for 2007-2013. Similarly, there was a data gap on the outcome and impact indicators for assessing the performance of the health sector and progress made in achieving some of the MDG targets. Thus, poor or inadequate data availability, especially for the earlier years, has tended to restrict the scope such that focus had to be on the recent years for which more data is available. Secondly, the successive State Governments have implemented several policies, programmes and initiatives aimed at achieving desired development results. But as evaluation studies have not been carried out on the policies and programmes, it may not be advisable to strongly associate them with the various development results.
Organization of the Report
The report is organized into eight chapters. Following this introductory chapter, which provides the context through a review of the State profile, is chapter 2, which provides an overview of development frameworks and performance in the State. Issues reviewed include governance, development frame-works, fiscal management, and development outcomes. Chapter 3 reviews the perfor-mance of Education while Chapter 4 focuses on Health. Similarly, Chapter 5 assesses the performance of the Water, Sanitation and Hygiene sector while 6 reviews that of Agriculture. In Chapter 7 is a discussion of the challenges and constraints to the perfor-mance of the sectors coupled with highlights of the emerging issues and priorities. Chapter 8 concludes the report with highlights of conclusions and recommendations from the entire report.

4
5
Governance
The period around May 1999, some eight years before the present democratic dispensation commenced in Delta State, was characterized by instability in the political leadership. Six military administrators and one civilian governor were in charge of the affairs of the State at various times between August 1991 and 29 May 1999, which trans-lates to an average of about one administrator per year. Perhaps, the nature of the military rule then led to the frequent changes in the political leadership of the state. The instability in political leadership was a major challenge to a sustained pursuit of the development aspirations of the very young State and expectations triggered by its creation remained largely unfulfilled (Delta SEEDS, 2005: 3). In contrast, the State began to experience stability in political leadership since the return to democratic rule in 1999. Two Governors, including the incumbent, have administered the State since then: Chief James Ibori, May 1999 – May 2007; and Dr Emmanuel Uduaghan, May 2007 – present. Thus, under democratic governance, stability in political leadership has been restored as a basis for orderly and sustained development efforts aimed at improving the welfare of the citizens.
From a development perspective, when good governance prevails, it allows for efficient and effective public administration, good policies and sound management of resources, which should lead to improved development outcomes (Obadan, 1998). Specifically, it reflects, among other things, accountability of
government officials for public funds and resources, transparency in government procedures, processes, investment decisions, contracts and appointments, and observance of the rule of law by governments and citizens (World Bank, 1992).
In some countries, especially in the developing world, governments find it difficult to observe the tenets of good governance. Consequently, poor governance has tended to inhibit those countries' deve-lopment. Nigeria, for instance, has not been immune to poor governance; if anything, it has remained a chief source of concern in the country. Poor governance, by entailing corruption, and lack of accountability and transparency, provides opportunities for the well-connected elites and interest groups to appropriate an undue proportion of the nation's resources at the expense of the people, thus exacerbating poverty and inequality in the country.
Against the backdrop of the strong desire for good governance, Delta State has a vision for good governance in the context of Vision 2020 which is 'to evolve a polity of transparency and accountability at all times that guaran-tees equity, justice, peace and security to all Deltans'. The mission is to establish a system of good governance based on global practices. To this end, strategies are outlined in Delta State Vision 2020 to promote good govern-ance in the areas of peace, security, law and order; civil service and parastatals; inter-ethnic and youth relations; as well as local government and labour relations. Specifically, the state government has created some
The primary focus of the assessment, whose findings are presented in this report, is performance of four key sectors in relation to the
MDGs and other State targets. The policies, programmes and projects aimed at achieving the objectives of the sectors are formulated
and implemented in the context of broad development frameworks and strategies, such as Delta SEEDS and Vision 2020. Also, the nature
and effectiveness of governance affect performance of the sectors. Therefore, this chapter provides an overview of development
performance in Delta State by reviewing governance, development frameworks and strategies, fiscal management, and development
outcomes, especially relating to economic growth and poverty.
Overview of Development
2
Frameworks and Performance
6
institutions and tools to promote good governance. Among these are the following:
— Setting up of Economic Advisory Team and Economic Management Team;
— Enactment of the State Fiscal Respon-sibility Law, 2008;
— Enactment of the Public Procurement Commission Law, 2009. The government has also set up a Public Procurement Reform Implementation Committee (its report was to be presented to the Go-vernor);
— Adoption of a Monitoring and Evaluation Software System. This is a monitoring and evaluation computerized system to support the implementation of Delta State Vision 2020. The software is being produced by the United Nations Institute for Training and Research (UNITAR);
— Publication of the Economic Dashboard showing the performance of the MDAs based on the Key Performance Indicators derived from the Delta State Vision 2020, the MDGs and International benchmarks. The Dashboard is an innovative and transparent self-assessment tool in the art of good governance; and
— Preparation of quarterly budget imple-mentation reports by MDAs.
These measures seek to promote good governance through strengthening of govern-ment institutions, processes, and systems in public financial management, policy and strategy, public sector management, know-ledge management, and monitoring and eva-luation.
Indications are that the present government in Delta State places high priority on reducing corruption and improving governance. In February 2010, the Delta State Government requested the World Bank to carry out a comprehensive review of the procurement systems in the State and Local Government Councils with a view to identifying the strengths and weaknesses of the procure-ment systems and to make recommendations for their improvement. In its report (World Bank, 2011), the Bank wrote as follows: 'The present Delta State Administration has realized the importance of sound procure-ment to the development of Delta State and has therefore asked the World Bank to make recommendations reflective of international good practice in public procurement and that
will yield dividends of reducing corruption, improving governance, and obtaining value for money for public resources'. Following the Bank's recommendations, the Government set up a Public Procurement Reform Imple-mentation Committee to drive the institu-tional framework for the optimal operation of the Public Procurement Law.
Development Frameworks and Strategies
The Delta State Vision 2020, 2011-2020, observes that socio-economic activities, policies and programmes had always been undertaken in Nigeria on an ad hoc and short-term basis without a clearly defined pathway into the future. The annual budget featured prominently as the key instrument for imple-menting the rolling plans which invariably lacked a perspective or long-term planning framework. The nation's economic perform-ance was not inspiring in the 1990s, which was the period of the implementing the rolling plans. The average growth rate for the country was less than 3.0 per cent. Even then, the administration of President Olusegun Obasanjo discontinued formal planning from the early 2000s in favour of the market strategy. However, the governments at the federal, state and local government levels, from 2004, introduced the National, State and Local Government Economic Empowerment and Development Strategies, respectively, as the major strategy for reducing poverty in the country and against the backdrop of the MDGs.
The Millennium Development Goals
The MDGs refer to eight internationally identified development goals agreed upon as the objects of worldwide pursuit and estab-lished following the Millennium Summit of the United Nations in September 2000. The goals derived from earlier development targets considered when world leaders adopted the United Nations Millennium Declaration. At the Millennium Summit, world leaders endorsed the Millennium Declaration and adopted the MDGs which turned out to be the main outcome of the Summit. The United Nations Millennium Declaration asserted that every individual has dignity, and hence, the right to freedom, equality, a basic standard of living that includes freedom from hunger and violence
7
and encourages tolerance and solidarity. All the 189 UN Member States then (193 currently) and at least 23 international organ-izations committed to helping to achieve the Millennium Development Goals by 2015. Nigeria was one of the Member States that committed to working together in a global partnership to address the development challenges facing humanity.
Box 2.1 shows the eight goals and targets in relation to the relevant sectors of the assessment. The goals are accompanied by 21 time-bound targets (most of which are set against a 1990 baseline), and a series of measurable indicators to assist the system-atic monitoring of global and national progress made against the Millennium Declaration. Besides, strategic roles and responsibilities were defined for national governments. For instance, they were required to align their strategic national development frameworks, policies and resources efficiently to achieve the set goals and targets. International organizations, citizens, civil society organizations and the private sector were to rally behind global and national campaigns aimed at achieving the MDGs. Also, national governments were mandated to develop MDG-based strategies to meet their specific regional and national situations, reflect local peculiarities, as well as target more specific and measurable prob-lems.
Nigeria has implemented several policies, programmes and projects aimed at achieving the MDGs. The savings from the external debt relief obtained from the Paris Club in 2005 have been devoted wholly to implementing MDGs programmes and projects. In Delta State, the government, in line with the national strategy for poverty reduction – NEEDS and Nigeria Vision 20: 2020 – developed the State Economic Empowerment and Development Strategy (SEEDS) docu-ment (in 2005); the Vision 2020, including the Implementation Plans (in 2010); and the 3-Point Agenda in the context of the Vision 2020.
So far, Delta State has produced two reports, one in 2010 and the other in 2011, showing progress on the attainment of the MDGs. The first indicated poverty as a major subsisting challenge but with significant progress in improving child nutrition, school enrolment,
ratio of girls to boys in primary and secondary schools, debt management and building partnerships (Delta State MDGs Report, 2010). The second Report, 2011, still reported mixed performance on the MDGs: notable progress towards achieving some targets and challenges with respect to others. Significant progress was noticed in Goals 2 (universal primary education) and 5 (improvement of maternal mortality). But progress was slow in meeting MDGs 1, 6 and 7 (i.e., poverty reduction, access to HIV & AIDS treatment, and access to safe water).
Delta State Economic Empowerment and Development Strategy
The Delta State Economic Empowerment and Development Strategy (DELTASEEDS) (2005-2007) was introduced in 2005 to provide a new development framework for strength-ening the achievements of the past and looking beyond the present to build a virile economy for the State. It was created to perform the same role as the National Economic Empowerment and Development Strategy (NEEDS), which was launched by the Federal Government in 2004. Accordingly, DELTASEEDS focused on four key areas of concern, namely, poverty reduction, employment generation, wealth creation, and achieving the MDGs. It was a strategy document aimed at achieving wealth creation, poverty reduction, employment generation, sustainable development, good governance, environmentally friendly attitu-des, and promotion of private sector growth. DELTASEEDS was designed to capture the broad goals of NEEDS and meet the MDGs at the same time.
The strategic areas of focus of DELTASEEDS can be enumerated as follows:
— Agriculture;— Social development with emphasis on
health, education, roads, transportation, water supply and justice;
— Environment/physical planning;— Small and medium enterprises; and— Reform of government finance instit-
utions for revenue enhancement through various channels.
DELTASEEDS-specific programmes and projects were to be embedded in the State's annual budgets from 2005-2007. Such
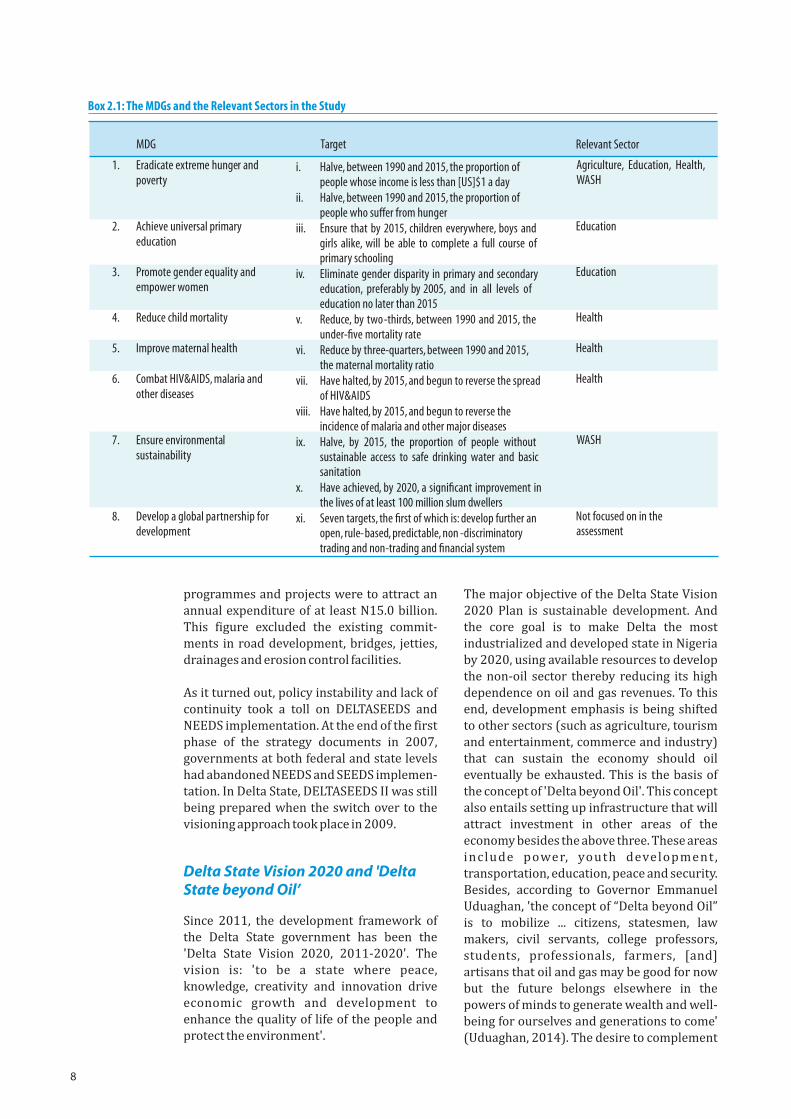
8
programmes and projects were to attract an annual expenditure of at least N15.0 billion. This figure excluded the existing commit-ments in road development, bridges, jetties, drainages and erosion control facilities.
As it turned out, policy instability and lack of continuity took a toll on DELTASEEDS and NEEDS implementation. At the end of the first phase of the strategy documents in 2007, governments at both federal and state levels had abandoned NEEDS and SEEDS implemen-tation. In Delta State, DELTASEEDS II was still being prepared when the switch over to the visioning approach took place in 2009.
Delta State Vision 2020 and 'Delta State beyond Oil’
Since 2011, the development framework of the Delta State government has been the 'Delta State Vision 2020, 2011-2020'. The vision is: 'to be a state where peace, knowledge, creativity and innovation drive economic growth and development to enhance the quality of life of the people and protect the environment'.
The major objective of the Delta State Vision 2020 Plan is sustainable development. And the core goal is to make Delta the most industrialized and developed state in Nigeria by 2020, using available resources to develop the non-oil sector thereby reducing its high dependence on oil and gas revenues. To this end, development emphasis is being shifted to other sectors (such as agriculture, tourism and entertainment, commerce and industry) that can sustain the economy should oil eventually be exhausted. This is the basis of the concept of 'Delta beyond Oil'. This concept also entails setting up infrastructure that will attract investment in other areas of the economy besides the above three. These areas include power, youth development , transportation, education, peace and security. Besides, according to Governor Emmanuel Uduaghan, 'the concept of “Delta beyond Oil” is to mobilize ... citizens, statesmen, law makers, civil servants, college professors, students, professionals, farmers, [and] artisans that oil and gas may be good for now but the future belongs elsewhere in the powers of minds to generate wealth and well-being for ourselves and generations to come' (Uduaghan, 2014). The desire to complement
Box 2.1: The MDGs and the Relevant Sectors in the Study
Target
i. Halve, between 1990 and 2015, the proportion of people whose income is less than [US]$1 a day
ii. Halve, between 1990 and 2015, the proportion of people who suffer from hunger
iii. Ensure that by 2015, children everywhere, boys and girls alike, will be able to complete a full course of primary schooling
iv. Eliminate gender disparity in primary and secondary education, preferably by 2005, and in all levels of education no later than 2015
v. Reduce, by two-thirds, between 1990 and 2015, the under-five mortality rate
vi. Reduce by three-quarters, between 1990 and 2015, the maternal mortality ratio
vii. Have halted, by 2015, and begun to reverse the spread of HIV&AIDS
viii. Have halted, by 2015, and begun to reverse the incidence of malaria and other major diseases
ix. Halve, by 2015, the proportion of people without sustainable access to safe drinking water and basic sanitation
x. Have achieved, by 2020, a significant improvement in the lives of at least 100 million slum dwellers
xi. Seven targets, the first of which is: develop further an open, rule-based, predictable, non -discriminatory trading and non-trading and financial system
Relevant Sector
Agriculture, Education, Health, WASH
Education
Education
Health
Health
Health
WASH
Not focused on in the assessment
MDG
1. Eradicate extreme hunger and poverty
2. Achieve universal primary education
3. Promote gender equality and empower women
4. Reduce child mortality
5. Improve maternal health
6. Combat HIV&AIDS, malaria and other diseases
7. Ensure environmental sustainability
8. Develop a global partnership for development
9
oil receipts led the government to design a model Comprehensive Economic Develop-ment Framework. The strategies of this framework focus on integrating other sectors of the State's economy, including commerce and industry, manufacturing, ICT, healthcare, culture, tourism and hospitality.
The Delta State Vision 2020 Plan is a major blueprint that articulates the developmental issues and challenges facing the State as well as the short, medium and long-term actions to tackle them over a ten-year period (from 2011-2020) in order to put the State firmly on the path of sustainable growth and develop-ment. The Plan also has targets for each sector/area of activity covered. For example, two of the targets set for the education sector are to: (i) Systematically increase enrolment of primary school pupils from the current 605,891 to about 758,614 in the short to medium term and 1,000,000 by 2020; and (ii) Raise the number of secondary school teachers from the current 11,254 to about 16,000 in the short to medium term and to 30,000 by 2020.
The Plan includes costed programmes and projects under three broad time horizons – short, medium and long terms that represent the first, second and third implementation plans, respectively. The proposed investment in the Delta State projects and programmes during the ten-year period is N3.189 trillion against expected total revenue of N2.757 trillion. The implied financing gap of N0.432 trillion is to be covered with borrowings from the capital market and other sources, bearing in mind the need not to veer off the path of debt sustainability and ensure compliance with the Fiscal Responsibility Law (FRL) (2008).
The 3-Point Agenda
Within the framework of the Vision 2020, and in pursuit of the goal of Delta Beyond Oil, the government is currently implementing a 3-Point Agenda, which focuses on:
· Peace and Security;
· Human Capital Development; and
· Infrastructure Development.
The state government recognizes the crucial role of peace and security in enabling the realization of economic potentials, and
promoting new domestic and foreign private investment. Very importantly, peace and security ranked above everything else for Governor Uduaghan at the time he assumed office in 2007 because of the very disturbing security situation which needed to be tackled frontally. The general elections in the State then had generated some conflicts and armed insurgents, ferocious ethnic suspicion and rivalry were common. Kidnapping of foreigners as baits for ransom money was widespread. Militants targeted government officials, perceived well-heeled individuals and foreigners as well as oil pipelines; attacks on the latter cut down the State's oil production capacity and its ability to generate revenue. At some point, oil production fell from 2.2 million barrels per day to below 700, 000 barrels per day.
This scenario informed the strategic priority of the government, which has been to significantly reduce the incidence of youth restiveness and communal conflicts. This is being pursued through the implementation of various programmes and specific actions in order to create a conducive environment for business, wealth creation and employment generation. One of the steps taken by the State was to create Delta State Security and Waterways Committee. This committee has assisted the government in intelligence gathering, resolution of contentious issues, and proactive monitoring and reporting of illegal activities in the creek areas with the aim of averting possible unrest. Besides, Delta State has been a major player in the Presidential Amnesty Programme for Niger Delta militants; and this has helped in the drastic reduction of militancy in the State. Finally, the State has been making notable efforts to develop the oil producing areas through the Delta State Oil Producing and Area Development Commission (DESOP-ADEC). The Government's support towards the development of the communities through this Commission has helped in calming frayed nerves in the state. (DESOPADEC is further discussed in Section 2.2.5.)
Generally, some success has been achieved in the control and management of the political crisis in the State, while the incidence of hostage taking and kidnapping has reduced. Governor Emmanuel Uduaghan stressed this point in the speech he delivered on 29 May at the 2014 Democracy Day celebration in Asaba
10
when he said: 'Delta State is more peaceful and united than it was when we assumed office. Crime wave is down and we intend to ensure that criminals have no hiding place in the State'. With the relative calm experienced in the Niger Delta region, national oil production increased significantly from 1.7 million barrels per day (mpd), prior to the amnesty initiative of August 2009, to 2.34 mpd in June 2011 and 2.29 mpd in 2013.
Human capital development is a major priority of the government of Governor Emmanuel Uduaghan. One primary objective of the human capital development policy is to provide accessible and affordable health care services with a view to increasing life expectancy. To achieve this, the government has introduced across the State free rural, maternal, and under-5 healthcare program-mes, and established new Primary Health Care Centres and hospitals, including the Delta State University Teaching Hospital, Oghara. The free maternal healthcare pro-gramme is a scheme that provides antenatal care, deliveries and provision of drugs throughout the duration of pregnancy for all pregnant women in government hospitals and free medical treatment for children under five years.
The government has shown a renewed interest in education as evidenced by the educational summit of September 2009 and the signing of an MoU aimed at youth empowerment in order to address the challenges of technical skills gap, unemplo-yment and youth restiveness in the Niger Delta region. Policies, programmes and structures have been developed to ensure equity and access to educational oppor-tunities by all Deltans. Of specific importance is the Free Education Policy introduced State-wide, entailing free primary, basic and post-basic secondary education. The government also created a grant and scholarship scheme to encourage undergraduate and post-graduate students. Besides improving access to education through the free education policy, a micro-credit programme was ini-tiated to improve the employment rate by providing gainful employment to young Delta citizens through economic/youth empower-ment and a number of youth rehabilitation centres. In collaboration with the United Nations Development Programme (UNDP), Delta State is building the Egbokodo Multi-
Purpose Youth Centre, which will focus on reorientation, conflict prevention, and job creation. The government has also rehab-ilitated various skills acquisition centres and constructed new ones for the training and empowerment of youths in the State.
The state government also introduced a number of policies and programmes covering education, healthcare, potable water, sanitation, public utilities and employment in order to achieve rapid and sustainable economic development. While these are discussed in detail in Chapters 3-6, Box 2.2 highlights these key policies, programmes and projects in the context of the 3-Point Agenda.
In acknowledging the crucial role of infrastructure in driving the economic growth and development of the State, the government allocates an appreciable percentage of the annual budget to the implementation of strategic infrastructural projects. Besides, the government has adopted the PPP model in the development, provision and maintenance of infrastructure, such as construction works, waste management, road maintenance and power generation. The aim of this is to sign-ificantly address the challenge of infra-structural provision by improving available facilities and building new ones.
Box 2.3 shows some critical infrastructural
projects executed by the government in line
with the 3-Point Agenda. The significance of
infrastructure, especially electric power, lies
in its centrality to all other economic
activities. The state government and some key
investors have reached an advanced stage in
completing an independent power project
(IPP). This project, which will generate 128
MW of electricity at full capacity, is at 70 per
cent completion, and is expected to be
completed by December 2014. Also, the State
has invested over N15.0 billion in the Federal
Government's IPP as part of its counterpart
funding to step up power generation and
distribution in the State.
DESOPADEC
DESOPADEC was set up in 2007 by an Act of the Delta State House of Assembly as the frontline interventionist agency to address
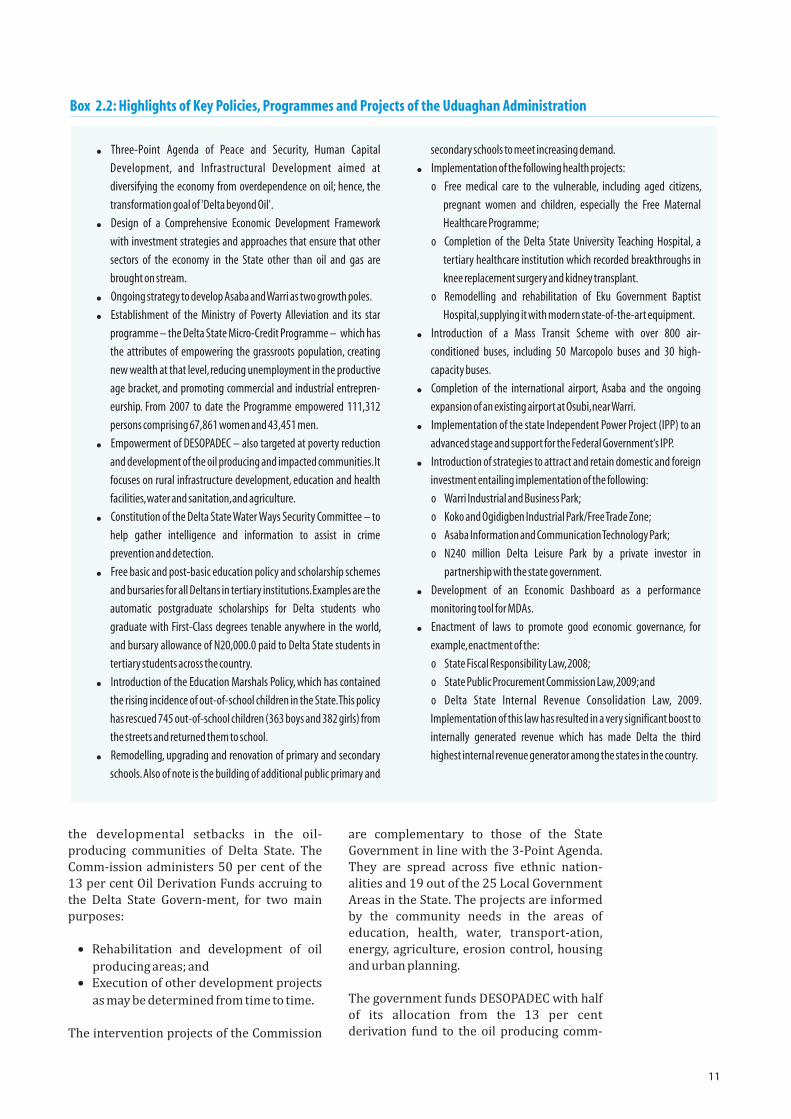
11
the developmental setbacks in the oil-producing communities of Delta State. The Comm-ission administers 50 per cent of the 13 per cent Oil Derivation Funds accruing to the Delta State Govern-ment, for two main purposes:
· Rehabilitation and development of oil
producing areas; and· Execution of other development projects
as may be determined from time to time.
The intervention projects of the Commission
are complementary to those of the State Government in line with the 3-Point Agenda. They are spread across five ethnic nation-alities and 19 out of the 25 Local Government Areas in the State. The projects are informed by the community needs in the areas of education, health, water, transport-ation, energy, agriculture, erosion control, housing and urban planning.
The government funds DESOPADEC with half of its allocation from the 13 per cent derivation fund to the oil producing comm-
! Three-Point Agenda of Peace and Security, Human Capital
Development, and Infrastructural Development aimed at
diversifying the economy from overdependence on oil; hence, the
transformation goal of 'Delta beyond Oil'.
! Design of a Comprehensive Economic Development Framework
with investment strategies and approaches that ensure that other
sectors of the economy in the State other than oil and gas are
brought on stream.
! Ongoing strategy to develop Asaba and Warri as two growth poles.
! Establishment of the Ministry of Poverty Alleviation and its star
programme – the Delta State Micro-Credit Programme – which has
the attributes of empowering the grassroots population, creating
new wealth at that level, reducing unemployment in the productive
age bracket, and promoting commercial and industrial entrepren-
eurship. From 2007 to date the Programme empowered 111,312
persons comprising 67,861 women and 43,451 men.
! Empowerment of DESOPADEC – also targeted at poverty reduction
and development of the oil producing and impacted communities. It
focuses on rural infrastructure development, education and health
facilities, water and sanitation, and agriculture.
! Constitution of the Delta State Water Ways Security Committee – to
help gather intelligence and information to assist in crime
prevention and detection.
! Free basic and post-basic education policy and scholarship schemes
and bursaries for all Deltans in tertiary institutions. Examples are the
automatic postgraduate scholarships for Delta students who
graduate with First-Class degrees tenable anywhere in the world,
and bursary allowance of N20,000.0 paid to Delta State students in
tertiary students across the country.
! Introduction of the Education Marshals Policy, which has contained
the rising incidence of out-of-school children in the State. This policy
has rescued 745 out-of-school children (363 boys and 382 girls) from
the streets and returned them to school.
! Remodelling, upgrading and renovation of primary and secondary
schools. Also of note is the building of additional public primary and
secondary schools to meet increasing demand.
! Implementation of the following health projects:
o Free medical care to the vulnerable, including aged citizens,
pregnant women and children, especially the Free Maternal
Healthcare Programme;
o Completion of the Delta State University Teaching Hospital, a
tertiary healthcare institution which recorded breakthroughs in
knee replacement surgery and kidney transplant.
o Remodelling and rehabilitation of Eku Government Baptist
Hospital, supplying it with modern state-of-the-art equipment.
! Introduction of a Mass Transit Scheme with over 800 air-
conditioned buses, including 50 Marcopolo buses and 30 high-
capacity buses.
! Completion of the international airport, Asaba and the ongoing
expansion of an existing airport at Osubi, near Warri.
! Implementation of the state Independent Power Project (IPP) to an
advanced stage and support for the Federal Government‘s IPP.
! Introduction of strategies to attract and retain domestic and foreign
investment entailing implementation of the following:
o Warri Industrial and Business Park;
o Koko and Ogidigben Industrial Park/Free Trade Zone;
o Asaba Information and Communication Technology Park;
o N240 million Delta Leisure Park by a private investor in
partnership with the state government.
! Development of an Economic Dashboard as a performance
monitoring tool for MDAs.
! Enactment of laws to promote good economic governance, for
example, enactment of the:
o State Fiscal Responsibility Law, 2008;
o State Public Procurement Commission Law, 2009; and
o Delta State Internal Revenue Consolidation Law, 2009.
Implementation of this law has resulted in a very significant boost to
internally generated revenue which has made Delta the third
highest internal revenue generator among the states in the country.
Box 2.2: Highlights of Key Policies, Programmes and Projects of the Uduaghan Administration
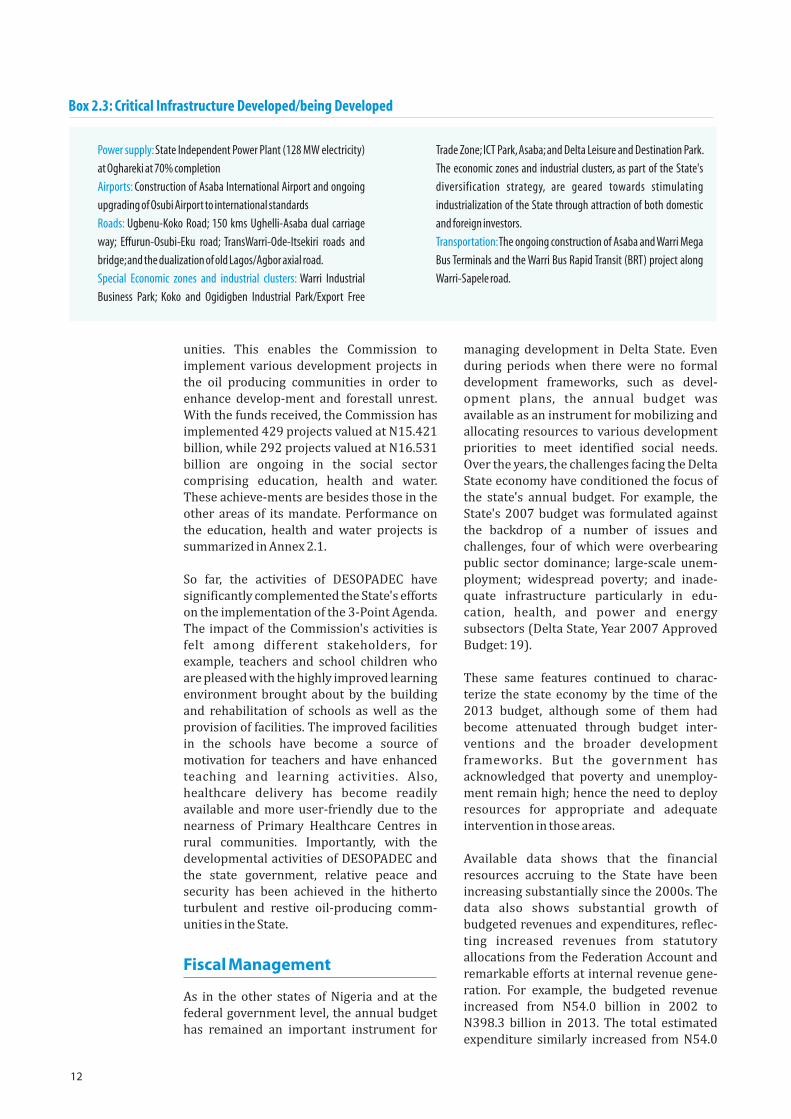
12
� State Independent Power Plant (128 MW electricity) Power supply:
at Oghareki at 70% completion
� Construction of Asaba International Airport and ongoing Airports:
upgrading of Osubi Airport to international standards
� Ugbenu-Koko Road; 150 kms Ughelli-Asaba dual carriage Roads:
way; Effurun-Osubi-Eku road; TransWarri-Ode-Itsekiri roads and
bridge; and the dualization of old Lagos/Agbor axial road.
� Warri Industrial Special Economic zones and industrial clusters:
Business Park; Koko and Ogidigben Industrial Park/Export Free
Trade Zone; ICT Park, Asaba; and Delta Leisure and Destination Park.
The economic zones and industrial clusters, as part of the State's
diversification strategy, are geared towards stimulating
industrialization of the State through attraction of both domestic
and foreign investors.
� The ongoing construction of Asaba and Warri Mega Transportation:
Bus Terminals and the Warri Bus Rapid Transit (BRT) project along
Warri-Sapele road.
Box 2.3: Critical Infrastructure Developed/being Developed
unities. This enables the Commission to implement various development projects in the oil producing communities in order to enhance develop-ment and forestall unrest. With the funds received, the Commission has implemented 429 projects valued at N15.421 billion, while 292 projects valued at N16.531 billion are ongoing in the social sector comprising education, health and water. These achieve-ments are besides those in the other areas of its mandate. Performance on the education, health and water projects is summarized in Annex 2.1.
So far, the activities of DESOPADEC have significantly complemented the State's efforts on the implementation of the 3-Point Agenda. The impact of the Commission's activities is felt among different stakeholders, for example, teachers and school children who are pleased with the highly improved learning environment brought about by the building and rehabilitation of schools as well as the provision of facilities. The improved facilities in the schools have become a source of motivation for teachers and have enhanced teaching and learning activities. Also, healthcare delivery has become readily available and more user-friendly due to the nearness of Primary Healthcare Centres in rural communities. Importantly, with the developmental activities of DESOPADEC and the state government, relative peace and security has been achieved in the hitherto turbulent and restive oil-producing comm-unities in the State.
Fiscal Management
As in the other states of Nigeria and at the federal government level, the annual budget has remained an important instrument for
managing development in Delta State. Even during periods when there were no formal development frameworks, such as devel-opment plans, the annual budget was available as an instrument for mobilizing and allocating resources to various development priorities to meet identified social needs. Over the years, the challenges facing the Delta State economy have conditioned the focus of the state's annual budget. For example, the State's 2007 budget was formulated against the backdrop of a number of issues and challenges, four of which were overbearing public sector dominance; large-scale unem-ployment; widespread poverty; and inade-quate infrastructure particularly in edu-cation, health, and power and energy subsectors (Delta State, Year 2007 Approved Budget: 19).
These same features continued to charac-terize the state economy by the time of the 2013 budget, although some of them had become attenuated through budget inter-ventions and the broader development frameworks. But the government has acknowledged that poverty and unemploy-ment remain high; hence the need to deploy resources for appropriate and adequate intervention in those areas.
Available data shows that the financial resources accruing to the State have been increasing substantially since the 2000s. The data also shows substantial growth of budgeted revenues and expenditures, reflec-ting increased revenues from statutory allocations from the Federation Account and remarkable efforts at internal revenue gene-ration. For example, the budgeted revenue increased from N54.0 billion in 2002 to N398.3 billion in 2013. The total estimated expenditure similarly increased from N54.0
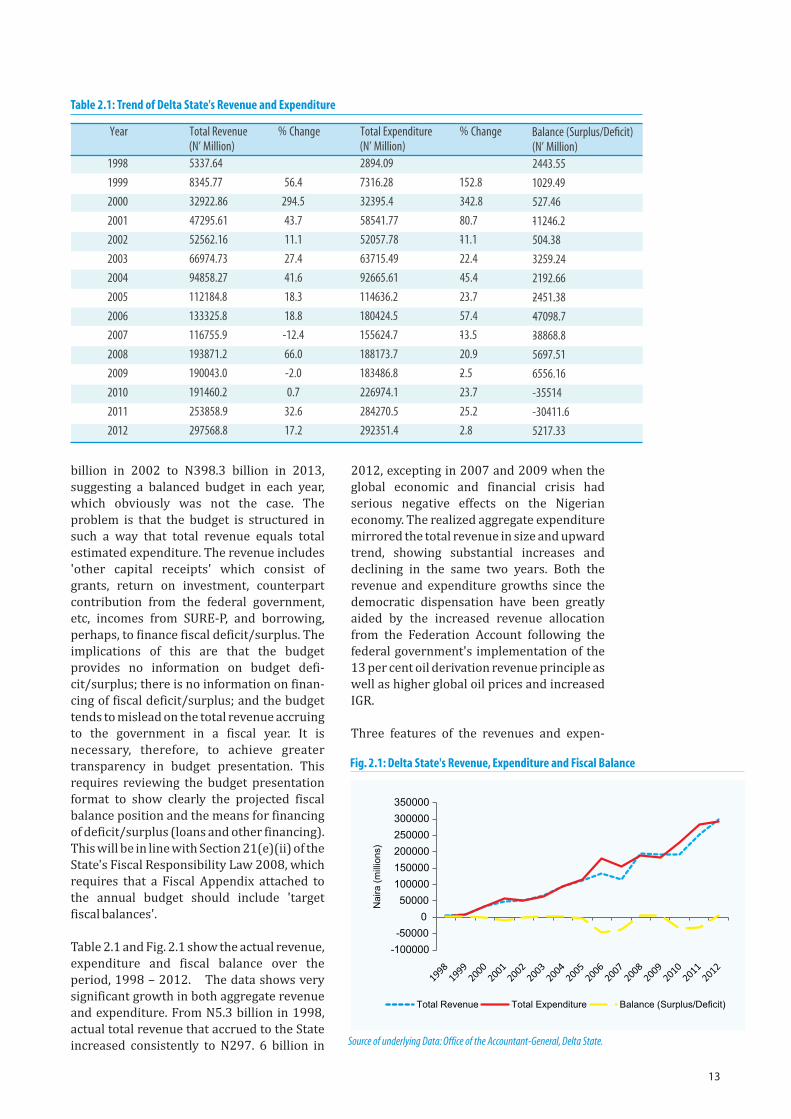
13
billion in 2002 to N398.3 billion in 2013, suggesting a balanced budget in each year, which obviously was not the case. The problem is that the budget is structured in such a way that total revenue equals total estimated expenditure. The revenue includes 'other capital receipts' which consist of grants, return on investment, counterpart contribution from the federal government, etc, incomes from SURE-P, and borrowing, perhaps, to finance fiscal deficit/surplus. The implications of this are that the budget provides no information on budget defi-cit/surplus; there is no information on finan-cing of fiscal deficit/surplus; and the budget tends to mislead on the total revenue accruing to the government in a fiscal year. It is necessary, therefore, to achieve greater transparency in budget presentation. This requires reviewing the budget presentation format to show clearly the projected fiscal balance position and the means for financing of deficit/surplus (loans and other financing). This will be in line with Section 21(e)(ii) of the State's Fiscal Responsibility Law 2008, which requires that a Fiscal Appendix attached to the annual budget should include 'target fiscal balances'.
Table 2.1 and Fig. 2.1 show the actual revenue, expenditure and fiscal balance over the period, 1998 – 2012. The data shows very significant growth in both aggregate revenue and expenditure. From N5.3 billion in 1998, actual total revenue that accrued to the State increased consistently to N297. 6 billion in
2012, excepting in 2007 and 2009 when the global economic and financial crisis had serious negative effects on the Nigerian economy. The realized aggregate expenditure mirrored the total revenue in size and upward trend, showing substantial increases and declining in the same two years. Both the revenue and expenditure growths since the democratic dispensation have been greatly aided by the increased revenue allocation from the Federation Account following the federal government's implementation of the 13 per cent oil derivation revenue principle as well as higher global oil prices and increased IGR.
Three features of the revenues and expen-
-100000
-50000
0
50000
100000
150000
200000
250000
300000
350000
Na
ira (
mill
ion
s)
Total Revenue Total Expenditure Balance (Surplus/Deficit)
Fig. 2.1: Delta State's Revenue, Expenditure and Fiscal Balance
Source of underlying Data: Office of the Accountant-General, Delta State.
Table 2.1: Trend of Delta State's Revenue and Expenditure
Year Total Revenue (N’ Million)
% Change
1998 5337.64
1999 8345.77 56.4
2000 32922.86 294.5
2001 47295.61 43.7
2002 52562.16 11.1
2003 66974.73 27.4
2004 94858.27 41.6
2005 112184.8 18.3
2006 133325.8 18.8
2007 116755.9 -12.4
2008 193871.2 66.0
2009 190043.0 -2.0
2010 191460.2 0.7
2011 253858.9 32.6
2012 297568.8 17.2
Total Expenditure
(N’ Million) 2894.09
7316.28
32395.4
58541.77
52057.78
63715.49
92665.61
114636.2
180424.5
155624.7
188173.7
183486.8
226974.1
284270.5
292351.4
% Change
152.8
342.8
80.7
-11.1
22.4
45.4
23.7
57.4
-13.5
20.9
-2.5
23.7
25.2
2.8
Balance (Surplus/Deficit) (N’ Million) 2443.55
1029.49
527.46
-11246.2
504.38
3259.24
2192.66
-2451.38
-47098.7
-38868.8
5697.51
6556.16
-35514
-30411.6
5217.33
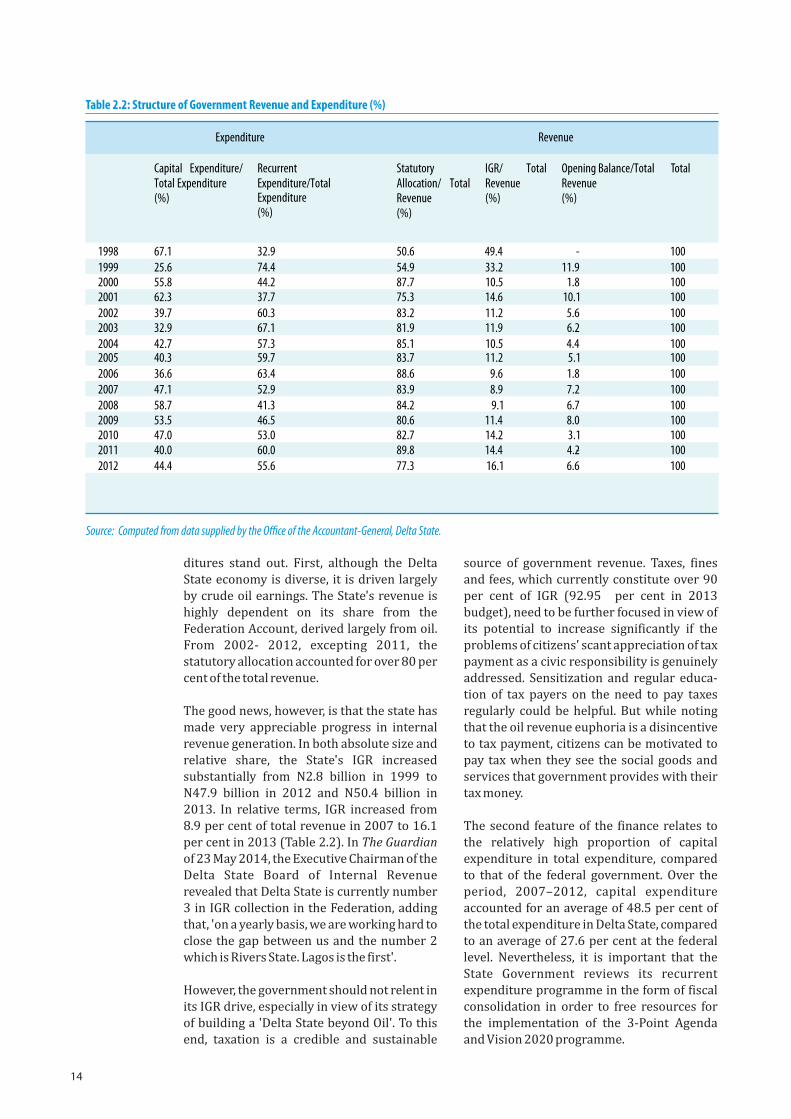
14
ditures stand out. First, although the Delta State economy is diverse, it is driven largely by crude oil earnings. The State's revenue is highly dependent on its share from the Federation Account, derived largely from oil. From 2002- 2012, excepting 2011, the statutory allocation accounted for over 80 per cent of the total revenue.
The good news, however, is that the state has made very appreciable progress in internal revenue generation. In both absolute size and relative share, the State's IGR increased substantially from N2.8 billion in 1999 to N47.9 billion in 2012 and N50.4 billion in 2013. In relative terms, IGR increased from 8.9 per cent of total revenue in 2007 to 16.1 per cent in 2013 (Table 2.2). In The Guardian of 23 May 2014, the Executive Chairman of the Delta State Board of Internal Revenue revealed that Delta State is currently number 3 in IGR collection in the Federation, adding that, 'on a yearly basis, we are working hard to close the gap between us and the number 2 which is Rivers State. Lagos is the first'.
However, the government should not relent in its IGR drive, especially in view of its strategy of building a 'Delta State beyond Oil'. To this end, taxation is a credible and sustainable
source of government revenue. Taxes, fines and fees, which currently constitute over 90 per cent of IGR (92.95 per cent in 2013 budget), need to be further focused in view of its potential to increase significantly if the problems of citizens' scant appreciation of tax payment as a civic responsibility is genuinely addressed. Sensitization and regular educa-tion of tax payers on the need to pay taxes regularly could be helpful. But while noting that the oil revenue euphoria is a disincentive to tax payment, citizens can be motivated to pay tax when they see the social goods and services that government provides with their tax money.
The second feature of the finance relates to the relatively high proportion of capital expenditure in total expenditure, compared to that of the federal government. Over the period, 2007–2012, capital expenditure accounted for an average of 48.5 per cent of the total expenditure in Delta State, compared to an average of 27.6 per cent at the federal level. Nevertheless, it is important that the State Government reviews its recurrent expenditure programme in the form of fiscal consolidation in order to free resources for the implementation of the 3-Point Agenda and Vision 2020 programme.
DRAFT
Expenditure Revenue
Capital Expenditure/ Total Expenditure (%)
Recurrent
Expenditure
(%)
Statutory Allocation/ Total Revenue (%)
IGR/ Total Revenue (%)
Opening Balance/Total Revenue (%)
Total
1999
2000 2001 2002 2003 2004 2005 2006 2007 2008 2009 2010 2011 2012
25.6
55.8 62.3 39.7 32.9 42.7 40.3 36.6 47.1 58.7 53.5 47.0 40.0 44.4
74.4
44.2 37.7 60.3 67.1 57.3 59.7 63.4 52.9 41.3 46.5 53.0 60.0 55.6
54.9
87.7 75.3 83.2 81.9 85.1 83.7 88.6 83.9 84.2 80.6 82.7 89.8 77.3
33.2
10.5 14.6 11.2 11.9 10.5 11.2
9.6 8.9 9.1
11.4 14.2 14.4 16.1
11.9
1.8 10.1 5.6 6.2 4.4 5.1 1.8 7.2 6.7 8.0 3.1
-4.2 6.6
1998 67.1 32.9 50.6 49.4 - 100 100
100 100 100 100 100 100 100 100 100 100 100 100 100
Source: Computed from data supplied by the Office of the Accountant-General, Delta State.
Table 2.2: Structure of Government Revenue and Expenditure (%)
Expenditure/Total
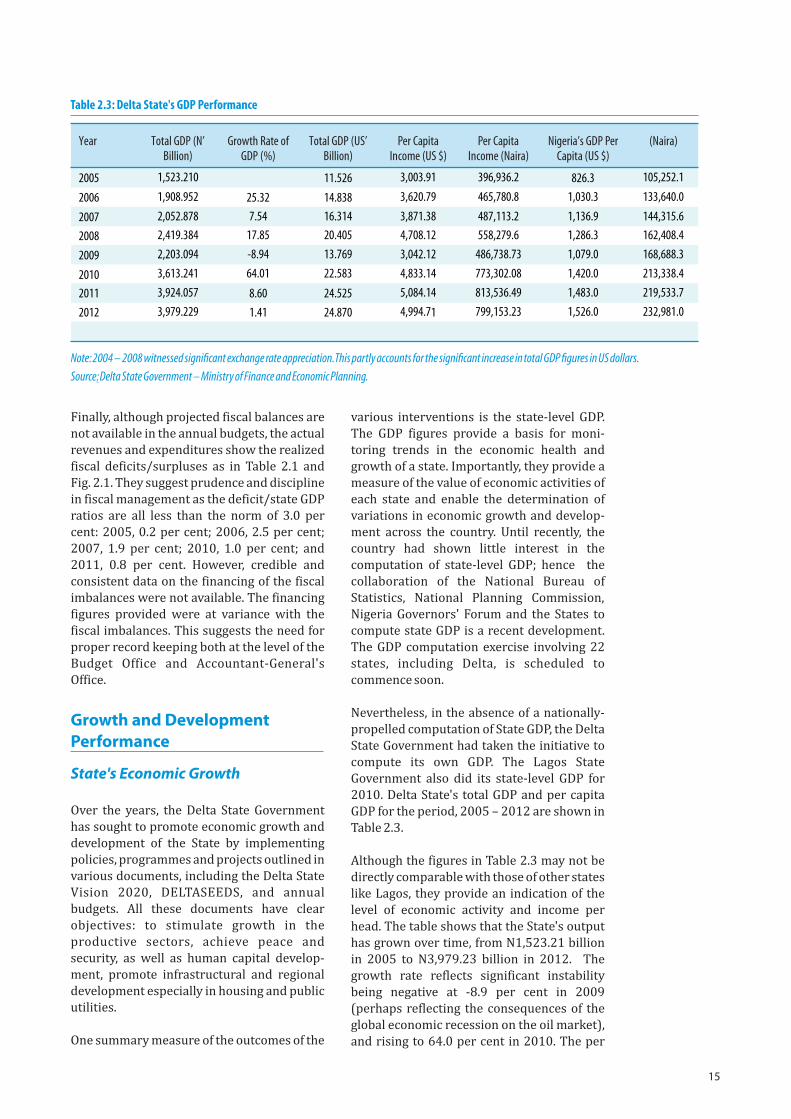
15
Finally, although projected fiscal balances are not available in the annual budgets, the actual revenues and expenditures show the realized fiscal deficits/surpluses as in Table 2.1 and Fig. 2.1. They suggest prudence and discipline in fiscal management as the deficit/state GDP ratios are all less than the norm of 3.0 per cent: 2005, 0.2 per cent; 2006, 2.5 per cent; 2007, 1.9 per cent; 2010, 1.0 per cent; and 2011, 0.8 per cent. However, credible and consistent data on the financing of the fiscal imbalances were not available. The financing figures provided were at variance with the fiscal imbalances. This suggests the need for proper record keeping both at the level of the Budget Office and Accountant-General's Office.
Growth and Development Performance
State's Economic Growth
Over the years, the Delta State Government has sought to promote economic growth and development of the State by implementing policies, programmes and projects outlined in various documents, including the Delta State Vision 2020, DELTASEEDS, and annual budgets. All these documents have clear objectives: to stimulate growth in the productive sectors, achieve peace and security, as well as human capital develop-ment, promote infrastructural and regional development especially in housing and public utilities.
One summary measure of the outcomes of the
various interventions is the state-level GDP. The GDP figures provide a basis for moni-toring trends in the economic health and growth of a state. Importantly, they provide a measure of the value of economic activities of each state and enable the determination of variations in economic growth and develop-ment across the country. Until recently, the country had shown little interest in the computation of state-level GDP; hence the collaboration of the National Bureau of Statistics, National Planning Commission, Nigeria Governors' Forum and the States to compute state GDP is a recent development. The GDP computation exercise involving 22 states, including Delta, is scheduled to commence soon.
Nevertheless, in the absence of a nationally-propelled computation of State GDP, the Delta State Government had taken the initiative to compute its own GDP. The Lagos State Government also did its state-level GDP for 2010. Delta State's total GDP and per capita GDP for the period, 2005 – 2012 are shown in Table 2.3.
Although the figures in Table 2.3 may not be directly comparable with those of other states like Lagos, they provide an indication of the level of economic activity and income per head. The table shows that the State's output has grown over time, from N1,523.21 billion in 2005 to N3,979.23 billion in 2012. The growth rate reflects significant instability being negative at -8.9 per cent in 2009 (perhaps reflecting the consequences of the global economic recession on the oil market), and rising to 64.0 per cent in 2010. The per
Table 2.3: Delta State's GDP Performance
Year Total GDP (N’ Billion)
Growth Rate of GDP (%)
Total GDP (US’ Billion)
Per Capita Income (US $)
Per Capita Income (Naira)
Nigeria’s GDP Per Capita (US $)
(Naira)
2005
2006
2011
2012
1,523.210
1,908.952
3,924.057
3,979.229
25.32
8.60
1.41
11.526
14.838
24.525
24.870
3,003.91
3,620.79
5,084.14
4,994.71
396,936.2
465,780.8
813,536.49
799,153.23
826.3
1,030.3
1,483.0
1,526.0
105,252.1
133,640.0
2007 2,052.878 7.54 16.314 3,871.38 487,113.2 1,136.9 144,315.6
2008 2,419.384 17.85 20.405 4,708.12 558,279.6 1,286.3 162,408.4
2009 2,203.094 -8.94 13.769 3,042.12 486,738.73 1,079.0 168,688.3
2010 3,613.241 64.01 22.583 4,833.14 773,302.08 1,420.0 213,338.4
219,533.7
232,981.0
Note: 2004 – 2008 witnessed significant exchange rate appreciation. This partly accounts for the significant increase in total GDP figures in US dollars.
Source: Delta State Government – Ministry of Finance and Economic Planning.
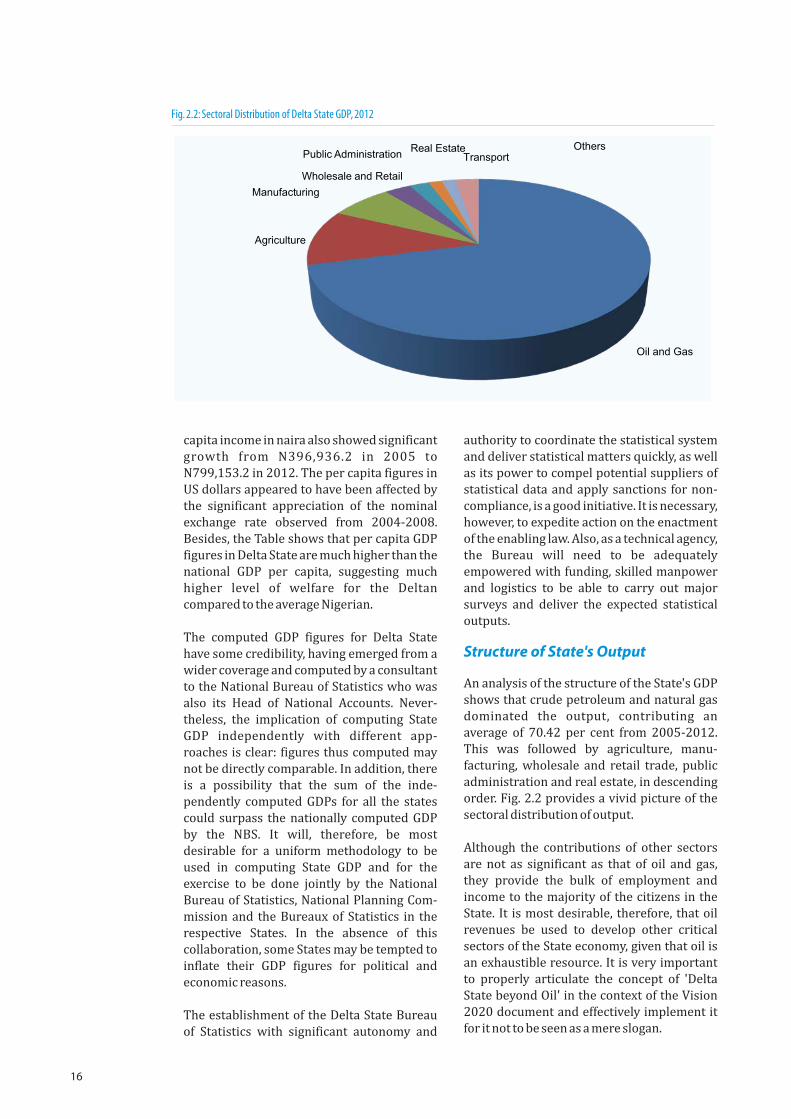
16
capita income in naira also showed significant growth from N396,936.2 in 2005 to N799,153.2 in 2012. The per capita figures in US dollars appeared to have been affected by the significant appreciation of the nominal exchange rate observed from 2004-2008. Besides, the Table shows that per capita GDP figures in Delta State are much higher than the national GDP per capita, suggesting much higher level of welfare for the Deltan compared to the average Nigerian.
The computed GDP figures for Delta State have some credibility, having emerged from a wider coverage and computed by a consultant to the National Bureau of Statistics who was also its Head of National Accounts. Never-theless, the implication of computing State GDP independently with different app-roaches is clear: figures thus computed may not be directly comparable. In addition, there is a possibility that the sum of the inde-pendently computed GDPs for all the states could surpass the nationally computed GDP by the NBS. It will, therefore, be most desirable for a uniform methodology to be used in computing State GDP and for the exercise to be done jointly by the National Bureau of Statistics, National Planning Com-mission and the Bureaux of Statistics in the respective States. In the absence of this collaboration, some States may be tempted to inflate their GDP figures for political and economic reasons.
The establishment of the Delta State Bureau of Statistics with significant autonomy and
authority to coordinate the statistical system and deliver statistical matters quickly, as well as its power to compel potential suppliers of statistical data and apply sanctions for non-compliance, is a good initiative. It is necessary, however, to expedite action on the enactment of the enabling law. Also, as a technical agency, the Bureau will need to be adequately empowered with funding, skilled manpower and logistics to be able to carry out major surveys and deliver the expected statistical outputs.
Structure of State's Output
An analysis of the structure of the State's GDP shows that crude petroleum and natural gas dominated the output, contributing an average of 70.42 per cent from 2005-2012. This was followed by agriculture, manu-facturing, wholesale and retail trade, public administration and real estate, in descending order. Fig. 2.2 provides a vivid picture of the sectoral distribution of output.
Although the contributions of other sectors are not as significant as that of oil and gas, they provide the bulk of employment and income to the majority of the citizens in the State. It is most desirable, therefore, that oil revenues be used to develop other critical sectors of the State economy, given that oil is an exhaustible resource. It is very important to properly articulate the concept of 'Delta State beyond Oil' in the context of the Vision 2020 document and effectively implement it for it not to be seen as a mere slogan.
Fig. 2.2: Sectoral Distribution of Delta State GDP, 2012
Oil and Gas
Agriculture
Manufacturing
Wholesale and Retail
Public AdministrationReal Estate
TransportOthers
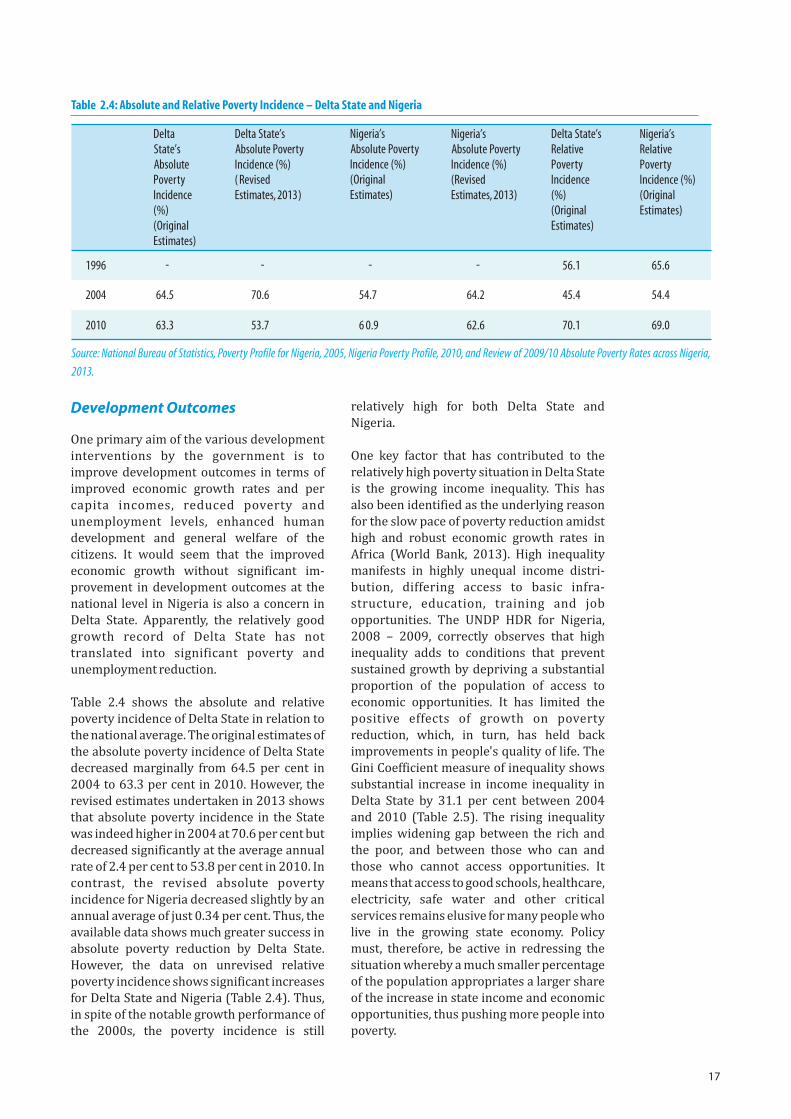
17
Development Outcomes
One primary aim of the various development interventions by the government is to improve development outcomes in terms of improved economic growth rates and per capita incomes, reduced poverty and unemployment levels, enhanced human development and general welfare of the citizens. It would seem that the improved economic growth without significant im-provement in development outcomes at the national level in Nigeria is also a concern in Delta State. Apparently, the relatively good growth record of Delta State has not translated into significant poverty and unemployment reduction.
Table 2.4 shows the absolute and relative poverty incidence of Delta State in relation to the national average. The original estimates of the absolute poverty incidence of Delta State decreased marginally from 64.5 per cent in 2004 to 63.3 per cent in 2010. However, the revised estimates undertaken in 2013 shows that absolute poverty incidence in the State was indeed higher in 2004 at 70.6 per cent but decreased significantly at the average annual rate of 2.4 per cent to 53.8 per cent in 2010. In contrast, the revised absolute poverty incidence for Nigeria decreased slightly by an annual average of just 0.34 per cent. Thus, the available data shows much greater success in absolute poverty reduction by Delta State. However, the data on unrevised relative poverty incidence shows significant increases for Delta State and Nigeria (Table 2.4). Thus, in spite of the notable growth performance of the 2000s, the poverty incidence is still
relatively high for both Delta State and Nigeria.
One key factor that has contributed to the relatively high poverty situation in Delta State is the growing income inequality. This has also been identified as the underlying reason for the slow pace of poverty reduction amidst high and robust economic growth rates in Africa (World Bank, 2013). High inequality manifests in highly unequal income distri-bution, differing access to basic infra-structure, education, training and job opportunities. The UNDP HDR for Nigeria, 2008 – 2009, correctly observes that high inequality adds to conditions that prevent sustained growth by depriving a substantial proportion of the population of access to economic opportunities. It has limited the positive effects of growth on poverty reduction, which, in turn, has held back improvements in people's quality of life. The Gini Coefficient measure of inequality shows substantial increase in income inequality in Delta State by 31.1 per cent between 2004 and 2010 (Table 2.5). The rising inequality implies widening gap between the rich and the poor, and between those who can and those who cannot access opportunities. It means that access to good schools, healthcare, electricity, safe water and other critical services remains elusive for many people who live in the growing state economy. Policy must, therefore, be active in redressing the situation whereby a much smaller percentage of the population appropriates a larger share of the increase in state income and economic opportunities, thus pushing more people into poverty.
Table 2.4: Absolute and Relative Poverty Incidence – Delta State and Nigeria
Source: National Bureau of Statistics, Poverty Profile for Nigeria, 2005, Nigeria Poverty Profile, 2010, and Review of 2009/10 Absolute Poverty Rates across Nigeria,
2013.
Delta State’s Absolute Poverty Incidence (%) (Original Estimates)
Delta State’s Absolute Poverty Incidence (%) ( Revised Estimates, 2013)
Nigeria’s Absolute Poverty Incidence (%)(Original Estimates)
Nigeria’s Absolute PovertyIncidence (%) (Revised Estimates, 2013)
Delta State’s Relative Poverty Incidence (%) (Original Estimates)
Nigeria’s Relative Poverty Incidence (%) (Original Estimates)
1996 - - - - 56.1 65.6
2004 64.5 70.6 54.7 64.2 45.4 54.4
2010 63.3 53.7 6 0.9 62.6 70.1 69.0
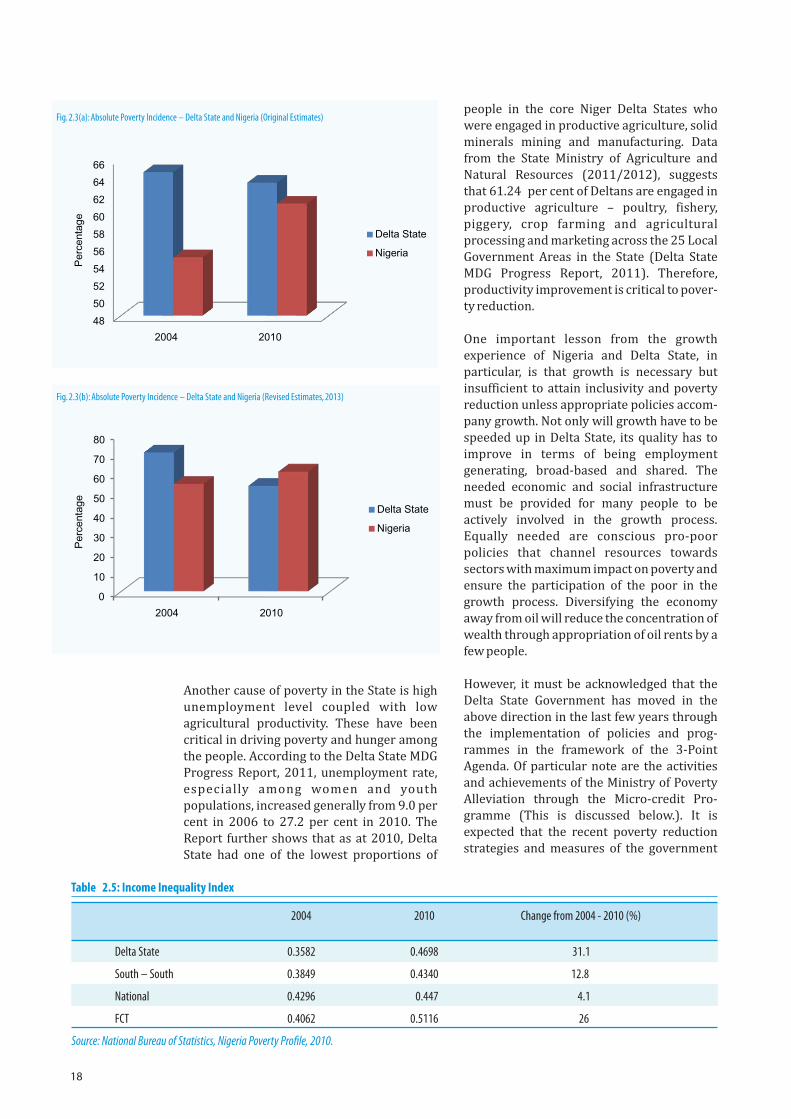
18
Another cause of poverty in the State is high unemployment level coupled with low agricultural productivity. These have been critical in driving poverty and hunger among the people. According to the Delta State MDG Progress Report, 2011, unemployment rate, especially among women and youth populations, increased generally from 9.0 per cent in 2006 to 27.2 per cent in 2010. The Report further shows that as at 2010, Delta State had one of the lowest proportions of
people in the core Niger Delta States who were engaged in productive agriculture, solid minerals mining and manufacturing. Data from the State Ministry of Agriculture and Natural Resources (2011/2012), suggests that 61.24 per cent of Deltans are engaged in productive agriculture – poultry, fishery, piggery, crop farming and agricultural processing and marketing across the 25 Local Government Areas in the State (Delta State MDG Progress Report, 2011). Therefore, productivity improvement is critical to pover-ty reduction.
One important lesson from the growth experience of Nigeria and Delta State, in particular, is that growth is necessary but insufficient to attain inclusivity and poverty reduction unless appropriate policies accom-pany growth. Not only will growth have to be speeded up in Delta State, its quality has to improve in terms of being employment generating, broad-based and shared. The needed economic and social infrastructure must be provided for many people to be actively involved in the growth process. Equally needed are conscious pro-poor policies that channel resources towards sectors with maximum impact on poverty and ensure the participation of the poor in the growth process. Diversifying the economy away from oil will reduce the concentration of wealth through appropriation of oil rents by a few people.
However, it must be acknowledged that the Delta State Government has moved in the above direction in the last few years through the implementation of policies and prog-rammes in the framework of the 3-Point Agenda. Of particular note are the activities and achievements of the Ministry of Poverty Alleviation through the Micro-credit Pro-gramme (This is discussed below.). It is expected that the recent poverty reduction strategies and measures of the government
48
50
52
54
56
58
60
62
64
66
2004 2010
Perc
enta
ge
Delta State
Nigeria
Fig. 2.3(a): Absolute Poverty Incidence – Delta State and Nigeria (Original Estimates)
0
10
20
30
40
50
60
70
80
2004 2010
Pe
rce
nta
ge
Delta State
Nigeria
Fig. 2.3(b): Absolute Poverty Incidence – Delta State and Nigeria (Revised Estimates, 2013)
Table 2.5: Income Inequality Index
Source: National Bureau of Statistics, Nigeria Poverty Profile, 2010.
2004 2010 Change from 2004 - 2010 (%)
Delta State
South – South
National
FCT
0.3582
0.3849
0.4296
0.4062
0.4698
0.4340
0.447
0.5116
31.1
12.8
4.1
26
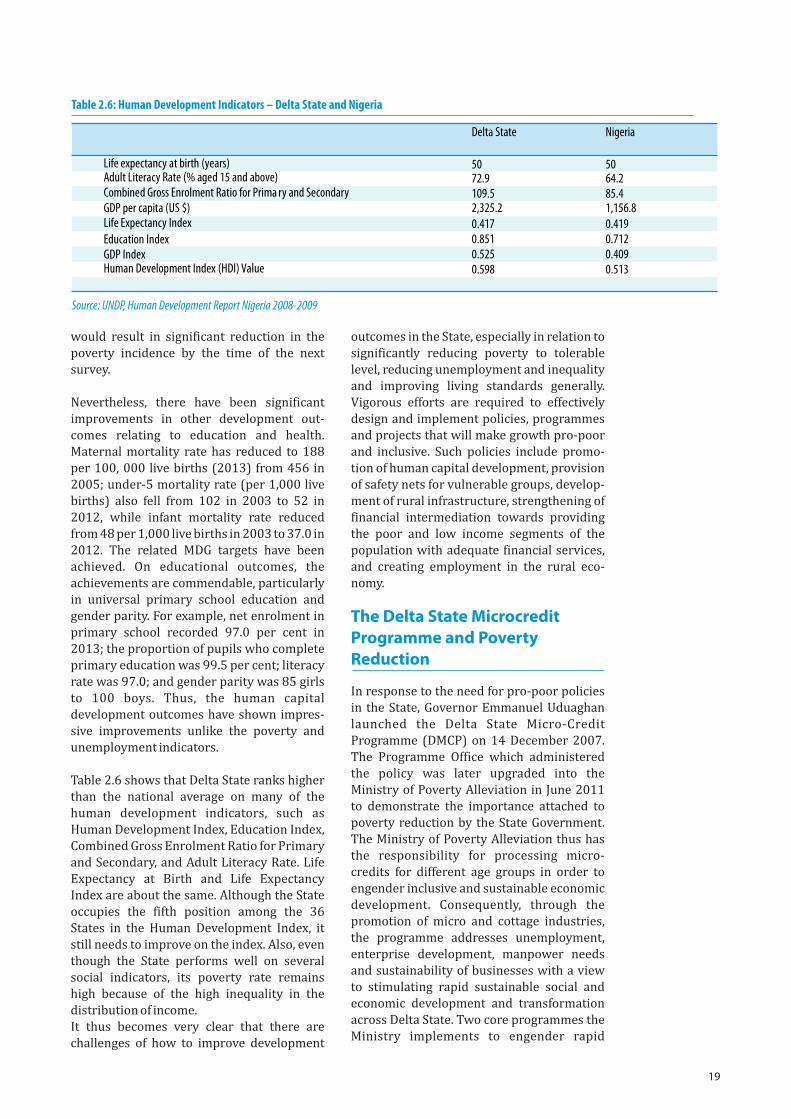
19
would result in significant reduction in the poverty incidence by the time of the next survey.
Nevertheless, there have been significant improvements in other development out-comes relating to education and health. Maternal mortality rate has reduced to 188 per 100, 000 live births (2013) from 456 in 2005; under-5 mortality rate (per 1,000 live births) also fell from 102 in 2003 to 52 in 2012, while infant mortality rate reduced from 48 per 1,000 live births in 2003 to 37.0 in 2012. The related MDG targets have been achieved. On educational outcomes, the achievements are commendable, particularly in universal primary school education and gender parity. For example, net enrolment in primary school recorded 97.0 per cent in 2013; the proportion of pupils who complete primary education was 99.5 per cent; literacy rate was 97.0; and gender parity was 85 girls to 100 boys. Thus, the human capital development outcomes have shown impres-sive improvements unlike the poverty and unemployment indicators.
Table 2.6 shows that Delta State ranks higher than the national average on many of the human development indicators, such as Human Development Index, Education Index, Combined Gross Enrolment Ratio for Primary and Secondary, and Adult Literacy Rate. Life Expectancy at Birth and Life Expectancy Index are about the same. Although the State occupies the fifth position among the 36 States in the Human Development Index, it still needs to improve on the index. Also, even though the State performs well on several social indicators, its poverty rate remains high because of the high inequality in the distribution of income. It thus becomes very clear that there are challenges of how to improve development
outcomes in the State, especially in relation to significantly reducing poverty to tolerable level, reducing unemployment and inequality and improving living standards generally. Vigorous efforts are required to effectively design and implement policies, programmes and projects that will make growth pro-poor and inclusive. Such policies include promo-tion of human capital development, provision of safety nets for vulnerable groups, develop-ment of rural infrastructure, strengthening of financial intermediation towards providing the poor and low income segments of the population with adequate financial services, and creating employment in the rural eco-nomy.
The Delta State Microcredit Programme and Poverty Reduction
In response to the need for pro-poor policies in the State, Governor Emmanuel Uduaghan launched the Delta State Micro-Credit Programme (DMCP) on 14 December 2007. The Programme Office which administered the policy was later upgraded into the Ministry of Poverty Alleviation in June 2011 to demonstrate the importance attached to poverty reduction by the State Government. The Ministry of Poverty Alleviation thus has the responsibility for processing micro-credits for different age groups in order to engender inclusive and sustainable economic development. Consequently, through the promotion of micro and cottage industries, the programme addresses unemployment, enterprise development, manpower needs and sustainability of businesses with a view to stimulating rapid sustainable social and economic development and transformation across Delta State. Two core programmes the Ministry implements to engender rapid
Table 2.6: Human Development Indicators – Delta State and Nigeria
Source: UNDP, Human Development Report Nigeria 2008-2009
Delta State Nigeria
Adult Literacy Rate (% aged 15 and above) Combined Gross Enrolment Ratio for Prima ry and Secondary GDP per capita (US $) Life Expectancy Index Education Index GDP Index Human Development Index (HDI) Value
72.9 109.5 2,325.2 0.417 0.851 0.525 0.598
Life expectancy at birth (years) 50 50
64.2 85.4 1,156.8 0.419 0.712 0.409 0.513
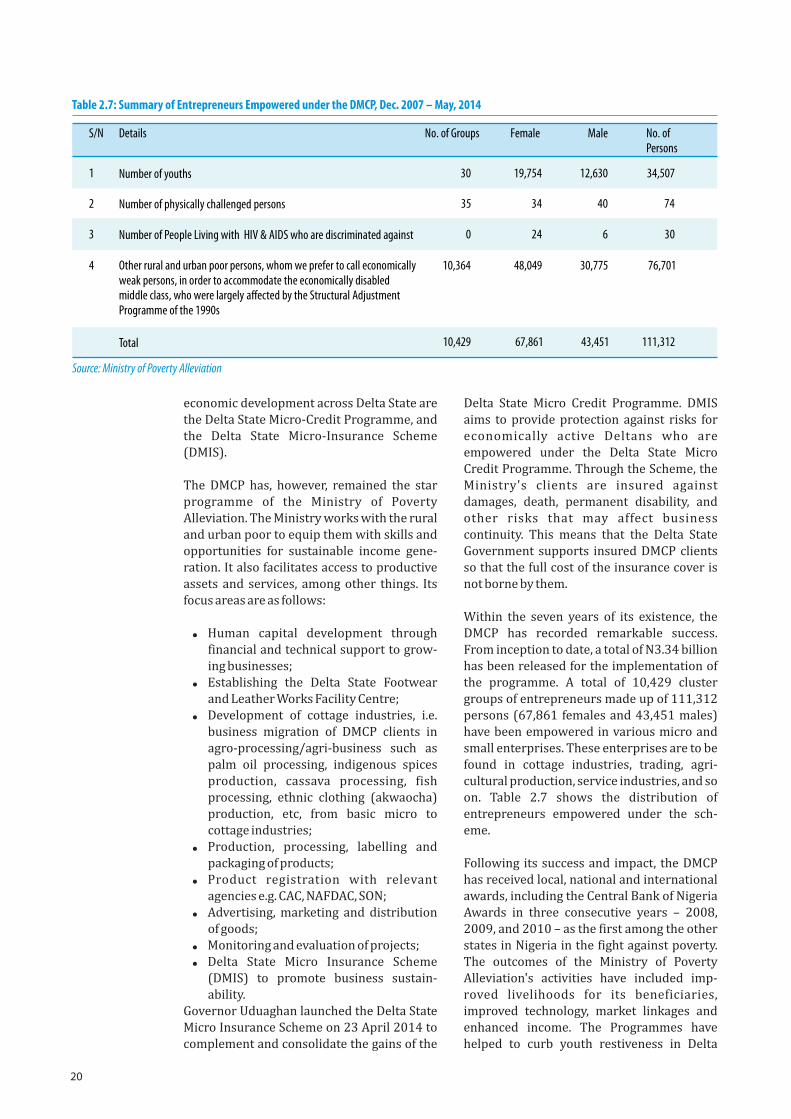
20
economic development across Delta State are the Delta State Micro-Credit Programme, and the Delta State Micro-Insurance Scheme (DMIS).
The DMCP has, however, remained the star programme of the Ministry of Poverty Alleviation. The Ministry works with the rural and urban poor to equip them with skills and opportunities for sustainable income gene-ration. It also facilitates access to productive assets and services, among other things. Its focus areas are as follows:
! Human capital development through financial and technical support to grow-ing businesses;
! Establishing the Delta State Footwear and Leather Works Facility Centre;
! Development of cottage industries, i.e. business migration of DMCP clients in agro-processing/agri-business such as palm oil processing, indigenous spices production, cassava processing, fish processing, ethnic clothing (akwaocha) production, etc, from basic micro to cottage industries;
! Production, processing, labelling and packaging of products;
! Product registration with relevant agencies e.g. CAC, NAFDAC, SON;
! Advertising, marketing and distribution of goods;
! Monitoring and evaluation of projects;! Delta State Micro Insurance Scheme
(DMIS) to promote business sustain-ability.
Governor Uduaghan launched the Delta State Micro Insurance Scheme on 23 April 2014 to complement and consolidate the gains of the
Delta State Micro Credit Programme. DMIS aims to provide protection against risks for economically active Deltans who are empowered under the Delta State Micro Credit Programme. Through the Scheme, the Ministry's clients are insured against damages, death, permanent disability, and other risks that may affect business continuity. This means that the Delta State Government supports insured DMCP clients so that the full cost of the insurance cover is not borne by them.
Within the seven years of its existence, the DMCP has recorded remarkable success. From inception to date, a total of N3.34 billion has been released for the implementation of the programme. A total of 10,429 cluster groups of entrepreneurs made up of 111,312 persons (67,861 females and 43,451 males) have been empowered in various micro and small enterprises. These enterprises are to be found in cottage industries, trading, agri-cultural production, service industries, and so on. Table 2.7 shows the distribution of entrepreneurs empowered under the sch-eme.
Following its success and impact, the DMCP has received local, national and international awards, including the Central Bank of Nigeria Awards in three consecutive years – 2008, 2009, and 2010 – as the first among the other states in Nigeria in the fight against poverty. The outcomes of the Ministry of Poverty Alleviation's activities have included imp-roved livelihoods for its beneficiaries, improved technology, market linkages and enhanced income. The Programmes have helped to curb youth restiveness in Delta
S/N Details No. of Groups Female Male No. of Persons
1 Number of youths
30
19,754
12,630
34,507
2 Number of physically challenged persons
35
34
40
74
3 Number of People Living with HIV & AIDS who are discriminated against
0
24
6
30
4 Other rural and urban poor persons, whom we prefer to call economically weak persons, in order to accommodate the economically disabled middle class, who were largely affected by the Structural Adjustment Programme of the 1990s
10,364 48,049 30,775 76,701
Total 10,429 67,861 43,451 111,312
Table 2.7: Summary of Entrepreneurs Empowered under the DMCP, Dec. 2007 – May, 2014
Source: Ministry of Poverty Alleviation
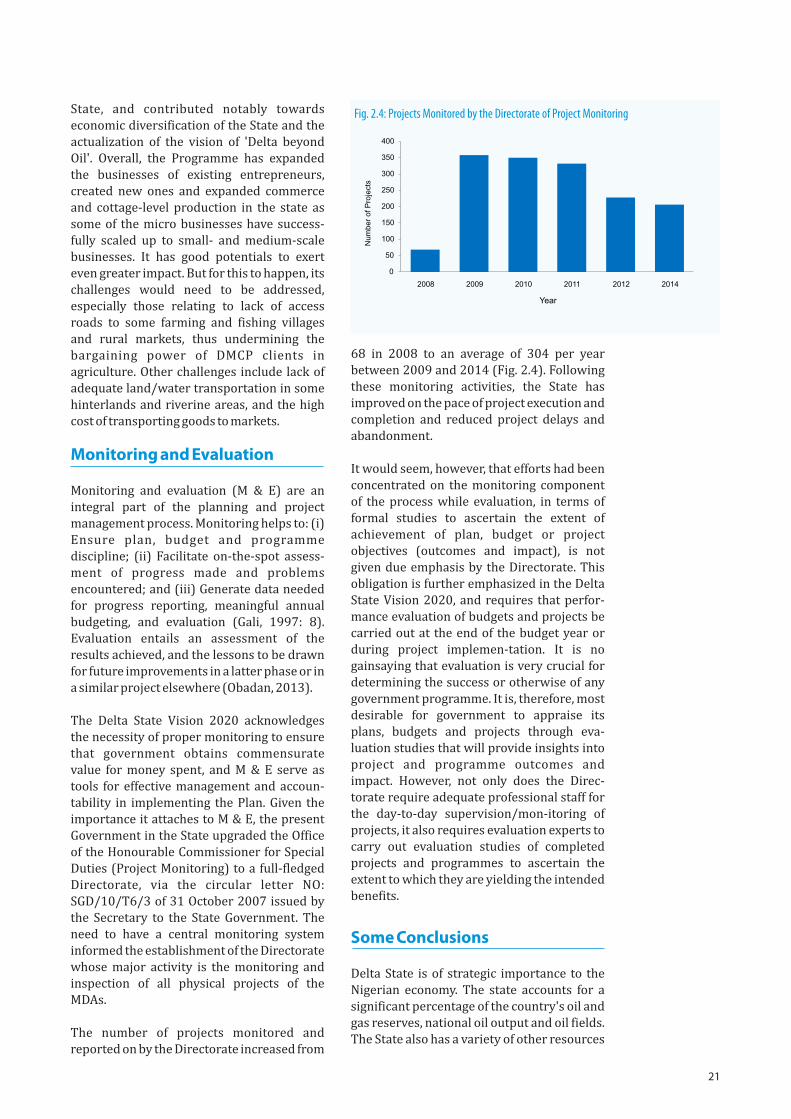
21
State, and contributed notably towards economic diversification of the State and the actualization of the vision of 'Delta beyond Oil'. Overall, the Programme has expanded the businesses of existing entrepreneurs, created new ones and expanded commerce and cottage-level production in the state as some of the micro businesses have success-fully scaled up to small- and medium-scale businesses. It has good potentials to exert even greater impact. But for this to happen, its challenges would need to be addressed, especially those relating to lack of access roads to some farming and fishing villages and rural markets, thus undermining the bargaining power of DMCP clients in agriculture. Other challenges include lack of adequate land/water transportation in some hinterlands and riverine areas, and the high cost of transporting goods to markets.
Monitoring and Evaluation
Monitoring and evaluation (M & E) are an integral part of the planning and project management process. Monitoring helps to: (i) Ensure plan, budget and programme discipline; (ii) Facilitate on-the-spot assess-ment of progress made and problems encountered; and (iii) Generate data needed for progress reporting, meaningful annual budgeting, and evaluation (Gali, 1997: 8). Evaluation entails an assessment of the results achieved, and the lessons to be drawn for future improvements in a latter phase or in a similar project elsewhere (Obadan, 2013).
The Delta State Vision 2020 acknowledges the necessity of proper monitoring to ensure that government obtains commensurate value for money spent, and M & E serve as tools for effective management and accoun-tability in implementing the Plan. Given the importance it attaches to M & E, the present Government in the State upgraded the Office of the Honourable Commissioner for Special Duties (Project Monitoring) to a full-fledged Directorate, via the circular letter NO: SGD/10/T6/3 of 31 October 2007 issued by the Secretary to the State Government. The need to have a central monitoring system informed the establishment of the Directorate whose major activity is the monitoring and inspection of all physical projects of the MDAs.
The number of projects monitored and reported on by the Directorate increased from
68 in 2008 to an average of 304 per year between 2009 and 2014 (Fig. 2.4). Following these monitoring activities, the State has improved on the pace of project execution and completion and reduced project delays and abandonment.
It would seem, however, that efforts had been concentrated on the monitoring component of the process while evaluation, in terms of formal studies to ascertain the extent of achievement of plan, budget or project objectives (outcomes and impact), is not given due emphasis by the Directorate. This obligation is further emphasized in the Delta State Vision 2020, and requires that perfor-mance evaluation of budgets and projects be carried out at the end of the budget year or during project implemen-tation. It is no gainsaying that evaluation is very crucial for determining the success or otherwise of any government programme. It is, therefore, most desirable for government to appraise its plans, budgets and projects through eva-luation studies that will provide insights into project and programme outcomes and impact. However, not only does the Direc-torate require adequate professional staff for the day-to-day supervision/mon-itoring of projects, it also requires evaluation experts to carry out evaluation studies of completed projects and programmes to ascertain the extent to which they are yielding the intended benefits.
Some Conclusions
Delta State is of strategic importance to the Nigerian economy. The state accounts for a significant percentage of the country's oil and gas reserves, national oil output and oil fields. The State also has a variety of other resources
0
50
100
150
200
250
300
350
400
2008 2009 2010 2011 2012 2014
Num
ber
of P
roje
cts
Year
Fig. 2.4: Projects Monitored by the Directorate of Project Monitoring

22
and facilities which confer on it significant comparative advantage over other states in the Federation.
Despite all these resources and comparative advantage over other states, Delta State has not fully harnessed its resources towards significantly improving the welfare of the people. This is the core challenge that the government is now trying to address with its 3-Point Agenda of Peace and Security, Human Capital Development and Infrastructure.
Also, because the quality of governance has been a notable source of concern in the country, the present government in Delta State has placed high priority on reducing corruption and improving governance. It has created new institutions and tools to promote good governance.
The state has done appreciably well in fiscal management and achieved significant suc-cesses in internal revenue generation. It is now the State with the third highest IGR collection in the country. Nevertheless, the State needs greater transparency in budget presentation to explicitly show the fiscal balance position and its projected financing. The Delta State Government has taken the commendable initiative to compute state-level GDP.But it must be noted that the implications of states computing their own GDPs with different approaches are strong enough to warrant a common approach under the guidance of the National Bureau of Statistics.
The record of improved economic growth without significant improvement in develop-ment outcomes at the national level is also an issue of concern in Delta State. Not only is the Delta State Government aware of this, it has moved in the last few years to implement initiatives, policies and programmes that significantly reduce poverty, within the framework of the 3-Point Agenda. It is most likely that the recent poverty reduction strategies and measures would result in significant reduction in the poverty incidence by the time of the next survey.
Although the successive democratic govern-ments in Delta State have made notable progress in the efforts to promote peace and security, physical and infrastructural development, human capital development
and general welfare of the citizens, significant challenges remain to be addressed in order to achieve the desired development outcomes. These challenges are discussed in Chapter 7.
To further improve overall development performance, it is important for government to do the following: enhance transparency in budget presentation relating to fiscal balance and the methods of financing it; continue the IGR drive, especially with a view to tapping the high potentials in taxation; and compute state-level GDP with a methodology that will confer credibility, comparability and accept-ability on the computed figures. Also, not only will growth have to be speeded up in Delta State, its quality has to improve in terms of being employment-generating, broad-based and shared. Conscious pro-poor policies that channel resources towards sectors with maximum poverty reducing impact, and ensure the participation of the poor in the growth process are indispensable.
23
Education SectorEducation, which is generally considered a service sector and an input to other sectors, is also acknowledged as a key ingredient in a
nation's development. The Delta State Government's understanding of this is evidenced in the implementation of its 3-Point Agenda,
one component of which is human capital development. The state government believes that the provision of education, healthcare
delivery and other social amenities are critical for rapid and sustainable economic development (Delta Vision 2020, 2011). Indeed, an
efficient and effective education is bound to produce citizens with employable skills needed in the modern-day technology-driven
society. Realizing the vision of 'Delta beyond Oil' critically depends on harnessing the technical skills and competencies acquired
through education for the development of the State.
Following the growth in the population of Delta State, is the increase in school age population. However, this was not initially translated into school enrolment increase. For example, between 2010 and 2011, 269,504 school-age children were not enrolled in the primary school. The same applied to the Junior Secondary Schools (JSS). This made the Delta State Government to implement several policies aimed at addressing these challenges and improving educational outcomes.
Against this background, this chapter reviews the performance of the education sector in Delta State. It examines the development and delivery of educational services to the people from its inception in 1991- 2013, to the extent permitted by data availability.
Institutional and Regulatory Frameworks for Policy and Programme Implementation
This section examines the institutional arrangements and regulatory framework for policy and programme implementation.
Institutional Arrangements
At the apex of the institutional arrangements in the education sector are two Ministries: the Ministry of Basic and Secondary Education, and the Ministry of Higher Education. These two Ministries emanated from the splitting of the old Ministry of Education into two in 2005. While the Ministry of Higher Education is charged with all matters of tertiary institu-
tions in the State, including policy and supervision, the Ministry of Basic and Secondary Education has responsibility for pre-primary, primary and secondary educa-tion. This institutional arrangement has yielded closer supervision, management of resources, governance and overall moni-toring and evaluation of efficiency and effectiveness of the entire school system.
Another element of the institutional arran-gement is the State Universal Basic Edu-cation Board (SUBUB) and the Post-Primary Education Board (PPEB). The statutory functions of the Boards include teachers' recr-uitment, salaries, posting, transfers, promo-tions, training and re-training, supervision and discipline. These functions reinforce the free and compulsory education policy. SUBEB is responsible for the management and supervision of education at the primary school level while PPEB performs similar functions for secondary schools. Their activities have made tremendous impact on school enrolment and parity in male-female school attendance.
Regulatory Framework
The Delta State Government has enacted laws to guide and regulate the implementation of the policies in the sector. These laws include:
1. The Free and Compulsory Education Law, 2004; and
2. The Child Rights Law of 2010.
In consonance with the Federal UBE Act of 26 May 2004, the Delta State Government, in the
3
24
same year, enacted a law on Free and Compulsory Education for all children of school age in the state. The law demands that every child of school age, irrespective of sex, social status, physical and religious affiliation, must attain basic education by the year 2015. Parents, under this law, are required to ensure that their children/wards of school age remain in school during school hours or face prosecution. However, it appears that the law is not being effectively enforced. Never-theless, this law and other legal instruments have provided the enabling climate for school enrolment to increase.
In 2010, the Delta State Legislature passed into law, the UNESCO Declaration of Inter-national Human Rights of 1941. The Act stipulates, among other things, a child's right to education; and eventually became the instrument driving Universal Basic Educa-tion.
Policies, Strategies and Programmes/initiatives in the Education Sector
The State's vision for primary and secondary education is functional. It envisions quality education that lays the foundation for good citizenship in every child (Delta Vision 2020, 2011). In the same way, the vision for higher education is for Delta State to become one of the leading states with the highest level of trained and skilled manpower. In line with the vision, specific goals/objectives, policies and strategies have been formulated to guide developments in the sector.
Objectives of the Education Sector
The specific objectives of the sector are to:
· Achieve free and compulsory basic and
secondary education; · Formulate policies, implementation
strategies and interventions for quali-tative and functional education needed for productive living in society;
· Promote and ensure improvement in
instructional delivery (teaching/learning processes);
· Improve professionalism in teaching
through welfare and in-service, training, to boost the morale of teachers and promote quality classroom teaching;
· Maintain zero tolerance among Out-of-
School Children (OOSC);· Provide access to educational services at
all levels of education: Pre-primary; Primary, Secondary and Tertiary;
· Produce graduates that are highly
successful in technical knowledge and skills;
· Provide school infrastructure such as
classrooms and furniture for students and staff;
· Achieve parity between male and female
access to quality education;· Increase literacy rate of men and women
in the State; and· Develop laboratories, ICT centres and
libraries in basic, secondary and tertiary institutions.
These are laudable objectives that would lead to the desired outcomes of a highly literate society, skilled manpower, gender parity, and knowledgeable citizens if faithfully imple-mented.
The objectives are also anchored on govern-ment's commitment to the achievement of national and global targets of the MDGs that are relevant to the education sector, namely:
Goal 2: Achieve Universal Primary Education
Target 2A: Ensure that by 2015 children everywhere, boys and girls alike, will be able to complete a full course of primary schooling.
Goal 3: Promote Gender Equality and Empower Women
Target 3A: Eliminate gender disparity in primary and secondary education preferably by 2005, and in all levels of education not later than 2015.
Policies
Government policies in this sector are formulated principally to promote human capital development, and educational infrastructural development. The key policies relate to the following:
a. Free and compulsory primary and secondary education;
b. Functional and high quality educa-
25
tion;c. Science and Technology. d. Inclusive and Special Education in
terms of access, curriculum develop-ment and instructional methods and materials (Special Education).
e. Gender parity in enrolment and school completion rate.
f. Professionalization of teaching and provision of teacher welfare scheme.
g. Equity in school infrastructural deve-lopment;
h. Quality assurance;i. Scholarship and bursary schemes. j. Early Childhood Care and Develop-
ment Education (ECCDE) k. Child-friendly school environment
(in all levels of education)l. Community ownership of schools
and participation. m. Public Private Partnership Initiatives
(PPPI) n. Adult Literacy and Non-Formal Edu-
cation.o. EDUMARSHAL Policy
These policies were developed by the Delta State Government in line with the National Policy on Education (NPE, 2004) and the United Nations Education, Scientific and Cultural Organization (UNESCO) declaration of Education for All (EFA) in 2000. The policies are meant to guide, direct, and ensure a holistic approach to providing and expanding the frontiers of quality education to the people. The policy on EFA implies that no child is denied access to education, regardless of physical and other challenges. Consequently, provisions are made by the state government to accommodate every child in the regular school setting without discrimination or rejection irrespective of observed individual differences. In addition, special schools are provided in few and widely spread apart locations.
The free and compulsory education policy seeks to reduce illiteracy rate, out- of- school children and school drop-outs to the barest minimum, and, by 2015, achieve the target of Universal Education for all children. The professionalization of teaching policy adopted by the State is in line with the federal government policy on the professionalization of teaching. However, this policy has not been fully implemented in the State as holders of Grade II Teaching Certificate are still in the
system as at 2014 and may even remain for some time beyond. Also of significance is the policy on community ownership and participation in the management of schools. However, the zero collection component of the Free and Compulsory Education, which prohibits the collection of fees and charges, has tended to limit the involvement and participation of some critical stakeholders notably, Old Students Association, PTA and SBMC.
Strategies, Initiatives/Programmes in the Sector
To develop the educational sector and achieve its set objectives, the state government has formulated and implemented several strategies and initiatives over the years. In particular, between 2007 and 2014, the government has embarked on a number of programmes and initiatives to achieve the two MDGs relevant to education, and other educational targets. Such programmes and interventions include:
a. Creation of the Ministry of Higher Education from the former Ministry of Education on 14 October 2005.
b. Introduction of the Free and Compul-sory Education Policy;
c. Construction of new school buildings and renovation/rehabilitation of exist-ing ones to increase number of class-rooms. The Delta State Govern-ment has given utmost priority to the deve-lopment of infrastructure/facil-ities to enhance access and quality across all levels;
d. Establishment of Education Marshal (EDUMARSHAL);
e. Beautification/landscaping of school environments;
f. Supply of school furniture, laboratory equipment and books;
g. Establishment of Special Education Sch-ool for persons with disabilities;
h. Building of more Technical Schools;I. Provisions for training and re-training of
teachers.
Some of these programmes and initiatives are briefly elaborated upon as follows:
a. Free and Compulsory Education
In 2007, Delta State made free educa-
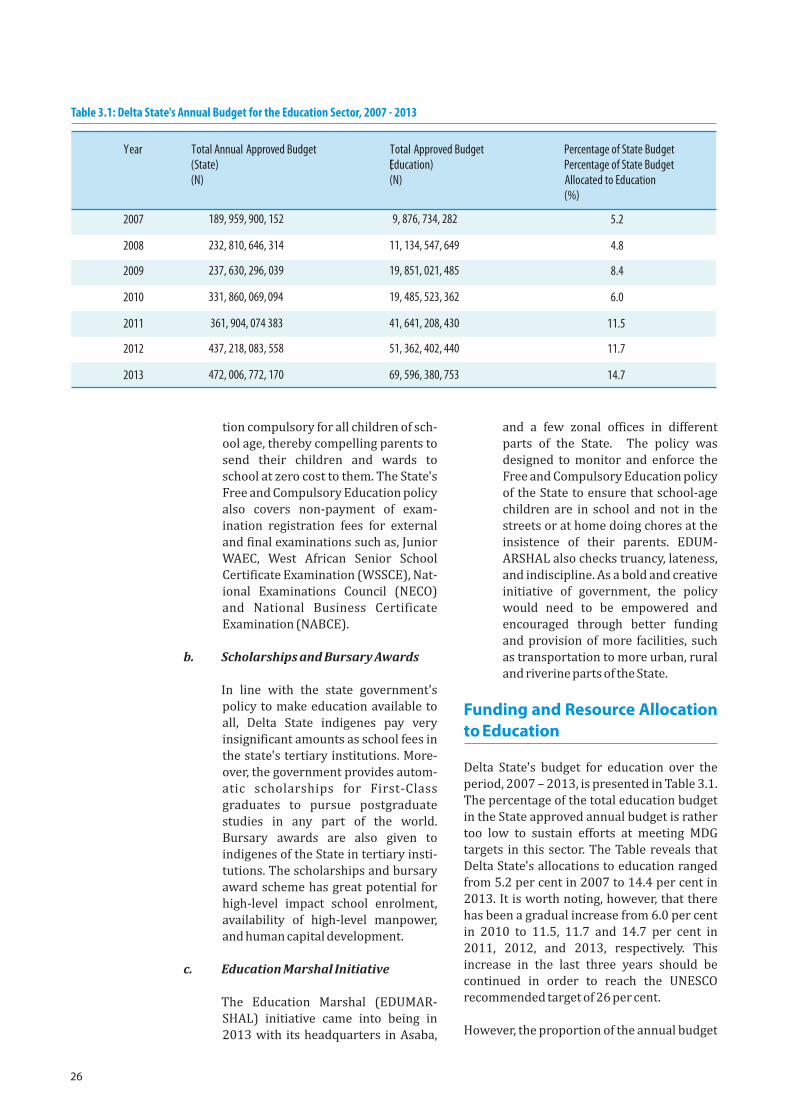
26
tion compulsory for all children of sch-ool age, thereby compelling parents to send their children and wards to school at zero cost to them. The State's Free and Compulsory Education policy also covers non-payment of exam-ination registration fees for external and final examinations such as, Junior WAEC, West African Senior School Certificate Examination (WSSCE), Nat-ional Examinations Council (NECO) and National Business Certificate Examination (NABCE).
b. Scholarships and Bursary Awards
In line with the state government's policy to make education available to all, Delta State indigenes pay very insignificant amounts as school fees in the state's tertiary institutions. More-over, the government provides autom-atic scholarships for First-Class graduates to pursue postgraduate studies in any part of the world. Bursary awards are also given to indigenes of the State in tertiary insti-tutions. The scholarships and bursary award scheme has great potential for high-level impact school enrolment, availability of high-level manpower, and human capital development.
c. Education Marshal Initiative The Education Marshal (EDUMAR-
SHAL) initiative came into being in 2013 with its headquarters in Asaba,
and a few zonal offices in different parts of the State. The policy was designed to monitor and enforce the Free and Compulsory Education policy of the State to ensure that school-age children are in school and not in the streets or at home doing chores at the insistence of their parents. EDUM-ARSHAL also checks truancy, lateness, and indiscipline. As a bold and creative initiative of government, the policy would need to be empowered and encouraged through better funding and provision of more facilities, such as transportation to more urban, rural and riverine parts of the State.
Funding and Resource Allocation to Education
Delta State's budget for education over the period, 2007 – 2013, is presented in Table 3.1. The percentage of the total education budget in the State approved annual budget is rather too low to sustain efforts at meeting MDG targets in this sector. The Table reveals that Delta State's allocations to education ranged from 5.2 per cent in 2007 to 14.4 per cent in 2013. It is worth noting, however, that there has been a gradual increase from 6.0 per cent in 2010 to 11.5, 11.7 and 14.7 per cent in 2011, 2012, and 2013, respectively. This increase in the last three years should be continued in order to reach the UNESCO recommended target of 26 per cent.
However, the proportion of the annual budget
Year Total Annual Approved Budget (State) (N)
Total Approved Budget (Education) (N)
Percentage of State Budget Percentage of State Budget Allocated to Education (%)
2007 189, 959, 900, 152 9, 876, 734, 282 5.2
2008 232, 810, 646, 314 11, 134, 547, 649 4.8
2009 237, 630, 296, 039 19, 851, 021, 485 8.4
2010 331, 860, 069, 094 19, 485, 523, 362 6.0
2011 361, 904, 074 383 41, 641, 208, 430 11.5
2012 437, 218, 083, 558 51, 362, 402, 440 11.7
2013 472, 006, 772, 170 69, 596, 380, 753 14.7
Table 3.1: Delta State's Annual Budget for the Education Sector, 2007 - 2013
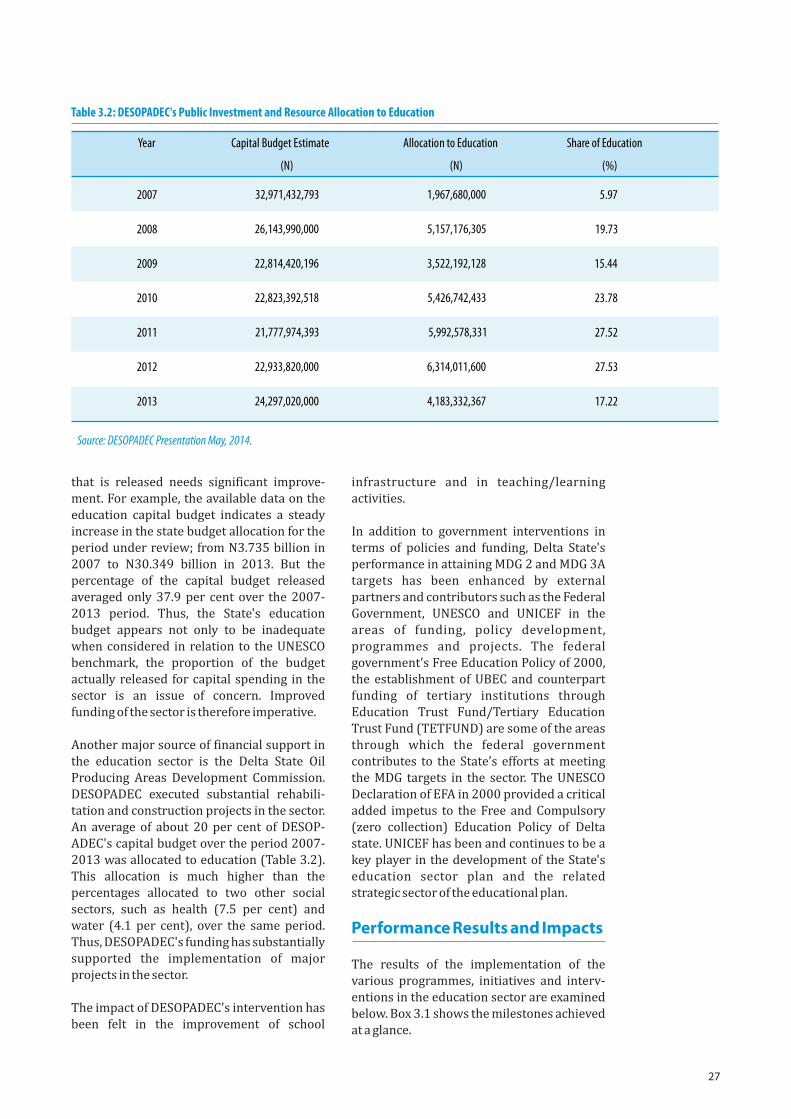
27
that is released needs significant improve-ment. For example, the available data on the education capital budget indicates a steady increase in the state budget allocation for the period under review; from N3.735 billion in 2007 to N30.349 billion in 2013. But the percentage of the capital budget released averaged only 37.9 per cent over the 2007-2013 period. Thus, the State's education budget appears not only to be inadequate when considered in relation to the UNESCO benchmark, the proportion of the budget actually released for capital spending in the sector is an issue of concern. Improved funding of the sector is therefore imperative.
Another major source of financial support in the education sector is the Delta State Oil Producing Areas Development Commission. DESOPADEC executed substantial rehabili-tation and construction projects in the sector. An average of about 20 per cent of DESOP-ADEC's capital budget over the period 2007-2013 was allocated to education (Table 3.2). This allocation is much higher than the percentages allocated to two other social sectors, such as health (7.5 per cent) and water (4.1 per cent), over the same period. Thus, DESOPADEC's funding has substantially supported the implementation of major projects in the sector.
The impact of DESOPADEC's intervention has been felt in the improvement of school
infrastructure and in teaching/learning activities.
In addition to government interventions in terms of policies and funding, Delta State's performance in attaining MDG 2 and MDG 3A targets has been enhanced by external partners and contributors such as the Federal Government, UNESCO and UNICEF in the areas of funding, policy development, programmes and projects. The federal government's Free Education Policy of 2000, the establishment of UBEC and counterpart funding of tertiary institutions through Education Trust Fund/Tertiary Education Trust Fund (TETFUND) are some of the areas through which the federal government contributes to the State’s efforts at meeting the MDG targets in the sector. The UNESCO Declaration of EFA in 2000 provided a critical added impetus to the Free and Compulsory (zero collection) Education Policy of Delta state. UNICEF has been and continues to be a key player in the development of the State's education sector plan and the related strategic sector of the educational plan.
Performance Results and Impacts
The results of the implementation of the various programmes, initiatives and interv-entions in the education sector are examined below. Box 3.1 shows the milestones achieved at a glance.
Table 3.2: DESOPADEC's Public Investment and Resource Allocation to Education
Source: DESOPADEC Presentation May, 2014.
Year Capital Budget Estimate
(N)
Allocation to Education
(N)
Share of Education
(%)
2007 32,971,432,793 1,967,680,000 5.97
2008 26,143,990,000 5,157,176,305 19.73
2009 22,814,420,196 3,522,192,128 15.44
2010 22,823,392,518 5,426,742,433 23.78
2011 21,777,974,393 5,992,578,331 27.52
2012 22,933,820,000 6,314,011,600 27.53
2013 24,297,020,000 4,183,332,367 17.22
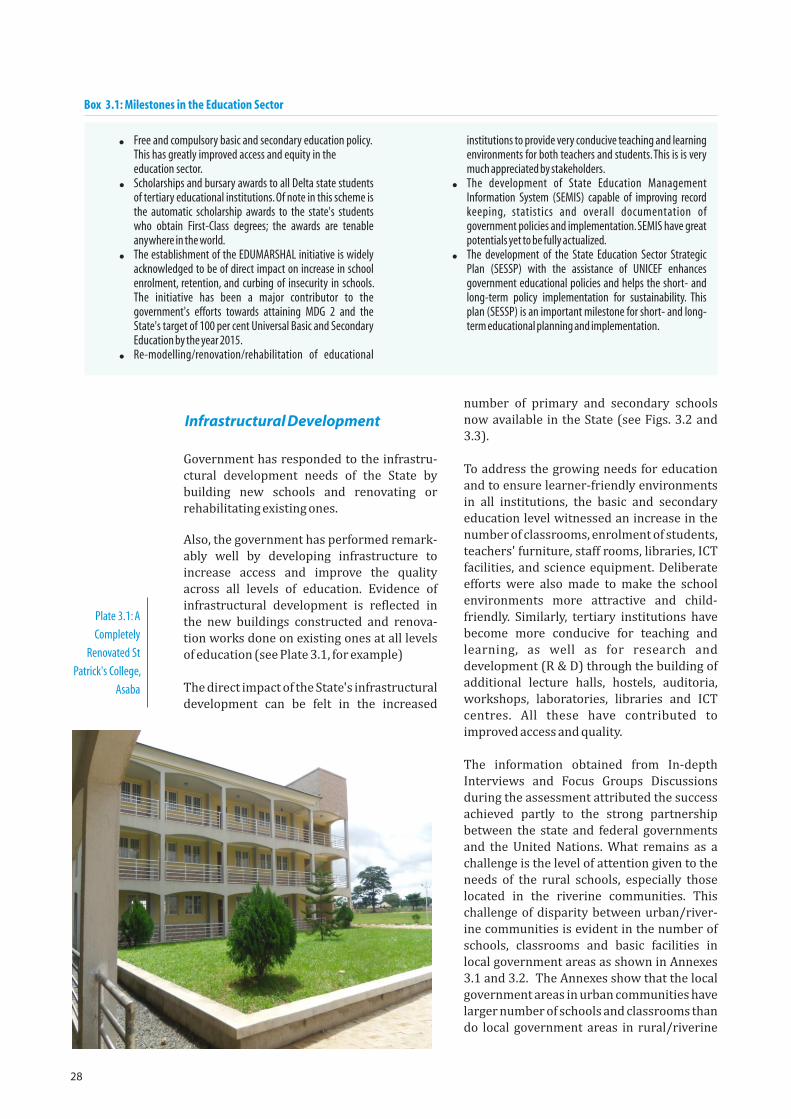
28
! Free and compulsory basic and secondary education policy. This has greatly improved access and equity in the education sector.! Scholarships and bursary awards to all Delta state students
of tertiary educational institutions. Of note in this scheme is the automatic scholarship awards to the state's students who obtain First-Class degrees; the awards are tenable anywhere in the world.
! The establishment of the EDUMARSHAL initiative is widely acknowledged to be of direct impact on increase in school enrolment, retention, and curbing of insecurity in schools. The initiative has been a major contributor to the government's efforts towards attaining MDG 2 and the State's target of 100 per cent Universal Basic and Secondary Education by the year 2015.
! Re-modelling/renovation/rehabilitation of educational
institutions to provide very conducive teaching and learning environments for both teachers and students. This is is very much appreciated by stakeholders.
! The development of State Education Management Information System (SEMIS) capable of improving record keeping, statistics and overall documentation of government policies and implementation. SEMIS have great potentials yet to be fully actualized.
! The development of the State Education Sector Strategic Plan (SESSP) with the assistance of UNICEF enhances government educational policies and helps the short- and long-term policy implementation for sustainability. This plan (SESSP) is an important milestone for short- and long-term educational planning and implementation.
Box 3.1: Milestones in the Education Sector
Infrastructural Development
Government has responded to the infrastru-ctural development needs of the State by building new schools and renovating or rehabilitating existing ones.
Also, the government has performed remark-ably well by developing infrastructure to increase access and improve the quality across all levels of education. Evidence of infrastructural development is reflected in the new buildings constructed and renova-tion works done on existing ones at all levels of education (see Plate 3.1, for example)
The direct impact of the State's infrastructural development can be felt in the increased
number of primary and secondary schools now available in the State (see Figs. 3.2 and 3.3).
To address the growing needs for education and to ensure learner-friendly environments in all institutions, the basic and secondary education level witnessed an increase in the number of classrooms, enrolment of students, teachers' furniture, staff rooms, libraries, ICT facilities, and science equipment. Deliberate efforts were also made to make the school environments more attractive and child-friendly. Similarly, tertiary institutions have become more conducive for teaching and learning, as well as for research and development (R & D) through the building of additional lecture halls, hostels, auditoria, workshops, laboratories, libraries and ICT centres. All these have contributed to improved access and quality.
The information obtained from In-depth Interviews and Focus Groups Discussions during the assessment attributed the success achieved partly to the strong partnership between the state and federal governments and the United Nations. What remains as a challenge is the level of attention given to the needs of the rural schools, especially those located in the riverine communities. This challenge of disparity between urban/river-ine communities is evident in the number of schools, classrooms and basic facilities in local government areas as shown in Annexes 3.1 and 3.2. The Annexes show that the local government areas in urban communities have larger number of schools and classrooms than do local government areas in rural/riverine
Plate 3.1: A
Completely
Renovated St
Patrick's College,
Asaba
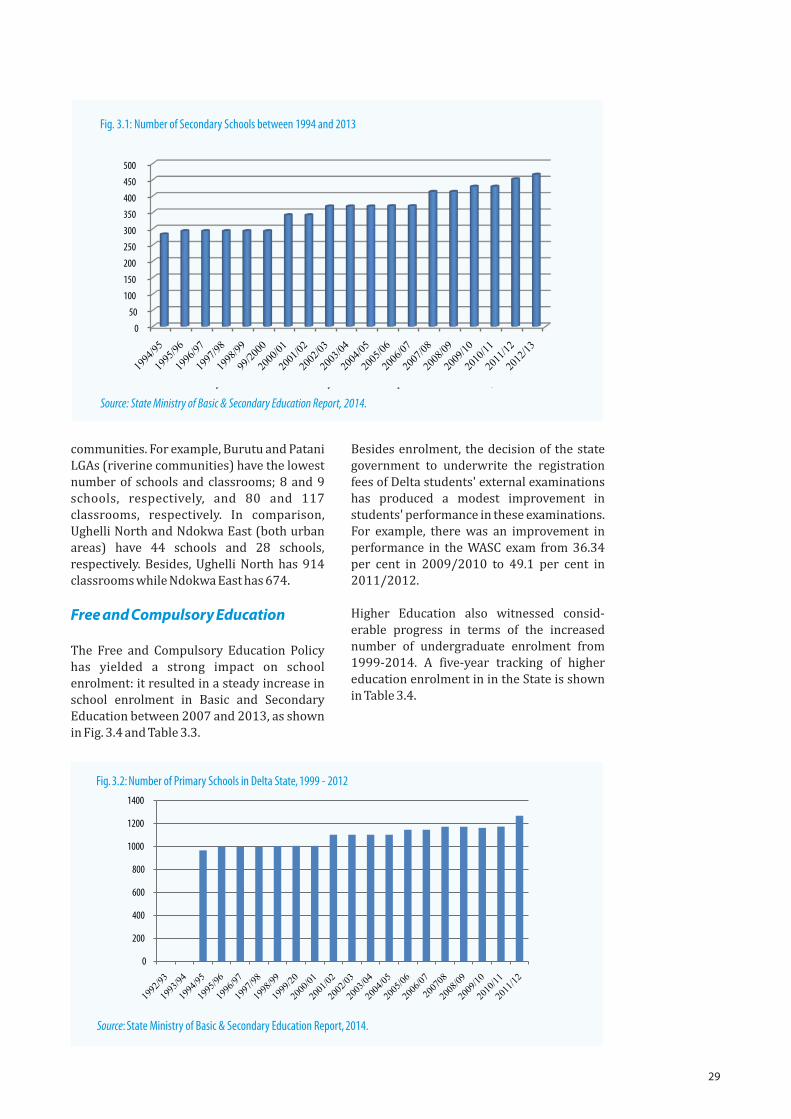
29
communities. For example, Burutu and Patani LGAs (riverine communities) have the lowest number of schools and classrooms; 8 and 9 schools, respectively, and 80 and 117 classrooms, respectively. In comparison, Ughelli North and Ndokwa East (both urban areas) have 44 schools and 28 schools, respectively. Besides, Ughelli North has 914 classrooms while Ndokwa East has 674.
Free and Compulsory Education
The Free and Compulsory Education Policy has yielded a strong impact on school enrolment: it resulted in a steady increase in school enrolment in Basic and Secondary Education between 2007 and 2013, as shown in Fig. 3.4 and Table 3.3.
Besides enrolment, the decision of the state government to underwrite the registration fees of Delta students' external examinations has produced a modest improvement in students' performance in these examinations. For example, there was an improvement in performance in the WASC exam from 36.34 per cent in 2009/2010 to 49.1 per cent in 2011/2012.
Higher Education also witnessed consid-erable progress in terms of the increased number of undergraduate enrolment from 1999-2014. A five-year tracking of higher education enrolment in in the State is shown in Table 3.4.
Source: State Ministry of Basic & Secondary Education Report, 2014.
Fig. 3.4: Number of Primary Schools between 1992 and 2012
Source: State Ministry of Basic and Secondary Education Report , 2014
0
50
100
150
200
250
300
350
400
450
500
Fig. 3.1: Number of Secondary Schools between 1994 and 2013
Source: State Ministry of Basic & Secondary Education Report, 2014.
0
200
400
600
800
1000
1200
1400
Fig. 3.2: Number of Primary Schools in Delta State, 1999 - 2012
Source: State Ministry of Basic & Secondary Education Report, 2014.
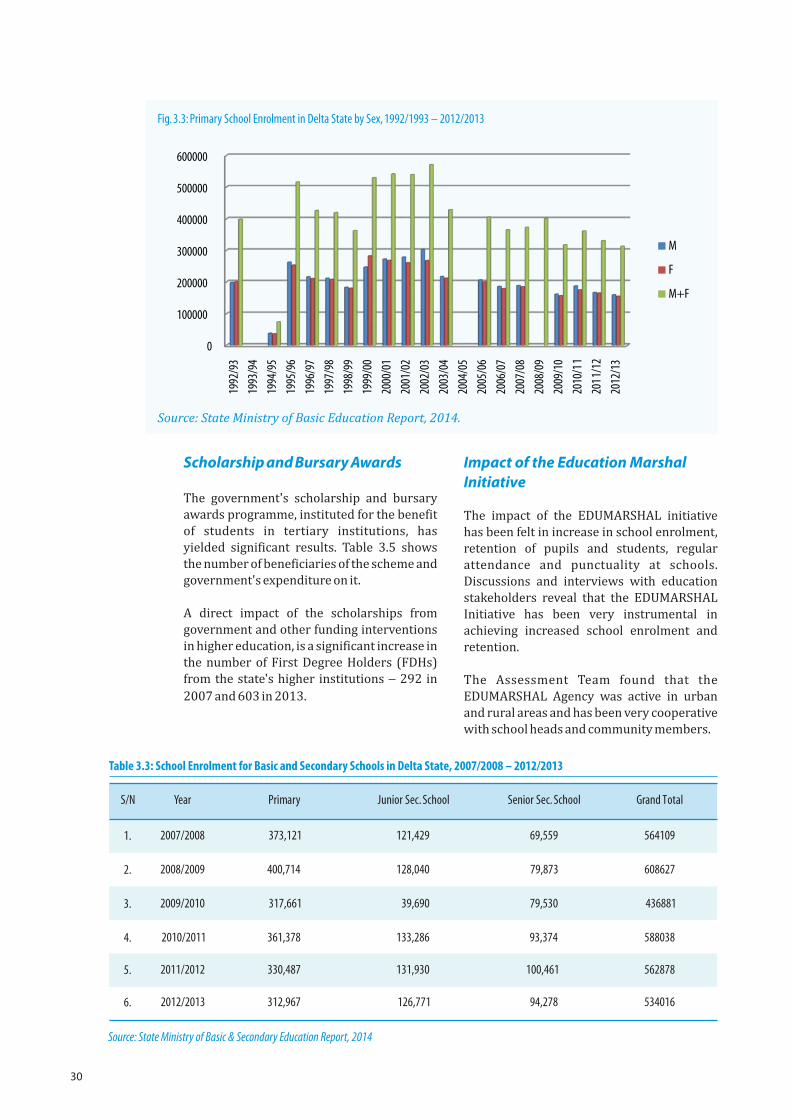
30
Scholarship and Bursary Awards
The government's scholarship and bursary awards programme, instituted for the benefit of students in tertiary institutions, has yielded significant results. Table 3.5 shows the number of beneficiaries of the scheme and government's expenditure on it.
A direct impact of the scholarships from government and other funding interventions in higher education, is a significant increase in the number of First Degree Holders (FDHs) from the state's higher institutions - 292 in
2007 and 603 in 2013.
Impact of the Education Marshal Initiative
The impact of the EDUMARSHAL initiative has been felt in increase in school enrolment, retention of pupils and students, regular attendance and punctuality at schools. Discussions and interviews with education stakeholders reveal that the EDUMARSHAL Initiative has been very instrumental in achieving increased school enrolment and retention.
The Assessment Team found that the EDUMARSHAL Agency was active in urban and rural areas and has been very cooperative with school heads and community members.
0
100000
200000
300000
400000
500000
600000
1992
/93
1993
/94
1994
/95
1995
/96
1996
/97
1997
/98
1998
/99
1999
/00
2000
/01
2001
/02
2002
/03
2003
/04
2004
/05
2005
/06
2006
/07
2007
/08
2008
/09
2009
/10
2010
/11
2011
/12
2012
/13
M
F
M+F
Fig. 3.3: Primary School Enrolment in Delta State by Sex, 1992/1993 – 2012/2013
Source: State Ministry of Basic Education Report, 2014.
Table 3.3: School Enrolment for Basic and Secondary Schools in Delta State, 2007/2008 – 2012/2013
Source: State Ministry of Basic & Secondary Education Report, 2014
S/N Year Primary Junior Sec. School Senior Sec. School Grand Total
1. 2007/2008 373,121 121,429 69,559 564109
2. 2008/2009 400,714 128,040 79,873 608627
3. 2009/2010 317,661 39,690 79,530 436881
4. 2010/2011 361,378 133,286 93,374 588038
5. 2011/2012 330,487 131,930 100,461 562878
6. 2012/2013 312,967 126,771 94,278 534016
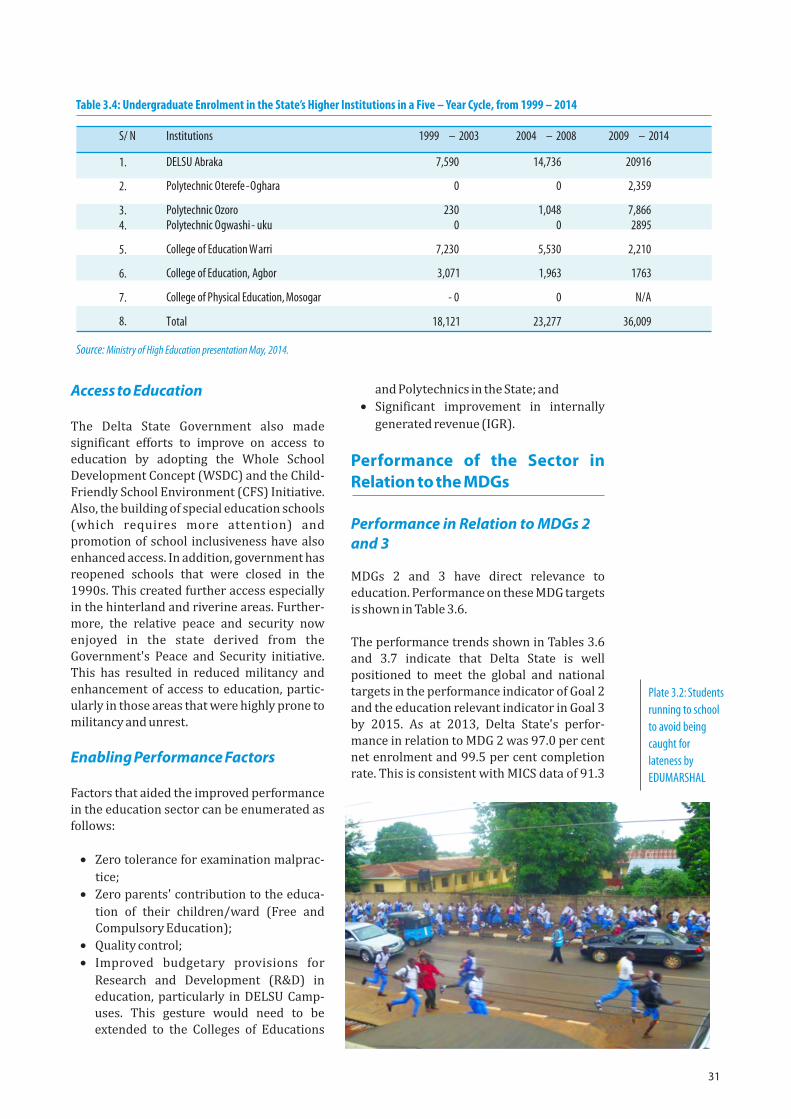
31
Access to Education
The Delta State Government also made significant efforts to improve on access to education by adopting the Whole School Development Concept (WSDC) and the Child-Friendly School Environment (CFS) Initiative. Also, the building of special education schools (which requires more attention) and promotion of school inclusiveness have also enhanced access. In addition, government has reopened schools that were closed in the 1990s. This created further access especially in the hinterland and riverine areas. Further-more, the relative peace and security now enjoyed in the state derived from the Government's Peace and Security initiative. This has resulted in reduced militancy and enhancement of access to education, partic-ularly in those areas that were highly prone to militancy and unrest.
Enabling Performance Factors
Factors that aided the improved performance in the education sector can be enumerated as follows:
· Zero tolerance for examination malprac-
tice;
· Zero parents' contribution to the educa-
tion of their children/ward (Free and Compulsory Education);
· Quality control;
· Improved budgetary provisions for
Research and Development (R&D) in education, particularly in DELSU Camp-uses. This gesture would need to be extended to the Colleges of Educations
and Polytechnics in the State; and
· Significant improvement in internally
generated revenue (IGR).
Performance of the Sector in Relation to the MDGs
Performance in Relation to MDGs 2 and 3
MDGs 2 and 3 have direct relevance to education. Performance on these MDG targets is shown in Table 3.6.
The performance trends shown in Tables 3.6 and 3.7 indicate that Delta State is well positioned to meet the global and national targets in the performance indicator of Goal 2 and the education relevant indicator in Goal 3 by 2015. As at 2013, Delta State's perfor-mance in relation to MDG 2 was 97.0 per cent net enrolment and 99.5 per cent completion rate. This is consistent with MICS data of 91.3
Plate 3.2: Students running to school to avoid being caught for lateness by EDUMARSHAL
S/ N Institutions 1999 – 2003 2004 – 2008 2009 – 2014
1. DELSU Abraka 7,590 14,736 20916
2. Polytechnic Oterefe -Oghara 0 0 2,359
3. Polytechnic Ozoro 230 1,048 7,866 4. Polytechnic Ogwashi - uku 0 0 2895
5. College of Education Warri 7,230 5,530 2,210
6. College of Education, Agbor 3,071 1,963 1763
7. College of Physical Education, Mosogar - 0 0 N/A
8. Total 18,121 23,277 36,009
Table 3.4: Undergraduate Enrolment in the State’s Higher Institutions in a Five – Year Cycle, from 1999 – 2014
Source: Ministry of High Education presentation May, 2014.
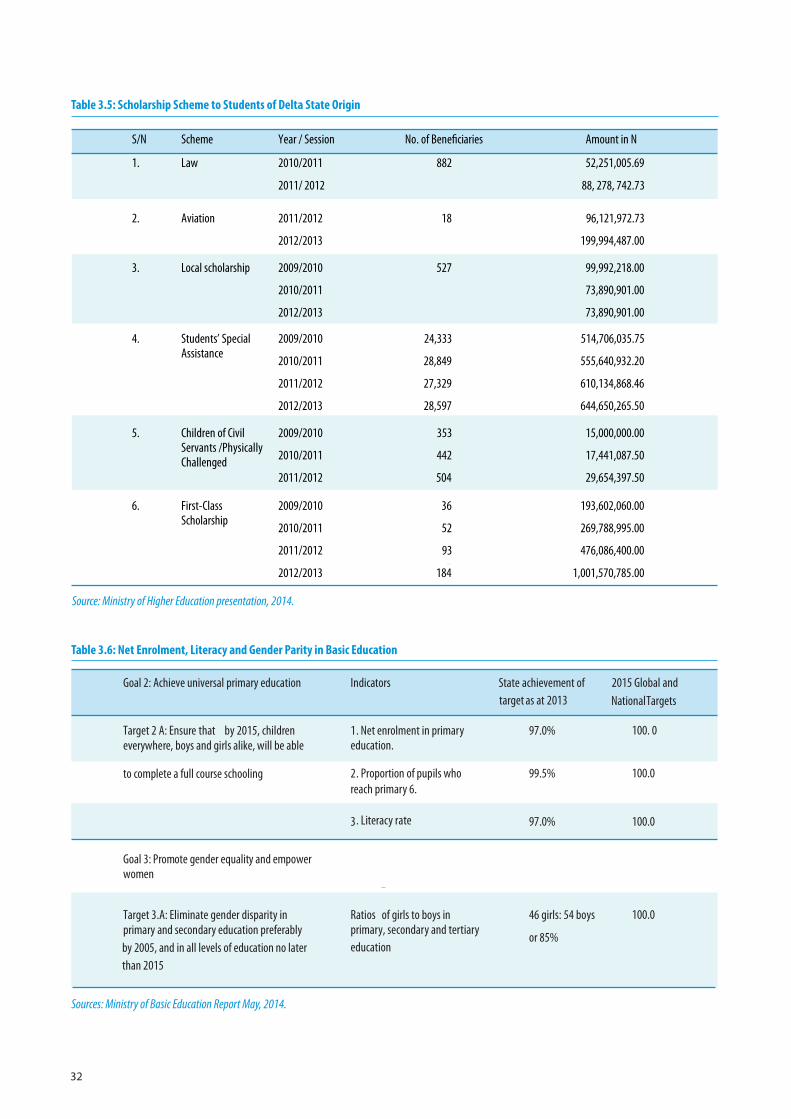
32
Table 3.5: Scholarship Scheme to Students of Delta State Origin
DRAFT
S/N Scheme Year / Session No. of Beneficiaries Amount in N
1. Law 2010/2011
2011/ 2012
882 52,251,005.69
88, 278, 742.73
2. Aviation 2011/2012
2012/2013
18 96,121,972.73
199,994,487.00
3. Local scholarship 2009/2010
2010/2011
2012/2013
527 99,992,218.00
73,890,901.00
73,890,901.00
4. Students’ Special Assistance
2009/2010
2010/2011
2011/2012
2012/2013
24,333
28,849
27,329
28,597
514,706,035.75
555,640,932.20
610,134,868.46
644,650,265.50
5. Children of Civil Servants /Physically Challenged
2009/2010
2010/2011
2011/2012
353
442
504
15,000,000.00
17,441,087.50
29,654,397.50
6. First-Class Scholarship
2009/2010
2010/2011
2011/2012
2012/2013
36
52
93
184
193,602,060.00
269,788,995.00
476,086,400.00
1,001,570,785.00
Source: Ministry of Higher Education presentation, 2014.
Sources: Ministry of Basic Education Report May, 2014.
DRAFT
Goal 2: Achieve universal primary education Indicators State achievement of target as at 2013
2015 Global and National Targets
Target 2 A: Ensure that by 2015, children everywhere, boys and girls alike, will be able
1. Net enrolment in primary education.
97.0% 100. 0
to complete a full course schooling 2. Proportion of pupils who reach primary 6.
99.5% 100.0
3. Literacy rate 97.0% 100.0
Goal 3: Promote gender equality and empower women
Target 3.A: Eliminate gender disparity in primary and secondary education preferably by 2005, and in all levels of education no later than 2015
Ratios of girls to boys in primary, secondary and tertiary education
46 girls: 54 boys
or 85%
100.0
Table 3.6: Net Enrolment, Literacy and Gender Parity in Basic Education
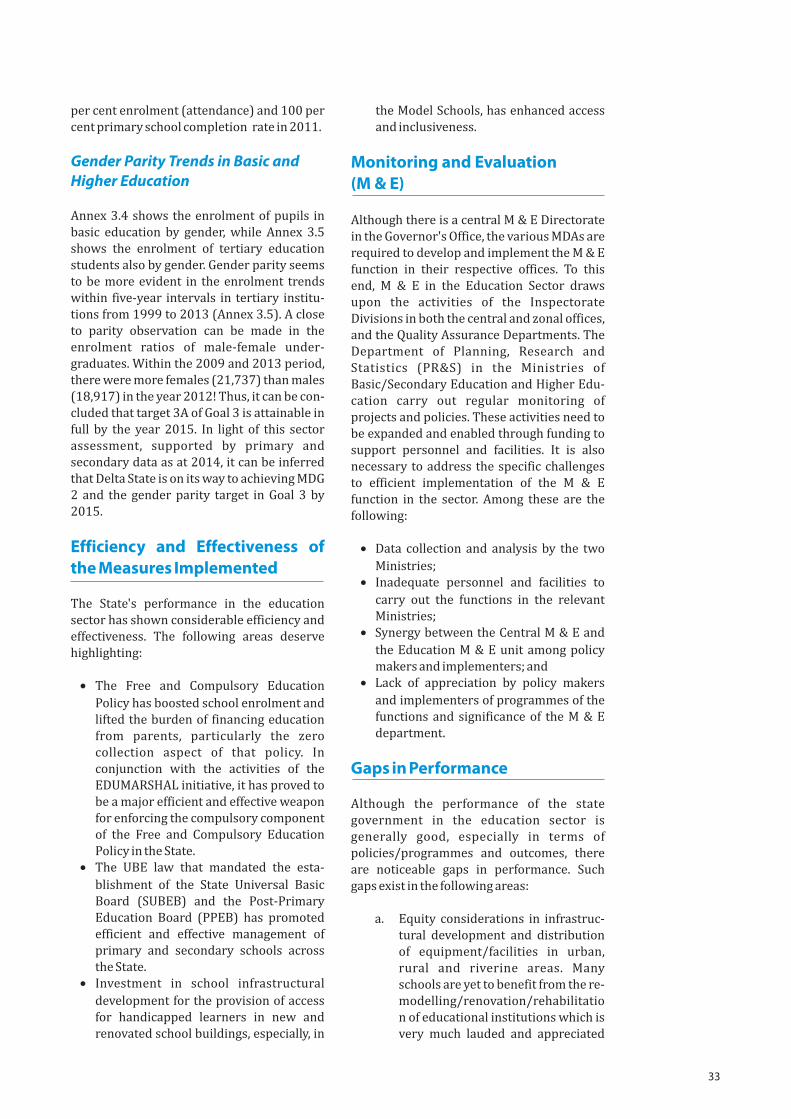
33
per cent enrolment (attendance) and 100 per cent primary school completion rate in 2011.
Gender Parity Trends in Basic and Higher Education
Annex 3.4 shows the enrolment of pupils in basic education by gender, while Annex 3.5 shows the enrolment of tertiary education students also by gender. Gender parity seems to be more evident in the enrolment trends within five-year intervals in tertiary institu-tions from 1999 to 2013 (Annex 3.5). A close to parity observation can be made in the enrolment ratios of male-female under-graduates. Within the 2009 and 2013 period, there were more females (21,737) than males (18,917) in the year 2012! Thus, it can be con-cluded that target 3A of Goal 3 is attainable in full by the year 2015. In light of this sector assessment, supported by primary and secondary data as at 2014, it can be inferred that Delta State is on its way to achieving MDG 2 and the gender parity target in Goal 3 by 2015.
Efficiency and Effectiveness of the Measures Implemented
The State's performance in the education sector has shown considerable efficiency and effectiveness. The following areas deserve highlighting:
· The Free and Compulsory Education
Policy has boosted school enrolment and lifted the burden of financing education from parents, particularly the zero collection aspect of that policy. In conjunction with the activities of the EDUMARSHAL initiative, it has proved to be a major efficient and effective weapon for enforcing the compulsory component of the Free and Compulsory Education Policy in the State.
· The UBE law that mandated the esta-
blishment of the State Universal Basic Board (SUBEB) and the Post-Primary Education Board (PPEB) has promoted efficient and effective management of primary and secondary schools across the State.
· Investment in school infrastructural
development for the provision of access for handicapped learners in new and renovated school buildings, especially, in
the Model Schools, has enhanced access and inclusiveness.
Monitoring and Evaluation (M & E)
Although there is a central M & E Directorate in the Governor's Office, the various MDAs are required to develop and implement the M & E function in their respective offices. To this end, M & E in the Education Sector draws upon the activities of the Inspectorate Divisions in both the central and zonal offices, and the Quality Assurance Departments. The Department of Planning, Research and Statistics (PR&S) in the Ministries of Basic/Secondary Education and Higher Edu-cation carry out regular monitoring of projects and policies. These activities need to be expanded and enabled through funding to support personnel and facilities. It is also necessary to address the specific challenges to efficient implementation of the M & E function in the sector. Among these are the following:
· Data collection and analysis by the two
Ministries;· Inadequate personnel and facilities to
carry out the functions in the relevant Ministries;
· Synergy between the Central M & E and
the Education M & E unit among policy makers and implementers; and
· Lack of appreciation by policy makers
and implementers of programmes of the functions and significance of the M & E department.
Gaps in Performance
Although the performance of the state government in the education sector is generally good, especially in terms of policies/programmes and outcomes, there are noticeable gaps in performance. Such gaps exist in the following areas:
a. Equity considerations in infrastruc-tural development and distribution of equipment/facilities in urban, rural and riverine areas. Many schools are yet to benefit from the re-modelling/renovation/rehabilitation of educational institutions which is very much lauded and appreciated
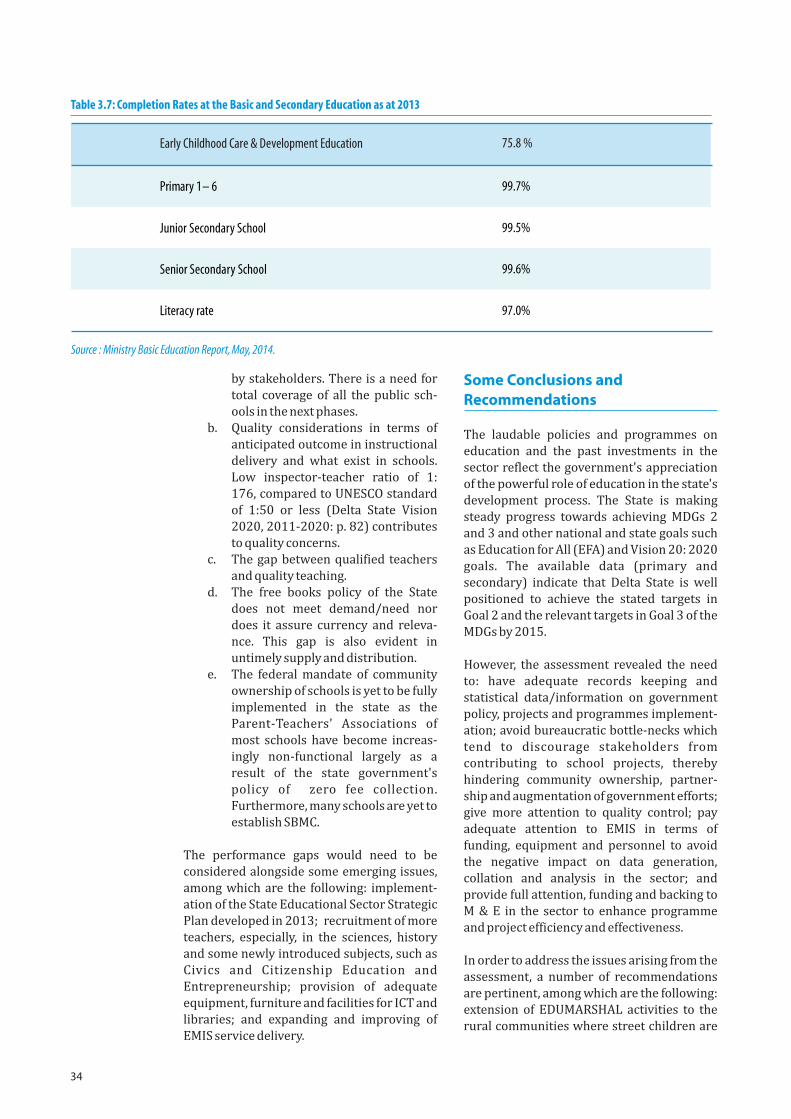
34
by stakeholders. There is a need for total coverage of all the public sch-ools in the next phases.
b. Quality considerations in terms of anticipated outcome in instructional delivery and what exist in schools. Low inspector-teacher ratio of 1: 176, compared to UNESCO standard of 1:50 or less (Delta State Vision 2020, 2011-2020: p. 82) contributes to quality concerns.
c. The gap between qualified teachers and quality teaching.
d. The free books policy of the State does not meet demand/need nor does it assure currency and releva-nce. This gap is also evident in untimely supply and distribution.
e. The federal mandate of community ownership of schools is yet to be fully implemented in the state as the Parent-Teachers' Associations of most schools have become increas-ingly non-functional largely as a result of the state government's policy of zero fee collection. Furthermore, many schools are yet to establish SBMC.
The performance gaps would need to be considered alongside some emerging issues, among which are the following: implement-ation of the State Educational Sector Strategic Plan developed in 2013; recruitment of more teachers, especially, in the sciences, history and some newly introduced subjects, such as Civics and Citizenship Education and Entrepreneurship; provision of adequate equipment, furniture and facilities for ICT and libraries; and expanding and improving of EMIS service delivery.
Some Conclusions and Recommendations
The laudable policies and programmes on education and the past investments in the sector reflect the government's appreciation of the powerful role of education in the state's development process. The State is making steady progress towards achieving MDGs 2 and 3 and other national and state goals such as Education for All (EFA) and Vision 20: 2020 goals. The available data (primary and secondary) indicate that Delta State is well positioned to achieve the stated targets in Goal 2 and the relevant targets in Goal 3 of the MDGs by 2015.
However, the assessment revealed the need to: have adequate records keeping and statistical data/information on government policy, projects and programmes implement-ation; avoid bureaucratic bottle-necks which tend to discourage stakeholders from contributing to school projects, thereby hindering community ownership, partner-ship and augmentation of government efforts; give more attention to quality control; pay adequate attention to EMIS in terms of funding, equipment and personnel to avoid the negative impact on data generation, collation and analysis in the sector; and provide full attention, funding and backing to M & E in the sector to enhance programme and project efficiency and effectiveness.
In order to address the issues arising from the assessment, a number of recommendations are pertinent, among which are the following: extension of EDUMARSHAL activities to the rural communities where street children are
Table 3.7: Completion Rates at the Basic and Secondary Education as at 2013
Early Childhood Care & Development Education 75.8 %
Primary 1– 6 99.7%
Junior Secondary School 99.5%
Senior Secondary School 99.6%
Literacy rate 97.0%
Source : Ministry Basic Education Report, May, 2014.
35
highly concentrated; provision and distri-bution of infrastructural facilities according to school needs; improvement in the subventions to schools and principals/head-teachers; employment of more teachers, especially for some secondary school subjects (Physics, Chemistry, and Civics); and
establishment of Teachers' Professional Development Centres for in-service training and development. Chapter 8 contains the detailed recommendations.

36
37
Health SectorThe objective of the assessment of the health sector was to gauge how the sector has contributed towards the achievement of the state
development goals and the Millennium Development Goals. This required a review of the health policies, programmes, interventions and
facilities to assess the extent of contribution to progress made in improving access to quality health care and improved health indicators
and outcomes. The assessment also identified bottlenecks and constraints to healthcare delivery and priority areas of focus to improve
and accelerate performance and for developing future health sector programmes. A key element of the methodology adopted for the
assessment was a field survey entailing visits to facilities and health infrastructure, and interactions with key informants, focal groups,
and beneficiaries of health services. The interactions and meetings provided the opportunity to generate missing information; clarify
issues; assess the views of beneficiaries and providers on appropriateness, quality and equity issues; and gain perspectives on
improvements needed.
4
Governance and Regulatory Framework of the Health Sector
Institutional Arrangements
The Delta State Ministry of Health (SMoH) is the apex of healthcare delivery. It has the mandate to formulate and implement policies/strategies for the achievement of the health sector goals. The SMoH has seven departments (four professional and three mandatory), and six parastatals (see Annex 4.1). Through the Departments and Paras-tatals, the SMoH, aims to fulfil the following responsibilities:
! Formulation of health policies.! Development and execution of health
sector development programmes.! Administration of State Government
Hospitals and Allied Health Institutions through the Hospitals Management Board.
! Promotion of Primary Health Care and Disease Control activities.
! Provision of pharmaceutical services including inspection and licensing of patent medicine shops.
! Supervision of the Specialist/University Teaching Hospital in the State.
! Management of Training Institutions for Nurses and Midwives, Health Superint-endents, Pharmacy Technicians, other para-medical staff and health workers.
! Registration of private/voluntary medical agencies.
! Liaison with other state services and national bodies in the health sector.
In the context of the nation's three-tier system of health care (National Health Policy 2004), the Local Government Authority also plays a notable role in health care delivery. It is resp-onsible for managing the Primary Healthcare Centres (PHCs). The Local Government Service Commission is responsible for employing and managing the technical personnel working in the PHCs, with support from NPHCDA, SPHCDA, and the SMoH. Additionally, the Delta State Oil Producing Areas Development Commission (DESOP-ADEC) and the Directorate of Millen-nium Development Goals Conditional Grants Scheme (MDG-CGS) have been implementing health projects in the State since 2008.
Regulatory Framework
The relevant SMoH Departments or Para-statals working in collaboration with the appropriate federal councils/bodies, under-take the registration and regulation of the activities of health professionals, includ-ing the annual renewals of registration. Impor-tantly:
! The Department of Medical Services and Training of the SMoH has its main function as setting and enforcing the
38
minimum healthcare standards through policy formulation, inspection and supervision of public and private health facilities.
! The manufacture, importation, storage, sale, distribution and dispensing of pharmaceuticals, vaccines, equipment and appliances. Other medical supplies have to comply with laid-down standard specifications and Essential Drug List.
! The State Drug Revolving Fund (DRF) has a quality control laboratory which undertakes laboratory tests for medic-ines before they are procured to ensure that effective and safe medicines are procured, stored and distributed.
! A Task Force on Counterfeit and Fake Drugs is being contemplated to enforce the provisions of the Counterfeit and Fake Drugs Act. It was yet to be consti-tuted at the time of the assessment.
Policies and Programmes in the Health Sector
Framework for Policies and Programmes
The National Health Policy (2004 revision) provides the overall guidance for health development in the entire federation. For Delta State, its key development frameworks continue to provide guidance for health policies and programmes. Among these are the Delta State Economic Empowerment and Development Strategy (DELTASEEDS), the State Vision 2020 (2011), the Delta State 3-Point Agenda, and the Delta State Strategic Health Development Programme (SSHDP). These frameworks indicate the objectives of the health policies.
DELTASEEDS
The Delta State Economic Empowerment and Development Strategy covering 2004-2007 contains targets and objectives for the State health sector. The policy objectives articul-ated in DELTASEEDS are as follows: broad-ening specialized services, controlling and managing HIV & AIDS, improving laboratory and radiological services, providing quality drugs, improving immunization coverage by strengthening routine immunization and malaria control; promoting gender equity and eliminating negative practices involving
women; protecting the repro-ductive health of citizens, promoting effective disease surveillance, promoting adequate inform-ation flow and management, strength-ening the State’s TB and leprosy control programme and improving access to quality/affordable and effective health services.
The Health Sector Reform Programme (HSRP), which was implemented alongside DELTASEEDS, addressed issues such as government stewardship role; management of the state health system; the burden of diseases; mobilization and utilization of health resources; health service delivery; consumer awareness and community participation; partnership, collaboration and coordination.
T h e D e l t a S t a t e S t r a t e g i c H e a l t h Development Plan, 2010-2015
The Delta State Strategic Health Development Plan (SSHDP), 2010-2015, provides the health vision, mission, objectives and priority areas for the period, 2010-2015. SSHDP was elaborated to address the challenges that subsisted at the time and improve on the unsatisfactory health indicators. The Mission is 'to develop and implement appropriate policies and programmes as well as undertake other necessary actions that will strengthen the State's health system to deliver effective, quality and affordable health care services', while the goal is to substantially reduce morbidity and mortality through the provision of accessible, affordable and quality healthcare services. Against this backdrop, the SSHDP has eight priority areas, namely: (i) Leadership and governance; (ii) Service delivery; (iii) Human Resource for Health; (iv) Health Financing; (v) Health Management Information System; (vi) Community participation; (vii) Partnership for health; and (viii) Health research. Developing and effectively implementing programmes to achieve the goals of each of the eight priority areas will strengthen the health system and the primary health care.
The Delta State Vision 2020, 2011 - 2020
The Delta State Vision 2020 has a chapter on Human Development of which education and healthcare are key components. The vision of the health sector, as articulated in the Plan, is 'high quality, accessible and affordable health
39
care delivery for all Deltans', while the mission is 'to provide standard and adequate facilities, infrastructure and human resources to achieve the highest quality of healthcare that is globally competitive'. The healthcare section of the Vision document outlines goals/objectives, two of which are: emphasis on Primary Health Care (PHC) over curative healthcare; and improvement of financing of the health sector. In light of the objectives, health sector targets were set, two of which are to:
! Increase hospital beds from 7,132 to 22,000 and ratio from 165 per 100,000 to 400 per 100,000);
! Improve immunization coverage from the current 80 per cent to 100 per cent;
The State Vision document further defined strategies for attaining the above targets, among which are the following: Exploiting PPP in the distribution and delivery of LLINs; allocating 15 per cent of the annual budget to the health sector; and implementing the State's Strategic Health Development Plan, 2010-2015.
The Delta State 3-Point Agenda
The Human Capital Development component of the State's 3-Point Agenda incorporates education and health. In order to address the major issues of poverty and ignorance, health improvement is considered to be pivotal. Under the Agenda, the State has accelerated the implementation of the existing program-mes to increase access to health services for rural and riverine communities. Additionally, the Free Under-5 Healthcare Programme was introduced in 2010.
The Millennium Development Goals
Delta State has embraced the Millennium Development Goals (MDGs) and has committed to achieving them by 2015. The goals relating to health are:
Goal 4: Reduce child mortality. The target is to reduce by two-thirds, between 1990 and 2015, the under-5 mortality rate.
Goal 5: Improve maternal health. The target is to reduce by three-quarters, between 1990 and 2015, the maternal mortality ratio.
Goal 6: Combat HIV & AIDS, malaria and other diseases. The targets here are two: (i) Have halted, by 2015, and begun to reverse the spread of HIV & AIDS; and (ii) Have halted, by 2015, and begun to reverse the incidence of malaria and other major diseases.
The Delta State Government's policies and programmes on health care are all aimed at achieving the MDGs and other State targets.
Health Programmes/Interventions
Information was not availed to the assessor regarding the health policies and program-mes implemented between 1991 and 2004. But the DELTASEEDS for 2005-2007 contained health policy objectives, targets and strategies, the basis of which program-mes such as the Free Maternal Healthcare Programme (FMHCP), the Free Under-5 Healthcare Programme, (FU-5HP) the Free Rural Healthcare Scheme (RHS), HIV & AIDS, TB and malaria programmes were designed and implemented. The key program-mes/interventions on which information is available are outlined in Box 4.1 while brief elaborations are provided as follows.
Programmes Implemented by the State Ministry of Health
The State Ministry of Health implemented a number of programmes among which are the following:
! Child survival programmes
To increase child survival rate and reduce child mortality, the State implemented the following priority interventions: (i) Routine immunization, and special campaigns for measles and polio immunization; (ii) Nutrition; and (iii) Diagnosis and treatment of the common conditions such as diarrhoea, respiratory infections, malaria and helmi-nthic infections. In May 2010, the government launched the Free under-5 Healthcare Scheme, which provides diagnostic and treatment services free of charge to children under five years of age attending secondary health facilities. Apart from the management of immunization and tuberculosis, which is provided free of charge at the Primary Healthcare Centres, the rest of the services are still being provided at full cost recovery. Prior to 2010, most of the maternal and
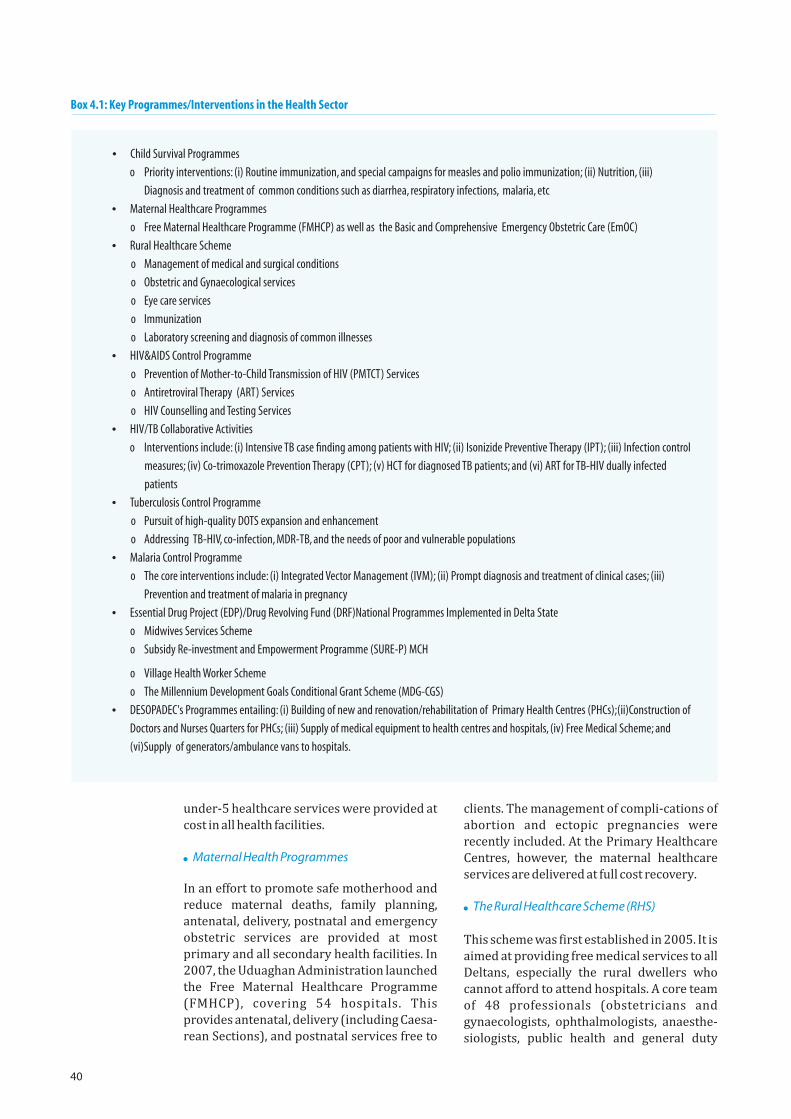
40
under-5 healthcare services were provided at cost in all health facilities.
! Maternal Health Programmes
In an effort to promote safe motherhood and reduce maternal deaths, family planning, antenatal, delivery, postnatal and emergency obstetric services are provided at most primary and all secondary health facilities. In 2007, the Uduaghan Administration launched the Free Maternal Healthcare Programme (FMHCP), covering 54 hospitals. This provides antenatal, delivery (including Caesa-rean Sections), and postnatal services free to
clients. The management of compli-cations of abortion and ectopic pregnancies were recently included. At the Primary Healthcare Centres, however, the maternal healthcare services are delivered at full cost recovery.
! The Rural Healthcare Scheme (RHS)
This scheme was first established in 2005. It is aimed at providing free medical services to all Deltans, especially the rural dwellers who cannot afford to attend hospitals. A core team of 48 professionals (obstetricians and gynaecologists, ophthalmologists, anaesthe-siologists, public health and general duty
Ÿ Child Survival Programmes
o Priority interventions: (i) Routine immunization, and special campaigns for measles and polio immunization; (ii) Nutrition, (iii)
Diagnosis and treatment of common conditions such as diarrhea, respiratory infections, malaria, etc
Ÿ Maternal Healthcare Programmes
o Free Maternal Healthcare Programme (FMHCP) as well as the Basic and Comprehensive Emergency Obstetric Care (EmOC)
Ÿ Rural Healthcare Scheme
o Management of medical and surgical conditions
o Obstetric and Gynaecological services
o Eye care services
o Immunization
o Laboratory screening and diagnosis of common illnesses
Ÿ HIV&AIDS Control Programme
o Prevention of Mother-to-Child Transmission of HIV (PMTCT) Services
o Antiretroviral Therapy (ART) Services
o HIV Counselling and Testing Services
Ÿ HIV/TB Collaborative Activities
o Interventions include: (i) Intensive TB case finding among patients with HIV; (ii) Isonizide Preventive Therapy (IPT); (iii) Infection control
measures; (iv) Co-trimoxazole Prevention Therapy (CPT); (v) HCT for diagnosed TB patients; and (vi) ART for TB-HIV dually infected
patients
Ÿ Tuberculosis Control Programme
o Pursuit of high-quality DOTS expansion and enhancement
o Addressing TB-HIV, co-infection, MDR-TB, and the needs of poor and vulnerable populations
Ÿ Malaria Control Programme
o The core interventions include: (i) Integrated Vector Management (IVM); (ii) Prompt diagnosis and treatment of clinical cases; (iii)
Prevention and treatment of malaria in pregnancy
Ÿ Essential Drug Project (EDP)/Drug Revolving Fund (DRF)National Programmes Implemented in Delta State
o Midwives Services Scheme
o Subsidy Re-investment and Empowerment Programme (SURE-P) MCH
o Village Health Worker Scheme
o The Millennium Development Goals Conditional Grant Scheme (MDG-CGS)
Ÿ DESOPADEC's Programmes entailing: (i) Building of new and renovation/rehabilitation of Primary Health Centres (PHCs);(ii)Construction of
Doctors and Nurses Quarters for PHCs; (iii) Supply of medical equipment to health centres and hospitals, (iv) Free Medical Scheme; and
(vi)Supply of generators/ambulance vans to hospitals.
Box 4.1: Key Programmes/Interventions in the Health Sector
41
medical officers) and an ad-hoc team of 10-15 personnel visit each community once every year, offering services such as laboratory testing, HIV screening, and diagnosis and treatment of common illnesses. General medical practice as well as specialist care including surgery are also offered free of charge to patients. By 2011 the scheme was expanded to include immunization and dental care.
! HIV & AIDS control programme
The State Action Committee on HIV & AIDS (SACA) was established in 2004 to coordinate a multi-sectoral response to the HIV & AIDS epidemic in the State. The health sector response to HIV & AIDS is coordinated by SMoH through the State AIDS and STI Control Programme (SASCP). The response consists of the following measures: (i) Developing and implementing a state policy on HIV & AIDS; (ii) Reducing HIV-related stigma and discrimination; (iii) Providing voluntary counselling and testing services, and undertaking awareness campaigns; (iv) Improving blood transfusion service; (v) Procuring and administering ARVs to eligible patients at subsidized cost; (vi) Preventing mother-to-child transmission; (vii) Providing post-exposure prophylaxis to health workers; and (viii) Building the capacity of health workers.
! Prevention of Mother-to-Child transmission of HIV services
In line with the global target of eliminating the transmission of HIV from mother to child by 2015, the National PMTCT Scale Up Plan (2010-2015) has the target of eliminating mother-to-child transmission of HIV by 2015. The scale up of PMTCT services has similarly been given prominence in Delta State SACA and SASCP, with support from PeTR-GS.
! Antiretroviral Therapy (ART) Services
Currently there are 94 ART sites in Delta State.
! HIV Counselling and Testing (HCT) services
This service is available for individuals who voluntarily wish to know their sero-status, and compulsory for all pregnant women booking at antenatal clinics and patients
diagnosed with tuberculosis.
! HIV/TB Collaborative Activities
Interventions in this area include: (i) Intensive TB case finding among patients with HIV, by screening for clinical symptoms, and undertaking Chest X-ray and GeneXpert. Patients diagnosed with active TB are referred to the TB clinic for treatment while those free of active TB are initiated on DOTS treatment; (ii) Isonizide Preventive Therapy (IPT); (iii) Taking of infection control measures to prevent nosocomial infection in all clinical settings in Delta State as well as environmental measures to improve ventil-ation in TB wards and clinics; (iv) Admini-stration of Co-trimoxazole Prevention Therapy (CPT) to all patients dually infected with TB and HIV; (v) Referring of dually infected patients for initiation of ART; (vi) Screening of all patients diagnosed with TB for HIV. Thus, HIV counselling and testing is conducted in all DOTS clinics either on-site or by referral.
! Tuberculosis control programme
The Stop TB strategy that is adopted by the National TB Control Programme has the following targets: (i) Halt and begin to reverse the incidence of TB by 2015; (ii) Reduce prevalence and deaths due to TB by 50 per cent compared with a baseline of 1990; and, by 2050, eliminate TB as a public health problem. Out of the components of this strategy, Delta State has implemented the following: Directly Observed Therapy Short-course (DOTS) Expansion Multidrug Resistant TB (MDR-TB) and TB/HIV collab-orative activities.
! Malaria control programme
Malaria is the commonest reason for out-patient consultation in Delta State health facilities. The State has been carrying out malaria control interventions in line with the Federal Ministry of Health's strategy that aims to reduce the number of cases and deaths from malaria by 75 per cent by 2015 in the context of the long-term vision of a malaria free Nigeria. The core interventions include:
! Long-Lasting Insecticide Net (LLINs) Distribution through: (i) Campaigns for
42
mass distribution of Long-Lasting Insecticide Nets (LLINs) since April 2013; (ii) Provision of LLINs to pregnant women and under-5 children attending clinics at health facilities; and (iii) the private sector.
! Indoor Residual Spraying. This is not carried out to any appreciable extent in the State.
! Malaria Case Management. Artemisinin-based combination therapies (ACTs) were first distributed in public-sector health facilities in Delta State in 2006. The provision of subsidized ACTs by the private sector began in 2008. Rapid Diagnosis Tests (RDTs) were introduced in 2011 and are still being rolled out.
! Essential Drug Project (EDP)/Drug Revolving Fund (DRF)
The Essential Drugs Project (EDP) was implemented in Delta State with support from World Bank up to 2009. The aim of the programme was to ensure the availability of safe and effective drugs and other pharmac-euticals required by the State and Local Government-owned health facilities at reasonable cost and on a continuous basis. At the end of the project duration in 2009, the state government took over the programme and changed its name to the Drug Revolving Fund (DRF).
The arrangement was to provide health facilities with seed drugs and pharmace-uticals to be sold to patients at full cost in order to sustain subsequent purchases from the State DRF. To date, the Secondary Health Facilities have continued to procure their drugs and pharmaceutical supplies from the State DRF. The PHCs, however, have stopped sourcing their supplies from the State DRF, resorting to LGA or Facility-based DRF instead.
The State is preparing to change to the new Drug Distribution System in line with the Guidelines of the Federal Ministry of Health. In the new system, the State Drug Distribution Centres will procure drugs only from registered manufacturers and providers.
National Programmes Implemented in Delta State
There are four federal programmes adopted
in and co-implemented by Delta State Government. These include: (i) The Midwives Service Scheme (MSS); (ii) The Subsidy Re-investment and Empowerment Programme (SURE-P); The MCH; (iii) The Village Health Worker Scheme; and (iv) The Millennium Development Goals Conditional Grant Scheme. They are further elaborated on below:
! Midwives Service Scheme (MSS) The National Primary Health Care Develop-ment Agency (NPHCDA) established the Midwives Service Scheme (MSS) in 2009 as a collaborative effort between the three tiers of government in Nigeria. All three tiers of government fulfil their agreed roles and responsibilities through a signed memor-andum. Delta State signed the memorandum and has been co-implementing the scheme since 2012. Under the scheme, midwives, including those newly qualified, unemployed and retired, are employed and deployed to selected PHCs in rural communities. The aim is to facilitate an increase in the coverage of Skilled Birth Attendance (SBA) to reduce maternal, newborn and child mortality. Twenty four PHCs in Delta State are involved in the MSS.
! Subsidy Re-investment and Empowerment Programme (SURE-P) MCH
The programme, which is initiated by the federal government, is designed to include supply- and demand-side interventions. On the supply side, each PHC receives a full complement of skilled health workers, basic commodities, equipment and refurbishment of infrastructure. On the demand side, health promotion and education are to be intensified through campaigns at the national, state and local government levels. The Ward Develop-ment Committees (WDCs) are being activated to boost community engagement in decision-making. Conditional Cash Transfers (CCT) would address the indirect costs of care seeking that may partially contribute to the low demand for ANC and delivery services at the PHCs. The SURE-P MCH is designed to run for four years (2012-2015). In Delta State, 47 PHCs are involved in the implementation of the SURE-P. Each of the 11 LGAs implementing the programme has four facilities while one LGA has three facilities.
43
Delta State has implemented the supply side of the programme, including employment and training of personnel for the facilities; infrastructural upgrading of the facilities; and provision of essential obstetric equipment. The demand side has yet to start.
! The Village Health Worker Scheme
The Scheme started in 2011 under the coordination of the Office of the Senior Special Assistant to the President on MDGs (OSSAP-MDGs). Delta State has seven out of 148 LGAs countrywide currently benefiting from the Scheme. They are: Ukwani, Ethiope West, Warri South-West, Ndokwa East, Udu, Bomadi and Burutu. A total of 100 Village Health Workers have been selected, trained and deployed to these communities.
! The Millennium Development Goals Conditional Grant Scheme (MDG-CGS)
This scheme started in 2007 at the federal level. However, Delta State started receiving funding from 2008. Under the scheme, Delta State mobilizes its own share of the federal and state counterpart funding to carry out interventions pertaining to health MDGs. Thus by December 2013, the following projects had been accomplished in Delta State: (i) Construction of 50 PHCs, 50 maternity wards, 50 staff quarters, four solar-powered boreholes, and toilets in five facilities; (ii) Distribution of 40,000 delivery packs; (iii) Provision of 25 units of gender-friendly squat toilets; (iv) Distribution of 400,000 LLINs, 666,732 doses of Sulfadox-ine/Pyremethamine (SP) and Artemisinin Combination Therapy (ACTs) for malaria prevention and treatment in pregnant women; and (v) Supply of 171 Essential Obstetric Care (EOC) equipment.
The Delta State Oil Producing Areas Development Commission (DESOPADEC) Health Programme
As observed in Chapter 2, DESOPADEC has the mandate to use 50 per cent of the 13 per cent oil derivation funds accruing to Delta State for:
! Rehabilitating and developing oil producing areas; and
! Embarking on other development projects as may be determined from time
to time by the Commission.
The Commission's interventions in the health sector have included: (i) Building of PHCs; Renovating PHCs; (ii) Building Doctors and Nurses Quarters for PHCs; (iii) Supplying medical equipment to health centres and hospitals; (iv) Running a Free Medical Scheme which includes consultation, treatment, drugs and surgery; and (vi) Supplying generators and ambulance vans to hospitals.It is easy to observe from these interventions that the health programmes implemented by the state government are relevant to the needs of the citizenry, especially the poor and vulnerable segments of the population. And they all have the potential to enhance access to health services. The scope of some of them may need to be extended, for example, the Free Maternal Healthcare Programme and Free Under-5 Healthcare Scheme, to cover service users at the PHCs.
Resource Allocation to Finance Agreed Priorities
The government, through the State Ministry of Health, MDG-CGS and DESOPADEC, has been funding the health sector program-mes/interventions and projects with a degree of success. The intervention of each of these institutions is briefly profiled for better appreciation.
SMoH Financing
The data on budget allocation and expend-iture on health made available to the assessment team covered 2006-2013 (see Table 4.1). The funds released to SMoH for 2011 exceeded the approved budget for that year.
The proportion of the state budget allocated to the health sector varied between 3 per cent and 8.2 per cent over the period, 2006 - 2011, with 2009 being its lowest point and 2012 its highest . On examining the proportion of the budget actually disbursed, two exceptions are noted: in 2006 almost 100 per cent of the approved budget was released, while in 2011 the disbursement exceeded the approved budget by 69 per cent. For the rest of the period, the disbursement has varied from as low as 40 per cent in 2009 to 76 per cent in 2006. The budgetary allocations to the health
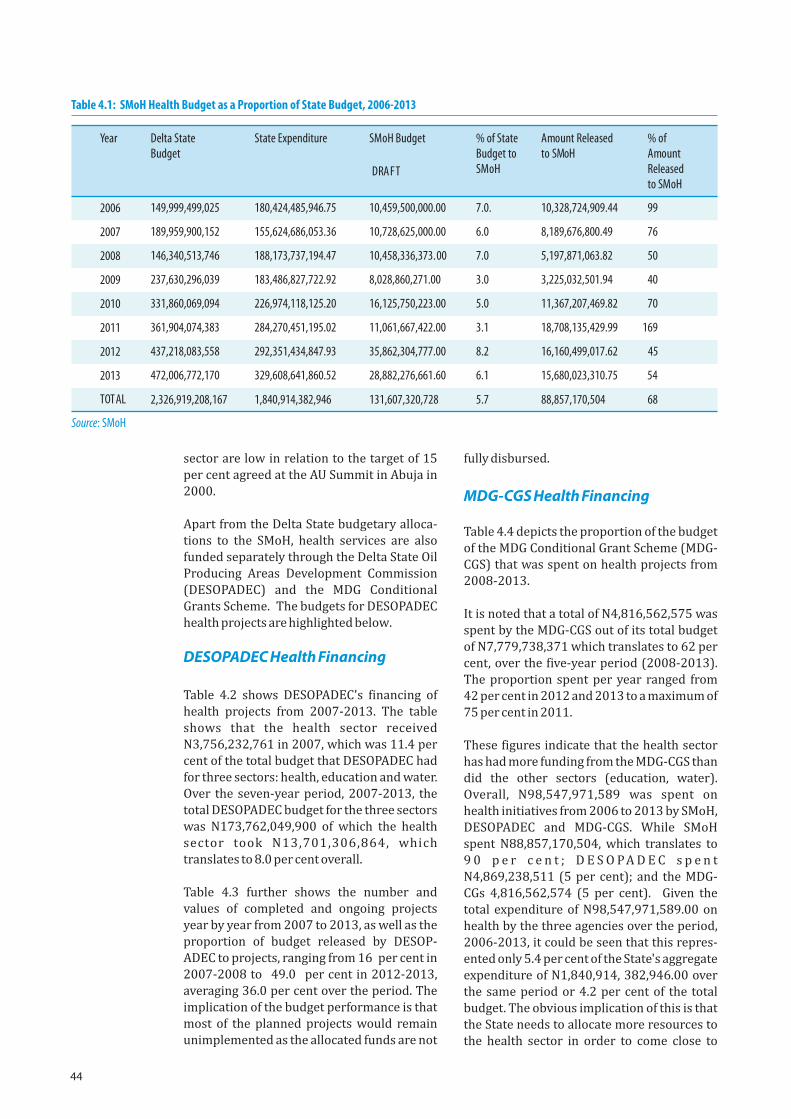
44
sector are low in relation to the target of 15 per cent agreed at the AU Summit in Abuja in 2000.
Apart from the Delta State budgetary alloca-tions to the SMoH, health services are also funded separately through the Delta State Oil Producing Areas Development Commission (DESOPADEC) and the MDG Conditional Grants Scheme. The budgets for DESOPADEC health projects are highlighted below.
DESOPADEC Health Financing
Table 4.2 shows DESOPADEC's financing of health projects from 2007-2013. The table shows that the health sector received N3,756,232,761 in 2007, which was 11.4 per cent of the total budget that DESOPADEC had for three sectors: health, education and water. Over the seven-year period, 2007-2013, the total DESOPADEC budget for the three sectors was N173,762,049,900 of which the health sector took N13,701,306,864, which translates to 8.0 per cent overall.
Table 4.3 further shows the number and values of completed and ongoing projects year by year from 2007 to 2013, as well as the proportion of budget released by DESOP-ADEC to projects, ranging from 16 per cent in 2007-2008 to 49.0 per cent in 2012-2013, averaging 36.0 per cent over the period. The implication of the budget performance is that most of the planned projects would remain unimplemented as the allocated funds are not
fully disbursed.
MDG-CGS Health Financing
Table 4.4 depicts the proportion of the budget of the MDG Conditional Grant Scheme (MDG-CGS) that was spent on health projects from 2008-2013.
It is noted that a total of N4,816,562,575 was spent by the MDG-CGS out of its total budget of N7,779,738,371 which translates to 62 per cent, over the five-year period (2008-2013). The proportion spent per year ranged from 42 per cent in 2012 and 2013 to a maximum of 75 per cent in 2011.
These figures indicate that the health sector has had more funding from the MDG-CGS than did the other sectors (education, water). Overall, N98,547,971,589 was spent on health initiatives from 2006 to 2013 by SMoH, DESOPADEC and MDG-CGS. While SMoH spent N88,857,170,504, which translates to 9 0 p e r c e n t ; D E S O PA D E C s p e n t N4,869,238,511 (5 per cent); and the MDG-CGs 4,816,562,574 (5 per cent). Given the total expenditure of N98,547,971,589.00 on health by the three agencies over the period, 2006-2013, it could be seen that this repres-ented only 5.4 per cent of the State's aggregate expenditure of N1,840,914, 382,946.00 over the same period or 4.2 per cent of the total budget. The obvious implication of this is that the State needs to allocate more resources to the health sector in order to come close to
DRAFT
Year Delta State Budget
State Expenditure SMoH Budget % of State Budget to SMoH
Amount Released to SMoH
% of Amount Released to SMoH
2006 149,999,499,025 180,424,485,946.75 10,459,500,000.00 7.0. 10,328,724,909.44 99
2007 189,959,900,152 155,624,686,053.36 10,728,625,000.00 6.0 8,189,676,800.49 76
2008 146,340,513,746 188,173,737,194.47 10,458,336,373.00 7.0 5,197,871,063.82 50
2009 237,630,296,039 183,486,827,722.92 8,028,860,271.00 3.0 3,225,032,501.94 40
2010 331,860,069,094 226,974,118,125.20 16,125,750,223.00 5.0 11,367,207,469.82 70
2011 361,904,074,383 284,270,451,195.02 11,061,667,422.00 3.1 18,708,135,429.99 169
2012 437,218,083,558 292,351,434,847.93 35,862,304,777.00 8.2 16,160,499,017.62 45
2013 472,006,772,170 329,608,641,860.52 28,882,276,661.60 6.1 15,680,023,310.75 54
TOTAL 2,326,919,208,167 1,840,914,382,946 131,607,320,728 5.7 88,857,170,504 68
Source: SMoH
Table 4.1: SMoH Health Budget as a Proportion of State Budget, 2006-2013
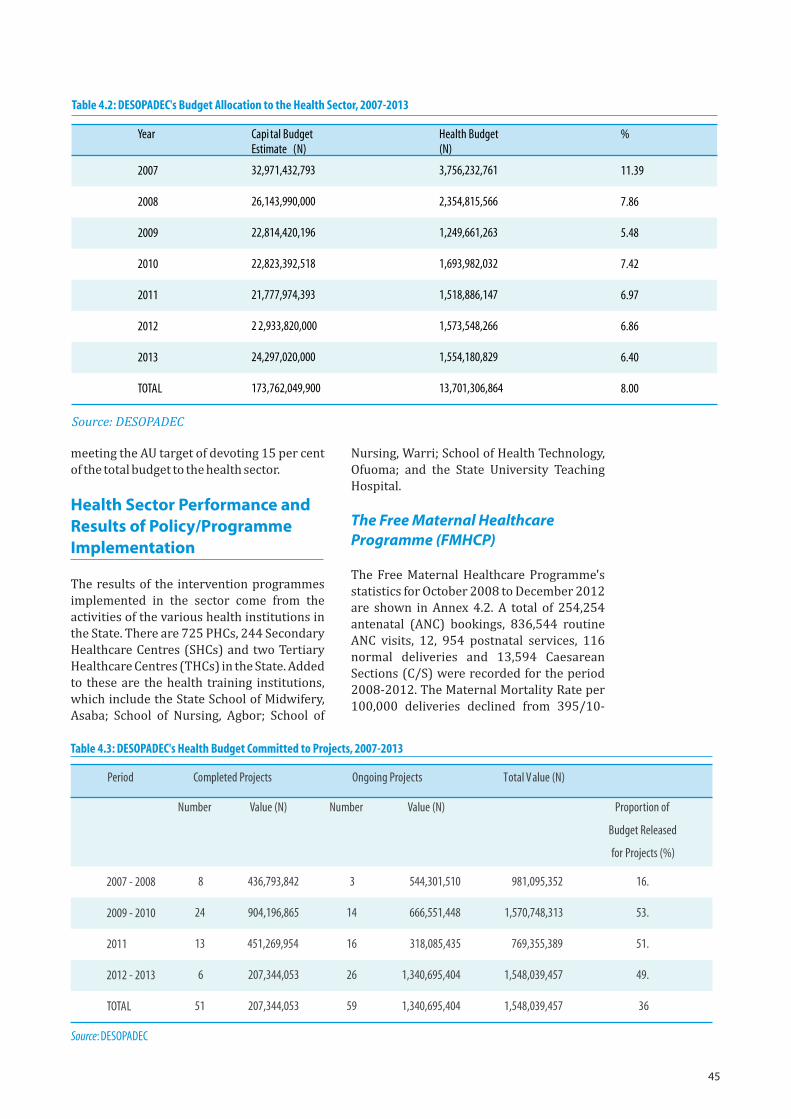
45
meeting the AU target of devoting 15 per cent of the total budget to the health sector.
Health Sector Performance and Results of Policy/Programme Implementation
The results of the intervention programmes implemented in the sector come from the activities of the various health institutions in the State. There are 725 PHCs, 244 Secondary Healthcare Centres (SHCs) and two Tertiary Healthcare Centres (THCs) in the State. Added to these are the health training institutions, which include the State School of Midwifery, Asaba; School of Nursing, Agbor; School of
Nursing, Warri; School of Health Technology, Ofuoma; and the State University Teaching Hospital.
The Free Maternal Healthcare Programme (FMHCP)
The Free Maternal Healthcare Programme's statistics for October 2008 to December 2012 are shown in Annex 4.2. A total of 254,254 antenatal (ANC) bookings, 836,544 routine ANC visits, 12, 954 postnatal services, 116 normal deliveries and 13,594 Caesarean Sections (C/S) were recorded for the period 2008-2012. The Maternal Mortality Rate per 100,000 deliveries declined from 395/10-
Table 4.3: DESOPADEC's Health Budget Committed to Projects, 2007-2013
Source: DESOPADEC
Period Completed Projects Ongoing Projects Total Value (N)
Number Value (N) Number Value (N) Proportion of
Budget Released
for Projects (%)
2007 - 2008 8 436,793,842 3 544,301,510 981,095,352 16.
2009 - 2010 24 904,196,865 14 666,551,448 1,570,748,313 53.
2011 13 451,269,954 16 318,085,435 769,355,389 51.
2012 - 2013 6 207,344,053 26 1,340,695,404 1,548,039,457 49.
TOTAL 51 207,344,053 59 1,340,695,404 1,548,039,457 36
Table 4.2: DESOPADEC's Budget Allocation to the Health Sector, 2007-2013
Year Capi tal Budget Estimate (N)
Health Budget (N)
%
2007 32,971,432,793 3,756,232,761 11.39
2008 26,143,990,000 2,354,815,566 7.86
2009 22,814,420,196 1,249,661,263 5.48
2010 22,823,392,518 1,693,982,032 7.42
2011 21,777,974,393 1,518,886,147 6.97
2012 2 2,933,820,000 1,573,548,266 6.86
2013 24,297,020,000 1,554,180,829 6.40
TOTAL 173,762,049,900 13,701,306,864 8.00
Source: DESOPADEC
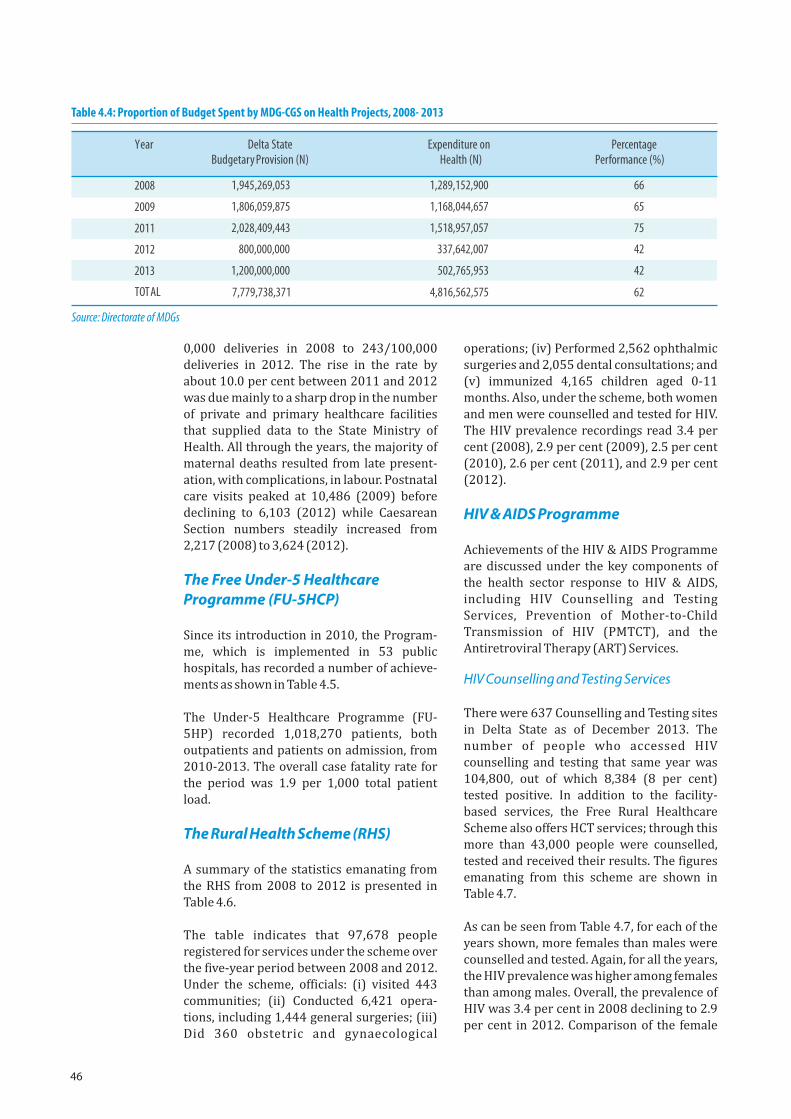
46
0,000 deliveries in 2008 to 243/100,000 deliveries in 2012. The rise in the rate by about 10.0 per cent between 2011 and 2012 was due mainly to a sharp drop in the number of private and primary healthcare facilities that supplied data to the State Ministry of Health. All through the years, the majority of maternal deaths resulted from late present-ation, with complications, in labour. Postnatal care visits peaked at 10,486 (2009) before declining to 6,103 (2012) while Caesarean Section numbers steadily increased from 2,217 (2008) to 3,624 (2012).
The Free Under-5 Healthcare Programme (FU-5HCP)
Since its introduction in 2010, the Program-me, which is implemented in 53 public hospitals, has recorded a number of achieve-ments as shown in Table 4.5.
The Under-5 Healthcare Programme (FU-5HP) recorded 1,018,270 patients, both outpatients and patients on admission, from 2010-2013. The overall case fatality rate for the period was 1.9 per 1,000 total patient load.
The Rural Health Scheme (RHS)
A summary of the statistics emanating from the RHS from 2008 to 2012 is presented in Table 4.6.
The table indicates that 97,678 people registered for services under the scheme over the five-year period between 2008 and 2012. Under the scheme, officials: (i) visited 443 communities; (ii) Conducted 6,421 opera-tions, including 1,444 general surgeries; (iii) Did 360 obstetric and gynaecological
operations; (iv) Performed 2,562 ophthalmic surgeries and 2,055 dental consultations; and (v) immunized 4,165 children aged 0-11 months. Also, under the scheme, both women and men were counselled and tested for HIV. The HIV prevalence recordings read 3.4 per cent (2008), 2.9 per cent (2009), 2.5 per cent (2010), 2.6 per cent (2011), and 2.9 per cent (2012).
HIV & AIDS Programme
Achievements of the HIV & AIDS Programme are discussed under the key components of the health sector response to HIV & AIDS, including HIV Counselling and Testing Services, Prevention of Mother-to-Child Transmission of HIV (PMTCT), and the Antiretroviral Therapy (ART) Services.
HIV Counselling and Testing Services
There were 637 Counselling and Testing sites in Delta State as of December 2013. The number of people who accessed HIV counselling and testing that same year was 104,800, out of which 8,384 (8 per cent) tested positive. In addition to the facility-based services, the Free Rural Healthcare Scheme also offers HCT services; through this more than 43,000 people were counselled, tested and received their results. The figures emanating from this scheme are shown in Table 4.7.
As can be seen from Table 4.7, for each of the years shown, more females than males were counselled and tested. Again, for all the years, the HIV prevalence was higher among females than among males. Overall, the prevalence of HIV was 3.4 per cent in 2008 declining to 2.9 per cent in 2012. Comparison of the female
Table 4.4: Proportion of Budget Spent by MDG-CGS on Health Projects, 2008- 2013
Year Delta State Budgetary Provision (N)
Expenditure on Health (N)
Percentage Performance (%)
2008 1,945,269,053 1,289,152,900 66
2009 1,806,059,875 1,168,044,657 65
2011 2,028,409,443 1,518,957,057 75
2012 800,000,000 337,642,007 42
2013 1,200,000,000 502,765,953 42
TOTAL 7,779,738,371 4,816,562,575 62
Source: Directorate of MDGs
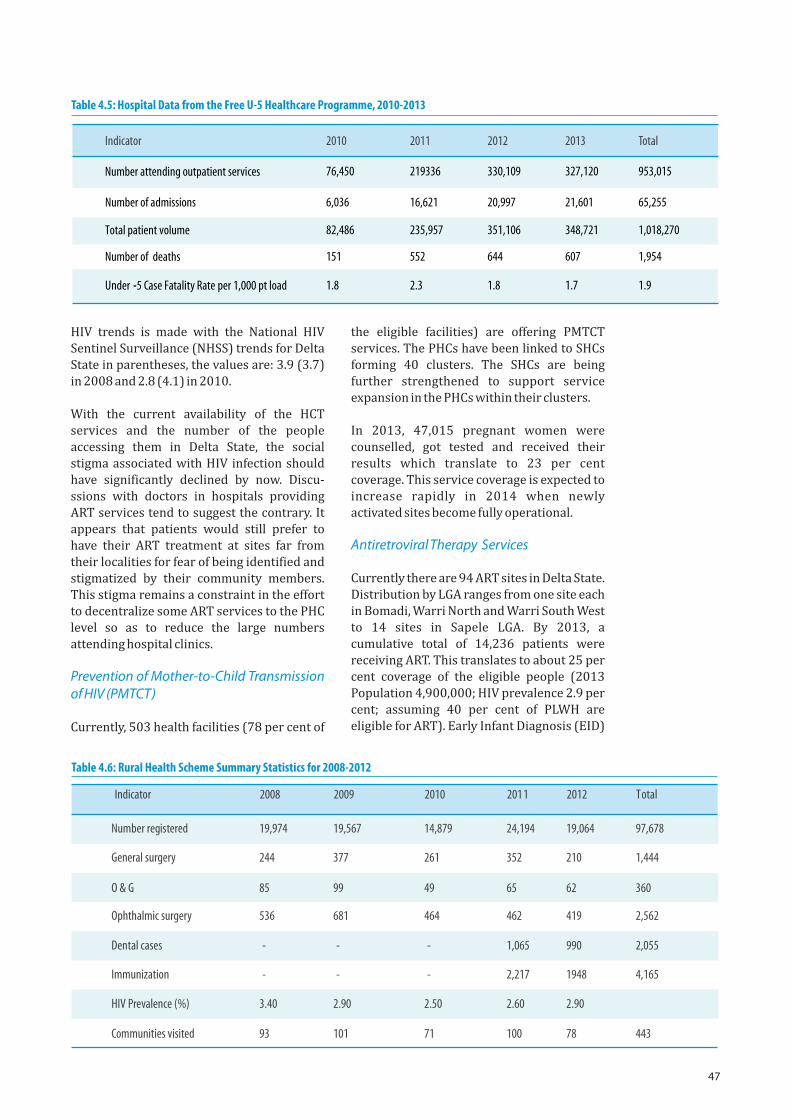
47
HIV trends is made with the National HIV Sentinel Surveillance (NHSS) trends for Delta State in parentheses, the values are: 3.9 (3.7) in 2008 and 2.8 (4.1) in 2010.
With the current availability of the HCT services and the number of the people accessing them in Delta State, the social stigma associated with HIV infection should have significantly declined by now. Discu-ssions with doctors in hospitals providing ART services tend to suggest the contrary. It appears that patients would still prefer to have their ART treatment at sites far from their localities for fear of being identified and stigmatized by their community members. This stigma remains a constraint in the effort to decentralize some ART services to the PHC level so as to reduce the large numbers attending hospital clinics.
Prevention of Mother-to-Child Transmission of HIV (PMTCT)
Currently, 503 health facilities (78 per cent of
the eligible facilities) are offering PMTCT services. The PHCs have been linked to SHCs forming 40 clusters. The SHCs are being further strengthened to support service expansion in the PHCs within their clusters.
In 2013, 47,015 pregnant women were counselled, got tested and received their results which translate to 23 per cent coverage. This service coverage is expected to increase rapidly in 2014 when newly activated sites become fully operational.
Antiretroviral Therapy Services
Currently there are 94 ART sites in Delta State. Distribution by LGA ranges from one site each in Bomadi, Warri North and Warri South West to 14 sites in Sapele LGA. By 2013, a cumulative total of 14,236 patients were receiving ART. This translates to about 25 per cent coverage of the eligible people (2013 Population 4,900,000; HIV prevalence 2.9 per cent; assuming 40 per cent of PLWH are eligible for ART). Early Infant Diagnosis (EID)
Indicator 2008 2009 2010 2011 2012 Total
Number registered 19,974 19,567 14,879 24,194 19,064 97,678
General surgery 244 377 261 352 210 1,444
O & G 85 99 49 65 62 360
Ophthalmic surgery 536 681 464 462 419 2,562
Dental cases - - - 1,065 990 2,055
Immunization - - - 2,217 1948 4,165
HIV Prevalence (%) 3.40 2.90 2.50 2.60 2.90
Communities visited 93 101 71 100 78 443
Table 4.6: Rural Health Scheme Summary Statistics for 2008-2012
Indicator 2010 2011 2012 2013 Total
Number attending outpatient services 76,450 219336 330,109 327,120 953,015
Number of admissions 6,036 16,621 20,997 21,601 65,255
Total patient volume 82,486 235,957 351,106 348,721 1,018,270
Number of deaths 151 552 644 607 1,954
Under -5 Case Fatality Rate per 1,000 pt load 1.8 2.3 1.8 1.7 1.9
Table 4.5: Hospital Data from the Free U-5 Healthcare Programme, 2010-2013
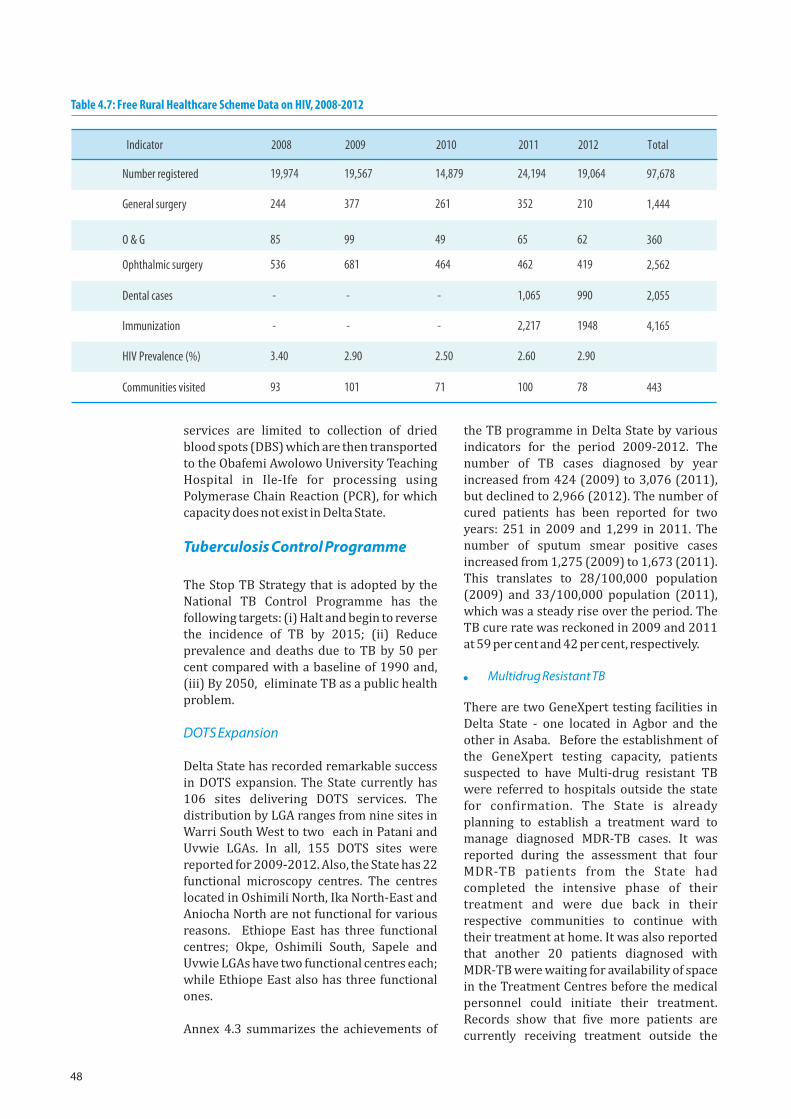
48
services are limited to collection of dried blood spots (DBS) which are then transported to the Obafemi Awolowo University Teaching Hospital in Ile-Ife for processing using Polymerase Chain Reaction (PCR), for which capacity does not exist in Delta State.
Tuberculosis Control Programme
The Stop TB Strategy that is adopted by the National TB Control Programme has the following targets: (i) Halt and begin to reverse the incidence of TB by 2015; (ii) Reduce prevalence and deaths due to TB by 50 per cent compared with a baseline of 1990 and, (iii) By 2050, eliminate TB as a public health problem.
DOTS Expansion
Delta State has recorded remarkable success in DOTS expansion. The State currently has 106 sites delivering DOTS services. The distribution by LGA ranges from nine sites in Warri South West to two each in Patani and Uvwie LGAs. In all, 155 DOTS sites were reported for 2009-2012. Also, the State has 22 functional microscopy centres. The centres located in Oshimili North, Ika North-East and Aniocha North are not functional for various reasons. Ethiope East has three functional centres; Okpe, Oshimili South, Sapele and Uvwie LGAs have two functional centres each; while Ethiope East also has three functional ones.
Annex 4.3 summarizes the achievements of
the TB programme in Delta State by various indicators for the period 2009-2012. The number of TB cases diagnosed by year increased from 424 (2009) to 3,076 (2011), but declined to 2,966 (2012). The number of cured patients has been reported for two years: 251 in 2009 and 1,299 in 2011. The number of sputum smear positive cases increased from 1,275 (2009) to 1,673 (2011). This translates to 28/100,000 population (2009) and 33/100,000 population (2011), which was a steady rise over the period. The TB cure rate was reckoned in 2009 and 2011 at 59 per cent and 42 per cent, respectively.
! Multidrug Resistant TB
There are two GeneXpert testing facilities in Delta State - one located in Agbor and the other in Asaba. Before the establishment of the GeneXpert testing capacity, patients suspected to have Multi-drug resistant TB were referred to hospitals outside the state for confirmation. The State is already planning to establish a treatment ward to manage diagnosed MDR-TB cases. It was reported during the assessment that four MDR-TB patients from the State had completed the intensive phase of their treatment and were due back in their respective communities to continue with their treatment at home. It was also reported that another 20 patients diagnosed with MDR-TB were waiting for availability of space in the Treatment Centres before the medical personnel could initiate their treatment. Records show that five more patients are currently receiving treatment outside the
Indicator 2008 2009 2010 2011 2012 Total
Number registered 19,974 19,567 14,879 24,194 19,064 97,678
General surgery 244 377 261 352 210 1,444
O & G 85 99 49 65 62 360
Ophthalmic surgery 536 681 464 462 419 2,562
Dental cases - - - 1,065 990 2,055
Immunization - - - 2,217 1948 4,165
HIV Prevalence (%) 3.40 2.90 2.50 2.60 2.90
Communities visited 93 101 71 100 78 443
Table 4.7: Free Rural Healthcare Scheme Data on HIV, 2008-2012
49
State, while one recently diagnosed patient has been put on the waiting list for referral.
Malaria Control Programme
The achievements under this programme are indicated below:
Long-Lasting Insecticide Net (LLIN) Distribution
Long-Lasting Insecticide Net (LLIN) distribution through campaigns to pregnant women and Under-5 children attending clinics and the private sector outlets has made LLINs available to households. In 2013, an LLIN Survey of Malaria Indicators in Delta State and the Malaria Indicator Survey (Delta State LLIN Report, 2013)revealed that:
! 65 per cent of households had at least one ITN;
! 47 per cent of persons of all ages had access to ITN;
! 28 per cent of persons of all ages slept under ITN the night prior to the survey; and
! 43 per cent of children under-5 slept under ITN the night prior to survey.
Artemisinin-Based Combination Therapies (ACTs)
Artemisinin-Based Combination Therapies (ACTs) have been administered through public and private sector health facilities in Delta State since 2006. Rapid diagnosis tests (RDTs) were introduced in 2011 and are still being rolled out. The 2013 Survey on ITN and other indicators revealed that 34 per cent of Under-5 children with fever were tested and given ACT within 24 hours (2013 Rapid Mobile-based Phone - RAMP-Survey ITN and Other Indicators).
The Delta State Strategic Health Development Programme (SSHDP), 2010-2015
The SSHDP Monitoring and Evaluation Framework have indicators with benchmarks for monitoring performance. Most of the indicators are in the Process and Output domains summarized in Annex 4.4. Below is an elaboration of the results achieved through the implementation of health interventions
under each of the eight Priority Areas.
Priority Area 1- Leadership and Governance for Health
One of the outcomes under this Priority Area is 'Strengthened accountability, transparency and responsiveness of the state health systems'. LGAs were supposed to establish Health Watch Groups whose role would be to assess the implementation of health interventions in their respective domains and provide feedback and recommendations to LGAs and SMoH. Findings during the assessment revealed that none of the LGAs has established Health Watch Groups. The only community-level groups linking the community to health services in the health facilities and facilitating community-level health promotion activities are the Ward Development Committees (WDCs) which are composed of community members who volunteer for community development.
Apart from facilitating health promotion activities in their respective communities, the WDCs are instrumental in creating demand for services in the PHCs. In a few instances, the WDCs contributed materially to effect minor repairs needed in their respective health facilities. Although their general feedback on the services provided is positive, there were complaints that the contents of the delivery kits distributed through the SURE-P and MSS were insufficient and inappropriate for women. They also reported that the infrastructural works undertaken in PHCs under the SURE-P are incomplete.
Priority Area 2- Health Service Delivery
This priority area has two outcomes, namely: (i) Universal availability and access to an essential package of primary health care services focusing, in particular, on vulnerable socio-economic groups and geographic areas; and (ii) Improved quality of primary health care services.
Based on the available 2012 Delta Statistical Digest which is compiled using routinely reported service data, two core indicators have been used to assess this priority area, namely:
! The number and distribution of health facilities per 10,000 population
50
! The number and distribution of hospital beds per 10,000 population.
Annex 4.4 summarizes the findings using these indicators for the State and by LGA. The state density of hospital beds was 6 per 10,000 population in 2012. The Table depicts wide variations between LGAs ranging from two hospital beds per 10,000 population (Oshimili South, Udu and Ughelli South LGAs) to 14 hospital beds per 10,000 (Ethiope East LGA). Eleven LGAs have a density lower than the state density.
On health facility density, the Table depicts 1.96 health facilities per 10,000 population. Again this ranges from 0.72/10,000 population (Warri North LGA) to 3.67/10,000 population (Uvwie LGA). Thirteen LGAs have a health facility density lower than that of the state. The minimum acceptable level is at least five emergency obstetric care facilities (including at least one comprehensive facility) for every 500, 000 population (WHO).
As indicated in Annex 4.2, the State PHC density is 244/10,000 population, ranging from 1 per 10,000 population in Okpe and Patani LGAs to 35 per 10,000 population in Uvwie LGAs.
Similarly, the density of State hospitals is 1.46 hospitals per 10,000, ranging from 0.6 per 10,000 to 2.97 per 10,000 population.
The distribution of the health facilities, there-fore, is far above the minimum acceptable levels. The assessment team was informed, however, that some PHCs were not function-ing according to expectation. One of the Urban Health Centres visited did not have a delivery room, although it was providing ANC services. Most need structural repairs, continuous running water and electricity. Beyond the structural requirements, the facilities need to be staffed adequately, equipped and regularly supplied with drugs and other consumables for optimal functioning.
Priority Area 3- Human Resource for Health
The goal of human resources for health is to implement strategies that would provide human resources for health needs in order to ensure availability, equity and quality of health care. To further this objective, the SMoH has established a Human Resource
Desk even though the State does not have a Human Resource Development Plan yet. The release of the guidelines from the FMoH will facilitate the development of the State HRH Plan.
Although no formal workload analysis has ever been conducted in Delta State, most Heads of Department in the health facilities visited in the course of the field work complained about the shortage of all catego-ries of health workers. Table 4.8 depicts the health worker-patient ratio for 2009 to 2012.
A comparison of the ratios with those at the federal level for 2012 indicates lower levels for Delta State for all the three categories of health workers.
The assessment team found that the staff working at PHCs were demotivated by irregular and delayed payment of salaries. In one PHC visited, the assessment team was informed that the staff had not received their January salary. Other challenges faced by staff include security concerns in some PHCs, and inadequate work tools. Supportive super-vision and training can help improve motiv-ation. Agencies at the State level (LG Service Commission and SPHCDA) conduct regular (at least monthly) supervisions to LGA Health Departments, but the LGA Health Department Officers supervise their LGAs irregularly.
Priority Area 4- Financing for Health
The goal of financing for health is to ensure that adequate and sustainable funds are available and allocated for accessible, affordable, efficient and equitable health care provision and consumption at local, state and federal levels. One of the two outcomes is that the Nigerian people, particularly the most vulnerable socio-economic population groups, are protected from financial catastrophe and impoverishment as a result of using health services.
The assessment revealed that contribution to the health insurance scheme is unpopular and facing resistance from civil servants in Delta State. Consequently, there is no pre-payment arrangement being implemented. The Professional Associations, however, are willing to work with the SMoH to mount a campaign to educate the general public about the merits of the fund pooling arrangement
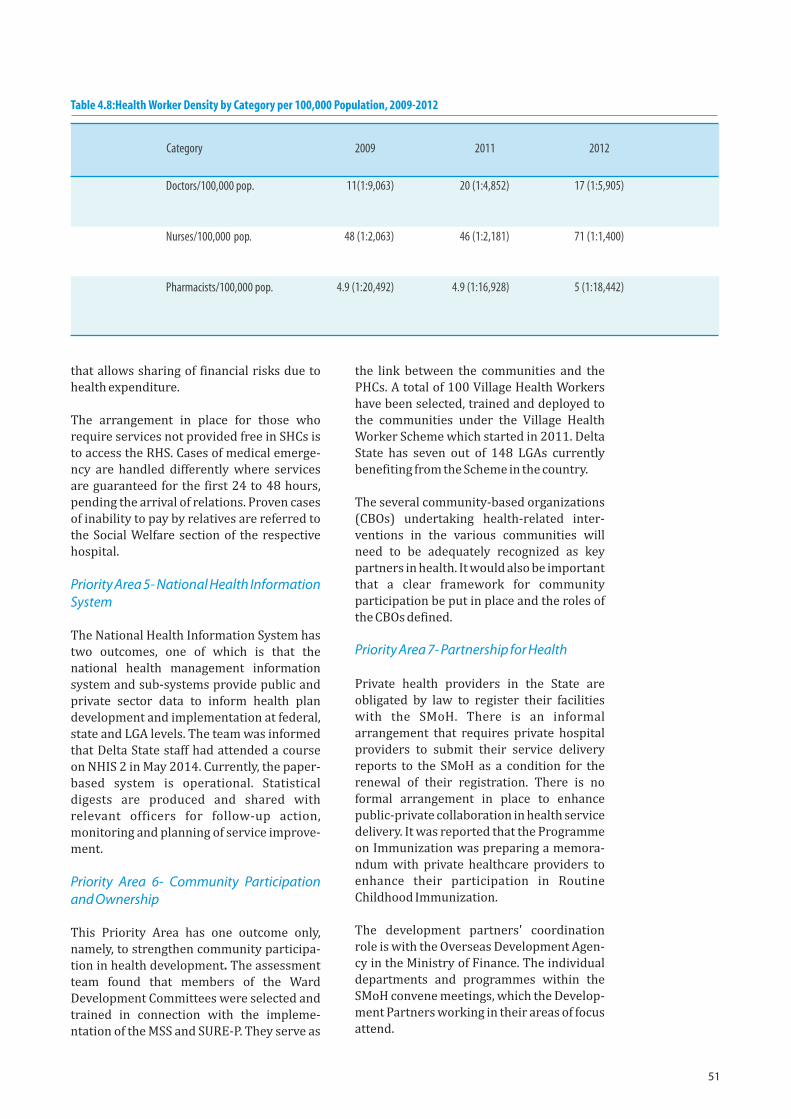
51
that allows sharing of financial risks due to health expenditure.
The arrangement in place for those who require services not provided free in SHCs is to access the RHS. Cases of medical emerge-ncy are handled differently where services are guaranteed for the first 24 to 48 hours, pending the arrival of relations. Proven cases of inability to pay by relatives are referred to the Social Welfare section of the respective hospital.
Priority Area 5- National Health Information System
The National Health Information System has two outcomes, one of which is that the national health management information system and sub-systems provide public and private sector data to inform health plan development and implementation at federal, state and LGA levels. The team was informed that Delta State staff had attended a course on NHIS 2 in May 2014. Currently, the paper-based system is operational. Statistical digests are produced and shared with relevant officers for follow-up action, monitoring and planning of service improve-ment.
Priority Area 6- Community Participation and Ownership
This Priority Area has one outcome only, namely, to strengthen community participa-tion in health development. The assessment team found that members of the Ward Development Committees were selected and trained in connection with the impleme-ntation of the MSS and SURE-P. They serve as
the link between the communities and the PHCs. A total of 100 Village Health Workers have been selected, trained and deployed to the communities under the Village Health Worker Scheme which started in 2011. Delta State has seven out of 148 LGAs currently benefiting from the Scheme in the country.
The several community-based organizations (CBOs) undertaking health-related inter-ventions in the various communities will need to be adequately recognized as key partners in health. It would also be important that a clear framework for community participation be put in place and the roles of the CBOs defined.
Priority Area 7- Partnership for Health
Private health providers in the State are obligated by law to register their facilities with the SMoH. There is an informal arrangement that requires private hospital providers to submit their service delivery reports to the SMoH as a condition for the renewal of their registration. There is no formal arrangement in place to enhance public-private collaboration in health service delivery. It was reported that the Programme on Immunization was preparing a memora-ndum with private healthcare providers to enhance their participation in Routine Childhood Immunization.
The development partners' coordination role is with the Overseas Development Agen-cy in the Ministry of Finance. The individual departments and programmes within the SMoH convene meetings, which the Develop-ment Partners working in their areas of focus attend.
Table 4.8: Health Worker Density by Category per 100,000 Population, 2009-2012
Category 2009 2011 2012
Doctors/100,000 pop. 11(1:9,063) 20 (1:4,852) 17 (1:5,905)
Nurses/100,000 pop. 48 (1:2,063) 46 (1:2,181) 71 (1:1,400)
Pharmacists/100,000 pop. 4.9 (1:20,492) 4.9 (1:16,928) 5 (1:18,442)
52
Priority Area 8 - Health Research
The assessment was not able to determine if any research-related activities were funded except those already reported under the HMIS.
Enabling Environment and Opportunities
A number of factors were responsible for the achievements made in the health sector. Among them are the following:
! Demonstrable high-level political comm-itment to health development
! Strong, committed and experienced health workforce made up of prof-essional and non-professional categories
! Provision of free health services by the State Government to pregnant women, Under-5 children and rural dwellers
! Existence of a network of health facilities both public and private
! Presence of agencies to facilitate effective execution of health activities
! Capacity building for LGA and State health workers
! Development Partners' support for the health sector
! Existing projects for rehabilitation of health facilities.
! Strong economic base for the State.
On the other hand, opportunities exist that could be harnessed for future improved performance of the health sector. These include:
! Staff enthusiasm and feeling of owner-ship of health programmes;
! Strong clinical capabilities! Large pool of trainable and trained man-
power ! Community leaders' willingness to lend
support! Existing economic possibilities in the
state;! Willingness of communities to embrace
health services! Willingness of donor partners to support
health programmes! A huge private sector presence ! Improved peace and security especially
in the riverine areas
Sectoral Performance in Relation to the MDGs and State Targets
Achievement of the health MDGs can better be tracked using agreed indicators for each goal. This is done in what follows.
Goal 4: Reduce child mortality by two-thirds of the 1990 level by 2015.
! Indicator 4.1 - Infant mortality rate: The Delta State values are: 48/1,000 live births (2003), 68/1,000 live births (2006), 32.3/1,000 live births (2011) and 37 per 1,000 live births (2012). The national baseline value (1990) is 91/1,000 live births while the target for this indicator is 30.3 per cent by 2015.
! Indicator 4.2 - Under-5 mortality rate: The rates are: 102 per 1,000 live births (2003), 54.4 per 1,000 live births (2006), 108 per 1,000 live births (2011) and 52 per 1,000 live births (2012). The national baseline value (1990) is 191/1,000 live births while target for is 63.7 per cent by 2015.
! Indicator 4.3 - Percentage of one-year-olds fully immunized against measles: The rates are 38.5 per cent (1999), 61.3 per cent (2008), 57.6 per cent (2012) and 60.4 per cent (2013).The national baseline value (1990) is 46 per cent while target is 100 per cent by 2015.
! It is noted that indicator 4.1 shows a downward trend, suggesting that Delta State could achieve the global target by 2015, while indicators 4.2 and 4.3 show no change.
Goal 5: Improve maternal health
Target 5A - reduce by three-quarters,
between 1990 and 2015, the maternal mortality ratio.The performance of Delta State under Target 5A is shown in Table 4.10.
! Indicator 5.1. There appears to be discrepancies on the maternal mortality rates available from UNFPA, State Ministry of Economic Planning and SMoH. Nevertheless, the rates in Table 4.10 and Annex 4.2 produced by the SMoH show consistent decline, excepting in 2012. The rates are 456 per 100,000 births (2005) and 188 per 100,000 live
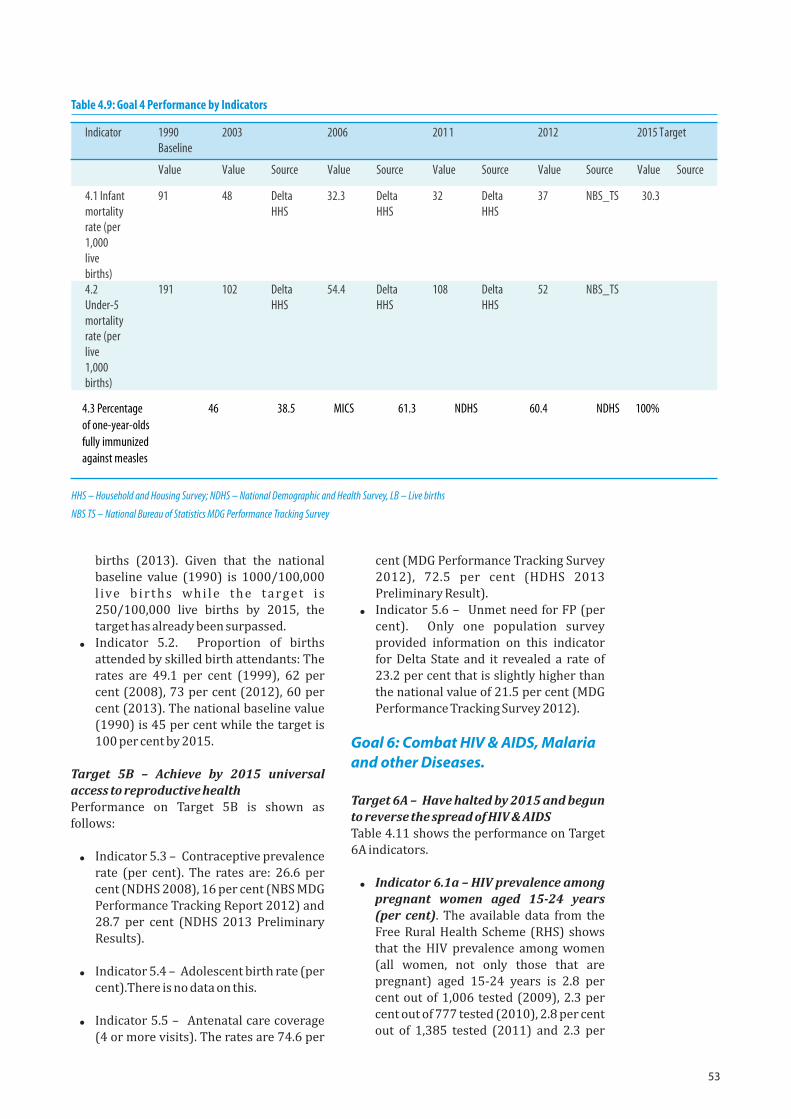
53
births (2013). Given that the national baseline value (1990) is 1000/100,000 l ive b i r t h s wh i l e t h e t a rg e t i s 250/100,000 live births by 2015, the target has already been surpassed.
! Indicator 5.2. Proportion of births attended by skilled birth attendants: The rates are 49.1 per cent (1999), 62 per cent (2008), 73 per cent (2012), 60 per cent (2013). The national baseline value (1990) is 45 per cent while the target is 100 per cent by 2015.
Target 5B – Achieve by 2015 universal access to reproductive healthPerformance on Target 5B is shown as follows:
! Indicator 5.3 – Contraceptive prevalence rate (per cent). The rates are: 26.6 per cent (NDHS 2008), 16 per cent (NBS MDG Performance Tracking Report 2012) and 28.7 per cent (NDHS 2013 Preliminary Results).
! Indicator 5.4 – Adolescent birth rate (per
cent).There is no data on this. ! Indicator 5.5 – Antenatal care coverage
(4 or more visits). The rates are 74.6 per
cent (MDG Performance Tracking Survey 2012), 72.5 per cent (HDHS 2013 Preliminary Result).
! Indicator 5.6 – Unmet need for FP (per cent). Only one population survey provided information on this indicator for Delta State and it revealed a rate of 23.2 per cent that is slightly higher than the national value of 21.5 per cent (MDG Performance Tracking Survey 2012).
Goal 6: Combat HIV & AIDS, Malaria and other Diseases.
Target 6A – Have halted by 2015 and begun to reverse the spread of HIV & AIDSTable 4.11 shows the performance on Target 6A indicators.
! Indicator 6.1a – HIV prevalence among pregnant women aged 15-24 years (per cent). The available data from the Free Rural Health Scheme (RHS) shows that the HIV prevalence among women (all women, not only those that are pregnant) aged 15-24 years is 2.8 per cent out of 1,006 tested (2009), 2.3 per cent out of 777 tested (2010), 2.8 per cent out of 1,385 tested (2011) and 2.3 per
HHS – Household and Housing Survey; NDHS – National Demographic and Health Survey, LB – Live births
NBS TS – National Bureau of Statistics MDG Performance Tracking Survey
Indicator 1990 Baseline
2003 2006 2011 2012 2015 Target
Value Value Source Value Source Value Source Value Source Value Source
4.1 Infant mortality rate (per 1,000 live births)
91 48 Delta HHS
32.3 Delta HHS
32 Delta HHS
37 NBS_TS 30.3
4.2 Under-5 mortality rate (per live 1,000 births)
191 102 Delta HHS
54.4 Delta HHS
108 Delta HHS
52 NBS_TS
Table 4.9: Goal 4 Performance by Indicators
4.3 Percentage of one-year-olds fully immunized against measles
46 38.5 MICS 61.3 NDHS 60.4 NDHS 100%
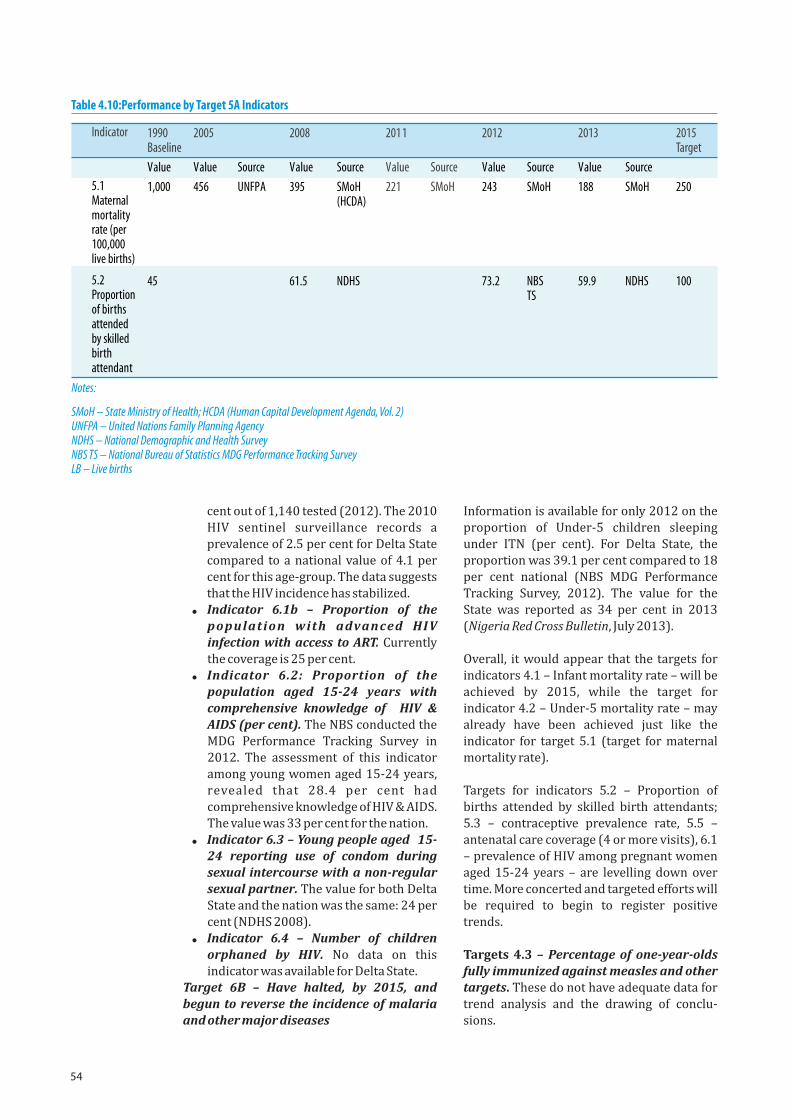
54
cent out of 1,140 tested (2012). The 2010 HIV sentinel surveillance records a prevalence of 2.5 per cent for Delta State compared to a national value of 4.1 per cent for this age-group. The data suggests that the HIV incidence has stabilized.
! Indicator 6.1b – Proportion of the population with advanced HIV infection with access to ART. Currently the coverage is 25 per cent.
! Indicator 6.2: Proportion of the population aged 15-24 years with comprehensive knowledge of HIV & AIDS (per cent). The NBS conducted the MDG Performance Tracking Survey in 2012. The assessment of this indicator among young women aged 15-24 years, revealed that 28.4 per cent had comprehensive knowledge of HIV & AIDS. The value was 33 per cent for the nation.
! Indicator 6.3 – Young people aged 15-24 reporting use of condom during sexual intercourse with a non-regular sexual partner. The value for both Delta State and the nation was the same: 24 per cent (NDHS 2008).
! Indicator 6.4 – Number of children orphaned by HIV. No data on this indicator was available for Delta State.
Target 6B – Have halted, by 2015, and begun to reverse the incidence of malaria and other major diseases
Information is available for only 2012 on the proportion of Under-5 children sleeping under ITN (per cent). For Delta State, the proportion was 39.1 per cent compared to 18 per cent national (NBS MDG Performance Tracking Survey, 2012). The value for the State was reported as 34 per cent in 2013 (Nigeria Red Cross Bulletin, July 2013).
Overall, it would appear that the targets for indicators 4.1 – Infant mortality rate – will be achieved by 2015, while the target for indicator 4.2 – Under-5 mortality rate – may already have been achieved just like the indicator for target 5.1 (target for maternal mortality rate).
Targets for indicators 5.2 – Proportion of births attended by skilled birth attendants; 5.3 – contraceptive prevalence rate, 5.5 – antenatal care coverage (4 or more visits), 6.1 – prevalence of HIV among pregnant women aged 15-24 years – are levelling down over time. More concerted and targeted efforts will be required to begin to register positive trends.
Targets 4.3 – Percentage of one-year-olds fully immunized against measles and other targets. These do not have adequate data for trend analysis and the drawing of conclu-sions.
Notes:
SMoH – State Ministry of Health; HCDA (Human Capital Development Agenda, Vol. 2)UNFPA – United Nations Family Planning AgencyNDHS – National Demographic and Health SurveyNBS TS – National Bureau of Statistics MDG Performance Tracking SurveyLB – Live births
Table 4.10:P erformance by Target 5A Indicators
Indicator
5.1 Maternal mortality rate (per 100,000 live births)
2011
221
Value
SMoH
Source
5.2 Proportion of births attended by skilled birth attendant
1990Baseline
1,000
Value
45
2005
456
Value
UNFPA
Source
2008
395
Value
61.5
SMoH(HCDA)
Source
NDHS
2012
243
Value
73.2
SMoH
Source
NBS TS
2013
188
Value
59.9
SMoH
Source
NDHS
2015 Target
250
100
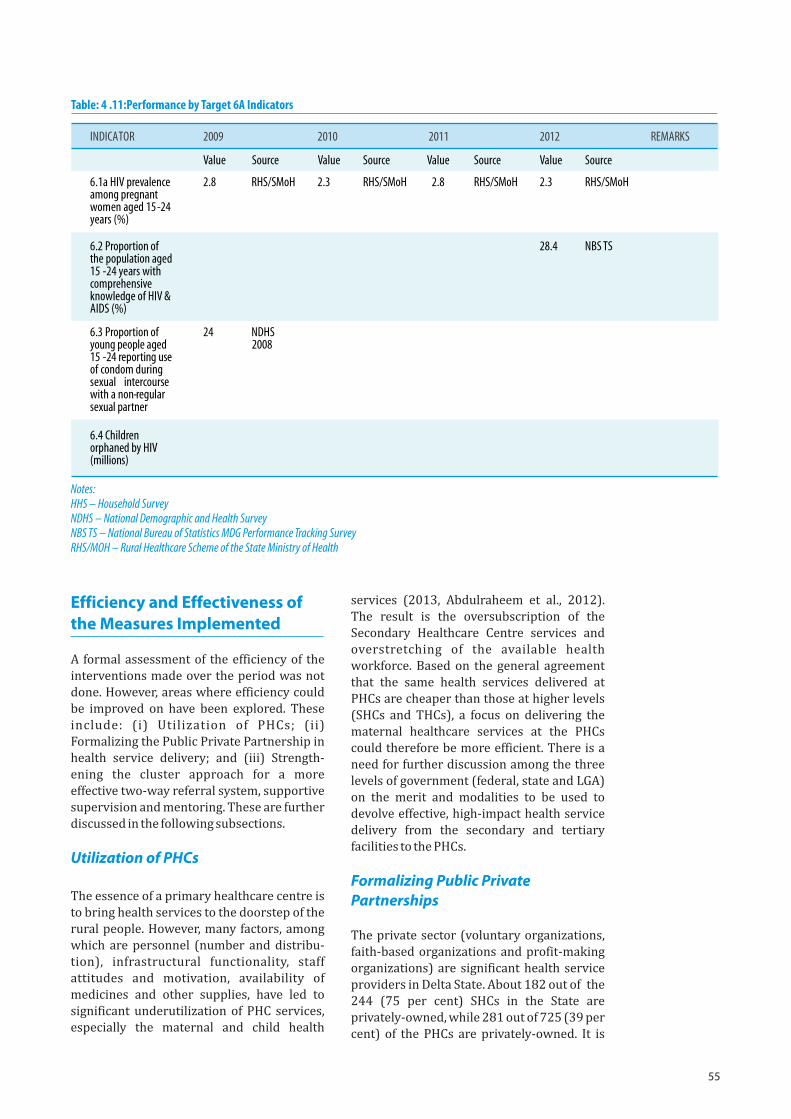
55
Efficiency and Effectiveness of the Measures Implemented
A formal assessment of the efficiency of the interventions made over the period was not done. However, areas where efficiency could be improved on have been explored. These include: (i) Utilization of PHCs; (ii) Formalizing the Public Private Partnership in health service delivery; and (iii) Strength-ening the cluster approach for a more effective two-way referral system, supportive supervision and mentoring. These are further discussed in the following subsections.
Utilization of PHCs
The essence of a primary healthcare centre is to bring health services to the doorstep of the rural people. However, many factors, among which are personnel (number and distribu-tion), infrastructural functionality, staff attitudes and motivation, availability of medicines and other supplies, have led to significant underutilization of PHC services, especially the maternal and child health
services (2013, Abdulraheem et al., 2012). The result is the oversubscription of the Secondary Healthcare Centre services and overstretching of the available health workforce. Based on the general agreement that the same health services delivered at PHCs are cheaper than those at higher levels (SHCs and THCs), a focus on delivering the maternal healthcare services at the PHCs could therefore be more efficient. There is a need for further discussion among the three levels of government (federal, state and LGA) on the merit and modalities to be used to devolve effective, high-impact health service delivery from the secondary and tertiary facilities to the PHCs.
Formalizing Public Private Partnerships
The private sector (voluntary organizations, faith-based organizations and profit-making organizations) are significant health service providers in Delta State. About 182 out of the 244 (75 per cent) SHCs in the State are privately-owned, while 281 out of 725 (39 per cent) of the PHCs are privately-owned. It is
Table: 4 .11:P erformance by Target 6A Indicators
INDICATOR 2009 2010 2011 2012 REMARKS
Value Source Value Source Value Source Value Source
6.1a HIV prevalence among pregnant women aged 15-24 years (%)
2.8 RHS/SMoH 2.3 RHS/SMoH 2.8 RHS/SMoH 2.3 RHS/SMoH
6.2 Proportion of the population aged 15 -24 years with comprehensive knowledge of HIV & AIDS (%)
28.4 NBS TS
6.3 Proportion of young people aged 15 -24 reporting use of condom during sexual intercourse with a non-regular sexual partner
24 NDHS 2008
6.4 Children orphaned by HIV (millions)
Notes:HHS – Household SurveyNDHS – National Demographic and Health SurveyNBS TS – National Bureau of Statistics MDG Performance Tracking SurveyRHS/MOH – Rural Healthcare Scheme of the State Ministry of Health
56
important for government to promote the optimal participation of non-governmental healthcare providers in the planning, organization, operation and management of health programmes and services, particularly primary health care. Collaboration in healthcare provision needs to be promoted. At present, apart from the Programme on Immunization, there is no existing arrang-ement to collaborate with the private sector in service delivery. The State Programme on Immunization is currently collaborating with private health service providers to immunize children free of charge in exchange for being provided with vaccines and requisite sup-plies. The Programme is in the process of formalizing this collaboration through sign-ing of a Memorandum of Understanding. This should specify the overall objective, clear terms and conditions, obligation of each party, and set clear targets to be achieved within a stipulated time-frame. Improved collaboration will result in increased under-standing, engagement, and regulation of the private sector health services by the SMoH.
The Cluster Approach to Health Service Delivery
This approach, which is also known as the 'Hub and Spoke' model of service delivery, has been applied in six MSS clusters in six LGAs of Delta State, namely, Bomadi, Sapele, Warri South, Ika South, Ndokwa West and Ughelli North. In each cluster, there are four PHCs and one secondary health facility. The PHCs have the capacity to deliver basic obstetric care and refer complicated cases to the general hospital within the cluster. Because the PHCs within the cluster are playing the role of filtering patients, the workload in the general hospitals in the six clusters is expected to reduce, thereby allowing time for the experienced health workers to visit the PHCs for supportive supervision and professional mentoring. Expansion of the cluster model to all the 25 LGAs will reduce the patient flow to the secondary health facilities, thereby allowing them to conduct professional mentoring and supervision of the PHCs.
Monitoring and Evaluation of Policies and Programmes in the Health Sector
The Office of the Special Adviser to the Governor on Project Monitoring provides a Focal Person for monitoring the health
programmes. The office is mandated to monitor the SSHDP implementation using the elaborated M & E result framework. The Health Management Information System has M & E and DSN units at the SMoH, LGAs and health facilities to track and monitor prog-ress. Periodic joint assessment of achieve-ments and progress towards MDGs are carried out with the Local Government Councils. The Expanded Health Data Consult-ative Committees (HDCC) is used to ensure cooperation of all stakeholders in reporting on their implementation progress. More regular State Council on Health meetings (twice yearly) are used to provide broad-based consultation, coordination and collaboration on a continuous basis.
The Monitoring and Evaluation framework of the SSHDP 2010-2015 incorporates indica-tors for all eight priority areas already noted earlier. There was no formal assessment done on progress made in implementation of the SSHDP using the M&E framework.
The State undertook a desk review of its performance as part of the 2013 Mid-Term Review of the NSHDP 2010-2015. The Number 1 tool that was applied contained overlapping indicators with those of the SSHDP. That information has been extracted to enable assessment made in the impleme-ntation of the SSHDP.
Significantly, there is lack of data for the majority of the indicators contained in the Monitoring and Evaluation Matrix. There are few data sets for the outcome and impact indicators. The national population based surveys, such as MICS, NARHS, do not provide state-level rates for most indicators. The DHS 2008 and 2013 and the MDG Tracking Survey 2013 contain rates for some outcome indicators, which were extracted to show the progress made in achieving the health MDGs. For the Delta-specific impact indicators, namely: (i) Infant Mortality Rate, (ii) Under-5 Mortality Rate, and (iii) Maternal Mortality Rate, however, the source has been the Delta State Household and Housing Survey Reports for 2003, 2006 and 2011. These surveys were planned to be conducted every three years, but this was not the case.
Facility-based service data provides inform-ation for indicators such as (i) Maternal Case Fatality Rate, (ii) Under-5 Case Fatality Rate, etc, which are very useful in monitoring service delivery quality. Their monitoring is
57
intended to generate information that is used to improve the quality of service delivery. The assessment team was informed that the State's health managers were reviewing these indicators and taking appropriate actions that are facility-targeted.
The Civil Registration System could serve as the authentic source of data for computing birth and death rates. However, it was reported that the completeness of Civil Registration in Delta State was less than 30 per cent.
The Nigerian Governor's Forum (NGF) conceived the State Peer Review Mechanism in 2009. Indicators to be applied during the conduct of the State Peer Reviews are being developed. The finalization of these indica-tors and the institution of the Peer Review Mechanism could serve a very useful purpose in ensuring that health programmes are executed as planned. This will facilitate the timely achievement of the State Health and Millennium Development Goals.
Gaps in Performance
Against the backdrop of the foregoing discussions, this section identifies gaps in performance and outlines the emerging issues/priorities.
The main gaps in performance relate to the following categories: (i) Implementing the SSHDP; (ii) Tracking progress; (iii) Financing the health sector; (iv) Gaining access to safe, efficacious medicines of high quality; (v) Gaining access to health services; and (vi) Sustaining critical health programmes. These are elaborated upon below:
! Implementation of the SSHDP
The SMoH, using nationally developed guidelines, undertook a highly participatory exercise to develop the SSHDP, 2010-2015. It was expected that Annual Operational Plans (AOPs) would be developed, budgeted for and implemented. However, this was not done except for the first year (2010). Conseq-uently, the budget allocation to the health sector was not systematically linked to the SSHDP and its priority areas. The SSHDP, therefore, remains very sparsely impleme-nted, only 18 months to its end.
! Tracking Implementation Progress
The Office of the Special Adviser to the Governor on Project monitoring provides a Focal Person for monitoring the health programmes. The Office is mandated to monitor the SSHDP implementation using the elaborated M & E result framework. The Health Management Information System has M & E and DSN units at the SMoH, LGAs and health facilities to track and monitor progress. Periodic joint assessments of achievements and progress towards MDGs are carried out with the Local Government Councils. However, it was not clear whether the Expanded Health Data Consultative Committees (HDCC) were operational, while it was reported that the State Health Council had not met for some years now.
There is a dearth of data to monitor and evaluate health programmes' outcomes and impact, except for the Household and Housing (HHS) Surveys conducted irregularly by the Department of Research and Statistics of MOEP. The assessment team was informed that the HHS surveys were supposed to be conducted every three years. However, reports are only available for 2003, 2006 and 2011. Without regularly conducting such surveys it is difficult to determine whether or not progress is being made on achieving the MDGs relating to Infant, Under-5 and Maternal Mortality Rates.
! Financing the Health Sector
It was revealed during the assessment that the SMoH, MDG-CGS and DESOPADEC fund and implement health programmes separa-tely. Most of the capital projects implemented are similar, such as construction and refurb-ishing of health facilities and procuring and distribution of health equipment. Improved coordination of their activities would not only enhance efficiency through avoiding duplication, but also provide a good idea of how much funds the government is spending on health. This information was not easy to secure during the assessment period. Besides, the need to adequately fund the health sector needs some attention.
! Gaining Access to Safe, Efficacious Medicines of High Quality
The State Drug Revolving Fund (DRF) ensures the distribution of affordable, efficacious and high quality medicines and health supplies. However, most of the PHCs
58
are not patronizing the DRF for reasons that are not very clear. This situation provides little or no assurance of the safety and quality of the medicines that are purchased from elsewhere.
! Gaining Access to Health Services
There are 281 PHCs and 182 SHCs belonging to the private sector. The Programme on Immunization has provided vaccines and related supplies to selected private health providers to undertake immunization of children free of charge. The Programme is planning to formalize this collaboration by signing a memorandum with these private health providers. The other SMoH Program-mes have not adequately engaged the private health service providers to expand service delivery. Such collaboration would greatly increase access to health services.
! Sustainability of critical programmes
The HIV & AIDS, TB and Malaria Programmes are enjoying substantial donor support to implement activities including provision of medicines, supplies, and reagents. There is very little funding from donors for operations. The programmes are accessing funding for operations from a common budget line which is mostly underfunded. The programmes do not have budget lines in the SMoH budget.
! Inadequate Diagnostic Equipment
There are only two GeneXpert facilities in Delta State, which are grossly inadequate. Also, there is no earmarked ward for the treatment of MDR-TB cases in Delta State.
Related to the above are some critical issues that have emanated from the assessment which also need to be stressed. They are: delivering comprehensive and integrated healthcare package at PHCs; striving for universal health coverage; strengthening the health system in the context of the primary healthcare; and promoting inter-sectoral collaboration and coordination of the health actors in the State. These issues are elaborated upon in Chapter 7.
Some Conclusions and Policy Recommendations
! Delta State has performed well by investing in health infrastructural rehabilitation and establishment as well
as in health service delivery through innovative health programmes targeting the rural poor. Evidence points to the reduction of infant mortality although the under-5 mortality remains static. Thus, it would appear that the targets for MDG indicators – infant mortality rate – will be achieved by 2015, while the target for under-5 mortality rate may already have been achieved. Also, the data from the State Ministry of Health points to reductions in the maternal mortality rates and the achievement of related targets by 2015. However, more concerted and targeted effort will be required to start registering positive trends in the other indicators, namely, proportion of births attended by skilled birth attendants, contraceptive preval-ence rate, antenatal care coverage (4 or more visits), and prevalence of HIV among pregnant women aged 15-24 years.
! The assessment revealed a number of lessons which can be built upon in the future to improve health development in the State, among which are: (i) The cluster model which can strengthen the referral system; (ii) Health facility survey, which is critical for determining facility readiness for service expansion; (iii) Public Private collaboration, which can expand service access; (iv) Use of mobile phone technology to improve civil registration; and (v) Provision of free health services to improve service utilization.
In light of these performance gaps , findings and observations, and challenges to achieving the health outcomes as desired, a number of recommendations are imperative. Five of them are highlighted here while detailed recommendations are provided in Chapter 8. they are largely the need to:
! Discuss between the State Ministry of Health (SMoH) and the Local Govern-ment Authorities on the modalities to be used to provide free reproductive, maternal and child health services to all PHCs;
! Expand the MSS to all the LGAs in the State to ensure that an increased number of PHCs deliver Basic Emergency Obstetric Care (EmOC) services and can refer complicated cases to a nearby facility for comprehensive EmOC serv-ices.
59
! Develop, cost and implement a Human Resource for Health (HRH) Plan, which will address all the current HRH issues identified;
! Establish a mechanism that provides financial protection to all its citizenry, especially the poor, by replacing all out-of-pocket payments for health services to a pre-payment mechanism, in a bid towards universal health coverage;
! Need for the State to endeavour to achieve budgetary allocation to the health sector amounting to at least the 15 per cent target set by African leaders in Abuja in 2000.
To make progress in implementing the recom-mendations, it is proposed that the SMoH with the technical support of the UN should organize a workshop lasting a few days. The participants of the workshop should include: (i) representatives from the key State Ministries and Departments; (ii) LGA Chair-men; (iv) Civil Society Organiz-ations (NGOs, CBOs, Professional Associa-tions); (v)
Organized Private Sector; (vi) Federal Ministry of Health; (vii) NPHCDA; and (viii) Development Partners. The workshop should discuss the findings and policy recommen-dations contained in this report and develop a road map for implementation.

60
61
Water, Sanitation and Hygiene SectorThe objective of this chapter is to undertake a comprehensive assessment of the water, sanitation and hygiene (WASH) sector with a view
to assisting the state government to gauge the progress and milestones covered so far, and determine any outstanding challenges to be
addressed in the sector using, among other things, the MDG targets (MDG 7.C in particular) and other state indicators. MDG Target 7.C
aims to halve, by 2015, the proportion of people without sustainable access to safe drinking water and basic sanitation. This means 77 per
cent access to improved water sources and 63 per cent to improved sanitation facilities. These sources and facilities are as follows:
5
Specifically, the assessment reviews how the sector programmes and policies have contributed towards progress made in increasing the proportion of the population using improved drinking water sources and the proportion of the population using improved sanitation facilities in Delta State. The assessment also identifies bottlenecks or constraints and determines priority areas of focus for future development in the sector. The rest of the chapter is structured to address critical issues in the WASH sector, including governance, policies, progra-mmes/initiatives, sectoral performance and progress on the achievement of the MDG related to WASH.
Governance and Regulatory Frameworks for Policies and Programmes
Many policies and programmes have been formulated and implemented for the development of the WASH sector against the backdrop of various institutional arrang-ements and frameworks, including the regulatory framework and the political framework of federalism.
The Federal Framework
Nigerian states operate with a high degree of legal and de facto autonomy in the areas of delivery, internal organization, and revenue generation, which coexist with a stronger federal mandate in the areas of federal control over sub-national borrowing.
The Nigerian federal structure makes the provision of most basic services the responsibility of states and local gover-nments, with a considerable degree of autonomy. In this regard, water supply is a state responsibility. In light of this, state governments have created State Water Boards (SWBs) or Authorities to manage and operate systems for water service delivery in all urban areas. The role of the federal government is limited to policy formulation at national level, research and development, and coordination of water supply (see Box 5.1). In addition, the federal government provides raw water from its dams through the River Basin Development Authorities for power, irrigation and regional water supply develop-ment. The nature of fiscal federalism and revenue allocation guarantees the states their share of financial resources such that the federal government has limited scope to use
Improved Water Sources Improved Sanitation Facilities
Piped water into dwelling/yard/plot Flush to pipe sewer
Public pipe/standpipe Flush to septic tank
Tube well/borehole Flush to pit latrine
Protected well Ventilated Improved Pit (VIP) latrine
Protected spring Pit latrine with slab
Rainwater collection Composting toilet
Bottled water*
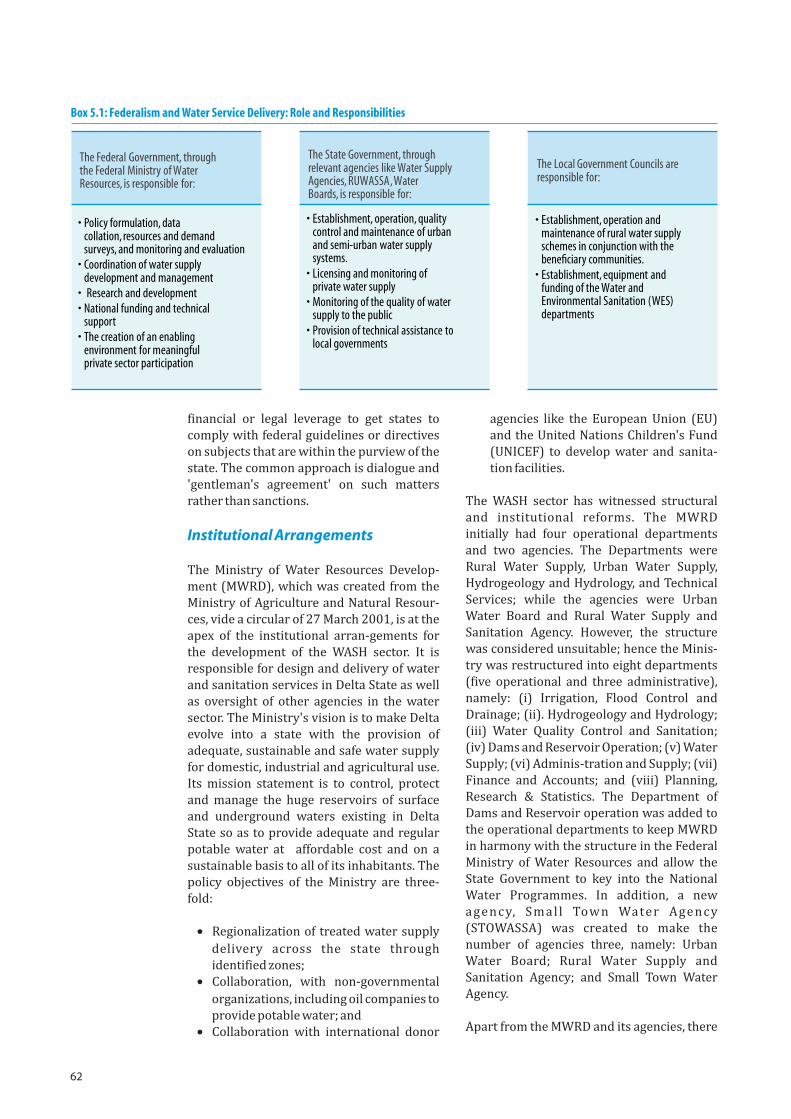
62
financial or legal leverage to get states to comply with federal guidelines or directives on subjects that are within the purview of the state. The common approach is dialogue and 'gentleman's agreement' on such matters rather than sanctions.
Institutional Arrangements
The Ministry of Water Resources Develop-ment (MWRD), which was created from the Ministry of Agriculture and Natural Resour-ces, vide a circular of 27 March 2001, is at the apex of the institutional arran-gements for the development of the WASH sector. It is responsible for design and delivery of water and sanitation services in Delta State as well as oversight of other agencies in the water sector. The Ministry's vision is to make Delta evolve into a state with the provision of adequate, sustainable and safe water supply for domestic, industrial and agricultural use. Its mission statement is to control, protect and manage the huge reservoirs of surface and underground waters existing in Delta State so as to provide adequate and regular potable water at affordable cost and on a sustainable basis to all of its inhabitants. The policy objectives of the Ministry are three-fold:
· Regionalization of treated water supply
delivery across the state through identified zones;
· Collaboration, with non-governmental
organizations, including oil companies to provide potable water; and
· Collaboration with international donor
agencies like the European Union (EU) and the United Nations Children's Fund (UNICEF) to develop water and sanita-tion facilities.
The WASH sector has witnessed structural and institutional reforms. The MWRD initially had four operational departments and two agencies. The Departments were Rural Water Supply, Urban Water Supply, Hydrogeology and Hydrology, and Technical Services; while the agencies were Urban Water Board and Rural Water Supply and Sanitation Agency. However, the structure was considered unsuitable; hence the Minis-try was restructured into eight departments (five operational and three administrative), namely: (i) Irrigation, Flood Control and Drainage; (ii). Hydrogeology and Hydrology; (iii) Water Quality Control and Sanitation; (iv) Dams and Reservoir Operation; (v) Water Supply; (vi) Adminis-tration and Supply; (vii) Finance and Accounts; and (viii) Planning, Research & Statistics. The Department of Dams and Reservoir operation was added to the operational departments to keep MWRD in harmony with the structure in the Federal Ministry of Water Resources and allow the State Government to key into the National Water Programmes. In addition, a new agency, Smal l Town Water Agency (STOWASSA) was created to make the number of agencies three, namely: Urban Water Board; Rural Water Supply and Sanitation Agency; and Small Town Water Agency.
Apart from the MWRD and its agencies, there
Box 5.1: Federalism and Water Service Delivery: Role and Responsibilities
The Federal Government, through the Federal Ministry of Water Resources, is responsible for:
• Policy formulation, data collation, resources and demand surveys, and monitoring and evaluation
• Coordination of water supply development and management
• Research and development• National funding and technical
support• The creation of an enabling
environment for meaningful private sector participation
The State Government, through relevant agencies like Water Supply Agencies, RUWASSA, Water Boards, is responsible for:
• Establishment, operation, quality control and maintenance of urban and semi-urban water supply systems.
• Licensing and monitoring of private water supply
• Monitoring of the quality of water supply to the public
• Provision of technical assistance to local governments
The Local Government Councils are responsible for:
• Establishment, operation and maintenance of rural water supply schemes in conjunction with the beneficiary communities.
• Establishment, equipment and funding of the Water and Environmental Sanitation (WES) departments
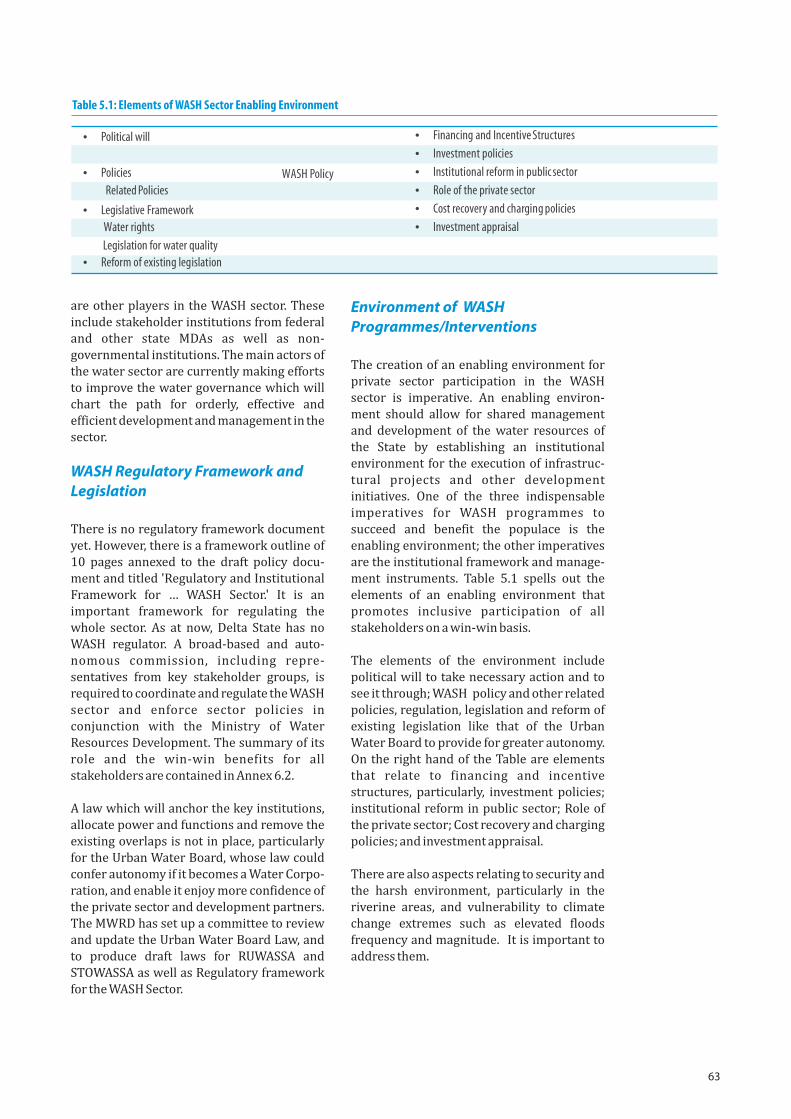
63
are other players in the WASH sector. These include stakeholder institutions from federal and other state MDAs as well as non-governmental institutions. The main actors of the water sector are currently making efforts to improve the water governance which will chart the path for orderly, effective and efficient development and management in the sector.
WASH Regulatory Framework and Legislation
There is no regulatory framework document yet. However, there is a framework outline of 10 pages annexed to the draft policy docu-ment and titled 'Regulatory and Institutional Framework for … WASH Sector.' It is an important framework for regulating the whole sector. As at now, Delta State has no WASH regulator. A broad-based and auto-nomous commission, including repre-sentatives from key stakeholder groups, is required to coordinate and regulate the WASH sector and enforce sector policies in conjunction with the Ministry of Water Resources Development. The summary of its role and the win-win benefits for all stakeholders are contained in Annex 6.2.
A law which will anchor the key institutions, allocate power and functions and remove the existing overlaps is not in place, particularly for the Urban Water Board, whose law could confer autonomy if it becomes a Water Corpo-ration, and enable it enjoy more confidence of the private sector and development partners. The MWRD has set up a committee to review and update the Urban Water Board Law, and to produce draft laws for RUWASSA and STOWASSA as well as Regulatory framework for the WASH Sector.
Environment of WASH Programmes/Interventions
The creation of an enabling environment for private sector participation in the WASH sector is imperative. An enabling environ-ment should allow for shared management and development of the water resources of the State by establishing an institutional environment for the execution of infrastruc-tural projects and other development initiatives. One of the three indispensable imperatives for WASH programmes to succeed and benefit the populace is the enabling environment; the other imperatives are the institutional framework and manage-ment instruments. Table 5.1 spells out the elements of an enabling environment that promotes inclusive participation of all stakeholders on a win-win basis.
The elements of the environment include political will to take necessary action and to see it through; WASH policy and other related policies, regulation, legislation and reform of existing legislation like that of the Urban Water Board to provide for greater autonomy. On the right hand of the Table are elements that relate to financing and incentive structures, particularly, investment policies; institutional reform in public sector; Role of the private sector; Cost recovery and charging policies; and investment appraisal.
There are also aspects relating to security and the harsh environment, particularly in the riverine areas, and vulnerability to climate change extremes such as elevated floods frequency and magnitude. It is important to address them.
Table 5.1: Elements of WASH Sector Enabling Environment
WASH Policy Related Policies
Water rights
Legislation for water quality
Ÿ Political will Ÿ Financing and Incentive Structures
Ÿ Investment policies
Ÿ Institutional reform in public sector
Ÿ Role of the private sector
Ÿ Cost recovery and charging policies
Ÿ Investment appraisal
Ÿ Policies
Ÿ Legislative Framework
Ÿ Reform of existing legislation
64
Policies, Strategies and Initiatives/programmes in the WASH Sector
The WASH Sector Policy
The MWRD has not yet finalized a WASH policy document. The draft policy available has been processed to an advanced stage of completion. The document states and addresses the policy impetus, the core principles adapted from the national policy and global community, policy thrust, goal, objectives, targets and guidelines, and the key components of the policy for water supply and sanitation. Being only a draft document, its provisions cannot be enforced until it is finalized and approved by the appropriate authorities. In addition, the draft policy would still require substantive revision and updating to make it more IWRM-compliant. Policy development is one of the objectives of MWRD's ongoing collaboration with the European Union. The lack of a coherent policy has tended to undermine the Ministry's ability for effective resource allocation and management.
Objectives, Policies and Strategies
The specific objectives of the WASH sector are to:
· Provide safe and potable water, effective
sanitation and hygiene;· Increase access to safe potable water and
effective sanitation and hygiene for all residents of Delta State using techno-logies with low maintenance costs;
· Reduce the incidence of water-borne
diseases;· Provide a strategic framework for the
design, and sustainable implementation of integrated interventions in the WASH sector;
· Stimulate increased investment and
funding in the sector; · Develop innovative solutions to WASH
challenges; and · Promote market principles and encou-
rage private sector participation in the sector.
The 36 states of Nigeria, including Delta State, are expected to be guided by the National
WASH Policy of January 2000 and to even domesticate it. Although the State does not have an approved WASH policy, it has, however, taken some policy decisions which have, in turn, led to some strategies for the development of the sector.
Strategies
The MWRD and its agencies endeavour to select appropriate water sources and water supply types that are sustainable: boreholes account for most of the water sources in Delta State. Types of schemes are also adapted to the needs of the community, be it urban, semi-urban (small towns) or rural areas. In regional or large urban schemes, large and complex head works fed by a number of boreholes (e.g. Asaba by three boreholes, and Warri/Effurun with 2.8 million litre water tower capacity by 17 boreholes) are constr-ucted to provide long-term and cost-effective services, whereas in small towns and rural areas, small to medium schemes are constructed.
The MWRD is also realistic in establishing the standards of supply appropriate for needs and constraints of communities. For example, hand pumps are often not considered to be sufficiently modern but with chronic power problems, Delta State MWRD has adopted an appropriate strategy by giving greater priority to hand pumps, particularly in RUWASSA's schemes, where construction of 154 such schemes was undertaken in rural communities across the State at the cost of N144, 255,804.00.
The MWRD has since 2012 adopted a new policy/strategy which it described as qualitative in place of the previous quant-itative approach to water supply service delivery. In this regard, emphasis was placed, first, on rehabilitation of already existing schemes and, recently, on routine maint-enance as against the previous practice of award of contract for non-redeemable ailing schemes. This procedure has not only saved money but is reported to be yielding results in the area of sustainable water supply to the people. In this wise, the state government, through the Ministry, has rehabilitated and made functional over 400 water schemes of various capacities and handed them over to user committees for ownership participation during this period under review.
65
To its credit MWRD is applying an integrated approach involving urban and rural water supplies. Its ultimate focus is to provide Regional Schemes in the urban communities and metropolis, benefitting rural areas in the urban region, as is the standard practice globally.
Initiatives/Programmes in the WASH Sector
The important initiatives and programme interventions in the WASH sector include those of DESOPADEC, European Union (EU), NDDC, MDG, NDSP-WS, Solar-Powered Electricity with Skypower Energy of Canada, the State Government, in collaboration with UNDP, on Territorial Approach to Climate Change (TACC), and UNICEF (for RUWASA). These are discussed briefly to highlight their contribution towards the realization of the sector's mandate and objectives.
Technical Assistance for Implementation of the Water Component of the Niger Delta Support Programme (NDSP)
The Ministry of Water Resources Develop-ment (MWRD), Delta State, has since 2013 collaborated with the European Union (EU) on this Programme under an MoU signed between the Federal and the State Govern-ments. The Programme seeks to implement the water supply (WS) component of the NDSP-WS by addressing issues of poor access to safe water and basic sanitation facilities in Delta State and four other participating States of the Niger Delta: Rivers, Bayelsa, Edo and Akwa Ibom. It has three main objectives:
! To improve policy, institutional, legal and financial framework in the water and sanitation sector;
! To support urban and small towns; sector institutions are to deliver sustainable water supply services;
! To support rural water sector institutions to deliver sustainable water supply and sanitation services.
MWRD is assisted by an EU Technical Assistance Team (TAT) for the achievement of the first and second objectives of the NDSP-WS, while the third objective, dealing with water and sanitation in rural areas, is implemented by UNICEF.
The total amount available from EU for emergency works is €500,000. The total amount available from EU for other works is €11.5 million, assuming availability of counterpart funds amounting to a total of €5.15 million, i.e. about N1.0 billion.
A total amount of €1.3 million is available to support the administration of the project, and a total amount of €1 million is available for grants to CSOs active in the water & sanitation sector.
A Delta State Working Group (SWG) inaugurated in October 2013 has been working with TAT to carry out some preparations for the smooth implementation of the project in the State. Besides, a Working Group on Policy and Law (WGP) has been appointed to revise the state draft water policy. Some other preliminary activities were also carried out relating to determining the 10 small towns that will benefit from the NDSP-WS Project while a number of future activities have been planned, one of which is drafting Water and Sanitation Policy and Law.
DESOPADEC Investments
One of the areas of interventions of the Delta State Oil Producing Areas Development Commission (DESOPADEC) is the WASH sector. The areas of intervention in the Water Sector include:
· Construction of Solar Powered Water
Supply Schemes;· Rehabilitation of Dilapidated Water
Supply Schemes; and· Extension and Distribution of Water
Supply
MDG Conditional Grants Scheme
Delta State started participating in the Conditional Grants Scheme of the MDGs in 2008. The Scheme's contribution to WASH service delivery in Delta State was a total of N8.934 billion from 2008-2013. This financed schemes such as the 106 fenced water schemes, 106 solar/motorized schemes and 95 toilet facilities in schools, markets, PHCs and other public places.
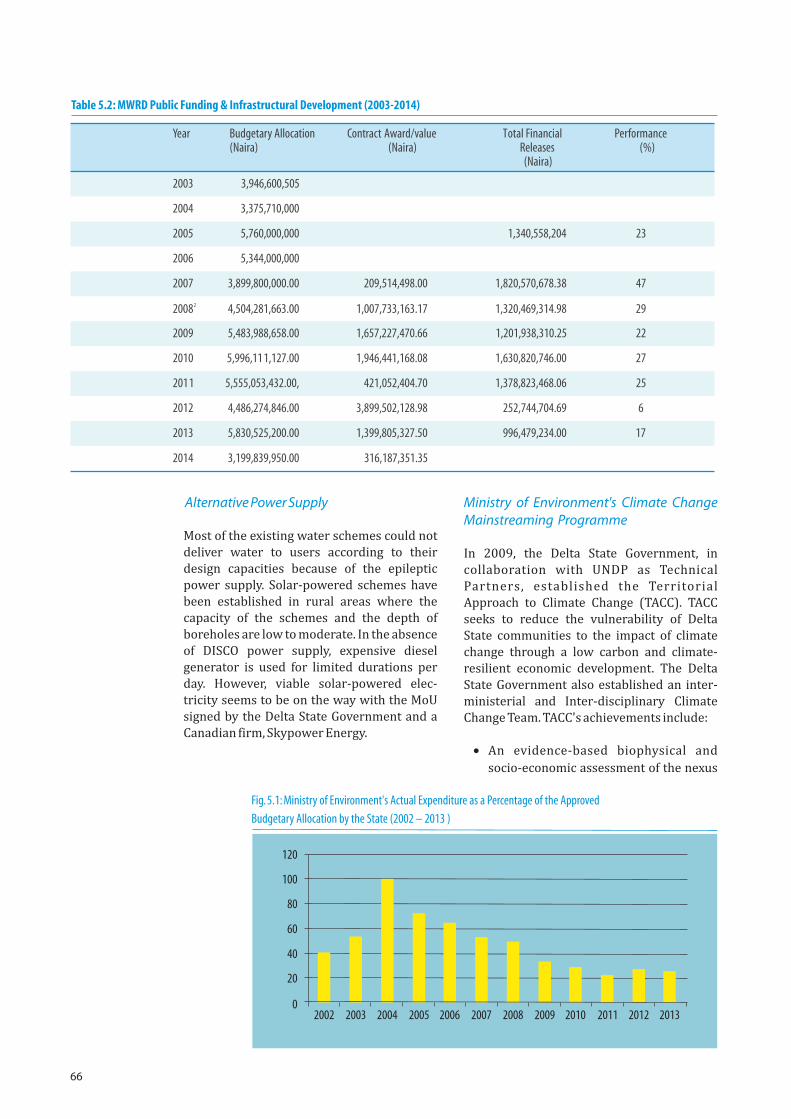
66
Alternative Power Supply
Most of the existing water schemes could not deliver water to users according to their design capacities because of the epileptic power supply. Solar-powered schemes have been established in rural areas where the capacity of the schemes and the depth of boreholes are low to moderate. In the absence of DISCO power supply, expensive diesel generator is used for limited durations per day. However, viable solar-powered elec-tricity seems to be on the way with the MoU signed by the Delta State Government and a Canadian firm, Skypower Energy.
Ministry of Environment's Climate Change Mainstreaming Programme
In 2009, the Delta State Government, in collaboration with UNDP as Technical Partners, established the Territorial Approach to Climate Change (TACC). TACC seeks to reduce the vulnerability of Delta State communities to the impact of climate change through a low carbon and climate-resilient economic development. The Delta State Government also established an inter-ministerial and Inter-disciplinary Climate Change Team. TACC's achievements include:
· An evidence-based biophysical and
socio-economic assessment of the nexus
Table 5.2: MWRD Public Funding & Infrastructural Development (2003-2014)
Year Budgetary Allocation (Naira)
Contract Award/value (Naira)
Total Financial Releases (Naira)
Performance(%)
2003 3,946,600,505
2004 3,375,710,000
2005 5,760,000,000 1,340,558,204 23
2006 5,344,000,000
2007 3,899,800,000.00 209,514,498.00 1,820,570,678.38 47
20082 4,504,281,663.00 1,007,733,163.17 1,320,469,314.98 29
2009 5,483,988,658.00 1,657,227,470.66 1,201,938,310.25 22
2010 5,996,111,127.00 1,946,441,168.08 1,630,820,746.00 27
2011 5,555,053,432.00, 421,052,404.70 1,378,823,468.06 25
2012 4,486,274,846.00 3,899,502,128.98 252,744,704.69 6
2013 5,830,525,200.00 1,399,805,327.50 996,479,234.00 17
2014 3,199,839,950.00 316,187,351.35
Fig. 5.1: Ministry of Environment's Actual Expenditure as a Percentage of the Approved
Budgetary Allocation by the State (2002 – 2013 )
2002
120
100
80
60
40
20
02003 2004 2005 2006 2007 2008 2009 2010 2011 2012 2013
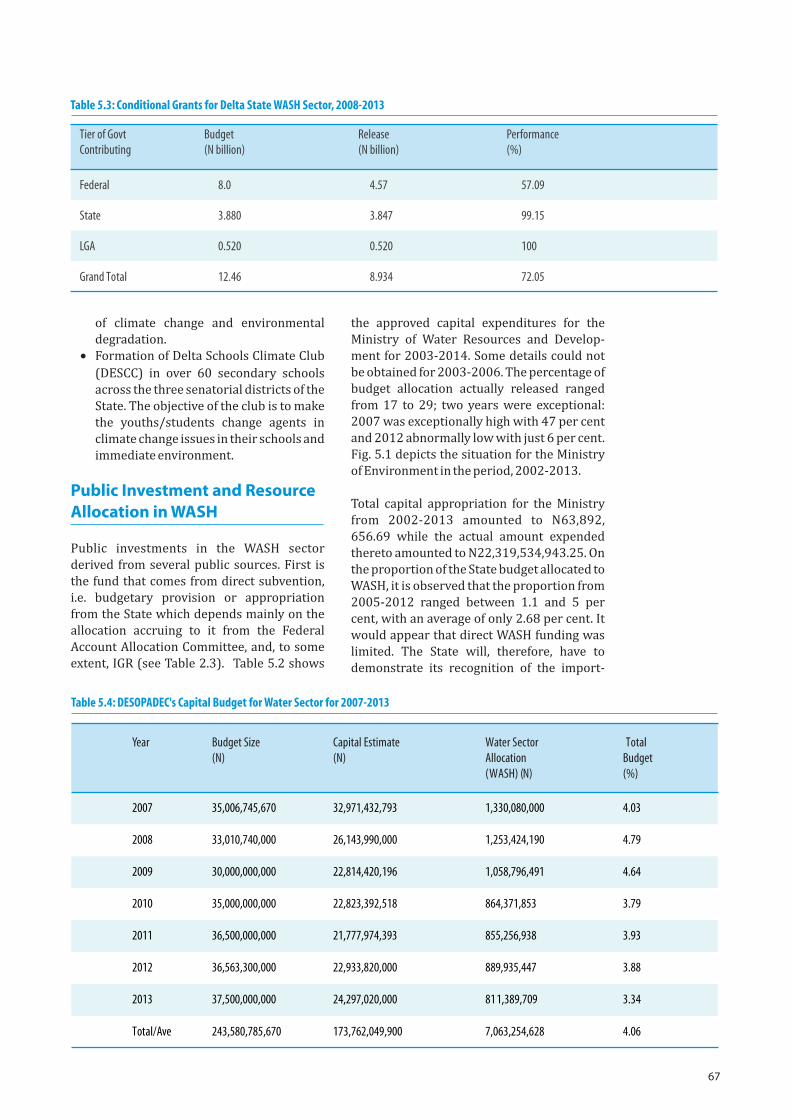
67
of climate change and environmental degradation.
· Formation of Delta Schools Climate Club
(DESCC) in over 60 secondary schools across the three senatorial districts of the State. The objective of the club is to make the youths/students change agents in climate change issues in their schools and immediate environment.
Public Investment and Resource Allocation in WASH
Public investments in the WASH sector derived from several public sources. First is the fund that comes from direct subvention, i.e. budgetary provision or appropriation from the State which depends mainly on the allocation accruing to it from the Federal Account Allocation Committee, and, to some extent, IGR (see Table 2.3). Table 5.2 shows
the approved capital expenditures for the Ministry of Water Resources and Develop-ment for 2003-2014. Some details could not be obtained for 2003-2006. The percentage of budget allocation actually released ranged from 17 to 29; two years were exceptional: 2007 was exceptionally high with 47 per cent and 2012 abnormally low with just 6 per cent. Fig. 5.1 depicts the situation for the Ministry of Environment in the period, 2002-2013.
Total capital appropriation for the Ministry from 2002-2013 amounted to N63,892, 656.69 while the actual amount expended thereto amounted to N22,319,534,943.25. On the proportion of the State budget allocated to WASH, it is observed that the proportion from 2005-2012 ranged between 1.1 and 5 per cent, with an average of only 2.68 per cent. It would appear that direct WASH funding was limited. The State will, therefore, have to demonstrate its recognition of the import-
Tier of Govt Contributing
Budget (N billion)
Release (N billion)
Performance (%)
Federal 8.0 4.57 57.09
State 3.880 3.847 99.15
LGA 0.520 0.520 100
Grand Total 12.46 8.934 72.05
Table 5.3: Conditional Grants for Delta State WASH Sector, 2008-2013
Year Budget Size (N)
Capital Estimate (N)
Water Sector Allocation (WASH) (N)
Total Budget (%)
2007 35,006,745,670 32,971,432,793 1,330,080,000 4.03
2008 33,010,740,000 26,143,990,000 1,253,424,190 4.79
2009 30,000,000,000 22,814,420,196 1,058,796,491 4.64
2010 35,000,000,000 22,823,392,518 864,371,853 3.79
2011 36,500,000,000 21,777,974,393 855,256,938 3.93
2012 36,563,300,000 22,933,820,000 889,935,447 3.88
2013 37,500,000,000 24,297,020,000 811,389,709 3.34
Total/Ave 243,580,785,670 173,762,049,900 7,063,254,628 4.06
Table 5.4: DESOPADEC's Capital Budget for Water Sector for 2007-2013
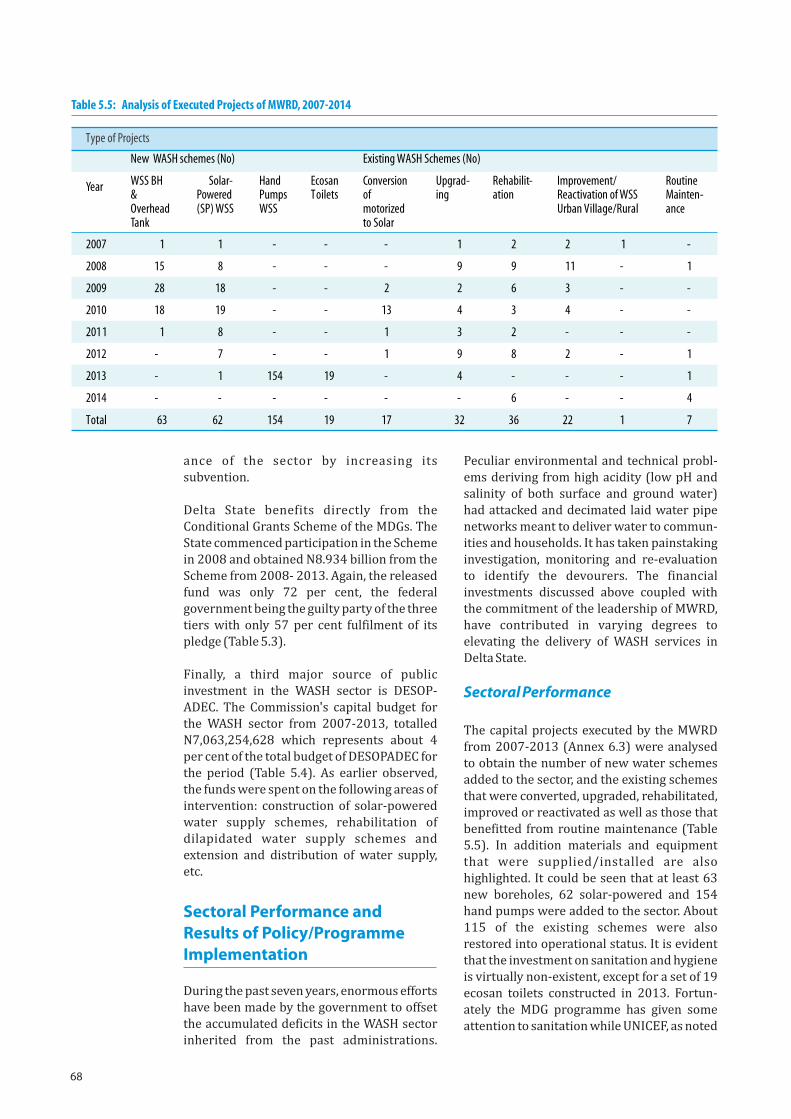
68
ance of the sector by increasing its subvention.
Delta State benefits directly from the Conditional Grants Scheme of the MDGs. The State commenced participation in the Scheme in 2008 and obtained N8.934 billion from the Scheme from 2008- 2013. Again, the released fund was only 72 per cent, the federal government being the guilty party of the three tiers with only 57 per cent fulfilment of its pledge (Table 5.3).
Finally, a third major source of public investment in the WASH sector is DESOP-ADEC. The Commission's capital budget for the WASH sector from 2007-2013, totalled N7,063,254,628 which represents about 4 per cent of the total budget of DESOPADEC for the period (Table 5.4). As earlier observed, the funds were spent on the following areas of intervention: construction of solar-powered water supply schemes, rehabilitation of dilapidated water supply schemes and extension and distribution of water supply, etc.
Sectoral Performance and Results of Policy/Programme Implementation
During the past seven years, enormous efforts have been made by the government to offset the accumulated deficits in the WASH sector inherited from the past administrations.
Peculiar environmental and technical probl-ems deriving from high acidity (low pH and salinity of both surface and ground water) had attacked and decimated laid water pipe networks meant to deliver water to commun-ities and households. It has taken painstaking investigation, monitoring and re-evaluation to identify the devourers. The financial investments discussed above coupled with the commitment of the leadership of MWRD, have contributed in varying degrees to elevating the delivery of WASH services in Delta State.
Sectoral Performance
The capital projects executed by the MWRD from 2007-2013 (Annex 6.3) were analysed to obtain the number of new water schemes added to the sector, and the existing schemes that were converted, upgraded, rehabilitated, improved or reactivated as well as those that benefitted from routine maintenance (Table 5.5). In addition materials and equipment that were supplied/installed are also highlighted. It could be seen that at least 63 new boreholes, 62 solar-powered and 154 hand pumps were added to the sector. About 115 of the existing schemes were also restored into operational status. It is evident that the investment on sanitation and hygiene is virtually non-existent, except for a set of 19 ecosan toilets constructed in 2013. Fortun-ately the MDG programme has given some attention to sanitation while UNICEF, as noted
Type of Projects
Year
New WASH schemes (No) Existing WASH Schemes (No)
WSS BH & Overhead Tank
Solar-Powered (SP) WSS
Hand Pumps WSS
Ecosan Toilets
Conversion of motorized to Solar
Upgrad-ing
Rehabilit-ation
Improvement/ Reactivation of WSS
Routine Mainten-ance Urban Village/Rural
2007 1 1 - - - 1 2 2 1 -
2008 15 8 - - - 9 9 11 - 1
2009 28 18 - - 2 2 6 3 - -
2010 18 19 - - 13 4 3 4 - -
2011 1 8 - - 1 3 2 - - -
2012 - 7 - - 1 9 8 2 - 1
2013 - 1 154 19 - 4 - - - 1
2014 - - - - - - 6 - - 4
Total 63 62 154 19 17 32 36 22 1 7
Table 5.5: Analysis of Executed Projects of MWRD, 2007-2014
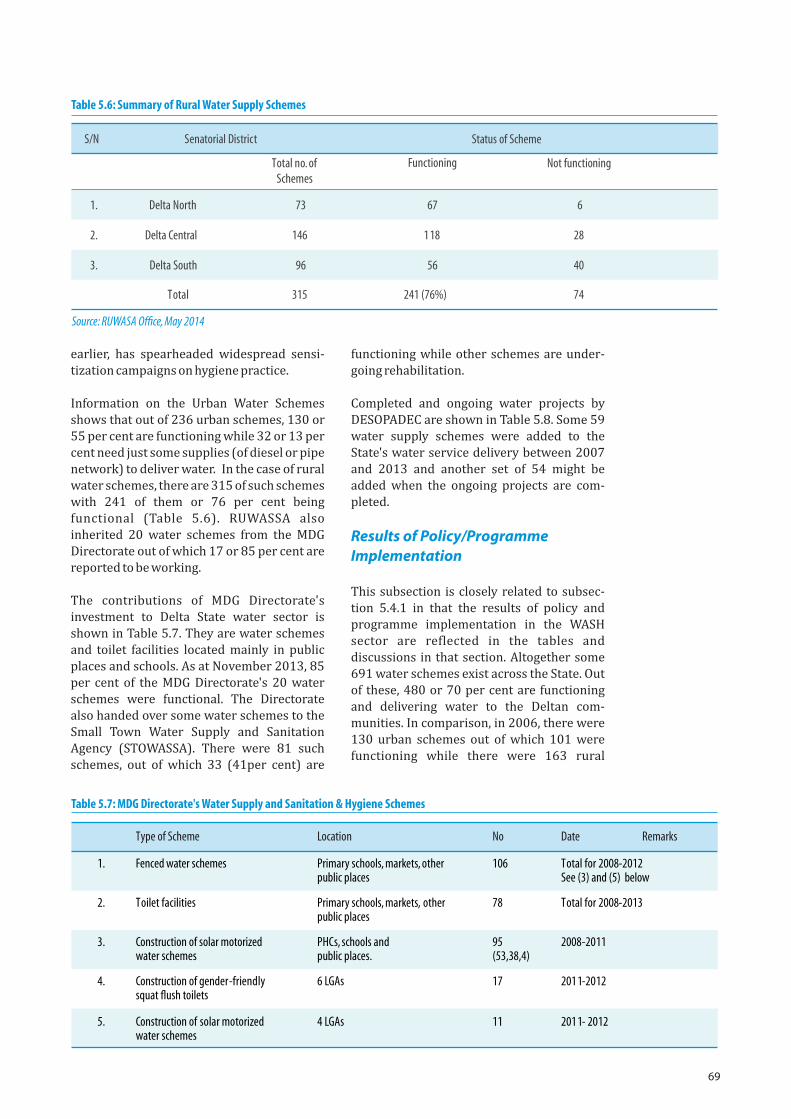
69
earlier, has spearheaded widespread sensi-tization campaigns on hygiene practice.
Information on the Urban Water Schemes shows that out of 236 urban schemes, 130 or 55 per cent are functioning while 32 or 13 per cent need just some supplies (of diesel or pipe network) to deliver water. In the case of rural water schemes, there are 315 of such schemes with 241 of them or 76 per cent being functional (Table 5.6). RUWASSA also inherited 20 water schemes from the MDG Directorate out of which 17 or 85 per cent are reported to be working.
The contributions of MDG Directorate's investment to Delta State water sector is shown in Table 5.7. They are water schemes and toilet facilities located mainly in public places and schools. As at November 2013, 85 per cent of the MDG Directorate's 20 water schemes were functional. The Directorate also handed over some water schemes to the Small Town Water Supply and Sanitation Agency (STOWASSA). There were 81 such schemes, out of which 33 (41per cent) are
functioning while other schemes are under-going rehabilitation.
Completed and ongoing water projects by DESOPADEC are shown in Table 5.8. Some 59 water supply schemes were added to the State's water service delivery between 2007 and 2013 and another set of 54 might be added when the ongoing projects are com-pleted.
Results of Policy/Programme Implementation
This subsection is closely related to subsec-tion 5.4.1 in that the results of policy and programme implementation in the WASH sector are reflected in the tables and discussions in that section. Altogether some 691 water schemes exist across the State. Out of these, 480 or 70 per cent are functioning and delivering water to the Deltan com-munities. In comparison, in 2006, there were 130 urban schemes out of which 101 were functioning while there were 163 rural
Table 5.6: Summary of Rural Water Supply Schemes
S/N Senatorial District Status of Scheme
Total no. of Schemes
Functioning Not functioning
1. Delta North 73 67 6
2. Delta Central 146 118 28
3. Delta South 96 56 40
Total 315 241 (76%) 74
Source: RUWASA Office, May 2014
Type of Scheme Location No Date Remarks
1. Fenced water schemes Primary schools, markets, other public places
106 Total for 2008- 2012 See (3) and (5) below
2. Toilet facilities Primary schools, markets, other public places
78 Total for 2008- 2013
3. Construction of solar motorized
water schemes PHCs, schools and public places.
95 (53,38,4)
2008-2011
4. Construction of gender-friendly squat flush toilets
6 LGAs 17 2011-2012
5. Construction of solar motorized water schemes
4 LGAs 11 2011- 2012
Table 5.7: MDG Directorate's Water Supply and Sanitation & Hygiene Schemes
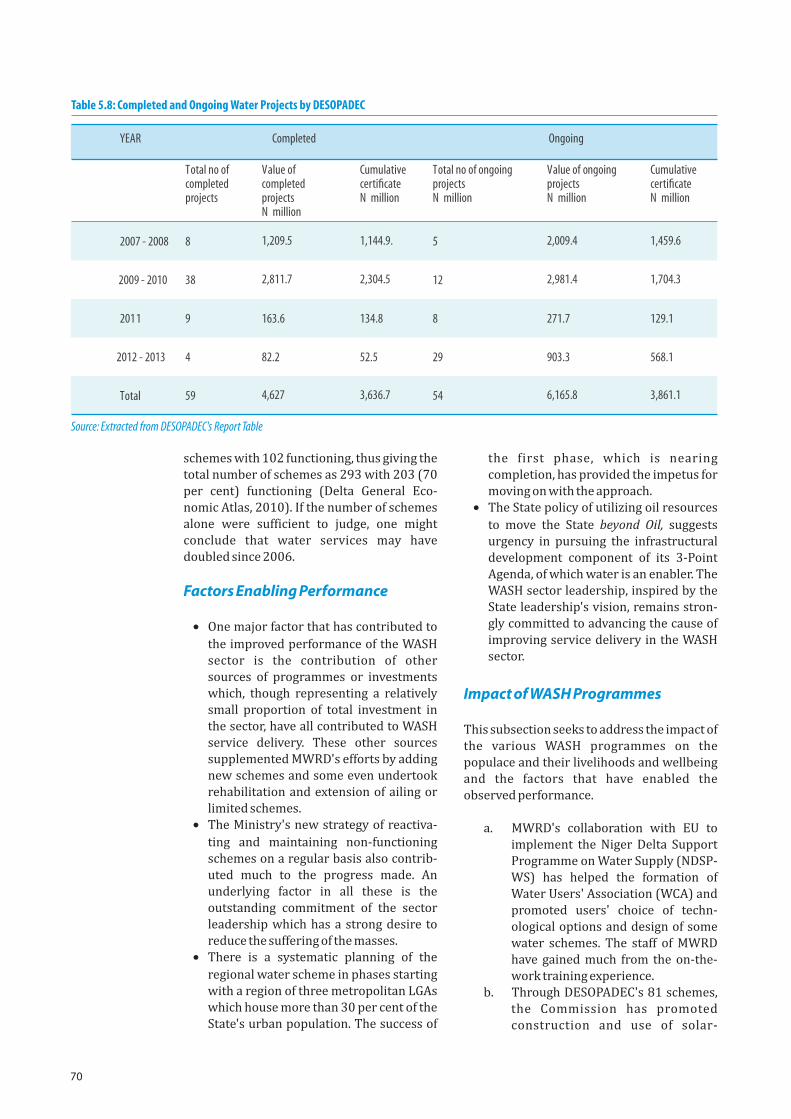
70
schemes with 102 functioning, thus giving the total number of schemes as 293 with 203 (70 per cent) functioning (Delta General Eco-nomic Atlas, 2010). If the number of schemes alone were sufficient to judge, one might conclude that water services may have doubled since 2006.
Factors Enabling Performance
· One major factor that has contributed to
the improved performance of the WASH sector is the contribution of other sources of programmes or investments which, though representing a relatively small proportion of total investment in the sector, have all contributed to WASH service delivery. These other sources supplemented MWRD's efforts by adding new schemes and some even undertook rehabilitation and extension of ailing or limited schemes.
· The Ministry's new strategy of reactiva-
ting and maintaining non-functioning schemes on a regular basis also contrib-uted much to the progress made. An underlying factor in all these is the outstanding commitment of the sector leadership which has a strong desire to reduce the suffering of the masses.
· There is a systematic planning of the
regional water scheme in phases starting with a region of three metropolitan LGAs which house more than 30 per cent of the State's urban population. The success of
the first phase, which is nearing completion, has provided the impetus for moving on with the approach.
· The State policy of utilizing oil resources
to move the State beyond Oil, suggests urgency in pursuing the infrastructural development component of its 3-Point Agenda, of which water is an enabler. The WASH sector leadership, inspired by the State leadership's vision, remains stron-gly committed to advancing the cause of improving service delivery in the WASH sector.
Impact of WASH Programmes
This subsection seeks to address the impact of the various WASH programmes on the populace and their livelihoods and wellbeing and the factors that have enabled the observed performance.
a. MWRD's collaboration with EU to implement the Niger Delta Support Programme on Water Supply (NDSP-WS) has helped the formation of Water Users' Association (WCA) and promoted users' choice of techn-ological options and design of some water schemes. The staff of MWRD have gained much from the on-the-work training experience.
b. Through DESOPADEC's 81 schemes, the Commission has promoted construction and use of solar-
Table 5.8: Completed and Ongoing Water Projects by DESOPADEC
YEAR
Completed Ongoing
Total no of completed projects
Value of completed projects N
million
Cumulative certificate N million
Total no of ongoing projects N million
Value of ongoing projects N million
Cumulative certificateN million
2007 - 2008
2009 - 2010
2012 - 2013
8 1,209.5 1,144.9. 5 2,009.4 1,459.6
38 2,811.7 2,304.5 12 2,981.4 1,704.3
2011 9 163.6 134.8 8 271.7 129.1
4 82.2 52.5 29 903.3 568.1
Total 59 4,627 3,636.7 54 6,165.8 3,861.1
Source: Extracted from DESOPADEC's Report Table
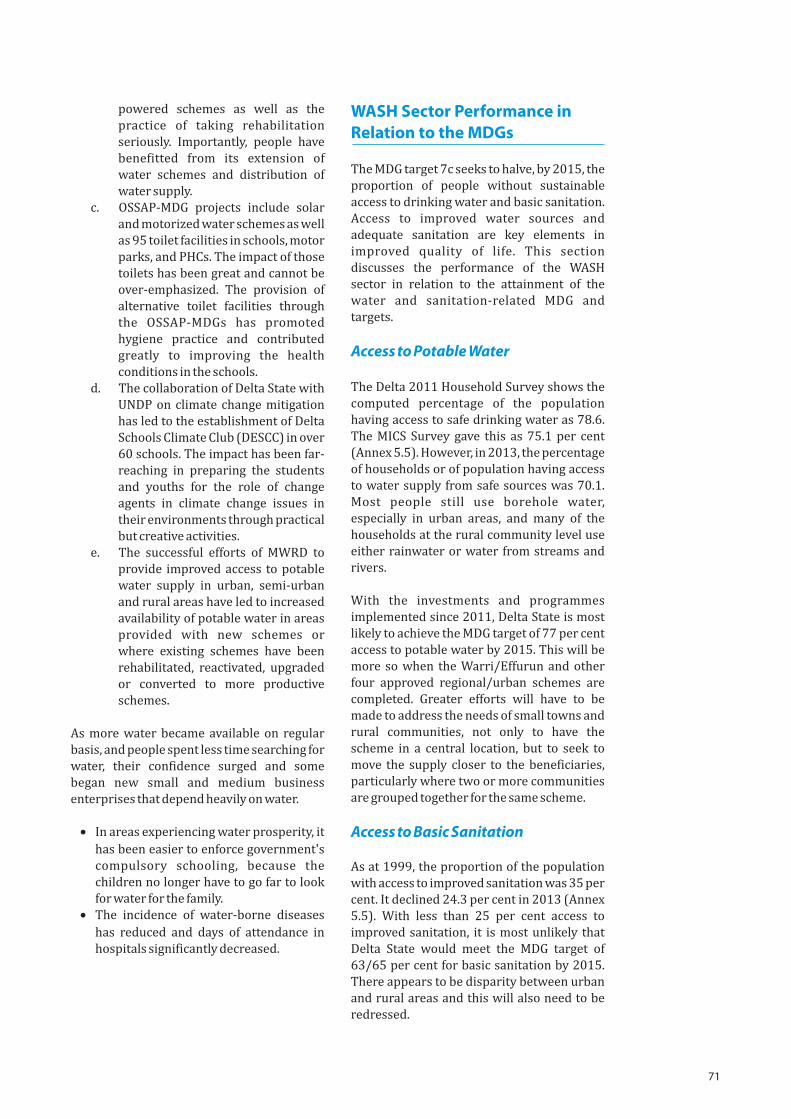
71
powered schemes as well as the practice of taking rehabilitation seriously. Importantly, people have benefitted from its extension of water schemes and distribution of water supply.
c. OSSAP-MDG projects include solar and motorized water schemes as well as 95 toilet facilities in schools, motor parks, and PHCs. The impact of those toilets has been great and cannot be over-emphasized. The provision of alternative toilet facilities through the OSSAP-MDGs has promoted hygiene practice and contributed greatly to improving the health conditions in the schools.
d. The collaboration of Delta State with UNDP on climate change mitigation has led to the establishment of Delta Schools Climate Club (DESCC) in over 60 schools. The impact has been far-reaching in preparing the students and youths for the role of change agents in climate change issues in their environments through practical but creative activities.
e. The successful efforts of MWRD to provide improved access to potable water supply in urban, semi-urban and rural areas have led to increased availability of potable water in areas provided with new schemes or where existing schemes have been rehabilitated, reactivated, upgraded or converted to more productive schemes.
As more water became available on regular basis, and people spent less time searching for water, their confidence surged and some began new small and medium business enterprises that depend heavily on water.
· In areas experiencing water prosperity, it
has been easier to enforce government's compulsory schooling, because the children no longer have to go far to look for water for the family.
· The incidence of water-borne diseases
has reduced and days of attendance in hospitals significantly decreased.
WASH Sector Performance in Relation to the MDGs
The MDG target 7c seeks to halve, by 2015, the proportion of people without sustainable access to drinking water and basic sanitation. Access to improved water sources and adequate sanitation are key elements in improved quality of life. This section discusses the performance of the WASH sector in relation to the attainment of the water and sanitation-related MDG and targets.
Access to Potable Water
The Delta 2011 Household Survey shows the computed percentage of the population having access to safe drinking water as 78.6. The MICS Survey gave this as 75.1 per cent (Annex 5.5). However, in 2013, the percentage of households or of population having access to water supply from safe sources was 70.1. Most people still use borehole water, especially in urban areas, and many of the households at the rural community level use either rainwater or water from streams and rivers.
With the investments and programmes implemented since 2011, Delta State is most likely to achieve the MDG target of 77 per cent access to potable water by 2015. This will be more so when the Warri/Effurun and other four approved regional/urban schemes are completed. Greater efforts will have to be made to address the needs of small towns and rural communities, not only to have the scheme in a central location, but to seek to move the supply closer to the beneficiaries, particularly where two or more communities are grouped together for the same scheme.
Access to Basic Sanitation
As at 1999, the proportion of the population with access to improved sanitation was 35 per cent. It declined 24.3 per cent in 2013 (Annex 5.5). With less than 25 per cent access to improved sanitation, it is most unlikely that Delta State would meet the MDG target of 63/65 per cent for basic sanitation by 2015. There appears to be disparity between urban and rural areas and this will also need to be redressed.
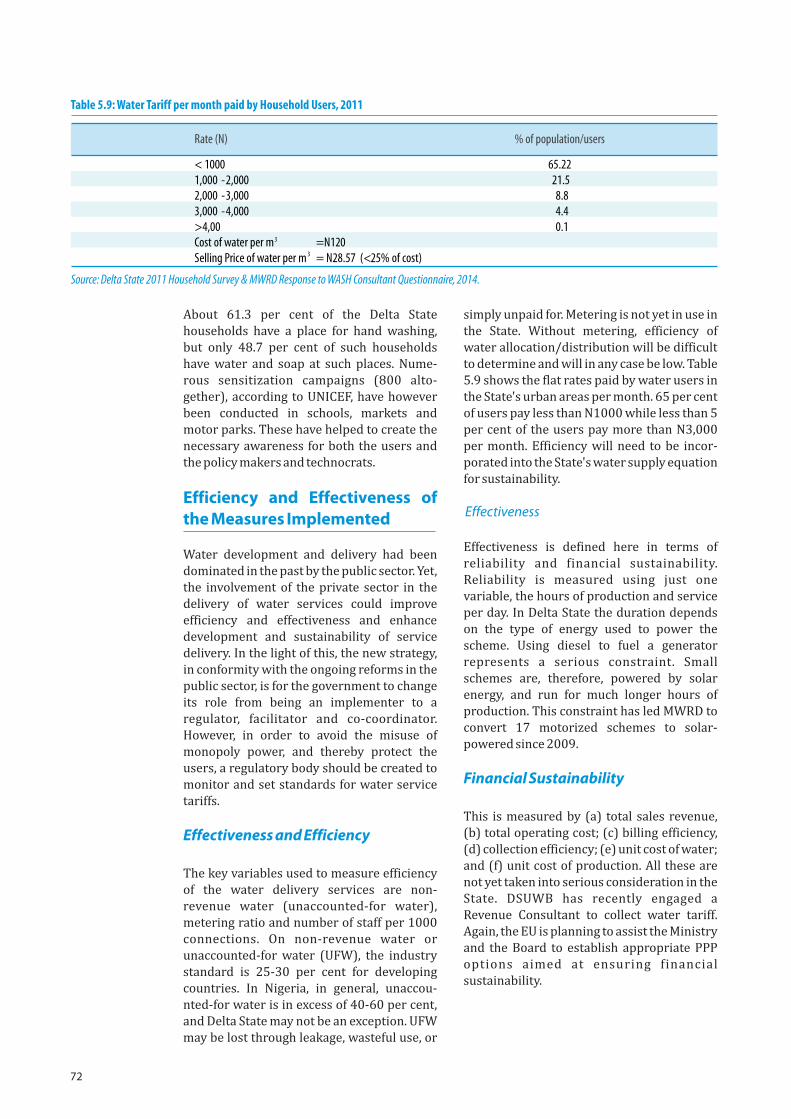
72
About 61.3 per cent of the Delta State households have a place for hand washing, but only 48.7 per cent of such households have water and soap at such places. Nume-rous sensitization campaigns (800 alto-gether), according to UNICEF, have however been conducted in schools, markets and motor parks. These have helped to create the necessary awareness for both the users and the policy makers and technocrats.
Efficiency and Effectiveness of the Measures Implemented
Water development and delivery had been dominated in the past by the public sector. Yet, the involvement of the private sector in the delivery of water services could improve efficiency and effectiveness and enhance development and sustainability of service delivery. In the light of this, the new strategy, in conformity with the ongoing reforms in the public sector, is for the government to change its role from being an implementer to a regulator, facilitator and co-coordinator. However, in order to avoid the misuse of monopoly power, and thereby protect the users, a regulatory body should be created to monitor and set standards for water service tariffs.
Effectiveness and Efficiency
The key variables used to measure efficiency of the water delivery services are non-revenue water (unaccounted-for water), metering ratio and number of staff per 1000 connections. On non-revenue water or unaccounted-for water (UFW), the industry standard is 25-30 per cent for developing countries. In Nigeria, in general, unaccou-nted-for water is in excess of 40-60 per cent, and Delta State may not be an exception. UFW may be lost through leakage, wasteful use, or
simply unpaid for. Metering is not yet in use in the State. Without metering, efficiency of water allocation/distribution will be difficult to determine and will in any case be low. Table 5.9 shows the flat rates paid by water users in the State's urban areas per month. 65 per cent of users pay less than N1000 while less than 5 per cent of the users pay more than N3,000 per month. Efficiency will need to be incor-porated into the State's water supply equation for sustainability.
Effectiveness
Effectiveness is defined here in terms of reliability and financial sustainability. Reliability is measured using just one variable, the hours of production and service per day. In Delta State the duration depends on the type of energy used to power the scheme. Using diesel to fuel a generator represents a serious constraint. Small schemes are, therefore, powered by solar energy, and run for much longer hours of production. This constraint has led MWRD to convert 17 motorized schemes to solar-powered since 2009.
Financial Sustainability
This is measured by (a) total sales revenue, (b) total operating cost; (c) billing efficiency, (d) collection efficiency; (e) unit cost of water; and (f) unit cost of production. All these are not yet taken into serious consideration in the State. DSUWB has recently engaged a Revenue Consultant to collect water tariff. Again, the EU is planning to assist the Ministry and the Board to establish appropriate PPP options aimed at ensuring financial sustainability.
Table 5.9: Water Tariff per month paid by Household Users, 2011
Rate (N) % of population/users
< 1000 65.22 1,000 -2,000 21.5 2,000 -3,000 8.8 3,000 -4,000 4.4 >4,00 0.1 Cost of water per m3 =N120 Selling Price of water per m = N28.57 (<25% of cost) 3
Source: Delta State 2011 Household Survey & MWRD Response to WASH Consultant Questionnaire, 2014.
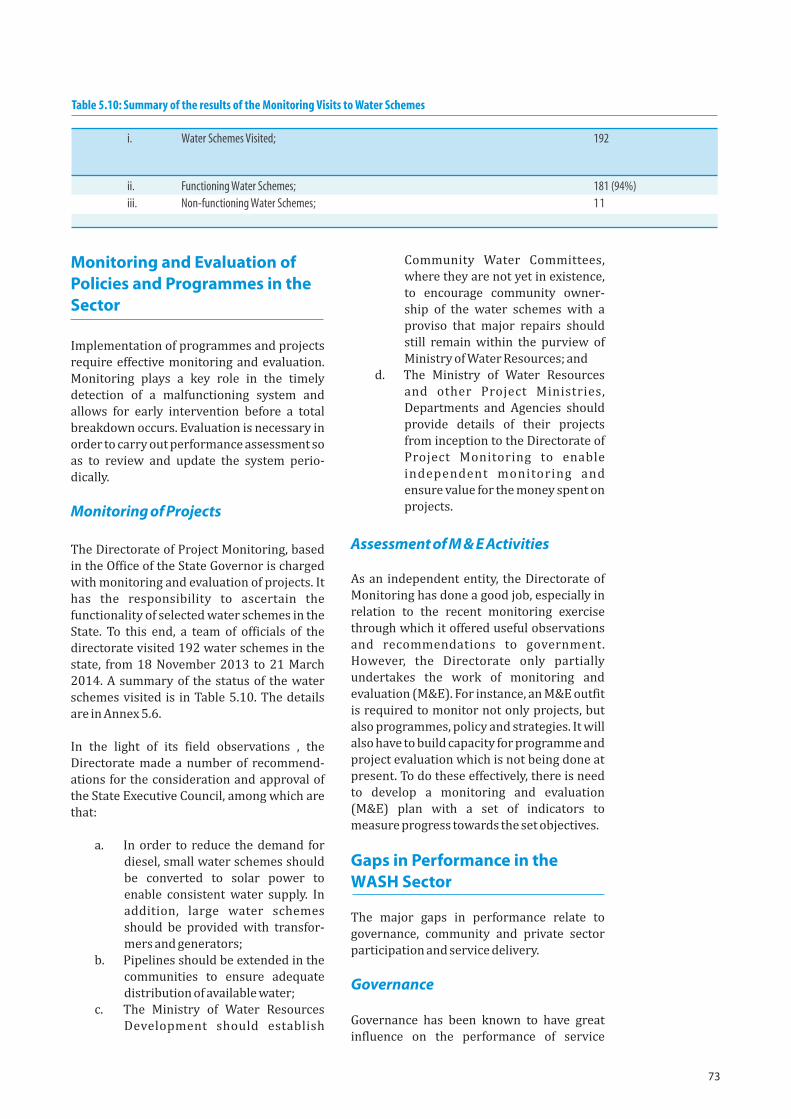
73
Monitoring and Evaluation of Policies and Programmes in the Sector
Implementation of programmes and projects require effective monitoring and evaluation. Monitoring plays a key role in the timely detection of a malfunctioning system and allows for early intervention before a total breakdown occurs. Evaluation is necessary in order to carry out performance assessment so as to review and update the system perio-dically.
Monitoring of Projects
The Directorate of Project Monitoring, based in the Office of the State Governor is charged with monitoring and evaluation of projects. It has the responsibility to ascertain the functionality of selected water schemes in the State. To this end, a team of officials of the directorate visited 192 water schemes in the state, from 18 November 2013 to 21 March 2014. A summary of the status of the water schemes visited is in Table 5.10. The details are in Annex 5.6.
In the light of its field observations , the Directorate made a number of recommend-ations for the consideration and approval of the State Executive Council, among which are that:
a. In order to reduce the demand for diesel, small water schemes should be converted to solar power to enable consistent water supply. In addition, large water schemes should be provided with transfor-mers and generators;
b. Pipelines should be extended in the communities to ensure adequate distribution of available water;
c. The Ministry of Water Resources Development should establish
Community Water Committees, where they are not yet in existence, to encourage community owner-ship of the water schemes with a proviso that major repairs should still remain within the purview of Ministry of Water Resources; and
d. The Ministry of Water Resources and other Project Ministries, Departments and Agencies should provide details of their projects from inception to the Directorate of Project Monitoring to enable independent monitoring and ensure value for the money spent on projects.
Assessment of M & E Activities
As an independent entity, the Directorate of Monitoring has done a good job, especially in relation to the recent monitoring exercise through which it offered useful observations and recommendations to government. However, the Directorate only partially undertakes the work of monitoring and evaluation (M&E). For instance, an M&E outfit is required to monitor not only projects, but also programmes, policy and strategies. It will also have to build capacity for programme and project evaluation which is not being done at present. To do these effectively, there is need to develop a monitoring and evaluation (M&E) plan with a set of indicators to measure progress towards the set objectives.
Gaps in Performance in the WASH Sector
The major gaps in performance relate to governance, community and private sector participation and service delivery.
Governance
Governance has been known to have great influence on the performance of service
Table 5.10: Summary of the results of the Monitoring Visits to Water Schemes
i. Water Schemes Visited; 192
ii. Functioning Water Schemes; 181 (94%) iii. Non-functioning Water Schemes; 11
74
delivery and even management of water resources, though no definite relationship can be defined. In Delta State, it is crucial to create and promote an inclusive and enabling environment for effective participation of all stakeholders such as communities of water users, NGOs and CSOs and, especially, the private sector through appropriate PPP options.
Community and Private Sector Participation
The efforts made to involve some commun-ities in the operation and maintenance of water schemes have been noted. More needs to be done to extend their involvement to other rural and small towns schemes. This sort of community participation is key to ownership and sustainable management of schemes. Of vital importance is the need to promote private sector participation through appropriate PPP options in charting a course towards adequate quantum and WASH service delivery.
Service Delivery
There are gaps in service delivery in spite of the tremendous effort, leadership and huge investments made in the sector. In less than six months from now, some of the gaps may be filled when ongoing new projects and renewed rehabilitation and reactivation of schemes are completed. However, for now, there remain gaps in all the three tiers of service: urban, small towns and especially rural areas. These gaps relate to the level of service in terms of litres per capita per day, and disparity between urban and rural areas of Delta State.
Besides the gaps in performance are a number of emerging issues that future actions in the sector should consider seriously. They include climate change and vulnerability, regional cooperation, including River Basin shared management, and rapid population growth which results every year in more Deltans who need to be watered, bathed, and fed.
Also worthy of note are some challenges/con-straints which tended to hinder performance. Notable among these are the acute problem of electric power supply, inadequate research and development activities on WASH challen-
ges, limited investment in environ-mental management and strengthening integrated water resource management systems.
Some Conclusions and Policy Recommendations
Much progress has been made in the WASH services delivery. This has been made possible largely by the effort of the state government through the Ministry of Water Resources Development. The multi-source investments in the sector have also helped as all the sources have made tangible contributions towards the realization of the sector's mandate and objectives. However, the proportion of the contributions from these other sources than MWRD is rather small compared with those in other states. Another important reason for the progress made is the total commitment of the leadership of MWRD to the State's Beyond Oil vision through sustainable infrastructural development. With the investments and programmes implemented since 2011, Delta State is most likely to achieve the adopted national MDG target of 77 per cent access to potable water by 2015.
The situation in sanitation is quite different: With less than 25 per cent access to improved sanitation, it is most unlikely that Delta State would meet the target of 63 per cent MDG target for basic sanitation by 2015. In order to change the status of sanitation from that of an orphan, stakeholders proposed during the well-attended WASH workshop that each MDA involved in sanitation and hygiene should appoint a desk officer to be empow-ered to work together under a standing inter-ministerial committee.
Even though the percentage of the population that has access to improved drinking water is impressive, the disparity between urban and rural areas remains high. The same conclusion applies to sanitation. Therefore, greater efforts will need to be made to cater for small towns and rural communities.
There are a number of important lessons to be drawn from the assessment, three of which are: (i) Availability of multiple sources of public funds for investing in the WASH sector is crucial for significant achievements; (ii) The regional approach to water supply development which is in line with global best practice is a desirable strategy which needs to
75
be extended to include rural communities; and (iii) Encouragement of private sector investments in the sector can enhance service delivery.
Also, the assessment threw up a number of policy recommendations, which include the need to select appropriate sources of water and technology to harness them and deliver
services to the people in a sustainable manner; and adoption of measures that will ensure long-term sustainability of services. The complete set of recommendations are discussed in Chapter 8.

76
77
Agricultural SectorAgriculture is of vital importance to the State's economy. About 75 per cent of the population depends on agriculture for their livelihood,
and the sector contributed about 13 per cent to the State's GDP in 2012, second to oil and gas which contributed about 79 per cent. Also,
the agricultural sector is key to the achievement of MDG 1, that is, eradicating extreme poverty and hunger by 2015, as well as the
promotion of employment opportunities in the State. The agricultural sector is currently targeted as a major pillar for achieving
economic transformation through the 'Delta Beyond Oil' Initiative.
6
Delta State has average rainfall that ranges from 1,910 mm in the northern areas to 2,670 mm in the coastal parts. The soil base provides a rich agricultural resource. The main agricultural commodities include arable crops (cassava, yam and maize), tree crops and perennials (oil palm, rubber, raffia palm and plantain), fruits and vegetables (pine-apple, citrus and tomato). While the people along the coastal areas are involved in artisanal fisheries, aquaculture is carried out throughout the State.
Reflecting the 'prime' importance accorded the agricultural sector by all the administ-rations during the period under review, the sector has witnessed a flurry of policies, strategies and programmes aimed at increasing agricultural production and productivity, generating employment and reducing poverty. The details of the programmes and projects are summarized in Annex 6.1.
Setting for Agricultural Activities
Agricultural activities in the State are conditioned by factors such as geography, topography and climate. In the light of this, crop production is dominated by upland (rain-fed) systems (80.4 per cent), while the shares of swampy (lowland) and irrigated land are 17.8 per cent and 1.8 per cent, respectively (Fig. 6.1). Cassava takes up the largest proportion of the cultivated area (135,725 ha) followed by yam (104,265 ha) and maize (90,190 ha). Besides the topography and climate, government policies and regulations have also been important influences on agriculture. The next three subsections examine the policy setting,
regulatory and institutional frameworks.
Policy Setting
At inception in 1991, Delta State inherited a number of agricultural initiatives from the defunct Bendel State. They included two farm settlements at Mbiri and Utagba-Uno; three communal farms at Deghele, Ogwashi-Uku and Irri-Emede; a College of Agriculture at Anwai-Asaba; an agricultural research station at Obior; a total of 6,866 hectares of oil palm plantation together with their oil palm mills at Cowan-Ajagbodudu, Nsukwa, Akwukwu-Igbo and Ubulu-Uku;, four tree crop units (oil palm, rubber), as well as some fishery sites.
Since 1991, the State has witnessed successive agricultural sector policies and strategies, aimed at promoting agricultural development for food security, employment generation, poverty reduction and economic diversification. Until 2006 when the State adopted its first definitive agricultural policy, the strategy for developing agriculture was based largely on case-specific programmes and projects. Two of the notable programmes initiated during the period 1991-2006 were the Rapid/Increasing Food Production Programme from 2001 and the Live and Own a Farm Programme from 2004.
In 2006, an Agricultural Policy was framed against the backdrop of the subsisting National Policy on Agriculture, 2001. The policy marked a significant turning point by defining the overall direction and goals of agricultural development and laying out the objectives, strategies and targets for various subsectors of agriculture and agricultural support services. It adopted en bloc the
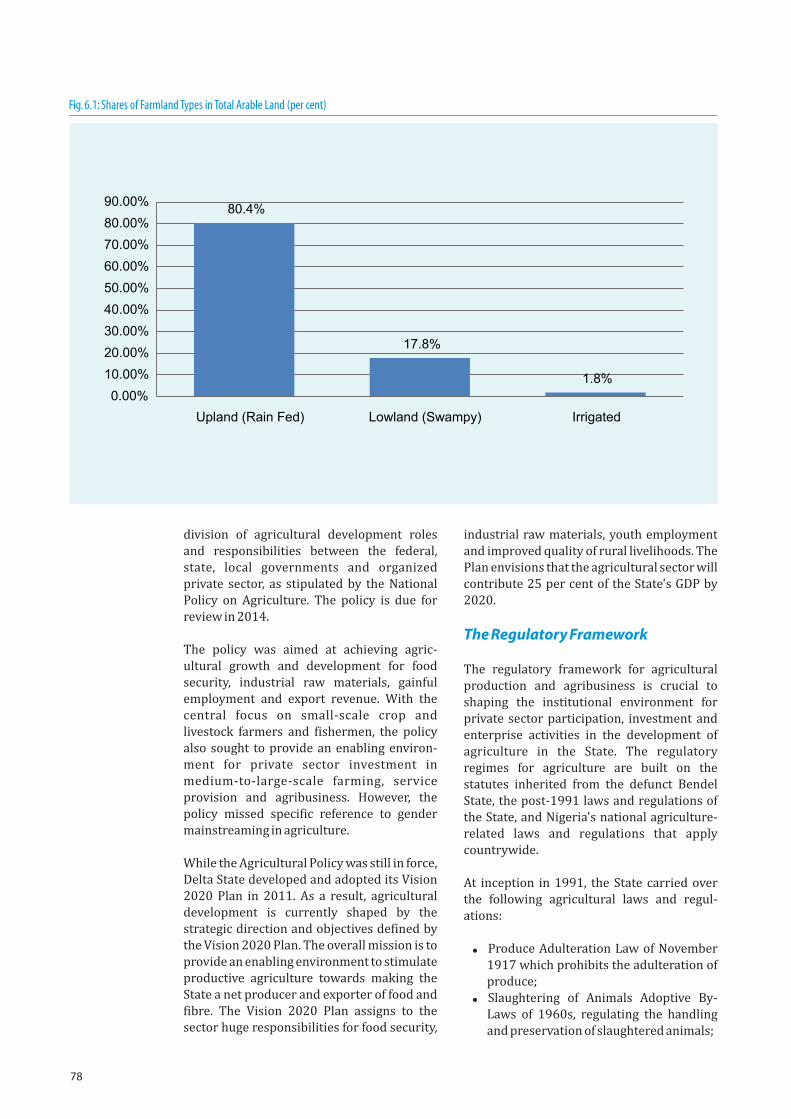
78
division of agricultural development roles and responsibilities between the federal, state, local governments and organized private sector, as stipulated by the National Policy on Agriculture. The policy is due for review in 2014.
The policy was aimed at achieving agric-ultural growth and development for food security, industrial raw materials, gainful employment and export revenue. With the central focus on small-scale crop and livestock farmers and fishermen, the policy also sought to provide an enabling environ-ment for private sector investment in medium-to-large-scale farming, service provision and agribusiness. However, the policy missed specific reference to gender mainstreaming in agriculture.
While the Agricultural Policy was still in force, Delta State developed and adopted its Vision 2020 Plan in 2011. As a result, agricultural development is currently shaped by the strategic direction and objectives defined by the Vision 2020 Plan. The overall mission is to provide an enabling environment to stimulate productive agriculture towards making the State a net producer and exporter of food and fibre. The Vision 2020 Plan assigns to the sector huge responsibilities for food security,
industrial raw materials, youth employment and improved quality of rural livelihoods. The Plan envisions that the agricultural sector will contribute 25 per cent of the State's GDP by 2020.
The Regulatory Framework
The regulatory framework for agricultural production and agribusiness is crucial to shaping the institutional environment for private sector participation, investment and enterprise activities in the development of agriculture in the State. The regulatory regimes for agriculture are built on the statutes inherited from the defunct Bendel State, the post-1991 laws and regulations of the State, and Nigeria's national agriculture-related laws and regulations that apply countrywide.
At inception in 1991, the State carried over the following agricultural laws and regul-ations:
! Produce Adulteration Law of November 1917 which prohibits the adulteration of produce;
! Slaughtering of Animals Adoptive By-Laws of 1960s, regulating the handling and preservation of slaughtered animals;
DRAFT
80.4%
17.8%
1.8%
0.00%
10.00%
20.00%
30.00%
40.00%
50.00%
60.00%
70.00%
80.00%
90.00%
Upland (Rain Fed) Lowland (Swampy) Irrigated
Fig. 6.1: Shares of Farmland Types in Total Arable Land (per cent)
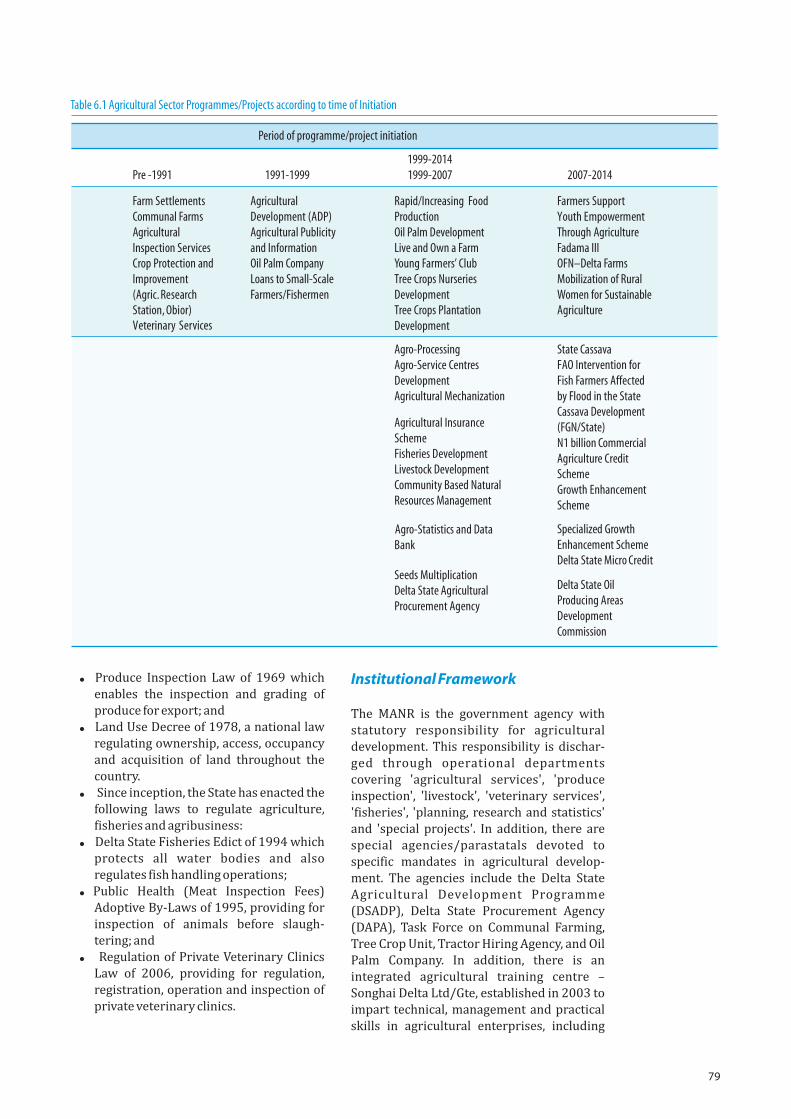
79
! Produce Inspection Law of 1969 which enables the inspection and grading of produce for export; and
! Land Use Decree of 1978, a national law regulating ownership, access, occupancy and acquisition of land throughout the country.
! Since inception, the State has enacted the following laws to regulate agriculture, fisheries and agribusiness:
! Delta State Fisheries Edict of 1994 which protects all water bodies and also regulates fish handling operations;
! Public Health (Meat Inspection Fees) Adoptive By-Laws of 1995, providing for inspection of animals before slaugh-tering; and
! Regulation of Private Veterinary Clinics Law of 2006, providing for regulation, registration, operation and inspection of private veterinary clinics.
Institutional Framework
The MANR is the government agency with statutory responsibility for agricultural development. This responsibility is dischar-ged through operational departments covering 'agricultural services', 'produce inspection', 'livestock', 'veterinary services', 'fisheries', 'planning, research and statistics' and 'special projects'. In addition, there are special agencies/parastatals devoted to specific mandates in agricultural develop-ment. The agencies include the Delta State Agricultural Development Programme (DSADP), Delta State Procurement Agency (DAPA), Task Force on Communal Farming, Tree Crop Unit, Tractor Hiring Agency, and Oil Palm Company. In addition, there is an integrated agricultural training centre – Songhai Delta Ltd/Gte, established in 2003 to impart technical, management and practical skills in agricultural enterprises, including
Period of programme/project initiation
Pre -1991
1991-1999 1999-2014 1999-2007 2007-2014
Farm Settlements Agricultural Development (ADP)
Communal Farms Agricultural Inspection Services
Agricultural Publicity and Information
Crop Protection and Improvement (Agric. Research Station, Obior)
Oil Palm Company
Loans to Small-Scale Farmers/Fishermen
Farmers Support Youth Empowerment Through Agriculture
Fadama III OFN–Delta Farms Mobilization of Rural Women for Sustainable Agriculture
Rapid/Increasing Food Production Oil Palm Development Live and Own a FarmYoung Farmers’ ClubTree Crops Nurseries DevelopmentTree Crops Plantation Development
Veterinary Services
State Cassava FAO Intervention for Fish Farmers Affected by Flood in the State
Cassava Development (FGN/State) N1 billion Commercial Agriculture Credit Scheme
Growth Enhancement Scheme
Specialized Growth Enhancement SchemeDelta State Micro Credit
Delta State Oil Producing Areas Development Commission
Agro-Processing Agro-Service Centres Development Agricultural Mechanization
Agricultural Insurance Scheme Fisheries DevelopmentLivestock DevelopmentCommunity Based Natural Resources Management
Agro-Statistics and Data Bank
Seeds Multiplication
Delta State Agricultural Procurement Agency
Table 6.1 Agricultural Sector Programmes/Projects according to time of Initiation
80
piggery, grass-cutter rearing, snailery, rabbitry, poultry, aquaculture, crop produc-tion and fabrication.The statutory organs of the MANR are often complemented by special purpose commit-tees dedicated to programme development and implementation. Furthermore, agricult-ural development in the oil producing areas of the State is supported by the Delta State Oil Producing Areas Development Commission (DESOPADEC). The Commission is currently implementing a programme, Delta State Economic Reintegration Programme (DESE-RP), comprising support for youth empower-ment through training and support for enterprises such as poultry, piggery and fishery. The programme also provides starter kits to graduates of the training.
An important rallying forum for agricultural development in the State is the State Council on Agriculture, which comprises all agricult-ural stakeholders – DSG agencies, LGAs, farmers associations, agro-dealers, commo-dity organizations and the organized private sector.
Rural Infrastructure
DSG has undertaken some high-value infrastructural projects to enhance the socio-economic development of the State. The Trans-Warri-Ode-Itsekiri Road for instance will open up and link over 10 riverine communities through mangrove swamps and difficult terrain. The Sapele-Abigborodo-Arowon Road has made it possible, for the first time, to access Abigborodo, a fishing community in Warri North LGA by land, the rehabilitation of the Warri Jetty as well as the cold rooms in Warri and Patani has facilitated the landing and handling of fish by fishermen. While these arterial roads and fisheries infrastructure have improved broad access to the rural areas, many producers are still challenged by poor access roads to link their farms to markets, the individual and comm-unal effort they make to ameliorate the situation notwithstanding. The poor electric power supply, a common problem all over Nigeria, is also a key constraint to efficient agricultural production and processing in the State. The few poultry farmers who can afford it, chill their processed birds at a very high cost using diesel-powered generators, while fish farmers are compelled to sell off their produce immediately after harvest also
because of inadequate electric power supply and cold room facilities.
Programmes and Interventions
Programmes and Inter ventions Initiated
The Delta State Government has formulated and/or implemented, singly or in collabor-ation with the federal government , development partners and the private sector almost 40 programmes and projects targeted at the agricultural sector. Table 6.1 lists the programmes and projects according to the time of initiation while Annex 6.1 presents the details of these interventions.
Most of the programmes were found to be relevant for addressing the challenges and problems of tackling the agriculture-related development needs of the State, including poverty reduction, food security and employ-ment generation. But the programme designs were often not robust, some being based on administrative pronouncements which were not translated into concrete design docu-ments that clearly indicate the objectives of the intervention and the targets to be achieved, the components and activities, implementation, institutional, monitoring and evaluation arrangements, partnerships and linkages to be fostered, and the estimated cost and duration of the intervention.
The pace of implementation of many inter-ventions was determined by actual budget releases which often differed remarkably from the budgetary provisions. Funding for many programmes was inadequate, some remaining unfunded continuously for some years and, hence, requiring considerable amounts for rehabilitation or renovation.
Some programmes and projects that were targeted at the agricultural sector were not under the full implementation control of the MANR. An example is the Youth Empower-ment through Agriculture (YETA) whose implementation committee was chaired by His Excellency, the Governor. The diffuse ownership arrangement made it difficult for the MANR to be held fully accountable for implementation lapses.
Eligibility and selection criteria were either
81
not clearly stated upfront or not sufficiently publicized to potential beneficiaries of the interventions. Even when the criteria were articulated on paper, they were not rigorously applied during the selection process in some programmes. This resulted in the selection of unsuitable programme participants; hence the high drop-out rates. Many participants, including local governments, considered government projects as their share of the 'national cake' and were unwilling to make the counterpart contributions that would have demonstrated ownership of project activities and enhanced the sustainability of the results. Private sector participation in project implementation was also limited, notably to two projects, the leasing of the oil palm plantations and the renting out of the fish cold room facilities at Warri and Patani to private operators.
Relevance and Adequacy of Policies and Strategies
This issue is examined with respect to stance of policy and strategy, inventory of agric-ultural resources and materials, agric-ultural loans, government subsidies, and the value chain angle.
Inventory of agricultural resources and potentials. The agricultural potentials of the State are fairly well documented. While the MANR has produced a number of documents that show the State's agricultural potentials, the Delta State General Economic Atlas shows some spatial mapping of the agricultural potentials/resources. Still, there is a large scope for resource and commodity mapping. In particular, there is a need to develop soil maps as a basis for the planning of crop cultivation in the State.
Stance of policy and strategy. Evidence shows that agricultural development in the State has been driven heavily by the public sector, through the MANR, its parastat-als/agencies and special task forces. While public sector intervention is a legitimate strategy to promote agricultural develop-ment, caution needs to be exercised to avoid precipitating a vicious farmer dependency on government services and support. Besides, there is the risk of crowding out private sector involvement.
The value chain angle. The policies and
programmes bear some value chain approach to agricultural development. Various agricul-tural development programmes support processing and linkages between the farm and downstream activities and facilities. An important dimension is the provision of financial and technical assistance in the establishment of processing centres in producer communities across the State. For instance, the DSG in 2001 established cassava processing centres in nine locations, including Obomkpa, Owa-Alero, Otefe, Edjekota-Ogor, Owhe-Ologbo, Aviara, Kwale, Abavo and Oria-Abraka.
But, there appears to be less emphasis on integrating production and processing based on a holistic approach to value chain development. Multi-stakeholder collabor-ation between farmers, local communities, state and federal governments, provides a highly promising approach to significantly enhance farm linkages with value-adding processing and marketing activities.
Design and administration of government subsidies. Government subsidies ranging up to 50 per cent have been applied for agric-ultural inputs, equipment and implements, physical facilities and cash loans. The design and administration of these subsidies, however, do not seem to satisfy 'equity', 'efficiency' and 'sustainability' requirements. The selection of beneficiaries is distorted, thereby leading to high incidence of unintended beneficiaries, which led to high failure and drop-out rates, for example, in YETA. The efficiency (value-for-money) of the subsidy administration is muted by government's direct procurement of inputs, materials and equipment on behalf of the beneficiaries.
Agricultural loans. Loans are an integral component of the government's strategy to support agricultural production and poverty reduction. But, the effectiveness of the loan programmes is compromised by three major shortcomings: inappropriate design, poor targeting and administration, and lack of information. According to the Delta State 2011 Household and Housing Survey, only 2.3 per cent of farmers obtained formal agric-ultural loans in the State. This implies that the overwhelming majority of farmers do not benefit from the existing agricultural loan interventions of the federal and state
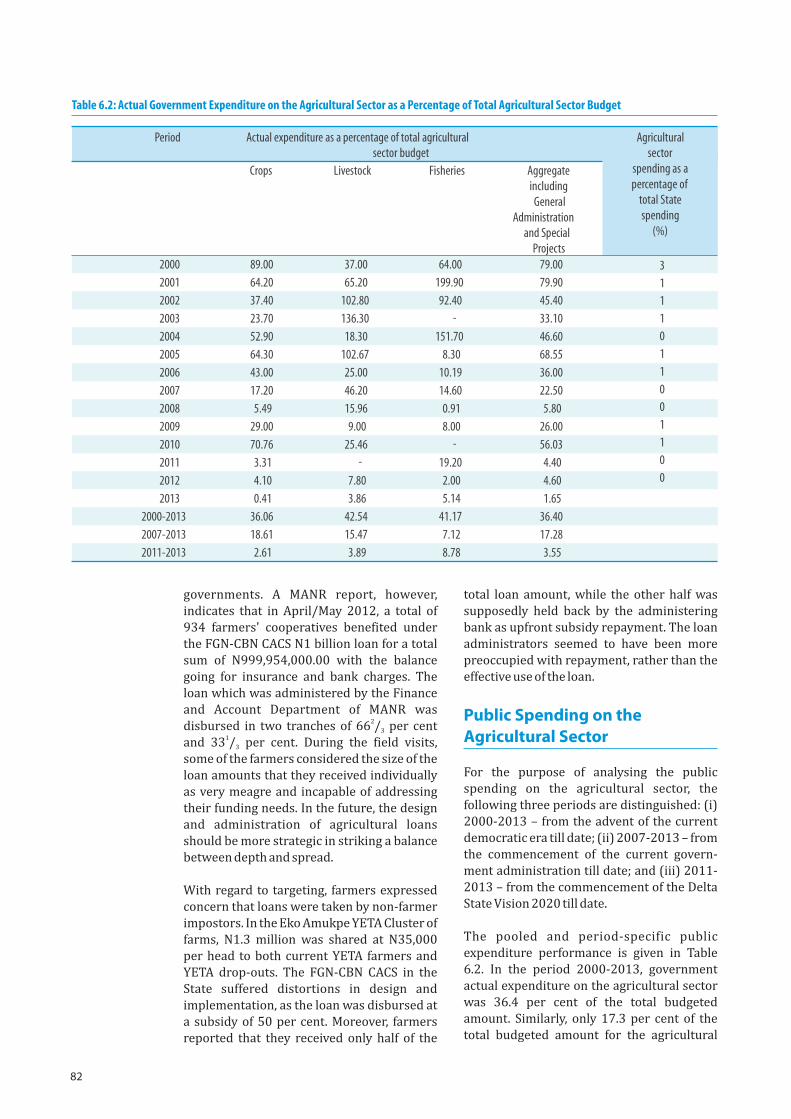
82
governments. A MANR report, however, indicates that in April/May 2012, a total of 934 farmers' cooperatives benefited under the FGN-CBN CACS N1 billion loan for a total sum of N999,954,000.00 with the balance going for insurance and bank charges. The loan which was administered by the Finance and Account Department of MANR was
2disbursed in two tranches of 66 / per cent 31and 33 / per cent. During the field visits, 3
some of the farmers considered the size of the loan amounts that they received individually as very meagre and incapable of addressing their funding needs. In the future, the design and administration of agricultural loans should be more strategic in striking a balance between depth and spread.
With regard to targeting, farmers expressed concern that loans were taken by non-farmer impostors. In the Eko Amukpe YETA Cluster of farms, N1.3 million was shared at N35,000 per head to both current YETA farmers and YETA drop-outs. The FGN-CBN CACS in the State suffered distortions in design and implementation, as the loan was disbursed at a subsidy of 50 per cent. Moreover, farmers reported that they received only half of the
total loan amount, while the other half was supposedly held back by the administering bank as upfront subsidy repayment. The loan administrators seemed to have been more preoccupied with repayment, rather than the effective use of the loan.
Public Spending on the Agricultural Sector
For the purpose of analysing the public spending on the agricultural sector, the following three periods are distinguished: (i) 2000-2013 – from the advent of the current democratic era till date; (ii) 2007-2013 – from the commencement of the current govern-ment administration till date; and (iii) 2011-2013 – from the commencement of the Delta State Vision 2020 till date.
The pooled and period-specific public expenditure performance is given in Table 6.2. In the period 2000-2013, government actual expenditure on the agricultural sector was 36.4 per cent of the total budgeted amount. Similarly, only 17.3 per cent of the total budgeted amount for the agricultural
Table 6.2: Actual Government Expenditure on the Agricultural Sector as a Percentage of Total Agricultural Sector Budget
Period Actual expenditure as a percentage of total agricultural
sector budget Crops Livestock Fisheries Aggregate
including General
Administration and Special
Projects 2000 89.00 37.00 64.00 79.00 3
2001 64.20 65.20 199.90 79.90 1 2002 37.40 102.80 92.40 45.40 1 2003 23.70 136.30 - 33.10 1
2004 52.90 18.30 151.70 46.60 0
2005 64.30 102.67 8.30 68.55 1
2006 43.00 25.00 10.19 36.00 1
2007 17.20 46.20 14.60 22.50 0
2008 5.49 15.96 0.91 5.80 0
2009 29.00 9.00 8.00 26.00 1
2010 70.76 25.46 - 56.03 1
2011 3.31 - 19.20 4.40 0
2012 4.10 7.80 2.00 4.60 0
2013 0.41 3.86 5.14 1.65
2000-2013 36.06 42.54 41.17 36.40
2007-2013 18.61 15.47 7.12 17.28
2011-2013 2.61 3.89 8.78 3.55
Agricultural sector
spending as a percentage of
total State spending
(%)
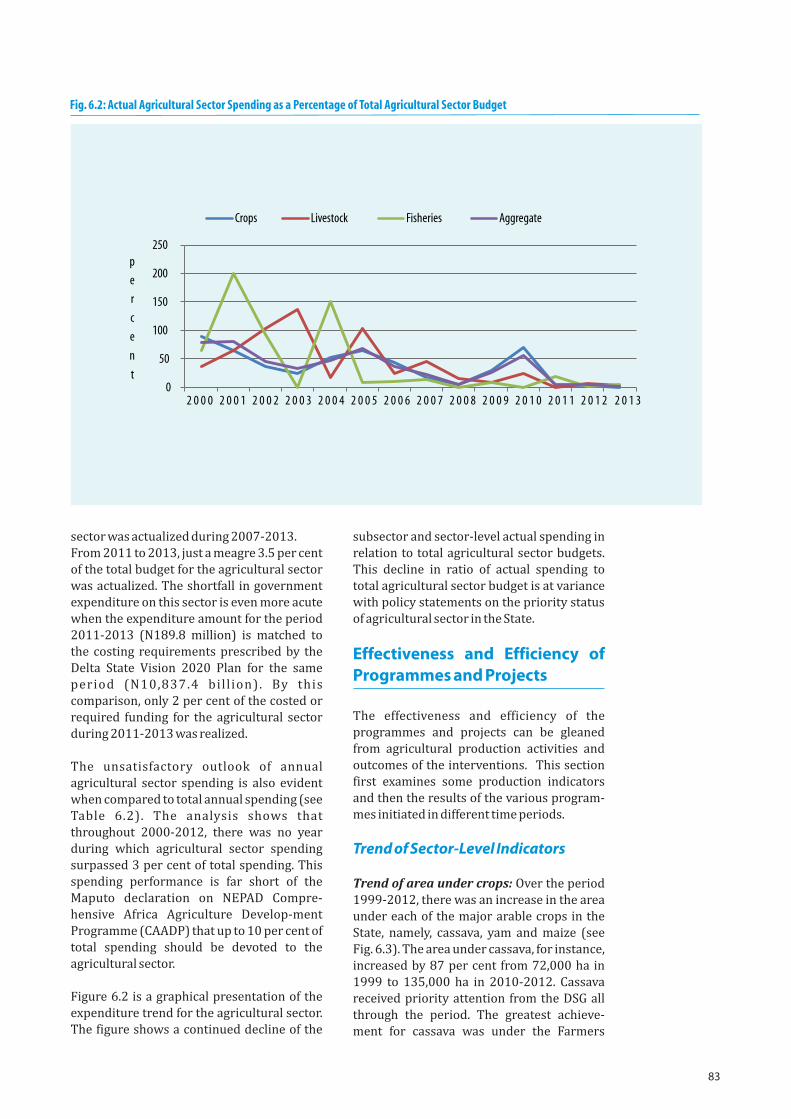
83
sector was actualized during 2007-2013. From 2011 to 2013, just a meagre 3.5 per cent of the total budget for the agricultural sector was actualized. The shortfall in government expenditure on this sector is even more acute when the expenditure amount for the period 2011-2013 (N189.8 million) is matched to the costing requirements prescribed by the Delta State Vision 2020 Plan for the same period (N10,837.4 bil l ion). By this comparison, only 2 per cent of the costed or required funding for the agricultural sector during 2011-2013 was realized.
The unsatisfactory outlook of annual agricultural sector spending is also evident when compared to total annual spending (see Table 6.2). The analysis shows that throughout 2000-2012, there was no year during which agricultural sector spending surpassed 3 per cent of total spending. This spending performance is far short of the Maputo declaration on NEPAD Compre-hensive Africa Agriculture Develop-ment Programme (CAADP) that up to 10 per cent of total spending should be devoted to the agricultural sector.
Figure 6.2 is a graphical presentation of the expenditure trend for the agricultural sector. The figure shows a continued decline of the
subsector and sector-level actual spending in relation to total agricultural sector budgets. This decline in ratio of actual spending to total agricultural sector budget is at variance with policy statements on the priority status of agricultural sector in the State.
Effectiveness and Efficiency of Programmes and Projects
The effectiveness and efficiency of the programmes and projects can be gleaned from agricultural production activities and outcomes of the interventions. This section first examines some production indicators and then the results of the various program-mes initiated in different time periods.
Trend of Sector-Level Indicators
Trend of area under crops: Over the period 1999-2012, there was an increase in the area under each of the major arable crops in the State, namely, cassava, yam and maize (see Fig. 6.3). The area under cassava, for instance, increased by 87 per cent from 72,000 ha in 1999 to 135,000 ha in 2010-2012. Cassava received priority attention from the DSG all through the period. The greatest achieve-ment for cassava was under the Farmers
0
50
100
150
200
250
2 0 0 0 2 0 0 1 2 0 0 2 2 0 0 3 2 0 0 4 2 0 0 5 2 0 0 6 2 0 0 7 2 0 0 8 2 0 0 9 2 0 1 0 2 0 1 1 2 0 1 2 2 0 1 3
p
e
r
c
e
n
t
Crops Livestock Fisheries Aggregate
Fig. 6.2: Actual Agricultural Sector Spending as a Percentage of Total Agricultural Sector Budget
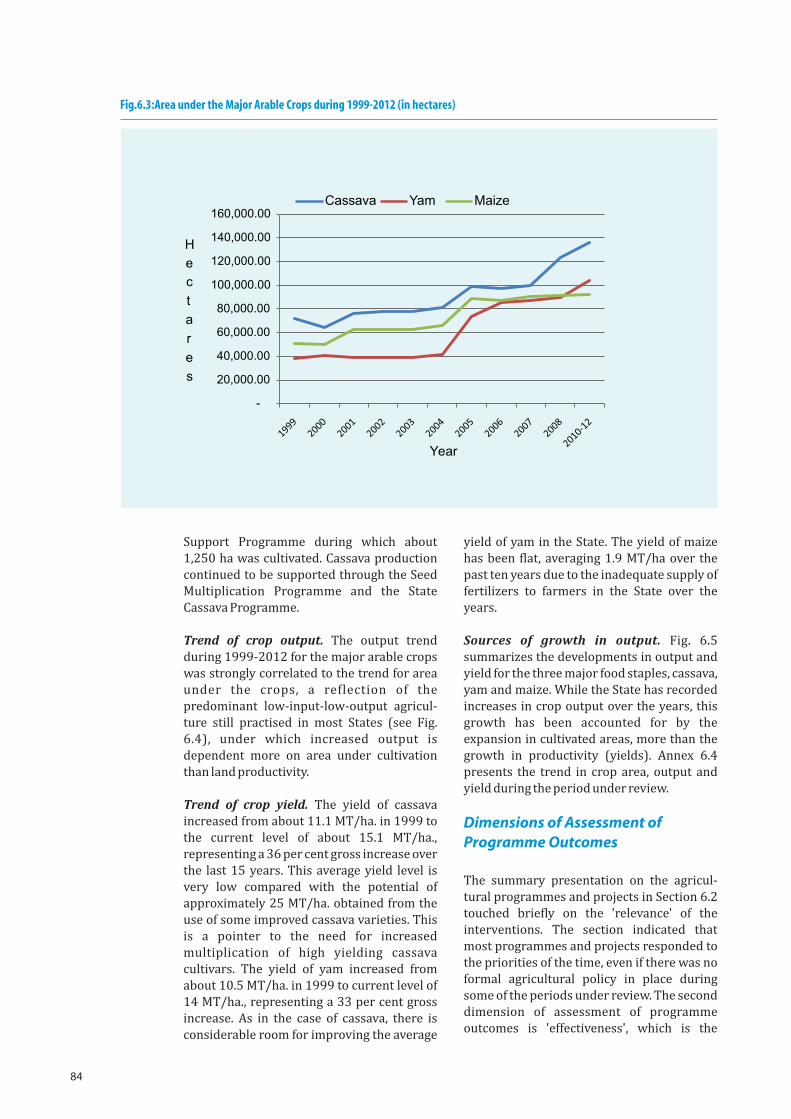
84
Support Programme during which about 1,250 ha was cultivated. Cassava production continued to be supported through the Seed Multiplication Programme and the State Cassava Programme.
Trend of crop output. The output trend during 1999-2012 for the major arable crops was strongly correlated to the trend for area under the crops, a reflection of the predominant low-input-low-output agricul-ture still practised in most States (see Fig. 6.4), under which increased output is dependent more on area under cultivation than land productivity.
Trend of crop yield. The yield of cassava increased from about 11.1 MT/ha. in 1999 to the current level of about 15.1 MT/ha., representing a 36 per cent gross increase over the last 15 years. This average yield level is very low compared with the potential of approximately 25 MT/ha. obtained from the use of some improved cassava varieties. This is a pointer to the need for increased multiplication of high yielding cassava cultivars. The yield of yam increased from about 10.5 MT/ha. in 1999 to current level of 14 MT/ha., representing a 33 per cent gross increase. As in the case of cassava, there is considerable room for improving the average
yield of yam in the State. The yield of maize has been flat, averaging 1.9 MT/ha over the past ten years due to the inadequate supply of fertilizers to farmers in the State over the years.
Sources of growth in output. Fig. 6.5 summarizes the developments in output and yield for the three major food staples, cassava, yam and maize. While the State has recorded increases in crop output over the years, this growth has been accounted for by the expansion in cultivated areas, more than the growth in productivity (yields). Annex 6.4 presents the trend in crop area, output and yield during the period under review.
Dimensions of Assessment of Programme Outcomes
The summary presentation on the agricul-tural programmes and projects in Section 6.2 touched briefly on the 'relevance' of the interventions. The section indicated that most programmes and projects responded to the priorities of the time, even if there was no formal agricultural policy in place during some of the periods under review. The second dimension of assessment of programme outcomes is 'effectiveness', which is the
-
20,000.00
40,000.00
60,000.00
80,000.00
100,000.00
120,000.00
140,000.00
160,000.00
H
e
c
t
a
r
e
s
Year
Cassava Yam Maize
Fig.6.3: Area under the Major Arable Crops during 1999-2012 (in hectares)
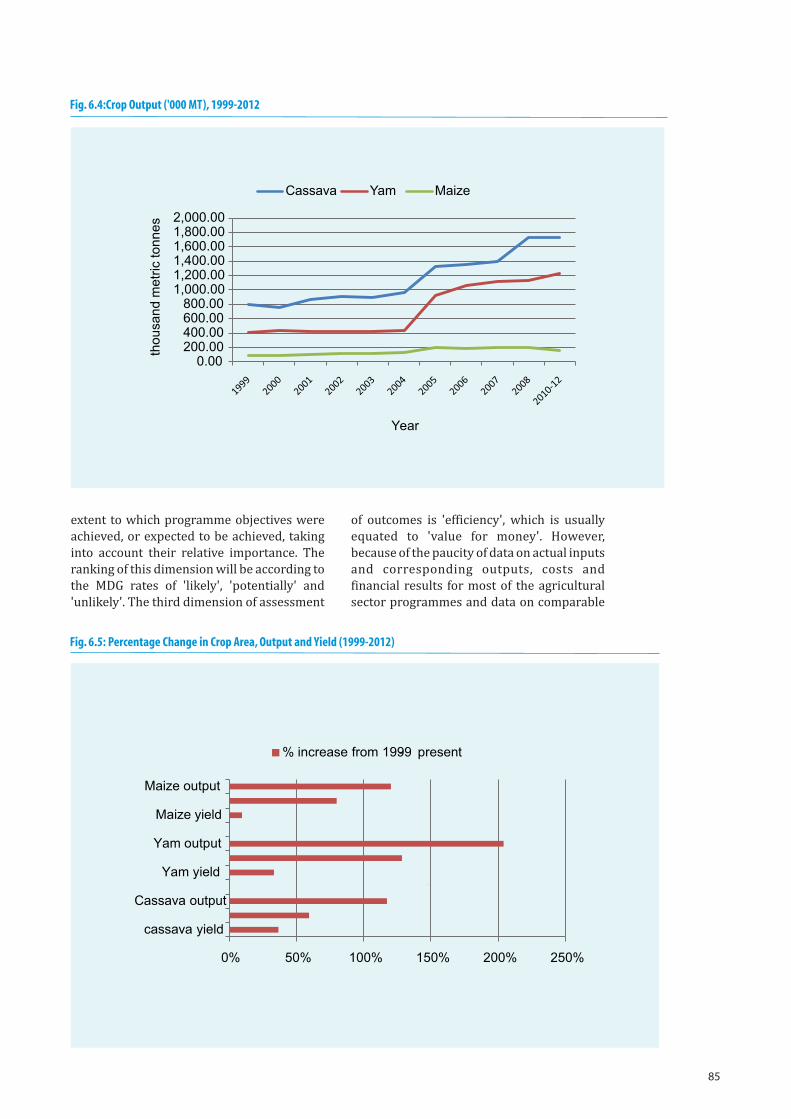
85
extent to which programme objectives were achieved, or expected to be achieved, taking into account their relative importance. The ranking of this dimension will be according to the MDG rates of 'likely', 'potentially' and 'unlikely'. The third dimension of assessment
of outcomes is 'efficiency', which is usually equated to 'value for money'. However, because of the paucity of data on actual inputs and corresponding outputs, costs and financial results for most of the agricultural sector programmes and data on comparable
0.00200.00400.00600.00800.00
1,000.001,200.001,400.001,600.001,800.002,000.00
tho
usa
nd m
etr
ic to
nn
es
Year
Cassava Yam Maize
Fig. 6.4: Crop Output ('000 MT), 1999-2012
DRAFT
0% 50% 100% 150% 200% 250%
cassava yield
Cassava output
Yam yield
Yam output
Maize yield
Maize output
% increase from 1999- present
Fig. 6.5: Percentage Change in Crop Area, Output and Yield (1999-2012)
86
interventions, this assessment does not undertake a rigorous analysis of the efficiency dimension.
The rating of the programmes presented in the following subsections draws from the data made available to the assessment team by officials of the MANR and other agencies, as well as primary data collected during consultations with focal groups and key informants during the field visit. The assessment will be applied to 16 programmes out of the 38 programmes highlighted in Section 6.2. The selected programmes are considered by the assessment team either to be big-ticket items or considered by the DSG and other stakeholders as strategic interven-tions.
Results of Programmes Initiated before the Creation of Delta State
The Farm Settlement Scheme. This aimed at: (i) Providing contiguous land for medium-scale production to boost food security and improve the economy; (ii) Creating employ-ment; and (iii) Encouraging trained youth to live in settlements. Available data indicate that during 1999-2003, N21.6 million was spent on projects in three settlements, Mbiri, Utagbo-Uno and Okunigbo, and 85 ha. of oil palm plantations were established at Mbiri and Utagbo-Uno. The full attainment of the objectives of the farm settlement schemes is rated as 'unlikely', especially considering that other programmes initiated after 1991 are competing with the schemes for the attainment of similar objectives.
Communal Farms. The objective of the communal farms is to assist youths in communities to establish farms as business ventures, in order to provide employment, curb youth restiveness, and reduce poverty. During 1999-2003, more than 2,000 ha of land was cultivated by 223 participant farmers in three communal farms (Ogwashi-Uku, Irri/Aviara and Deghele). Based on the interaction with beneficiaries, the achieve-ment of the objectives of the communal farms is rated as 'likely'. However, there is a need for better communication with the participants and more efficient and timely government facilitation of access to inputs and financial resources.
Assessment Results of Programmes Initiated from 1991-1999
Delta State Agricultural Development Programme (DSADP). This World Bank-assisted programme was meant to be the major extension arm of the MANR to ensure accelerated agricultural production by small-scale farmers, although it also provided a base to support the implementation of other projects. Two of the many achievements of the DSADP are the training and retraining of extension workers and the provision of mobility (200 motorcycles in 2008) to the workers to facilitate their assignments, and outreach to about 4,273 families with agricultural information and technologies. Inadequate funding was, however, a chal-lenge. Over the period 1996-2014, the government released only 66 per cent of the N1 billion budget for the programme. In 2003, 2007 and 2009-2012, there was no release of funds to the DSADP. During the field visits, there were complaints by many farmer groups about inadequate extension services. Other farmers, however, saw DSADP as a more credible organization for channelling govern-ment resources to farmers in an equitable manner. The issue of shortfall in the number of extension agents is a national concern which the Federal Ministry of Agriculture has tried to address in the interim by recruiting and training some extension agents (EAs) out of which 11 have been assigned to Delta State. The Federal Ministry of Agriculture has also distributed 22 motorcycles to Delta State which will be allocated soon to extension agents. To ensure an even distribution of extension information, DSADP has allocated two cells to each EA since the State has only 83 EAs as against the 200 cells proposed by the FAO delineation policy. The rating of performance is 'potentially likely', based on continued commitment by the DSG to provide effective extension services to small-scale farmers in support of the diverse agricultural programmes being implemented.
The Oil Palm Company. This company was established for the effective management of the four oil palm estates covering 6,866 ha. inherited from the defunct Bendel State. Leases, each for 25 years, were done in line with the privatization policy of the DSG. The leases yielded about N96.5 million to the DSG as at 2013. The performance of the programme 'likely' rating, but the govern-
87
ment would need to monitor closely the terms of the leases to ensure that the programme yields adequate revenue and is effectively managed.
Loans to Small Scale Farmers/Fishermen. The aim of this programme, which was implemented between 1993 and 2004, was to increase farmers' production by raising their capital base, and overcoming the challenge of collateral requirements. In 1993, 1998, 2000 and 2004, a cumulative loan amount of N20.2 million was disbursed to 109 farmers/fish-ermen cooperatives and 798 individual farmers. The recovery rate for the loan tranches was 19 per cent, 0.1 per cent, 32 per cent, and 66 per cent, respectively. The unacceptably low recovery rates were attributed by the MANR to lack of mobility for field officers for effective loan recovery. The assessment team noticed considerable commendation by farmers for the implem-entation of the programme, attributed to a more equitable distribution of the 'national cake', but without any serious intention of paying back the loan. The performance of the programme is rated as 'potentially likely'.
Assessment Results of Programmes Initiated during 1999-2014
Rapid/Increasing Food Production Programme (R/IFPP). This programme, implemented during 2001-2003, aimed at quickly bridging the gap in food production and demand and preventing imminent famine in 2001. The programme supported crop development through mechanized land preparation, provision of improved see-ds/seedlings, fertilizers and chemicals; piggery and poultry development through the supply of improved breeding stock; and fisheries development through the provision of fingerlings and inputs, all at 50 per cent subsidy. A total of N200 million was released for the programme out of the approved N295.5 million. The programme is rated as 'likely' to have achieved the objective of rapidly increasing food production, even if the administration of the subsidy might be unsustainable.
Oil Palm Development. This programme, which started in 2001, is aimed at reviving the dwindling production of oil palm in the State by giving loans to farmers at low interest rates. About N91.7 million was disbursed to
396 farmers at an interest rate of 5 per cent in 2001 to cultivate 1,000 ha. A total of 7,339 ha. is estimated to have been planted or replanted under the programme. Specifically, in 2012, 957 farmers were assisted to plant 6,029 ha. with an estimated output of 47,273 MT. The programme is rated as being 'likely' to achieve the objective considering the increased cultivation of oil palm over the years.
Live and Own a Farm (LOAF). This programme, which was implemented during 2004-2007, aimed at encouraging Deltans to engage in farming activities for increased agricultural production. A total of N422.8 million was released out of the N475.6 million approved in 2005 for the programme. About 1,382 farmers were assisted in oil palm, food crop, poultry, piggery and fisheries produc-tion as well as agro-processing. Some of the implementation constraints faced by LOAF were: late release of funds, dearth of fertilizers, and high mortality of chicks due to wrong sexing at the hatcheries. The perfor-mance of the programme in achieving its objectives is rated as 'likely'. A g r i c u l t u r a l M e c h a n i z a t i o n . T h i s programme aimed at making mechanized farm services available and affordable throu-gh subsidized services offered at Tractor Hire Centres. Although considerable investments have been made in this programme, farmers still complained bitterly about the non-availability of affordable tractor services. The performance of this programme is rated as 'unlikely'.
Livestock Development. The programme aims at multiplying breeds of livestock and distributing them to farmers for increased livestock production. Pig weaners, day-old chicks, point-of-lay birds, and goat growers were distributed to farmers at subsidy. The programme is rated as being 'likely' to achieve its objective.
Fisheries Development. The aim of this programme is to develop the fisheries potential of the State and help reduce protein deficiency in the diet of the citizenry. Although considerable effort has been put into hatchery production, distribution of subsidized fingerlings and inputs for fishermen, establishment of fish cluster farms and provision of cold storage facilities in
88
Warri and Patani, performance of this programme is rated as 'potentially likely'.
Delta State Agricultural Procurement Agency (DAPA). This agency was established to supply price competitive agricultural inputs, especially fertilizer, to farmers. During 1999-2003, N113.7 million was spent on fertilizer procurement and distribution. Between 2007 and 2013, N887.8 million was spent on the procurement and distribution of various inputs, mainly subsidized fertilizer. Nevertheless, DAPA is rated as being 'unlikely' to achieve its objective since the sustain-ability of its business operations is anchored on the adequacy of supply of its major commodity, fertilizer, over which it has little control. There are opportunities for the agency to function as a major agro-dealer under the new input voucher scheme.
Farmers Support Programme (FSP). This programme, managed jointly with YETA, aims at empowering farmers to improve agricultural production through the provision of soft loans for working capital as well as farm inputs. A total of N600 million was approved in August 2008 for the first phase of FSP, out of which N480 million was disbursed as loans and inputs subsidized at 50 per cent to 3,921 farmers between September 2008 and April 2009. Although farmers showed appreciation for the programme during the field visits of the assessment team, repayment was very low. As at April 2009, only 8 per cent of the subsidy portion of the loans had been repaid. The MANR informed the assessment team that His Excellency the Governor, who chaired the Implementation Committee, selected the participating micro-finance banks for the loan component and the implementation of the component was an autonomous activity that had no bearing with the MANR. The MANR also expressed surprise at the assessment team's observation that some of the banks held back part of the money as upfront payment without observing the required period of moratorium.
YETA. This programme, which started in 2008, aimed at encouraging youths to take up agriculture as a profession. Youths were trained, organized into clusters, provided farm infrastructure and enterprise package, and given a monthly stipend. The programme has gone through two phases: Phase 1 (2008/2009) involving about 450 youths for
which N600 million was approved in October 2008; and Phase 2 (2010/2011) for 500 youths with an approved budget of N1.1 billion. During the field visits, a high drop-out rate from the programme, caused by poor selection of participants, was observed. In one cluster, for the poultry enterprise, only two people were left out of the six in the 2008/2009 set. In another cluster, for the fisheries enterprise, there was a 100 per cent drop-out, involving all the four members of the 2008/2009 set and all the eight members of the 2010/2011 set.
However, the team observed some positive outcomes for the YETA members that endured the challenges of the programme. Some have expanded their operations to the poultry and piggery pens left behind by the drop-outs, and employed extra hands to run the enterprises. Others have procured generators to enhance the security of the enterprises. The assessment team rates YETA as ‘potentially likely’ to achieve its objective if a thorough evaluation is done before going into another phase.
Mobil ization of Rural Women for Sustainable Agriculture (MORWSA). This programme is selected for analysis because of its clear gender focus. The objective of MORWSA is to harness the potential of women for agricultural production and processing through sensitization, mobiliza-tion and empowerment. Since the commence-ment of MORWSA in 2009, 37 women groups have been mobilized and various processing machines, fish fingerlings and feed distri-buted to some of the groups free. The programme is rated as ‘potentially likely’ to achieve its objectives.
Fadama III. This programme is an example of collaboration between the DSG, the federal government and a donor partner, the World Bank. Fadama III took off in 2008 with the objective of increasing the income of the rural poor on a sustainable basis. From the adoption surveys conducted in 2012/2013, there are indications that the programme’s objectives will be achieved. The survey report indicates a 39 per cent increase in income of participants and yield increases of major crops in the range of 14 per cent for maize, 18 per cent for cassava, 24 per cent for fisheries and 30 per cent for goats. State counterpart fund contributions have been fair, 88 per cent
89
of the budget of N281.8 million for 2009-2013 having been paid. The challenge with funding has been with the LGAs. Fadama III is rated being ‘likely’ to achieve its objectives, especially with the programme now working in collaboration with another World Bank-assisted project, the State Employment and Expenditure for Results (SEEFOR).
Self-Assessment by Officials of the MANR
Top officials of the MANR were asked to provide own assessment of the extent of implementation of the State Agricultural Policy in 2006 by ranking the respective strategies in the policy on a 3-point scale of implementation status of low, moderate and high. This approach to policy assessment is significant for eliciting policy implementers' views and impressions on the progress of policy implementation. The results show that the officials assessed the performance of the implementation of the Agricultural Policy as generally poor, as shown in Annex 6.3. The implementation of strategies and measures under food crops and livestock had relatively better ratings than agricultural land policy, agricultural research and agricultural mechanization. A high rating was recorded only for the implementation of strategies under agricultural cooperatives.
Challenges to Performance
The notable challenges that have tended to constrain performance would need to be tackled. Among them are the following:
! Inadequate and irregular funding both at the MANR administrative level and at the operational level of programme implem-entation.
! Poor monitoring and feedback arrange-ments. Programme beneficiaries are not followed-through in a proactive and corrective manner.
! Poor rural infrastructure, especially roads and electricity, for value addition and access to markets.
! Poor access to sustainable financial services by farmers and other rural entrepreneurs and poor design and administration of loans.
Agricultural Sector Performance in Relation to the MDGs
According to the National Bureau of Statistics' Poverty Profile of Nigeria 2010, the poverty rate in Delta State was 53.8 per cent in 2009/2010, lower than the national poverty rate of 62.6 per cent.
The target of halving extreme poverty by 2015 translates to 21.4 per cent poverty rate by 2015 (see Nigeria MDG Report 2013). Delta State, like other states of the country, is lagging far behind the MDG1 target on poverty reduction. However, progress is being made, given that poverty has reduced from 70.6 per cent in 2003/2004 to 53.8 per cent in 2009/2010. This might be partly due to some outcome from the agricultural development efforts of the DSG considering that the large majority of the poor is engaged in the agricultural sector. Food security (hunger index) is measured as the proportion of Under-5 children that are underweight. The National Demographic and Health Survey 2008 estimated the proportion of Under-5 children that are underweight in Delta State at 13.4 per cent, which is less than half of the national rate estimated at 27.4 per cent. It is, therefore, evident that Delta State is achieving much more than the overall national levels in terms of reducing extreme hunger. Never-theless, there is a huge opportunity for agricultural development to further contrib-ute to the MDG1 targets in terms of reduction in extreme poverty and hunger.
Monitoring, Evaluation and Feedback
The Planning, Research and Statistics Department (PRSD) of the MANR undertakes the M&E of agricultural policies and programmes in the context of the overall M & E undertaken by the Directorate of M & E in the Governor's Office. However, the assess-ment team observed that the PRSD was poorly staffed and lacked relevant tools and mobility to facilitate its work; consequently, M & E tended to be inadequate. Fund releases to the Department are also inadequate for its functions, although funding is a common challenge to the entire MANR. The assess-ment team was informed by officials of the PRSD that they relied on the extension agents
90
and the district agricultural officers to gather information on programme implementation and send to the headqu-arters of the MANR for collation and analysis. However, the arrangement is hindered by inadequate logistics and lack of follow-through. Finally, the Agro-Statistics and Data Bank Programme of MANR aims to provide statistical inform-ation for policy formulation and baseline data for planning, M&E of agricultural policies and programmes. A major achievement of the programme was the conduct of an agric-ultural survey in 2005, but there has not been any update since then.
Gaps in Performance
Against the backdrop of these findings, observations and interactions relating to the assessment, the observed gaps in perform-ance are outlined as follows:
! There are productivity gaps, associated with poor quality of inputs, limited access to production inputs, low levels of mechanization, weak research-extension services, and lack of access to financial services in support of the different stages of the agricultural value chains.
! The State is lagging in MDG1 achieve-ment, associated with low levels of productivity and weak links between agricultural production policies/pro-grammes and food security in the State
! The sector is characterized by weak monitoring and evaluation system. As a result, there are data deficiencies for robust policy development and program-me assessment, performance analysis and inter-temporal compar-isons.
! Inadequate mainstreaming of gender in the agricultural policy, leading to weaknesses in strategies for harnessing the full potential of women in agricultural development.
! There is little or no attention to agricultural impacts on the environment and the challenges of agricultural adaptation to climate change impacts, even with the glaring environmental challenges in recent years, such as the 2012 floods that devastated considerable areas of agricultural production activ-ities.
The identified gaps would need to be addressed along with the emerging issues in the sector. These issues are discussed in Chapter 7.
Some Conclusions and Policy Recommendations
Although the agricultural sector is duly acknowledged as the cornerstone of non-oil growth and development into the future, there is wide acknowledgement among stakeholders (policy officials, farmers, processors, service providers, marketers) that the actual agricultural performance in terms of sector-level indicators and in meeting MDG 1 needs significant improve-ment.
Corrective measures that promote value for money and efficient public spending on agriculture, inter-departmental coordination and inter-agency synergy, targeting of beneficiaries, programme monitoring and feedback and more efficient administration of subsidies are necessary to boost sector performance and accelerate progress towa-rds the achievement of MDG 1.
The assessment revealed the following: the need to pay attention to the details of key processes in programme implementation, such as the development of robust criteria for selection of programme beneficiaries and close monitoring of implementation; the riskiness of direct supply/delivery of subsidized agricultural inputs by government agencies and the need to consider best-practice modes of delivering government support; and that full-scale rollout of intervention programmes without prior piloting does not allow for cumulative learning.
In light of the findings from the assessment, the performance gaps and challenges, there is a need for corresponding policy actions. These are discussed in Chapter 8.
91
Challenges, Constraints and Emerging IssuesSucceeding Delta State Governments under the democratic dispensation, especially the current administration, have made discernible
and notable progress in their efforts to promote peace and security, physical and infrastructural development, human capital
development and general welfare of the citizens. But several challenges and constraints have tended to undermine the achievements.
The following subsections first provide an overview of the challenges and constraints, and then outline the challenges of each of the four
sectors under focus with a view to addressing them forcefully. Thereafter, the emerging issues and priorities, which policy makers need to
focus on, are outlined.
7
Overview of the Challenges and Constraints
Notable among the challenges is the sustenance of the gains in the area of peace and security, especially against the backdrop of the prevailing fear and uncertainty in the country. Another challenge is improvement of governance through effective combating of corrupt practices and enthronement of accountability. Also of note is that even though Delta State is an oil producing State, limited revenue constrains the implement-ation of some otherwise laudable develop-ment projects. Other challenges that need to be effectively addressed include: over reliance on oil and gas, revitalization of agriculture and manufacturing, inadequate electric power supply, poverty, inequality and unemployment, limited inter-modal transp-ort linkages, environmental degradation, floods and pollution, and constraining federal regulations.
With sustained vigour in the implementation of articulated policies and programmes as well as improved quality of governance, most of these challenges can be overcome to the benefit of the Delta State people, especially with greater successes in internal revenue generation and economic diversification.
Sectoral Challenges/Constraints
Health Sector Challenges/Constraints
The major challenges militating against the
timely achievement of health outcomes in Delta State are as follows:
· The health system that is characterized
by inadequate numbers and poor distribution of the health workforce, inadequate equipment and weak system for their repair and maintenance, inadequate health financing, a dysfunct-ional two-way referral system for patients, inadequate logistics for con-ducting regular supervision and a dearth of reliable, timely and accurate inform-ation for planning, monitoring and evaluating health programmes;
· The socio-cultural practices that
negatively influence health-seeking behaviour, resulting in low utilization of reproductive and maternal health services especially by women;
· The social stigma related to HIV & AIDS
that is forcing people living with the conditions from disclosing their sero-status and discouraging people from seeking HIV & AIDS services;
· Inadequate community involvement and
participation without which health service ownership and sustainability become uncertain;
· Limited funds for implementing or
extending otherwise laudable progra-mmes, for example, extension of the Free Maternal Healthcare Policy to the PHCs.
Education Sector Challenges/Constraints
The challenges identified from primary and
92
secondary sources include the following:
· School safety and security in schools with
regards to school personnel – children, staff, and school property;
· On-time completion and quality of new
school buildings, renovations and rehabilitation projects;
· Supply and distribution of school furnit-
ure/instructional materials due to the peculiar geographic terrain of the state (a challenge of access and equity);
· Recruitment and transfer of qualified
teachers to rural and riverine areas;· Bureaucratic bottlenecks that tend to
discourage and hinder contributions from vital stakeholders such as PTA, SBMC, Old Students Associations, NGOs, and so on;
· Mechanisms to increase internally
generated revenue (IGR), particularly in tertiary institutions;
· More involvement of stakeholders and
community ownership/participation in schools without undermining the free and compulsory education policy of the government; and
· Expanding and improving Monitoring
and Evaluation in the sector (noting the financial implications).
WASH Sector Challenges/Constraints
The challenges and constraints that have tended to hinder performance in this sector include the following:
Electric Power
The lack of continuous electric power is probably the most serious technical obstacle for sustainable supply of water. Currently, power supply is intermittent and of variable voltage. Poor voltages and surges are among the major causes of breakdown of water schemes. Hopefully, the state government's collaboration through MoU with Canada's Skypower Energy should provide better energy environment in the State.
Research and Development
Several Ministries in Delta State include research and development (R&D) in their organogram and programmes. This is right and proper, but should not just be on paper.
Research is necessary to unravel some geophysical and ecological challenges confronting and complicating resource development and management in the State. It should also equip the State to counter adverse environmental challenges. The State should seek suitable research institutions within the country for collaboration in R&D.
Other Challenges/Issues, which Require Attention
Other challenges/issues, which require attention, include:
· Integrating environmental strategies
into WASH and other sectoral policies.· Improving environmental monitoring to
reduce environmental degradation· Increasing investments in environmental
management such as planting trees to combat deforestation, improving farm-ing and land management practices to combat desertification, treating and recycling of wastewater to reduce nutrient loads and ecosystems, and preserving critical ecosystems to protect biodiversity.
· Strengthening integrated water resour-
ces management system;· Strengthening the regulatory environ-
ment of the WASH sector;· Strengthening environmental protection
agencies through a substantial scaling up of human resources, equipment, and operating budgets.
· Currently, monitoring systems are inade-
quate. Yet, it is known that no strategy for environmental sustainability can be successful without better monitoring and evaluation.
Agricultural Sector Challenges/Constraints
The implementation challenges that the sector has had to contend with include the following:
· Inadequate and irregular funding both at
the MANR administrative level and at the operational level of programme implem-entation.
· Poor monitoring and feedback arrange-
ments. Programme beneficiaries are not followed-through in a proactive and
93
corrective manner. · Inadequate attention to developing
robust criteria for selection of progra-mme beneficiaries and weak enforce-ment of existing criteria.
· Poor rural infrastructure, especially
roads and electricity, for value addition and access to markets.
· Poor access to sustainable financial
services by farmers and other rural entrepreneurs and poor design and administration of loans.
· Weak linkages between the public and
private sectors in programme impleme-ntation.
Emerging Priorities and Issues
These are pertinent issues and priorities that require the attention of the government, going forward.
Health Sector Issues
Ward Minimum Health Care Package
In relation to the Minimum Health Package defined nationally by the NPHCDA in 1998 and reviewed in 2005, most PHCs in Delta State offer a very limited service package to patients at subsidized or full cost recovery. The most critical components of the package, namely, assessment of HIV and ART initiation and maintenance; Under-5 healthcare services; and maternal and newborn care are delivered at the secondary and tertiary facilities cost free.
Universal Health Coverage
It would appear that Delta State, through its FMHCP, RHS, and FU-5HP, has made policy choices to expand coverage to the rural poor, to increase coverage to selected key high-impact interventions delivered through the above programmes and to provide selected services free to the patient. However, as the State further moves towards universal coverage, more discussions will be needed in order to make further policy choices with regard to whether, for instance, more rural poor should be targeted by decentralizing the FMHCP and FU-5HP to the PHC facilities, or to offer all the components of the WMHCP at a subsidized cost.
Strengthening Health System in the Context of Primary Health Care
It was envisaged that implementation of the Strategic Heath Development Plan (SSHDP) would strengthen the health system and the Primary Health Care system to enhance achievement of the health MDGs by 2015. This assessment has revealed that the SSHDP has not been systematically implemented as the annual budgetary allocations were not linked to the SSHDP Priority Areas. There has been no review of its implementation although its lifespan ends only in the next 18 months. The SMoH may need to consider giving the SSHDP implementation renewed impetus.
Intersectoral Collaboration and Coordination
Certain health challenges in Delta State have no easy solutions. Consequently, effective action on them will require collaboration across the State with LGAs and community level government agencies, the private sector, civil society, and community-based organiz-ations. Among these challenges are the following: health inequities, the aging population and certain traditional practices, including gender disparities. Others, such as climate change arising from environmental degradation, resulting in recurrent flooding and extensive soil erosion and loss of habitat, create new health problems.
Education Sector Priorities/Issues
For this sector, the following priorities/issues are worth noting:
· Implementation of the State Educational
Sector Strategic Plan developed in 2013. · Recruitment of more teachers, especially,
in the sciences, history and some newly introduced subjects, such as Civics and Citizenship education and Entrepre-neurship.
· Recruitment, and retraining, of teachers
for special education.· Giving of more focus and attention to
security issues.· Expanding and improvement of the EMIS
service delivery.· Capacity building of quality assurance
personnel.· Provision of more incentives for teachers
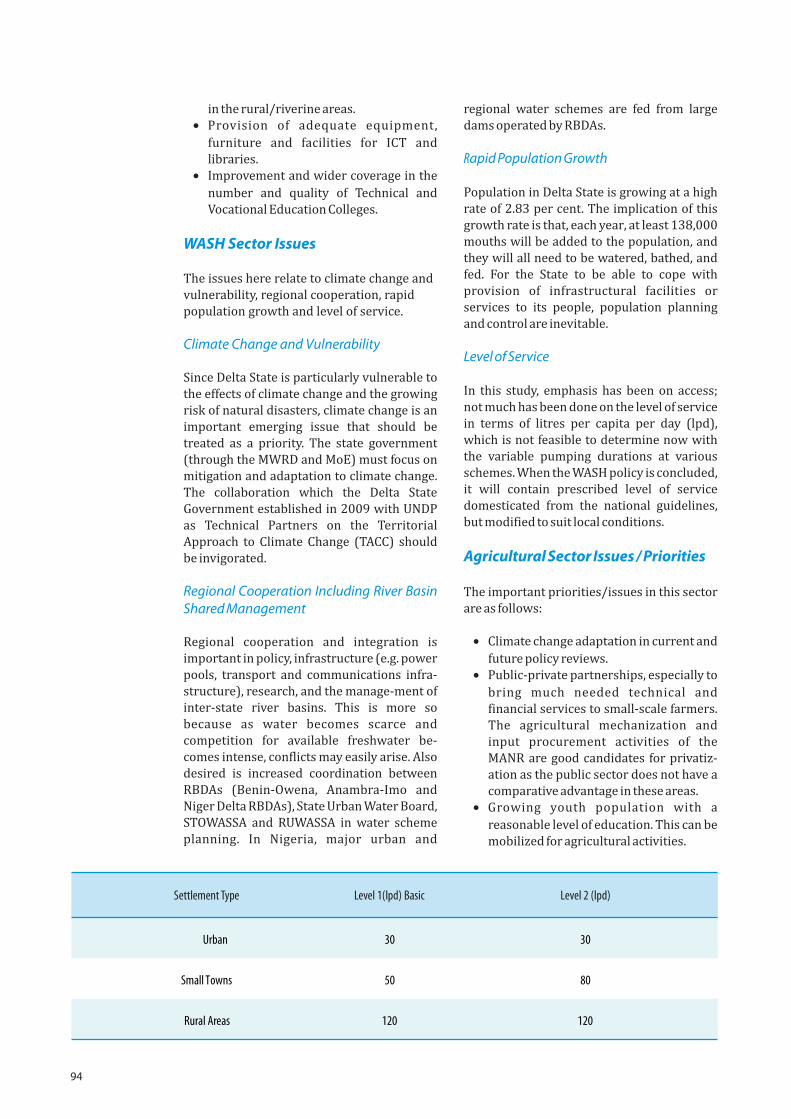
94
in the rural/riverine areas. · Provision of adequate equipment,
furniture and facilities for ICT and libraries.
· Improvement and wider coverage in the
number and quality of Technical and Vocational Education Colleges.
WASH Sector Issues
The issues here relate to climate change and vulnerability, regional cooperation, rapid population growth and level of service.
Climate Change and Vulnerability
Since Delta State is particularly vulnerable to the effects of climate change and the growing risk of natural disasters, climate change is an important emerging issue that should be treated as a priority. The state government (through the MWRD and MoE) must focus on mitigation and adaptation to climate change. The collaboration which the Delta State Government established in 2009 with UNDP as Technical Partners on the Territorial Approach to Climate Change (TACC) should be invigorated.
Regional Cooperation Including River Basin Shared Management
Regional cooperation and integration is important in policy, infrastructure (e.g. power pools, transport and communications infra-structure), research, and the manage-ment of inter-state river basins. This is more so because as water becomes scarce and competition for available freshwater be-comes intense, conflicts may easily arise. Also desired is increased coordination between RBDAs (Benin-Owena, Anambra-Imo and Niger Delta RBDAs), State Urban Water Board, STOWASSA and RUWASSA in water scheme planning. In Nigeria, major urban and
regional water schemes are fed from large dams operated by RBDAs.
Rapid Population Growth
Population in Delta State is growing at a high rate of 2.83 per cent. The implication of this growth rate is that, each year, at least 138,000 mouths will be added to the population, and they will all need to be watered, bathed, and fed. For the State to be able to cope with provision of infrastructural facilities or services to its people, population planning and control are inevitable.
Level of Service
In this study, emphasis has been on access; not much has been done on the level of service in terms of litres per capita per day (lpd), which is not feasible to determine now with the variable pumping durations at various schemes. When the WASH policy is concluded, it will contain prescribed level of service domesticated from the national guidelines, but modified to suit local conditions.
Agricultural Sector Issues / Priorities
The important priorities/issues in this sector are as follows:
· Climate change adaptation in current and
future policy reviews. · Public-private partnerships, especially to
bring much needed technical and financial services to small-scale farmers. The agricultural mechanization and input procurement activities of the MANR are good candidates for privatiz-ation as the public sector does not have a comparative advantage in these areas.
· Growing youth population with a
reasonable level of education. This can be mobilized for agricultural activities.
Settlement Type
Urban
Small Towns
Rural Areas
Level 1(lpd) Basic
30
50
120
Level 2 (lpd)
30
80
120
95
· Harnessing the role of ICTs for service
delivery – the example of the e-wallet.· Farmer documentation and database
development – expanding the gains from the federal government farmer registr-ation initiative. It is difficult to target farmers accurately without a reference to farmer database.
· Closer attention to the value chain
approach. This can catalyse the develop-ment of linkages between agriculture and
industry in the State.· Linking agriculture to food security. This
is an important desirable policy and programme orientation for achieving MDG1 target of eradicating extreme hunger.

96
97
Conclusions, Lessons and RecommendationsThe assessment of development performance in Delta State, in particular, in the four key sectors – Education, Health, Agriculture, and
Water, Sanitation and Hygiene – has generated important conclusions and lessons to guide future development activities. Also, against
the backdrop of the findings, challenges, and emerging priorities/issues, useful policy recommendations are made for the consideration
of the government. This final chapter first highlights the conclusions and then the lessons learnt. The chapter concludes with policy
recommendations.
8
Conclusions
General Conclusions from the State Overview
! Delta State is of remarkable strategic economic importance to Nigeria. Although the State's population is less than 3.0 per cent of the national population and occupies only 1.99 per cent of the country's land area, it accounts for 40 per cent of the country's gas reserves. It also accounts for a significant proportion of national oil output and oil fields. Besides abundant oil and gas, the State has a variety of other resources and facilities which confer on it significant comparative advantage in relation to other states in the federation. There is, thus, a good basis to achieve respectable economic development and diversification.
! However, the State's resources, especially oil, are yet to be fully harnessed towards significantly improving the welfare of the people. This is because the state govern-ment has had to contend with numerous challenges to its development efforts. Nevertheless, it is poised to tackle the challenges with its 3-Point Agenda of Peace and Security, Human Capital Development and Infrastructure, which is being implemented within the framework of Delta State Vision 2020.
! The eight years of the existence of Delta State before the present democratic dispensation commenced in May 1999, was characterized by political instability. But under democratic governance, stability has been restored as a basis for
orderly and sustained development efforts aimed at improving the welfare of the citizens.
! For a long time, the quality of governance has been a notable source of concern in Nigeria. At present, Delta State has a vision for good governance in the context of its Vision 2020. Indications are that the present government in Delta State places high priority on reducing corruption and improving governance. The state govern-ment has put in place some institutions and tools to promote good governance.
! The state government has managed development with the aid of notable development frameworks and strategies such as the rolling plans, DELTASEEDS, Vision 2020, 3-Point Agenda and the annual budget. The implementation of some of them, for example, DELTASEEDS that was aimed at poverty reduction, tended to reflect policy discontinuity as implementation ended with the first phase.
! The focus of the current strategic framework and economic direction of the Vision 2020 Plan is to use the substantial resources accruing from the oil and gas sector to diversify the economic base of the State and pursue economic growth and development based on the non-oil sector. This is the essence of the concept of 'Delta State beyond Oil' which is simplified in the 3-Point Agenda. The long-term Vision 2020 Plan is both useful and measurable in that it has costed programmes and projects which are also aimed at towards achieving the 3-Point Agenda, unlike the Nigeria Vision 20: 2020. In the context of this Agenda, the actions of the government, especially
98
towards the development of the communities, have helped in calming frayed nerves in the State. Some measure of success has been achieved in the control and management of crisis in the State while the incidence of hostage taking and kidnapping has reduced.
! In acknowledging the crucial role of infrastructure in driving economic growth and development in the State, the government allocates an appreciable percentage of the annual budget to the implementation of strategic infrastru-ctural projects. Besides, the government has adopted the PPP model in the development, provision and mainte-nance of existing infrastructure in several areas. Some critical infrast-ructural projects have been executed by the government, in line with the 3-Point Agenda, in the spheres of airport development, road projects, industrial parks, power projects, etc.
! The State has done appreciably well in fiscal management with significant successes achieved in internal revenue generation; it ranks as number three in IGR collection among the 36 States in the country. Also, prudence and discipline in fiscal management are reflected in fiscal surpluses or low fiscal deficit ratios. Besides, the State has a commendable capital budget ratio in relation to the situation at the federal level where recurrent spending highly dominates the public expenditure programme. How-ever, there is a need for greater transparency in budget presentation to explicitly show the fiscal balance position and its projected financing. Also, the government should not relent in its IGR drive, especially by optimally tapping the potentials in taxation which is a credible and sustainable source of government revenue.
! The Delta State Government has taken the commendable initiative to compute state-level GDP. Although the computed figures are not directly comparable with those of other states like Lagos, because of differences in approaches and coverage, they provide an indication of the level of economic activity and income per head. The per capita GDP figures in Delta State are much higher than the national GDP per capita, suggesting much higher level of welfare for the average
Deltan compared to the average Nigerian. The computed GDP figures for Delta State have some credibility; they emerged from a wider coverage and were computed by a consultant to the National Bureau of Statistics who was also its Head of National Accounts. Nevertheless, the implications of states computing GDPs with different approaches are strong enough to warrant a common approach under the guidance of the National Bureau of Statistics.
! The Delta State economy is highly dependent on oil and gas for the bulk of its revenue and contribution to the gross domestic product. Even though the other sectors do not contribute much, they provide the bulk of employment and income to the majority of the citizens in the State. It is most desirable, therefore, that oil revenue be used to develop the other critical sectors of the State economy, as correctly recognized in the 'Delta beyond Oil' policy.
! The available data suggest that the scenario of improved economic growth without significant improvement in development outcomes at the national level in Nigeria is also an issue of concern in Delta State. The relatively good growth record of Delta State has apparently not translated into significant poverty and unemployment reduction. One contrib-utory factor to the relatively high poverty incidence in the State is the growing income inequality, implying that a much smaller percentage of the population appropriated a larger share of the increase in state income and economic opportunities, thus pushing more people into poverty. The other notable factors are high level of unemployment and low agricultural productivity.
! The MDG target of halving poverty has not been met considering the poverty incidence data available as at 2010. Also, the target relating to the rate of unemployment has not been met. However, it must be acknowledged that the Delta State Government has, in the last few years, implemented initiatives, policies and programmes aimed at significantly reducing poverty, within the framework of the 3-Point Agenda. Of particular note is the establishment of the Ministry of Poverty Alleviation and its significant achievements through the
99
Micro-Credit Programme which has helped over 11,000 less privileged and disadvantaged people to establish and/or expand businesses such as cottage industries, agricultural produc-tion, trading, and services. It is most likely that the recent poverty reduction strategies and measures would result in significant reduction in the poverty incidence by the time of the next survey.
! However, there have been significant improvements in other development outcomes relating to education and health as reported in Chapters 3 and 4. For example, the maternal mortality rate stood at 188 per 100, 000 live births in 2013; Under-5 mortality rate (per 1,000 live births) stood at 52 in 2012; and infant mortality rate per 1,000 live births was 37.0 in 2012. The related MDG targets have been achieved. On educational outcomes, the achievements are com-mendable in the areas of universal primary school education, and gender parity. For example, as at 2013, net enrolment in primary education was 97.0 per cent; proportion of pupils who start primary 1 and reach primary 6 was 99.5 per cent; literacy rate was 97.0; and gender parity was 85 girls to 100 boys. Thus, the human capital development outcomes have shown impressive improvements unlike the poverty and unemployment indicators.
Conclusions from Sector Assessments
Health Sector Observations /Conclusions
! Delta State has performed well in investing in health infrastructural rehabilitation and establishment as well as in health service delivery through innovative health programmes targeting the rural poor. Evidence points to the reduction of infant mortality although the Under-5 mortality remains static. Also, the data from the State Ministry of Health indicates that maternal mortality rate has significantly reduced in relation to the value in 2005 and the related MDG target has been achieved.
! Patients appear to be bypassing the Primary Healthcare Centres to seek maternal and child health services in Secondary facilities due to many reasons,
including the cost element and perception of quality. As a result, the services in the secondary health facilities are overstretched.
! The Rural Healthcare Scheme (RHS) is delivered largely as an isolated outreach service to the communities without any strong linkages with the surrounding health facilities. As a result, there is no continuity of these services to the target communities between the RHS visits.
! Diagnosis of Paediatric HIV is posing a challenge in Delta State due to the lack of capacity for Polymerase Chain Reaction (PCR) testing. The collected dried blood spots (DBS) have to be transported to the University of Ife for processing, and this causes unavoidable delays and loss of patients. Additionally, the rapid expan-sion of HIV Counselling and Testing (HCT) and Prevention of Mother-to-Child Transmission (PMTCT) services is done in a manner that threatens to reduce their quality without adequate laboratories to support the expansion in PHC facilities.
! Health manpower seems inadequate to deliver the needed services while maintaining their quality as exemplified by the low health worker/patient ratio. Besides, it has been found that staff motivation is affected negatively by factors such as: irregular and delayed payment of salaries for PHC-based and LGA staff, staff security concerns in some PHC facilities, inadequate work tools and overwork.
! Except for immunization, TB, malaria and HIV services, other maternal and child health services are provided through out-of-pocket payment of fees by the patient in the PHC facilities. Family planning materials are free, but because supplies are not provided, the patients are asked to pay varying fees for the services. Treatment of minor ailments is provided by full cost recovery at PHCs and SHCs. Lack of awareness of the concept and benefits of health insurance has led to opposition by civil servants in Delta State to join the National Health Insurance Scheme (NHIS).
! The proportion of the State budget that has been allocated to health over the years has been far below the recom-mended 15 per cent of the total budget. Besides, for most of the years from 2006-2013, the proportion of approved health
100
budget that was ultimately released had been low.
! UNICEF has supported all the States in Nigeria through the Populat ion Commission to register and report on births using the mobile phone short messaging system (RapidSMS) since 2009. The Population Commission in Delta State has Registrars in two to five centres in each of the 25 LGAs. More Registration Centres are needed, which means employment of more Registrars. Substantial support is required to expand this system which could improve civil registration, thereby generating the needed vital statistics.
Education Sector Conclusions
! The recognition by the Delta State Government that education is a vital component of human capital develop-ment that needs to be adequately focused on for improved outcomes, is evident in the findings of the sector assessment, the 3-Point Agenda of the State and the laudable policies and programmes on education formulated and implemented.
! There is steady progress towards achieving the sector MDGs and other national and state goals such as Education for All (EFA) and Vision 20:2020 goals. The available data (primary and secondary) indicate that Delta State is willing and well-positioned to achieve the stated targets in Goal 2 and the relevant targets in Goal 3 of the MDGs by 2015. The prospect of 100 per cent attainment of Goal 2 by the anticipated year 2015 represents a formidable impact for an enlightened and literate citizenry with employable skills. This is the ultimate exemplification of Delta State's achievements in the education sector and an endorsement of the road-map implicit in the Mil lennium Development Goals for national and global developments.
! This positive prospect has been made possible, in large part, by the policy initiatives, programmes and projects implemented by the state government. School infrastructural development and related interventions have yielded results in the form of an increase in the number of schools; from 995 primary schools in 1994/1995 to 1,250 in 2011/2012 and
from 275 secondary schools to 420 in the same period. In the tertiary education subsector, the creation of two campuses of DELSU in Anwai and Oleh, in addition to the main campus at Abraka, has significantly increased access to tertiary education in the State.
! The specific government policies, programmes and projects that have direct impact on achievements in the sector include the following: the state's adoption in 2010 of the Federal UBE law which grew out of the National Policy on Education (NPE) and UNESCO EFA mandate; the free and Compulsory Basic Education policy of the state; the drive towards gender parity and equity in access to education; scholarship and bursary awards; and the conspicuous infrastructural development entailing construction of new educational institutions and renovation/remodelling of existing ones.
! However, although the achievements and impacts are laudable, the issues of data collection/analysis remain a strong challenge for monitoring progress and sustainability. Equity concern is another issue. The location of new schools and renovation/rehabilitation of existing ones and the distribution of educational facilities and materials deserve priority attention in some urban areas and rural/riverine areas, in particular.
! Also important is the need for govern-ment to enhance its commitment to quality, in addition to access and equity in the spread and pacing of school infrastructural development and distrib-ution of facilities/materials. Quality is key in harnessing the dividends of educational services delivery.
WASH Sector Conclusions
! Delta State has no WASH policy yet; one has been approved by the State Executive Council but it has yet to be processed through the State House of Assembly. The State also has no regulator. Yet, having a regulator is just as important as having a good policy. Besides all else, it will separate regulation from service delivery and prevent a situation in which the same institution plays the role of regulator and service provider. Furthermore, a law which will anchor the key institutions,
101
allocate power and functions and remove the existing overlaps is yet to be put in place.
! Two strategies which MWRD employed and which worked well are those of mainstreaming scheme maintenance into the WASH services delivery system. For some two years, MWRD has adopted a new strategy to water supply service delivery with emphasis on rehabilitation of existing non-functioning schemes and, recently, routine maintenance as against the practice of awarding contract for non-redeemable ailing schemes. Also of note is the provision of regional schemes in the urban communities and metropolis, benefitting rural areas in the urban region as is the standard practice globally. The Warri/Effurun Regional Scheme covering three metropolitan LGAs is nearing completion.
! In relation to the MDGs, the Delta 2011 Household Survey indicates the propor-tion of the population having access to safe drinking water as 78.6 per cent. The MICS Survey gave this as 75.1 per cent. However, in 2013, the percentage of households or of popula-tion having access to water supply from safe sources was 70.1.
! With the investments and programmes implemented since 2011, Delta State is most likely to achieve the MDG target of 77 per cent access to potable water by 2015. The disparity between urban and rural areas remains high, however, and it needs to be addressed. Greater efforts will need to be made to cater for small towns and rural communities, not only to provide the scheme in a central location, but to seek to extend the supply closer to the beneficiaries.
! The performance of the sanitation subsector is different from that of water supply. As at 1999, the proportion of the population with access to improved sanitation was 35 per cent. By 2013, it had declined to 24.3 per cent. With less than 25 per cent access to improved sanitation, it is most unlikely that Delta State would meet the MDG target for basic sanitation of 63 per cent by 2015. However, the numerous sensitization campaigns (800 altogether) that have been conducted in schools, markets and motor parks have helped to create the necessary awareness for both the users
and the policy makers and technocrats. ! One major factor that has enabled the
observed performance in the sector is the multiple sources of programmes/in-vestments. These include those of DESOPADEC, European Union (EU), NDDC, MDG, NDSP-WS, Solar-Powered Electricity with Skypower Energy of Canada, the State Government in collaboration with UNDP on Territorial Approach to Climate Change, and with UNICEF (on RUWASA). An underlying factor in all these is the observed commitment of the sector leadership to service delivery in the sector.
! The important issue of financial sustainability is yet to be addressed by the sector. However, DSUWB has recently engaged a revenue consultant to collect water tariff. The EU, as part of ongoing collaboration, could assist the Ministry and the Board to establish appropriate PPP options.
Agricultural Sector Conclusions
! The agricultural sector is duly acknow-ledged in DSG policy and strategy documents as the cornerstone of non-oil growth and development into the future.
! The State Agricultural Policy, 2006, adequately defined the overall direction and goals of agricultural development. The implementation performance of the Agricultural Policy was, however, weakened by inadequate funding of the sector, inconsistency in following through the policy priorities, etc. In 2012, for instance, spending on the agricultural sector was only 0.03 per cent of the total expenditure of the State. This calls for a further reflection by the state govern-ment of the framework for equitable allocation of budget resources to its various development priorities.
! Most of the agricultural programmes implemented since the creation of Delta State were relevant for addressing the development needs of the State. However, the programme designs were often not robust enough and the pace of imple-mentation was generally slowed by inadequate or late fund releases that are out of sync with the seasonal agricultural cycle.
! Most of the growth of the agricultural
102
sector is accounted for by the expansion in cultivated areas rather than a more sustainable growth in productivity. Nevertheless, the performance of the sector overall is deemed to have contributed substantially to the relative progress of Delta State against the MDG1 targets compared with other states. And there is wide acknowledgement among agricultural sector stakeholders (policy officials, farmers, processors, service providers, marketers) that the actual agricultural performance in terms of sector-level indicators and in meeting MDG1 needs significant improvement.
! Delta State, like many other states in Nigeria, is lagging behind on the MDG1 target relating to poverty reduction. However, progress is being made, considering the fact that the revised absolute poverty incidence has reduced from 70.6 per cent in 2003/2004 to 53.8 per cent in 2009/2010. The estimated proportion of Under-5 children that are underweight in Delta State is 13.4 per cent, which is less than half of the national rate of 27.4 per cent. It is evident, therefore, that Delta State has achieved much more than the overall national level in terms of reducing extreme hunger.
Lessons Learned from the Assessments
The assessment of the four main sectors is a huge investment itself and sows tangibly into the future of the State. It is, therefore, important to learn lessons from the assess-ment on the things that worked well and those things that need to be done better or differently.
Health Sector Lessons
Here, the lessons learnt are outlined as follows:
! The cluster model is useful to improve efficiency, service delivery quality and strengthening the referral system as reflected in the MSS model and the clustering of Secondary Health Facilities in eleven zones.
! Health facility survey is critical for determining facility readiness for service
expansion. The physical assessment of all the health facilities in the state was critical in determining the facilities that were ready to take up PMTCT services
! Public Private Partnership is important for expanding service coverage. The approach has yielded good results in increasing the number of children being vaccinated.
! Mobile phone technology can improve civil registration. The approach has significantly improved the rate of birth registration in the State.
! Provision of free health services improves utilization. The provision of FMHCP and FU-5HP in Secondary Health facilities in Delta State has resulted in increased service utilization.
Education Sector Lessons
! Need to have adequate records keeping and statistical data/information on government policy, projects and pro-grammes implementation.
! Need to avoid bureaucratic bottlenecks which tend to discourage stakeholders from contributing to school projects, thereby hindering community owner-ship, partnership and augmentation of government efforts.
! Need to give more vigour and attention to quality control and its related monitoring and evaluation functions in the sector.
! Paying adequate attention to EMIS in terms of funding, equipment and personnel can help avoid the negative impact on data generation, collation and analysis in the sector.
! Need to provide full attention, funding and backing to M & E in the sector to enhance programme and project efficien-cy and effectiveness.
WASH Sector Lessons
! Availability of multiple sources of funds for investing in the WASH sector is an enabling factor for significant progress in service delivery. The sources have been critical.
! Proactive planning to mitigate the frightening risks associated with climate change in the coming decades is crucial. The State has already taken some commendable proactive steps to combat climate change; these would need to be
103
carried forward. ! Global best practice can provide useful
guides on approaches to water supply development. The regional approach to water supply development is in line with global best practice. It should be extended to include rural communities.
! Need to ensure effective maintenance of WASH infrastructure and reticulation networks through the contribution by water users particularly those residing in urban areas. This would release capital funds for extension of existing services and construction of new ones.
! Need for concerted efforts to attract private sector investments into the sector, as some states have been doing. This will be in accord with the vision of 'Delta beyond Oil'.
Agricultural Sector Lessons
! Need to pay attention to the details of key processes in programme impleme-ntation, such as the development of robust criteria for selection of program-me beneficiaries and close monitoring of implementation.
! The direct supply/delivery of subsidized agricultural inputs by government agencies is very risky. The State should consider best-practice modes of deliver-ing government support, which limit government's role to facilitation, funding and monitoring.
! Full-scale rollout of intervention pro-grammes without prior piloting does not allow for cumulative learning. Sequen-cing of programme implemen-tation in terms of scale and content is critical for effective outcomes.
Policy Recommendations
General Recommendations
a. Need for greater transparency in budget presentation relating to fiscal balance and the methods of financing it. The budget, as currently pre-sented, appears to give the mis-leading impression of a balanced budget with estimated revenue being equal to expenditure. The budget deficit/surplus position is not clear. Greater openness in budget
presentation requires reviewing the budget presentation format to show clearly the projected fiscal balance position and the means for financing of deficit/surplus.
b. Need for the government not to relent in its IGR drive as its hard work has yielded commendable dividends, especially in view of its strategy of building a 'Delta State beyond oil'. In this direction, taxation is a credible and sustainable source of govern-ment revenue. Taxes, fines and fees which currently constitute over 90 per cent of IGR (92.95 per cent in 2013 budget), need to be further focused on in view of its potential to increase significantly if the problems of citizens' scant appreciation of tax payment as a civic responsibility is genuinely addressed. The citizens can be motivated to pay tax when they see goods and services provided with their tax money.
c. Capital budget/total expenditure ratios. Even though the State has maintained capital expenditure/to-tal expenditure ratios that are much higher than the prevailing rate at the federal level, it is important that the state government should review its recurrent expend-iture programme in the form of fiscal consolidation in order to free resources for the implementation of the 3-Point Agenda and Vision 2020 plan.
d. Need to compute state-level GDP with a methodology that will confer credibility, comparability and acce-ptability on the computed figures. To this end, it will be most desirable for a uniform methodology to be deve-loped and used in computing State-level GDP; the state government should support the State Bureau of Statistics to work with the National Bureau of Statistics and National Planning Commission to jointly estimate the state GDP.
e. The plan of the government to set up the State Bureau of Statistics with significant autonomy and authority to coordinate the statistical system and deliver statistical matters quickly, as well as its empowerment to compel potential suppliers of statistical data and apply sanctions
104
for non-compliance, is a good initiative. However, there is need to expedite action on the enactment of the law to establish the State Statistical System and State Bureau of Statistics. Also, as a technical agency, the Bureau will need to be adequately empowered with fund-ing, skilled manpower and logistics to be able to carry out major surveys and deliver the expected statistical outputs.
f. As the case of Nigeria and Delta State, in particular, has shown, growth is necessary but insufficient to attain inclusivity and poverty reduction unless appropriate policies accomp-any it (growth). Therefore, not only will growth have to be speeded up in Delta State, its quality has to improve in terms of being employment generating, broad-based and shared. The needed economic and social infrastructure must be provided for many people to be actively involved in the growth process. Also called for are conscious pro-poor policies that channel resources towards sectors with maximum poverty reducing impact and ensure the participation of the poor in the growth process. Finally, policies that reduce inequ-ality will make growth pro-poor.
g. Policies, programmes and projects that will make growth pro-poor and inclusive include the promotion of human capital development, provi-sion of safety nets for vulnerable groups, development of rural infrastructure, strengthening of financial intermediation towards providing the poor and low income segments of the population with adequate financial services, and creating employment in the rural economy.
h. Need for evaluation of programmes and projects. As at now, evaluation of plan, budget, programmes and projects is not being done by the Directorate of Monitoring. The government should embrace the evaluation of plans, budgets and projects through evaluation studies that will provide insights into project and programme outcomes and impact. Not only does the Direct-
orate require adequate professional staff for the day-to-day super-vision/monitoring of projects, it also requires evaluation experts to carry out evaluation studies of completed projects and programmes to ascertain the extent to which they are yielding the intended benefits.
Sectoral Policy Recommendations
Health Sector Recommendations
a. The State Ministry of Health (SMoH), the Local Government Authority and LGA Chairmen should initiate discussions on the modalities to provide free Reproductive, Maternal and Child health services to all PHCs in order to relieve the workload in the SHCs.
b. The delivery of the Rural Healthcare Scheme should be re-designed. Services under the scheme should be delivered in designated static health facilities where regular outreach services could serve as practical, on-the-job training for health workers in these facilities, in a bid to ensure constant availability of services to the communities. Inaccessible river-ine communities should benefit from the services under the Scheme using appropriate transport and service delivery methods to reach them.
c. The SMoH should further strengthen and expand the 'Hub and Spoke' arrangement that clusters several PHCs around a Secondary Healthcare facility. This will allow a more structured mentoring and provision of professional support to the healthcare workers in the PHCs by experienced SHC staff in order to improve the quality of the services delivered at the PHCs.
d. The SHMB, the SPHCDA and LGA Health Departments should expand the MSS to all the LGAs in the State to ensure that an increased number of PHCs deliver Basic Emergency Obstetric Care (EmOC) services and can refer complicated cases to a nearby facility that can deliver comprehensive EmOC services.
e. To increase the diagnostic capacity
105
for Paediatric HIV and ensure that HCT and PMTCT service expansion adhere to quality assurance, the SMoH should conduct an assessment with a view to strengthening labora-tories in selected SHCs, including the establishment of PCR testing capa-city.
f. The SMoH should work towards increasing MDR-TB diagnostic capa-city by providing more GeneXpert testing equipment. To enable timely initiation of treatment for the already diagnosed MDR-TB patients, a special ward for treating MDR-TB cases should be established as a matter of priority.
g. The SMoH should develop, cost and implement a Human Resource for Health (HRH) Plan, which will address all the current HRH issues identified.
h. Delta State should lift the embargo on staff employment in the health sector and fill the staff gaps based on a workload analysis in the PHCs and SHCs.
i. The SMoH, with the support of the UN, should institute a State Health Account which will enable timely collection, analysis and reporting on health expenditures by source and intervention (disease) in order to link expenditures to budgets and health outputs annually in a sustain-able fashion.
j. The SMoH should endeavour to establish a mechanism that provides financial protection to all the citi-zenry, especially the poor, by replacing all out-of-pocket payments for health services to a pre-payment mechanism, in a bid towards universal health coverage; this will require, among other things, creating a core group of knowledgeable individuals such as Professional Association Members to undertake mass education and community mobilization for the pre-payment mechanism.
k. The State should endeavour to achieve budgetary allocation to the health sector amounting to at least the 15 per cent target set by African leaders in Abuja in 2000. Further-more, efforts should be made to
increase disbursement of the approved health budget.
l. The SMoH should endeavour to adopt the new National Drug Distrib-ution System in order to ensure the safety and effectiveness of the medicines delivered by all health facilities in the state, including PHCs and the privately-owned facilities.
m. The State should systematically empower the Department of Re-search and Statistics (in SMEP), the Population Commission and the Department of Planning and Sta-tistics (in SMoH) to collaborate in generating the information required for health planning, monitoring and evaluation through conducting house-hold and other population sur-veys, strengthening routine service reporting and civil registr-ation to generate the needed data.
n. Delta State should provide the needed resources (manpower and financial) to the Population Comm-ission to improve the RapidSMS reporting of child births and expand it to include reporting on child and maternal deaths; this will allow timely response to address causes of maternal and child mortality.
o. SMoH should arrange to evaluate the implementation of the SSHDP, 2010-2015. The findings of this evaluation will inform the development of the next plan, beyond 2015.
p. The SMoH should involve a broad spectrum of stakeholders in the review of the current SSHDP and the development of future health plans-/strategies; the stakeholders should include LGAs, civil society organi-zations, the private sector and deve-lopment partners.
q. The SMoH should formalize arrangements for collaboration with private health service providers beyond registering them; this will entail signing of MoU with them for health service delivery in a bid to expand access to health services.
r. Each programme (AIDS, TB and malaria) should have a budget line and the SMoH should gradually increase its contribution through budgetary allocation in order to not only alleviate the inadequate funding
106
for operations, but also to ensure sustainability of these important programmes.
Education Sector Recommendations
a. EDUMARSHAL activities should be extended to the rural and riverine communities where street children are highly concentrated. The success recorded by the EDUMARSHAL initi-ative so far is mainly in the cities where schools can easily be accessed by road.
b. Infrastructure should be provided and distributed according to school needs. A situation where some schools have very many classrooms, computers, well-equipped libraries and laboratories for few students, while some have close to 2,000 students, for example, but have only 12 to 13 classrooms, does not augur well for the schools and the govern-ment. In the interest of quality, equity and fairness, there should be equi-table distribution of infrastructure across the State.
c. Government subventions to schools and principals/head-teachers should be increased significantly. Also, there is need for significant increase in the percentage of money released from the annual education budget.
d. There is a need to employ more secondary school teachers to handle certain subject areas (Physics, Che-mistry, and Civics) and address expressed shortage of teachers generally.
e. There is a need also to give more focus to 'quality' alongside 'qualified' teachers.
f. It is necessary to enhance quality through the establishment of Tea-chers' Professional Development Centres for in-service training and staff development, and sharing of teacher-made and commercially produced instructional materials. These centres should promote staff development through competencies-based workshops, seminars and conferences.
g. The government should make re-certification of teachers a compuls-
ory requirement/ condition for retaining professional status in classroom teaching, thereby prom-oting the quest for quality teachers and not just qualified teachers.
h. Stronger cooperation and collabor-ation should exist between the State Universal Basic Education Board (SUBEB) and the State Post-Primary Education Board (SPPEB).
i. There is a need for more cooperation and synergy between the two Ministries of Education: Basic and Secondary Education, and Higher Education.
j. More schools for children with special needs should be built in every local government area. This will promote equal access to education. In the alternative, provisions should be made for the integration of children with special needs into the public schools (basic, secondary and tertiary). This will give them a sense of belonging and self-actualization.
k. Teachers should be adequately motivated for maximum produc-tivity. They should be prom-oted as and when due while the benefits accruing from promotions are also paid promptly. This would enhance job satisfaction and raise produc-tivity.
l. Adequate security personnel should be employed in the system. In most schools in the state, teachers, pupils/students and the facilities remain vulnerable to thieves due to the absence of well-trained security personnel.
WASH Sector Recommendations
The recommendations here are grouped into four categories.
I. Technical Strategies
These deal with a selection of appropriate sources of water and appropriate technology to harness them and deliver services to the people in a sustainable manner. Such a choice may be limited by natural endowment but still making the right choices is important, especially with respect to:
! Selection of appropriate water supply
107
type. The choice may be between surface and groundwater or between shallow or deep-seated groundwater, etc. A tho-rough assessment will need to be made to reach the right decision.
! Standards of supply appropriate for needs of communities. Although hand pumps are often not considered as being sufficiently modern, but with epileptic power supply, it is recommended that they be given greater priority. And until public power supply improves or the plan for an alternative power materializes, MWRD may need to convert more of its motorized pumps to solar pumps.
ii. Management Strategies These entail the following:! More of participatory planning with
communities for scheme development to improve vastly on the present reasonable practice;
! Decentralized autonomous management for service delivery and system O&M with the objective of achieving cost recovery.
! Handover of service provision to com-munities and/or private sector for community managed schemes. This applies not only to rural and small town schemes, but ultimately to urban schemes. Models of this are found in the South South and South East geopolitical zones.
! Provision of performance incentives for staff based on achieved levels of service delivery.
! Establishment of water regulators to monitor, control and support water issues.
iii. Financial Strategies
The following are crucial to ensure long-term sustainability of services:
! Government should prepare clear strategies for cost recovery;
! Revenue from water fees must be directly used to support operation and mainte-nance, otherwise both the service providers and water users will be frustrated by the diversion;
! Regulators are to ensure fair tariffs and affordable water for all with arrangement for pro-poor subsidy;
! Procedures for water fee collection and
financial management should be robust and professionally designed and carried out;
! Subsidies from local governments should also be ploughed in to meet funding needs in the sector.
iv. Institutional Strategies
! There is a need for increased coor-dination between RBDAs (Benin-Owena, Anambra-Imo and Niger Delta RBDAs), State Water, STOWASSA and RUWASSA in water scheme planning;
! More integrated approach involving urban and rural water supplies, not just for metropolitan areas, are needed. The four approved schemes for Asaba, Agbor, Ughelli and Sapele should be implem-ented with incorporation of rural communities while the plans for implementing the remaining two sets of regional schemes should be set in motion.
Agricultural Sector Recommendations
a. Rationalize government involvement in (or possible disengagement from) services and activities that are more efficiently and effectively under-taken by the private sector or in partnership with the private sector, while the public sector exercises a monitoring, regulatory and quality control function. The activities in which government involvement should be rationalized include tractor hiring services, procurement and distribution of agricultural inputs, multiplication of seeds, seedlings and improved breeds for livestock, and the administration of credit to farmers. The quality control function entails the development of appropriate selection criteria for participants in the programmes and ensuring that such criteria are enforced during implementation.
b. Develop and operationalize policy and programme linkages between the agricultural production interven-tions and food security goals by mainstreaming food security dimen-sions in sector strategy and policy design and targeting comm-odity enhancement based on the value chain approach.
108
c. Strengthen the Ministry of Agric-ulture and Natural Resources to become more capable in the design, execution and monitoring of agricul-tural and food security policies and programmes.
d. Provide adequate budgetary resour-ces to the agricultural sector in line with the 'priority' status accorded the sector in current development plans and even in the 'Delta Beyond Oil' policy. The 0.03 per cent of total state expenditure accounted for by the agricultural sector is a far cry from even the 10 per cent bench-mark of the Maputo Declaration.
e. Include in the enhanced funding provisions for the agricultural sector, a strategic plan for the provision of critical infrastructure for agricul-tural development, especially access roads and electric power. The Indian example could be a source of inspiration. Pumping of irrigation water for enhanced food production was accorded top priority during periods of limited electric power supply.
109
Abayomi, A. 2012., '2012 Education Budget and its Implications: Analysis'. Available at http://www.vanguardngr.com/2012. Retrieved on 18/06/2014.
Abdulraheem, I.S. et al. 2012. 'Pri-mary Health Care Services in Nigeria: Critical Issues and Strategies for Enhancing the Use by the Rural Community'. Journal of Public Health and Epidemiology, Vol. 4, No. 1.
Adams, Isaac et al. 2004. 'Assessing Efficiency in Service Delivery'. Bulletin of Health Information 1.
Ajuyah, C.O. 2013. Primary Healthcare Delivery System in Nigeria in Achieving the Millennium Development Goals: A Case of Delta State. Kuru: NIPSS.
Barry, Saidou Pathe, et al. 2010. The Ouagadougou Declaration on Primary \health Care and Health Systems in Africa: Achieving Better Heath for Africa in the New Millennium. WHO Regional office in Africa, April-June.Central Bank of Nigeria. 2009-2012. Annual Reports. Abuja: CBN.
Delta State Government, Ministry of Economic Planning. 2012. Sector Investment Programme: Macroecono-mic Overview. Asaba: DSG, June.
Delta State Government. 2014. Delta State Strategic Education Sector Operational Plan (2014 -2016). Asaba: DSG.
Delta State Government. 2011. Delta State Vision 2020, 2011-2020. Asaba: DSG.
Delta State Government. 2012. 'Delta State Oil Mineral Producing Areas Development Commission'. Asaba: DSG.
Delta State Government. 2012. Eco- nomic Dashboard, Full Year Report. Asaba: DSG.
Delta State Government. 2013. 'Budget of Consolidation, Sustainable Economic Growth and Development'. An address by His Excellency Dr. Emmanuel Eweta Uduaghan CON, Governor of Delta State to the Delta State House of Assembly at the presentation of the year 2014 budget proposal on Wednesday 18th, 2013. Ava i l a b l e a t h t t p : / /www.de l t a -
stateassembly.gov.ng/2014-budget. Retrieved on 18/06/2014.
Delta State Government. 2014. 'The Achievements/ Milestones of the Minis-try of Higher Education', A Presentation in Asaba on 23-25 April.
Delta State Government. 2014a. 'Memorandum Submitted by the People and Government of Delta State to the National Conference', , 8 The GuardianJune.
Delta State College of Education. n.d. 'Policy Development Plan/Strategy and Achievements of College of Education. Agbor: Delta State College of Education.
Delta State College of Education. n.d. Five-Year Strategic Plan. Agbor: Delta State College of Education.
Delta State Government. n.d. 'Report of the Sub-Committee on Agriculture and Natural Resources towards Vision 2020'. Asaba: DSG.
Delta State Government of Nigeria, Ministry of Economic Planning. 2009. . Approved Budgets for 2003-2014Asaba: DSG.
Delta State Government. 2009. 'Im-plementation of the Road Map on Agricultural Development: Youth Em-powerment through Agriculture Pro-gramme for Year 2009�- Memorandum
by the Chairman of the Committee on Farmers Support and Youth Em-powerment through Agriculture Pro-gramme'. Asaba.
Delta State Ministry of Agriculture and Natural Resources. 2011. Hand-book on Delta State Agriculture. Asaba: DSG.
Delta State. 2009. 'A Bill for a Law to Establish the Delta State Council on Public Procurement and Public Pro-curement Commission ….'
Delta State Government. 2009 Delta State Statistical Year Book. Asaba: DSG.
Delta State Government. various years. 'Annual Budget' Presentations. Asaba: DSG.
Delta State, Central Office of Re-search and Statistics. 2011. House-hold and Housing Survey, 2011. Asaba: DSG.
Delta State, Delta State Ministry of Economic Planning. 2013. Approved Year 2013 Budget.
Delta State, , 2001, Facts and Figures2004 and 2009.
Delta State Government. 2012. Millennium Development Goals, Pro-gress Report. Asaba: DSG.
Delta State, Ministry of Agriculture and Natural Resources. 2003. End of Administration Status Report 29 May 1999 – May 2003. Asaba: MANR.
Delta State, Ministry of Agriculture and Natural Resources. 2006. Delta State Agricultural Policy. Asaba: MANR.
Delta State, Ministry of Agriculture and Natural Resources. 2006. Report on the Achievement of the LOAF Programme from 2005 to March 2006. Asaba: MANR.
Delta State, Ministry of Economic Planning. 2005. Delta SEEDS, 2005-2007. Asaba: Ministry of Economic Planning.
Delta State, Ministry of Economic Planning. 2010. Delta State General Economic Atlas. Asaba: Ministry of Economic Planning.
Delta State, Ministry of Environment. 2014. 'A Presentation at the Stake-holders Workshop' in Asaba, 23-25 April.
Delta State, Ministry of Health. 2013. Human Capital Development Agenda: The Critical Role of Healthcare, Vol. 2.
Delta State Ministry of Poverty Alleviation. 2014. 'Delta State Micro Credit Programme (DCMP) - Profile'. Asaba: Delta State, Ministry of Poverty Alleviation.
Delta State, Ministry of Water Re-sources Development. 2014. 'A Pre-sentation at the Stakeholder Workshop' in Asaba, 23-25 April.
Delta State, Oil Mineral Producing Areas Development Commission (DESOPADEC). 2012. 'Executed Pro-jects 2007-2011'. Asaba: DESOPADEC.
Eboh, E. C. 2012. 'Implications of Flood Damage and Losses for Poverty and Food Security in Affected Areas of
References
110
Nigeria'. An Assessment Report Sub-mitted to the United Nations Develop-ment Programme (UNDP).
Federal Government of Nigeria and International Fund for Agricultural Development. 2013. 'Community-based Natural Resource Management Programme (CBNRMP) in the Niger Delta Region: Aide Memoire'. Report of Follow-Up Supervision Mission, 18-22 November.
Federal Government of Nigeria and International Fund for Agricultural Development. 2013. 'Community-based Natural Resource Management Programme (CBNRMP) in the Niger Delta Region: Aide Memoire'. Report of 13th Supervision Mission, 6 June -4 July.
Federal Government of Nigeria and World Bank. 2010. 'Third National Fadama Development Project – Aide Memoire for the Third Joint World Bank/Federal Government of Nigeria Supervision Mission, 1-12 November.
Federal Government of Nigeria and World Bank. 2012. 'Third National Fadama Development Project – Aide Memoire for the Midterm Review/Fifth Joint World Bank/Federal Government of Nigeria Implementation Support Supervision Mission', 4-15 June.
Federal Government of Nigeria, National Agricultural Extension and Research Liaison Services (NAERLS) a n d P l a n n i n g , Re s e a rc h a n d Statistics Department – Federal Ministry of Agriculture and Rural Development (PRSD-FMARD). 2012. 'Agricultural Performance Survey of 2012 Wet Season in Nigeria' Abuja: NAERLS-/PRSD-FMARD.
Federal Ministry of Education. 2014. Manual for Annual School Census Data Collection for Data Collectors and Supervisors. Abuja: Federal Ministry of Education.
Federal Republic of Nigeria. 2004. National Policy on Education. Lagos: NERDC Press.
Federal Republic of Nigeria. 2011. Community Citizenship Education. Abuja: NERDC Press.
Frimanno Ventures. 2012. 'Report of the Community Needs Assessment
Study Conducted for Ovia, Ethiope East Local Government Area, Delta State,' April.
Gali, C. D. 1997. The Nigerian Experience in National Economic Planning, CBN Research Department Seminar Paper No. 2, 8 April.
Health in All Policies: Improving Health through Intersectoral Collaboration (2013). A Discussion Paper, IOM Round Table on Population Health Improve-ment.
Masiye, F., et al. 2008. 'Removal of User Fees in PHC facilities in Zambia: A Study of the Effects on Utilization and Quality of Care'. 57, Equinet Discussion PaperMarch.
Ministry of Education. 2000. UBE for Nigeria. Proceedings of the Main Summit, Abuja: Monday, 29 November 1999.
Morel International Consultants. n.d. Report on Delta State Gross Domestic Product (GDP), 2006-2008. Asaba: Morel.
Murrray, C.J.L, et al. 2010. 'A WHO Framework for Health System Perform-ance Assessment'. Available at: www.who.int/healthinfo/paper30.pd.
National Bureau of Statistics. 2013. Revised Poverty Statistics. Abuja: NBS.
National Bureau of Statistics, 2011. Poverty Profile 2010. Abuja: NBS.
National Bureau of Statistics. 2005. Poverty Profile for Nigeria, 2005. Abuja: NBS.
National Food Reserve Agency (NFRA). 1999-2010. Agricultural Pro-duction Surveys. Abuja: NFRA.
National Population Commission. 2009. Nigerian Demographic and Health Survey, 2008. Abuja: NPC.
Obadan. 2013. 'Development Planning in Africa: The Nigerian Experience'. A Study undertaken for the United Nations Commission for Africa, December.
Obadan, M.I. 1998. The State, Leader-ship, Government and Economic Development. A Published Presidential Address Delivered at the Annual
Conference of the Nigerian Economic Society, Kano, 22-24 July.
Odiaka, O. I. 2013. 'Opinion: 2013 Budget, Education and Nigerian Universities'. Available at http-://www.omojuwa.com/end opinion – 2013- budget.
OSSAP-MDGs. 2010. Nigeria MDGs 2013 Report. Abuja: OSSAP-MDGs.
Okorosaye-Orubite A. K. 2008. From Universal Primary Education (UPE) to Universal Basic Education (UBE): What Hope for Nigeria. University of Port-Harcourt School Graduate Studies Seminar series; SGS Monograph No 1 Port-Harcourt: University of Port-Harcourt Press.
Okpara, K. 2014. 'Delta State Policies /Programmes'. A Presentation at the Preparatory Workshop on 'Delta State Development Performance Assess-ment', held in Asaba, 23-25 March.
OSSAP and UNDP. 2008. MDGs Needs Assessment and Financing Strategy for Nigeria. Abuja: OSSAP/UNDP.
Ottersen, T., et al. 2014. 'WHO Con-sultative Group on Equity and Universal Coverage', WHO , Vol. 92, No.6, BulletinJune. Renner, A, et al. n.d. 'Technical Efficiency of Peripheral Health Units in Pujehun District, Sierra Leone: A DEA Application'. Available at: www.bio-medcentral.com/1472-6963/5/77.
South-South Governors' Forum. 2009. . Based for Global CompetitionsProceed-ings of First South-South Nigeria Economic Summit, 2009. Lagos: Ekidio Limited.
Sripati, V. & Thiruengadam, A. 2004. 'India: Constitutional Amendment Making the Right to Education a Fundamental Right'. International Journal of Constitutional Law, 2 (1): 148.
Task Team for the Global Thematic Consultation on Health in the Post-2015 Development Agenda. 2013. Health in the Post 2015 Agenda Report – of the Global Thematic Consultation on Health. Available at: http://www-.saluteinternazionale.info/wp-con-tent/uploads/2013/07/Health-in-the-
111
post-2015-agenda-Report-on-the-Global-Thematic-Consultation-on-Health-April-2013.pdf.
Uduaghan, E. A. 2013. 'Delta State and Development Imperatives: Exploring the Potential Sectors for Strengthened Partnership between Delta State Government and the United States Department of State'. Text of a Present-ation to the United States' Department of State, 12 June.
Uduaghan, E. A. 2014a. 'Perspectives on Sustainable Development in Delta State: Delta beyond Oil'. Paper presen-tation by His Excellency Dr. Emmanuel Uduaghan, at the Roosevelt House, Hunter College, New York, USA, 7 March.
Uduaghan, E. A. 2014b. 'Despite Challenges We Are Delivering on Our Mandate', Text of a Speech delivered on 29 May Democracy Day at the Events Centre, Asaba.
UNDP. 2009. Human Development Report Nigeria 2008-2009. Achieving Growth with Equity. Abuja: UNDP.
UNICEF. 2010. Making the Case for an Equity Focus in Education. New York: Andrew
United Nations. 2013. 'Addendum to the MDG Country Report Guidelines'. UNDG: Guidance Note. NY: UN.
Universal Basic Education Program-me. 2002. , Abuja: Information on UBEUBE.
WHO. 2010. 'Health System Financing: The Path to Universal Access:. World Health Report, 2010.
WHO. 2013. 'Health in all Policies: Hel-sinki Statement Framework for Action', WHO 8 Global Conference on Health th
Promotion, June.
WHO. n.d. 'Achieving Sustainable Health Development in the African Region, Strategic Directions for WHO, 2010-2015'.
Who Regional Office for Africa. 2008. 'Framework for Implementation of the Ouagadougou Declaration on Primary Health Care and Health Systems in Africa: Achieving Better Health for Africa in the New Millennium, AFR/RC58/16, Yaounde, Cameroun, July.
World Bank. 2011. Delta Procurement Assessment Report (DSPAR), September.
World Bank. 1992. Governance and
Development. Washington, D.C: Inter-national Bank for Reconstruction and Development.
World Bank. 2013. 'Africa Continues to Grow Strongly but Poverty and Inequality Remain Persistently High'. Available at: http://www.world-b a n k . o r g / e n / n e w s / p r e s s - r e -lease/2013/10/07/africa-continuous-grow-strongly-poverty-inequality/

112
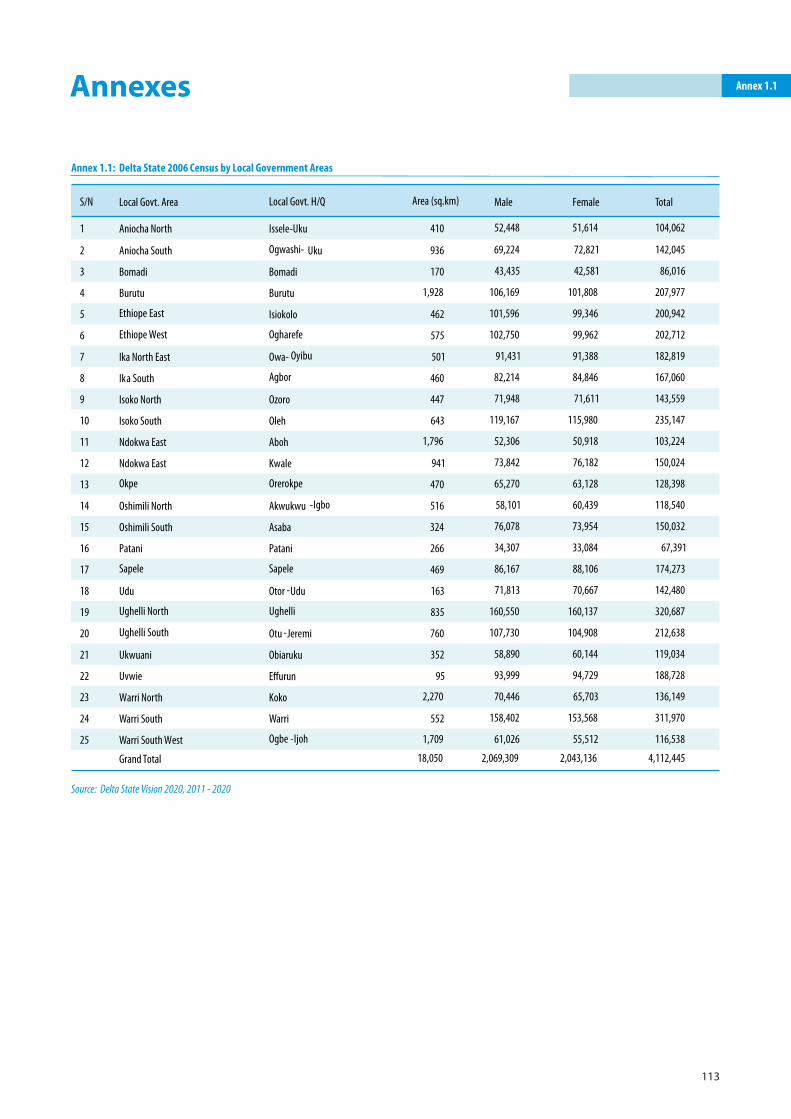
113
Annexes
Source: Delta State Vision 2020, 2011 - 2020
Annex 1.1: Delta State 2006 Census by Local Government Areas
S/N Local Govt. Area Local Govt. H/Q Area (sq.km) Male Female Total
1 Aniocha North Issele-Uku 410 52,448 51,614 104,062
2 Aniocha South Ogwashi- Uku 936 69,224 72,821 142,045
3 Bomadi Bomadi 170 43,435 42,581 86,016
4 Burutu Burutu 1,928 106,169 101,808 207,977
5 Ethiope East Isiokolo 462 101,596 99,346 200,942
6 Ethiope West Ogharefe 575 102,750 99,962 202,712
7 Ika North East Owa- Oyibu 501 91,431 91,388 182,819
8 Ika South Agbor 460 82,214 84,846 167,060
9 Isoko North Ozoro 447 71,948 71,611 143,559
10 Isoko South Oleh 643 119,167 115,980 235,147
11 Ndokwa East Aboh 1,796 52,306 50,918 103,224
12 Ndokwa East Kwale 941 73,842 76,182 150,024
13 Okpe Orerokpe 470 65,270 63,128 128,398
14 Oshimili North Akwukwu -Igbo 516 58,101 60,439 118,540
15 Oshimili South Asaba 324 76,078 73,954 150,032
16 Patani Patani 266 34,307 33,084 67,391
17 Sapele Sapele 469 86,167 88,106 174,273
18 Udu Otor -Udu 163 71,813 70,667 142,480
19 Ughelli North Ughelli 835 160,550 160,137 320,687
20 Ughelli South Otu -Jeremi 760 107,730 104,908 212,638
21 Ukwuani Obiaruku 352 58,890 60,144 119,034
22 Uvwie Effurun 95 93,999 94,729 188,728
23 Warri North Koko 2,270 70,446 65,703 136,149
24 Warri South Warri 552 158,402 153,568 311,970
25 Warri South West Ogbe -Ijoh 1,709 61,026 55,512 116,538
Grand Total 18,050 2,069,309 2,043,136 4,112,445
Annex 1.1
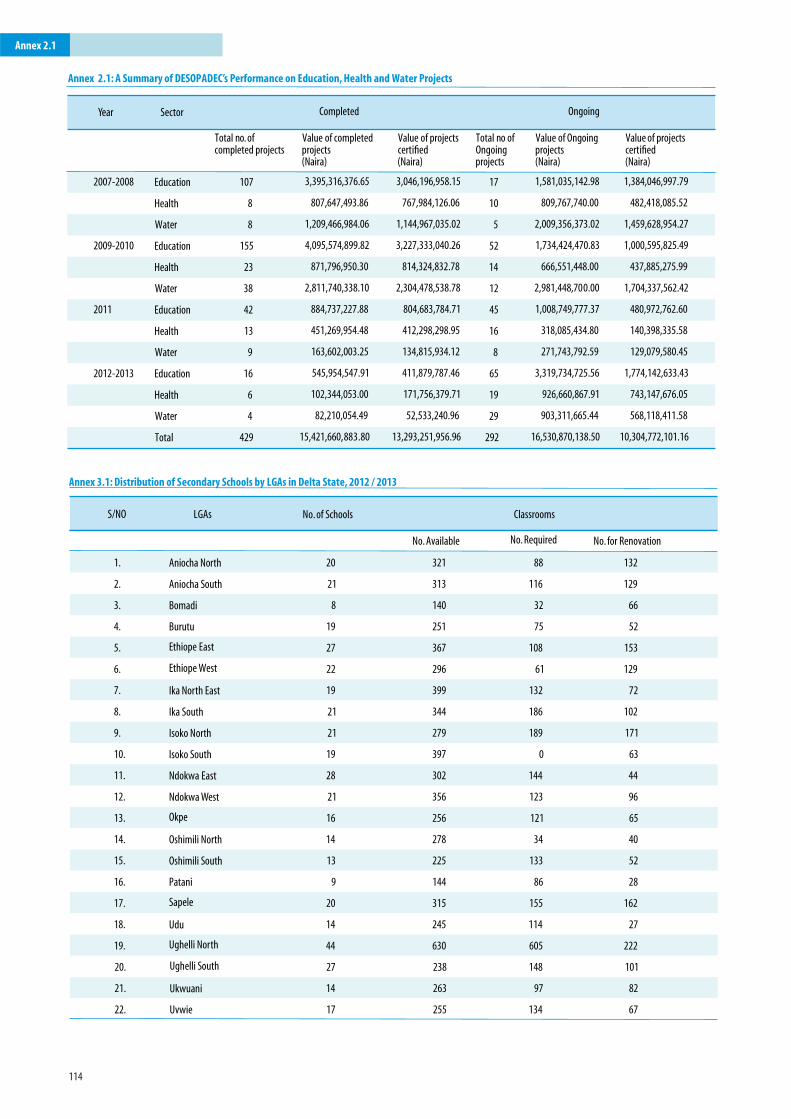
114
Annex 2.1: A Summary of DESOPADEC’s Performance on Education, Health and Water Projects
Year Sector Completed Ongoing
Total no. of completed projects
Value of completed projects (Naira)
Value of projects certified (Naira)
Total no of Ongoing projects
Value of Ongoing projects (Naira)
Value of projects certified (Naira)
Education 107 3,395,316,376.65 3,046,196,958.15 17 1,581,035,142.98 1,384,046,997.79 2007-2008
Health 8 807,647,493.86 767,984,126.06 10 809,767,740.00 482,418,085.52
Water 8 1,209,466,984.06 1,144,967,035.02 5 2,009,356,373.02 1,459,628,954.27
Education 155 4,095,574,899.82 3,227,333,040.26 52 1,734,424,470.83 1,000,595,825.49 2009-2010
Health 23 871,796,950.30 814,324,832.78 14 666,551,448.00 437,885,275.99
Water 38 2,811,740,338.10 2,304,478,538.78 12 2,981,448,700.00 1,704,337,562.42
Education 42 884,737,227.88 804,683,784.71 45 1,008,749,777.37 480,972,762.60 2011
Health 13 451,269,954.48 412,298,298.95 16 318,085,434.80 140,398,335.58
Water 9 163,602,003.25 134,815,934.12 8 271,743,792.59 129,079,580.45
Education 16 545,954,547.91 411,879,787.46 65 3,319,734,725.56 1,774,142,633.43
Health 6 102,344,053.00 171,756,379.71 19 926,660,867.91 743,147,676.05
2012-2013
Water
4 82,210,054.49
52,533,240.96
29
903,311,665.44
568,118,411.58
Total 429 15,421,660,883.80 13,293,251,956.96 292 16,530,870,138.50 10,304,772,101.16
Annex 3.1: Distribution of Secondary Schools by LGAs in Delta State, 2012 / 2013
S/NO LGAs No. of Schools Classrooms
No. Available No. Required No. for Renovation
1. Aniocha North 20 321
2. Aniocha South 21 313
3. Bomadi 8 140
4. Burutu 19 251
5. Ethiope East 27 367
6. Ethiope West 22 296
7. Ika North East 19 399
8. Ika South 21 344
9. Isoko North 21 279
10. Isoko South 19 397
11. Ndokwa East 28 302
12. Ndokwa West 21 356
13. Okpe 16 256
14. Oshimili North 14 278
15. Oshimili South 13 225
16. Patani 9 144
17. Sapele 20 315
18. Udu 14 245
Ughelli North 44 630
19.
20. Ughelli South 27 238
21. Ukwuani 14 263
22. Uvwie 17 255
88
116
32
75
108
61
132
186
189
0
144
123
121
34
133
86
155
114
605
148
97
134
132
129
66
52
153
129
72
102
171
63
44
96
65
40
52
28
162
27
222
101
82
67
Annex 2.1
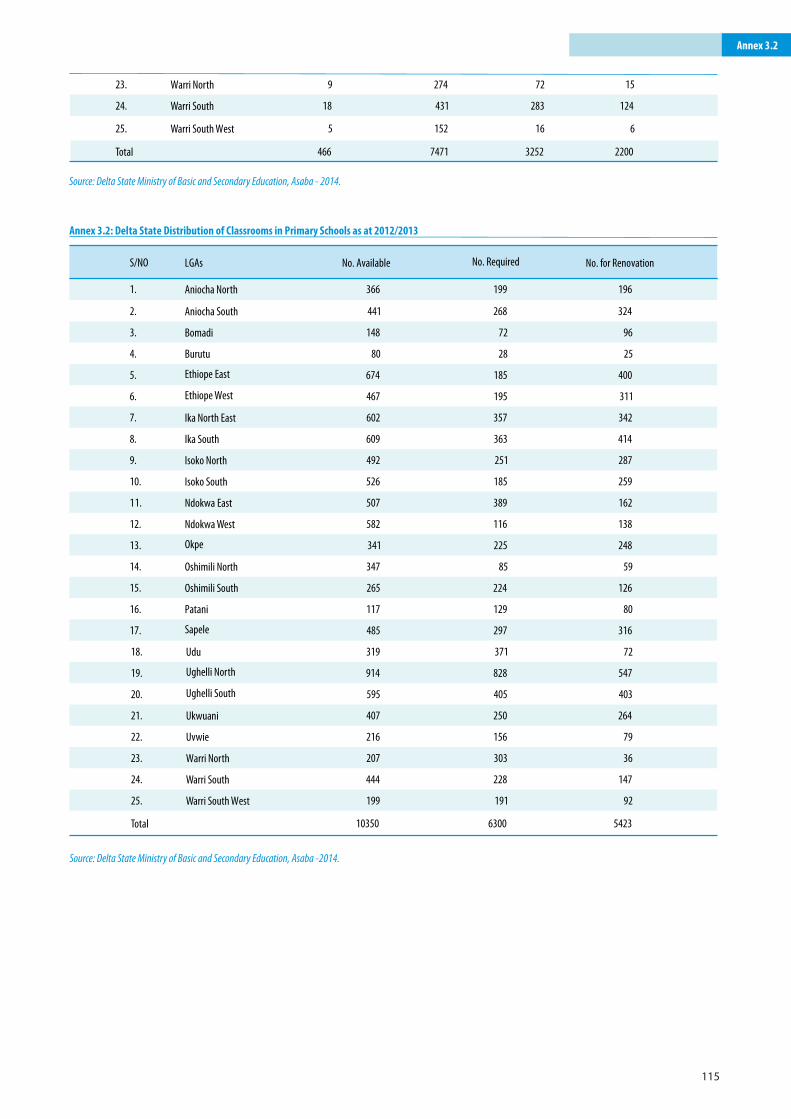
115
23. Warri North 9 274 72 15
24. Warri South 18 431 283 124
25. Warri South West 5 152 16 6
Total 466 7471 3252 2200
Source: Delta State Ministry of Basic and Secondary Education, Asaba - 2014.
Annex 3.2: Delta State Distribution of Classrooms in Primary Schools as at 2012/2013
S/NO LGAs
No. Available No. Required No. for Renovation
1. Aniocha North
2. Aniocha South
3. Bomadi
4. Burutu
5. Ethiope East
6. Ethiope West
7. Ika North East
8. Ika South
9. Isoko North
10. Isoko South
11. Ndokwa East
12. Ndokwa West
13. Okpe
14. Oshimili North
15. Oshimili South
16. Patani
17. Sapele
18. Udu
19. Ughelli North
20. Ughelli South
21. Ukwuani
22. Uvwie
23. Warri North
24. Warri South
25. Warri South West
Total
199
268
72
28
185
195
357
363
251
185
389
116
225
85
224
129
297
371
828
405
250
156
303
228
191
6300
196
324
96
25
400
311
342
414
287
259
162
138
248
59
126
80
316
72
547
403
264
79
36
147
92
5423
Source: Delta State Ministry of Basic and Secondary Education, Asaba -2014.
366
441
148
80
674
467
602
609
492
526
507
582
341
347
265
117
485
319
914
595
407
216
207
444
199
10350
Annex 3.2
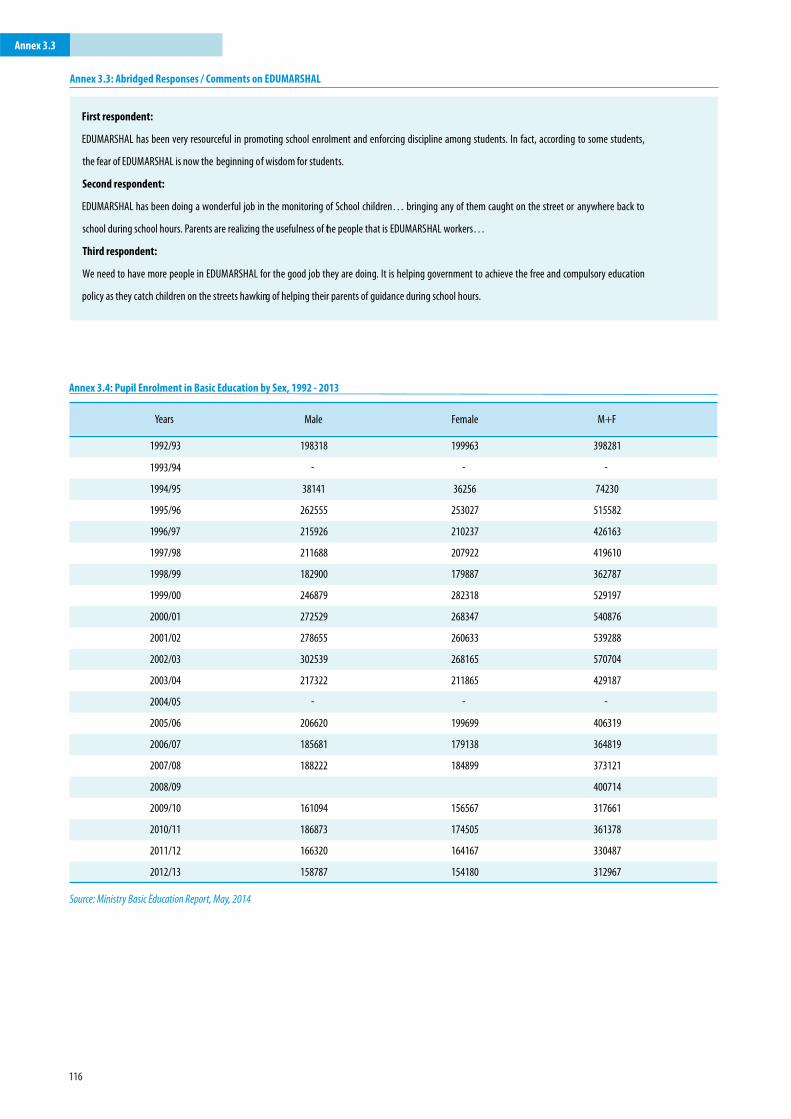
116
First respondent:
EDUMARSHAL has been very resourceful in promoting school enrolment and enforcing discipline among students. In fact, accordin g to some students,
the fear of EDUMARSHAL is now the beginning of wisdom for students.
Second respondent:
EDUMARSHAL has been doing a wonderful job in the monitoring of School children… bringing any of them caught on the street or anywhere back to
school during school hours. Parents are realizing the usefulness of the people that is EDUMARSHAL workers…
Third respondent:
We need to have more people in EDUMARSHAL for the good job they are doing. It is helping government to achieve the free and compulsory education
policy as they catch children on the streets hawking of helping their parents of guidance during school hours.
Annex 3.3: Abridged Responses / Comments on EDUMARSHAL
Years Male Female M+F
1992/93 198318 199963 398281
1993/94 - - -
1994/95 38141 36256 74230
1995/96 262555 253027 515582
1996/97 215926 210237 426163
1997/98 211688 207922 419610
1998/99 182900 179887 362787
1999/00 246879 282318 529197
2000/01 272529 268347 540876
2001/02 278655 260633 539288
2002/03 302539 268165 570704
2003/04 217322 211865 429187
2004/05 - - -
2005/06 206620 199699 406319
2006/07 185681 179138 364819
2007/08 188222 184899 373121
2009/10 161094 156567 317661
2010/11 186873 174505 361378
2011/12 166320 164167 330487
2012/13 158787 154180 312967
Annex 3.4: Pupil Enrolment in Basic Education by Sex, 1992 - 2013
Source: Ministry Basic Education Report, May, 2014
2008/09 400714
Annex 3.3
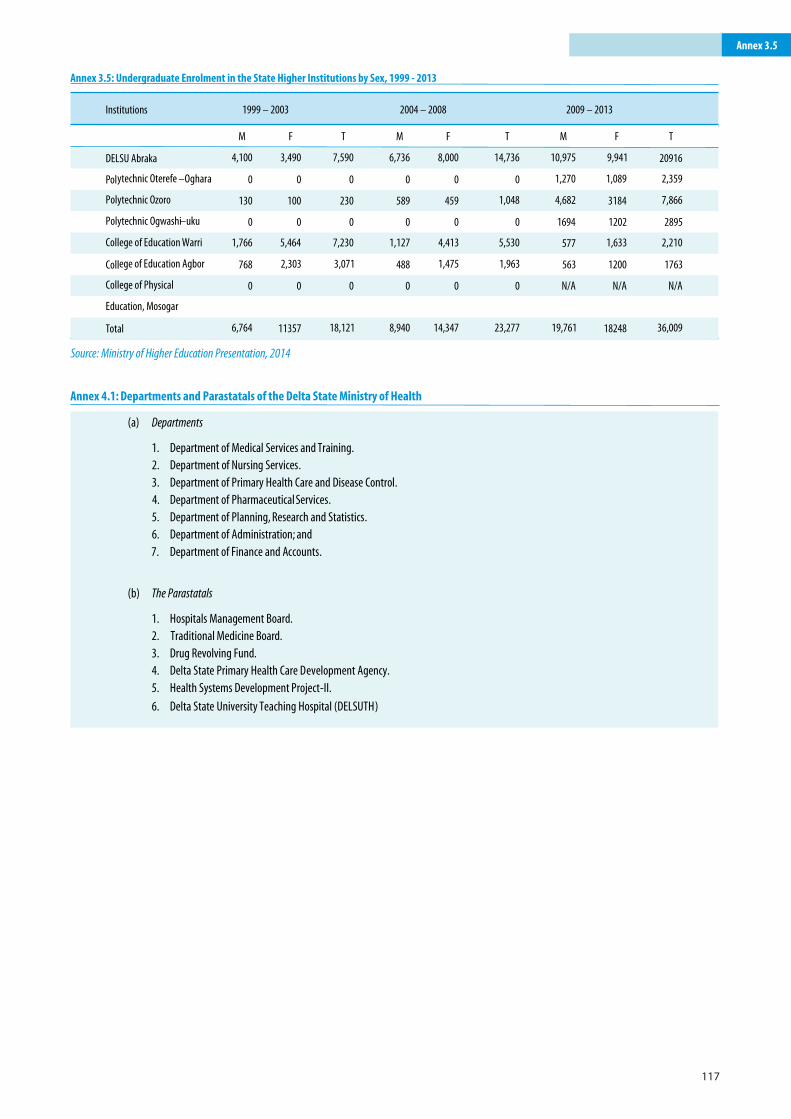
117
Annex 4.1: Departments and Parastatals of the Delta State Ministry of Health
(a) Departments
1. Department of Medical Services and Training. 2. Department of Nursing Services. 3. Department of Primary Health Care and Disease Control. 4. Department of Pharmaceutical Services. 5. Department of Planning, Research and Statistics. 6. Department of Administration; and 7. Department of Finance and Accounts.
(b) The Parastatals
1. Hospitals Management Board. 2. Traditional Medicine Board. 3. Drug Revolving Fund. 4. Delta State Primary Health Care D evelopment Agency. 5. Health Systems Development Project -II.
6. Delta State University Teaching Hospital (DELSUTH )
Institutions 1999 – 2003 2004 – 2008 2009 – 2013
M F T M F T M F T
DELSU Abraka 4,100 3,490 7,590 6,736 8,000 14,736 10,975 9,941 20916
Polytechnic Oterefe –Oghara 0 0 0 0 0 0 1,270 1,089 2,359
Polytechnic Ozoro 130 100 230 589 459 1,048 4,682 3184 7,866
Polytechnic Ogwashi–uku 0 0 0 0 0 0 1694 1202 2895
College of Education Warri 1,766 5,464 7,230 1,127 4,413 5,530 577 1,633 2,210
College of Education Agbor 768 2,303 3,071 488 1,475 1,963 563 1200 1763
College of Physical
Education, Mosogar
0 0 0 0 0 0 N/A N/A N/A
Source: Ministry of Higher Education Presentation, 2014
Annex 3.5: Undergraduate Enrolment in the State Higher Institutions by Sex, 1999 - 2013
Total 6,764 11357 14,347 23,277 19,761 18248 36,009 18,121 8,940
Annex 3.5
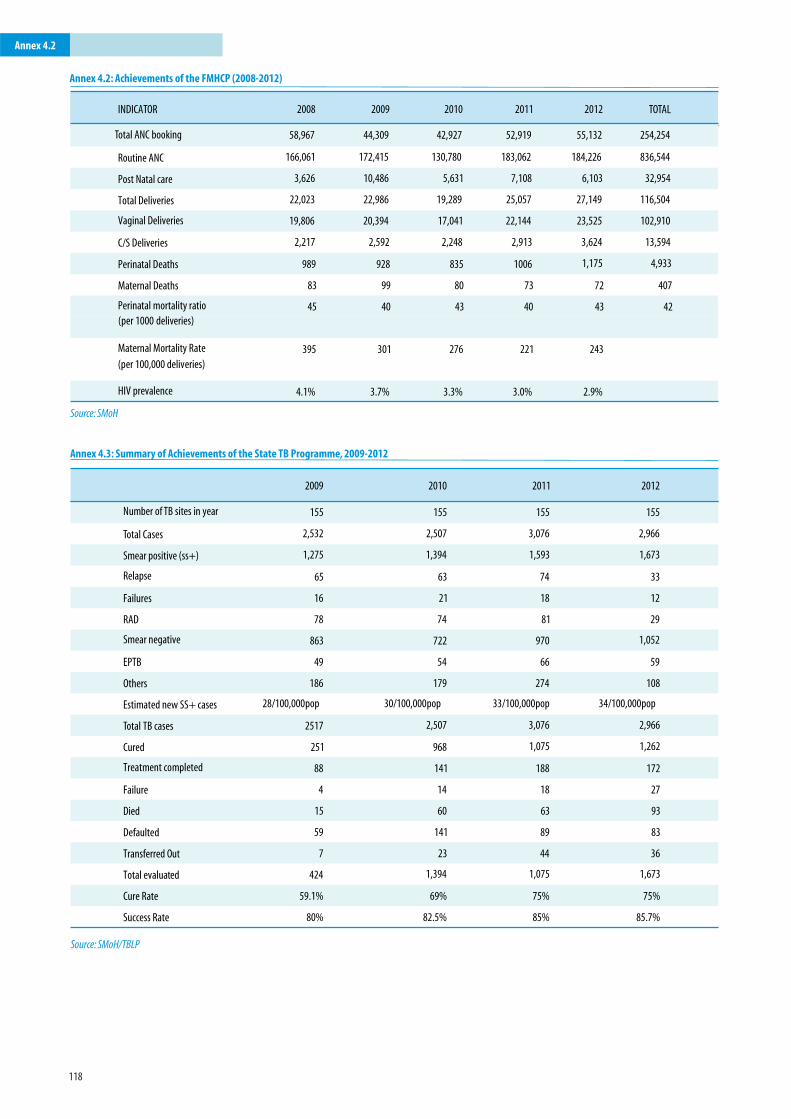
118
Annex 4.2: Achievements of the FMHCP (2008-2012)
INDICATOR 2008 2009 2010 2011 2012 TOTAL
Total ANC booking 58,967 44,309 42,927 52,919 55,132 254,254
Routine ANC 166,061 172,415 130,780 183,062 184,226 836,544
Post Natal care 3,626 10,486 5,631 7,108 6,103 32,954
Total Deliveries 22,023 22,986 19,289 25,057 27,149 116,504
Vaginal Deliveries 19,806 20,394 17,041 22,144 23,525 102,910
C/S Deliveries 2,217 2,592 2,248 2,913 3,624 13,594
Perinatal Deaths 989 928 835 1006 1,175 4,933
Maternal Deaths 83 99 80 73 72 407
Perinatal mortality ratio(per 1000 deliveries)
45 40 43 40 43 42
Maternal Mortality Rate
(per 100,000 deliveries)
395 301 276 221 243
HIV prevalence 4.1% 3.7% 3.3% 3.0% 2.9%
Source: SMoH
2009 2010 2011 2012
Number of TB sites in year 155 155 155 155
Total Cases 2,532 2,507 3,076 2,966
Smear positive (ss+) 1,275 1,394 1,593 1,673
Relapse 65 63 74 33
Failures 16 21 18 12
RAD 78 74 81 29
Smear negative 863 722 970 1,052
EPTB 49 54 66 59
Others 186 179 274 108
Estimated new SS+ cases 28/100,000pop 30/100,000pop 33/100,000pop 34/100,000pop
Total TB cases 2517 2,507 3,076 2,966
Cured 251 968 1,075 1,262
Treatment completed 88 141 188 172
Failure 4 14 18 27
Died 15 60 63 93
Defaulted 59 141 89 83
Transferred Out 7 23 44 36
Total evaluated 424 1,394 1,075 1,673
Cure Rate 59.1% 69% 75% 75%
Success Rate 80% 82.5% 85% 85.7%
Source: SMoH/TBLP
Annex 4.3: Summary of Achievements of the State TB Programme, 2009-2012
Annex 4.2
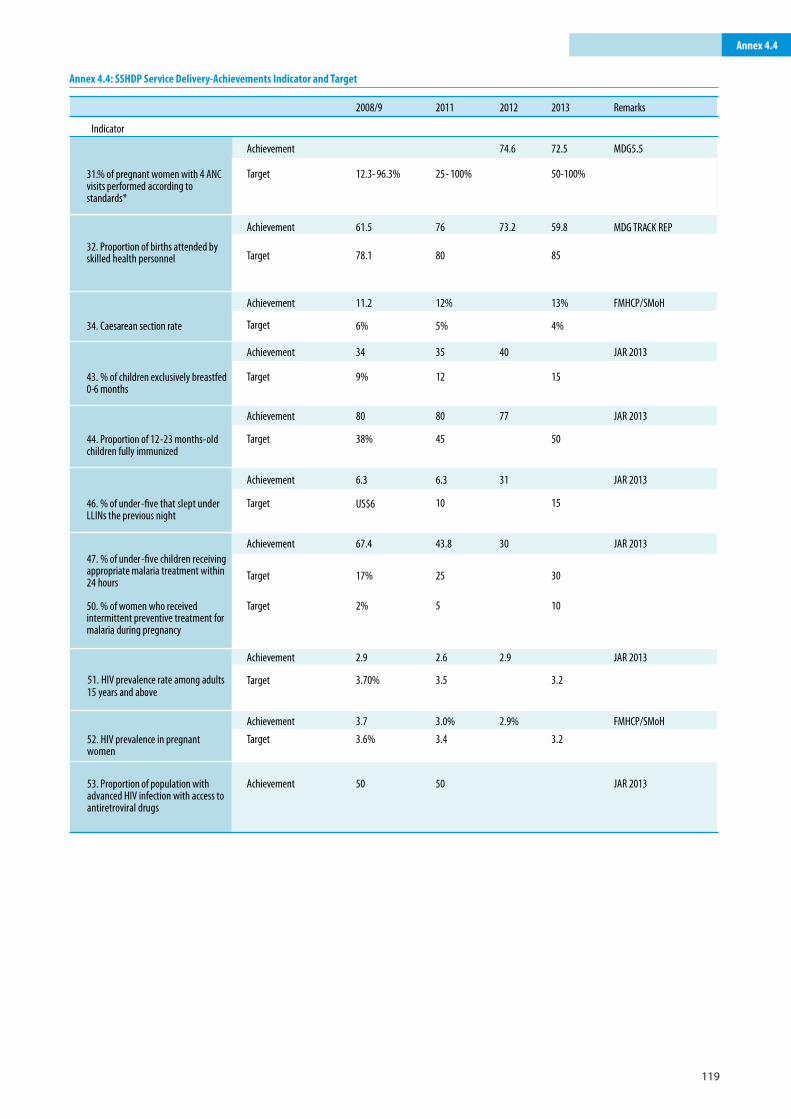
119
2008/9 2011 2012 2013 Remarks
Indicator
31.% of pregnant women with 4 ANC visits performed according to standards*
Achievement 74.6 72.5 MDG5.5
Target 12.3 - 96.3% 25 - 100% 50-100%
Achievement 61.5 76 73.2 59.8 MDG TRACK REP
32. Proportion of births attended by skilled health personnel
Target
78.1
80
85
34. Caesarean section rate
Achievement 11.2 12% 13% FMHCP/SMoH
Target 6% 5% 4%
Achievement 34 35 40 JAR 2013
43. % of children exclusively breastfed 0-6 months
Target 9% 12 15
Achievement 80 80 77 JAR 2013
44. Proportion of 12-23 months-old children fully immunized
Target 38% 45 50
Achievement 6.3 6.3 31 JAR 2013
46. % of under-five that slept under LLINs the previous night
Target
US$6
10
15
Achievement 67.4 43.8 30 JAR 2013 47. % of under-five children receivingappropriate malaria treatment within 24 hours
Target 17% 25 30
50. % of women who received intermittent preventive treatment for malaria during pregnancy
Target
2%
5
10
Annex 4.4: SSHDP Service Delivery-Achievements Indicator and Target
Annex 4.4
Achievement 2.9 2.6 2.9 JAR 2013
Target
3.70%
3.5
3.2
Achievement 3.7 3.0% 2.9% FMHCP/SMoH
Target 3.6% 3.4 3.2
51. HIV prevalence rate among adults15 years and above
52. HIV prevalence in pregnant women
53. Proportion of population with advanced HIV infection with access to antiretroviral drugs
Achievement 50 50 JAR 2013
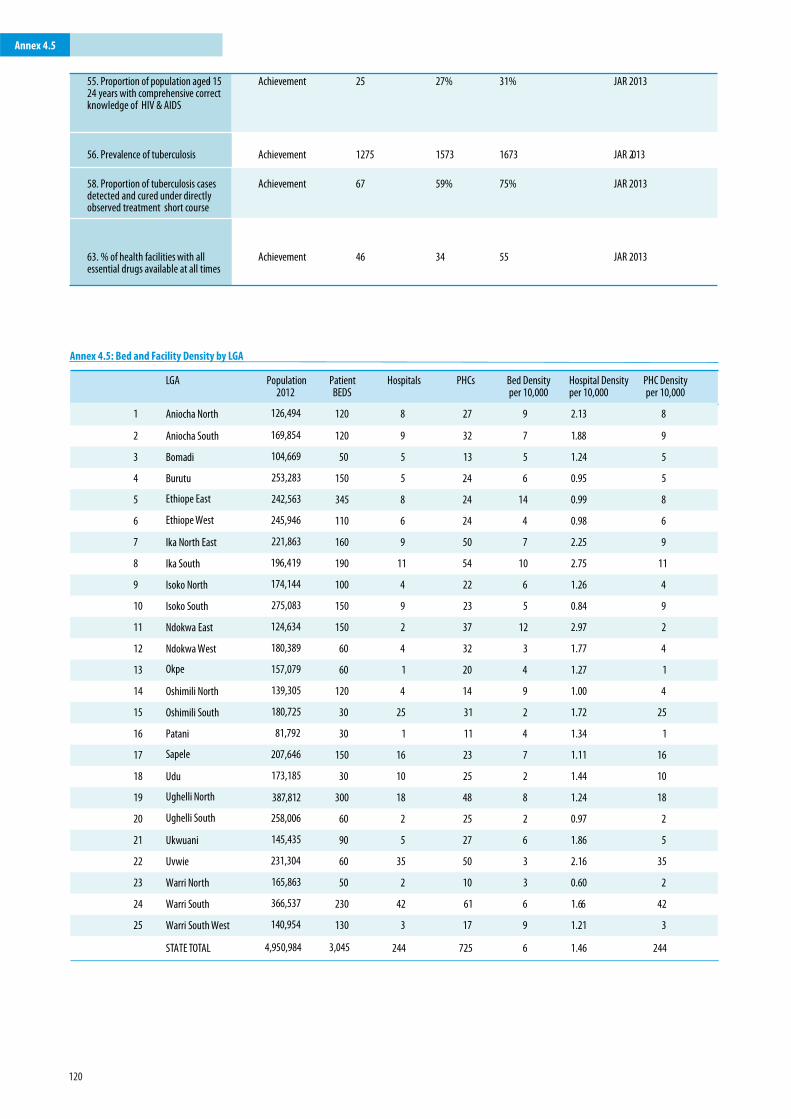
120
Achievement 25 27% 31% JAR 2013
Achievement 1275 1573 1673 JAR 2013
Achievement 67 59% 75% JAR 2013
55. Proportion of population aged 15-24 years with comprehensive correct knowledge of HIV & AIDS
56. Prevalence of tuberculosis
58. Proportion of tuberculosis cases detected and cured under directly observed treatment short course
63. % of health facilities with all essential drugs available at all times
Achievement 46 34 55 JAR 2013
LGA Population 2012
Patient BEDS
Hospitals PHCs Bed Density per 10,000
Hospital Density per 10,000
PHC Density per 10,000
1 Aniocha North 120 8 9 2.13 8
2 Aniocha South 120 9 7 1.88 9
3 Bomadi 50 5 5 1.24 5
4 Burutu 150 5 6 0.95 5
5 Ethiope East 345 8 14 0.99 8
6 Ethiope West 110 6 4 0.98 6
7 Ika North East 160 9 7 2.25 9
8 Ika South 190 11 10 2.75 11
9 Isoko North 100 4 6 1.26 4
10 Isoko South 150 9 5 0.84 9
11 Ndokwa East 150 2 12 2.97 2
12 Ndokwa West 60 4 3 1.77 4
13 Okpe 60 1 4 1.27 1
14 Oshimili North 120 4 9 1.00 4
15 Oshimili South 30 25 2 1.72 25
16 Patani 30 1 4 1.34 1
17 Sapele 150 16 7 1.11 16
18 Udu 30 10 2 1.44 10
19 Ughelli North 300 18 8 1.24 18
20 Ughelli South 60 2 2 0.97 2
21 Ukwuani 90 5 6 1.86 5
22 Uvwie 60 35 3 2.16 35
23 Warri North 50 2 3 0.60 2
24 Warri South 230 42 6 1.66 42
25 Warri South West 130 3 9 1.21 3
STATE TOTAL
126,494
169,854
104,669
253,283
242,563
245,946
221,863
196,419
174,144
275,083
124,634
180,389
157,079
139,305
180,725
81,792
207,646
173,185
387,812
258,006
145,435
231,304
165,863
366,537
140,954
4,950,984 3,045 244
27
32
13
24
24
24
50
54
22
23
37
32
20
14
31
11
23
25
48
25
27
50
10
61
17
725 6 1.46 244
Annex 4.5: Bed and Facility Density by LGA
Annex 4.5
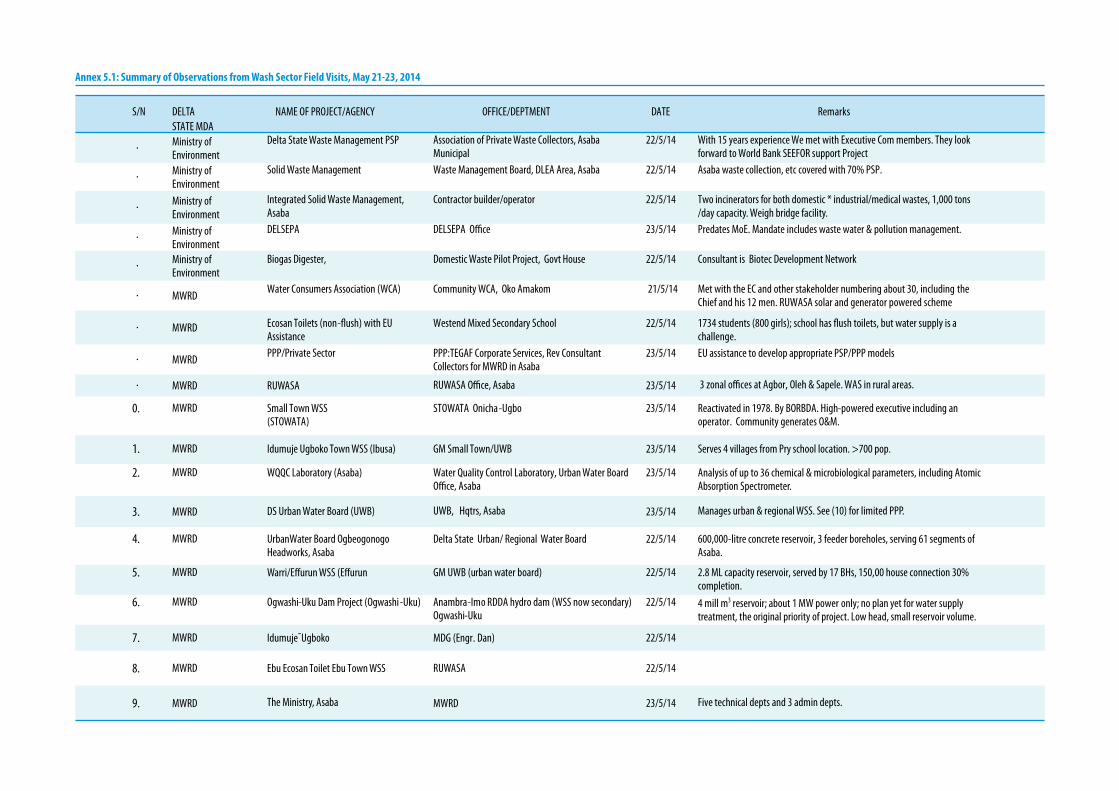
119
S/N DELTA NAME OF PROJECT/AGENCY OFFICE/DEPTMENT DATE RemarksSTATE MDA
.
Ministry of Environment
Delta State Waste Management PSP Association of Private Waste Collectors, Asaba Municipal
22/5/14 With 15 years experience We met with Executive Com members. They look forward to World Bank SEEFOR support Project
.
Ministry of Environment
Solid Waste Management Waste Management Board, DLEA Area, Asaba 22/5/14 Asaba waste collection, etc covered with 70% PSP.
. Ministry of Environment
Integrated Solid Waste Management, Asaba
Contractor builder/operator 22/5/14 Two incinerators for both domestic * industrial/medical wastes, 1,000 tons /day capacity. Weigh bridge facility.
.
Ministry of Environment
DELSEPA DELSEPA Office 23/5/14 Predates MoE. Mandate includes waste water & pollution management.
.
Ministry of Environment
Biogas Digester, Domestic Waste Pilot Project, Govt House 22/5/14 Consultant is Biotec Development Network
.
MWRD Water Consumers Association (WCA) Community WCA, Oko Amakom 21/5/14 Met with the EC and other stakeholder numbering about 30, including the
Chief and his 12 men. RUWASA solar and generator powered scheme
.
MWRD Ecosan Toilets (non-flush) with EU Assistance
Westend Mixed Secondary School 22/5/14 1734 students (800 girls); school has flush toilets, but water supply is a challenge.
.
MWRD
PPP/Private Sector PPP:TEGAF Corporate Services, Rev Consultant Collectors for MWRD in Asaba
23/5/14 EU assistance to develop appropriate PSP/PPP models
.
MWRD RUWASA RUWASA Office, Asaba 23/5/14 3 zonal offices at Agbor, Oleh & Sapele. WAS in rural areas.
0. MWRD STOWATA Onicha -Ugbo 23/5/14 Reactivated in 1978. By BORBDA. High-powered executive including an
operator. Community generates O&M. Small Town WSS (STOWATA)
1. MWRD Idumuje Ugboko Town WSS (Ibusa) GM Small Town/UWB 23/5/14 Serves 4 villages from Pry school location. >700 pop.
2. MWRD WQQC Laboratory (Asaba) Water Quality Control Laboratory, Urban Water Board Office, Asaba
23/5/14 Analysis of up to 36 chemical & microbiological parameters, including Atomic Absorption Spectrometer.
3. MWRD DS Urban Water Board (UWB) UWB, Hqtrs, Asaba 23/5/14 Manages urban & regional WSS. See (10) for limited PPP.
4. UrbanWater Board Ogbeogonogo Headworks, Asaba
Delta State Urban/ Regional Water Board 22/5/14 600,000-litre concrete reservoir, 3 feeder boreholes, serving 61 segments of Asaba.
MWRD
5. MWRD Warri/Effurun WSS (Effurun GM UWB (urban water board) 22/5/14 2.8 ML capacity reservoir, served by 17 BHs, 150,00 house connection 30%
completion.
6.
MWRD
Ogwashi-Uku Dam Project (Ogwashi-Uku)
22/5/14
4 mill m3 reservoir; about 1 MW power only; no plan yet for water supply treatment, the original priority of project. Low head, small reservoir volume.
Anambra-Imo RDDA hydro dam (WSS now secondary)Ogwashi-Uku
7.
MWRD
Idumuje-Ugboko
MDG (Engr. Dan)
22/5/14
8.
MWRD
Ebu Ecosan Toilet Ebu Town WSS
RUWASA
22/5/14
9. MWRD The Ministry, Asaba MWRD 23/5/14 Five technical depts and 3 admin depts.
Annex 5.1: Summary of Observations from Wash Sector Field Visits, May 21-23, 2014
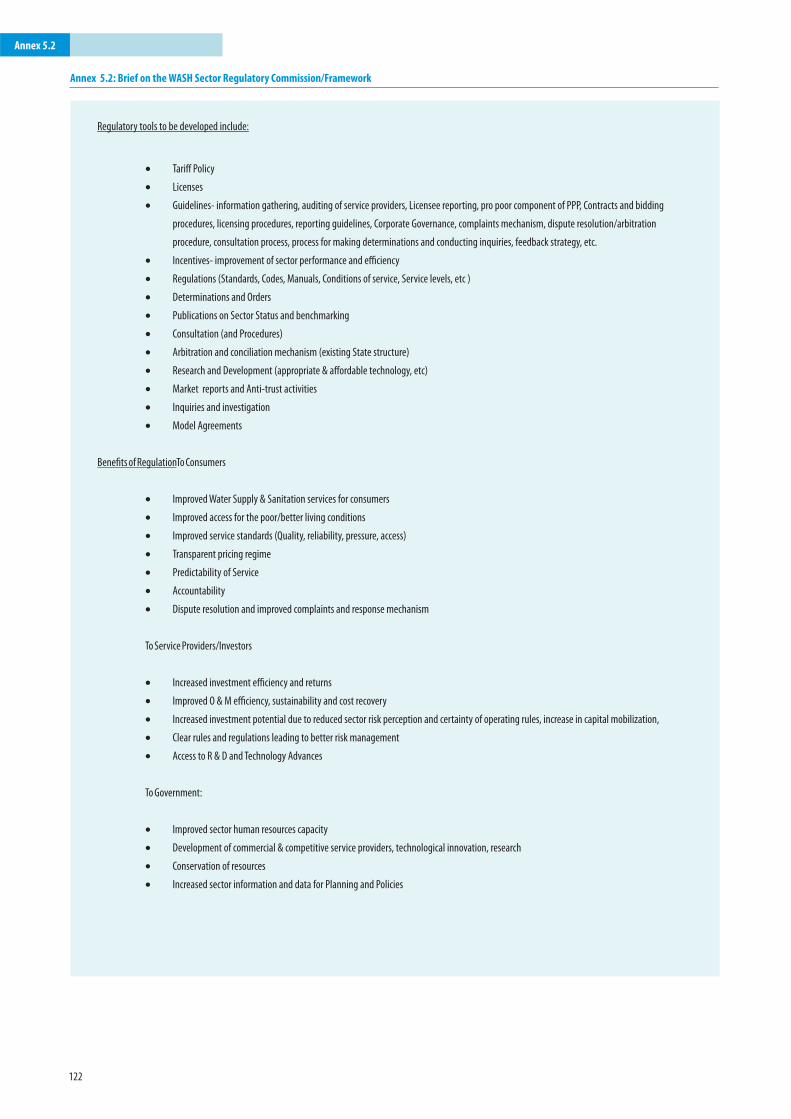
122
Regulatory tools to be developed include:
· Tariff Policy
· Licenses
· Guidelines- information gathering, auditing of service providers, Licensee reporting, pro poor component of PPP, Contracts and bidding
procedures, licensing procedures, reporting guidelines, Corporate Governance, complaints mechanism, dispute resolution/arbitration
procedure, consultation process, process for making determinations and conducting inquiries, feedback strategy, etc.
· Incentives- improvement of sector performance and efficiency
· Regulations (Standards, Codes, Manuals, Conditions of service, Service levels, etc )
· Determinations and Orders
· Publications on Sector Status and benchmarking
· Consultation (and Procedures)
· Arbitration and conciliation mechanism (existing State structure)
· Research and Development (appropriate & affordable technology, etc)
· Market reports and Anti-trust activities
· Inquiries and investigation
· Model Agreements
Benefits of RegulationTo Consumers
· Improved Water Supply & Sanitation services for consumers
· Improved access for the poor/better living conditions
· Improved service standards (Quality, reliability, pressure, access)
· Transparent pricing regime
· Predictability of Service
· Accountability
· Dispute resolution and improved complaints and response mechanism
To Service Providers/Investors
· Increased investment efficiency and returns
· Improved O & M efficiency, sustainability and cost recovery
· Increased investment potential due to reduced sector risk perception and certainty of operating rules, increase in capital mobilization,
· Clear rules and regulations leading to better risk management
· Access to R & D and Technology Advances
To Government:
· Improved sector human resources capacity
· Development of commercial & competitive service providers, technological innovation, research
· Conservation of resources
· Increased sector information and data for Planning and Policies
Annex 5.2: Brief on the WASH Sector Regulatory Commission/Framework
Annex 5.2
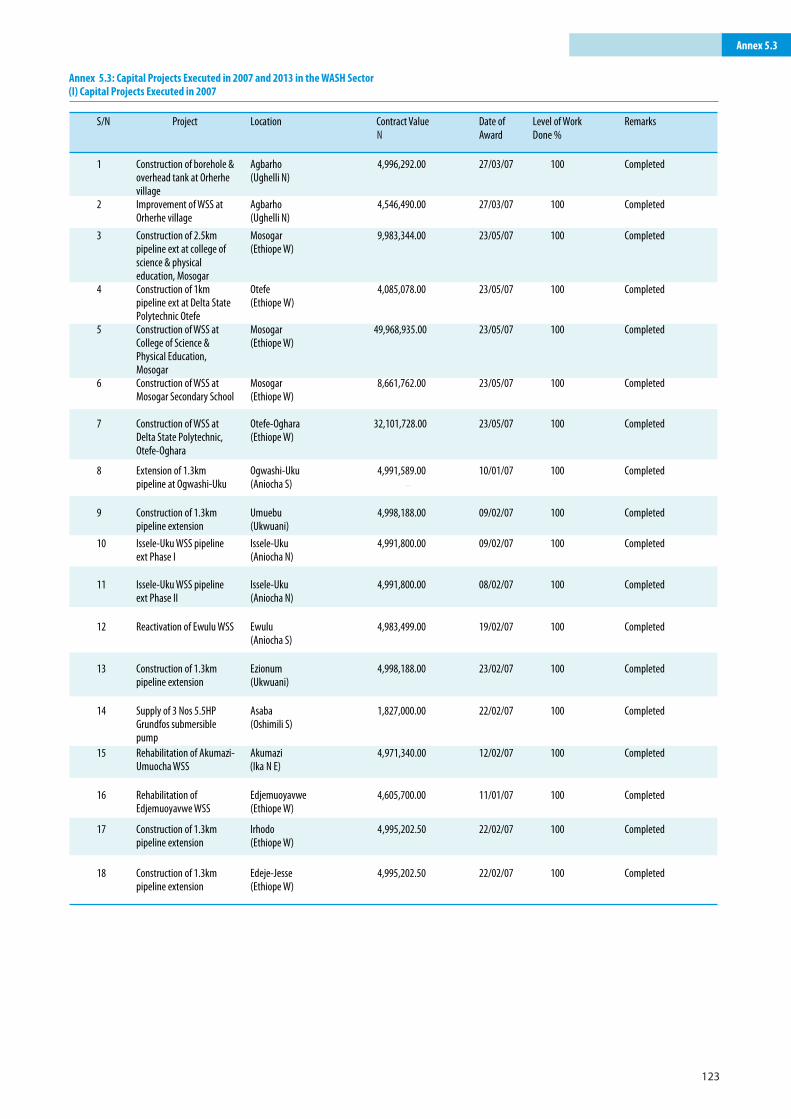
123
Annex 5.3
DRAFT
S/N Project Location Date of Award
Level of Work Done %
Remarks
1 Construction of borehole & overhead tank at Orherhe village
Agbarho (Ughelli N)
4,996,292.00 27/03/07 100 Completed
2 Improvement of WSS at Orherhe village
Agbarho (Ughelli N)
4,546,490.00 27/03/07 100 Completed
3 Construction of 2.5km pipeline ext at college of science & physical education, Mosogar
Mosogar (Ethiope W)
9,983,344.00 23/05/07 100 Completed
4 Construction of 1km pipeline ext at Delta State Polytechnic Otefe
Otefe (Ethiope W)
4,085,078.00 23/05/07 100 Completed
5 Construction of WSS at College of Science & Physical Education, Mosogar
Mosogar (Ethiope W)
49,968,935.00 23/05/07 100 Completed
6 Construction of WSS at Mosogar Secondary School
Mosogar (Ethiope W)
8,661,762.00 23/05/07 100 Completed
7 Construction of WSS at Delta State Polytechnic, Otefe-Oghara
Otefe-Oghara (Ethiope W)
32,101,728.00 23/05/07 100 Completed
8 Extension of 1.3km pipeline at Ogwashi-Uku
Ogwashi-Uku (Aniocha S)
4,991,589.00 10/01/07 100 Completed
9 Construction of 1.3km pipeline extension
Umuebu (Ukwuani)
4,998,188.00 09/02/07 100 Completed
10 Issele-Uku WSS pipeline ext Phase I
Issele-Uku (Aniocha N)
4,991,800.00 09/02/07 100 Completed
11 Issele-Uku WSS pipeline ext Phase II
Issele-Uku (Aniocha N)
4,991,800.00 08/02/07 100 Completed
12 Reactivation of Ewulu WSS Ewulu (Aniocha S)
4,983,499.00 19/02/07 100 Completed
13 Construction of 1.3km pipeline extension
Ezionum (Ukwuani)
4,998,188.00 23/02/07 100 Completed
14 Supply of 3 Nos 5.5HP Grundfos submersible pump
Asaba (Oshimili S)
1,827,000.00 22/02/07 100 Completed
15 Rehabilitation of Akumazi-Umuocha WSS
Akumazi (Ika N E)
4,971,340.00 12/02/07 100 Completed
16 Rehabilitation of Edjemuoyavwe WSS
Edjemuoyavwe (Ethiope W)
4,605,700.00 11/01/07 100 Completed
17 Construction of 1.3km pipeline extension
Irhodo (Ethiope W)
4,995,202.50 22/02/07 100 Completed
18 Construction of 1.3km pipeline extension
Edeje-Jesse (Ethiope W)
4,995,202.50 22/02/07 100 Completed
Contract Value N
Annex 5.3: Capital Projects Executed in 2007 and 2013 in the WASH Sector(I) Capital Projects Executed in 2007
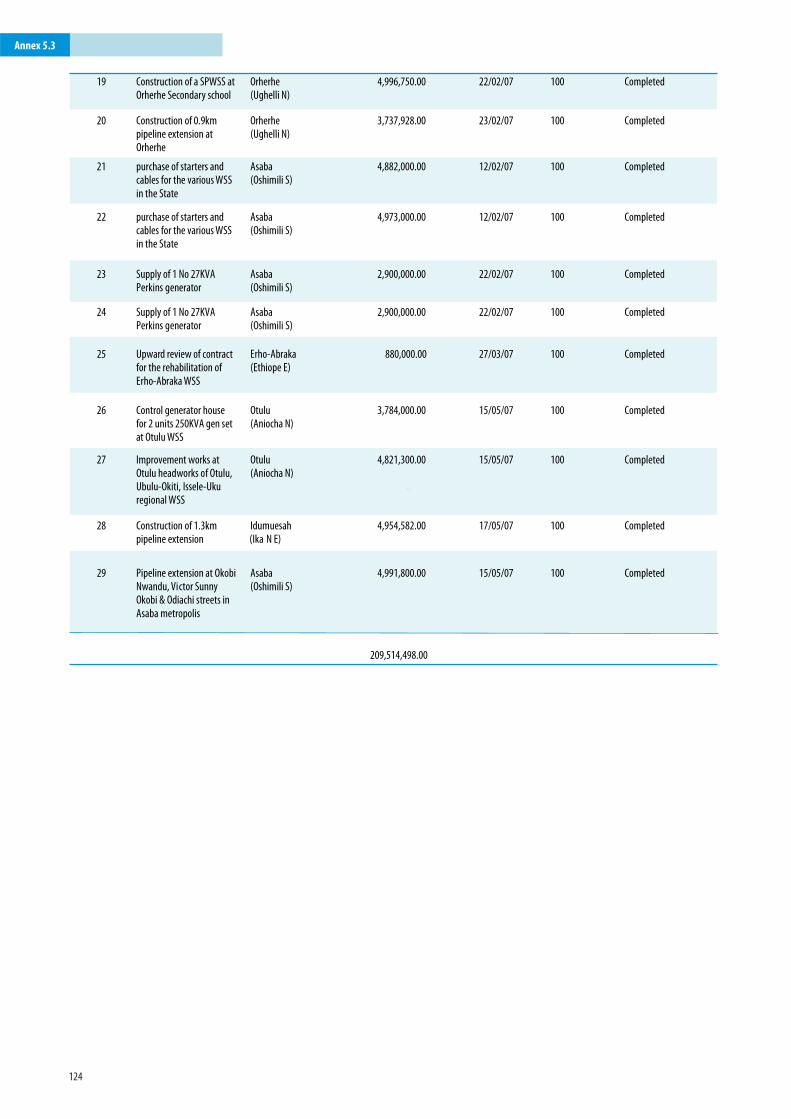
124
DRAFT
19 Construction of a SPWSS at Orherhe Secondary school
Orherhe (Ughelli N)
4,996,750.00 22/02/07 100 Completed
20 Construction of 0.9km pipeline extension at Orherhe
Orherhe (Ughelli N)
3,737,928.00 23/02/07 100 Completed
21 purchase of starters and cables for the various WSS in the State
Asaba (Oshimili S)
4,882,000.00 12/02/07 100 Completed
22 purchase of starters and cables for the various WSS in the State
Asaba (Oshimili S)
4,973,000.00 12/02/07 100 Completed
23 Supply of 1 No 27KVA Perkins generator
Asaba (Oshimili S)
2,900,000.00 22/02/07 100 Completed
24 Supply of 1 No 27KVA Perkins generator
Asaba (Oshimili S)
2,900,000.00 22/02/07 100 Completed
25 Upward review of contract for the rehabilitation of Erho-Abraka WSS
Erho-Abraka (Ethiope E)
880,000.00 27/03/07 100 Completed
26 Control generator house for 2 units 250KVA gen set at Otulu WSS
Otulu (Aniocha N)
3,784,000.00 15/05/07 100 Completed
27 Improvement works at Otulu headworks of Otulu, Ubulu-Okiti, Issele-Uku regional WSS
Otulu (Aniocha N)
4,821,300.00 15/05/07 100 Completed
28 Construction of 1.3km pipeline extension
Idumuesah (Ika N E)
4,954,582.00 17/05/07 100 Completed
29 Pipeline extension at Okobi Nwandu, Victor Sunny Okobi & Odiachi streets in Asaba metropolis
Asaba (Oshimili S)
4,991,800.00 15/05/07 100 Completed
209,514,498.00
Annex 5.3
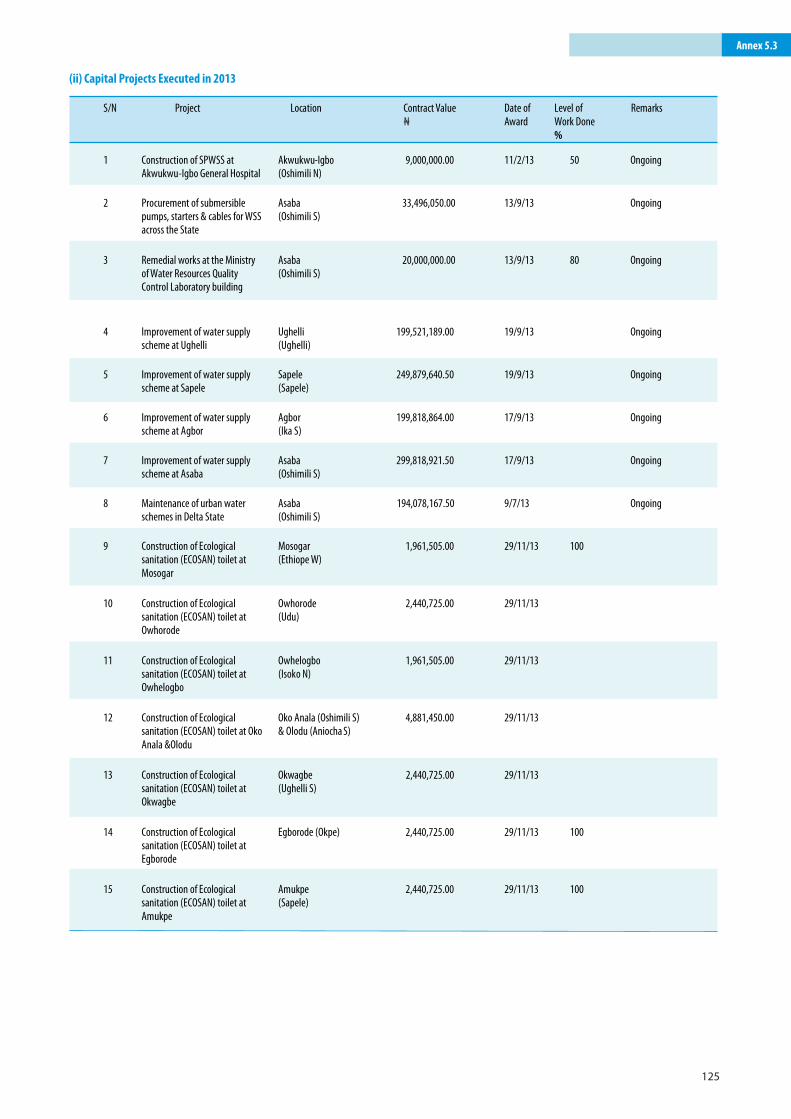
125
(ii) Capital Projects Executed in 2013
DRAFT
S/N Project Location Date of Award
Level of Work Done %
Remarks
1 Construction of SPWSS at Akwukwu-Igbo General Hospital
Akwukwu-Igbo (Oshimili N)
9,000,000.00 11/2/13 50 Ongoing
2 Procurement of submersible pumps, starters & cables for WSS across the State
Asaba (Oshimili S)
33,496,050.00 13/9/13 Ongoing
3 Remedial works at the Ministry of Water Resources Quality Control Laboratory building
Asaba (Oshimili S)
20,000,000.00 13/9/13 80 Ongoing
4 Improvement of water supply scheme at Ughelli
Ughelli (Ughelli)
199,521,189.00 19/9/13 Ongoing
5 Improvement of water supply scheme at Sapele
Sapele (Sapele)
249,879,640.50 19/9/13 Ongoing
6 Improvement of water supply scheme at Agbor
Agbor (Ika S)
199,818,864.00 17/9/13 Ongoing
7 Improvement of water supply scheme at Asaba
Asaba (Oshimili S)
299,818,921.50 17/9/13 Ongoing
8 Maintenance of urban water schemes in Delta State
Asaba (Oshimili S)
194,078,167.50 9/7/13 Ongoing
9 Construction of Ecological sanitation (ECOSAN) toilet at Mosogar
Mosogar (Ethiope W)
1,961,505.00 29/11/13 100
10 Construction of Ecological sanitation (ECOSAN) toilet at Owhorode
Owhorode (Udu)
2,440,725.00 29/11/13
11 Construction of Ecological sanitation (ECOSAN) toilet at Owhelogbo
Owhelogbo (Isoko N)
1,961,505.00 29/11/13
12 Construction of Ecological sanitation (ECOSAN) toilet at Oko Anala &Olodu
Oko Anala (Oshimili S) & Olodu (Aniocha S)
4,881,450.00 29/11/13
13 Construction of Ecological sanitation (ECOSAN) toilet at Okwagbe
Okwagbe (Ughelli S)
2,440,725.00 29/11/13
14 Construction of Ecological sanitation (ECOSAN) toilet at Egborode
Egborode (Okpe) 2,440,725.00 29/11/13 100
15 Construction of Ecological sanitation (ECOSAN) toilet at Amukpe
Amukpe (Sapele)
2,440,725.00 29/11/13 100
Contract Value N
Annex 5.3
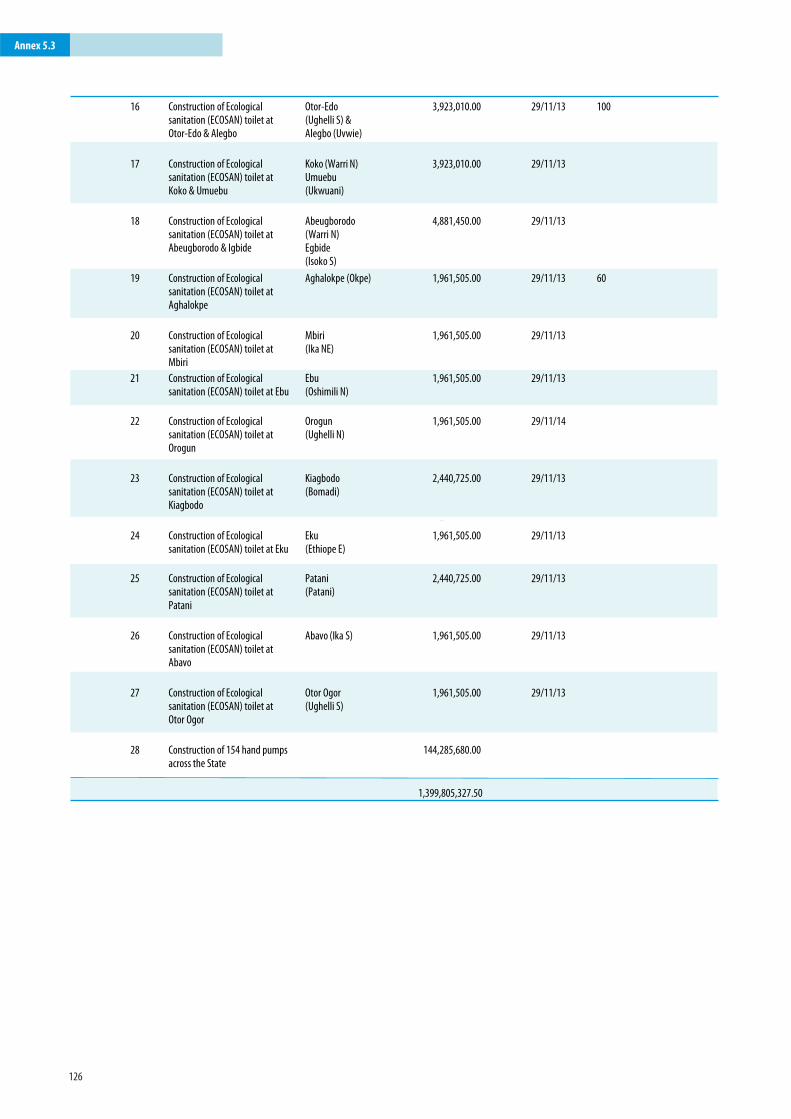
126
DRAFT
16 Construction of Ecological sanitation (ECOSAN) toilet at Otor-Edo & Alegbo
Otor-Edo (Ughelli S) & Alegbo (Uvwie)
3,923,010.00 29/11/13 100
17 Construction of Ecological sanitation (ECOSAN) toilet at Koko & Umuebu
Koko (Warri N) Umuebu
(Ukwuani)
3,923,010.00 29/11/13
18 Construction of Ecological sanitation (ECOSAN) toilet at Abeugborodo & Igbide
Abeugborodo (Warri N) Egbide (Isoko S)
4,881,450.00 29/11/13
19 Construction of Ecological sanitation (ECOSAN) toilet at Aghalokpe
Aghalokpe (Okpe) 1,961,505.00 29/11/13 60
20 Construction of Ecological sanitation (ECOSAN) toilet at Mbiri
Mbiri (Ika NE)
1,961,505.00 29/11/13
21 Construction of Ecological sanitation (ECOSAN) toilet at Ebu
Ebu (Oshimili N)
1,961,505.00 29/11/13
22 Construction of Ecological sanitation (ECOSAN) toilet at Orogun
Orogun (Ughelli N)
1,961,505.00 29/11/14
23 Construction of Ecological sanitation (ECOSAN) toilet at Kiagbodo
Kiagbodo (Bomadi)
2,440,725.00 29/11/13
24 Construction of Ecological sanitation (ECOSAN) toilet at Eku
Eku (Ethiope E)
1,961,505.00 29/11/13
25 Construction of Ecological sanitation (ECOSAN) toilet at Patani
Patani (Patani)
2,440,725.00 29/11/13
26 Construction of Ecological sanitation (ECOSAN) toilet at Abavo
Abavo (Ika S)
1,961,505.00 29/11/13
27 Construction of Ecological sanitation (ECOSAN) toilet at Otor Ogor
Otor Ogor (Ughelli S)
1,961,505.00 29/11/13
28 Construction of 154 hand pumps across the State
144,285,680.00
1,399,805,327.50
Annex 5.3
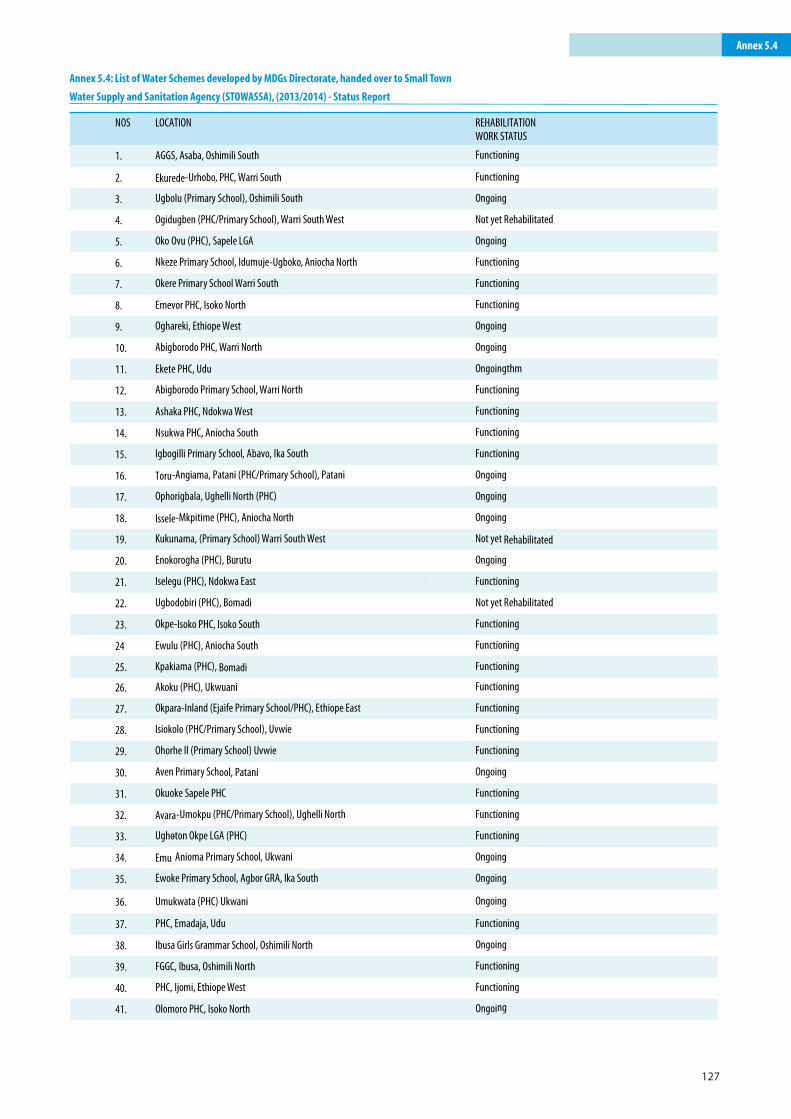
127
DRAFT
NOS LOCATION REHABILITATION WORK STATUS
1. AGGS, Asaba, Oshimili South Functioning
2. Ekurede-Urhobo, PHC, Warri South Functioning
3. Ugbolu (Primary School), Oshimili South Ongoing
4. Ogidugben (PHC/Primary School), Warri South West Not yet Rehabilitated
5. Oko Ovu (PHC), Sapele LGA Ongoing
6. Nkeze Primary School, Idumuje-Ugboko, Aniocha North Functioning
7. Okere Primary School Warri South Functioning
8. Emevor PHC, Isoko North Functioning
9. Oghareki, Ethiope West Ongoing
10. Abigborodo PHC, Warri North Ongoing
11. Ekete PHC, Udu Ongoingthm
12. Abigborodo Primary School, Warri North Functioning
13. Ashaka PHC, Ndokwa West Functioning
14. Nsukwa PHC, Aniocha South Functioning
15. Igbogilli Primary School, Abavo, Ika South Functioning
16. Toru-Angiama, Patani (PHC/Primary School), Patani Ongoing
17. Ophorigbala, Ughelli North (PHC) Ongoing
18. Issele-Mkpitime (PHC), Aniocha North Ongoing
19. Kukunama, (Primary School) Warri South West Not yet Rehabilitated
20. Enokorogha (PHC), Burutu Ongoing
21. Iselegu (PHC), Ndokwa East Functioning
22. Ugbodobiri (PHC), Bomadi Not yet Rehabilitated
23. Okpe-Isoko PHC, Isoko South Functioning
24 Ewulu (PHC), Aniocha South Functioning
25. Kpakiama (PHC), Bomadi Functioning
26. Akoku (PHC), Ukwuani Functioning
27. Okpara-Inland (Ejaife Primary School/PHC), Ethiope East Functioning
28. Isiokolo (PHC/Primary School), Uvwie Functioning
29. Ohorhe ll (Primary School) Uvwie Functioning
30. Aven Primary School, Patani Ongoing
31. Okuoke Sapele PHC Functioning
32. Avara-Umokpu (PHC/Primary School), Ughelli North Functioning
33. Ughoton Okpe LGA (PHC) Functioning
34. Emu
-
Anioma Primary School, Ukwani Ongoing
35. Ewoke Primary School, Agbor GRA, Ika South Ongoing
36. Umukwata (PHC) Ukwani Ongoing
Annex 5.4: List of Water Schemes developed by MDGs Directorate, handed over to Small Town
Water Supply and Sanitation Agency (STOWASSA), (2013/2014) - Status Report
37. PHC, Emadaja, Udu Functioning
38. Ibusa Girls Grammar School, Oshimili North Ongoing
39. FGGC, Ibusa, Oshimili North Functioning
40. PHC, Ijomi, Ethiope West Functioning
41. Olomoro PHC, Isoko North Ongoing
Annex 5.4
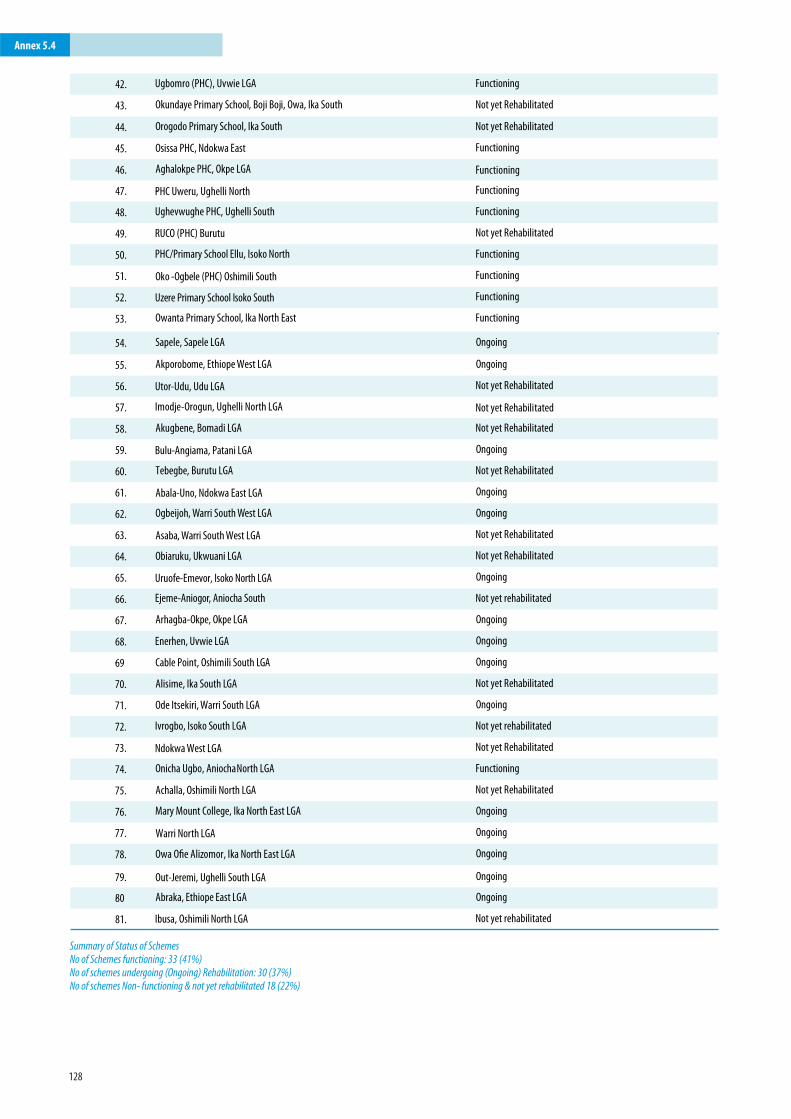
128
44. Orogodo Primary School, Ika South Not yet Rehabilitated
45. Osissa PHC, Ndokwa East Functioning
46. Aghalokpe PHC, Okpe LGA Functioning
47. PHC Uweru, Ughelli North- Functioning
48. Ughevwughe PHC, Ughelli South Functioning
49. RUCO (PHC) Burutu Not yet Rehabilitated
50. PHC/Primary School Ellu, Isoko North Functioning
51. Oko -Ogbele (PHC) Oshimili South Functioning
52. Uzere Primary School Isoko South Functioning
53. Owanta Primary School, Ika North East Functioning
54. Sapele, Sapele LGA Ongoing
55. Akporobome, Ethiope West LGA Ongoing
56. Utor-Udu, Udu LGA Not yet Rehabilitated
57. Imodje-Orogun, Ughelli North LGA Not yet Rehabilitated
58. Akugbene, Bomadi LGA Not yet Rehabilitated
59. Bulu-Angiama, Patani LGA Ongoing
60. Tebegbe, Burutu LGA Not yet Rehabilitated
61. Abala-Uno, Ndokwa East LGA Ongoing
62. Ogbeijoh, Warri South West LGA Ongoing
63. Asaba, Warri South West LGA Not yet Rehabilitated
64. Obiaruku, Ukwuani LGA Not yet Rehabilitated
65. Uruofe-Emevor, Isoko North LGA Ongoing
66. Ejeme-Aniogor, Aniocha South Not yet rehabilitated
67. Arhagba-Okpe, Okpe LGA Ongoing
68. Enerhen, Uvwie LGA Ongoing
69. Cable Point, Oshimili South LGA Ongoing
70. Alisime, Ika South LGA Not yet Rehabilitated
71. Ode Itsekiri, Warri South LGA Ongoing
72. Ivrogbo, Isoko South LGA Not yet rehabilitated
73. Ndokwa West LGA Not yet Rehabilitated
74. Onicha Ugbo, Aniocha North LGA Functioning
75. Achalla, Oshimili North LGA Not yet Rehabilitated
76. Mary Mount College, Ika North East LGA Ongoing
77. Warri North LGA Ongoing
78. Owa Ofie Alizomor, Ika North East LGA Ongoing
79. Out-Jeremi, Ughelli South LGA Ongoing
80. Abraka, Ethiope East LGA Ongoing
81. Ibusa, Oshimili North LGA Not yet rehabilitated
Summary of Status of SchemesNo of Schemes functioning: 33 (41%)No of schemes undergoing (Ongoing) Rehabilitation: 30 (37%)No of schemes Non- functioning & not yet rehabilitated 18 (22%)
42. Ugbomro (PHC), Uvwie LGA Functioning
43. Okundaye Primary School, Boji Boji, Owa, Ika South Not yet Rehabilitated
Annex 5.4
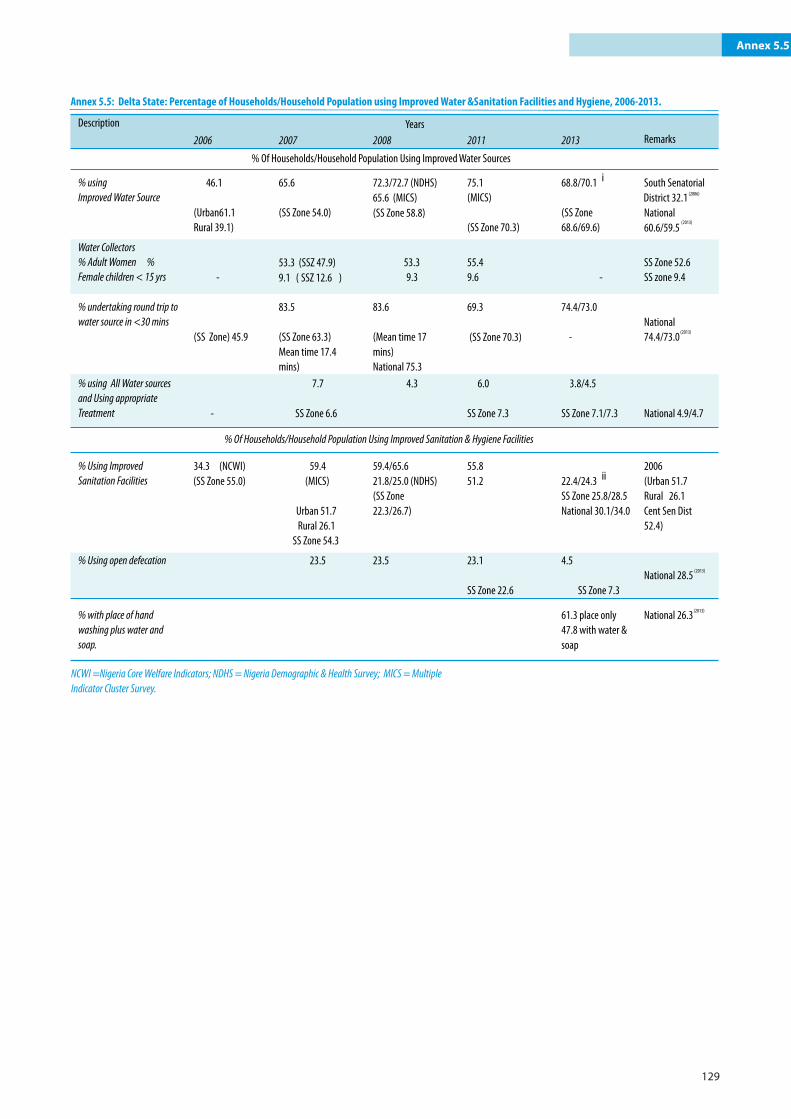
129
Annex 5.5
(2006)
Annex 5.5: Delta State: Percentage of Households/Household Population using Improved Water &Sanitation Facilities and Hygiene, 2006-2013.
Description
Years Remarks 2006 2007 2008 2011 2013
% Of Households/Household Population Using Improved Water Sources
% using Improved Water Source
46.1
(Urban61.1 Rural 39.1)
65.6 (SS Zone 54.0)
72.3/72.7 (NDHS) 65.6 (MICS) (SS Zone 58.8)
75.1 (MICS) (SS Zone 70.3)
68.8/70.1 i (SS Zone 68.6/69.6)
South Senatorial District 32.1
National 60.6/59.5
(2006)
(2013)
(2013)
(2013)
(2013)
Water Collectors % Adult Women % Female children < 15 yrs
-
53.3 (SSZ 47.9) 9.1 ( SSZ 12.6 )
53.3 9.3
55.4 9.6
-
SS Zone 52.6 SS zone 9.4
% undertaking round trip to water source in <30 mins
(SS Zone) 45.9
83.5 (SS Zone 63.3) Mean time 17.4 mins)
83.6 (Mean time 17 mins) National 75.3
69.3 (SS Zone 70.3)
74.4/73.0 -
National 74.4/73.0
% using All Water sources and Using appropriate Treatment
-
7.7
SS Zone 6.6
4.3
6.0 SS Zone 7.3
3.8/4.5 SS Zone 7.1/7.3
National 4.9/4.7
% Of Households/Household Population Using Improved Sanitation & Hygiene Facilities
% Using Improved Sanitation Facilities
34.3 (NCWI) (SS Zone 55.0)
59.4 (MICS)
Urban 51.7 Rural 26.1
SS Zone 54.3
59.4/65.6 21.8/25.0 (NDHS) (SS Zone 22.3/26.7)
55.8 51.2
22.4/24.3 ii SS Zone 25.8/28.5 National 30.1/34.0
2006 (Urban 51.7 Rural 26.1 Cent Sen Dist 52.4)
% Using open defecation
23.5 23.5 23.1 SS Zone 22.6
4.5
SS Zone 7.3
National 28.5
% with place of hand washing plus water and soap.
61.3 place only 47.8 with water & soap
National 26.3
NCWI =Nigeria Core Welfare Indicators; NDHS = Nigeria Demographic & Health Survey; MICS = Multiple Indicator Cluster Survey.
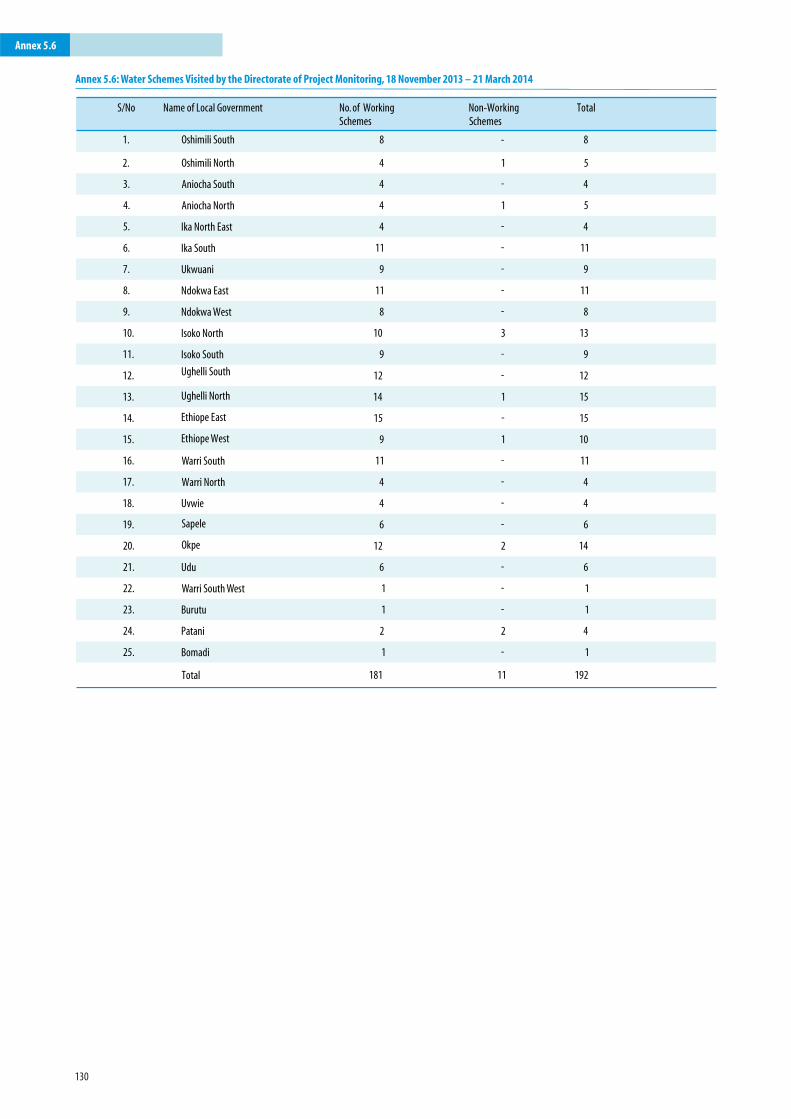
130
Annex 5.6: Water Schemes Visited by the Directorate of Project Monitoring, 18 November 2013 – 21 March 2014
S/No Name of Local Government No. of Working Schemes
Total
1. - 8
2. Oshimili North 1 5
3. - 4
4. 1 5
5. - 4
6. - 11
7. - 9
8. - 11
9. - 8
10. 3 13
11. - 9
12. - 12
13. 1 15
14. - 15
15. 1 10
16. - 11
17. - 4
18. - 4
19. - 6
20. 2 14
21. - 6
22. - 1
23. - 1
24. 2 4
25. - 1
Oshimili South
Aniocha South
Aniocha North
Ika North East
Ika South
Ukwuani
Ndokwa East
Ndokwa West
Isoko North
Isoko South
Ughelli South
Ughelli North
Ethiope East
Ethiope West
Warri South
Warri North
Uvwie
Sapele
Okpe
Udu
Warri South West
Burutu
Patani
Bomadi
Total
8
4
4
4
4
11
9
11
8
10
9
12
14
15
9
11
4
4
6
12
6
1
1
2
1
181 11 192
Annex 5.6
Non-Working Schemes
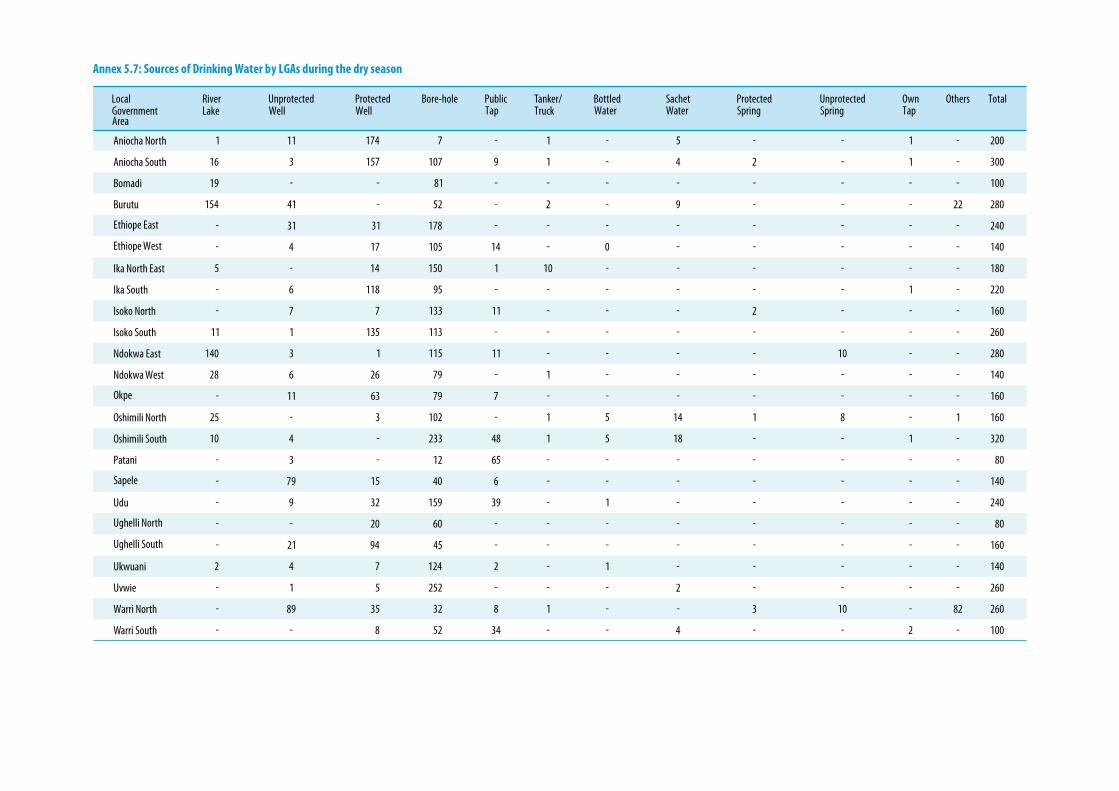
#
Annex 5.7: Sources of Drinking Water by LGAs during the dry season
Local
Area
Bore-hole Tanker/Truck
Others Total
DRAFT
Aniocha North 174 - 1 - 5 - - 1 - 200
Aniocha South 157 9 1 - 4 2 - 1 - 300
Bomadi - - - - - - - - - 100
Burutu - - 2 - 9 - - - 22 280
Ethiope East 31 - - - - - - - - 240
Ika North East 14 1 10 - - - - - - 180
Ika South 118 - - - - - - 1 - 220
Isoko North 7 11 - - - 2 - - - 160
Isoko South 135 - - - - - - - - 260
Ndokwa East 1 11 - - - - 10 - - 280
Ndokwa West 26 - 1 - - - - - - 140
Okpe 63 7 - - - - - - - 160
Oshimili North 3 - 1 5 14 1 8 - 1 160
Oshimili South - 48 1 5 18 - - 1 - 320
Patani - 65 - - - - - - - 80
Sapele 15 6 - - - - - - - 140
Udu 32 39 - 1 - - - - - 240
Ughelli North 20 - - - - - - - - 80
Ughelli South 94 - - - - - - - - 160
Ukwuani 7 2 - 1 - - - - - 140
Uvwie 5 - - - 2 - - - - 260
Warri North 35 8 1 - - 3 10 - 82 260
Warri South 8 34 - - 4 - - 2 - 100
Ethiope West
1
16
19
154
-
5
-
-
11
140
28
-
25
10
-
-
-
-
-
2
-
-
-
-
11
3
-
41
31
-
6
7
1
3
6
11
-
4
3
79
9
-
21
4
1
89
-
4 17
7
107
81
52
178
150
95
133
113
115
79
79
102
233
12
40
159
60
45
124
252
32
52
105 14 - 0 - - - - - 140
GovernmentRiver Lake
Unprotected Well
Public Tap
Bottled Water
Sachet Water
Protected Spring
Unprotected Spring
Own Tap
Protected Well
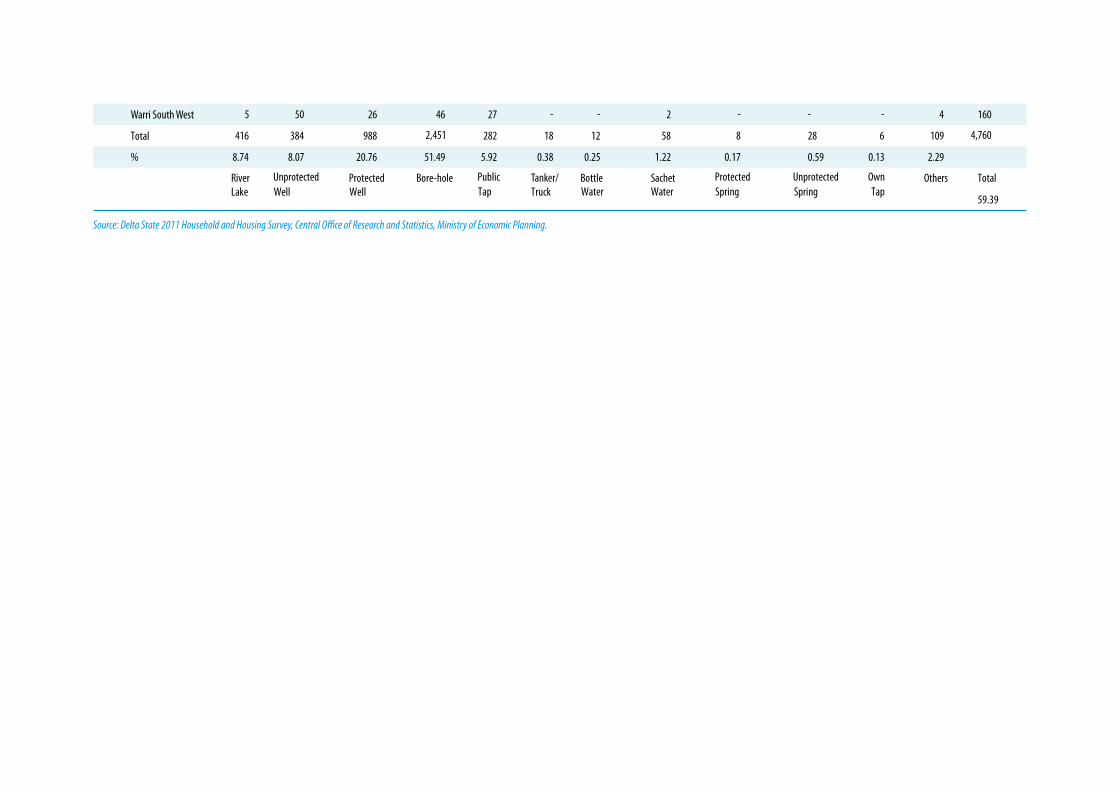
130
Warri South West -
Total 28
160
4,760
%
5
416
8.74
50
384
8.07
26
988
20.76
46
2,451
51.49
27
282
5.92
-
18
0.38
-
12
0.25
2
58
1.22
-
8
0.17 0.59
-
6
0.13
4
109
2.29
River Bore-hole Tanker/
Truck
Own Others Total
59.39
Source: Delta State 2011 Household and Housing Survey, Central Office of Research and Statistics, Ministry of Economic Planning.
LakeUnprotected Well
Protected Well
Public Tap
Bottle Water
Sachet Water
Protected Spring
Unprotected Spring Tap
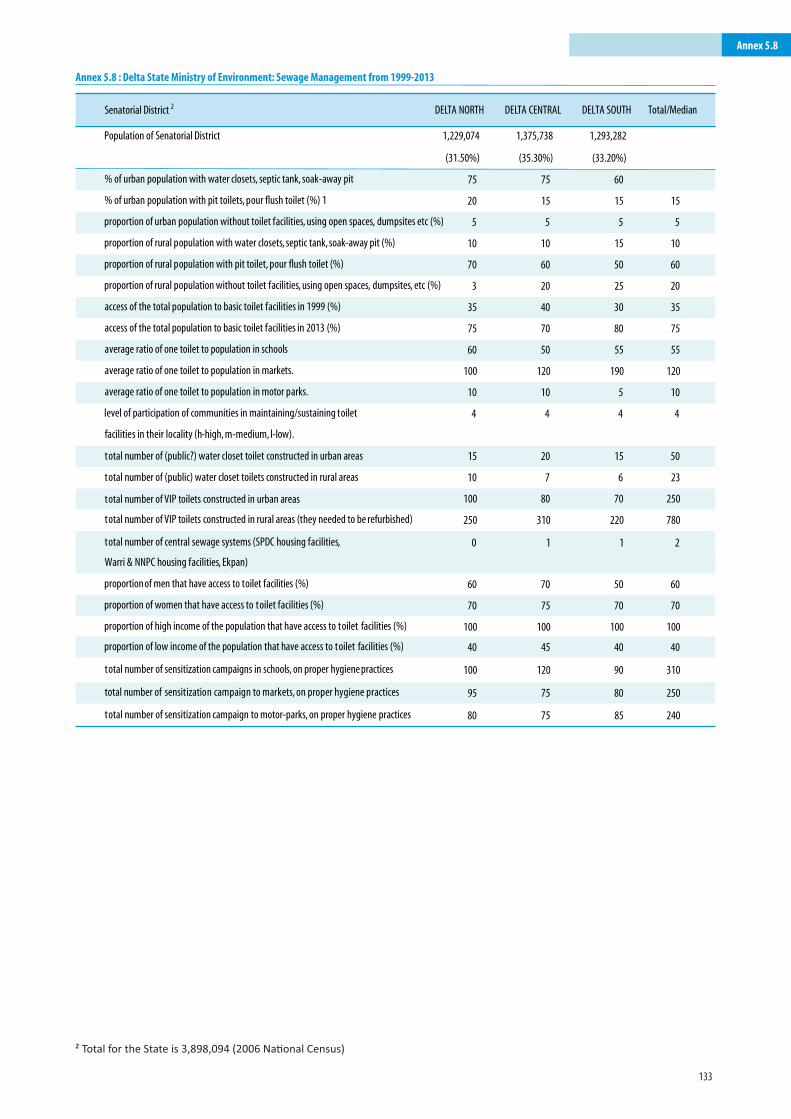
133
Senatorial District 2 DELTA CENTRAL DELTA SOUTH Total/Median
Population of Senatorial District
% of urban population with water closets, septic tank, soak -away pit
% of urban population with pit toilets, pour flush toilet (%) 1
proportion of urban population without toilet facilities, using open spaces, dumpsites etc (%)
DELTA NORTH
1,229,074
(31.50%)
75
20
5
1,375,738
(35.30%)
75
15
5
1,293,282
(33.20%)
60
15
5
10
70
3
35
75
60
100
10
4
15
10
100
250
10
60
20
40
70
50
120
10
4
20
7
80
310
15
50
25
30
80
55
190
5
4
15
6
70
220
proportion of rural population with water closets, septic tank, soak -away pit (%)
proportion of rural population without toilet facilities, using open spaces, d umpsites, etc (%)
proportion of rural population with pit toilet, pour flush toilet (%)
access of the total population to basic toilet facilities in 1999 (%)
access of the total population to basic toilet facilities in 2013 (%)
average ratio of one toilet to population in schools
average ratio of one toilet to population in markets.
average ratio of one toilet to population in motor parks.
level of participation of communities in maintaining/sustaining toilet
facilities in their locality (h-high, m-medium, l-low).
total number of (public?) water closet toilet constructed in urban areas
total number of (public) water closet toilets constructed in rural areas
total number of VIP toilets constructed in urban areas
total number of VIP toilets constructed in rural areas (they needed to be refurbished)
0 1 1 total number of central sewage systems (SPDC housing facilities,
60
70
100
70
75
100
50
70
100
proportion of men that have access to toilet facilities (%)
proportion of women that have access to toilet facilities (%)
proportion of high income of the population that have access to toilet facilities (%)
40 45 40 proportion of low income of the population that have access to toilet f acilities (%)
100 120 90 total number of sensitization campaigns in schools, on proper hygiene p ractices
95 75 80 total number of sensitization campaign to markets, on proper hygiene p ractices
15
5
10
60
20
35
75
55
120
10
4
50
23
250
780
2
60
70
100
40
310
250
Annex 5.8 : Delta State Ministry of Environment: Sewage Management from 1999-2013
Annex 5.8
80 75 85 total number of sensitization campaign to motor -parks, on proper hygiene practices 240
Warri & N NPC housing facilities, Ekpan)
² Total for the State is 3,898,094 (2006 Na�onal Census)
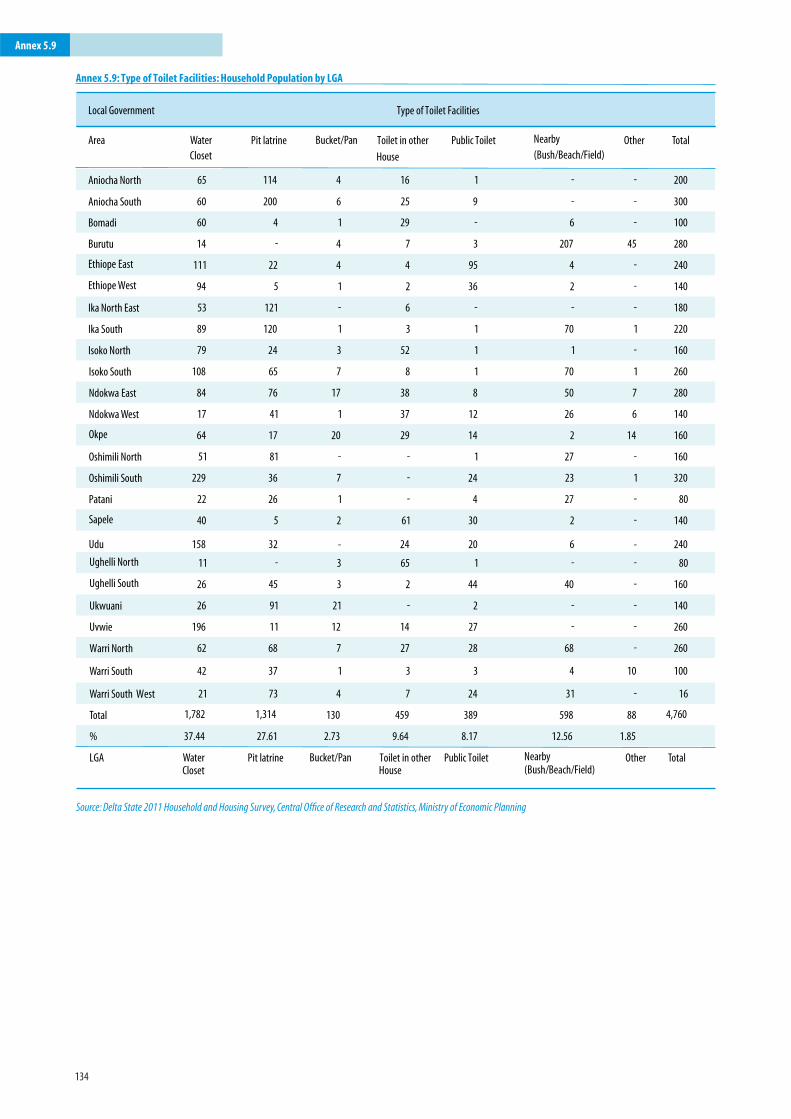
134
Annex 5.9: Type of Toilet Facilities: Household Population by LGA
Local Government Type of Toilet Facilities
Area Water Closet
Pit latrine Bucket/Pan Toilet in other
House
Public Toilet Nearby
(Bush/Beach/Field)
Other Total
Aniocha North
Aniocha South
Bomadi
Burutu
Ethiope East
Ethiope West
Ika North East
Ika South
Isoko North
Isoko South
Ndokwa East
Ndokwa West
Okpe
Oshimili North
Oshimili South
Patani
Sapele
Udu
Ughelli North
Ughelli South
Ukwuani
Uvwie
Warri North
Warri South
Warri South West
Total
%
LGA
65
60
60
14
111
94
53
89
79
108
84
17
64
51
229
22
40
158
11
26
26
196
62
42
21
1,782
37.44
Water Closet
114
200
4
-
22
5
121
120
24
65
76
41
17
81
36
26
5
32
-
45
91
11
68
37
73
1,314
27.61
Pit latrine
4
6
1
4
4
1
-
1
3
7
17
1
20
-
7
1
2
-
3
3
21
12
7
1
4
130
2.73
Bucket/Pan
16
25
29
7
4
2
6
3
52
8
38
37
29
-
-
-
61
24
65
2
-
14
27
3
7
459
9.64
Toilet in otherHouse
1
9
-
3
95
36
-
1
1
1
8
12
14
1
24
4
30
20
1
44
2
27
28
3
24
389
8.17
Public Toilet
-
-
6
207
4
2
-
70
1
70
50
26
2
27
23
27
2
6
-
40
-
-
68
4
31
598
12.56
Nearby
(Bush/Beach/Field)
200
300
100
280
240
140
180
220
160
260
280
140
160
160
320
80
140
240
80
160
140
260
260
100
16
4,760
Total
-
-
-
45
-
-
-
1
-
1
7
6
14
-
1
-
-
-
-
-
-
-
-
10
-
88
1.85
Other
Source: Delta State 2011 Household and Housing Survey, Central Office of Research and Statistics, Ministry of Economic Planning
Annex 5.9
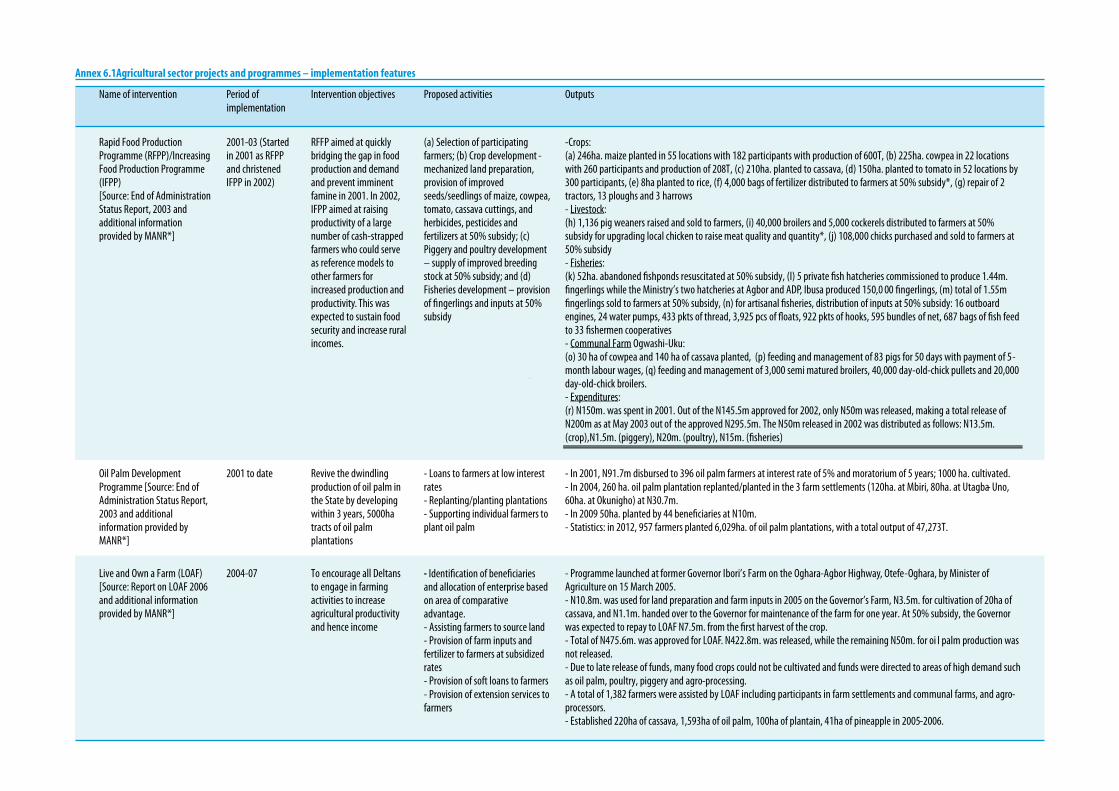
133
Annex 6.1 Agricultural sector projects and programmes – implementation features
Name of intervention Period of implementation
Intervention objectives Proposed activities Outputs
Oil Palm Development Programme [Source: End of Administration Status Report, 2003 and additional information provided by MANR*]
2001 to date Revive the dwindling production of oil palm in the State by developing within 3 years, 5000ha tracts of oil palm plantations
- Loans to farmers at low interest rates - Replanting/planting plantations - Supporting individual farmers to plant oil palm
- In 2001, N91.7m disbursed to 396 oil palm farmers at interest rate of 5% and moratorium of 5 years; 1000 ha. cultivated. - In 2004, 260 ha. oil palm plantation replanted/planted in the 3 farm settlements (120ha. at Mbiri, 80ha. at Utagba- Uno, 60ha. at Okunigho) at N30.7m. - In 2009 50ha. planted by 44 beneficiaries at N10m. - Statistics: in 2012, 957 farmers planted 6,029ha. of oil palm plantations, with a total output of 47,273T.
Live and Own a Farm (LOAF) [Source: Report on LOAF 2006 and additional information provided by MANR*]
2004-07 To encourage all Deltans to engage in farming activities to increase agricultural productivity and hence income
- Identification of beneficiaries and allocation of enterprise based on area of comparative advantage. - Assisting farmers to source land - Provision of farm inputs and fertilizer to farmers at subsidized rates - Provision of soft loans to farmers - Provision of extension services to farmers
- Programme launched at former Governor Ibori’s Farm on the Oghara-Agbor Highway, Otefe-Oghara, by Minister of Agriculture on 15 March 2005. - N10.8m. was used for land preparation and farm inputs in 2005 on the Governor’s Farm, N3.5m. for cultivation of 20ha of cassava, and N1.1m. handed over to the Governor for maintenance of the farm for one year. At 50% subsidy, the Governor was expected to repay to LOAF N7.5m. from the first harvest of the crop. - Total of N475.6m. was approved for LOAF. N422.8m. was released, while the remaining N50m. for oi l palm production was not released. - Due to late release of funds, many food crops could not be cultivated and funds were directed to areas of high demand such as oil palm, poultry, piggery and agro-processing. - A total of 1,382 farmers were assisted by LOAF including participants in farm settlements and communal farms, and agro-processors. - Established 220ha of cassava, 1,593ha of oil palm, 100ha of plantain, 41ha of pineapple in 2005-2006.
DRAFT
Rapid Food Production Programme (RFPP)/Increasing Food Production Programme (IFPP) [Source: End of Administration Status Report, 2003 and additional information provided by MANR*]
2001-03 (Started in 2001 as RFPP and christened IFPP in 2002)
RFFP aimed at quickly bridging the gap in food production and demand and prevent imminent famine in 2001. In 2002, IFPP aimed at raising productivity of a large number of cash-strapped farmers who could serve as reference models to other farmers for increased production and productivity. This was expected to sustain food security and increase rural incomes.
(a) Selection of participating farmers; (b) Crop development - mechanized land preparation, provision of improved seeds/seedlings of maize, cowpea, tomato, cassava cuttings, and herbicides, pesticides and fertilizers at 50% subsidy; (c) Piggery and poultry development – supply of improved breeding stock at 50% subsidy; and (d) Fisheries development – provision of fingerlings and inputs at 50% subsidy
-Crops: (a) 246ha. maize planted in 55 locations with 182 participants with production of 600T, (b) 225ha. cowpea in 22 locations with 260 participants and production of 208T, (c) 210ha. planted to cassava, (d) 150ha. planted to tomato in 52 locations by 300 participants, (e) 8ha planted to rice, (f) 4,000 bags of fertilizer distributed to farmers at 50% subsidy*, (g) repair of 2 tractors, 13 ploughs and 3 harrows - Livestock: (h) 1,136 pig weaners raised and sold to farmers, (i) 40,000 broilers and 5,000 cockerels distributed to farmers at 50% subsidy for upgrading local chicken to raise meat quality and quantity*, (j) 108,000 chicks purchased and sold to farmers at 50% subsidy - Fisheries: (k) 52ha. abandoned fishponds resuscitated at 50% subsidy, (l) 5 private fish hatcheries commissioned to produce 1.44m. fingerlings while the Ministry’s two hatcheries at Agbor and ADP, Ibusa produced 150,0 00 fingerlings, (m) total of 1.55m fingerlings sold to farmers at 50% subsidy, (n) for artisanal fisheries, distribution of inputs at 50% subsidy: 16 outboard engines, 24 water pumps, 433 pkts of thread, 3,925 pcs of floats, 922 pkts of hooks, 595 bundles of net, 687 bags of fish feed to 33 fishermen cooperatives - Communal Farm Ogwashi-Uku: (o) 30 ha of cowpea and 140 ha of cassava planted, (p) feeding and management of 83 pigs for 50 days with payment of 5-month labour wages, (q) feeding and management of 3,000 semi matured broilers, 40,000 day-old-chick pullets and 20,000 day-old-chick broilers. - Expenditures: (r) N150m. was spent in 2001. Out of the N145.5m approved for 2002, only N50m was released, making a total release of N200m as at May 2003 out of the approved N295.5m. The N50m released in 2002 was distributed as follows: N13.5m. (crop),N1.5m. (piggery), N20m. (poultry), N15m. (fisheries)
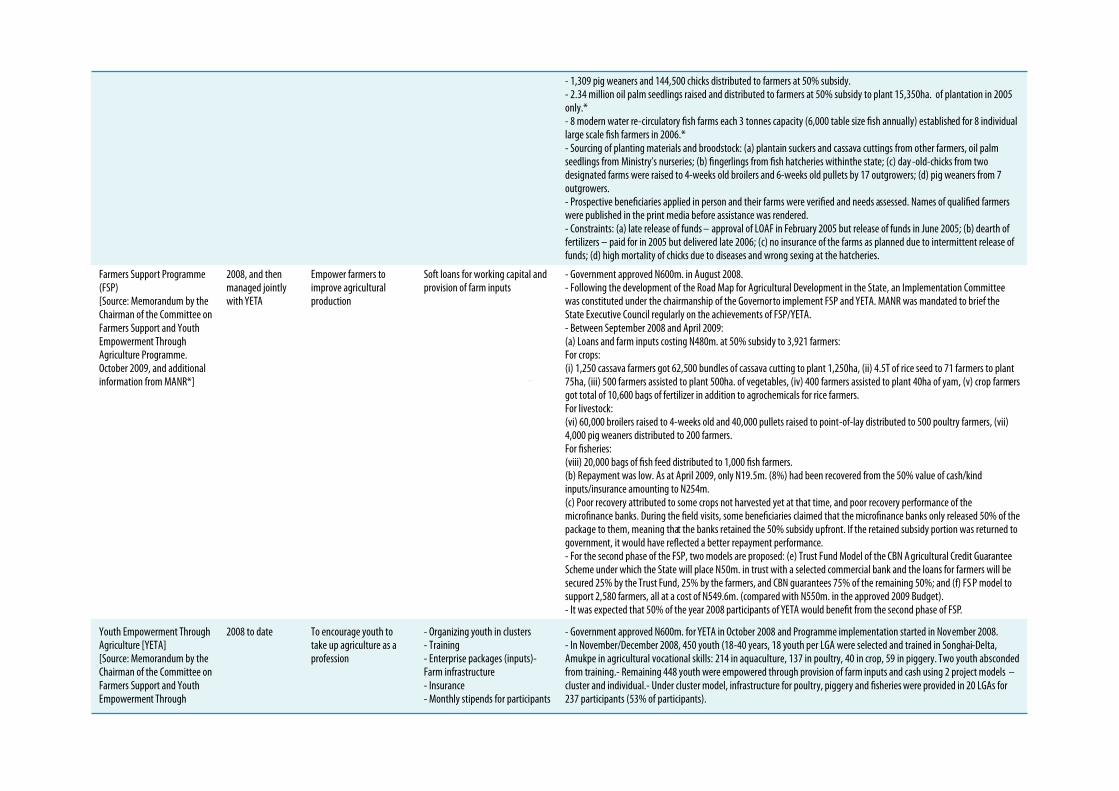
134
DRAFT
- 1,309 pig weaners and 144,500 chicks distributed to farmers at 50% subsidy. - 2.34 million oil palm seedlings raised and distributed to farmers at 50% subsidy to plant 15,350ha. of plantation in 2005 only.* - 8 modern water re-circulatory fish farms each 3 tonnes capacity (6,000 table size fish annually) established for 8 individual large scale fish farmers in 2006.* - Sourcing of planting materials and broodstock: (a) plantain suckers and cassava cuttings from other farmers, oil palm seedlings from Ministry’s nurseries; (b) fingerlings from fish hatcheries within the state; (c) day -old-chicks from two designated farms were raised to 4-weeks old broilers and 6-weeks old pullets by 17 outgrowers; (d) pig weaners from 7 outgrowers. - Prospective beneficiaries applied in person and their farms were verified and needs assessed. Names of qualified farmers were published in the print media before assistance was rendered. - Constraints: (a) late release of funds – approval of LOAF in February 2005 but release of funds in June 2005; (b) dearth of fertilizers – paid for in 2005 but delivered late 2006; (c) no insurance of the farms as planned due to intermittent release of funds; (d) high mortality of chicks due to diseases and wrong sexing at the hatcheries.
Farmers Support Programme (FSP) [Source: Memorandum by the Chairman of the Committee on Farmers Support and Youth Empowerment Through Agriculture Programme. October 2009, and additional information from MANR*]
2008, and then managed jointly with YETA
Empower farmers to improve agricultural production
Soft loans for working capital and provision of farm inputs
- Government approved N600m. in August 2008. - Following the development of the Road Map for Agricultural Development in the State, an Implementation Committee was constituted under the chairmanship of the Governor to implement FSP and YETA. MANR was mandated to brief the State Executive Council regularly on the achievements of FSP/YETA. - Between September 2008 and April 2009: (a) Loans and farm inputs costing N480m. at 50% subsidy to 3,921 farmers: For crops: (i) 1,250 cassava farmers got 62,500 bundles of cassava cutting to plant 1,250ha, (ii) 4.5T of rice seed to 71 farmers to plant 75ha, (iii) 500 farmers assisted to plant 500ha. of vegetables, (iv) 400 farmers assisted to plant 40ha of yam, (v) crop farmers got total of 10,600 bags of fertilizer in addition to agrochemicals for rice farmers. For livestock: (vi) 60,000 broilers raised to 4-weeks old and 40,000 pullets raised to point-of-lay distributed to 500 poultry farmers, (vii) 4,000 pig weaners distributed to 200 farmers. For fisheries: (viii) 20,000 bags of fish feed distributed to 1,000 fish farmers. (b) Repayment was low. As at April 2009, only N19.5m. (8%) had been recovered from the 50% value of cash/kind inputs/insurance amounting to N254m. (c) Poor recovery attributed to some crops not harvested yet at that time, and poor recovery performance of the microfinance banks. During the field visits, some beneficiaries claimed that the microfinance banks only released 50% of the package to them, meaning that the banks retained the 50% subsidy upfront. If the retained subsidy portion was returned to government, it would have reflected a better repayment performance. - For the second phase of the FSP, two models are proposed: (e) Trust Fund Model of the CBN A gricultural Credit Guarantee Scheme under which the State will place N50m. in trust with a selected commercial bank and the loans for farmers will be secured 25% by the Trust Fund, 25% by the farmers, and CBN guarantees 75% of the remaining 50%; and (f) FS P model to support 2,580 farmers, all at a cost of N549.6m. (compared with N550m. in the approved 2009 Budget). - It was expected that 50% of the year 2008 participants of YETA would benefit from the second phase of FSP.
Youth Empowerment Through Agriculture [YETA] [Source: Memorandum by the Chairman of the Committee on Farmers Support and Youth Empowerment Through
2008 to date To encourage youth to take up agriculture as a profession
- Organizing youth in clusters - Training - Enterprise packages (inputs)- Farm infrastructure - Insurance - Monthly stipends for participants
- Government approved N600m. for YETA in October 2008 and Programme implementation started in November 2008. - In November/December 2008, 450 youth (18-40 years, 18 youth per LGA were selected and trained in Songhai-Delta, Amukpe in agricultural vocational skills: 214 in aquaculture, 137 in poultry, 40 in crop, 59 in piggery. Two youth absconded from training.- Remaining 448 youth were empowered through provision of farm inputs and cash using 2 project models – cluster and individual.- Under cluster model, infrastructure for poultry, piggery and fisheries were provided in 20 LGAs for 237 participants (53% of participants).
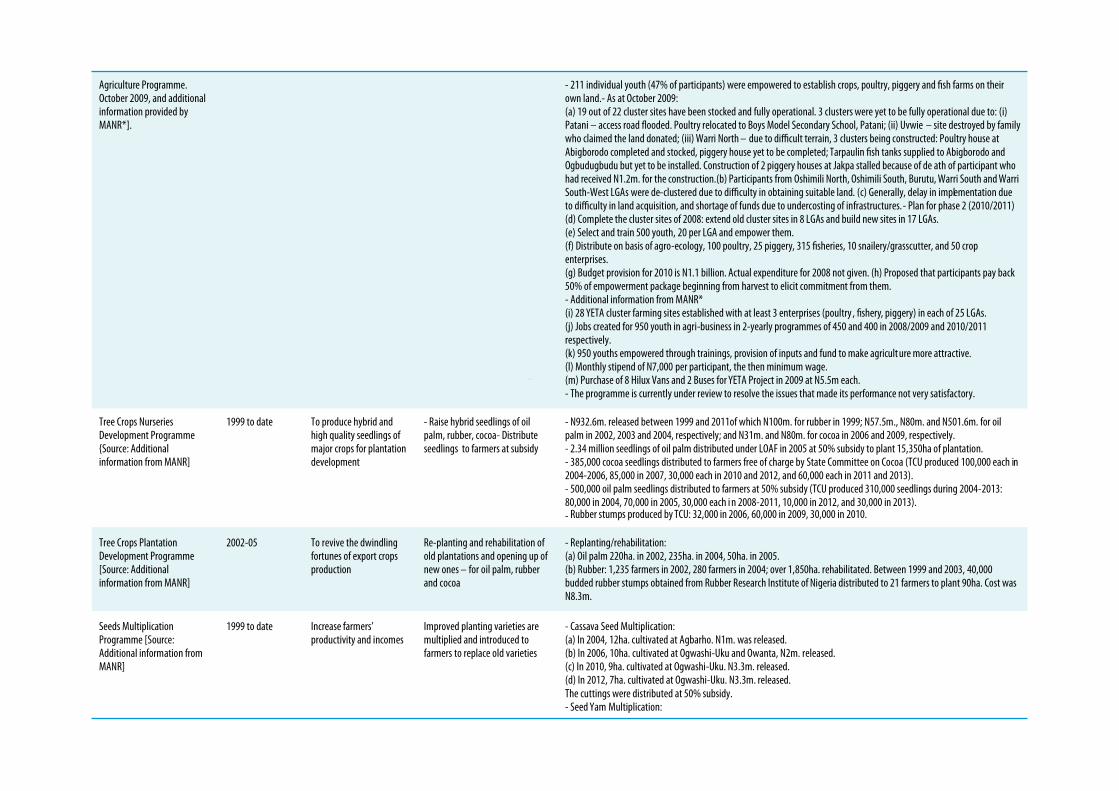
133
DRAFT
Agriculture Programme. October 2009, and additional information provided by MANR*].
- 211 individual youth (47% of participants) were empowered to establish crops, poultry, piggery and fish farms on their own land.- As at October 2009: (a) 19 out of 22 cluster sites have been stocked and fully operational. 3 clusters were yet to be fully operational due to: (i) Patani – access road flooded. Poultry relocated to Boys Model Secondary School, Patani; (ii) Uvwie – site destroyed by family who claimed the land donated; (iii) Warri North – due to difficult terrain, 3 clusters being constructed: Poultry house at Abigborodo completed and stocked, piggery house yet to be completed; Tarpaulin fish tanks supplied to Abigborodo and Ogbudugbudu but yet to be installed. Construction of 2 piggery houses at Jakpa stalled because of de ath of participant who had received N1.2m. for the construction.(b) Participants from Oshimili North, Oshimili South, Burutu, Warri South and Warri South-West LGAs were de-clustered due to difficulty in obtaining suitable land. (c) Generally, delay in implementation due to difficulty in land acquisition, and shortage of funds due to undercosting of infrastructures.- Plan for phase 2 (2010/2011) (d) Complete the cluster sites of 2008: extend old cluster sites in 8 LGAs and build new sites in 17 LGAs. (e) Select and train 500 youth, 20 per LGA and empower them. (f) Distribute on basis of agro-ecology, 100 poultry, 25 piggery, 315 fisheries, 10 snailery/grasscutter, and 50 crop enterprises. (g) Budget provision for 2010 is N1.1 billion. Actual expenditure for 2008 not given. (h) Proposed that participants pay back 50% of empowerment package beginning from harvest to elicit commitment from them. - Additional information from MANR* (i) 28 YETA cluster farming sites established with at least 3 enterprises (poultry , fishery, piggery) in each of 25 LGAs. (j) Jobs created for 950 youth in agri-business in 2-yearly programmes of 450 and 400 in 2008/2009 and 2010/2011 respectively. (k) 950 youths empowered through trainings, provision of inputs and fund to make agricult ure more attractive. (l) Monthly stipend of N7,000 per participant, the then minimum wage. (m) Purchase of 8 Hilux Vans and 2 Buses for YETA Project in 2009 at N5.5m each. - The programme is currently under review to resolve the issues that made its performance not very satisfactory.
Rubber stumps produced by TCU: 32,000 in 2006, 60,000 in 2009, 30,000 in 2010.
Tree Crops Nurseries Development Programme {Source: Additional information from MANR]
1999 to date To produce hybrid and high quality seedlings of major crops for plantation development
- Raise hybrid seedlings of oil palm, rubber, cocoa- Distribute seedlings to farmers at subsidy
- N932.6m. released between 1999 and 2011of which N100m. for rubber in 1999; N57.5m., N80m. and N501.6m. for oil palm in 2002, 2003 and 2004, respectively; and N31m. and N80m. for cocoa in 2006 and 2009, respectively. - 2.34 million seedlings of oil palm distributed under LOAF in 2005 at 50% subsidy to plant 15,350ha of plantation. - 385,000 cocoa seedlings distributed to farmers free of charge by State Committee on Cocoa (TCU produced 100,000 each in 2004-2006, 85,000 in 2007, 30,000 each in 2010 and 2012, and 60,000 each in 2011 and 2013). - 500,000 oil palm seedlings distributed to farmers at 50% subsidy (TCU produced 310,000 seedlings during 2004-2013: 80,000 in 2004, 70,000 in 2005, 30,000 each i n 2008-2011, 10,000 in 2012, and 30,000 in 2013). -
Tree Crops Plantation Development Programme [Source: Additional information from MANR]
2002-05 To revive the dwindling fortunes of export crops production
Re-planting and rehabilitation of old plantations and opening up of new ones – for oil palm, rubber and cocoa
- Replanting/rehabilitation: (a) Oil palm 220ha. in 2002, 235ha. in 2004, 50ha. in 2005. (b) Rubber: 1,235 farmers in 2002, 280 farmers in 2004; over 1,850ha. rehabilitated. Between 1999 and 2003, 40,000 budded rubber stumps obtained from Rubber Research Institute of Nigeria distributed to 21 farmers to plant 90ha. Cost was N8.3m.
Seeds Multiplication Programme [Source: Additional information from MANR]
1999 to date Increase farmers’ productivity and incomes
Improved planting varieties are multiplied and introduced to farmers to replace old varieties
- Cassava Seed Multiplication: (a) In 2004, 12ha. cultivated at Agbarho. N1m. was released. (b) In 2006, 10ha. cultivated at Ogwashi-Uku and Owanta, N2m. released. (c) In 2010, 9ha. cultivated at Ogwashi-Uku. N3.3m. released. (d) In 2012, 7ha. cultivated at Ogwashi-Uku. N3.3m. released. The cuttings were distributed at 50% subsidy. - Seed Yam Multiplication:
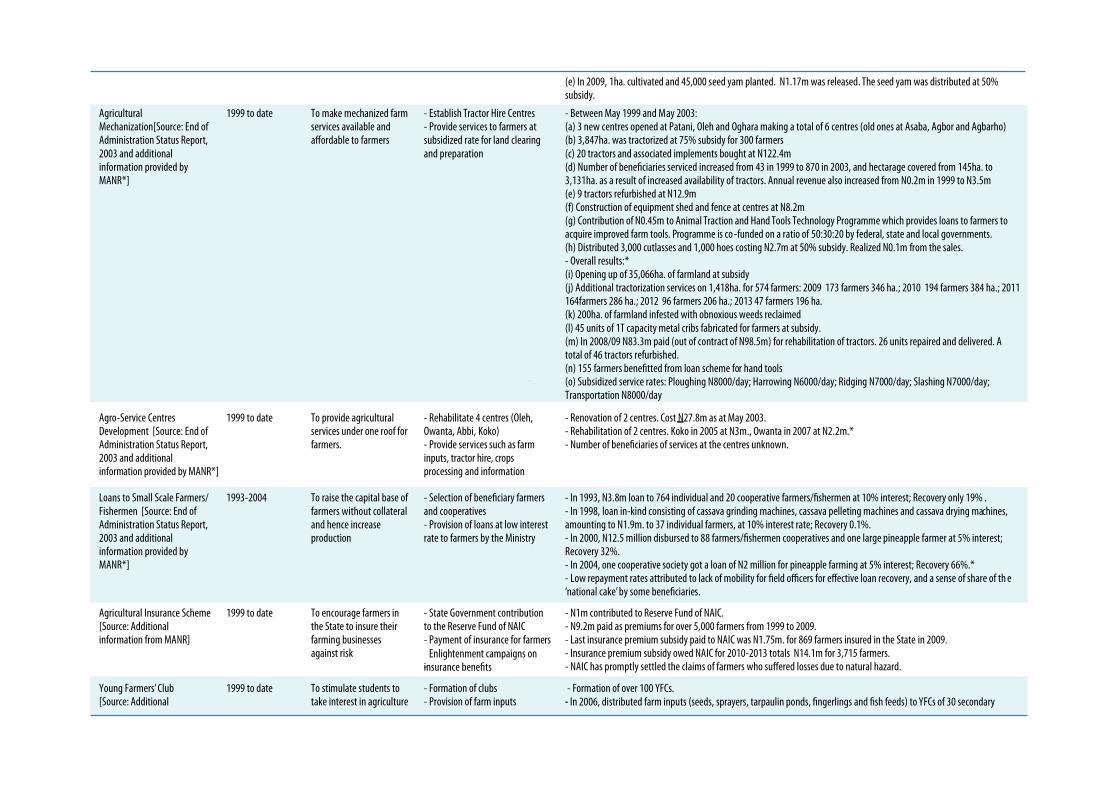
134
DRAFT
(e) In 2009, 1ha. cultivated and 45,000 seed yam planted. N1.17m was released. The seed yam was distributed at 50% subsidy.
Agricultural Mechanization[Source: End of Administration Status Report, 2003 and additional information provided by MANR*]
1999 to date To make mechanized farm services available and affordable to farmers
- Establish Tractor Hire Centres - Provide services to farmers at subsidized rate for land clearing and preparation
- Between May 1999 and May 2003: (a) 3 new centres opened at Patani, Oleh and Oghara making a total of 6 centres (old ones at Asaba, Agbor and Agbarho) (b) 3,847ha. was tractorized at 75% subsidy for 300 farmers (c) 20 tractors and associated implements bought at N122.4m (d) Number of beneficiaries serviced increased from 43 in 1999 to 870 in 2003, and hectarage covered from 145ha. to 3,131ha. as a result of increased availability of tractors. Annual revenue also increased from N0.2m in 1999 to N3.5m (e) 9 tractors refurbished at N12.9m (f) Construction of equipment shed and fence at centres at N8.2m (g) Contribution of N0.45m to Animal Traction and Hand Tools Technology Programme which provides loans to farmers to acquire improved farm tools. Programme is co -funded on a ratio of 50:30:20 by federal, state and local governments. (h) Distributed 3,000 cutlasses and 1,000 hoes costing N2.7m at 50% subsidy. Realized N0.1m from the sales. - Overall results:* (i) Opening up of 35,066ha. of farmland at subsidy (j) Additional tractorization services on 1,418ha. for 574 farmers: 2009 173 farmers 346 ha.; 2010 194 farmers 384 ha.; 2011 164farmers 286 ha.; 2012 96 farmers 206 ha.; 2013 47 farmers 196 ha. (k) 200ha. of farmland infested with obnoxious weeds reclaimed (l) 45 units of 1T capacity metal cribs fabricated for farmers at subsidy. (m) In 2008/09 N83.3m paid (out of contract of N98.5m) for rehabilitation of tractors. 26 units repaired and delivered. A total of 46 tractors refurbished. (n) 155 farmers benefitted from loan scheme for hand tools (o) Subsidized service rates: Ploughing N8000/day; Harrowing N6000/day; Ridging N7000/day; Slashing N7000/day; Transportation N8000/day
Agro-Service Centres Development [Source: End of Administration Status Report, 2003 and additional information provided by MANR*]
1999 to date To provide agricultural services under one roof for farmers.
- Rehabilitate 4 centres (Oleh, Owanta, Abbi, Koko) - Provide services such as farm inputs, tractor hire, crops processing and information
- Renovation of 2 centres. Cost N27.8m as at May 2003. - Rehabilitation of 2 centres. Koko in 2005 at N3m., Owanta in 2007 at N2.2m.* - Number of beneficiaries of services at the centres unknown.
Loans to Small Scale Farmers/ Fishermen [Source: End of Administration Status Report, 2003 and additional information provided by MANR*]
1993-2004 To raise the capital base of farmers without collateral and hence increase production
- Selection of beneficiary farmers and cooperatives - Provision of loans at low interest rate to farmers by the Ministry
- In 1993, N3.8m loan to 764 individual and 20 cooperative farmers/fishermen at 10% interest; Recovery only 19% . - In 1998, loan in-kind consisting of cassava grinding machines, cassava pelleting machines and cassava drying machines, amounting to N1.9m. to 37 individual farmers, at 10% interest rate; Recovery 0.1%. - In 2000, N12.5 million disbursed to 88 farmers/fishermen cooperatives and one large pineapple farmer at 5% interest; Recovery 32%. - In 2004, one cooperative society got a loan of N2 million for pineapple farming at 5% interest; Recovery 66%.* - Low repayment rates attributed to lack of mobility for field officers for effective loan recovery, and a sense of share of th e ‘national cake’ by some beneficiaries.
Agricultural Insurance Scheme [Source: Additional information from MANR]
1999 to date To encourage farmers in the State to insure their farming businesses against risk
- State Government contribution to the Reserve Fund of NAIC - Payment of insurance for farmers
-
Enlightenment campaigns on insurance benefits
- N1m contributed to Reserve Fund of NAIC. - N9.2m paid as premiums for over 5,000 farmers from 1999 to 2009. - Last insurance premium subsidy paid to NAIC was N1.75m. for 869 farmers insured in the State in 2009. - Insurance premium subsidy owed NAIC for 2010-2013 totals N14.1m for 3,715 farmers. - NAIC has promptly settled the claims of farmers who suffered losses due to natural hazard.
Young Farmers’ Club [Source: Additional
1999 to date To stimulate students to take interest in agriculture
- Formation of clubs - Provision of farm inputs
- Formation of over 100 YFCs. - In 2006, distributed farm inputs (seeds, sprayers, tarpaulin ponds, fingerlings and fish feeds) to YFCs of 30 secondary
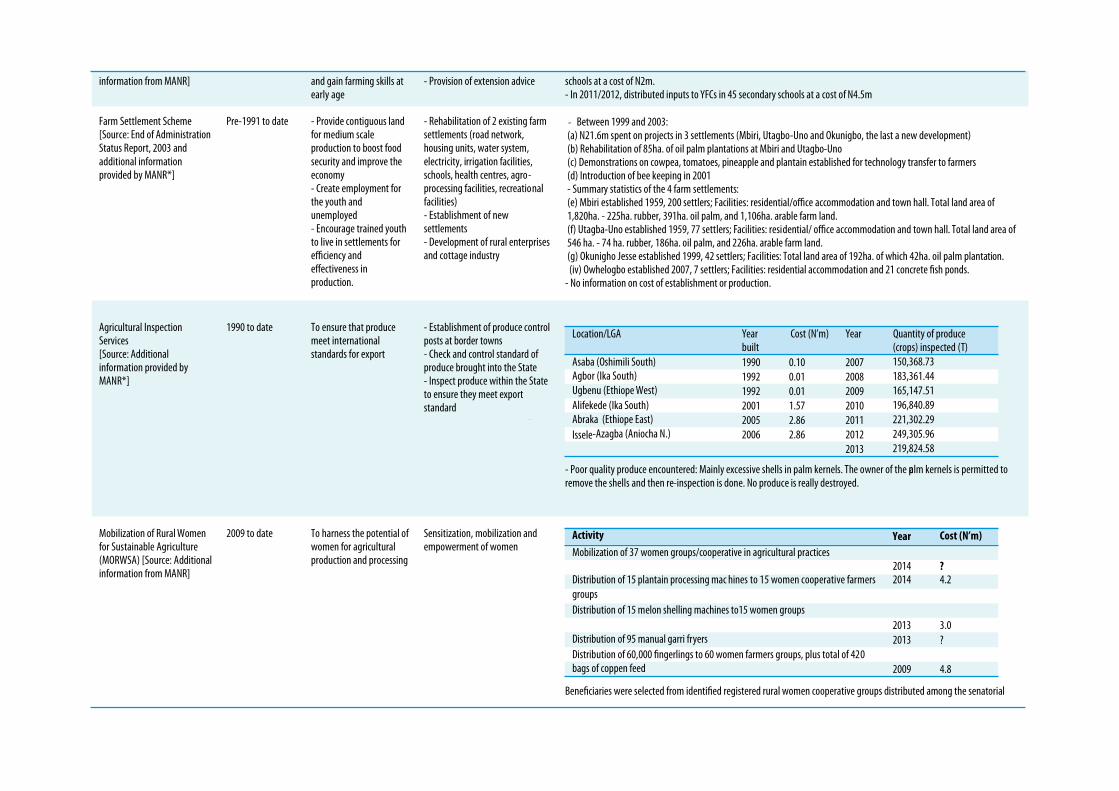
133
information from MANR] and gain farming skills at early age
- Provision of extension advice schools at a cost of N2m. - In 2011/2012, distributed inputs to YFCs in 45 secondary schools at a cost of N4.5m
Farm Settlement Scheme [Source: End of Administration Status Report, 2003 and additional information provided by MANR*]
Pre-1991 to date - Provide contiguous land for medium scale production to boost food security and improve the economy - Create employment for the youth and unemployed - Encourage trained youth to live in settlements for efficiency and effectiveness in production.
- Rehabilitation of 2 existing farm settlements (road network, housing units, water system, electricity, irrigation facilities, schools, health centres, agro-processing facilities, recreational facilities) - Establishment of new settlements - Development of rural enterprises and cottage industry
- Between 1999 and 2003: (a) N21.6m spent on projects in 3 settlements (Mbiri, Utagbo-Uno and Okunigbo, the last a new development) (b) Rehabilitation of 85ha. of oil palm plantations at Mbiri and Utagbo-Uno (c) Demonstrations on cowpea, tomatoes, pineapple and plantain established for technology transfer to farmers (d) Introduction of bee keeping in 2001 - Summary statistics of the 4 farm settlements: (e) Mbiri established 1959, 200 settlers; Facilities: residential/office accommodation and town hall. Total land area of 1,820ha. - 225ha. rubber, 391ha. oil palm, and 1,106ha. arable farm land. (f) Utagba-Uno established 1959, 77 settlers; Facilities: residential/ office accommodation and town hall. Total land area of 546 ha. - 74 ha. rubber, 186ha. oil palm, and 226ha. arable farm land. (g) Okunigho Jesse established 1999, 42 settlers; Facilities: Total land area of 192ha. of which 42ha. oil palm plantation. (iv) Owhelogbo established 2007, 7 settlers; Facilities: residential accommodation and 21 concrete fish ponds.
- No information on cost of establishment or production.
DRAFT
Agricultural Inspection Services [Source: Additional information provided by MANR*]
1990 to date To ensure that produce meet international standards for export
- Establishment of produce control posts at border towns - Check and control standard of produce brought into the State- Inspect produce within the State to ensure they meet export standard
Location/LGA Year
built Cost (N’m) Year Quantity of produce
(crops) inspected (T) Asaba (Oshimili South) 1990 0.10 2007 150,368.73
Agbor (Ika South) 1992 0.01 2008 183,361.44
Ugbenu (Ethiope West) 1992 0.01 2009 165,147.51
Alifekede (Ika South) 2001 1.57 2010 196,840.89
Abraka (Ethiope East) 2005 2.86 2011 221,302.29
Issele-Azagba (Aniocha N.) 2006 2.86 2012 249,305.96 2013 219,824.58
- Poor quality produce encountered: Mainly excessive shells in palm kernels. The owner of the palm kernels is permitted to remove the shells and then re-inspection is done. No produce is really destroyed.
Mobilization of Rural Women for Sustainable Agriculture (MORWSA) [Source: Additional information from MANR]
2009 to date To harness the potential of women for agricultural production and processing
Sensitization, mobilization and empowerment of women
Activity Year Cost (N’m)
Mobilization of 37 women groups/cooperative in agricultural practices 2014
?
Distribution of 15 plantain processing mac hines to 15 women cooperative farmers groups
2014 4.2
Distribution of 15 melon shelling machines to15 women groups
2013
3.0
Distribution of 60,000 fingerlings to 60 women farmers groups, plus total of 420 bags of coppen feed 2009 4.8
Beneficiaries were selected from identified registered rural women cooperative groups distributed among the senatorial
Distribution of 95 manual garri fryers 2013 ?
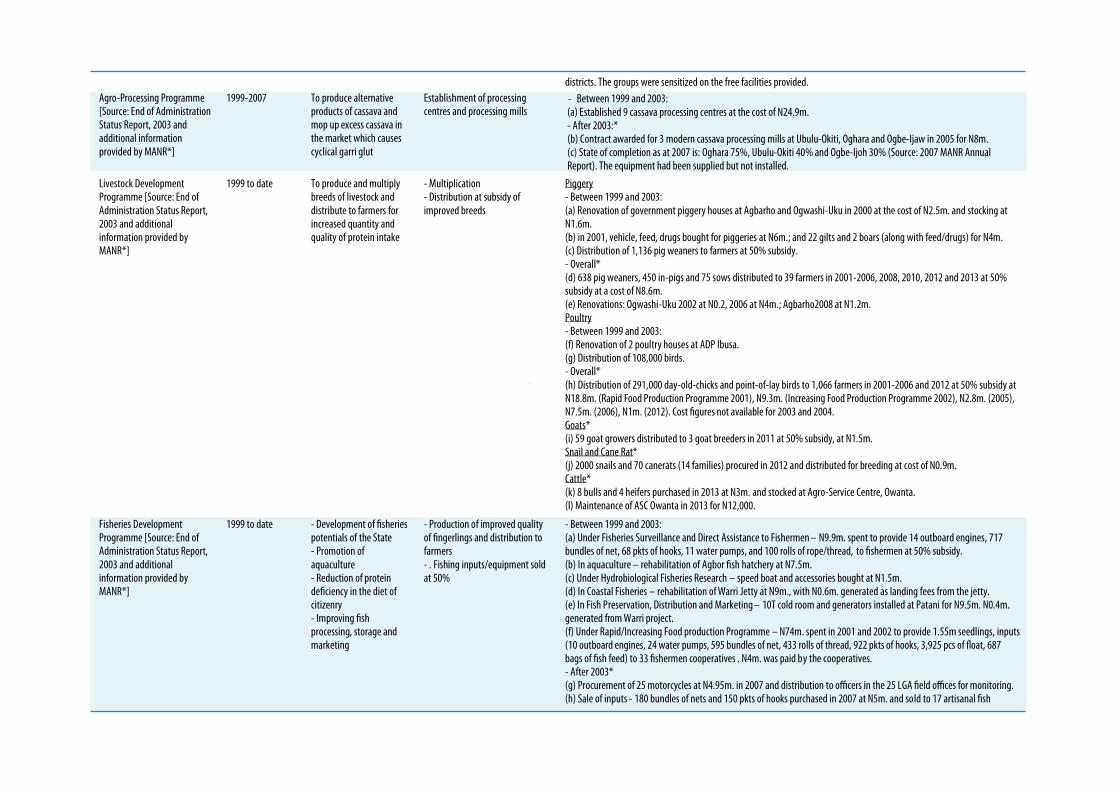
134
districts. The groups were sensitized on the free facilities provided. Agro-Processing Programme [Source: End of Administration Status Report, 2003 and additional information provided by MANR*]
1999-2007 To produce alternative products of cassava and mop up excess cassava in the market which causes cyclical garri glut
Establishment of processing centres and processing mills
- Between 1999 and 2003: (a) Established 9 cassava processing centres at the cost of N24.9m. - After 2003:* (b) Contract awarded for 3 modern cassava processing mills at Ubulu-Okiti, Oghara and Ogbe-Ijaw in 2005 for N8m. (c) State of completion as at 2007 is: Oghara 75%, Ubulu-Okiti 40% and Ogbe-Ijoh 30% (Source: 2007 MANR Annual Report). The equipment had been supplied but not installed.
DRAFT
Livestock Development Programme [Source: End of Administration Status Report, 2003 and additional information provided by MANR*]
1999 to date To produce and multiply breeds of livestock and distribute to farmers for increased quantity and quality of protein intake
- Multiplication - Distribution at subsidy of improved breeds
Piggery - Between 1999 and 2003: (a) Renovation of government piggery houses at Agbarho and Ogwashi-Uku in 2000 at the cost of N2.5m. and stocking at N1.6m. (b) in 2001, vehicle, feed, drugs bought for piggeries at N6m.; and 22 gilts and 2 boars (along with feed/drugs) for N4m. (c) Distribution of 1,136 pig weaners to farmers at 50% subsidy. - Overall* (d) 638 pig weaners, 450 in-pigs and 75 sows distributed to 39 farmers in 2001-2006, 2008, 2010, 2012 and 2013 at 50% subsidy at a cost of N8.6m. (e) Renovations: Ogwashi-Uku 2002 at N0.2, 2006 at N4m.; Agbarho2008 at N1.2m. Poultry - Between 1999 and 2003: (f) Renovation of 2 poultry houses at ADP Ibusa. (g) Distribution of 108,000 birds. - Overall* (h) Distribution of 291,000 day-old-chicks and point-of-lay birds to 1,066 farmers in 2001-2006 and 2012 at 50% subsidy at N18.8m. (Rapid Food Production Programme 2001), N9.3m. (Increasing Food Production Programme 2002), N2.8m. (2005), N7.5m. (2006), N1m. (2012). Cost figures not available for 2003 and 2004. Goats* (i) 59 goat growers distributed to 3 goat breeders in 2011 at 50% subsidy, at N1.5m. Snail and Cane Rat* (j) 2000 snails and 70 canerats (14 families) procured in 2012 and distributed for breeding at cost of N0.9m. Cattle* (k) 8 bulls and 4 heifers purchased in 2013 at N3m. and stocked at Agro-Service Centre, Owanta. (l) Maintenance of ASC Owanta in 2013 for N12,000.
Fisheries Development Programme [Source: End of Administration Status Report, 2003 and additional information provided by MANR*]
1999 to date - Development of fisheries potentials of the State - Promotion of aquaculture - Reduction of protein deficiency in the diet of citizenry - Improving fish processing, storage and marketing
- Production of improved quality of fingerlings and distribution to farmers - . Fishing inputs/equipment sold at 50%
- Between 1999 and 2003: (a) Under Fisheries Surveillance and Direct Assistance to Fishermen – N9.9m. spent to provide 14 outboard engines, 717 bundles of net, 68 pkts of hooks, 11 water pumps, and 100 rolls of rope/thread, to fishermen at 50% subsidy. (b) In aquaculture – rehabilitation of Agbor fish hatchery at N7.5m. (c) Under Hydrobiological Fisheries Research – speed boat and accessories bought at N1.5m. (d) In Coastal Fisheries – rehabilitation of Warri Jetty at N9m., with N0.6m. generated as landing fees from the jetty. (e) In Fish Preservation, Distribution and Marketing – 10T cold room and generators installed at Patani for N9.5m. N0.4m. generated from Warri project. (f) Under Rapid/Increasing Food production Programme – N74m. spent in 2001 and 2002 to provide 1.55m seedlings, inputs (10 outboard engines, 24 water pumps, 595 bundles of net, 433 rolls of thread, 922 pkts of hooks, 3,925 pcs of float, 687 bags of fish feed) to 33 fishermen cooperatives . N4m. was paid by the cooperatives. - After 2003* (g) Procurement of 25 motorcycles at N4.95m. in 2007 and distribution to officers in the 25 LGA field offices for monitoring. (h) Sale of inputs - 180 bundles of nets and 150 pkts of hooks purchased in 2007 at N5m. and sold to 17 artisanal fish
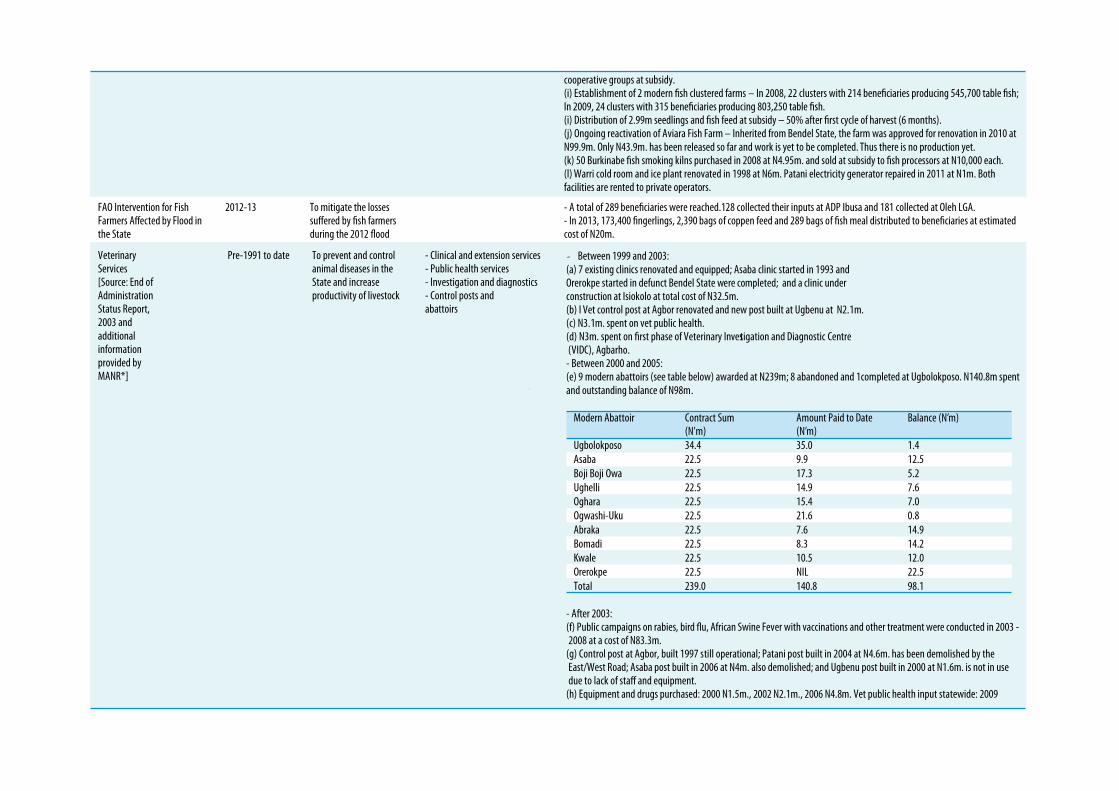
133
cooperative groups at subsidy. (i) Establishment of 2 modern fish clustered farms – In 2008, 22 clusters with 214 beneficiaries producing 545,700 table fish; In 2009, 24 clusters with 315 beneficiaries producing 803,250 table fish. (i) Distribution of 2.99m seedlings and fish feed at subsidy – 50% after first cycle of harvest (6 months). (j) Ongoing reactivation of Aviara Fish Farm – Inherited from Bendel State, the farm was approved for renovation in 2010 at N99.9m. Only N43.9m. has been released so far and work is yet to be completed. Thus there is no production yet. (k) 50 Burkinabe fish smoking kilns purchased in 2008 at N4.95m. and sold at subsidy to fish processors at N10,000 each. (l) Warri cold room and ice plant renovated in 1998 at N6m. Patani electricity generator repaired in 2011 at N1m. Both facilities are rented to private operators.
FAO Intervention for Fish Farmers Affected by Flood in the State
2012-13 To mitigate the losses suffered by fish farmers during the 2012 flood
- A total of 289 beneficiaries were reached.128 collected their inputs at ADP Ibusa and 181 collected at Oleh LGA. - In 2013, 173,400 fingerlings, 2,390 bags of coppen feed and 289 bags of fish meal distributed to beneficiaries at estimated cost of N20m.
DRAFT
Veterinary Services [Source: End of Administration Status Report, 2003 and additional information provided by MANR*]
Pre-1991 to date To prevent and control animal diseases in the State and increase productivity of livestock
- Clinical and extension services - Public health services - Investigation and diagnostics - Control posts and abattoirs
- Between 1999 and 2003: (a) 7 existing clinics renovated and equipped; Asaba clinic started in 1993 and Orerokpe started in defunct Bendel State were completed; and a clinic under construction at Isiokolo at total cost of N32.5m. (b) I Vet control post at Agbor renovated and new post built at Ugbenu at N2.1m. (c) N3.1m. spent on vet public health. (d) N3m. spent on first phase of Veterinary Investigation and Diagnostic Centre (VIDC), Agbarho. - Between 2000 and 2005: (e) 9 modern abattoirs (see table below) awarded at N239m; 8 abandoned and 1completed at Ugbolokposo. N140.8m spent and outstanding balance of N98m.
- After 2003: (f) Public campaigns on rabies, bird flu, African Swine Fever with vaccinations and other treatment were conducted in 2003 -2008 at a cost of N83.3m.
(g) Control post at Agbor, built 1997 still operational; Patani post built in 2004 at N4.6m. has been demolished by the East/West Road; Asaba post built in 2006 at N4m. also demolished; and Ugbenu post built in 2000 at N1.6m. is not in use due to lack of staff and equipment.
(h) Equipment and drugs purchased: 2000 N1.5m., 2002 N2.1m., 2006 N4.8m. Vet public health input statewide: 2009
Modern Abattoir Contract Sum (N’m)
Amount Paid to Date (N’m)
Balance (N’m)
Ugbolokposo 34.4 35.0 1.4 Asaba 22.5 9.9 12.5 Boji Boji Owa 22.5 17.3 5.2 Ughelli 22.5 14.9 7.6 Oghara 22.5 15.4 7.0 Ogwashi-Uku 22.5 21.6 0.8 Abraka 22.5 7.6 14.9 Bomadi 22.5 8.3 14.2 Kwale 22.5 10.5 12.0 Orerokpe 22.5 NIL 22.5 Total 239.0 140.8 98.1
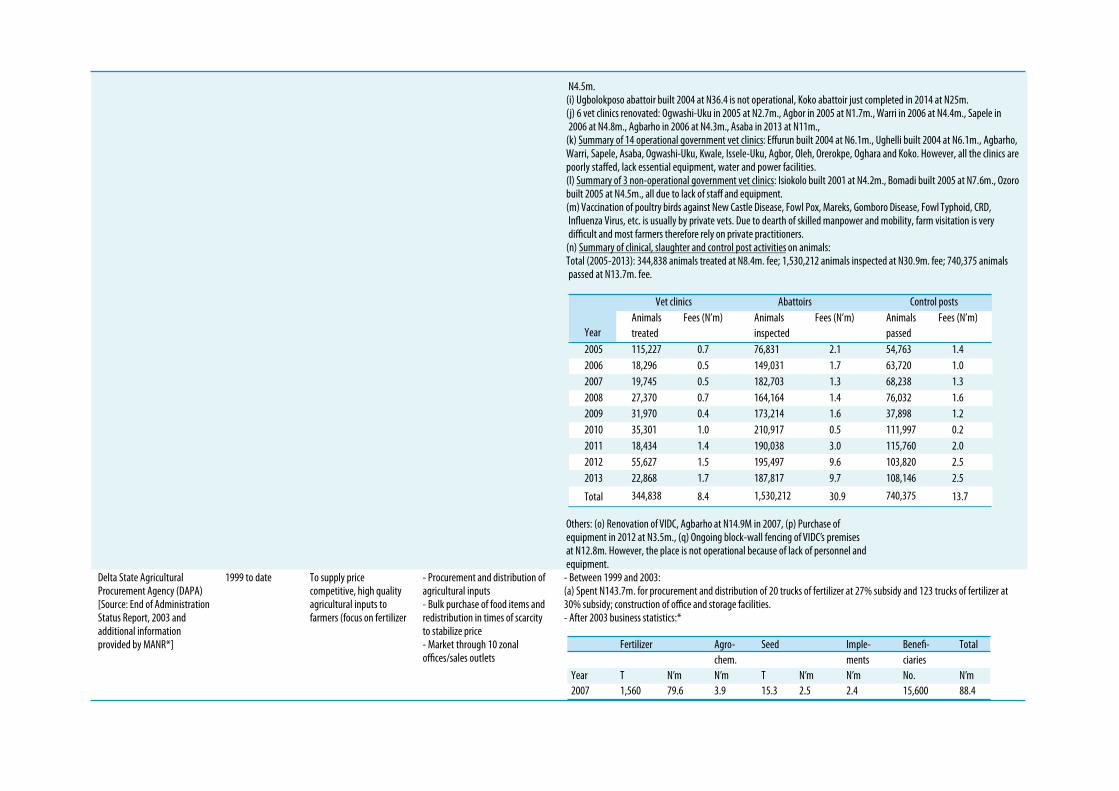
134
N4.5m. (i) Ugbolokposo abattoir built 2004 at N36.4 is not operational, Koko abattoir just completed in 2014 at N25m. (j) 6 vet clinics renovated: Ogwashi-Uku in 2005 at N2.7m., Agbor in 2005 at N1.7m., Warri in 2006 at N4.4m., Sapele in 2006 at N4.8m., Agbarho in 2006 at N4.3m., Asaba in 2013 at N11m.,
(k) Summary of 14 operational government vet clinics: Effurun built 2004 at N6.1m., Ughelli built 2004 at N6.1m., Agbarho, Warri, Sapele, Asaba, Ogwashi-Uku, Kwale, Issele-Uku, Agbor, Oleh, Orerokpe, Oghara and Koko. However, all the clinics are poorly staffed, lack essential equipment, water and power facilities .(l) Summary of 3 non-operational government vet clinics: Isiokolo built 2001 at N4.2m., Bomadi built 2005 at N7.6m., Ozoro built 2005 at N4.5m., all due to lack of staff and equipment. (m) Vaccination of poultry birds against New Castle Disease, Fowl Pox, Mareks, Gomboro Disease, Fowl Typhoid, CRD, Influenza Virus, etc. is usually by private vets. Due to dearth of skilled manpower and mobility, farm visitation is very difficult and most farmers therefore rely on private practitioners.
(n) Summary of clinical, slaughter and control post activities on animals: Total (2005-2013): 344,838 animals treated at N8.4m. fee; 1,530,212 animals inspected at N30.9m. fee; 740,375 animals passed at N13.7m. fee.
Others: (o) Renovation of VIDC, Agbarho at N14.9M in 2007, (p) Purchase of equipment in 2012 at N3.5m., (q) Ongoing block-wall fencing of VIDC’s premises at N12.8m. However, the place is not operational because of lack of personnel and equipment.
Delta State Agricultural Procurement Agency (DAPA) [Source: End of Administration Status Report, 2003 and additional information provided by MANR*]
1999 to date To supply price competitive, high quality agricultural inputs to farmers (focus on fertilizer
- Procurement and distribution of agricultural inputs - Bulk purchase of food items and redistribution in times of scarcity to stabilize price - Market through 10 zonal offices/sales outlets
- Between 1999 and 2003: (a) Spent N143.7m. for procurement and distribution of 20 trucks of fertilizer at 27% subsidy and 123 trucks of fertilizer at 30% subsidy; construction of office and storage facilities. - After 2003 business statistics:*
Year
Vet clinics Abattoirs Control posts Animals treated
Fees (N’m) Animals inspected
Fees (N’m) Animals passed
Fees (N’m)
2005 115,227 0.7 76,831 2.1 54,763 1.4 2006 18,296 0.5 149,031 1.7 63,720 1.0 2007 19,745 0.5 182,703 1.3 68,238 1.3 2008 27,370 0.7 164,164 1.4 76,032 1.6 2009 31,970 0.4 173,214 1.6 37,898 1.2 2010 35,301 1.0 210,917 0.5 111,997 0.2 2011 18,434 1.4 190,038 3.0 115,760 2.0 2012 55,627 1.5 195,497 9.6 103,820 2.5 2013 22,868 1.7 187,817 9.7 108,146 2.5
Total 344,838 8.4 1,530,212 30.9 740,375 13.7
Year
Fertilizer Agro-chem.
Seed Imple- ments
Benefi-ciaries
Total
T N’m N’m T N’m N’m No. N’m 2007 1,560 79.6 3.9 15.3 2.5 2.4 15,600 88.4
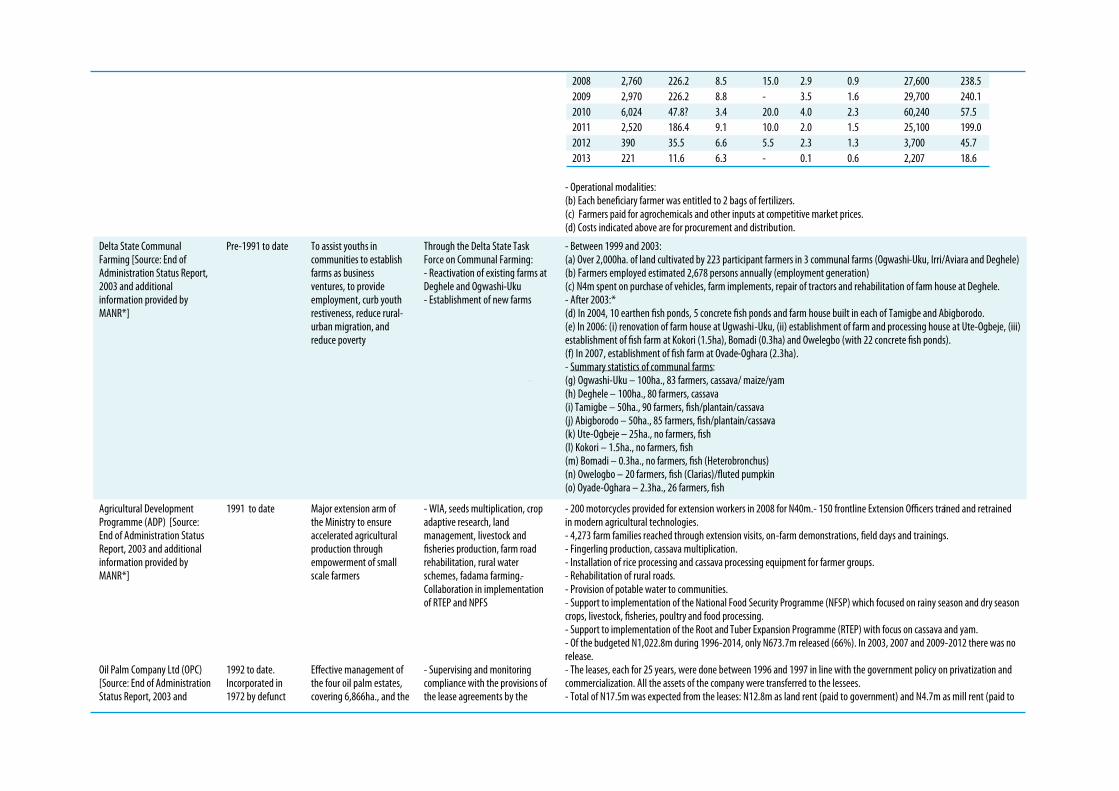
133
DRAFT
- Operational modalities: (b) Each beneficiary farmer was entitled to 2 bags of fertilizers. (c) Farmers paid for agrochemicals and other inputs at competitive market prices. (d) Costs indicated above are for procurement and distribution.
Delta State Communal Farming [Source: End of Administration Status Report, 2003 and additional information provided by MANR*]
Pre-1991 to date To assist youths in communities to establish farms as business ventures, to provide employment, curb youth restiveness, reduce rural-urban migration, and reduce poverty
Through the Delta State Task Force on Communal Farming: - Reactivation of existing farms at Deghele and Ogwashi-Uku - Establishment of new farms
- Between 1999 and 2003: (a) Over 2,000ha. of land cultivated by 223 participant farmers in 3 communal farms (Ogwashi-Uku, Irri/Aviara and Deghele) (b) Farmers employed estimated 2,678 persons annually (employment generation) (c) N4m spent on purchase of vehicles, farm implements, repair of tractors and rehabilitation of farm house at Deghele. - After 2003:* (d) In 2004, 10 earthen fish ponds, 5 concrete fish ponds and farm house built in each of Tamigbe and Abigborodo. (e) In 2006: (i) renovation of farm house at Ugwashi-Uku, (ii) establishment of farm and processing house at Ute-Ogbeje, (iii) establishment of fish farm at Kokori (1.5ha), Bomadi (0.3ha) and Owelegbo (with 22 concrete fish ponds). (f) In 2007, establishment of fish farm at Ovade-Oghara (2.3ha). - Summary statistics of communal farms: (g) Ogwashi-Uku – 100ha., 83 farmers, cassava/ maize/yam (h) Deghele – 100ha., 80 farmers, cassava (i) Tamigbe – 50ha., 90 farmers, fish/plantain/cassava (j) Abigborodo – 50ha., 85 farmers, fish/plantain/cassava (k) Ute-Ogbeje – 25ha., no farmers, fish (l) Kokori – 1.5ha., no farmers, fish (m) Bomadi – 0.3ha., no farmers, fish (Heterobronchus) (n) Owelogbo – 20 farmers, fish (Clarias)/fluted pumpkin (o) Oyade-Oghara – 2.3ha., 26 farmers, fish
Agricultural Development Programme (ADP) [Source: End of Administration Status Report, 2003 and additional information provided by MANR*]
1991 to date Major extension arm of the Ministry to ensure accelerated agricultural production through empowerment of small scale farmers
- WIA, seeds multiplication, crop adaptive research, land management, livestock and fisheries production, farm road rehabilitation, rural water schemes, fadama farming.- Collaboration in implementation of RTEP and NPFS
- 200 motorcycles provided for extension workers in 2008 for N40m.- 150 frontline Extension Officers trained and retrained in modern agricultural technologies. - 4,273 farm families reached through extension visits, on-farm demonstrations, field days and trainings. - Fingerling production, cassava multiplication. - Installation of rice processing and cassava processing equipment for farmer groups. - Rehabilitation of rural roads. - Provision of potable water to communities. - Support to implementation of the National Food Security Programme (NFSP) which focused on rainy season and dry season crops, livestock, fisheries, poultry and food processing. - Support to implementation of the Root and Tuber Expansion Programme (RTEP) with focus on cassava and yam. - Of the budgeted N1,022.8m during 1996-2014, only N673.7m released (66%). In 2003, 2007 and 2009-2012 there was no release.
Oil Palm Company Ltd (OPC) [Source: End of Administration Status Report, 2003 and
1992 to date. Incorporated in 1972 by defunct
Effective management of the four oil palm estates, covering 6,866ha., and the
- Supervising and monitoring compliance with the provisions of the lease agreements by the
- The leases, each for 25 years, were done between 1996 and 1997 in line with the government policy on privatization and commercialization. All the assets of the company were transferred to the lessees. - Total of N17.5m was expected from the leases: N12.8m as land rent (paid to government) and N4.7m as mill rent (paid to
2008 2,760 226.2 8.5 15.0 2.9 0.9 27,600 238.5 2009 2,970 226.2 8.8 - 3.5 1.6 29,700 240.1 2010 6,024 47.8? 3.4 20.0 4.0 2.3 60,240 57.5 2011 2,520 186.4 9.1 10.0 2.0 1.5 25,100 199.0 2012 390 35.5 6.6 5.5 2.3 1.3 3,700 45.7 2013 221 11.6 6.3 - 0.1 0.6 2,207 18.6
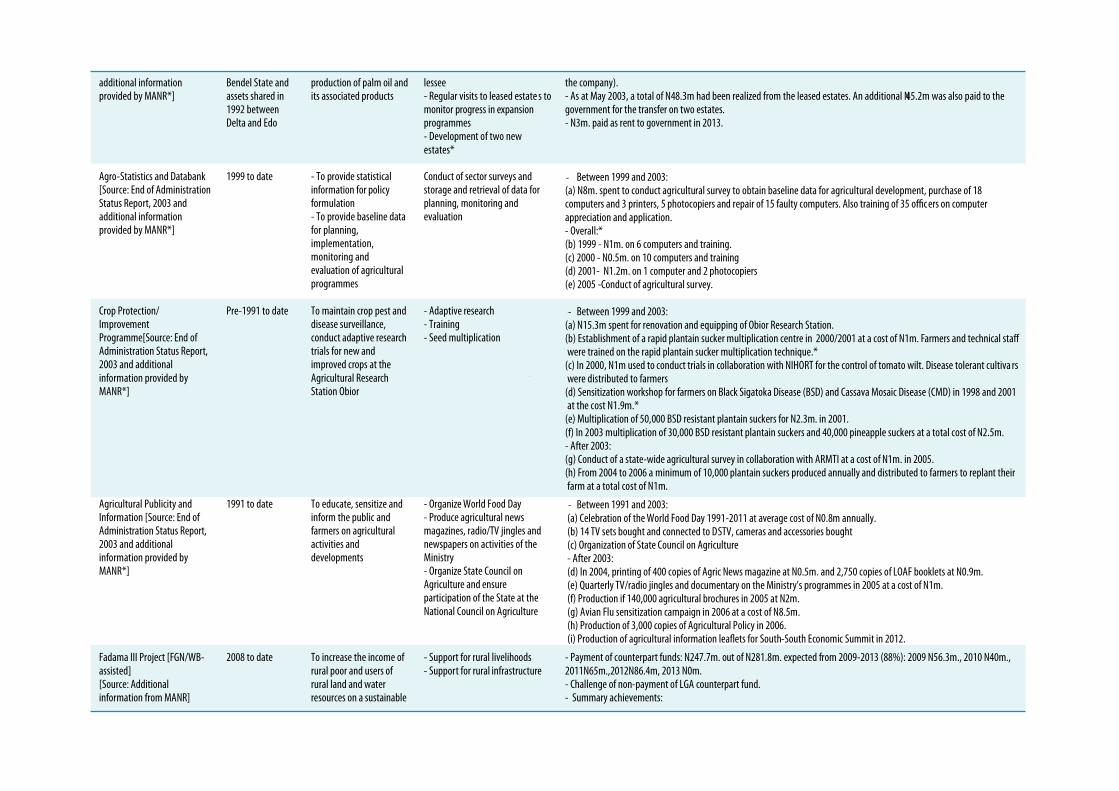
134
additional information provided by MANR*]
Bendel State and assets shared in 1992 between Delta and Edo
production of palm oil and its associated products
lessee - Regular visits to leased estate s to monitor progress in expansion programmes - Development of two new estates*
the company). - As at May 2003, a total of N48.3m had been realized from the leased estates. An additional N45.2m was also paid to the government for the transfer on two estates. - N3m. paid as rent to government in 2013.
Agro-Statistics and Databank [Source: End of Administration Status Report, 2003 and additional information provided by MANR*]
1999 to date - To provide statistical information for policy formulation - To provide baseline data for planning, implementation, monitoring and evaluation of agricultural programmes
Conduct of sector surveys and storage and retrieval of data for planning, monitoring and evaluation
- Between 1999 and 2003: (a) N8m. spent to conduct agricultural survey to obtain baseline data for agricultural development, purchase of 18 computers and 3 printers, 5 photocopiers and repair of 15 faulty computers. Also training of 35 officers on computer appreciation and application. - Overall:* (b) 1999 - N1m. on 6 computers and training. (c) 2000 - N0.5m. on 10 computers and training (d) 2001- N1.2m. on 1 computer and 2 photocopiers (e) 2005 -Conduct of agricultural survey.
DRAFT
Crop Protection/ Improvement Programme[Source: End of Administration Status Report, 2003 and additional information provided by MANR*]
Pre-1991 to date To maintain crop pest and disease surveillance, conduct adaptive research trials for new and improved crops at the Agricultural Research Station Obior
- Adaptive research - Training - Seed multiplication
- Between 1999 and 2003: (a) N15.3m spent for renovation and equipping of Obior Research Station. (b) Establishment of a rapid plantain sucker multiplication centre in 2000/2001 at a cost of N1m. Farmers and technical staff were trained on the rapid plantain sucker multiplication technique.*
(c) In 2000, N1m used to conduct trials in collaboration with NIHORT for the control of tomato wilt. Disease tolerant cultiva rs were distributed to farmers
(d) Sensitization workshop for farmers on Black Sigatoka Disease (BSD) and Cassava Mosaic Disease (CMD) in 1998 and 2001 at the cost N1.9m.*
(e) Multiplication of 50,000 BSD resistant plantain suckers for N2.3m. in 2001. (f) In 2003 multiplication of 30,000 BSD resistant plantain suckers and 40,000 pineapple suckers at a total cost of N2.5m. - After 2003: (g) Conduct of a state-wide agricultural survey in collaboration with ARMTI at a cost of N1m. in 2005. (h) From 2004 to 2006 a minimum of 10,000 plantain suckers produced annually and distributed to farmers to replant their farm at a total cost of N1m.
Agricultural Publicity and Information [Source: End of Administration Status Report, 2003 and additional information provided by MANR*]
1991 to date To educate, sensitize and inform the public and farmers on agricultural activities and developments
- Organize World Food Day - Produce agricultural news magazines, radio/TV jingles and newspapers on activities of the Ministry - Organize State Council on Agriculture and ensure participation of the State at the National Council on Agriculture
- Between 1991 and 2003: (a) Celebration of the World Food Day 1991-2011 at average cost of N0.8m annually. (b) 14 TV sets bought and connected to DSTV, cameras and accessories bought (c) Organization of State Council on Agriculture - After 2003: (d) In 2004, printing of 400 copies of Agric News magazine at N0.5m. and 2,750 copies of LOAF booklets at N0.9m. (e) Quarterly TV/radio jingles and documentary on the Ministry’s programmes in 2005 at a cost of N1m. (f) Production if 140,000 agricultural brochures in 2005 at N2m. (g) Avian Flu sensitization campaign in 2006 at a cost of N8.5m. (h) Production of 3,000 copies of Agricultural Policy in 2006. (i) Production of agricultural information leaflets for South-South Economic Summit in 2012.
Fadama III Project [FGN/WB-assisted] [Source: Additional information from MANR]
2008 to date To increase the income of rural poor and users of rural land and water resources on a sustainable
- Support for rural livelihoods - Support for rural infrastructure
- Payment of counterpart funds: N247.7m. out of N281.8m. expected from 2009-2013 (88%): 2009 N56.3m., 2010 N40m., 2011N65m.,2012N86.4m, 2013 N0m. - Challenge of non-payment of LGA counterpart fund. - Summary achievements:
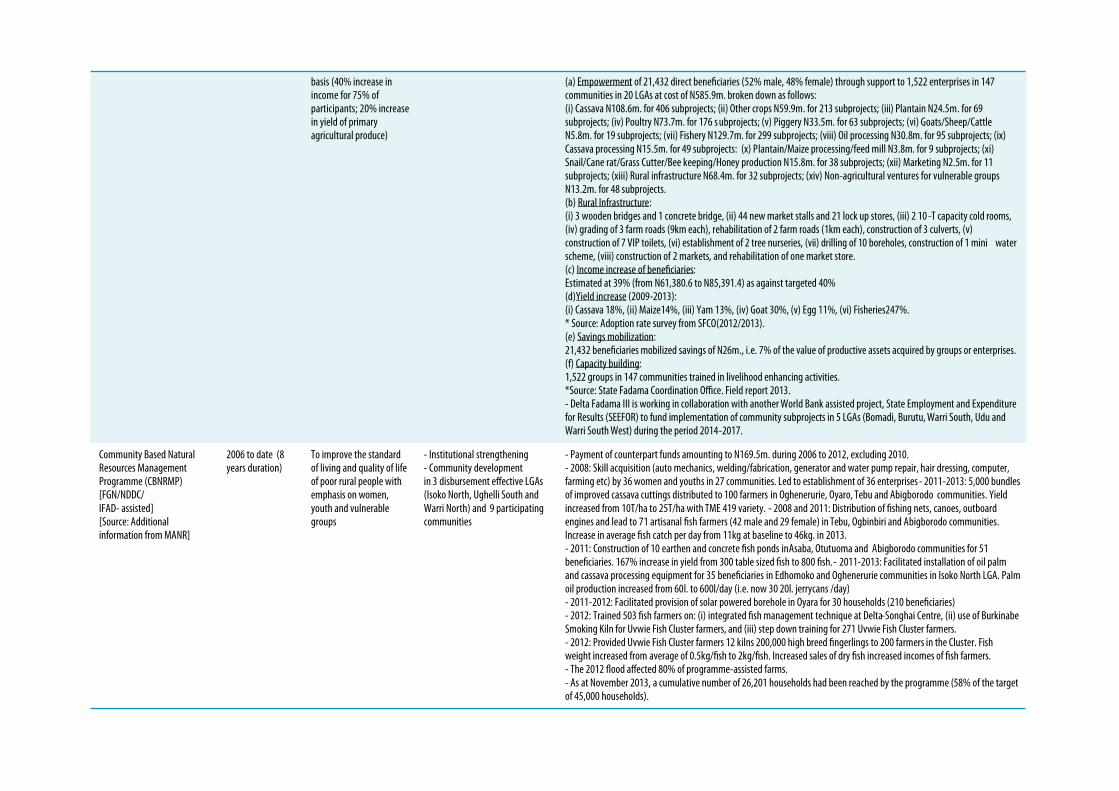
133
DRAFT
basis (40% increase in income for 75% of participants; 20% increase in yield of primary agricultural produce)
(a) Empowerment of 21,432 direct beneficiaries (52% male, 48% female) through support to 1,522 enterprises in 147 communities in 20 LGAs at cost of N585.9m. broken down as follows: (i) Cassava N108.6m. for 406 subprojects; (ii) Other crops N59.9m. for 213 subprojects; (iii) Plantain N24.5m. for 69 subprojects; (iv) Poultry N73.7m. for 176 s ubprojects; (v) Piggery N33.5m. for 63 subprojects; (vi) Goats/Sheep/Cattle N5.8m. for 19 subprojects; (vii) Fishery N129.7m. for 299 subprojects; (viii) Oil processing N30.8m. for 95 subprojects; (ix) Cassava processing N15.5m. for 49 subprojects: (x) Plantain/Maize processing/feed mill N3.8m. for 9 subprojects; (xi) Snail/Cane rat/Grass Cutter/Bee keeping/Honey production N15.8m. for 38 subprojects; (xii) Marketing N2.5m. for 11 subprojects; (xiii) Rural infrastructure N68.4m. for 32 subprojects; (xiv) Non-agricultural ventures for vulnerable groups N13.2m. for 48 subprojects. (b) Rural Infrastructure: (i) 3 wooden bridges and 1 concrete bridge, (ii) 44 new market stalls and 21 lock up stores, (iii) 2 10 -T capacity cold rooms, (iv) grading of 3 farm roads (9km each), rehabilitation of 2 farm roads (1km each), construction of 3 culverts, (v) construction of 7 VIP toilets, (vi) establishment of 2 tree nurseries, (vii) drilling of 10 boreholes, construction of 1 mini water scheme, (viii) construction of 2 markets, and rehabilitation of one market store. (c) Income increase of beneficiaries: Estimated at 39% (from N61,380.6 to N85,391.4) as against targeted 40% (d)Yield increase (2009-2013): (i) Cassava 18%, (ii) Maize14%, (iii) Yam 13%, (iv) Goat 30%, (v) Egg 11%, (vi) Fisheries247%. * Source: Adoption rate survey from SFCO(2012/2013). (e) Savings mobilization: 21,432 beneficiaries mobilized savings of N26m., i.e. 7% of the value of productive assets acquired by groups or enterprises. (f) Capacity building: 1,522 groups in 147 communities trained in livelihood enhancing activities. *Source: State Fadama Coordination Office. Field report 2013. - Delta Fadama III is working in collaboration with another World Bank assisted project, State Employment and Expenditure for Results (SEEFOR) to fund implementation of community subprojects in 5 LGAs (Bomadi, Burutu, Warri South, Udu and Warri South West) during the period 2014-2017.
Community Based Natural Resources Management Programme (CBNRMP) [FGN/NDDC/ IFAD- assisted] [Source: Additional information from MANR]
2006 to date (8 years duration)
To improve the standard of living and quality of life of poor rural people with emphasis on women, youth and vulnerable groups
- Institutional strengthening - Community development in 3 disbursement effective LGAs (Isoko North, Ughelli South and Warri North) and 9 participating communities
- Payment of counterpart funds amounting to N169.5m. during 2006 to 2012, excluding 2010. - 2008: Skill acquisition (auto mechanics, welding/fabrication, generator and water pump repair, hair dressing, computer, farming etc) by 36 women and youths in 27 communities. Led to establishment of 36 enterprises - 2011-2013: 5,000 bundles of improved cassava cuttings distributed to 100 farmers in Oghenerurie, Oyaro, Tebu and Abigborodo communities. Yield increased from 10T/ha to 25T/ha with TME 419 variety. - 2008 and 2011: Distribution of fishing nets, canoes, outboard engines and lead to 71 artisanal fish farmers (42 male and 29 female) in Tebu, Ogbinbiri and Abigborodo communities. Increase in average fish catch per day from 11kg at baseline to 46kg. in 2013. - 2011: Construction of 10 earthen and concrete fish ponds in Asaba, Otutuoma and Abigborodo communities for 51 beneficiaries. 167% increase in yield from 300 table sized fish to 800 fish. - 2011-2013: Facilitated installation of oil palm and cassava processing equipment for 35 beneficiaries in Edhomoko and Oghenerurie communities in Isoko North LGA. Palm oil production increased from 60l. to 600l/day (i.e. now 30 20l. jerrycans /day) - 2011-2012: Facilitated provision of solar powered borehole in Oyara for 30 households (210 beneficiaries) - 2012: Trained 503 fish farmers on: (i) integrated fish management technique at Delta-Songhai Centre, (ii) use of Burkinabe Smoking Kiln for Uvwie Fish Cluster farmers, and (iii) step down training for 271 Uvwie Fish Cluster farmers. - 2012: Provided Uvwie Fish Cluster farmers 12 kilns 200,000 high breed fingerlings to 200 farmers in the Cluster. Fish weight increased from average of 0.5kg/fish to 2kg/fish. Increased sales of dry fish increased incomes of fish farmers. - The 2012 flood affected 80% of programme-assisted farms. - As at November 2013, a cumulative number of 26,201 households had been reached by the programme (58% of the target of 45,000 households).
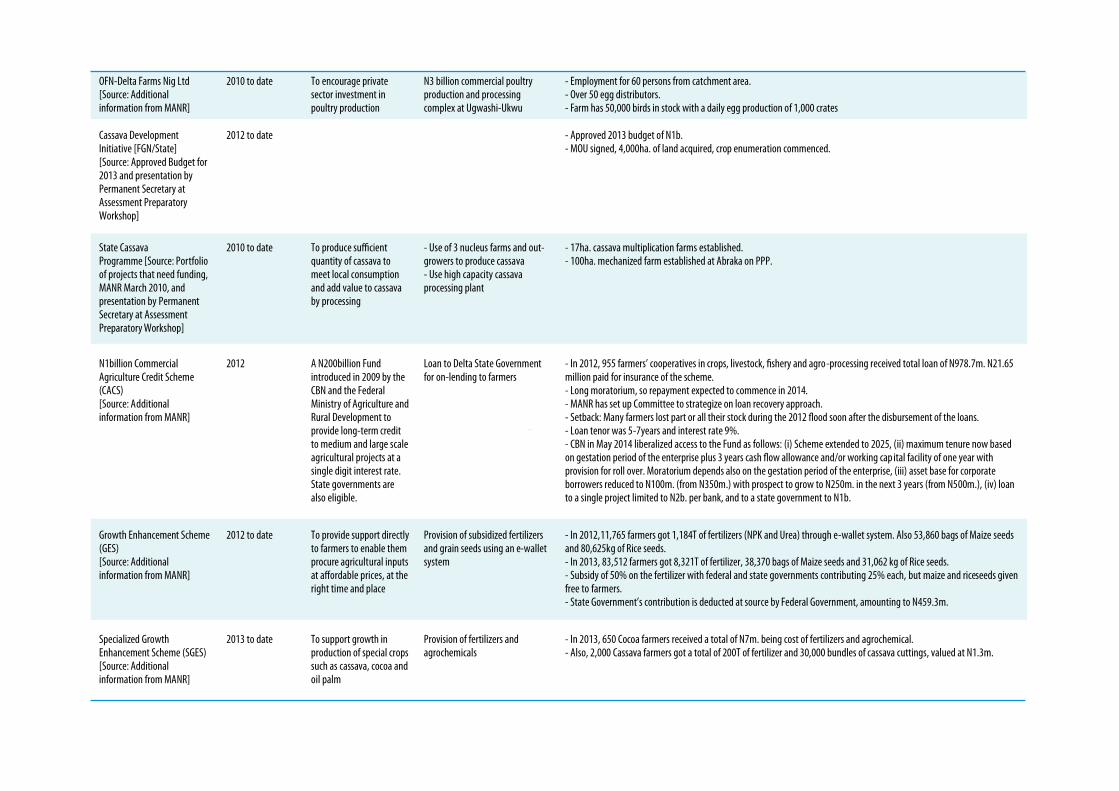
134
OFN-Delta Farms Nig Ltd [Source: Additional information from MANR]
2010 to date To encourage private sector investment in poultry production
N3 billion commercial poultry production and processing complex at Ugwashi-Ukwu
- Employment for 60 persons from catchment area. - Over 50 egg distributors. - Farm has 50,000 birds in stock with a daily egg production of 1,000 crates
Cassava Development Initiative [FGN/State] [Source: Approved Budget for 2013 and presentation by Permanent Secretary at Assessment Preparatory Workshop]
2012 to date - Approved 2013 budget of N1b. - MOU signed, 4,000ha. of land acquired, crop enumeration commenced.
State Cassava Programme [Source: Portfolio of projects that need funding, MANR March 2010, and presentation by Permanent Secretary at Assessment Preparatory Workshop]
2010 to date To produce sufficient quantity of cassava to meet local consumption and add value to cassava by processing
- Use of 3 nucleus farms and out-growers to produce cassava - Use high capacity cassava processing plant
- 17ha. cassava multiplication farms established. - 100ha. mechanized farm established at Abraka on PPP.
DRAFT
N1billion Commercial Agriculture Credit Scheme (CACS) [Source: Additional information from MANR]
2012 A N200billion Fund introduced in 2009 by the CBN and the Federal Ministry of Agriculture and Rural Development to provide long-term credit to medium and large scale agricultural projects at a single digit interest rate. State governments are also eligible.
Loan to Delta State Government for on-lending to farmers
- In 2012, 955 farmers’ cooperatives in crops, livestock, fishery and agro-processing received total loan of N978.7m. N21.65 million paid for insurance of the scheme. - Long moratorium, so repayment expected to commence in 2014. - MANR has set up Committee to strategize on loan recovery approach. - Setback: Many farmers lost part or all their stock during the 2012 flood soon after the disbursement of the loans. - Loan tenor was 5-7years and interest rate 9%. - CBN in May 2014 liberalized access to the Fund as follows: (i) Scheme extended to 2025, (ii) maximum tenure now based on gestation period of the enterprise plus 3 years cash flow allowance and/or working cap ital facility of one year with provision for roll over. Moratorium depends also on the gestation period of the enterprise, (iii) asset base for corporate borrowers reduced to N100m. (from N350m.) with prospect to grow to N250m. in the next 3 years (from N500m.), (iv) loan to a single project limited to N2b. per bank, and to a state government to N1b.
Growth Enhancement Scheme (GES) [Source: Additional information from MANR]
2012 to date To provide support directly to farmers to enable them procure agricultural inputs at affordable prices, at the right time and place
Provision of subsidized fertilizers and grain seeds using an e-wallet system
- In 2012,11,765 farmers got 1,184T of fertilizers (NPK and Urea) through e-wallet system. Also 53,860 bags of Maize seeds and 80,625kg of Rice seeds. - In 2013, 83,512 farmers got 8,321T of fertilizer, 38,370 bags of Maize seeds and 31,062 kg of Rice seeds. - Subsidy of 50% on the fertilizer with federal and state governments contributing 25% each, but maize and rice seeds given free to farmers. - State Government’s contribution is deducted at source by Federal Government, amounting to N459.3m.
Specialized Growth Enhancement Scheme (SGES) [Source: Additional information from MANR]
2013 to date To support growth in production of special crops such as cassava, cocoa and oil palm
Provision of fertilizers and agrochemicals
- In 2013, 650 Cocoa farmers received a total of N7m. being cost of fertilizers and agrochemical. - Also, 2,000 Cassava farmers got a total of 200T of fertilizer and 30,000 bundles of cassava cuttings, valued at N1.3m.
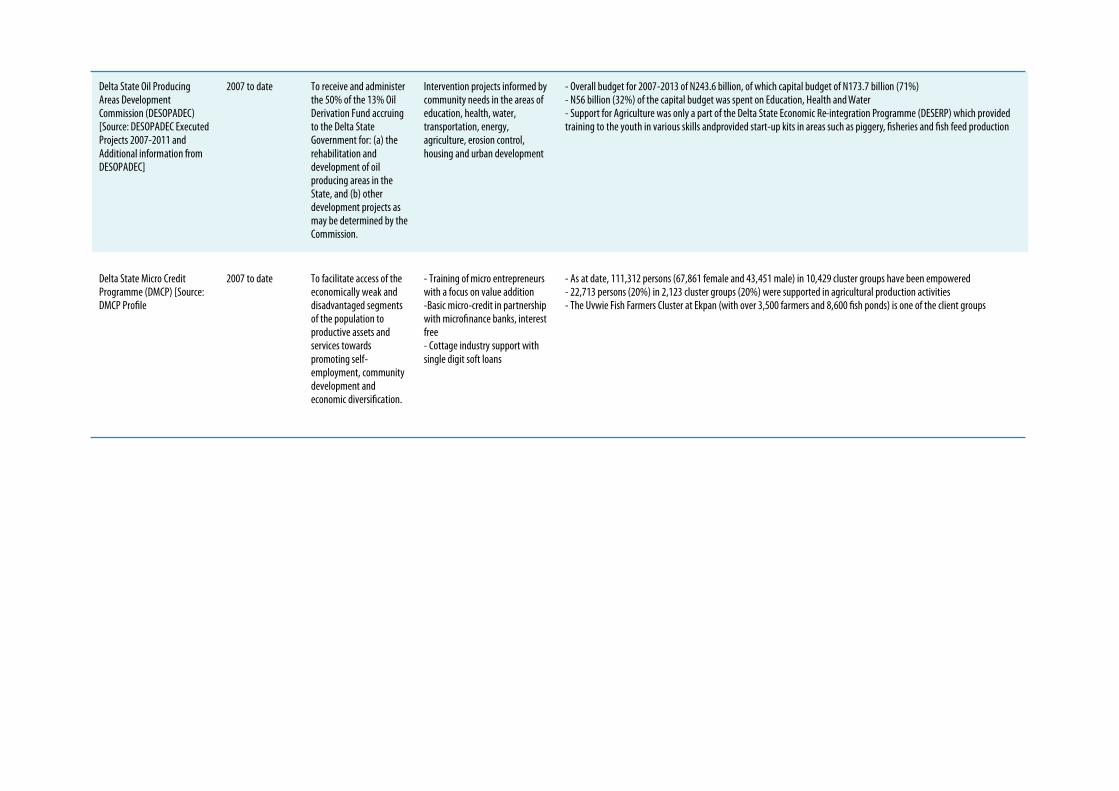
133
Delta State Oil Producing Areas Development Commission (DESOPADEC) [Source: DESOPADEC Executed Projects 2007-2011 and Additional information from DESOPADEC]
2007 to date To receive and administer the 50% of the 13% Oil Derivation Fund accruing to the Delta State Government for: (a) the rehabilitation and development of oil producing areas in the State, and (b) other development projects as may be determined by the Commission.
Intervention projects informed by community needs in the areas of education, health, water, transportation, energy, agriculture, erosion control, housing and urban development
- Overall budget for 2007-2013 of N243.6 billion, of which capital budget of N173.7 billion (71%) - N56 billion (32%) of the capital budget was spent on Education, Health and Water - Support for Agriculture was only a part of the Delta State Economic Re-integration Programme (DESERP) which provided training to the youth in various skills and provided start-up kits in areas such as piggery, fisheries and fish feed production
Delta State Micro Credit Programme (DMCP) [Source: DMCP Profile
2007 to date To facilitate access of the economically weak and disadvantaged segments of the population to productive assets and services towards promoting self-employment, community development and economic diversification.
- Training of micro entrepreneurs with a focus on value addition -Basic micro-credit in partnership with microfinance banks, interest free - Cottage industry support with single digit soft loans
- As at date, 111,312 persons (67,861 female and 43,451 male) in 10,429 cluster groups have been empowered - 22,713 persons (20%) in 2,123 cluster groups (20%) were supported in agricultural production activities - The Uvwie Fish Farmers Cluster at Ekpan (with over 3,500 farmers and 8,600 fish ponds) is one of the client groups
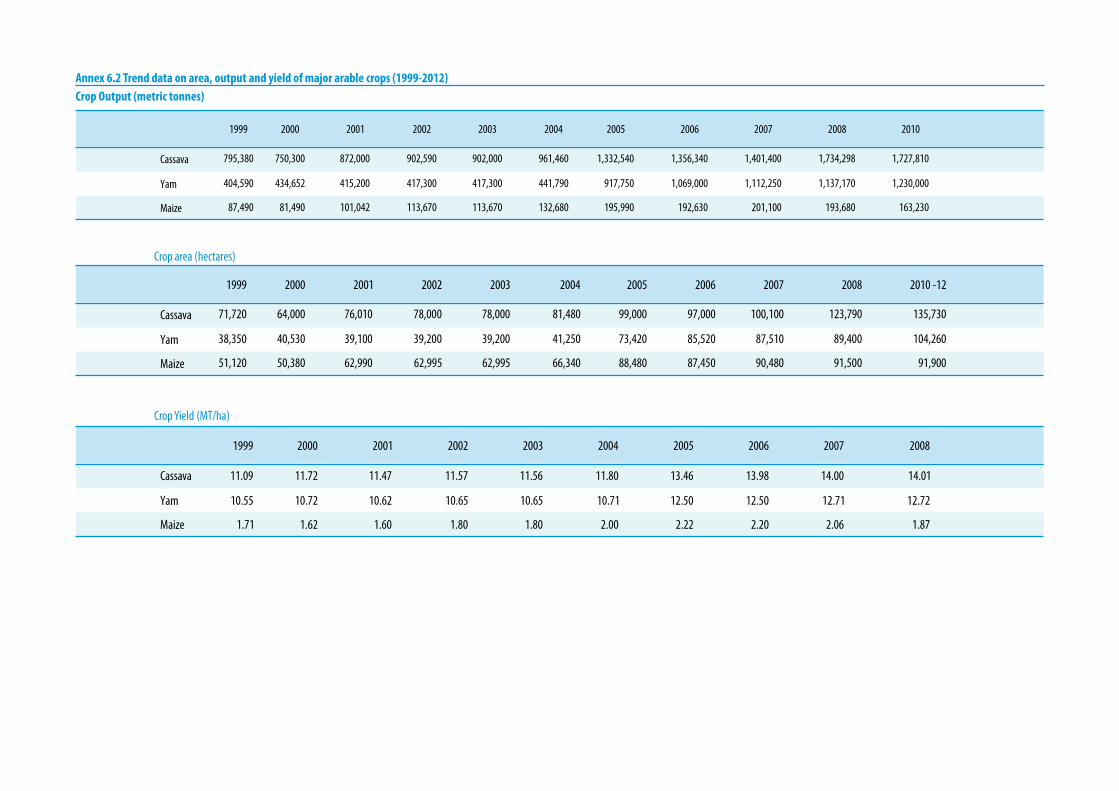
134
Annex 6.2 Trend data on area, output and yield of major arable crops (1999-2012)Crop Output (metric tonnes)
1999 2000 2001 2002 2003 2004 2005 2006 2007 2008 2010
Cassava 795,380 750,300 872,000 902,590 902,000 961,460 1,332,540 1,356,340 1,401,400 1,734,298 1,727,810
Yam 404,590 434,652 415,200 417,300 417,300 441,790 917,750 1,069,000 1,112,250 1,137,170 1,230,000
Maize 87,490 81,490 101,042 113,670 113,670 132,680 195,990 192,630 201,100 193,680 163,230
Crop area (hectares)
Crop Yield (MT/ha)
DRAFT
1999 2000 2001 2002 2003 2004 2005 2006 2007 2008 2010 -12
Cassava 71,720 64,000 76,010 78,000 78,000 81,480 99,000 97,000 100,100 123,790 135,730
Yam 38,350 40,530 39,100 39,200 39,200 41,250 73,420 85,520 87,510 89,400 104,260
Maize 51,120 50,380 62,990 62,995 62,995 66,340 88,480 87,450 90,480 91,500 91,900
1999 2000 2001 2002 2003 2004 2005 2006 2007 2008
Cassava 11.09 11.72 11.47 11.57 11.56 11.80 13.46 13.98 14.00 14.01
Yam 10.55 10.72 10.62 10.65 10.65 10.71 12.50 12.50 12.71 12.72
Maize 1.71 1.62 1.60 1.80 1.80 2.00 2.22 2.20 2.06 1.87
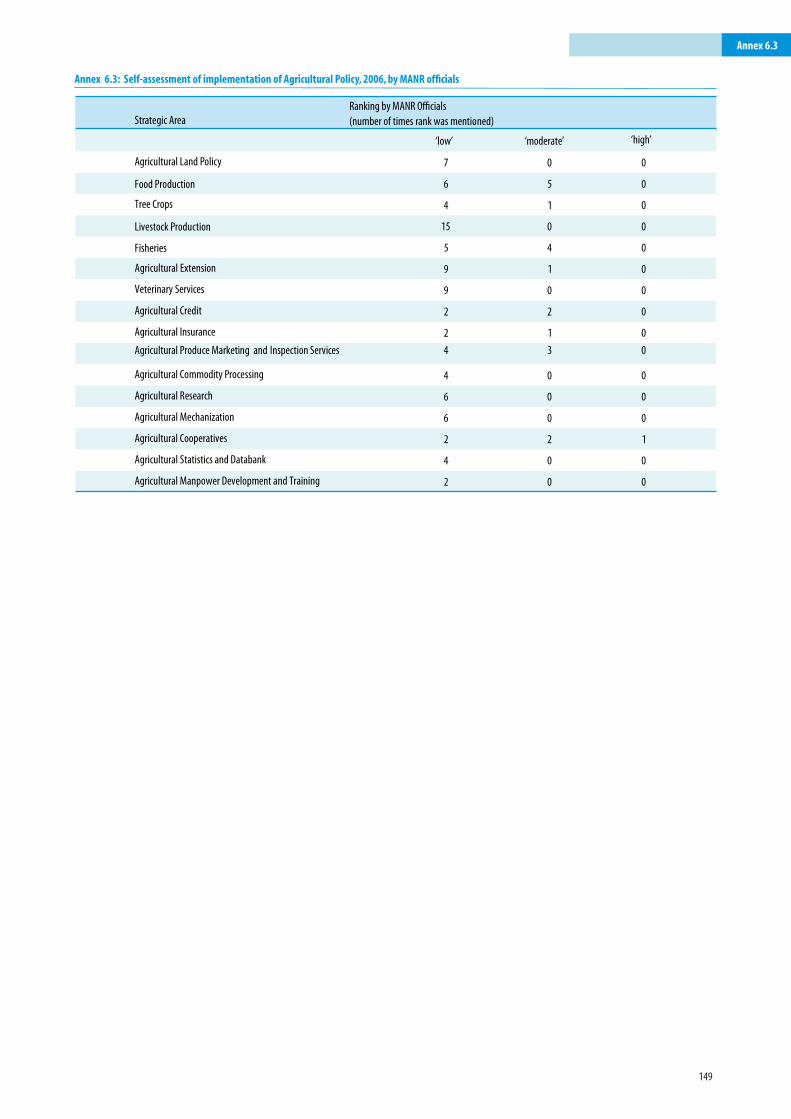
149
Strategic Area
Ranking by MANR Officials (number of times rank was mentioned)
‘low’ ‘moderate’ ‘high’
Agricultural Land Policy 7 0 0
Food Production 6 5 0
Tree Crops 4 1 0
Livestock Production 15 0 0
Fisheries 5 4 0
Agricultural Extension 9 1 0
Veterinary Services 9 0 0
Agricultural Credit 2 2 0
Agricultural Insurance 2 1 0
Agricultural Produce Marketing and Inspection Services 4 3 0
Agricultural Commodity Processing 4 0 0
Agricultural Research 6 0 0
Agricultural Mechanization 6 0 0
Agricultural Cooperatives 2 2 1
Agricultural Statistics and Databank 4 0 0
Agricultural Manpower Development and Training 2 0 0
Annex 6.3: Self-assessment of implementation of Agricultural Policy, 2006, by MANR officials
Annex 6.3

9 789785 335804
ISBN 978533580-1


