Embed Size (px)
Citation preview

Biodiversity and Conservation8: 1621–1641, 1999.© 1999Kluwer Academic Publishers. Printed in the Netherlands.
Deforestation in Lacandonia (southeast Mexico):evidence for the declaration of the northernmosttropical hot-spot
EDUARDO MENDOZA and RODOLFO DIRZO∗Instituto de Ecología, UNAM, Ap. Post. 70-275, Mexico 04510 D. F., Mexico;∗Author for correspondence (e-mail: [email protected])
Received 8 January 1999; accepted in revised form 12 April 1999
Abstract. To assess the conservation status of Lacandonia, a megadiversity area in Mexico, rates of defor-estation were calculated for the periods 1974–1981 and 1981–1991, using a random sample of 38 5×5 kmsites. We evaluated: (i) the overall magnitude of, and spatial and temporal variation in deforestation;(ii) how spatial variation relates to human population density, terrain slope and the presence of the MontesAzules Biosphere Reserve; (iii) the magnitude of potential plant species loss associated with deforestation.Overall deforestation was greater in the former than in the second period (1412 vs. 744 ha/year), althoughmean rates (2.1 and 1.6%/year) were statistically indistinguishable due to a considerable spatial variation.The greatest spatial variation was related to the presence of the Montes Azules Reserve: deforestation out-side the reserve was 20 and 6 times greater in the first and second period, respectively. Population densityand terrain slope were related to deforestation but the relationship was considerably poor. Estimates ofplant species committed to extinction (out of the expected total flora of 4314 species) were as high as 22%by year 2035, and 55% by year 2135. Such levels of potential species extinction associated to deforestation,and the great biological diversity of Lacandonia provide evidence to declare it as the northernmost tropicalhot-spot and a priority goal in conservation efforts.
Key words: biodiversity hot-spot, deforestation, Lacandonia, northernmost tropical forest
Introduction
The current patterns of land use constitute one of the most pressing global envir-onmental changes. Habitat destruction and fragmentation have been recognised asthe major threat to biological diversity (Reid and Miller 1989; Whitmore and Sayer1992; Laurance and Bierregaard 1997; Whitmore 1997), especially in the tropics,where a disproportionately high magnitude of the Earth’s biological diversity is con-centrated (Wilson 1988; Orians et al. 1995). Also, there is a growing recognition thatdeforestation, particularly of tropical forests, plays an important role in atmosphericgas regulation (Trexler and Haugen 1993; Dixon et al. 1994) and can significantlyinfluence the climate at different scales (Nobre et al. 1991; IPCC 1992; Henderson-Sellers et al. 1993). Thus, there is a justified concern for the measurement, monitoringand assessment of the consequences of tropical deforestation (Whitmore and Sayer

1622
1992; Skole and Tucker 1993; Heywood and Watson 1995; Laurance and Bierregaard1997). Despite this growing concern, several methodological and organisational prob-lems persist and the mere estimates of the magnitude and rates of deforestation con-tinue to be a major issue in conservation biology (Melillo et al. 1985; Orians et al.1995). Such estimates remain considerably variable depending on the authors andsource (see examples and reviews in Whitmore and Sayer 1992; Myers 1993; Skoleand Tucker 1993).
An important contribution to the undergoing international efforts to assess thecurrent patterns of land use is the detailed analysis of the levels and consequencesof deforestation at local/regional scales. At these scales, methodological and organ-isational problems can be more readily tackled and estimates can be supported byfieldwork and more tractable ground-truthing protocols. The need for such studies isparticularly critical in areas where biological diversity is known or suspected to benotably high, and where information on current and potential habitat destruction isunknown.
In this paper we report on the magnitude and rates of deforestation in Lacandoniaor Selva Lacandona (Chiapas, southern Mexico), where remaining extensive tropicalrain forest vegetation reaches its northernmost distribution on the American continent(Dirzo 1994).
Although Mexico is recognised as one of the megadiversity regions of the world(Mittermeier and Mittermeier 1992; Ramamoorthy et al. 1993), Mexican tropical rainforests occupy a reduced proportion of its territory. In addition, a recent estimateindicates that deforestation rates of this biome are the highest (2%/year) for all closedforests of the country (Masera et al. 1997). Thus the remaining tropical rain forestsin Mexico are an important conservation priority; moreover here we argue that theimportance of Lacandonia should transcend the Mexican conservation interests.
Lacandonia includes not only the major tract of tropical rain forest on the Mex-ican territory, but it stretches into Guatemala and Belize, thus constituting the mostextensive tract of this biome in Mesoamerica, and one of the largest in the Neotropics(Dirzo 1994). Despite its extreme latitudinal position on the continent, the preliminarybiological information for some groups of organisms (discussed below) indicates thatthe biodiversity of the area is considerable. This, and the qualitative value of thisforest’s biological diversity at its most northern distribution, suggests that Lacandoniais likely to constitute a special component of the Neotropical biological diversity. Theimportance of the study of deforestation in this zone was recognised by Myers (1993),who regarded this general region as one of the main deforestation fronts in tropicalareas. Thus a thorough analysis of the recent and current rates of deforestation willhelp to elucidate to what extent this region is an important and as yet ignored hot-spotof biological diversity (see Myers 1990; Wilson 1992 and Meffe and Carroll 1997 fora description of the major hot-spots in the world).
In order to provide a detailed description of deforestation in Lacandonia, we spe-cifically addressed the following questions: (i) what are the recent and current levels

1623
of deforestation in the Mexican part of this forest? (ii) given its large extension, howdo rates of deforestation vary spatially? (iii) is spatial variation in deforestation asso-ciated to proximal factors such as local human population density and terrain slope?and (iv) what scenarios of potential species loss can be derived from the calculationsof deforestation rates in this forest?
Materials and methods
The study site
The Mexican portion of Lacandonia is located on the eastern extreme of the Stateof Chiapas (16◦05′, 17◦15′ LN; 90◦25′ and 91◦45′ LW) (Figure 1). The study areaencompasses 800,000 ha, slightly over half the total area covered by Lacandonia (Dela Maza and De la Maza 1991). The region of Marqués de Comillas, located to theeast and south of the Lacantún river (Figure 1), was not included in the present ana-lysis because it was massively colonised and deforested in the decade of the sixties.Although lowlands are predominant, Lacandonia presents three ranges that run in aNW–SE direction, with an elevational gradient from 60 to 2450 m above sea level(m.a.s.l.). The climate typical of elevations below 800 m is hot (mean of 25◦C);it becomes semi-hot (average 20◦C) from 800 to 1300 m and lower temperatureregimes are restricted to some peaks above 1300 m. Rainfall ranges from 2500 to3500 mm per year, with the greatest concentration in June–September, and the lowestin March–April. The predominant vegetation type of the zone is tropical rain forestbut numerous variants and associations are present (Dirzo 1991; Martínez et al. 1994).Such vegetational diversity is associated in part to the great diversity of soils and thecomplex fluvial network of the zone (Figure 1). The most thorough, though still in-complete, biological inventories correspond to butterflies, with 800 recorded species(De la Maza and De la Maza 1991) and vascular plants with 3400 recorded speciesand 4314 species expected when inventories are completed in the whole region (seeMartínez et al. 1994). Mayan archaeological sites are profusely scattered throughoutthe zone (Gómez-Pompa and Dirzo 1995).
A remarkable feature of Lacandonia is the presence of the Montes Azules Bio-sphere Reserve (see Figure 1), officially decreed in 1978. With an extension of331, 200 ha, and largely covered by lowland rain forest, the reserve hosts some 9000inhabitants of several ethnic origins, collectively known as the Lacandon community.A detailed description of the Montes Azules Reserve is given in Gómez-Pompa andDirzo (1995).

1624
Figure 1. The location of the area of study, in the Mexican State of Chiapas. The squares in the inset showthe 38 randomly selected sampling quadrats, numbered consecutively. The main roads (- - - - -), rivers(——–) and the Montes Azules Biosphere Reserve ( ), as well as some prominent localities are alsoshown.

1625
Analysis of deforestation
In order to provide quantitative estimates of deforestation, six satellite Landsat Multis-pectral Scanner System (MSS) and Thematic Mapper (TM) scenes were used tocreate a time-series of images corresponding to 1974, 1984 and 1991. Each imagewas a mosaic of two Landsat scenes (path 21 and rows 48 and 49). Dates of pairsof scenes were: 15/02/74 (first set), 25/11/84 and 15/01/85 (second set) and 19/02/90and 03/04/91 (third set). The first two sets correspond to MSS and the latter to TM.Each image was corrected in order to match spatial resolution to 60×60 m and reducedistortions and spatial error to less than a pixel (see Mendoza 1997 for more details).A non-supervised classification procedure was applied to each image through theuse of the GRASS4.1 software for work station (US Army Construction EngineeringResearch Laboratory 1993) using a maximum likelihood algorithm. This algorithmallows classification of the images based on the probability that a pixel belongs toa particular spectral class. Sets of homogeneous spectral clusters were subsequentlyassigned to land cover classes. The classification procedure was aided with the follow-ing ancillary tools: thematic cartographic charts scales 1:25,000 (produced by DIASAConsultores, Mexico City) and 1:250,000 (from the National Institute of Geographyand Statistics, INEGI); aerial photography sets, scales 1:70,000 (INEGI 1978) and1:38,000 (National Defense Secretary, SEDENA, 1994); false color composites; asurvey flight (1994) and periodic visits by the authors to the area since 1992. Detailsregarding dates, acquisition, processing, classification and analyses of the images andancillary tools are given in Mendoza (1997).
Given the large extension of the study area and in order to facilitate the possibilityof any necessary verification in the field, a representative sample of areas was takenfor the analysis of deforestation. To this effect, the satellite images were divided intoa grid of 5×5 km quadrats. A random sample of 50 quadrats was chosen for analysis.However, 12 of them had to be eliminated either because of the lack of complete cor-respondence in the time series (due to a shift in the orbit of TM satellites with respectto that of MSS), or because the presence of clouds prevented a reliable analysis offorest coverage. Such a random sample has the additional advantages that averagedeforestation values can be given with associated statistical measures of variation,and that spatial variations in deforestation can be explored in conjunction with othervariables (e.g., population density, terrain slope, etc.) specific to those local quadrats.
Areas were calculated in terms of forested and deforested sectors, which includedareas converted to pastures or agricultural fields and sparse/poorly developed second-ary vegetation. A differentiation was also made of bodies of water (rivers, lakes) andshadows due to topographical features.
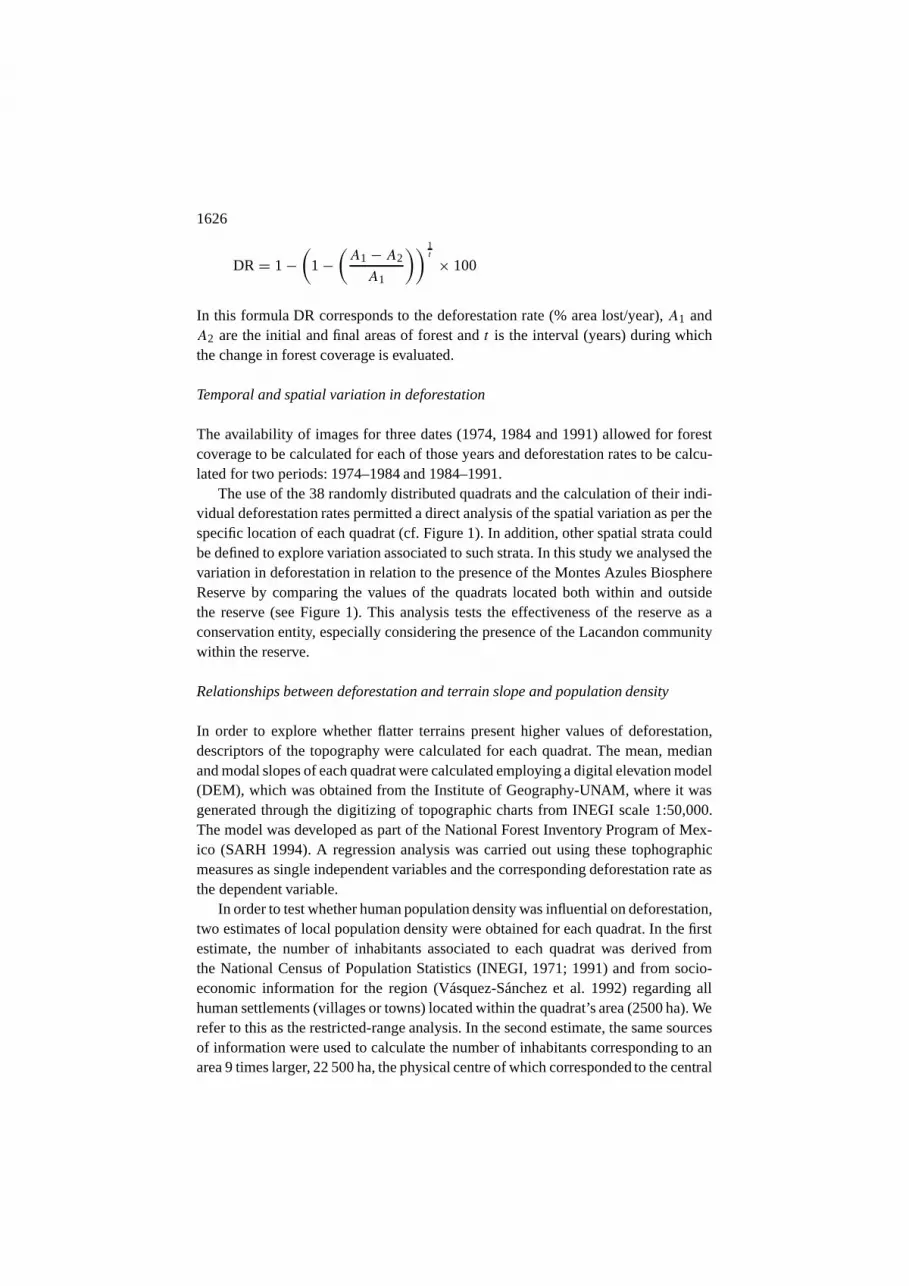
From the areas covered by forest in each of the dates, a deforestation rate wascalculated for each quadrat according to the formula of Dirzo and García (1992):
1626
DR= 1−(
1−(A1− A2
A1
)) 1t × 100
In this formula DR corresponds to the deforestation rate (% area lost/year),A1 andA2 are the initial and final areas of forest andt is the interval (years) during whichthe change in forest coverage is evaluated.
Temporal and spatial variation in deforestation
The availability of images for three dates (1974, 1984 and 1991) allowed for forestcoverage to be calculated for each of those years and deforestation rates to be calcu-lated for two periods: 1974–1984 and 1984–1991.
The use of the 38 randomly distributed quadrats and the calculation of their indi-vidual deforestation rates permitted a direct analysis of the spatial variation as per thespecific location of each quadrat (cf. Figure 1). In addition, other spatial strata couldbe defined to explore variation associated to such strata. In this study we analysed thevariation in deforestation in relation to the presence of the Montes Azules BiosphereReserve by comparing the values of the quadrats located both within and outsidethe reserve (see Figure 1). This analysis tests the effectiveness of the reserve as aconservation entity, especially considering the presence of the Lacandon communitywithin the reserve.
Relationships between deforestation and terrain slope and population density
In order to explore whether flatter terrains present higher values of deforestation,descriptors of the topography were calculated for each quadrat. The mean, medianand modal slopes of each quadrat were calculated employing a digital elevation model(DEM), which was obtained from the Institute of Geography-UNAM, where it wasgenerated through the digitizing of topographic charts from INEGI scale 1:50,000.The model was developed as part of the National Forest Inventory Program of Mex-ico (SARH 1994). A regression analysis was carried out using these tophographicmeasures as single independent variables and the corresponding deforestation rate asthe dependent variable.
In order to test whether human population density was influential on deforestation,two estimates of local population density were obtained for each quadrat. In the firstestimate, the number of inhabitants associated to each quadrat was derived fromthe National Census of Population Statistics (INEGI, 1971; 1991) and from socio-economic information for the region (Vásquez-Sánchez et al. 1992) regarding allhuman settlements (villages or towns) located within the quadrat’s area (2500 ha). Werefer to this as the restricted-range analysis. In the second estimate, the same sourcesof information were used to calculate the number of inhabitants corresponding to anarea 9 times larger, 22 500 ha, the physical centre of which corresponded to the central

1627
point of each of the quadrats studied. We refer to this as the broad-range analysis.Each of these two estimates of population density were used as single independentvariables and deforestation rate as the dependent variable in regression analyses.
Scenarios of potential species loss associated to deforestation
The estimated rates of deforestation were used to model scenarios of potential di-versity loss, on the basis of the species-area relationship of MacArthur and Wilson’s(1967) island biogeography theory:S = cAz (whereS is the number of species,c a constant,A the area andz the slope of the relationship between species andarea). Average rates of deforestation were used to predict remaining forest areas ata given time (or the time necessary for a given reduction in area to occur) usinga simple exponential decay model (Dirzo and García 1992). The calculation of theS value for the specified reductions in forest area was made following Simberloff(1992). Thez exponent values have been found empirically to range between 0.15and 0.35 (Connor and McCoy 1979; Begon et al. 1990) and these two values wereused to model scenarios of plant species loss, assuming that the current average de-forestation rate remains the same. Plants were chosen for this exercise since theyconstitute an important descriptor of overall biological diversity (Raven 1992) andalso because a recent account of the flora of the Selva Lacandona is available (seeMartínez et al. 1994). For these simulations the expected number of vascular plants,4314, was employed.
Results
Temporal variation in deforestation
Our estimates of the areas of remaining forest (Table 1) indicate that in a periodof 17 years a total of 19,327 (i.e., 14,121+5206) ha were lost in the 38 selectedquadrats. This corresponds to ca. 24% of the forest coverage present at the beginningof the study period (1974). However, there was a notable contrast in the magnitude ofabsolute deforestation between the two periods analysed (Table 1). While 17% of theforest was lost between 1974 and 1984, only ca. 7% was lost in the subsequent sevenyears. Although this may be due in part to the time-difference in the two periods, suchcontrast is also borne out in the estimate ofannualforest loss, which was 1.6 timeshigher in the former period.
A revealing view of the deforestation process in Lacandonia is gained by consid-ering the original forest coverage, i.e., when all analysed quadrats were completelyforested. Of the initial 95,000 ha (not considering the minor fraction covered bybodies of water), only 13% was lost by 1974. That is, the proportional amount offorest lost from the last century (or centuries) to the early seventies is lower than that

1628
Table 1. Estimates of forest area and loss for the accumulatedarea of the 38 quadrats studied in Lacandonia, Mexico.
Estimatedforest area Lost area Lost area Annual loss
Year (ha) (ha) (%) (ha)
Potential 95,000 – – –12,562 13.22
1974 82,43814,121 17.13 1412
1984 68,3175206 7.62 744
1991 63,111
lost between 1974 and 1984, indicating that a major pulse of deforestation occurred inthe decades of the sixties and seventies. In general terms, the original forest coverageof all sampled quadrats has been reduced by approximately 34% currently, with themost accelerated pace occurring during the last third of this century.
The average estimated areas of forest coverage in the quadrats and their corres-ponding 95% confidence intervals were used to extrapolate forest coverage remainingin the entire study zone. We calculated areas of 694,218± 33,000 ha in 1974, and531,453± 55,600 ha in 1991. The values can be used to estimate conservative andworst-case magnitudes of absolute forest loss in the zone in the last 17 years. Thesewould be, respectively: 74,165 ha (i.e., [1974 average+ 33,000]− [1991 average− 55,600]) and 251,365 ha (i.e., [1974 average− 33,000]− [1991 average+ 55,600]).
Spatial variation in deforestation
Rates of deforestation varied considerably among quadrats. Figure 2 depicts threerepresentative examples of such spatial variation. Figure 2A shows a case of lowdeforestation with almost imperceptible changes in forest cover (2%); Figure 2Billustrates a case where, although forest conversion is already evident in 1974, theremaining coverage in 1991 is 64% of that in 1974, giving an intermediate deforesta-tion rate. Finally, Figure 2C shows a typical situation of high deforestation in the area,in this case forest coverage was reduced by 80% in a period of 17 years. Our ground-truthing work and further analysis of the images indicate that the spatial variationin deforestation depicted in Figure 2 reflect that conversion to grassland for cattleranching is the predominant use, followed by conversion to secondary vegetation inabandoned agricultural lands.
The analysis of the data for each of the two survey periods separately yields astrikingly similar pattern of spatial variation (Figure 3). In both cases the frequencydistribution of deforestation rates produced a non-normal pattern, with a markedpositive skew (1.3 and 1.9; first and second periods, respectively) and a highcoefficient of variation (116 and 125%, respectively). In the first period (Figure 3A)

1629
Figure 2. Examples of the variation in deforestation in three representative quadrats within Lacandonia.Each pair of images corresponds to forest coverage in 1974 (left panels) and 1991 (right panels). (A) Lowdeforestation; (B) Intermediate deforestation and (C) High deforestation. Prominant localities and rivers(R) or lagoons (L) are indicated. The numbers in the upper left and lower right angles indicate the quadrat’sUTM coordinates. For details see text.

1630
Figure 3. Frequency-distribution of the rates of deforestation in the 38 5× 5 randomly sampled quadratsin Lacandonia, in the two study periods: (A) 1974–1984; (B) 1984–1991.
the range of variation in deforestation rates was 0 to 8.1%/year, with an average of2.1. However there was a predominance of values around 1%, and about 11% ofthe cases had no detectable deforestation. The first three lowest classes account for

1631
ca. 70% of the instances. The three largest classes of deforestation, although of lowfrequency, included rates of very high score (5.2 to 8.15%/year). A pooled categoryof intermediate levels of deforestation (2.1 to 5%) had a cumulative frequency of ca.30%. In the latter period (Figure 3B) values ranged from 0 to 7.9%, with an average of1.6 and, again, with a modal representation of values around 1%. Deforestation wasnil in 8% of the cases, and the classes with the three lowest scores accounted for over80% of the total. Again, the highest rates of deforestation were of low frequency,but included scores that went beyond 6%/year. Intermediate values, in this period,were poorly represented. Although the average rate was slightly higher in the firstperiod, the median values are the same (1.0) and statistical comparisons do not revealsignificant differences (U-test of ranks,P = 0.603). Nevertheless, even if the rates ofdeforestation show a statistically indistinguishable pattern between the periods, theabsolute deforestation was markedly higher in the first period.
The most distinguishable aspect of the spatial heterogeneity in the area was thepresence of the Montes Azules Biosphere Reserve. Figure 1 shows that 11 quadratsare located within the reserve and 21 are located outside. In addition, 6 quadrats canbe considered as located on the reserve’s limits. We compared the rates of deforest-ation among these three sectors of the area. In both periods, Kruskal–Wallis testsrevealed the existence of statistical significant variation in the rates of deforestationamong sectors (Figure 4) (P < 0.0001, χ2 = 20.90, DF = 3 for 1974–1984 andP = 0.0035, χ2 = 5.99, DF= 3 for 1974–1984; tests corrected for unequal samplesizes and tied ranks). A post hoc test (Tukey-type) showed that differences were dueto the considerable lower values of deforestation rates inside the reserve for bothperiods. In the first period (Figure 4A), values for the quadrats within the reserveranged from 0 to 0.56%/year, with an average of 0.14. Outside the reserve the rangewas 0.16 to 7.9, with an average value, 2.79%, 20-times larger than within. Verysimilar results were obtained in the second period (Figure 4B), although the contrastwithin–outside was not as large (a 6-fold difference). Interestingly, quadrats locatedat the reserve’s limits (border) had values which were higher than, but statisticallyindistinguishable from those of the quadrats outside (averages = 3.82 and 2.23% inthe first and second periods, respectively).
Relationships with human population density and slope
Human population density did not show a significant relationship with deforestationrates in the period 1974–1984, considering either the restricted (regression ANOVA,F = 2.70;P = 0.1090) or the broad (F = 3.33;P = 0.076) ranges of populationdensity. In contrast, in the second period (Figure 5) a significant positive relationshipwas detected in both the restricted range (F = 14.12;P = 0.0006) and in thebroad range (F = 6.94, P = 0.0123). Nevertheless, in both cases the proportion ofexplained variation in deforestation by local population size was relatively low: 28%

1632
Figure 4. Average rates of deforestation (±SE) within, outside and at the border of the Montes AzulesBiosphere Reserve in the two periods of study: (A) 1974–1984; (B) 1984–1991. Different letters indicatestatistically significant differences (Tukey-type post hoc test).

1633
Figure 5. Relationship between population density and deforestation rate in Lacandonia, in the period1984–1991. The figure shows the relationship of deforestation with population density in the restrictedrange (A) and the broad range (B). See text for details.
in the restricted analysis and only 15% in the broad analysis. Thus, human populationdensity seemed to play a limited role in explaining the variation in deforestation rates.
The regression analyses between slope estimators and rates of deforestationshowed a statistically significant relationship (ANOVA,F = 5.25, P = 0.0277)only for the 1974–1984 period, using the average slope of quadrats. However, theproportion of explained variance was very low (r2 = 0.127). Moreover, the re-lationship was again very poor and marginally significant using the median slope(F = 4.05, P = 0.0518). None of the relationships for the 1984 to1991 period werestatistically significant (F = 0.84, P = 0.3641;F = 0.0032, P = 0.9556 andF = 0.38, P = 0.5423 for the average, modal and median slopes, respectively).

1634
Thus it appears that the topography of terrain does not play a determining role on thedeforestation rates of the zone.
Scenarios of plant species loss
Assuming that the most recent average rate of deforestation calculated (1.6%/year)remains constant after 1991, the time-course of plant species committed to localextinction according to the species-area relationship of the island biogeographymodel,would show a pattern like the one depicted in Figure 6. The calculated proportionalloss of plant species is shown for time-points when the forest is reduced to 75, 50, 25and 10% of its 1991 area, when the number of species expected to exist in the area is4314. The increment in species committed to extinction at equilibrium is, as would beexpected, sharper in the simulation when thezcoefficient is set at 0.35. Nevertheless,even with the slope of 0.15, predicted species loss is quite significant, reaching∼ 10%by the year 2035 and 29% by the year 2135. When forest area is reduced to 10% of its1991 size (year 2135) and the slope is 0.35, about 55% of Lacandonia’s plant specieswould be committed to extinction. Such final proportional loss would be equivalentto reducing the known flora from 4314 to 1925 species, or to a committed rate of lossof about 17 species per year.
Figure 6. The predicted plant species loss as a function of deforestation in Lacandonia, on the basis of thespecies-area relationship (S = cAz). Forest remaining area in Lacandonia (#) was estimated assumingthat average deforestation rate (1.6%/year) remains constant. The time-course of predicted species loss isshown under two values of thezexponent ( = 0.15,� = 0.35) of the species–area model.

1635
Discussion
An extrapolation from our calculated average of forest area remaining in 1974 and1991 permits an estimate of some 163,000 ha lost in the whole of the Mexican side ofLacandonia, equivalent to approximately 23% of the original area. This is a significantreduction, particularly considering that about two thirds of the original 1.5 millionha of Mexican Lacandonia had been lost prior to 1974 (Calleros and Bauer 1984).The predominant conversion activity noted in the area is extensive cattle grazing.Indeed, Chiapas was the second state of Mexico with the largest number of cattle inthe 1970–1990 period (World Bank 1995).
The calculated average rates of deforestation for Lacandonia (2.13%/year for 1974and 1.6%/year for 1984–1991) are larger than those reported for the closed forests ofthe country, 1.29%, and close to those of the collective evergreen tropical forests ofMexico, 2.0% (Masera et al. 1997). Rates of deforestation in Lacandonia are lowerthan those reported in the Los Tuxtlas region of Southern Veracruz (2.1 vs. 4.3%/yearin an equivalent period) (Dirzo and García 1992). Nevertheless, in terms of absolutearea, deforestation in Lacandonia was considerably higher (7500 vs. 118,920 ha) inthe same period corresponding, on an average, to an annual area loss 16 times higher.This underscores the importance of addressing policies to curb the deforestationtendencies in Lacandonia.
The observed reduction in absolute deforestation for the latter period of this studymay not necessarily imply an encouraging situation. It is possible this reflects thatthe areas most susceptible to undergo deforestation have already succumbed andthose remaining are the least accessible (see Lambin 1997) both physically (e.g.,remote, isolated) and administratively, such as the Montes Azules Biosphere Reserve.Nevertheless, if present trends of deforestation continue, conversion pressure mightshift into the protected area. This could be exacerbated by the fact that some 9000inhabitants are settled within the limits of the reserve. In this regard, it was of interestto confirm that in both periods deforestation rates were 20- and 6-times lower withinthe reserve. Average deforestation rates for Lacandonia, omitting the values of the re-serve, are 3.31 and 2.14%/year for each of the two periods – substantially higher thanthe overall calculated values. It would appear that since its decree, in 1978, the reservehas played a significant role in diminishing the deforestation process in Lacandonia.
A superficial analysis indicates that in addition to the spatial variation in defor-estation accounted for the biosphere reserve, the presence of roads and rivers mayalso play some role in such variation. For example, of the seven quadrats associ-ated with major roads (i.e., quadrats 5, 10, 11, 27, 30, 31, 38, see Figure 1), sixpresented deforestation rates which were, at least in one of the two periods, abovethe median value for their respective period. Four of these had deforestation ratesabove 3.35%/year. Moreover, three of these sites had deforestation rates greater than6%/year. The importance of roads as a determining factor of habitat destruction wasquite evident in an analysis of deforestation in Costa Rica (Sader and Joyce 1988;

1636
Mertens and Lambin 1997). It is of interest that in the first period the two largestvalues of the deforestation rate corresponded to two sites (24 and 25) which werelocated in direct relation to the Lacantún river which was, at that time, the majormeans of local/regional communication. Nevertheless the association between riversand deforestation does not appear to show much consistency throughout the zone.
It was expected that proximal factors such as terrain slope and population densitycould explain a significant portion of the spatial variation in deforestation. Whilethe effect of slope is evident in other tropical deforestation studies (Green and Suss-man 1990; Dirzo and García 1992), this appeared to be of negligible importance inthe present study. It was surprising that the relationship between human populationdensity and deforestation was significant in only the second period, and with a lowproportion of explained variance. On the one hand substantial deforestation is associ-ated to some areas of Lacandonia where human settlement is of long permanence anddensity. For example, the region of Las Cañadas (quadrats 8, 18, 19, 20, 21, 22, 23, 30,34, 35, 36, 37 and 38 to the west of the reserve, Figure 1), densely colonised for a longtime, shows a considerable reduction of its forest coverage (see also Ortíz-Espejel andToledo 1998). This is reflected in the fact that in the mid 1970s the quadrats locatedin this region had forest coverage significantly lower than within the reserve (U -test,P = 0.0005). On the other hand, population nuclei have been found to bring aboutdeforestation in other studies (Green and Sussman 1990; Harrison 1991). The lack ofrelationship in the first period may reflect that population density during the decadesof the sixties and seventies was low in general. However our findings and those ofother studies (see Masera et al. 1997) indicate that it may be unwarranted to usehuman demographic information to predict deforestation and to imply causality (seeSkole et al. 1994). Ultimately the causes of deforestation are rooted in inappropriatesocio-economic strategies and policy factors that have promoted the extensive cattleranching of the zone (Mendoza 1997).
Deforestation leading to habitat destruction has been considered a major drivingforce for the extinction of species and populations (Reid and Miller 1989; Whitmoreand Sayer 1992). An approach used to assess such relationships has been the useof the species-area relationship proposed by MacArthur and Wilson (1967). Ourapplication of such an approach to model plant species loss, given the most recentaverage rate of deforestation, leads to expectations of as much as 29 or 55% ofthe floristic contingent of Lacandonia being committed to extinction by year 2135.While such applications are useful in providing potential scenarios of extinction,several caveats have to be borne in mind. First, there is the uncertainty that a modeldevised for oceanic islands should be readily applicable to terrestrial ‘islands’ whereconnectivity is more feasible and may buffer against extinction. Secondly, theuse of the average deforestation rate throughout the simulation period may be un-realistic if, with time, deforestation rates change. In particular, as remaining forestedareas are reduced, deforestation rates may also decrease (Reid 1992). Thirdly, po-tential extinctions can be overestimates since the model ignores the possibility that

1637
some species may thrive in altered areas resulting from forest conversion (Lugoet al. 1993). Also, it ignores the fact that the dispersal ability of some species mayhave the effect of reducing the value of thez coefficient. On the other hand, severalconsiderations argue that extinction scenarios like the ones presented here may beconservative. Species extinction may come about or may be exacerbated for reasonsother than area reduction (Wilson 1992) such as: over exploitation (orchids, palmsand precious timbers are all real-life examples in Lacandonia), disease, and loss ofecological interactions (Dirzo et al. 1995, see a review in Phillips 1997). Some recentstudies provide evidence in support of the contention that deforestation may haveprofound consequences on extinction of birds (e.g., Brooks et al. 1997). In summary,our predicted scenarios suggest the potential for a significant pulse of plant speciescommitted to local extinction in this zone (but see Turner et al. 1994).
The significance of Lacandonia’s rates of deforestation in relation to its potentialspecies or population loss can be seen in the light of recent information regardingthe biological diversity of this forest. The most popularized biological aspect of thisforest in the last few years has been the revolutionary discovery of a new Angiospermfamily, Lacandoniaceae (Martínez and Ramos 1989). The type species,Lacandoniaschismatica, has a number of truly remarkable features (see also Márquez-Guzmánet al. 1989) including that it is only known from two populations of Lacandonia, andeach population is composed of a few individuals – a truly rare taxon evolutionarilyand ecogeographically speaking. This discovery has drawn the attention of conser-vation biologists and biological inventories for some groups have been advanced,highlighting the biodiversity of this zone. As an example, data for species richnessin five groups of organisms and the total for Mexico are given in Table 2. Fishes,followed by amphibians and reptiles are the taxa with the least proportional diversityin relation to the whole country. The rest of the groups are outstanding, approachingor surpassing 20% of the country’s total known, with butterflies having the highestrepresentation. The overall relative representation of ca. 20% is clearly above theexpected, given that the area encompasses only 4% of the country. Considering thelatitudinal position of the area (approaching the northernmost limit of the distributionof tropical rain forest on the continent) these numbers are noteworthy. Moreover,the distributional aspect brings up an additional relevant facet to the biodiversity ofthis forest. Lacandonia is the extreme point of boreal expansion of many taxa ofEquatorial and Antillean affinity and it is likely that some of these taxa will be repres-ented here by local populations distinct from their more southern counterparts. To ourknowledge no genetic studies have been made to compare these marginal populations,but the mere phenotypic appearance of some species (e.g.,Brosimum alicastrum,Terminalia amazonia, among plants), which contrasts with that of more southernpopulations (R. Dirzo, pers. obs.), may be indicative of population differentiation(see Hamrick et al. 1992; Hall et al. 1994).
In summary, the remarkable biodiversity features of this region, and the currentmagnitude and trends of deforestation described here, designate Lacandonia as the

1638
Table 2. Numbers of species in six groups of organisms in Lacandonia, and their relativerepresentation with respect to the total known of species in those groups for Mexico.
Lacandonia Mexico RelativeGroup of organisms (No. of species) (No. of species) representation (%)
Angiosperms 4314 22,800 18.9Mammals 112 439 25.5Birds 300b 1007c 29.8Butterflies 800d 2237e 36.0Fish 40 384f 10.4Amphibians & reptiles 109b 978g 11.1
Total 5675 27,845 20.4
Sources:(a) Martınez et al. (1994); (b) Medellın (1991); (c) Escalante et al. (1993); (d) De laMaza and De la Maza (1991); (e) Mittermier et al. (1998); (f) Espinoza-Perez et al. (1993); (g)Flores-Villela (1993).
northernmost hot-spot of tropical biological diversity. Further studies on biodiversity,conservation and the application of ecological principles directed to responsible man-agement practices in the area are imperative.
Acknowledgements
This study was carried out with support from the Pew Scholars Program in Conser-vation and the Environment (RD), Conservation International-Mexico (EMR) and agrant from DGAPA-UNAM and CONACyT to RD while on sabbatical at NorthernArizona University. Comments on an earlier draft by Lourdes Rico, Justin Moat,Omar Masera, Alvaro Miranda, Valentino Sorani and Ana Goodman-Novak helpedto improve this paper. Valentino Sorani supervised the work with the satellite images,using facilities provided by the Instituto de Geografía-UNAM.
References
Begon M, Harper JL and Towsend CR (1990) Ecology: Individuals, Populations and Communities.Blackwell Scientific Publications, London
Brooks TM, Pimm SL and Collar NJ (1996) Deforestation predicts the number of threatened birds ininsular Southeast Asia. Conserv. Biol. 11: 382–394
Calleros G and Brauer FA (1983) Problemática regional de la Selva Lacandona. Chiapas, México:Dirección General de Desarrollo Forestal, Coordinación Ejecutiva del Programa Ecológico de la SelvaLacandona, Mexico, Secretaría de Agricultura y Recursos Hidráulicos
Connor EF and McCoy ED (1979) The statistics and biology of the species-area relationship. Am. Nat.113: 791–833
De la Maza J and De la Maza R (1991) El ‘Monte Alto’: esbozo de una región. In: Lacandonia, el últimorefugio, pp 21–35. Agrupación Sierra Madre-UNAM, Mexico
Dirzo R (1991) La Vegetación, Exhuberancia Milenaria. In: Lacandonia, el último refugio, pp 52–74.Agrupación Sierra Madre-UNAM, Mexico

1639
Dirzo R (1994) Diversidad de la flora mexicana. Agrupación Sierra Madre, MexicoDirzo R, Naeem S and Cushman JH (1995) Biotic linkages and species interaction In: Heywood VH and
Watson RT (eds) Global Biodiversity Assessment, pp 341–342. UNEP, Cambridge University Press,Cambridge
Dirzo R and García MC (1992) Rates of deforestation in Los Tuxtlas, a neotropical area in southeastMexico. Conserv. Biol. 6: 84–90
Dirzo R and Miranda A (1992) Altered patterns of herbivory and diversity in the forest understory: acase study of the possible consequences of contemporary defaunation. In: Price PW, Lewinsohn TM,Fernandes GW and Benson WW (eds) Plant–Animal Interactions: Evolutionary Ecology in Tropicaland Temperate Regions, pp 273–287. Wiley, New York
Dixon RK, Brown S, Huton RA, Solomon AM, Trexler MC and Wisniewski J (1994) Carbon pools andflux of global forest ecosystems. Science 263: 185–90
Escalante P, Navarro A and Towsend A (1993) A geographical, ecological, and historical analysis of landbird diversity in Mexico. In: Ramamoorty TP, Bye R, Lot A and Fa J (eds) Biological Diversity ofMexico: Origins and Distribution, pp 281–307. Oxford University Press, New York
Espinosa-Pérez H, Fuentes-Mata P, Gaspar-Dillanes MT and Arenas V (1993) Notes on Mexicanichtyofauna. In: Ramamoorty TP, Bye R, Lot A and Fa J (eds) Biological Diversity of Mexico: Originsand Distribution, pp 229–51. Oxford University Press, New York
Flores-Villela O (1993) Herpetofauna of Mexico: distribution and endemism. In: Ramamoorty TP, ByeR, Lot A and Fa J (eds) Biological Diversity of Mexico: Origins and Distribution, pp 253–280. OxfordUniversity Press, New York
Gómez-Pompa A and Dirzo R (1995) Atlas de las áreas naturales protegidas de México. CONABIO-INE,Mexico City
Green MG and Sussman RW (1990) Deforestation history of the eastern rain forest of Madagascar fromsatellite images. Science 248: 212–215
Hall P, Chase MR and Bawa KS (1994) Low genetic variation but high population differentiation in acommon tropical forest tree species. Conserv. Biol. 8: 471–482
Hamrick JL, Godt MJW and Sherman-Broyles SL (1992) Factors influencing levels of genetic diversity inwoody plant species. New For. 6: 95–124
Harrison S (1991) Population growth, land use and deforestation in Costa Rica, 1950–1984. Interciencia16: 83–93
Henderson-Sellers A, Dixon RE, Durbidge TB, Kennedy PJ, McGuffie K and Pitman AJ (1993) Tropicaldeforestation: modelling local to regional scale climate change. J. Geophys. Res. 98: 7289–7315
Heywood V and Watson R (eds) (1995) Global Biodiversity Assessment. UNEP, Cambridge UniversityPress, Cambridge
INEGI (1971) Chiapas, Resultados Definitivos, Datos por Localidad (Integración Territorial) Tomo I, XICenso General de Población y Vivienda 1970. INEGI, Mexico City
INEGI (1991) Chiapas, Resultados Definitivos, Datos por Localidad (Integración Territorial) Tomo I, XICenso General de Población y Vivienda 1990. INEGI, Mexico City
IPCC (1992) Climate Change 1992: The Supplementary Report to the IPCC Scientific Assessment.Cambridge University Press, Melbourne, Australia
Lambin EF (1997) Modelling and monitoring land-cover change processes in tropical regions. Progressin Physical Geography 21: 375–393
Laurance WF and Bierregaard RO, Jr. (1997) Preface: a crisis in the making. In: Laurance WF andBierregaard RO, Jr. (eds) Tropical Forest Remnants: Ecology, Management, and Conservation ofFragmented Communities, pp xi–xv. University of Chicago Press, Chicago, IL
Lugo AE, Parrota JA and Brown S (1993) Loss in species caused by tropical deforestation and recoverythrough management. Ambio 22: 106–109
MacArthur RH and Wilson EO (1967) The Theory of Island Biogeography. Princeton University Press,Princeton, NJ
Márquez-Guzmán J, Engleman M, Martínez-Mena A, Martínez E and Ramos C (1989) Anatomíareproductiva de Lacandonia schismatica (Lacandoniaceae). Ann. Missouri. Bot. Gard. 76: 124–127
Martínez E and Ramos C (1989) Lacandoniaceae (Triuridales): Una nueva familia de Mexico. Ann.Missouri. Bot. Gard. 76: 128–135

1640
Martínez E, Ramos CH and Chiang F (1994) Lista florística de la Lacandona, Chiapas. Bol. Soc. Bot.Méx. 54: 99–177
Masera OR, Ordoñez MJy and Dirzo R (1997) Carbon emissions from Mexican forests: current situationand long-term scenarios. Climatic Change 35: 265–295
Medellín R (1991) La Fauna: diversidad de los vertebrados. In: Lacandonia, el último refugio,pp 75–109. Sierra Madre-UNAM, México
Meffe GK and Carroll CR (1997) Principles of Conservation Biology. Sinauer Associates, Sunderland,MA
Mendoza E (1997) Análisis de la deforestación de la Selva Lacandona: patrones, magnitud yconsecuencias. B.Sc. Thesis. Facultad de Ciencias, Universidad Nacional Autónoma de México, México
Mertens B and Lambin EF (1997) Spatial modelling of deforestation in southern Cameroon. AppliedGeography 17: 143–162
Mittermeier RA and Mittermier C (1992) La importancia de la diversidad biológica de México. In:Sarukhán J and Dirzo R (eds) Mexico frente a los retos de la biodiversidad, pp 63–73. CONABIO,Mexico City
Mittermeier R, Robles-Gil P and Mittermeier C (1998) Megadiversidad. CEMEX, Mexico CityMyers N (1990) The biodiversity challenge: expanded hot-spot analysis. Environmentalist 10: 243–256Myers N (1993) Tropical forests: the main deforestation fronts. Environ. Conserv. 20: 9–16Nobre CA, Sellers PJ and Shukla J (1991) Amazonian deforestation and regional climate change.
J. Climate 4: 957–988Orians GH, Dirzo R, Cushman JH, Medina E and Wright SJ (1995) Tropical Forest Biodiversity and
Ecosystem Functioning. In: Watson RT and Heywood VH (eds) Global Biodiversity Assessment,pp 339–345. Cambridge University Press, Cambridge
Ortiz-Espejel B and Toledo VM (1998) Tendencias en la deforestación de la Selva Lacandona (Chiapas,México): el caso de las Cañadas. Interciencia 23: 318–327
Phillips OL (1997) The changing ecology of tropical forests. Biodiv. Conser. 6: 291–311Ramamoorthy TP, Bye R, Lot A and Fa J (eds) (1993) Biological Diversity of Mexico: Origins and
Distribution. Oxford University Press, New YorkRaven PH (1992) Floristic diversity of the planet and its importance for human well-being. In: Sarukhán
J and Dirzo R (eds) Mexico frente a los retos de la biodiversidad, pp 81–89. CONABIO, Mexico CityReid WV (1992) How many species will be there? In: Whitmore TC and Sayer JA (eds) Tropical
Deforestation and Species Extinction, pp 55–73. Chapman & Hall, LondonReid WV and Miller KR (1989) Keeping Options Alive: The Scientific Basis for Conserving Biodiversity.
World Resources Institute, Washington, DCSader SA and Joyce AT (1988) Deforestation rates and trends in Costa Rica, 1940 to 1983. Biotropica
20: 11–19SARH (1994) Inventario Nacional Forestal Periodico Mexico 1994. Subsecretaria Forestal y de Fauna
Silvestre. SARH, Mexico CitySimberloff D (1992) Do species-area curves predict extinction in fragmentated forest? In: Whitmore TC
and Sayer JA (eds) Tropical Deforestation and Species Extinction, pp 75–89. Chapman & Hall, LondonSkole D and Tucker C (1993) Tropical deforestation and habitat fragmentation in the Amazon: satellite
data from 1978 to 1988. Science 260: 1905–1910Skole DL, Chomentowsky WH, Salas WA and Nobre AD (1994) Physical and human dimensions of
deforestation in Amazonia. Bioscience 44: 314–322Trexler MC and Haugen CA (1993) Keeping it green: using tropical forest to mitigate global warming.
World Resources Institute, Washington, DCTurner IM, Tan HTW, Wee YC, Ibrahim AB, Chew PT and Corlett RT (1994) A study of plant species
extinction in Singapore: lessons for the conservation of tropical biodiversity. Conserv. Biol. 8: 705–712US Army Construction Engineering Research Laboratories (1993) Geographical Resources Analysis
Support Systems (GRASS) Ver. 4.1Vásquez-Sánchez MA, March IJ and Lazcano-Barrero MA (1992) Características socioeconómicas de la
Selva Lacandona. In: Vásquez-Sánchez MA and Ramos MA (eds) Reserva de la biósfera de MontesAzules, Selva Lacandona: investigación para su conservación, pp 287–323. Ecósfera, Mexico

1641
Whitmore TC (1997) Tropical forests disturbance, disappearance, and species loss. In: Laurance WFand Bierregaard RO Jr. (eds) Tropical Forest Remnants: Ecology, Management, and Conservation ofFragmented Communities, pp 3–12. University of Chicago Press, Chicago, IL
Whitmore TC and Sayer JA (1992) Deforestation and species extinction in tropical moist forests. In:Whitmore TC and Sayer JA (eds) Tropical Deforestation and Species Extinction, pp 1–14. Chapman &Hall, London
Wilson EO (1988) Threats to biodiversity. Sci. Am. 261: 108–116Wilson EO (1992) The Diversity of Life. Norton and Co, New YorkWorld Bank (1995) Mexico, resource conservation and forest sector review. Natural resources and rural
poverty operations division, Country Department II, Latin America and the Caribbean Regional Office.Washington, DC


