Embed Size (px)
Citation preview
0
Deconstructing Nepotism
Sheheryar Banuri, Catherine Eckel, & Rick Wilson1
Abstract
We present a laboratory experiment to test the strength of two motives for engaging in nepotism:
beliefs and favoritism. Using real-world groups, nepotism is introduced by allowing partner
selection in the trust game. The design varies: (1) the productivity of group members and (2) the
ability to select partners. We find beliefs to be the predominant motive, while favoritism plays a
role when group members are equally productive. Partnering with group members is always
profitable, except when group members are less productive and partner selection is unavailable.
These results help explain why nepotism persists.
Keywords: Nepotism, Corruption, Group Identity, Discrimination, Trust, Reciprocity
JEL Classification Codes: C92, D73, M51
1 Banuri: Development Economics Research Group, World Bank, 1818 H St NW, MC 3-356, Washington, DC,
20433 (e-mail: [email protected]); Eckel: Department of Economics, Texas A&M University, 4228 TAMU,
College Station, TX, 77845 (e-mail: [email protected]); Wilson: Department of Political Science, Rice
University, MS 24, Houston, TX, 77251 (e-mail: [email protected]). The authors have no relevant or material financial
interests that relate to the research described in this paper. The findings, interpretations, and conclusions expressed
in this paper are entirely those of the authors and do not necessarily represent the views of the World Bank, its
Executive Directors, or the countries they represent. We are indebted to Klaus Abbink, Rachel Croson, Sherry Xin
Li, Angela de Oliveira, Ngoc Phan and participants of the EITM summer school at Washington University-St.
Louis, NSF Conference on Politics Experiments at the University of Virginia, the NYU Experimental Political
Science Conference, and the Economic Science Association meetings in Tucson, AZ. Funding was provided by the
National Science Foundation (NSF SES-0921884). Any errors remain our own.
1
“Better to dance with the devil you know than the angel you don’t.” – English proverb
INTRODUCTION
Consider a manager who is in a position to hire one of two possible candidates, with
identical levels of skill. One candidate has social ties to the manager, while the other candidate
is a random individual from the general population. Which candidate will the manager select for
the position? Will his answer be the same if the candidate with social ties has a lower level of
skill? If the manager chooses the candidate with social ties, this can be considered nepotism, an
act that, depending on the organization and context, is either illegal or frowned upon in most of
the world.2 Virtually every country has some form of anti-nepotism rules on its books.
Nepotism is widely regarded as inefficient and discriminatory, and yet is a pervasive aspect of
corruption that plagues many developing countries. However, there is little agreement about the
motives for nepotism, nor about the effectiveness of mechanisms for addressing the problem of
nepotism.
From the perspective of traditional economic theory, nepotism can only reduce profit,
since restricting employment choices to a favored group yields a less qualified candidate, on
average, than an open, full search (Becker 1971). Current empirical research also supports the
notion that nepotism is damaging for firm profitability (Bennedsen et al. 2007, Perez-Gonzalez
2006), and damages the efficiency of government policies (e.g. Tangri and Mwenda 2001).
Despite its impact on performance and efficiency, nepotism persists.
Two motives have been offered for engaging in nepotism. One motive is based on the
claim that nepotism is rewarded: members of the same group are expected to work harder,
thereby reciprocating the trust placed in them by the employment opportunity (McConaugby, et
al., 2001, Kets de Vries 1993, Alexander 1974, Davis et al 1997, Donaldson and Davis 1991). A
second motive is the desire to confer benefits on group members by engaging in nepotism in
hiring (Vanhanen 1999, Sidanius et al. 2001, Brewer 1979, Brewer 1999, Brandts and Sola 2010,
Belot and van de Ven 2011). While both motives are plausible, it has been difficult to determine
2 Note that we define nepotism in a broader framework than simply kin-based relationships. Nepotism is defined
as “discrimination in favor” of a group member relative to the population (Fershtman et al. 2005, Becker 1971). This
is divergent from traditional biological definitions of nepotism, which stress kin-based relationships..
2
the relative contribution of each in determining nepotism. This is due, in part, to the inherent
difficulty of observing motives underlying nepotism in the field.
We employ a laboratory experiment in order to investigate the motivation for engaging in
nepotistic behavior and the effect of rules that forbid nepotism. Specifically, we use experiments
to test whether the ability to engage in nepotism by selecting a partner in a two-person
„investment game,‟ also known as the trust game (Berg et al.1995) affects individual behavior,
and we collect additional information that allows us to test the impact of these two motives. We
adapt the game in two ways. First, we give the first mover the ability to choose between a fellow
group member or a member of the general population as a partner. Second, we vary the
productivity of group members is varied (by design) relative to non-members. We compare one
set of treatments where first movers can choose their partners to a parallel set where this choice
mechanism is removed. This mimics an anti-nepotism rule that forbids discrimination on the
basis of group membership.
We address three central questions. First, why do individuals engage in nepotism,
especially when it is costly to them: Is it a strategic choice based on expectations of reciprocity
(beliefs), or is it out of concern for the wellbeing of the group (favoritism)? Second, what is the
effect of implementing an anti-nepotism law on trust and reciprocity? And finally, is engaging in
nepotism profitable?
We find that individuals engage in nepotism because of beliefs. Favoritism plays a role
when nepotism is “free” (i.e., fellow group members are as productive as others in the
population). However, when nepotism is “costly” (i.e., group members are less productive);
favoritism is not a significant factor. Within groups, the introduction of an anti-nepotism rule
has no impact on trust, but lowers reciprocity when nepotism is costly. We find that engaging in
nepotism is always profitable, except when group members are less productive, and an anti-
nepotism rule is in effect. For “nepotists,” (i.e. individuals that choose group members as
partners) introducing costs to nepotism has no impact on their earnings. These results help to
explain why nepotism persists, and the conditions under which it is beneficial to engage in
nepotism. In the next section we discuss related literature, section III presents hypotheses, and
section IV presents the experimental design. Section V provides experimental procedures, and
section VI presents the results of our study. Section VII concludes and discusses some policy
implications as a result of this study.
3
RELATED RESEARCH
Observational studies on corruption document its association with lower levels of overall
well-being in developing countries, and pose a significant challenge to the legitimacy of political
institutions (Johnston 2005). Furthermore, evidence shows there is a detrimental impact of
corruption on economic growth (Mauro 1995, Tanzi and Davoodi 2002; see alsoTreisman 2000),
income inequality (Gupta et al. 2002, You and Khagram 2005), private investment (Knack and
Keefer 1995, Lambsdorff 2003), public investment (Mauro 1998, Shleifer and Vishny 1993,
Gupta et al. 2001), poverty (Gupta et al. 2002, Krishna 2007), as well as a negative impact on a
battery of “good” societal outcome variables such as health and education (Holmberg et al.
2009). The key finding that has emerged indicates that corruption is detrimental to development.
Corruption has many manifestations, including bribery, extortion, patronage, malfeasance, and
nepotism. Here we focus exclusively on nepotism, leaving aside other aspects of corruption.
At the macro level nepotism is shown to be an important element of corruption (Nye
1967, Robertson-Snape 1999, Treisman 2000). Several studies on nepotism confirm that it leads
to inefficient outcomes. For example, in a study of the emergence of liberal democracy in Africa
following the demise of colonialism, Fatton (1990) argues that the newly-established
governments are likely to fall back on traditional ethnic divisions, intensifying competition for
scarce resources. This leads to inefficient, nepotistic allocations of jobs and resources based on
ethnicity rather than merit.3 Englebert (2000) makes a similar argument, noting that in countries
where colonial institutions conflict with historical (formal or informal) institutions, reversion to
ethnicity-based resource allocation decisions is more likely, again yielding inefficient outcomes.4
3 For example, Sun (1999) argues that the key difference between corruption in China and Russia is that of
nepotism. In Russia, instability in the political and economic regimes allowed the mafia to take control of a large
sector of the economy. In-group favoritism among the mafia served to increase barriers to entry, especially for
small entrepreneurs. By contrast, China‟s political stability allowed corruption to thrive, but was more efficient in
that it provided economic opportunities to the highest bidder. Thus, in both cases, economic growth suffered, but
the Russians formulated policies to satisfy certain groups, rather than promoting development and growth. Thus,
economic growth declined in Russia but increased in China. 4 A number of studies examine the impact of nepotism on policy decisions: Johnson and Mitton (2003) show that,
during the Asian financial crisis, firms with strong ties to the ruling regime in Malaysia were more likely to receive
bailouts and subsidies. Robertson-Snape (1999) argues that the Suharto regime in Indonesia set import quotas to
provide monopoly power to Panca Holdings, whose main beneficiaries were Suharto‟s family. In a cross-national
study Faccio (2006) examines the relationship between the political connections of firms and policy decisions. The
presence of politicians on corporate boards has no consistent positive effect on company valuation, but firm
valuation increases when a businessman enters high-level politics, indicating the possibility of future benefits from
the appointment. Overall, these studies point to welfare-reducing influence of nepotism on government policy.
4
Nepotism also is a widespread phenomenon within professional groups. To name two
examples, Lentz and Laband (1989) show that children of doctors are 14 percent more likely to
be admitted to medical school than are comparable other candidates,5 and Singell and Thornton
(1997) find that many dairy farmers in Utah regularly make hiring decisions based on family and
group ties, and that these farms underperform when compared with farmers that do not.
Similarly, Brick et al. (2005) find that excess compensation of boards of directors, which they
interpret as evidence of cronyism, predicts future firm underperformance.
Why does nepotism persist if it is welfare-reducing? There are two dominant
explanations:
Beliefs. The first is based on the belief that nepotism is profitable because of the superior
performance of group members, leading to greater expected payoffs. This belief can have two
main sources. Most obvious is the belief that group members are in fact more capable, on
average, than those outside the group. In this sense this is a statistically-based form of
discrimination. But superior capability is not necessary for a belief-based motivation: the belief
that productivity will be higher can arise from the enhanced ability to monitor a fellow group
member. Here social ties can substitute for incomplete contracts or weak legal institutions.6
Fearon and Laitin (1996) point out three factors that enhance trust and cooperation within
groups: greater information regarding other members of the group, individual reputations that are
sustainable and credible, and the availability of sanctions from within the group when defection
is observed. All of these factors serve to enhance productivity and reciprocity. Even if fellow
group members are less capable, they may be more likely to engage in reciprocal behavior,
effectively working harder than their more-qualified counterparts. Strong group identity yields
high motivation for reciprocity (on average), and results in a greater preference for nepotism.
Favoritism. The second dominant explanation for nepotism is that individuals with a
strong sense of group identity may be more likely to select their group members because of
favoritism. This can be either taste based discrimination (Becker, 1971) or because of strong ties
5 Their research cannot rule out the effects of legacy and donations on college acceptance, and note that
intergenerational human capital transfers may also be a likely reason for larger acceptance rates. 6 For example, McConaugby et al. (2001) argue that family-controlled firms are more likely to hire fellow group
members as a solution to the agency problem, and that reduced monitoring costs can yield higher firm valuations.
5
to a social identity (Akerlof and Kranton, 2000).7 Nepotism is employed to benefit fellow group
members, or because of the higher value placed on interactions within the group. Tajfel and
Turner‟s (1979) social identity theory suggests that individuals derive utility from group
membership and actively work towards maintaining ties within the group, culminating in
favoritism.8 Behavior favoring fellow group members is commonplace in these studies (for
reviews, see Brewer and Brown, 1998; Messick and Mackie, 1989).9
Motives are difficult to uncover in observational studies. Nepotism, for example, is
either illegal or viewed as socially undesirable, and therefore, observing nepotism and its
motivation is problematic. Controlled experiments offer the possibility for studying nepotism
and uncovering underlying motives. This has not been lost on experimentalists. Brandts and
Sola (2010) find higher reciprocity among friends in a lab experimental study using the trust
game, justifying the selection of friends as partners, even when their productivity is, by design,
lower. Fershtman, et al., (2005) also find nepotism using a unique pool of subjects in Israel and
Belgium. Orthodox Jews trust other Orthodox Jews more than the general population and
Belgian subjects are less trusting of identifiable out-groups (Flemish vs. Walloon). However,
neither of these studies distinguishes between the two motives for nepotistic behavior, because
they do not collect information on expected reciprocity or strength of friendship.
Two additional studies inform the motives for nepotism. In a field experiment with
children aged 6-8 and 10-12, Belot and van de Ven (2011) demonstrate that motives change with
age. They show that younger children are more likely to select friends as group members
regardless of performance, illustrating that the second motive at work. But for older children
performance becomes important. This study also finds that favoritism improves performance, as
Group members who are selected exert more effort, consistent with (accurate) beliefs about the
7 Psychologists have studied the effects of in-group bias starting with Tajfel‟s (1974) seminal work on intergroup
relations. In-group bias is understood as discriminating in favor of the primary group of the individual relative to an
out-group (Brewer, 1979; Tajfel, 1982). Once individuals establish their identities as part of a particular group, pro-
social behavior towards their group members increases based on this linkage. Thus, the stronger an individual
identifies with their group, the greater the instance of pro-social behavior. See Chen and Li (2009) and Goette et al.
(2006) for recent examples. 8 Much of the research in this area utilizes lab experiments, and employs the minimal group paradigm (Billig and
Tajfel 1973), a relatively weak procedure for manipulating group identity in the lab. The procedure creates an in-
group as well as a complementary out-group. 9 In contrast, several studies find in-group denigration. Lewis and Sherman (2003) document two such situations.
They show that individuals are more likely to hire out-group members when both applicants are unqualified (for
qualified candidates, the favoritism result holds), or when a qualified out-group member might confirm a negative
stereotype about the in-group.
6
productivity of fellow group members. In another field experiment in a fruit-picking firm,
Bandiera, et al., (2009) provide evidence that managers favor workers who are socially close to
them when it is costless to do so, but when it is costly, such favoritism is eliminated. These
studies demonstrate the prevalence of the favoritism motive, but suggest that beliefs about higher
performance can also play an important role.
While these studies are informative, they are unable to disentangle the relative strengths
of the beliefs and favoritism as motives for selecting a fellow group member as a partner, even
when it is more costly to do so. Thus, we address whether nepotism is caused by beliefs about
reciprocity, in-group bias, or both, and assess how each contributes to nepotism. We use
laboratory experiments to examine which behavioral factors influence nepotism, and the impact
of such behavior on trust and reciprocity. Laboratory experiments are particularly useful in this
setting because we can establish the appropriate counterfactuals to investigate the impact of
behavior-modifying policies, something we would be unable to do outside of the lab.
HYPOTHESES
To reiterate, nepotism is the choice of a partner from one‟s own primary group (kin,
friendship, or identity group) in a setting involving trust. An individual engaging in nepotism
either may have some prior belief that they can trust the appointee‟s performance (beliefs), or
they may be motivated by a desire to increase the wellbeing of the in-group member (favoritism).
The first hypothesis addresses the potential effect of imposing differences in the
productivity of the group members. Regardless of the motive for nepotism, raising the cost of
nepotism by lowering inherent productivity of fellow group members will reduce the likelihood
they are preferred as partners.
H1: Lower productivity of in-group members (relative to the population) reduces the
likelihood that individuals will choose in-group members as partners in the trust
game.
In our experiment (described below) this hypothesis is tested by exogenously varying the
multiplier in the trust game, so that choosing an in-group partner incurs a lower multiplier on the
amount trusted.
Previous literature supports both beliefs about trustworthiness (e.g., Ashraf et al 2006;
Barr 2003; Buchan et al. 2008) and favoritism (Falk and Zehnder 2007) as determinants of the
7
level of trust in the investment game.10
These findings also have implications for partner choice
in our setting. Beliefs that reciprocity will be higher from fellow group members will enhance
the likelihood that a group member is selected as a partner. Favoritism also will lead to the
greater choice of in-group members, irrespective of expectations. This yields our second set of
hypotheses:
H2a (Beliefs): The choice of a fellow group member as a partner is positively related to
expectations about the trustworthiness of the group member relative to the
general population.
H2b (Favoritism): The choice of a fellow group member as parther is positively related
to altruism toward the group.
In our experiment, beliefs are elicited by asking the first-mover to forecast the second-
mover‟s response, while favoritism is measured by the subjects‟ willingness to share resources
with a fellow group member, as compared with a general member of the populations.
The next hypothesis focuses on the effects of implementing a basic anti-nepotism rule on
trust and trustworthiness. Removing the possibility of nepotism by enforcing random partner-
selection mimics the effect of anti-nepotism rules. Slonim and Garbarino (2008) show that
providing subjects with the ability to select their partners (based on gender and age) in the trust
game increases trust. Belot and Van de Ven (2011) find that among school children, partner
choice enhances reciprocity and improves performance among friends. Based on these results,
we would expect the implementation of an anti-nepotism law to reduce trust and reciprocity.
This yields our fourth hypothesis:
H3: Anti-nepotism rules (i.e., removal of partner choice) reduce overall trust and
reciprocity.
In our experiment, this is tested by implementing two types of treatments. In one, partner
choice is possible, and in the other, partner preference is elicited, but partners are selected by a
random process.
Changing the costs of nepotism may also impact trust and reciprocity. Coleman (1990)
notes that an exogenous increase in costs of trusting reduces the potential gains from trust, and
10
Cox (2004) presents a “triadic” design that carefully explores the relationship between altruism and trust. He
argues that the amount sent in the trust game incorporates both altruism and trust. Thus in our context, trust would
be greater for fellow group members if there is greater altruism toward group members.
8
thus lowers the incentives to trust. There are a number of studies that utilize a lower rate of
return rather than the standard multiplier of 3 (Glaesar et al. 2000; Greig and Bohnet, 2008;
Karlan, 2005; Lazzarini et al. 2005; among others). Using a meta-analytical approach, Johnson
and Mislin (2011) find that a lower rate of return does not yield lower trust among senders;
however, there is evidence for an increase in reciprocity (measured as percent returned). The
authors interpret this result as responders taking the smaller “size of the pie” into account and
adjusting the amount returned upwards. That is, the additional cost due to reduced productivity is
borne (at least in part) by the responders. This evidence yields our third hypothesis regarding the
effect of costly nepotism on reciprocity.
H4: Lowered productivity of group members increases reciprocity among the group.
Again, this hypothesis is tested by exogenously varying the multiplier in the trust game.
However, since the multiplier is only lowered among group members, the hypothesis above
applies only to trust and reciprocity among group members.
In addition to testing these hypotheses, we also engage in an exploratory analysis of the
interaction among partner choice, in-group productivity (in the form of the multiplier), and
behavior in the trust game. This includes an analysis of trust and reciprocity under all
conditions.
EXPERIMENTAL DESIGN
We modify the standard trust game (developed by Berg et al. 1995) by introducing
groups, choice of partner, and differential productivity of groups. We allow the proposer to
choose either a fellow group member as responder for the trust game or a responder that is not in
the proposer‟s group. By design, there is no identifiable out-group, reflecting general situations
where nepotism plays a role. This is an important distinction, since favoritism towards one‟s
group is not the same as out-group dislike (as pointed out by Brewer 1999).11
Previous studies of
in-group favoritism typically include an identifiable out-group, confounding in-group favoritism
with out-group dislike. By structuring the game in this way, we are able attribute any preferential
treatment shown the in-group members as favoritism, rather than out-group dislike. We elect to
11
Brewer (1999) argues that in-group favoritism and out-group discrimination are separable phenomena, and thus
it may be unclear whether behavioral variation is driven by a preference for the in-group or dislike towards the out-
group. .
9
observe naturally-occurring groups, where individuals have been randomly assigned (to avoid
self-selection biases), and have shared histories and previous interactions.
The experiment includes two factors with four treatments, in a 2x2 design. The first
factor is partner choice, labeled as “Partner Choice” and “No Choice,” respectively. The
difference between the two is that the former allows proposers to choose their partners, while the
latter does not (though partner preferences are elicited). The other factor varies the cost of
nepotism, which is either “Free” or “Costly.” Where nepotism is Free, the standard trust game
multiplier of 3 applies to first-mover transfers to both the in-group and the others, as described
below. Where nepotism is Costly, a lower multiplier of 2.5 is applied to transfers to an in-group
member, while transfers to others retain the multiplier of 3. Each treatment is conducted with an
independent sample in a between-subjects design.
Figure 1 shows a timeline of events in each session. The experiment begins with a pre-
game survey (collecting demographic information) followed by three games (Trust, Dictator,
Risk, presented in random order by session) and then a post-game survey (collecting game
specific information). Each game is discussed in detail below.
[Figure 1 about here]
Nepotism Game
As noted above, we modify the standard trust game (Berg et al., 1995) to accommodate
nepotism. Proposers and responders in the trust game are endowed with 20 tokens (with each
token equal to $.50 USD). Proposers can send any amount of their tokens to a responder.
Whatever is sent is multiplied by the experimenter, as specified in the experimental design. The
responder then can decide to send some, all or none of the tokens in his possession (including the
initial endowment) back to the truster. The game is computerized using z-tree (Fischbacher,
2007). It is played once, all participants have fixed positions, and the pairings are anonymous.
The modifications to the game involve the treatments dealing with partner choice and
productivity.
In the Costly Nepotism treatments, proposers are informed that choosing an individual
from their group has consequences. If the responder is their group, the amount sent is multiplied
by 2.5; otherwise a multiplier of 3 is utilized. This difference in multipliers creates a cost for
engaging in nepotism. In the Free Nepotism treatment the multiplier is the same for either in-
10
group members or others. Because of the matching protocol that is used (see the discussion
below), all subjects make decisions for both pairings: one for responders from the in-group and
another for responders from the overall university population.
In the Partner Choice treatments, proposers make three decisions; (1) they indicate their
first choice for the group their responder is drawn from, (2) they choose how much of their
endowment they want to send to the responder, and (3) they provide an estimate of how much
they expect to receive back from the responder. Belief estimates are incentivized using a binary
scoring rule: Subjects receive a 2-token ($1) bonus if they estimate correctly. The subjects are
asked to make another decision for their second choice of responder group. The matching
protocol (described below) ensures that there is some chance they will be matched with their
second choice of responder.
Responders make two decisions: (1) they estimate how much they will receive from the
proposer(incentivized as above) and (2) they indicate how much they want to send back to the
proposer for all possible amounts sent (strategy method). Both proposers and responders are
aware that the proposers are making a choice that affects the group membership of their
responders, and that actual matching is based on this choice.
In the No Choice treatments, proposers make only two decisions; (1) they determine how
much to send to the responder, and (2) they provide an estimate of how much the responder will
send back. As before, they make these decisions for both the in-group, and the others.
Responders make the same two decisions as in the Partner Choice treatments. Both proposers
and responders are aware that actual matching is random. In the post-game survey for this
treatment, proposers are asked which group they prefer to be matched with if they could choose;
however, their response has no bearing on the matching protocol.
Preference Controls
To measure subject‟s key preferences – altruism and risk aversion – we conduct
additional games designed to measure altruism towards in-group members and others, and
individual risk preferences. In addition, as an additional control variable, we measure the
strength of group identity using a 7-point Likert-scale survey question (“How strongly do you
identify with members of [primary group]?”) and use survey measures of generalized trust and
perceptions of generalized fairness (from the World Values Survey).
11
Our measure of altruism is the standard dictator game (Forsythe et al. 1994) with a single
modification. Proposers are endowed with 20 tokens (each worth $.50 USD) and are asked how
much they want to send to a responder (in 2 token increments). In the Partner Choice treatments,
proposers make two decisions: (1) they choose the group their responder belongs to, (2) they
make the dictator decision for this group. Subsequently, they make the dictator-game decision
for the other group (as their second choice). Once they make both decisions, the game ends.
The protocol in the No Choice treatments is identical, but the choice of responder group is
removed. Responders estimate how many tokens they will receive.
We implement a simple measure of risk aversion as in Eckel and Grossman (2008),
wherein subjects are asked to select one of six possible gambles. Appendix B displays a
screenshot of the gambles viewed by the subjects. Gambles one through five increase in both
expected value and variance (risk). Gamble six increases in variance, but holds the expected
value the same as in gamble five. Each gamble has a 50% chance of paying out a low amount or
a high amount.
EXPERIMENTAL PROCEDURES
We conducted the experiment at Rice University, making use of their Residential College
system. Upon entrance to the university as freshmen, undergraduates are randomly assigned to
one of eleven Residential Colleges. Colleges have their own dining halls, dorms, and faculty
advisors, which cultivates a strong group identity. Furthermore, a week-long orientation week
for freshman and regular competitions among colleges further establish strong group
affiliations.12
These residential colleges serve as the primary group affiliation for undergraduates
on campus. Subjects were recruited during lunch and dinner hours at the dining hall for each
particular college. The experiments explicitly make reference to the primary college under
observation in order to establish a basis for engaging in nepotism. All partners are anonymous,
12
We utilize Rice University‟s residential college system as the basis for our groups. This is useful as (1) we can
implement the partner choice mechanism with an in-group but no identifiable out-group, and (2) we can conceal the
identity of the partner so as to mitigate post-game play. Furthermore, random assignment assures that potentially
confounding factors are not correlated with treatments, and the possibility of selection bias in group assignment is
avoided. However, one threat to randomization is the possibility of legacy admissions; i.e., undergraduates
requesting to be assigned to a particular college based on previous affiliation. The number of legacy admissions is
relatively small at Rice, and given the relatively small sample of subjects, the probability of legacy students
participating in the study is low. For more information on the residential college system, please see:
http://www.futureowls.rice.edu/futureowls/Residential_Colleges1.asp?SnID=2059130588

12
and no identifiable characteristics (other than group membership) are revealed.
[Table 1 about here]
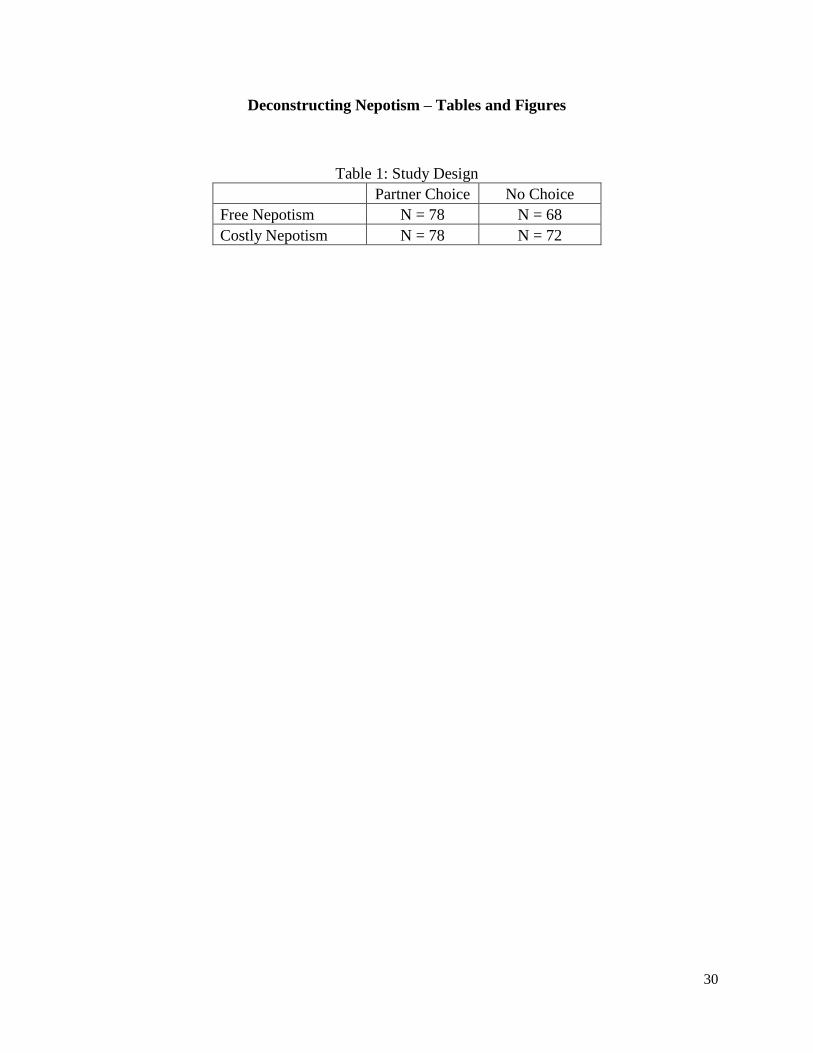
Table 1 contains the overall design of the study. Sessions were conducted at the
Behavioral Research Lab at Rice University in April and October 2009, and October 2010. A
total of 296 subjects participated in the study, as shown in Table 1. There were between 4 and
24 subjects in each session. In all cases, the in-groups were labeled in accordance with the name
of the residential college.
As detailed above, the experiment consisted of an initial short entry survey (collecting
demographic information), and the three games (Dictator, Nepotism, and Risk, described above),
followed by a post-game survey. Each game started with instructions, two examples, and a short
quiz to test understanding, followed by the game itself. Order of the games was randomized for
each session to control for order effects. None were observed in the data.
Upon arriving at the lab, subjects signed in and were asked to confirm their residential
college name and then promptly seated at a terminal. Instructions referred to in-group subjects
by the name of their college (for example, “individuals in Baker College”) and others were
referred to as “individuals not in Baker College but from the Rice University population.”13
No
feedback was provided on earnings between tasks during the experiment. At the end of the
session, the experimenter entered the lab area and asked for a volunteer. The volunteer rolled an
eight-sided die in order to determine the game that would be paid for in the session. Only 1 of
the 4 games was eligible for payment in any given session. If the risk game was selected for
payment, subjects were directed to the payment area and rolled a six-sided die. A roll of 1
through 3 gave them the low amount listed for their chosen gamble, and the roll of 4 through 6
gave them a payout of the high amount.
Subjects were assigned to one of two roles at the beginning of the session: proposer or a
responder. Subjects kept this role through the entire session. Three of the four games require
subjects to be paired. In all sessions, all proposers belonged to the in-group, while
approximately half of the responders belonged to the in-group. The remaining responders
belonged to residential colleges other than the in-group‟s. All participants were aware of this.
13
Note that the “others” belonged to Rice University, which constitutes another in-group for the subjects, but one
that is not as salient as their own college.
13
Appendix B contains screenshots of the proposer and responder decision screen,
respectively (Figures B.2 and B.3). In the Partner Choice treatments, proposers had the option
to select the group that their counterpart would be drawn from for each task. In the No Choice
treatments, subjects were not given this option, but were told that there would be “approximately
a 50% chance” that they would be matched with a responder from either group (i.e., their own
group, or the “other” group).
Subjects were paired using a matching algorithm that is a variation on one developed by
Castillo and Petrie (2010) for eliciting preferences for partners in a public goods game. For the
Partner Choice treatments, one proposer was selected at random. His preferred-group choice
was noted, and then a responder was randomly selected from his preferred group. Next, a second
proposer was randomly selected and given his first choice of group from the remaining candidate
responders. This process continued until each proposer was matched with a responder in the
session. In the event that the pool of responders from any particular group was exhausted, but
still had been requested by a proposer, then the proposer was matched with a responder from the
alternate group. In the No Choice treatments, each proposer was matched with a responder at
random. The matching algorithm was triggered once all subjects had completed all tasks and the
surveys. Each proposer was matched with a single responder, with no overlap.
RESULTS
In this section we first examine the main treatment effects. We then focus on the motives
for nepotism: favoritism or beliefs. Next, we discuss the impact of partner choice on trust and
reciprocity. Finally, we address the question of whether nepotism is a profitable strategy for
those who engage in it. Appendix A provides descriptive statistics for the variables used in the
analysis, for both proposers and responders.
Hypothesis 1 states that nepotism will be lower when it is costly. Figure 2 presents
partner preferences in the trust game treatments. Under Free Nepotism with Partner Choice, 87
percent of proposers choose fellow group members over a member of the general population.
Preferences echo these choices in the Free Nepotism with No Choice treatment, where 82 percent
of first movers indicate they prefer to be matched with an in-group member. When nepotism is
free, partner preference does not differ significantly between Partner Choice and No Choice.
[Figure 2 about here]
14
Nepotism, however, is rarely costless. When nepotism is costly, it is less utilized.
Returning to figure 2 we observe a significant decrease in the choice of a costly group member
under the Partner Choice treatments (from 87 percent to 44 percent, two-sample z-test of
proportions, z=4.05, p<.001), and a significant decrease in preference for a fellow group member
in the No Choice treatments (from 82 percent to 44 percent, two-sample z-test of proportions,
z=3.28, p=.001). On the other hand, in the presence of costs for preferring/selecting a group
member, there are still a large proportion of subjects who prefer the fellow group member. Only
those with strong preferences for the group – either because of beliefs about the relative
trustworthiness of in-group members or a strong identification with (and favoritism toward) the
group -- will continue to choose the in-group when it is costly.
Impact of Risk Preferences, Beliefs, Altruism and Group Identity on Partner Choice
The experimental design allows us to further probe whether nepotism is motivated by
favoritism or beliefs by turning to Hypotheses 2a and 2b. A multivariate model is used to
estimate the likelihood of choosing a fellow group member (in the Partner Choice treatment) or
preferring a group member (in the No Choice treatment). The Free and Costly treatments are
estimated separately under the following model:
In this model is the probability of subject i selecting an in-group member as partner,
is a dummy variable equal to 1 if subject is in the No Choice treatment. We test
hypothesis 2a by including , the difference between subject i's
expectation of returns from their in-group and subject i's expectation of returns from others. If
the choice is motivated by beliefs then . To test hypothesis 2b, we include the variable
, which is a behavioral measure of altruism and consists of the difference between
the amount that subject i gives to an in-group member and the amount that subject i gives to
others in the dictator game. If the difference in dictator game giving favors the fellow group
member then this variable is positive. A positive coefficient, , then indicates that stronger
altruism toward group members plays a role in the selection of a partner in the trust game.
15
Including the survey measure of Group Identity provides an additional measure of favoritism
toward the group.14
In addition to the above, we include a risk measure as an additional control in the model
using a simple gamble choice task.15
is subject i‟s gamble choice in the risk
measure. A positive coefficient would indicate that more risk-tolerant subjects are more likely to
select a fellow group member.
Finally a number of additional controls are added that are shown to be correlated with
trusting decisions. These include the gender of the subject as well as survey-based attitudinal
measures of trust16
and fairness17
. The results are provided in table 2 (marginal effects are
reported)18
.
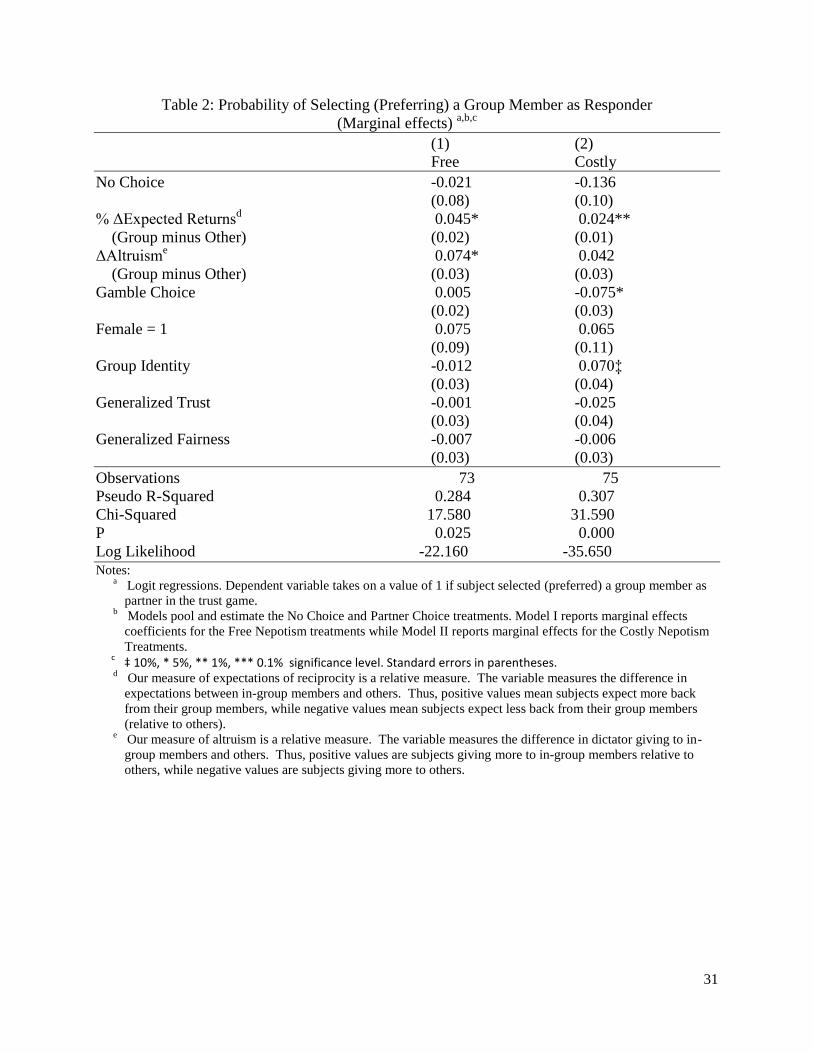
Model 1 estimates partner choice in the Free Nepotism treatment, while Model 2
estimates partner choice in the Costly Nepotism treatment. First, relative expected returns (i.e.,
the difference between expected returns from members of the in-group as opposed to others),
increases the likelihood of choosing an in-group member as counterpart both when nepotism is
free, and when it is costly. This supports Hypothesis 2a in that the choice of a partner is
positively related to expectations of higher trustworthiness from fellow group members. A 1%
increase in expectations (of in-group members relative to others) is associated with a 4.5%
increase in the likelihood of selecting an in-group member as partner for the Free Nepotism set
of treatments. Similarly, when nepotism is costly, a 2.5% increase in the likelihood is observed.
14
This was measured using a 7 point likert scale response to the question “To what extent do you identify with other
members of {Insert group name}?” taken from Levin and Sidanius, 1999. 15
The risk tolerance of the decision maker may also mediate the hypothesized relationship between nepotism and
beliefs. Ben-Ner and Putterman (2001) argue that trust is necessarily a risky decision due to lack of information
between partners. The decision to trust is inherently risky due to the possibility of betrayal. Trust decisions involve
uncertainty regarding behavior of the counterpart; this uncertainty is diminished in interactions between individuals
with a common social identity. Individuals choosing between in-group partners and “others” have a shared history
with in-group members, allowing better calibration of reciprocity beliefs. Conversely, the perceived distribution of
reciprocity levels in the general population is larger, which in turn makes the choice of an individual from the
general population a riskier prospect. 16
Trust is measured by a 7 point likert scale response to the question “Generally speaking, would you say that most
people can be trusted, or that you need to be very careful in dealing with people?” taken from the 2005 version of
the world values survey, accessible at http://www.wvsevsdb.com/wvs/WVSAnalize.jsp 17
Fairness is measured by a 7 point likert scale response to the question “Do you think that most people would try to
take advantage of you if they got a chance, or would they try to be fair?” taken from the 2005 version of the world
values survey, accessible at http://www.wvsevsdb.com/wvs/WVSAnalize.jsp 18
Model coefficients are provided in table C.1 in appendix C for the interested reader.
16
Hence, individuals with higher expectations from their group are more likely to select in-group
members as counterparts, even if in-group members are less productive.
Second, we find considerable support for Hypothesis 2b (favoritism), but only when
nepotism is free. A 1-token (50 cent) increase in giving to the group is associated with a 7.4%
increase in the probability of selecting a group member as partner. However, when nepotism is
costly, this measure of in-group favoritism does not have a significant impact on partner
preference. Thus, favoritism only plays a role in facilitating nepotism if there are no associated
costs. If an in-group member is not as productive as the general population, subjects displaying
greater favoritism towards their group are no more likely to select fellow group members as
partners.
[Table 2 about here]
The models in table 2 allow us to test the conditional effect of risk preferences on the
choice of partner. While the coefficient for the Free Nepotism treatment is not different from
zero, it is negative for the Costly Nepotism treatment. This implies that more risk-averse subjects
are more likely to engage in nepotism.
It is also worth noting that the group identity variable is marginally significant in the
second regression. This provides further evidence of favoritism toward one‟s group: first-movers
who select group members when nepotism is costly identify more strongly with their in-group.
We find that nepotism is a strategic decision, motivated largely by beliefs, especially
when nepotism is costly. When nepotism is costly, expectations and risk preferences predict
partner selection, while favoritism does not. Only in the case when nepotism is free does
favoritism play a role, and even then in conjunction with expectations. Thus, people engage in
nepotism because they expect better (more profitable) outcomes for themselves.
Impact on Trust
In this section we analyze the amount sent by proposers in the trust game across all four
treatments.19
This allows us to estimate the impact of both Costly Nepotism and an anti-nepotism
19
Recall that in the No Choice treatment, subjects indicate a preference for participating in the trust game with a
member of their own group, or a randomly selected individual. This preference has no bearing on who they are
ultimately matched with. In the Partner Choice treatment, counterparts are matched in accordance to the subject‟s
17
law (No Choice) on overall trust. Recall that each subject makes two decisions, one for a partner
from their primary group, and one for a member of the general population. To account for
correlations within a given subject‟s decisions, errors are clustered by individual. We estimate
the following tobit model for all treatments with censoring at 0 and 20:
where observations belong to the decision , and observations are indexed by
. is the amount sent by subject i in the trust game, is a dummy
variable equal to 1 if the subject is in the Costly Nepotism treatment, is a dummy
variable equal to 1 if subjects i's decision is for a fellow group member, is a
dummy variable equal to 1 if the subject indicated that this decision was his first choice decision.
In addition, the model controls for risk preferences, gender, academic year, group identity, and
survey measures of trust and fairness, with as the error term. This setup allows us to test
Hypothesis 3 which predicts that preventing partner choice will reduce trust and reciprocity. If
so, we expect .
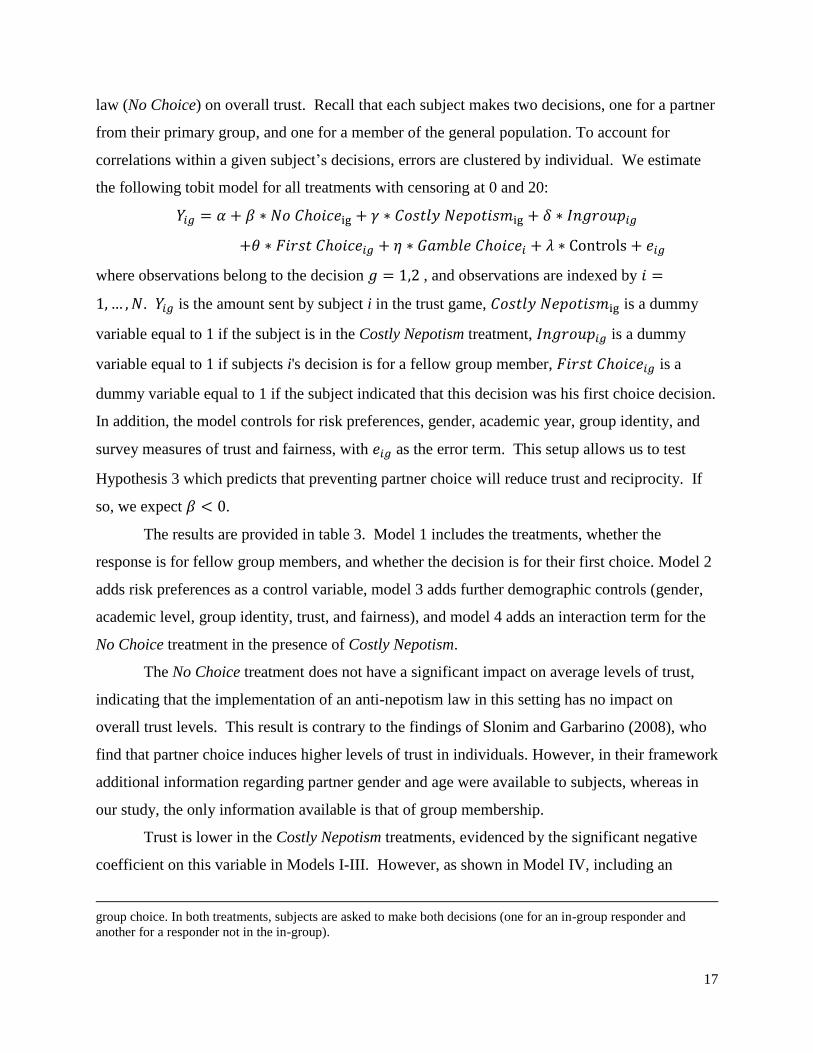
The results are provided in table 3. Model 1 includes the treatments, whether the
response is for fellow group members, and whether the decision is for their first choice. Model 2
adds risk preferences as a control variable, model 3 adds further demographic controls (gender,
academic level, group identity, trust, and fairness), and model 4 adds an interaction term for the
No Choice treatment in the presence of Costly Nepotism.
The No Choice treatment does not have a significant impact on average levels of trust,
indicating that the implementation of an anti-nepotism law in this setting has no impact on
overall trust levels. This result is contrary to the findings of Slonim and Garbarino (2008), who
find that partner choice induces higher levels of trust in individuals. However, in their framework
additional information regarding partner gender and age were available to subjects, whereas in
our study, the only information available is that of group membership.
Trust is lower in the Costly Nepotism treatments, evidenced by the significant negative
coefficient on this variable in Models I-III. However, as shown in Model IV, including an
group choice. In both treatments, subjects are asked to make both decisions (one for an in-group responder and
another for a responder not in the in-group).
18
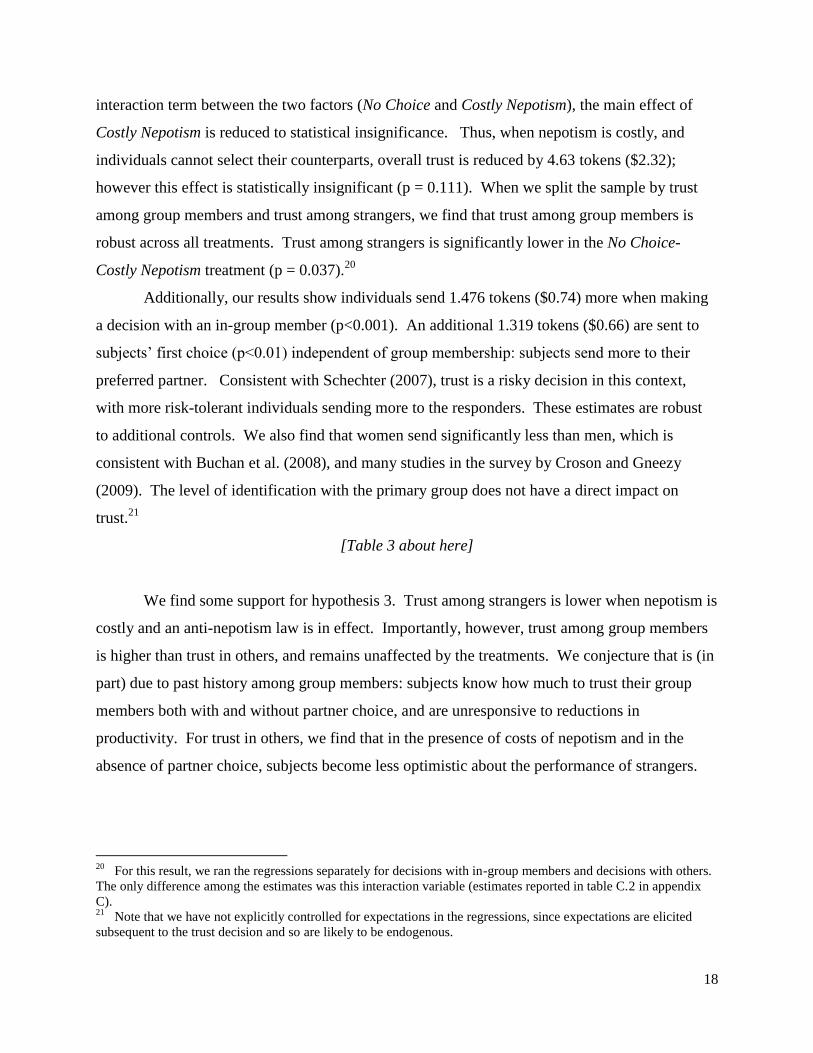
interaction term between the two factors (No Choice and Costly Nepotism), the main effect of
Costly Nepotism is reduced to statistical insignificance. Thus, when nepotism is costly, and
individuals cannot select their counterparts, overall trust is reduced by 4.63 tokens ($2.32);
however this effect is statistically insignificant (p = 0.111). When we split the sample by trust
among group members and trust among strangers, we find that trust among group members is
robust across all treatments. Trust among strangers is significantly lower in the No Choice-
Costly Nepotism treatment (p = 0.037).20
Additionally, our results show individuals send 1.476 tokens ($0.74) more when making
a decision with an in-group member (p<0.001). An additional 1.319 tokens ($0.66) are sent to
subjects‟ first choice (p<0.01) independent of group membership: subjects send more to their
preferred partner. Consistent with Schechter (2007), trust is a risky decision in this context,
with more risk-tolerant individuals sending more to the responders. These estimates are robust
to additional controls. We also find that women send significantly less than men, which is
consistent with Buchan et al. (2008), and many studies in the survey by Croson and Gneezy
(2009). The level of identification with the primary group does not have a direct impact on
trust.21
[Table 3 about here]
We find some support for hypothesis 3. Trust among strangers is lower when nepotism is
costly and an anti-nepotism law is in effect. Importantly, however, trust among group members
is higher than trust in others, and remains unaffected by the treatments. We conjecture that is (in
part) due to past history among group members: subjects know how much to trust their group
members both with and without partner choice, and are unresponsive to reductions in
productivity. For trust in others, we find that in the presence of costs of nepotism and in the
absence of partner choice, subjects become less optimistic about the performance of strangers.
20
For this result, we ran the regressions separately for decisions with in-group members and decisions with others.
The only difference among the estimates was this interaction variable (estimates reported in table C.2 in appendix
C). 21
Note that we have not explicitly controlled for expectations in the regressions, since expectations are elicited
subsequent to the trust decision and so are likely to be endogenous.
19
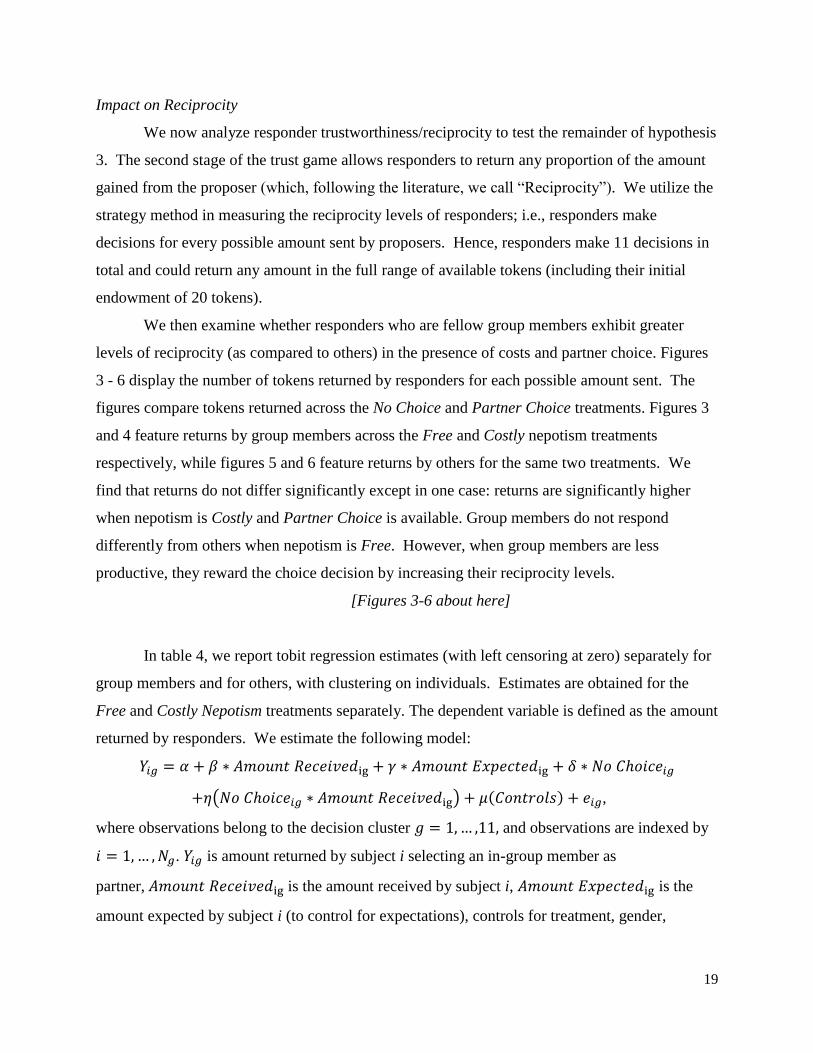
Impact on Reciprocity
We now analyze responder trustworthiness/reciprocity to test the remainder of hypothesis
3. The second stage of the trust game allows responders to return any proportion of the amount
gained from the proposer (which, following the literature, we call “Reciprocity”). We utilize the
strategy method in measuring the reciprocity levels of responders; i.e., responders make
decisions for every possible amount sent by proposers. Hence, responders make 11 decisions in
total and could return any amount in the full range of available tokens (including their initial
endowment of 20 tokens).
We then examine whether responders who are fellow group members exhibit greater
levels of reciprocity (as compared to others) in the presence of costs and partner choice. Figures
3 - 6 display the number of tokens returned by responders for each possible amount sent. The
figures compare tokens returned across the No Choice and Partner Choice treatments. Figures 3
and 4 feature returns by group members across the Free and Costly nepotism treatments
respectively, while figures 5 and 6 feature returns by others for the same two treatments. We
find that returns do not differ significantly except in one case: returns are significantly higher
when nepotism is Costly and Partner Choice is available. Group members do not respond
differently from others when nepotism is Free. However, when group members are less
productive, they reward the choice decision by increasing their reciprocity levels.
[Figures 3-6 about here]
In table 4, we report tobit regression estimates (with left censoring at zero) separately for
group members and for others, with clustering on individuals. Estimates are obtained for the
Free and Costly Nepotism treatments separately. The dependent variable is defined as the amount
returned by responders. We estimate the following model:
,
where observations belong to the decision cluster and observations are indexed by
. is amount returned by subject i selecting an in-group member as
partner, is the amount received by subject i, is the
amount expected by subject i (to control for expectations), controls for treatment, gender,
20
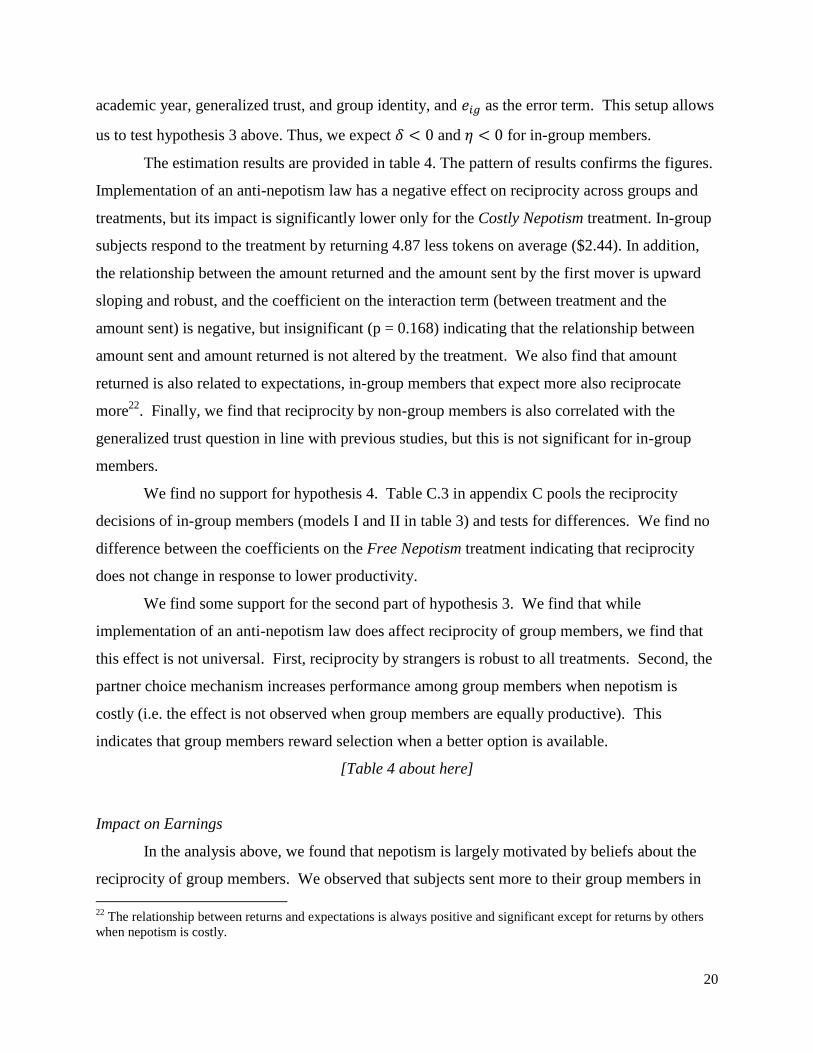
academic year, generalized trust, and group identity, and as the error term. This setup allows
us to test hypothesis 3 above. Thus, we expect and for in-group members.
The estimation results are provided in table 4. The pattern of results confirms the figures.
Implementation of an anti-nepotism law has a negative effect on reciprocity across groups and
treatments, but its impact is significantly lower only for the Costly Nepotism treatment. In-group
subjects respond to the treatment by returning 4.87 less tokens on average ($2.44). In addition,
the relationship between the amount returned and the amount sent by the first mover is upward
sloping and robust, and the coefficient on the interaction term (between treatment and the
amount sent) is negative, but insignificant (p = 0.168) indicating that the relationship between
amount sent and amount returned is not altered by the treatment. We also find that amount
returned is also related to expectations, in-group members that expect more also reciprocate
more22
. Finally, we find that reciprocity by non-group members is also correlated with the
generalized trust question in line with previous studies, but this is not significant for in-group
members.
We find no support for hypothesis 4. Table C.3 in appendix C pools the reciprocity
decisions of in-group members (models I and II in table 3) and tests for differences. We find no
difference between the coefficients on the Free Nepotism treatment indicating that reciprocity
does not change in response to lower productivity.
We find some support for the second part of hypothesis 3. We find that while
implementation of an anti-nepotism law does affect reciprocity of group members, we find that
this effect is not universal. First, reciprocity by strangers is robust to all treatments. Second, the
partner choice mechanism increases performance among group members when nepotism is
costly (i.e. the effect is not observed when group members are equally productive). This
indicates that group members reward selection when a better option is available.
[Table 4 about here]
Impact on Earnings
In the analysis above, we found that nepotism is largely motivated by beliefs about the
reciprocity of group members. We observed that subjects sent more to their group members in
22
The relationship between returns and expectations is always positive and significant except for returns by others
when nepotism is costly.
21
the trust game, and this amount was unaffected by the treatments. We also observed that Costly
Nepotism had no effect on reciprocity among group members. However, introducing an anti-
nepotism law lowered reciprocity among group members, but only when nepotism is Costly. We
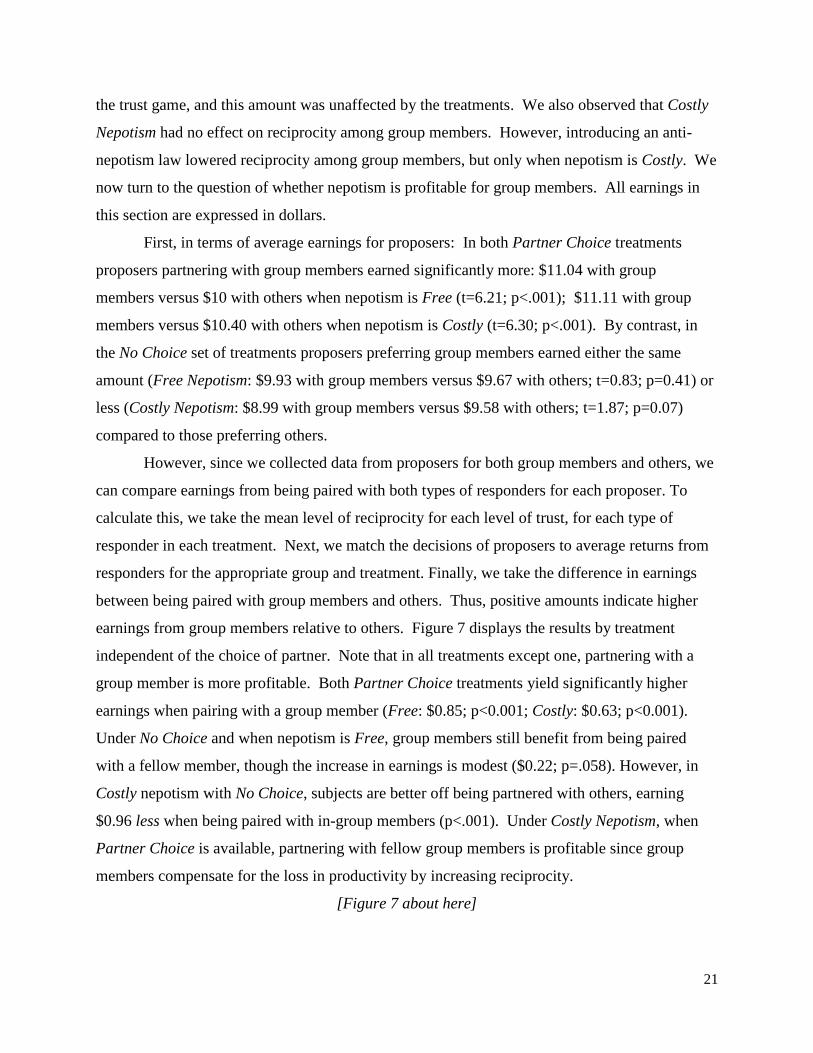
now turn to the question of whether nepotism is profitable for group members. All earnings in
this section are expressed in dollars.
First, in terms of average earnings for proposers: In both Partner Choice treatments
proposers partnering with group members earned significantly more: $11.04 with group
members versus $10 with others when nepotism is Free (t=6.21; p<.001); $11.11 with group
members versus $10.40 with others when nepotism is Costly (t=6.30; p<.001). By contrast, in
the No Choice set of treatments proposers preferring group members earned either the same
amount (Free Nepotism: $9.93 with group members versus $9.67 with others; t=0.83; p=0.41) or
less (Costly Nepotism: $8.99 with group members versus $9.58 with others; t=1.87; p=0.07)
compared to those preferring others.
However, since we collected data from proposers for both group members and others, we
can compare earnings from being paired with both types of responders for each proposer. To
calculate this, we take the mean level of reciprocity for each level of trust, for each type of
responder in each treatment. Next, we match the decisions of proposers to average returns from
responders for the appropriate group and treatment. Finally, we take the difference in earnings
between being paired with group members and others. Thus, positive amounts indicate higher
earnings from group members relative to others. Figure 7 displays the results by treatment
independent of the choice of partner. Note that in all treatments except one, partnering with a
group member is more profitable. Both Partner Choice treatments yield significantly higher
earnings when pairing with a group member (Free: $0.85; p<0.001; Costly: $0.63; p<0.001).
Under No Choice and when nepotism is Free, group members still benefit from being paired
with a fellow member, though the increase in earnings is modest ($0.22; p=.058). However, in
Costly nepotism with No Choice, subjects are better off being partnered with others, earning
$0.96 less when being paired with in-group members (p<.001). Under Costly Nepotism, when
Partner Choice is available, partnering with fellow group members is profitable since group
members compensate for the loss in productivity by increasing reciprocity.
[Figure 7 about here]
22
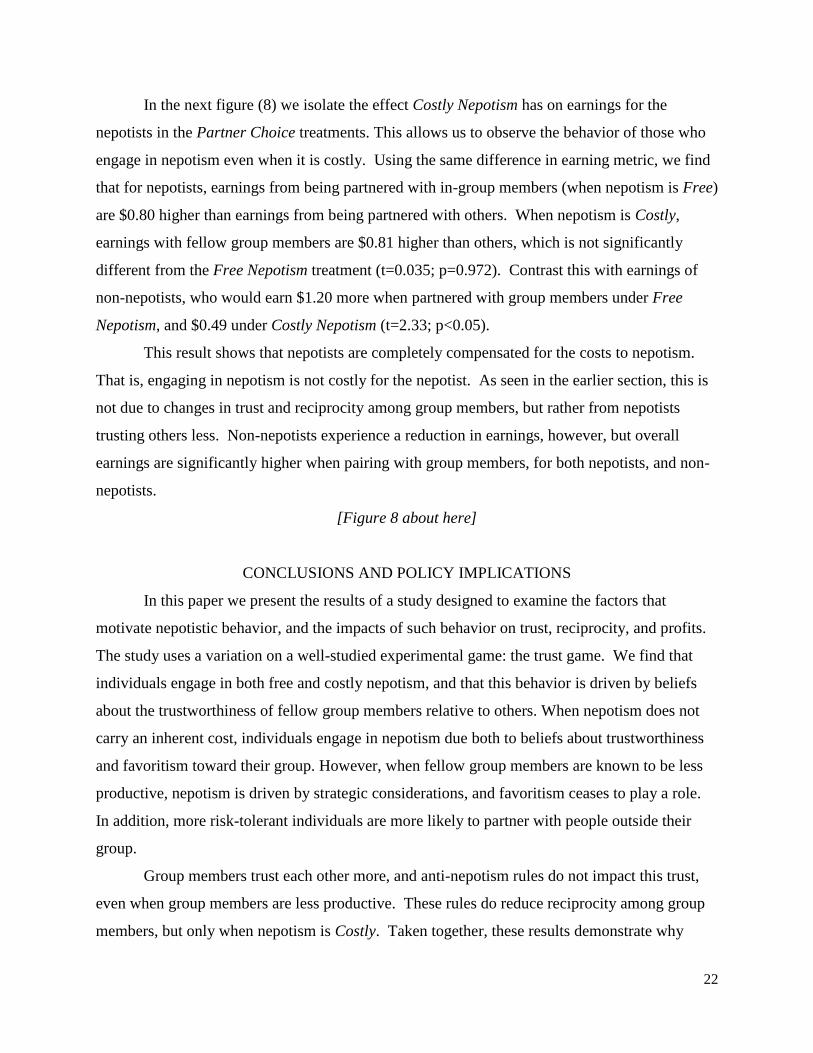
In the next figure (8) we isolate the effect Costly Nepotism has on earnings for the
nepotists in the Partner Choice treatments. This allows us to observe the behavior of those who
engage in nepotism even when it is costly. Using the same difference in earning metric, we find
that for nepotists, earnings from being partnered with in-group members (when nepotism is Free)
are $0.80 higher than earnings from being partnered with others. When nepotism is Costly,
earnings with fellow group members are $0.81 higher than others, which is not significantly
different from the Free Nepotism treatment (t=0.035; p=0.972). Contrast this with earnings of
non-nepotists, who would earn $1.20 more when partnered with group members under Free
Nepotism, and $0.49 under Costly Nepotism (t=2.33; p<0.05).
This result shows that nepotists are completely compensated for the costs to nepotism.
That is, engaging in nepotism is not costly for the nepotist. As seen in the earlier section, this is
not due to changes in trust and reciprocity among group members, but rather from nepotists
trusting others less. Non-nepotists experience a reduction in earnings, however, but overall
earnings are significantly higher when pairing with group members, for both nepotists, and non-
nepotists.
[Figure 8 about here]
CONCLUSIONS AND POLICY IMPLICATIONS
In this paper we present the results of a study designed to examine the factors that
motivate nepotistic behavior, and the impacts of such behavior on trust, reciprocity, and profits.
The study uses a variation on a well-studied experimental game: the trust game. We find that
individuals engage in both free and costly nepotism, and that this behavior is driven by beliefs
about the trustworthiness of fellow group members relative to others. When nepotism does not
carry an inherent cost, individuals engage in nepotism due both to beliefs about trustworthiness
and favoritism toward their group. However, when fellow group members are known to be less
productive, nepotism is driven by strategic considerations, and favoritism ceases to play a role.
In addition, more risk-tolerant individuals are more likely to partner with people outside their
group.
Group members trust each other more, and anti-nepotism rules do not impact this trust,
even when group members are less productive. These rules do reduce reciprocity among group
members, but only when nepotism is Costly. Taken together, these results demonstrate why
23
nepotism persists, even in the presence of costs. Becker (1971) argued that engaging in
discrimination (of any variety) would reduce profits since a more productive member would be
available to a wider search. Nepotism may violate this condition for the simple reason that group
members trust each other more. In addition, when the choice mechanism is available, engaging
in nepotism is always profitable. We find that the only time engaging in nepotism was not
profitable was when group members are less productive and an anti-nepotism rule is in effect,
making the rule itself a self-fulfilling prophecy. Hence, as with other forms of corruption,
nepotism persists because it is individually profitable, but may still be welfare reducing due to
negative externalities (threats to meritocracy and so forth).
Our results are similar to those found by Brandts and Sola (2010), Fiedler et al. (2011),
and Belot and van de Ven (2011), which show that reciprocity increases with reduced social
distance. Fershtman et al. (2005) also show that trust is higher among group members, but has no
real impact on reciprocity. We build on these studies by introducing a partner choice mechanism
to show that nepotism is not always payoff maximizing. Thus, we demonstrate the conditions
under which nepotism is a pay-off maximizing strategy, and test the relative strength of motives
for engaging in nepotistic behavior.
Our stylized representation of nepotism differs from the “real world” form of nepotism in
two important ways. First, the analysis we present is static, i.e. the trust game is played a single
time and ends. Nepotism may have a significant long term component with impacts on
inequality and meritocracy that we do not address here. In addition, these repeated interactions
may provide further incentives for individuals to engage in inefficient behavior. Further research
is needed to estimate the long run impact of engaging in such behavior. Second, this paper is
divorced from externalities. One major reason for anti-nepotism rules and policies is that there is
an overall negative impact on the population, those who are not party to the transaction.
With these two caveats in mind, our results have interesting implications for policy.
First, it shows clear incentives for group polarization. Partnering with fellow group members
pays off, even for individuals that are not precluded to doing so. Second, even when differences
in productivity are evident, a significant proportion of the population has the predisposition to be
nepotistic. Furthermore, it is profitable to engage in nepotism. Organizations that do not allow
nepotism may not be availing themselves of productivity enhancements due to group-based
considerations. So, should we eliminate anti-nepotism rules? The answer lies in the purpose of
24
the law itself. If the purpose is to reduce discrimination for its own sake, then implementing the
law is desirable. However, if the purpose is to maximize profits, then the relationships between
employers and workers need closer examination. If group members are equally productive, anti-
nepotism laws are observed to have very little impact. However, group members are less
productive (which is likely to be the case according to Becker), anti-nepotism rules may yield
lower overall performance.
25
REFERENCES
Akerlof, George, and Rachel Kranton. 2000. “Economics and Identity.” Quarterly Journal of
Economics, 115(3): 715-753.
Alexander, Richard D. 1974. “The Evolution of Social Behavior.” Annual Review of Ecology
and Systematics, 5: 325-383.
Ashraf, Nava, Iris Bohnet, and Nikita Piankov. 2006. “Decomposing Trust and Trustworthiness.”
Experimental Economics, 9(3): 193-208.
Bandiera, Oriana, Iwan Barankay, and Imran Rasul. 2009. “Social Connections and Incentives in
the Workplace: Evidence from Personnel Data.” Econometrica, 77(4): 1047-1094.
Barr, Abigail. 2003. “Trust and Trustworthiness: Experimental Evidence from Zimbabwean
Villages.” The Economic Journal, 113(489): 614-630.
Becker, Gary. 1971. The Economics of Discrimination. Chicago, IL: University of Chicago
Press.
Ben-Ner, Avner. and Louis Putterman. 2001. “Trusting and Trustworthiness.” Boston University
Law Review, 81(2): 523-551.
Bennedsen, Morten, Kasper M. Nielsen, Francisco Perez-Gonzalez, and Daniel Wolfenzon .
2007. “Inside the Family Firm: the Role of Families in Succession Decisions and
Performance.” Quarterly Journal of Economics, 122(2): 647-691.
Belot, Michele, and Jeroen van de Ven. 2011. “Friendships and Favoritism at School: Evidence
from the Field.” Economic Journal, 121(557): 1228-1251.
Berg, Joyce, John Dickhaut, and Kevin McCabe. 1995. “Trust, Reciprocity, and Social History.”
Games and Economic Behavior, 10(1): 122-142.
Billig, Michael, and Henri Tajfel. 1973. “Social Categorization and Similarity in Intergroup
Behavior.” European Journal of Social Psychology, 3(1): 27-52.
Brandts, Jordi, and Carlos Solà. 2010. “Personal Relations and their Effect on Behavior in an
Organizational Setting: An Experimental Study.” Journal of Economic Behavior and
Organization, 73(2): 246-253.
Brewer, Marilynn B. 1979. “Ingroup Bias in the Minimal Intergroup Situation: A Cognitive-
Motivational Analysis.” Psychological Bulletin, 86(2): 307-324.
Brewer, Marilynn B. 1999. “The Psychology of Prejudice: Ingroup Love or Outgroup Hate?”
Journal of Social Issues, 55(3): 429-444.
Brewer, Marilynn B. and Rupert J. Brown. 1998. “Intergroup Relations.” In Daniel T. Gilbert,
Susan T. Fiske, and Gardner Lindzey (Eds.), The Handbook of Social Psychology, 2(4),
Boston, MA: McGraw-Hill.
26
Brick, Ivan E., Oded Palmon, and John K. Wald. 2005. “CEO Compensation, Director
Compensation, and Firm Performance: Evidence of Cronyism.” Journal of Corporate
Finance, 12(3): 403-423.
Buchan, Nancy R., Rachel T.A. Croson, and Sara Solnick. 2008. “Trust and Gender: An
Examination of Behavior, Biases and Beliefs in the Investment Game.” Journal of
Economic Behavior and Organization, 64(3-4): 466-476.
Castillo, Marco, and Ragan Petrie. 2010. “Discrimination in the Lab: Does Information Trump
Appearance?” Games and Economic Behavior, 68(1): 50-59.
Chen, Yan, and Sherry X. Li. 2009. “Group Identity and Social Preferences.” American
Economic Review, 99(1): 431-457.
Coleman, James S. 1990. Foundations of Social Theory. Cambridge, MA: The Belknap Press.
Cox, James C. 2004. “How to Identify Trust and Reciprocity.” Games and Economic Behavior,
46: 260-281.
Croson, Rachel T.A., and Uri Gneezy. 2009. “Gender Differences in Preferences.” Journal of
Economic Literature, 47(2): 448-474.
Davis, James H., F. David Schoorman, and Lex Donaldson. 1997. “Toward a Stewardship
Theory of Management.” The Academy of Management Review, 22(1): 20-47.
Donaldson, Lex, and James H. Davis. 1991. “Stewardship Theory or Agency Theory: CEO
Governance and Shareholder Returns.” Australian Journal of Management, 16(1): 49-65.
Eckel, Catherine C., and Philip J. Grossman. 2008. “Forecasting Risk Attitudes: An
Experimental Study Using Actual and Forecast Gamble Choices.” Journal of Economic
Behavior and Organization, 68 (1): 1-17.
Englebert, Pierre. 2000. “Pre-Colonial Institutions, Post-Colonial States, and Economic
Development in Tropical Africa.” Political Research Quarterly, 53(1): 7-36.
Faccio, Mara. 2006. “Politically Connected Firms.” American Economic Review, 96(1): 369-386.
Falk, Armin, and Christian Zehnder. 2007. “Discrimination and In-Group Favoritism in a
Citywide Trust Experiment.” IZA Working Paper DP 2765.
Fatton Jr., Robert. 1990. “Liberal Democracy in Africa.” Political Science Quarterly, 105(3):
455-473.
Fearon, James D., and David D. Laitin. 1996. “Explaining Interethnic Cooperation.” American
Political Science Review, 90(4): 715-735.
Fershtman, Chaim, Uri Gneezy, and Frank Verboven. 2005. “Discrimination and Nepotism: the
Efficiency of the Anonymity Rule.” Journal of Legal Studies, 34(2): 371-394.
27
Fiedler, Marina, Ernan Haruvy, and Sherry X. Li. 2011. “Social Distance in a Virtual World
Experiment.” Games and Economic Behavior, 72(2): 400-426.
Fischbacher, Urs. 2007. “z-Tree: Zurich Toolbox for Ready-Made Economic Experiments.”
Experimental Economics, 10(2): 171-178.
Glaeser, Edward L., David I. Laibson, Jose A. Scheinkman, and Christine L. Soutter. 2000.
“Measuring Trust.” Quarterly Journal of Economics, 65(3): 811-846.
Goette, Lorenz, David Huffman, and Stephan Meier. 2006. “The Impact of Group Membership
on Cooperation and Norm Enforcement: Evidence Using Random Assignment to Real
Social Groups.” American Economic Review, 96(2): 212-216.
Greig, Fiona, and Iris Bohnet. 2008. “Is there Reciprocity in a Reciprocal-Exchange Economy?
Evidence of Gendered Norms from a Slum in Nairobi, Kenya.” Economic Inquiry, 46(1):
77-83.
Gupta, Sanjeev, Hamid Davoodi, and Erwin Tiongson. 2001. “Corruption and the Provision of
Health Care and Educational Services,” in Arvind K. Jain (ed.), The Political Economy of
Corruption, London, UK: Routledge.
Gupta, Sanjeev, Hamid Davoodi, and Rosa Alonso-Terme. 2002. “Does Corruption Affect
Income Inequality and Poverty?” Economics of Governance, 3(1): 23-45.
Holmberg, Soren, Bo Rothstein, and Naghmeh Nasiritousi. 2008. “Quality of Government: What
You Get.” Annual Reviews of Political Science, 12(1): 135-161.
Johnson, Noel D., and Alexandra A, Mislin. 2011. “Trust Games: A Meta-Analysis.” Journal of
Economic Psychology, 32(5): 865-889.
Johnson, Simon, and Todd Mitton. 2003. “Cronyism and Capital Controls: Evidence from
Malaysia.” Journal of Financial Economics, 67(2): 351–382.
Johnston, Michael. 2005. Syndromes of Corruption: Wealth, Power, and Democracy.
Cambridge, UK: Cambridge University Press.
Karlan, Dean. 2005. “Using Experimental Economics to Measure Social Capital and Predict
Financial Decisions.” American Economic Review, 95(5): 1688-1699.
Kets de Vries, Manfred F.R. 1993. “The Dynamics of Family Controlled Firms: The Good and
Bad News.” Organizational Dynamics, 21(3): 59-71.
Knack, Stephen, and Philip E. Keefer. 1995. “Institutions and Economic Performance: Cross-
Country Tests Using Alternative Institutional Measures.” Economics and Politics, 7(3):
207-227.
Krishna, Kamini. 2007. “Is International Aid the Panacea for Africa's Problems?” World Affairs,
11(3): 68-88.

28
Lambsdorff, Johann G. 2003. “How Corruption Affects Persistent Capital Flows.” Economics of
Governance, 4(3): 229-243.
Lazzarini, Sergio G., Regina Madalozzo, Rinaldo Artes, and Jose de Oliveira Siqueira. 2005.
“Measuring Trust: An Experiment in Brazil.” Brazilian Journal of Applied Economics,
9(2): 153-169.
Lentz, Bernard F. and David N. Laband. 1989. “Why So Many Children of Doctors Become
Doctors: Nepotism vs. Human Capital Transfers.” Journal of Human Resources, 24(3):
392-413.
Lewis, Amy C., and Steven J. Sherman. 2003. “Hiring You Makes Me Look Bad: Social-Identity
Based Reversals of the Ingroup Favoritism Effect.” Organizational Behavior and Human
Decision Processes, 90(2): 262-276.
Mauro, Paulo. 1995. “Corruption and Growth.” Quarterly Journal of Economics, 110(3): 681-
712.
Mauro, Paulo. 1998. “Corruption: Causes, Consequences, and Agenda for Further Research.”
Finance and Development, 35(1): 11-14.
McConaugby, Daniel L., Charles H. Matthews, and Anne S. Fialko. 2001. “Founding family
Controlled Firms: Performance, Risk, and Value.” Journal of Small Business
Management, 39(1): 31-49.
Messick, David M., and Diane M. Mackie. 1989. “Intergroup Relations.” Annual Review of
Psychology, 40(1): 45-81.
Nye, Joseph S. 1967. “Corruption and Political Development: A Cost-Benefit Analysis.”
American Political Science Review, 61(2): 417–427.
Perez-Gonzalez, Francisco. 2006. “Inherited Control and Firm Performance.” American
Economic Review, 96(5): 1559-1588.
Robertson-Snape, Fiona. 1999. “Corruption, Collusion, and Nepotism in Indonesia.” Third
World Quarterly, 20(3): 589-601.
Shleifer, Andrei, and Robert W. Vishny. 1993. “Corruption.” Quarterly Journal of Economics,
108(3): 599–617.
Sidanius, Jim, Felicia Pratto, and Michael Mitchell. 2001. “In-Group Identification, Social
Dominance Orientation, and Differential Intergroup Social Allocation.” Journal of Social
Psychology, 134(2): 151-167.
Singell, Larry D., and James Thornton. 1997. “Nepotism, Discrimination, and the Persistence of
Utility-Maximizing, Owner-Operated Firms.” Southern Economic Journal, 63(4): 904-
919.
29
Slonim, Robert, and Ellen Garbarino. 2008. “Increases in Trust and Altruism from Partner
Selection: Experimental Evidence.” Experimental Economics, 11(2): 134-153.
Sun, Yan. 1999. “Reform, State, and Corruption: Is Corruption Less Destructive in China than in
Russia?” Comparative Politics, 32(1): 1-20.
Tajfel, Henri. 1974. “Social Identity and Intergroup Behaviour.” Social Science Information,
13(2): 65-93.
Tajfel, Henri. 1982. “Social Psychology of Intergroup Relations.” In Mark R. Rosenzweig and
Lyman W. Porter (Eds.), Annual Review of Psychology, 33: 1-39. Palo Alto, CA: Annual
Reviews.
Tajfel, Henri, and John Turner. 1979. “An Integrative Theory of Intergroup Conflict.” In William
G. Austin and Stephen Worchel (Eds.), The Social Psychology of Intergroup Relations,
Monterey, CA: Brooks-Cole.
Tangri, Roger, and Andrew Mwenda. 2001. “Corruption and Cronyism in Uganda‟s Privatization
in the 1990s.” African Affairs, 100(398): 117-133.
Tanzi, Vito, and Hamid Davoodi. 2002. “Corruption, Public Investment, and Growth.” in George
T. Abed and Sanjeev Gupta (Eds.), Governance, Corruption, and Economic
Performance, Washington, D.C.: International Monetary Fund.
Treisman, Daniel. 2000. “The Causes of Corruption: A Cross-National Study.” Journal of Public
Economics, 76(3): 399-457.
Vanhanen, Tatu. 1999. “Domestic Ethnic Conflict and Ethnic Nepotism: A Comparative
Analysis.” Journal of Peace Research, 36(1): 55-73.
You, Jong-sung, and Sanjeev Khagram. 2005. “A Comparative Study of Inequality and
Corruption.” American Sociological Review, 70(1): 136-157.
30
Deconstructing Nepotism – Tables and Figures
Table 1: Study Design
Partner Choice No Choice
Free Nepotism N = 78 N = 68
Costly Nepotism N = 78 N = 72
31
Table 2: Probability of Selecting (Preferring) a Group Member as Responder
(Marginal effects) a,b,c
(1) (2)
Free Costly
No Choice -0.021 -0.136
(0.08) (0.10)
% ΔExpected Returnsd 0.045* 0.024**
(Group minus Other) (0.02) (0.01)
ΔAltruisme 0.074* 0.042
(Group minus Other) (0.03) (0.03)
Gamble Choice 0.005 -0.075*
(0.02) (0.03)
Female = 1 0.075 0.065
(0.09) (0.11)
Group Identity -0.012 0.070‡
(0.03) (0.04)
Generalized Trust -0.001 -0.025
(0.03) (0.04)
Generalized Fairness -0.007 -0.006
(0.03) (0.03)
Observations 73 75
Pseudo R-Squared 0.284 0.307
Chi-Squared 17.580 31.590
P 0.025 0.000
Log Likelihood -22.160 -35.650 Notes: a
Logit regressions. Dependent variable takes on a value of 1 if subject selected (preferred) a group member as
partner in the trust game. b
Models pool and estimate the No Choice and Partner Choice treatments. Model I reports marginal effects
coefficients for the Free Nepotism treatments while Model II reports marginal effects for the Costly Nepotism
Treatments. c
‡ 10%, * 5%, ** 1%, *** 0.1% significance level. Standard errors in parentheses. d
Our measure of expectations of reciprocity is a relative measure. The variable measures the difference in
expectations between in-group members and others. Thus, positive values mean subjects expect more back
from their group members, while negative values mean subjects expect less back from their group members
(relative to others). e
Our measure of altruism is a relative measure. The variable measures the difference in dictator giving to in-
group members and others. Thus, positive values are subjects giving more to in-group members relative to
others, while negative values are subjects giving more to others.
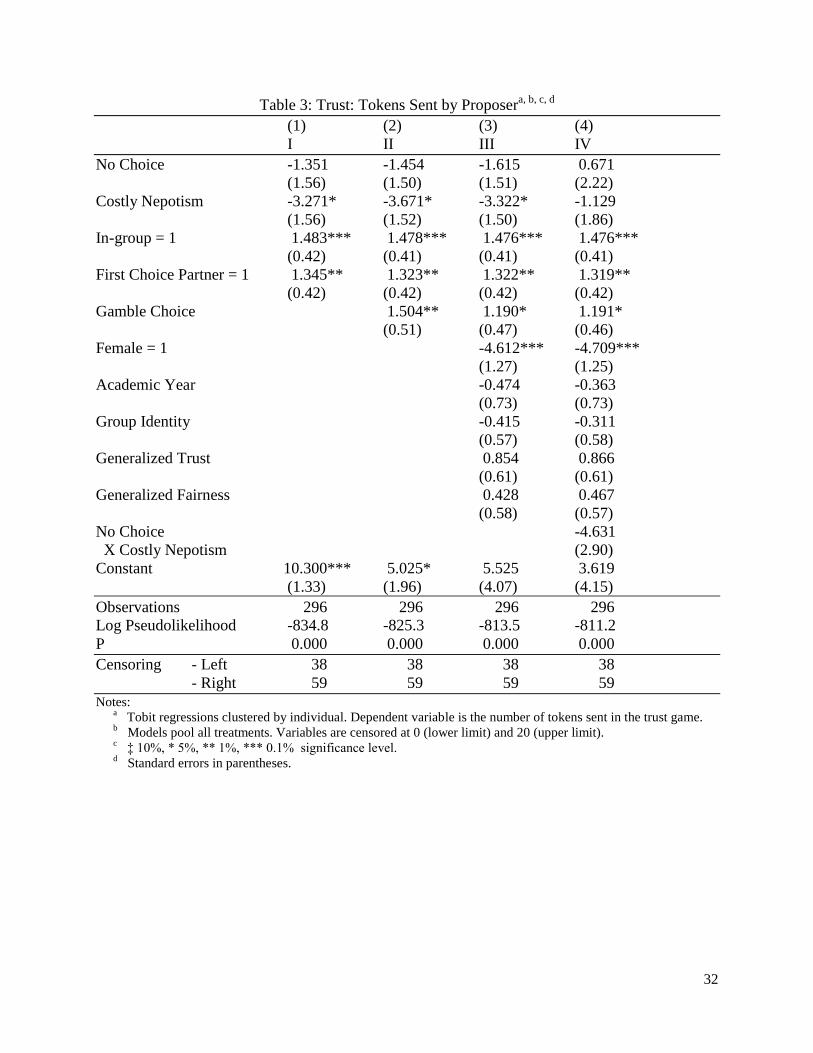
32
Table 3: Trust: Tokens Sent by Proposera, b, c, d
(1) (2) (3) (4)
I II III IV
No Choice -1.351 -1.454 -1.615 0.671
(1.56) (1.50) (1.51) (2.22)
Costly Nepotism -3.271* -3.671* -3.322* -1.129
(1.56) (1.52) (1.50) (1.86)
In-group = 1 1.483*** 1.478*** 1.476*** 1.476***
(0.42) (0.41) (0.41) (0.41)
First Choice Partner = 1 1.345** 1.323** 1.322** 1.319**
(0.42) (0.42) (0.42) (0.42)
Gamble Choice 1.504** 1.190* 1.191*
(0.51) (0.47) (0.46)
Female = 1 -4.612*** -4.709***
(1.27) (1.25)
Academic Year -0.474 -0.363
(0.73) (0.73)
Group Identity -0.415 -0.311
(0.57) (0.58)
Generalized Trust 0.854 0.866
(0.61) (0.61)
Generalized Fairness 0.428 0.467
(0.58) (0.57)
No Choice -4.631
X Costly Nepotism (2.90)
Constant 10.300*** 5.025* 5.525 3.619
(1.33) (1.96) (4.07) (4.15)
Observations 296 296 296 296
Log Pseudolikelihood -834.8 -825.3 -813.5 -811.2
P 0.000 0.000 0.000 0.000
Censoring - Left 38 38 38 38
- Right 59 59 59 59
Notes: a
Tobit regressions clustered by individual. Dependent variable is the number of tokens sent in the trust game. b
Models pool all treatments. Variables are censored at 0 (lower limit) and 20 (upper limit). c
‡ 10%, * 5%, ** 1%, *** 0.1% significance level. d
Standard errors in parentheses.
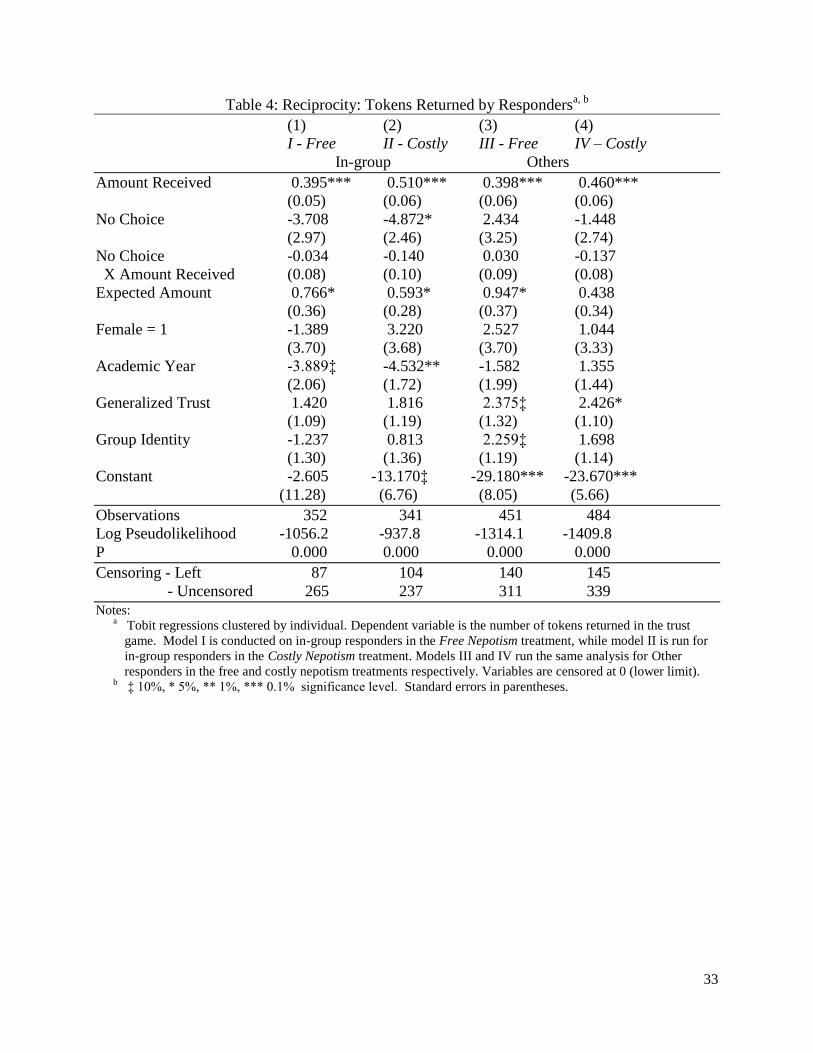
33
Table 4: Reciprocity: Tokens Returned by Respondersa, b
(1) (2) (3) (4)
I - Free II - Costly III - Free IV – Costly
In-group Others
Amount Received 0.395*** 0.510*** 0.398*** 0.460***
(0.05) (0.06) (0.06) (0.06)
No Choice -3.708 -4.872* 2.434 -1.448
(2.97) (2.46) (3.25) (2.74)
No Choice -0.034 -0.140 0.030 -0.137
X Amount Received (0.08) (0.10) (0.09) (0.08)
Expected Amount 0.766* 0.593* 0.947* 0.438
(0.36) (0.28) (0.37) (0.34)
Female = 1 -1.389 3.220 2.527 1.044
(3.70) (3.68) (3.70) (3.33)
Academic Year -3.889‡ -4.532** -1.582 1.355
(2.06) (1.72) (1.99) (1.44)
Generalized Trust 1.420 1.816 2.375‡ 2.426*
(1.09) (1.19) (1.32) (1.10)
Group Identity -1.237 0.813 2.259‡ 1.698
(1.30) (1.36) (1.19) (1.14)
Constant -2.605 -13.170‡ -29.180*** -23.670***
(11.28) (6.76) (8.05) (5.66)
Observations 352 341 451 484
Log Pseudolikelihood -1056.2 -937.8 -1314.1 -1409.8
P 0.000 0.000 0.000 0.000
Censoring - Left 87 104 140 145
- Uncensored 265 237 311 339
Notes: a
Tobit regressions clustered by individual. Dependent variable is the number of tokens returned in the trust
game. Model I is conducted on in-group responders in the Free Nepotism treatment, while model II is run for
in-group responders in the Costly Nepotism treatment. Models III and IV run the same analysis for Other
responders in the free and costly nepotism treatments respectively. Variables are censored at 0 (lower limit). b
‡ 10%, * 5%, ** 1%, *** 0.1% significance level. Standard errors in parentheses.
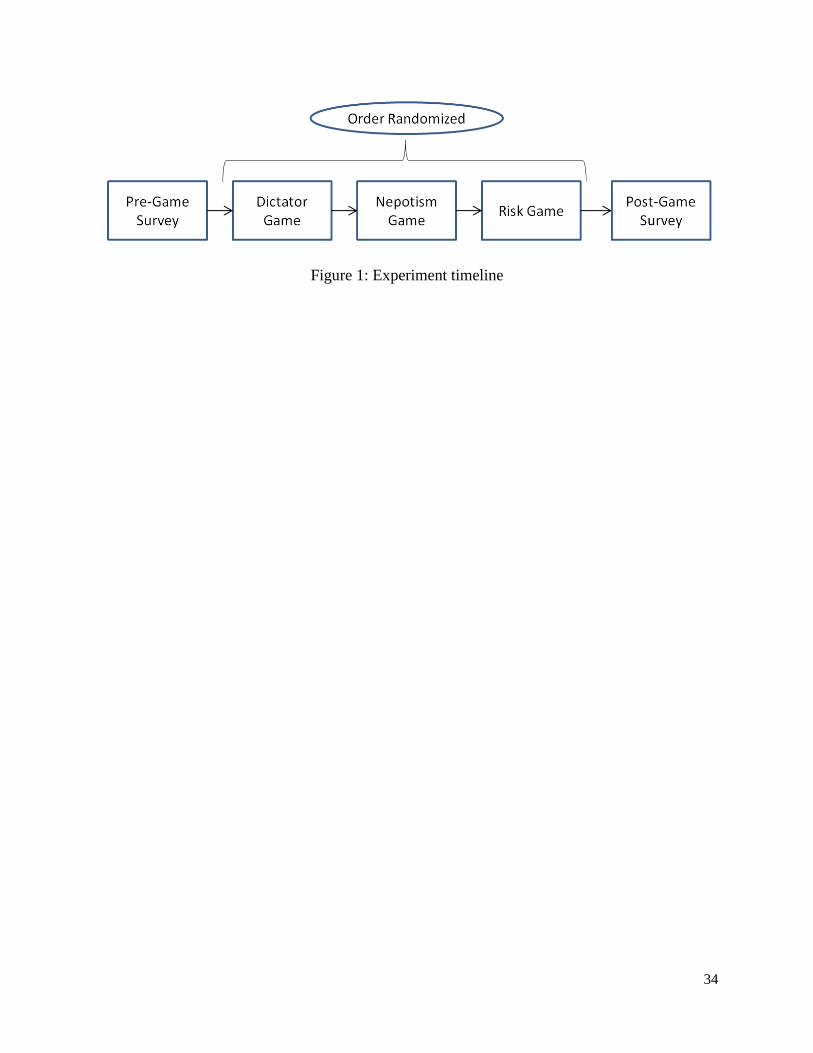
34
Figure 1: Experiment timeline
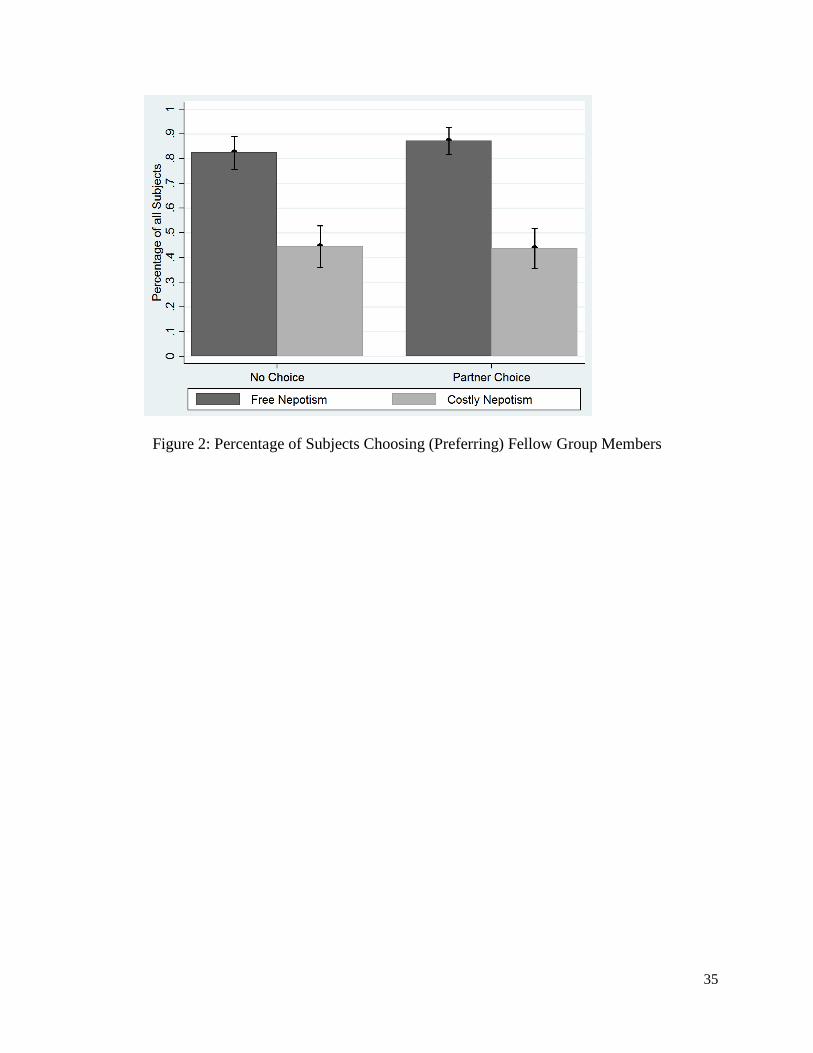
35
Figure 2: Percentage of Subjects Choosing (Preferring) Fellow Group Members
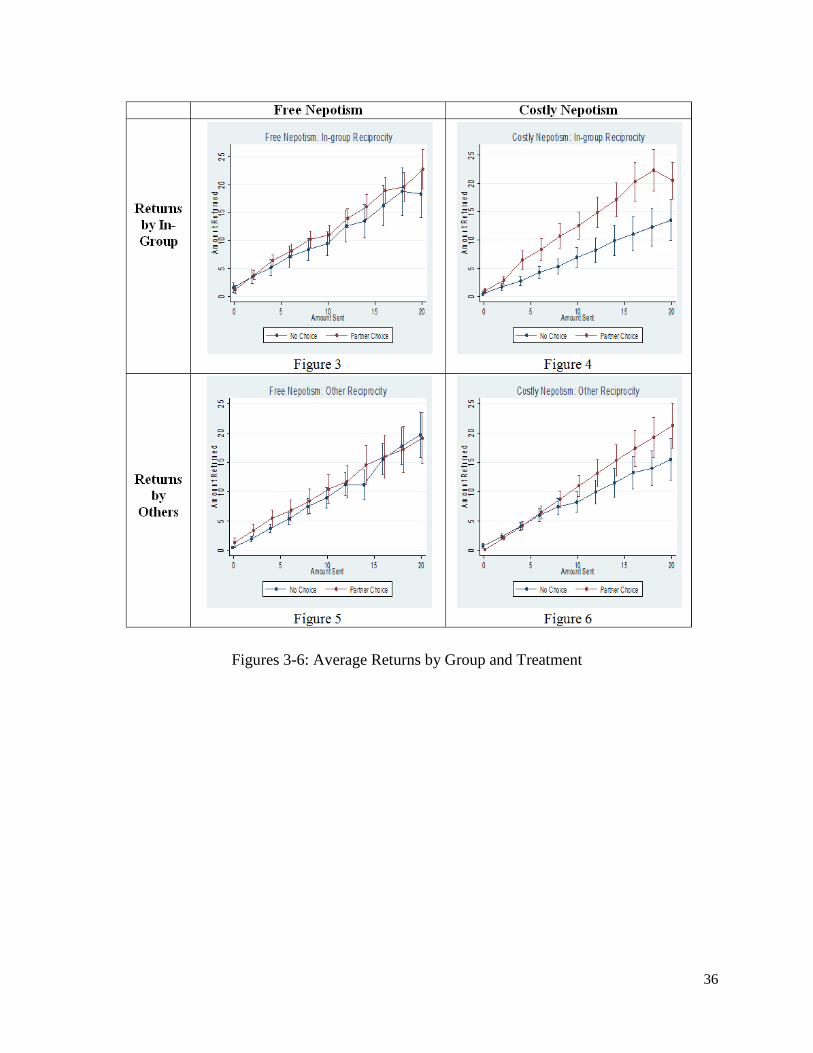
36
Figures 3-6: Average Returns by Group and Treatment
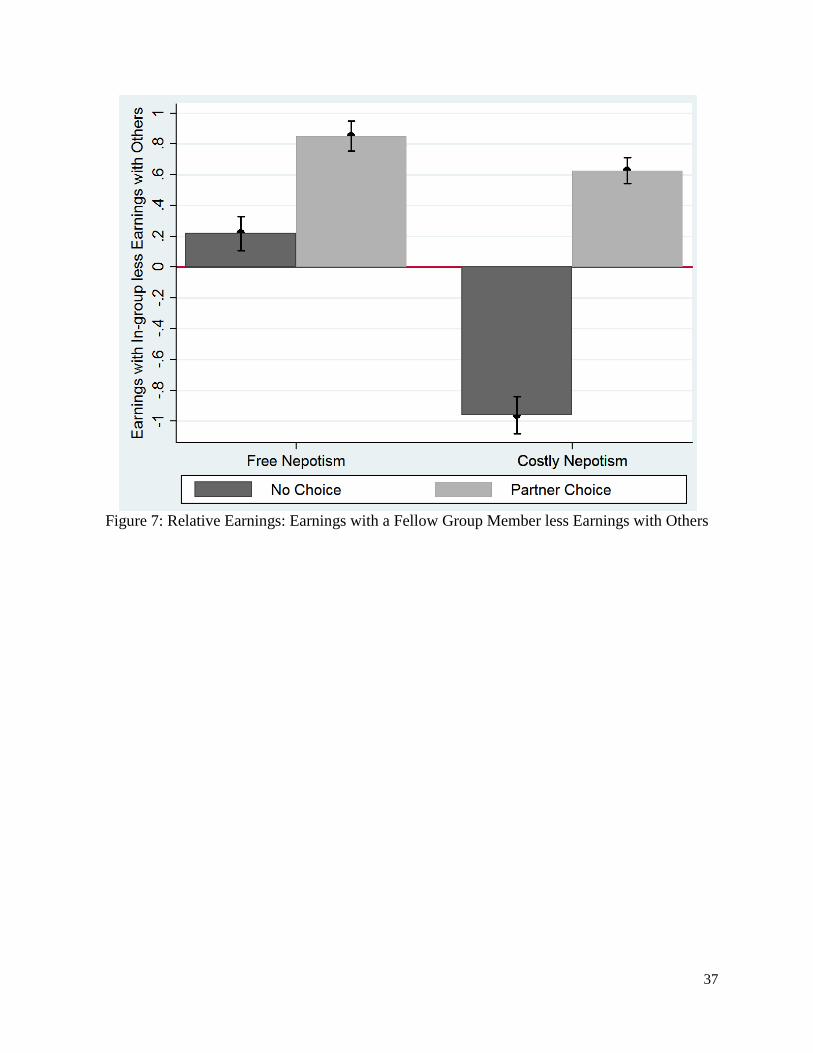
37
Figure 7: Relative Earnings: Earnings with a Fellow Group Member less Earnings with Others
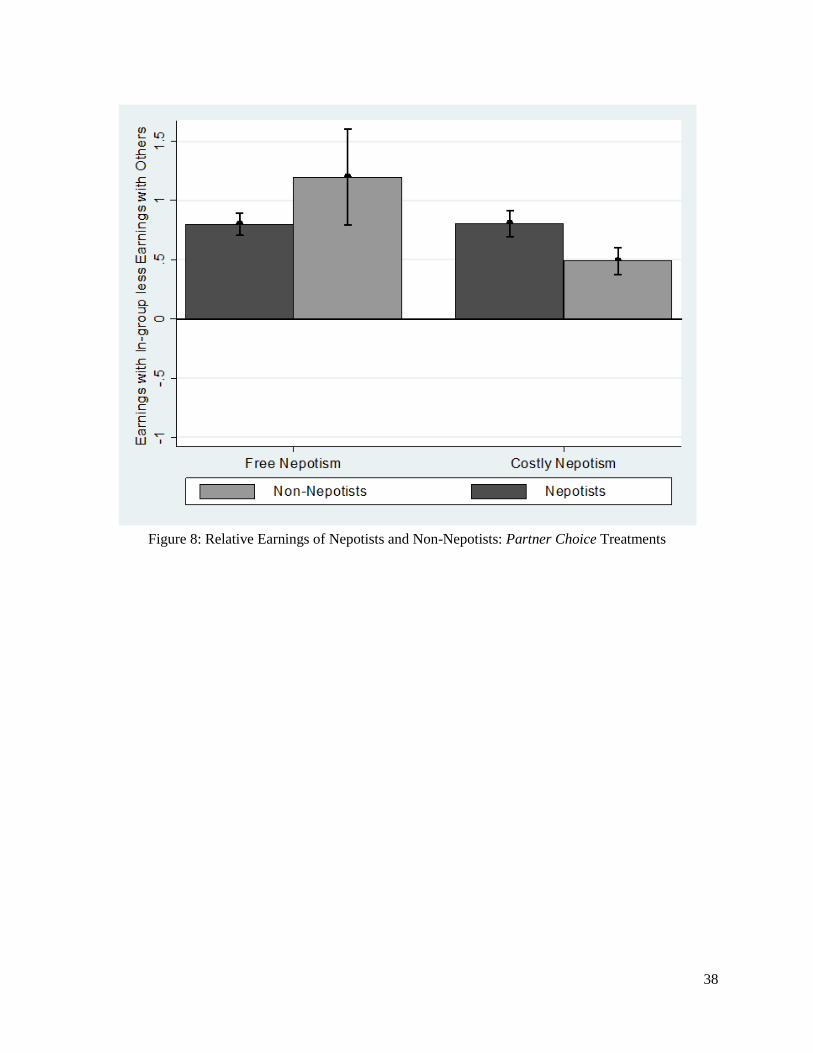
38
Figure 8: Relative Earnings of Nepotists and Non-Nepotists: Partner Choice Treatments
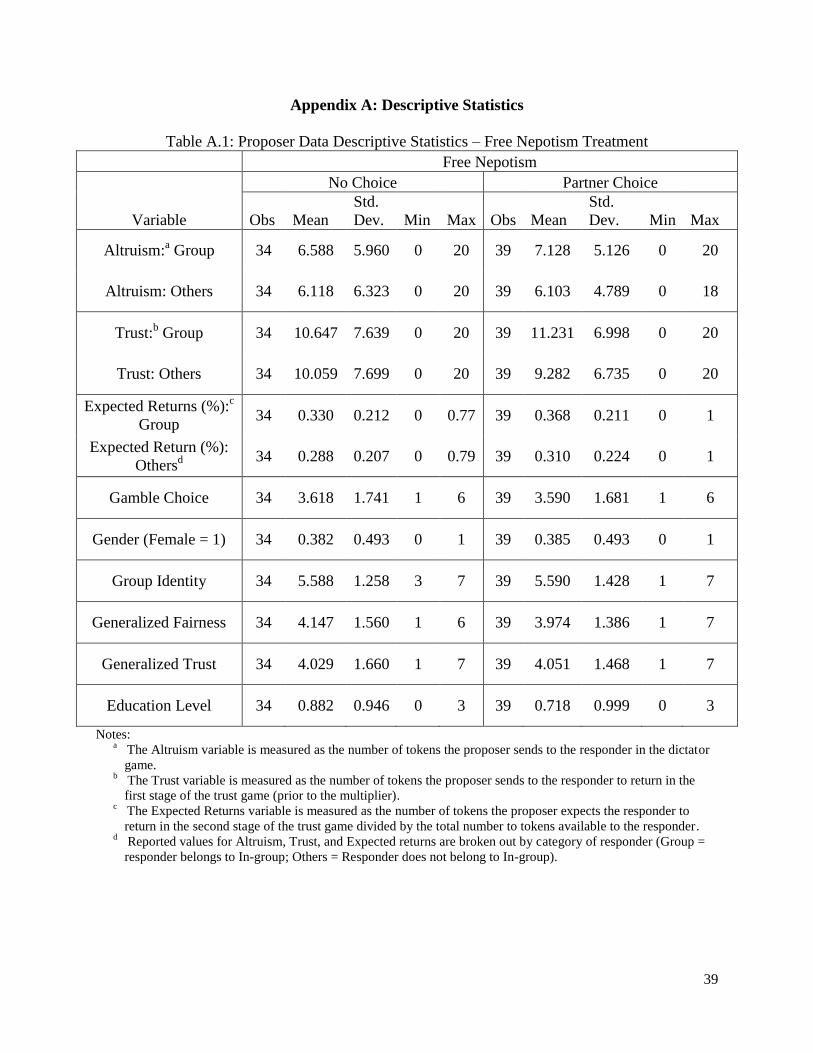
39
Appendix A: Descriptive Statistics
Table A.1: Proposer Data Descriptive Statistics – Free Nepotism Treatment
Free Nepotism
Variable
No Choice Partner Choice
Obs Mean
Std.
Dev. Min Max Obs Mean
Std.
Dev. Min Max
Altruism:a Group 34 6.588 5.960 0 20 39 7.128 5.126 0 20
Altruism: Others 34 6.118 6.323 0 20 39 6.103 4.789 0 18
Trust:b Group 34 10.647 7.639 0 20 39 11.231 6.998 0 20
Trust: Others 34 10.059 7.699 0 20 39 9.282 6.735 0 20
Expected Returns (%):c
Group 34 0.330 0.212 0 0.77 39 0.368 0.211 0 1
Expected Return (%):
Othersd
34 0.288 0.207 0 0.79 39 0.310 0.224 0 1
Gamble Choice 34 3.618 1.741 1 6 39 3.590 1.681 1 6
Gender (Female = 1) 34 0.382 0.493 0 1 39 0.385 0.493 0 1
Group Identity 34 5.588 1.258 3 7 39 5.590 1.428 1 7
Generalized Fairness 34 4.147 1.560 1 6 39 3.974 1.386 1 7
Generalized Trust 34 4.029 1.660 1 7 39 4.051 1.468 1 7
Education Level 34 0.882 0.946 0 3 39 0.718 0.999 0 3
Notes: a
The Altruism variable is measured as the number of tokens the proposer sends to the responder in the dictator
game. b
The Trust variable is measured as the number of tokens the proposer sends to the responder to return in the
first stage of the trust game (prior to the multiplier). c
The Expected Returns variable is measured as the number of tokens the proposer expects the responder to
return in the second stage of the trust game divided by the total number to tokens available to the responder. d
Reported values for Altruism, Trust, and Expected returns are broken out by category of responder (Group =
responder belongs to In-group; Others = Responder does not belong to In-group).
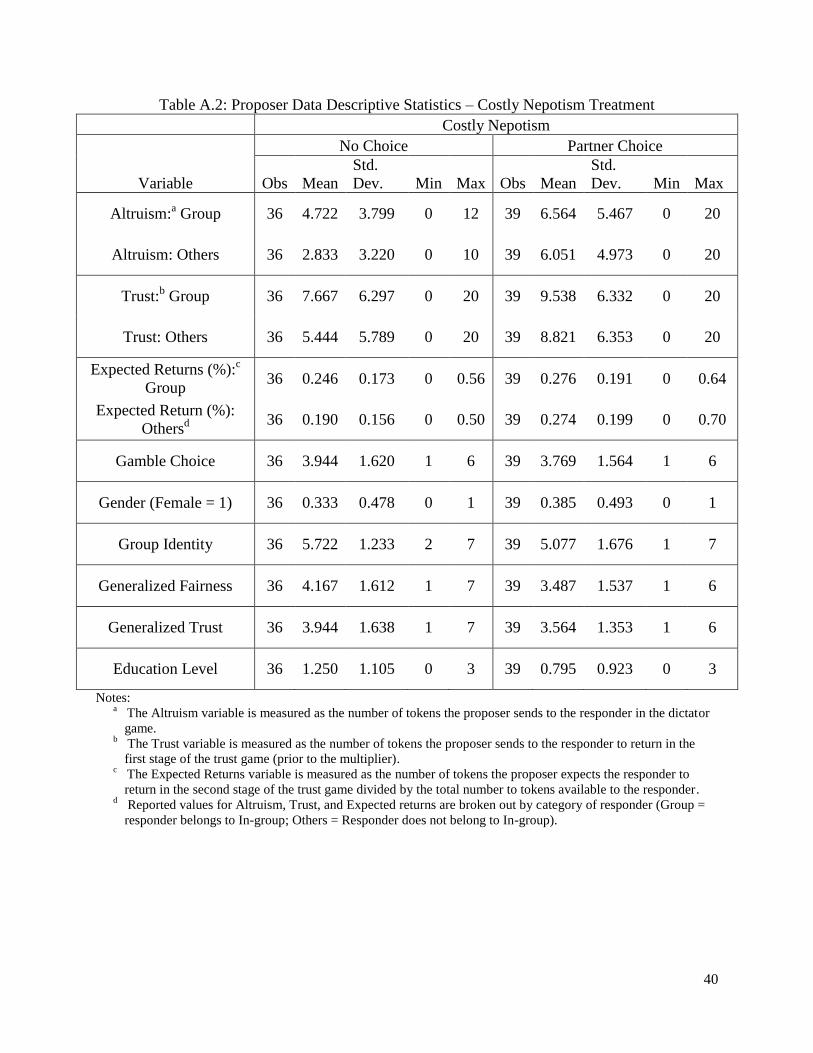
40
Table A.2: Proposer Data Descriptive Statistics – Costly Nepotism Treatment
Costly Nepotism
Variable
No Choice Partner Choice
Obs Mean
Std.
Dev. Min Max Obs Mean
Std.
Dev. Min Max
Altruism:a Group 36 4.722 3.799 0 12 39 6.564 5.467 0 20
Altruism: Others 36 2.833 3.220 0 10 39 6.051 4.973 0 20
Trust:b Group 36 7.667 6.297 0 20 39 9.538 6.332 0 20
Trust: Others 36 5.444 5.789 0 20 39 8.821 6.353 0 20
Expected Returns (%):c
Group 36 0.246 0.173 0 0.56 39 0.276 0.191 0 0.64
Expected Return (%):
Othersd
36 0.190 0.156 0 0.50 39 0.274 0.199 0 0.70
Gamble Choice 36 3.944 1.620 1 6 39 3.769 1.564 1 6
Gender (Female = 1) 36 0.333 0.478 0 1 39 0.385 0.493 0 1
Group Identity 36 5.722 1.233 2 7 39 5.077 1.676 1 7
Generalized Fairness 36 4.167 1.612 1 7 39 3.487 1.537 1 6
Generalized Trust 36 3.944 1.638 1 7 39 3.564 1.353 1 6
Education Level 36 1.250 1.105 0 3 39 0.795 0.923 0 3
Notes: a
The Altruism variable is measured as the number of tokens the proposer sends to the responder in the dictator
game. b
The Trust variable is measured as the number of tokens the proposer sends to the responder to return in the
first stage of the trust game (prior to the multiplier). c
The Expected Returns variable is measured as the number of tokens the proposer expects the responder to
return in the second stage of the trust game divided by the total number to tokens available to the responder. d
Reported values for Altruism, Trust, and Expected returns are broken out by category of responder (Group =
responder belongs to In-group; Others = Responder does not belong to In-group).
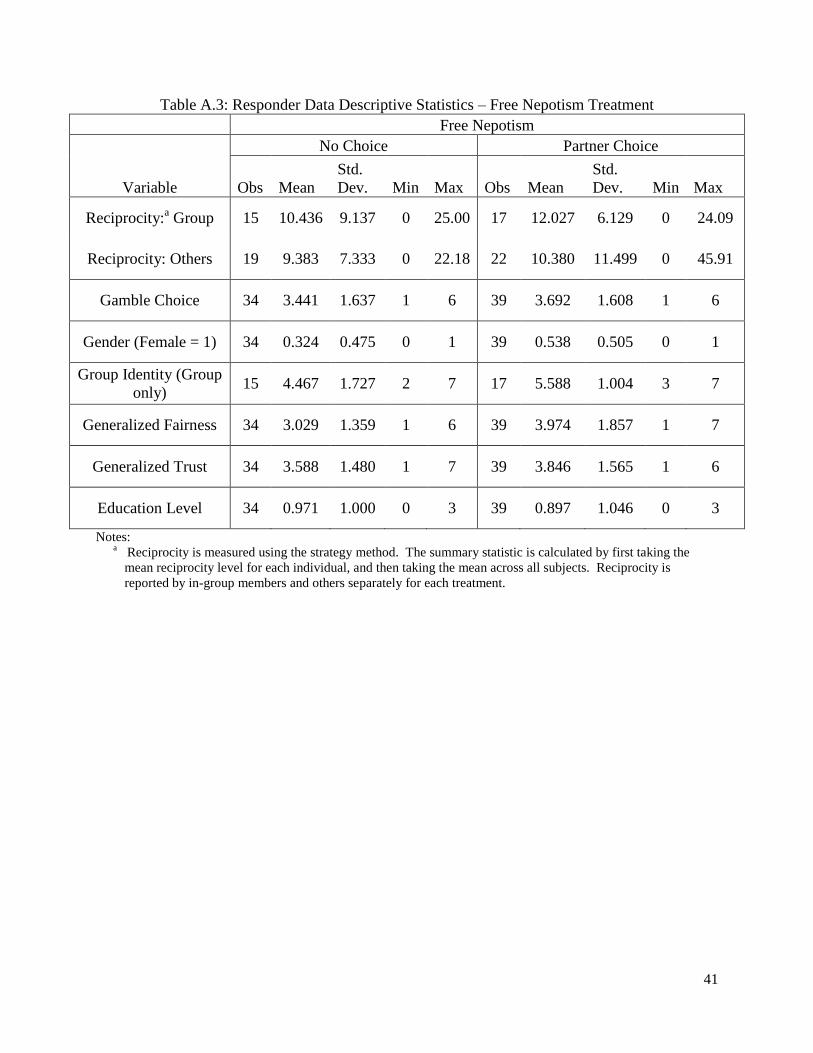
41
Table A.3: Responder Data Descriptive Statistics – Free Nepotism Treatment
Free Nepotism
Variable
No Choice Partner Choice
Obs Mean
Std.
Dev. Min Max Obs Mean
Std.
Dev. Min Max
Reciprocity:a Group 15 10.436 9.137 0 25.00 17 12.027 6.129 0 24.09
Reciprocity: Others 19 9.383 7.333 0 22.18 22 10.380 11.499 0 45.91
Gamble Choice 34 3.441 1.637 1 6 39 3.692 1.608 1 6
Gender (Female = 1) 34 0.324 0.475 0 1 39 0.538 0.505 0 1
Group Identity (Group
only) 15 4.467 1.727 2 7 17 5.588 1.004 3 7
Generalized Fairness 34 3.029 1.359 1 6 39 3.974 1.857 1 7
Generalized Trust 34 3.588 1.480 1 7 39 3.846 1.565 1 6
Education Level 34 0.971 1.000 0 3 39 0.897 1.046 0 3
Notes: a
Reciprocity is measured using the strategy method. The summary statistic is calculated by first taking the
mean reciprocity level for each individual, and then taking the mean across all subjects. Reciprocity is
reported by in-group members and others separately for each treatment.
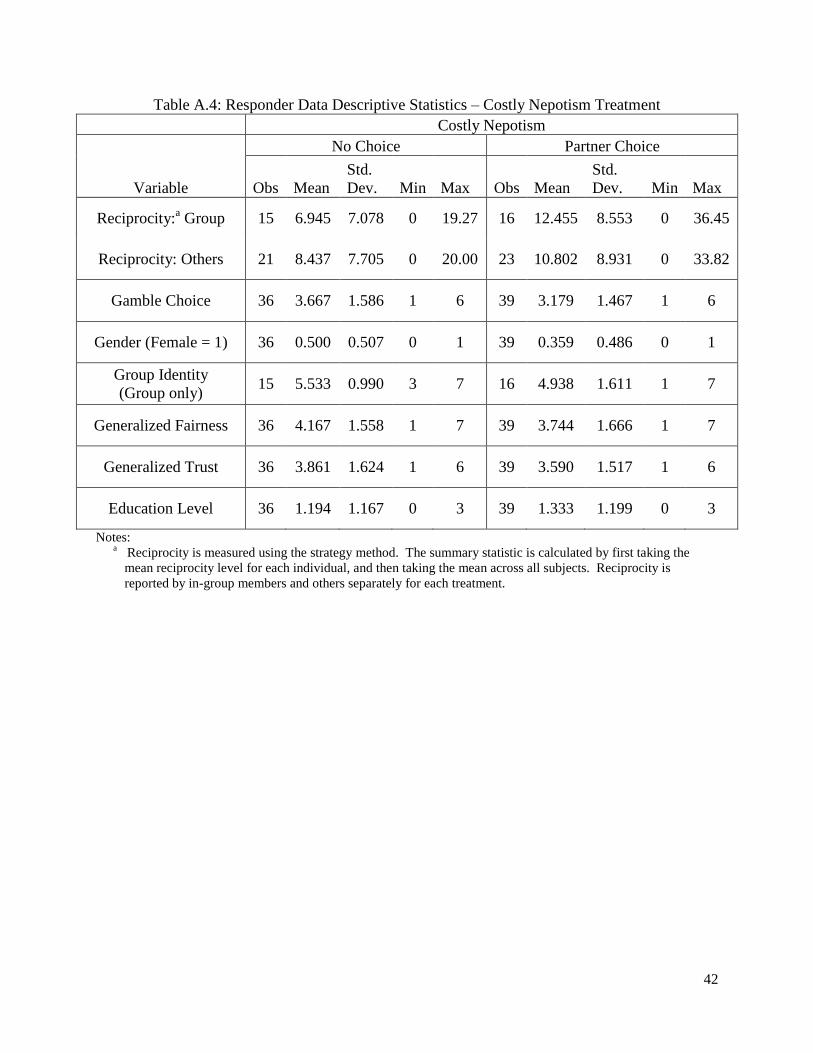
42
Table A.4: Responder Data Descriptive Statistics – Costly Nepotism Treatment
Costly Nepotism
Variable
No Choice Partner Choice
Obs Mean
Std.
Dev. Min Max Obs Mean
Std.
Dev. Min Max
Reciprocity:a Group 15 6.945 7.078 0 19.27 16 12.455 8.553 0 36.45
Reciprocity: Others 21 8.437 7.705 0 20.00 23 10.802 8.931 0 33.82
Gamble Choice 36 3.667 1.586 1 6 39 3.179 1.467 1 6
Gender (Female = 1) 36 0.500 0.507 0 1 39 0.359 0.486 0 1
Group Identity
(Group only) 15 5.533 0.990 3 7 16 4.938 1.611 1 7
Generalized Fairness 36 4.167 1.558 1 7 39 3.744 1.666 1 7
Generalized Trust 36 3.861 1.624 1 6 39 3.590 1.517 1 6
Education Level 36 1.194 1.167 0 3 39 1.333 1.199 0 3
Notes: a
Reciprocity is measured using the strategy method. The summary statistic is calculated by first taking the
mean reciprocity level for each individual, and then taking the mean across all subjects. Reciprocity is
reported by in-group members and others separately for each treatment.
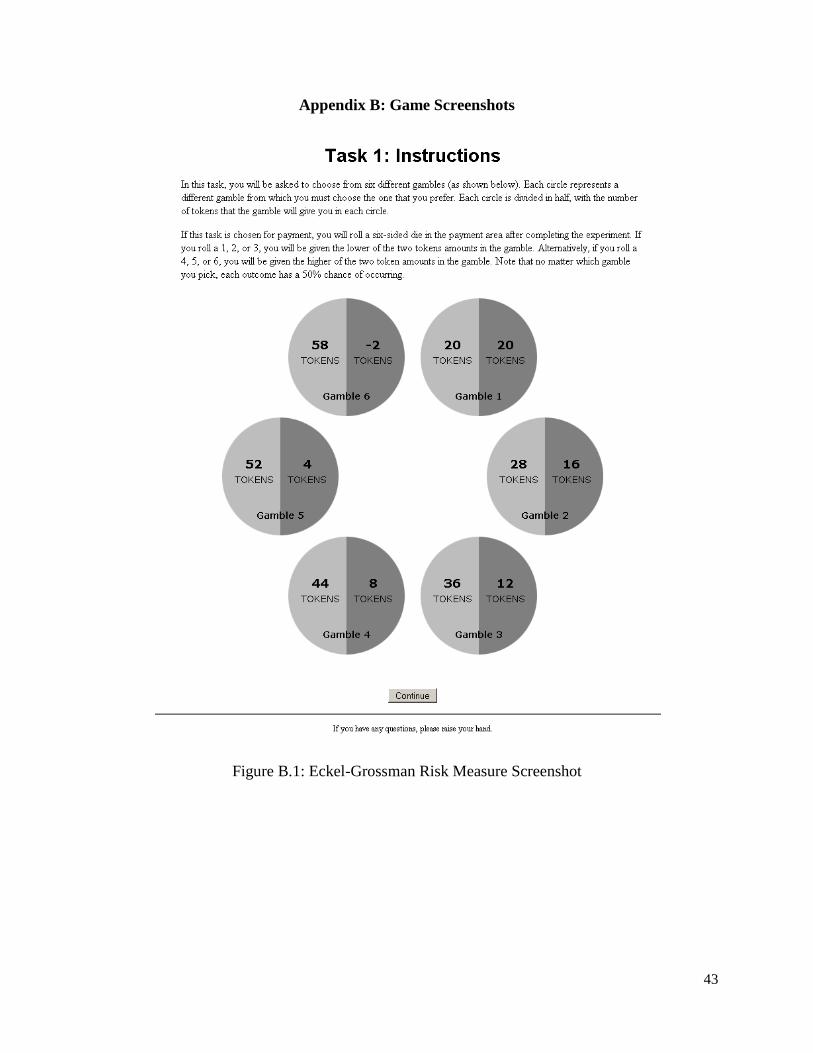
43
Appendix B: Game Screenshots
Figure B.1: Eckel-Grossman Risk Measure Screenshot
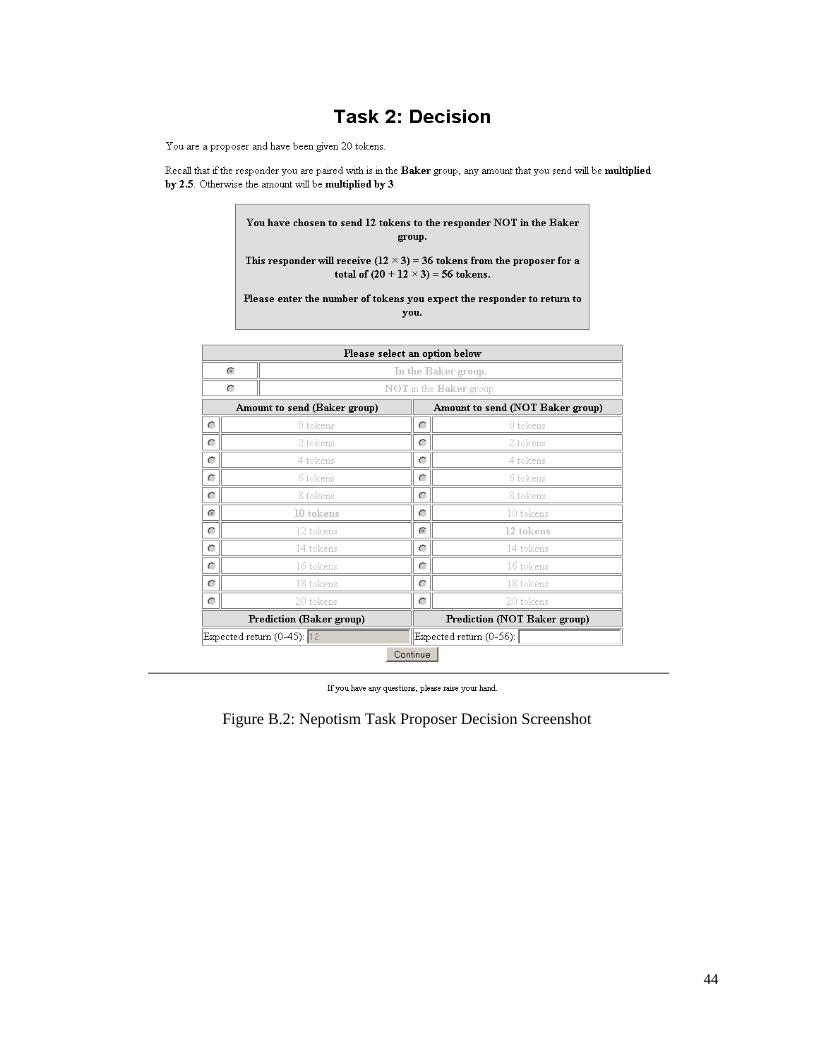
44
Figure B.2: Nepotism Task Proposer Decision Screenshot
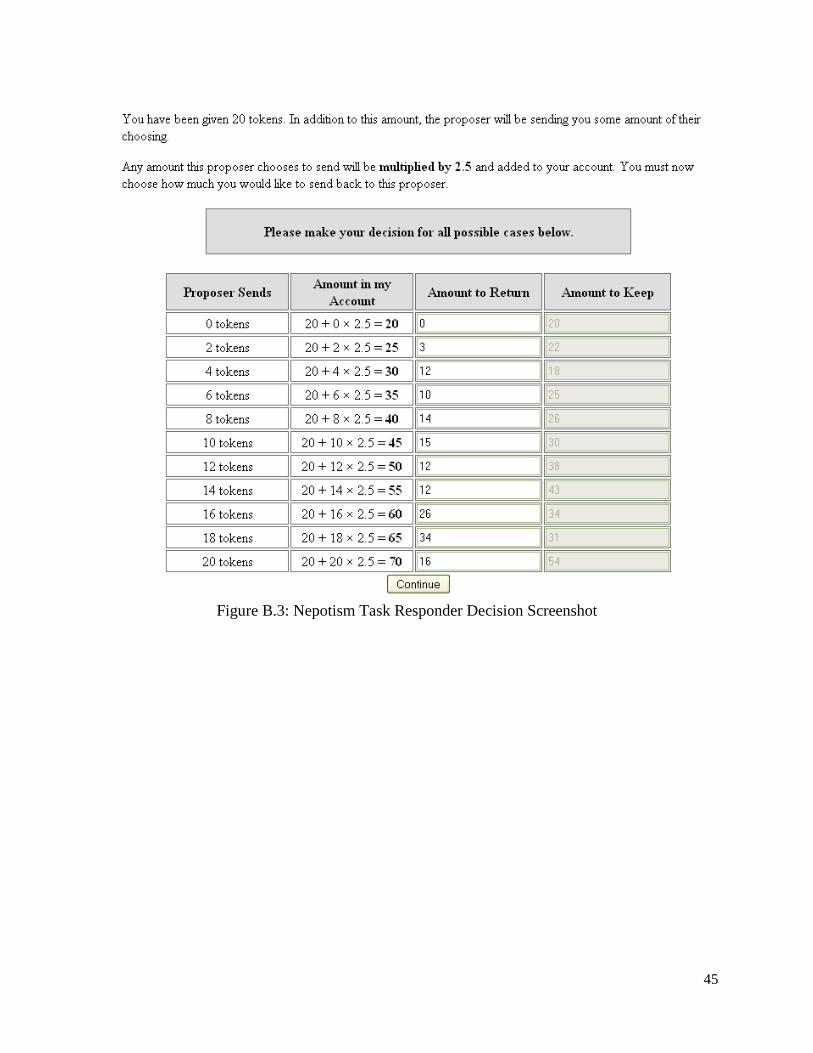
45
Figure B.3: Nepotism Task Responder Decision Screenshot
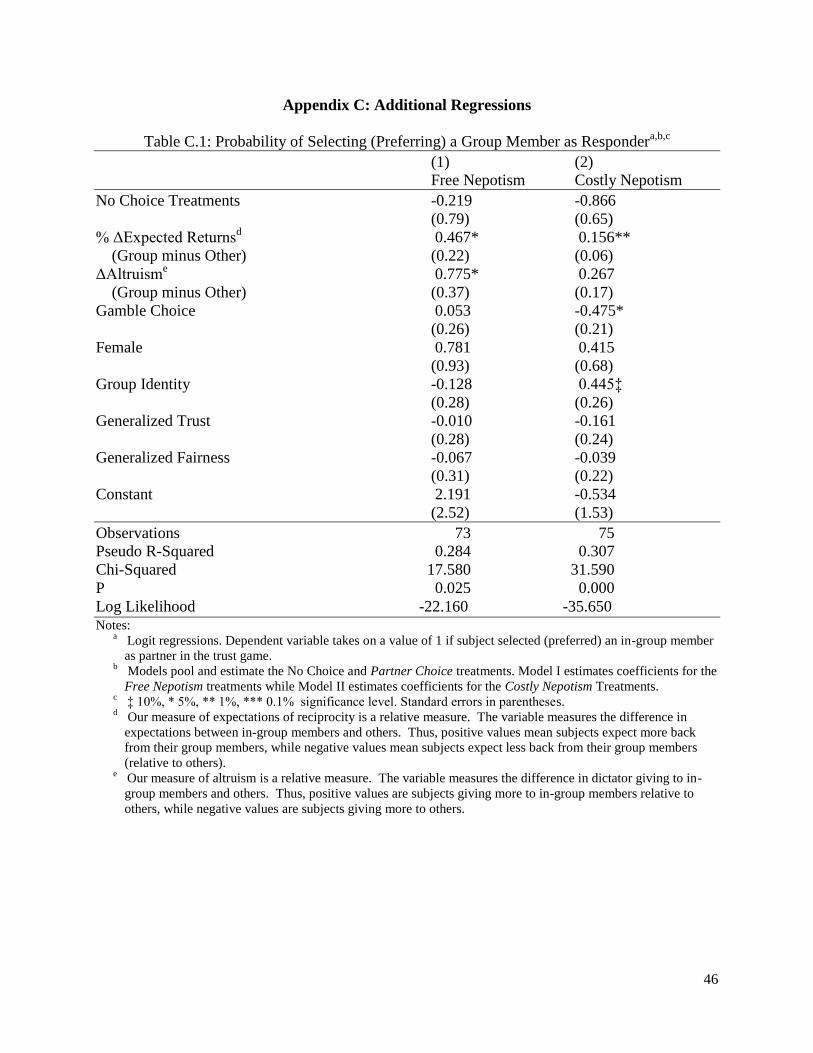
46
Appendix C: Additional Regressions
Table C.1: Probability of Selecting (Preferring) a Group Member as Respondera,b,c
(1) (2)
Free Nepotism Costly Nepotism
No Choice Treatments -0.219 -0.866
(0.79) (0.65)
% ΔExpected Returnsd 0.467* 0.156**
(Group minus Other) (0.22) (0.06)
ΔAltruisme 0.775* 0.267
(Group minus Other) (0.37) (0.17)
Gamble Choice 0.053 -0.475*
(0.26) (0.21)
Female 0.781 0.415
(0.93) (0.68)
Group Identity -0.128 0.445‡
(0.28) (0.26)
Generalized Trust -0.010 -0.161
(0.28) (0.24)
Generalized Fairness -0.067 -0.039
(0.31) (0.22)
Constant 2.191 -0.534
(2.52) (1.53)
Observations 73 75
Pseudo R-Squared 0.284 0.307
Chi-Squared 17.580 31.590
P 0.025 0.000
Log Likelihood -22.160 -35.650 Notes: a
Logit regressions. Dependent variable takes on a value of 1 if subject selected (preferred) an in-group member
as partner in the trust game. b
Models pool and estimate the No Choice and Partner Choice treatments. Model I estimates coefficients for the
Free Nepotism treatments while Model II estimates coefficients for the Costly Nepotism Treatments. c
‡ 10%, * 5%, ** 1%, *** 0.1% significance level. Standard errors in parentheses. d
Our measure of expectations of reciprocity is a relative measure. The variable measures the difference in
expectations between in-group members and others. Thus, positive values mean subjects expect more back
from their group members, while negative values mean subjects expect less back from their group members
(relative to others). e
Our measure of altruism is a relative measure. The variable measures the difference in dictator giving to in-
group members and others. Thus, positive values are subjects giving more to in-group members relative to
others, while negative values are subjects giving more to others.
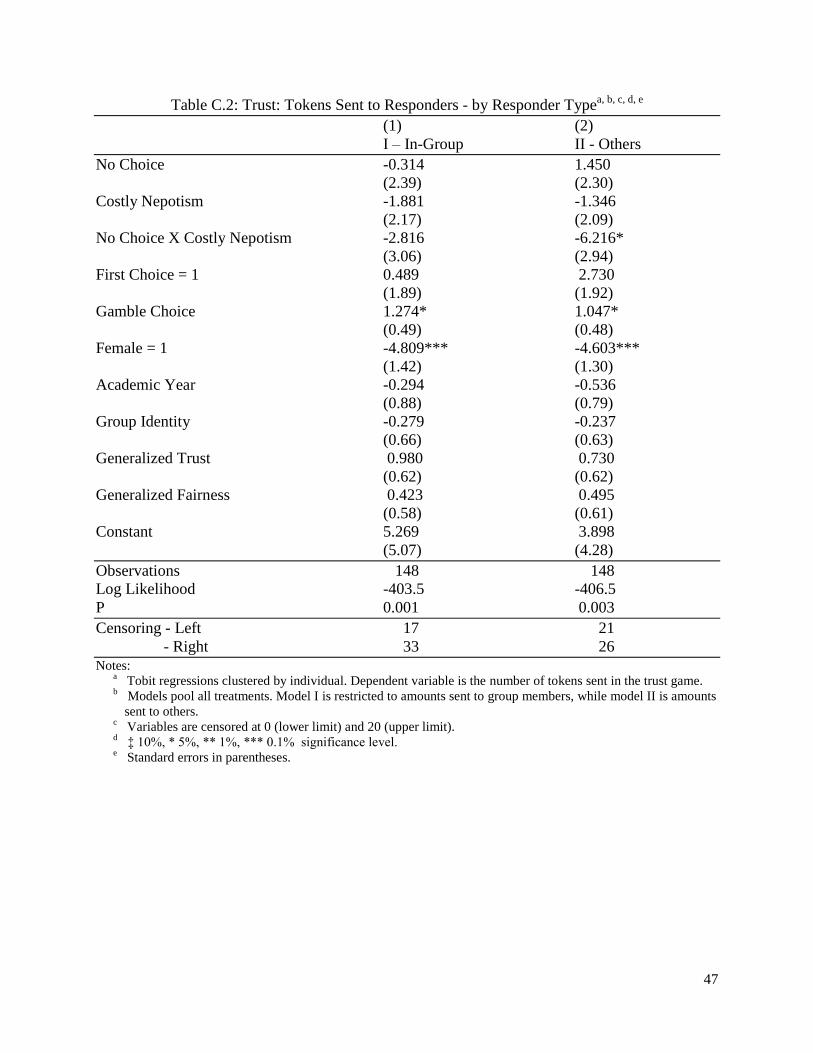
47
Table C.2: Trust: Tokens Sent to Responders - by Responder Typea, b, c, d, e
(1) (2)
I – In-Group II - Others
No Choice -0.314 1.450
(2.39) (2.30)
Costly Nepotism -1.881 -1.346
(2.17) (2.09)
No Choice X Costly Nepotism -2.816 -6.216*
(3.06) (2.94)
First Choice = 1 0.489 2.730
(1.89) (1.92)
Gamble Choice 1.274* 1.047*
(0.49) (0.48)
Female = 1 -4.809*** -4.603***
(1.42) (1.30)
Academic Year -0.294 -0.536
(0.88) (0.79)
Group Identity -0.279 -0.237
(0.66) (0.63)
Generalized Trust 0.980 0.730
(0.62) (0.62)
Generalized Fairness 0.423 0.495
(0.58) (0.61)
Constant 5.269 3.898
(5.07) (4.28)
Observations 148 148
Log Likelihood -403.5 -406.5
P 0.001 0.003
Censoring - Left 17 21
- Right 33 26
Notes: a
Tobit regressions clustered by individual. Dependent variable is the number of tokens sent in the trust game. b
Models pool all treatments. Model I is restricted to amounts sent to group members, while model II is amounts
sent to others. c
Variables are censored at 0 (lower limit) and 20 (upper limit). d
‡ 10%, * 5%, ** 1%, *** 0.1% significance level. e
Standard errors in parentheses.
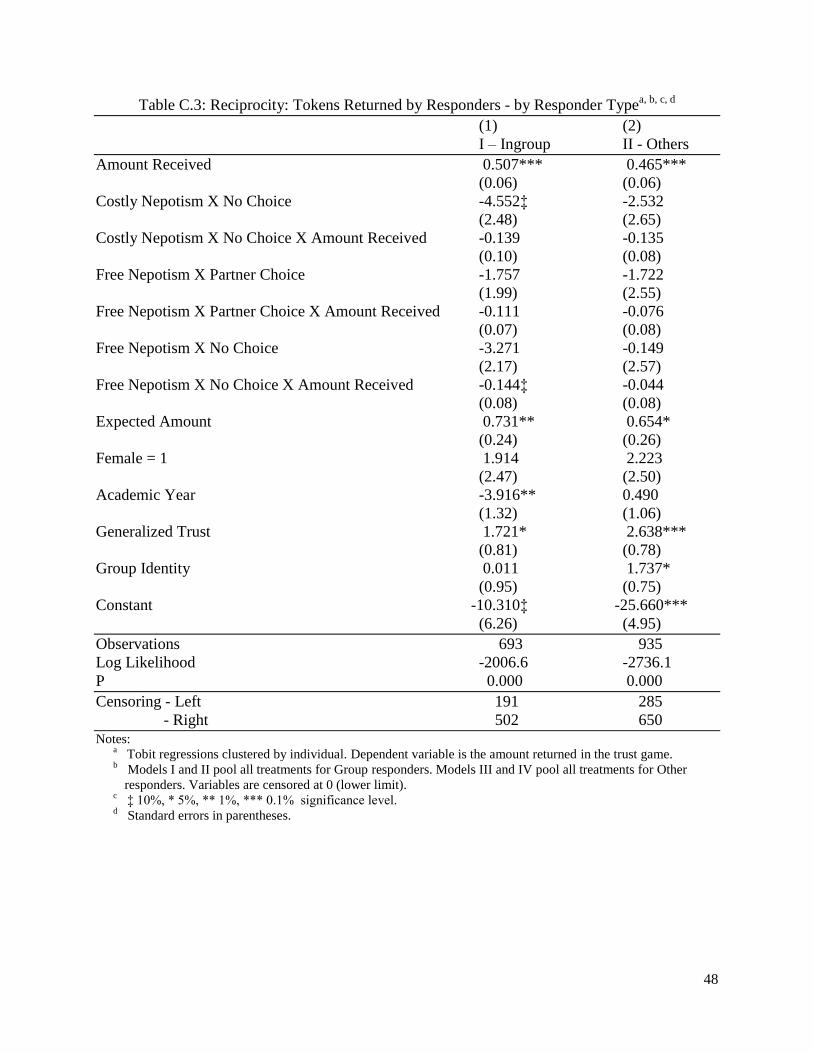
48
Table C.3: Reciprocity: Tokens Returned by Responders - by Responder Typea, b, c, d
(1) (2)
I – Ingroup II - Others
Amount Received 0.507*** 0.465***
(0.06) (0.06)
Costly Nepotism X No Choice -4.552‡ -2.532
(2.48) (2.65)
Costly Nepotism X No Choice X Amount Received -0.139 -0.135
(0.10) (0.08)
Free Nepotism X Partner Choice -1.757 -1.722
(1.99) (2.55)
Free Nepotism X Partner Choice X Amount Received -0.111 -0.076
(0.07) (0.08)
Free Nepotism X No Choice -3.271 -0.149
(2.17) (2.57)
Free Nepotism X No Choice X Amount Received -0.144‡ -0.044
(0.08) (0.08)
Expected Amount 0.731** 0.654*
(0.24) (0.26)
Female = 1 1.914 2.223
(2.47) (2.50)
Academic Year -3.916** 0.490
(1.32) (1.06)
Generalized Trust 1.721* 2.638***
(0.81) (0.78)
Group Identity 0.011 1.737*
(0.95) (0.75)
Constant -10.310‡ -25.660***
(6.26) (4.95)
Observations 693 935
Log Likelihood -2006.6 -2736.1
P 0.000 0.000
Censoring - Left 191 285
- Right 502 650
Notes: a
Tobit regressions clustered by individual. Dependent variable is the amount returned in the trust game. b
Models I and II pool all treatments for Group responders. Models III and IV pool all treatments for Other
responders. Variables are censored at 0 (lower limit). c
‡ 10%, * 5%, ** 1%, *** 0.1% significance level. d
Standard errors in parentheses.


