Embed Size (px)
Citation preview
Debonding resistance of FRP-to-clay brick masonry joints
J. Kashyap a, C.R. Willis a, M.C. Griffith a,⇑, J.M. Ingham b, M.J. Masia c
a School of Civil, Environmental and Mining Engineering, The University of Adelaide, Adelaide, SA 5005, AustraliabDept. of Civil and Environmental Engineering, The University of Auckland, Auckland, Private Bag 92019, New ZealandcCentre for Infrastructure Performance and Reliability, The University of Newcastle, Faculty of Engineering, Callaghan, NSW 2308, Australia
a r t i c l e i n f o
Article history:
Received 21 May 2011
Revised 15 March 2012
Accepted 16 March 2012
Keywords:
Masonry
FRP
Strengthening
Debonding
Bond pull-tests
Bond strength model
a b s t r a c t
Debonding at the FRP-to-masonry interface has been identified as the preferred failure mechanism in
fibre-reinforced polymer (FRP) retrofitted masonry as it allows for some redistribution of forces. The
results of 14 FRP-to-masonry bond tests are presented, where the FRP was near surface mounted
(NSM) to stack-bonded clay brick masonry. These tests were conducted to investigate the effect that vari-
ables such as cyclic loading and FRP strip dimensions have on the debonding resistance of a NSM FRP-to-
masonry joint. These results were then incorporated into a large database of FRP retrofitted masonry pull
test results by various researchers over the past 10 years. The database includes results for both exter-
nally bonded (EB) and NSM retrofitting techniques. From this database, local bond–slip parameters such
as the maximum interface shear stress, smax, and the maximum slip, dmax, were investigated to determine
correlations between these values and masonry material properties. Further, 15 existing concrete and
masonry bond strength (maximum load at the FRP-to-substrate interface) models in the literature were
assessed for their use with masonry by comparing these models against the results in the pull test data-
base. Based on the comparative statistics of the test-to-predicted bond strength it is concluded that a new
FRP-to-masonry bond model is required which gives more accurate predictions. Results include a discus-
sion on the global load–slip response and FRP-to-masonry interface behaviour.
Ó 2012 Elsevier Ltd. All rights reserved.
1. Introduction and background
Unreinforced masonry (URM) structures constitute both a sig-
nificant portion of the world’s heritage buildings and a significant
component of the modern residential building stock, and are par-
ticularly susceptible to damage from out-of-plane loads such as
those generated by earthquakes [1]. Over the past decade or so,
the use of near surface mounted (NSM) fibre reinforced polymers
(FRPs) has gained much attention as a promising new seismic
strengthening technique [2–6]. The NSM FRP retrofitting technique
(i.e. inserting FRP strips into grooves cut into the surface of a wall)
provides significant advantages over externally bonded (EB) FRP
such as improved aesthetics, reduced surface preparation and bet-
ter protection from UV exposure and vandalism. Importantly, NSM
FRP debonds at higher strains than EB FRP and thus leads to more
efficient use of the FRP material [7]. When using the NSM tech-
nique, the most efficient cross-section is a thin rectangular strip
as its benefits, in terms of efficiency and construction time, are
superior to those of other shapes such as bars [8].
Some of the common out-of-plane failure mechanisms of FRP
strengthened masonry walls include sliding of the masonry units,
flexural-shear cracking, FRP rupture, FRP debonding, punching
shear and crushing of brick in compression [9–14]. Among these
debonding mechanisms, intermediate crack (IC) debonding gov-
erns the increase in moment capacity and sectional ductility. IC
debonding involves progressive detachment of the NSM FRP strip
which initiates at the location of intermediate flexural or flex-
ural-shear cracks when the strip is subjected to large tension
stress. If the FRP is perfectly attached to the masonry then theoret-
ically the FRP strip requires infinite strain capacity in order to
bridge the intercepting cracks. As such strain levels are not possi-
ble, debonding cracks will occur at the FRP-to-substrate interface
and gradually propagate towards the strip ends [15,16] as long
as the debonding strain is lower than the tensile rupture strain
for the FRP.
IC debonding may be further divided into two types: (i) associ-
atedwith the presence of a single crack in amember; and, (ii) where
multiple cracks are distributed along the length of a member
[17,18]. The stress state at the interface for type (i) (refer Fig. 1a)
can be idealised using a pull test where a tensile force (P) is applied
to the FRP strip causing a slip (D) at the crack face as shown in
Fig. 1(b). The resulting P–D response is referred to as the global
load–slip response which depends on the interfacial bond charac-
teristics between the FRP and the surrounding masonry substrate
such as the interface shear stress, s and the local interface slip, d.
The local s–d response is known as the local bond–slip behaviour.
Pull tests are a useful and relatively inexpensive testing procedure
0141-0296/$ - see front matter Ó 2012 Elsevier Ltd. All rights reserved.
http://dx.doi.org/10.1016/j.engstruct.2012.03.032
⇑ Corresponding author. Tel.: +61 8 8303 5451; fax: +61 8 8303 4359.
E-mail address: [email protected] (M.C. Griffith).
Engineering Structures 41 (2012) 186–198
Contents lists available at SciVerse ScienceDirect
Engineering Structures
journal homepage: www.elsevier .com/locate /engstruct

that can be used to investigate the interface s–d behaviour aswell as
to determine the critical bond length, Leff, the strain in the FRP strip
at the onset of debonding, edb, and other factors impacting the bond
strength. Furthermore, the debonding resistance obtained from
FRP-plated pull tests is a lower bound to the IC debonding resistance
in beams due to effects of moment and crack distribution [17–20].
Hence, to understand the behaviour of a FRP-strengthened URM
wall subjected to out-of-plane loading, the FRP-to-masonry joint
behaviour must be understood first [18,19,6,5].
Due to material similarity between concrete and masonry, such
as low tensile strength and brittleness, the debonding mechanisms
for retrofitted masonry have been shown to be similar to those of
retrofitted reinforced concrete (RC) members (Fig. 2). Moreover,
factors affecting the FRP-to-concrete bonded joint behaviour simi-
larly influence FRP-to-masonry bonded joint behaviour [19,6]. The
use of FRP to improve the flexural resistance of RC members is now
well established (e.g. [21,15]). Hence, the research on the debond-
ing mechanisms in plated RC structures has been used as a starting
point for research on FRP retrofitted masonry structures.
A large database of pull test results is presented, reporting pre-
viously published data for masonry retrofitted with FRP strips. The
derivation of analytical models to determine the IC debonding
resistance of bonded joints is also presented. Empirical relation-
ships for key parameters such as the fracture energy, Gf, and shear
stress–slip (denoted as local bond–slip) relationship, s–d, are
investigated. Whilst the application of NSM FRP strips appears to
be a particularly viable retrofitting technique (Dizhur et al. [22]),
limited research has previously been conducted on the application
of this retrofitting technique to masonry structures. For example,
of the 223 FRP-to-masonry pull tests available in the open litera-
ture, NSM tests account for only about 25% of the total. Hence, to
add to the relatively small existing NSM database, 14 new pull
tests on clay brick masonry prisms retrofitted with NSM carbon
FRP strips were conducted. These experimental tests are reported
below.
2. New pull test data
As part of ongoing research at the University of Adelaide 14
NSM carbon FRP-to-masonry pull tests were conducted. Different
variables that affect the bond behaviour of FRP-to-masonry joints
were considered such as FRP strip cross-section and loading type.
2.1. Material properties
Clay brick unitswith nominal dimensions of 230 � 110 � 76 mm
were used. The mortar used to construct the pull-test specimens
consisted of Portland cement, hydrated lime and sand, combined
in a ratio of 1:1:6 by volume.Material testswere conducted in accor-
dance with Standards Australia [23,24] to determine the quality of
the masonry and to quantify any material parameters that are re-
quired for development of the empirical model. The mean value of
the flexural tensile strength of the brick unit, fut and the modulus
of elasticity of themasonry, Em, were 3.41 MPa and10.7 GPa, respec-
tively. The ultimate tensile strength of the FRP, frupt, and Young’s
modulus of the FRP, Ep, provided by the manufacturer were
2700 MPa and 165 GPa, respectively.
2.2. Test setup and specimen details
Fig. 3 shows the test setup and instrumentation details. Each
pull test prism consisted of a five brick stack, with 10 mm mortar
bed joints and an FRP-to-masonry bonded length of 420 mm. The
groove for the NSM strip was cut using a diamond blade saw and
then filled with an epoxy adhesive. The strip was cleaned with ace-
tone to remove any foreign substances before being inserted into
to the epoxy-filled groove and allowed to cure for 7 days. The
FRP strip was positioned flush with masonry surface as shown in
Fig. 3 for all specimens. A layer of quick drying paste was applied
to the top and bottom surfaces of the masonry prism to ensure that
the load was transferred evenly using a manually controlled
hydraulic ram. A solid steel plate with a small gap for the FRP to
pass through was placed onto the top surface (loaded end) of the
specimen. This restraining plate was used to apply approximately
1kN of pre-compression to settle the specimen at the early stages
of loading. Once the specimen was in place, a monotonic tensile
load was applied in displacement control using an Avery testing
machine at a constant rate of approximately 2.5 kN per minute un-
til failure, with 0.5 mm per minute as an upper bound for displace-
ment rate. For cyclic loading, one cycle of load consisted of
increasing the load monotonically until the target load (displace-
ment) was reached, then reducing the load to zero. Thus, the
NSM strips of FRP were only loaded in tension. Each cyclic speci-
men was subjected to three cycles of load for each target
displacement.
Each test specimen had two strain gauges glued on the FRP
strips and positioned 25 mm away from the top brick unit at the
Fig. 1. Pull test simulating IC debonding.
Fig. 2. Debonding failure in pull test specimen.
J. Kashyap et al. / Engineering Structures 41 (2012) 186–198 187
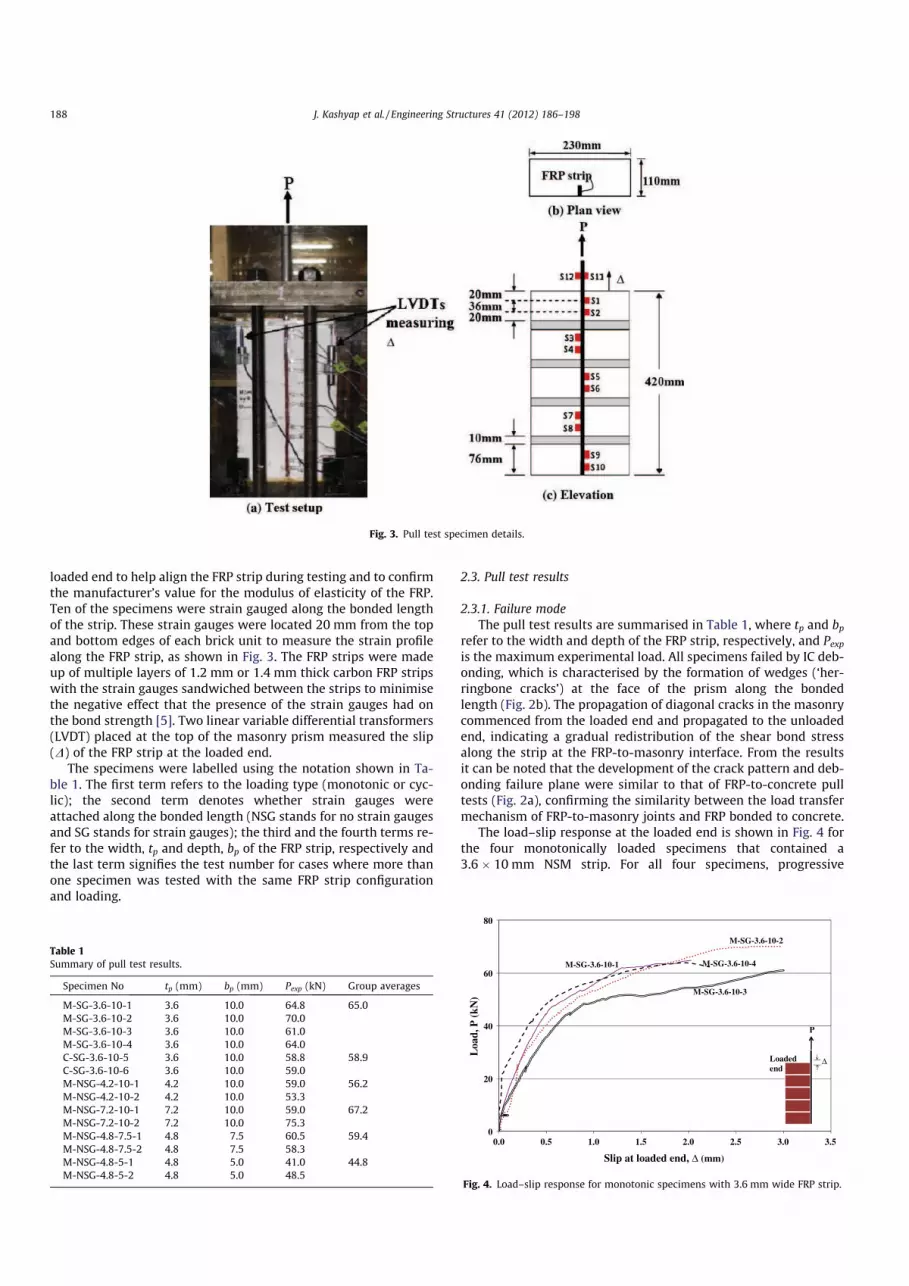
loaded end to help align the FRP strip during testing and to confirm
the manufacturer’s value for the modulus of elasticity of the FRP.
Ten of the specimens were strain gauged along the bonded length
of the strip. These strain gauges were located 20 mm from the top
and bottom edges of each brick unit to measure the strain profile
along the FRP strip, as shown in Fig. 3. The FRP strips were made
up of multiple layers of 1.2 mm or 1.4 mm thick carbon FRP strips
with the strain gauges sandwiched between the strips to minimise
the negative effect that the presence of the strain gauges had on
the bond strength [5]. Two linear variable differential transformers
(LVDT) placed at the top of the masonry prism measured the slip
(D) of the FRP strip at the loaded end.
The specimens were labelled using the notation shown in Ta-
ble 1. The first term refers to the loading type (monotonic or cyc-
lic); the second term denotes whether strain gauges were
attached along the bonded length (NSG stands for no strain gauges
and SG stands for strain gauges); the third and the fourth terms re-
fer to the width, tp and depth, bp of the FRP strip, respectively and
the last term signifies the test number for cases where more than
one specimen was tested with the same FRP strip configuration
and loading.
2.3. Pull test results
2.3.1. Failure mode
The pull test results are summarised in Table 1, where tp and bprefer to the width and depth of the FRP strip, respectively, and Pexpis the maximum experimental load. All specimens failed by IC deb-
onding, which is characterised by the formation of wedges (‘her-
ringbone cracks’) at the face of the prism along the bonded
length (Fig. 2b). The propagation of diagonal cracks in the masonry
commenced from the loaded end and propagated to the unloaded
end, indicating a gradual redistribution of the shear bond stress
along the strip at the FRP-to-masonry interface. From the results
it can be noted that the development of the crack pattern and deb-
onding failure plane were similar to that of FRP-to-concrete pull
tests (Fig. 2a), confirming the similarity between the load transfer
mechanism of FRP-to-masonry joints and FRP bonded to concrete.
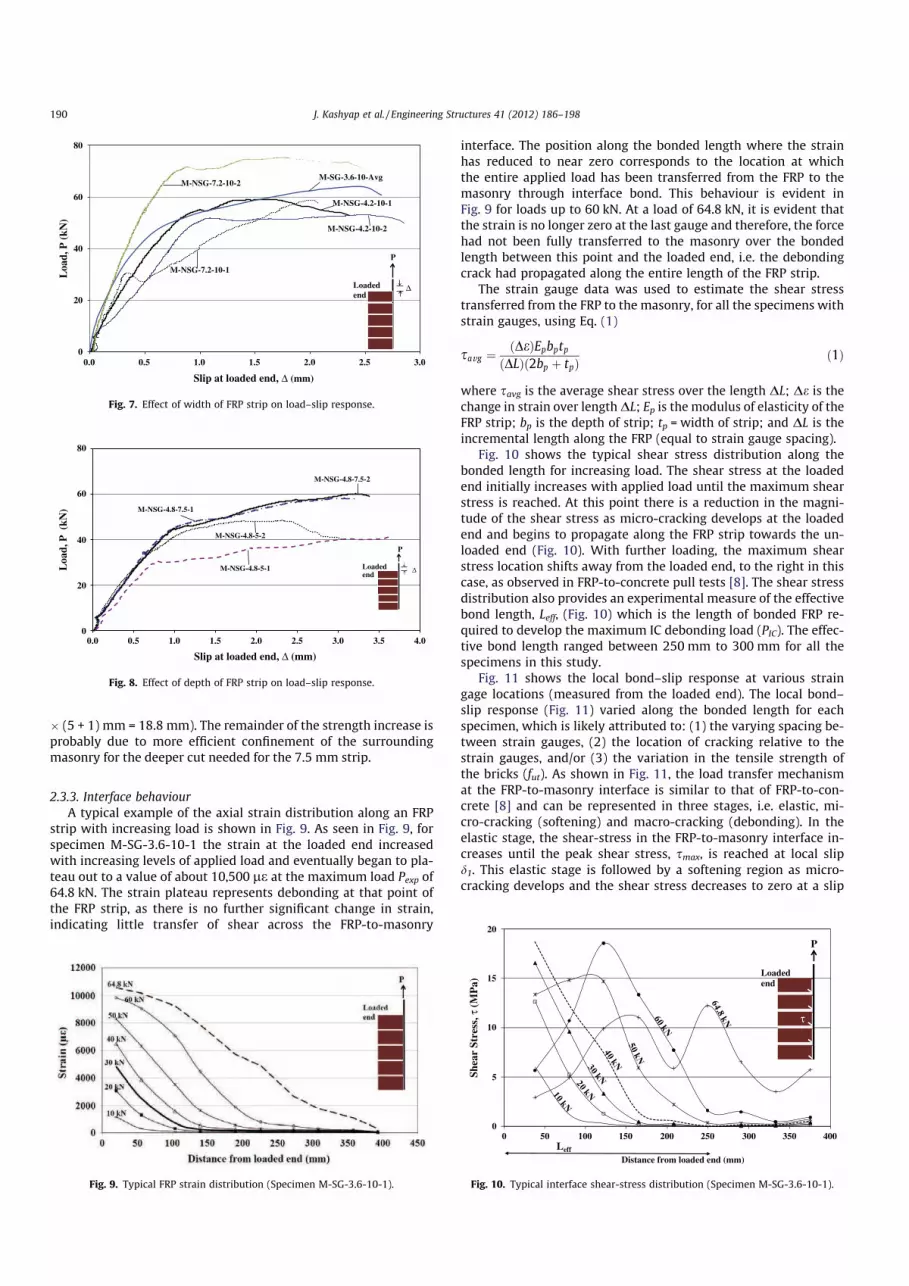
The load–slip response at the loaded end is shown in Fig. 4 for
the four monotonically loaded specimens that contained a
3.6 � 10 mm NSM strip. For all four specimens, progressive
Fig. 3. Pull test specimen details.
Table 1
Summary of pull test results.
Specimen No tp (mm) bp (mm) Pexp (kN) Group averages
M-SG-3.6-10-1 3.6 10.0 64.8 65.0
M-SG-3.6-10-2 3.6 10.0 70.0
M-SG-3.6-10-3 3.6 10.0 61.0
M-SG-3.6-10-4 3.6 10.0 64.0
C-SG-3.6-10-5 3.6 10.0 58.8 58.9
C-SG-3.6-10-6 3.6 10.0 59.0
M-NSG-4.2-10-1 4.2 10.0 59.0 56.2
M-NSG-4.2-10-2 4.2 10.0 53.3
M-NSG-7.2-10-1 7.2 10.0 59.0 67.2
M-NSG-7.2-10-2 7.2 10.0 75.3
M-NSG-4.8-7.5-1 4.8 7.5 60.5 59.4
M-NSG-4.8-7.5-2 4.8 7.5 58.3
M-NSG-4.8-5-1 4.8 5.0 41.0 44.8
M-NSG-4.8-5-2 4.8 5.0 48.5
Slip at loaded end, ∆ (mm)
0
20
40
60
80
0.0 0.5 1.0 1.5 2.0 2.5 3.0 3.5
Lo
ad
, P
(k
N)
M-SG-3.6-10-2
M-SG-3.6-10-1 M-SG-3.6-10-4
M-SG-3.6-10-3
P
Loaded
end∆
Fig. 4. Load–slip response for monotonic specimens with 3.6 mm wide FRP strip.
188 J. Kashyap et al. / Engineering Structures 41 (2012) 186–198

damage in the FRP-to-masonry joints was indicated through re-
duced stiffness of the load–slip response with increasing load. Prior
to failure, significant diagonal cracking had occurred in the ma-
sonry (Fig. 2b) (step-wise through each brick unit, interrupted by
the mortar bed joints), demonstrating significant stress transfer
into the masonry substrate and ‘good’ bond at the FRP-to-masonry
interface. The ultimate failure plane was mostly within the ma-
sonry, near the masonry-to-adhesive interface as evidenced by a
very thin layer of masonry being detached from the masonry prism
(Fig. 5b). This observation suggests that the bonding characteristics
of FRP-to-masonry are closely related to the tensile strength of the
masonry unit and highlights the importance of fut in theoretical
models. From Fig. 4 it is evident that there was reasonable consis-
tency between the overall behaviour of these four pull test
specimens.
2.3.2. Effect of variables on test results
2.3.2.1. Effect of cyclic loading. The global load–slip (P–D) response
of two specimens subjected to cyclic loading (Fig. 6) closely traces
the average P–D curve for the four monotonically loaded speci-
mens shown previously in Fig. 4. This observation suggests that
cyclic loading does not significantly affect the overall behaviour
of the FRP-to-masonry bond. The small reduction in strength that
was observed after each loading–unloading cycle indicates that
strength degradation of the bond was cumulative. Similar behav-
iour was observed in the study by Konthesingha et al. [25]. How-
ever, it was noted that these relatively small differences in
strength and deformation capacity for the pull test specimens
may simply be due to material variability (30% is typical for ma-
sonry tests, e.g. Drysdale et al. [26]). Therefore, further testing is
recommended to confirm the effects of cyclic loading on FRP-
to-masonry bond.
2.3.2.2. Effect of FRP strip dimensions. As seen in Table 1 and Fig. 7, no
significant improvement in load–slip behaviourwas observedwhen
the width of the FRP strip, tp (measured parallel to the
masonry face), was varied from 3.6 mm to 7.2 mm. In contrast,
increasing the depth of the FRP strip, bp (measured into the ma-
sonry), was found to be effective in enhancing the debonding load
(Pexp) (Fig. 8). Considering the average value of Pexp (Table 1), increas-
ing the depth from5 mm to 7.5 mm resulted in about a 33% increase
in the maximum load (Fig. 8). Most of this strength increase can be
attributed simply to the 27% increase in the perimeter of the deb-
onding failure plane, Lper (Fig. 5b), for specimenswith a 7.5 mmdeep
strip (Lper = (4.8 + 2) mm + 2 � (7.5 + 1) mm = 23.8 mm) compared
to specimens with a 5 mm deep strip (Lper = (4.8 + 2) mm + 2
Fig. 5. Failure plane in masonry.
0
20
40
60
80
0.0 0.5 1.0 1.5 2.0 2.5 3.0 3.5
Lo
ad
, P
(k
N)
Slip at loaded end, ∆ (mm)
C-SG-3.6-10-5
C-SG-3.6-10-6
M-SG-3.6-10-Avg
Loaded
end
P
∆
Fig. 6. Effect of cyclic loading on load–slip response.
J. Kashyap et al. / Engineering Structures 41 (2012) 186–198 189
� (5 + 1) mm = 18.8 mm). The remainder of the strength increase is
probably due to more efficient confinement of the surrounding
masonry for the deeper cut needed for the 7.5 mm strip.
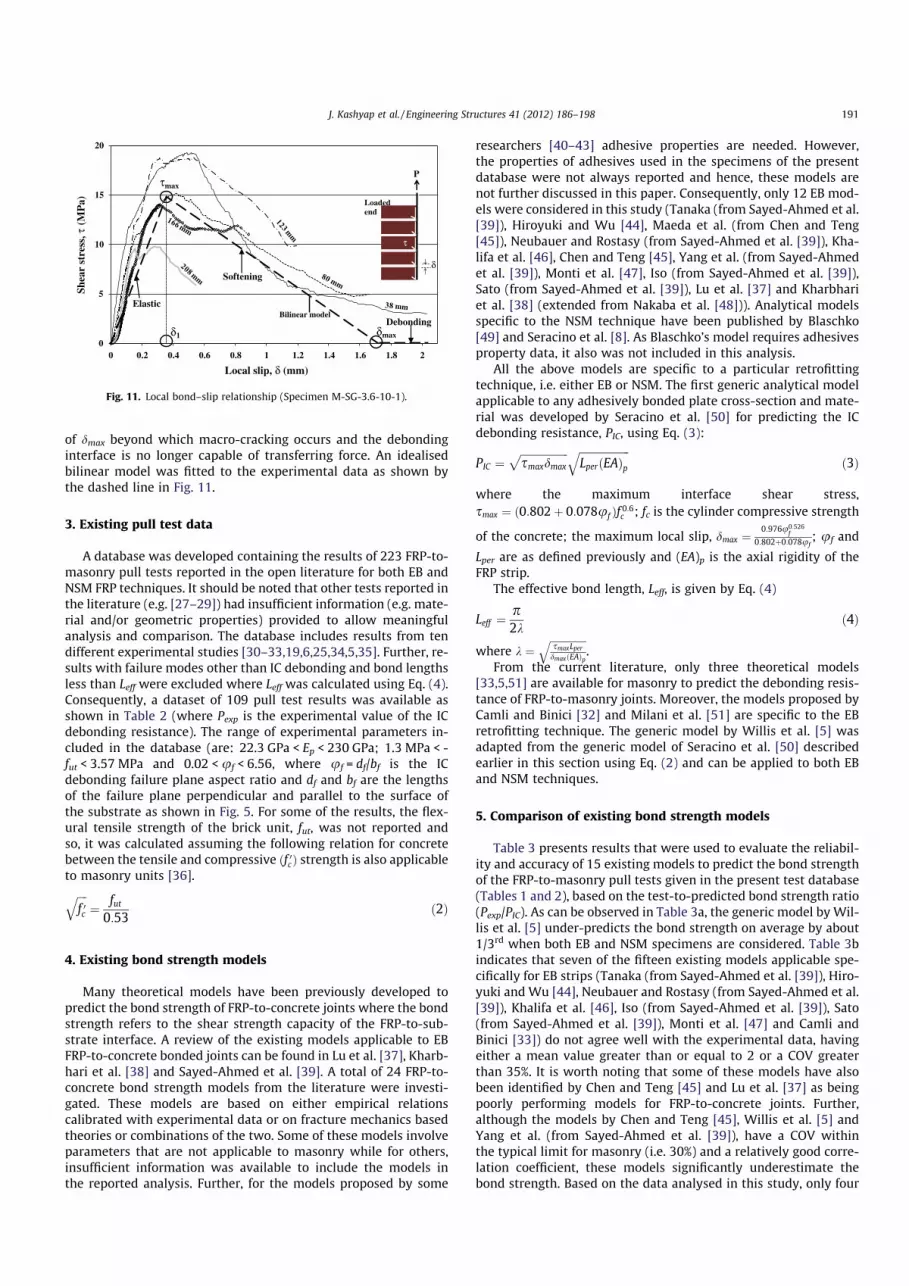
2.3.3. Interface behaviour
A typical example of the axial strain distribution along an FRP
strip with increasing load is shown in Fig. 9. As seen in Fig. 9, for
specimen M-SG-3.6-10-1 the strain at the loaded end increased
with increasing levels of applied load and eventually began to pla-
teau out to a value of about 10,500 le at the maximum load Pexp of
64.8 kN. The strain plateau represents debonding at that point of
the FRP strip, as there is no further significant change in strain,
indicating little transfer of shear across the FRP-to-masonry
interface. The position along the bonded length where the strain
has reduced to near zero corresponds to the location at which
the entire applied load has been transferred from the FRP to the
masonry through interface bond. This behaviour is evident in
Fig. 9 for loads up to 60 kN. At a load of 64.8 kN, it is evident that
the strain is no longer zero at the last gauge and therefore, the force
had not been fully transferred to the masonry over the bonded
length between this point and the loaded end, i.e. the debonding
crack had propagated along the entire length of the FRP strip.
The strain gauge data was used to estimate the shear stress
transferred from the FRP to the masonry, for all the specimens with
strain gauges, using Eq. (1)
savg ¼ðDeÞEpbptp
ðDLÞð2bp þ tpÞð1Þ
where savg is the average shear stress over the length DL; De is the
change in strain over lengthDL; Ep is the modulus of elasticity of the
FRP strip; bp is the depth of strip; tp = width of strip; and DL is the
incremental length along the FRP (equal to strain gauge spacing).
Fig. 10 shows the typical shear stress distribution along the
bonded length for increasing load. The shear stress at the loaded
end initially increases with applied load until the maximum shear
stress is reached. At this point there is a reduction in the magni-
tude of the shear stress as micro-cracking develops at the loaded
end and begins to propagate along the FRP strip towards the un-
loaded end (Fig. 10). With further loading, the maximum shear
stress location shifts away from the loaded end, to the right in this
case, as observed in FRP-to-concrete pull tests [8]. The shear stress
distribution also provides an experimental measure of the effective
bond length, Leff, (Fig. 10) which is the length of bonded FRP re-
quired to develop the maximum IC debonding load (PIC). The effec-
tive bond length ranged between 250 mm to 300 mm for all the
specimens in this study.
Fig. 11 shows the local bond–slip response at various strain
gage locations (measured from the loaded end). The local bond–
slip response (Fig. 11) varied along the bonded length for each
specimen, which is likely attributed to: (1) the varying spacing be-
tween strain gauges, (2) the location of cracking relative to the
strain gauges, and/or (3) the variation in the tensile strength of
the bricks (fut). As shown in Fig. 11, the load transfer mechanism
at the FRP-to-masonry interface is similar to that of FRP-to-con-
crete [8] and can be represented in three stages, i.e. elastic, mi-
cro-cracking (softening) and macro-cracking (debonding). In the
elastic stage, the shear-stress in the FRP-to-masonry interface in-
creases until the peak shear stress, smax, is reached at local slip
d1. This elastic stage is followed by a softening region as micro-
cracking develops and the shear stress decreases to zero at a slip
Slip at loaded end, ∆ (mm)
0
20
40
60
80
0.0 0.5 1.0 1.5 2.0 2.5 3.0
Lo
ad
, P
(k
N)
M-NSG-7.2-10-2M-SG-3.6-10-Avg
M-NSG-4.2-10-1
M-NSG-4.2-10-2
M-NSG-7.2-10-1
P
Loaded
end∆
Fig. 7. Effect of width of FRP strip on load–slip response.
0
20
40
60
80
0.0 0.5 1.0 1.5 2.0 2.5 3.0 3.5 4.0
Lo
ad
, P
(k
N)
Slip at loaded end, ∆ (mm)
M-NSG-4.8-7.5-1
M-NSG-4.8-7.5-2
M-NSG-4.8-5-1
M-NSG-4.8-5-2
∆Loaded end
P
Fig. 8. Effect of depth of FRP strip on load–slip response.
Fig. 9. Typical FRP strain distribution (Specimen M-SG-3.6-10-1).
Loaded
end
P
τ
0
5
10
15
20
0 50 100 150 200 250 300 350 400
Sh
ear
Str
ess,
τ (
MP
a)
Distance from loaded end (mm)
Leff
Fig. 10. Typical interface shear-stress distribution (Specimen M-SG-3.6-10-1).
190 J. Kashyap et al. / Engineering Structures 41 (2012) 186–198
of dmax beyond which macro-cracking occurs and the debonding
interface is no longer capable of transferring force. An idealised
bilinear model was fitted to the experimental data as shown by
the dashed line in Fig. 11.
3. Existing pull test data
A database was developed containing the results of 223 FRP-to-
masonry pull tests reported in the open literature for both EB and
NSM FRP techniques. It should be noted that other tests reported in
the literature (e.g. [27–29]) had insufficient information (e.g. mate-
rial and/or geometric properties) provided to allow meaningful
analysis and comparison. The database includes results from ten
different experimental studies [30–33,19,6,25,34,5,35]. Further, re-
sults with failure modes other than IC debonding and bond lengths
less than Leff were excluded where Leff was calculated using Eq. (4).
Consequently, a dataset of 109 pull test results was available as
shown in Table 2 (where Pexp is the experimental value of the IC
debonding resistance). The range of experimental parameters in-
cluded in the database (are: 22.3 GPa < Ep < 230 GPa; 1.3 MPa < -
fut < 3.57 MPa and 0.02 < uf < 6.56, where uf = df/bf is the IC
debonding failure plane aspect ratio and df and bf are the lengths
of the failure plane perpendicular and parallel to the surface of
the substrate as shown in Fig. 5. For some of the results, the flex-
ural tensile strength of the brick unit, fut, was not reported and
so, it was calculated assuming the following relation for concrete
between the tensile and compressive ðf 0cÞ strength is also applicable
to masonry units [36].
ffiffiffiffi
f 0c
q
¼fut
0:53ð2Þ
4. Existing bond strength models
Many theoretical models have been previously developed to
predict the bond strength of FRP-to-concrete joints where the bond
strength refers to the shear strength capacity of the FRP-to-sub-
strate interface. A review of the existing models applicable to EB
FRP-to-concrete bonded joints can be found in Lu et al. [37], Kharb-
hari et al. [38] and Sayed-Ahmed et al. [39]. A total of 24 FRP-to-
concrete bond strength models from the literature were investi-
gated. These models are based on either empirical relations
calibrated with experimental data or on fracture mechanics based
theories or combinations of the two. Some of these models involve
parameters that are not applicable to masonry while for others,
insufficient information was available to include the models in
the reported analysis. Further, for the models proposed by some
researchers [40–43] adhesive properties are needed. However,
the properties of adhesives used in the specimens of the present
database were not always reported and hence, these models are
not further discussed in this paper. Consequently, only 12 EB mod-
els were considered in this study (Tanaka (from Sayed-Ahmed et al.
[39]), Hiroyuki and Wu [44], Maeda et al. (from Chen and Teng
[45]), Neubauer and Rostasy (from Sayed-Ahmed et al. [39]), Kha-
lifa et al. [46], Chen and Teng [45], Yang et al. (from Sayed-Ahmed
et al. [39]), Monti et al. [47], Iso (from Sayed-Ahmed et al. [39]),
Sato (from Sayed-Ahmed et al. [39]), Lu et al. [37] and Kharbhari
et al. [38] (extended from Nakaba et al. [48])). Analytical models
specific to the NSM technique have been published by Blaschko
[49] and Seracino et al. [8]. As Blaschko’s model requires adhesives
property data, it also was not included in this analysis.
All the above models are specific to a particular retrofitting
technique, i.e. either EB or NSM. The first generic analytical model
applicable to any adhesively bonded plate cross-section and mate-
rial was developed by Seracino et al. [50] for predicting the IC
debonding resistance, PIC, using Eq. (3):
PIC ¼ffiffiffiffiffiffiffiffiffiffiffiffiffiffiffiffiffiffi
smaxdmax
p
ffiffiffiffiffiffiffiffiffiffiffiffiffiffiffiffiffiffiffi
LperðEAÞp
q
ð3Þ
where the maximum interface shear stress,
smax ¼ ð0:802þ 0:078uf Þf0:6c ; fc is the cylinder compressive strength
of the concrete; the maximum local slip, dmax ¼0:976u0:526
f
0:802þ0:078uf; uf and
Lper are as defined previously and (EA)p is the axial rigidity of the
FRP strip.
The effective bond length, Leff, is given by Eq. (4)
Leff ¼p2k
ð4Þ
where k ¼ffiffiffiffiffiffiffiffiffiffiffiffiffiffi
smaxLperdmaxðEAÞp
q
.
From the current literature, only three theoretical models
[33,5,51] are available for masonry to predict the debonding resis-
tance of FRP-to-masonry joints. Moreover, the models proposed by
Camli and Binici [32] and Milani et al. [51] are specific to the EB
retrofitting technique. The generic model by Willis et al. [5] was
adapted from the generic model of Seracino et al. [50] described
earlier in this section using Eq. (2) and can be applied to both EB
and NSM techniques.
5. Comparison of existing bond strength models
Table 3 presents results that were used to evaluate the reliabil-
ity and accuracy of 15 existing models to predict the bond strength
of the FRP-to-masonry pull tests given in the present test database
(Tables 1 and 2), based on the test-to-predicted bond strength ratio
(Pexp/PIC). As can be observed in Table 3a, the generic model by Wil-
lis et al. [5] under-predicts the bond strength on average by about
1/3rd when both EB and NSM specimens are considered. Table 3b
indicates that seven of the fifteen existing models applicable spe-
cifically for EB strips (Tanaka (from Sayed-Ahmed et al. [39]), Hiro-
yuki and Wu [44], Neubauer and Rostasy (from Sayed-Ahmed et al.
[39]), Khalifa et al. [46], Iso (from Sayed-Ahmed et al. [39]), Sato
(from Sayed-Ahmed et al. [39]), Monti et al. [47] and Camli and
Binici [33]) do not agree well with the experimental data, having
either a mean value greater than or equal to 2 or a COV greater
than 35%. It is worth noting that some of these models have also
been identified by Chen and Teng [45] and Lu et al. [37] as being
poorly performing models for FRP-to-concrete joints. Further,
although the models by Chen and Teng [45], Willis et al. [5] and
Yang et al. (from Sayed-Ahmed et al. [39]), have a COV within
the typical limit for masonry (i.e. 30%) and a relatively good corre-
lation coefficient, these models significantly underestimate the
bond strength. Based on the data analysed in this study, only four
0
5
10
15
20
0 0.2 0.4 0.6 0.8 1 1.2 1.4 1.6 1.8 2
Sh
ear
stre
ss, τ
(MP
a)
Local slip, δ (mm)
δ1 δmax
τmax
Bilinear model
τ
δ
Loaded
end
P
τ
Softening
Elastic
Debonding
Fig. 11. Local bond–slip relationship (Specimen M-SG-3.6-10-1).
J. Kashyap et al. / Engineering Structures 41 (2012) 186–198 191
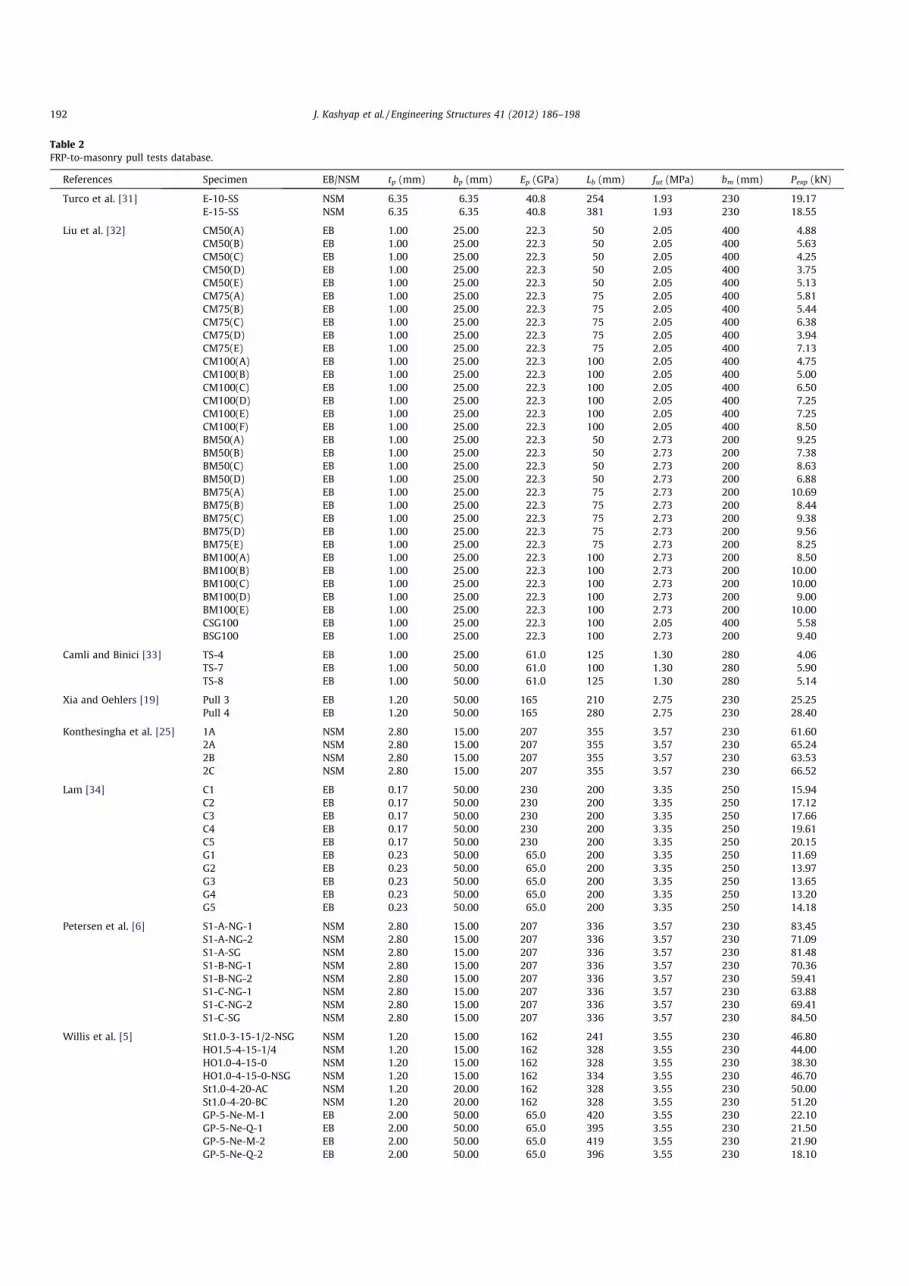
Table 2
FRP-to-masonry pull tests database.
References Specimen EB/NSM tp (mm) bp (mm) Ep (GPa) Lb (mm) fut (MPa) bm (mm) Pexp (kN)
Turco et al. [31] E-10-SS NSM 6.35 6.35 40.8 254 1.93 230 19.17
E-15-SS NSM 6.35 6.35 40.8 381 1.93 230 18.55
Liu et al. [32] CM50(A) EB 1.00 25.00 22.3 50 2.05 400 4.88
CM50(B) EB 1.00 25.00 22.3 50 2.05 400 5.63
CM50(C) EB 1.00 25.00 22.3 50 2.05 400 4.25
CM50(D) EB 1.00 25.00 22.3 50 2.05 400 3.75
CM50(E) EB 1.00 25.00 22.3 50 2.05 400 5.13
CM75(A) EB 1.00 25.00 22.3 75 2.05 400 5.81
CM75(B) EB 1.00 25.00 22.3 75 2.05 400 5.44
CM75(C) EB 1.00 25.00 22.3 75 2.05 400 6.38
CM75(D) EB 1.00 25.00 22.3 75 2.05 400 3.94
CM75(E) EB 1.00 25.00 22.3 75 2.05 400 7.13
CM100(A) EB 1.00 25.00 22.3 100 2.05 400 4.75
CM100(B) EB 1.00 25.00 22.3 100 2.05 400 5.00
CM100(C) EB 1.00 25.00 22.3 100 2.05 400 6.50
CM100(D) EB 1.00 25.00 22.3 100 2.05 400 7.25
CM100(E) EB 1.00 25.00 22.3 100 2.05 400 7.25
CM100(F) EB 1.00 25.00 22.3 100 2.05 400 8.50
BM50(A) EB 1.00 25.00 22.3 50 2.73 200 9.25
BM50(B) EB 1.00 25.00 22.3 50 2.73 200 7.38
BM50(C) EB 1.00 25.00 22.3 50 2.73 200 8.63
BM50(D) EB 1.00 25.00 22.3 50 2.73 200 6.88
BM75(A) EB 1.00 25.00 22.3 75 2.73 200 10.69
BM75(B) EB 1.00 25.00 22.3 75 2.73 200 8.44
BM75(C) EB 1.00 25.00 22.3 75 2.73 200 9.38
BM75(D) EB 1.00 25.00 22.3 75 2.73 200 9.56
BM75(E) EB 1.00 25.00 22.3 75 2.73 200 8.25
BM100(A) EB 1.00 25.00 22.3 100 2.73 200 8.50
BM100(B) EB 1.00 25.00 22.3 100 2.73 200 10.00
BM100(C) EB 1.00 25.00 22.3 100 2.73 200 10.00
BM100(D) EB 1.00 25.00 22.3 100 2.73 200 9.00
BM100(E) EB 1.00 25.00 22.3 100 2.73 200 10.00
CSG100 EB 1.00 25.00 22.3 100 2.05 400 5.58
BSG100 EB 1.00 25.00 22.3 100 2.73 200 9.40
Camli and Binici [33] TS-4 EB 1.00 25.00 61.0 125 1.30 280 4.06
TS-7 EB 1.00 50.00 61.0 100 1.30 280 5.90
TS-8 EB 1.00 50.00 61.0 125 1.30 280 5.14
Xia and Oehlers [19] Pull 3 EB 1.20 50.00 165 210 2.75 230 25.25
Pull 4 EB 1.20 50.00 165 280 2.75 230 28.40
Konthesingha et al. [25] 1A NSM 2.80 15.00 207 355 3.57 230 61.60
2A NSM 2.80 15.00 207 355 3.57 230 65.24
2B NSM 2.80 15.00 207 355 3.57 230 63.53
2C NSM 2.80 15.00 207 355 3.57 230 66.52
Lam [34] C1 EB 0.17 50.00 230 200 3.35 250 15.94
C2 EB 0.17 50.00 230 200 3.35 250 17.12
C3 EB 0.17 50.00 230 200 3.35 250 17.66
C4 EB 0.17 50.00 230 200 3.35 250 19.61
C5 EB 0.17 50.00 230 200 3.35 250 20.15
G1 EB 0.23 50.00 65.0 200 3.35 250 11.69
G2 EB 0.23 50.00 65.0 200 3.35 250 13.97
G3 EB 0.23 50.00 65.0 200 3.35 250 13.65
G4 EB 0.23 50.00 65.0 200 3.35 250 13.20
G5 EB 0.23 50.00 65.0 200 3.35 250 14.18
Petersen et al. [6] S1-A-NG-1 NSM 2.80 15.00 207 336 3.57 230 83.45
S1-A-NG-2 NSM 2.80 15.00 207 336 3.57 230 71.09
S1-A-SG NSM 2.80 15.00 207 336 3.57 230 81.48
S1-B-NG-1 NSM 2.80 15.00 207 336 3.57 230 70.36
S1-B-NG-2 NSM 2.80 15.00 207 336 3.57 230 59.41
S1-C-NG-1 NSM 2.80 15.00 207 336 3.57 230 63.88
S1-C-NG-2 NSM 2.80 15.00 207 336 3.57 230 69.41
S1-C-SG NSM 2.80 15.00 207 336 3.57 230 84.50
Willis et al. [5] St1.0-3-15-1/2-NSG NSM 1.20 15.00 162 241 3.55 230 46.80
HO1.5-4-15-1/4 NSM 1.20 15.00 162 328 3.55 230 44.00
HO1.0-4-15-0 NSM 1.20 15.00 162 328 3.55 230 38.30
HO1.0-4-15-0-NSG NSM 1.20 15.00 162 334 3.55 230 46.70
St1.0-4-20-AC NSM 1.20 20.00 162 328 3.55 230 50.00
St1.0-4-20-BC NSM 1.20 20.00 162 328 3.55 230 51.20
GP-5-Ne-M-1 EB 2.00 50.00 65.0 420 3.55 230 22.10
GP-5-Ne-Q-1 EB 2.00 50.00 65.0 395 3.55 230 21.50
GP-5-Ne-M-2 EB 2.00 50.00 65.0 419 3.55 230 21.90
GP-5-Ne-Q-2 EB 2.00 50.00 65.0 396 3.55 230 18.10
192 J. Kashyap et al. / Engineering Structures 41 (2012) 186–198

models (Maeda et al. (from Chen and Teng [45]), Milani et al. [51],
Lu et al. [37] and Kharbhari et al.[38]) out of the 15 models appli-
cable for EB can be considered to provide satisfactory predictions
of the debonding strength (Table 3b). From Table 3b it can be ob-
served that the models by Lu et al. [37] and Kharbhari et al. [38]
provide particularly good estimates of the bond strength when
compared to the other models. It is interesting to note that the gen-
eric model by Willis et al. [5] correlates better with the NSM test
data (Table 3c) than with the EB test data (Table 3b). Further, the
NSM specific bond strength model by Seracino et al. [8] is also
not reliable, with a large coefficient of variation (COV) and low cor-
relation coefficient as shown in Table 3c. From these results it can
Table 2 (continued)
References Specimen EB/NSM tp (mm) bp (mm) Ep (GPa) Lb (mm) fut (MPa) bm (mm) Pexp (kN)
GP-5-Sa-Q EB 2.00 50.00 65.0 394 3.55 230 24.70
GP-5-Gr-Q EB 2.00 50.00 65.0 393 3.55 230 24.30
GD-5-Sa-Q-1 EB 0.62 50.00 73.0 386 3.55 230 19.90
GD-5-Sa-Q-2 EB 0.62 50.00 73.0 386 3.55 230 18.60
CP-2-Ne-M EB 1.20 50.00 162 140 3.55 230 26.80
CP-3-Ne-M EB 1.20 50.00 162 210 3.55 230 24.90
CP-4-Ne-M EB 1.20 50.00 162 280 3.55 230 28.40
Oliveria et al. [35] G150RS-1 EB 0.15 25.00 80.2 150 1.57 235 3.48
G150RS-2 EB 0.15 25.00 80.2 150 1.57 235 4.81
G150RS-3 EB 0.15 25.00 80.2 150 1.57 235 4.69
G150RS-5 EB 0.15 25.00 80.2 150 1.57 235 4.64
G100RS-1 EB 0.15 25.00 80.2 100 1.57 235 3.66
G100RS-2 EB 0.15 25.00 80.2 100 1.57 235 3.17
G100RS-3 EB 0.15 25.00 80.2 100 1.57 235 2.85
G100RS-4 EB 0.15 25.00 80.2 100 1.57 235 3.68
G100RS-5 EB 0.15 25.00 80.2 100 1.57 235 3.79
G200RS-2 EB 0.15 25.00 80.2 200 1.57 235 4.48
G200RS-3 EB 0.15 25.00 80.2 200 1.57 235 5.06
G150RI-5 EB 0.15 25.00 80.2 150 1.57 235 5.27
G150RT-1 EB 0.15 25.00 80.2 150 1.57 235 4.20
G150RT-2 EB 0.15 25.00 80.2 150 1.57 235 4.89
G150RT-3 EB 0.15 25.00 80.2 150 1.57 235 5.60
G150RT-4 EB 0.15 25.00 80.2 150 1.57 235 4.34
G150RT-5 EB 0.15 25.00 80.2 150 1.57 235 5.49
G150ES-1 EB 0.15 25.00 80.2 150 1.57 235 3.52
G150ES-2 EB 0.15 25.00 80.2 150 1.57 235 4.83
G150ES-4 EB 0.15 25.00 80.2 150 1.57 235 4.53
G150ES-5 EB 0.15 25.00 80.2 150 1.57 235 5.46
G150XS-1 EB 0.15 25.00 80.2 150 1.57 235 4.55
G150XS-2 EB 0.15 25.00 80.2 150 1.57 235 3.73
G150XS-3 EB 0.15 25.00 80.2 150 1.57 235 3.82
G150XS-4 EB 0.15 25.00 80.2 150 1.57 235 4.54
G150XS-5 EB 0.15 25.00 80.2 150 1.57 235 4.06
C150RS-1 EB 0.12 25.00 216 150 1.57 235 4.78
C150RS-2 EB 0.12 25.00 216 150 1.57 235 4.29
C150RS-3 EB 0.12 25.00 216 150 1.57 235 4.02
C150RS-4 EB 0.12 25.00 216 150 1.57 235 4.33
C150RS-5 EB 0.12 25.00 216 150 1.57 235 4.26
Table 3
Pexp/PIC ratios for existing models.
Model Mean Median Max Min SD COV Correlation
(a) For all specimens
Willis et al. [5] 1.507 1.514 2.388 0.668 0.458 0.304 0.919
(b) For EB specimens only
Kharbhari et al. [38] 1.111 1.125 1.848 0.309 0.327 0.294 0.850
Lu et al. [37] 1.204 1.049 1.854 0.792 0.294 0.244 0.890
Milani et al. [51] 1.288 1.281 1.989 0.434 0.367 0.285 0.885
Maeda et al. (from [45]) 1.332 1.260 2.283 0.360 0.398 0.299 0.831
Chen and Teng [45] 1.486 1.508 2.289 0.529 0.408 0.274 0.886
Willis et al. [5] 1.642 1.646 2.388 0.668 0.426 0.259 0.884
Yang et al. (from [39]) 1.702 1.612 2.562 0.709 0.406 0.239 0.924
Camli and Binici [33] 1.844 1.585 3.813 0.496 0.772 0.419 0.837
Iso (from [39]) 2.046 2.008 3.508 0.710 0.724 0.354 0.879
Monti et al. [47] 2.099 1.843 4.225 0.878 0.899 0.428 0.926
Nebauer and Rostasy (from [39]) 2.256 1.955 4.434 0.907 0.953 0.422 0.922
Sato (from [39]) 2.341 2.681 4.961 0.180 1.280 0.547 0.710
Khalifa et al. [46] 2.459 2.468 4.405 0.882 0.890 0.362 0.915
Hiroyuki and Wu [44] 9.174 8.350 17.759 3.536 3.731 0.407 0.735
Tanaka (from [39]) 2.294 1.680 11.726 0.632 2.071 0.903 0.174
(c) For NSM specimens only
Willis et al. [5] 1.148 1.074 1.919 0.742 0.333 0.290 0.565
Seracino et al. [8] 1.405 1.329 3.198 0.643 0.574 0.409 0.260
J. Kashyap et al. / Engineering Structures 41 (2012) 186–198 193

be seen that the existing bond strength models are inadequate for
predicting the FRP-to-masonry joint test data considered in this
study. Additionally, numerical investigations carried out by Milani
[52] and Milani and Bucchi [53] on reinforced masonry walls and
curved structures, respectively, suggests that application of exist-
ing FRP-to-concrete models to masonry is questionable. This
further highlights the need for development of new models that
can more accurately predict the bond strength of FRP retrofitted
masonry and its application to complex realistic geometries.
6. New model for FRP-to-masonry joints
The generic model of Seracino et al. [50] for defining PIC was
considered as the starting point for development of a new model.
Seracino et al.’s [50] model for concrete is a function of the cylinder
compressive strength, fc, which was originally incorporated to rep-
resent the principal tensile stress that resulted in the interface deb-
onding cracks. The corresponding material property for masonry is
the flexural tensile strength of the masonry unit, fut which is a va-
lue used widely in design and so is readily available for use in an
expression of PIC.
It is known that the debonding strain is higher for a NSM strip
than for an EB strip due to better confinement. Therefore, to ac-
count for the type of retrofitting technique (i.e. EB or NSM) it
was assumed that smaxdmax, which is twice the fracture energy, Gf
(area under the local bond–slip curve), is a function of the geomet-
ric property,uf. Also, since the debonding cracks are initiated with-
in the masonry, smaxdmax was assumed to be a function of the
masonry material property, fut [50]. Hence, the following expres-
sion can be written:
smaxdmax ¼ Cumf f
nut ð5Þ
6.1. New generic model
In order to derive values for C, m and n in Eq. (5), first a value of
smaxdmax was calculated for each test specimen in the pull-test
database by substituting Pexp into Eq. (3) and solving for smaxdmax.
A statistical analysis was then undertaken to determine optimal
values for the constants C, m and n using the data for 109 speci-
mens from the database (Table 2) and the 14 new pull test results
(Table 1). The parameters C and m were determined from linear
regression, with n varied incrementally until the lowest coefficient
of variation was identified. Eq. (6) was obtained from this process
and is represented graphically in Fig. 12. Data points clustered on
the left end of the graph represent results for EB test specimens
and those on the right end represent NSM test results.
ðsmaxdmaxÞGeneric ¼ 3:94u0:38f f 0:94ut ð6Þ
By substituting Eq. (6) into Eq. (3), a generic expression was de-
rived for the IC debonding resistance, PIC, given by Eq. (7) in terms
of the conventional design parameters, fut, for masonry and the
other standard parameters for an FRP section.
ðPICÞGeneric ¼ 1:99u0:19f f 0:47ut
ffiffiffiffiffiffiffiffiffiffiffiffiffiffiffiffiffiffiffi
LperðEAÞp
q
ð7Þ
The predictions of the new generic model (Eq. (7)) compared
with the 123 test results of the present database (Tables 1 and 2)
are shown in Fig. 13 and summarised in Table 4a. A value greater
than one for the test-to predicted bond strength ratio (Pexp/PIC)
(i.e. above the line in Fig. 13) signifies a conservative estimate of
bond strength. As shown in Table 4a and Fig. 14a, the experimental
and the predicted bond strengths agreed reasonably well with
mean, COV, and linear regression correlation coefficient of the
test-to-predicted strength ratios being 1.036, 25.6% and 0.922,
respectively.
Although Eq. (7) is valid for both EB and NSM pull tests, it was
considered important to further investigate the EB and NSM spec-
imens separately to identify the sensitivity of the new generic PICexpression (Eq. (7)) to consideration of the database in subsets,
and whether further improvements of the new generic model
could be achieved.
6.2. New EB specific model
When considering a model specific to EB FRP strips, 89 tests re-
sults were available out of the total of 109 tests listed in Table 2.
This subset of the data was used to determine smaxdmax giving Eq.
(9) for calculating the bond strength of EB FRP strips in masonry.
The same method used for generic equation was applied to cal-
ibrate the constants C,m and n (Eq. (5)) for 89 EB test results giving
Eqs. (8) and (9).
ðsmaxdmaxÞEB ¼ 187:40u1:69f f 1:80ut ð8Þ
ðPICÞEB ¼ 13:69u0:84f f 0:90ut
ffiffiffiffiffiffiffiffiffiffiffiffiffiffiffiffiffiffiffi
LperðEAÞp
q
ð9Þ
The statistics of the Pexp/PIC ratios for the EB specific model is gi-
ven in Table 4b. The correlation coefficient for the EB model is
0.884 and the mean value is close to one (Table 4b and Fig. 15a)
which demonstrates that the ‘EB specific’ bond strength model
-1
0
1
2
-2 -1 0 1
log( )
log(τmaxδmax/fut0.94)
Fig. 12. Statistical analysis for key bond–slip parameters.
-
20
40
60
80
100
- 20 40 60 80 100
Pex
p(k
N)
PIC (kN)
Fig. 13. Comparison of experimental and predicted (using new generic model) IC
debonding resistance.
194 J. Kashyap et al. / Engineering Structures 41 (2012) 186–198
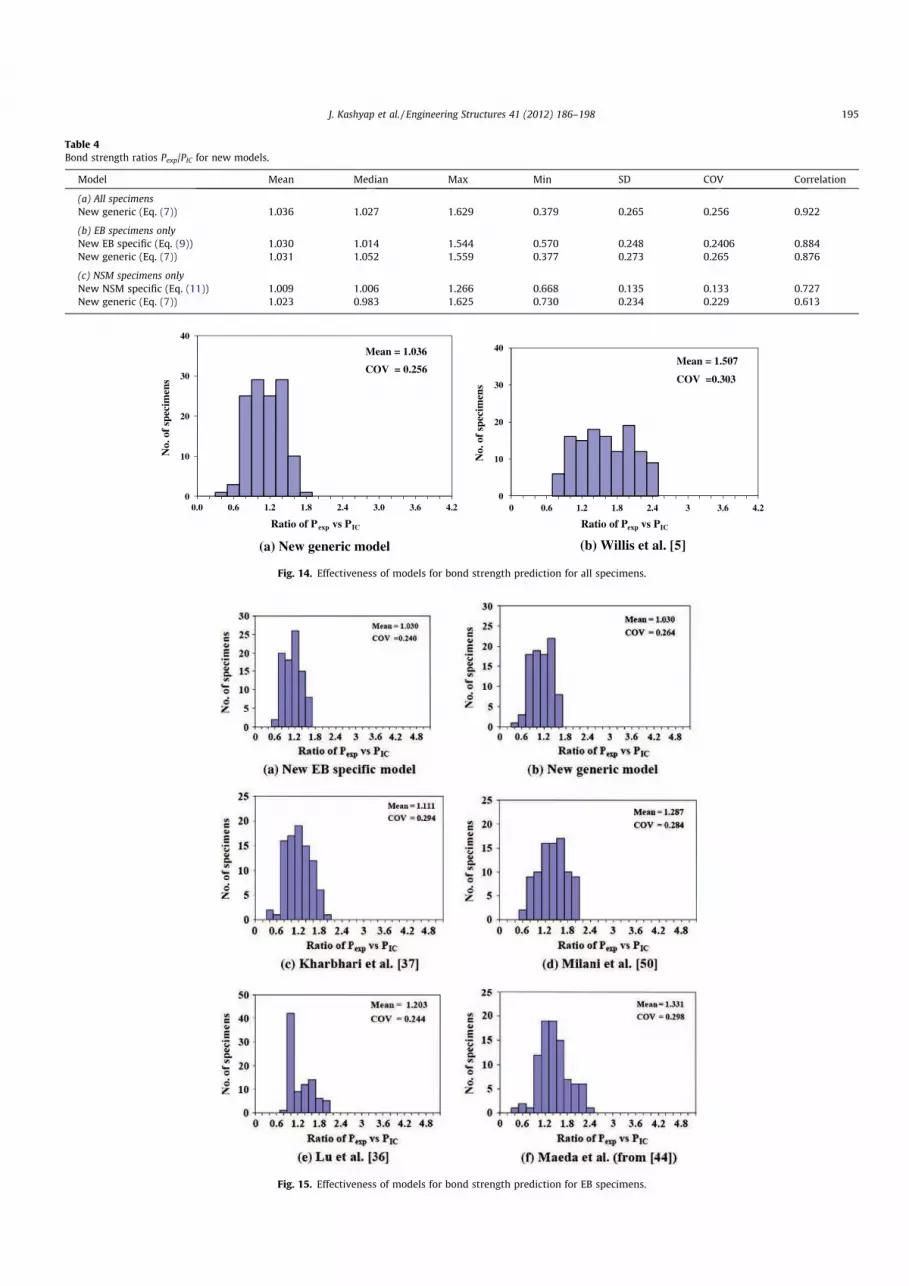
Table 4
Bond strength ratios Pexp/PIC for new models.
Model Mean Median Max Min SD COV Correlation
(a) All specimens
New generic (Eq. (7)) 1.036 1.027 1.629 0.379 0.265 0.256 0.922
(b) EB specimens only
New EB specific (Eq. (9)) 1.030 1.014 1.544 0.570 0.248 0.2406 0.884
New generic (Eq. (7)) 1.031 1.052 1.559 0.377 0.273 0.265 0.876
(c) NSM specimens only
New NSM specific (Eq. (11)) 1.009 1.006 1.266 0.668 0.135 0.133 0.727
New generic (Eq. (7)) 1.023 0.983 1.625 0.730 0.234 0.229 0.613
(a) New generic model (b) Willis et al. [5]
0
10
20
30
40
No
. o
f sp
ecim
ens
Ratio of Pexp vs PIC
Mean = 1.036
COV = 0.256
0
10
20
30
40
0.0 0.6 1.2 1.8 2.4 3.0 3.6 4.2 0 0.6 1.2 1.8 2.4 3 3.6 4.2
No
. o
f sp
ecim
ens
Ratio of Pexp vs PIC
Mean = 1.507
COV =0.303
Fig. 14. Effectiveness of models for bond strength prediction for all specimens.
Fig. 15. Effectiveness of models for bond strength prediction for EB specimens.
J. Kashyap et al. / Engineering Structures 41 (2012) 186–198 195
predicts the trends of the test data reasonably well. Further, it was
noted that the values of the constants C,m and n in the new generic
expression (Eq. (7)) and the EB expression (Eq. (9)) are significantly
different in spite of the commonly assumed form for the relation-
ship between fracture energy and aspect ratio and masonry unit
tensile strength. Moreover, when the new generic model (Eq. (7))
was used to predict the bond strength for only EB specimens from
the database, the correlation coefficient was only slightly lower
and the COV was only slightly higher than for the ‘EB specific’
model as shown in Table 4b. Hence, while the EB specific model
provides reasonable estimate of the bond strength, it does not
appear to be any more accurate or reliable than the new generic
model.
6.3. New NSM specific model
In a similar fashion, the 34 NSM specimens from the database
(Tables 1 and 2) were used to calibrate the constants C, m and n
in Eq. (5) in order to define a bond strength model specific to the
NSM technique. The final expression is given by Eq. (11).
ðsmaxdmaxÞNSM ¼ 6:94uÿ0:24f f 0:94ut ð10Þ
ðPICÞNSM ¼ 2:63uÿ0:12f f 0:47ut
ffiffiffiffiffiffiffiffiffiffiffiffiffiffiffiffiffiffiffi
LperðEAÞp
q
ð11Þ
From Table 4c it can be observed that the average value of the Pexp/
PIC ratio for the NSM model (Eq. (11)) is close to one and the COV is
about 0.133. Further, by comparing the generic (Eq. (7)), EB (Eq. (9))
and NSM (Eq. (11)) models it can be noted that the constants C, m
and nwere significantly different for each model, possibly reflecting
the difference between the EB and NSM applications. Moreover, the
results for the new generic model, when applied to only NSM
specimens, were only slightly less accurate than those obtained
using the ‘NSM specific’ model’ (Table 4c). This was also clear from
Fig. 16 which shows the differences between these two models
(Fig. 16a versus b). Given the versatility of the new generic expres-
sion over the NSM specific expression, the new generic expression is
preferred. In any case, given the relatively small size of the data set
available, there seems to be scope for further NSM bond tests on
masonry.
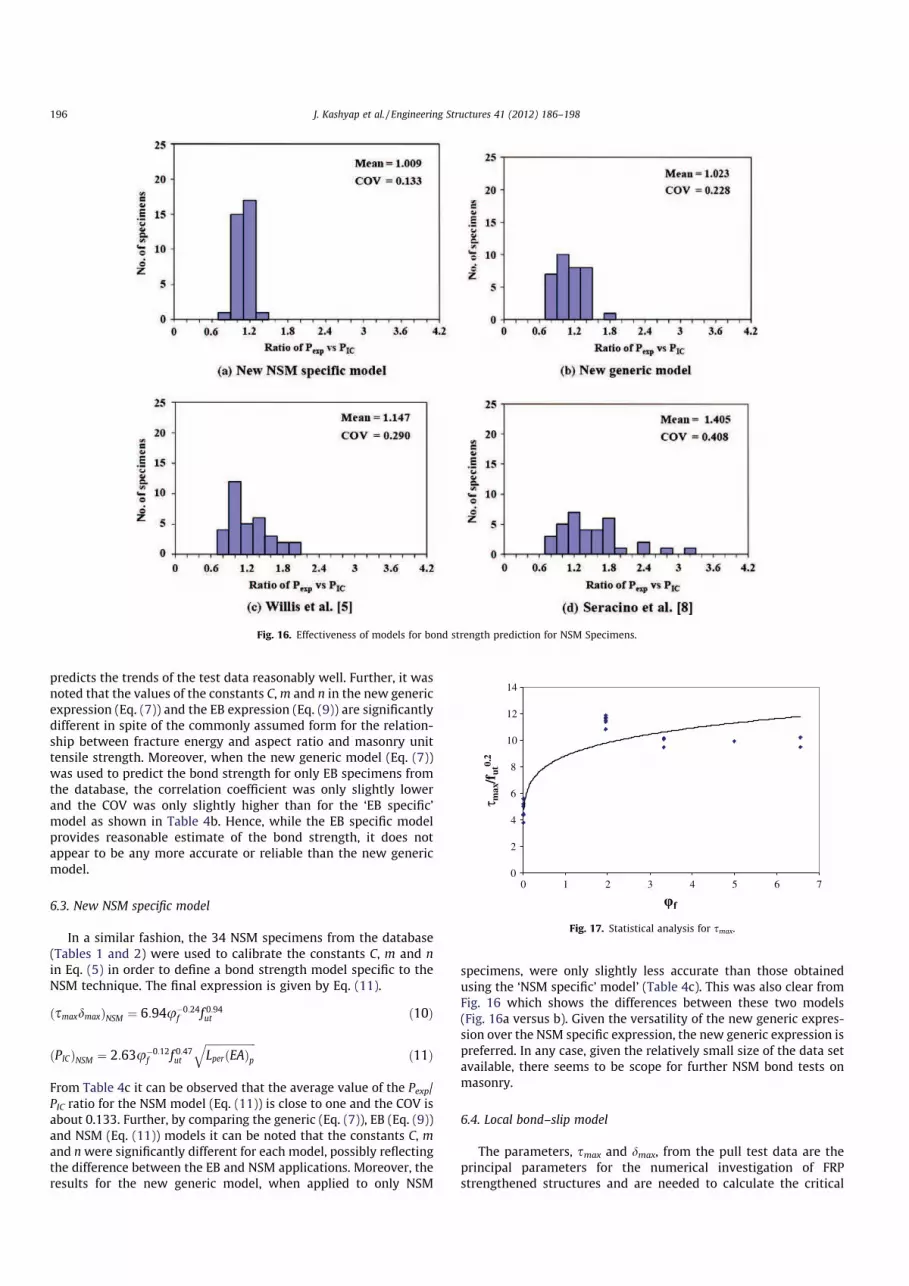
6.4. Local bond–slip model
The parameters, smax and dmax, from the pull test data are the
principal parameters for the numerical investigation of FRP
strengthened structures and are needed to calculate the critical
Fig. 16. Effectiveness of models for bond strength prediction for NSM Specimens.
0
2
4
6
8
10
12
14
0 1 2 3 4 5 6 7
τm
ax/f
ut0
.2
Fig. 17. Statistical analysis for smax.
196 J. Kashyap et al. / Engineering Structures 41 (2012) 186–198

bond length, Leff ((Eq. (4)). Hence, the statistical analysis was ex-
tended to determine an empirical expression for smax. Reported val-
ues of smax (for 20 tests) were plotted against uf and the data was
analysed using power regression. The resulting expression for smax
is given by Eq. (12) and is graphically represented in Fig. 17. There
is good agreement between the experimental and the predicted
values of smax with mean of 1.009 and a correlation coefficient of
0.897.
smax ¼ 8:83u0:15f f 0:2ut ð12Þ
Eq. (6) can then be divided by Eq. (12) to generate the following
expression for dmax:
dmax ¼ 0:45u0:23f f 0:74ut ð13Þ
Note, that smax and dmax are functions of both the masonry unit
tensile strength and the aspect ratio of the FRP strip. This conclu-
sion differs from that reported by Seracino et al. [50] for concrete
where dmax was expressed as a function of the aspect ratio only.
It should be noted that the above expressions for smax (Eq. (12))
and dmax (Eq. (13)) are based on small data set available.
7. Comparison of the proposed new bond strength models with
existing models
Fig. 14 compares the model by Willis et al. [5] with the new
generic model (Eq. (7)), considering results from both NSM and
EB specimens given in the complete test database of 123 speci-
mens (Tables 1 and 2). It is clear that the new generic model is
more accurate than the model by Willis et al. [5] suggesting that
equations developed for concrete (e.g. Eq. (3)) cannot be applied
directly to masonry by simply substituting f 0c with the correspond-
ing tensile masonry strength (fut).
For the EB specimens the new generic model gives good esti-
mates of the bond strength, with a mean value for the Pexp/PIC ratio
being close to unity and a COV value of approximately 25%
(Table 4b). From Fig. 15 it can be identified that the new generic
model (Fig. 15b) is more accurate as compared to the four best per-
forming existing models (Fig. 15c–f) mentioned previously. While
the model by Lu et al. [37] gives results that are close to the new
generic model it is suggested that the Lu et al. model [37] is too
complicated for practical application. Fig. 16 gives similar compar-
isons between the new generic model (Fig. 16b) and pre-existing
expressions (Fig. 16c and d) applicable to NSM specimens. It is
concluded that the new generic model is more accurate than the
existing models with reasonably low COV values (of about 25%).
8. Conclusions and recommendations
The results of an experimental and analytical study into the
FRP-to-masonry bond behaviour are presented. In the experimen-
tal study, 14 new NSM FRP-to-masonry pull tests were conducted
to assess the effect of different test variables such as cyclic loading
and FRP strip dimensions to establish their influence on FRP-to-
masonry joint behaviour. All specimens failed by IC debonding.
The pull test results also indicated that increasing the depth of
the NSM FRP strips (measured perpendicular to the face of the ma-
sonry) was more effective at enhancing the debonding resistance
of FRP-to-masonry joint than was increasing the width of the FRP
strip, possibly because of the increase in Lper for specimens with
a deeper strip and hence providing more efficient confinement of
the surrounding masonry. The experimental investigation into
the effects of cyclic loading on load–slip behaviour of FRP-to-ma-
sonry bonded joints was somewhat inconclusive. Therefore, it is
recommended that further research into the effects of cyclic load-
ing on FRP-to-masonry bond be conducted.
An analytical model was derived for the IC debonding resistance
of FRP-to-masonry joints using a large set of test data from the
open literature. A new generic model that is applicable to both
EB and NSM techniques (generic) was derived. This model is a
function of the usual geometric and material design variables such
as the FRP strip aspect ratio, the axial rigidity of the FRP strip and
the masonry unit tensile strength. For the range of experimental
parameters investigated as part of this study, the predicted values
from the new model correlate reasonably well with the experi-
mental values. Further, empirical expressions were developed for
the key local bond–slip parameters such as peak interface shear-
stress and maximum slip. These bond characteristics are necessary
to determine the critical bond length of FRP-to-masonry joints and
for analysing the behaviour of FRP strengthened structures. Impor-
tantly, it should be noted that the proposed models give the lower
bound debonding resistance in FRP strengthened structures due to
the presence of the multiple cracks in flexural members.
Although the model proposed in this study is reasonably accu-
rate there is further scope for improvement by adding more FRP-
to-masonry pull test results to the present database. In addition,
a significant number of test results were excluded from the test
database due to insufficient information available for analysis.
The exclusion of some data points to the need for standardised
reporting of test results as well as standardised testing procedures.
References
[1] Ingham JM, Griffith MC. Performance of unreinforced masonry buildingsduring the 2010 Darfield (Christchurch, NZ) earthquake. Aust J Struct Eng2011;11(3):207–24.
[2] Tao Y, Chen JF. Behaviour of a masonry arch bridge repaired using fibre-reinforced polymer composites. Eng Struct 2011;33(5):1594–606.
[3] Hamed E, Rabinovitch O. Failure characteristics of FRP strengthened masonrywalls under out-of-plane loads. Eng Struct 2010;32(8):2134–45.
[4] Willis CR, Seracino R, Griffith MC. Out-of-plane strength of brick masonryretrofitted with horizontal NSM CFRP strips. Eng Struct 2010;32(2):547–55.
[5] Willis CR, Yang Q, Seracino R, Griffith MC. Bond behaviour of FRP-to-clay brickmasonry joints. Eng Struct 2009;31(11):2580–7.
[6] Petersen RB, Masia MJ, Seracino R. Bond behaviour of NSM FRP strips bondedto modern clay brick masonry prisms: influence of strip orientation andcompression perpendicular to the strip. J Compos Construct 2009;13(3):169–178.
[7] De Lorenzis L, Teng JG. Near-surface mounted FRP reinforcement – anemerging technique for strengthening structures. Compos B: Eng 2007;28:119–143.
[8] Seracino R, Jones NM, Ali MSM, Page MW, Oehlers DJ. Bond strength of near-surface mounted FRP strip-to-concrete joints. J Compos Construct2007;11(4):401–9.
[9] Albert ML, Elwi AE, Cheng JJR. Strengthening of unreinforced masonry wallsusing FRPs. J Compos Construct 2001;5(2):76–84.
[10] Tumialan JG, Galati N, Nanni A. Field assessment of unreinforced masonrywalls strengthened with fiber reinforced polymer laminates. J Struct Eng2003;129(8):1047–56.
[11] Ghobarah A, Galal KEM. Out-of-plane strengthening of unreinforced masonrywalls with openings. J Compos Construct 2004;8(4):298–305.
[12] Galati N, Tumialan G, Nanni A. Strengthening with FRP bars of URM wallssubject to out-of-plane loads. Construct Build Mater 2006;20:101–10.
[13] Mosallam AS. Out-of-plane flexural behavior of unreinforced red brick wallsstrengthened with FRP composites. Compos B: Eng 2007;38:559–74.
[14] Hamed E, Rabinovitch O. Failure characteristics of FRP-strengthened masonrywalls under out-of-plane loads. Eng Struct 2010;32(8):2134–45.
[15] Oehlers DJ, Seracino R. Design of FRP and steel plated RC structures: retrofittingof beams and slabs for strength, stiffness and ductility. Kidlington (Oxford,UK): Elsevier; 2004. 252p.
[16] Liu IST, Oehlers DJ, Seracino R. Study of intermediate crack debonding inadhesively plated beams. J Compos Construct 2007;11(2):175–83.
[17] Chen JF, Yuan H, Teng JG. Debonding failure along a softening FRP-to-concreteinterface between two adjacent cracks in concrete members. Eng Struct2007;29(2):259–70.
[18] Liu IST. Intermediate crack debonding of plated RC beams. Ph.D. thesis, Schoolof Civil and Environmental Engineering, The University of Adelaide; 2005.610p.
[19] Xia S, Oehlers DJ. Debonding mechanisms in FRP plated unreinforced masonryunder out-of-plane loading. Adv Struct Eng 2006;9(5):619–37.
[20] Wu Z, Niu H. Prediction of crack-induced debonding failure in R/C structuresflexurally strengthened with externally bonded FRP composite. JSCE, J MaterConcr Struct Pavements 2007;63(4):620–39.
J. Kashyap et al. / Engineering Structures 41 (2012) 186–198 197
[21] Yuan H, Teng JG, Seracino R, Wu ZS, Yao J. Full-range behavior of FRP-to-concrete bonded joints. Eng Struct 2004;26(5):553–65.
[22] Dizhur D, Derakhshan H, Griffith M, Ingham J. In-situ testing of a lowintervention NSM seismic strengthening technique for historic URM buildings.Int J Mater Struct Integrity 2011;5(2-3):168–91.
[23] Standards Australia, AS 3700-2001. Masonry structures. Sydney; 2001. 212p.[24] Standards Australia, AS/NZS 4456.15:2003: Masonry units, segmental pavers
and flags—methods of test method 15: determining lateral modulus ofrupture. Sydney; 2003. 5p.
[25] Konthesingha KMC, Masia MJ, Petersen RB, Page AW. Bond behaviour of NSMFRP strips to modern clay brick masonry prisms under cyclic loading. In: 11thCanadian masonry symposium, Toronto, Ontario, May 31–June 3, 2009.
[26] Drysdale RG, Hamid AA, Baker LR. Masonry structures – behavior anddesign. Englewood Cliffs (NJ): Prentice-Hall Inc.; 1994. p. 784.
[27] Soric Z, Tulin LG. Bond stress/deformation in pull-out masonry specimens. JStruct Eng 1989;115(10):2588–602.
[28] Carloni C, Subramanium KV. Investigation of the interface fracture duringdebonding between FRP and masonry. Adv Struct Eng 2010;12(5):731–43.
[29] Capozucca R. Experimental FRP/SRP–historic masonry delamination. ComposStruct 2009;92:891–903.
[30] De Lorenzis L, Tinazzi D, Nanni A. Near-surface mounted FRP rods for masonrystrengthening: bond and flexural testing. In: Proceedings of the mechanics ofmasonry structures strengthened with FRP-materials: modeling, testing,design, control, Venice, Italy, December 7–18, 2000.
[31] Turco VN Galati L, De Lorenzis Modena C, Nanni A. Bond between near surfacemounted FRP rods and masonry in structural strengthening. Advancing withcomposites, plast, Ed. I: Crivelli-Visconti, Milan, Italy,May 7–9, 2003. p. 209–17.
[32] Liu Y, Dawe J, McInerney J. Behaviour of GFRP sheets bonded to masonry walls.In: Proceedings of the international symposium on bond behaviour of FRP instructures; 2005. p. 473–80.
[33] Camli US, Binici B. Strength of carbon fiber reinforced polymers bonded toconcrete and masonry. Construct Build Mater 2006;21:1431–46.
[34] Lam C. Finite element study of bond–slip behaviour of CFRP and GFRPlaminates on brick masonry. M.Sc. thesis. University of Padova; 2009. 79p.
[35] Oliveira DV, Basilio I, Lourenço PB. Experimental bond behavior of FRP sheetsglued on brick masonry. J Compos Construct 2010;15(1):32–41.
[36] MacGregor JG. Reinforced concrete: mechanics and design. NewJersey: Prentice Hall; 1988. 582p.
[37] Lu XZ, Teng JG, Ye LP, Jiang JJ. Bond–slip models for FRP sheets/plates bondedto concrete. Eng Struct 2005;27(6):920–37.
[38] Karbhari VM, Niu H, Sikorsky C. Review and comparison of fracturemechanics-based bond strength models for FRP-strengthened structures. JReinf Plast Compos 2006;25(17):1757–94.
[39] Sayed-Ahmed EY, Bakay R, Shrive NG. Bond strength of FRP laminates toconcrete: state-of-the-art review. J Struct Eng 2009;9:45–61.
[40] Chaallal O, Nollet MJ, Perraton D. Strengthening of reinforced concrete beamswith externally bonded fiber-reinforced-plastic plates: design guidelines forshear and flexure. Can J Civ Eng 1998;25(4):692–704.
[41] Brosens K, van Gemert D. Anchorage design for externally bonded carbon fiberreinforced polymer laminates. In: Proceedings of 4th international symposiumon fiber reinforced polymer reinforcement for reinforced concrete structures,SP-188. Farmington Hills (MI): ACI; 1999. p. 635–45.
[42] Dai JG, Ueda T. Local bond stress slip relations for FRP sheets concreteinterfaces. In: Proceedings of 6th international symposium on FRPreinforcement for concrete structures. Singapore: World ScientificPublications; 2003. p. 143–52.
[43] Ueda T, Dai JG, Sato Y. A nonlinear bond stress–slip relationship for FRP sheet–concrete interface. In: Proceedings of international symposium on latestachievement of technology and research on retrofitting concrete structures;2003. p. 113–20.
[44] Hiroyuki Y, Wu Z. Analysis of debonding fracture properties of CFSstrengthened member subject to tension. In: Proceedings of 3rdinternational symposium on non-metallic (FRP) reinforcement for concretestructures; 1997. p. 284–94.
[45] Chen JF, Teng JG. Anchorage strength models for FRP and steel plates bonded toconcrete. J Struct Eng 2001;127(7):784–91.
[46] Khalifa A, Gold WJ, Nanni Antonio MI, Abdel Aziz. Contribution of externallybonded FRP to shear capacity of RC flexural members. J Compos Construct1998;2(4):195–202.
[47] Monti M, Renzelli M, Luciani P. FRP adhesion in uncracked and crackedconcrete zones. In: Proceedings of 6th international symposium on FRPreinforcement for concrete structures. Singapore: World ScientificPublications; 2003. p. 183–92.
[48] Nakaba K, Kanakubo T, Furuta T, Yoshizawa H. Bond behavior between fiber-reinforced polymer laminates and concrete. ACI Struct J 2001;98(3):359–67.
[49] Blaschko M. Bond behaviour of CFRP strips glued into slits. In: Tan KH, editor.Proceedings 6th international symposium fiber reinforced polymerreinforcement for concrete structures, Singapore; 2003. p. 205–14.
[50] Seracino R, Saifulnaz MRR, Oehlers DJ. Generic debonding resistance of EB andNSM plate-to-concrete joints. J Compos Construct 2007;11(1):62–70.
[51] Milani G, Milani E, Tralli A. Upper bound limit analysis model for FRP-reinforced masonry curved structures. Part II: Structural analyses. ComputStruct 2009;87(23–24):1534–58.
[52] Milani G. FE homogenized limit analysis model for masonry strengthened bynear surface bed joint; FRP bars. Compos Struct 2010;92(2):330–8.
[53] Milani G, Bucchi A. Kinematic FE homogenized limit analysis model formasonry curved structures strengthened by near surface mounted FRP bars.Compos Struct 2010;93(1):239–58.
198 J. Kashyap et al. / Engineering Structures 41 (2012) 186–198