Embed Size (px)
Citation preview
324
WETLANDS, Vol. 24, No. 2, June 2004, pp. 324–356q 2004, The Society of Wetland Scientists
DATING RECENT PEAT DEPOSITS
Merritt R. Turetsky1, Sturt W. Manning2, and R. Kelman Wieder3
1 Department of Biological SciencesUniversity of Alberta
Edmonton, Alberta, Canada T6G 2E9Current Address: U.S. Geological Survey
345 Middlefield Rd. MS 962Menlo Park, California, USA 94025
2 Department of Fine ArtSidney Smith Hall
100 St. George StreetUniversity of Toronto
Toronto, Ontario, Canada M5S 3G3and
Department of ArchaeologySchool of Human and Environmental Sciences
Whiteknights PO Box 227Reading, UK RG6 6AB
3 Department of BiologyVillanova University
Villanova, Pennsylvania, USA 19085
Abstract: Dating recent peat deposits (i.e., past ; 300 yrs of peat accumulation) has emerged as an im-portant yet challenging task for estimating rates of organic matter accumulation and atmospheric pollutantdeposition in peatlands. Due to their ombrotrophic nature and the tendency for Sphagnum-derived peat tohave high cation exchange capacity, peatlands are ideal archives of atmospheric pollution. However, effortsto establish depth-age relationships in peats are complicated by the difficulty of dating deposits reliably.Assumptions underlying the techniques available for dating peat deposits often are poorly understood andgenerally untested. We outline the approaches used to establish depth-age relationships in peat chronologies,including brief descriptions of the theory, assumptions, methodology, and logistics of each technique. Weinclude both continuous dating methods (i.e., methods based on 14C, 210Pb, constant bulk density, acid-insoluble ash, moss increment, pollen density) and chrono-stratigraphic markers (i.e., fallout isotopes fromthe Chernobyl accident and nuclear weapons testing, pollen stratigraphies, isothermal remanence magnetism,charcoal particles, spherical carbonaceous particles, PAHs, PCBs, DDT, toxaphene) that can be measured inpeat and correlated temporally with known historical events. We also describe the relatively new radiocarbonapplication of wiggle matching and use hypothetical data to highlight the potential of this developing tech-nique for dating recent peat. Until the uncertainty associated with each of these dating approaches is clarified,we recommend employing multiple techniques to allow for corroboration between different methods.
Key Words: dating, bogs, peat, 14C, wiggle matching, 210Pb, bulk density, ash, pollen, isothermal remnancemagnetism, fire, soot balls, PAHs, PCBs, DDT, Toxaphene, 241Am, 137Cs, 207Bi
INTRODUCTION
Peatlands have a wide geographic distribution butare located mostly at northern latitudes where theycover major portions of Alaska, Canada, Russia, theBaltic Republics, and Fennoscandia (Gore 1983, Lap-palainen 1996). Peat accumulates when the rate of netprimary production at the surface exceeds losses from
decomposition, leaching, and/or disturbance through-out the peat column, resulting in a vertically and/orlaterally aggrading deposit of organic matter. Lowrates of decomposition are thought to control the ac-cumulation of peat more than high net primary pro-ductivity (cf. Clymo 1965, 1984, 1992, Vitt 1990,Trumbore and Harden 1997, Frolking et al. 1998). De-
Turetsky et al., DATING RECENT PEAT 325
composition in peatlands may be retarded by highacidity, low oxygen supply at depth, low nutrientavailability, and/or poor substrate quality for microbialactivity (cf. Yavitt and Lang 1990, Johnson and Dam-man 1991, Valentine et al. 1994, Maltby and Proctor1996, Bridgham et al. 1998).
Peat deposits are highly organic (often . 95 % or-ganic matter on a dry mass basis), especially in om-brotrophic bogs, which receive water and inorganicnutrient inputs solely from atmospheric deposition.Sphagnum-derived peat in bogs and poor fens has ahigh cation exchange capacity, which has been attri-buted to high concentrations of unesterified polyuronicacids in Sphagnum cell walls (Spearing 1972).Through cation exchange, positively charged ions sorbstrongly to the negatively charged functional groupson peat (Rapaport and Eisenreich 1986, Livett 1988,Clymo et al. 1990, Cole et al. 1990, Wieder 1990, Vileet al. 1999). This may immobilize cations that are de-posited via dry or wet deposition or via surface/groundwater flow (fens only) in the peat column.
Peatlands can serve as ideal archives of atmospher-ically deposited cations/particulates due to cation ex-change and the ombrotrophic nature of bogs (Clymoet al. 1990). Since the inception of the Industrial Rev-olution (; 1850 A.D.), increasing pollution in thenorthern hemisphere has led to contamination of bothterrestrial and aquatic ecosystems. Peatlands serve asarchives for atmospheric chemical deposition and mayprovide useful records of the spatial and temporal pat-terns and magnitude of this deposition (e.g., Norton1987, Schell 1986, 1987, Rapaport and Eisenreich1988, Schell et al. 1989, 1997, Brannvall et al. 1997,Espi et al. 1997, Farmer et al. 1997, Norton et al. 1997,Shotyk et al. 1997a,b, Weiss et al. 1997, Vile et al.2000).
Peatlands contain 1/3 of the world’s soil carbonpool, storing an estimated 397–455 Pg (1015 g) of C(Gorham 1991, Zoltai and Martikainen 1996, Mooreet al. 1998) as organic matter. Currently, peatlands arethought to function simultaneously as a net sink foratmospheric CO2, sequestering approximately 76 Tg(1012 g) of C yr21 from the atmosphere, and as a sub-stantial source of CH4 (Gorham 1991, 1994, 1995,Wahlen 1993). Global warming, which will be mostpronounced at northern latitudes (Raisanen 1997),likely will affect the mass balance of C near peat sur-faces where peat temperature fluctuates with air tem-perature. Therefore, it is important to focus researchefforts on C cycling of recently accumulated peat. Itcertainly is possible to estimate directly both net pri-mary production and decomposition rates in peatlands.Methodological limitations, however, combined withtypically large spatial and temporal variability lead tosubstantial errors in extrapolating from direct mea-
surements to annual C budgets in near-surface peat.An alternative approach to estimating the short-term Csink capacity of a peatland takes advantage of the lon-ger-term records stored in vertically accumulatingpeat, which allow for the quantitative estimation ofrecent net rates of organic matter accumulation (e.g.,Belyea and Warner 1994a,b, Wieder et al. 1994, Old-field et al. 1995, Clymo et al. 1998, Turetsky et al.2000, Wieder 2001).
Because of ongoing decomposition and compactionwithin a peat deposit, depth generally is not linearlyrelated to age (Clymo 1984, Clymo et al. 1990). Ac-curate dating of a peat profile is essential to constructchronologies from which rates of historical contami-nant loading or organic matter accumulation can becalculated. Many commonly used dating methods takeadvantage of the ombrotrophic nature of some peat-lands. These methods rely on the deposition of atmo-spherically-derived constituents as a basis for absolutedating, using a constant rate of supply approach (e.g.,210Pb, acid-insoluble ash, pollen density), or providechrono-stratigraphic markers recording historicalchanges in atmospheric loadings (e.g., 137Cs, 241Am or207Bi from nuclear weapons testing and/or the Cher-nobyl accident, pollen, polychlorinated biphenyls(PCBs), polyaromatic hydrocarbons (PAHs), pesti-cides). These dating approaches rely on the assumptionof post-depositional immobility of atmospherically de-rived constituents mainly through cation exchange (cf.Shotyk et al. 1997b, Vile et al. 1999). Large, non-polarcompounds (such as PCBs and PAHs) also bindstrongly to the organic peat matrix (Rapaport and Ei-senreich 1988, Sanders et al. 1995). Such strong bind-ing limits mobility of certain atmospherically-depos-ited materials within peat.
No single tool for dating recent peat deposits hasemerged as the most reliable (cf. Belyea and Warner1994a). Many studies either use a single method orcorroborate dates using several methods. Most inde-pendent dating methods can provide continuous chro-nologies that are useful in revealing fluctuations inpeat accumulation over time. Chrono-stratigraphicmarkers record only single points in time but can pro-vide helpful corroborations with other methods. Inlight of the increasing interest in both the role of peat-lands in global C cycling and in the use of peatlandsas archives of past atmospheric deposition of pollut-ants, we review currently available methods for datingrecent peat deposits (defined here as the past 300 yearsof peat accumulation). Some methods, such as radio-carbon and 210Pb dating, have been extremely populartools in peatlands. Less commonly used methods haveless literature on their use in peat.
For each method, we identify background informa-tion necessary to understand the theories behind each
326 WETLANDS, Volume 24, No. 2, 2004
technique, methodology commonly used, an evalua-tion of key literature, and any practical considerationsincluding the assumptions, advantages, and limitationsof each approach. In addition, to provide informationon wiggle matching, a relatively recent application ofradiocarbon dating, we outline its potential use in dat-ing recent peat using a hypothetical data set.
ABSOLUTE OR CONTINUOUS DATINGMETHODS
Radiocarbon (14C) Dating
Radiocarbon (14C) was the first cosmogenic isotopedetected (Rubin and Kamen 1941). The principles andapplication of radiocarbon dating were developed inthe 1940s (Arnold and Libby 1949, Libby 1955). Ra-diocarbon dating has applications for dating materialsup to approximately 50,000 years in age (see Tayloret al. 1992, Taylor 2000). For the principles and prac-tice of radiocarbon dating in depth, see Olsson (1986),Taylor (1987, 1997), Delibrias (1989), Duplessy andArnold (1989), Aitken (1990), Bowman (1990), Pilch-er (1991), Kromer and Munnich (1992), Gove (1992),Cook et al. (1996), and the specialist literature, es-pecially the journal Radiocarbon (also see Bjorck andWohlfarth (2001) for a review of 14C dating of lakesediments and similar materials). An excellent gen-eral resource may also be found at: http://www.c14dating.com/. Although much development in radio-carbon focuses on the more distant past (e.g., Hughenet al. 2000, van der Plicht 2000), we highlight in thisreview the potential for high-resolution dating of re-cent peat (here regarded as the last ; 300 yrs).
Carbon-14 exists in minute concentrations, at aboutone out of every 1012 carbon atoms, most of which arethe stable isotopes 12C (99% abundance) and 13C (1%abundance). A radioactive (unstable) isotope, radio-carbon is produced in the upper atmosphere (the strato-sphere) when thermal neutrons (produced by cosmicrays) react with 14N atoms (Masarik and Beer 1999).Since the arrival of cosmic rays is modulated by solarwinds, 14C production offers a solar variation proxy(e.g., Stuiver and Braziunas 1993, Bard et al. 1997,2000). The resulting 14C is oxidized to 14CO2, whichmixes into the lower atmosphere (the troposphere), andis quickly homogenized within the overall atmosphericCO2 reservoir. From there, 14C (as 14CO2) can be fixedinto stable plant matter via photosynthesis and, hence,also enters the food web. Animal tissues contain 14C:12C ratios proportional to ingested plant material. Uponthe death of an animal or plant, uptake of fresh 14Cceases. The amount of 14C in the organic matter thenbegins to decrease as the 14C undergoes radioactivebeta particle (b2) decay. 14CO2 can also enter the chem-
ical pathways of terrestrial and marine carbonates andso allows the 14C dating of inorganic carbon samples.However, in this review, we consider only the datingof organic carbon samples.
The basis for 14C dating is the basic radioactiveproperty of the isotope: in an isolated sample, abun-dance decreases by 1% every 83 years, such that after5730 years (the half-life) only half the original numberof atoms remain. As conceived by Libby, this decayprocess allowed radiocarbon to be used in determiningages for organic materials. The time elapsed since thedeath of an animal or plant is calculated using Equa-tion 1:
A T0 1/214C age (years) 5 ln 3 (1)A ln 2
In Equation 1, A is the sample’s current 14C specificactivity (in disintegrations per gram of C), A0 is theAD1950 ‘‘modern’’ reference 14C specific activity, andT1/2 is the half life. The value of A0 is determined froma standard, either AD1850 wood or SRM 4990 oxalic-acid (now available as SRM 4990-C) supplied byNIST (National Institute of Standards and Technology,formerly the U.S. National Bureau of Standards, Goh1991a, Arnold 1995). The currently accepted half lifeof 14C is 5730 6 40 years (Godwin 1962). However,during the development of radiocarbon dating, a halflife of 5568 6 30 years (Engelkemeir et al. 1949—referred to now as the ‘‘Libby half life’’) was used inEquation 1 to determine age. This results in a 2.9%error from the ‘‘true’’ radiocarbon age (Arnold 1995).However, because of the preponderance of 14C datespublished using the Libby half-life, this value has longbeen used as a convention in all radiocarbon dating.Radiocarbon dates are reported in radiocarbon yearsbefore present (‘‘years BP’’), where the present is de-fined as AD1950. For the established conventions onreporting 14C dates, see Stuiver and Polach (1977).
In conventional 14C-dating, measurement of betaparticle emissions is used to estimate 14C activity eitherby gas proportional counting or liquid scintillationspectrometry. A relatively large amount of sample(typically 5–10 grams for dry peat) is needed with theconventional technique, as only a small proportion of14C disintegrations actually can be counted (Hedges1981, Hedges and Gowlett 1986). Counting time istypically up to a week. With older material, it becomesdifficult to separate the radioactive disintegration of14C from background radiation. As a result, back-ground signals contribute increasingly to error withprogressively older samples (Hedges 1981). Since thelate 1970s, the use of accelerator mass spectrometry(AMS) to quantify carbon isotopes directly by atomicmass separation has become increasingly popular in
Turetsky et al., DATING RECENT PEAT 327
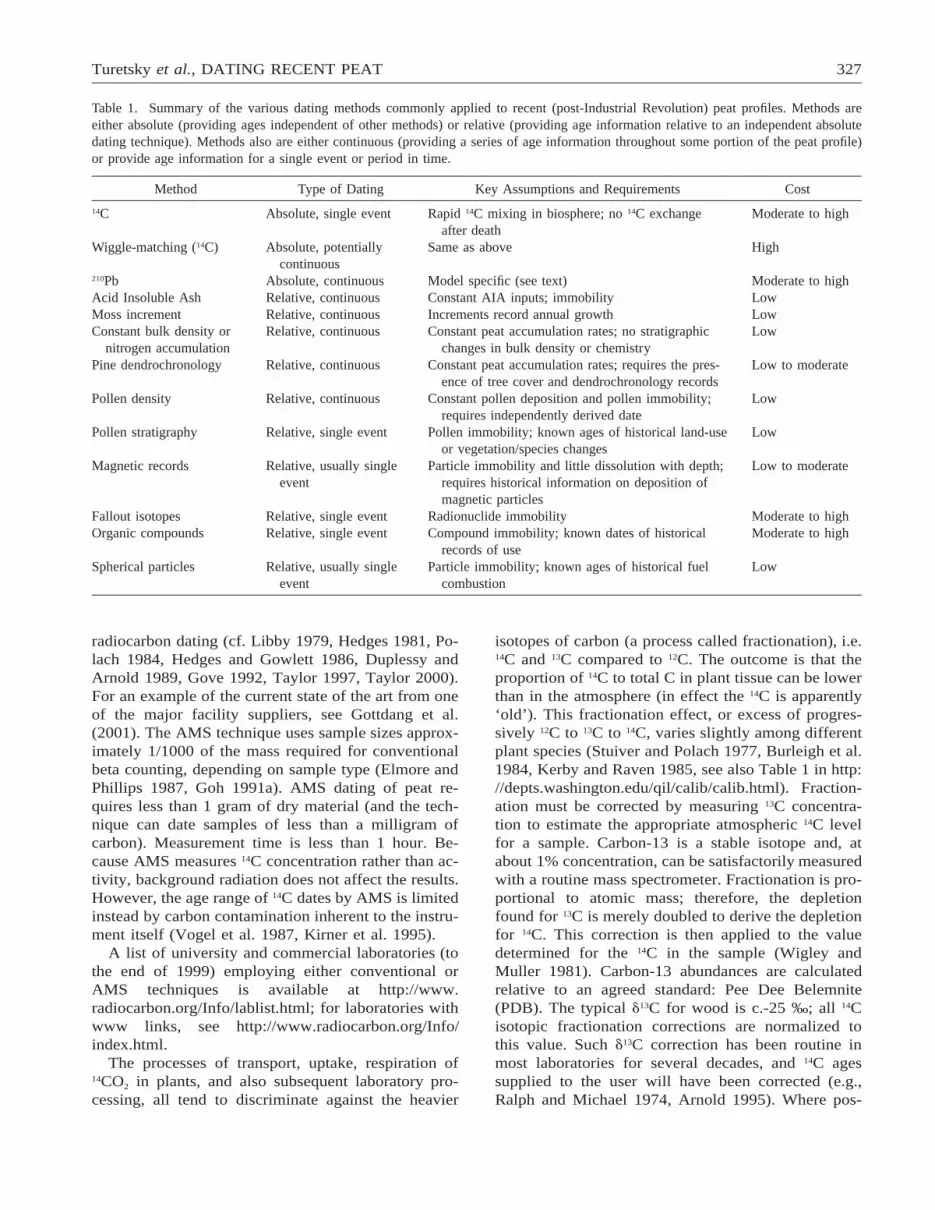
Table 1. Summary of the various dating methods commonly applied to recent (post-Industrial Revolution) peat profiles. Methods areeither absolute (providing ages independent of other methods) or relative (providing age information relative to an independent absolutedating technique). Methods also are either continuous (providing a series of age information throughout some portion of the peat profile)or provide age information for a single event or period in time.
Method Type of Dating Key Assumptions and Requirements Cost
14C Absolute, single event Rapid 14C mixing in biosphere; no 14C exchangeafter death
Moderate to high
Wiggle-matching (14C) Absolute, potentiallycontinuous
Same as above High
210Pb Absolute, continuous Model specific (see text) Moderate to highAcid Insoluble Ash Relative, continuous Constant AIA inputs; immobility LowMoss increment Relative, continuous Increments record annual growth LowConstant bulk density or
nitrogen accumulationRelative, continuous Constant peat accumulation rates; no stratigraphic
changes in bulk density or chemistryLow
Pine dendrochronology Relative, continuous Constant peat accumulation rates; requires the pres-ence of tree cover and dendrochronology records
Low to moderate
Pollen density Relative, continuous Constant pollen deposition and pollen immobility;requires independently derived date
Low
Pollen stratigraphy Relative, single event Pollen immobility; known ages of historical land-useor vegetation/species changes
Low
Magnetic records Relative, usually singleevent
Particle immobility and little dissolution with depth;requires historical information on deposition ofmagnetic particles
Low to moderate
Fallout isotopes Relative, single event Radionuclide immobility Moderate to highOrganic compounds Relative, single event Compound immobility; known dates of historical
records of useModerate to high
Spherical particles Relative, usually singleevent
Particle immobility; known ages of historical fuelcombustion
Low
radiocarbon dating (cf. Libby 1979, Hedges 1981, Po-lach 1984, Hedges and Gowlett 1986, Duplessy andArnold 1989, Gove 1992, Taylor 1997, Taylor 2000).For an example of the current state of the art from oneof the major facility suppliers, see Gottdang et al.(2001). The AMS technique uses sample sizes approx-imately 1/1000 of the mass required for conventionalbeta counting, depending on sample type (Elmore andPhillips 1987, Goh 1991a). AMS dating of peat re-quires less than 1 gram of dry material (and the tech-nique can date samples of less than a milligram ofcarbon). Measurement time is less than 1 hour. Be-cause AMS measures 14C concentration rather than ac-tivity, background radiation does not affect the results.However, the age range of 14C dates by AMS is limitedinstead by carbon contamination inherent to the instru-ment itself (Vogel et al. 1987, Kirner et al. 1995).
A list of university and commercial laboratories (tothe end of 1999) employing either conventional orAMS techniques is available at http://www.radiocarbon.org/Info/lablist.html; for laboratories withwww links, see http://www.radiocarbon.org/Info/index.html.
The processes of transport, uptake, respiration of14CO2 in plants, and also subsequent laboratory pro-cessing, all tend to discriminate against the heavier
isotopes of carbon (a process called fractionation), i.e.14C and 13C compared to 12C. The outcome is that theproportion of 14C to total C in plant tissue can be lowerthan in the atmosphere (in effect the 14C is apparently‘old’). This fractionation effect, or excess of progres-sively 12C to 13C to 14C, varies slightly among differentplant species (Stuiver and Polach 1977, Burleigh et al.1984, Kerby and Raven 1985, see also Table 1 in http://depts.washington.edu/qil/calib/calib.html). Fraction-ation must be corrected by measuring 13C concentra-tion to estimate the appropriate atmospheric 14C levelfor a sample. Carbon-13 is a stable isotope and, atabout 1% concentration, can be satisfactorily measuredwith a routine mass spectrometer. Fractionation is pro-portional to atomic mass; therefore, the depletionfound for 13C is merely doubled to derive the depletionfor 14C. This correction is then applied to the valuedetermined for the 14C in the sample (Wigley andMuller 1981). Carbon-13 abundances are calculatedrelative to an agreed standard: Pee Dee Belemnite(PDB). The typical d13C for wood is c.-25 ‰; all 14Cisotopic fractionation corrections are normalized tothis value. Such d13C correction has been routine inmost laboratories for several decades, and 14C agessupplied to the user will have been corrected (e.g.,Ralph and Michael 1974, Arnold 1995). Where pos-
328 WETLANDS, Volume 24, No. 2, 2004
sible in peat/sediment studies, selection of sampleswhose 14CO2 is derived from the atmosphere (e.g.,plant macrofossils) is usually preferable.
Various other processes can also affect the C avail-able for analysis in an organic sample and lead to dis-tortions between the date obtained and the real datefor the target event of interest. The generic label ‘con-tamination’ is usually applied to such issues. Hedges(1992) provides a useful general review of sampletreatment strategies for radiocarbon samples. With ref-erence to peat, we note the following:
(i) Particularly in permafrost systems, frost heavingcan disturb peat chronologies and bury surface peatwith underlying, older deposits (Brown 1969; but seeVorren and Vorren 1976).
(ii) Peat samples may be contaminated by youngercarbon through root penetration, infiltration of dis-solved modern organic carbon (humics), or bacterialaction on stored samples, leading to underestimates ofbulk peat age (Geyh et al. 1974, Matthewes 1985, Goh1991a, Hammond et al. 1991, Olsson 1991, Tornqvistet al. 1992, Punning et al. 1993, Charman et al. 1994,Killian et al. 1995, Oldfield et al. 1997). Standard lab-oratory pretreatments (NaOH) aim to remove such mo-bile material. Dating ‘bulk’ samples can remain trou-blesome if materials are heterogeneous in age. In thiscase, dating only the NaOH insoluble fraction can biasdata towards old and reworked material. In other sit-uations, dating the NaOH-soluble fraction may lead tomore correct ages (Olsson 1986, Gulliksen et al.1998). However, the best strategy generally is to datespecific macrofossil remains.
(iii) Bulk samples may be subject to other local res-ervoir effects. For example, hard-water sources in lakedeposits may have a significant reservoir component(Barkenow et al. 1998). MacDonald et al. (1987)found that aquatic moss samples gave older than ex-pected ages because of uptake of 14C-deficient carbonfrom an unknown source. The presence of tough de-cay-resistant plant remains (such as heather) or the in-wash of soil materials containing old carbon are otherapparent sources of a reservoir effect (Edwards andRowntree 1980). This especially can be a problem inrecent times, as the proportion of soil in-wash has in-creased in many areas from late prehistoric throughmodern times. Thawing permafrost can also be a factorreleasing old reservoirs of organic matter in closeproximity to plant uptake (Damon et al. 1996).
(iv) Organic matter fractions, such as humic acid,humin, and fulvic acid, in soils and peats have beenshown to differ substantially in radiocarbon content(Scharpenseel 1971, Scharpenseel and Schiffmann1977, Stout et al. 1981, Hammond et al. 1991, Shoreet al. 1995). Physical removal of roots and/or chemicalpre-treatment of samples are recommended to mini-
mize sample contamination by adsorption or exchangewith non-contemporaneous carbon (Goh 1991b).Where peat samples represent time intervals signifi-cantly longer than the 10-year measurement segmentsof the 14C calibration (see text on calibration below),it is appropriate to employ a smoothed calibrationcurve more suitable for the time window representedin the peat (Mook 1983). However, AMS dating per-mits the dating of specific macrofossils from inten-sively sampled peat sequences and is likely to over-come this problem.
Minor variations in 14C levels at different times andplaces on the Earth is another complication for 14Cdating. Excluding modern fossil fuel CO2 contributions(about 50% of the modern observed variation), theproduction and flux of 14C naturally varies slightly bytime of year on a c.1–4 ‰ range (winter-spring low,summer peak). This can be relevant if seasonally spe-cific materials are dated (sub-annual growth samples)or at times of rapidly and significantly changing 14Clevels (i.e., changing solar irradiance: Kromer et al.2001, Manning et al. 2001). The atmospheric 14C con-tent at earth surface level varies slightly depending onboth latitude and altitude (Levin et al. 1989, 1992,Levin and Kromer 1997a, Levin and Hesshaimer2000). Thus, while mid-northern latitude North Amer-ica and Eurasia near sea-level generally have similar14C levels within a c.1 ‰ range (Braziunas et al. 1995),areas further north or south have generally increasingbut temporally varying offsets (Stuiver and Braziunas1998, Stuiver et al. 1998a). More significant is the in-ter-hemisphere offset (the current standard recommen-dation is that southern hemisphere ages be reduced by41614 14C years: McCormac et al. 2002); however,this varies through time and has become smaller sincethe mid-19th century (Kromer et al. 1998, McCormacet al. 1998, Stuiver et al. 1998b). For very recent sam-ples, it can be largely ignored. For equatorial or near-equatorial locations, the relevance of which hemi-spheric trend samples follow will vary according tomovements in the Intertropical Convergence Zone(Hua et al. 2002).
Calibration. Libby’s earliest models for radiocarbondating assumed that (i) the ratio of 14C:12C has beenconstant worldwide over time; (ii) radiocarbon is rap-idly mixed following production throughout the bio-sphere; and (iii) measured 14C is from the organismbeing studied (i.e., no exchange occurs between theenvironment and the organism after death). As mea-surement precision improved, discrepancies betweenknown ages and measured 14C ages led to much in-vestigation (Libby 1963). As early as the 1950s, den-drochronological analysis (tree rings of known age)was used to document continuous variations in 14C
Turetsky et al., DATING RECENT PEAT 329
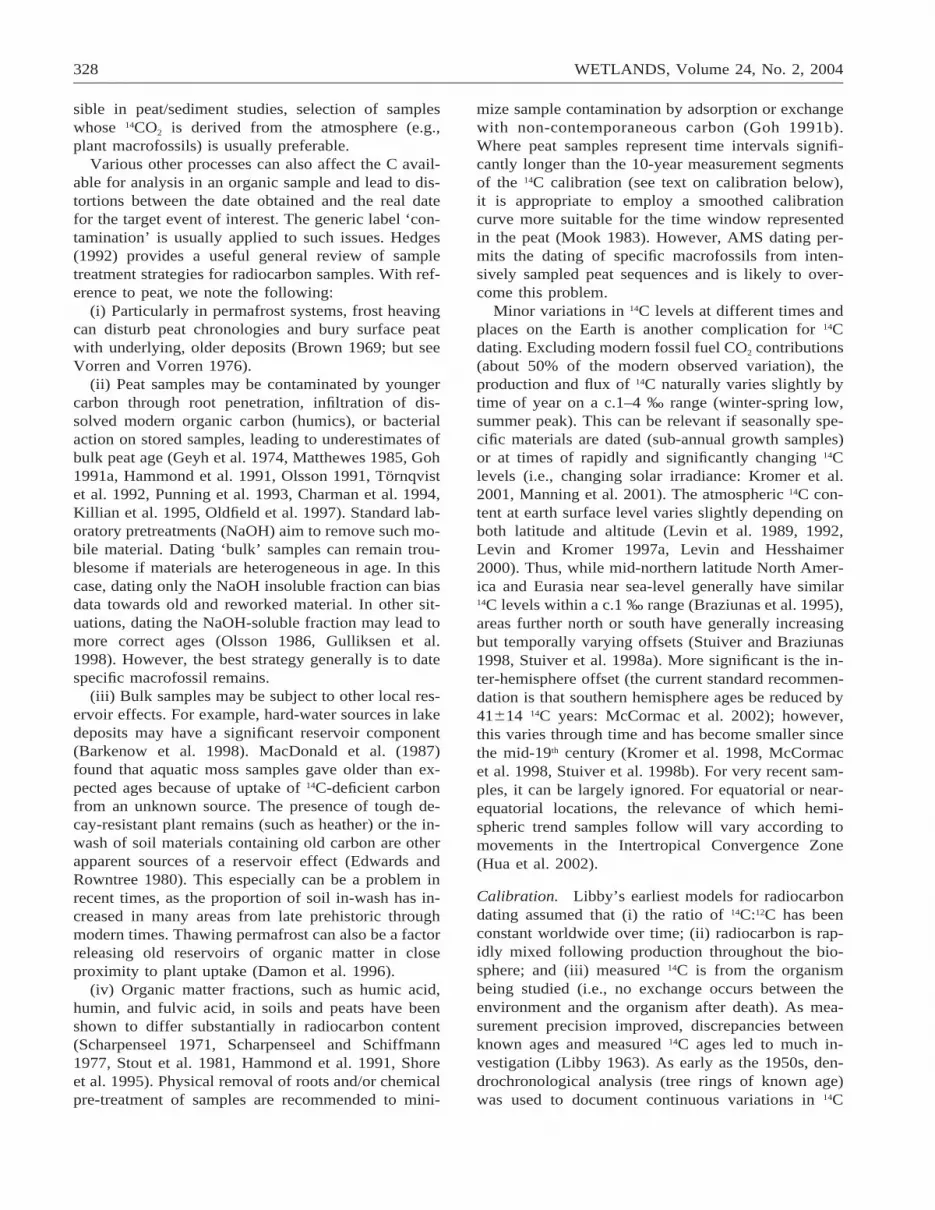
Figure 1. A. Last six centuries of the INTCAL98 14C cal-ibration curve (Stuiver et al. 1998a). This curve consists ofmeasurements on consecutive 10-year sections of wood. Thegrey lines show the 6 1s envelope for the INTCAL98 da-taset. B. Comparison of the 1-year calibration dataset(AD1511–1955; Stuiver et al. 1998b) against the standard10-year timeframe INTCAL98 dataset (AD1700–1955;Stuiver et al. 1998a). Note that a 10-year moving averageof the 1-year dataset is largely consistent with the INT-CAL98 curve.
concentrations in the atmospheric C reservoir overtime (de Vries 1958; see later, e.g., Suess 1965, Da-mon et al. 1974). High-precision radiocarbon mea-surements in the 1970s and 1980s verified that this wasreal variation rather than a measurement or laboratoryartifact (Pearson et al. 1977, de Jong et al. 1979, Stuiv-er 1982, Pearson et al. 1983). Such variations occurboth as a result of natural changes in 14C productionrate due to solar variability, geomagnetic field intensity(Damon et al. 1978, Stuiver et al. 1991, Stuiver andBraziunas 1993, 1998, van Geel et al. 1998), and an-thropogenic activities such as 14C dilution in the at-mosphere through fossil fuel combustion (von Gunten1995) or 14C enrichment of the atmosphere with nu-clear weapons testing in the 1950s and 1960s (Mat-thews 1985, Goh 1991b).
Sets of absolutely time-resolved, high-precision 14Cmeasurements have been internationally adopted, firstin 1986 (Pearson 1986, 1987, Stuiver and Pearson1986), and then again in 1998 (an INTCAL04 revisionis in preparation: Reimer et al. 2002 and Paula Reimer,pers. comm.) (Stuiver et al. 1998a), and these are nowroutinely employed to ‘calibrate’ measured 14C ages onsamples of unknown age to determine true calendarages. A southern hemisphere calibration data set(SHCal02) also exists for the period 1955AD to950AD (McCormac et al. 1998, 2002). The current(1998) standard relationship between 14C age and cal-endar (tree-ring) age is shown in Figure 1A (data fromStuiver et al. 1998a). This calibration curve derivesfrom measurements on 10-year blocks of wood (thusproviding a 10-year average curve; various statisticalmodels are adopted to interpolate between the datapoints for analysis or to generate smoothed curves bestfitting the data pattern versus specific data points. e.g.,Dekling and van der Plicht 1993, Knox and McFadgen2001). Additionally, a few partial calibration datasetsbuilt from higher resolution data exist, in particular a1-year curve for AD1511–1955 (Stuiver et al. 1998b)(Figure 1B). These data show short-term variationaround the long-term trend determined from the stan-dard 10-year timeframe measurements.
Several computer programs (most notably CALIB—available at http://www.calib.org; OxCal—available athttp://www.rlaha.ox.ac.uk/orau/index.htm; and BCal—available at http://bcal.shef.ac.uk/) are available to car-ry out the calibration process (for these and other com-puter calibration programs, see Stuiver and Reimer1986, 1993, van der Plicht 1993, Bronk Ramsey 1995,Puchegger et al. 2000, Weninger and Joris 2001, Jonesand Nicholls 2002). OxCal and BCal (and related:Bwigg) provide comprehensive statistical packages forthe analysis of radiocarbon dates using Bayesian ap-proaches and represent the current ‘state of the art’(see Buck et al. 1991, 1992, 1994, 1996, 1999, Bronk
Ramsey 1994, 2001, Christen and Litton 1995, Chris-ten 2003).
Wiggle Matching. A common misconception is that14C dating stops at AD1950—due to atmospheric ther-monuclear bomb activity distorting natural 14C levels.It is merely a little more difficult and non-standard.Although no internationally agreed-upon curve existsfor 14C levels since 1954, there are extensive dataavailable for both hemispheres (see at http://cdiac.esd.ornl.gov/trends/co2/contents.htm). A recentpaper by Goodsite et al. (2001) provides a detailedpost-bomb calibration curve and analytical assessmentfor the northernmost northern hemisphere and dem-onstrates the ability to achieve dates for peat accurateto within 1 to 2 years. Meanwhile, in the southernhemisphere, a study by Hua et al. (2003) using tree-
330 WETLANDS, Volume 24, No. 2, 2004
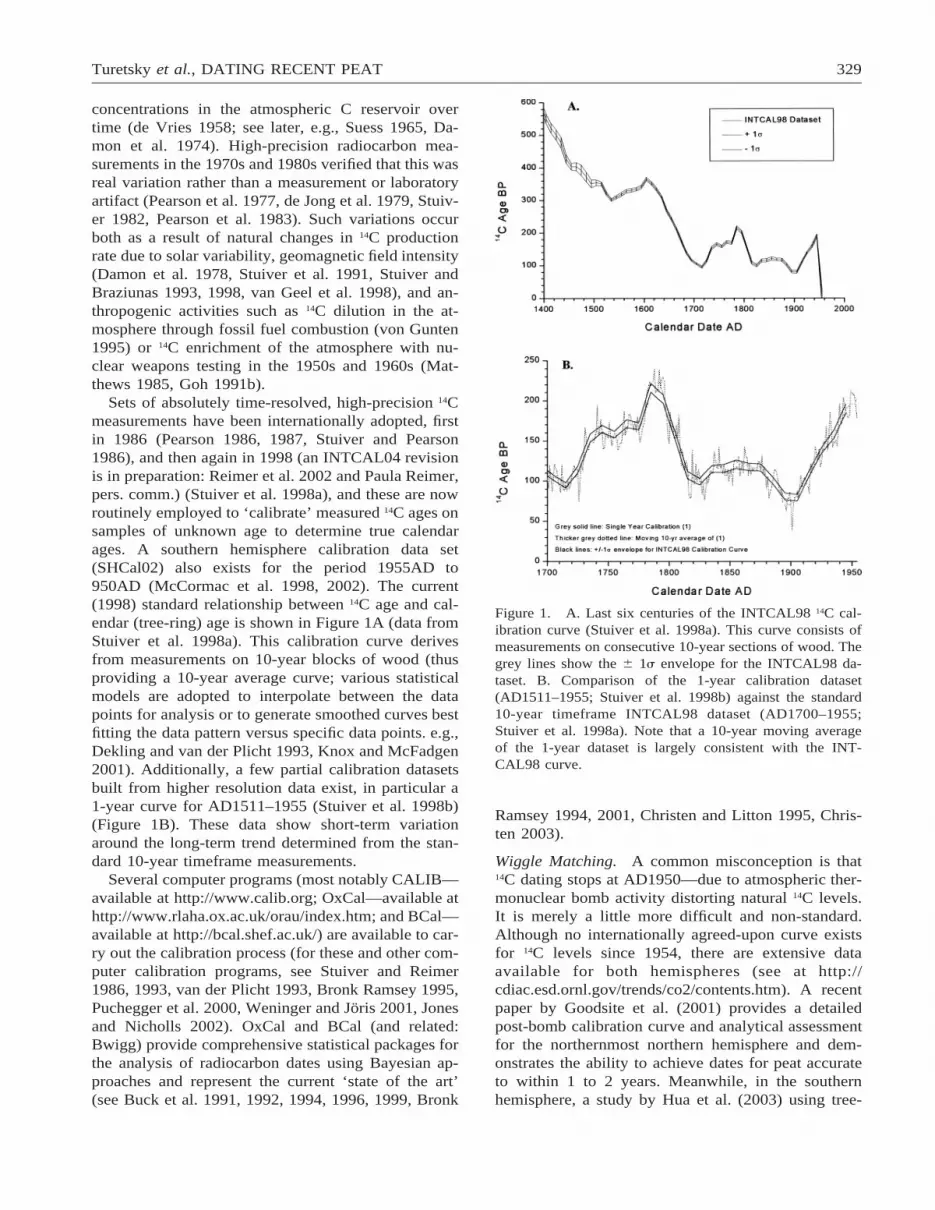
Figure 2. A. Annual weighted average values for atmo-spheric 14C from Vermunt (Levin et al. 1994) and Schauins-land (Levin and Kromer 1997b) in the northern hemisphere,and Wellington (Manning and Melhuish 1994) in the south-ern hemisphere. 1 s errors range from approximately 2 to 4per mil (data not shown). B. Hypothetical calibration of astratigraphic (known order) series of modern 14C samplesagainst the northern hemisphere data is shown in A (sampleA collected at the peat surface while sample E was locatedat the base of a peat core). Errors are ignored in this ex-ample. The stratigraphic order allows resolution of the oth-erwise problematic apparent age inversion for sample E. Thedetailed 14C record allows its precise dating at the start ofthe sequence.
rings from northern New South Wales, Australia haslikewise demonstrated the application of annual reso-lution radiocarbon dating for the period 1952–1978. Intheory, given use of 7Be to determine the current 0–1year present peat horizon, a 1–2 year dating accuracy/precision via careful and detailed 14C analysis shouldbe possible for stratigraphic sequences over the lastfive decades. Goodsite et al. (2001) conclude that such14C dating offers far better accuracy and precision thanany other dating technique for recent contexts (in thiscase, recent is defined as the post-bomb spike).
A time-ordered (from oldest to most recent) seriesof 14C ages should resemble the time-series of 14C agesrepresented by the 14C calibration curves. By compar-ison of such time-resolved datasets, it is possible toderive highly precise calendar ages for each individualconstituent 14C determination, potentially with resolu-tion close to that of the underlying calibration dataset.This technique has come to be called ‘wiggle-match-ing.’
Although first employed four decades ago (e.g., Fer-guson et al. 1966, Neustupny 1973), wiggle-matchingis a relatively new application of radiocarbon dating.It can significantly improve the precision of age chro-nologies and may be used for dating recent peat. Thistechnique capitalizes on the irregularities or ‘wiggles’in 14C calibration curves (see Figure 1) due to changesin atmospheric 14C concentrations over time. Wiggle-matching involves superimposing sequences of 14Cdates onto the individual irregularities in the tree-ringcalibration curve.
Two distinct forms of wiggle-matching exist. Thefirst, usually relevant to dendrochronological samples,takes a fixed calendar-year sequence (e.g., a 200-growth rings 5 200-calendar years piece of wood),dates a series of blocks of these rings at fixed intervals(e.g., 10 samples of 10 rings each, spaced either 10 or20 years apart, from the 200-year sample), and thenmatches this series against the 14C calibration curve.Given the choice of similar dated sections (e.g., 10-year blocks) and inter-sample intervals (e.g., units of10-years), the unknown sample should be compatiblewith the calibration curve, and a satisfactory match islikely where no significant laboratory offset/error in-terferes. For some examples of fixed-sequence wiggle-matching, see Ferguson et al. (1966), Clark and Ren-frew (1972), Pearson (1986), van der Plicht et al.(1995), Manning et al. (2001). The second form ofwiggle-matching, relevant to peat sequences (and ar-chaeology), is variable or flexible sequence wiggle-matching. Here, the order of the samples is known, butthe intervals between the samples are either notknown, or known only in approximate terms (e.g.,from estimates from sedimentation rates or peat-growth rates), and so are flexible within the series.
Within the sequence constraints, the issue then iswhether the sequence can plausibly be pushed orpulled so as to best match the calibration curve’s re-cord of past atmospheric 14C levels. If the sequencecovers a time of dramatic change in 14C levels, thenthis can almost be considered a graphical exercise ofmatching the shape in the data to the shape of thecalibration curve (e.g., van Geel and Mook 1989, Mau-quoy et al. 2002; see Figure 2). At other times, theremay be differing possibilities with varying probabili-ties, and the analysis of the overall sequence is nec-essary to try to resolve the likely best placement. Forsome examples of work using variable/flexible se-quence wiggle-matching, see Clymo et al. (1990),

Turetsky et al., DATING RECENT PEAT 331
Manning and Weninger (1992), Tolonen et al. (1993),Day and Mellars (1994), Christen and Litton (1995),Kilian et al. (1995, 2000), Oldfield et al. (1997), andGulliksen et al. (1998). In general, variable/flexiblewiggle-matching is more approximate than fixed-se-quence analysis; analyses are susceptible to compli-cations caused not only by measurement accuracy, butalso stratigraphic interpretation or misinterpretation.For example, in palaeoenvironmental sequences, it istypically necessary to employ bulk sediments to obtainthe required dense time-series data (e.g., Gulliksen etal. 1998). Such work should (i) include comparison ofbulk material and macrofossils at several points in thesequence to test the reliability of the bulk sample dataand (ii) only use samples from terrestrial or soft-watercontexts.
Initial applications mainly employed simple leastsquares (chi-squared) fitting to determine the place-ment of a floating sequence versus the known se-quence (the calibration curve)—a recent developmentuses Monte Carlo simulation to better derive overalldating uncertainties. Another approach is to use Bayes-ian statistics, where the relative likelihood of each yearof fit is determined. Bayesian wiggle-matching isavailable through the OxCal and BCal software pack-ages. As the recent paper of Bronk Ramsey et al.(2001) shows, all techniques achieve consistent results.The great advantages of the Bayesian approach are theability to include additional prior knowledge beyondmere sequence into the analysis model (e.g., allowingfor approximate intervals and a confidence range onthese, or including a known historical datum), and tobe able to quantify the errors involved.
To give an idea of the sort of analyses possible, wepresent a hypothetical case study using the OxCal 3.9software. This situation involves a peat deposit that is87 cm in depth and is thought to be a relatively recentsequence. The peat developed above an old soil sur-face that used to support some tree cover. The peatseems to have formed at a relatively consistent rate butshows signs of slightly greater compaction in the corewith depth. Two cores were taken in AD1980; one wasanalyzed immediately and the other stored (frozen). A14C age of 110650BP was obtained some years agofrom a sample deep in the first core. The calibratedage at 1s is AD1685–1731, 1809–1895, 1906–1925,1948–1951. A date in either of the first two intervalsis most likely, but covering over 200 years, the initialworkers concluded the core was modern with littleutility in further 14C dating.
Now a new team wishes to examine the frozen coreto achieve chronological resolution. A stump from atree formerly growing on the old soil surface is rec-ognized in the section exposed for study, and the teamwaits for a dendrochronological report. Microscope
examination of the core also reveals traces of volcanictephra at around 65 cm depth in the core; a samplehas been sent away for analysis. The stored core issampled at 1-cm resolution and 10 AMS dates are an-alyzed using macrofossils (Sphagnum branches andleaves) from the 1-cm slices (Figure 2, 3).
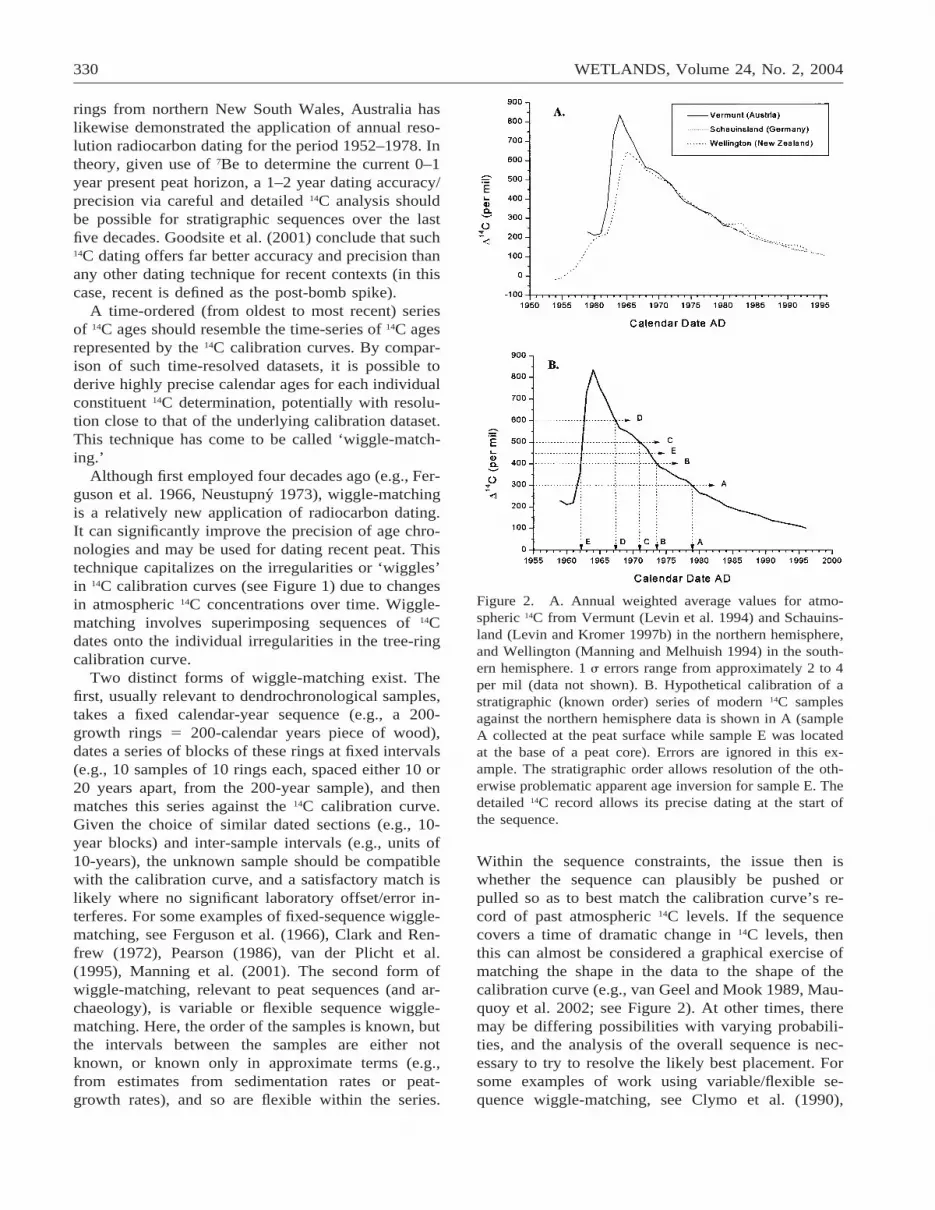
The team considers samples C-J using the Sequencefunction of OxCal (Figure 3). This already yields quitea refined resolution calendar chronology. Then, theteam examines the two ‘modern’ results (A and B) andcompares them with one of the available bomb 14Ccurves (Figure 4). Each sample could calibrate in twoplaces. However, as sample A is known to be morerecent than sample B, sample A must lie aroundAD1980 (and it is known that the core was obtainedin AD1980). We have no constraint on sample B; itcould thus date either around AD1966 or AD1963.The team thus has a high-precision dating of the first7 cm of the core. Given the apparent observation offairly consistent accumulation, each cm of peat likelyrepresents .2.2 years. Thus, the approximate likelytime interval between the various samples could beestimated, and this information could be incorporatedinto the dating model. See Figure 5 where the gapsare estimated in round terms with a suitably cautious650% error allowance.
The results on the dendrochronological examinationof the tree stump and the tephra analyses are now bothavailable. The tree had bark preserved in one part ofthe radius, and after matching its growth curve to theregional master chronology, the last year of growth(death) has been assigned to AD1717. We can incor-porate this terminus post quem into the dating model.Further, the tephra from depth 65 cm (between sam-ples H and I) has been found to match closely theAD1783 Laki eruption products. We can also incor-porate this information into the model (Figure 5). Twoexamples of the derived calibrated ranges for individ-ual samples from Figure 5 are shown in Figure 6. Sam-ples are now dated with a resolution of a couple ofdecades, even at a 95% confidence level. Dating ofmore samples through the core could further refinethese age estimates towards decadal level or a betterresolution. An assessment of Figure 5, or use of otherdating methods, might allow refinement of the be-tween-sample intervals employed (Figure 5), with ad-ditional revisions to a dating model.
In theory, wiggle-matching may provide much moreconcise peat ages than single radiocarbon dates (Kilianet al. 1995) and may establish depth-age relationshipsthat can be accurately extrapolated to surface peat(Clymo et al. 1990, Oldfield et al. 1995). Recent workindicates that 14C can offer more accurate and precisedata for modern peats/sediments than other commonradioisotope techniques such as 210Pb (Goodsite et al.
332 WETLANDS, Volume 24, No. 2, 2004
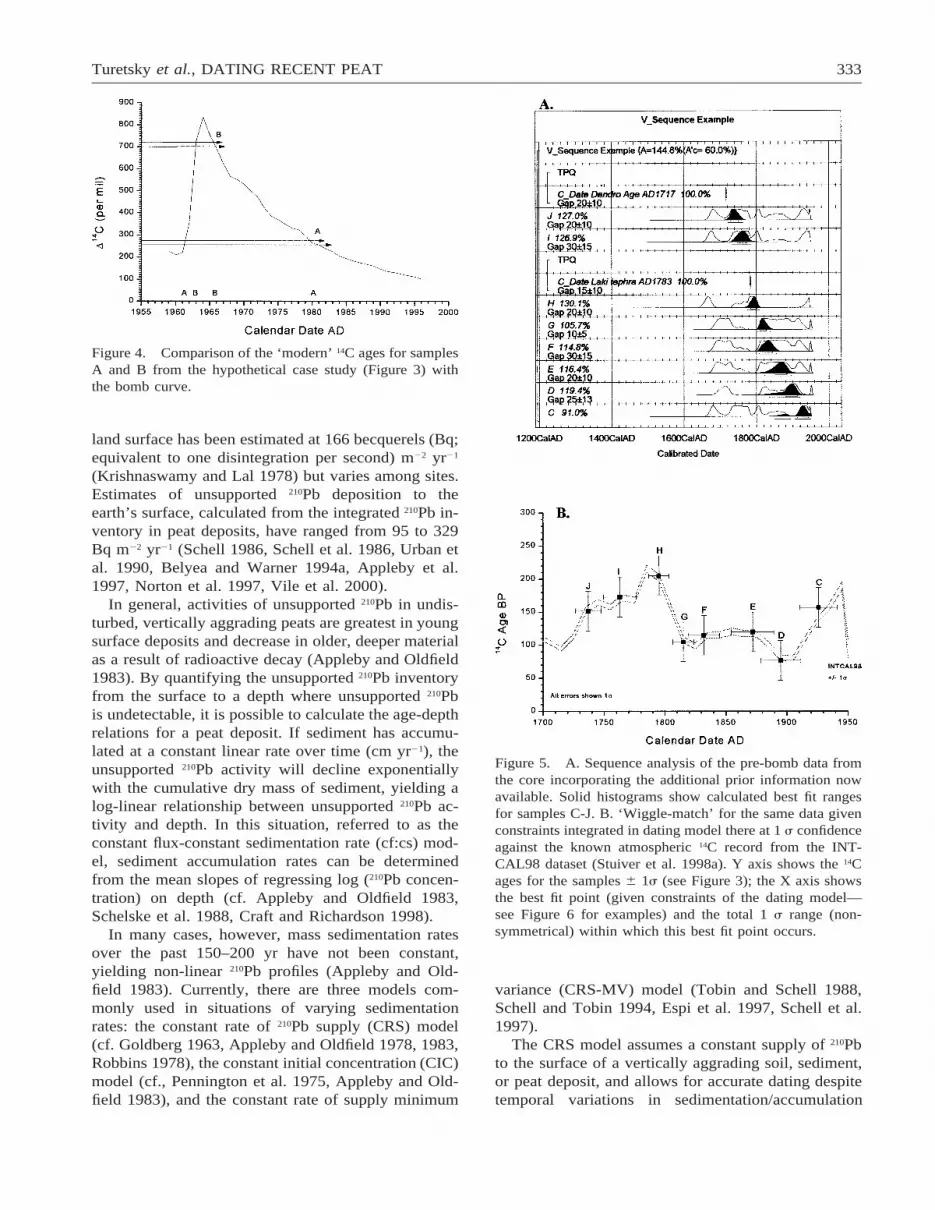
Figure 3. A. The ‘normal’ calibrated age ranges for theeight data points in a hypothetical case study using OxCal3.9 (curve resolution set at 1). The upper and lower linesunder each histogram indicate respectively the 1 s and 2 scalibrated age ranges. Note the multiple and differing cal-endar ranges possible for each sample, reflecting the wigglynature of the calibration curve where several calendar years(even a century or more apart) have effectively the same 14Cage. This situation appears problematic for refined dating. B.Sequence analysis of the ordered series of data enables thecalculation of possible fit ranges (the solid histograms) with-in the possible dating ranges for the individual samples takenin isolation (hollow histograms). This approach providesmore refined dating precision. An agreement statistic of
←
.c.60% indicates satisfactory agreement of data, model andcalibration curve at 95% confidence level; therefore, the se-quence analysis outlined here is satisfactory.
2001). Bomb-period 14C calibration can be included insuch analyses to enable accurate and precise dating tothe present (see case study above; Goodsite et al.2001). Surprisingly, few adequately (towards high-pre-cision) dated 14C series for peat or lake sediment se-quences have been published (e.g., Oldfield et al.1995, but see Clymo et al. 1990, Ilkonen 1995, Pilcheret al. 1996, Makila 1997, Oldfield et al. 1997, van derKnaap and Ammann 1997, Gulliksen et al. 1998, Mau-quoy et al. 2002). Much more work should now followon modern peats.
C-14 dating (and in particular via AMS dating ofselected macrofossils) of modern peat samples may of-fer accurate and precise decadal-scale or better age res-olution over the last several hundred years and at nearannual-scale for the very recent past. ‘Wiggle-matched’ 14C dating is a suitable approach for the high-resolution dating of post-Industrial Revolution peats,enabling detailed stratigraphic information to yieldtight chronological control. In all cases, however,proper sample preparation and attention to stratigraph-ic context are vital to enable accurate and precise dat-ing.
210Pb Dating
Based on the radioactive decay series of 238U, 210Pb-dating (Goldberg 1963, Appleby and Oldfield 1978)allows for radiometric dating of peat deposited overthe past 150–200 years. Uranium-238 is a primordialnuclide, present since the earth first condensed into asolid mass some four billion years ago. Because of itslong half-life (4.46 3 109 yr), about half of the original238U remains today. Widely dispersed in the earth’scrust, 238U is found in all sediments and continually isdecaying to produce 210Pb and other daughter isotopes.Within soil, 238U decays to 226Ra through a number ofdecay products, which subsequently decays to inert222Rn gas. Radon gas then decays through a series ofshort-lived isotopes to 210Pb (half life of 22.3 yr). Thetotal 210Pb pool in soil, sediment, or peat has two com-ponents: 1) a supported 210Pb component producedwithin the soil/sediment via radioactive decay of 222Rnthat never diffused to the atmosphere and 2) an un-supported 210Pb component derived from 222Rn that firstdiffused into the atmosphere and subsequently decayedto 210Pb. Unsupported 210Pb, removed from the atmo-sphere via wet deposition and dry fallout, is depositedonto the earth’s surface. Mean global 210Pb flux onto
Turetsky et al., DATING RECENT PEAT 333
Figure 4. Comparison of the ‘modern’ 14C ages for samplesA and B from the hypothetical case study (Figure 3) withthe bomb curve.
Figure 5. A. Sequence analysis of the pre-bomb data fromthe core incorporating the additional prior information nowavailable. Solid histograms show calculated best fit rangesfor samples C-J. B. ‘Wiggle-match’ for the same data givenconstraints integrated in dating model there at 1 s confidenceagainst the known atmospheric 14C record from the INT-CAL98 dataset (Stuiver et al. 1998a). Y axis shows the 14Cages for the samples 6 1s (see Figure 3); the X axis showsthe best fit point (given constraints of the dating model—see Figure 6 for examples) and the total 1 s range (non-symmetrical) within which this best fit point occurs.
land surface has been estimated at 166 becquerels (Bq;equivalent to one disintegration per second) m22 yr21
(Krishnaswamy and Lal 1978) but varies among sites.Estimates of unsupported 210Pb deposition to theearth’s surface, calculated from the integrated 210Pb in-ventory in peat deposits, have ranged from 95 to 329Bq m22 yr21 (Schell 1986, Schell et al. 1986, Urban etal. 1990, Belyea and Warner 1994a, Appleby et al.1997, Norton et al. 1997, Vile et al. 2000).
In general, activities of unsupported 210Pb in undis-turbed, vertically aggrading peats are greatest in youngsurface deposits and decrease in older, deeper materialas a result of radioactive decay (Appleby and Oldfield1983). By quantifying the unsupported 210Pb inventoryfrom the surface to a depth where unsupported 210Pbis undetectable, it is possible to calculate the age-depthrelations for a peat deposit. If sediment has accumu-lated at a constant linear rate over time (cm yr21), theunsupported 210Pb activity will decline exponentiallywith the cumulative dry mass of sediment, yielding alog-linear relationship between unsupported 210Pb ac-tivity and depth. In this situation, referred to as theconstant flux-constant sedimentation rate (cf:cs) mod-el, sediment accumulation rates can be determinedfrom the mean slopes of regressing log (210Pb concen-tration) on depth (cf. Appleby and Oldfield 1983,Schelske et al. 1988, Craft and Richardson 1998).
In many cases, however, mass sedimentation ratesover the past 150–200 yr have not been constant,yielding non-linear 210Pb profiles (Appleby and Old-field 1983). Currently, there are three models com-monly used in situations of varying sedimentationrates: the constant rate of 210Pb supply (CRS) model(cf. Goldberg 1963, Appleby and Oldfield 1978, 1983,Robbins 1978), the constant initial concentration (CIC)model (cf., Pennington et al. 1975, Appleby and Old-field 1983), and the constant rate of supply minimum
variance (CRS-MV) model (Tobin and Schell 1988,Schell and Tobin 1994, Espi et al. 1997, Schell et al.1997).
The CRS model assumes a constant supply of 210Pbto the surface of a vertically aggrading soil, sediment,or peat deposit, and allows for accurate dating despitetemporal variations in sedimentation/accumulation
334 WETLANDS, Volume 24, No. 2, 2004
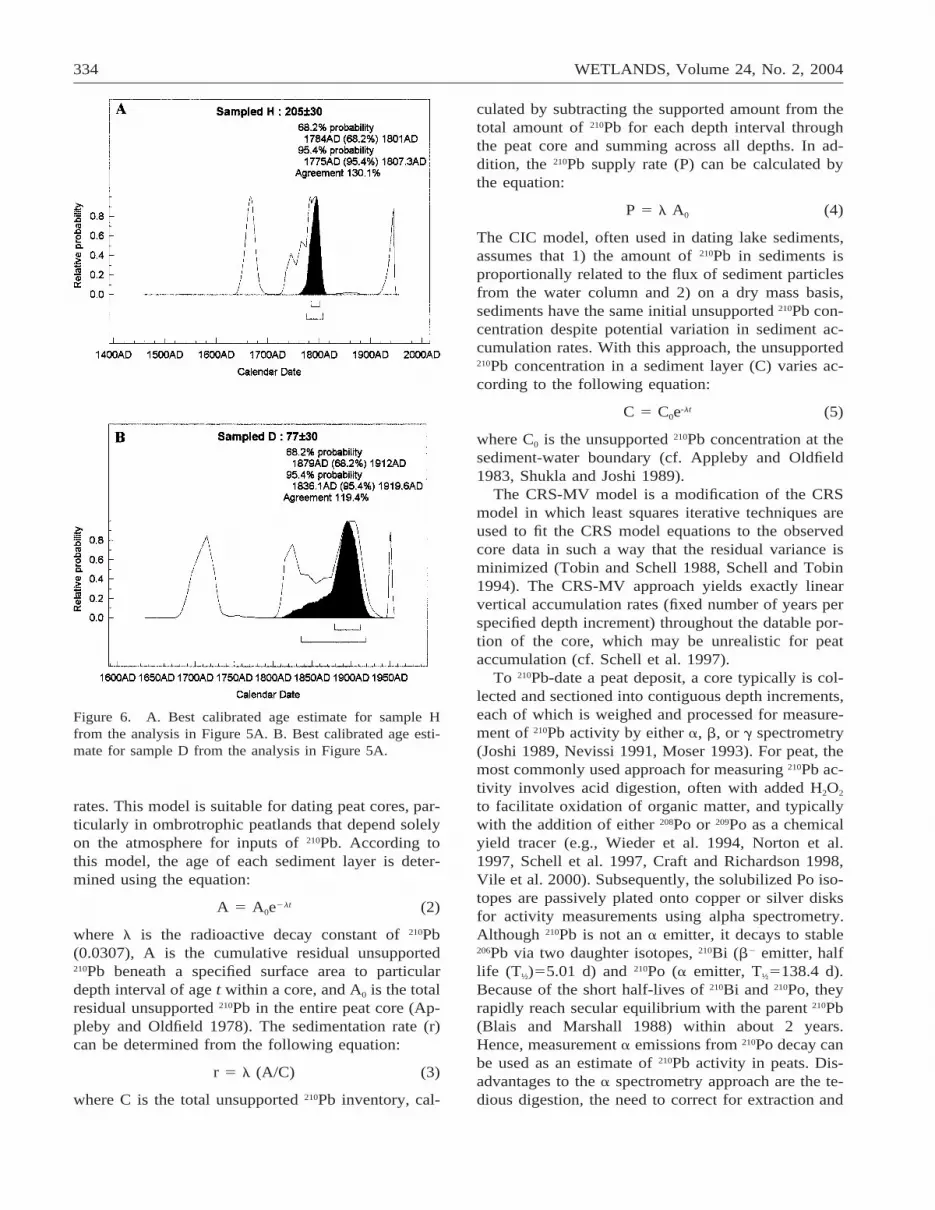
Figure 6. A. Best calibrated age estimate for sample Hfrom the analysis in Figure 5A. B. Best calibrated age esti-mate for sample D from the analysis in Figure 5A.
rates. This model is suitable for dating peat cores, par-ticularly in ombrotrophic peatlands that depend solelyon the atmosphere for inputs of 210Pb. According tothis model, the age of each sediment layer is deter-mined using the equation:
2ltA 5 A e0 (2)
where l is the radioactive decay constant of 210Pb(0.0307), A is the cumulative residual unsupported210Pb beneath a specified surface area to particulardepth interval of age t within a core, and A0 is the totalresidual unsupported 210Pb in the entire peat core (Ap-pleby and Oldfield 1978). The sedimentation rate (r)can be determined from the following equation:
r 5 l (A/C) (3)
where C is the total unsupported 210Pb inventory, cal-
culated by subtracting the supported amount from thetotal amount of 210Pb for each depth interval throughthe peat core and summing across all depths. In ad-dition, the 210Pb supply rate (P) can be calculated bythe equation:
P 5 l A0 (4)
The CIC model, often used in dating lake sediments,assumes that 1) the amount of 210Pb in sediments isproportionally related to the flux of sediment particlesfrom the water column and 2) on a dry mass basis,sediments have the same initial unsupported 210Pb con-centration despite potential variation in sediment ac-cumulation rates. With this approach, the unsupported210Pb concentration in a sediment layer (C) varies ac-cording to the following equation:
-ltC 5 C e0 (5)
where C0 is the unsupported 210Pb concentration at thesediment-water boundary (cf. Appleby and Oldfield1983, Shukla and Joshi 1989).
The CRS-MV model is a modification of the CRSmodel in which least squares iterative techniques areused to fit the CRS model equations to the observedcore data in such a way that the residual variance isminimized (Tobin and Schell 1988, Schell and Tobin1994). The CRS-MV approach yields exactly linearvertical accumulation rates (fixed number of years perspecified depth increment) throughout the datable por-tion of the core, which may be unrealistic for peataccumulation (cf. Schell et al. 1997).
To 210Pb-date a peat deposit, a core typically is col-lected and sectioned into contiguous depth increments,each of which is weighed and processed for measure-ment of 210Pb activity by either a, b, or g spectrometry(Joshi 1989, Nevissi 1991, Moser 1993). For peat, themost commonly used approach for measuring 210Pb ac-tivity involves acid digestion, often with added H2O2
to facilitate oxidation of organic matter, and typicallywith the addition of either 208Po or 209Po as a chemicalyield tracer (e.g., Wieder et al. 1994, Norton et al.1997, Schell et al. 1997, Craft and Richardson 1998,Vile et al. 2000). Subsequently, the solubilized Po iso-topes are passively plated onto copper or silver disksfor activity measurements using alpha spectrometry.Although 210Pb is not an a emitter, it decays to stable206Pb via two daughter isotopes, 210Bi (b2 emitter, halflife (T½)55.01 d) and 210Po (a emitter, T½5138.4 d).Because of the short half-lives of 210Bi and 210Po, theyrapidly reach secular equilibrium with the parent 210Pb(Blais and Marshall 1988) within about 2 years.Hence, measurement a emissions from 210Po decay canbe used as an estimate of 210Pb activity in peats. Dis-advantages to the a spectrometry approach are the te-dious digestion, the need to correct for extraction and

Turetsky et al., DATING RECENT PEAT 335
plating efficiency using 208Po or 209Po tracers, and thedestructive nature of the method. Advantages, how-ever, include the ability to digest large (several gram)subsamples of peat (concentrating the extracted Po iso-topes onto a single copper or silver disk for counting),and the sensitivity of modern alpha detector systemswith respect to the a emissions from 210Po decay.
Pb-210 emits a weak g ray (46.5 keV; one electronvolt is equivalent to 1.602 3 10219 joules), and its ac-tivity in a peat sample can be measured directly bygamma spectrometry (e.g., Appleby et al. 1986, 1988,1990, 1997, Schelske et al. 1994, Farmer et al. 1997).Compared to a spectrometry, sample processing isminimal (samples are weighed into containers andplaced directly into a gamma counting chamber). Inaddition, analysis of 210Pb activity by gamma spec-trometry is non-destructive. However, the weak energyof the emitted g rays and the small fraction of decaysemitting g rays contribute to difficulties in quantifying210Pb activities, particularly in deeper samples whereunsupported 210Pb activities become diminishinglysmall.
In principle, 210Pb activity in peat could be deter-mined by b2 counting of digested solutions, althoughfor peat samples, this has not been the method ofchoice. Pb-210 is a b2 emitter (0.063 MeV), but so is210Bi, a granddaughter of 210Pb decay (b2 energy of1.16 MeV). Pb-210 activity can be estimated by mea-suring b2 emissions, separating b2 emissions from210Pb and 210Bi based on their respective energy spectra,or by chemical separation before measurement (e.g.,Blais and Marshall 1988, Nevissi 1991, Ament andLieser 1993, Sapozhnikov et al. 1993, Gogrewe et al.1996).
Pb-210 dating constructs a continuous dating recordextending back to generally no more than about 150yr from the present (time of core collection). After 10half-lives (T1/2 5 22.3 yr) or about 223 yr, unsupported210Pb concentrations will be only 2210 of their initialrespective values, at which point detection against abackground of supported 210Pb technologically is notfeasible. Because the temporal frequency of decayevents is low, counts of disintegrations over time fol-low the Poisson distribution in which the variance (s2)is equal to the mean (total number of counts measuredover the counting time, N), and hence the standarddeviation of the total number of counts, s, is equal tothe square root of N. Thus, the counting error, «, ex-pressed as a proportion of the total accumulated countsis given as
ÏN 1« 5 5 . (6)
N ÏN
Counting error is high when the total accumulated
number of counts is low (deeper in a profile) and de-creases as the N increases (closer to the surface). Inpractice, errors are propagated from the surface down-ward (cf. Bevington 1969, Binford 1990). As a result,moving from section to section downward through acore, errors increase, to the point where the countingerror (in years) may actually exceed the age of thesection. Therefore, although it often is possible to cal-culate dates that are older than 5 half-lives of 210Pb(111.5 yr), the error terms associated with these datesmay be quite large.
Pb-210 dating assumes immobility of atmospheri-cally deposited 210Pb at the peat/sediment surface andsubsequently within the peat profile over time (vonGunten 1995, Shotyk et al. 1997b, Vile et al. 1999).Several studies have invoked mobility of Pb in peat toexplain vertical distributions of Pb in peat columns(Damman 1978, Clymo and Hayward 1982, Pakarinenet al. 1983, Pakarinen and Gorham 1983, Urban et al.1990, Oldfield et al. 1995, Sanders et al. 1995). Forexample, Sanders et al. (1995) conclude that 210Pb inpeat may be impacted by decomposition, cation mo-bility, lateral water movement, and/or DOM concen-trations. However, others have concluded that Pb re-mains immobile after deposition onto a peat surface(Figure 7; Benninger et al. 1975, Livett et al. 1979,Mitchell et al. 1992, Appleby et al. 1997, Farmer etal. 1997, MacKenzie et al. 1997, Vile et al. 1999) orhave found good agreement between 210Pb-dating inpeat cores and other dating methods (El-Daoushy etal. 1982, Clymo et al. 1990, Cole et al. 1990, Belyeaand Warner 1994a, Wieder et al. 1994, Vile et al.1995, Appleby et al. 1997, MacKenzie et al. 1997,Shotyk et al. 1997a).
Pb-210 dating is a popular tool available for quan-titatively dating peat accumulation over the past ; 200years. The chemistry involved in 210Pb dating can becomplicated and lengthy, and commercial analysis isexpensive. The digestion procedure for a-counting re-quires fairly large sample sizes, about 3 g of driedmaterial.
Pb-210 dating is one of the few independent datingmethods that can yield a continuous chronology (Table1). Once 210Pb concentrations in sediment layers havebeen measured and the appropriate model has beenutilized, however, there is no guarantee that the profilewill be datable. Any past disturbance to the soil, sed-iment, or peat profile (bioturbation, treefall, tramplingby animals) may preclude construction of a continuouschronology. Similar to other methods that build con-tinuous chronologies, considerable effort can be ex-pended in core collection, processing, and measure-ment of 210Pb activities before it becomes evident thata core is undateable.
336 WETLANDS, Volume 24, No. 2, 2004
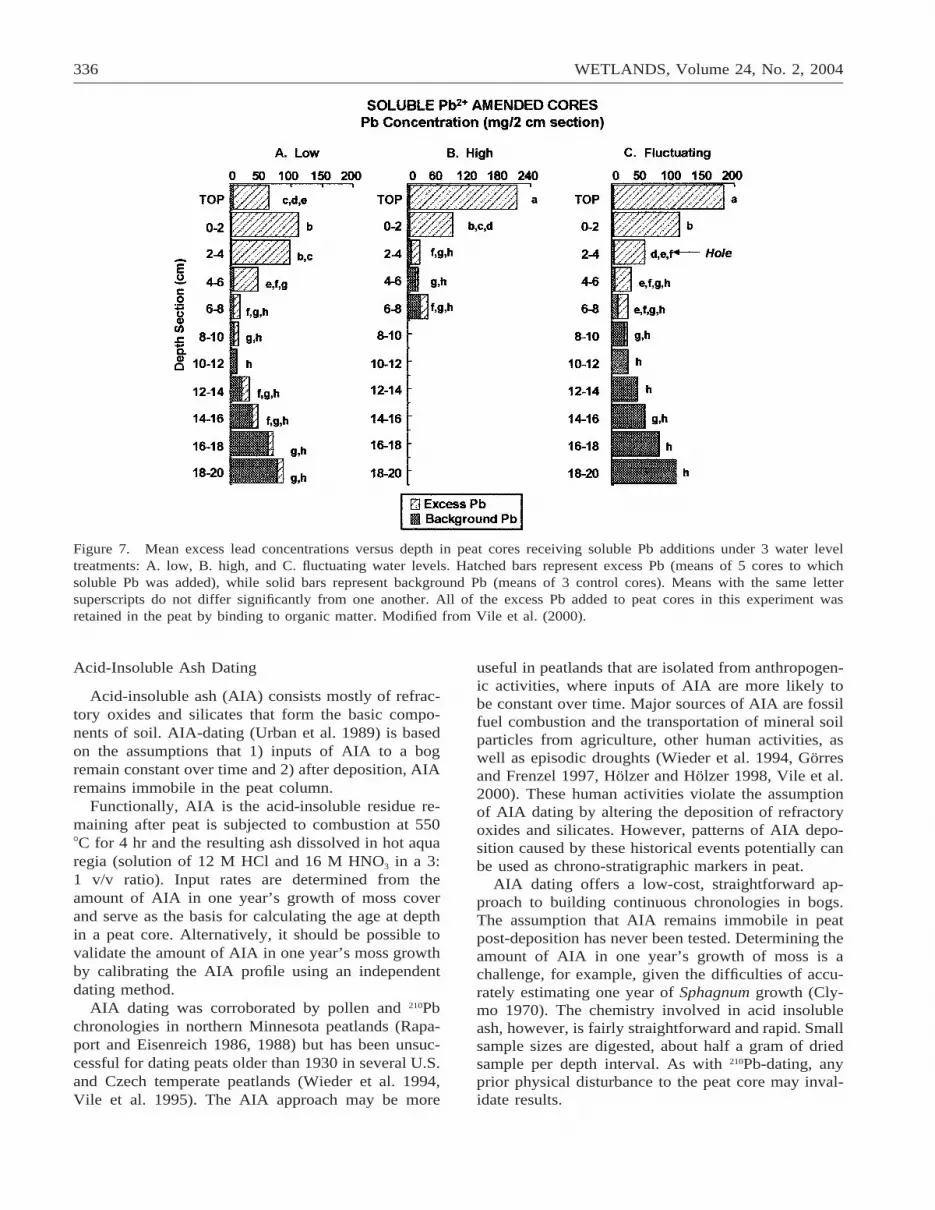
Figure 7. Mean excess lead concentrations versus depth in peat cores receiving soluble Pb additions under 3 water leveltreatments: A. low, B. high, and C. fluctuating water levels. Hatched bars represent excess Pb (means of 5 cores to whichsoluble Pb was added), while solid bars represent background Pb (means of 3 control cores). Means with the same lettersuperscripts do not differ significantly from one another. All of the excess Pb added to peat cores in this experiment wasretained in the peat by binding to organic matter. Modified from Vile et al. (2000).
Acid-Insoluble Ash Dating
Acid-insoluble ash (AIA) consists mostly of refrac-tory oxides and silicates that form the basic compo-nents of soil. AIA-dating (Urban et al. 1989) is basedon the assumptions that 1) inputs of AIA to a bogremain constant over time and 2) after deposition, AIAremains immobile in the peat column.
Functionally, AIA is the acid-insoluble residue re-maining after peat is subjected to combustion at 5508C for 4 hr and the resulting ash dissolved in hot aquaregia (solution of 12 M HCl and 16 M HNO3 in a 3:1 v/v ratio). Input rates are determined from theamount of AIA in one year’s growth of moss coverand serve as the basis for calculating the age at depthin a peat core. Alternatively, it should be possible tovalidate the amount of AIA in one year’s moss growthby calibrating the AIA profile using an independentdating method.
AIA dating was corroborated by pollen and 210Pbchronologies in northern Minnesota peatlands (Rapa-port and Eisenreich 1986, 1988) but has been unsuc-cessful for dating peats older than 1930 in several U.S.and Czech temperate peatlands (Wieder et al. 1994,Vile et al. 1995). The AIA approach may be more
useful in peatlands that are isolated from anthropogen-ic activities, where inputs of AIA are more likely tobe constant over time. Major sources of AIA are fossilfuel combustion and the transportation of mineral soilparticles from agriculture, other human activities, aswell as episodic droughts (Wieder et al. 1994, Gorresand Frenzel 1997, Holzer and Holzer 1998, Vile et al.2000). These human activities violate the assumptionof AIA dating by altering the deposition of refractoryoxides and silicates. However, patterns of AIA depo-sition caused by these historical events potentially canbe used as chrono-stratigraphic markers in peat.
AIA dating offers a low-cost, straightforward ap-proach to building continuous chronologies in bogs.The assumption that AIA remains immobile in peatpost-deposition has never been tested. Determining theamount of AIA in one year’s growth of moss is achallenge, for example, given the difficulties of accu-rately estimating one year of Sphagnum growth (Cly-mo 1970). The chemistry involved in acid insolubleash, however, is fairly straightforward and rapid. Smallsample sizes are digested, about half a gram of driedsample per depth interval. As with 210Pb-dating, anyprior physical disturbance to the peat core may inval-idate results.

Turetsky et al., DATING RECENT PEAT 337
Figure 8. Age-depth profiles of peat layers from a Sphag-num hummock of a Finnish bog (Kunonniemensuo bog)showing good agreement between moss increment chronol-ogies, 14C dates, 210Pb chronologies, and a pollen marker.Vertical bars represent 6 1s of the 210Pb ages or averageerror of the moss-increment years. Length of rectangles rep-resents either the moss-increment age intervals or the un-certainties in the 14C ages. Modified from El-Daoushy et al(1982). Reprinted by permission from Nature copyright 1982Macmillan Magazine Ltd.
Moss-Increment Dating
The shape and microstructure of individual mossplants have been correlated to the periodicity of annualgrowth increments and have been proposed as a datingmethod (Pakarinen and Tolonen 1977, Vitt and Pak-arinen 1977). Potentially useful features include sizeand orientation of leaves, cyclic pigmentation, branch-ing patterns and density, location of groups of gam-etangia, and changes in the growth direction of mainshoots by pressure from snow cover (cf. Pakarinen andTolonen 1977, Vitt and Pakarinen 1977, Pakarinen andRinne 1979, El-Daoushy et al. 1982, Norton 1986, Eu-stis and Tolonen 1990, Jungner et al. 1995).
El-Daoushy et al. (1982) showed good agreementbetween moss-increment dating, 210Pb dating, pollenmarkers (see section on pollen stratigraphy below),and radiocarbon dating in cores collected from Finnishpeatlands (Figure 8). Norton (1986), however, foundthat 210Pb dating in Maine peat provided ages consis-tently younger than the chronology constructed withmoss-increment dating, while Eustis and Tolonen(1990) found good agreement between moss-incre-ment ages and AIA dating for peat only to 10 cm indepth.
Moss-increment dating offers a low-cost approachto dating peat profiles. This method, however, is usefulfor only a few bryophyte taxa (i.e., Dicranum majus,Hylocomium splendens, Meesia triquetra, Polytrichumspp., Sphagnum spp.). Identification of annual markersmay be subjective (Belyea and Warner 1994a) and be-comes more difficult with depth (Eustis and Tolonen1990), as ongoing decomposition and compaction altermoss macrostructure. Eustis and Tolonen (1990) con-cluded that moss-increment dating is practical only inhummocks when moss stems have not been horizon-tally compressed. Nonetheless, the presence of clearmarkers on several common moss species in bogs,poor fens, and rich fens makes this a valuable datingtechnique, at least for near-surface peat layers.
Constant Bulk-Density or Nitrogen AccumulationDating
Bulk-density measurements of samples in a peatprofile have been used to estimate peat age (Ilomets1980, Punning et al. 1993, Belyea and Warner 1994a).This approach assumes a constant rate of peat accu-mulation over time, and provides rough estimates ofpeat age (Zoltai 1991, Belyea and Warner 1994a). Es-timates are based upon an independently derived da-tum, usually established by radiocarbon dating. Themean volumetric peat accumulation rate is determinedby measuring total peat mass beneath a specified sur-face area to the dated depth divided by the age of the
datum. Ages of depth intervals in a peat core are cal-culated by multiplying the dry mass per volume ofeach depth interval by the age:cumulative dry massratio at the datum.
Based on radiocarbon dating of peat columns col-lected from 66 peatlands in western Canada, Zoltai(1991) found a significant linear relationship betweenpeat cumulative dry mass and age (Figure 9). He con-cluded that mass measurements are useful indicatorsof age when absolute accuracy is not critical. Punninget al. (1993) used constant bulk density dating in as-sociation with pollen and radiocarbon dating. Whilethe authors did not comment specifically on the use-fulness of constant bulk density as a corroborative dat-ing method, constant bulk density dates appeared to
338 WETLANDS, Volume 24, No. 2, 2004
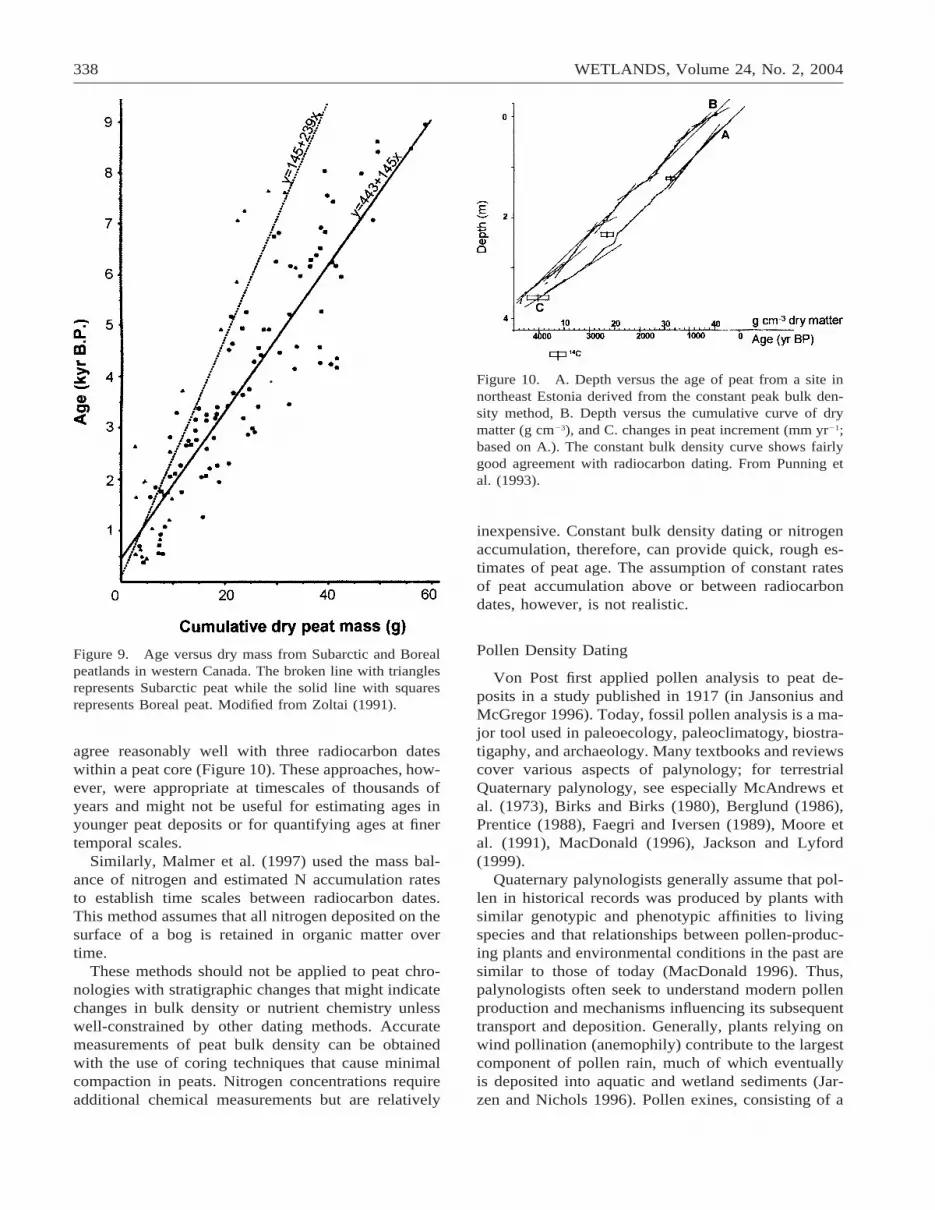
Figure 9. Age versus dry mass from Subarctic and Borealpeatlands in western Canada. The broken line with trianglesrepresents Subarctic peat while the solid line with squaresrepresents Boreal peat. Modified from Zoltai (1991).
Figure 10. A. Depth versus the age of peat from a site innortheast Estonia derived from the constant peak bulk den-sity method, B. Depth versus the cumulative curve of drymatter (g cm23), and C. changes in peat increment (mm yr21;based on A.). The constant bulk density curve shows fairlygood agreement with radiocarbon dating. From Punning etal. (1993).
agree reasonably well with three radiocarbon dateswithin a peat core (Figure 10). These approaches, how-ever, were appropriate at timescales of thousands ofyears and might not be useful for estimating ages inyounger peat deposits or for quantifying ages at finertemporal scales.
Similarly, Malmer et al. (1997) used the mass bal-ance of nitrogen and estimated N accumulation ratesto establish time scales between radiocarbon dates.This method assumes that all nitrogen deposited on thesurface of a bog is retained in organic matter overtime.
These methods should not be applied to peat chro-nologies with stratigraphic changes that might indicatechanges in bulk density or nutrient chemistry unlesswell-constrained by other dating methods. Accuratemeasurements of peat bulk density can be obtainedwith the use of coring techniques that cause minimalcompaction in peats. Nitrogen concentrations requireadditional chemical measurements but are relatively
inexpensive. Constant bulk density dating or nitrogenaccumulation, therefore, can provide quick, rough es-timates of peat age. The assumption of constant ratesof peat accumulation above or between radiocarbondates, however, is not realistic.
Pollen Density Dating
Von Post first applied pollen analysis to peat de-posits in a study published in 1917 (in Jansonius andMcGregor 1996). Today, fossil pollen analysis is a ma-jor tool used in paleoecology, paleoclimatogy, biostra-tigaphy, and archaeology. Many textbooks and reviewscover various aspects of palynology; for terrestrialQuaternary palynology, see especially McAndrews etal. (1973), Birks and Birks (1980), Berglund (1986),Prentice (1988), Faegri and Iversen (1989), Moore etal. (1991), MacDonald (1996), Jackson and Lyford(1999).
Quaternary palynologists generally assume that pol-len in historical records was produced by plants withsimilar genotypic and phenotypic affinities to livingspecies and that relationships between pollen-produc-ing plants and environmental conditions in the past aresimilar to those of today (MacDonald 1996). Thus,palynologists often seek to understand modern pollenproduction and mechanisms influencing its subsequenttransport and deposition. Generally, plants relying onwind pollination (anemophily) contribute to the largestcomponent of pollen rain, much of which eventuallyis deposited into aquatic and wetland sediments (Jar-zen and Nichols 1996). Pollen exines, consisting of a
Turetsky et al., DATING RECENT PEAT 339
complex polymer of carotenoids and carotenoid esters,are highly resistant to degradation and are preservedwell in anaerobic sediments. Pollen grains can oftenbe identified to genera and sometimes to species levels,allowing for the reconstruction of the vegetational his-tory of a site or region. The transport of pollen to lakeor wetland basins is dependent upon plant species,plant morphology, community/canopy structure, land-scape position, and climate (Jarzen and Nichols 1996,MacDonald 1996).
Rates of peat accumulation have been estimatedwith the abundance of pollen grains in a sequence(e.g., Conway 1947, Dickinson 1975, Middledorp1982, 1986, Rowell and Turner 1985, Punning et al.1993). This method depends upon an independentlyderived date (Belyea and Warner 1994a) and assumesthat the pollen deposition rate has been constant duringthe period covered (Turner and Peglar 1988). Concen-trations of pollen are expressed cumulatively beneatha specified surface area of peat and can be used toestimate age if the average rate of pollen accumulationin peat within a given time interval is known (Mid-dledorp 1986). Changes in pollen concentration withinthe peat profile are interpreted accordingly as indicat-ing variation in peat accumulation (Irwin 1989).
Depth-age chronologies based on radiocarbon dat-ing in peat have corresponded well to relationshipsbetween depth and cumulative arboreal pollen (Mid-dledorp 1982, Rowell and Turner 1985, Punning et al.1993). Tolonen (1985b) applied pollen density datingto a peat chronology in southwest Finland using amean accumulation rate of 1.3 3 104 pollen grainscm22 yr21 and estimated that 16 cm of vertical net peataccumulation represented 65 6 15 yr. Punning et al.(1993) advocated the use of pollen density dating inpeat if no major changes in the development or hy-drology of the peatland have occurred.
Assumptions underlying this technique, includingthe immobility and constant deposition of pollengrains over time, have been investigated. Boyd (1986)found that moss morphology played an important rolein the entrapment of pollen grains. Irwin (1989) re-ported higher concentrations of pollen in an ericaceoushummock than a Sphagnum-dominant hollow in theacrotelm of the same peatland, and concluded thathummocks trap pollen more efficiently than hollows.Pollen grains have been shown to move with waterthrough peat under experimental flow regimes (Clymoand Mackay 1987). In a field setting, however, Rowleyand Rowley (1956) found that downward movementof pollen was limited to less compacted Sphagnumpeat. They concluded that pollen migration is differ-ential with taxa and occurs only at the time of depo-sition. Nonetheless, spatial variability in pollen trap-
ping may contribute an element of error to pollen den-sity dating.
Jacobson and Bradshaw (1981) reported high vari-ability in pollen accumulation rates in peat. Sourcearea varies for pollen taxa. Even well-dispersed pollensuch as pine (Pinus) may show variability in local de-position (Bennet 1986, Grimm 1988). Pollen spectracan reflect vegetation on different spatial scales, in-cluding local and long-distance components (cf. Jans-sens 1973). Pollen density dating may not be a suitablechoice for dating small peat deposits with limitedsource areas, as single events such as treefall may havelarge effects on their pollen rain (Turner and Peglar1988).
Pollen density dating is an inexpensive option, al-though time consuming. Preparation of samples forpollen analysis typically involves boiling in potassiumhydroxide, concentrated hydrofluoric acid, and a mix-ture of sulfuric acid and acetic anhydride (acetolysis;Faegri and Iversen 1975; see also Berglund and Ral-ska-Jasiewiczowa 1986, Moore et al. 1991, and Woodet al. 1996 for useful descriptions of pollen method-ology). Most organic material is destroyed by the lattersolution, leaving pollen exines and resistant organiccomponents in solution. Samples then are stained andmounted for slide preparation and microscopy (Jacob-son 1988). Before chemical treatment, tablets contain-ing known amounts of exotic pollen (i.e., Eucalyptuspollen or Lycopodium spores) can be added to eachsample to help determine the pollen concentrations(Benninghoff 1962, Stockmarr 1971, Thompson 1980,Maher 1981, Ogden 1986). Pollen grains can be iden-tified from published keys and reference material (cf.McAndrews et al. 1973, Birks and Birks 1980, Mooreet al. 1991). Pollen density dating is a valid option fora dating tool where vegetation has not been alteredsignificantly in the past few hundred years.
Pine Dendrochronology
Several studies have dated the accumulation of re-cently deposited moss-derived peat using pine dendro-chronology (Ohlson and Dahlberg 1991, Koff et al.1998, Schultze et al. 2002). This method can only beused in bogs or other treed peatlands, where the po-sition of Pinus hypocotyls is expected to remain con-stant in relation to surrounding moss layers. Over time,mosses grow and essentially ‘bury’ tree stems. There-fore, the accumulation of moss layers above the hy-pocotyls can be dated in relation to the age of pinetrees. This method assumes a constant rate of peat ac-cumulation above the hypocotyl. Schulze et al. (2002)plotted the total accumulation of peat (in kg m22) as afunction of tree age along a pine chronosequence in aSiberian bog to estimate annual rates of peat accu-
340 WETLANDS, Volume 24, No. 2, 2004
mulation. They concluded that the dendrochronologymethod was useful because of its applicability to largespatial scales but that it may overestimate carbon stor-age in relation to other methods.
CHRONO-STRATIGRAPHIC OR SINGLE EVENTMARKERS
Pollen Stratigraphy
Regional or local changes in pollen abundance orspecies composition may serve as reliable time mark-ers in peat (Lee and Tallis 1973, Cole et al. 1990,Belyea and Warner 1994a, Wieder et al. 1994, Sanderset al. 1995, Vile et al. 1995, Appleby et al. 1997). Thepollen record can provide insights into major changesin terrestrial vegetation caused by disease, land use,and introduction of cultivars/exotics (Brush et al.1982). Increases in the abundance of ragweed (Am-brosia) pollen long have been associated with thewidespread settlement and agricultural disturbance byEuropeans in North America (Truman 1937, Bazzaz1974, Brugam 1978, Kemp et al. 1978, van Zant et al.1979, Engstrom and Swain 1986). Other pollen typessuch as plantain (Plantago), sorrel (Rumex), and rye(Secale) have been used as indicators for Europeancultivation (cf. McAndrews 1966, Davis 1967, Jans-sens 1967, Davis et al. 1971, Webb 1973, Brugam1978, van Zant et al. 1979). Decreases in arboreal pol-len may reflect forest clearance associated with agri-culture. Because the timing of westward colonizationis well-documented in North America, increases in theabundance of pollen types associated with disturbanceor agriculture in a peat profile can provide a clear timemarker for a particular region.
Agricultural development occurred much earlier inEurope than North America; therefore, pollen markersmay not be as useful for dating recent European peats.Tolonen (1985b) found an increase in rye (Secale) pol-len in a peat deposit in southwest Finland with theonset of rye cultivation in the area around 1600–1800B.P. As early as 200 A.D., forest clearance and slashand burn cultivation in southern Finland were evidentin pollen records from both lake and peat coresthrough increases in rye, flax, hemp, and hops pollen(Huttunen 1980). Dupont (1986) investigated the hu-man influence on the palynology of a bog in The Neth-erlands and found that anthropogenic indicator pollen(including Cerealia, Spergula, Urtica, Chenopodi-aceae, and Artemisia) peaked as early as 2250 B.P.,and the first anthropogenic indicator pollen appearedat 1900 B.P. during the Roman Iron Age.
The decline of the American chestnut (Castaneadentata (Marsh.) Borkh.) pollen due to the spread ofthe chestnut blight has been used as a marker in North
American peats (Wieder et al. 1994). The decline ofAmerican chestnuts began in New England in 1912and spread southward through the Appalachian Moun-tains (Anderson 1974, Allison et al. 1986). Decliningconcentrations of Ulmus pollen due to Dutch Elm dis-ease has been a useful regional marker in North Amer-ican and European peats (Cole et al. 1990, Sanders etal. 1995).
Pollen markers have proven to be useful in corrob-oration with 210Pb based chronologies (cf. Cole et al.1990, Wieder et al. 1994, Vile et al. 1995, Appleby etal. 1997). Hemp was grown in the Jura Mountain re-gion of Switzerland until 1930, providing a markerthat was consistent with 210Pb dating of peat cores inthe region (Appleby et al. 1997). Pollen signals reflect-ing regional changes in land use, land cover, and ag-ricultural practices in the Czech Republic also havebeen useful in corroborating 210Pb dates in peats (Vileet al. 1995).
Dates associated with changes in land use or diseaseas reflected in the pollen record will vary regionally.Identifying historical events with the use of pollen maybe useful in providing chrono-stratigraphic markers inpeats, although pollen markers cannot provide a con-tinuous chronology, especially for high resolution dat-ing in near-surface peat. Nonetheless, pollen can beused to build chronologies that span long time periods,as long as the age of historical events recorded bypollen can be determined (i.e., from historical records,14C-dating, etc.). As with pollen density dating, the useof pollen markers relies upon the assumption of neg-ligible post-depositional movement.
Constructing complete pollen profiles for entire peatcores is time-consuming (see section above for pollenmethodologies). Screening for changes in the abun-dance of key pollen taxa (such as Ambrosia, Castanea,or Cannabis in the examples given above), however,can provide good corroboration of alternative datingtechniques.
Magnetic Records
Fuel combustion, including metal smelting, iron andsteel manufacturing, and coal combustion, convertsiron impurities into ferro- and antiferro magnetic ironoxides, mainly magnetite and haematite, that are re-leased to the atmosphere and subsequently depositedonto the earth’s surface (Chaddha and Seehra 1983,Thompson and Oldfield 1986). Pure organic matterpossesses weak magnetism (typically diamagnetic orparamagnetic); therefore, assessing the magnetic prop-erties of a peat chronology can provide useful infor-mation on the timing and nature of regional fuel com-bustion. Because the concentrations of magnetic min-erals in peatlands will be low except under conditions

Turetsky et al., DATING RECENT PEAT 341
Figure 11. Variations in saturated isothermal remanentmagnetization (SIRM) with depth in ombrotrophic peat pro-files from bogs in the UK. All samples were measured aftersaturation in an applied field of 104 oersteds. Enriched mag-netic particles in near surface peat could be used to date theonset of fuel combustion. Modified from Oldfield et al.(1978).
of extreme pollution, the characterization of magneticrecords in peat chronologies is limited to sensitivetechniques (Thompson and Oldfield 1986). Saturationisothermal remanent magnetization (SIRM) refers tothe maximum remanence (or magnetization remainingin the absence of an external magnetic field) attainableby the application and subsequent removal of a strongmagnetic field under laboratory conditions (Thompsonand Oldfield 1986). Magnetic susceptibility, a measureof the ease with which a sample can be magnetized inlaboratory conditions, also has been applied to peatdeposits. In natural materials, SIRM and susceptibilitymainly reflect magnetite content and are useful proxiesfor magnetite concentrations. In parts of the worldwhere the history of regional industrial activity is well-documented, patterns of SIRM or susceptibility mayserve as a useful time marker in peats (Oldfield et al.1978, Beckwith et al. 1986, Schell 1987, Livett 1988,Sanders et al. 1995, Vile et al. 1995, 2000). Magneticrecords also have been used in establishing fire his-tories (Rummery et al. 1979).
Oldfield et al. (1978) combined radiocarbon dating,pollen analysis, and SIRM measurements in ombro-trophic peatlands in Britain and N. Ireland and foundincreased levels of magnetic material in near-surfacepeat compared to prehistoric peat. Their sites differedin proximity to industrial sources; however, they con-cluded that even their remote location (Lough Fea Bogin N. Ireland) showed increased magnetism dominatedby magnetite in surface layers (Figure 11; Oldfield et
al. 1978, Thompson and Oldfield 1986). Similarly, el-evated SIRM was reported in sub-surface peat samplesfrom Cumbria (Oldfield et al. 1979). Rapaport and Ei-senreich (1986) concluded that magnetic dating over-estimated rates of peat accumulation compared to acidinsoluble ash dating and dichloro-diphenyl-trichloro-ethane (DDT) inputs. Relationships between depth andmagnetic susceptibility in Czech peatlands did not re-veal clear trends towards increasing magnetic activityin surface peat (Vile et al. 2000).
Tehnological advances over the past few decades inmagnetic susceptibility and remanence measurementshave led to increases in sensitivity and decreases in thecost of analyses. The bulk of environmental magneticmeasurements are made on susceptibility bridges andfluxgate magnetometers (Thompson and Oldfield1986). The ease of sample preparation, rapidity ofanalysis, and non-destructive nature of the methods areadvantages to reconstructing magnetic records aschrono-stratigraphic markers.
However, the immobility of magnetic particulates inpeat profiles has not been tested, although post-depo-sitional immobility remains a major assumption of thismethod. Williams (1992) concluded that magnetic re-cords in peat stratigraphies will be influenced by thedissolution of magnetite in reducing, water-saturatedpeat layers. Oldfield et al. (1979) reported higher con-centrations of magnetic particles in peatland hum-mocks compared to hollows. This pattern was inter-preted as a result of differential uptake, where hollowsor pools received particles mainly through precipita-tion while hummocks scavenged particles through hor-izontal eddy diffusion (Thompson and Oldfield 1986).This trend also could be attributed to Eh-controlleddissolution of magnetic oxides (Williams 1992). Whilethe importance of regional or global deposition ofmagnetic particles has not been investigated in peatdeposits, magnetic records based on anthropogenic ac-tivities probably are most useful in populated or in-dustrial areas, as they rely on measuring the byprod-ucts of fossil fuel combustion and interpreting histor-ical patterns of deposition.
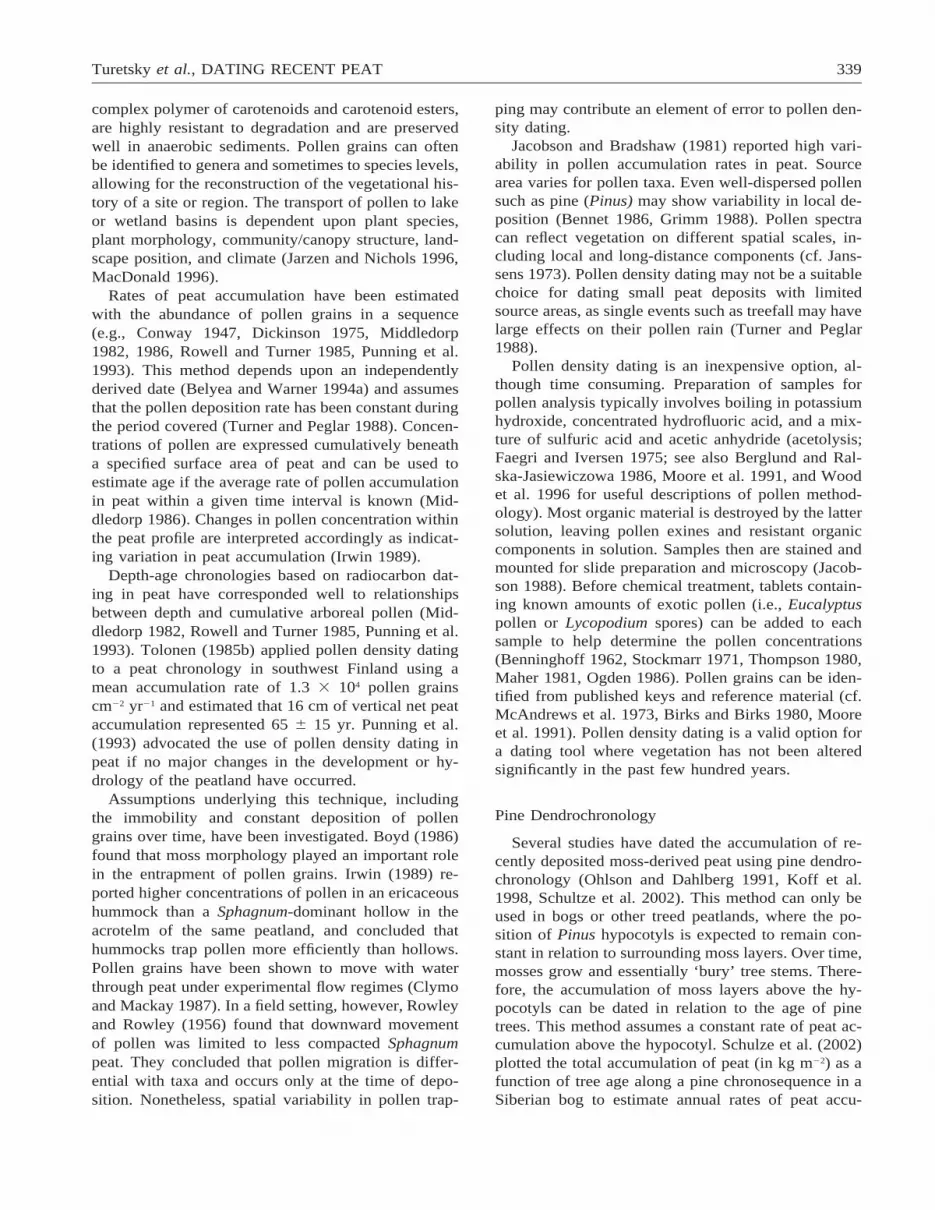
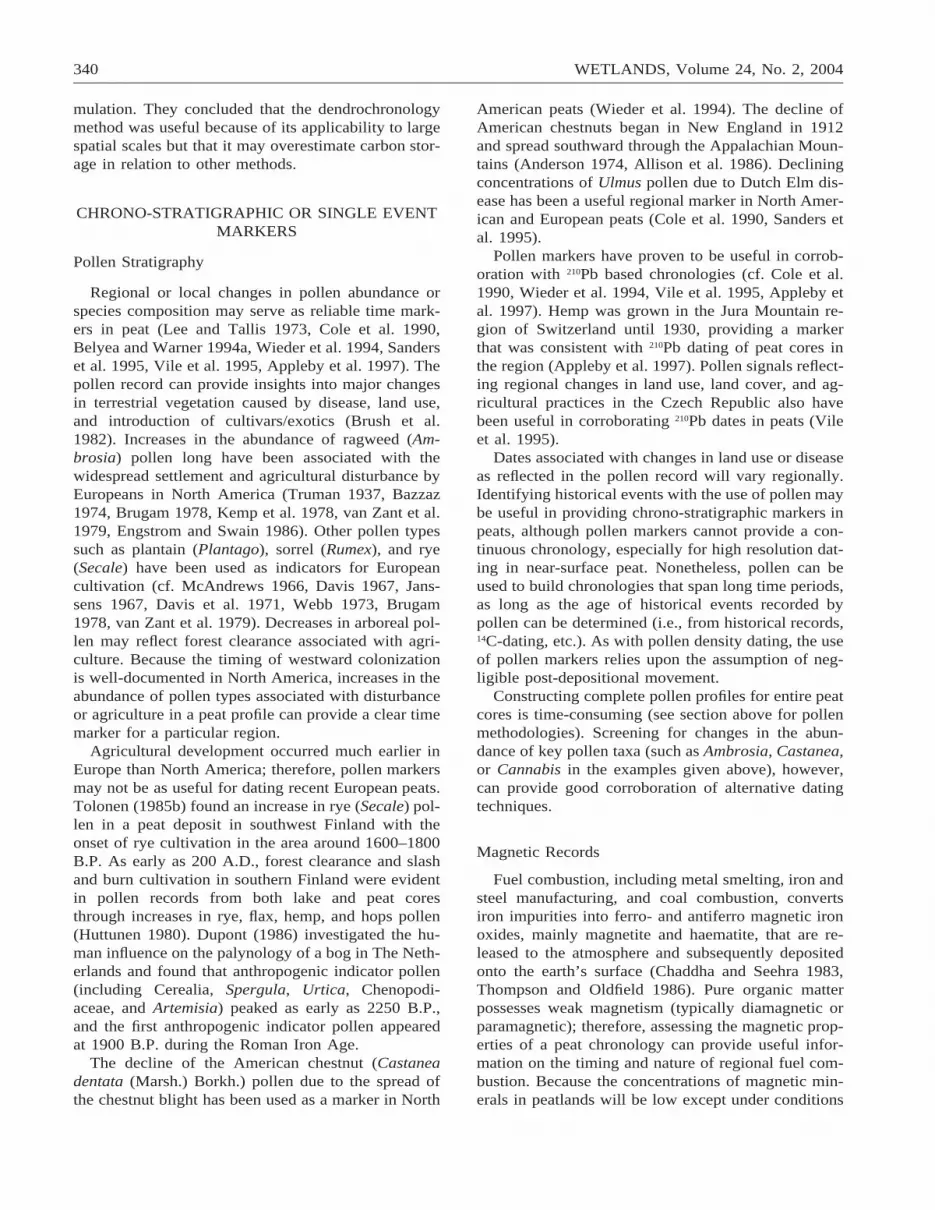
Hydrophobic Organic Compounds: PAHs, PCBs,DDT, and Toxaphene
Large, non-polar, hydrophobic organic compounds,such as polychlorinated biphenyls (PCBs) and poly-aromatic hydrocarbons (PAHs), bind strongly to theorganic matter matrix in peat (Rapaport and Eisenreich1988, Sanders et al. 1995). When such compoundshave a known recent history of use and are depositedonto bog surfaces from the atmosphere, they mayserve as time markers.
342 WETLANDS, Volume 24, No. 2, 2004
Figure 12. Net PCB concentrations (sum of 25 congeners)versus depth in a UK peat core. PCB concentrations peak at17 cm (dated at ;1964 using a 210Pb profile constrained bythe 241Am peak at 1963/1964 shown in Figure 14). IncreasingPCB concentrations near the surface may be due to upwardoutgassing or transport by vegetation. Generally, these dataagree with historical PCB production in the UK, which peak-ed in the mid- to late- 1960s. From Sanders et al. (1995)with permission from Elsevier Science.
PCBs. PCBs have been used globally since their firstmanufacture in 1929 (Bracewell et al. 1993). PCB usein the U.S. decreased dramatically following a 1971voluntary ban on non-contained use. The manufactur-ing, importation, and most non-electrical uses of PCBsin Canada were banned in 1977 (Environment Canada1991). The sole manufacturer of PCBs in the UnitedKingdom limited their sale after 1971 for specified‘open’ uses (Jones et al. 1992). PCB use decreased in1973 following an Organization for Economic Coop-eration and Development (OECD) control decision in1973. Nevertheless, PCB production in some Europeancountries exceeded 15,000 tonnes in 1980 (Yrjanheik-ki et al. 1987). Atmospheric transport and depositionare major modes of global distribution of PCBs andother organochlorine compounds (Simonich and Hikes1995, Bignert et al. 1998, Wania 1999, Wania andMackay 1999).
Rapaport and Eisenreich (1988) used acid-insolubleash dating and DDT (dichloro-diphenyl-trichloroeth-ane; see below) inputs to determine that PCB concen-trations in several eastern North American bogs fol-lowed closely the patterns of historical use in the Unit-ed States, with maximum PCB inputs between 1967and 1970. PCB concentrations began increasingaround 1932 in an English peat chronology based on210Pb and 241Am data (Sanders et al. 1994). Maximumconcentrations of PCBs occurred at a depth corre-sponding to the early to mid-1960s, consistent withpatterns of PCB production in the United Kingdom,which peaked in the late 1960s (Figure 12; Sanders etal. 1994, 1995). Himberg and Pakarinen (1994) esti-mated that atmospheric deposition of PCBs from 1976to 1986 ranged from 13 to 63 mg m22 yr21 from mosssamples collected from two ombrotrophic bogs insouthern Finland. They concluded that PCB concen-trations in moss samples decreased consistently withinthis time period.
In both U.K. and U.S. peatlands, significant amountsof PCBs have been measured prior to the productionperiods. This may be the result of immediate down-ward percolation of PCBs with rainfall (Rapaport andEisenreich 1988, Sanders et al. 1995). Movement ofPCBs in peat has not been tested directly; however,field data suggest that PCB immobility may not be acompletely reliable assumption.
PAHs. PAHs are the products of incomplete com-bustion and include many carcinogenic and/or muta-genic compounds (Jones et al. 1992). Fossil fuel com-bustion has been the major source of PAHs over thepast century (Environment Canada 1991). Severalstudies have documented recent decreases in PAHloading to lake and peat sediments, most likely asso-ciated with decreases in heavy industry and the estab-
lishment of clean air regulations (Cranwell and Koul1989, Sanders et al. 1993, 1995). PAH loadings to anEnglish bog increased around the beginning of the In-dustrial Revolution and peaked in the early 1930s(Sanders et al. 1995). Correlations between PAH orhydrocarbon derived particulates and magnetic prop-erties of sediments suggest that hydrocarbons candominate ferromagnetic influx to peat and lake sedi-ments (Williams 1992, Morris et al. 1994).
DDT. DDT production began during World War II,and consumption in the United States peaked in 1960(United States Environmental Protection Agency1975). In 1972, the United States Environmental Pro-tection Agency issued a ban on all but minor uses ofDDT, limiting its use to nearly zero. Its use was se-verely restricted in Canada in the early 1970s, but itwas not banned until 1991 (Environment Canada1991). DDT remains an important insecticide globally,and small amounts continue to reach North Americathrough long-range transport (Rapaport and Eisenreich1988). The replacement choice for DDT after the U.S.ban was polychlorinated camphene (toxaphene),whose use peaked between 1975 and 1978 (Rapaportand Eisenreich 1986, 1988). The history of DDT andtoxaphene production clearly is reflected in their con-centrations in dated peat cores collected from bogsthroughout the eastern U.S. and Canada (Rapaport andEisenreich 1988).
Hydrophobic contaminants such as PCBs and PAHs
Turetsky et al., DATING RECENT PEAT 343
Figure 13. Concentrations of carbonaceous particles orsoot balls (g dw21) versus depth and age in a varved sedi-ment of Lake Laukunlampi. Soot ball chronologies in Finn-ish lakes agreed well with historical coal and oil consump-tion in the region. Dating by soot balls corroborated wellwith 210Pb dating and varves in Bothnian Bay sediment, but210Pb ages were older than those derived from soot balls inmore acidic lakes. Fom Tolonen et al. (1990).
can be determined in organic solvent extracts using gaschromotography, high performance liquid chromatog-raphy, or gas chromatography-mass spectrometry.Various extraction and purification methods have beendeveloped (cf. Wickstrom and Tolonen 1987, Wer-shaw et al. 1987, Sander et al. 1992, Foreman et al.1994, Morris et al. 1994, Sanders et al. 1995, VanMetre et al. 1997). During analysis, individual con-geners in samples are identified and quantified againstknown, calibrated standards.
PCBs, PAHs, DDT, and toxaphene all have the po-tential to serve as clear time-equivalent stratigraphicmarkers in peat. Each contaminant has well-knowntemporal patterns of use and release to the environ-ment and can be measured quantitatively in peat sam-ples even at low concentrations. Potential long-rangetransport of these chemicals also may produce histor-ical markers in remote peatlands. However, construct-ing historical patterns of contaminant use may be dif-ficult with larger scale distribution compared to localor regional deposition. Drawbacks to the use of thesecontaminants as dating tools in peats are the high costand complexity of their analyses.
Spherical Particles
Spherical particles, often referred to as soot balls,soot spheres, or cenospheres, are a by-product of oiland coal combustion and have served as the basis fordating recent lake sediments (cf. Tolonen et al. 1975,Wik et al. 1986, Rose et al. 1995, Wik and Renberg1996; Figure 13). The surface morphology and struc-ture of carbonaceous particles can reveal informationabout the nature and history of fuel-use (Griffin andGoldberg 1979, 1981, Kothari and Wahlen 1984). Ingeneral, the combustion of fossil fuels is associatedwith the presence of spherical particles in sedimentsand peats (Kothari and Wahlen 1984). Clark and Pat-terson (1984) reported that the majority of sphericalparticles were 5–25 mm in diameter. Carbonaceousparticles formed through oil combustion show convo-luted, layered structures, whereas the surfaces of coaland wood carbons are homogeneous (Griffin andGoldberg 1979, 1981). Oil combustion tends to formspherical particles, while a mixture of spherical andelongate particles are generated by coal combustion.Particles formed via burning of wood and vegetationoften show remnant cellular structures and tend to beelongate (length to width ratios . 3; Griffin and Gold-berg 1979, 1981).
Carbonaceous particles can be quantified via lightmicroscopy, with sample preparation usually involvingoxidation of organic matter with H2O2 prior to count-ing or analysis of elemental carbon. Particle morphol-ogy can be examined through scanning electron mi-
croscopy (see Griffin and Goldberg 1979, Kothari andWahlen 1984, Rose 1990).
Increases in the abundance of carbonaceous parti-cles in lake and marine sediments have been comparedwith historical records of fossil fuel combustion to pro-vide useful chrono-stratigraphic markers. Griffin andGoldberg (1979, 1981) reported increases in the abun-dance of spherical carbonaceous particles in LakeMichigan sediments around 1930, with shifts fromelongate particles from wood consumption to a greaterabundance of spherical coal particles. The first evi-dence of oil combustion appeared around the late1940s. Similarly, increasing numbers of spherical par-ticles deposited after 1900 were analyzed in intertidalsediments in New York (Clark and Patterson 1984).To our knowledge, however, there are few studies inwhich the profiles of carbonaceous particles in peatdeposits have been linked directly to a known histor-ical record of fossil fuel use. Tolonen (1985b) reportedan exponential increase in carbonaceous particles inthe upper 16 cm of a peat profile in SW Finland. In-creases in spherical particles in Estonian peat werecorrelated to the development of the oil industry in thelate 1950s (Punning and Alliksaar 1997, Koff et al.1998). Focusing on a longer time scale, Gilbertson etal. (1997) linked patterns of soot concentration with

344 WETLANDS, Volume 24, No. 2, 2004
depth in a peat core collected from a bog in Sheffield,U.K. to regional manufacturing of iron and steelthroughout the 19th and 20th centuries.
Quantification and evaluation of spherical carbona-ceous particles are easy to combine with pollen anal-ysis. Counting carbonaceous particles may be time-consuming but inexpensive. As with magnetic suscep-tibility measurements, this technique will identify onlya general time period corresponding to regional com-bustion of fossil fuels. However, long distance trans-port of carbonaceous particles may interfere with in-terpretations of regional fuel use, as spherical particleshave even been found in arctic systems (Rosen et al.1981). Irregular shaped particles, formed by wood,coal, and oil combustion, also could complicate mea-surements of spherical particles.
Charcoal Particles
Charcoal from the incomplete combustion of planttissue preserves well and can be used as a proxy ofpast fires (Patterson et al. 1987). Charcoal productionis related to the intensity of fire as well as the natureof the material being burnt. Wind and water move-ments are the primary dispersal modes for charcoal,although most charcoal is deposited soon after pro-duction (Patterson et al. 1987). Charcoal layers withina peat core can be used as a dating tool when corre-lated to fire events of known age. Approaches mayinclude analysis of historical records of regional fireactivity, use of dendrochronological techniques, orcorroboration of charcoal concentrations in nearby an-nually laminated (varved) lake sediments (cf. Gajewskiet al. 1985, Tolonen 1985a, Alm et al. 1993, Pitkanenand Huttenen 1999, Pitkanen et al. 1999).
While charcoal has been used frequently to deter-mine fire histories in peats, it rarely has been used asa dating tool, likely due to the difficulties in defininglocal versus regional signals in charcoal data. Alm etal. (1993) were able to assign dates to two charcoallayers in the upper portions of a peat deposit in centralFinland using dendrochronologically-dated fire scarson Scots pine (Pinus sylvestris) stumps. Evidence ofincreased numbers of charcoal layers in peat depositsas a result of slash-and-burn cultivation may be a use-ful historical marker (cf. Tolonen 1985b).
Macroscopic charcoal or ash layers can be identifiedvisually within intact cores or from sieve washing ofsamples (cf. Clark 1982, Tolonen 1985b,c, Pattersonet al. 1987, Foster and Zebryk 1993, Efremova andEfremov 1994). Quantitative methods for charcoalanalysis, however, including microscopy and elemen-tal carbon analysis, are more time-consuming (Patter-son et al. 1987). Individual particles, total area, or sizeclasses of charcoal fragments can be counted under a
light microscope in pollen slides, sediment sections, orsieved samples (cf. Waddington 1969, Tallis 1975,Cwynar 1978, Tolonen 1978, Tolonen 1985b, Patter-son et al. 1987, Sarmaja-Korjonen 1991, Tinner andHu 2003). Chemical analysis of charcoal involvesnitric acid digestion followed by ignition at around500 8C for several hours to determine mineral content(Tallis 1975, Robinson 1984). Data can be expressedas total charcoal content per unit sediment, influx ofcharcoal per unit area per year, charcoal percentage ofthe pollen sum, or ratio of charcoal to total pollen(Waddington 1969, Patterson et al. 1987). Winkler(1985) subtracted dry weight following ignition (500 8Cfor 3 hr) from the dry weight after digestion in nitricacid to yield charcoal percentages.
Robinson (1984) concluded that visual estimates bysieving provided qualitative measures of charcoalabundance but missed small particles that passedthrough sieves. The microscopic method (total area ofcharcoal particles) was considered more precise andreliable than chemical digestions (digested in sodiumhydroxide and nitric acid, and combusted at 500 8Cfor 5 hr). Winkler (1985) found correlation betweenmicroscopic charcoal and results obtained from a di-gestion method. Tinner and Hu (2003) found that prep-aration techniques can influence charcoal size and size-class distributions in lake sediments and concludedthat measurements of charcoal area in pollen slidesmay by unnecessary.
Because most charcoal analyses have been per-formed in corroboration with pollen analysis, micros-copy has been used more commonly than elementalanalysis. Breakage of large charcoal particles isthought to be a potential complication to investigationsof charcoal abundance by microscopy (Patterson et al.1987). However, no difference between the total num-ber of charcoal particles and the total area of charcoalin size classes ranging from 25 to 3200 mm2 was foundin a Finnish peat once ratios of charcoal to arborealpollen were used to correct for higher concentrationsof particles with increasing bulk density (Sarmaja-Kor-jonen 1991).
The use of charcoal as a dating tool assumes mini-mal post-depositional movement of charcoal and ashparticles in the peat matrix. This assumption may bemore serious for charcoal analysis than for pollen dat-ing, as fire events must be identified over short timeperiods. Clearly, undisturbed peat must be used toidentify individual fires. Microscopic charcoal (5–80mm diameter) might be more influenced by regionalcharcoal sources than local sources, complicating theuse of charcoal records for constructing local fire his-tories (Clark 1988). Tolonen (1983) also cautioned thatfire history information in peat may not be useful be-cause 1) only local fires leave detectable horizons and
Turetsky et al., DATING RECENT PEAT 345
2) fire activity may be particularly heterogeneous inpeatlands. Large abundances of charcoal particles notassociated with burned peat within a core may be in-terpreted as reflecting charcoal deposition outside thelocal basin (Tolonen 1985b). Charcoal analyses mayalso be complicated by the presence of spherical car-bonaceous particles generated through fossil fuel com-bustion. These carbonaceous particles may interferewith identification of charcoal particles.
Fallout Isotopes: 137Cs, 241Am, 207Bi
Aboveground nuclear weapons testing in the late1950s and early 1960s, along with the Chernobyl ac-cident in 1986, left discrete radioactive markers in en-vironments that favor post-depositional immobility(Walling and He 1993, von Gunten 1995). Fallout iso-topes, including 137Cs (T½ 5 30.2 yr), 241Am (T½ 5432.2 yr), and 207Bi (T½ 5 31.55 yr), may be usefulgeochronological tools in peat deposits. Each of theseisotopes is a gamma emitter, although their detectionin peat cores may be limited by low activities.
137Cs. Cs-137 is the predominant nuclide present ininventories from the Chernobyl accident and nuclearweapons testing. Worldwide deposition of 137Cs fromChernobyl fallout reached 89,000 TBq (Colgan et al.1993). Cs-137 does not appear to remain immobile inacidic peat and is affected by diffusion and advectionthrough pore water as well as biological uptake byvegetation (Schell 1986, Schell et al. 1989, Urban etal. 1990, Mitchell et al. 1992, Colgan et al. 1993, Ger-dol et al. 1994, Oldfield et al. 1995, Appleby et al.1997, Kim et al. 1997, MacKenzie et al. 1997, Cohenet al. 1999). MacKenzie et al. (1997) reported a lowerdegree of 137Cs mobility in peats with high mineralcontent due to the importance of clay minerals to 137Csexchange (Shand et al. 1994, Hird et al. 1996, Livenset al. 1996). Eight years after the Chernobyl accident,runoff coefficients of fallout 137Cs from peatlands wereabout one order of magnitude greater than coefficientsfrom soils with larger mineral contents (Kudelsky etal. 1996). Cs-137 losses from an Irish peatland were63% from nuclear weapons testing and 47% fromChernobyl fallout compared to inventories from near-by mineral soils (Colgan et al. 1993).
Concentrations of 134Cs (T1/252.08 yr) remaining insoils and peats as a result of the Chernobyl accidentcan be quantified to separate the relative concentra-tions of 137Cs into Chernobyl and nuclear weapons fall-out components. Chernobyl fallout is isolated usingmeasured 137Cs:134Cs activity ratios of sample, takinginto account radioactive decay since deposition, aswell as known ratios of fallout immediately followingthe Chernobyl accident (cf. McGee et al. 1992, Mitch-
ell et al. 1992, Colgan et al. 1993, Gerdol et al. 1994,Mackenzie et al. 1997).
241Am. Am-241 is produced via radioactive decay of241Pu (Colgan et al. 1993). Although the potential forpost-depositional mobility of 241Am remains largelyuntested, this nuclide appears to be less mobile withinpeat profiles than 137Cs and hence may be a more use-ful chrono-stratigraphic marker (Clymo et al. 1990,Appleby et al. 1991, 1997, Oldfield et al. 1995, Sand-ers et al. 1995, Shotyk et al. 1997b, Smith et al. 1997).Mitchell et al. (1992), however, did find evidence forthe mobility of 241Am in peat, suggesting that this iso-tope may not be a useful dating tool.
207Bi. Bi-207 has not been well-tested as a geochro-nological tool. However, peaks in the concentrationsof 207Bi in a salt marsh were found at similar depthsin different locations, suggesting post-depositional im-mobility (Kim et al. 1997). Peaks in 207Bi were foundat depths corresponding both to the mid-1960s basedon 210Pb-dated chronologies in lake sediments (Joshiand McNeely 1988) and to peak fallout of 137Cs in soiland vegetation samples (Aarkrog et al. 1984). Inter-ference by 134Cs may provide difficulties in detecting207Bi via gamma spectroscopy but should become lessof a problem in samples older than about 20 years dueto the short half life of 134Cs (Kim et al. 1997).
Radiogenic fallout from the Chernobyl accident willbecome a more useful stratigraphic marker in the fu-ture, especially in central and eastern Europe, as it in-grows and is progressively buried deeper in peat chro-nologies (Schell et al. 1997). The low activities of nu-clear fallout in peats may necessitate the use of largesample sizes and long counting times. As many havefound evidence for 137Cs mobility in soils and peats,we do not recommend its use as a dating method inpeatlands. Moreover, Sanders et al. (1995) warn thatclassic radioisotopic methods often are inconsistentand unreliable to use alone or as corroborative tools(Figure 14). However, we feel that an investigationinto the mobility of 207Bi in peat would be worthwhile.
Other Dating Tools
Other chronostratigraphic markers may prove tobe useful in dating recent peats. Deposition of heavymetals such as Pb, Cu, Zn, and V with mining,smelting, or other anthropogenic activities has notbeen used specifically as a dating tool but has beenlinked to historical patterns of use (cf. Farmer et al.1997, Gorres and Frenzel 1997, West et al. 1997,Shotyk et al. 1998, Vile et al. 2000) and could, there-fore, serve as a stratigraphic marker in peat deposits.Lead in particular can be related to regional patternsof lead-based petrol additives and subsequent un-

346 WETLANDS, Volume 24, No. 2, 2004
Figure 14. Depth versus radioisotope activities in a UK peat core. A. 210Pb activities do not show a monotonic log-lineardistribution, B. 241Am activities show a relatively tight peak at 19 cm beneath the surface, which may correspond to the onsetof nuclear weapons testing in the early 1960s, and C. 137Cs activities show two maxima at 5 and 23 cm beneath the peatsurface, which may correspond to Chernobyl- and nuclear weapons- derived 137Cs. The latter maxima occurs 4 cm lower thanthe 241Am bomb spike, suggesting that at least one radioisotope experienced downwards mobility. Modified from Sanders etal. (1995).
leaded gasoline use. Stable isotope abundances of Pbare useful in identifying the geochemical origins andfuel source of Pb deposition (Farmer et al. 1997).Shotyk et al. (1998) used 206Pb/207Pb and Pb enrich-ment factors to differentiate background from an-thropogenic fluxes.
Tephrochronologies have been developed in peat-lands situated in Great Britain, Canada, and New Zea-land (cf. Dugmore et al. 1995, Dugmore et al. 1996,Pilcher and Hall 1996, Pilcher et al. 1996). This ap-proach, however, mostly has been useful in datingpeats on the order of thousands of years. Tephrochron-ology depends upon correlating layers of tephra to his-torical records of volcanic eruptions. Volcanic ash, thesmallest tephra fragments, can travel up to thousandsof kilometers downwind from a volcano. Tephra can
be identified visually, microscopically, or chemicallyby electron microprobe analysis. The White River vol-canic ash layer (originating from Mount Churchill1200 years ago) has been used to estimate apparentrates of peat accumulation in the Northwest Territo-ries, Canada (Harris and Schmidt 1994, Robinson andMoore 1999). Recent volcanic activity also could beused to determine rates of peat accumulation in somelocalities (i.e., the 1973 eruption of Heimaey, Iceland;1980 eruption of Mount St. Helen’s, Washington;1991 eruption of Mt. Pinatubo; 1994 eruption of theKliuchevskoi volcano, Russia or the 1994 eruption ofMerapi, Indonesia). Tephra layers from some of theserecent eruptions will become more valuable as strati-graphic markers as the ash progressively is buriedwithin a peat deposit.
Turetsky et al., DATING RECENT PEAT 347
CONCLUSIONS
A variety of dating techniques exists for recentlydeposited peat, including radiometric methods, such as14C and 210Pb-dating, and chrono-stratigraphic markers,such as fallout from atmospheric bomb testing and theChernobyl accident. Each dating technique has its ownset of assumptions, many of which have received littleattention (Table 1). A number of dating tools rely uponthe assumption of particle immobility within a peatprofile. To our knowledge, however, only lead andpollen mobility in peat have been addressed experi-mentally. 210Pb was found to be immobile in peat (Vileet al. 1999), while mixed results have been obtainedfor pollen grains (Rowley and Rowley 195, Clymo andMackay 1987). Field evidence supports the mobilityof 137Cs fallout in peat. We therefore recommendagainst its use as a dating tool in organic soils. Moreinvestigation into the behaviors of 241Am and 207Bi isneeded before these isotopes can be trusted as radio-genic markers. Movement of PCBs downward in peatcolumns has been noted; however, measurements ofthese contaminants still have been correlated to his-torical patterns of use (Rapaport and Eisenreich 1988,Sanders et al. 1995). Caution should be exercised inusing PCB congeners as dating markers in peat.
It is important to consider carefully all assumptionsunderlying dating methods (Table 1). Both pollen den-sity dating and acid insoluble ash dating assume con-stant rates of deposition over time. Constant bulk den-sity dating depends upon the assumption that peat ac-cumulation changes little with time (Punning et al.1993). Clearly, these assumptions will not be valid insome peat-accumulating systems and may lead to er-roneous dates. Many of the potential stratigraphicmarkers outlined here (i.e., spherical carbonaceousparticles, magnetic susceptibility, PCBs, PAHs, DDT)depend upon changes in particulate deposition causedby anthropogenic activity. However, as noted above,such changes in particle deposition may preclude theuse of acid insoluble ash dating. Thus, the nature ofpeatland development, proximity to industrial activity,and its position on the landscape should be taken intoconsideration when choosing a dating method.
Radiocarbon dating is by far the most commonlyused dating tool in peats. It is an expensive method,however, and analyzing more than a few samples maynot be feasible for all studies. Precise radiocarbondates for modern samples would be valuable in cor-roboration with other techniques. Wiggle matching of14C dates allows radiocarbon dating to be extended tosurface peat. This method is extremely promising butexpensive and requires further development for com-mon application to peat deposits.
Methods based on 210Pb, acid insoluble ash, moss
increments, constant bulk density, and pollen densityprovide continuous chronologies in recent peats (Table1). As peat accumulation fluctuates with short-term en-vironmental changes, continuous age chronologies willbe more highly resolved than interpolation betweenindependently derived dates. Within these continuousmethods, we feel that 210Pb dating and pollen densitydating hold the most promise as reliable techniques.While constant bulk density dating may provide roughdepth-age relationships (Zoltai 1991, Belyea andWarner 1994), this method will overestimate peat age,as it does not consider decomposition throughout thecolumn. Moss increment dating appears useful, partic-ularly in hummock topographies (Eustis and Tolonen1990, Belyea and Warner 1994); however its appli-cation to dating peat may be limited as it covers onlya short age range and few plant taxa.
Stratigraphic markers also can be used to constructage chronologies in peat and are useful for calibratingindependent dates. Changes in pollen abundance as-sociated with settlement, agriculture, or disease areused commonly in North American and Europeanpeats and seem to be reliable options as stratigraphicmarkers. While correlating charcoal abundance to re-gional or local fire activity is feasible, we feel that thedifficulty in identifying single fires of known age willpreclude the use of charcoal as a common dating tool.As mentioned previously, stratigraphic markers basedon spherical carbonaceous particles, magnetic suscep-tibility, PCBs, PAHs, and DDT all depend uponknowledge of regional anthropogenic activity. Com-bining a number of these markers to build an age chro-nology in peat will save time with background re-search into contaminant use and fossil fuel combus-tion.
As noted throughout the text, many dating methodsin peat rely upon the ombrotrophic nature of bogs torecord atmospheric deposition (i.e., 210Pb, pollen den-sity, acid insoluble ash, magnetic susceptibility, car-bonaceous particles, PCBs, PAHs, DDT) and the greatpotential for cation exchange in Sphagnum peat (i.e.,210Pb, PCBs, PAHs, DDT). Violation of assumptionsmay occur if these methods are applied to minero-trophic sites. While underlying assumptions should becarefully considered for every site, radiocarbon dating,wiggle-matching, moss increment dating, constantbulk density dating, pollen markers, and charcoalabundance should be applicable to all peat accumulat-ing systems regardless of hydrologic controls.
Because of uncertainties associated with dating peatdeposits, the use of two or more dating methods seemsprudent. The nature of corroborations to date, how-ever, has been piecemeal in recent peats. No singlestudy has undertaken a comprehensive assessment ofall available dating/corroboration methods. The most
348 WETLANDS, Volume 24, No. 2, 2004
ambitious study to date in this regard was that of Be-lyea and Warner (1994a), who used 210Pb, 14C, and con-stant peat bulk density in two hummock and two hol-low/depression peat cores. As well, they dated thehummock cores using moss-increment dating and thetwo hollow cores using pollen density dating. No twomethods appeared to agree consistently. Pb-210 dateswere young relative to other methods in one hummockand one hollow core. Cole et al. (1990), however,found good corroboration between 210Pb dating, pollenmarkers, and radiocarbon dating in bog hummockcores. Oldfield et al. (1995) concluded that the bestage chronologies in peat can be derived from pollenmarkers, 241Am fallout, and 210Pb dating. They recom-mended constraining the 210Pb profile with the chron-ostratigraphic markers if the independent methods donot agree.
Given the diverse nature of dating tools outlinedhere, certain methods will be better suited for individ-ual sites. We recommend careful consideration of peat-land characteristics, including the ombrotrophic status,size of the wetland (i.e., catchment size for pollen,charcoal, etc.), and developmental history of the siteitself (i.e., potential changes in bulk density), as wellas surrounding regions that could affect pollen rain.We also advocate evaluating the assumptions under-lying each method available for dating recently accu-mulated peat. Studies investigating these assumptionsusing experimental approaches would add to our con-fidence in these dating methods. Until the uncertaintyunderlying these methods is resolved, however, werecommend the use of two or more dating tools inbuilding age chronologies in recent peat. The choiceof appropriate methodologies should be dictated by in-dividual objectives. Single-event markers may be ad-equate for many studies. However, studies investigat-ing temporal change in peat stratigraphies will requirea continuous method with independent validation. Inall cases, corroboration of age/depth relationships de-rived from multiple methods, such as a continuous dat-ing method with one or more markers or independentmethods, seems ideal.
ACKNOWLEDGMENTS
We thank the individuals whose efforts and discus-sions have contributed to the compiling of the infor-mation presented in this review, including Ilka Bauer,Dave Beilman, Martin Bell, Ian Campbell, Petra Dark,John Duke, Ted Evans, Hans Gottgens, Linda Halsey,Bill Harbert, Martin Novak, Bill Schell, CharlieSchweger, Nat Rutter, Melanie Vile, Dale Vitt, ChrisWilliams, Zicheng Yu, and Joe Yavitt. We also thankBob Booth, Marc Brenner, Steve Jackson, Steve Rob-inson, and Zicheng Yu, and an anonymous reviewer
for helpful suggestions on this manuscript. We ac-knowledge financial support from the NSF (DEB 97-27800 to Wieder and Yavitt), and student grants fromthe Canadian Circumpolar Institute at the Universityof Alberta, and the Society of Wetland Scientists toTuretsky.
LITERATURE CITED
Aarkrog, A., H. Dahlgaard, E. Holm, and L. Hallstadius. 1984. Bis-muth-207 in global fallout. Journal of Environmental Radioactiv-ity 1:107–117.
Aitken, M. J. 1990. Science-Based Dating in Archaeology. Long-man, London, UK.
Allison, T. D., R. E. Moeller, and M. B. Davis. 1986. Pollen inlaminated sediments provides evidence for a mid-Holocene forestpathogen outbreak. Ecology 67:1101–1105.
Alm, J., K. Tolonen, and H. Vasander. 1993. Determination of recentapparent carbon accumulation in peat using dated fire horizons.Suo 43:191–194.
Ament, A. and K. H. Lieser. 1993. Determination of 210Pb by liquidscintillation spectrometry in presence of various amounts of thedaughter nuclides 210Bi and 210Po. Radiochimica Acta 60:21–23.
Anderson, T. 1974. The chestnut pollen decline as a time horizonin lake sediments in eastern North America. Canadian Journal ofEarth Sciences 11:678–685.
Appleby, P. G. and F. R. Oldfield. 1978. The calculation of 210Pbdates assuming a constant rate of supply of unsupported 210Pb tothe sediment. Catena (Supplement) 5:1–8.
Appleby, P. G. and F. R. Oldfield. 1983. The assessment of 210Pbdata from sites with varying sediment accumulation rates. Hydro-biologia 103:29–35.
Appleby, P. G., P. J. Nolan, D. W. Gifford, M. J. Godfrey, F. Old-field, N. Anderson, and R. W. Battarbee. 1986. 210Pb-dating bylow background gamma counting. Hydrobiologia 143:21–27.
Appleby, P. G., P. J. Nolan, F. Oldfield, N. Richardson, and S. R.Higgett. 1988. 210Pb-dating of lake sediments and ombrotrophicpeats by gamma-assay. The Science of the Total Environment 69:157–177.
Appleby, P. G., N. Richardson, P. J. Nolan, and F. Oldfield. 1990.Radiometric dating of the UK SWAP sites. Philosophical Trans-actions of the Royal Society of London B, Biological Sciences327:233–238.
Appleby, P. G., N. Richardson, and P. J. Nolan. 1991. 241Am datingof lake sediments. Hydrobiologia 241:35–42.
Appleby, P. G., W. Shotyk, and A. Fankhauser. 1997. Lead-210 agedating of three peat cores in the Jura Mountains, Switzerland.Water, Air, and Soil Pollution 100:223–231.
Arnold, J. R. and W. F. Libby. 1949. Age determinations by radio-carbon content: checks with samples of known age. Science 110:678–680.
Arnold, L. D. 1995. Conventional radiocarbon dating. p. 107–115.In N. Rutter and N. Catto (eds.) Dating Methods of QuaternaryDeposits. Geological Association of Canada, St. Johns, New-foundland, Canada.
Bard, E., G. Raisbeck, F. Yiou, and J. Jouzel. 1997. Solar modula-tion of cosmogenic nuclide production over the last millennium:comparison between 14C and 10Be records. Earth and PlanetaryScience Letters 150:453–462.
Bard, E., G. Raisbeck, F. Yiou, and J. Jouzel. 2000. Solar irradianceduring the last 1200 years based on cosmogenic nuclides. Tellus52B:985–992.
Barnekow, L., G. Possnert, and P. Sandgren. 1998. AMS 14C chro-nologies of Holocene lake sediments in the Abisko area, northernSweden—a comparison between dated bulk sediment and mac-rofossil samples. GFF—Upsala 120:59–68.
Bazzaz, F. A. 1974. Ecophysiology of Ambrosia artemisifolia: asuccessful dominant. Ecology 55:112–119.
Beckwith, P. R., J. B. Ellis, R. M. Revitt, and F. Oldfield. 1986.
Turetsky et al., DATING RECENT PEAT 349
Heavy metal and magnetic relationships for urban source sedi-ments. Physics of the Earth and Planetary Interiors 42:67–75.
Belyea, L. R. and B. G. Warner. 1994a. Dating of the near-surfacelayer of a peatland in northeastern Ontario, Canada. Boreas 23:259–269.
Belyea, L. R. and B. G. Warner. 1994b. Temporal scale and theaccumulation of peat in a Sphagnum bog. Canadian Journal ofBotany 74:366–377.
Bennett, K. D. 1986. Competitive interactions among forest treepopulations in Norfolk, England, during the last 10,000 years.New Phytologist 103:603–620.
Benninger, L. K., D. M. Lewis, and K. K. Turekian. 1975. The useof natural Pb-210 as a heavy metal tracer in the river-estuarinesystem. p. 202–210. In T. M. Church (ed.) Marine Chemistry inthe Coastal Environment. American Chemical Society, Series 18,New York, NY, USA.
Benninghoff, W. S. 1962. Calculation of pollen and spore densityin sediments by addition of exotic pollen in known quantities.Pollen et Spores 4:332–333.
Berglund, B. E. (ed.). 1986. Handbook of Holocene Palaeoecologyand Paleohydrology. John Wiley and Sons, Chichester, UK.
Berglund, B. E. and M. Ralska-Jasiewiczowa. 1986. Pollen analysisand pollen diagrams. p. 455–484. In B. E. Berglund (ed.) Hand-book of Holocene Paleoecology and Paleohydrology. John Wileyand Sons, Chichester, UK.
Bevington, P. R. 1969. Data Reduction and Error Analysis for thePhysical Sciences. McGraw-Hill, New York, NY, USA.
Bignert, A., M. Olsson, W. Persson, S. Jensen, S. Zakrisson, K.Litzen, U. Eriksson, L. Haeggberg, and T. Alsberg. 1998. Tem-poral trends of organochlorines in Northern Europe, 1967–1995.Relation to global fractionation, leakage from sediments and in-ternational measures. Environmental Pollution 99:177–198.
Binford, M. W. 1990. Calculation and uncertainty analysis of 210Pbdates for PIRLA project cores. Journal of Paleolimnology 3:253–267.
Birks, H. J. B. and H. H. Birks. 1980. Quaternary Paleoecology.Edward Arnold, London, England.
Bjorck, S. and B. Wohlfarth. 2001. 14C chronostratigraphic tech-niques in paleolimnology. p. 205–245. In W. M. Last and J. P.Smol (eds.) Tracking Environmental Change Using Lake Sedi-ments. Volume 1: Basin Analysis, Coring, and ChronologicalTechniques. Kluwer Academic Publishers, Dordrecht, The Neth-erlands.
Blais, J. S. and W. D. Marshall. 1988. Determination of 210Pb inadmixture with 210Bi and 210Po in quenched samples by liquid scin-tillation counting. Analytical Chemistry 60:1851–1856.
Bowman, S. 1990. Interpreting the Past: Radiocarbon Dating. BritishMuseum Publications, London, England.
Boyd, W. E. 1986. The role of mosses in modern pollen analysis:the influence of moss morphology on pollen entrapment. Pollenet Spores 28:243–256.
Bracewell, J. M., A. Hepburn, and C. Thompson. 1993. Levels anddistribution of polychlorinated biphenyls on the Scottish landmass. Chemosphere 27:1657–1667.
Brannvall, M.-L., R. Bindler, O. Emteryd, M. Nilsson, and I. Ren-berg. 1997. Stable isotope and concentration records of atmo-spheric lead pollution in peat and lake sediments in Sweden. Wa-ter, Air, and Soil Pollution 100:243–252.
Braziunas, T. F., I. E. Fung, and M. Stuiver. 1995. The pre-industrialatmospheric 14CO2 latitudinal gradient as related to exchangesamong atmospheric, oceanic, and terrestrial reservoirs. GlobalBiochemical Cycles 9:565–584.
Bridgham, S. D., K. Updegraff, and J. Pastor. 1998. Carbon, nitro-gen, and phosphorus mineralization in northern wetlands. Ecology79:1545–1561.
Bronk Ramsey, C. 1994. Analysis of chronological information andradiocarbon calibration: the program OxCal. Archaeological Com-puting Newsletter 41:11–16.
Bronk Ramsey, C. 1995. Radiocarbon calibration and analysis ofstratigraphy: the OxCal program. Radiocarbon 37:425–430.
Bronk Ramsey, C. 2001. Development of the radiocarbon calibrationprogram. Radiocarbon 43:355–363.
Bronk Ramsey, C., J. van der Plicht, and B. Weninger. 2001. ‘Wig-gle matching’ radiocarbon dates. Radiocarbon 43:381–389.
Brown, J. 1969. Buried soils associated with permafrost. p. 115–127. In S. Pawluk (ed.) Pedology and Quaternary Research. TheNational Research Council of Canada and the University of Al-berta, Edmonton, Alberta, Canada.
Brugam, R. B. 1978. Pollen indicators of land-use change in south-ern Connecticut. Quaternary Research 9:349–362.
Brush, G. S., E. A. Martin, R. S. DeFries, and C. A. Rice. 1982.Comparisons of 210Pb and pollen methods for determining rates ofestuarine sediment accumulation. Quaternary Research 18:196–217.
Buck, C. E., W. G. Cavanagh, and C. D. Litton. 1996. Bayesianapproach to interpreting archaeological data. John Wiley and Son,Chichester, UK.
Buck, C. E., J. A Christen, and G. N. James. 1999. BCal: an on-line Bayesian radiocarbon calibration tool. Internet Archaeology7.http://intarch.ac.uk/journal/issue7/buckpindex.html.
Buck, C. E., J. B Kenworthy, C. D Litton, and A. F. M Smith. 1991.Combining archaeological and radiocarbon information: a Bayes-ian approach to calibration. Antiquity 65:808–821.
Buck, C. E., C. D. Litton, and E. M. Scott. 1994. Making the mostof radiocarbon dating: some statistical considerations. Antiquity68:252–263.
Buck, C. E., C. D. Litton, and A. F. M. Smith. 1992. Calibration ofradiocarbon results pertaining to related archaeological events.Journal of Archaeological Science 19:497–512.
Burleigh, R., K. Matthews and M. Leese. 1984. Consensus d13Cvalues. Radiocarbon 26:7–45.
Chaddha, G. and M. S. Seehra. 1983. Magnetic components andparticle size distribution of coal fly ash. Journal of Physics D:Applied Physics 16:1767–1776.
Charman, D. J., R. Aravena, and B. G. Warner. 1994. Carbon dy-namics in a forested peatland in north-eastern Ontario. Canada.Journal of Ecology 82:55–62.
Christen, J. A. 2003. Bwigg: an internet facility for Bayesian radiocar-bon wiggle-matching. Internet Archaeology 13. http://intarch.ac.uk/journal/issue13/christenpindex.html.
Christen, J. A. and C. D. Litton. 1995. A Bayesian approach towiggle-matching. Journal of Archaeological Science 22:719–725.
Clark, J. S. 1988. Particle motion and the theory of charcoal anal-ysis: source area, transport, deposition, and sampling. QuaternaryResearch 30:67–80.
Clark, J. S. and W. A. Patterson. 1984. Pollen, 210Pb, and opaquespherules: an integrated approach to dating and sedimentation inthe intertidal environment. Journal of Sedimentary Petrology 54:1249–1263.
Clark, R. L. 1982. Point count estimation of charcoal in pollen prep-arations and thin sections of sediments. Pollen et Spores 24:523–536.
Clark, R. M. and C. Renfrew. 1972. A statistical approach to thecalibration of floating tree-ring chronologies using radiocarbondates. Archaeometry 14:5–19.
Clymo, R. S. 1965. Experiments on breakdown of Sphagnum in twobogs. Journal of Ecology 53:747–757.
Clymo, R. S. 1970. The growth of Sphagnum: methods of measure-ment. Journal of Ecology 58:13–49.
Clymo, R. S. 1984. The limits to peat bog growth. PhilosophicalTransactions of the Royal Society of London B 303:605–654.
Clymo, R. S. 1992. Models of peat growth. Suo 43:127–136.Clymo, R. S. and P. M. Hayward. 1982. The ecology of Sphagnum.
p. 229–289. In A. J. E. Smith (ed.) Ecology of Bryophytes. Chap-man and Hall, London, England.
Clymo, R. S. and D. Mackay. 1987. Upwash and downwash ofpollen and spores in the unsaturated surface layer of Sphagnum-dominated peat. New Phytologist 105:175–183.
Clymo, R. S., F. Oldfield, P. G. Appleby, G. W. Pearson, P. Rat-nessar, and N. Richardson. 1990. A record of atmospheric depo-sition in a rain-dependent peatland. Philosophical Transactions ofthe Royal Society of London B 327:331–338.
Clymo, R. S., J. Turunen, and K. Tolonen. 1998. Carbon accumu-lation in peatland. Oikos 81:368–388.
Cohen, A. D., C. P. Gage, W. S. Moore, and R. S. VanPelt. 1999.
350 WETLANDS, Volume 24, No. 2, 2004
Combining organic petrography and palynology to assess anthro-pogenic impacts on peatlands. Part 2. An example from a CarolinaBay wetland at the Savannah River Site in South Carolina. Inter-national Journal of Coal Geology 39:47–95.
Cole, K. L., D. R. Engstrom, R. P. Futyma, and R. Stottlemyer.1990. Past atmospheric deposition of metals in Northern Indianameasured in a peat core from Cowles Bog. Environmental Scienceand Technology 24:543–549.
Colgan, P. A., P. McCann, E. J. McGee, and I. R. McAulay, 1993.Short- and long-term losses of 137Cs from peatland soils. Irish Jour-nal of Agricultural and Food Research 32:37–46.
Conway, V. M. 1947. Ringinglow Bog, near Sheffield. Journal ofEcology 34:149–181.
Cook, G. T., D. D. Harkness, A. B. MacKenzie, B. F. Miller, andE. M. Scott (eds.). 1996. Liquid Scintillation Spectrometry, 1994.Radiocarbon Publishers, Tucson, AZ, USA.
Craft, C. B. and C. J. Richardson. 1998. Recent and long-term or-ganic soil accretion and nutrient retention in the Everglades. SoilScience Society of America Journal 62:834–843.
Cranwell, P. A. and V. K. Koul. 1989. Sedimentary record of poly-cyclic aromatic and aliphatic hydrocarbons in the Windermerecatchment. Water Research 23:275–283.
Cwynar, L. C. 1978. Recent history of fire and vegetation fromlaminated sediment of Greenleaf Lake, Algonquin Park, Ontario.Canadian Journal of Botany 56:10–21.
Damman, A. W. H. 1978. Distribution and movement of elementsin ombrotrophic peat bogs. Oikos 30:480–495.
Damon, P. E., G. Burr, A. N. Peristykh, G. C. Jacoby, and R. D.D’Arrigo. 1996. Regional radiocarbon effect due to thawing offrozen earth. Radiocarbon 38:597–602.
Damon, P. E., C. W. Ferguson, A. Long, and E. I. Wallick. 1974.Dendrochronologic calibration of the radiocarbon timescale.American Antiquity 39:350–366.
Damon, P. E., J. C. Lerman, and A. Long. 1978. Temporal functionsof 14C: causal factors and implications. Annual Review of Earthand Planetary Science 6:457–494.
Davis, M. B., L. B. Brubaker, and J. M. Beiswinger. 1971. Pollengrains in lake sediments: pollen percentages in surface sedimentsfrom southern Michigan. Quaternary Research 1:450–467.
Davis, R. B. 1967. Pollen studies of near surface sediments in MaineLakes. p. 143–173. In E. J. Cushing and H. E. Wright (eds.) Qua-ternary Paleoecology. Yale University Press. New Haven, CT,USA.
Day, S. P. and P. A. Mellars. 1994. ‘Absolute’ dating of Mesolithichuman activity at Star Carr, Yorkshire: new palaeoecological stud-ies and identification of the 9600 BP radiocarbon ‘plateau’. Pro-ceedings of the Prehistoric Society 60:417–422.
de Jong, A. F. M., W. G. Mook, and B. Becker. 1979. Confirmationof the Suess wiggles: 3200–700 BC. Nature 280:48–49.
Dekling H. and J. van der Plicht. 1993. Statistical problems in cal-ibrating radiocarbon dates. Radiocarbon 35:239–244.
Delibrias, G. 1989. Carbon-14. p. 399–436. In E. Roth and B. Poty(eds.) Nuclear Methods of Dating. Kluwer Academic Publishers,Dordrecht, The Netherlands.
de Vries, H. 1958. Variation in the concentration of radiocarbon withtime and location on Earth. Koninklijke Nederlandse Akademievan Wetenschappen (Series B) 61:94–102.
Dickinson, W. 1975. Recurrence surfaces in Rusland Moss, Cumbria(formerly North Lancashire). Journal of Ecology 63:913–935.
Dugmore, A. J., G. Larsen, and A. J. Newton. 1995. Seven tephraisochrones in Scotland. The Holocene 5:257–266.
Dugmore, A. J., A. J. Newton, K. J. Edwards, G. Larsen, J. J. Black-ford, and G. T. Cook. 1996. Long-distance marker horizons fromsmall-scale eruptions: British tephra deposits from the AD 1510eruption of Hekla, Iceland. Journal of Quaternary Science 11:511–516.
Duplessy, J. C. and M. Arnold. 1989. Radiocarbon dating by accel-erator mass spectrometry. p. 437–453. In E. Roth and B. Poty(eds.) Nuclear Methods of Dating. Kluwer Academic Publishers,Dordrecht, The Netherlands.
Dupont, L. 1986. Temperature and rainfall variation in the Holocenebased on comparative palaeoecology and isotope geology of a
hummock and hollow, Bourtangerveen, The Netherlands. Reviewof Palaeobotany and Palynology 48:71–160.
Edwards, K. J. and K. M. Rowntree. 1980. Radiocarbon and pa-laeoenvironmental evidence for changing rates of erosion at aFlandrian stage site in Scotland. p. 207–223. In R. A. Cullingford,D. A. Davidson, and J. Lewin, Timescales in Geomorphology.Wiley, Chichester, UK.
Efremova, T. T. and S. P. Efremov. 1994. Peat fires as an ecologicalfactor in the development of forest-bog ecosystems. Russian Jour-nal of Ecology 25:330–335.
El-Daoushy, F., K. Tolonen, and R. Rosenberg. 1982. Lead 210 andmoss-increment dating of two Finnish Sphagnum hummocks. Na-ture 296:429–431.
Elmore, D. E. and F. M. Phillips. 1987. Accelerator mass spectrom-etry for measurement of long-lived radioisotopes. Science 236:543–550.
Engelkemeir, A., W. H. Hamill, M. G. Inghram, and W. F. Libby.1949. The half-life of radiocarbon (C14). Physical Review 75:1825–1833.
Engstrom, D. and E. Swain. 1986. The chemistry of lakes in timeand space. Hydrobiologia 43:37–44.
Environment Canada. 1991. The State of Canada’s Environment –1991. D.W. Friesen and Sons, Ltd., Altona, Manitoba, Canada.
Espi, E., C. F. Boutron, S. Hong, M. Pourchet, C. Ferrari, W. Sho-tyk, and L. Charlet. 1997. Changing concentrations of Cu, Zn, Cd,and Pb in a high altitude peat bog from Bolivia during the pastthree centuries. Water, Air, and Soil Pollution 100:289–296.
Eustis, D. S. and K. Tolonen 1990. A comparison of ash dating andmoss-increment dating in Sphagnum hummocks. Suo 41:33–41.
Faegri, K. and J. Iversen. 1975. Textbook of Pollen Analysis, 3rd
revised edition. Hafner Press, New York, NY, USA.Faegri, K. and J. Iversen. 1989. Appendix A. p. 69–89. In K. Faegri,
P. E. Kaland, and K. Krzywinski (eds.) Textbook of Pollen Anal-ysis, 4th ed. Blackwell Scientific Publications, New York, NY,USA.
Farmer, J. G., A. B. MacKenzie, C. L. Sugden, P. J. Edgar, and L.J. Eades. 1997. A comparison of the historical lead pollution re-cords in peat and freshwater lake sediments from central Scotland.Water, Air, and Soil Pollution 100:253–270.
Ferguson, C. W., B. Huber, and H. E. Suess. 1966. Determinationof the age of Swiss lake dwellings as an example of dendrochro-nologically-calibrated radiocarbon dating. Zeitscrift fur Naturfor-schung 21A:1173–1177.
Foreman, W. T., B. F. Connor, E. T. Furlong, D. G. Vaught, and L.M. Merten. 1994. Methods of analysis by the U.S. GeologicalSurvey National Water Quality Laboratory. Determination of or-ganochlorine insecticides and polychlorinated biphenyls in bottomsediment. U.S. Geological Survey Open-File Report No. 94–140.
Foster, D. R. and T. M. Zebryk. 1993. Long-term vegetation dynam-ics and disturbance history of a Tsuga-dominated forest in NewEngland. Ecology 74:982–998.
Frolking, S, J. L. Bubier, T. R. Moore, T. Ball, L. M. Bellisario, A.Bhardwaj, P. Carroll, P. M. Crill, P. M. Lafleur, J. H. McCaughey,N. T. Roulet, A. E. Suyker, S. B. Verma, J. M. Waddington, andG. J. Whiting. 1998. The relationship between ecosystem produc-tivity and photosynthetically active radiation for northern peat-lands. Global Biogeochemical Cycles 12:115–126.
Gajewski, K., M. G. Winkler, and A. M. Swain. 1985. Vegetationand fire history from 3 lakes with varved sediments in North-western Wisconsin, USA. Review of Palaeobotany and Palynol-ogy 44:277–292.
Gerdol, R., S. Degetto, D. Mazzotta, and G. Vecchiati. 1994. Thevertical distribution of the Cs-137 derived from Chernobyl fall-out in the uppermost Sphagnum layer of two peatlands in thesouthern Alps (Italy). Water, Air, and Soil Pollution 75:93–106.
Geyh, M. A., W. E. Krumbein, and H. R. Kudrass. 1974. Unreliable14C dating of long-stored deep-sea sediments due to bacterial ac-tivity. Marine Geology 17:M45–M50.
Gilbertson, D. D., J. P. Grattan, M. Cressey, and F. B. Pyatt. 1997.An air-pollution history of metallurgical innovation in iron- andsteel-making: a geochemical archive of Sheffield. Water, Air, andSoil Pollution 100:327–341.
Godwin, H. 1962. Radiocarbon dating. Nature 195:943–945.

Turetsky et al., DATING RECENT PEAT 351
Gogrewe, D., M. Putz, R. Weber, K. Siemon, R. A. Esterlund, andP. Patzelt. 1996. Determination of 210Pb via 210Bi using a hydridegeneration technique combined with beta spectrometry. Radi-ochimica Acta 73:105–110.
Goh, K. M. 1991a. Carbon dating. p. 125–145. In D. C. Colemanand B. Fry (eds.) Carbon Isotope Techniques. Academic Press,Inc., San Diego, CA, USA.
Goh, K. M. 1991b. Bomb carbon. p. 147–151. In D.C. Coleman andB. Fry (eds.) Carbon Isotope Techniques. Academic Press, Inc.,San Diego, CA, USA.
Goldberg, E. D. 1963. Geochronology with 210Pb. p. 121–131. InRadioactive Dating. IAEA STI/PUB 68. International Atomic En-ergy Agency, Vienna, Austria.
Goodsite, M. E., W. Rom, J. Heinemeier, T. Lange, S. Ooi, P. G.Appleby, W. Shotyk, W. O. Van Der Knapp, C. Lohse, and T. S.Hansen. 2001. High-resolution AMS 14C dating of post-bomb peatarchives of atmospheric pollutants. Radiocarbon 43:495–515.
Gore, A. J. P. (ed.). 1983. Mires: Swamp, Bog, Fen and Moor—Ecosystems of the World 4A and B. Elsevier Scientific PublishingCompany, Amsterdam, The Netherlands.
Gorham, E. 1991. Northern peatlands: role in the carbon cycle andprobable responses to global warming. Ecological Applications 1:182–195.
Gorham, E. 1994. The future of research in Canadian peatlands: abrief survey with particular reference to global change. Wetlands14:206–215.
Gorham, E. 1995. The biogeochemistry of northern peatlands andits possible responses to global warming. p. 169–187. In G. M.Woodwell and F. T. Mackenzie (eds.) Biotic Feedbacks in theGlobal Climatic System: Will the Warming Feed the Warming?Oxford University Press, New York, NY, USA.
Gorres, M. and B. Frenzel. 1997. Ash and metal concentrations inpeat bogs as indicators of anthropogenic activity. Water, Air, andSoil Pollution 100:355–365.
Gottdang, A., M. Klein, and D. J. W. Mous. 2001. Accelerator massspectrometry at High Voltage Engineering Europa (HVEE). Ra-diocarbon 43:149–156.
Gove, H. E. 1992. The history of AMS, its advantages over decaycounting: applications and prospects. p. 214–229. In R. E. Taylor,A. Long, and R. S. Kra (eds.) Radiocarbon after Four Decades:an Interdisciplinary Perspective. Springer-Verlag, New York, NY,USA.
Griffin, J. J. and E. D. Goldberg. 1979. Morphologies and origin ofelemental carbon in the environment. Science 206:563–565.
Griffin, J. J., and E. D. Goldberg. 1981. Sphericity as a characteristicof solids from fossil fuel burning in a Lake Michigan sediment.Geochimica et Cosmochimica Acta 45:763–769.
Grimm, E. C. 1988. Data analysis and display. p. 43–76. In B. Hunt-ley and T. Webb III (eds.) Vegetation History. Kluwer AcademicPublishers, Dordrecht, The Netherlands.
Gulliksen, S., H. H. Birks, G. Possnert, and J. Mangerud. 1998. Acalendar age estimate of the Younger Dryas-Holocene boundaryat Krakenes, western Norway. The Holocene 8:249–259.
Hammond, A. P., K. M. Goh, P. J. Tonkin, and M. R. Manning.1991. Chemical pretreatments for improving the radiocarbon-datesof peats and organic silts in a gley podzol environment—GrahamsTerrace, North Westland. New Zealand Journal of Geology andGeophysics 34:191–194.
Harris, S. A. and I. H. Schmidt. 1994. Permafrost aggradation andpeat accumulation since 1200 years B.P. in peat plateaus at Tuch-itua, Yukon Territory (Canada). Journal of Paleolimnology 12:3–17.
Hedges, R. E. M. 1981. Radiocarbon dating with an accelerator:review and preview. Archaeometry 23:3–18.
Hedges, R. E. M. 1992. Sample treatment strategies in radiocarbondating. p. 165–183. In R. E. Taylor, A. Long, and R. S. Kra (eds.)Radiocarbon after Four Decades: an Interdisciplinary Perspective.Springer-Verlag, New York, NY, USA.
Hedges, R. E. M. and J. A. J. Gowlett. 1986. Radiocarbon datingby accelerator mass spectrometry. Scientific American 254:100–107.
Himberg, K. K. and P. Pakarinen. 1994. Atmospheric PCB deposi-tion in Finland during 1970s and 1980s on the basis of concen-
trations in ombrotrophic peat mosses (Sphagnum). Chemosphere29:431–440.
Hird, A. D., D. L. Rimmer, and F. R. Livens. 1996. Factors affectingthe sorption and fixation of caesium in acid organic soils. Euro-pean Journal of Soil Science 47:97–104.
Holzer, A. and A. Holzer. 1998. Silicon and titanium in peat profilesas indicators of human impact. The Holocene 8:685–696.
Hua, Q., M. Barbetti, U. Zoppi, D. Fink, and G. Jacobsen. 2002.Atmospheric radiocarbon offset for the tropics during the LittleIce Age. Abstract and oral presentation for the 9th InternationalConference on Accelerator Mass Spectrometry, 9–13 September2002 in Nagoya, Japan.
Hua, Q., M. Barbetti, U. Zoppi, D. M. Chapman, and B. Thomson.2003. Bomb radiocarbon in tree-rings from northern New SouthWales, Australia: implications for dendrochronology, atmospherictransport and air-sea exchange of CO2. Radiocarbon 45:431–447.
Hughen, K. A., J. R. Southon, S. J. Lehman, and J. T. Overpeck.2000. Synchronous radiocarbon and climate shifts during the lastdeglaciation. Science 290:1951–1954.
Huttunen, P. 1980. Early land uses, especially the slash-and-burncultivation in the commune of Lammi, southern Finland, inter-preted mainly using pollen and charcoal analysis. Acta BotaniciFennici 113:1–45.
Ilkonen, L. 1995. Rate of carbon accumulation in a raised bog,southwestern Finland. Geological Survey of Finland, Special Pa-per 20, 135–137.
Ilomets, M. 1980. The determination of the age of peat layers basedon the peat bulk density method. Proceedings of the Academy ofSciences of the ESSR 29 Geology 3:121.
Irwin, T. E. 1989. Pollen percentage, concentration and influx to amire hummock and hollow. Pollen et Spores 31:317–328.
Jackson, S. T. and M. E. Lyford. 1999. Pollen dispersal models inQuaternary plant ecology: assumptions, parameters, and prescrip-tions. Botanical Reviews 65:39–75.
Jacobson, G. L. 1988. Ancient permanent plots: sampling in paleo-vegetational studies. p. 3–16. In B. Huntley and T. Webb III (eds.)Vegetation History. Kluwer Academic Publishers, Dordrecht, TheNetherlands.
Jacobson, G. L. and R. H. W. Bradshaw. 1981. The selection ofsites for paleovegetational studies. Quaternary Research 16:80–96.
Jansonius, J. and D. C. McGregor. 1996. Introduction. p. 1–10. InJ. Jansonius and D. C. McGregor (eds.) Palynology: Principlesand Applications. American Association of Stratigraphic Palynol-ogists Foundation, Volume 1. Publishers Press, Salt Lake City,UT, USA.
Janssens, C. R. 1967. A postglacial pollen diagram from a smallTypha swamp in northwestern Minnesota, interpreted from pollenindicators and surface samples. Ecological Monographs 37:145–172.
Janssens, C. R. 1973. Local and regional pollen deposition. p. 31–42. In H. J. B. Birks and R. G. West (eds.) Quaternary PlantEcology. Blackwell Scientific Publications, Oxford, England.
Jarzen, D. M. and D. J. Nichols. 1996. Pollen. p. 261–292. In J.Jansonius and D. C. McGregor (eds.) Palynology: Principles andApplications. American Association of Stratigraphic PalynologistsFoundation, Volume 1. Publishers Press, Salt Lake City, UT,USA.
Johnson, L. C. and A. W. H. Damman. 1991. Species-controlledSphagnum decay on a South Swedish raised bog. Oikos 61:234–242.
Jones, K. C., G. Sanders, S. R. Wild, V. Burnett, and A. E. Johnston.1992. Evidence for a decline of PCBs and PAHs in rural vege-tation and air in the United Kingdom. Nature 356:137–139.
Jones, M. and G. Nicholls. 2002. New radiocarbon calibration soft-ware. Radiocarbon 44:663–674.
Joshi, S. R. and R. McNeely. 1988. Detection of fallout 155Eu and207Bi in a 210Pb-dated lake sediment core. Journal of Radioanalyt-ical Nuclear Chemistry 122:183–191.
Joshi, S. R. 1989. Common analytical errors in the radiodating ofrecent sediments. Environmental Geology and Water Sciences 14:203–207.
Jungner H., E. Sonninen, G. Possnert, and K. Tolonen. 1995. Use

352 WETLANDS, Volume 24, No. 2, 2004
of bomb-produced C-14 to evaluate the amount of CO2 emanatingfrom 2 peat bogs in Finland. Radiocarbon 37:567–573.
Kemp, A., J. Williams, R. Rhodes, and M. Gregory. 1978. Impactof man’s activity on the chemical composition of the sedimentsof Lakes Superior and Huron. Water, Air, and Soil Pollution 10:381–402.
Kerby, N. W. and J. A. Raven. 1985. Transport and fixation ofinorganic carbon by marine algae. Advances in Botanical Re-search 11:71–123.
Kilian, M. R., J. van der Plicht, and B. van Geel. 1995. Dating raisedbogs: new aspects of AMS 14C wiggle matching, a reservoir effectand climatic change. Quaternary Science Reviews 14:959–966.
Kilian, M. R., B. van Geel, and J. van der Plicht. 2000. C14 AMSwiggle-matching of raised bog deposits and models of peat ac-cumulation. Quaternary Science Review 19:1011–1033.
Kim, G., N. Hussain, T. M. Church, and W. L. Carey. 1997. Thefallout isotope 207Bi in a Delaware salt marsh: a comparison with210Pb and 137Cs as a geochronological tool. The Science of theTotal Environment 196:31–41.
Kirner, D. L., R. E. Taylor, and J. R. Southon. 1995. Reduction inbackgrounds of microsamples for AMS 14C dating. Radiocarbon37:697–704.
Knox, F. B. and B. G. McFadgen. 2001. Least-squares fitting smoothcurves to decadal radiocarbon calibration data from AD1145 toAD1945. Radiocarbon 43:87–118.
Koff, R., J.-M. Punning, and M. Yli-Halla. 1998. Human impact ona paludified landscape in northern Estonia. Landscape and UrbanPlanning 41:263–272.
Kothari, B. K. and M. Wahlen. 1984. Concentration and surfacemorphology of charcoal particles in sediments of Green Lake,N.Y.: implications regarding the use of energy in the past. North-eastern Environmental Science 3:24–29.
Krishnaswami, S. and D. Lal. 1978. Radionuclide Limnochronology.p. 153–177. In A. Lerman (ed.) Lakes, Chemistry, Geology, andPhysics. Springer Verlag, New York, NY, USA.
Kromer, B., S. W. Manning, P. I. Kuniholm, M. W. Newton, M.Spurk, and I. Levin. 2001. Regional 14CO2 offsets in the tropo-sphere: magnitude, mechanisms, and consequences. Science 294:2529–2532.
Kromer, B. and K.-O. Munnich. 1992. CO2 gas proportional count-ing in radiocarbon dating—review and perspective. p. 184–197.In R. E. Taylor, A. Long, and R. S. Kra (eds.) Radiocarbon afterFour Decades: an Interdisciplinary Perspective. Springer-Verlag,New York, NY, USA.
Kromer, B., M. Spurk, S. Remmele, M. Barbetti, and V. Toniello.1998. Segments of atmospheric 14C change as derived from LateGlacial and Early Holocene floating tree-ring series. Radiocarbon40:351–358.
Kudelsky, A. V., J. T. Smith, S. V. Ovsiannikova, and J. Hilton.1996. Mobility of Chernobyl-derived 137Cs in a peatbog systemwithin the catchment of the Pripyat River, Belarus. The Scienceof the Total Environment 188:101–113.
Lappalainen, E. 1996. General review on world peatland and peatresources. p. 53–56. In E. Lappalainen (ed.) Global Peat Resourc-es. International Peat Society, Jyvaskyla, Finland.
Lee, J. A. and J. H. Tallis. 1973. Regional and historical aspects oflead pollution in Britain. Nature 245:216–218.
Levin, I., R. Bosinger, G. Bonani, R. J. Francey, B. Kromer, K. O.Munnich, M. Suter, N. B. A. Trivett, and W. Wolfli. 1992. Ra-diocarbon in atmospheric carbon dioxide and methane: global dis-tribution and trends. p. 503–518. In R. E. Taylor, A. Long, andR. S. Kra (eds.) Radiocarbon after Four Decades: an Interdisci-plinary Perspective. Springer-Verlag, New York, NY, USA.
Levin, I. and V. Hesshaimer. 2000. Radiocarbon—a unique tracerof global carbon cycle dynamics. Radiocarbon 42:69–80.
Levin, I. and B. Kromer. 1997a. Twenty years of atmospheric 14CO2
observation at Schauinsland Station, Germany. Radiocarbon 39:205–218.
Levin, I. and B. Kromer. 1997b. D14CO2 records from Schauinsland.In Trends: a Compendium of Data on Global Change. CarbonDioxide Information Analysis Centre, Oak Ridge National Labo-ratory, U.S. Department of Energy, Oak Ridge, TN, USA.
Levin, I., B. Kromer, H. Schoch-Fischer, M. Bruns, K. O. Munnich,
D. Berdau, J. C. Vogel, and K. O. Munnich. 1994. D14CO2 recordsfrom Vermunt. In Trends: a Compendium of Data on GlobalChange. Carbon Dioxide Information Analysis Centre, Oak RidgeNational Laboratory, U.S. Department of Energy, Oak Ridge,Tennessee, U.S.A.
Levin, I., J. Schuchard, B. Kromer, and K. O. Munnich. 1989. Thecontinental European Suess effect. Radiocarbon 31:431–440.
Libby, W. F. 1955. Radiocarbon Dating, 2nd ed. University of Chi-cago Press, Chicago, IL, USA.
Libby, W. F. 1963. Accuracy of radiocarbon dates. Antiquity 37:7–12.
Libby, W. F. 1979. Radiocarbon dating in the future; thirty yearsafter inception. Environment International 2:205–207.
Livens, F. R., M. T. Howe, J. D. Hemingways, K. W. T. Goulding,and B. J. Howard. 1996. Forms and rates of release of 137Cs intwo peat soils. European Journal of Soil Science 47:105–112.
Livett, E. A. 1988. Geochemical monitoring of atmospheric heavymetal pollution: theory and application. Advances in EcologicalResearch 18:65–177.
Livett, E. A., J. A. Lee, and J. H. Tallis. 1979. Lead, zinc, andcopper analyses of British blanket peats. Journal of Ecology 67:865–891.
MacDonald, G. M. 1996. Non-aquatic Quaternary. p. 879–910. In J.Jansonius and D. C. McGregor (eds.) Palynology: Principles andApplications. American Association of Stratigraphic PalynologistsFoundation, Volume 2. Publishers Press, Salt Lake City, UT,USA.
MacDonald, G. M., R. P Beukens, W. E. Kieser, and D. H. Vitt.1987. Comparative radiocarbon dating of terrestrial plant macro-fossils and aquatic moss from the ‘ice-free’ corridor of westernCanada. Geology 15:837–40.
Maher, L. J. 1981. Statistics for microfossil concentration measure-ments employing samples spiked with marker grains. Review ofPalaeobotany and Palynology 32:153–191.
Makila, M. 1997. Holocene lateral expansion, peat growth and car-bon accumulation on Haukkasua, a raised bog in southeastern Fin-land. Boreas 26:1–14.
MacKenzie, A. B., J. G. Farmer, and C. L. Sugden. 1997. Isotopicevidence of the relative retention and mobility of lead and radi-ocaesium in Scottish ombrotrophic peats. The Science of the TotalEnvironment 203:115–127.
Malmer, N., G. Svensson, and B. Wallen, 1997. Mass balance andnitrogen accumulation in hummocks on a South Swedish bog dur-ing the late Holocene. Ecography 20:535–549.
Maltby, E. and M. C. F. Proctor. 1996. Peatlands: their nature androle in the biosphere. p. 11–19. In E. Lappalainen (ed.) GlobalPeat Resources, Kukkalantie. International Peat Society, Jyvas-kyla, Finland.
Manning, M. R. and W. H. Melhuish. 1994. Atmospheric D14C re-cord from Wellington. In Trends: a Compendium of Data onGlobal Change. Carbon Dioxide Information Analysis Centre,Oak Ridge National Laboratory, U.S. Department of Energy, OakRidge, TN, U.S.A.
Manning, S. W. and B. Weninger. 1992. A light in the dark: ar-chaeological wiggle matching and the absolute chronology of theclose of the Aegean Late Bronze Age. Antiquity 66:636–663.
Manning, S. W., B. Kromer, P. I. Kuniholm, and M. W. Newton.2001. Anatolian tree-rings and a new chronology for the east Med-iterranean Bronze-Iron Ages. Science 294:2532–2535.
Masarik, J. and J. Beer. 1999. Simulation of particle fluxes andcosmogenic nuclide production in the Earth’s atmosphere. Journalof Geophysical Research 104:12099–12111.
Matthewes, J. A. 1985. Radiocarbon dating of surface and buriedsoils: principles, problems and prospects. p. 269–288. In K. S.Richards, R. R. Arnett, and S. Ellis (eds.) Geomorphology andSoils. George Allen & Unwin Ltd., London, England.
Mauquoy, D., B. van Geel, M. Blaauw, and J. van der Plicht. 2002.Evidence from northwest European bogs shows ‘Little Ice Age’climatic changes driven by variations in solar activity. The Ho-locene 12:1–6.
McAndrews, J. H. 1966. Postglacial history of prairie, savanna, andforest in northwestern Minnesota. Bulletin of the Torrey BotanicalClub 22:1–72.
Turetsky et al., DATING RECENT PEAT 353
McAndrews, J. H., A. A. Berti, and G. Norris. 1973. Key to theQuaternary pollen and spores of the Great Lakes region. Life Sci-ence Miscellaneous Publication, Royal Ontario Museum, Toronto,Ontario, Canada.
McCormac, F. G., A. G. Hogg, T. G. F. Higham, J. Lynch-Stieglitz,W. S. Broecker, M. G. L. Baillie, J. Palmer, L. Xiong, J. R. Pilch-er, D. Brown, and S. T. Hoper. 1998. Temporal variation in theinterhemispheric 14C offset. Geophysical Research Letters 25:1321–1324.
McCormac, F. G., P. J. Reimer, A. G. Hogg, T. F. G. Higham, M.G. L. Baillie, J. Palmer, and M. Stuiver. 2002. Calibration of theradiocarbon time scale for the southern hemisphere: AD 1850–950. Radiocarbon 44:641–651.
McGee, E. J., P. A. Colgan, D. E. Dawson, B. Rafferty, and C.O’Keeffe. 1992. Effects of topography on Caesium-137 in mon-tane peat soils and vegetation. Analyst 117:461–464.
Middledorp, A. A. 1982. Pollen concentration as a basis for indirectdating and quantifying net organic and fungal production in a peatbog ecosystem. Review of Palaeobotany and Palynology 37:225–282.
Middledorp, A. A. 1986. Functional palaeoecology of the Hahen-moor raised bog ecosystem—a study of vegetation, history, pro-duction, and decomposition by means of pollen density dating.Review of Palaeobotany and Palynology 49:1–73.
Mitchell, P. I., W. R. Schell, A. McGarry, T. P. Ryan, J. A. Sanchex-Cabeza, and A. Vidal-Quadras. 1992. Studies of the vertical dis-tribution of 134Cs, 137Cs, 238Pu, 239,240Pu, 241Pu, 241Am and 210Pb inombrogenous mires at mid-latitudes. Journal of Radioanalyticaland Nuclear Chemistry–Articles 156:361–387.
Mook, W. G. 1983. 14C calibration and the time-width of 14C sam-ples. p. 517–525. In W. G. Mook and H. T. Waterbolk (eds.)Proceedings of the 1st International Conference on 14C and Ar-chaeology, PACT Publication 8, Groningen, The Netherlands.
Moore, P. D., J. A. Webb, and M. E. Collinson. 1991. Pollen Anal-ysis, 2nd Edition. Blackwell Scientific Publications, Oxford, UK.
Moore, T. R., N. T. Roulet, and J. M. Waddington. 1998. Uncer-tainty in predicting the effect of climatic change on the carboncycling of Canadian peatlands. Climatic Change 40:229–245.
Morris, W. A., J. K. Versteeg, C. H. Marvin, B. E. McCarry, andN. A. Rukavina. 1994. Preliminary comparisons between mag-netic susceptibility and polycyclic aromatic hydrocarbon contentin sediments from Hamilton Harbour, western Lake Ontario. TheScience of the Total Environment 152:153–160.
Moser, R. N. 1993. A comparison of methods for the determinationof the dating nuclides 210Pb and 226Ra. Journal of Radioanalyticaland Nuclear Chemistry—Articles 173:283–292.
Neustupny, E. 1973. Absolute chronology of the Aeneolithic period.p. 243–248. In Actes du VIII congres international des sciencesprehistoriques et protohistoriques. Beograd 9–15 September 1971,II. Beograd: Comite d’Organisation.
Nevissi, A. E. 1991. Measurement of 210Pb, 210Bi, and 210Po in en-vironmental samples. Journal of Radioanalytical and NuclearChemistry—Articles 148:121–131.
Norton, S. A. 1986. Geochemistry of selected Maine peat deposits.Bulletin of the Maine Geological Survey 34:1–38.
Norton, S. A. 1987. The stratigraphic record of atmospheric loadingof metals at the ombrotrophic Big Heath Bog, Mt. Desert Island,Maine, U.S.A. p. 561–576. In T. C. Hutchinson, and K. M. Mee-ma (eds.) Effects of Atmospheric Pollutants on Forests, Wetlands,and Agricultural Ecosystems. NATO ASI Series, Vol. G16.Springer-Verlag Berlin, Heidelberg, Germany.
Norton, S. A., G. C. Evans, and J. S. Kahl. 1997. Comparison ofHg and Pb fluxes to hummocks and hollows of ombrotrophic BigHeath Bog and to nearby Sargent Mt. Pond, Maine, USA. Water,Air, and Soil Pollution 100:271–286.
Ohlson, M. and B. Dahlberg. 1991. Rate of peat increment in hum-mock and lawn communities on Swedish mires during the last150 years. Oikos 61:369–378.
Ogden, J. G. 1986. An alternative to exotic spore or pollen additionin quantitative microfossil studies. Canadian Journal of Earth Sci-ences 23:102–106.
Oldfield, F., P. G. Appleby, R. Cambray, J. Eakins, K. Barber, R.
Batterbee, G. Pearson, and J. Williams. 1979. Pb-210, Cs-137, andPu-239 profiles in ombrotrophic peat. Oikos 33:40–45.
Oldfield, F., P. R. J. Crooks, D. D. Harkness, and G. Petterson. 1997.AMS radiocarbon dating of organic fractions from varved lakesediments: and empirical test of reliability. Journal of Paleolim-nology 18:87–91.
Oldfield, F., N. Richardson, and P. G. Appleby. 1995. Radiometricdating (210Pb, 137Cs, 241Am) of recent ombrotrophic peat accumu-lation and evidence for changes in mass balance. The Holocene5:141–148.
Oldfield, F., R. Thompson, and K. Barber. 1978. Changing atmo-spheric fallout of magnetic particles recorded in recent ombro-trophic peat sections. Science 199:679–680.
Olsson, I. 1986. Radiometric dating. p. 273–312. In B. E. Berglund(ed.) Handbook of Holocene Palaeoecology and Palaeohydrology.Wiley, New York, NY, USA.
Olsson, I. 1991. Accuracy and precision in sediment chronology.Hydrobiologia 214:25–34.
Pakarinen, P. and E. Gorham. 1983. Mineral element compositionof Sphagnum fuscum peats collected from Minnesota, Manitobaand Ontario. p. 417–429. In C. H. Fuchsman and S. A. Spigarelli(eds.) Proceedings of the International Symposium on Peat Utili-zation. Bemidji State University, Bemidji, MN, USA.
Pakarinen, P. and R. J. K. Rinne. 1979. Growth rates of heavy metalconcentrations of five moss species in paludified spruce forests.Lindbergia 5:77–83.
Pakarinen, P. and K. Tolonen. 1977. On the growth rate and datingof surface peat. Suo 28:19–24.
Pakarinen, P., K. Tolonen, S. Heikkinen, and A. Nurmi. 1983. Ac-cumulation of metals in Finnish raised bogs. Environmental Bio-geochemistry 35:377–382.
Patterson, W. A. III, K. J. Edwards, and D. J. Maguire. 1987. Mi-croscopic charcoal as a fossil indicator of fire. Quaternary ScienceReviews 6:3–23.
Pearson, G. W. 1987. How to cope with calibration. Antiquity 61:98–103.
Pearson, G. W. 1986. Precise calendrical dating of known growth-period samples using a ‘curve fitting’ technique. Radiocarbon 28:292–299.
Pearson, G. W., J. R. Pilcher, and M. G. L. Baillie. 1983. Highprecision 14C measurements of Irish oaks to show the natural 14Cvariations from 200BC to 4000BC. Radiocarbon 25:179–186.
Pearson, G. W., J. R. Pilcher, M. G. L. Baillie, and J. Hillam. 1977.Absolute radiocarbon dating using a low altitude European tree-ring calibration. Nature 270:25–28.
Pennington, W., R. S. Cambray, J. D. Eakins, and D. D. Harkness.1975. Radionuclide dating of the recent sediments of BlelhamTarn. Freshwater Biology 6:317–331.
Pilcher, J. R. 1991. Radiocarbon dating for the Quaternary scientist.Quaternary Proceedings 1:27–33.
Pilcher, J. R. and V. Hall. 1996. Tephrochronological studies innorthern England. The Holocene 6:100–105.
Pilcher, J. R., V. A. Hall, and F. F. McCormac. 1996. An outlinetephrochronology for the north of Ireland. Journal of QuaternaryScience 11:485–494.
Pitkanen, A. and P. A. Huttunen. 1999. 1300-year forest-fire historyat a site in eastern Finland based on charcoal and pollen recordsin laminated lake sediment. Holocene 9:311–320.
Pitkanen, A., H. Lehtonen, and P. Huttunen. 1999. Comparison ofsedimentary microscopic charcoal particle records in a small lakewith dendrochronological data: evidence for the local origin ofmicroscopic charcoal produced by forest fires of low intensity ineastern Finland. Holocene 9:559–567.
Polach, H. A. 1984. Radiocarbon targets for AMS: a review of per-ceptions, aims and achievements. Nuclear Instruments and Meth-ods in Physics Research B5:259–264.
Prentice, I. C. 1988. Records of vegetation in time and space: theprinciples of pollen analysis. p 17–42. In B. Huntley and T. WebbIII (eds.) Vegetation History. Kluwer, The Hague, The Nether-lands.
Puchegger, S., W. Rom, and P. Steier. 2000. Automated evaluationof 14C measurements. Nuclear Instruments and Methods in PhysicsResearch B 172:274–280.
354 WETLANDS, Volume 24, No. 2, 2004
Punning, J. M. and R. Alliksaar. 1997. The trapping of fly-ash par-ticles in the surface layer of Sphagnum-dominated peat. Water,Air, and Soil Pollution 94:59–69.
Punning, J. M., M. Ilomets, and T. Koff. 1993. Possibilities for de-tailed dating of peat bog deposits. Radiocarbon 35:379–385.
Raisanen, J. 1997. Objective comparison of patterns of CO2 inducedclimate change in coupled GCM experiments. Climate Dynamics13:197–211.
Ralph, E. K. and H. N. Michael. 1974. Twenty-five years of radio-carbon dating. American Scientist 62:553–560.
Rapaport, R. A. and S. J. Eisenreich. 1986. Atmospheric depositionof toxaphene to eastern North America derived from peat accu-mulation. Atmospheric Environment 20:2367–2379.
Rapaport, R. A. and S. J. Eisenreich. 1988. Historical atmosphericinputs of high molecular weight chlorinated hydrocarbons to east-ern North America. Environmental Science and Technology 22:931–941.
Reimer, P. J., K. A. Hughen, T. P. Guilderson, G. McCormac, M.G. L. Baillie, E. Bard, P. Barratt, J. W. Beck, C. E. Buck, P. E.Damon, M. Friedrich, B. Kromer, C. Bronk Ramsey, R. W. Rei-mer, S. Remmele, J. R. Southon, M. Stuiver, and J. van der Plicht.2002. Preliminary report of the first workshop of the IntCal04Radiocarbon Calibration/Comparison Working Group. Radiocar-bon 44:653–661.
Robbins, J. A. 1978. Geochemical and geophysical applications ofradioactive lead. p. 285–393. In J. O. Nriagu (ed.) Biogeochem-istry of Lead in the Environment. Elsevier Scientific, Amsterdam,The Netherlands.
Robinson, D. 1984. The estimation of the charcoal content of sedi-ment: a comparison of methods on peat sections from the Islandof Arran. Circaea 2:121–128.
Robinson, S. D. and T. R. Moore. 1999. Carbon and peat accumu-lation over the past 1200 years in a landscape with discontinuouspermafrost, northwestern Canada. Global Biogeochemical Cycles13:591–601.
Rose, N. L. 1990. An extraction method for carbonaceous particlesfrom lake sediments. Journal of Paleolimnology 3:45–53.
Rose, N. L., S. Harlock, P. G. Appleby, and R. W. Battarbee. 1995.Dating of recent lake-sediments in the United Kingdom and Ire-land using spheroidal carbonaceous particle (SCP) concentrationprofiles. The Holocene 5:328–335.
Rosen, H., T. Novakov, and B. A. Bodhaine. 1981. Soot in thearctic. Atmospheric Environment 15:1371–1374.
Rowell, K. T. and J. Turner. 1985. Litho-, humic- and pollen stra-tigraphy at Quick Moss, Northumberland. Journal of Ecology 73:11–25.
Rowley, J. R. and J. Rowley. 1956. Vertical migration of sphericaland aspherical pollen in a Sphagnum bog. Proceedings of the Min-nesota Academy of Science 24:29–30.
Rubin, S. and M. D. Kamen. 1941. Long-lived radioactive carbon:14C. Physical Review 59:349–354.
Rummery, T. A., J. Bloemendal, J. Dearing, F. Oldfield, and R.Thompson. 1979. The persistence of fire-induced magnetic oxidesin soils and lake sediments. Annals of Geophysics 35:103–107.
Sanders, G., S. J. Eisenreich, and K. C. Jones. 1994. The rise andfall of PCBs: Time-trend data from temperate industrialized coun-tries. Chemosphere 29:2201–2208.
Sanders, G., K. C. Jones, and J. Hamilton-Taylor. 1995. PCB andPAH fluxes to a dated UK peat core. Environmental Pollution 89:17–25.
Sanders, G., K. C. Jones, J. Hamilton-Taylor, and H. Dorr. 1992.Historical inputs of polychlorinated biphenyls and other organo-chlorines to a dated lacustrine sediment core in rural England.Environmental Science and Technology 26:1815–1821.
Sanders, G., K. C. Jones, J. Hamilton-Taylor and H. Dorr. 1993.Concentrations and deposition fluxes of polynuclear aromatic hy-drocarbons and heavy metals in the dated sediments of a ruralEnglish lake. Environmental Toxicology and Chemistry 12:1567–1581.
Sapozhnikov, Y. A., O. B. Egorov, I. P. Efimov, S. V. Pirogova,and N. K. Kutseva. 1993. Determination of 210Pb in bottom sedi-ments via 210Bi. Journal of Radioanalytical and Nuclear Chemis-try—Letters 176:353–359.
Sarmaja-Korjonen, K. 1991. Comparison of two methods of count-ing microscopic charcoal particles in peat. Bulletin of the Geo-logical Society of Finland, 63, Part 1: 41–48.
Scharpenseel, H. W. 1971. Radiocarbon dating of soils. Soviet SoilScience 3:76–83.
Scharpenseel, H. W. and H. Schiffmann. 1977. Radiocarbon datingof soils, a review. Zeitschrift fur Pflanzenernahrung Dungung undBodenkunde 140:159–174.
Schell, W. R. 1986. Deposited atmospheric chemicals: a mountain-top peat bog in Pennsylvania provides a record dating to 1800.Environmental Science Technology 20:847–853.
Schell, W. R. 1987. A historical perspective of atmospheric chem-icals deposited on a mountain top peat bog in Pennsylvania. In-ternational Journal of Coal Geology 8:147–173.
Schell, W. R., A. L. Sanchez, and C. Granlund. 1986. New datafrom peat bogs may give a historical perspective on acid deposi-tion. Water, Air, and Soil Pollution 30:393–409.
Schell, W. R. and M. Tobin. 1994. 210Pb dating using the CRS-MVmodel with historical data to test and evaluate accuracy. p. 355–368. In M. Garcia-Leon and R. Garcia-Tenorio (eds.) Low-LevelMeasurements of Radioactivity in the Environment. Proceedingsof the Third International Summer School, World Scientific Pub-lishing Company, Huelva, Spain.
Schell, W. R., M. J. Tobin, and C. D. Massey. 1989. Evaluation oftrace metal deposition history and potential element mobility inselected cores from peat and wetland ecosystems. The Science ofthe Total Environment 87/88:19–42.
Schell, W. R., M. J. Tobin, M. J. V. Novak, R. K. Wieder, and P.I. Mitchell. 1997. Deposition history of trace metals and falloutradionuclides in wetland ecosystems using 210Pb chronology. Wa-ter, Air, and Soil Pollution 100:233–239.
Schelske, C. L., A. Peplow, M. Brenner, and C. N. Spencer. 1994.Low-background gamma counting: applications for 210Pb-dating ofsediments. Journal of Paleolimnology 10:115–128.
Schelske, C. L., J. A. Robbins, W. D. Gardner, D. J. Conley, andR. A. Bourbonniere. 1988. Sediment record of biogeochemicalresponses to anthropogenic perturbations of nutrient cycles inLake Ontario. Canadian Journal of Fisheries and Aquatic Sciences45:1291–1303.
Schultze, E. D., A. Prokuschkin, A. Arneth, N. Knorre, and E. A.Vaganov. 2002. Net ecosystem productivity and peat accumula-tion in a Siberian Aapa mire. Tellus B 54:531–536.
Shand, C. A., M. V. Cheshire, S. Smith, M. Vidal, and G. Rauret.1994. Distribution of radiocaesium in organic soils. Journal ofEnvironmental Radioactivity 23:285–302.
Shore, J. S., D. D. Bartley, and D. D. Harkness. 1995. Problemsencountered with the C-14 dating of peat. Quaternary Science Re-views 14:373–383.
Shotyk, W., A. K. Cheburkin, P. G. Appleby, A. Fankhauser, andJ. D. Kramers. 1997a. Lead in three peat bog profiles, Jura Moun-tains, Switzerland: enrichment factors, isotopic composition, andchronology of atmospheric deposition. Water, Air, and Soil Pol-lution 100:297–310.
Shotyk, W., S. A. Norton, and J. G. Farmer. 1997b. Summary ofthe workshop on peat bog archives of atmospheric metal deposi-tion. Water, Air, and Soil Pollution 100:213–219.
Shotyk, W., D. Weiss, P. G. Appleby, A. K. Cherburkin, R. Frei,M. Gloor, J. D. Kramers, S. Reese, and W. O. van der Knaap.1998. History of atmospheric lead deposition since 12,370 14C yrBP from a peat bog, Jura Mountains, Switzerland. Science 281:1635–1640.
Shukla, B. S. and S. R. Joshi. 1989. Evaluation of the CIC modelof 210Pb dating of sediments. Environmental Geology and WaterSciences 14:73–76.
Simonich, S. L. and R. A. Hites. 1995. Global distribution of per-sistent organochlorine compounds. Science 269:1851–1854.
Smith, J. T., P. G. Appleby, J. Hilton, and N. Richardson. 1997.Inventories and fluxes of 210Pb, 137Cs and 241Am determined fromthe soils of three small catchments in Cumbria, UK. Journal ofEnvironmental Radioactivity 37:127–142.
Spearing, A. M. 1972. Cation-exchange capacity and galacturonicacid content of several species of Sphagnum in Sandy Ridge Bog,central New York State. The Bryologist 75:154–158.

Turetsky et al., DATING RECENT PEAT 355
Stockmarr, J. 1971. Calcium tablets with spores used in absolutepollen analysis. Pollen et Spores 13:615–621.
Stout, J. D., K. M. Goh, and T. A. Rafter. 1981. Chemistry andturnover of naturally occuring resistant organic compounds in soil.p. 1–73. In E. A. Paul and J. N. Ladd (eds.). Soil Biochemistry,vol. 5. Marcel-Dekker, New York, NY, USA.
Stuiver, M. 1982. A high-precision calibration of the AD radiocar-bon time scale. Radiocarbon 24:1–26.
Stuiver, M. and T. F. Braziunas. 1993. Sun, ocean, climate and at-mospheric 14CO2: an evaluation of causal and spectral relation-ships. The Holocene 3:289–305.
Stuiver, M. and T. F. Braziunas. 1998. Anthropogenic and solarcomponents of hemispheric 14C. Geophysical Research Letters 25:329–32.
Stuiver, M., T. F. Braziunas, B. Becker, and B. Kromer. 1991. Cli-matic, solar, oceanic, and geomagnetic influences on late-glacialand Holocene atmospheric 14C/12C change. Quaternary Research35:1–24.
Stuiver, M. and G. W. Pearson. 1986. High precision calibration ofthe radiocarbon time scale, AD 1950–500 B.C. Radiocarbon 28:805–838.
Stuiver, M. and H. Polach. 1977. Reporting of 14C data. Radiocarbon19:355–363.
Stuiver, M. and P. J. Reimer. 1986. A computer program for radio-carbon age calibration. Radiocarbon 28:1022–1030.
Stuiver, M. and P. J. Reimer. 1993. Extended 14C database and re-vised CALIB radiocarbon calibration program. Radiocarbon 35:215–230.
Stuiver, M., P. J. Reimer, E. Bard, J. W. Beck, G. S. Burr, K. A.Hughen, B. Kromer, G. McCormac, J. van der Plicht, and M.Spurk. 1998a. INTCAL98 radiocarbon age calibration, 24,000–0cal BP. Radiocarbon 40:1041–1083.
Stuiver, M., P. J. Reimer, and T. F. Braziunas. 1998b. High-preci-sion radiocarbon age calibration for terrestrial and marine samples.Radiocarbon 40:1127–1151.
Suess, H. E. 1965. Secular variations of the cosmic-ray-producedcarbon 14 in the atmosphere and their interpretations. Journal ofGeophysical Research 70:5937–5952.
Tallis, J. H. 1975. Tree remains in southern Pennine peats. Nature256:482–484.
Taylor, R. E. 1987. Radiocarbon Dating: an Archaeological Per-spective. Academic Press, Orlando, FL, USA.
Taylor, R. E. 1997. Radiocarbon dating. p. 65–96. In R. E. Taylorand M. J. Aitken (eds.) Chronometric Dating in Archaeology. Ple-num Press, New York, NY, USA.
Taylor, R. E. 2000. Fifty years of radiocarbon dating. AmericanScientist 88:60–67.
Taylor, R. E., A. Long, and R. Kra (eds.). 1992. Radiocarbon afterFour Decades: an Interdisciplinary Perspective. Springer Verlag,New York, NY, USA.
Thompson, R. 1980. Use of the word ‘‘influx’’ in palaeolimnolog-ical studies. Quaternary Research 14:269–270.
Thompson, R. and F. Oldfield. 1986. Environmental Magnetism. Al-len & Unwin, London, UK.
Tinner, W. and F. S. Hu. 2003. Size parameters, size-class distri-bution and area-number relationship of microscopic charcoal: rel-evance for fire reconstruction. The Holocene 13:291–296.
Tobin, M. J. and W. R. Schell. 1988. Recent developments in sed-imentation modeling and the statistical reliability of the 210Pbmethod. Paper presented at the Trace Metals in Lakes Conference,McMaster University, Ontario, Canada.
Tolonen, K. 1983. The post-glacial fire record. p. 21–44. In R. W.Wein and D. A. MacLean (eds.) The Role of Fire in NorthernCircumpolar Ecosystems. John Wiley and Sons, Chichester, UK.
Tolonen, K., P. Goran, J. Hogne, S. Eloni, and A. Jukka. 1993. Highresolution carbon-14 of surface peat using the AMS technique.Suo 43:271–275.
Tolonen, K., R. Haapalahti, and J. Suksi. 1990. Comparison of varvedated soot ball chronology and lead-210 dating in Finland. Geo-logical Survey of Finland, Special Paper 14:65–75.
Tolonen, K., A. Siiriainen, and R. Thompson. 1975. Prehistoric fielderosion sediment in Lake Lojarvi in S. Finland and its palaeo-magnetic dating. Annales Botanici Fennici 12:161–164.
Tolonen, M. 1985a. Palaeoecology of annually laminated sedimentsin Lake Ahvenainen, South Finland. Part II. Comparison of datingmethods. Annales Botanici Fennici 15:209–222.
Tolonen, M. 1985b. Palaeoecological record of local fire historyfrom a peat deposit in SW Finland. Annales Botanici Fennici 22:15–29.
Tolonen, M. 1985c. Palaeoecological reconstruction of vegetation ina prehistoric settlement area, Salo, SW Finland. Annales BotaniciFennici 22:101–116.
Tolonen, M. 1978. Palaeoecology of annually laminated sedimentsin Lake Ahvenainen, S. Finland. I. Pollen and charcoal analysisand their relation to human impact. Annales Botanici Fennici 15:177–208.
Tornqvist, T. E., A. F. M. De Jong, W. A. Oosterbaan, and K. VanDer Borg. 1992. Accurate dating of organic deposits by AMS 14Cmeasurement of macrofossils. Radiocarbon 34:566–577.
Truman, H. V. 1937. Fossil evidence of two prairie invasions ofWisconsin. Transactions of the Wisconsin Academy of Sciences,Arts, and Letters 30:35–42.
Trumbore, S. E. and J. W. Harden. 1997. Accumulation and turnoverof carbon in organic and mineral soils of the BOREAS northernstudy area. Journal of Geophysical Research 102:28817–28830.
Turetsky, M. R., R. K. Wieder, C. J. Williams, and D. H. Vitt. 2000.Organic matter accumulation, peat chemistry and permafrost melt-ing in peatlands of boreal Alberta. Ecoscience 7:379–392.
Turner, J. and S. M. Peglar. 1988. Temporally-precise studies ofvegetation history. p. 754–777. In B. Huntley and T. Webb III(eds.) Vegetation History. Kluwer Academic Publishers, Dor-drecht, The Netherlands.
United States Environmental Protection Agency. 1975. DDT, a re-view of scientific and economic aspects of the decision to ban itsuse as a pesticide. U.S. Environmental Protection Agency, Officeof Pesticide Programs, U.S. Government Printing Office, Wash-ington, DC, USA. EPA-540/1–75–022.
Urban, N. R., S. J. Eisenreich, and D. F. Grigal. 1989. Sulfur cyclingin a forested Sphagnum bog in northern Minnesota. Biogeochem-istry 7:81–109.
Urban, N. R., S. J. Eisenreich, D. F. Grigal, and K. T. Schurr. 1990.Mobility and diagenesis of Pb and Pb-210 in peat. Geochimica etCosmochimica Acta 54:3329–3346.
Valentine, D. W., E. A. Holland, and D. S. Schimel. 1994. Ecosys-tem and physiological controls over methane production in north-ern wetlands. Journal of Geophysical Research 99:1563–1571.
van der Knaap, W. O. and B. Ammann. 1997. Depth- age relation-ships of 25 well-dated Swiss Holocene pollen sequences archivedin the alpine palynological data-base. Revue Paleobiology 16:433–480.
van der Plicht, J. 1993. The Groningen radiocarbon calibration pro-gram. Radiocarbon 35:231–237. Available from: http://www.cio.phys.rug.nl/HTML-docs/carbon14/cal25.html
van der Plicht, J. (ed.). 2000. Introduction. Special varves/compari-son issue. Radiocarbon 42:313–322.
van der Plicht, J., E. Jansma, and H. Kars. 1995. The ‘‘AmsterdamCastle’’: a case study of wiggle-matching and the proper calibra-tion curve. Radiocarbon 37:965–968.
van Geel, B. and W. G. Mook. 1989. High-resolution 14C dating oforganic deposits using natural atmospheric 14C variations. Radio-carbon 31:151–155.
van Geel, B., J. van der Plicht, M. R. Kilian, E. R. Klaver, J. H. MKouwenberg, H. Renssen, I. Reynaud-Farrera, and H. T. Water-bolk. 1998. The sharp rise of d14C ca. 800 cal BC: possible causes,related climatic teleconnections and the impact on human envi-ronments. Radiocarbon 40:535–550.
Van Metre, P. C., E. Callender, and C. C. Fuller. 1997. Historicaltrends in organochlorine compounds in river basins identified us-ing sediment cores from reservoirs. Environmental Science andTechnology 31:2339–2344.
van Zant, K. L., T. Webb III, G. M. Peterson, and R. G. Baker.1979. Increased Cannabis/Humulus pollen, an indicator of Euro-pean agriculture in Iowa. Palynology 3:227–233.
Vile, M. A., M. J. V. Novak, E. Brızova, R. K. Wieder, and W. R.Schell. 1995. Historical rates of atmospheric Pb deposition using
356 WETLANDS, Volume 24, No. 2, 2004
210Pb dated peat cores: corroboration, computation, and interpre-tation. Water, Air, and Soil Pollution 79:89–106.
Vile, M. A., R. K. Wieder, and M. Novak. 1999. Mobility of Pb inSphagnum-derived peat. Biogeochemistry 45:35–52.
Vile, M. A., R. K. Wieder, and M. Novak. 2000. 200 years of Pbdeposition throughout the Czech Republic: patterns and sources.Environmental Science and Technology 34 :12–21.
Vitt, D. H. 1990. Growth and production dynamics of boreal mossesover climatic, chemical, and topographical gradients. BotanicalJournal of the Linnean Society 104:35–59.
Vitt, D. H. and P. Pakarinen. 1977. The bryophyte vegetation, pro-duction, and organic components of Truelove Lowland. p. 225–244. In L. C. Bliss (ed.) Truelove Lowland, Devon Island, Canada:a High Arctic Ecosystem. The University of Alberta Press, Ed-monton, Alberta, Canada.
Vogel J. S., D. E. Nelson, and J. R. Southon. 1987. C-14 backgroundlevels in an accelerator mass spectrometry system. Radiocarbon.29:323–329.
von Gunten, H. R. 1995. Radioactivity—a tool to explore the past.Radiochimica Acta 70:305–316.
Vorren, K.-D. and B. Vorren. 1976. The problem of dating a palsa.Two attempts involving pollen diagrams, determination of mosssubfossils, and C14-datings. Astarte 8:73–81.
Waddington, J. C. B. 1969. A stratigraphic record of the polleninflux to a lake in the Big Woods of Minnesota. Geological So-ciety of America, Special Paper 123:263–283.
Wahlen, M. 1993. The global methane cycle. Annual Reviews inEarth and Planetary Science 21:407–426.
Walling, D. and Q. He. 1993. Towards improved interpretation of137Cs Profiles in lake sediments. p. 31–53. In J. McManus and R.Duck (eds.) Geomorphology and Sedimentology of Lakes andReservoirs. John Wiley and Sons, Ltd., New York, NY, USA.
Wania, F. 1999. On the origin of elevated levels of persistent chem-icals in the environment. Environmental Science and PollutionResearch 6:11–19.
Wania, F. and D. Mackay. 1999. The evolution of mass balancemodels of persistent organic pollutant fate in the environment.Environmental Pollution 100:223–240.
Webb, T. III. 1973. A comparison of modern and presettlement pol-len from southern Michigan. Review of Palaeobotany and Paly-nology 16:137–156.
Weiss, D., W. Shotyk, A. K. Cheburkin, M. Gloor, and S. Reese.1997. Atmospheric lead deposition from 12,400 to ca. 2,000 yrsBP in a peat bog profile, Jura Mountains, Switzerland. Water, Air,and Soil Pollution 100:311–324.
Weninger, B. and O. Joris. 2001. Manual ,Calpal., Program Ver-sion May 2001: Glacial Radiocarbon Conversion 0–50 Ka. Soft-ware available from: http://www.calpal.de/
Wershaw, R. L., M. J. Fishman, R. R. Grabbe, and L. E. Lowe (eds.).
1987. Techniques of Water-Resources Investigations, Book 5,U.S. Geological Survey, Denver, CO, USA.
West, S., D. J. Charman, J. P. Grattan, and A. K. Cherburkin. 1997.Heavy metals in Holocene peats from southwest England: De-tecting mining impacts and atmospheric pollution. Water, Air, andSoil Pollution 100:343–353.
Wickstrom, K. and K. Tolonen. 1987. The history of airborne poly-cyclic aromatic hydrocarbons (PAH) and Perylene as recorded indated lake sediments. Water, Air, and Soil Pollution 32:155–175.
Wieder, R. K. 2001. Past, present and future peatland carbon bal-ance—an empirical model based on 210Pb-dated cores. EcologicalApplications 7:321–336.
Wieder, R. K. 1990. Metal cation binding to Sphagnum peat andsawdust: relation to wetland treatment of metal-polluted waters.Water, Air, and Soil Pollution 53:391–400.
Wieder, R. K., M. Novak, W. R. Schell, and T. Rhodes. 1994. Ratesof peat accumulation over the past 200 years in five Sphagnum-dominated peatlands in the United States. Journal of Paleolim-nology 12:35–47.
Wigley, T. M. L. and A. B. Muller. 1981. Fractionation correctionsin radiocarbon dating. Radiocarbon 23:173–190.
Wik, M. and I. Renberg. 1996. Environmental reviews of carbona-ceous fly-ash particles from fossil fuel combusion: a summary.Journal of Paleolimnology 15:193–206.
Wik, M., I. Renberg, and J. Darley. 1986. Sedimentary records ofcarbonaceous particles from fossil fuel combustion. Hydrobiologia143:387–394.
Williams, M. 1992. Evidence for the dissolution of magnetite inrecent Scottish peats. Quaternary Research 37:171–182.
Winkler, M. 1985. Charcoal analysis for paleoenvironmental inter-pretation: a chemical assay. Quaternary Research 23:313–326.
Wood, G. D., A. M. Gabriel, and J. C. Lawson. 1996. Palynologicaltechniques—processing and microscopy. p. 29–50. In J. Jansoniusand D. C. McGregor (eds.) Palynology: Principles and Applica-tions. American Association of Stratigraphic Palynologists Foun-dation, Volume 1. Publishers Press, Salt Lake City, UT, USA.
Yavitt, J. B. and G. E. Lang. 1990. Methane production in contrast-ing wetland sites: response to organo-chemical components ofpeat and to sulfate reduction. Geomicrobiology Journal 8:27–46.
Yrjanheikki, E., J. H. Rantanen, V. Silano, and S. Tarkowski (eds.).1987. PCBs, PCDDs, and PCDFs: Prevention and control of ac-cidental and environmental exposures. WHO, Copenhagen, Den-mark.
Zoltai, S. C. 1991. Estimating the age of peat samples from theirweight: a study from west-central Canada. The Holocene 1:68–73.
Zoltai, S. C. and P. J. Martikainen. 1996. The role of forested peat-lands in the global carbon cycle. NATO ASI Series I, 40:47–58.
Manuscript received 7 February 2003; revisions received 17 Novem-ber 2003 and 12 January 2004; accepted 29 February 2004.


