Embed Size (px)
Citation preview
Computers and Electrical Engineering 39 (2013) 1433–1450
Contents lists available at SciVerse ScienceDirect
Computers and Electrical Engineering
journal homepage: www.elsevier .com/ locate/compeleceng
Data weighing mechanisms for clustering ensembles q
0045-7906/$ - see front matter � 2013 Elsevier Ltd. All rights reserved.http://dx.doi.org/10.1016/j.compeleceng.2013.02.004
q Reviews processed and approved for publication by Editor-in-Chief Dr. Manu Malek.⇑ Corresponding authors.
E-mail addresses: [email protected] (H. Parvin), [email protected] (B. Minaei-Bidgoli), [email protected] (H. Alinejad-Rokny).
Hamid Parvin a,⇑, Behrouz Minaei-Bidgoli a,⇑, Hamid Alinejad-Rokny b,c,⇑, William F. Punch d
a Department of Computer Engineering, Iran University of Science and Technology, Narmak, Tehran, Iranb Complex Systems in Biology Group, Centre for Vascular Research, Faculty of Medicine, The University of New South Wales, Sydney, NSW, Australiac School of Computer Science and Engineering, The University of New South Wales, Sydney, NSW, Australiad Department of Computer Science & Engineering, Michigan State University, Engineering Building, East Lansing, USA
a r t i c l e i n f o
Article history:Received 25 May 2011Received in revised form 3 February 2013Accepted 5 February 2013Available online 16 May 2013
a b s t r a c t
Inspired by bagging and boosting algorithms in classification, the non-weighing andweighing-based sampling approaches for clustering are proposed and studied in the paper.The effectiveness of non-weighing-based sampling technique, comparing the efficacy ofsampling with and without replacement, in conjunction with several consensus algorithmshave been invested in this paper. Experimental results have shown improved stability andaccuracy for clustering structures obtained via bootstrapping, subsampling, and boostingtechniques. Subsamples of small size can reduce the computational cost and measurementcomplexity for many unsupervised data mining tasks with distributed sources of data. Thisempirical research study also compares the performance of boosting and bagging cluster-ing ensembles using different consensus functions on a number of datasets.
� 2013 Elsevier Ltd. All rights reserved.
1. Introduction
While some efforts have explored for a perfect solution to the clustering [1], some others search for methods with robustsolutions. Inspired by the classifier ensemble, data clustering can benefit significantly from combining multiple data partit-ionings. Clustering ensembles combine multiple partitionings of data into a better single clustering named consensuspartitioning. They give better solutions in terms of robustness, novelty and stability [2–4]. Moreover, some of their non-weighing versions are suitable for parallelisation and distributed data mining. Yet, achieving stability and constancy inthe combination of multiple clusterings has faced many difficulties.
The clustering ensembles are more difficult than the classifier ensembles [5–9]. Due to the lack of labeled training data,this study faces a difficult correspondence problem between cluster labels in different partitionings of an ensemble. As diver-sity in base classifier outputs is a necessary precondition for a classifier ensemble to be successful, it is also usual to expectthat in clustering ensemble approaches the diversity is vital. Parvin et al. proposed [6] a new way for generating diversity inclassifiers called Classifier Combination with Heuristic Retraining (CCHR). CCHR stresses on crucial and the boundary pointsduring the training phase. Topchy et al. [10] have showed clustering ensemble can obtained outside of voting-type situationsusing graph-based, statistical or information-theoretic methods without explicitly solving the label correspondence prob-lem. Other empirical consensus functions have been also considered in [11–13]. However, the problem of consensus cluster-ing is known to be NP complete [14]. Evaluation of a clustering algorithm can be computed by matching final outputs(partitioning) of that algorithm and external desired outputs [15,16].
Clustering ensembles need a partitioning generation procedure, too. There are several methods that can be used to createbase partitionings for clustering ensembles. For example, one can use:
1434 H. Parvin et al. / Computers and Electrical Engineering 39 (2013) 1433–1450
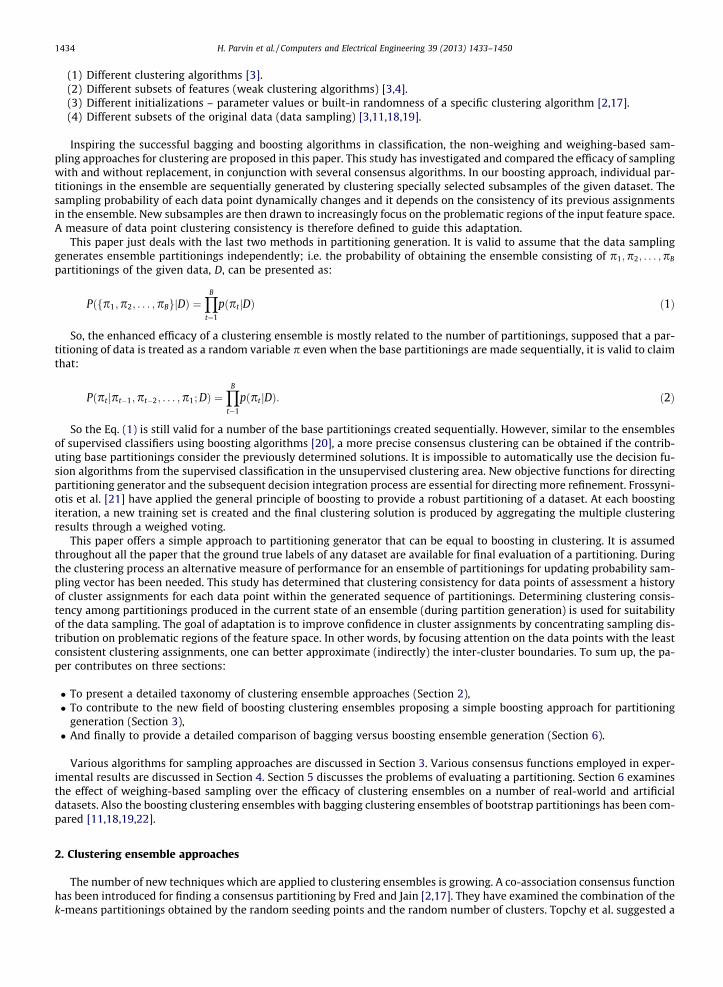
(1) Different clustering algorithms [3].(2) Different subsets of features (weak clustering algorithms) [3,4].(3) Different initializations – parameter values or built-in randomness of a specific clustering algorithm [2,17].(4) Different subsets of the original data (data sampling) [3,11,18,19].
Inspiring the successful bagging and boosting algorithms in classification, the non-weighing and weighing-based sam-pling approaches for clustering are proposed in this paper. This study has investigated and compared the efficacy of samplingwith and without replacement, in conjunction with several consensus algorithms. In our boosting approach, individual par-titionings in the ensemble are sequentially generated by clustering specially selected subsamples of the given dataset. Thesampling probability of each data point dynamically changes and it depends on the consistency of its previous assignmentsin the ensemble. New subsamples are then drawn to increasingly focus on the problematic regions of the input feature space.A measure of data point clustering consistency is therefore defined to guide this adaptation.
This paper just deals with the last two methods in partitioning generation. It is valid to assume that the data samplinggenerates ensemble partitionings independently; i.e. the probability of obtaining the ensemble consisting of p1;p2; . . . ;pB
partitionings of the given data, D, can be presented as:
Pðfp1;p2; . . . ;pBgjDÞ ¼YB
t¼1
pðptjDÞ ð1Þ
So, the enhanced efficacy of a clustering ensemble is mostly related to the number of partitionings, supposed that a par-titioning of data is treated as a random variable p even when the base partitionings are made sequentially, it is valid to claimthat:
Pðpt jpt�1;pt�2; . . . ;p1; DÞ ¼YB
t�1
pðpt jDÞ: ð2Þ
So the Eq. (1) is still valid for a number of the base partitionings created sequentially. However, similar to the ensemblesof supervised classifiers using boosting algorithms [20], a more precise consensus clustering can be obtained if the contrib-uting base partitionings consider the previously determined solutions. It is impossible to automatically use the decision fu-sion algorithms from the supervised classification in the unsupervised clustering area. New objective functions for directingpartitioning generator and the subsequent decision integration process are essential for directing more refinement. Frossyni-otis et al. [21] have applied the general principle of boosting to provide a robust partitioning of a dataset. At each boostingiteration, a new training set is created and the final clustering solution is produced by aggregating the multiple clusteringresults through a weighed voting.
This paper offers a simple approach to partitioning generator that can be equal to boosting in clustering. It is assumedthroughout all the paper that the ground true labels of any dataset are available for final evaluation of a partitioning. Duringthe clustering process an alternative measure of performance for an ensemble of partitionings for updating probability sam-pling vector has been needed. This study has determined that clustering consistency for data points of assessment a historyof cluster assignments for each data point within the generated sequence of partitionings. Determining clustering consis-tency among partitionings produced in the current state of an ensemble (during partition generation) is used for suitabilityof the data sampling. The goal of adaptation is to improve confidence in cluster assignments by concentrating sampling dis-tribution on problematic regions of the feature space. In other words, by focusing attention on the data points with the leastconsistent clustering assignments, one can better approximate (indirectly) the inter-cluster boundaries. To sum up, the pa-per contributes on three sections:
� To present a detailed taxonomy of clustering ensemble approaches (Section 2),� To contribute to the new field of boosting clustering ensembles proposing a simple boosting approach for partitioning
generation (Section 3),� And finally to provide a detailed comparison of bagging versus boosting ensemble generation (Section 6).
Various algorithms for sampling approaches are discussed in Section 3. Various consensus functions employed in exper-imental results are discussed in Section 4. Section 5 discusses the problems of evaluating a partitioning. Section 6 examinesthe effect of weighing-based sampling over the efficacy of clustering ensembles on a number of real-world and artificialdatasets. Also the boosting clustering ensembles with bagging clustering ensembles of bootstrap partitionings has been com-pared [11,18,19,22].
2. Clustering ensemble approaches
The number of new techniques which are applied to clustering ensembles is growing. A co-association consensus functionhas been introduced for finding a consensus partitioning by Fred and Jain [2,17]. They have examined the combination of thek-means partitionings obtained by the random seeding points and the random number of clusters. Topchy et al. suggested a
H. Parvin et al. / Computers and Electrical Engineering 39 (2013) 1433–1450 1435
number of consensus functions connected to intra-class variance criteria and by using some weak partitionings [4,10]. Liketheir detailed study, hyper-graph based algorithms for finding consensus partitionings and their object-distributed and fea-ture-distributed formulations have been proposed by Strehl and Ghosh [3].
It has been shown that sampling approaches are capable of revealing data statistics. Efron generalized the concept of so-called ‘‘pseudo-samples’’ to sampling with replacement – the bootstrap method [23]. Sampling approaches like bagging havebeen used in the context of classification for many years [24]. Jain and Moreau have applied bootstrapping in cluster analysisto determinate the number of real clusters in a multi-dimensional dataset and also for evaluating cluster validity [25]. A de-gree of consistency between two clusters is explained by Levine and Domany [26]. Data sampling has been also widely ap-plied to assess the clustering validity [11,27] and its reliability [13,28].
Fig. 1 depicts classification of various consensus functions for clustering ensembles. The classification also contains solu-tions to the generative approaches. Details of the algorithms can be found in the listed references in Fig. 2.
It is an out-of-reach goal in clustering research to design a scalable and efficient algorithm for large datasets [38]. A solu-tion to scaling problem in clustering research is its parallelization [39–41]. Distributed data clustering concerns with thecombination of partitionings from many data subsets (usually disjoint). Here, among the generative approaches based ona single algorithm, ‘‘the different subsets of objects’’ (especially sampling method) will be investigated in details.
3. Sampling
3.1. Bagging sampling approach
The samples taken by both bootstrap (sampling with replacement) and subsampling (sampling without replacement) areindependent. This study wants to create a set of different samplings so as to reach a set of diverse partitionings. The key ideaof the approach is to integrate multiple partitionings produced by clustering of pseudo-samples of a dataset.
Clustering ensemble can be formulated as below. Let D be a dataset of N data points in d-dimensional space. The inputdata can be represented as a N � d pattern matrix or N � N dissimilarity matrix. Suppose that X = {X1, . . ., XB}is a set of B boot-strap pseudo-samples of size S < N. A chosen clustering algorithm is run on each of the pseudo-samples in X, which results in
Fig. 1. Taxonomy of different approaches to clustering combination, left side: different approaches to obtain the diversity in clustering; right side: differentconsensus functions to find the clustering ensembles.

Fig. 2. Different approaches to clustering combination. (See above-mentioned references for further information.)
1436 H. Parvin et al. / Computers and Electrical Engineering 39 (2013) 1433–1450
B base partitioningsQ
= {p1, p2, . . ., pB} Each component partitioning inQ
is a set of non-overlapping and exhaustive clusterswith pi ¼ fCi
1;Ci2; . . . ;Ci
kðiÞg;Xi ¼ Ci1 [ . . . [ Ci
kðiÞ;8pi, where k(i) is the number of clusters in the ith partitioning.The problem of combining partitionings is to find a new partitioning r = {C1, . . ., pM} of the entire dataset D given the par-
titionings inQ
, such that the data points in any cluster of r are more similar to each other than to points in different clusterswithin r. This study has assumed that the number of clusters, M, in the consensus clustering is predefined. In order to findthe target partitioning r, one needs a consensus function utilizing information from the partitionings fpig. Several knownconsensus functions [3,4,17] can be employed to map a given set of partitionings
Q= {p1, p2, . . ., pB} to the target partition-
ing, r, in our study.
3.2. Boosting sampling approach
Although there are many methods to construct diverse data partitionings for an ensemble, none of them use boostingconcept. By data samplings, partitionings in an adaptive approach can be generated [22] as described for supervised classi-fication [11,13,19,29]. The authors believed that any clustering ensemble method proposed so far can be boosted. The boost-ing partitioning generation mechanism that is based on Breiman [20,24] reduces the variance of inter-class decisionboundaries. In the boosting sampling approach, the points near to boundary gradually are sampled more frequently.
This study can’t claim that boosting sampling certainly increases the performance of clustering task, but it can be said thatit generates more diverse partitionings than previous bagging sampling. According to Frossyniotis et al. [21], the more di-verse the components existing in the ensembles, the more accurate the ensembles.

H. Parvin et al. / Computers and Electrical Engineering 39 (2013) 1433–1450 1437
3.3. Sampling algorithms
In each sampling algorithm, a sampling vector has been used. Any element of this vector is a function of the weigh vector.At the beginning, all the data points have the same weighs, means that the sampling probability pi ¼ 1
N ; i 2 ½1; . . . ;N�. Themain contribution that the boosting clustering ensemble reduces the clustering error is because of the sampling variationthat causes inaccurate inter-cluster boundaries.
In the design of bagging sampling approach, there are two methods to deal with the sampling: bootstrap and subsam-pling. While the sampling probabilities are kept fixed in the bootstrap, the sampling probabilities of the selected samplesare ignored in the subsampling. The pseudo code of bagging sampling methods is depicted in Fig. 3. Note that the pseudocode depicted in Fig. 3 does not work well when S > D.
The time order of the algorithm for bagging sampling is obviously O(BSN). The key point in the design of the boostingmechanism is the updating of the sampling probabilities. It should be decided how and which data points should be sampled.A consensus function based on the co-association values [2,17] supplies the necessary guidelines for adjustments of sam-pling probabilities. Notice that the co-association similarity between two data points, x and y, is defined as the number ofclusters shared by these points in the partitionings of a reference ensemble,
Q. The pseudo code of boosting sampling meth-
od is depicted in Fig. 4.The time order of the algorithm for boosting sampling is OðBSN þ BSdkþ1log2Sþ Bq2dðN � SÞlog2qþ B2N2 þ BN2 þ BNÞ
where d is the number of features. If it could be assumed that S� N and q2d log 2q� BN then the time order of the algorithmreduces to O(BSdk+1 log2 S + B2N2). First the study samples Xi like bagging bootstrap approach. Then using k-means clusteringalgorithm the bootstrapped data Xi have been partitioned into k clusters. Because some of data points have omitted from apseudo-sampling, this study uses the cluster centers to partition all data D. It has been named partitioning produced by the
Fig. 3. Algorithm for bagging sampling.
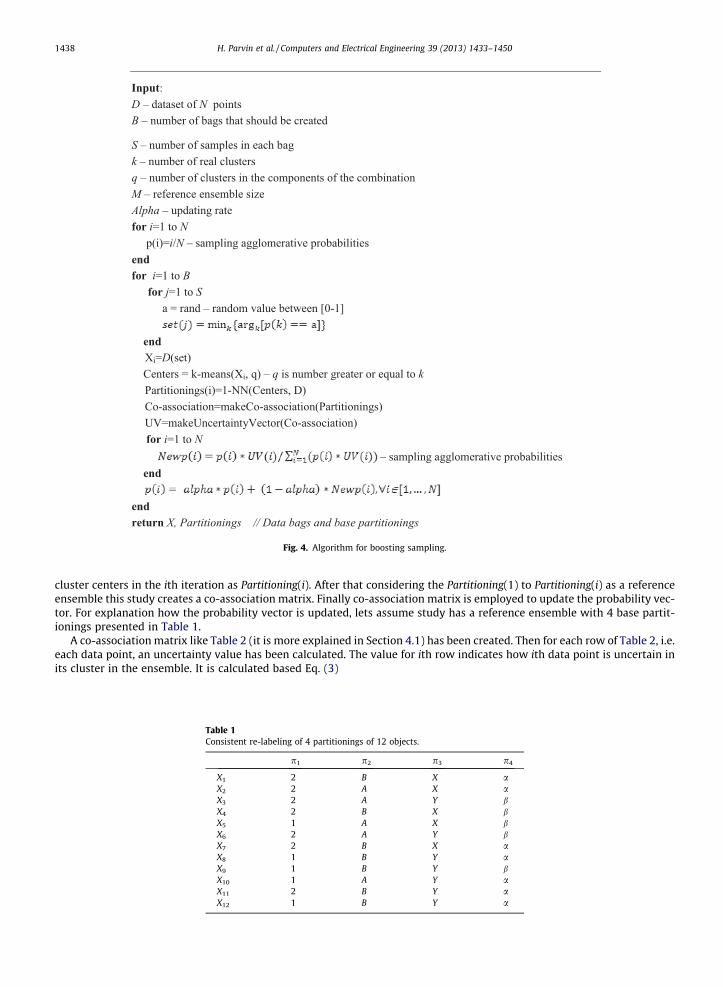
Fig. 4. Algorithm for boosting sampling.
1438 H. Parvin et al. / Computers and Electrical Engineering 39 (2013) 1433–1450
cluster centers in the ith iteration as Partitioning(i). After that considering the Partitioning(1) to Partitioning(i) as a referenceensemble this study creates a co-association matrix. Finally co-association matrix is employed to update the probability vec-tor. For explanation how the probability vector is updated, lets assume study has a reference ensemble with 4 base partit-ionings presented in Table 1.
A co-association matrix like Table 2 (it is more explained in Section 4.1) has been created. Then for each row of Table 2, i.e.each data point, an uncertainty value has been calculated. The value for ith row indicates how ith data point is uncertain inits cluster in the ensemble. It is calculated based Eq. (3)
Table 1Consistent re-labeling of 4 partitionings of 12 objects.
p1 p2 p3 p4
X1 2 B X aX2 2 A X aX3 2 A Y bX4 2 B X bX5 1 A X bX6 2 A Y bX7 2 B X aX8 1 B Y aX9 1 B Y bX10 1 A Y aX11 2 B Y aX12 1 B Y a

Table 2Co-association matrix of 4 partitionings presented in Table 1.
x1 x2 x3 x4 x5 x6 x7 x8 x9 x10 x11 x12 Uncertainty Newp
x1 1.00 0.75 0.25 0.75 0.25 0.25 1.00 0.50 0.25 0.25 0.75 0.50 3.0733 7.99x2 0.75 1.00 0.50 0.50 0.50 0.50 0.75 0.25 0.00 0.50 0.50 0.25 3.2041 8.33x3 0.25 0.50 1.00 0.50 0.50 1.00 0.25 0.25 0.50 0.50 0.50 0.25 3.4657 9.01x4 0.75 0.50 0.50 1.00 0.50 0.50 0.75 0.25 0.50 0.00 0.50 0.25 3.2041 8.33x5 0.25 0.50 0.50 0.50 1.00 0.50 0.25 0.25 0.50 0.50 0.00 0.25 3.4657 9.01x6 0.25 0.50 1.00 0.50 0.50 1.00 0.25 0.25 0.50 0.50 0.50 0.25 3.4657 9.01x7 1.00 0.75 0.25 0.75 0.25 0.25 1.00 0.50 0.25 0.25 0.75 0.50 3.0733 7.99x8 0.50 0.25 0.25 0.25 0.25 0.25 0.50 1.00 0.75 0.75 0.75 1.00 3.0733 7.99x9 0.25 0.00 0.50 0.50 0.50 0.50 0.25 0.75 1.00 0.50 0.50 0.75 3.2041 8.33x10 0.25 0.50 0.50 0.00 0.50 0.50 0.25 0.75 0.50 1.00 0.50 0.75 3.2041 8.33x11 0.75 0.50 0.50 0.50 0.00 0.50 0.75 0.75 0.50 0.50 1.00 0.75 2.9425 7.65x12 0.50 0.25 0.25 0.25 0.25 0.25 0.50 1.00 0.75 0.75 0.75 1.00 3.0733 7.99
H. Parvin et al. / Computers and Electrical Engineering 39 (2013) 1433–1450 1439
UncertaintyðiÞ ¼XN
j¼1
½co� associationði; jÞ � logðco� associationði; jÞÞ�;8i 2 ½1; . . . ;N� ð3Þ
After calculating all Uncertainty values for all data points, a new probability vector has been defined denoted by Newp basedon Eq. (4)
NewpðiÞ ¼ pðiÞ � UncertaintyðiÞ=XN
i¼1
ðpðiÞ � UncertaintyðiÞÞ; 8i 2 ½1; . . . ;N� ð4Þ
In the example of Table 2, let us assume that pi ¼ 1N ; i 2 ½1; . . . ;N�. After calculating Newp vector, it is depicted in the last col-
umn of Table 2.Finally by use of the Newp vector and an updating rate alpha, the p vector is updated. The updating relation is presented in
Eq. (5)
pðiÞ ¼ alpha � pðiÞ þ ð1� alphaÞ � NewpðiÞ; 8i 2 ½1; . . . ;N� ð5Þ
By using of an agglomerative clustering algorithm that could be found as a consensus function (e.g., single linkage) that isapplied to a co-association matrix the consensus partitioning is constructed. The feature of the consensus solution relatedto the accuracy of similarity values as estimated by the co-association values. The least reliable co-association values comefrom the data points located in the problematic areas of the feature space. Hence, our boosting strategy is to increase thesampling probability value for such data points as this study proceed with the generation of different partitionings in theensemble.
4. Consensus functions
To create a consensus partitioning r, a set of partitioningsQ
= {p1, p2, . . ., pB} are presented to a consensus function. Fourtypes of consensus functions have been applied in the article. All types of consensus functions are explained in this section indetails.
4.1. Co-association based consensus functions
To use a co-association based function firstly the clustering ensemble to a N � N co-association matrix should be trans-fered. The co-association matrix can also be viewed as a similarity matrix. The similarity between two objects, x and y iscomputed as:
simðx; yÞ ¼ 1=BXB
i¼1
dðpiðxÞ;piðyÞÞ; ð6Þ
where d(a, b) is defined as
dða; bÞ ¼1; if ða ¼ bÞ0; if ða–bÞ
�ð7Þ
The similarity between a pair of objects simply counts the number of clusters shared by the pair of objects in the ensem-ble partitionings {p1, p2, . . ., pB}. In co-association based functions, any hierarchical similarity based clustering algorithm(like single linkage) can be applied as the consensus function C.
1440 H. Parvin et al. / Computers and Electrical Engineering 39 (2013) 1433–1450
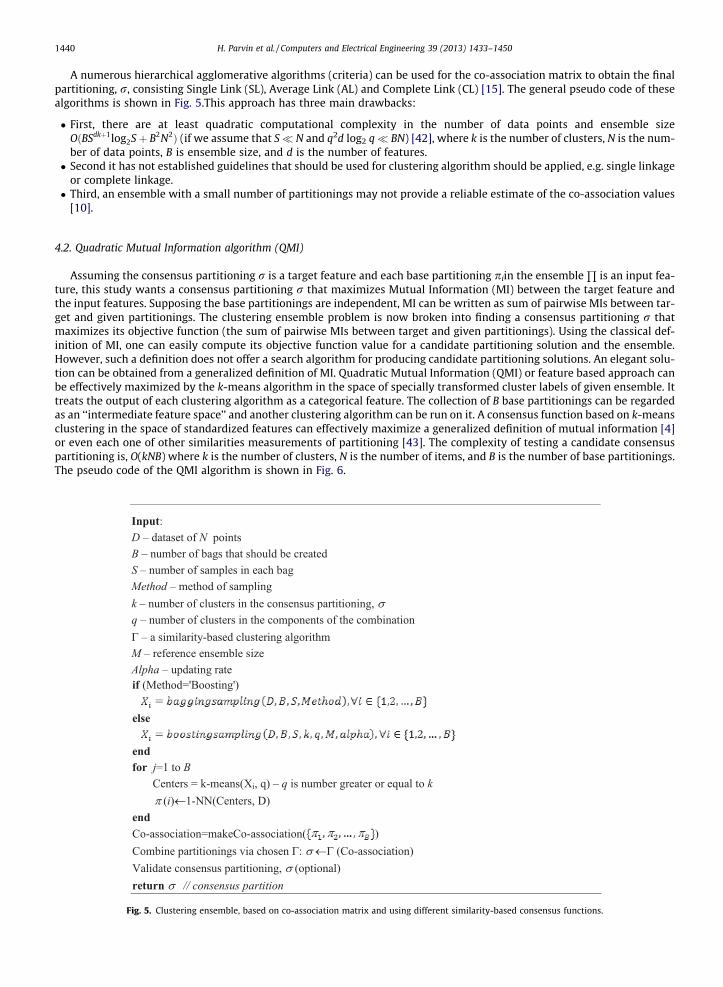
A numerous hierarchical agglomerative algorithms (criteria) can be used for the co-association matrix to obtain the finalpartitioning, r, consisting Single Link (SL), Average Link (AL) and Complete Link (CL) [15]. The general pseudo code of thesealgorithms is shown in Fig. 5.This approach has three main drawbacks:
� First, there are at least quadratic computational complexity in the number of data points and ensemble sizeOðBSdkþ1log2Sþ B2N2Þ (if we assume that S� N and q2d log2 q� BN) [42], where k is the number of clusters, N is the num-ber of data points, B is ensemble size, and d is the number of features.� Second it has not established guidelines that should be used for clustering algorithm should be applied, e.g. single linkage
or complete linkage.� Third, an ensemble with a small number of partitionings may not provide a reliable estimate of the co-association values
[10].
4.2. Quadratic Mutual Information algorithm (QMI)
Assuming the consensus partitioning r is a target feature and each base partitioning piin the ensembleQ
is an input fea-ture, this study wants a consensus partitioning r that maximizes Mutual Information (MI) between the target feature andthe input features. Supposing the base partitionings are independent, MI can be written as sum of pairwise MIs between tar-get and given partitionings. The clustering ensemble problem is now broken into finding a consensus partitioning r thatmaximizes its objective function (the sum of pairwise MIs between target and given partitionings). Using the classical def-inition of MI, one can easily compute its objective function value for a candidate partitioning solution and the ensemble.However, such a definition does not offer a search algorithm for producing candidate partitioning solutions. An elegant solu-tion can be obtained from a generalized definition of MI. Quadratic Mutual Information (QMI) or feature based approach canbe effectively maximized by the k-means algorithm in the space of specially transformed cluster labels of given ensemble. Ittreats the output of each clustering algorithm as a categorical feature. The collection of B base partitionings can be regardedas an ‘‘intermediate feature space’’ and another clustering algorithm can be run on it. A consensus function based on k-meansclustering in the space of standardized features can effectively maximize a generalized definition of mutual information [4]or even each one of other similarities measurements of partitioning [43]. The complexity of testing a candidate consensuspartitioning is, O(kNB) where k is the number of clusters, N is the number of items, and B is the number of base partitionings.The pseudo code of the QMI algorithm is shown in Fig. 6.
Fig. 5. Clustering ensemble, based on co-association matrix and using different similarity-based consensus functions.
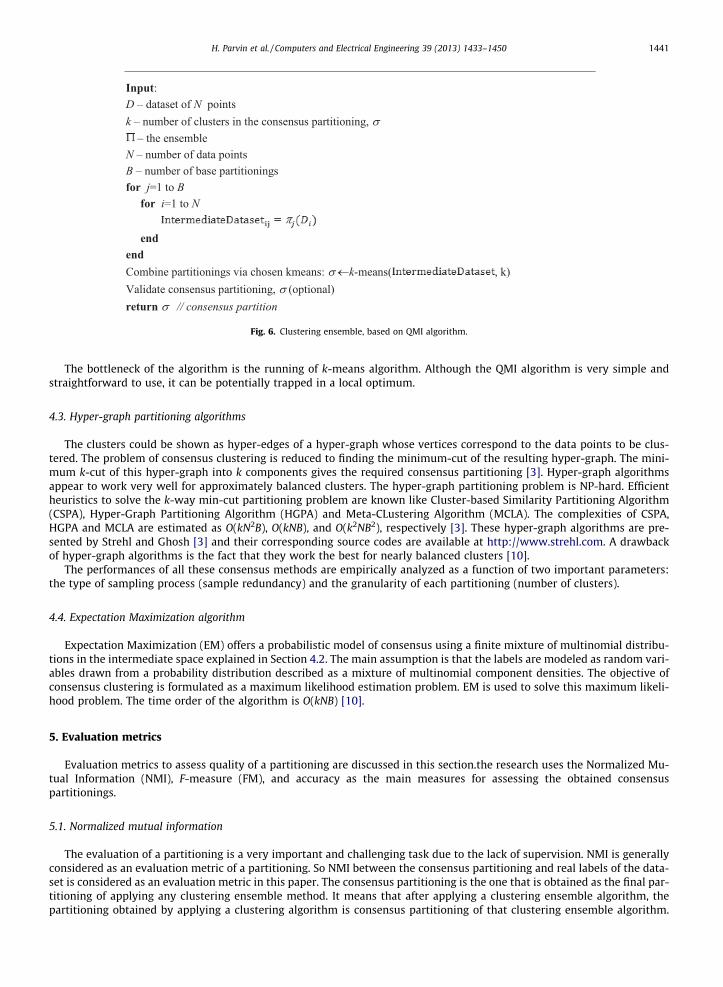
Fig. 6. Clustering ensemble, based on QMI algorithm.
H. Parvin et al. / Computers and Electrical Engineering 39 (2013) 1433–1450 1441
The bottleneck of the algorithm is the running of k-means algorithm. Although the QMI algorithm is very simple andstraightforward to use, it can be potentially trapped in a local optimum.
4.3. Hyper-graph partitioning algorithms
The clusters could be shown as hyper-edges of a hyper-graph whose vertices correspond to the data points to be clus-tered. The problem of consensus clustering is reduced to finding the minimum-cut of the resulting hyper-graph. The mini-mum k-cut of this hyper-graph into k components gives the required consensus partitioning [3]. Hyper-graph algorithmsappear to work very well for approximately balanced clusters. The hyper-graph partitioning problem is NP-hard. Efficientheuristics to solve the k-way min-cut partitioning problem are known like Cluster-based Similarity Partitioning Algorithm(CSPA), Hyper-Graph Partitioning Algorithm (HGPA) and Meta-CLustering Algorithm (MCLA). The complexities of CSPA,HGPA and MCLA are estimated as O(kN2B), O(kNB), and O(k2NB2), respectively [3]. These hyper-graph algorithms are pre-sented by Strehl and Ghosh [3] and their corresponding source codes are available at http://www.strehl.com. A drawbackof hyper-graph algorithms is the fact that they work the best for nearly balanced clusters [10].
The performances of all these consensus methods are empirically analyzed as a function of two important parameters:the type of sampling process (sample redundancy) and the granularity of each partitioning (number of clusters).
4.4. Expectation Maximization algorithm
Expectation Maximization (EM) offers a probabilistic model of consensus using a finite mixture of multinomial distribu-tions in the intermediate space explained in Section 4.2. The main assumption is that the labels are modeled as random vari-ables drawn from a probability distribution described as a mixture of multinomial component densities. The objective ofconsensus clustering is formulated as a maximum likelihood estimation problem. EM is used to solve this maximum likeli-hood problem. The time order of the algorithm is O(kNB) [10].
5. Evaluation metrics
Evaluation metrics to assess quality of a partitioning are discussed in this section.the research uses the Normalized Mu-tual Information (NMI), F-measure (FM), and accuracy as the main measures for assessing the obtained consensuspartitionings.
5.1. Normalized mutual information
The evaluation of a partitioning is a very important and challenging task due to the lack of supervision. NMI is generallyconsidered as an evaluation metric of a partitioning. So NMI between the consensus partitioning and real labels of the data-set is considered as an evaluation metric in this paper. The consensus partitioning is the one that is obtained as the final par-titioning of applying any clustering ensemble method. It means that after applying a clustering ensemble algorithm, thepartitioning obtained by applying a clustering algorithm is consensus partitioning of that clustering ensemble algorithm.
1442 H. Parvin et al. / Computers and Electrical Engineering 39 (2013) 1433–1450
The true labels of the dataset can be used after termination of a clustering algorithm to evaluate how good clustering algo-rithm has done the clustering task. The NMI between two partitioning, pa and pb, is calculated based on Eq. (8).
NMIðpa;pbÞ ¼�2PkðaÞ
i¼1
PkðbÞj¼1 Nab
ij logNab
ij �N
Nai �Nb
j
� �
PkðaÞi¼1 Na
i log Nai
N
� �þPkðbÞ
i¼1 Nbi log Nb
iN
� �;
ð8Þ
where N is the total number of samples and Nabij denotes the number of shared patterns between clusters Ca
i 2 pa and Cbj 2 pb;
Nai is the number of patterns in the cluster i of clustering a; also Nb
j is the number of patterns in the cluster j of clustering b;k(a) and k(b) respectively stands for numbers of clusters in pa and pb.
5.2. F-measure
F-measure (F-score) is another measure to evaluate a clustering algorithm. To compute the final performance of a clus-tering algorithm in terms of F-measure, after termination of the clustering algorithm, its output partitioning and true labelsof the dataset are fed into F-measure computation formula. Both the precision and recall measures are used to compute theF-measure. The F-measure can be interpreted as a weighed average of the precision and recall, where it hits its best value at 1and its worst score at 0 [44]. The F-measure formula used in the paper is based on Eq. (9).
FMðpa;pbÞ ¼ maxsXkðaÞ
i¼1
2� Nai �
NabisðiÞNa
i� Nab
isðiÞNB
sðiÞ
� �
N � NABisðiÞNa
iþ NAB
isðiÞNB
sðiÞ
� � ð9Þ
where again N is the total number of samples and Nabij denotes the number of shared patterns between clusters Ca
i 2 pa andCb
j 2 pb; Nai is the number of patterns in the cluster i of clustering a; also Nb
j is the number of patterns in the cluster j of clus-tering b; k(a) and k(b) respectively stands for numbers of clusters in pa and pb; and s is a permutation of {1, . . ., K(b)} forrelabeling of pb.
It is worthy to mention that in all experimentations, the NMI, F-measure and accuracy are scaled between [0–100] forconvention, so they are always reported in range [0–100].
5.3. Accuracy
Another alternative to evaluate a partitioning is the accuracy metric, provided that the number of clusters and their trueassignments are known. To compute the final performance of a clustering algorithm in terms of accuracy, one can first re-label the obtained clusters in such a way that have maximal matching with the ground truth labels and then counting thepercentage of the true classified samples. So the error rate can be determined after solving the correspondence problem be-tween the labels of derived and known clusters. The Hungarian algorithm is employed to solve the minimal weigh bipartitematching problem. It has been shown that it can efficiently solve this label correspondence problem [45].
The numbers of clusters are predetermined in all datasets, and their true assignments, are known. Therefore, the misclas-sified (error) rate of the final consensus partitioning as a measure of performance of clustering combination quality can becomputed. Pay attention that the true labels of data point can’t be used during the clustering process.
6. Experimental study and discussion
The experiments have been performed on several datasets, including one challenging artificial problem, the ‘‘Halfrings’’dataset, nine datasets from UCI repository, the ‘‘Yeast’’, ‘‘BreastCancer’’, ‘‘SABreast’’, ‘‘Bupa’’, ‘‘Glass’’, ‘‘Galaxy’’, ‘‘ Ionosphere’’,‘‘Iris’’ and ‘‘Wine’’ and one other real world dataset, the ‘‘Star/Galaxy’’ dataset. A summary of dataset characteristics is shownin Table 3.
6.1. Datasets
The Halfrings dataset, as shown in Fig. 7, consists of two clusters, unbalanced clusters with 100- and 300-point patterns inthe Halfrings dataset. The k-means algorithm by itself is not able to detect the two natural clusters since it implicitly assumesthem as hyper-spherical clusters (see Table 4).
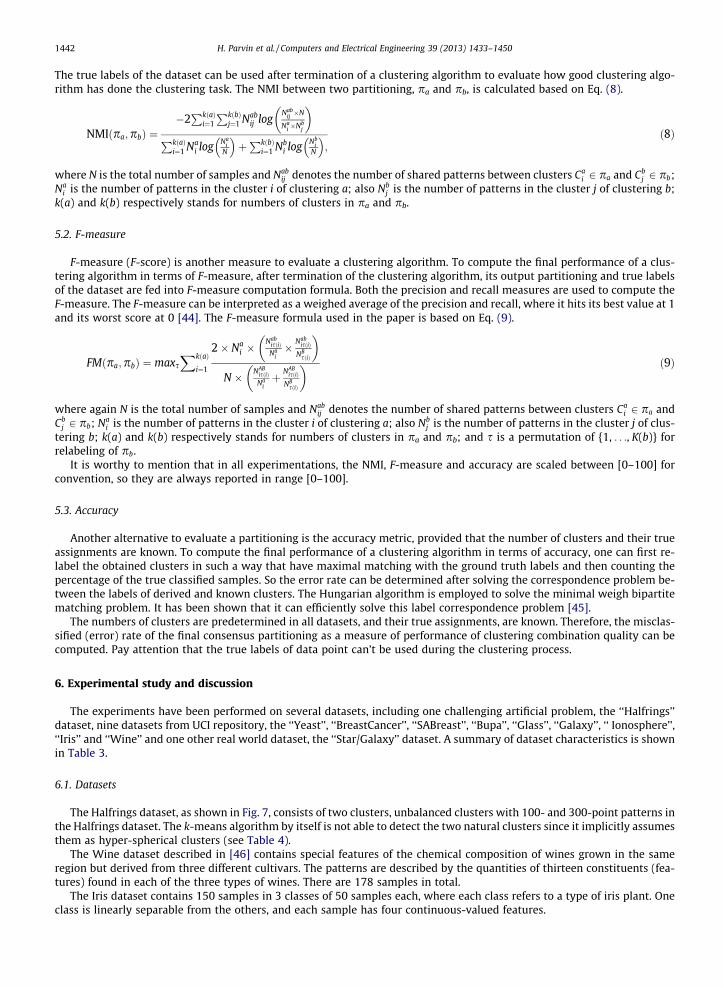
The Wine dataset described in [46] contains special features of the chemical composition of wines grown in the sameregion but derived from three different cultivars. The patterns are described by the quantities of thirteen constituents (fea-tures) found in each of the three types of wines. There are 178 samples in total.
The Iris dataset contains 150 samples in 3 classes of 50 samples each, where each class refers to a type of iris plant. Oneclass is linearly separable from the others, and each sample has four continuous-valued features.
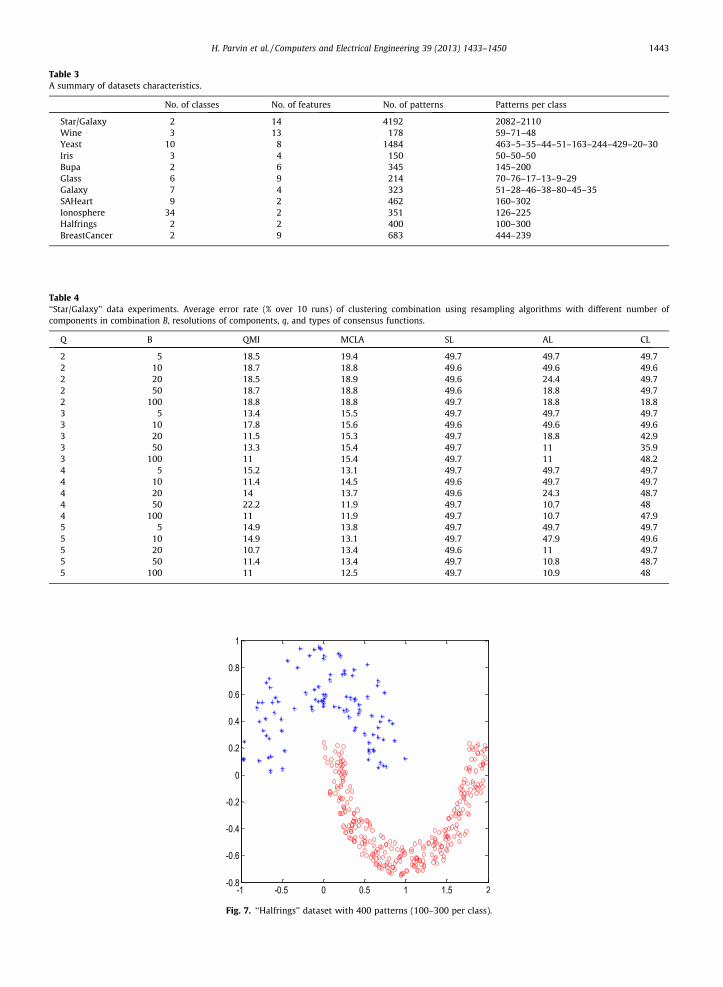
Table 3A summary of datasets characteristics.
No. of classes No. of features No. of patterns Patterns per class
Star/Galaxy 2 14 4192 2082–2110Wine 3 13 178 59–71–48Yeast 10 8 1484 463–5–35–44–51–163–244–429–20–30Iris 3 4 150 50–50–50Bupa 2 6 345 145–200Glass 6 9 214 70–76–17–13–9–29Galaxy 7 4 323 51–28–46–38–80–45–35SAHeart 9 2 462 160–302Ionosphere 34 2 351 126–225Halfrings 2 2 400 100–300BreastCancer 2 9 683 444–239
Fig. 7. ‘‘Halfrings’’ dataset with 400 patterns (100–300 per class).
Table 4‘‘Star/Galaxy’’ data experiments. Average error rate (% over 10 runs) of clustering combination using resampling algorithms with different number ofcomponents in combination B, resolutions of components, q, and types of consensus functions.
Q B QMI MCLA SL AL CL
2 5 18.5 19.4 49.7 49.7 49.72 10 18.7 18.8 49.6 49.6 49.62 20 18.5 18.9 49.6 24.4 49.72 50 18.7 18.8 49.6 18.8 49.72 100 18.8 18.8 49.7 18.8 18.83 5 13.4 15.5 49.7 49.7 49.73 10 17.8 15.6 49.6 49.6 49.63 20 11.5 15.3 49.7 18.8 42.93 50 13.3 15.4 49.7 11 35.93 100 11 15.4 49.7 11 48.24 5 15.2 13.1 49.7 49.7 49.74 10 11.4 14.5 49.6 49.7 49.74 20 14 13.7 49.6 24.3 48.74 50 22.2 11.9 49.7 10.7 484 100 11 11.9 49.7 10.7 47.95 5 14.9 13.8 49.7 49.7 49.75 10 14.9 13.1 49.7 47.9 49.65 20 10.7 13.4 49.6 11 49.75 50 11.4 13.4 49.7 10.8 48.75 100 11 12.5 49.7 10.9 48
H. Parvin et al. / Computers and Electrical Engineering 39 (2013) 1433–1450 1443
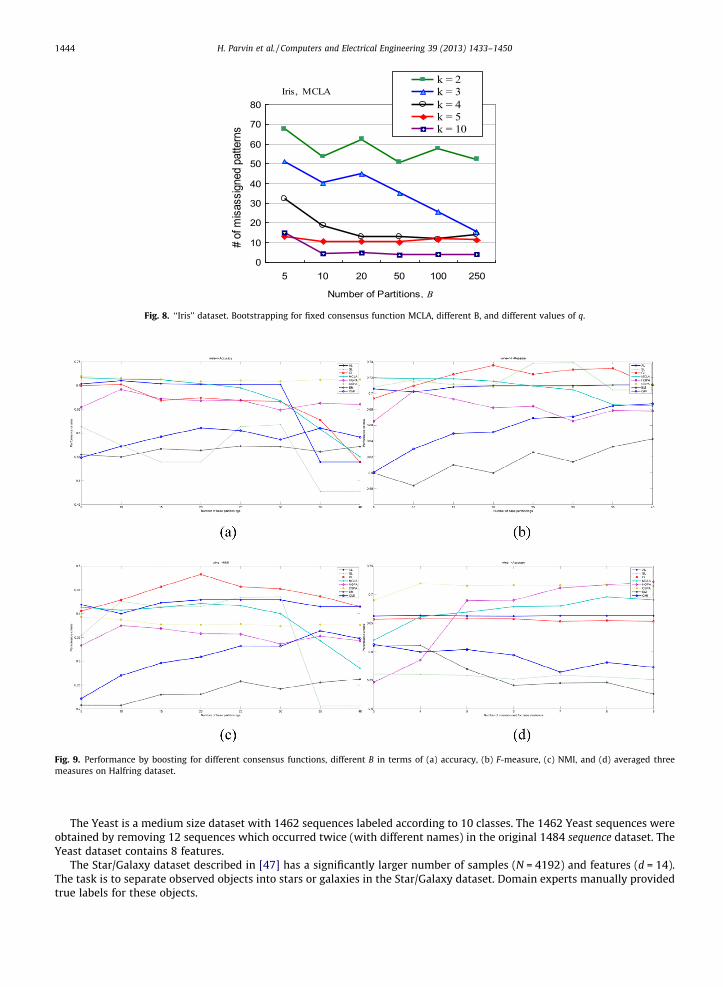
Fig. 8. ‘‘Iris’’ dataset. Bootstrapping for fixed consensus function MCLA, different B, and different values of q.
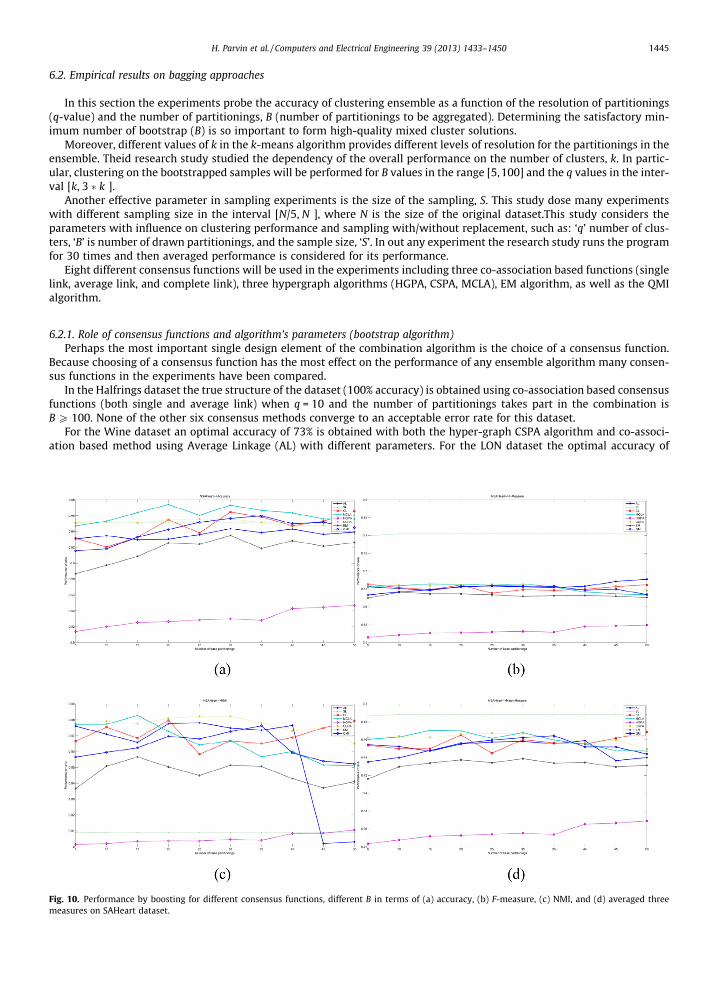
Fig. 9. Performance by boosting for different consensus functions, different B in terms of (a) accuracy, (b) F-measure, (c) NMI, and (d) averaged threemeasures on Halfring dataset.
1444 H. Parvin et al. / Computers and Electrical Engineering 39 (2013) 1433–1450
The Yeast is a medium size dataset with 1462 sequences labeled according to 10 classes. The 1462 Yeast sequences wereobtained by removing 12 sequences which occurred twice (with different names) in the original 1484 sequence dataset. TheYeast dataset contains 8 features.
The Star/Galaxy dataset described in [47] has a significantly larger number of samples (N = 4192) and features (d = 14).The task is to separate observed objects into stars or galaxies in the Star/Galaxy dataset. Domain experts manually providedtrue labels for these objects.
H. Parvin et al. / Computers and Electrical Engineering 39 (2013) 1433–1450 1445
6.2. Empirical results on bagging approaches
In this section the experiments probe the accuracy of clustering ensemble as a function of the resolution of partitionings(q-value) and the number of partitionings, B (number of partitionings to be aggregated). Determining the satisfactory min-imum number of bootstrap (B) is so important to form high-quality mixed cluster solutions.
Moreover, different values of k in the k-means algorithm provides different levels of resolution for the partitionings in theensemble. Theid research study studied the dependency of the overall performance on the number of clusters, k. In partic-ular, clustering on the bootstrapped samples will be performed for B values in the range [5,100] and the q values in the inter-val [k, 3 � k ].
Another effective parameter in sampling experiments is the size of the sampling, S. This study dose many experimentswith different sampling size in the interval [N/5, N ], where N is the size of the original dataset.This study considers theparameters with influence on clustering performance and sampling with/without replacement, such as: ‘q’ number of clus-ters, ‘B’ is number of drawn partitionings, and the sample size, ‘S’. In out any experiment the research study runs the programfor 30 times and then averaged performance is considered for its performance.
Eight different consensus functions will be used in the experiments including three co-association based functions (singlelink, average link, and complete link), three hypergraph algorithms (HGPA, CSPA, MCLA), EM algorithm, as well as the QMIalgorithm.
6.2.1. Role of consensus functions and algorithm’s parameters (bootstrap algorithm)Perhaps the most important single design element of the combination algorithm is the choice of a consensus function.
Because choosing of a consensus function has the most effect on the performance of any ensemble algorithm many consen-sus functions in the experiments have been compared.
In the Halfrings dataset the true structure of the dataset (100% accuracy) is obtained using co-association based consensusfunctions (both single and average link) when q = 10 and the number of partitionings takes part in the combination isB P 100. None of the other six consensus methods converge to an acceptable error rate for this dataset.
For the Wine dataset an optimal accuracy of 73% is obtained with both the hyper-graph CSPA algorithm and co-associ-ation based method using Average Linkage (AL) with different parameters. For the LON dataset the optimal accuracy of
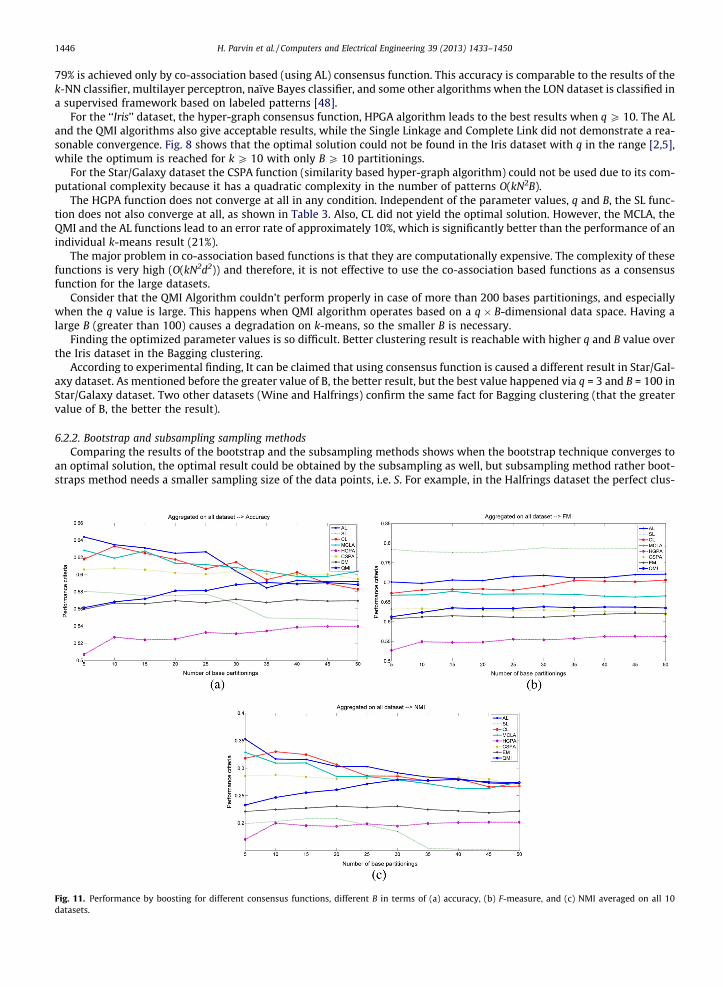
Fig. 10. Performance by boosting for different consensus functions, different B in terms of (a) accuracy, (b) F-measure, (c) NMI, and (d) averaged threemeasures on SAHeart dataset.
1446 H. Parvin et al. / Computers and Electrical Engineering 39 (2013) 1433–1450
79% is achieved only by co-association based (using AL) consensus function. This accuracy is comparable to the results of thek-NN classifier, multilayer perceptron, naïve Bayes classifier, and some other algorithms when the LON dataset is classified ina supervised framework based on labeled patterns [48].
For the ‘‘Iris’’ dataset, the hyper-graph consensus function, HPGA algorithm leads to the best results when q P 10. The ALand the QMI algorithms also give acceptable results, while the Single Linkage and Complete Link did not demonstrate a rea-sonable convergence. Fig. 8 shows that the optimal solution could not be found in the Iris dataset with q in the range [2,5],while the optimum is reached for k P 10 with only B P 10 partitionings.
For the Star/Galaxy dataset the CSPA function (similarity based hyper-graph algorithm) could not be used due to its com-putational complexity because it has a quadratic complexity in the number of patterns O(kN2B).
The HGPA function does not converge at all in any condition. Independent of the parameter values, q and B, the SL func-tion does not also converge at all, as shown in Table 3. Also, CL did not yield the optimal solution. However, the MCLA, theQMI and the AL functions lead to an error rate of approximately 10%, which is significantly better than the performance of anindividual k-means result (21%).
The major problem in co-association based functions is that they are computationally expensive. The complexity of thesefunctions is very high (O(kN2d2)) and therefore, it is not effective to use the co-association based functions as a consensusfunction for the large datasets.
Consider that the QMI Algorithm couldn’t perform properly in case of more than 200 bases partitionings, and especiallywhen the q value is large. This happens when QMI algorithm operates based on a q � B-dimensional data space. Having alarge B (greater than 100) causes a degradation on k-means, so the smaller B is necessary.
Finding the optimized parameter values is so difficult. Better clustering result is reachable with higher q and B value overthe Iris dataset in the Bagging clustering.
According to experimental finding, It can be claimed that using consensus function is caused a different result in Star/Gal-axy dataset. As mentioned before the greater value of B, the better result, but the best value happened via q = 3 and B = 100 inStar/Galaxy dataset. Two other datasets (Wine and Halfrings) confirm the same fact for Bagging clustering (that the greatervalue of B, the better the result).
6.2.2. Bootstrap and subsampling sampling methodsComparing the results of the bootstrap and the subsampling methods shows when the bootstrap technique converges to
an optimal solution, the optimal result could be obtained by the subsampling as well, but subsampling method rather boot-straps method needs a smaller sampling size of the data points, i.e. S. For example, in the Halfrings dataset the perfect clus-
Fig. 11. Performance by boosting for different consensus functions, different B in terms of (a) accuracy, (b) F-measure, and (c) NMI averaged on all 10datasets.
H. Parvin et al. / Computers and Electrical Engineering 39 (2013) 1433–1450 1447
tering can be obtained using a SL consensus function with q = 10, B = 100 and S P 200 (50% data size) when subsamplingmethod is used. This perfect result can be achieved by q = 10, B = 150, and S P 200 (50% data size) or q = 10, B = 100, andS P 300 (75% data size) when a bootstrap method is used. Thus, there is a tradeoff between the number of partitioningsB and the sample size S. This comparison shows that the subsampling method can be much faster than the bootstrap(N = 400) in relation to the computational complexity.
6.3. Empirical study on boosting approach
The experiments are conducted on all datasets, with known cluster labels, to validate the accuracy of consensus partition-ing. A comparison of the proposed boosting and previous bagging [49] ensemble is the primary goal of the experimental re-sults. The performance of the clustering ensemble algorithms by matching the detected and the known partitionings of thedatasets has been evaluated. To be fair, again each experiment is repeated 30 times and the averaged performance is con-sidered as its performance.
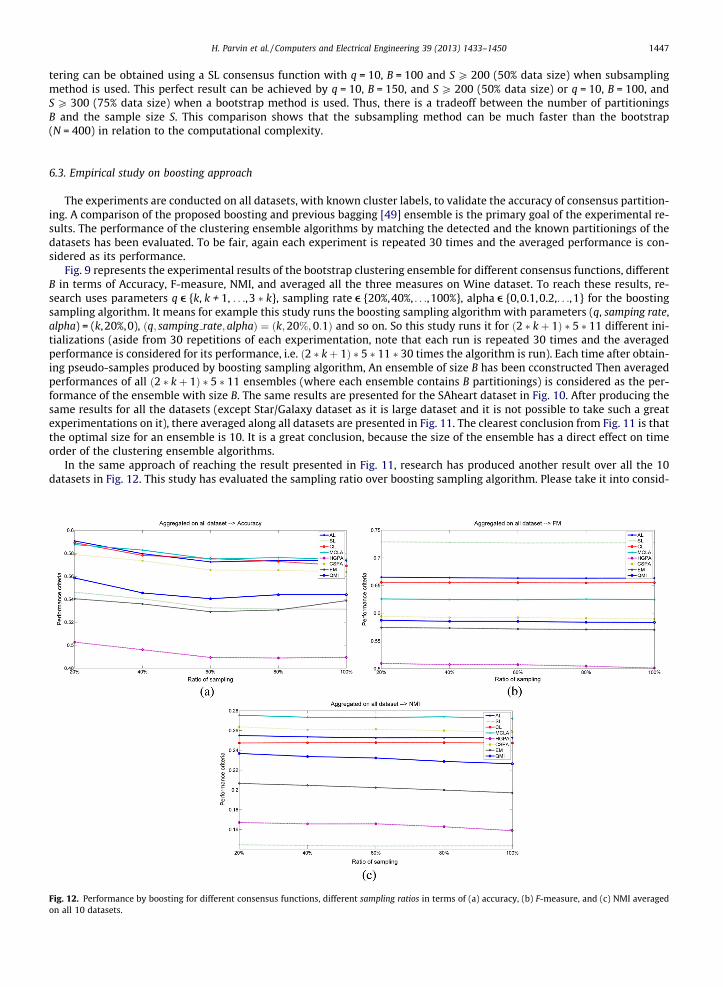
Fig. 9 represents the experimental results of the bootstrap clustering ensemble for different consensus functions, differentB in terms of Accuracy, F-measure, NMI, and averaged all the three measures on Wine dataset. To reach these results, re-search uses parameters q e {k, k + 1, . . .,3 � k}, sampling rate e {20%,40%, . . .,100%}, alpha e {0,0.1,0.2,. . .,1} for the boostingsampling algorithm. It means for example this study runs the boosting sampling algorithm with parameters (q, samping rate,alpha) = (k,20%,0), ðq; samping rate; alphaÞ ¼ ðk;20%;0:1Þ and so on. So this study runs it for ð2 � kþ 1Þ � 5 � 11 different ini-tializations (aside from 30 repetitions of each experimentation, note that each run is repeated 30 times and the averagedperformance is considered for its performance, i.e. ð2 � kþ 1Þ � 5 � 11 � 30 times the algorithm is run). Each time after obtain-ing pseudo-samples produced by boosting sampling algorithm, An ensemble of size B has been cconstructed Then averagedperformances of all ð2 � kþ 1Þ � 5 � 11 ensembles (where each ensemble contains B partitionings) is considered as the per-formance of the ensemble with size B. The same results are presented for the SAheart dataset in Fig. 10. After producing thesame results for all the datasets (except Star/Galaxy dataset as it is large dataset and it is not possible to take such a greatexperimentations on it), there averaged along all datasets are presented in Fig. 11. The clearest conclusion from Fig. 11 is thatthe optimal size for an ensemble is 10. It is a great conclusion, because the size of the ensemble has a direct effect on timeorder of the clustering ensemble algorithms.
In the same approach of reaching the result presented in Fig. 11, research has produced another result over all the 10datasets in Fig. 12. This study has evaluated the sampling ratio over boosting sampling algorithm. Please take it into consid-
Fig. 12. Performance by boosting for different consensus functions, different sampling ratios in terms of (a) accuracy, (b) F-measure, and (c) NMI averagedon all 10 datasets.
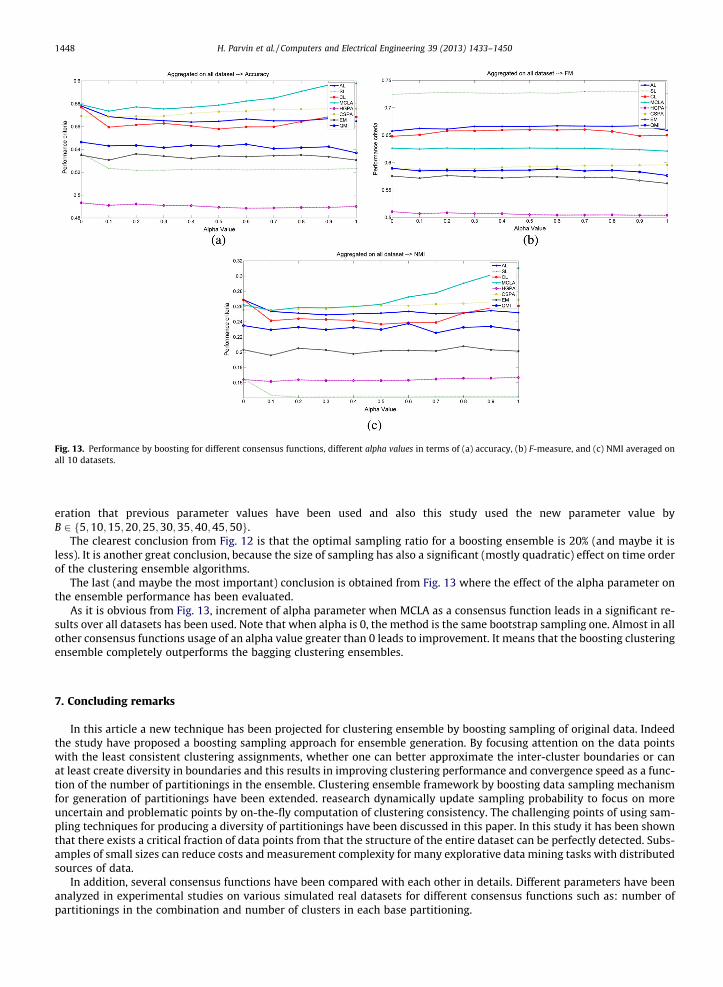
Fig. 13. Performance by boosting for different consensus functions, different alpha values in terms of (a) accuracy, (b) F-measure, and (c) NMI averaged onall 10 datasets.
1448 H. Parvin et al. / Computers and Electrical Engineering 39 (2013) 1433–1450
eration that previous parameter values have been used and also this study used the new parameter value byB 2 f5;10;15;20;25;30;35;40;45;50g.
The clearest conclusion from Fig. 12 is that the optimal sampling ratio for a boosting ensemble is 20% (and maybe it isless). It is another great conclusion, because the size of sampling has also a significant (mostly quadratic) effect on time orderof the clustering ensemble algorithms.
The last (and maybe the most important) conclusion is obtained from Fig. 13 where the effect of the alpha parameter onthe ensemble performance has been evaluated.
As it is obvious from Fig. 13, increment of alpha parameter when MCLA as a consensus function leads in a significant re-sults over all datasets has been used. Note that when alpha is 0, the method is the same bootstrap sampling one. Almost in allother consensus functions usage of an alpha value greater than 0 leads to improvement. It means that the boosting clusteringensemble completely outperforms the bagging clustering ensembles.
7. Concluding remarks
In this article a new technique has been projected for clustering ensemble by boosting sampling of original data. Indeedthe study have proposed a boosting sampling approach for ensemble generation. By focusing attention on the data pointswith the least consistent clustering assignments, whether one can better approximate the inter-cluster boundaries or canat least create diversity in boundaries and this results in improving clustering performance and convergence speed as a func-tion of the number of partitionings in the ensemble. Clustering ensemble framework by boosting data sampling mechanismfor generation of partitionings have been extended. reasearch dynamically update sampling probability to focus on moreuncertain and problematic points by on-the-fly computation of clustering consistency. The challenging points of using sam-pling techniques for producing a diversity of partitionings have been discussed in this paper. In this study it has been shownthat there exists a critical fraction of data points from that the structure of the entire dataset can be perfectly detected. Subs-amples of small sizes can reduce costs and measurement complexity for many explorative data mining tasks with distributedsources of data.
In addition, several consensus functions have been compared with each other in details. Different parameters have beenanalyzed in experimental studies on various simulated real datasets for different consensus functions such as: number ofpartitionings in the combination and number of clusters in each base partitioning.
H. Parvin et al. / Computers and Electrical Engineering 39 (2013) 1433–1450 1449
As it can be found in the research study the bagging sampling methods lead a successful ensemble. But the main outcomeof the paper is where it has been found out (1) boosting sampling method with the use of MCLA consensus function con-structs a very powerful ensemble were also (2) the less the sampling ratio the better ensemble. (3) Also in boosting cluster-ing ensemble, 10 base partitionings is almost best option for ensemble size. Any of the three main conclusions has a greatimpact, on both performance and time order of the clustering ensemble framework.
References
[1] Saha S, Bandyopadhyay S. A new multi-objective clustering technique based on the concepts of stability and symmetry. Knowl Inf Syst 2009.[2] Fred ALN, Jain AK. Data clustering using evidence accumulation. In: Proc of the 16th intl conf on pattern recognition, ICPR 2002, Quebec City; 2002. p.
276–80.[3] Strehl A, Ghosh J. Cluster ensembles-a knowledge reuse framework for combining multiple partitions. J Mach Learn Res 2003;3:583–617.[4] Topchy A, Jain AK, Punch WF. Combining multiple weak clusterings. In: Proc 3d IEEE intl conf on data mining; 2003. p. 331–8.[5] Mohammadi M, Alizadeh H, Minaei-Bidgoli B. Neural network ensembles using clustering ensemble and genetic algorithm. In: International
conference on convergence and hybrid information technology, ICCIT08; 2008. p. 11–3.[6] Parvin H, Alizadeh H, Minaei-Bidgoli B, Analoui M. CCHR: combination of classifiers using heuristic retraining. In: International conference on
networked computing and advanced information management (NCM 2008); 2008.[7] Parvin H, Alizadeh H, Minaei-Bidgoli B, Analoui M. An scalable method for improving the performance of classifiers in multiclass applications by
pairwise classifiers and GA. In: International conference on networked computing and advanced information management (NCM 2008), published byIEEE CS; 2008.
[8] Parvin H, Alizadeh H, Minaei-Bidgoli B. A new approach to improve the vote-based classifier selection. In: International conference on networkedcomputing and advanced information management (NCM 2008), Korea, published by IEEE CS; 2008.
[9] Parvin H, Alizadeh H, Moshki M, Minaei-Bidgoli B, Mozayani N. Divide & conquer classification and optimization by genetic algorithm. In: Internationalconference on convergence and hybrid information technology, ICCIT08, published by IEEE CS; 2008.
[10] Topchy A, Jain AK, Punch WF. A mixture model for clustering ensembles. In: Proc SIAM intl conf on data mining, SDM 04; 2004. p. 379–90.[11] Dudoit S, Fridlyand J. Bagging to improve the accuracy of a clustering procedure. Bioinformatics 2003;19(9):1090–9.[12] Fern X, Brodley CE. Random projection for high dimensional data clustering: a cluster ensemble approach. In: Proc 20th int conf on machine learning,
ICML; 2003.[13] Fischer B, Buhmann JM. Data resampling for path based clustering. In: Van Gool L, editor. Pattern recognition – symposium of the DAGM 2002.
Springer, LNCS 2449; 2002. p. 206–14.[14] Barthelemy JP, Leclerc B. The median procedure for partition. In: Cox IJ et al., editors. Partitioning data sets, AMS DIMACS series in discrete
mathematics, vol. 19; 1995. p. 3–34.[15] Jain AK, Dubes RC. Algorithms for clustering data. Englewood Cliffs, NJ: Prentice-Hall; 1988.[16] Tan PN, Steinbach M, Kumar V. Introduction to data mining. 1st ed. Addison-Wesly; 2005.[17] Fred ALN, Jain AK. Combining multiple clustering using evidence accumulation. IEEE Trans Pattern Anal Mach Intell 2005;27(6).[18] Fischer B, Buhmann JM. Path-based clustering for grouping of smooth curves and texture segmentation. IEEE Trans PAMI 2003;25(4):513–8.[19] Minaei-Bidgoli B, Topchy A, Punch WF. Ensembles of partitions via data resampling. In: Proc intl conf on information technology, ITCC 04, Las Vegas;
2004.[20] Breiman L. Arcing classifiers. Ann Stat 1998;26(3):801–49.[21] Frossyniotis D, Likas A, Stafylopatis A. A clustering method based on boosting. Pattern Recogn Lett 2004;6(19):641–54.[22] Topchy A, Minaei-Bidgoli B, Jain AK, Punch WF. Adaptive clustering ensembles. In: Proc intl conf on pattern recognition, ICPR 2004, Cambridge, UK;
2004.[23] Efron B. Bootstrap methods: another look at the jackknife. Ann Stat 1979;7:1–26.[24] Breiman L. Bagging predictors. J Mach Learn 1996;24(2):123–40.[25] Jain AK, Moreau JV. The bootstrap approach to clustering. In: Devijver PA, Kittler J, editors. Pattern recognition theory and applications. Springer-
Verlag; 1987. p. 63–71.[26] Levine E, Domany E. Resampling method for unsupervised estimation of cluster validity. Neural Comput 2001;13:2573–93.[27] Ben-Hur A, Elisseeff A, Guyon I. A stability based method for discovering structure in clustered data. In: Pac symp biocomputing, vol. 7; 2002. p. 6–17.[28] Roth V, Lange T, Braun M, Buhmann JM. A resampling approach to cluster validation. In: Proceedings in computational statistics: 15th symposium
COMPSTAT 2002. Heidelberg: Physica-Verlag; 2002. p. 123–8.[29] Minaei-Bidgoli B, Topchy A, Punch WF. A comparison of resampling methods for clustering ensembles. In: Proc intl conf machine learning methods
technology and application, MLMTA 04, Las Vegas; 2004.[30] Parvin H, Beigi A, Mozayani N. A clustering ensemble learning method based on the ant colony clustering algorithm. Int J Appl Comput Math
2012;11(2):286–302.[31] Fern X, Brodley CE. Solving cluster ensemble problems by bipartite graph partitioning. In: Proceedings of the 21st international conference on machine
learning, Canada; 2004.[32] Ng A, Jordan M, Weiss Y. On spectral clustering: analysis and an algorithm. NIPS 2002;14.[33] Jiamthapthaksin R, Eick CF, Lee S. GAC-GEO: a generic agglomerative clustering framework for geo-referenced datasets. Knowl Inf Syst; 2010;
29(3):597–628.[34] Wang H, Shan H, Banerjee A. Bayesian cluster ensembles. In: Proceedings of the ninth SIAM international conference on data mining; 2009. p. 211–22.[35] Guénoche A. Consensus of partitions: a constructive approach. In: Advances in data analysis and classification; 2011.[36] Christou IT. Coordination of cluster ensembles via exact methods. IEEE Trans Pattern Anal Mach Intell 2011;33(2).[37] Singh V, Mukherjee L, Peng J, Xu J. Ensemble clustering using semidefinite programming with applications. Mach Learn 2010;79:177–200.[38] Zhang T, Ramakrishnan R, Livny M. BIRCH: an efficient data clustering method for very large databases. ACM SIGMOD Rec 1996;25(2):103–14.[39] Dhillon IS, Modha DS. A data-clustering algorithm on distributed memory multiprocessors. In: Proceedings of large-scale parallel KDD systems
workshop, ACM SIGKDD, in large-scale parallel data mining, lecture notes in artificial intelligence, vol. 1759; 2000. p. 245–60.[40] Park BH, Kargupta H. Distributed data mining. In: Ye Nong, editor. The handbook of data mining. Lawrence Erlbaum Associates; 2003.[41] Zhang B, Hsu M, Forman G. Accurate recasting of parameter estimation algorithms using sufficient statistics for efficient parallel speed-up
demonstrated for center-based data clustering algorithms. In: Proc 4th European conference on principles and practice of knowledge discovery indatabases, in principles of, data mining and knowledge discovery; 2000.
[42] Duda RO, Hart PE, Stork DG. Pattern classification. 2nd ed. New York, NY: John Wiley & Sons, Inc.; 2001.[43] Pfitzne D, Leibbrandt R, Powers D. Characterization and evaluation of similarity measures for pairs of clusterings. Knowl. Inf. Syst. 2009;19(3):361–94.[44] Marxer R, Holonowicz P, Purwins H, Hazan A. Dynamical hierarchical self-organization of harmonic motivic, and pitch categories. In: Music, brain and
cognition, part 2: models of sound and cognition, held at NIPS’07; 2007.[45] Munkres J. Algorithms for the assignment and transportation problems. J Soc Ind Appl Math 1957;5(1):32–8.[46] Aeberhard S, Coomans D, De Vel O. Comparison of classifiers in high dimensional settings, tech. rep. no. 92-02. Dept. of Computer Science and Dept. of
Mathematics and Statistics, James Cook University of North Queensland; 1992.

1450 H. Parvin et al. / Computers and Electrical Engineering 39 (2013) 1433–1450
[47] Odewahn SC, Stockwell EB, Pennington RL, Humphreys RM, Zumach WA. Automated star/galaxy discrimination with neural networks. Astron J1992;103:308–31.
[48] Minaei-Bidgoli B, Punch WF. Using genetic algorithms for data mining optimization in an educational web-based system. GECCO 2003;2003:2252–63.[49] Minaei-Bidgoli B, Parvin H, Alinejad-Rokny H, Alizadeh H, Panch WF. Effects of resampling method and adaptation on clustering ensemble efficacy,
artificial intelligence review. Springer; 2011. http://dx.doi.org/10.1007/s10462-011-9295-x.


