Embed Size (px)
Citation preview
Abstract—While data grids can provide the ability to solve large-scale applications which require the processing of large amounts of data, they have been recognized as extremely energy inefficient. Computing elements can be located far away from the data storage elements. A common solution to improve availability and file access time in such environments is to replicate the data, resulting in the creation of copies of data files at many different sites. The energy efficiency of the data centers storing this data is one of the biggest issues in data intensive computing. Since power is needed to transmit, store and cool the data, we propose to minimize the amount of data transmitted and stored by utilizing smart replication strategies that are data aware. In this paper we present a new data replication approach, called the sliding window replica strategy (SWIN), that is not only data aware, but is also energy efficient. We measure the performance of SWIN and existing replica strategies on our Sage green cluster to study the power consumption of the strategies. Results from this study have implications beyond our cluster to the management of data in clouds.
Keywords-data cluster; data grid; data intensive computing; data replication; power consumption; sliding window protocol
I. INTRODUCTION Large scale geographically distributed systems are becoming more and more popular as data is being shared in data-intensive scientific applications. Grid computing systems allow such sharing of data and resources in dynamic, multi-institutional virtual organizations [1]. A Grid computing system for managing and processing a very large amount of distributed data is a data grid. Examples of data grids are the Biomedical Informatics Research Network (BIRN) [2], the Large Hadron Collider (LHC) [3] at the particle physics center Cern, the DataGrid project (EDG) funded by the European Union, now known as the Enabling Grids for E-SciencE project (EGEE) [4] and the International Virtual Observatory Alliance (IVOA) Grid community Research Group [5]. Millions of files will be generated from these scientific experiments and thousands of clients around the world will access the data. Jobs involving this data are loosely coupled and can require computationally intensive tasks, and/or the need to manage an extremely large number of data sets that are typically larger than 1 TB. While such systems can provide the ability to solve large-scale
applications requiring the processing of large amounts of data, they have been recognized as extremely energy inefficient [1].
Storing and managing large amounts of data leads to this energy inefficiency because of the power and cooling of the data centers [6] in which the data is stored. For example, there are 6,000 data centers in the U.S. and reportedly consumed 1.5% of all electricity in the U.S. at a cost of $4.5 billion and 61B kWh of energy in 2006 [7]. The power demanded by data centers is predicted to double from 2006 to 2011. Peak instantaneous demand is predicted to increase from 7 GW in 2006 to 12 GW in 2011, requiring the construction of 10 new power plants [23].
Storing, managing and moving massive amounts of data are also being recognized as a significant bottleneck [22]. The current 20% growth rate of storage devices is expected to accelerate [23]. However, data resources in a traditional distributed system are typically considered as second class objects. Instead, new strategies for scheduling and resource allocation that consider data as first class objects are needed for such massive scale. Some data aware strategies are being proposed to reduce the bottleneck [46]. However, there has been little effort to design and analyze data aware strategies considering the power efficiency of the strategies. In an effort to address such issues, we are proposing to design and analyze a series of data aware strategies, involving data replication, within the framework of energy efficiency. We propose that it is not only important to reduce the data bottleneck, but to also consider solutions that are the most energy efficient.
One approach to addressing this energy inefficiency is to utilize a green cluster or grid. (A data grid can incorporate a cluster and the resources can be managed as part of a grid.) These green systems are designed to save energy typically through the use of efficient CPU usage or reclamation of waste heat to reduce other heating costs. Another approach is to consider strategies to minimize disk storage and/or data transmission in order to provide energy efficiency for both green and non-green clusters or grids. We utilize both these approaches in this work.
In a grid system, computing elements are often located far away from the data storage elements. A common solution to improve availability and file access time in such
Susan V. Vrbsky, Ming Lei, Karl Smith and Jeff Byrd Department of Computer Science
The University of Alabama Tuscaloosa, AL 35487-0290
{vrbsky, mlei, ksmith}@cs.ua.edu
Data Replication and Power Consumption in Data Grids
2nd IEEE International Conference on Cloud Computing Technology and Science
978-0-7695-4302-4/10 $26.00 © 2010 IEEE
DOI 10.1109/CloudCom.2010.35
288
environments is to replicate the data, resulting in the creation of copies of data files at many different sites [9]. There have been different approaches to replication for data grids ranging from an economical model [10] that uses predictions of future usage of a page to determine which page to replace, to storing only fragments of a file [14]. Some approaches [11, 12] assume the total system replica storage is large enough to hold all the data replica copies that are needed. This is not a green approach.
Replication strategies that decrease the file access times by accessing local files, while not requiring an increase in data storage, are needed for energy efficiency. In this paper we present such a data replication approach, called SWIN. Since power is needed to store and cool the data, we propose to minimize the amount of data stored by utilizing smart replication strategies. We will consider replicating the data only when necessary, as additional energy is needed to store the data, but it is a tradeoff with the energy needed to transmit the data if it is not replicated. We will measure the impact of our strategy on the energy consumption. We implement our replication strategy on a “green” cluster and determine its impact compared to traditional strategies for data replication.
The goal of this work is to design data aware strategies for data-intensive computing that allow for shorter running times, decreased amount of data transmitted and smaller storage space, in order to reduce the power needed. The remainder of this paper is organized as follows. In Section 2 we describe related work. In Section 3 we present our strategy for data replication and in Section 4 we present the performance of our replication scheme and existing schemes in terms of energy consumed. Section 5 provides conclusions and future work.
II. RELATED WORK Early work on data replication [10, 13] has placed the
most attention on decreasing the data access latency and the network bandwidth assumption for data grids. In [13], six replica strategies are presented and their results indicate that the best strategy has significant savings in latency and bandwidth consumption if the access patterns contain a moderate amount of geographical locality. In [10], a replica scheme based on the economical-model has been proposed. The authors use an auction protocol to make the replica decision for long-term optimization. The authors show the scheme outperforms other replica strategies with sequential file access patterns.
As bandwidth and computing capacity have become relatively cheaper, the data access latency can drop dramatically, and how to improve the system reliability and availability becomes the focus. More recent work has focused on maximizing file availability. In [14], the authors propose providing replicated fragments of files to increase data access performance and load balancing. Although the authors state the importance of data availability, it is not directly measured. An analytical model appears in [11] for determining the optimal number of replica servers, catalog
servers and catalog sizes to guarantee a given overall reliability in the face of unreliable components. In [12], a dynamic model-driven replication approach in which peers create replicas automatically in a decentralized fashion is presented.
Both [11] and [12] propose algorithms to meet the data availability goal based on the assumption that the total system replica storage is large enough to hold all the data replica copies. Each file will be replicated to the arbitrary number of copies needed to achieve its availability goal without any discrimination, even if the file will be only be accessed one time in its whole life span. In contrast to this, we have proposed several strategies [15, 16] to maximize the data availability assuming limited storage capacity and we also proposed measures to assess data availability.
The need to consider the energy efficiency of computing systems, such as grids, is becoming increasingly mainstream, as exhibited by articles appearing regularly in such magazines as IEEE Computer and Communications of the ACM. Green Grid is a group of professionals in IT who propose to increase the energy efficiency of data centers by providing a series of white papers [6]. Their goal is to provide metrics to measure productivity, as well as efficiency. They have proposed a Power Usage Effectiveness metric (PUE), which is: (total facility power)/(IT equipment power) and the Data Center infrastructure Efficiency metric (CDiE), which is (1/PUE). In [1] the authors propose a blue print for an Energy Aware Grid that incorporates energy efficiency and thermal management for data centers. The decision for placing a computational workload is based on an energy coefficient associated with a data center, dependent on such factors as the data center thermal management infrastructure and seasonal variations. Their results demonstrate the economic feasibility and energy savings of their approach.
The work in the Petashare project [46] proposes several approaches to data aware scheduling for CPU-oriented batch schedulers and proposes a new data aware paradigm. Experiments indicate increasing parallelism and concurrency do not always result in an increase in the data transfer rate. In addition, their results indicate that data placement by a scheduler can improve the performance and reliability of a system. The authors also consider such factors as remote I/O versus staging. The authors do not consider the energy efficiency of their approaches.
While server processors can provide a wide dynamic power range, the range of other components of the server is much smaller, e.g. 25% for disk drives and 15% for networking switches [19]. Disk devices have a latency and energy penalty for transition from an inactive to an active mode. Networking equipment typically does not have low-power modes. As a result, alternative strategies are needed to reduce the amount of disk storage utilized and the data transmitted in a data grid. We are currently not aware of any work that considers data replication in the context of power consumption.
289
III. DATA REPLICATION
When the data are distributed among different sites in a data intensive environment, there is a high probability the system will access data which is not in the local site. Remote data file access can be a very expensive operation, considering the size of the files and limited networking bandwidth or network congestion. To reduce the amount of time needed to access the data, data replication can be utilized to avoid remote file access. However, in order to decrease the amount of energy needed to store the data, it is imperative that a limit be placed on the size of the storage. We propose to minimize the energy consumed through the use of smart data replication to reduce the cost of accessing and storing data.
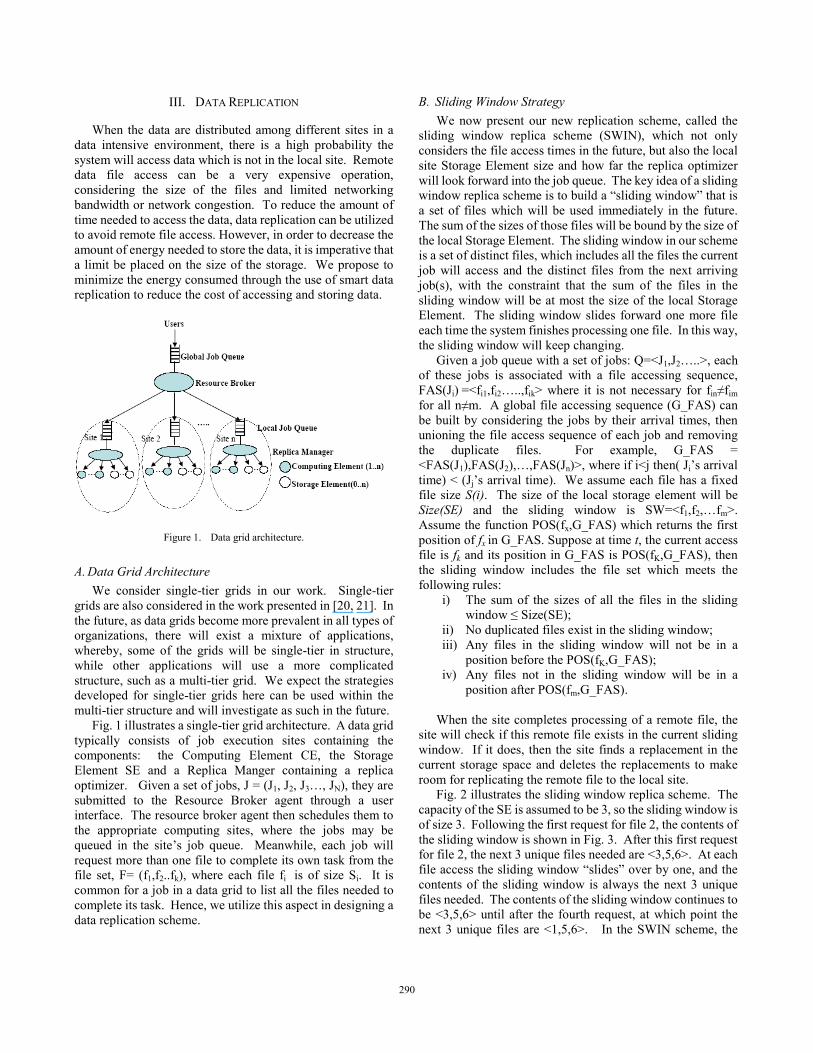
Figure 1. Data grid architecture.
A. Data Grid Architecture We consider single-tier grids in our work. Single-tier
grids are also considered in the work presented in [20, 21]. In the future, as data grids become more prevalent in all types of organizations, there will exist a mixture of applications, whereby, some of the grids will be single-tier in structure, while other applications will use a more complicated structure, such as a multi-tier grid. We expect the strategies developed for single-tier grids here can be used within the multi-tier structure and will investigate as such in the future.
Fig. 1 illustrates a single-tier grid architecture. A data grid typically consists of job execution sites containing the components: the Computing Element CE, the Storage Element SE and a Replica Manger containing a replica optimizer. Given a set of jobs, J = (J1, J2, J3…, JN), they are submitted to the Resource Broker agent through a user interface. The resource broker agent then schedules them to the appropriate computing sites, where the jobs may be queued in the site’s job queue. Meanwhile, each job will request more than one file to complete its own task from the file set, F= (f1,f2..fk), where each file fi is of size Si. It is common for a job in a data grid to list all the files needed to complete its task. Hence, we utilize this aspect in designing a data replication scheme.
B. Sliding Window Strategy We now present our new replication scheme, called the
sliding window replica scheme (SWIN), which not only considers the file access times in the future, but also the local site Storage Element size and how far the replica optimizer will look forward into the job queue. The key idea of a sliding window replica scheme is to build a “sliding window” that is a set of files which will be used immediately in the future. The sum of the sizes of those files will be bound by the size of the local Storage Element. The sliding window in our scheme is a set of distinct files, which includes all the files the current job will access and the distinct files from the next arriving job(s), with the constraint that the sum of the files in the sliding window will be at most the size of the local Storage Element. The sliding window slides forward one more file each time the system finishes processing one file. In this way, the sliding window will keep changing.
Given a job queue with a set of jobs: Q=<J1,J2…..>, each of these jobs is associated with a file accessing sequence, FAS(Ji) =<fi1,fi2…..,fik> where it is not necessary for fin≠fim for all n≠m. A global file accessing sequence (G_FAS) can be built by considering the jobs by their arrival times, then unioning the file access sequence of each job and removing the duplicate files. For example, G_FAS = <FAS(J1),FAS(J2),…,FAS(Jn)>, where if i<j then( Ji’s arrival time) < (Jj’s arrival time). We assume each file has a fixed file size S(i). The size of the local storage element will be Size(SE) and the sliding window is SW=<f1,f2,…fm>. Assume the function POS(fx,G_FAS) which returns the first position of fx in G_FAS. Suppose at time t, the current access file is fk and its position in G_FAS is POS(fK,G_FAS), then the sliding window includes the file set which meets the following rules:
i) The sum of the sizes of all the files in the sliding window ≤ Size(SE);
ii) No duplicated files exist in the sliding window; iii) Any files in the sliding window will not be in a
position before the POS(fK,G_FAS); iv) Any files not in the sliding window will be in a
position after POS(fm,G_FAS).
When the site completes processing of a remote file, the site will check if this remote file exists in the current sliding window. If it does, then the site finds a replacement in the current storage space and deletes the replacements to make room for replicating the remote file to the local site.
Fig. 2 illustrates the sliding window replica scheme. The capacity of the SE is assumed to be 3, so the sliding window is of size 3. Following the first request for file 2, the contents of the sliding window is shown in Fig. 3. After this first request for file 2, the next 3 unique files needed are <3,5,6>. At each file access the sliding window “slides” over by one, and the contents of the sliding window is always the next 3 unique files needed. The contents of the sliding window continues to be <3,5,6> until after the fourth request, at which point the next 3 unique files are <1,5,6>. In the SWIN scheme, the
290
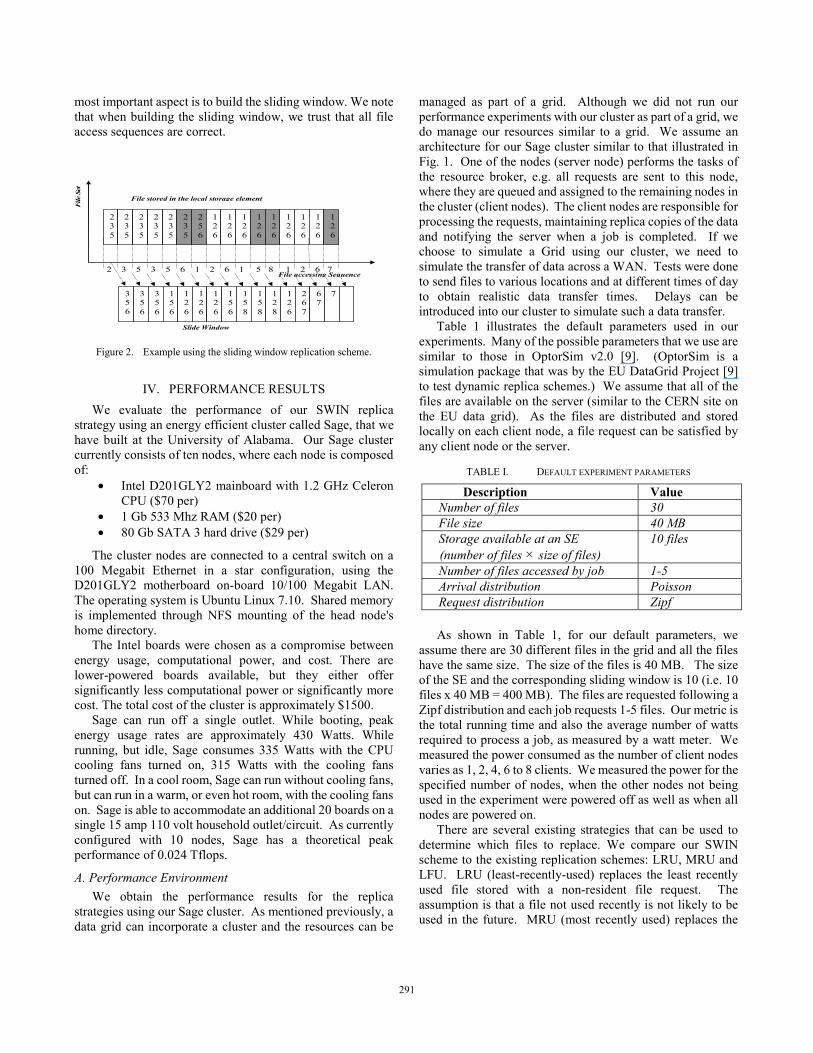
most important aspect is to build the sliding window. We note that when building the sliding window, we trust that all file access sequences are correct.
File
Set
2 3 5 3 5 6 1 2 6 1 5 8 1 2 6 7
2 3 5
2 3 5
2 3 5
235
2 35
23 5
256
126
126
126
126
126
126
126
126
126
File stored in the local storage element
File accessing Sequence
Slide Window
3 5 6
3 56
3 56
1 56
1 26
1 26
1 26
1 56
1 58
1 58
1 28
1 26
2 67
67
7
Figure 2. Example using the sliding window replication scheme.
IV. PERFORMANCE RESULTS We evaluate the performance of our SWIN replica
strategy using an energy efficient cluster called Sage, that we have built at the University of Alabama. Our Sage cluster currently consists of ten nodes, where each node is composed of:
• Intel D201GLY2 mainboard with 1.2 GHz Celeron CPU ($70 per)
• 1 Gb 533 Mhz RAM ($20 per) • 80 Gb SATA 3 hard drive ($29 per)
The cluster nodes are connected to a central switch on a 100 Megabit Ethernet in a star configuration, using the D201GLY2 motherboard on-board 10/100 Megabit LAN. The operating system is Ubuntu Linux 7.10. Shared memory is implemented through NFS mounting of the head node's home directory.
The Intel boards were chosen as a compromise between energy usage, computational power, and cost. There are lower-powered boards available, but they either offer significantly less computational power or significantly more cost. The total cost of the cluster is approximately $1500.
Sage can run off a single outlet. While booting, peak energy usage rates are approximately 430 Watts. While running, but idle, Sage consumes 335 Watts with the CPU cooling fans turned on, 315 Watts with the cooling fans turned off. In a cool room, Sage can run without cooling fans, but can run in a warm, or even hot room, with the cooling fans on. Sage is able to accommodate an additional 20 boards on a single 15 amp 110 volt household outlet/circuit. As currently configured with 10 nodes, Sage has a theoretical peak performance of 0.024 Tflops.
A. Performance Environment We obtain the performance results for the replica
strategies using our Sage cluster. As mentioned previously, a data grid can incorporate a cluster and the resources can be
managed as part of a grid. Although we did not run our performance experiments with our cluster as part of a grid, we do manage our resources similar to a grid. We assume an architecture for our Sage cluster similar to that illustrated in Fig. 1. One of the nodes (server node) performs the tasks of the resource broker, e.g. all requests are sent to this node, where they are queued and assigned to the remaining nodes in the cluster (client nodes). The client nodes are responsible for processing the requests, maintaining replica copies of the data and notifying the server when a job is completed. If we choose to simulate a Grid using our cluster, we need to simulate the transfer of data across a WAN. Tests were done to send files to various locations and at different times of day to obtain realistic data transfer times. Delays can be introduced into our cluster to simulate such a data transfer.
Table 1 illustrates the default parameters used in our experiments. Many of the possible parameters that we use are similar to those in OptorSim v2.0 [9]. (OptorSim is a simulation package that was by the EU DataGrid Project [9] to test dynamic replica schemes.) We assume that all of the files are available on the server (similar to the CERN site on the EU data grid). As the files are distributed and stored locally on each client node, a file request can be satisfied by any client node or the server.
TABLE I. DEFAULT EXPERIMENT PARAMETERS
Description Value Number of files 30 File size 40 MB Storage available at an SE (number of files × size of files)
10 files
Number of files accessed by job 1-5 Arrival distribution Poisson Request distribution Zipf
As shown in Table 1, for our default parameters, we assume there are 30 different files in the grid and all the files have the same size. The size of the files is 40 MB. The size of the SE and the corresponding sliding window is 10 (i.e. 10 files x 40 MB = 400 MB). The files are requested following a Zipf distribution and each job requests 1-5 files. Our metric is the total running time and also the average number of watts required to process a job, as measured by a watt meter. We measured the power consumed as the number of client nodes varies as 1, 2, 4, 6 to 8 clients. We measured the power for the specified number of nodes, when the other nodes not being used in the experiment were powered off as well as when all nodes are powered on.
There are several existing strategies that can be used to determine which files to replace. We compare our SWIN scheme to the existing replication schemes: LRU, MRU and LFU. LRU (least-recently-used) replaces the least recently used file stored with a non-resident file request. The assumption is that a file not used recently is not likely to be used in the future. MRU (most recently used) replaces the
291
most recently used file. MRU is most useful when an older file is more likely to be requested (e.g. in a large cyclical loop) or in repeated scans over large datasets. LFU (least-frequently-used) replaces the file that was least recently used, assuming it is not likely to be used in the future.
The LFU, LRU and MRU replica strategies were implemented in C++ on our Sage cluster as follows. If file fi is needed for a job, but it is not stored locally, then the file is obtained from a remote site. If there is enough free space to store file fi in the site’s storage element, then a copy of fi is stored. Otherwise, if there is not enough empty storage space, then a file currently stored in the storage element must be removed from storage to make room for file fi. LFU, LRU or MRU is applied to determine which file to replace. SWIN is implemented as described in Section III.C.
B. Number of Nodes Powered On
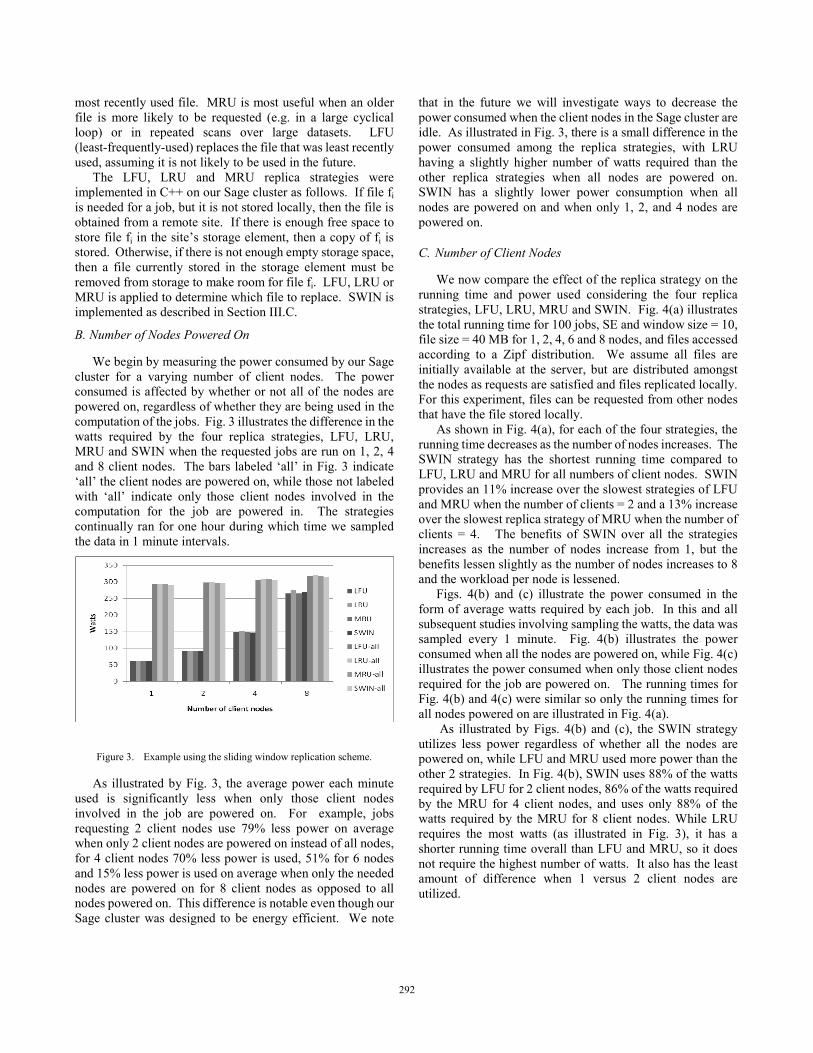
We begin by measuring the power consumed by our Sage cluster for a varying number of client nodes. The power consumed is affected by whether or not all of the nodes are powered on, regardless of whether they are being used in the computation of the jobs. Fig. 3 illustrates the difference in the watts required by the four replica strategies, LFU, LRU, MRU and SWIN when the requested jobs are run on 1, 2, 4 and 8 client nodes. The bars labeled ‘all’ in Fig. 3 indicate ‘all’ the client nodes are powered on, while those not labeled with ‘all’ indicate only those client nodes involved in the computation for the job are powered in. The strategies continually ran for one hour during which time we sampled the data in 1 minute intervals.
Figure 3. Example using the sliding window replication scheme.
As illustrated by Fig. 3, the average power each minute used is significantly less when only those client nodes involved in the job are powered on. For example, jobs requesting 2 client nodes use 79% less power on average when only 2 client nodes are powered on instead of all nodes, for 4 client nodes 70% less power is used, 51% for 6 nodes and 15% less power is used on average when only the needed nodes are powered on for 8 client nodes as opposed to all nodes powered on. This difference is notable even though our Sage cluster was designed to be energy efficient. We note
that in the future we will investigate ways to decrease the power consumed when the client nodes in the Sage cluster are idle. As illustrated in Fig. 3, there is a small difference in the power consumed among the replica strategies, with LRU having a slightly higher number of watts required than the other replica strategies when all nodes are powered on. SWIN has a slightly lower power consumption when all nodes are powered on and when only 1, 2, and 4 nodes are powered on.
C. Number of Client Nodes
We now compare the effect of the replica strategy on the running time and power used considering the four replica strategies, LFU, LRU, MRU and SWIN. Fig. 4(a) illustrates the total running time for 100 jobs, SE and window size = 10, file size = 40 MB for 1, 2, 4, 6 and 8 nodes, and files accessed according to a Zipf distribution. We assume all files are initially available at the server, but are distributed amongst the nodes as requests are satisfied and files replicated locally. For this experiment, files can be requested from other nodes that have the file stored locally.
As shown in Fig. 4(a), for each of the four strategies, the running time decreases as the number of nodes increases. The SWIN strategy has the shortest running time compared to LFU, LRU and MRU for all numbers of client nodes. SWIN provides an 11% increase over the slowest strategies of LFU and MRU when the number of clients = 2 and a 13% increase over the slowest replica strategy of MRU when the number of clients = 4. The benefits of SWIN over all the strategies increases as the number of nodes increase from 1, but the benefits lessen slightly as the number of nodes increases to 8 and the workload per node is lessened.
Figs. 4(b) and (c) illustrate the power consumed in the form of average watts required by each job. In this and all subsequent studies involving sampling the watts, the data was sampled every 1 minute. Fig. 4(b) illustrates the power consumed when all the nodes are powered on, while Fig. 4(c) illustrates the power consumed when only those client nodes required for the job are powered on. The running times for Fig. 4(b) and 4(c) were similar so only the running times for all nodes powered on are illustrated in Fig. 4(a).
As illustrated by Figs. 4(b) and (c), the SWIN strategy utilizes less power regardless of whether all the nodes are powered on, while LFU and MRU used more power than the other 2 strategies. In Fig. 4(b), SWIN uses 88% of the watts required by LFU for 2 client nodes, 86% of the watts required by the MRU for 4 client nodes, and uses only 88% of the watts required by the MRU for 8 client nodes. While LRU requires the most watts (as illustrated in Fig. 3), it has a shorter running time overall than LFU and MRU, so it does not require the highest number of watts. It also has the least amount of difference when 1 versus 2 client nodes are utilized.
292
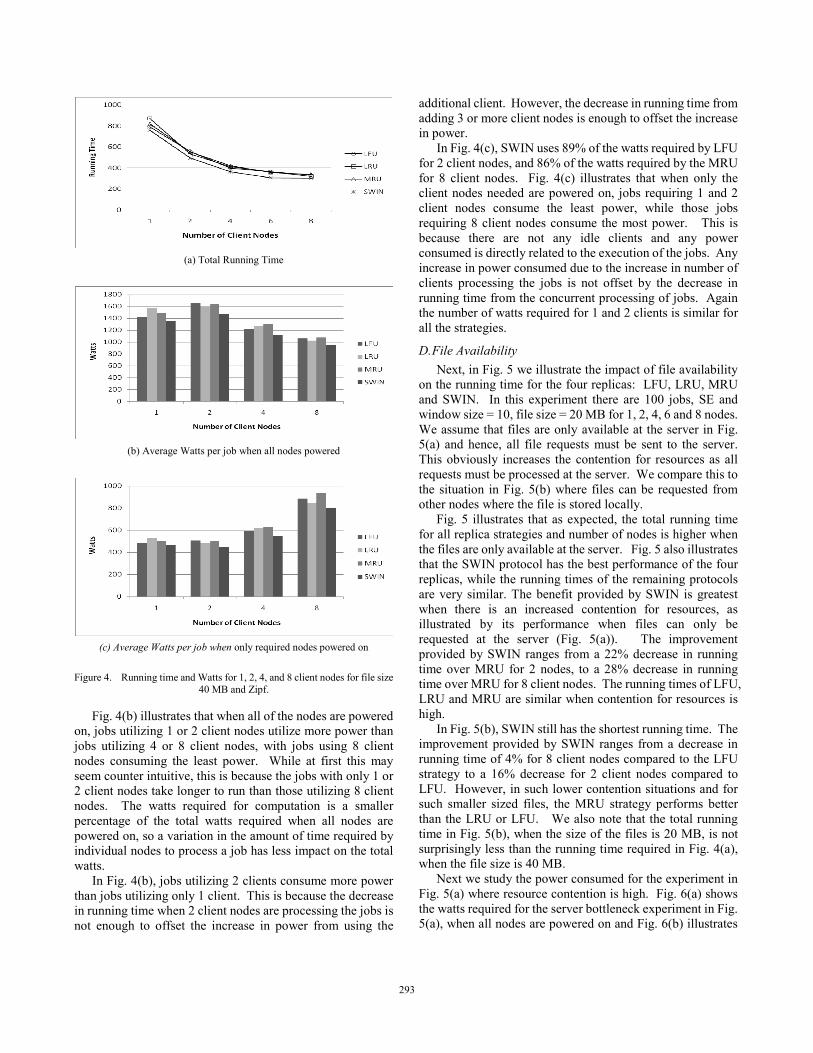
(a) Total Running Time
(b) Average Watts per job when all nodes powered
(c) Average Watts per job when only required nodes powered on
Figure 4. Running time and Watts for 1, 2, 4, and 8 client nodes for file size 40 MB and Zipf.
Fig. 4(b) illustrates that when all of the nodes are powered on, jobs utilizing 1 or 2 client nodes utilize more power than jobs utilizing 4 or 8 client nodes, with jobs using 8 client nodes consuming the least power. While at first this may seem counter intuitive, this is because the jobs with only 1 or 2 client nodes take longer to run than those utilizing 8 client nodes. The watts required for computation is a smaller percentage of the total watts required when all nodes are powered on, so a variation in the amount of time required by individual nodes to process a job has less impact on the total watts.
In Fig. 4(b), jobs utilizing 2 clients consume more power than jobs utilizing only 1 client. This is because the decrease in running time when 2 client nodes are processing the jobs is not enough to offset the increase in power from using the
additional client. However, the decrease in running time from adding 3 or more client nodes is enough to offset the increase in power.
In Fig. 4(c), SWIN uses 89% of the watts required by LFU for 2 client nodes, and 86% of the watts required by the MRU for 8 client nodes. Fig. 4(c) illustrates that when only the client nodes needed are powered on, jobs requiring 1 and 2 client nodes consume the least power, while those jobs requiring 8 client nodes consume the most power. This is because there are not any idle clients and any power consumed is directly related to the execution of the jobs. Any increase in power consumed due to the increase in number of clients processing the jobs is not offset by the decrease in running time from the concurrent processing of jobs. Again the number of watts required for 1 and 2 clients is similar for all the strategies.
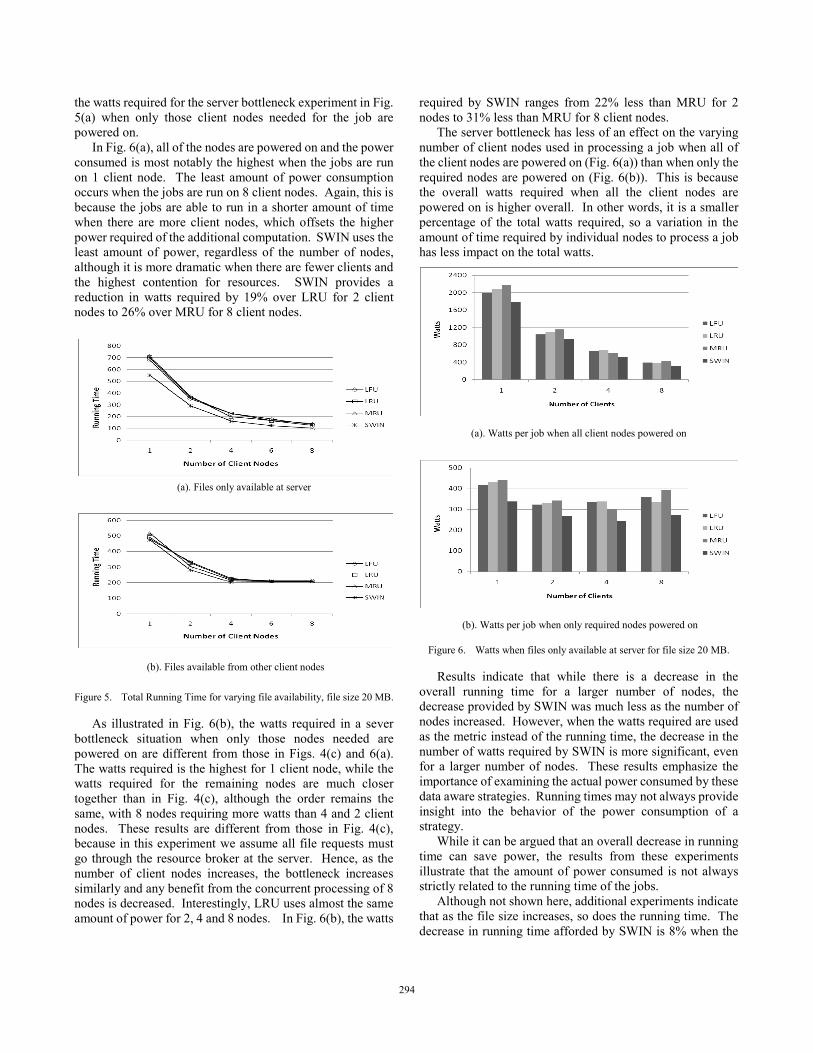
D. File Availability Next, in Fig. 5 we illustrate the impact of file availability
on the running time for the four replicas: LFU, LRU, MRU and SWIN. In this experiment there are 100 jobs, SE and window size = 10, file size = 20 MB for 1, 2, 4, 6 and 8 nodes. We assume that files are only available at the server in Fig. 5(a) and hence, all file requests must be sent to the server. This obviously increases the contention for resources as all requests must be processed at the server. We compare this to the situation in Fig. 5(b) where files can be requested from other nodes where the file is stored locally.
Fig. 5 illustrates that as expected, the total running time for all replica strategies and number of nodes is higher when the files are only available at the server. Fig. 5 also illustrates that the SWIN protocol has the best performance of the four replicas, while the running times of the remaining protocols are very similar. The benefit provided by SWIN is greatest when there is an increased contention for resources, as illustrated by its performance when files can only be requested at the server (Fig. 5(a)). The improvement provided by SWIN ranges from a 22% decrease in running time over MRU for 2 nodes, to a 28% decrease in running time over MRU for 8 client nodes. The running times of LFU, LRU and MRU are similar when contention for resources is high.
In Fig. 5(b), SWIN still has the shortest running time. The improvement provided by SWIN ranges from a decrease in running time of 4% for 8 client nodes compared to the LFU strategy to a 16% decrease for 2 client nodes compared to LFU. However, in such lower contention situations and for such smaller sized files, the MRU strategy performs better than the LRU or LFU. We also note that the total running time in Fig. 5(b), when the size of the files is 20 MB, is not surprisingly less than the running time required in Fig. 4(a), when the file size is 40 MB.
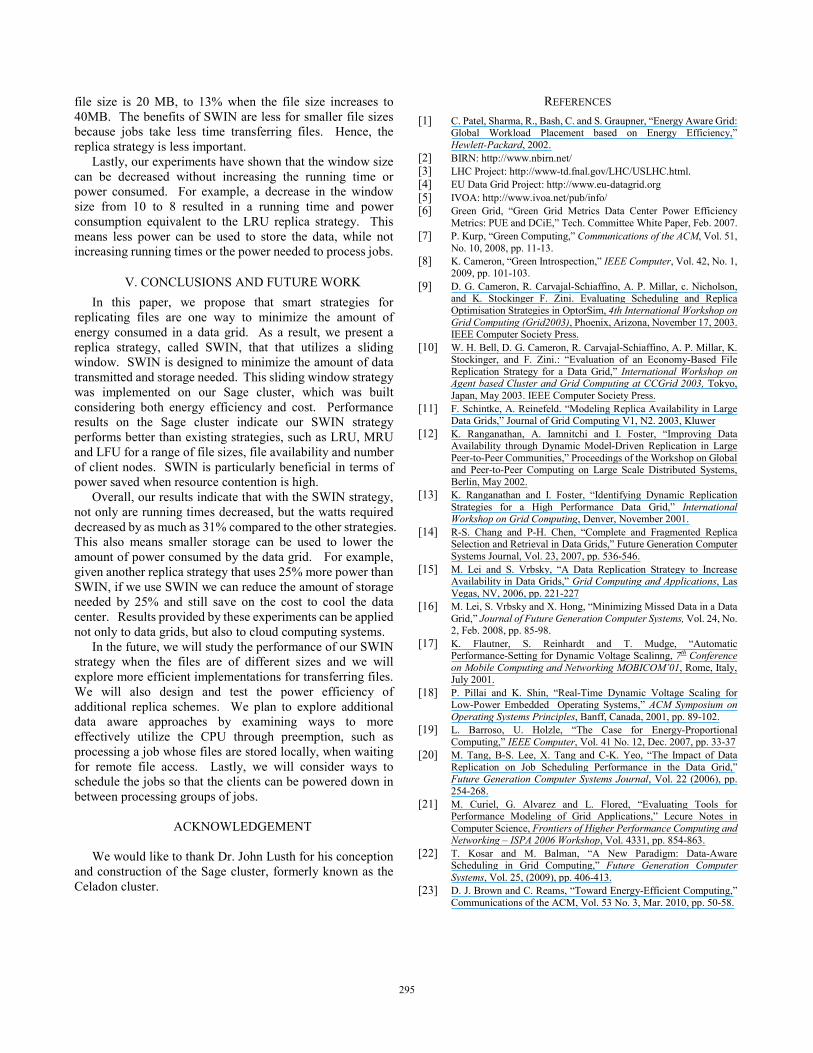
Next we study the power consumed for the experiment in Fig. 5(a) where resource contention is high. Fig. 6(a) shows the watts required for the server bottleneck experiment in Fig. 5(a), when all nodes are powered on and Fig. 6(b) illustrates
293
the watts required for the server bottleneck experiment in Fig. 5(a) when only those client nodes needed for the job are powered on.
In Fig. 6(a), all of the nodes are powered on and the power consumed is most notably the highest when the jobs are run on 1 client node. The least amount of power consumption occurs when the jobs are run on 8 client nodes. Again, this is because the jobs are able to run in a shorter amount of time when there are more client nodes, which offsets the higher power required of the additional computation. SWIN uses the least amount of power, regardless of the number of nodes, although it is more dramatic when there are fewer clients and the highest contention for resources. SWIN provides a reduction in watts required by 19% over LRU for 2 client nodes to 26% over MRU for 8 client nodes.
(a). Files only available at server
(b). Files available from other client nodes
Figure 5. Total Running Time for varying file availability, file size 20 MB.
As illustrated in Fig. 6(b), the watts required in a sever bottleneck situation when only those nodes needed are powered on are different from those in Figs. 4(c) and 6(a). The watts required is the highest for 1 client node, while the watts required for the remaining nodes are much closer together than in Fig. 4(c), although the order remains the same, with 8 nodes requiring more watts than 4 and 2 client nodes. These results are different from those in Fig. 4(c), because in this experiment we assume all file requests must go through the resource broker at the server. Hence, as the number of client nodes increases, the bottleneck increases similarly and any benefit from the concurrent processing of 8 nodes is decreased. Interestingly, LRU uses almost the same amount of power for 2, 4 and 8 nodes. In Fig. 6(b), the watts
required by SWIN ranges from 22% less than MRU for 2 nodes to 31% less than MRU for 8 client nodes.
The server bottleneck has less of an effect on the varying number of client nodes used in processing a job when all of the client nodes are powered on (Fig. 6(a)) than when only the required nodes are powered on (Fig. 6(b)). This is because the overall watts required when all the client nodes are powered on is higher overall. In other words, it is a smaller percentage of the total watts required, so a variation in the amount of time required by individual nodes to process a job has less impact on the total watts.
(a). Watts per job when all client nodes powered on
(b). Watts per job when only required nodes powered on
Figure 6. Watts when files only available at server for file size 20 MB.
Results indicate that while there is a decrease in the overall running time for a larger number of nodes, the decrease provided by SWIN was much less as the number of nodes increased. However, when the watts required are used as the metric instead of the running time, the decrease in the number of watts required by SWIN is more significant, even for a larger number of nodes. These results emphasize the importance of examining the actual power consumed by these data aware strategies. Running times may not always provide insight into the behavior of the power consumption of a strategy.
While it can be argued that an overall decrease in running time can save power, the results from these experiments illustrate that the amount of power consumed is not always strictly related to the running time of the jobs.
Although not shown here, additional experiments indicate that as the file size increases, so does the running time. The decrease in running time afforded by SWIN is 8% when the
294
file size is 20 MB, to 13% when the file size increases to 40MB. The benefits of SWIN are less for smaller file sizes because jobs take less time transferring files. Hence, the replica strategy is less important.
Lastly, our experiments have shown that the window size can be decreased without increasing the running time or power consumed. For example, a decrease in the window size from 10 to 8 resulted in a running time and power consumption equivalent to the LRU replica strategy. This means less power can be used to store the data, while not increasing running times or the power needed to process jobs.
V. CONCLUSIONS AND FUTURE WORK In this paper, we propose that smart strategies for
replicating files are one way to minimize the amount of energy consumed in a data grid. As a result, we present a replica strategy, called SWIN, that that utilizes a sliding window. SWIN is designed to minimize the amount of data transmitted and storage needed. This sliding window strategy was implemented on our Sage cluster, which was built considering both energy efficiency and cost. Performance results on the Sage cluster indicate our SWIN strategy performs better than existing strategies, such as LRU, MRU and LFU for a range of file sizes, file availability and number of client nodes. SWIN is particularly beneficial in terms of power saved when resource contention is high.
Overall, our results indicate that with the SWIN strategy, not only are running times decreased, but the watts required decreased by as much as 31% compared to the other strategies. This also means smaller storage can be used to lower the amount of power consumed by the data grid. For example, given another replica strategy that uses 25% more power than SWIN, if we use SWIN we can reduce the amount of storage needed by 25% and still save on the cost to cool the data center. Results provided by these experiments can be applied not only to data grids, but also to cloud computing systems.
In the future, we will study the performance of our SWIN strategy when the files are of different sizes and we will explore more efficient implementations for transferring files. We will also design and test the power efficiency of additional replica schemes. We plan to explore additional data aware approaches by examining ways to more effectively utilize the CPU through preemption, such as processing a job whose files are stored locally, when waiting for remote file access. Lastly, we will consider ways to schedule the jobs so that the clients can be powered down in between processing groups of jobs.
ACKNOWLEDGEMENT
We would like to thank Dr. John Lusth for his conception
and construction of the Sage cluster, formerly known as the Celadon cluster.
REFERENCES [1] C. Patel, Sharma, R., Bash, C. and S. Graupner, “Energy Aware Grid:
Global Workload Placement based on Energy Efficiency,” Hewlett-Packard, 2002.
[2] BIRN: http://www.nbirn.net/ [3] LHC Project: http://www-td.fnal.gov/LHC/USLHC.html. [4] EU Data Grid Project: http://www.eu-datagrid.org [5] IVOA: http://www.ivoa.net/pub/info/ [6] Green Grid, “Green Grid Metrics Data Center Power Efficiency
Metrics: PUE and DCiE,” Tech. Committee White Paper, Feb. 2007. [7] P. Kurp, “Green Computing,” Communications of the ACM, Vol. 51,
No. 10, 2008, pp. 11-13. [8] K. Cameron, “Green Introspection,” IEEE Computer, Vol. 42, No. 1,
2009, pp. 101-103. [9] D. G. Cameron, R. Carvajal-Schiaffino, A. P. Millar, c. Nicholson,
and K. Stockinger F. Zini. Evaluating Scheduling and Replica Optimisation Strategies in OptorSim, 4th International Workshop on Grid Computing (Grid2003), Phoenix, Arizona, November 17, 2003. IEEE Computer Society Press.
[10] W. H. Bell, D. G. Cameron, R. Carvajal-Schiaffino, A. P. Millar, K. Stockinger, and F. Zini.: “Evaluation of an Economy-Based File Replication Strategy for a Data Grid,” International Workshop on Agent based Cluster and Grid Computing at CCGrid 2003, Tokyo, Japan, May 2003. IEEE Computer Society Press.
[11] F. Schintke, A. Reinefeld. “Modeling Replica Availability in Large Data Grids,” Journal of Grid Computing V1, N2. 2003, Kluwer
[12] K. Ranganathan, A. Iamnitchi and I. Foster, “Improving Data Availability through Dynamic Model-Driven Replication in Large Peer-to-Peer Communities,” Proceedings of the Workshop on Global and Peer-to-Peer Computing on Large Scale Distributed Systems, Berlin, May 2002.
[13] K. Ranganathan and I. Foster, “Identifying Dynamic Replication Strategies for a High Performance Data Grid,” International Workshop on Grid Computing, Denver, November 2001.
[14] R-S. Chang and P-H. Chen, “Complete and Fragmented Replica Selection and Retrieval in Data Grids,” Future Generation Computer Systems Journal, Vol. 23, 2007, pp. 536-546.
[15] M. Lei and S. Vrbsky, “A Data Replication Strategy to Increase Availability in Data Grids,” Grid Computing and Applications, Las Vegas, NV, 2006, pp. 221-227
[16] M. Lei, S. Vrbsky and X. Hong, “Minimizing Missed Data in a Data Grid,” Journal of Future Generation Computer Systems, Vol. 24, No. 2, Feb. 2008, pp. 85-98.
[17] K. Flautner, S. Reinhardt and T. Mudge, “Automatic Performance-Setting for Dynamic Voltage Scalinng, 7th Conference on Mobile Computing and Networking MOBICOM’01, Rome, Italy, July 2001.
[18] P. Pillai and K. Shin, “Real-Time Dynamic Voltage Scaling for Low-Power Embedded Operating Systems,” ACM Symposium on Operating Systems Principles, Banff, Canada, 2001, pp. 89-102.
[19] L. Barroso, U. Holzle, “The Case for Energy-Proportional Computing,” IEEE Computer, Vol. 41 No. 12, Dec. 2007, pp. 33-37
[20] M. Tang, B-S. Lee, X. Tang and C-K. Yeo, “The Impact of Data Replication on Job Scheduling Performance in the Data Grid,” Future Generation Computer Systems Journal, Vol. 22 (2006), pp. 254-268.
[21] M. Curiel, G. Alvarez and L. Flored, “Evaluating Tools for Performance Modeling of Grid Applications,” Lecure Notes in Computer Science, Frontiers of Higher Performance Computing and Networking – ISPA 2006 Workshop, Vol. 4331, pp. 854-863.
[22] T. Kosar and M. Balman, “A New Paradigm: Data-Aware Scheduling in Grid Computing,” Future Generation Computer Systems, Vol. 25, (2009), pp. 406-413.
[23] D. J. Brown and C. Reams, “Toward Energy-Efficient Computing,” Communications of the ACM, Vol. 53 No. 3, Mar. 2010, pp. 50-58.
295


