Embed Size (px)
Citation preview
Data Acquisition in Photovoltaic Systems
VALENTIN DOGARU ULIERU, COSTIN CEPISCA, TRAIAN DANIEL IVANOVICI Electrical Engineering Faculty
Valahia University of Targoviste, Politehnica University Bucharest ROMANIA
[email protected], [email protected], [email protected] www.valahia.ro, www.upb.ro
Abstract: The Solar Amphitheatre at Valahia University of Targoviste is the first integrated PV building in Romania and one of the few in Eastern Europe. The European Union is aiming to increase the use of renewable energy which can replace fossil fuel, diversify energy resources and reduce carbon dioxide emissions. Technologic developments, increasing energy request, reduction of fuel supplies, environment pollution and a much computerized society are factors that intensified research on new energy production solutions. Photovoltaic systems convert sunlight energy into electric energy and are characterized by modularity, operating autonomy and long operation period. The paper presents the authors’ experimental results regarding the operation of the “Solar Amphitheatre” photovoltaic system and aspects on monitoring the electric energy supplied by a photovoltaic generator. Key words: Renewable Energy, Photovoltaic Systems, Graphical Programming 1. Introduction During the last decades, human lifestyle and economic growth has had a profound effect on the energetic sector considerably changing the perspective on the energy issue. The increasing energy demand and variable oil price, insecure energy resources and global warming, have made us aware of the fact that energy is indeed a limited product. Regarding energy resources, the International Energy Agency estimates that oil resources will be over in 40 years, natural gas resources in 60 years and coil resources in 200 years. Given expectations that world oil prices will remain relatively unstable throughout the projection, liquid fuels are the world’s slowest growing source of energy: liquids consumption increases with an average annual rate of 1.2 percent from 2005 to 2030. Renewable energy and coal are the fastest growing energy sources, with consumption increasing by 2.1 percent per year and 2.0 percent, respectively. Projected unstable prices for oil and natural gas, as well as rising concern about the environmental impacts of fossil fuel use, improve prospects for renewable energy sources. Net electricity generation worldwide is estimated to a total of 33.3 trillion kilowatt-hours in 2030, nearly double than the 2005 total of 17.3 trillion kilowatt-hours.
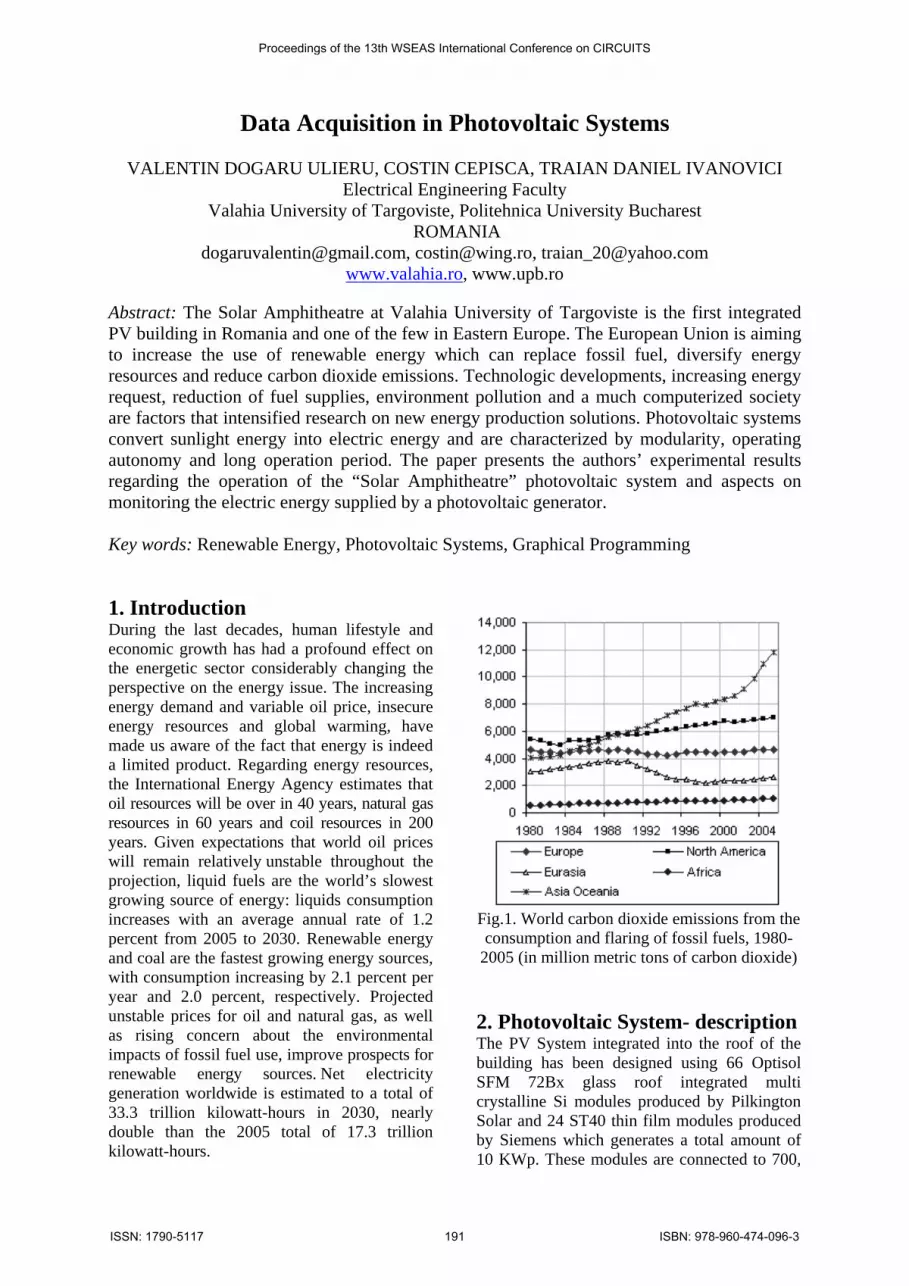
Fig.1. World carbon dioxide emissions from the consumption and flaring of fossil fuels, 1980-
2005 (in million metric tons of carbon dioxide) 2. Photovoltaic System- description The PV System integrated into the roof of the building has been designed using 66 Optisol SFM 72Bx glass roof integrated multi crystalline Si modules produced by Pilkington Solar and 24 ST40 thin film modules produced by Siemens which generates a total amount of 10 KWp. These modules are connected to 700,
Proceedings of the 13th WSEAS International Conference on CIRCUITS
ISSN: 1790-5117 191 ISBN: 978-960-474-096-3
1100, 2000 and 2500W Sunny Boy inverters, which convert dc energy into ac energy by using an intermediate circuit, composed of MOSFET transistor. The research/ experimental aspects are taken into account and therefore arrays of 4,5,6,9 and 11 photovoltaic modules, were realized.
Fig.2. Energy consumption (Energy Information Administration / Annual Energy Review 2007)
These modules can be serial or parallel connected. The dc voltage produced by the photovoltaic systems, is converted by the Sunny Boy inverters (SWR 700, SWR 1100, SWR 2000 and SWR 2500) and supplied directly into the public electric system. The use of a controller to monitor the operating parameters ensures the sine-wave form of the voltage and current, with a low amount of harmonics. The control of operations serves to totally automated operating and to adjusting the MPP (maximum power point). The connection diagram of the PV system presented in this paper has been designed after a series of shading effects analysis and building placement restrictions.
Fig.3. Electric Energy Producing System Using
Photovoltaic Panels (phase A, B)
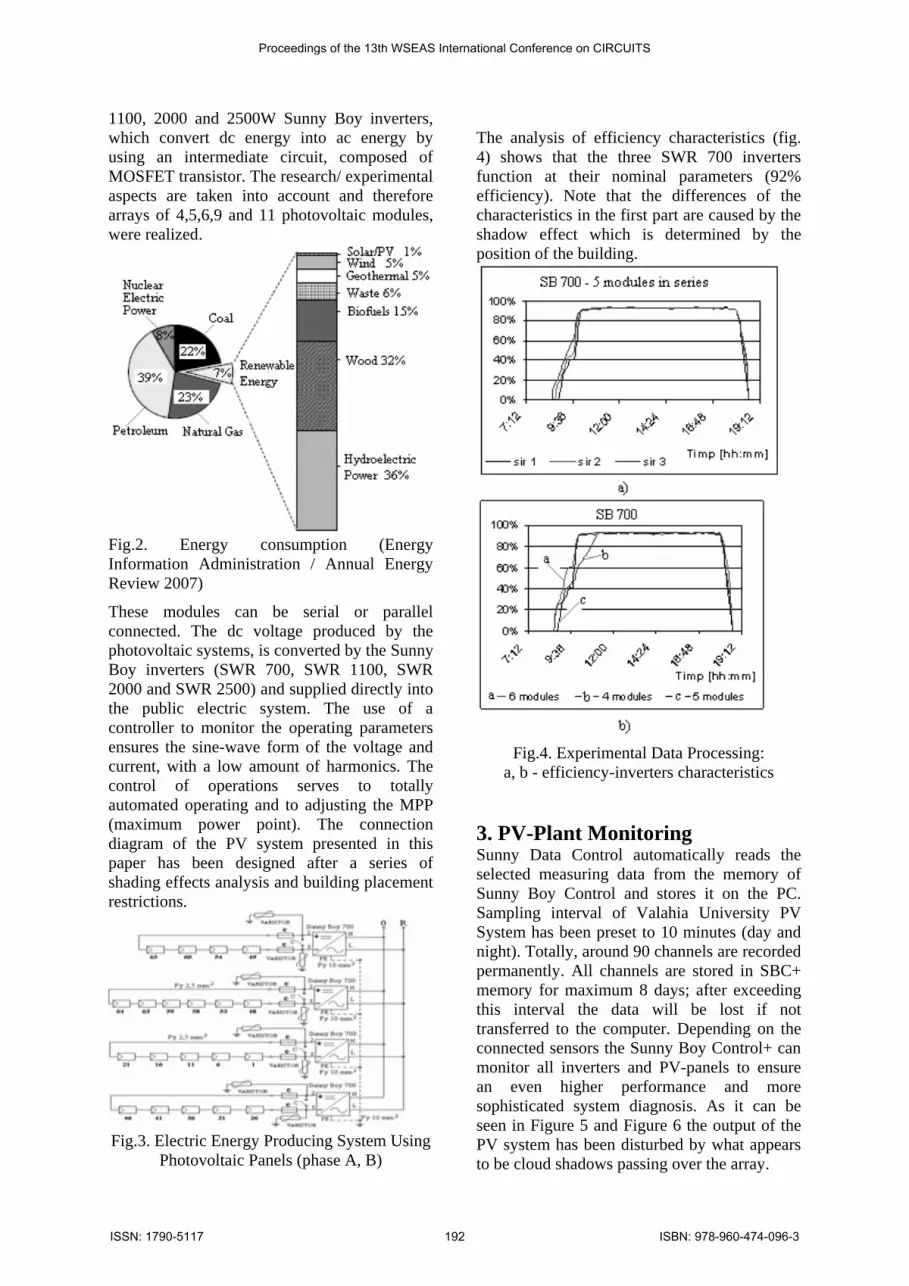
The analysis of efficiency characteristics (fig. 4) shows that the three SWR 700 inverters function at their nominal parameters (92% efficiency). Note that the differences of the characteristics in the first part are caused by the shadow effect which is determined by the position of the building.
Fig.4. Experimental Data Processing:
a, b - efficiency-inverters characteristics 3. PV-Plant Monitoring Sunny Data Control automatically reads the selected measuring data from the memory of Sunny Boy Control and stores it on the PC. Sampling interval of Valahia University PV System has been preset to 10 minutes (day and night). Totally, around 90 channels are recorded permanently. All channels are stored in SBC+ memory for maximum 8 days; after exceeding this interval the data will be lost if not transferred to the computer. Depending on the connected sensors the Sunny Boy Control+ can monitor all inverters and PV-panels to ensure an even higher performance and more sophisticated system diagnosis. As it can be seen in Figure 5 and Figure 6 the output of the PV system has been disturbed by what appears to be cloud shadows passing over the array.
Proceedings of the 13th WSEAS International Conference on CIRCUITS
ISSN: 1790-5117 192 ISBN: 978-960-474-096-3

Fig.5. A daily output plot of a PV System
(February 2007)
Fig.6. A daily output plot of a PV System
(August 2007)
The advantages of using the Sunny Boy Control device are:
Monitoring the operation of connected inverters and photovoltaic modules, error messages and their performances; On-line transmission of measured values
from the selected inverters; Detecting certain errors in the operation of
photovoltaic modules; Graphic shielding of the selected inverter
characteristics or of the comparative data from various inverters; Providing reports by fax or SMS Continuous distance monitoring of the
system.
Fig.7. A week of data plots - PV System
(February 2007)
Fig.8. A week of data plots - PV System
(August 2007)
Proceedings of the 13th WSEAS International Conference on CIRCUITS
ISSN: 1790-5117 193 ISBN: 978-960-474-096-3

Fig.9. A month of data plots - PV System
(August 2007)
4. Determining Operation Characteristics The virtual instrument designed here represents an association between the hard-ware equipment (AT-MIO 16XE50 acquisition board, a signal conditioning device) and the soft-ware application (LabVIEW) which implements the required functions, playing the part of an interface between the human operator and the measurement system. The use of this hard-ware equipment ensures the flexibility (other virtual instruments can be designed) to measure other physical measures using sensors/transducers which are specific to the measurement process. Analog inputs can be differently configured, with a voltage level of ±2.5V, ±5V, ±10V (bipolar/single polar) which can be selected through the configuration program of the acquisition board. The block diagram of the acquisition system is presented in fig. 10 and the result (front panel of virtual instrument) is presented in fig. 11. To ensure the accuracy of the measurement, the operating parameters of the photovoltaic system and the configuration of the acquisition system are taken into account and have imposed the signal conditioning and the setting of the signal source, of the field and of the channels. The adopted solution to condition the signal uses current and voltage transducers based on the Hall Effect. As we have to determine the
operation characteristics of the photovoltaic panels and the panel arrays, the application allows measuring the values of current and voltage, simultaneously trace characteristics (current-voltage, power-voltage, power-charge resistance), present the measured parameters (during the data acquisition) in tables, continuous acquisition and save data into files for future processing (fig.6).
Fig.10. Block diagram
Fig.11. Front Panel DC Characteristics (5 Pilkington modules serial connected)
Fig.12. Current-Voltage Characteristic
Optimization in LabVIEW
Proceedings of the 13th WSEAS International Conference on CIRCUITS
ISSN: 1790-5117 194 ISBN: 978-960-474-096-3

The acquired data can be saved into text files or Excel for further analysis and processing. Fig. 13a presents the current-voltage experimental characteristics (continuous line, 1/4/5/6/9/11 serial modules) and calculated characteristics
(interrupted line, 2/3/7/8/10 serial modules). Fig. 13b presents the power-voltage experimental characteristics, for the implemented schemes.
a)
b)
Fig.13. DC Characteristics: current-voltage characteristics; power-voltage characteristics
For alternative current systems it is necessary to obtain signals with volt-range amplitude to be applied to the input of the data acquisition board. For phase/line voltages there can be used voltage dividers (which do not ensure galvanic isolation) or voltage measurement transformers (ensure galvanic separation). Shunts (current-voltage converters) or current measurement transformers can be used for currents. The use of both voltage dividers and shunts must be done by taking into account the current through the voltage divider, the voltage drop on the shunt, the power dissipation, parasite resistances, self-heating effects and dynamic effects. The use of voltage-current measurement transformers guarantees galvanic isolation of the measuring system but it introduces ratio and angle errors and inadequate perturbation
transfer. The solution adopted was to use current and voltage transducers based on the Hall Effect. To obtain a good magnetic sensor the magnetic field is concentrated around the transducer, by using a circular core (used as a flux concentrator and made of a material with high magnetic permeability), which ensures both an increase of the magnetic field in the area of the sensor and the independence from the position of the conductor inside the core. Non-linear behavior of the flux concentrator can be obtained by using an operational amplifier, which injects a compensation current through the reaction loop. Figure 14 presents the front panel of the LabVIEW application which acquires and processes data in the ac circuit from the output of the phase B- connected inverters.
Proceedings of the 13th WSEAS International Conference on CIRCUITS
ISSN: 1790-5117 195 ISBN: 978-960-474-096-3

Fig.14. Front Panel of the Acquisition System
5. Conclusions Even though the costs of installations producing electric energy using photovoltaic panels are high compared to the costs of conventional installations, the number of such systems is continuously increasing. It is very important to determine the output characteristics of the photovoltaic panels in order to achieve an accurate connection and operation of the device and reduce energy losses. Monitoring activities follow the operation analysis by periodical reports, papers, synthesis, with the precise aim to make the most accurate decisions to produce electric energy using unconventional sources.
6. References 1. Ambros, T., s.a. – Renewable energy, Ed. “TEHNICA-INFO”, Kishinev, 1999 2. Awerbuch, S: - Energy Diversity and Security in the EU: Mean-Variance Portfolio Analysis, of Electricity Generating Mixes, and the Implications for Renewables, in EURELECTRIC Twin Conf. on DG, Brussels 2002 3. Szekely, I, s.a. – Systems for data acquisition and processing, Ed. Mediamira, Cluj - Napoca, 1997 4. Vasile, N. - Players on the market in renewable energy, "Round Table" renewable sources of energy between the European Directive 77/2001 and reality ", Chamber of Commerce of Romania and Bucharest, May 2003 5. *** Energy Information Administration / Annual Energy Review 2007 6. *** www.ni.com, www.lem.com
Proceedings of the 13th WSEAS International Conference on CIRCUITS
ISSN: 1790-5117 196 ISBN: 978-960-474-096-3


