Embed Size (px)
Citation preview

DARKS ARE PROCESSED FASTER THAN LIGHTS
Stanley Jose Komban1, Jose-Manuel Alonso1, and Qasim Zaidi11Graduate Center for Vision Research, State University of New York, College of Optometry, NewYork, USA.
AbstractRecent physiological studies claim that Dark stimuli have access to greater neuronal resourcesthan Light stimuli in early visual pathway. We used two sets of novel stimuli to examine thefunctional consequences of this Dark dominance in human observers. We show that increment anddecrement thresholds are equal when controlled for adaptation and eye-movements. However,measurements for salience differences at high-contrasts show that Darks are detectedpronouncedly faster and more accurately than Lights when presented against uniform binary noise.In addition, the salience advantage for Darks is abolished when the background distribution isadjusted to control for the irradiation illusion. The threshold equality suggests that the highestsensitivities of neurons in the ON and OFF channels are similar, whereas the salience difference isconsistent with a population advantage for the OFF system.
KeywordsON; OFF; human; retina; thalamus; visual cortex; natural scene
INTRODUCTIONMach (1886) demonstrated that the perception of configurations as wholes is disrupted iftheir components are separated into Dark and Light contrast polarities. Physiologicalevidence for independent processing of light increments and decrements by separate ON andOFF pathways in the retina was provided by Hartline (1938). The segregation begins at thefirst synapse of photoreceptors with sign-inverting and sign-conserving bipolar cells(Werblin and Dowling, 1969), and persists at the striate cortex (Jin et al., 2008). But doesthe visual system treat these two inputs as equals differing only in polarity?Neuroanatomical and neurophysiological studies in Macaques and cats indicate OFFdominance of neural resources: there are more OFF than ON bipolar cells in the centralretina (Ahmad et al., 2003), OFF center geniculate afferents dominate the corticalrepresentation of central vision (Jin et al., 2008; Jin et al., 2011), and visual responses toDark stimuli dominate the superficial layers of V1 (Yeh et al., 2009; Xing et al., 2010). Inaddition, Darks generate larger visual evoked potentials than Lights (Zemon et al., 1988).
Psychophysical threshold measurements of ON and OFF sensitivity have given mixedresults (Blackwell, 1946; Krauskopf, 1980; Bowen et al., 1989; Poot et al., 1997). Morecomplex behavioral tasks have revealed the advantage of Dark-on-Light over Light-on-Darkin reading (Buchner and Baumgartner, 2007), and the primacy of Dark texels in judgingtexture variance (Chubb and Nam, 2000). We first show that, when adaptation is equated
Send correspondence to: Qasim Zaidi Graduate Center for Vision Research State University of New York College of Optometry NewYork, NY 10036 Tel.: 212 938- 5542 [email protected] financial interests: The authors declare no competing financial interests.
NIH Public AccessAuthor ManuscriptJ Neurosci. Author manuscript; available in PMC 2012 January 22.
Published in final edited form as:J Neurosci. 2011 June 8; 31(23): 8654–8658. doi:10.1523/JNEUROSCI.0504-11.2011.
NIH
-PA Author Manuscript
NIH
-PA Author Manuscript
NIH
-PA Author Manuscript
for, and eye-movements cannot contaminate the measurements, ON and OFF channelsensitivities are essentially equal at threshold. Then we show that, at supra-threshold levelson uniform-noise backgrounds, observers can report the number ofDark targets significantlyfaster and more accurately than Light targets. Finally, we show that the advantage for Darksdisappears when the background is adjusted for the irradiation illusion, in which Lights inDark backgrounds appear larger than physically equal Darks in Light backgrounds (Galilei,1632).
MATERIALS AND METHODSAll stimuli were presented using MATLAB (Mathworks) and Psychtoolbox 3 (Brainard,1997) on a Sony GDM-F520 21″ CRT monitor, calibrated for linearity, subtending3.84°×5.12° of visual angle at a distance of 4.2m, each pixel subtending 0.05° × 0.05°. Themean luminance of the monitor was held constant at 50 cd/m2. Experiments were conductedin a dark room. Observers used a numerical keypad to respond. 5 observers, 3 females and 2males (including the author, SJK) with corrected or 20/20 vision participated in Experiment1, and 4 observers, 1 male and 3 females in Experiments 2 and 3.
Experiment 1: Sensitivity of isolated ON and OFF channelsTo selectively activate ON and OFF pathways, observers first adapted for 120s to the mid-gray of the monitor, then either a horizontal or a vertical square-wave grating appeared as anincrement or a decrement on the adapting level, i.e. one set of bars remained at mid-gray(Fig. 1a). Observers were required to report the orientation of the grating. After 0.1s, thegrating was turned into a horizontal-vertical grid for 0.05s, ensuring that the observers’horizontal versus vertical decisions could only utilize the 0.1s period, which minimizes thechance of an eye movement activating both channels across spatial edges. Under thiscondition the receptive field centers of ON and OFF cells respond to increments anddecrements respectively. The receptive field surrounds also respond to the opposite polaritybut with a much weaker response than those generated by the receptive field centers. Sincepsychophysical thresholds are determined by the most responsive neurons, it is reasonable toassume that increments are conveyed mostly by the receptive field centers of ON cells anddecrements by the centers of OFF cells. Contrast thresholds were measured using themethod of constant stimuli at spatial frequencies of 16, 24 and 32 cycles/degree (cpd), using50 trials per level. Sensitivity of ON and OFF pathways during different levels of transientand steady adaptation was measured using the same stimulus sequence at 16 cpd but withthe background shifted 0.5 or 1.5 times the mid-gray, at 0s or 0.1s before the onset of thegrating. As an additional test, we used temporal sawtooth modulation that has been shown toselectively activate ON and OFF retinal ganglion cells (Kremers et al., 1993), and askedobservers to detect the presence of flicker on a 2° circular field against a mid-graybackground, in a 2IFC task.
Experiment 2: Reaction times to Dark and Light targetsObservers were asked to report, as rapidly as possible, the number (1 to 3) of Dark or Lighttarget squares against a uniform binary noise background randomized for every trial (Fig.2a). Observers initially adapted to mid-gray for 120s and an auditory tone for stimulus onsetwas provided 2s prior to the end of the adaptation period. Subsequent stimulus presentationswere initiated automatically following the observer’s response to the number of targets. Arepresentative sequence is shown in Figure 2a and correct responses are 3, 1, 3, 2, 3, 1, 2, 2,1, 2, 2 & 3. The target size was six times the size of the background texels, so the probabilityof a false target formed by random grouping of texels was negligible (p=0.02). ReactionTimes (RTs) for 1600 trials were collected per observer, spread across 4 sessions. RThistograms (bin size = 0.1 s), were averaged and fitted using the Exponential-Gaussian
Komban et al. Page 2
J Neurosci. Author manuscript; available in PMC 2012 January 22.
NIH
-PA Author Manuscript
NIH
-PA Author Manuscript
NIH
-PA Author Manuscript

function (Ratcliff, 1979; Cousineau, 2005). The function assumes that RT’s result fromtaking the sum of independent Gaussian and Exponential random variables, implying thatthe probability distribution characterizing RT’s is the convolution of an Exponential (exp)with a Gaussian ( ϕ ) (Equation 1):
(1)
The 3 parameters of the function, mean ( μ ) and standard deviation ( σ ) of the normalcomponent and mean of the exponential ( τ ), were estimated using Maximum LikelihoodEstimation. The Goodness of Fit was tested using a chi-squared statistic. The mean RT forthe distributions was calculated as the sum of the Gaussian and Exponential means. Post-hocplanned contrasts compared the mean RTs of Dark and Light targets.
Chubb and Nam (2000) used independent and identically distributed textures composed of 9equally spaced gray-levels from Light to Dark to determine the impact of different gray-levels in judging texture variance. They demonstrated that the perception of texture contrastis affected disproportionately by Dark texels. To test if we could replicate their results withour stimuli, we repeated our detection experiment on a background consisting of a uniformdistribution of 9 equally spaced luminance levels. The targets were uniform noise patternswith luminance values from the top 3 levels for Light and bottom 3 levels for Dark (Fig. 2c).Correct responses for Figure 2c are 2, 2, 3, 1, 2, 1, 1, 3, 2, 3, 2 & 3.
Experiment 3: Correction for the irradiation illusionConsistent with the irradiation illusion, the Light texels in the uniform binary noise appearedlarger than the physically equal Dark texels. To test whether the perceptual inequality of thebackground favored the detection of Dark targets, we measured the irradiation illusion withtwo methods and controlled for it. In Method 1, we presented a single Dark or Light texelfrom the binary background against a larger background of opposite polarity (Fig. 3a, left).At physical equality the Light square appeared larger than Dark. Therefore, using largerversus smaller responses from each observer, the size of the Light square was adjusted toachieve perceptual equality with the fixed Dark square. The mean size (s.e.m. < 0.001) foreach observer was calculated from 8 reversal points per session for 10 sessions (s.d. <1.5).In Method 2, the Dark/Light proportion was varied randomly through 7 different values(Fig. 3a, right) and observers reported if the binary noise background had more Light area orDark. The Dark/Light proportion at which observers equated for area was estimated frompsychometric fits. Targets were then presented on binary backgrounds with binomialprobabilities for Dark and Light texels adjusted to correct the irradiation illusion for eachobserver.
RESULTSExperiment 1: Sensitivity of isolated ON and OFF channels
To isolate sensitivities of ON and OFF channels, after adaptation to mid-gray, either ahorizontal or a vertical square-wave grating appeared as either an increment or a decrementon the adapting luminance (Fig. 1a). To minimize the chances of an eye movementactivating both channels, the grating turned into a horizontal-vertical grid to mask thecritical orientation information. Figure 1b shows contrast thresholds for 5 observers toincrement and decrement gratings. The results show that there was no significant differencein performance between ON and OFF channels at steady adaptation, except that thresholds
Komban et al. Page 3
J Neurosci. Author manuscript; available in PMC 2012 January 22.
NIH
-PA Author Manuscript
NIH
-PA Author Manuscript
NIH
-PA Author Manuscript

at 32 cpd were consistently lower for decrements than increments. However the differencedid not reach significance (Wilcoxon signed-rank test, p=0.068).
Next we measured the sensitivity of ON and OFF channels during different levels oftransient and steady adaptation, using the same stimulus but with the background shifted 0.5or 1.5 times the mid-gray at 0s or 0.1s before the grating presentation. Figure 1c shows thatcontrast thresholds after negative step changes were significantly lower than for positive(Poot et al., 1997), but there was no consistent threshold difference for increments anddecrements in any adaptation condition.
We also used sawtooth modulation to selectively activate ON and OFF channels (Kremers etal., 1993). Two observers were asked to detect the presence of flicker on a circular fieldagainst a mid-gray background. The flicker detection thresholds (Fig. 1c) show no consistentdifference between Fast ON and Fast OFF saw-teeth at 8Hz, contradicting results using themethod of adjustment (Bowen et al., 1989), but consistent with ganglion cell measurementsshowing equal ON and OFF cell sensitivity (Kremers et al., 1993).
Experiment 2: Reaction times to Dark and Light targetsFour observers were asked to report, as rapidly as possible, the number (1 to 3) of Dark orLight target squares against a uniform binary noise background randomized for every trial(Fig. 2a). The RT distributions in Figure 2b show that, on average, observers responded 0.2s faster to Dark targets than Light targets (p < 0.01, ANOVA) and were also more accurateat reporting the number of Dark targets (92% versus 83% correct). We repeated ourdetection experiment on a uniform distribution of 9 equally spaced luminance levels (Chubband Nam, 2000). The targets were uniform noise patterns with luminance values from thetop 3 levels for Light and bottom 3 levels for Dark (Fig. 2c). In the results shown in Figure2d, the RTs and percent correct on the 9-level backgrounds were also better for Dark thanLight targets.
Experiment 3: Correction for the irradiation illusionIn trying to identify the causes of this Dark/Light asymmetry, we observed that thebackground binary noise appeared to have more area covered by Light than Dark despitephysical equality, seemingly consistent with the irradiation illusion (Galilei, 1632). Themagnitude of the illusion was estimated with two methods. First, we presented a single Darkor Light texel from the binary background against a larger background of opposite polarity(Fig. 3a, left) and asked observers to adjust the size of the Light square to achieve perceptualequality with the fixed Dark square. Second, the observers reported if the binary noisebackground had more Light or Dark area while the Dark/Light proportion was variedrandomly through 7 different values (Fig. 3a, right). The two methods used to measure theirradiation illusion converged to approximately the same value: Light/(Light+Dark)=0.4(Fig. 3b). When the backgrounds were corrected for the irradiation illusion so that thebackground looked equally Dark and Light, the RT and percent of correct responses forDark and Light targets were similar ((85% versus 87% correct) Fig. 3c). These resultssuggest that the Dark/Light asymmetry was caused by the perceptual inequality in theuniform background.
DISCUSSIONOur results demonstrate that contrast thresholds for increments and decrements are similaracross different spatial frequencies (Fig 1b,c). However, at supra-threshold levels in noisybackgrounds, we show that Darks are perceived remarkably faster and more accurately thanLights. Moreover, we show that the advantage to perceive Darks disappears when the
Komban et al. Page 4
J Neurosci. Author manuscript; available in PMC 2012 January 22.
NIH
-PA Author Manuscript
NIH
-PA Author Manuscript
NIH
-PA Author Manuscript

background is adjusted to correct for the irradiation illusion. The perceptual advantage forDarks with a simple detection task, is consistent with recent studies showing a dominantrepresentation of Dark stimuli in early visual processing (Ahmad et al., 2003; Jin et al.,2008; Yeh et al., 2009; Xing et al., 2010; Jin et al., 2011).
Our threshold results contradict previous psychophysical claims that observers are moresensitive to decrements than increments at threshold (Blackwell, 1946; Krauskopf, 1980).The short presentations of incremental and decremental gratings in our study (Fig 1a), weredesigned not only to isolate ON and OFF pathways by minimizing eye-movements, but alsoto minimize adaptation changes caused by the test stimulus. Since light adaptation is fasterafter a negative step change than after a positive step (Poot et al., 1997), longer stimuluspresentations would lead to lower measured thresholds for decrements. The equal thresholdsfor Rapid-OFF and Rapid-ON sawtooth modulation obtained with our objective 2IFCmethod (Fig 1d) also contradict the differences reported using the less accurate method ofadjustment (Bowen et al., 1989). Psychophysical thresholds reflect the responses of neuronsmost sensitive to the test stimulus, so taken together our threshold results suggest that thehighest sensitivities of neurons in the ON and OFF channels are similar. Recordings fromretinal ganglion cells confirm our results that sawtooth modulation can be used to isolate ONand OFF visual responses, and that the two classes of cells have similar sensitivity underphotopic conditions in macaques (Kremers et al., 1993).
Our main result is that Dark targets are perceived faster and more accurately than Lighttargets at supra-threshold levels in noisy backgrounds (Fig 2). Since these results cannot bedue to differences in the peak sensitivities of ON and OFF pathways, a possible explanationcould be based on the greater neuronal resources to process Darks available in the earlyvisual pathway (Ahmad et al., 2003; Jin et al., 2008; Yeh et al., 2009; Xing et al., 2010) .
An alternate explanation could be based on asymmetries in the response variability to Darksand Lights. The information-theoretic analysis of Pandarinath et al. (2010) shows that, in aPoisson distribution, decrements from the mean are more discriminable than incrementsbecause they have lower variability. Their derivations predict that the integration periodsrequired for detection should be smaller for decrements than for increments. We haveconsidered different ways in which Poisson photon statistics could apply to the detection ofDark and Light patches in Experiment 2. On the uniform binary noise, 50% of each testpatch was a transition from the opposite polarity (See Methods). For these binary stimuli,Pandarinath et al.’s equations predict decrements to be 0.96 times as discriminable asincrements, which is much smaller in magnitude and in the wrong direction from the resultsof Experiment 2. Further, the binary-noise backgrounds are not treated by the “salience”system as equivalent mean level backgrounds because, if the noise backgrounds inExperiment 2 are replaced by uniform backgrounds equated for mean luminance, there is noRT difference between detection of Dark and Light patches. Finally, if the patches aredetected by eye-movements across their boundaries, there will be equal numbers oftransitions of each polarity for each eye-movement on backgrounds with equal numbers ofLight and Dark texels. Consequently, our stimulus design excludes photon decrement/increment asymmetries as an explanation. Further, both Dark and Light targetspredominantly evoke incremental response in OFF and ON cells respectively, so adifference between incremental and decremental Poisson spike trains does not apply to thetasks in Experiments 2 and 3.
In the irradiation illusion, a Light square on a Dark background appears larger than a Darksquare on a Light background, and this makes uniform binary noise seem to have greaterLight area. It is interesting that correcting for the illusion abolishes the salience advantagefor Darks (Fig 3c). The locus of the irradiation illusion remains elusive but it is often
Komban et al. Page 5
J Neurosci. Author manuscript; available in PMC 2012 January 22.
NIH
-PA Author Manuscript
NIH
-PA Author Manuscript
NIH
-PA Author Manuscript
suggested that it is due to light scatter originating in the optical structures of the eye. Ourresults suggest that the locus of the irradiation illusion is earlier than the locus of thesaliency task in Experiment 2 & 3, but do not identify the anatomical location of the illusion.Mathematically, blurring plus a nonlinear compression of the luminance signal simulate theirradiation illusion. The main question is whether the nonlinearity is early and affects allvisual tasks, or late so that it only affects the most complex tasks. In order to test for an earlylocus, we took as the input a pair of Dark and Light squares against a larger background ofopposite polarity (Fig. 3a), and used a simple model comprising three sequential stages. Ateach stage we compared the Full Width at Half-height of the Maxima (FWHM) of the Darkto the Light output waveform: (R = (FWHM(Dark) / (FWHM(Light) + FWHM(Dark))). Theinputs were first convolved with the point-spread function of the eye (Campbell andGubisch, 1966) for the pupil size appropriate to the mean luminance (Le Grand, 1957).Convolution with the point spread function decreased the contrast of the texels withoutaltering their FWHM. The output was then passed through a compressive nonlinear functionof the form 0.5*log (1+2 Ω ). The compressive function changed the FWHMs to a ratioR=0.43. Finally, ON and OFF Difference of Gaussian (DOG) filters (Rodieck, 1965,Chichlinisky and Kalmar, 2000) were applied separately to the Dark and Light texels fromthe preceding stage. Filtering added an extra distortion, so that the model gave an irradiationillusion similar to that obtained empirically (R=0.4). These simulations indicate thatpublished measures of optical blur are not sufficient to account for the magnitude of theirradiation illusion unless a compressive nonlinear function of luminance is added in theearly stages of visual processing. Even though there is evidence for compressive responsefunctions as early as photoreceptors (Schnapf et al., 1990), we were unable to find definitivemeasurements of the non-linear function to use in our model. We can only conclude that, ifthe retinal non-linearity is not sufficient to explain the irradiation illusion, some or part ofthe illusion could be due to cortical mechanisms.
Consistent with a later locus for the irradiation illusion are the gain-control mechanisms inthe retina (Shapley and Victor, 1978; Kaplan and Shapley, 1986; Smirnakis et al., 1997;Brown and Masland, 2001) that lead to fairly linear contrast-response curves for parvo-cellsin the LGN. In addition, the result of Nam and Chubb (2000) demonstrated that gray-levelscarry weight proportional to their values when observers judge average luminance ofrandom textures, a finding that is incompatible with an early non-linear compression ofluminance. Perhaps, the differences between ON and OFF pathways contribute to thisclassical illusion. For example, ON retinal ganglion cells in the retinal periphery have largerreceptive fields than OFF retinal ganglion cells (Chichilnisky and Kalmar, 2002) and theOFF pathway is better represented than the ON pathway at the center of vision in the cortex(Jin et al., 2008; Jin et al., 2011).
The irradiation illusion could explain results of complex behavioral tasks showing supra-threshold ON/OFF asymmetries. For example, while Chubb and Nam (2000) demonstratedthat Dark texels carry more weight when judging luminance variance of random textures,the results in Fig 2c&d show that the 9-level Chubb-Nam noise backgrounds have a similareffect on Dark salience as the uniform-noise background. Therefore the irradiation illusionthat can account for the measured salience differences in our stimuli, could also explain thedominance of Dark texels when perceiving texture variance. Another manifestation of theirradiation illusion is that Light letters on Dark appear less sharp than Dark letters on Light,and this could potentially explain the differences in reading performance (Buchner andBaumgartner, 2007).
It is worth noting that the luminance profile of natural scenes has been shown to be skewedtowards Darks (van Hateren et al., 2002; Balasubramanian and Sterling, 2009; Ratliff et al.,2010). While the presence of smaller, denser and more numerous OFF bipolar cells suggest
Komban et al. Page 6
J Neurosci. Author manuscript; available in PMC 2012 January 22.
NIH
-PA Author Manuscript
NIH
-PA Author Manuscript
NIH
-PA Author Manuscript

an evolutionary adaptation to these luminance statistics, our results offer a related functionalinterpretation. The greater amount of Dark makes natural scenes similar to our irradiation-corrected backgrounds. Hence, analogous to the results of Experiment 3, the asymmetry innatural luminance statistics will serve to equalize the salience of Darks and Lights in naturalscenes.
AcknowledgmentsWe are grateful to the observers who participated in the study and to NIH (EY013312, EY007556 and EY005253)for funding support.
REFERENCESAhmad KM, Klug K, Herr S, Sterling P, Schein S. Cell density ratios in a foveal patch in macaque
retina. Vis Neurosci. 2003; 20:189–209. [PubMed: 12916740]Balasubramanian V, Sterling P. Receptive fields and functional architecture in the retina. J Physiol.
2009; 587:2753–2767. [PubMed: 19525561]Blackwell HR. Contrast thresholds of the human eye. J Opt Soc Am. 1946; 36:624–643. [PubMed:
20274431]Bowen RW, Pokorny J, Smith VC. Sawtooth contrast sensitivity: decrements have the edge. Vision
Res. 1989; 29:1501–1509. [PubMed: 2635476]Brainard DH. The Psychophysics Toolbox. Spat Vis. 1997; 10:433–436. [PubMed: 9176952]Brown SP, Masland RH. Spatial scale and cellular substrate of contrast adaptation by retinal ganglion
cells. Nat Neurosci. 2001; 4:44–51. [PubMed: 11135644]Buchner A, Baumgartner N. Text - background polarity affects performance irrespective of ambient
illumination and colour contrast. Ergonomics. 2007; 50:1036–1063. [PubMed: 17510822]Chichilnisky EJ, Kalmar RS. Functional asymmetries in ON and OFF ganglion cells of primate retina.
J Neurosci. 2002; 22:2737–2747. [PubMed: 11923439]Chubb C, Nam JH. Variance of high contrast textures is sensed using negative half-wave rectification.
Vision Res. 2000; 40:1677–1694. [PubMed: 10814756]Cousineau D. How to use MATLAB to fit the ex-Gaussian and other probability functions to a
distribution of response times. Tutorials in Quantitative Methods for Psychology. 2005; 4:35–45.Galilei, G. Dialogue concerning the Two Chief World Systems: Translated by Stillman Drake. 2nd rev.
ed. Berkeley: 1632. 1967Hartline HK. The response of single optic nerve fibers of the vertebrate eye to illumination of the
retina. Am J Physiol. 1938; 121:400–415.Jin J, Wang Y, Swadlow HA, Alonso JM. Population receptive fields of ON and OFF thalamic inputs
to an orientation column in visual cortex. Nat Neurosci. 2011; 14:232–238. [PubMed: 21217765]Jin JZ, Weng C, Yeh CI, Gordon JA, Ruthazer ES, Stryker MP, Swadlow HA, Alonso JM. On and off
domains of geniculate afferents in cat primary visual cortex. Nat Neurosci. 2008; 11:88–94.[PubMed: 18084287]
Kaplan E, Shapley RM. The primate retina contains two types of ganglion cells, with high and lowcontrast sensitivity. Proc Natl Acad Sci U S A. 1986; 83:2755–2757. [PubMed: 3458235]
Krauskopf J. Discrimination and detection of changes in luminance. Vision research. 1980; 20:671–677. [PubMed: 7445437]
Kremers J, Lee BB, Pokorny J, Smith VC. Responses of macaque ganglion cells and human observersto compound periodic waveforms. Vision Res. 1993; 33:1997–2011. [PubMed: 8249315]
Le Grand, Y. Light, Color and Vision. John Wiley & Sons Inc.; New York: 1957.Mach, E. Beiträge zur Analyse der Empfindungen. Gustav Fischer; Jena: 1886. Jena: G. FischerNam JH, Chubb C. Texture luminance judgments are approximately veridical. Vision Res. 2000;
40:1695–1709. [PubMed: 10814757]Pandarinath C, Victor JD, Nirenberg S. Symmetry breakdown in the ON and OFF pathways of the
retina at night: functional implications. J Neurosci. 2010; 30:10006–10014. [PubMed: 20668185]
Komban et al. Page 7
J Neurosci. Author manuscript; available in PMC 2012 January 22.
NIH
-PA Author Manuscript
NIH
-PA Author Manuscript
NIH
-PA Author Manuscript

Poot L, Snippe HP, van Hateren JH. Dynamics of adaptation at high luminances: adaptation is fasterafter luminance decrements than after luminance increments. J Opt Soc Am A Opt Image Sci Vis.1997; 14:2499–2508. [PubMed: 9291617]
Ratcliff R. Group reaction time distributions and an analysis of distribution statistics. Psychol Bull.1979; 86:446–461. [PubMed: 451109]
Ratliff CP, Borghuis BG, Kao YH, Sterling P, Balasubramanian V. Retina is structured to process anexcess of darkness in natural scenes. Proc Natl Acad Sci U S A. 2010
Schnapf JL, Nunn BJ, Meister M, Baylor DA. Visual transduction in cones of the monkey Macacafascicularis. J Physiol. 1990; 427:681–713. [PubMed: 2100987]
Shapley RM, Victor JD. The effect of contrast on the transfer properties of cat retinal ganglion cells. JPhysiol. 1978; 285:275–298. [PubMed: 745079]
Smirnakis SM, Berry MJ, Warland DK, Bialek W, Meister M. Adaptation of retinal processing toimage contrast and spatial scale. Nature. 1997; 386:69–73. [PubMed: 9052781]
van Hateren JH, Ruttiger L, Sun H, Lee BB. Processing of natural temporal stimuli by macaque retinalganglion cells. J Neurosci. 2002; 22:9945–9960. [PubMed: 12427852]
Werblin FS, Dowling JE. Organization of the retina of the mudpuppy, Necturus maculosus. II.Intracellular recording. J Neurophysiol. 1969; 32:339–355. [PubMed: 4306897]
Xing D, Yeh CI, Shapley RM. Generation of black-dominant responses in V1 cortex. J Neurosci.2010; 30:13504–13512. [PubMed: 20926676]
Yeh CI, Xing D, Shapley RM. “Black” responses dominate macaque primary visual cortex v1. JNeurosci. 2009; 29:11753–11760. [PubMed: 19776262]
Zemon V, Gordon J, Welch J. Asymmetries in ON and OFF visual pathways of humans revealed usingcontrast-evoked cortical potentials. Visual neuroscience. 1988; 1:145–150. [PubMed: 3154786]
Komban et al. Page 8
J Neurosci. Author manuscript; available in PMC 2012 January 22.
NIH
-PA Author Manuscript
NIH
-PA Author Manuscript
NIH
-PA Author Manuscript

Figure 1. Sensitivity to ON and OFF channels(a) Stimulus sequence to isolate ON and OFF channels. Observers reported the orientationof the grating using 2AFC (H vs V) (b) Contrast threshold for increment and decrementgratings for 16, 24 and 32 cycles per degree. (c) Contrast threshold measured for incrementand decrement gratings presented 0s and 0.1s following positive and negative step changes.(d) Contrast threshold for fast ON and fast OFF sawtooth modulation at 8Hz.
Komban et al. Page 9
J Neurosci. Author manuscript; available in PMC 2012 January 22.
NIH
-PA Author Manuscript
NIH
-PA Author Manuscript
NIH
-PA Author Manuscript

Figure 2. Reaction time distributions to Dark and Light targets on uniform binary noisebackground(a, c) Stimulus sequence of Dark and Light targets (1 to 3) presented in random order on anoisy background. (b, d) Reaction time (RT) distributions for correct responses to thenumber of Dark and Light targets. Solid lines are Exponential Gaussian fits to the datapoints (triangles).
Komban et al. Page 10
J Neurosci. Author manuscript; available in PMC 2012 January 22.
NIH
-PA Author Manuscript
NIH
-PA Author Manuscript
NIH
-PA Author Manuscript
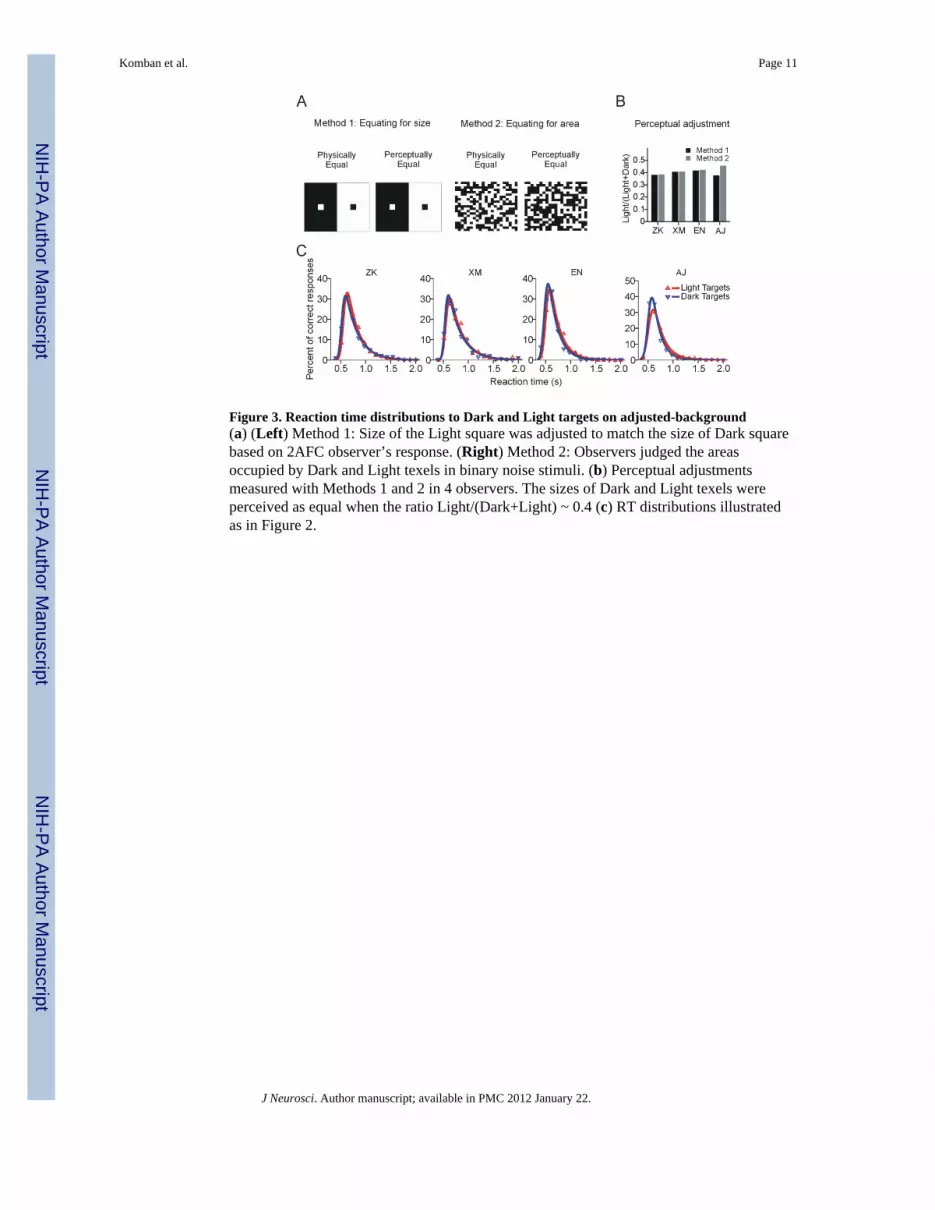
Figure 3. Reaction time distributions to Dark and Light targets on adjusted-background(a) (Left) Method 1: Size of the Light square was adjusted to match the size of Dark squarebased on 2AFC observer’s response. (Right) Method 2: Observers judged the areasoccupied by Dark and Light texels in binary noise stimuli. (b) Perceptual adjustmentsmeasured with Methods 1 and 2 in 4 observers. The sizes of Dark and Light texels wereperceived as equal when the ratio Light/(Dark+Light) ~ 0.4 (c) RT distributions illustratedas in Figure 2.
Komban et al. Page 11
J Neurosci. Author manuscript; available in PMC 2012 January 22.
NIH
-PA Author Manuscript
NIH
-PA Author Manuscript
NIH
-PA Author Manuscript


