Embed Size (px)
Citation preview
Virginia Wood Preserving SiteRichmond, Virginia
Work Plan andQuality Assurance Project Plan
Prepared-for:
Rentokil, IncorporatedSupa Timber Division ~
DAMES & MOORE7101.Wisconsin* Avenue, Suite 700, Bethesda, Maryland 2081*
April 3, 1989
VIRGINIA WOOD PRESERVING SITERICHMOND, VIRGINIA
Work Planand
Quality Assurance Project Plan
Prepared by:
DAMES <5c MOORE _ ". '7101 Wisconsin Avenue, Suite 700
Bethesda, Maryland 2081*(301)652-2215-
Prepared for:Rentokil, IncorporatedSupa Timber Division ;
April 3, 1989
APPROVALS . .. _- _,_.-,.. . , =-. ._ ^ .. ~_ :
Dames & Moore . ^_ ^: — - - _. .;•.-- - U.5. Environmental Protection Agency
J. Woloshin Name: Randy Sturgeon
Director 1 Title: Compliance Officer
Signature:" _
Date: ' ;Name: 3ohn O. Osgood : Name: Patricia 3. Krantz
Title: . Project Manage_c____ . T i t l e : Quality Assurance' " Chief,
Signature: _ ^ ^ - - > ? \ . - . . Quality Assurance""
Date: _______________Signature:
Name: Sucya S. Prasad, Ph.D., CPSS, Date:CPAg -
Title: - Quality Assurance Officer
Signature:
Date:
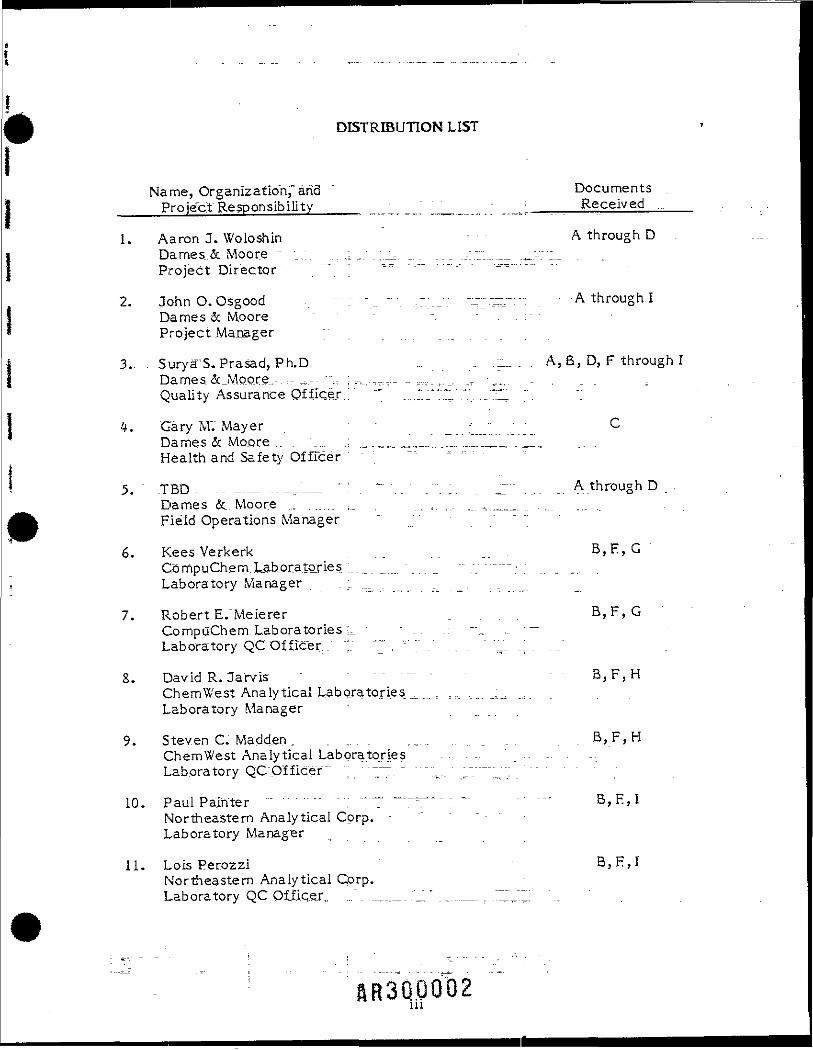
DISTRIBUTION LIST
Name, Organization," arid " " " """ "" " "Documents____ Project Responsibility ____ ___,.." „____...; ..„: Received ...
1. Aaron J. Woloshin - A through DDames_& Moore •• :... ..;;..,. ;._ . _. . ___ .-:.7i_.._ ._--::.._Project" Director" ~ _ """" ' """_..'""" """"._"
2. 3ohnO.Osgood \ -y-__ ~ . ,-;_„: -_::.—-:-. . A through IDames & Moore -, „ : . - . - - ' ' . .Project Manager
3.. . SuryS'S. Prasad, Ph.D. - - .- ~- - A, B, D, F through IDames. &JvlQO_re...-. ... .... -17 ;,-.,..__._ -,,v:,:;_. :T -•/.,. , . ,Quality Assurance Qffiqej-J ' " ...I;".".!.' •'•-.• --"™1 "7" "!
*. Gary M". Mayer ' _ : " " . : ^Dames.5c Mo.ore _ ___.;„,, . .„._.,_._ _.._......_ ._._„ . __., ... .Health and Safety Of freer - "" ' '=
5. " TBD. -- _— ..--,,:— ' : . ~" .. . '. 1. . ~' ..... _. A through D _ .Dames &.. Moore ... ...... ,_ . .. ;. ... ....,_._, _ . .. ....Field Operations Manager
6. Kees Verkerk _ . . __ B»^J GC o mpuChem. Laboratories ; _ . _ _ _ _ - - - - - — ,Laboratory Manager . _ .__ . _ _ . . . . _ . _
7 . Robert E/Meierer _ . . . ^,F,GCbmpuChem Laboratories u. " . . .: "._. .. • —Laboratory QCOfllcer. "; ^ ,. " ;' ...." _ .. ' " _ _; _ .../
S. David R.Jarvis ' — ~ - - B, F, HChemWest Analytical Laboratories _ _._ : =:, .... _^ „.Laboratory Manager • . _ . . . . "
9. Stev.en C. Madden, . ,. . . ,,..- . . . . _ _ . . B,_F,HChemWest Analytical .Laboratories . . . . . . ' .. ..Laboratory QC'pfficer" ; ~ . " "..,.. ~J"~" ". - - - - - - -
10. Paul Painter" " - - - - - - - • - - ; -— T ":. " " :; B^*1Northeastern Analytical Corp. -Laboratory Manager
11. Lois Perozzi B, H, INortheastern Analytical Corp.Laboratory QC Olfi.cer, ..." _ _____ .'„ " . _...___ T ."ZJ. " ., " .
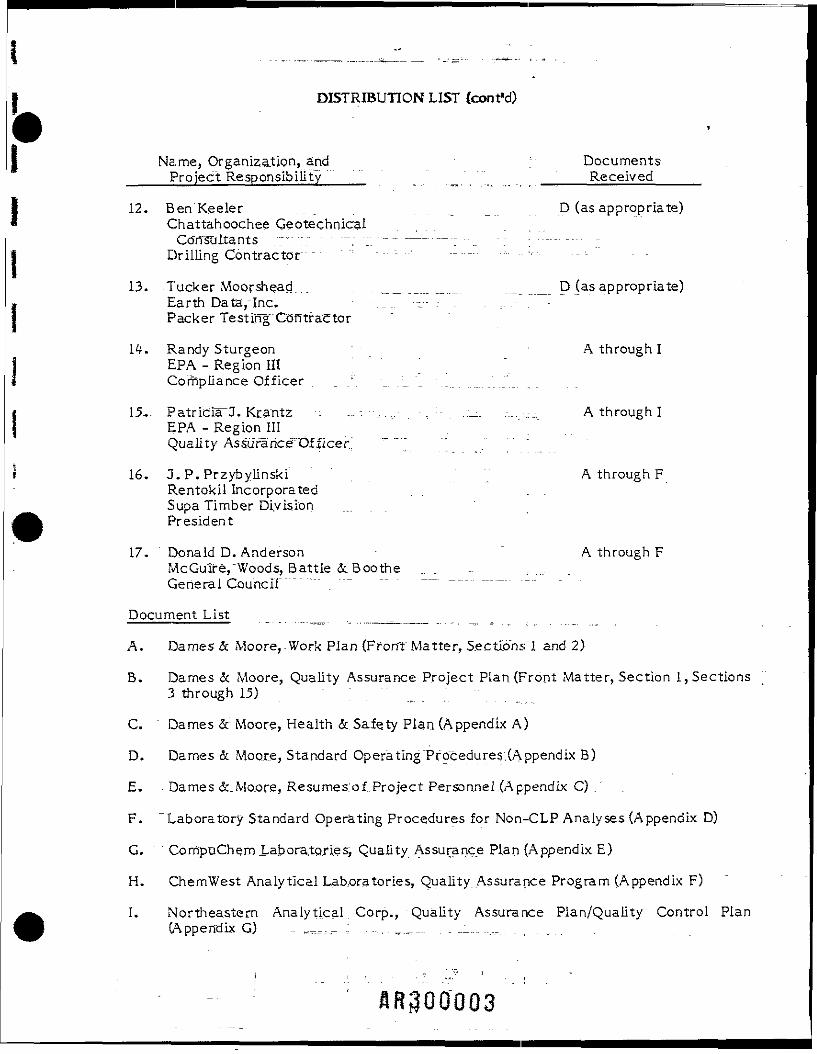
DISTRIBUTION LIST (confd)
Name, Organization, and . ; Documents____Project Responsibility____ Received
12. Ben Keeler ..... . ._ _ D (as appropriate)Chattahoochee GeotechniqalConsultants "i" :; ~; "::":.:: ~—" — -_ -•.. •; ;._-;---.-
, Drilling Contractor ~ : ----- - - - - - -----
13. Tucker Moorshead... _ , _ _ _ _ . _ _ _ _ _ . _ D (as appropriate)Earth Dataylnc. • -..... ••:_-- . . .-...-.-Packer Testing Contractor
1 4 . Randy Sturgeon • - ' A through IEPA - Region III 'Compliance Officer . _ .'. _. .:_. 7 "._... ........7._.
15,. Patridia~X.Kr.antz- --. ...-.-....-. - . -- ..;__. ......-_ A through IEPA - Region_IIIQuality Assu"rancevOf ficer "~ "7-
1 6 , J.P. Przybylinski . . . . . " 7 A through FRentokil Incorporated . . . .Supa Timber DivisionPresident
17. Donald D. Anderson " A through FMcGuire,"Woods, Battle &Boothe .. . :.. .. . .. .....General Council""""""
Document List
A. Dames & Moore,-Work Plan (Front Matter, Sections" 1 and 2)
B. Dames & Moore, Quality Assurance-Project Plan. (Front Matter, Section 1, Sections3 through 15) "
C. ' Dames &r Moore, Health &.Safety Plan (Appendix A)
D. Dames & Moore, Standard Operating Procedures,(Appendix B)
E. Darnes &.Moore, Resumes;of. Project Personnel.(Appendix C) /
F. "Laboratory Standard Operating Procedures for Non-CLP Analyses (Appendix D)
G. ' Co nipt Ch em Labora.toj'ie.s, Quality Assurance Plan (Appendix E)
H. ChemWest Analytical Laboratories, Quality. Assurance Program (Appendix F)
I. Northeastern Analytical. Corp., Quality Assurance Plan/Quality Control Plan(Appendix G) - H^=,_ .; ...... =.-._-,— .". _i...:...__.. ........
CONTENTS
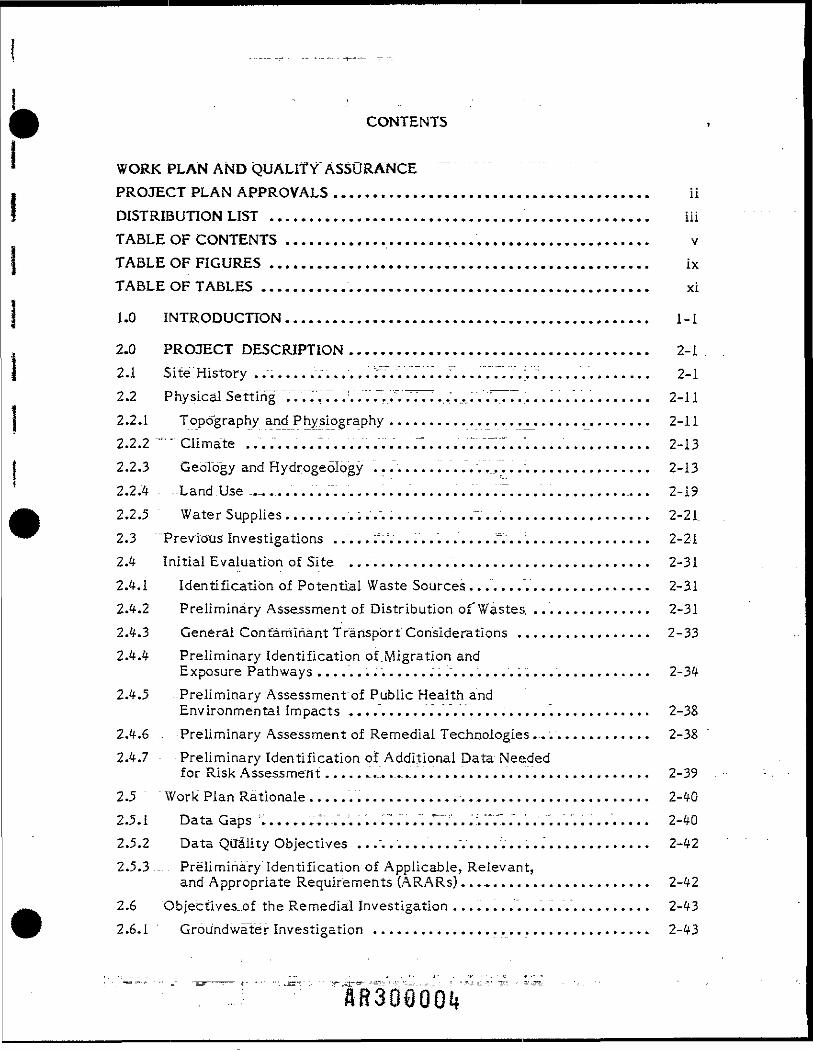
WORK PLAN AND QUALITY ASSURANCEPROJECT PLAN APPROVALS ........................................ iiDISTRIBUTION LIST ................................................ iiiTABLE OF CONTENTS .............................................. vTABLE OF FIGURES ................................................ ixTABLE OF TABLES ................................................. xi
1.0 INTRODUCTION.............................................. 1-1
2.0 PROJECT DESCRIPTION ...................................... 2-12.1 Site History ..".... .".v...... ;7.. ......"... .7....;.;.............. " 2-12.2 Physical Setting" ~.V:.7.T. /.. .V.y.7777.,.... • V777.......".......... 2-112.2.1 Topo'graphy and Physiography .................. .............. 2-112.2.2 "'"" Climate ......... 7...........f".... ..7.Y77.................. 2-132.2.3 Geology and Hydrogeology .................................... 2-132.2.4 - -Land Use .„ ..............................7.................. 2-192.2.5 Water Supplies........................~..................... 2-21.2.3 "Previous Investigations ..... .V.. ............7.................. 2-212.4 Initial Evaluation of Site ............ /......................... 2-312.4.1 Identification of Potential Waste Sources ....................... 2-312.4.2 Preliminary Assessment of Distribution of" Wastes. ............... 2-312.4.3 General Contaminant Transport Considerations ................. 2-332.4.4 Preliminary Identification of.Migration and
Exposure Pathways .......................................... 2-342.4.5 --Preliminary Assessment'of Public Health and
Environmental Impacts ....................................... 2-382.4.6 , Preliminary Assessment of Remedial Technologies ............... 2-382.4.7 - Preliminary Identification of Additional Data Needed
for Risk Assessment........-..................................... 2-392.5 " Work Plan Rationale ............................................ 2-402.5.1 Data Gaps v....,.;...L......... ;V... .. ................. 2-402.5.2 Data Qilality Objectives ..."....................."............. 2-422.5.3 --- - Preliminary Identification of Applicable, Relevant,
and Appropriate Requirements (ARARs)...-..................... 2-422.6 "Objectives_.of the Remedial investigation ..........."...".".......... 2-432.6.1 Groundwater Investigation ................................... 2-43
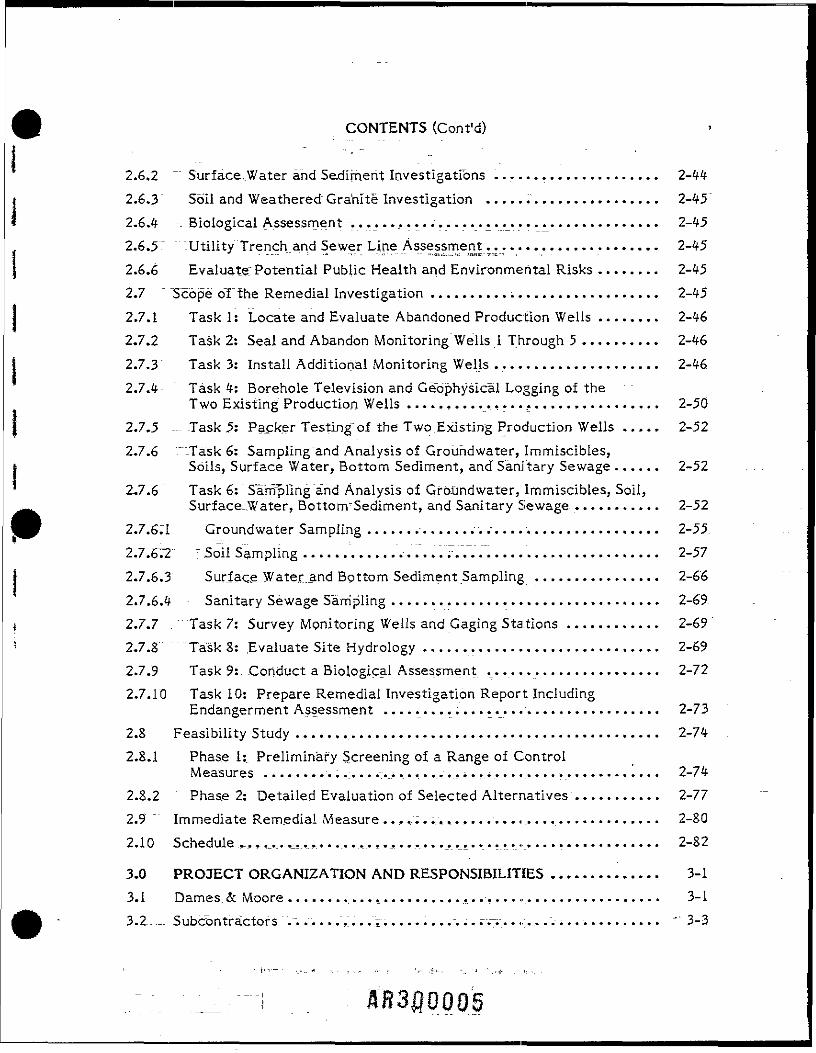
CONTENTS (Co'nt'd)
2.6,2 ~ Surface;:Water and Sediment Investigations ..................... 2-442.6.3 Soil and Weathered Granite" Investigation ...................... 2-452.6.4 -- Biological Assessment ......................... .............. 2-452.6.5" -Utility"Trench.and Sewer Line Assessment...................... 2-452.6.6 Evaluate: Potential Public Health and Environmental Risks ........ 2-452.7 " Scope oT the Remedial Investigation ............................. 2-452.7.1 Task 1: Locate and Evaluate Abandoned Production Wells ........ 2-462.7.2 Task 2: Seal and Abandon Monitoring Wells 1 Through 5 .......... 2-462.7.3 Task 3: Install Additional Monitoring Wells ..................... 2-462.7.4 Task 4: Borehole Television and Geophysical Logging of the
Two Existing Production Wells ................................ 2-502.7.5 - Task 5: Packer Testing of the Two Existing Production Wells ..... 2-522.7.6 " -Task 6: Sampling and Analysis of Grouhdwater, Immiscibles,
Soils, Surface Water, Bottom Sediment, and Sanitary Sewage ...... 2-522.7.6 Task 6: Sampling and Analysis of Groundwater, Immiscibles, Soil,
Surface.Water, BottonvSediment, and Sanitary Sewage ............ 2-522.7.6.1 Groundwater Sampling ............... v..................... 2-552.7.672 r Soil Sampling ............................................. 2-572.7.6.3' Surface Water.and Bpttorn Sediment_Sampling ................ 2-662.7.6.4 Sanitary Sewage Sampling .................................. 2-692.7.7 Task 7: Survey Monitoring Wells and Gaging Stations ............ 2-692,7.3 Task S: .Evaluate Site Hydrology .............................. 2-692.7.9 Task 9: Conduct a Biological Assessment ...................... 2-722.7.10 Task 10: Prepare Remedial Investigation Report Including
Endangerment Assessment ................................... 2-732.8 Feasibility Study .............................................. 2-742.8.1 Phase 1:, Preliminary Screening of a Range of Control
Measures ................-.._........._............................. 2-742.8.2 Phase 2: Detailed Evaluation of Selected Alternatives ........... 2-772.9 " Immediate Remedial Measure .....;;.............................. 2-802.10 Schedule ,.,,_.. ,,.... . .,.,..... . . ......................... 2-82
3.0 PROJECT ORGANIZATION AND RESPONSIBILITIES .............. 3-13.1 Dames.. & Moore ................................................ 3-13.2..— Subcontractors .......... .7............. r.-...................... ' 3-3
CONTENTS (Confd) -
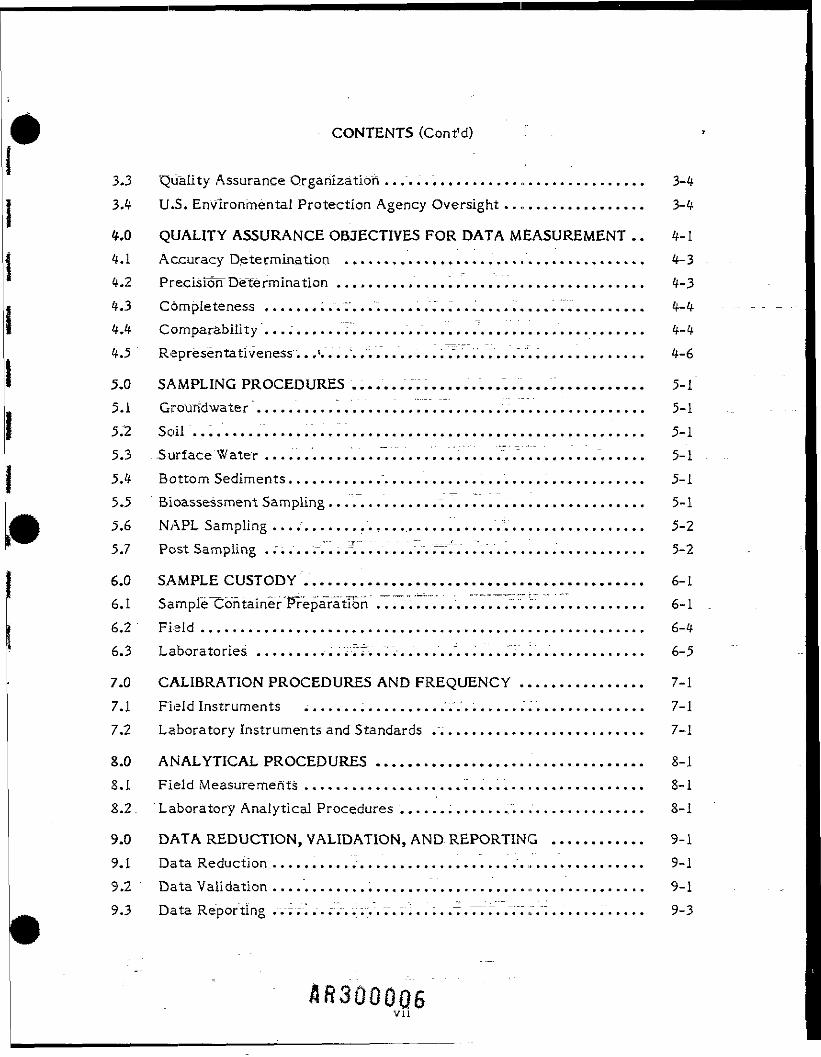
3.3 'Quality Assurance Organization .................................. 3-43.4 U.S. Environmental Protection Agency Oversight................... 3-4
4.0 QUALITY ASSURANCE OBJECTIVES FOR DATA MEASUREMENT .. 4-14.1 Accuracy Determination ...................................... 4-34.2 PrecisiofTDeTermlnation ....................................... 4-34.3 Completeness .......... V.......... .7......................... 4-44.4 Comparability 7 ................................... 7........... 4-44.5 Representativeness .. ,l.7 . /. ,".7.........Y.......7'............... 4-6
5.0 SAMPLING PROCEDURES ..................................... 5-15.1 Groundwater 7 ................................................ 5-15.2 Soil ... 7..................................................... 5-15.3 .Surface Water ....7 ........ ..77.7 .....7.7 .. 7. .7 ........ .7 ..... 5-15.4 Bottom Sediments............................................. 5-15,5 Bioassessment Sampling ........................................ 5-15.6 "" NAPL Sampling ...................... .7 ... 7 7 ................. 5-25.7 Post"Sampling . ;... .777. .7.. 77 .7 ... rr....... i.... .7........... 5-2
6.0 SAMPLE CUSTODY 77 ......................................... 6-16.1 Sample'Container'Preparation ................."................. 6-16.2 Field ........................................................ 6-46.3 Laboratories. ...........wTT..".".-..'.....".. ... .7'................ 6-5
7.0 CALIBRATION PROCEDURES AND FREQUENCY ................ 7-17.1 Field Instruments ................. ,= . .7 ...................... 7-17.2 Laboratory Instruments and Standards ........................... 7-1
8.0 ANALYTICAL PROCEDURES ....................7 ............. 8-18.1 Field Measurements ........................................... 8-18.2 Laboratory Analytical Procedures ,.............'................. S-i
9.0 DATA REDUCTION, VALIDATION, AND REPORTING ............ 9-19.1 Data Reduction ......... 7.7 ............./... 7.................. 9-19.2 ' Data Validation ................................................ 9-19.3 Data Reporting ..-7.7 ...-".-.... 7 v. ;7 .... ."7.7vr. .Y; ,;.;......."..... 9-3
IR30vn
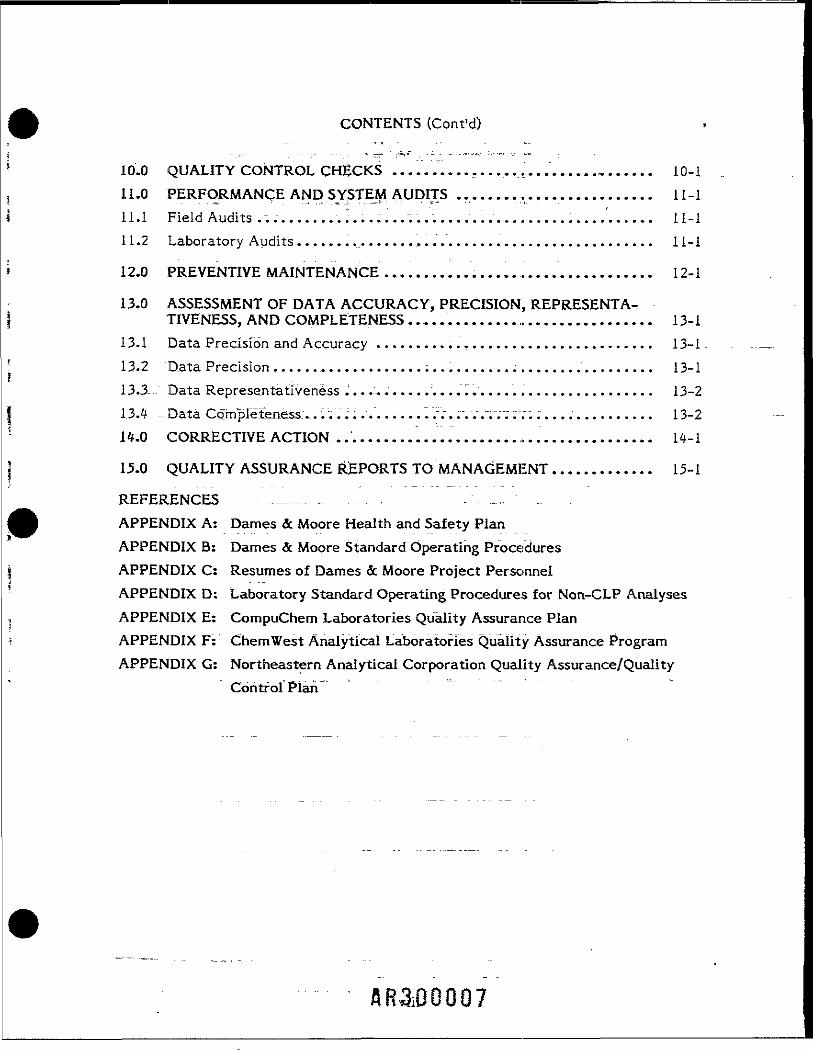
CONTENTS (Cont'd)
10.0 QUALITY CONTROL CHECKS ........................7 ............ 10-111.0 PERFORMANCE AND SYSTEM AUDITS ......................... 11-111.1 Field Audits.;..........!..........;........................... li-i11.2 . Laboratory Audits............... . .77 .......................... 11-1
12.0 PREVENTIVE MAINTENANCE.................................. 12-1
13.0 ASSESSMENT OF DATA ACCURACY, PRECISION, REPRESENTA-TIVENESS, AND COMPLETENESS................................ 13-1
13.1 Data Precision and Accuracy .........;.,....................... 13-113.2 Data Precision ........................................7 ........ 13-113.3- - Data Representativeness .7. ...... .7,...".... 7.................. 13-213.4 Data Completeness:.. 7v,7........ .7V7...... vv;;;;.............. 13-214,0 CORRECTIVE ACTION . 7....................................... 14-1
15.0 QUALITY ASSURANCE REPORTS TO MANAGEMENT ............. 15-1
REFERENCES —— .. . . . . . - -,. -APPENDIX A: Dames & Moore Health and Safety PlanAPPENDIX B: Dames & Moore Standard Operating ProceduresAPPENDIX C: Resumes of Dames & Moore Project PersonnelAPPENDIX D: Laboratory Standard Operating Procedures for Non-CLP AnalysesAPPENDIX E: CompuChem Laboratories Quality Assurance PlanAPPENDIX F: ChemWest Analytical Laboratories Quality Assurance ProgramAPPENDIX G: Northeastern Analytical Corporation Quality Assurance/Quality
Control Plan
FIGURES
"V 1 j*. - - - -_ _ —- ----- - -— - -•;: .:-.- -.--... —_ ; . —_i -_. -.- -: - r ^—— ~~ - "^^ T "~ , - r . _ r . ——iNo. • ;- : . .. . _ : " . r- " - . . Page
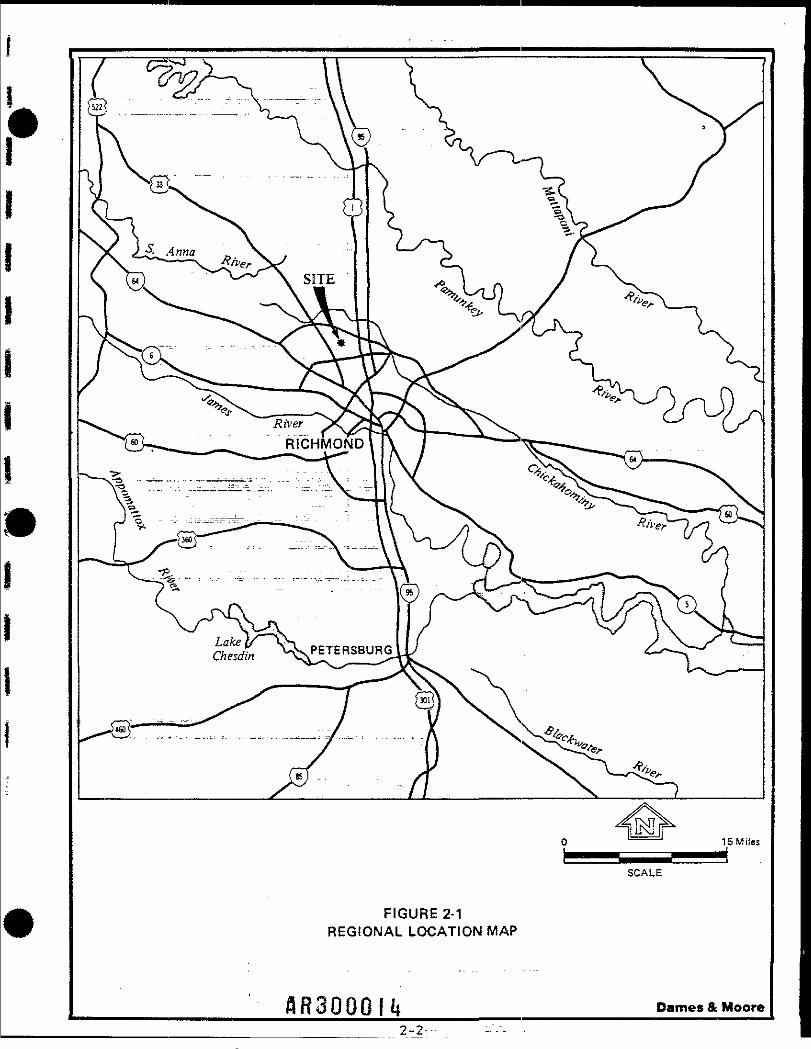
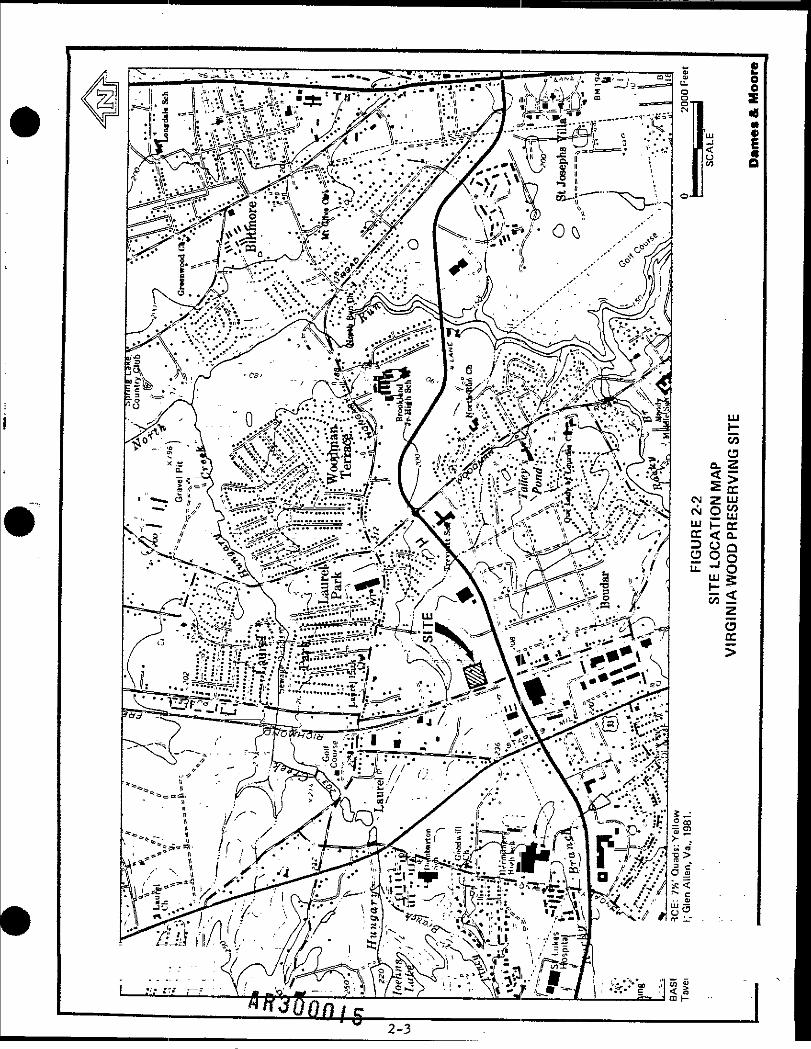
2-1 _ . .. Regional Location Map ..........7 ........................... 2-22-2 : Site~Location Map, Virginia Wood Preserving Site ................ 2-32-3 Products Reportedly Used at Virginia Wood
Preserving Facility .......7 ............. 7..................... 2-42-4 -Virginia Wood Preserving Facilities Map ........................ 2-52-5 "Virginia Wood Preserving Existing Facilities Map., 1988 ........... 2-62-6 Topographic"Map, Virginia Wood Preserving Site ................. 2-122-7 ' Idealized Stratigraphic Section, Virginia Wood _. .
Preserving Site .. 7. .7 . .7.7 ... .7 ._. .77 . 77.77 .7777.7 ........... 2-152-8 Potentiometric Surface Contour Map^of the Shallow Perched-.
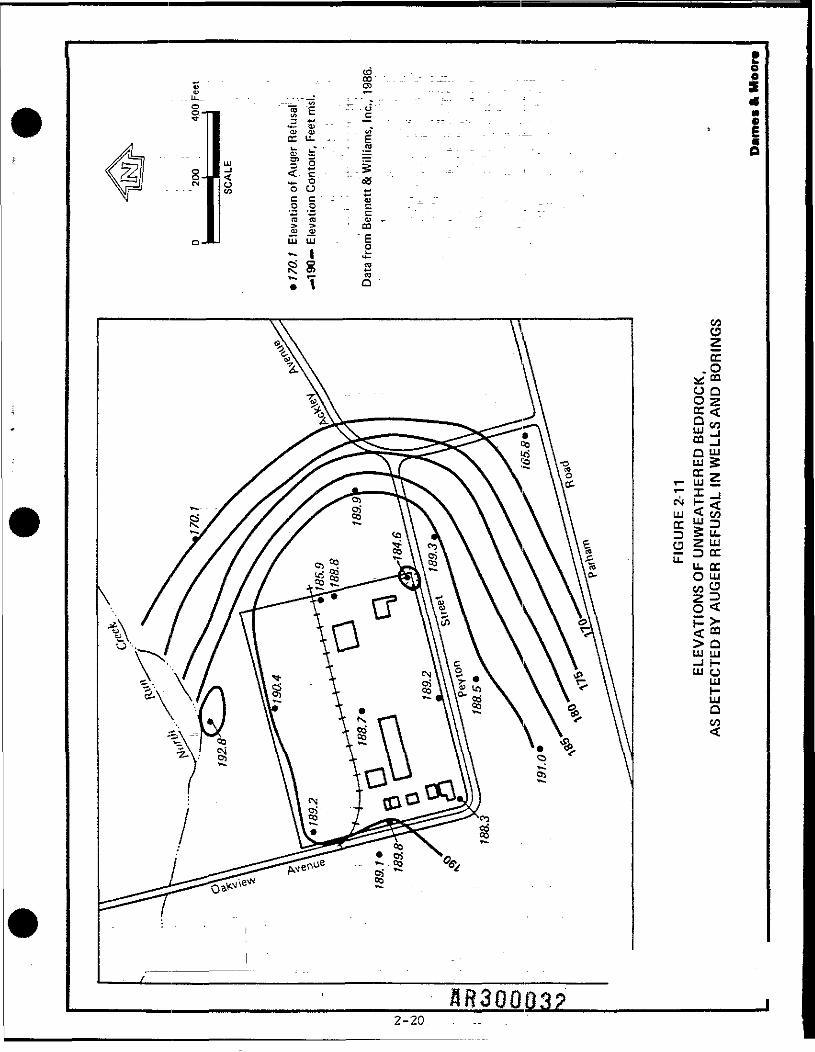
Water Table ................................................ 2-162-9 Elevation of Top of Hardpan or Friable Clayey Sand ............. 2-172-10- -- -Potentiorhetric Surface7C6ntbur Map "of the Saprolite Aquifer ..... 2-182-11 Elevations of Unweathered Bedrock, As Detected
by Auger Refusal in Wells and Borings ......................... 2-202-12- DistributioTi of Non-Aqueous Phase Liquids in Soils,
Perched Water Table Aquifer ........... 7..................... 2-242-i3- - - Distribution of Total Recoverable Phenolics in Groundwater,
Perched Water Table and Saprolite ............................ 2-25 .2-14 •- Distribution "of Total Phenolics in Soils . 7.7 ..................... 2-262-15 Locations of WeiTs~M~onitored by the Henrico County
Health Department.."... .77 ........".......................... 2-282-16 .,=._. ..Locations of Environmental Technology, Inc., Wells and
Surface Water'Siations ... 77 .. .77 ............................ 2-302-17 .-— Principal Potential Source Areas, Virginia Wood
Preserving Site .. 7.. .77 . .7 .......77....... 77 ................ 2-322-13 Potential Surface Migration Pathways,.Virginia Wood
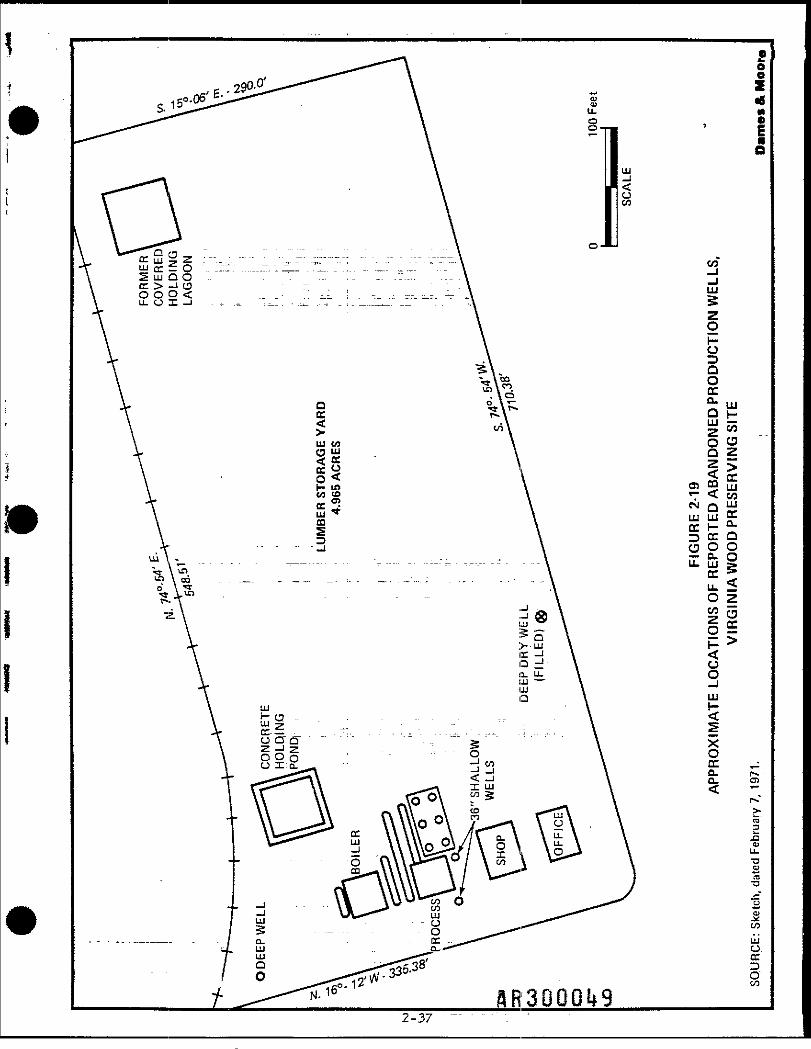
Preserving Site 7 .77.....~,. T7........ 7".. .77 .................... 2-352-19 Approximate Locations of Reported^Abandoned Production
Wells, Virginia Wood Preserving SiYe7.. 7.,,',.". 77.7 ............... 2-372-20 ."GrburTdwaTer Monitoring Network, Saprolite Aquifer,
Virginia Wood Preserving Remedial Investigation ................ 2-472-21 Grouhdwater Monitoring Network, Perched Water Table Aquifer,
Virginia Wood Preserving Remedial Investigation ................ 2-50
FIGURES (contfd)
No. ._...._"._.__ _.:. !:_.." "-. __" "_....,_.... - Page
2-22 ~- Ground water Monitoring Network, Bedrock Aquifer,Virginia Wood Preserving Remedial Investigation ................ 2-51
2-23 " - Soil Sampling Locations, Virginia Wood Preserving SiteRemedial Investigation ...................................... 2-59
2-24 Surface Water and Sediment Sample Stations in the Vicinity ofVirginia. Wood Preserving Site ..............7 .................. 2-67
2- 25 ~~ Locations of Downstream Surface Water and Sediment Samples,Virginia Wood Preserving Site ....... .7 .... .7 .................. 2-68
2-26 = .[Utility Trench and Sewer Line Sample Stations, VirginiaWood Preserving Site ............, .7.7 ....................... 2-71
2-27 Extent of IRM CCA Area .....................7 .............. 2-812-28 Schedule for the Virginia Wood Preserving Site Remedial
Investigation and Feasibility Study= ............................ 2-832-29 Critical Path Diagram Based on Work Phase/Task Numbers
Depicted in Figure 2-287 .77............7 ..................... 2-843-1 Project Organization . 7.7 .................. 7................. 3-26-1 Chain-of-Custpdy Record ........... ......................'.. 6-26-2 --- * Custody Seal and Sample Label ............................... 6-3
TABLES
No. . . . = .__„_.____:_-_ : .._____- 7 . ;j : _. "
2-1 Summary of Operational History of Virginia Wood PreservingFacility .....................7 .... .7 ........................ 2-8
2-2 .: Summary of Sampling Sites in Each Medium .................... 2-532-3 Summary of Sampling Point Locations Within Each
Sampling Zone .......__........__.... .1,..................._.._.......... 2-542-4.7 _ . Non-Aqueous Phase Liquid Samples and Associated
Analyses if Detected . v........_.".......... ,.„................ 2-562-5 '.. .General Groundwater Quality Samples and Associated
Analyses ...................~......... .~.~vr;................... 2-582-6 Soil Samples and Associated Analyses, Virginia Wood
Preserving Site ...; .77. 7. .77 .777v.: .7 . 777 77.77............. 2-612-7 : - Soil Boring and Perched.Water Table Well Pairs for Surrogate
NAPL Sampling" for Dioxln". .........7 . .7 .... 7.7 .............. 2-642-8 Surface Water, Sediment, and Sanitary Sewage Samples and
Associated-Analyses ........................................ 2-703-1 Subcontractor List ...............;.........„................ 3-53-2 Project Responsibilities and Project Team Members
Assigned ................................................... 3-74-1 Data Quality Objectives Requirements, and
Assessments for Non-CLP Parameters ........ „................ 4-24-2 -- -Sample Duplicates and Associated Analyses....,-................ 4-57-1 Field Instrument Calibration and Maintenance Schedule .......... 7-27-2 Summary of Calibration Information for Non-CLP Analyses ....... 7-3S-l Quality Assurance Objective for Precision aYid Accuracy of
Field Water Quality Measurements .............................. 8-23-2 - Analytical Methods .......................................... 8-310-1 Summary of Specific QC Requirements for Non-CLP Analyses .... 10-210-2 : Non-CLP Analyses Performed by ChemWest Anayltical
Laboratories and Northeastern Analytical Corporationthat are Certified by CornpuChem Laboratories .................. 10-3
11-1.. _ ..System Audit Checklist - Field Operations ...................... 11-312-1 Equipment MaintenanceSchedule .........7.7.................. 12-2
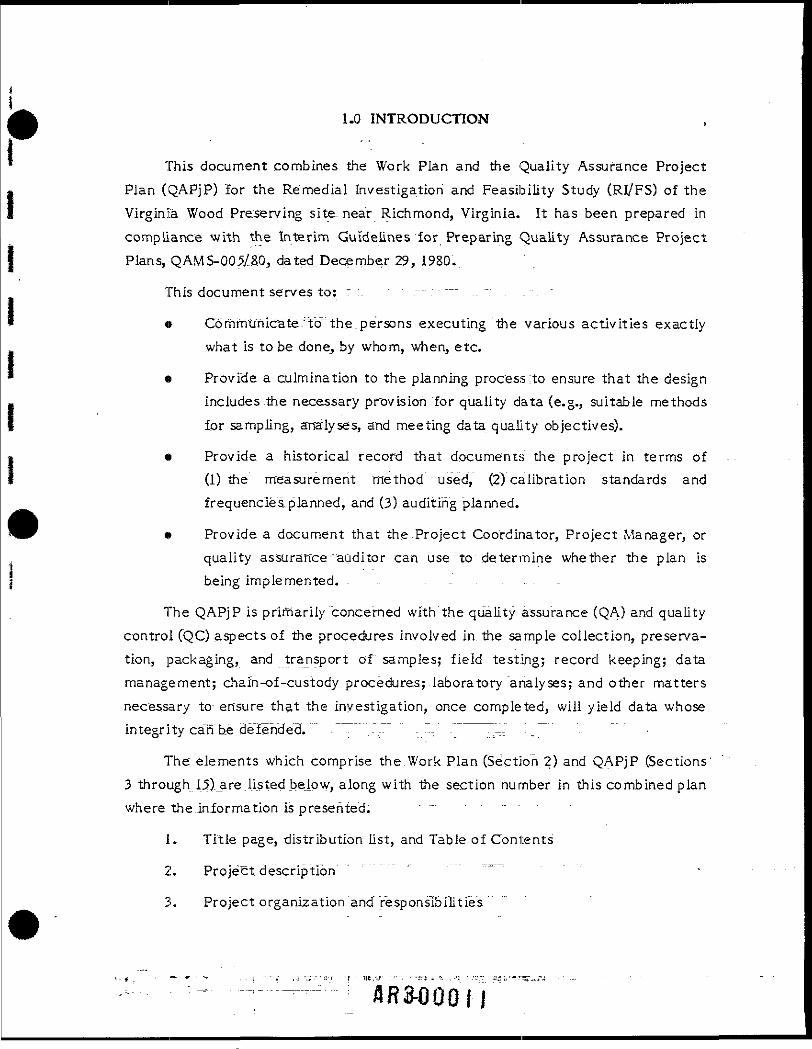
1.0 INTRODUCTION
This document combines the Work Plan and the Quality Assurance ProjectPlan (QAPjP) for the Remedial Investigation and Feasibility Study (RI/FS) of theVirginia Wood Preserving site-near Richmond, Virginia. It has been prepared incompliance_:w.ith the Interim Guidelines for Preparing Quality Assurance ProjectPlans, QAMS-005/80, dated December 29, 1980.
This document serves to: ~ :. .-•-- - ~~ .. ~: - .. . "
« CbmmuTuCate-TcTthe.persons executing the various activities exactlywhat is to be done, by whom, when, etc.
« Provide a culmination to the planning process1:to ensure that the designincludes the necessary provision for quality data (e.g., suitable methodsfor sampling, analyses, and meeting data quality objectives).
* Provide a. historical record that documents the project in terms of(1) the measurement method "used, (2) calibration standards andfrequencies,planned, and (3) auditing planned.
* Provide a document that the Project Coordinator, Project Manager, orquality assurance "auditor can use to determine whether the plan isbeing implemented. . - . _ . . . . . . _
The QAPjP is primarily concerned with the quality assurance (QA) and qualitycontrol CQC) aspects of the procedures involved in. the sample collection, preserva-tion, packaging, and transport of samples; field testing! record keeping; datamanagement; chafn-of-custody procedures;.laboratory analyses; and other mattersnecessary to ensure that the investigation, once completed, will yield data whoseintegrity can"he defended. - - .-,- - -v -
The elements which comprise the.Work Plan (Section 2) and QAPjP (Sections'3 through 15)._are.listed below, along with the section number in this combined planwhere the.information i s presented. " ~ - - - - - -
1. Title page, -distribution list, and Table of Contents
2. ..-Projectdescription' ' "" " ' """"
3. Project organization and "responsibilities."
4. Quality assurance objectives for data measurement '
5. Sanripling:proce"dures ; . ,,,. .. . "... .. .---—-.:. ,. ;; ;
6 . Sample custody _ • _ " _ .
7. Calibration procedures and frequency
8. Analytical procedures "" " =-•=—=
9. Data reduction, validation, and reporting
10. .Quality control checks ..... . . . . . _ . .
11. Performance and system audits ;.
12. Preventive maintenance"'
13. Assessment of data precision, accuracy, representativeness, andcompleteness - . .:.,.. :..". ..... . ' i.. .
14. Corrective action1"""" "" '" "" ; '
15. Quality assurance reports to management
The Work Plan and QAPjP are supplemental by additional informationprovided-in appendices. 'Appendices A through Q"_contain information prepared orcompiled specifically for this project, and are bound in with this combined plan.Appendices E through G conslsitof.generic quality assurance plans prepared by oursubcontracting laboratories. These, quality assurance plans are stand-alone docu-ments and therefore have not been bound, directly in with the major body of theQAPjP. However, they provide vital information regarding the laboratoriescapabilities", and operating" procedures/ . Where any discrepancies exist betweeninformatibTi~s"tated in., the QAPjP and "information provided -in the individuallaboratory QA Plans, the information in the QAPjP should be taken as the correctinterpretation. " . . "! • .;
2.0 PROJECT DESCRIPTION
2.1 SITE HISTORY
The Virginia Wood Preserving Site (the Site) is located north-northwest ofRichmond, Virginia in" HenricoT County (Figure"2-1)7" The Site is situated onapproximately 10 acres near 1-95, 2.4 miles west of the Parham Road exit at theintersection of Oakview Avenue and Peyton Street (Figure 2-2).
Rentqkil, Inc., owns 4.96 acres and leases 5 acres from the Richmond LandCorporation, an affiliate of the Richmond, Fredericksburg, and Potomac Railroad(RF&P), The surrounding land is mostly owned by Richmond Land Corporation.
Prior to 1974, the facility was owned and operated by Virginia WoodPreserving Cor"p"ofatroh, which was o^ned"by TaCo Corporation and Taylor-ColquittCompany- In 1974, Rentokil purchased the stock of TaCo Corporation. LaterTaylor-Colquitt" Company was succeeded by" Southern Wood Piedmont Company, asubsidiary of ITT Gfihnell. . 7 __. .7 ----"-"
Construction'"©! the Virginia Wood Preserving plant began in 1956, andmodifications to, the plant have continued to the present. The first treatmentcylinder was installed in 1956; wood treating "operations began shortly thereafterand have continued to date without interruption.
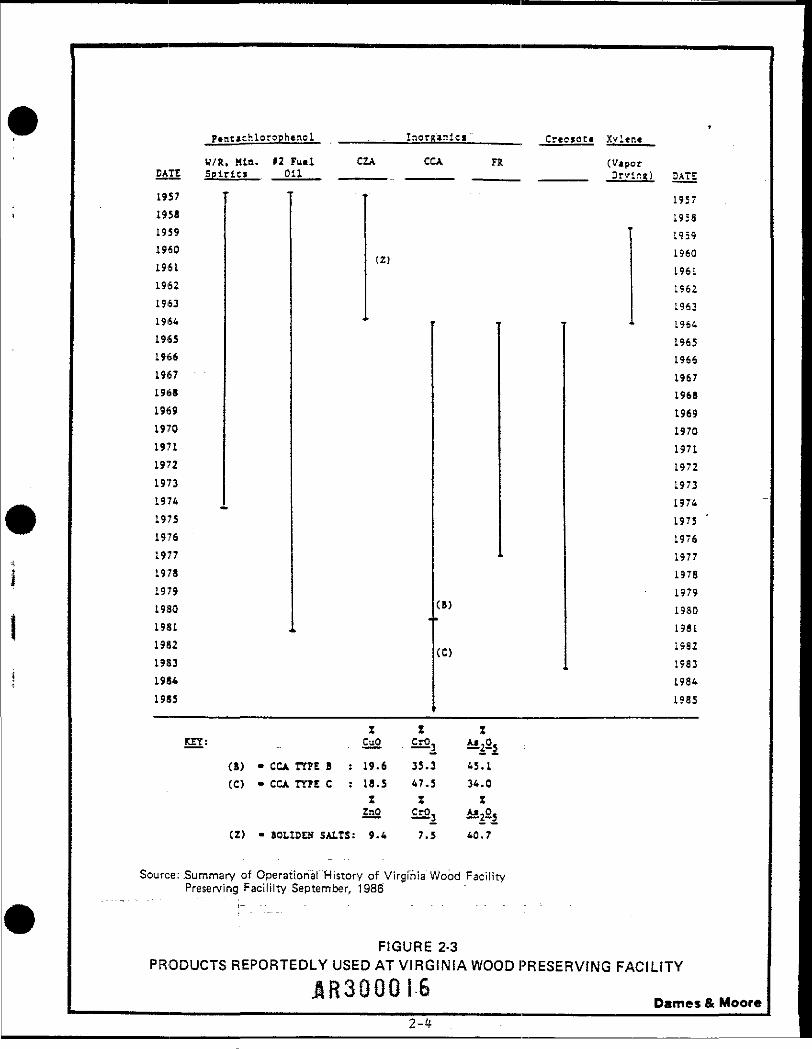
The sole business at. the facility is and has been treating wood withpreservatives. The methods and the chemicals used have changed over the years.Products reportedly used on the Site include mineral spirits, No. 2 fuel oil,chromium ziric arseriate (CZA), copper chromated arsenate (CCA), fire retardant(FR), creosote, pehta"chlorophenol (PCP), and xylene (Figure 2-3). The fireretardant is believed to have been a water-based solution of ammonium phosphateor ammonium sulfate. The fire retardant solution may also have containedammonium thiocyanate as_ a corrosion-inhibiting additive. Of the compounds in thefire retardant solution, only the ammonium thiocyanate is believed to potentiallybe of environmental significance.
In 1964, the plant added air drying of decking, creosoting of marine piling,and fire-retardant treating to its processes. Treatment with CZA was replaced bytreatment with CCA. Treatment with PCP was ended in 1980, and creosotetreatment was ended.in 19837 The only treatment product now in use is CCA.
15 Milesj •
SCALE
FIGURE 2-1REGIONAL LOCATION MAP
QR3QQQ } k________________________Dames & Moore2-2 -'-:- =
2-3
p«ntichloroph«nol . . laen'tnlci'_______ Creosott Xvl»n«
U/R, MiQ. n Futl CZA CCA FR (VtporDATE Splrlcs Oil .._ _______. ______ .______ ______ Orvirg) DATI
195719581959I960196119621963196419651966196719681969197019711972197319741975197619771978197919801981198219831984
1985
(2)
(B)
1957193819591960196LL562L963L9S419651966196719681969197019711972197319741975197619771978197919301981199219831984
1985
I I ZKZT: CuO CrO. Aj-0—— - —— ——j —^-
(8) • CCA TYPE B : 19.6 33.3 45.1(C) • CCA TYPE C : 18.5 47.5 34.0
I Z Z2nO CrO. Aj-0.
- " ™' '"""i'CZ) • 5OLIDEN SALTS: 9.4 7.5 40.7
SourcerSummary of Operational History of Virginia Wood FacilityPreserving Faciltlty September, 1986
FIGURE 2-3PRODUCTS REPORTEDLY USED AT VIRGINIA WOOD PRESERVING FACILITY
1R3000I6______________ Dames & Moore__ , ,
SOURCE: Bennett& Williams, 1986
FIGURE 2-4VIRGINIA WOOD PRESERVING FACILITIES IV,™
SB30QOI7 Dames & Moore
SOURCE: Bennett & Williams, 1986
FIGURE 2-5VIRGINIA WOOD PRESERVING EXISTING FACILITIES MAr,
| f{_____ Dames & Moore2-6
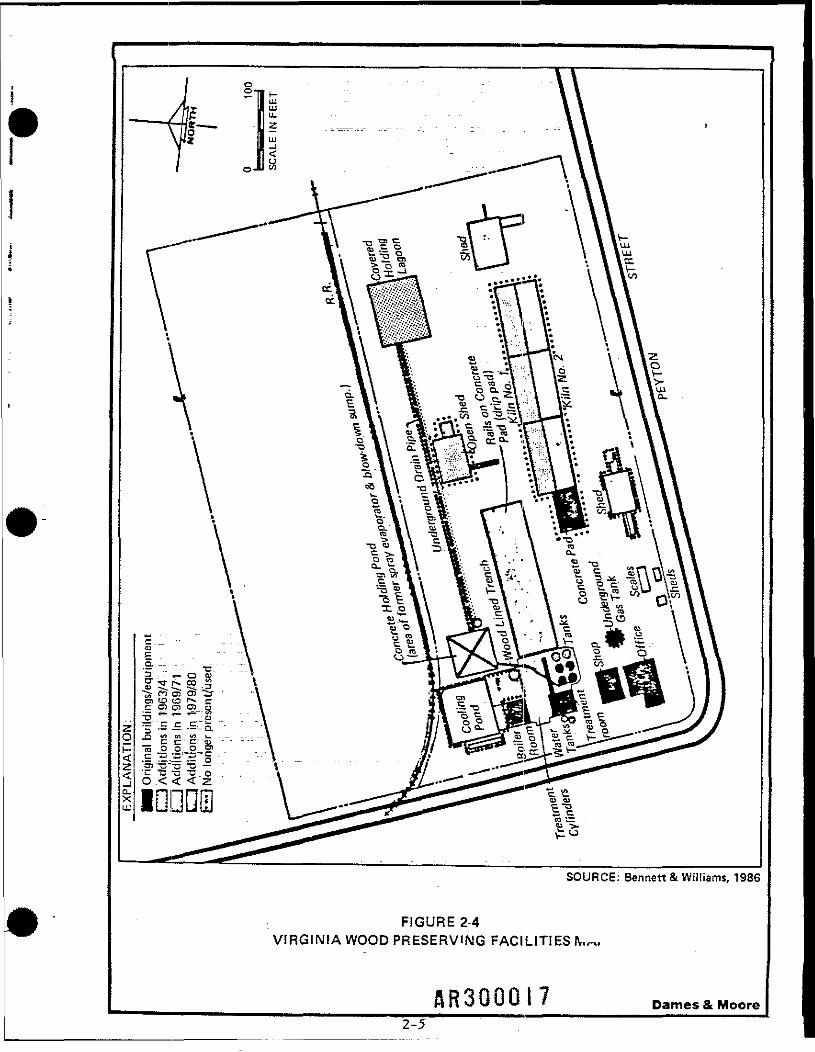
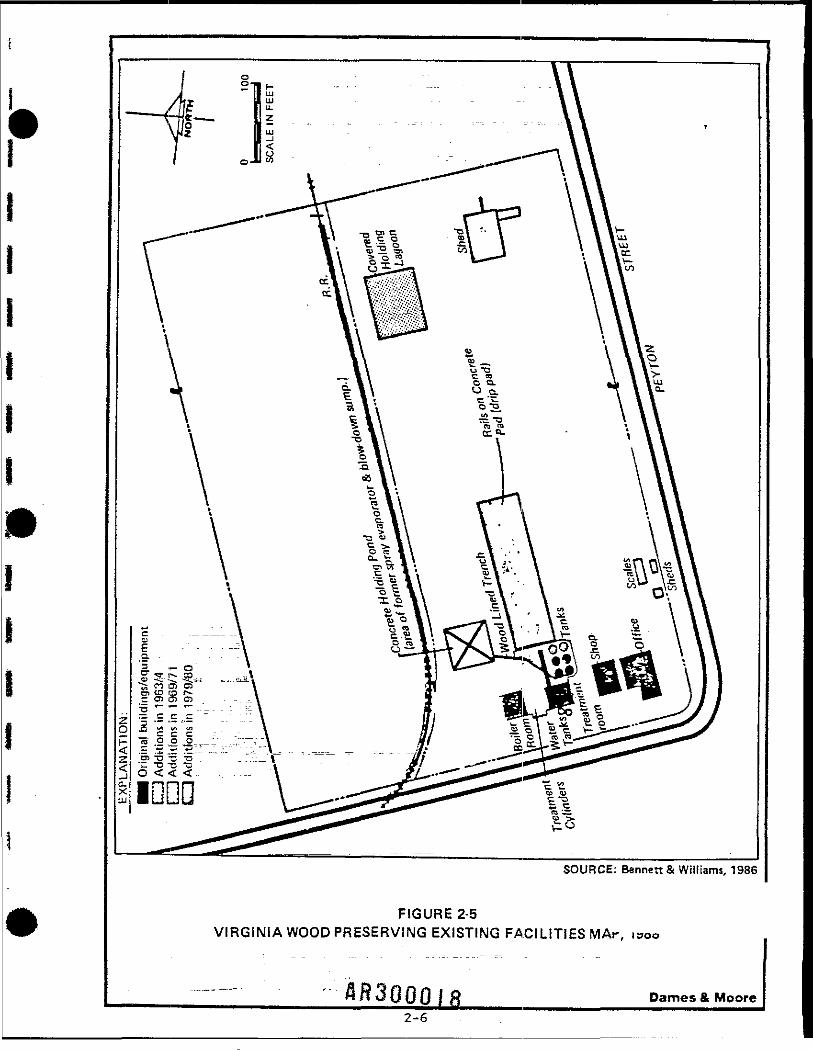
Over the years, many of the features installed on the Site have been taken,out of servlce~~of~ removed (Figure 2-4). Facilities still in use include theaboveground storage -tanks, treatment room, treatment cylinders, concrete drippad, concrete holding pond, shop, office, arid assorted sheds (Figure 2-5). Theoperational history of the plant is summarized in Table 2-1.
Wastes from the early wood treatment operations were reportedly dischargedto the biowdown sump "north of the treatment cylinders (Figure 2-4). In 1963, atthe request of the Virginia State Water Control Board (VSWCB), the previousowners of the Site replaced the biowdown sump with the present concrete holdingpond and constructed the covered holding lagoon. The_ concrete holding pond waslinked to the. covered holding lagoon by. an. underground drain pipe (Figure 2-4).These two waste ••management"features were operated under a Virginia dischargepermit. The VSWCB's request for the installation of these features apparently wasmade because of reported fish kills in T alley's Pond (Figure 2-2) on January 2, 1962and on two previous occasions. 'The VSWCB believed that a "chlorinated cresol"was involved and reportedly traced this substance upstream on North Run Creek tothe plant. - - - - - ••—- . — - - - -
At. one point in 1976 "of' 1977, it was reported that a batch of CCAprecipitated in a process' tank, before use and was rendered unusable. Theprecipitation was reportedly caused by reduction of the chromium from the.hexavalent state to the trivaient state. This batch of approximately 1,100 to 1,400pounds of CCA was reportedly disposed of at the Site by placing it and alternating6-inch layers of lime in a "pit located along the north fence line in the northeastquadrant of the Site." ~~ -~~~-, - ."-"M"V"= " =:.:.:::::. :::.._—- *:~
ln 1987, the entire contents of the covered holding lagoon were removed andtransported to off site, treatment or disposal facilities. There is presently anexcavation at the Site of the former holding lagoon, which contains water (acombination of rainwater and groundwater) with an oily sheen. The observed depthto -the top of the water in the excavation was approximately 5 to 6 feet on
August S, I9SS. " -
In 1974, however, a new water treatment/preservative recovery system wasbuilt, and since then there has been no discharge of process: wastewater becausethe wastewater is continuously recycled. Also in 1974, the underground drain pipe
ft-8300019
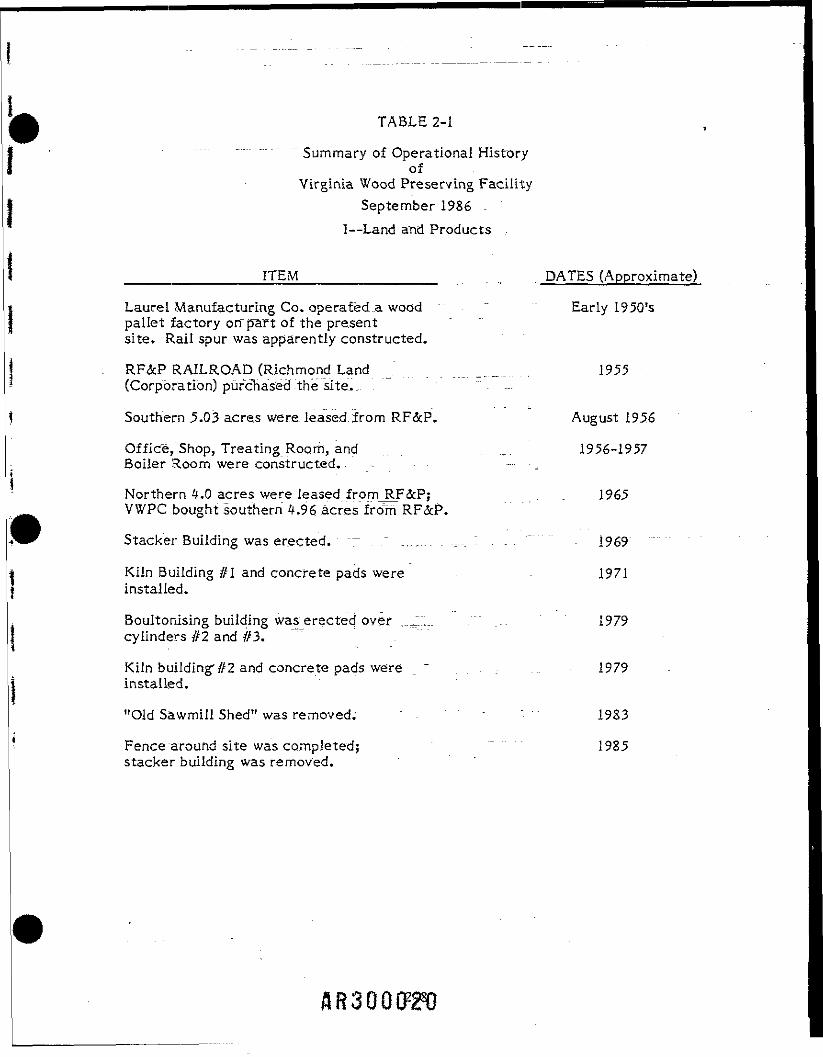
TABLE 2-1
- - - - - Summary of Operational Historyof
Virginia Wood Preserving FacilitySeptember 1986 -
I—Land and Products
_____________ITEM_____________ DATES (Approximate)
Laurel Manufacturing Co. operafed.a wood Early 1950'spallet factory orf part of the presentsite. Rail spur was apparently constructed.
RF&P RAILROAD (Richmond Land _." _ _ _ . „ _ . 1955(Corporation) purchased-the site... . " -
Southern 5.03 acres were leased from RF&P. August 1956
Office/Shop, Treating Room, and _ 1956-1957Boiler Room were constructed.
Northern 4.0 acres were leased from_RF&P; . 1965 -VWPC bought southern 4.96 acres from RF&P.
Stacker Building was erected. ~ ~ _._... _=._. :. . . . " 1969 "
Kiln Building #1 and concrete pads were 1971installed.
Boultonising building was erected over ..- - . 1979cylinders #2 and #3.
Kiln building'#2 and concrete pads were " , . _ 1979installed.
"Old Sawmill Shed" was removed. ' - ^ 1983
Fence around site was completed; - 1985stacker building was removed.
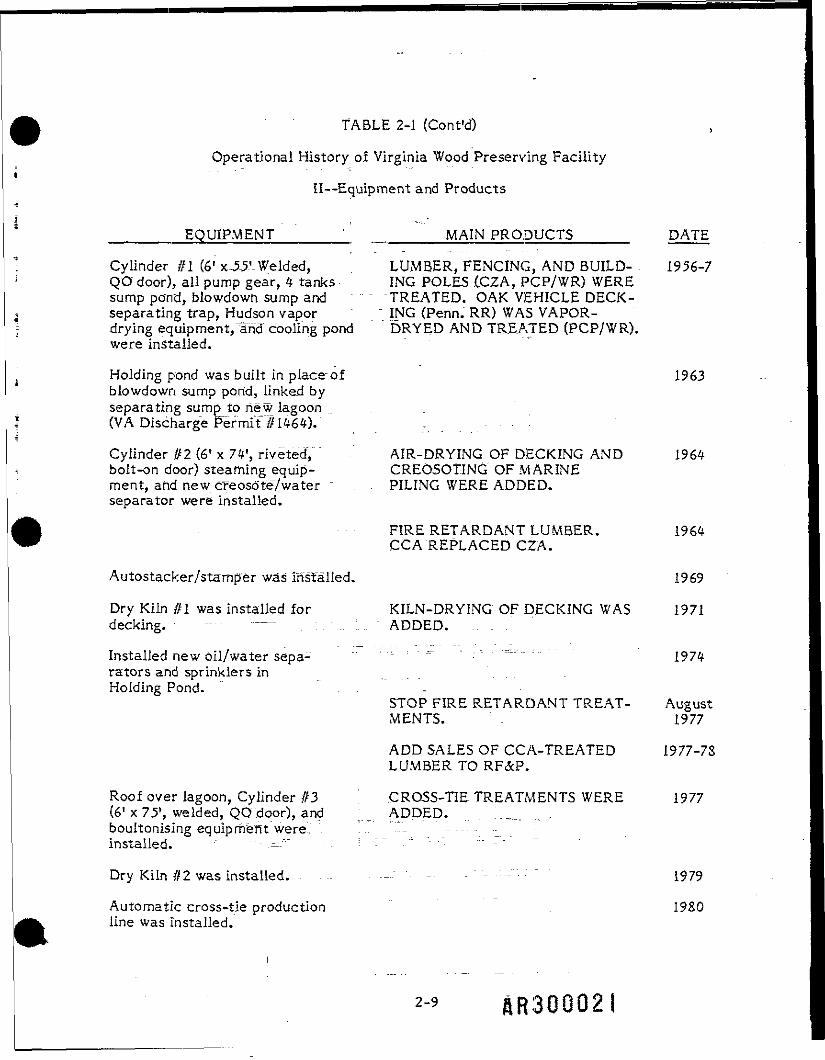
TABLE 2-1 (Cont'd)
Operational History of Virginia Wood Preserving Facility
II—Equipment and Products
_______EQUIPMENT ________MAIN PRODUCTS_____ DATE
Cylinder //I (61 x-5-5'-Welded, LUMBER, FENCING, AND BUILD- 1956-7QO door), all pump gear, 4 tanks ING POLES (CZA, PCP/WR) WEREsump pond, biowdown sump and ' "TREATED. OAK VEHICLE DECK-separating trap, Hudson vapor ~ ING (Penn. RR) WAS VAPOR-drying equipment, and cooling pond DRYED AND TREATED (PCP/WR).were installed.
Holding pond was built in place-of 1963biowdown sump pond, linked byseparating sump^to new lagoon . .(VA Discharge Permit"?/1464). ,
Cylinder #2 (6' x 74', riveted, AIR-DRYING OF DECKING AND 1964bolt-on door) steaming equip- CREOSOtING OF MARINEment, and new creosote/water ~. ., PILING WERE ADDED.separator were installed.
FIRE RETARDANT LUMBER. 1964CCA REPLACED CZA.
Autostacker/stamper was installed. 1969
Dry Kiln #1 was installed for KILN-DRYING: OF DECKING WAS 1971decking. -— : : ADDED.
Installed new oil/water sepa- " •••-••• - - . =^ : 1974rators and sprinklers inHolding Pond. .
STOP FIRE RETARDANT TREAT- AugustMENTS. . 1977
ADD SALES OF CCA-TREATED 1977-78LUMBER TO RF&P.
Roof over lagoon, Cylinder //3 CROSS-TIE TREATMENTS WERE 1977(6[ x 75', welded, QO door), and ; _= ADDED. .__boultonising equipment were.. . '... -- - - -•_installed. ---"" "- : -~ " " : " •• "
D r y Kiln//2 w a s installed. - — - - - - - - 1979
Automatic cross-tie production . 19SOline was installed.
2-9
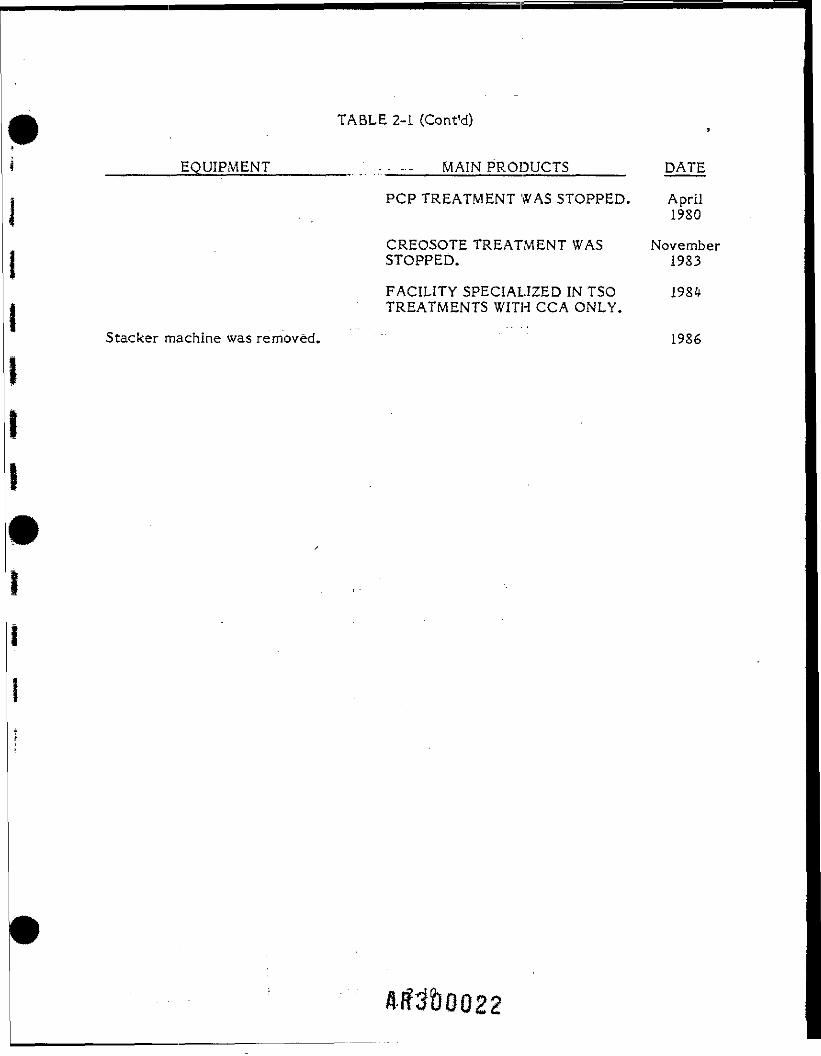
TABLE 2-1 (Cont'd)
_______EQUIPMENT_______^ _: - - - - MAIN PRODUCTS_____ DATE
PCP TREATMENT WAS STOPPED. April19SO
CREOSOTE TREATMENT WAS NovemberSTOPPED. 1983
FACILITY SPECIALIZED IN TSO 1984TREATMENTS WITH CCA ONLY.
Stacker machine was removed. 1986
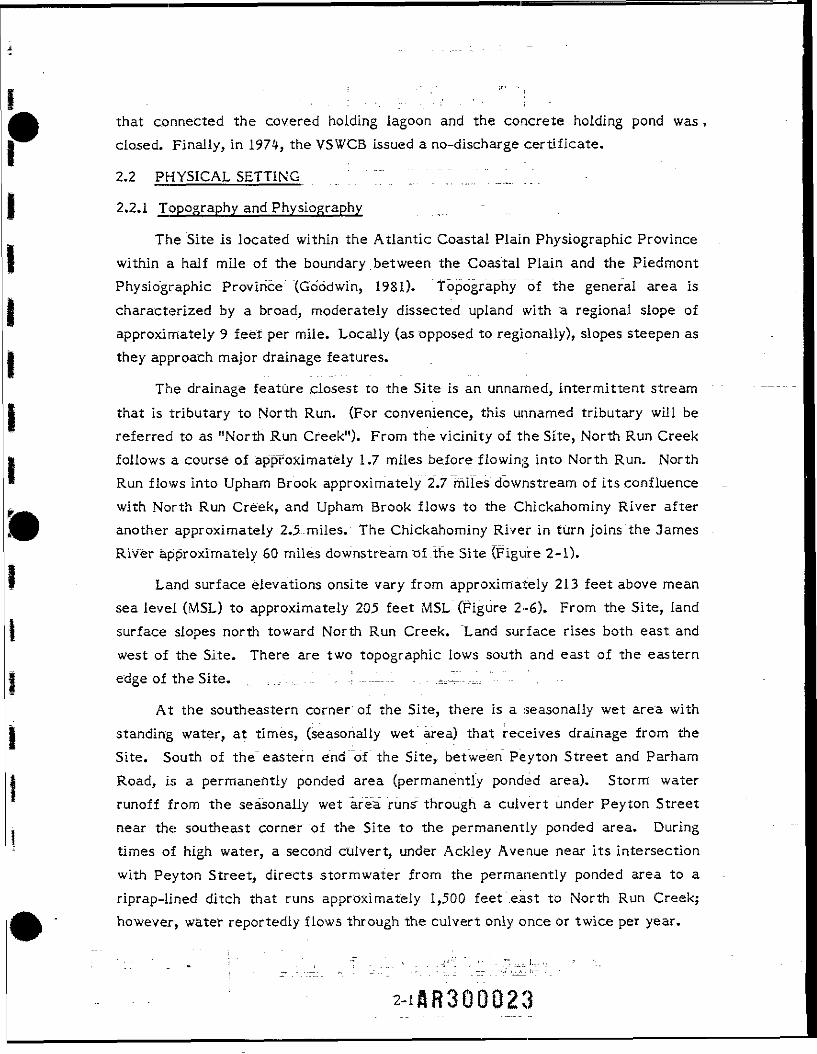
that connected the covered holding lagoon and the concrete holding pond was ,closed. Finally, in 1974, the VSWCB issued a no-discharge certificate.
2.2 PHYSICAL SETTING "" ,
2.2.1 Topography and Physiography -
The Site is located within the Atlantic Coastal Plain Physiographic Provincewithin a half mile of the boundary between the Coastal Plain and the PiedmontPhysiographic Province (Goodwin, 1981). Topography of the general area ischaracterized by a broad, moderately dissected upland with a regional slope ofapproximately 9 feet per mile. Locally (as.opposed to regionally), slopes steepen asthey approach major drainage features.
The drainage feature closest to the Site is an unnamed, intermittent streamthat is tributary to North Run. (For convenience, this unnamed tributary will bereferred to as "North Run Creek"). From the vicinity of the Site, North Run Creekfollows a course of approximately 1.7 miles before flowing into North Run. NorthRun flows into Upham Brook approximately 2.7 miles downstream of its confluencewith North Run Creek, and Upham Brook flows to the Chickahominy River afteranother approximately 2.5-miles, The Chickahominy River in turn joins the JamesRiver approximately 60 miles downstream "Of the Site (Figure 2-1).
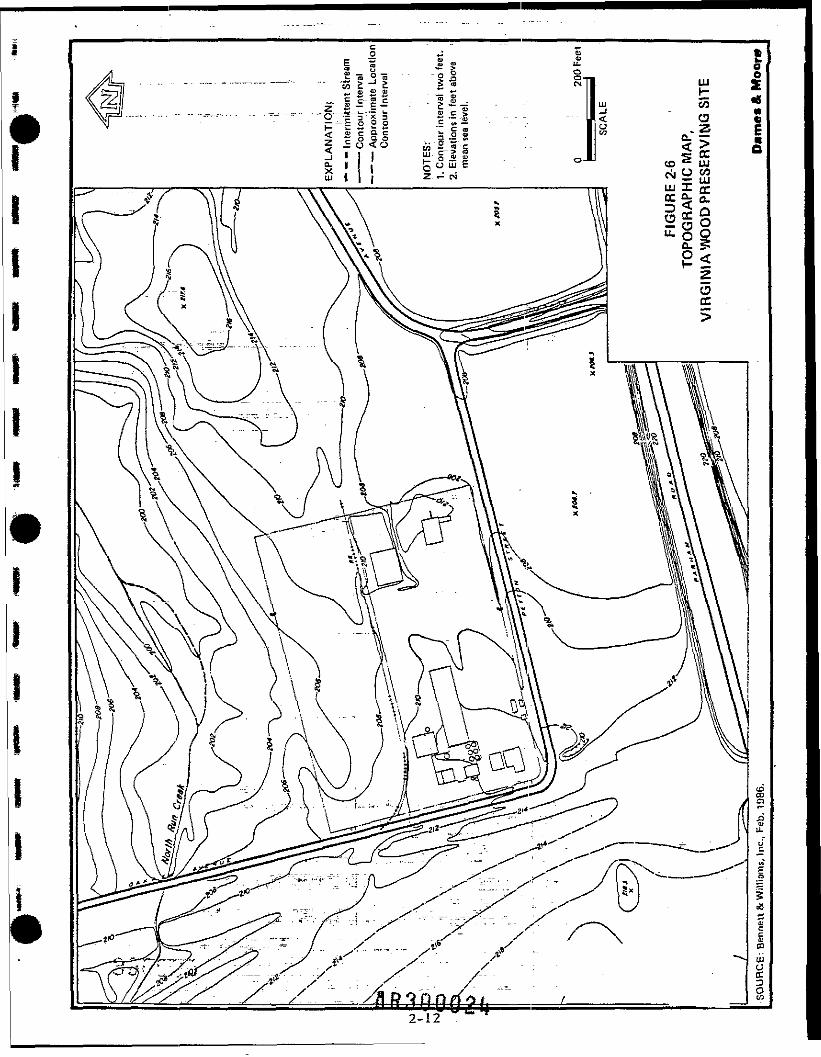
Land surface elevations onsite vary from approximately 213 feet above meansea level (MSL) to approximately 205 feet MSL (Figure 2-6). From the Site, landsurface slopes north toward North Run Creek. "Land surface rises both east andwest of the Site. There are two topographic lows south and east of the easternedge of the Site. .. :...".:.. . _ ", '.....-..'. .... --,,:J .. . ..
At the southeastern corner of the Site, there is a seasonally wet area withstanding water, at times, (seasonally wet area) that receives drainage from theSite. South of the eastern end of the Site, between Peyton Street and ParhamRoad, is a permanently ponded area (permanently ponded area). Storm waterrunoff from the seasonally wet area runs" through a culvert under Peyton Streetnear the southeast corner of the Site to the permanently ponded area. Duringtimes of high water, a second culvert, under Ackley Avenue near its intersectionwith Peyton Street, directs stormwater from the permanently ponded area to ariprap-lined ditch that runs approximately 1,500 feet'.east to North Run Creek;however, water reportedly flows through the culvert only once or twice per year.
2-12
2.2.2 Climate ;= " .: ,__ \.=r. ._ ~~_ "~;._;_.-.
The Site is located in an area of relatively mild winters and warm, humidsummers. The average annual total precipitation is 44.2 inches, according to theSoil Survey of Henrico County, Virginia. The "Climatic Atlas of United Statesindicates aTforrn'al annual total precipitation of 32 to 48 inches per year and anaverage of 40 inches. The mean annual lake evaporation,, as given by the ClimaticAtlas of the United States, is 38 to 40 inches, per year and an average of 39 inches.The average net annual precipitation is 5.2 inches according to the Soil Survey or1 inch according to the Climatic Atlas of the United States. The mean annualtemperature ranges from 55 .degrees F to^ 60 _degrees F. The average high is 90degrees F and the_av~erage low is 32 degrees F. _ _.The average humidity is 71percent. The overall prevailing wind direction is southerly; however, winds maycome from any direction. Mostly southerly to westerly winds prevail, except inOctober and February when the prevailing winds, are north-northeasterly. Theaverage wind speed is 7.7 miles per hour (roph).
2-2.3 Geology and Hydrogeology
From a ro~ck stratigraphic point of view", there are two geologic units in thestudy area". These are sediments deposited during regression of the sea during lateTertiary arid Quaternary time and the underlying Petersburg granite of Paleozoicage. . ._ . " . . . : . : . . _
Daniels and Onuschak (1974) report that the sediments were deposited influvial and nearshore depositional environments and consist of buff to red clays,silts, sands, and gravels. In some areas the sediments may be stained black bymanganese, iron, and cobalt. According to information collected by previousinvestigations of the Site :(Bennett. and Williams, Inc., 1986), the sedimentarydeposits in the vicinity of the site are fluvial clayey sands.
The Petersburg., granite has .several, facies. The predominant fades are aporphyritic orthoclase granite, a quartz monzonite, and a quartz-biotite gneiss.The granite is generally without foliation, loints within the Petersburg granite areeither horizontal or nearly vertical. The nearly vertical joints have either anortherly or an easterly trend. The Petersburg granite weathers to a saprolite thatis commonly a clayey sand (Daniels and Onuschak, 1974).
2-13J
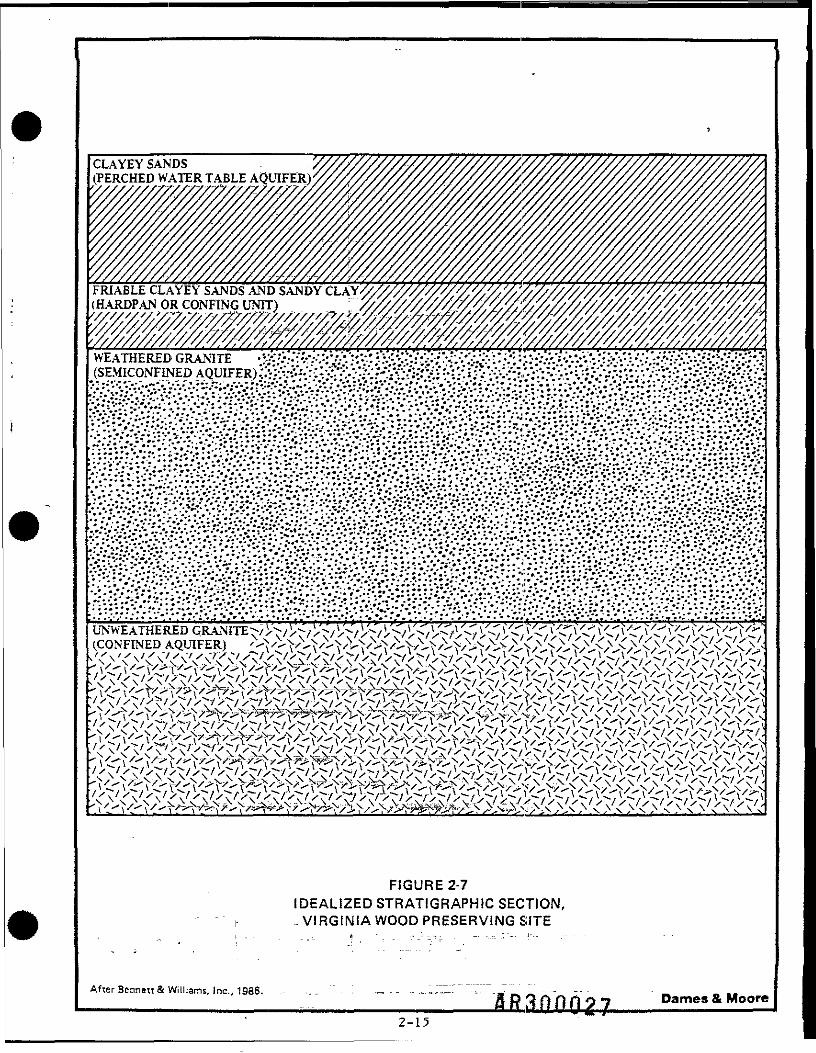
The Bennett and Williams, Inc. (BWI) report concluded that there are four ,hydrogeologic units at the Site (Figure 2-7). From the land surface down, these area perched water table aquifer, an underlying hardpan that functions as a confiningunit, weathered granite (saprolite) that functions as a semiconfined aquifer, and aconfined aquifer in the unweathered granite.
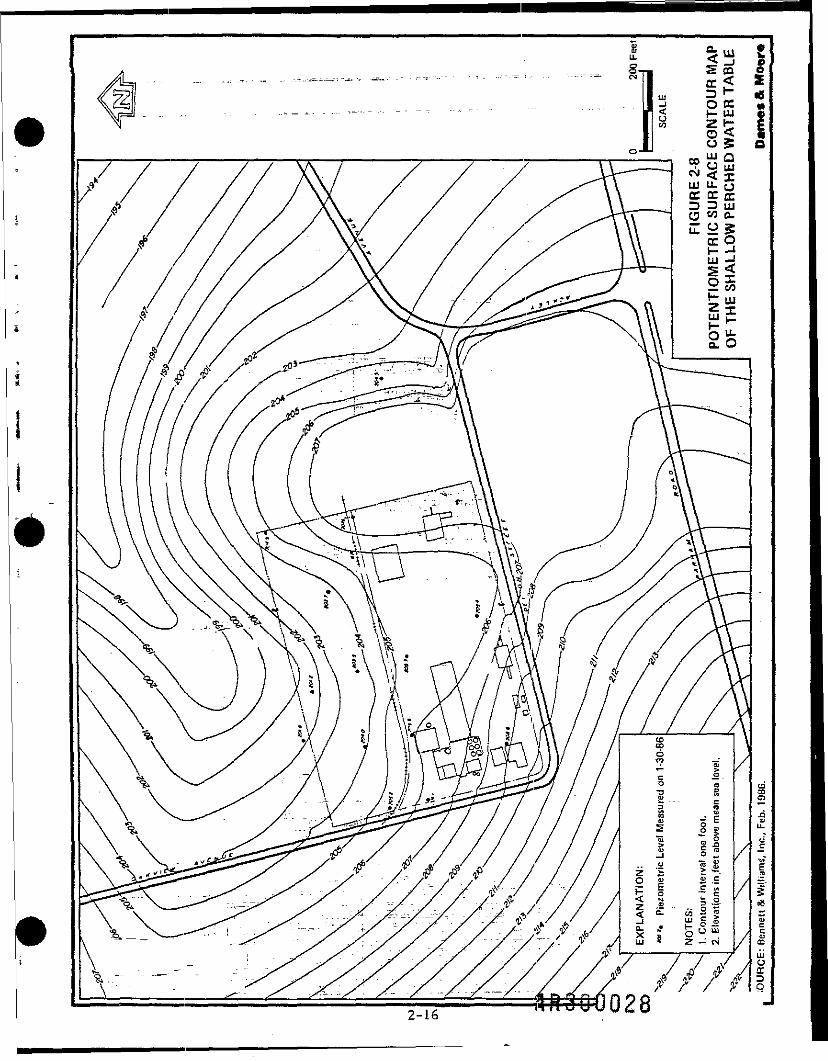
BWI found that the perched water table aquifer consists of fluvial clayeysands that vary from 4 to 10 feet in thickness. Depth to the water table variedfrom 0 to 4.6 feet and the saturated thickness varied from 0 to 7.4 feet. From thewater table contour map (Figure 2-8), it may be inferred that the horizontalcomponent of groundwater flow is generally northeast toward North Run Creek inthe perched water table aquifer; although in the southeast part of the Site, BWIinferred that there may be" a component of flow toward the southeast. Thisinference "appears to""be based upon the presence of standing water in thepermanently ponded area'since that water would represent a surface expression ofthe perched water table. Hydraulic conductivity of the perched water tableaquifer is in the low to moderate range (0.2 to.2.0 gallons per day per square foot(gpd/ft2)). - - -- -;
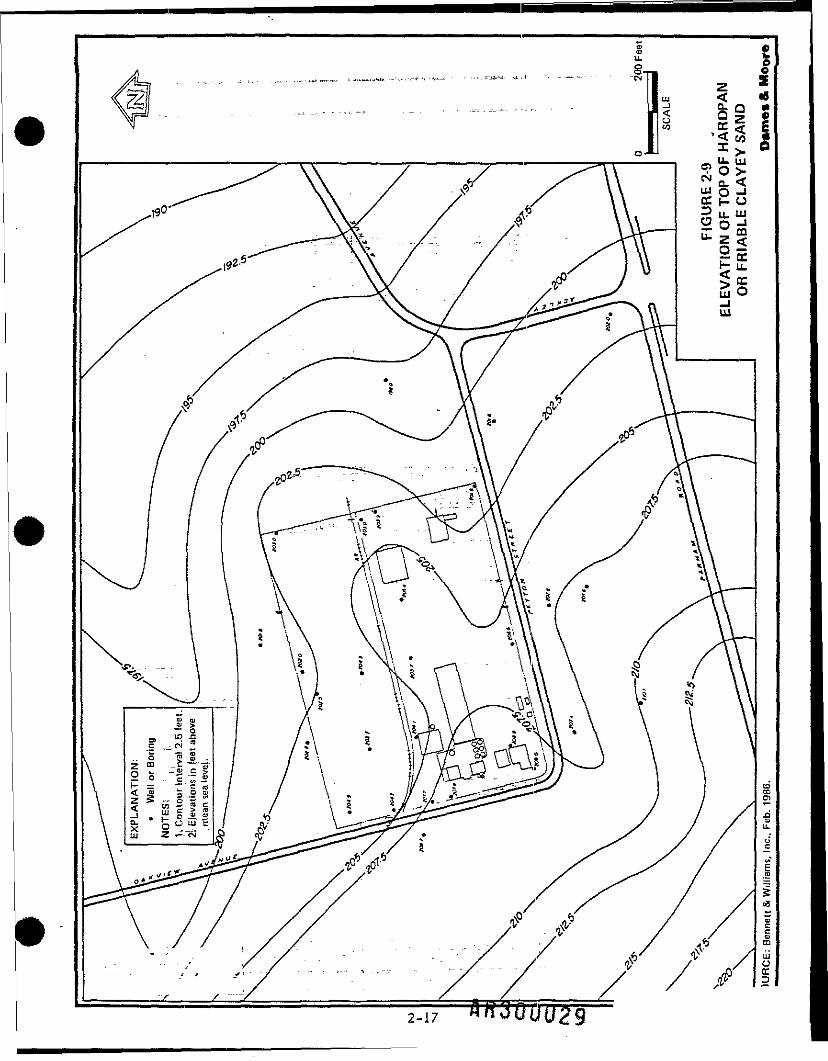
The confining "unit (hardpan) that separates the perched water table and theweathered granite consists, of friable clayey sands and sandy clay. The uppersurface of this unit slopes toward the northeast (Figure 2-9). The BWI reportindicated that the hardpan is up to 7.5 feet thick and that it is also absent inportions "of ..the study area. However, this opinion is not reflected in the contourmap of.the top of the hardpan included in the BWI report (Figure 2-9) that shows a.continuous surface- across/the entire study area. In fact, the data points BWI usedto construct that figure do indicate that the hardpan is present throughout the Siteand does extend offsite In all directions, and the BWI v/ell logs also report thepresence of the hardpan.
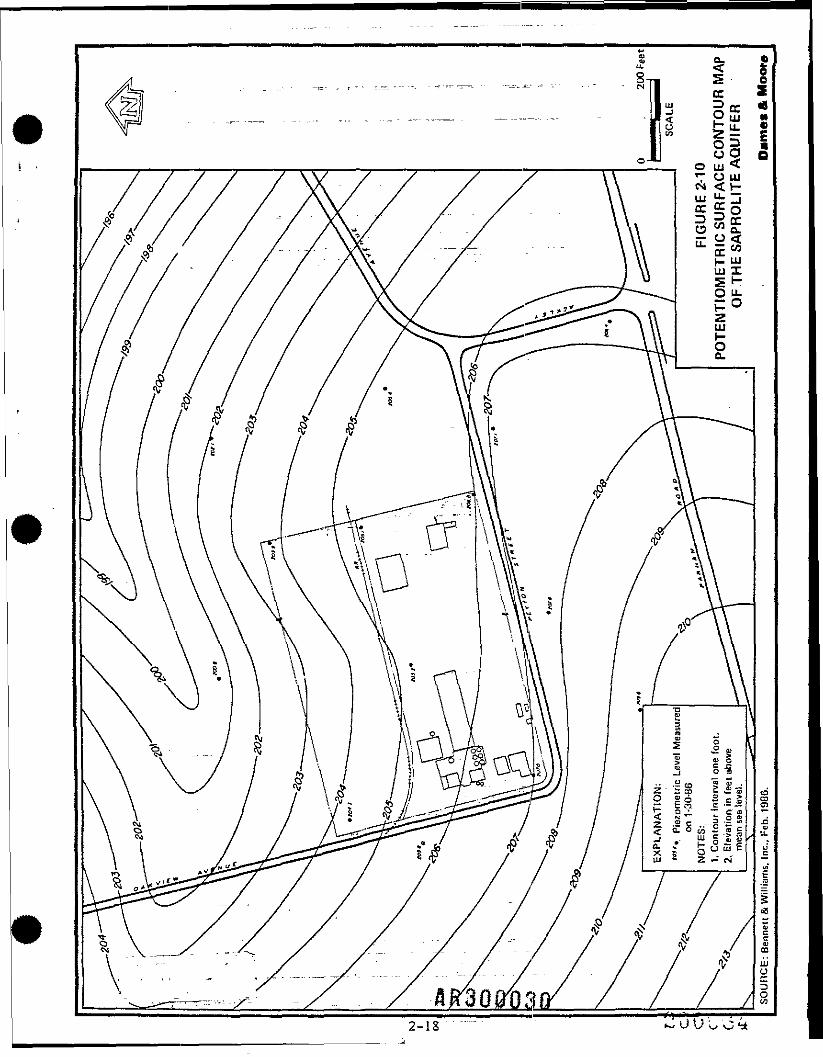
The saprolite beneath the study area reportedly consists of clayey sand tosandy clay (BWI, 1986). It varied from 3.6 to 30 feet thick in the test boringsincluded in previous investigations"and was encountered at depths of 4.5 to 14 feet.The horizontal direction of groundwater flow in the saprolite is similar to thedirection of Slow in the perched water table aquifer (Figure 2-10) and ischaracterized primarily by flow toward North Run Creek. According to the BWIreport, transmissivity of the saprolite is fairly low (approximately 2 to 12 gallonsper day per foot (gpd/ft)).
-2-14
CLAYEY SANDS(PERCHED WATER TABLE AQUIFER)
FRIABLE CLAYEY SANDS AND SANDY(HARDPAN OR CONFING UNIT)///////s/ 's:*?'/-, -s-j yrsys~/?7 7 /
WEATHERED GRANITE
v£i£i ;;£;< &;::;.-;;/:V;y-:;:>:> <-^
'.'r'x?/>tw/; />:v>r/> W> >v'>x'> />r/>r/> :v A
FIGURE 2-7IDEALIZED STRATIGRAPHIC SECTION,... VIRGINIA WOOD PRESERVING SITE
After Bennen & Williams, Inc., 1986. - , _ . " - ! « -- - .*.,7 -'~" ~~~~ T "^ " _.- -- - .____________________^________________flR3fmp27 Pames& Moore
2-15
=. ^
/ / v /////
2-17
reported that elevations of the upper surface of the unweathered granite ,adjacent to the Site varied from 192.8 feet MSL to 16.5.5; feet MSL (Figure 2-11).Within the confines of the Site, the upper surface ol unweathered bedrock appearsto exhibit little relief and has elevations of 1S5.9 .to 190.4 feet MSL. East andsouth of the Site, the unweathered granite surface appears to dip to the east andsoutheast. BWI's interpretation is based .upon auger" refusal, which is a somewhatambiguous method of detecting the top of unweathered bedrock since the advanceof the augers may be halterd by a very dense, little-weathered saprolite. However,the surface represented Jby auger refusal wouFd represent a distinct change indensity (increase) and in hydraulic conductivity (decrease).
Conversations with per-sbnnerat the"Richmond offices of the VSWCB and theU.S. Geological. Survey .(USGS) indicate that there are no data regarding thedirections of groundwater flow in the granite. However, the personnel at theVSWCB and the USGS expressed the opinion that consideration of regional surface .water features make it reasonable to infer that groundwater in the granite wouldflow either south or southeast toward the James River or east toward theChickahominy River since these are the major surface water drainage features inthe region. ; ~ V = " -- .
Comparison of the elevations of the potentiometric surfaces of the perchedwater table aquifer and the saprolite indicates that the hydraulic relationship ofthese two hydrogeologic units varies with location (Figure 2-S and 2-10). In thesouthwest corner of the Site, the water levels in the perched water table aregreater than those: in the saprolite and favor downward flow of water from theperched-water table to the saprolite. The reverse tends to be the case to thenorth, northeast, and east of the Site.
2.2,4 Land Use .__,...... __ ! ". ... ._...". ..."." "" . •
Present land use adjacent to the Site is undeveloped (wooded) except for theroads bordering the western and southern boundaries of the Site and the railroadright-of-way west of Oakview Avenue. Nearby development is light industrialjcommercial and residential development in the general area is depicted onFigure 2-2. . ... . ."-": . . ''.':. '-.'---' = -: ::"-:- -^T.__ r.. .-
2-19
i
Q
cc.0^ CDO QOZ
01co jQ 111w 5CC H
t— LU _r x ,N t<L1J < V>CC DD & LL(j Z UJ
E DCCu. enO u
iS*-S;< 03> QLLJ LU_J HUJ O
LUHUJQto
flfi30003?2-20
2.2.5" Water Supplies •-"••_ • „
:Beiore"19S7, water supply in the general area of the Site consisted of bothprivaterwells and the Henrico County municipal water supply. Water mains werelocated on ParhanvRoad, Sedgemore Drive, Broadway Avenue, and Ackley Avenue.The Site itself has taken its drinking water from the municipal water supply since1982. - - - --- - - -- -- -
In March and April of 19S7, rjenrico County extended the municipal watermains to residents of the neighborhood northeast of the Site. Residents ofWakefield Road, Mayfair Avenue and Oakview Avenue, who had previously usedgroundwater, were provided access to the Henrico County public water supply. TheCounty health Department has reported that all residents in the neighborhood havehooked up to public water. "One business, Oakview Auto Sales, continues to usewell water for non-potable purposes. Whether or not other area residents are stillusing v/ater from their wells, despite the public water supply hookup, is unknown.Downgradient well owners "who may be affected by the contamination will beadvised of the possibility that their wells are contaminated and urged to stop usingthem. This will be done'if contamination is found during the remedial investigationin either the saprolite or granite,aquifers that exceeds drinking water standards.
2.3 PREVIOUS INVESTIGATIONS .,...„.._._ ,._ .1
Investigations of the Site and nearby areas have been performed by the State,Henrico County, arid several private organizations. The VSWCB investigation of1962 was discussed in Section 2.2. Environmental Laboratories, Inc. (ELI) andDvorak Geotechnical Services, Inc. (DGS) performed a limited study of subsurfaceconditions at the Site in 1985. This was followed by a broader investigation of theSite and the .immediate:.vicinity by BWI in 1985 and 1986. NUS Corporationconducted a site investigation 6f the Site in 1985. On behalf of Richmond LandCorporation, Environmental Technology, Inc. (ETI) conducted an Investigation ofoffsite groundwater, surface water, sediment, and soils in 1987.
Initial investigations by ELI and DGS were undertaken at the request of the.VSWCB. They involved installation of five monitor wells into the saprolite and ninesoil borings and collection "and analysis of .soil, groundwater, and runoff samples.These" samples were collected onsite or at the Site boundary. The analyticalprogram included analyses for PCP, creosote (as total PAHs), copper, chromium,
and arsenic. In the onsite soil samples (upper 12 inches), the following results werereported: chromium (69,1 to 675 mg/kg), copper (20 to 455 mg/kg), arsenic (65.4 to1,220 mg/kg), PCP (3-1.64 to 1,412.55 mg/kg), and creosote (16.0 to 359.63 mg/kg).Runoff samples collected at the Site boundary were reported to contain copper(0.06 to 1.59 ppm), chromium (<0.05 to 3.61 ppm), arsenic (0.20 to 3.81 ppm), PCP(6 to 84 ppb), arid creosote (<2.0 to" 1,686 ppb}. Groundwater samples werecollected from wells at the four corners and at the center of the Site from thesaprolite aquifer; these .samples were reported to contain copper (<0.10 to 0.46mg/1), chromium (<0.05_ to 0.05_mg/l), PCP (3 to 64 ug/I), and creosote (<2 to 243ug/1). This investigation provided no formal assessment of data quality. The wellsinstalled during this investigation penetrated the hardpan at the Site without use ofconductor casings to~seal off the perched water table aquifer before penetratingthe hardpan and perhaps without being fully grouted (the well construction diagramreflects the use of "low-permeability backfill); so it may be that these wellscreated conduits for vertical migration through the hardpan. Therefore thegroundwater analytical results may~reflect this potential; vertical migration.
As on outgrowth of the initial ELI report, ELI also conducted an investigationof possible migration via utility line backfill and via the sanitary sewer adjacent tothe Site, and reported that creosote. in..water collected from temporary wells in theutility trenches was less than 20 ppb and that PCP ranged from 27 to 43 ppb. Soilsamples from the utility trenches exhibited creosote values of 2S1 to 795.6 ppb.Sewage samples contained PCP at concentrations, of less than 10 ppb and lowconcentrations of some PAHs. - - - -
The study by BWI was a. continuation of the ELI/DGS Investigations. Thisinvestigation was conducted onsite and also extended offsite in all directions; itinvolved installation of 14 wells and 14 soil borings, collection and analysis ofgroundwater and soil samples, an assessment of site geology and hydrogeology, anda preliminary interpretation of the extent of contamination based upon visualexamination of soils and total pfienolics data. The BWI report provided a goodoverall evaluation of the geology and groundwater hydrology of the Site; althoughthe.interpretations of these data sometimes tended to go beyond the limits of thedata. The saprolite wells installed by BWI penetrated the hardpan without usingconductor casings through the perched water table aquifer, but they werereportedly grouted from below the hardpan to land surface. The BWI analytical
2-22
data were not subjected to formal data validation, but there were problems,(laboratory instrument failure) with the analyses other than those for totalphenolics. . " --—-—--•-:--- - •--.--• ----- - • - - _ : _ _
The BWI report concluded that constituents probably attributable tocreosote, PCP, and CCA were present in soil above the hardpan in three phases:light non-aqueous phase liquid (NAPL), dense NAPL, and that directly dissolved inthe groundwater.
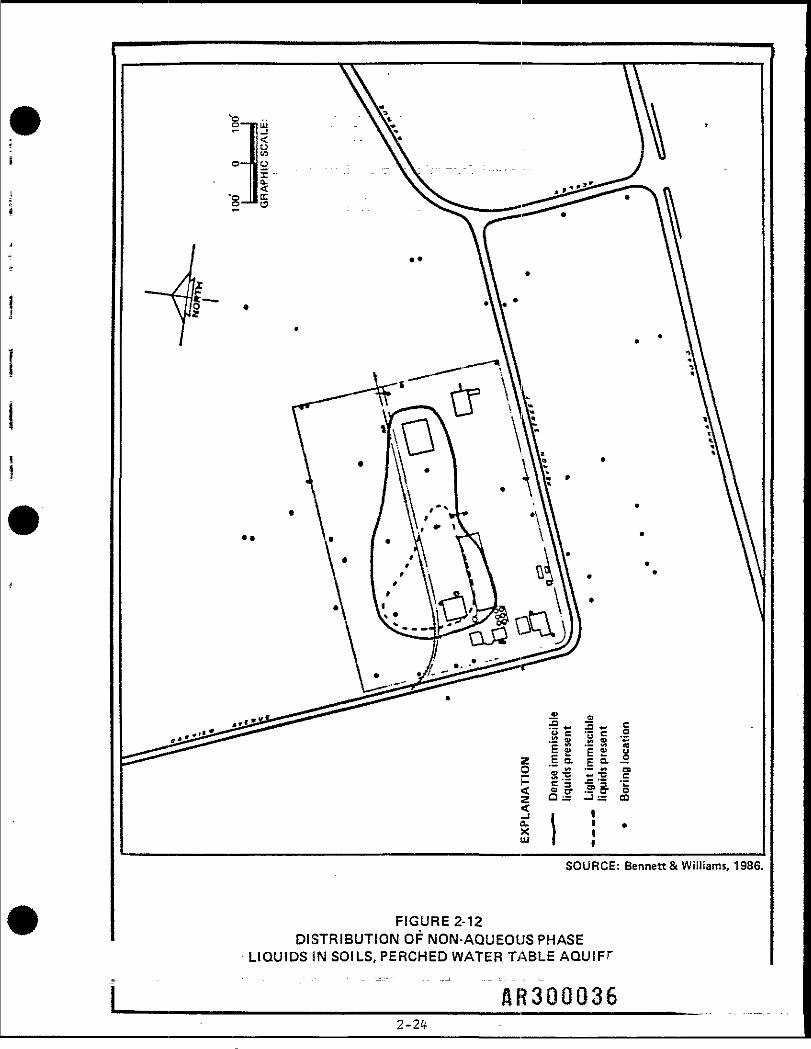
BWI reported that both light and dense NAPL were present in the perchedwater table aquifer; however, the dense phase was distributed more widely (Figure2-12). The light phase was reportedly present at and above the water table. Thedense-phase reportedly settled to the bottom of the perched water table aquiferand accumulated on top of the hardpan. BWI concluded that these product phasesappeared to be restricted to .the shallow perched water table aquifer.
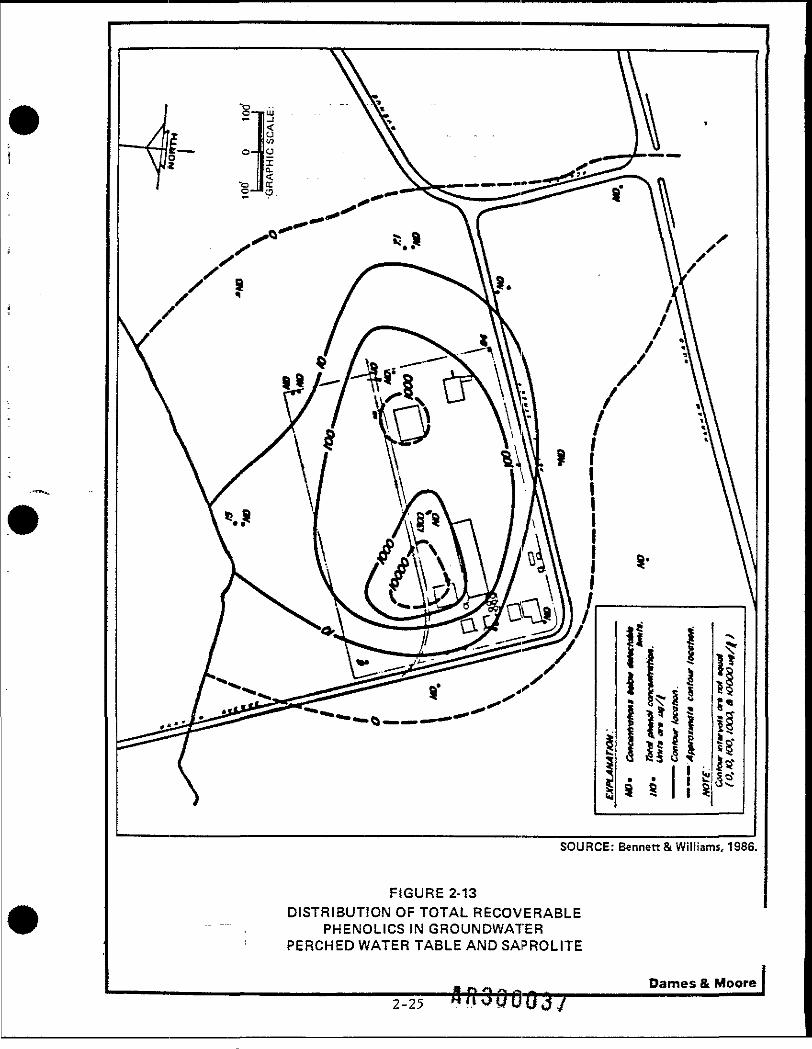
BWI reported that groundwater with dissolved components of these productphases was between the light and dense product phases in the perched water tableaquifer and in the underlying; hardpan and "saprolite aquifer. BWI based itsinterpretation of the ex.tent-6f_ these components in the groundwater upon totalrecoverable phenolics (Figure 2-13). This interpretation is subject to limitationssince it cfoes not differentiate between natural and synthetic phenolics; however, itrepresents a useful first approximation, especially in the high concentration areas.Highest reported concentrations were in the vicinity of the concrete holding pondand the former holding lagoon (structures shown in Figure 2-4). The reportedconcentrations diminished rapidly toward the boundaries of the Site and were belowdetection limits at the northeast and southwest boundaries of the Site.
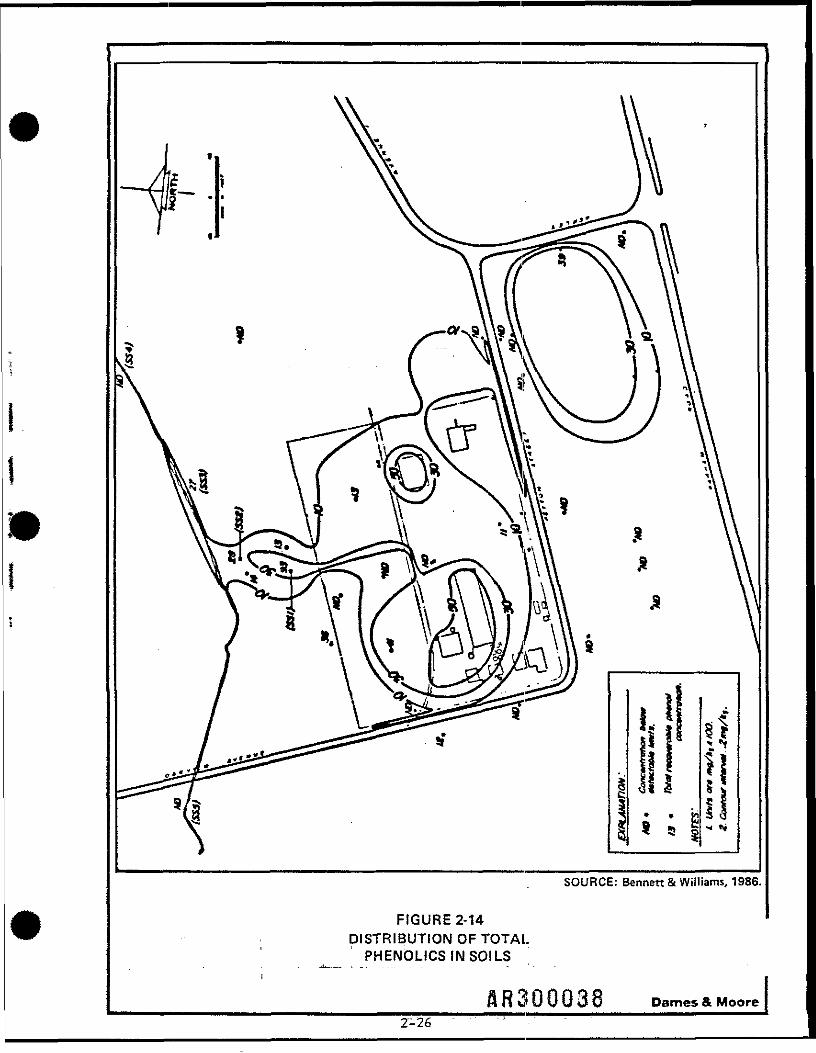
BWI's interpretation of the distribution of chemicals in products used at theSite in soils (Figure 2-14) is also based upon analyses for total recoverablephenolics. from all the previous investigations. It should be, recognized that an
interpretation based upon this analysis is misleading since that analytical methoddoes not .differentiate among naturally occurring phenolic compounds that areproducts of biodegradation, phenolic compounds associated with creosote, PCP, orother phenolic compounds. An interpretation based upon the results of the totalrecoverable phenolics analysis may overestimate the extent of the location andconcentration of these constituents and may include samples that contain only
2-23
«- 3 *, g
s ia =>~ = 5 •= 5 '=< . « g- && aQ — — ' ~ co
a.XUi I I •
SOURCE: BennettSt Williams, 1986.
FIGURE 2-12DISTRIBUTION OF NON-AQUEOUS PHASE
LIQUIDS IN SOILS, PERCHED WATER TABLE AQUIFr
_______ "fl'R300Q362-24
SOURCE: Bennett & Williams, 1986.
FIGURE 2-13DISTRIBUTION OF TOTAL RECOVERABLE
PHENOLICS IN GROUNDWATERPERCHED WATER TABLE AND SAPROLITE
2-25Dames & Moore
SOURCE: Bennett & Williams, 1986.
FIGURE 2-14DISTRIBUTION OF TOTALPHENOLICS IN SOILS
Dames & Moore2-26
byproducts of the decomposition of organic matter. Total phenolic concentrationsin soils were reported to be highest in the vicinity _of_the. former holding lagoon, theformer holding pond, the cooling pond, treatment cylinders, storage tanks, and thedrip pad. These structures are identified on Figure 2-4,. BWI reported that lowerconcentrations extend offsite to the north from the center of the Site and to thesoutheast from the southeast quadrant of the Site.
NUS conducted an investigation of the Site under EPA contract in 1985. Thisinvestigation involved analysis of groundwater samples from three private wells,water and sediment samples from two locations on North Run Creek, one liquid andone sediment sample from the covered holding lagoon, and surface water andsediment samples from two locations in the marsh east of the site. PCP (12 ug/1)was reportedly detected in one groundwater sample taken from a single well,approximately 1,000 feet northeast of the site adjacent to North Run Creek. Thatconcentration is significantly less than the proposed maximum contaminant levelgoal for drinking water (PMCLG) of 200 ug/1. No organics (other than probablelaboratory artifacts) were reported in the samples from the creek. PCP, a varietyof PAHs, arsenic, "copper, "chromium, and zinc were reportedly detected in thesamples collected from the (former) covered holding lagoon and the seasonally wetarea... The NUS data were subjected to formal data validation procedures. Allanalytical fractions were evaluated as being "acceptable with exceptions."
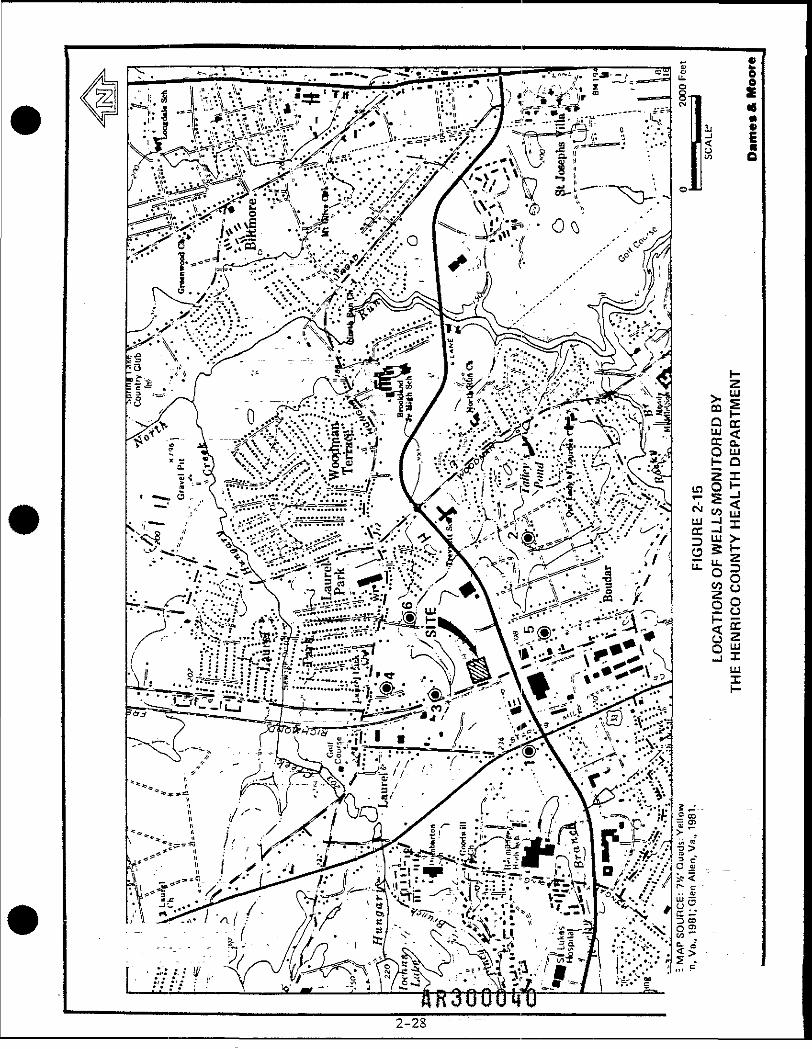
The Henrico County Health Department reported that there are 92 homewells within a 1-kilometer radius of the Site. Depths of these wells reportedlyrange from 10 to 215 leet; however, wells 20 to 40 feet deep are the mostprevalent (Rentokil, 1986). Eighteen of the wells were reportedly northeast(downgradient) of the Site, In August 1985, the Henrico County Health Departmentreported that it had tested 15 privately owned wells near the Site and found waterto be safe for drinking (Henrico; County Health Dept., 1985). The County selectedsix wells for long-term quarterly monitoring (Figure 2-15). After as many astwelve sampling and analysis events, the County concluded that, as of February1988, there had not been a public health problem (Henrico County Health Dept.,1988). For the six wells, the ranges of concentrations varied as follows: copper(0.02 to 5.75 mg/I), chromium (<0.0003 to 0.002 mg/1), arsenic (<0.0003 to.0.0036mg"/l), and total phenolics (<0.001 to 0.004 mg/I). PCP was not detected (<0.0001mg/lL in all but one sample. The sample where PCP was detected had a
2-27 AR300039
2-28
concentration of 0..55 mg/1. This point was judged to be an unrepresentative outlier,measurement based on the previous quarterly monitoring results and eightsubsequent analyses, which all found PCP concentrations to be below the detectionlimit. These analyses were performed by the Virginia Department of GeneralServices Division of Consolidated Laboratories and by the Virginia Department ofHealth's Bureau of Water Supply Engineering. =
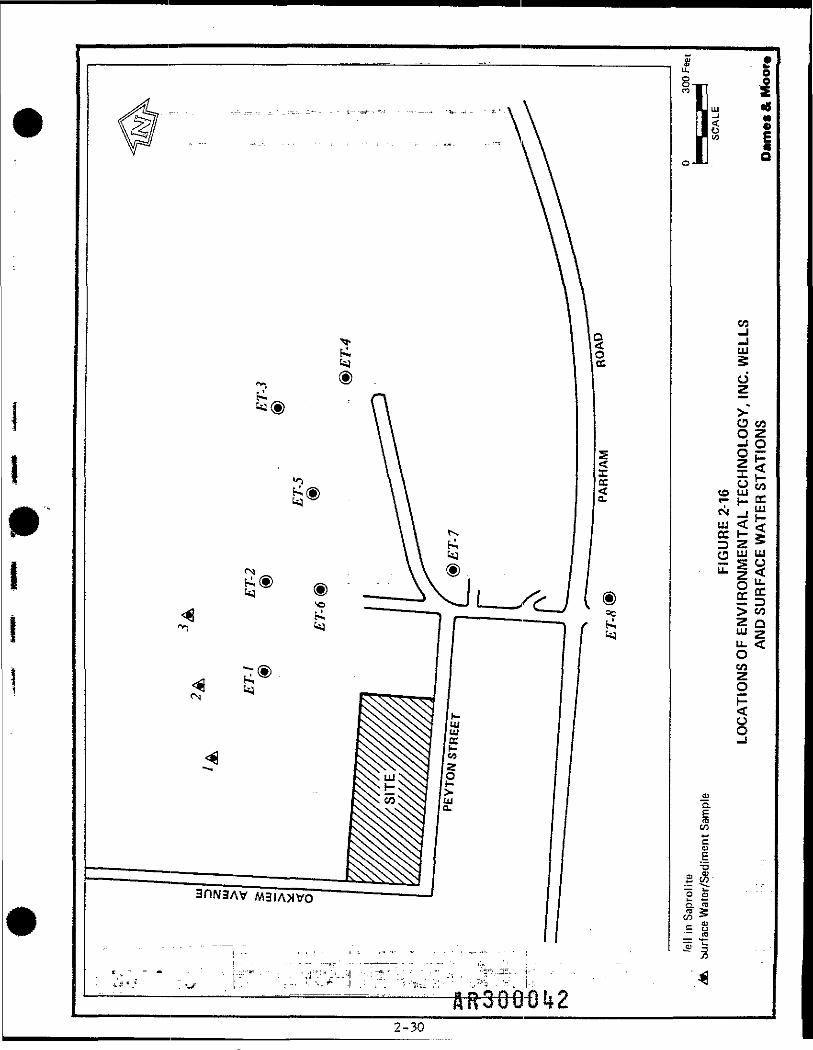
In addition to these onsite studies, a study was completed in March 1987 byEnvironmental Technology Incorporated (ET1) on property north and east of theSite. "Eight groundwater monitoring wells were constructed into the saprolite andthree sediment and water samples were taken from North Run Creek (Figure 2-16).Ten surface soil and eight subsurface soil and water samples were also collected.No organic compo-unds were detected in the ETI study. ETI reported that thesediment samples from North Run Creek contained arsenic (4.0 to 140.7 mg/kg),chromium (<9.3 to 18.1 mg/kg), and copper (<9.3 to 21.7 mg/kg). Surface soilsample concentrations of metals varied as-follows: arsenic (1.7 to 242.7 mg/kg)chromium (<9.6 to 67.7 mg/kg), and copper (<9.6 to S9..7 mg/kg), and subsurfacesoil samples were found to contain arsenic (4.6 to 23.9 mg/kg), chromium (<9.3 to9,8 mg/kg), and copper (<9.2 to 9.5 mg/kg). Surface water samples from North RunCreek metals were reported to be arsenic..(<0.005 to 0.041 mg/U, chromium (<0.05to 0.05 mg/1), 'and copper (<O.Q5 to" 0.05 mg/i). Metals detected in groundwaterwere reported to be arsenic (<0.005 to 0.040 mg/1), chromium (<0.05 to 0.05 mg/1),and copper (<0.05 to 0.12 mg/1). ETI provided no formal data validation but didreport that the field blank and the trip blank contained none of the target analytes..The ETI data were not subjected'to a formal data validation procedure.
Samples from the former covered holding lagoon were collected on January29, 1987; these samples were subsequently analyzed by Triangle Laboratories fortetra to octa dioxins and furans. Penta, hexa, hepta, and octa isomers weredetected at concentrations that varied from 0.30 ng/g to 6494.22 ng/g; however,none."of the more toxic tetra isomers were detected. ERT (1987) reported that allcontents of-the "covered holding lagoon were removed in September 1987 andtransported for treatment and disposal. Removal operations continued until visiblyclean soil was observed. ERT reported that "very little penetration was noted inthe low-permeable silt and clay." This appears to indicate that the lagoon had notbreached the hardpan.
2-29
2.4 INITIAL EVALUATION OF SITE
2.4.1 Identification of Potential' Waste Sources .. -
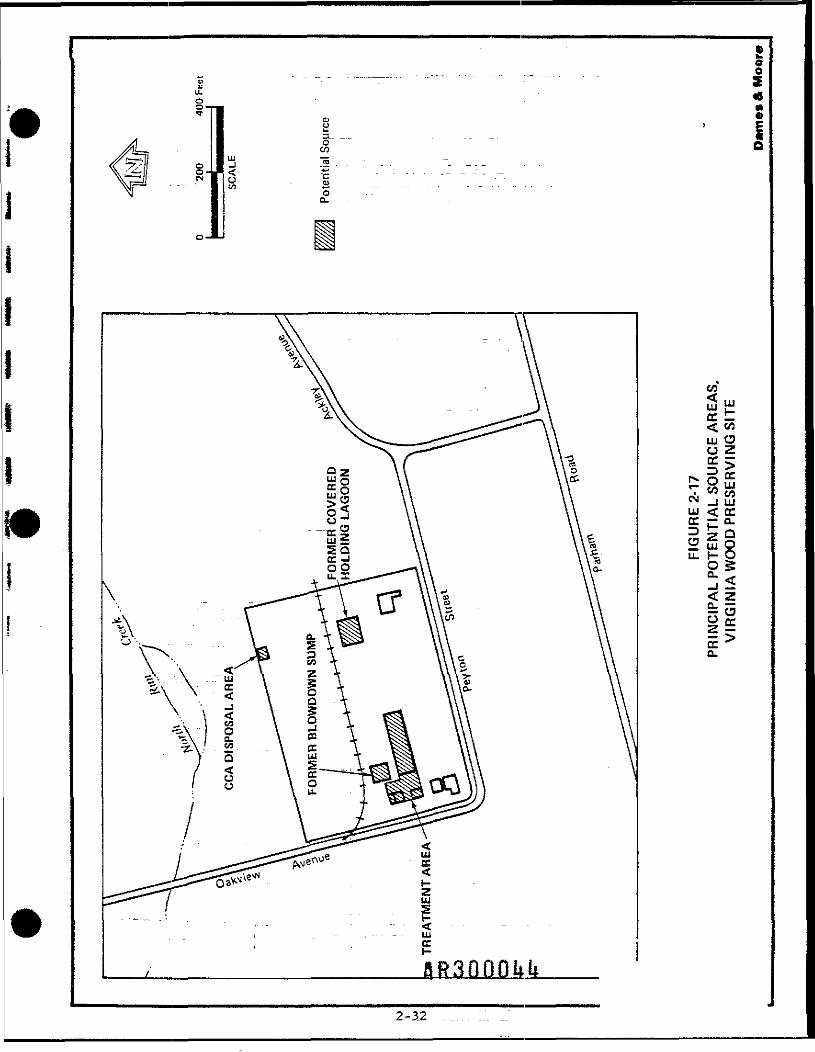
The identification of potential waste sources at the Site requiresconsideration of the chemical products that were used in treating wood products atthe site and of reported waste management practices. All of the chemicalproducts reportedly used at the Site (Figure 2-3) are potential wastes. Past wastemanagement practices at the Site suggest that there are four principal potentialsource areas (Figure 2-17). These potential source areas are the treatment areaincluding the treatment .cylinders, product storage tanks, treatment room, and drippad; the area of the former" biowdown sump; the former covered holding lagoon;and the reported disposal of approximately 1,100 to 1,400 pounds of CCA in 1976 or1977. The NAPLs observed by BWI (Figure 2-11) may also constitute a potentialsource for groundwater_^egradation in the perched water table aquifer.
2.4.2. Preliminary'Assessment of Distribution of Wastes
The BWI investigation is"'"the most .extensive investigation of the Siteundertaken to date" and is the only one that has attempted to describe the.distribution of waste-related products on "and near the Site. While there werelimitations in the BWI analytical program, BWI's interpretations are considered auseful point of departure and must be-considered in conjunction with informationgathered during other investigations. _
BWI based its interpretation of the distribution of waste upon observations ofNAPLs (Figure 2-12) and analyses of total recoverable phenolics in groundwater(Figure "2-l3Tand soiT/sediment (Figure 2-14). BWI concluded that the NAPLs wererestricted to the central portion of the Site. Since, .this interpretation is based uponsimple observations (visual detection of "oily" product in soil samples) andmeasurements (detection of non-aqueous liquid in wells), it may be consideredreasonably reliable.
The BWI interpretation of the distribution of waste-related products ingroundwater is based upon total recoverable phenolics (Figure 2-13). As discussedearlier, this procedure should detect PCP, related phenolic compounds, and manynaturally occurring phenolic compounds and would therefore tend to overestimatethe distribution of site-related phenolics. The subsequent investigation by ETI ofthe area~ downgradient of the Site detected no organic compounds and appears to
2-31
CO
60<
< COLJ OO ZCC
r- § EP S uj• W3 w« -I UJLU < OCDC Q.
u_ (- Oss< 2
Ifcc Q.
confirm the BWI interpretation. It is recognized that an interpretation based uponphenolic compounds and PAHs does not address ail potential waste productsassociated with the Site. Accordingly, the present study will address the fullspectrum of potential wastes by performing analyses for volatile organics, semi-volatile organics (includes PAHs and phenolics), and the metals associated withwood treating processes (arsenic, chromium, copper, and zinc).
Although the data from the BWI and ETI studies indicate that phenolics ingroundwater are restricted to_the immediate vicinity of the site, the NUS reportstated that 12 ug/1 PCP was detected in a single private well (Merkel) locatedapproximately 1,000 feet northeast of the site. This single datum from the NUSinvestigation Is not supported by the long-term quarterly monitoring of privatewells by the Henrico County Health Department which has reportedly included 11analyses of this same well (well 6 on Figure 2-15), none of which detected PCP( 0.1 ug/1). The NUS__datuncLis alsa;at odds with., the ETI finding of no PCP ingroundwater closer to but_downgradient of the Site.
BWI found that total recoverable phenolics in soil/sediment (Figure 2-13)were distributed over most of the area of the plant and in the major drainage waysfrom" the Site.' The off site areas in which phenolics were detected include an areaof soils that extends, north from the Site to North Run Creek and then extendsapproximately 200 feet downstream. The other olfsite areas in which phenolicswere detected are the .seasonally wet area and the permanently ponded area.
The metals data from the sediments of North Run Creek (ETI, 1987) indicatethat metals concentrations may be elevated above background concentrations atthe approximate location" of station 2 on Figure 2-16. The only metal detected atstation 1 was arsenic (L.7 mg/kg). All three metals were detected at station 2 atconcentrations that varied from 67.7 mg/kg to 242.7 mg/kg, but only copper andchromium were"'detected at station 3 at concentrations of approximately 10 mg/kg.No organics.were' detected in these sediment samples.
2.4.3 General Contaminant TransporrConsi'derations
Groundwater samples collected during this investigation will be from theshallow unconfirmed perched water table and semi-confined saprolite and graniticaquifers. Recharge of these aquifers occurs through infiltration of precipitation,principally rain, through the lands' surface to the - underlying unconfined
2-33.
groundwater .system, which then leaks through the clay zone to the underlying»piedmont and granite .systems. ^Infiltration rates vary widely, depending on landuse, the character and moisture content of the soil, and the intensity and durationof precipitation. Infiltration rates may range possibly as much as 0.1 in/hr inclayey and silty soils to 0.001 in/hr or less in the hardpan.
Because the source areas of possible contamination at Rentokii are locatedon or near the land surface, infiltration is the process through which contaminantsmay be transferred into the groundwater. Once in the groundwater, solublecontaminants will travel by advection along the same pathways and directions asthe groundwater. Immiscible.- contaminants that "are less dense than water willmigrate on the water table, down its steepest gradient, unless intercepted by animpermeable.obstruction that lies in the plane of the water table. They will theneither migrate around the obstacle or.be impounded by it.
Contamina'nts that are immiscible and more dense than water tend to sink tothe bottom of the aquifer and collect on materials of low permeability that canserve as a barrier to their further downward migration. After reaching such abarrier, dense immiscibles tend to pool or flow under the force of gravity along thesurface of the barrier. The hardpan layer is thought to be such a barrier at theRentokii site. Accordingly, the potential migration pathway along the top of thehardpan must be investigated. Similarly, the granite bedrock beneath the site alsomay provide such a barrier, and the interface between the weathered and solidgranite bedrock requires careful investigation to identify any dense immisciblespresent, " -..— ..- .....-_ .._..._ ... -----
i kThe remedial investigation is designed to address; these various pathways ! b-
through collection of .soil and groundwater samples from specific points in these taquifers. The concentrations of contaminants will be determined and related to
i.the degree of site-specific segregation and accumulation that has occurred along ; .;the various interfaces and aquifer zones. ' ^
wrf- l2.4.4 Preliminary Identification of Migration and Exposure Pathways O -'-
CD ;Potential migration pathways at the Site involve surface water, ci)
soil/sediment, and groundwater. The existing information does not indicate that ^^tiE™
the air pathway is operative at the Site. «£
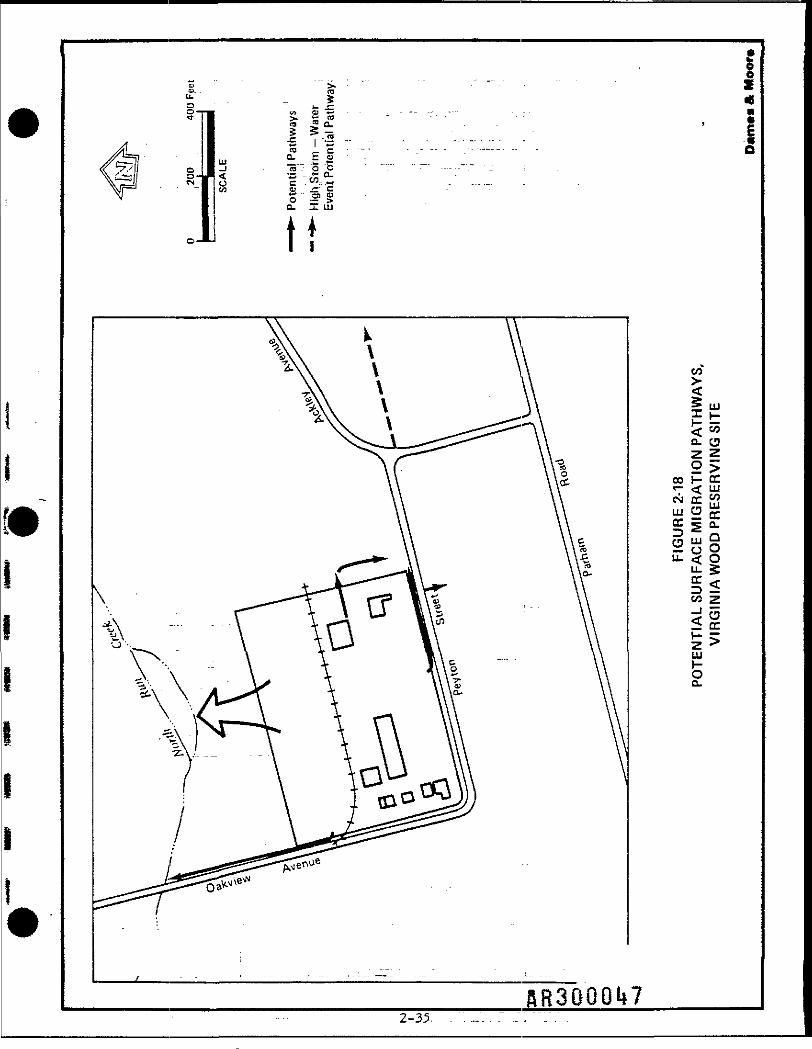
Potential surface water pathways from the Site are depicted in Figure 2-18.The principal potential pathways flow north fromatfre ffififl hpftion of
2-34
•
CO
<h<«a. C3z z2 >
CO f- CCr- < LU
tt g Q.
5 UJ QSE o ou_ <
LUHOCL.
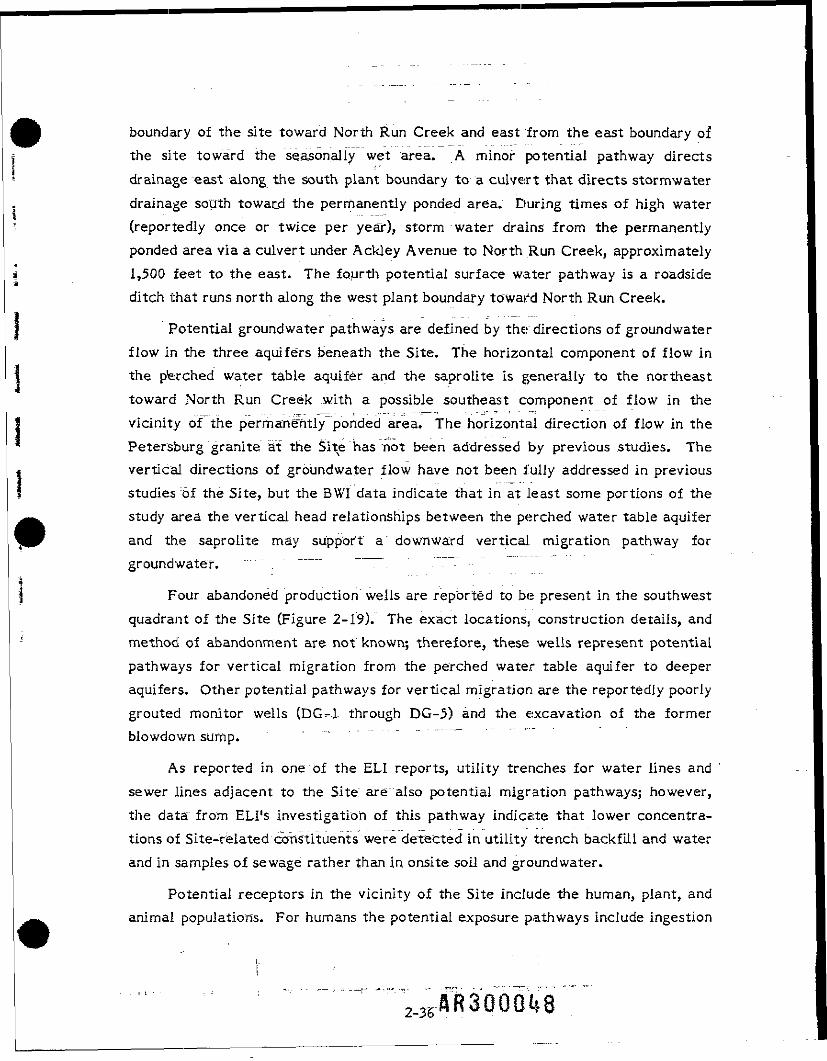
boundary of the site toward North Run Creek and east from the east boundary ofthe site toward the seasonally wet area. A minor potential pathway directsdrainage "east along the south plant boundary to a culvert that directs stormwaterdrainage south toward the permanently ponded area. During times of high water(reportedly once or twice per year), storm water drains from the permanentlyponded area via a culvert under Ackley Avenue to North Run Creek, approximately1,500 feet to the east. The fourth potential surface water pathway is a roadsideditch that runs north along the west plant boundary to'wafd North Run Creek.
Potential groundwater pathways are defined by the directions of groundwaterflow in the three aquifers beneath the Site. The horizontal component of flow inthe pferched water table aquifer and the saprolite is generally to the northeasttoward North Run Creek with a possible southeast component of flow in thevicinity of the permanently ponded area. The horizontal direction of flow in thePetersburg granite at the Site has not been addressed by previous studies. Thevertical directions of groundwater flow have not been fully addressed in previousstudies of the Site, but the BWI data indicate that in at least some portions of thestudy area the vertical head relationships between the perched water table aquiferand the saproiite may support a downward vertical migration pathway forgroundwater. " ——— —_ ";~r
Four abandoned production wells are reported to be present in the southwestquadrant of the Site (Figure 2-19). The exact locations, construction details, andmethod of abandonment are not known; therefore, these wells represent potentialpathways for vertical migration from the perched water table aquifer to deeperaquifers. Other potential pathways for vertical migration are the reportedly poorlygrouted monitor wells (DG-1 through DG-5) and the excavation of the formerbiowdown sump.
As reported in one of the ELI reports, utility trenches for water lines andsewer_.lines adjacent to the Site are also potential migration pathways; however,the data from ELI's investigation of this pathway indicate that lower concentra-tions of Site-related constituents were derected in utility trench backfill and waterand in samples of sewage rather than in onsite soil and graundwater.
Potential receptors in the vicinity of the Site Include the human, plant, andanimal population's. For humans the potential exposure pathways include ingestion
p
Q
UJg
OoaoQ*Q H"
Cl CD ujT < w
cc i- a-D cc QU O O
u. _O Zw 51-h- >oo-ILJJ
<
Xocc ^fl. r—o_ en
EQJLJ_
tU.orDO"to
or contact with groundwater, contact with surface water and sediments, andcontact .with soils. For plant and animal communities, the potential exposurepathways involve contact with surface water, sediments, or soils. These potentialpathways and receptors will be fully explored during the RI/FS.
2.4.5 Preliminary Assessment of!Public Health and Environmental Impacts
The information available to date indicates that there have been no publichealth impacts attributable to the Site, and this is the expressed opinion of theHenrico County Public Health Department (Henrico County Health Dept., 1988).
The Agency for Toxic Substances and Disease Registry (ATSDR) performed apreliminary health assessment in May 19SS. The document prepared by ATSDRstates that it is based upon a document dated December 21, 19S7 which has notbeen made available. However, the ATSDR preliminary assessment fails toconsider much that is known about the Site. It ignores the results of the wellsampling program conducted by Henrico County (Section 2.3) and the opinion of theCounty Health Department that the water in the area is safe for drinking. ATSDRalso ignored the fact that in 19S7 public water lines .were extended to neighbor-hoods with residences.'downgradien.t _of the Site. Nor did ATSDR note that theplant is served by the public drinking water supply; that the Site is completelyenclosed by a chain link fence topped with barbed wire; and that access to the Siteis strictly controlled. Accordingly, the ATSDR preliminary assessment cannot beconsidered accurate or reliable.
Visual observations of the area around the plant indicate that there may beenvironmental impacts associated with the Site. During site visits, Dames & Moorenoted stressed vegetation (dead or dying trees, bare ground) in the majordrainageway north of.the Site and in the two receiving areas near the southeastcorner of the Site... It also was noted that marsh grasses, and rushes (Juneus spp.)were present in areas of former pine forest; so It is not clear at this time to whatextent the observed vegetative stress may result from a change in hydroperiodinduced by human redirection of drainage or to what extent it may result fromeffects of chemical constituents associated with products used at the Site.
2.4.6 Preliminary Assessment of Remedial Technologies ;
While the information available at this time does-not permit a complete andproper... _asses~s"ment of remedial technologies, it is possible to make some
2-38
preliminary assessments of potential remedial technologies for the Site. These....technologies are intended to. address remediation, if required, of groundwater,surface water, soil, and sediment. For completeness, the technologies will includetreatment for both organic and inorganic wastes.
Potentially applicable technologies for soil include the following:
• Removal and of fsite disposal• Onsite containment or encapsulation• Thermal treatment for organic wastes :• Soil washing or flushing, either in situ or following excavation• Bioremediation for organic wastes, :
Potentially applicable technologies for water include; the following:
• Containment by caps or barriers
• Extraction for treatment
• Treatmen.t_of inorganics _ by precipitation and flocculation or by ionexchange . ,, ..:_•_-..•:—.•__ - =... ..,.._- ;
• Treatment of organics by precipitation and flocculation, carbonadsorption, activated sludge, air/stream stripping, and/or enhancedoxidation.
Potentially applicable technologies for NAPLs include extraction inconjunction with extraction of groundwater from the perched water table aquiferor treatment in conjunction with treatment of shallow soils.
Other potentially applicable technologies may be identified during thefeasibility study.
2.4.7 Preliminary Identification of Additional Data Needed for Risk Assessment
The available data are not sufficient for an assessment of risks in terms of anevaluation of potentially toxic constituents of products reportedly used onsite or anevaluation of potentially exposed populations. The data that will be needed for therisk assessment include chemical data (concentrations in the various media andphysicochemical data), pathways data (identification of pathways and datapertinent to estimations of transport), toxlcity data, and receptor data. However,the available information does provide a useful point of departure in identifyingpotentially affected areas for investigation.
2-39
Chemical concentration data will focus, on components of the products,reportedly used at the Site (Figure 2-3). These fall into several classes, namelyvolatile organics, semivolatile (acid and base/neutral) organics, dioxins and f urans,and the metals arsenic, copper, chromium, and zinc. The volatile organics arecomponents of the mineral spirits and No. 2 fuel oil that were used as carriers forthe PCP and of creosote. The semivolatile organics include certain phenolics andcresols present in creosote and also include PAHs present in both creosote andNo. 2 fuel oil. PCP itself is also considered a semivolatile organic compounds.Dioxins and f urans are reported to be incidental .by-products of the synthesis ofPCP and some other chlorinated organic compounds. It should be noted that PCPwas used in wood treating processes at the Site but was not synthesized at the Site.The metals copper, chromium, arsenic, and zinc are components of CCA (firstthree) and/or CZA (last three). .
ETI reported that the sediment samples, from North Run Creek containedarsenic (4.0 to 140.7 mg/kg), chromium (<9.3 to 18.1 mg/kg), and copper (<9.3 to21.7 mg/kg). Surface soil sample concentrations of metals varied as follows:arsenic (1.7 to 242.7 mg"/kg) chromium (<9.6 to 67.7 mg/kg), and copper (<9.6 toS9.7 mg/kg), and subsurface soil samples were found to contain arsenic (4.6 to 23.9mg/kg), chromium (<9.3 to 9.8 mg/kg), and copper (<9.2 to 9.5 mg/kg). Surfacewater samples from North Run Creek metals were reported to be arsenic (<Q.QQ5to 0.041 mg/1), chromium (<-0.05 to mg/1), and copper (<0,.05 to 0.05 mg/1). Metalsdetected in groundwater were reported to be-arsenic (<0.005 to 0.040 mg/1),chromium (<0.05 to 0.05 mg/1), and copper (<0.05 to 0.12 mg/1). ETI provided noformal data validation but did report that the field blank and the trip blankcontained none of the target analytes. .
2.5 WORK PLAN RATIONALE
2.5.1 Data Gaps . " "'~; \ '."'. "".~~~'_~"_ . --""-_;""-_ --——-
The information developed in previous investigations of the Site and nearbyareas provides a good general description of the geology of the Site and provides agood initial evaluation of the hydrology of the perched water table aquifer and thesaprolite. The chemical data are incomplete but provide a basis for expansion andrefinement of the distribution of waste constituents. Data gaps that must beaddressed to ensure an adequate understanding of the Site include the following:
2-40
A. The actual location of the interface between the weathered and>unweathered granite. This will be evaluated by the following steps:
• Split spoon samples will be collected to verify the interfacebetween the weathered and unweathered granite.
• If this investigation indicates that the Bennett & Williams refusaldepths do not accurately identify the interface, Dames & Moorewill redrill selected Bennett & Williams wells. Determinations onwhich BWI wells will be redrilled will be dependent on:
The difference in deviation between BWI and D&M depth tothis interface" . ~. -"
The spatial relationship between well locations andinterface position
The relative importance of certain wells from the viewpointof contamination potential
EPA approval.
B. The vertical hydraulic relationships among the three aquifers.
C. The ho'riz'orital direction of groundwater flow in the granite aquiferbeneath the Site, •- .-— . ._.- -:--. . r
D. The relationship of groundwater to surface v/ater and the presence ofareas of groundwater discharge to land surface.
E. The horizontal and vertical distribution of waste-related chemicals insoils, surface water, sediments, and groundwater in all three aquifersreported at the Site.
F. Plant and animal species that may function as potential receptors.
G. The potential need for off site air monitoring for compliance with theNational Ambient Air Quality Standards (NAAQS), National EmissionStandards for Hazardous Air Pollutants (NESHAP), and Virginia Air.Toxics regulations if,onsite air monitoring for parameters that couldpotentially be emitted at the source exceeds limits of these standardsconsistently over an 8-hour day.
2-41
2.5.2 :Data Quality Objectives ( _. _. .____._ ,.
Data quality objectives; lor .this effort are defined -primarily by therequirement to employ Contract Laboratory Protocols (CLP), where appropriate,and to employ other. EPA-approved methods of analysis for parameters not coveredby the CLP. The data quality objectives of accuracy, precision, completeness,comparability, and representativeness, are discussed in Section 4.0.
2.5.3 Preliminary Identification of Applicable, Relevant, and AppropriateRequirements (ARARs)
ARARs for the Site will be identified by a formal regulatory analysis duringthe feasibility study. This analysis will consider chemicals identified in environ-mental media, the environmental context of the Site, and potential remedialactions. Sources of requirements that may be applicable, relevant, or appropriateinclude the following statutes and regulations issued under those statutes:
* Resource"Conservation and Recovery Act
0 , Clean Water Act
o Safe Drinking Water Act
* Rivers and Harbors Act
* Clean Air "Act -. -
* Federal Insecticide, Rodenticide, and Fungicide Act
* Comprehensive Environmental Response, Compensation, and LiabilityAct
* Superfund Amendments and Reauthorization Act
• Virginia Air.Toxics Regulations
• Virginia "Water Control Law . -- .
• Virginia Waste Management Act . _ ... ..
• Executive Order 11988"- Flood Plains Management
• Executive Order 11990 - Protection of Wetlands
Additional requirements may be: identified during the course of this investigation,while others listed above may: eventually prove to have limited applicability,
2-42
relevancy," or app'roprtateness"to1"response actions that may be developed for the'Site. The review of ARARs during the FS will be comprehensive to ensure that allpotential ARARs are considered. — -
2.6 OB3ECTIVES OF THE REMEDIAL INVESTIGATION
The principal objectives of: the remedial investigation (RI) are to evaluate thenature and extent of potentially toxic chemicals in environmental media in thevicinity of the Site that may have resulted from Site operations and to assess thesignificance of those chemicals in terms of human and environmental health.Consideration" of the initial evaluation of the Site in Section 2.5 and the data gapsidentified Infection T.&.I indicate that the appropriate scope of work for the RIwill include an. investigation of groundwater in all three aquifers in the vicinity ofthe Site, an investigation of nearby_surface water and sediments, an investigationof - soils on and near the Site, an assessment of potential impacts on the localaquatic comimunity, a "survey of the'iocal animal species potentially affected, and aformal evaluation of potential public health and environmental impacts.
2.6.1 Groundwater Investigation . . ' . ' . .
• Determine whether constituents of the products reportedly used at thesite are pre'sent in the groundwater in the three aquifers beneath thesite. In support of this objective, Dames & .Moore will install monitorwells at strategic points both on and off the site and will sample newand appropriately constructed existing wells.
• Evaluate .the local hydrogeology both onsite and offsite. This willinvolve determining the direction of flow in each aquifer unit and thevertical head relationships among all three aquifers. Bennett &Williams conducted pump tests in a previous study to measure thepermeability (K-vaiues) of the perched and saprolite aquifers. TheK-values reported were calculated frorrrfield-derived data determinedby measuring the recovery rates, after, sustained pump tests had beenconducted at each well. The equations and methodologies followed areoutlined in:
Worsluff, April 1951. "Time Lag and Soil Permeability inGroundwater Observations," Bulletin 36, Waste WaterExperimental Station, Corps of Engineers.
2-43
Cooper, H. H., Jr., J. D. Bredehoeft, and I. S. Popadoupolos, 1967."Response "of a Finite-Diameter Well to an Instantaneous Chargeof Water", Water Resources Res., No. 3, pp. 263-269.
Laboratory tests were done on undisturbed soil samples collected with ashelby tube. Either constant or falling head tests were conducted onthese samples (Personal communication, Donald Claybaugh, BWI).These are professionally accepted methods and will not be repeatedduring investigation.
* Seal potential avenues of vertical migration that may have beencreated by improperly constructed monitor wells onsite and by fourabandoned production wells of unknown location and status. This willinvolve sealing and abandoning the five DGS monitoring wells installedat the four corners and at the center of the Site and will also involve anattempt to locate the four reportedly abandoned production wells. Iflocated, the status.of these wells will be evaluated and plans will bedevised for sealing them if they were not properly sealed at the time ofabandonment.
• Inspect existing production wells onsite to determine their suitabilityfor packer testing and to assess the. condition of the casings of the twoexisting production wells. The packer testing will provide a means ofmeasuring hydraulic conductivity and evaluating water quality withdepth in the granite aquifer and will thus address concerns of potentialvertical migration that may have been created by the four reportedlyabandoned production wells.
2.6.2 Surface Water and Sediment Investigations
• Investigate whether constituents of the products reportedly used at theSite are"present in 'the surface water and bottom sediments in NorthRun Creek, the seasonally wet area, and the permanently ponded area.In support of this objective, Dames <5c Moore will collect and analyzesamples of surface water and sediment from North Run Creek, theseasonally wet area, "and the permanently ponded area.
2-44
2.6.3- Soil and Weathered Granite Investigation " . _ ! . _ . . . >
o Investigate whether constituents of the products reportedly used at thesite are present in the soil on and near the site. This investigation willinclude an investigation of potential vertical^ migration through thehardpan in the east-west axis" of the Site by collecting and screeningsamples of the weathered granite (saprolite) along that axis. This axisincludes all principal potential source areas (the treatment area, theformer biowdown sump, the drain from the former biowdown sump tothe former covered~: holding lagoon, and the former covered holdinglagoon).
2.6.4 Biological Assessment _ _.. ._ ._,_ ,;„",.,. .„ ...... . . ....
Objectives of the biological assessment are "to identify faunal populations inthe area and delineate any wetlands.
2.6.5 -UtilityTrench and Sewer Line Assessment
o This potential pathway will be addressed by sampling trench backfilland sewage to complete the evaluation of all pathways.
2.6.6 Evaluate Potential Public Health and Environmental Risks "
The Rl will evaluate the potential impacts, if any, of the Site on public healthand the environment by conducting a Level 3 Endangerment Assessment. Thepotential exposure of people and sensitive environmental systems will beestimated. 'In assessing potential public health impacts, potential exposurepathways and points of possible human or environmental exposure, will beidentified, and populations, if any, that may be at risk will be characterized.Environmental concentrations of'significant constituents will be calculated at allexposure points and compared to "applicable- standards and criteria. Resultsobtained under_.o_ther tasks will be used for these analyses.
2.7 SCOPE OF THE REMEDIAL INVESTIGATION
The scope of the RI has been defined by consideration of the availableinformation, as discussed in the previous sections of the work plan. It is intendedto better evaluate the nature and extent of site-related constituents in environ-mental media, to-better evaluate natural resources in the vicinity of the Site, andto assess potential risks. If additional data needs are Identified during the courseof the.investigation, those needs will ..be..evaluated" and addressed in supplements to•'this woTk plan.
""*"' -* -' -J *~. -i*
2-« -AR300057
2.7.1 Task i: Locate and Evaluate Abandoned Production Wells *
Four abandoned production wells have been reported onsite, two with steelcasings and. two with cement casings (Figure 2-19). They may have been backfilledwith soil. Once the general location of the wells has been estimated, the ground ateach location will be probed with a soil probe in an attempt to locate the casings(SOP B.iII-17). A metal detector may ^ aid in identification of the wells with metalcasings. If the wells are located and the wells appear to have been backfilled withsoil, a specific procedure for properly sealing the wells will be developed for EPAreview and approval. After EPA approval of the procedure, the wells will besealed,. - - - -- ------ . _ . . . . — .
2.7.2 Task 2: Seal and Abandon Monitoring Wells 1 Through 5
DCS installed five monitor wells onsite. Four of these wells are located atthe .points indicated as Dames «5c Moore replacement wells DM-i (R) throughDM-4 (R), as shown in Figure 2-20. The.fifth onsite DGS monitoring well is,locatedon the southwestern corner of the property. As discussed previously, these wellsmay have created potential pathways for. vertical migration from the perchedwater table aquifer torfrTe .saprolite aquifer" since they do not have conductorcasings through the perched water table aquifer and they may not have beenadequately grouted. Therefore, these wells will be sealed and abandoned followingSOP BMII-1S. The casing and screen, will be removed, if possible, and the hole willbe pressure, grouted "with" a tremie pipe. The decision to attempt removal of thecasing and screen will be. based on the length of grout in the annular space. Theoverriding c'orfcerrrwill be not to; damage.a'potentially adequate seal and introduce.contaminants to the saprolite aquifer by attempting arid failing to remove thecasing and screen. If it. is not possible to remove the casing and screen, the casingand screen will be filled with grout.
2.7.3 Task 3: Install AdditionaTMonitoring Wells
The RI will involve installation of new monitor wells to supplement existingones in all three aquifers beneath the site. An important element of the wellinstallation will be the collection of additional information on subsurface geologyin the vicinity of the Site. This information will include visual description of soilof the perched- water..table aquifer and hardpan, saprolite, and granite and will be
_._ . . —,—— — -— --—--- - =- -=.-. - j*\. -j-\ jnt f\ I"* i2-46 aR'300058r"* • "
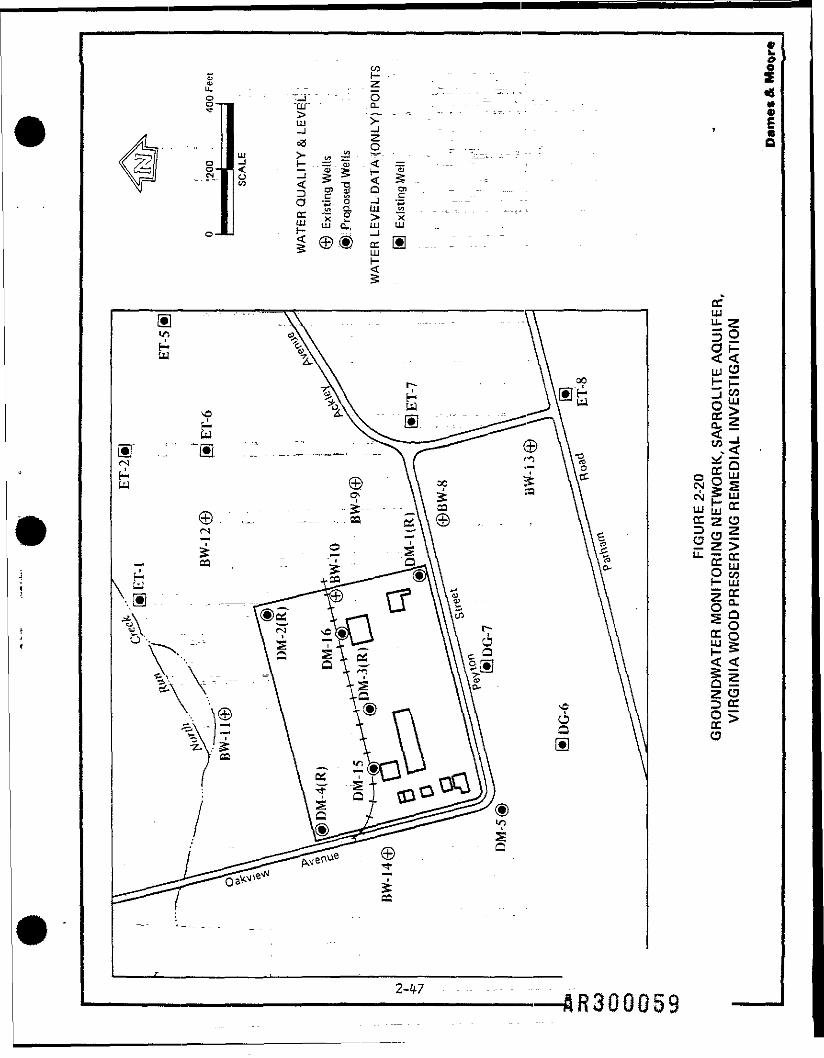
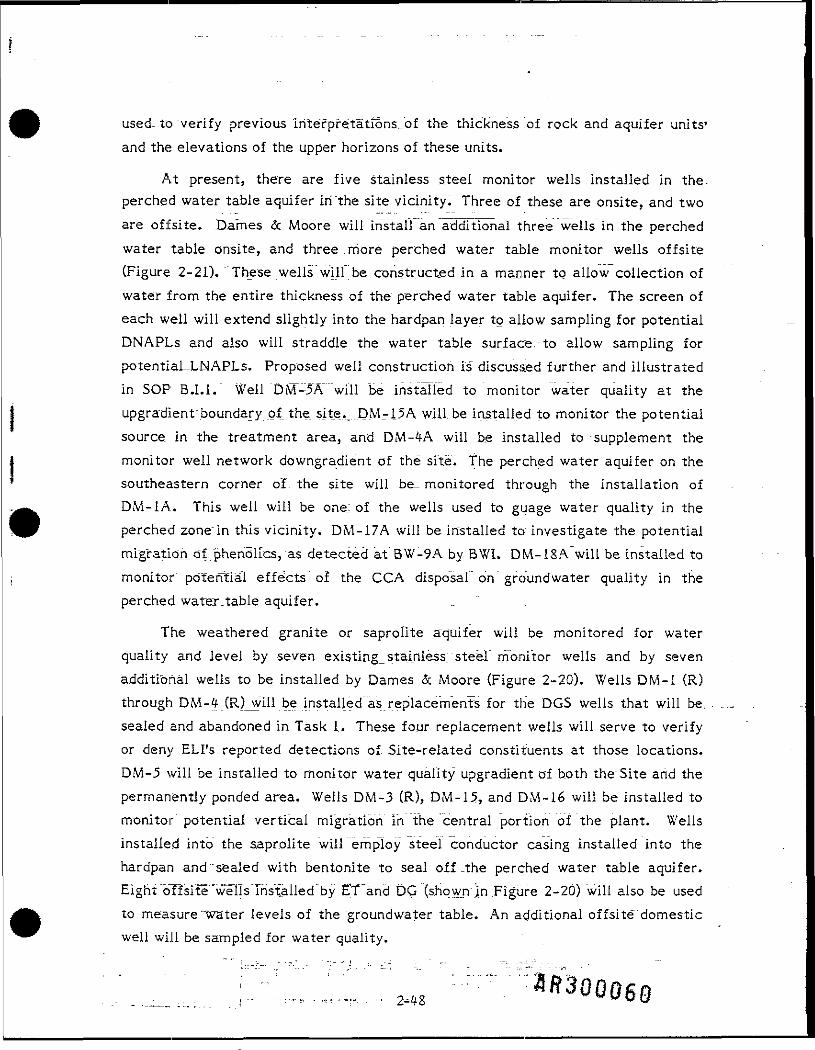
used-to "verify previous interpretations._bf the thickness .of rock and aquifer units'and the elevations of the upper horizons of these units.
At present, there are five stainless steel monitor wells installed in the.perched water table aquifer iri the site vicinity. Three of these are onsite, and twoare offsite. JDames <5c Moore will install an additional three wells in the perchedwater table onsite, and three more perched water table monitor wells offsite(Figure ~2-2T). These wells will be. .constructed in a manner to allow collection ofwater from the entire thickness of the perched water table aquifer. The screen ofeach well will extend slightly into the hardpan layer to allow sampling for potentialDNAPLs and also will straddle the water table surface.-to allow sampling forpotentiaLLNAPLs. Proposed well construction is~ discussed further and illustratedin SOP B.I.I." Well DM~-5A~ "will be installed to monitor water quality at theupgradienfboundary of. the sit_e._DM-15A will.be installed to monitor the potentialsource in the treatment area, and DM-4A will be installed to supplement themonitor well network do~wngradient of the site. The perched water aquifer on thesoutheastern corner of. the site will be_ monitored through the installation ofDM-1A. This well will be one; of the wells .used to guage water quality in theperched zone'in this vicinity. DM-17A will be installed to investigate the potentialmigration, o"I"pPienolics, as detected at BW-9A by BWI. DM-"l8A will be installed tomonitor potential effects' of the CCA disposal on groundwater quality in theperched water.table aquifer.
The weathered granite or saprolite aquifer will be monitored for waterquality and level. _by seven existing stainless; steel monitor wells and by sevenadditional wells to be installed by Dames & Moore (Figure 2-20). Wells DM-1 (R)through DM-4 (R)_will be installed"as replacements for the DGS wells that will be.sealed and abandoned in Task 1. These four replacement wells will serve to verifyor deny ELI's reported detections of Site-related constituents at those locations.DM-5 will be installed to monitor water quality upgradient of both the'Site and thepermanently ponded area. -Wells DM-3 (R), DM-15, and DM-16 will be installed tomonitor potential vertical migration in the "central portion of the plant. Wellsinstalled into the saprolite will employ steel conductor casing installed into thehardpan and "sealed with bentonite to seal of f .the perched water table aquifer.Eight offsite 'wells installed by E'T and DG (shown in .Figure 2-20) will also be usedto measure ""water levels of the groundwater table. An additional offsite domesticwell will be. sampled for water quality.
-2-48
£oo
CCLUU.5o3!CO H< <*- s
QUJ<x
y QCC LULU 5:Q-
cc o
LU
•z.3OCC
The well installation program will also involve installation of two new wells;into bedrock (wells DM-1 (3) and DM-11 (B), shown on Figure 2-22). These willprovide two additional bedrock water level measuring stations that may be usedwith water level data from existing (through out-of-service) bedrock productionwells, PW-1 and PW-2, to determine the horizontal direction of flow in bedrock.They will also be used to. monitor groundwater quality in the upper zone (upper 15feet) of the bedrock. Well DM-11 (B) will be placed in the major surface drainagepathway north of the Site to monitor potential vertical migration in that pathway.This location is one in which BWI indicated a thinning or possible absence of thehardpan and a depth to bedrock of approximately 11 feet. DM-1 (B) is located atthe potential downgradient corner of the Site. If significant contamination is foundin the. lower part of-the saprolite aquifer, appropriate measures will be taken tocharacterize, this contamination, which may include installing an additional bedrockwell on the east side of the lagoon or other .appropriate place.
2.7.4 Task 4: .Borehole Television, and .Geophysical Logging of the Two ExistingProduction.Wells . _ . . . _ _ • . „ . , , -
As mentioned-in Task 3, there are_two existing production wells on thesouthwest corner of the Site near facility buildings. The condition of these wellcasings .will be investigated by means of a downhole television camera. A casingdepth of approximately 50 feet Is anticipated; therefore, the maximum depth fortelevision logging will be 1.20 feet. This inspection will precede mobilization of thepacker testing equipment to the Site "to check for leaks or obstructions In thecasing. / "~"~~ " • ^~ •" • - """ • • • -• -- - - - - -
Several different logging methods will be employed to provide a maximumamount of useful information concerning the.status of these two wells. Below is abrief description of the logs most likely to be. used. Geophysical logs will beobtained prior to mobilizing for packer testing so that the packer testing intervalsmay be. modified, if necessary. "
Call per_ Log - Measures depth and diameter of the borehole. It will aid inidentification of borehole irregularities and major fractures. Caliper logs must be .obtained prior to the packer tests to determine variations In borehole diameterwith depth and to adjust packer testing intervals to avoid areas that might providean unsuitable seal due to borehole enlargement.
2-50
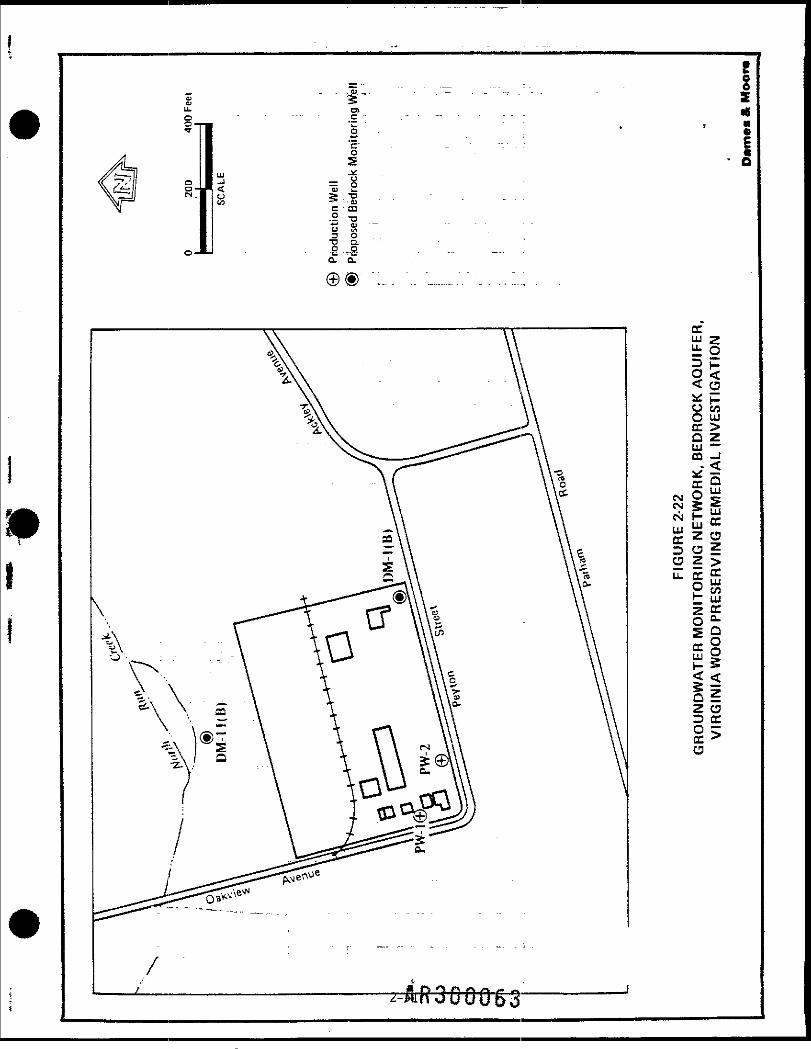
oo
«M«
O
o wO LLJCC >0 Zuj —m -t
CM W
CM I-
2 SE0 i
112 OO Xo 5cc >
Natural Gamma Log - Measures gamma; radiation that is naturally emitted from,radioactive isojtopes and decay products of = potassium, uranium, and thorium, toname a few. These isotopes are"common in fine-grained clays, shale, and siltstone.This log is helpful in identifying aquitards. _ .__ "
Spontaneous Potential Log - Measures small electrical voltages generated naturallyat the contacts between differing rock types, the water in the bedrock, and thewater in the borehole. With electrical resistivity logs, they are referred to as"electric-logging" or "E-logging".
Temperature!Log - Measures fluid temperature and identified active groundwaterflow.
Sonic Televiewer Log - Detects and measured not only fractures but also fracturedip angle and direction. "Sonic televiewer logs "are different from other logs in thattheir output Is a picture created by a small transducer that emits a beam of high-frequency sound. Echoes, returning to .the transducer are. displayed as light anddark areas corresponding with distance. By identifying fractures, this log identifieszones:of higher hydraulic conductivity.
2.7.5 Task 5: Packer Testing of the Two Existing Production Wells
The.primary use for packer tests at the Site .will be to" collect water samples.at varying depths within the boreholes of the two existing" production wells (PW-1and PW-2). Secondarily, the vertical distribution of hydraulic conductivity in thegranite will be measured. The first water sample will be collected for the interval50 to" 100.feet_below the surface. Then intervals of the borehole will be tested byisolating "50-foot sections with the aid of balloon-like devices ("packers") inflatedinside the borehole to make a tight seal with the surrounding rock. Water will bepumped and sampled from each test section while observing drawdown with respectt o time. - - _ - - - - . - - _ - . . , : - - - = • _ - . - . , - . - : — . . . . - - - - . - . . - - -
2.7.6 Task 6: "Sampling and Analysis of Groundwater, Immiscibles, Soil, SurfaceWater, Bottom Sediment, and Sanitary Sewage - "
Samples of groundwater, immiscibles, soil, surface water, bottom sediment,and sanitary sewage-, will be collected for chemical'analysis. An overview of thesampling program-is ""presented in Tables -2-2 and 2-3. For each sampling medium,the number of sites where -samples will be collected is summarized in Table 2-2. In
2-52 flR30
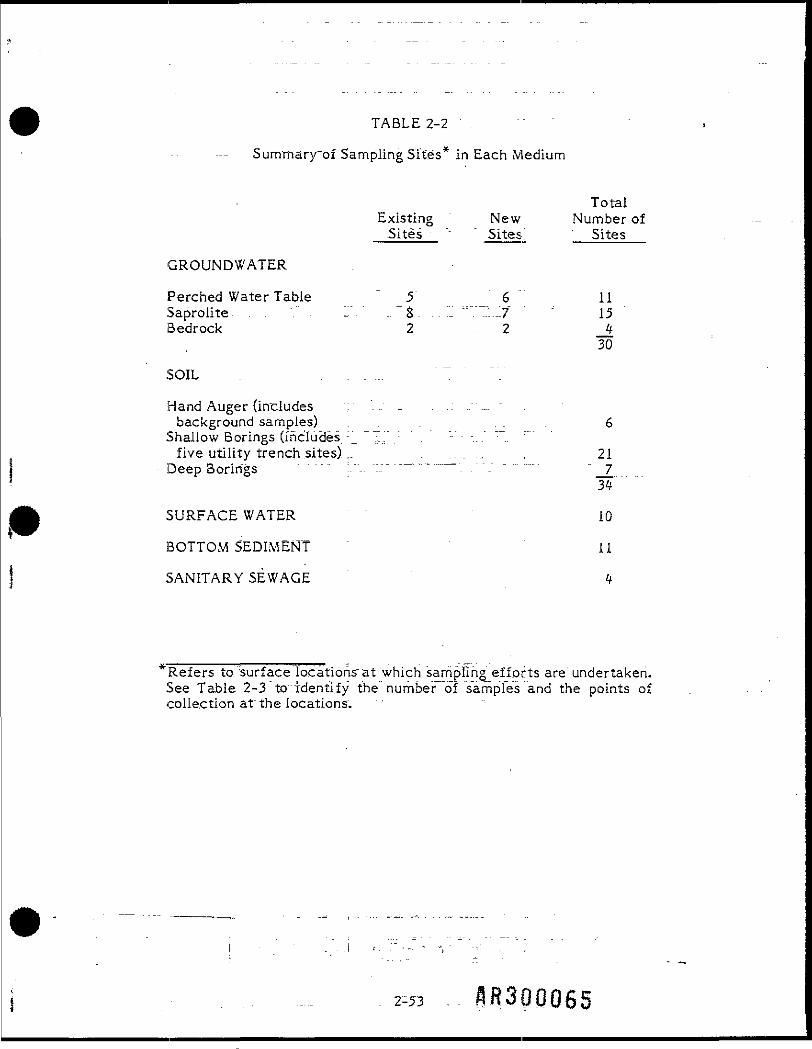
TABLE 2-2
Summaryof Sampling Site's*" in Each Medium
TotalExisting New Number ofSites : "'~~ " Sites Sites
GROUNDWATER
Perched Water Table " 5 _ 6 11Saprolite . L-". " ..8. .. "J ''''" .':..L7 '' 15Bedrock - 2 - 2 _ _ 4
30
SOIL . . . . . . " ".
Hand Auger (includes ; .., ^ . .: .-•.... "background samples) . . . . . . 6
Shallow Borings (includes.:_ "T.// . " -..." "- :"five utility trench sites) ,. . . . . . . . , 21
Deep Borings " ''.."-. "i:""~~'-'-"-— -=~. . "_" - - - - - - 734
SURFACE WATER 10
BOTTOM SEDIMENT " II
SANITARY SEWAGE ' 4
Refers to surface locations" at which sampling efforts are undertaken.See Table 2-3 to":identify the number of samples and the points ofcollection at the locations.
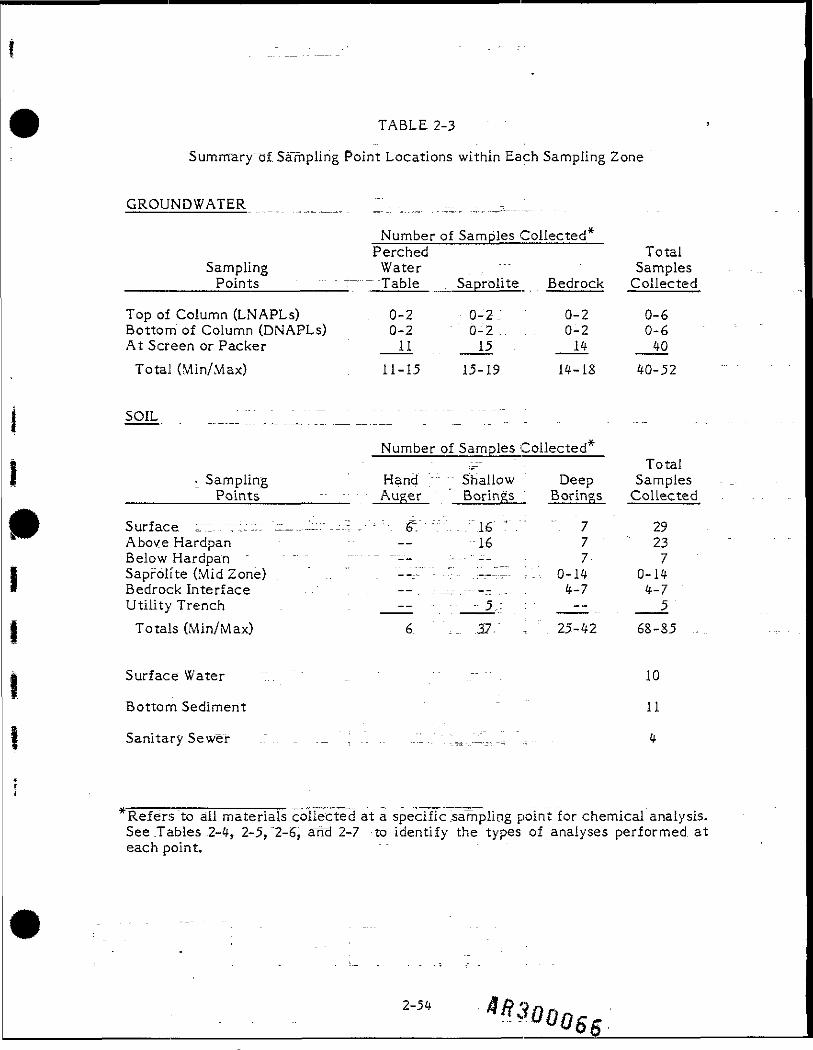
TABLE 2-3
Summary"of. Sampling Point Locations within Each Sampling Zone
GROUNDWATER ._.„. 1".-. -..,.. ...--_ ._;.,..-.;.. ...
Number of Samples Collected*Perched Total
Sampling Water " " . , " " Samples________Points ~ Table .. Saprolite Bedrock Collected
Top of Column (LNAPLs) 0-2 0-2: 0-2 0-6Bottom of Column (DNAPLs) 0-2 0-2 . . 0-2 0-6At Screen or Packer _U _15 _U _40Total (Win/Max) 11-15 15-19 14-IS 40-52
SOIL _.._.„" .". "..".""._=_.__" "_"."."."_ "",""=.
Number of Samples Collected*Total
•_ Sampling Hand " Shallow Deep Samples________Points_____- •• Auger Borings Borings Collected
Surface T::/. T::-:-"-._--::-- . -"-. 6~. "'.... f .16"*'." ' . 7 29Above Hardpan - — -16 7 " 23Below Hardpan " " " " "~ ""-- 1---"--- 7 7Saprolite (Mid Zone) . ' . - . ' " - "—,"""- -7 - - .~~- ','.'-. 0-14 0-14Bedrock Interface - . —_..-.^ ..----.- . 4-7 4-7Utility Trench . : - _^ - -• 5- : • _^ .. __5Totals (Min/Max) 6 ,_ 37- ^ 25-42 68-S5 ..
Surface" Water :.. " _. ; .."" . " 10
Bottom Sediment 11
Sanitary Sewer .r .. _ ._ '..... ..'.i.. . ;MJ.:!.,, ..= ., - - 4
Refers "to all materials collected at a specific sampling point for chemical analysis.See Tables 2-4, 2-5, "2-6, an"d 2-7 to identify the types of analyses performed, ateach point.
2-54
the sampling mediums of groundwater and soil, multiple samples may be taken at a'given Il'map: location." proundwateF^rne'dTurn samples-may consist of both watersamples and non-aque~6us~phase liquid (NAPL) samples. Soil medium samples may "consist of soil samples collecte_d at various depths in the borehole. The distributionof these samples is summarized in Table 2-3 by sampling zone (i.e., aquifer orborehole depth) and location within the zone.
All sampling locations will be staked, .or otherwise physically indicated, atthe beginning" of the field investigation by Dames & Moore's project manager, inconsultation with the Dames & Moore field team leader, EPA's representative, andrepresentatives (if present) of the Commonwealth of Virginia.
2.7.6.1 Groundwater ..Sampling.' Grouhdwatgr.samples will be collected from thewater quality sampling wells that were shown in Figures 2-20, 2-21, and 2-22 plusone private."well (30 wells total)." With the exception of the one private well, allwells used as water quality sampling points will be checked for the presence oflight and dense NAPLs_using-SOP B.III.14. If NAPLs are found in any of the wells,their chemical composition will be characterized. This characterization will beperformed by collecting a maximum of two samples of each NAPL phase from eachof the. three aquifers being studied. That is, up to two LNAPL and two DNAPLsamples will be collected -from perched, saprolitic, and granite aquifer wells(maximum "of"12." total samples). If two samples of, a: given NAPL phase arecollected from an aquifer, they will be collected from different wells in order toevaluate, whether or not its chemical composition is likely to be independent ofwell location. These samples will be analyzed for TCL volatiles, •semivolatiles,pesticides, and PCBs, and dioxins and furans. The chemical analysis program issummarized in Table 2-4. Note however that LNAPLs are not expected to be foundin either the saprolite or granite aquifer wells due to casing characteristics.
All groundwater samples will be analyzed in the field for pH, temperature,Eh, dissolved oxygen (DO), and specific conductance. This number includes theformer production wells PW-1 and PW-2 from which samples will be collectedduring-packer testing (described in Task 5). All samples will be analyzed in thelaboratory for target compound list (TCL) volatiles and semivolatiles; arsenic,copper, chromium, and zinc, folio wing CLPj and the thiocyanate ion. Samples from
2-55 .
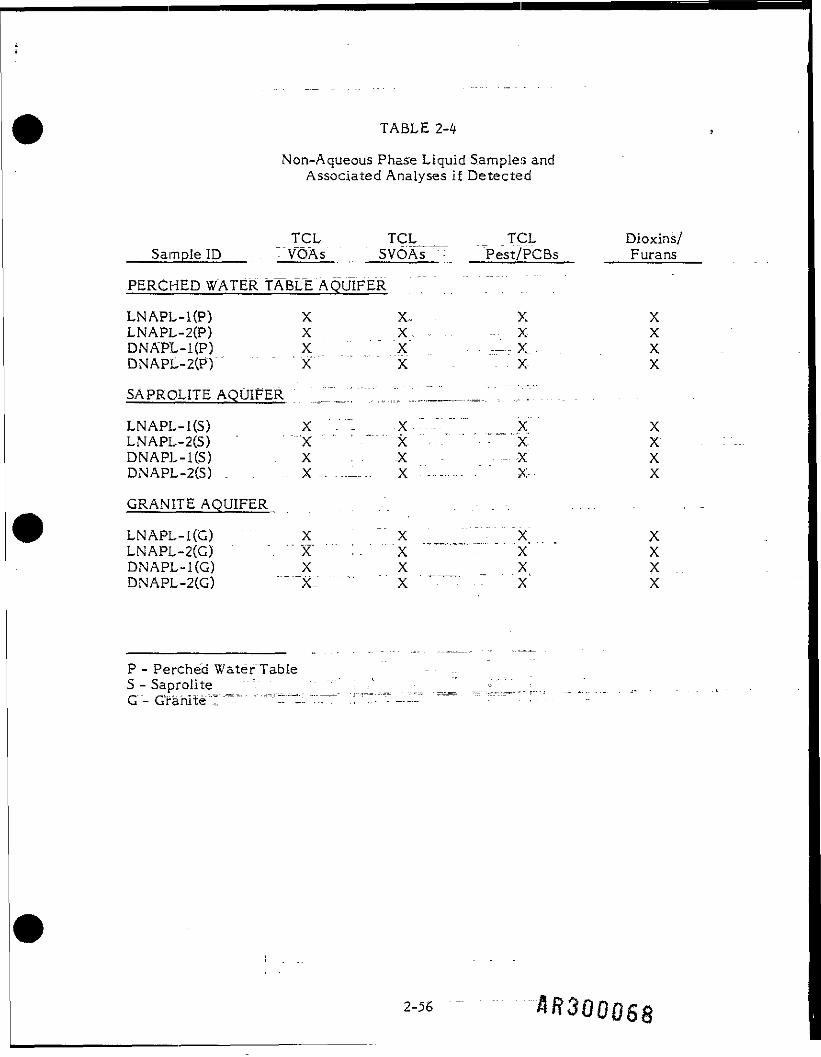
TABLE 2-4
Non-Aqueous Phase Liquid Samples andAssociated Analyses if Detected
TCL TCL___ _ TCL Dioxins/Sample ID . " VOAs SVOAs ""'- Pest/PCBs F urans
PERCHED WATER TABLE'AQUIFER 7 . . ~ .. ..
LNAPL-l(P) X X- X XLNAPL-2(P) X X - X- XDNAPL-l(P) X '" X — X XDNAPL-2(P)" " "X" X - X X
SAPROLITE AQUIFER ; _"_! ~~^,^~ 1™_.—~ -" ..." " . . . . . . .
LNAPL-KS) X - ~- X " " " ' X XLNAPL-2(S) ' X " ' " X " - - - " " *- " "X XDNAPL-KS) . X . . -X - - -X" XDNAPL-2(S) . X ...-—-- - X - ' " - - - - - - " - - - - - - X - - X
GRANITE AQUIFER . ,. . . . . .
LNAPL-I(G) X X - - - - - - - - - - ^LNAPL-2(G) ". :." X' " : — .--x--—"•—-;-'--x- - xDNAPL-l(G) X X X XDNAPL-2(G) " —-x_- -- - x • - - - • • ; ': x X
P - Perched Water'TableS - SaproliteG - Granite"" "=""" "'" ""'"1
2-56 300068
wells DM-I5A, DM-15, DM-16, BW-3A, DM-3 (R), BW-10A, and BW-10 will also 'be analyzed for dioxins and furans since these wells are in the central portion ofthe plant and would have received the most direct input of process wastes.However, dioxins and furans are;not expected to be detected in the groundwaterdue to their strong tendency to become adsorbed to soil particles. Water fromwells DM-5 and BW-2A also will be analyzed for dioxins and furans for comparison.
Water from wells BW-2A, DM-2 (R), BW-3A, DM-3 (R), DM-5, DM-15, andDM-16 and the uppermost sample for PW-1 will be analyzed for total organiccarbon, BOD, COD, total Kjeldahl nitrogen (TKN), total phosphorus, alkalinity,hardness, total suspended solids, and total dissolved solids for use in the feasibilitystudy treatab.iiity analysis. .Samples from these wells will also be analyzed for alltarget analyte list (TAL) metals and TCL pesticides/PCBs. "With the exception ofDM-5,"all of the wells listed either adjoin or are immediately downgradient of theareas holding the greatest potential to be contaminant sources. The principalpotential source-a"re"as" were graphically illustrated in Figure 2-17. Based on thelocation of. the potential source areas, the wells selected are correspondinglythought to hold the highest potential of being contaminated. If this assumption iscorrect and a groundwater treatment system is found, to-be necessary, groundwaterwould most likely be extracted, from these or nearby points. Therefore, thetreatability analysis data . collected .would be the most representative of theconditions anticipated." Also", if other TAL metals or TCL pesticides/PCBscontaminate, the site, they would most likely be found in these wells. Water fromthe upgradient well DM-5 will be collected arid .analyzed.as a background controlsample. . . : - . . _ - - .
The .groundwater sampling program" includes the collection a water sample .from the Merkel well (Well 6 on Figure 2-15), which will be collected and analyzedfor TCL volatiies and semivolatiies; arsenic, copper, chromium, and zinc; andthiocyanate. to .follow up on the NUS and Henrico County data. The analyticalgroundwater sampling program is summarized in Table 2-5,,
2.7.6.2' Soil Sampling. Soli samples will be' c'oilecfed for a.nalysis at the locationsindicated on Figure 2-23." The sampling locations are of four basic types: surfacesamples collected in minor drainage ways (SO-9 through SO-12)j samples collectedto evaluate the distribution of waste products in soils above the hardpan (SO-1through SO-S, SO-13 through SO-1S, DM-1 (R). through DM-4 (R), DM-5, DM-11 (B),
2-57
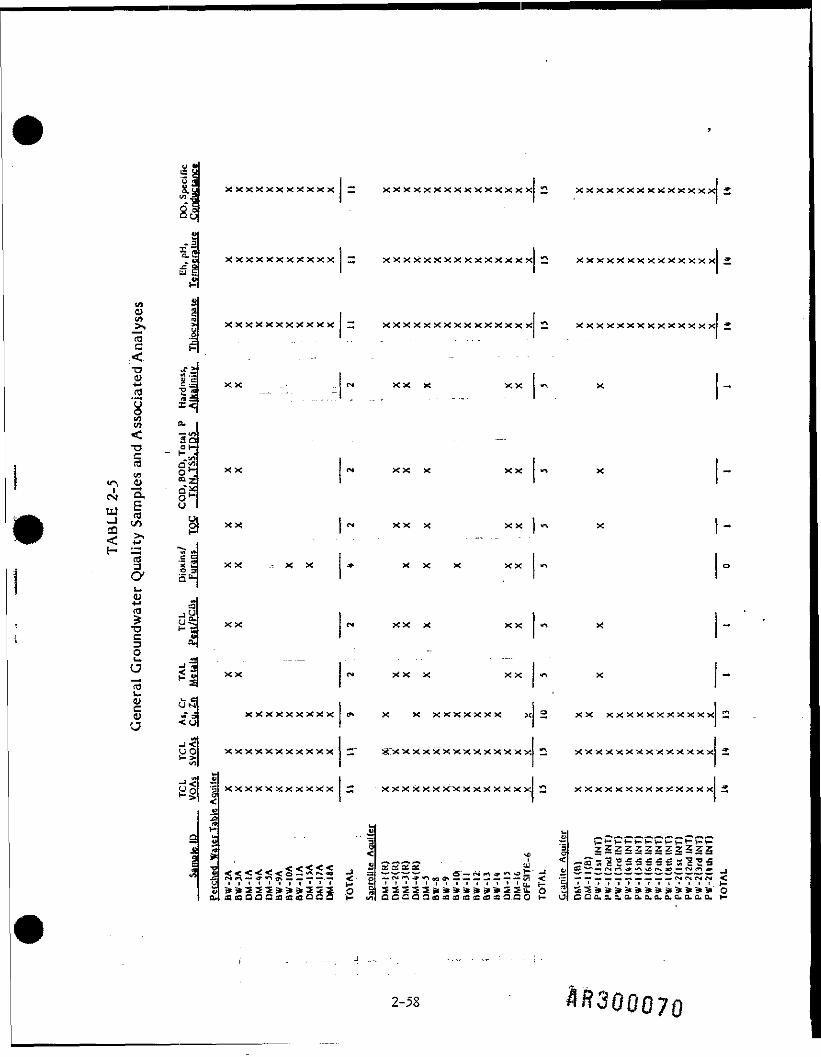
V •
I/I
fiSQU
13 <£*JH a.|fTJ "P «—« «=sy r<
^3a-W1
OS
xxxxxxxxxxx
XXXXXXXXXXX
XXXXXXXXXXX
X X
xxxxxxxxxxxxx xx
xxxxxxxx xxxxxxx
XXXXXXXXXXXXXXX
xxxxxxxxxxxxxxj *
xxxxx xx x xxxxx x
XXXXXXXXXXXXXX
XX^ 9 gsc^ 1 • 8"*UJ § °^ t/) o{ xx [^ xx x xx I "-x< •M'E- ^
CO .S g3 Sia §£5 wfl jyu->• t- «JC3o
XX , x X
XX
XXXXXXXXX
•*3UO XXXXXXXXXXX*-->•[Wl[
-"<! -2-si I
»3
X X X
XX X
X X X X X
X X XXXXXXX X
X X X X X X X"X XXXXXXX
XX XXXXXXXXXXX
XXXXXXXXXXXXXX
1 <*. H ml_ ^ _ _ _ S u - O 2co a: ffl as Q-Q 0 v- <J|
2-58 300070
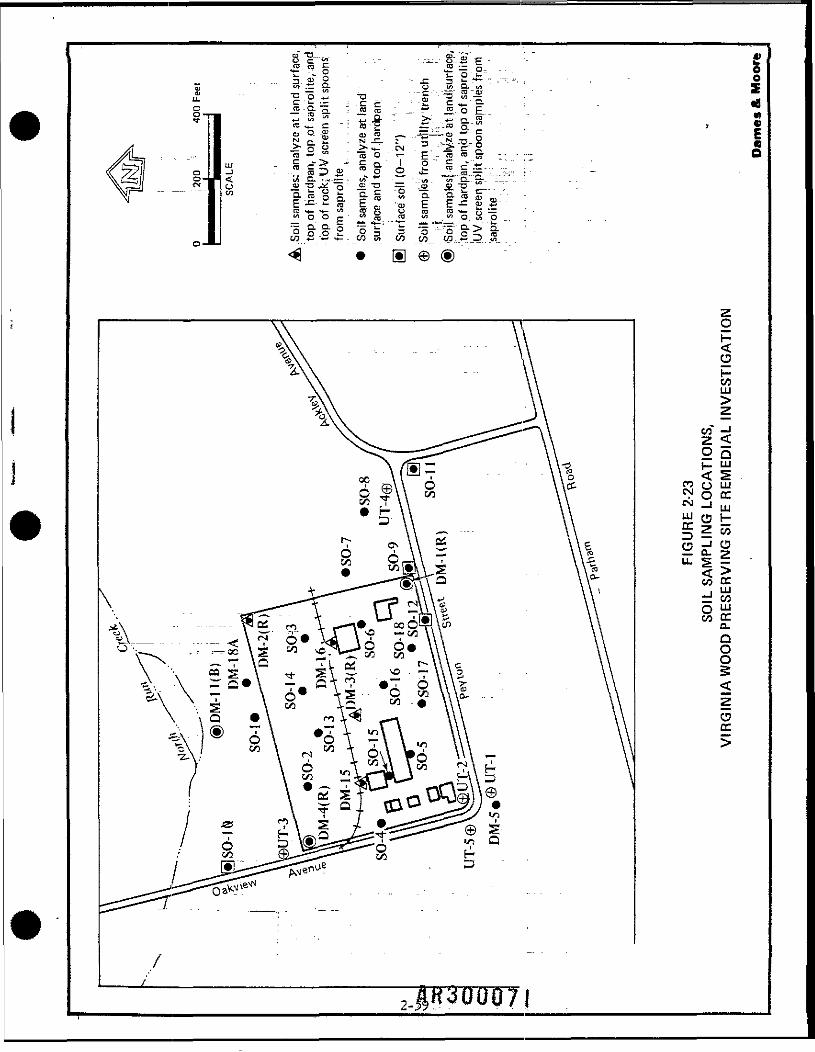
2<CD
00LJ
2 <2 5
^ O ccCM -I mtu ^ t_§ z wC5 z1 «— 0-2u. s I< >
CO CE
O £to cca.QOO
<
2-J ,R300071
DM-15, DM-16, and DM-1S A); backfill samples from utility trenches (UT-1 >through UT-,5); and samples collected to evaluate the potential vertical migrationof waste products through the hardpan and into the saprolite (DM-i (R) throughDM-* (R), DM-11 (B), DM-15, and DM-16). The rationale for these four soilsampling categories is explained, in this subsection, and the analyses to. beperformed on these samples also:are described. The total number of sampling siteswere summarized in Table 2-2, and the potential samples collected from points ineach site were summarized in Table 2-3. The soil sampling program is presented inTable 2-6. " " " ^
The. surface samples to be. collected from minor drainageways were selectedto evaluate.whether or not contaminants that may have been present in storm-water runoff were adsorbed by surface soils in the drainageways. The locationswhere these"."samples will be taken are not in production areas, and anycontaminants detected .would not likely be present in underlying soils. The lowexpectations for finding contamination at depth at these; locations "are due to thedistance from the Site (St)-, 10 and SO-11), height of the perched water table (SO-9),or presence of the water-intercepting utility trench (SO -12). Soil sample SO-11will be collected to evaluate whether or not the culvert under Ackley Avenue is aprobable pathwayfor more extensive offsite "contamination. These samples will beanalyzed for TCL volatiles and semi volatiles; arsenic, chromium, copper, and zinc;and dioxins ar!3 furans. Sample S'O-9 will also be analyzed for total organic carbon.
The other samples shown with the "SO" prefix and all samples shown with the"DM" prefix will be collected both at the ground surface and at the top of thehardpan layer. Because the hardpan is a low-permeability confining layer, the topof'the hardpan is the maximum depth to which soil-adsorbable contaminants wouldbe expected to migrate. All of these samples will be analyzed for TCL volatilesand se'mivolatiles, arid arsenic, chromium, copper, and zinc. Selected surface soilsamples (i.e., 5O-7, SO-T4 through SO-T6, and SO-13) will also be analyzed fortotal organic carbon. The surface ..soil samples from SO-1 and SO-7 will beanalyzed for the complete list .of TAL metals and TCL pesticides/PCBs. Inaddition, two background soil samples will be-collected from yet to be determinedlocations and analyzed for TCL -volatiles and sernivoiatiles; arsenic, copper,chromium, and zinc;~ahd di.oxins^and furans. The locations will be .selected afterconsultation between the. Dames & Moore Project Manager and the EPA ProjectCoordinator. "" " "."" r . . " • " • " . . . ;
2-6D fl'R300072
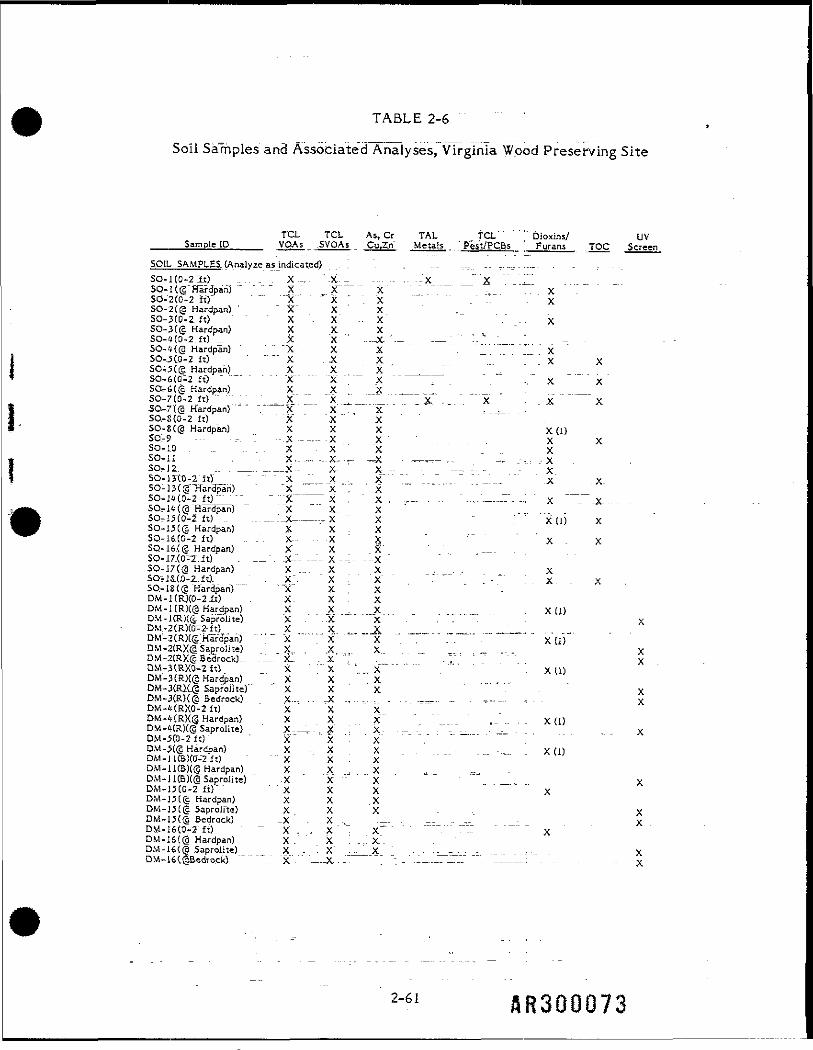
TABLE 2-6
Soil Samples and Associated Analyses, Virginia Wood Preserving Site
Sample ID
SOIL SAMPLES. {Analyze as indicated} . ; . . .._ .._. _. T. ........ .SO-lCO-2"it) .... _ _. X-- X-. .... - .. .-X _ __" X " "~SO-1 (g" Hardpan) " X X" X _" """ x50-2(0-2 ft)" " " "X ' X " X " " " .. '. xSO-2(@ Hardpan) ' "X"" X X50-3(0-2 f t ) X X X . . . . XSO-3((c Hardpan) X X X .50- 1(0-2.ft) ... X X ' --X - _ ——J " -_, '' ''__ L_SQ-U(Q Hardpan) ~X X X ^J" "^ " X50-.5CQ-2 ft) " "" X" : X X""" "" " " " '~ " XSO 5(@ Hardpan) X X _ X _____50-6(0-2 ft") " " " "X" "" "X XSCt 6 (l§ Hardpan) X X X __50-7(0-2 ft) '" _ *I" II "x ^ _—~_--^ _x~ "XSa-7_'((5 Hardpan) "" """" "X X ... X - - ^_SQ-S(0-2 fO X X " ' X . -SO-8(@ Hardpan) X X X x (1)50-9 --- -,. " -.X -_- X X . . . . X X50-10 . _ . . . . X - X X X50-11 . . X,. =, . X, ^ ^X -._,— .. _ -•- -XSO-J2. ,. . ——.. _._JC- X- X - - -- - Xso-mo-z-ft) - x „;.;__ x..., x"" ~~_ :_...._. ;."___"" .x" .x.so-j<f(o"-2 ft)"'•"_ " X"—:x ! " x. ,- . .. -.-..'.-.— -.:,' x ~~~_x.SOrl4{@ fiardpan) X X. X _50,15(0-2 ft) .. ...__:_x——-x x . . . x(j- xSO-i5((5 Hardpan) X X . XSQ-16(0-2 ft) .. .". X-- -- -X X " x XSQ-16.((2 Hardpan) X X XS0-17.(0-"2".ft) . _". .X-"- —- X - - 1 - X "S0-17(@ Hardpan) X .... X X _, __. . . x
SO-ISdg'Hardpan")"": '' "X" X X . . . . . . .DM-I(RXO-2Xt) . X- X . XDM-1 (R)(@ Hardpan) _ X _X X X [I)DM-l(R)(tc Saprolite) X X "" " "x -" - - - • • - - -DM.-2(R)(0"-"2-ft) X X. j; _ ____DM-2(R)((GHard'p"an) " X X X , ... X (i)DM-2(R)((a"Sapro]Jte) X X X XDM-2(R)«cBedrock)__ ._. xl . x'V . ."" ; . ... xD.M-3(R)(0-2ft) _ X X x"~" " ' "" X (1)DM-3{R)(@ Hardpan) X X " . XDM-3(R).C@ Saprolitc) X X X XDM-3(RK@ Bedrock) X... ... ..X .,....." . .. .__.. _ . — - , .. xDM-iKRXO-2ft) X X XDM-4(R)(@ Hardpan) X X X X ( 1 )DM-(f(R)(@ Saprolite} X.._. X '." X- ._ .' ."~\~.. ."_-_. xDM-5CO-2ft) ' X" X " 'X • - - ; • - — 'DM -X@ Hardpan) X - X X - - X (1)DM-ll(B)(0"-2 ft) X X i XDM-11(B)((3 Hardpan) X X , X , .. _DM-J1(B")"(| Saprolite) X X X _ vDM-15CO-2 It}" X X X XDM-JM(£ Hardpan} X X XDM-J5(@ Saprolite} X X "X - XDM-15((s Bedrock) _X X — . — - - _- xDM-16(0-2 ft) ~ Ji . , -X . X^ - - - - - -- ....... ^ .DM-16(ig Hardpan) X. X ' _.!x.DM-16(@ Saprolite) _ _ X - - X ... X - - --_-_-- -- L- -• xDM-16((aBedrcic(<). ." "__L.X- ——X -'.- .- , .__...„_-.., - ____.: . . . . X
2-61
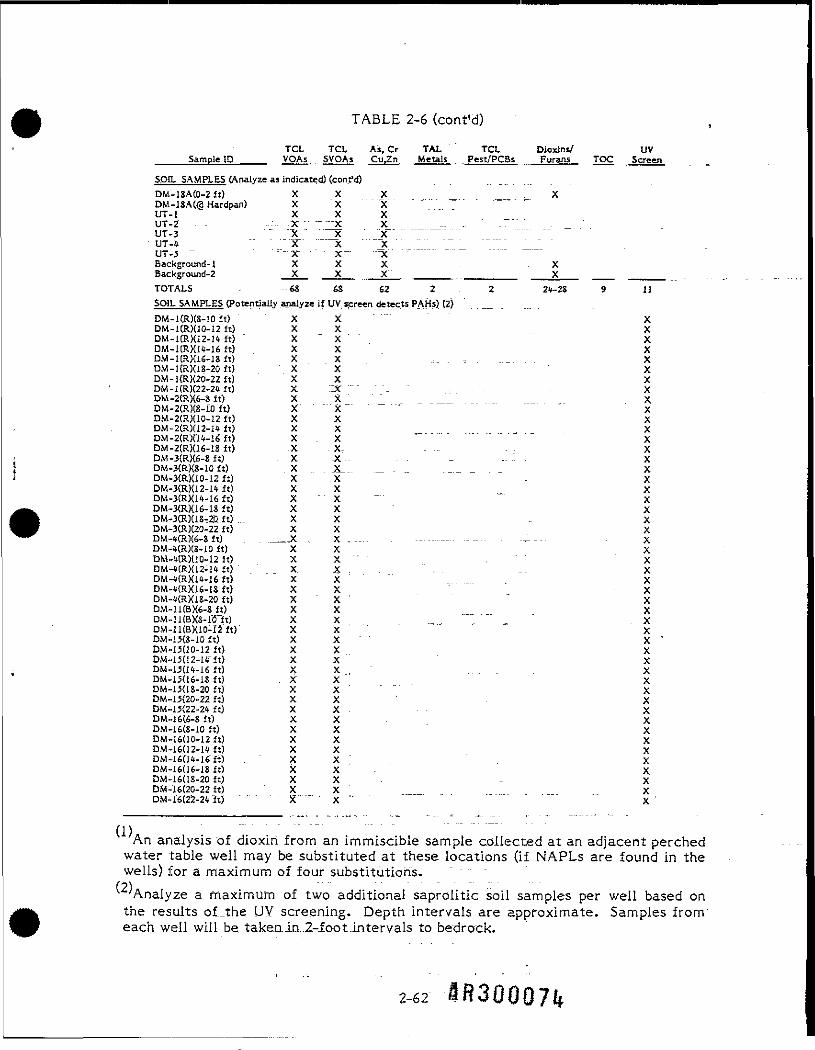
TABLE 2-6 (cont'd)
TCL Dioxins/ UV____ Sample ID ____ VQAs . SypAa Cu.Zn Metals . Pest/PCSs Fur3_n_s_ TQC ...Screen
SOIL SAMPLES (Analyze as indicated) (cont'd)DM-lSA(0-2 It) X X XDM-18A(@ Hardpan) X "X XUT-1 X X XUT-2 - X ~ X X_UT-3 X _X LXUT-4 "" ""X" "" X " "_XUT-5 X X- "XBackground- 1 X X XBackground-2 X X XTOTALS 6S 6S 62 2.2 24-28 9 11SOIL SAMPLES (Potentially .analyze if UV screen detects PAHs} (2)DM-1(R)(S-IO ft) X X "" " XDM-1(R)(10-12 ft) X X XDM-KRXI2-14 ft) X X XDM-l(R)(I<f-16 ft) X X XDM-l(RXlS-lSft) X X - - _ XDM-1{R){18-20 f t } ' X X ' XDM-HRX2Q-22 ft) X X XDM-i(RX22-24ft) x ::x ... . xDM-2(RX6-S ft) X X _ 1 __ _ XDM-2(R)(S-IO ft) X X XDM-2(RX10-12 ft) X X XDM-2(R)(12-14 ft) X X _ XDM-2(RX!4-l6ft) " " X . " X " " " " XDM-2(R)U6-1S ft) X X- - - - - XDM-3{RX6-Sft) .X X-. . - - -- - - XDM-3(RXS-10 ft) X X_ _ _ _ _ _ XDM-3(RXlO-12ft) X ,X - XDM-3(RX12-14ft) X X XDM-3(RX1*-16 ft) X X " XDM-3(RX16-1S ft) X X XDM-3(R)(1S-2Q ft) X X .. XDM-3(R)(20-22 ft) X X XDM-4(R)(6-S ft) . . .__,X .. X , - - . - - .-...___.. .__.. . .__.. - xDM~*(R)(8-10 ft) X X XDM-4(R)(10-12 f t ) X X " . XDM-4(R)(12-H ft) X X . _ XDM-4(RX14-16 ft) X X XDM-K(RXJ6-1S f t ) X X ' XDM-K(RXl8-20ft) X X ' XDM-1KBX6-S f t ) X X XDM-ll(BX3-10ft) X X XDM-ll{flXiO-I2 f t ) X X ' " XDM-ija-lQ f t ) X X XDM-IJ5(10-12ft) X X XDM-15(!2-lift) X X XDM-1.JU4-J.6 ft) X X . , XDM-1506-1S f t ) X X XDM-1XIS-20 f t ) X X " " " XDM-15{20-22 ft) X X XDM-15C22-24 ft) X X XDH-16(6-Sft) X X XDM-16CS-10 ft) X X XDM-16(10-12 fl) X X XDM-16Q2-14 ft) X X XDM-16(14-l£ft) . X X " XDM-16C16-1S ft) X X - XDM-16(1S-20 ft) X X - - XDM-16(20-22 ft) ' X _ X ^ _ XDM-16(22-24'It) ' ' X X ' " " ' """ ' X
An analysis of dioxin from an immiscible sample collected at an adjacent perchedwater table well may be substituted at these locations (if NAPLs are found in thewells) for a maximum of four substitutions. - -( ? ) " . . . . - . - . . .7Analyze a maximum of two additional saproiitic soil samples per well based onthe results of._the UV screening. Depth intervals are approximate. Samples fromeach well will be.take.nia.2.-foot.intervals to bedrock.
2-62
Soil sampling for dioxin and furan analysis will be conducted, as indicated in'Table 2-6. As shown in the table, some of the samples .will be collected at thesurface- while others will be taken at the hardpan. Surface samples will becollected—Where there is the greatest liklihood. that dioxin-contaminated oilpenetrated the ground surface directly as a result of production operation spills anddrips, or was" tarried with surface water runoff. Soil samples taken at the hardpanare.locations, where dioxin contamination, if it exists, will most probably be as aresult of lateral migration in a NAPL layer rather than through surface infiltration.In those . areas:"where., soil samples may have been contaminte.d by eithercontaminated surface runoff or subsurface "NAPL migration, the sampling pointsare staggered between surface .a.nd_.hardpan' samples. -"
For the selected dioxin samples flagged in Table.2-6, soil samples will becollected near the location where a-perched water table, well either exists or willbe installed. The soil boring locatiorisjadjacent to perched aquifer wells are listedin Table 2-7. At a maximum of four of these paired boring and well locations, if aNAPL is detected and sampled in the ....well, the dioxin analysis will not beperformed on the soil sample. This is because dioxin would be mobilized in theNAPL carrier and, therefore, the NAPL analysis would be a surrogate for the soilanalysis. If..dioxin was found in the NAPL, the soil would be.inferred to becontaminated with dioxin.
Soil samples with the ""DM" prefix will be collected while installing wellshaving the; same, identifier... S.oiLsamples at well locations will be collected duringwell drilling, operations by means of the split spoon sampling technique (SOPB.III.4), In order to assess the potential vertical migration of contaminants throughthe hardpan and into the underlying saprolite, the onsite and down gradient wellsthrough the saprolite will be sampled more extensively. Split-spoon samples from'"these ;-well locations (DM-1 (R) through DM-4 (R), DM-il (B), DM-15, and DM-16)will be .screened for organics contamination from the hardpan layer through the.saprolite to the unweathered bedrock interface- The screening will be performedusing the .ultraviolet (UV) fluorescence screening" technique described in SOPB.III.5. The screening will be continuous as samples will be withdrawn continuouslyin discrete" 2-foot intervals. A saprolitic soil sample taken from just below thehardpan will be collected from each of these well locations and analyzed for TCLvolatiles and semivolatiles, and arsenic, copper, chromium, and zinc. Soil samples
2-63
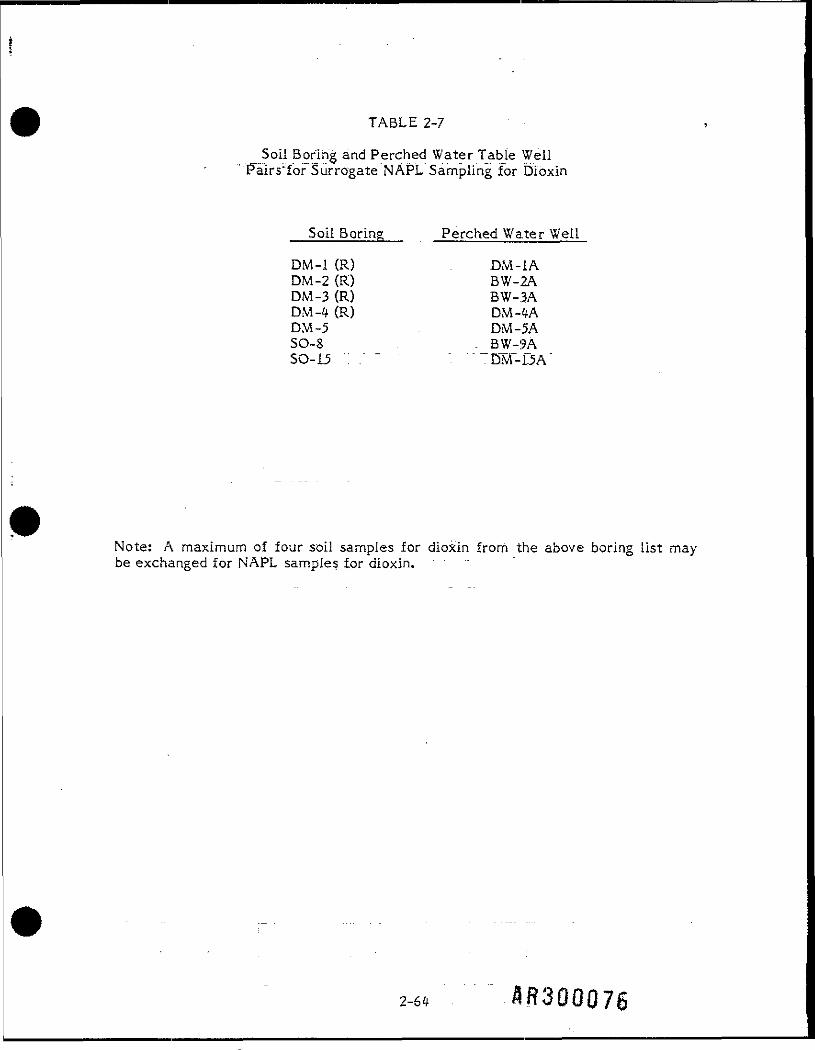
TABLE 2-7
_Soii Boring and Perched Water Table WellPairsLfor Surrogate NAPL Sampling for Dioxin
Soil Boring Perched Water Well
DM-! (R) DM-IADM-2(R) BW-2ADM-3 (R) BW-3ADM-4 (R) DM-4ADM-5 - DM-5ASO-S _ ^B^r^ASO-15 : . - .DM-I5A"
Note: A maximum of four soil samples for dioxin from the above boring list maybe exchanged for NAPL samples for dioxin. • - -
2-64
from"wells..installed .along the center axis of the site (DM-3 (R), DM-15, arid'DM-16) and near the CCA disposal area (D"M-2 (R)) will also be analyzed for TCLvolatiles and semiovolatiles at the apparent bedrock interface. For all seven wells,a maximum of two additional saprolitic soil samples per well will be collected forlaboratory analysis, based on the. results of the UV screening. In the case of wellsDM-2 (R), DM-3 (R), DM-15 and DM-16, these samples will be collected from theinterval between the sample collected at the apparent bedrock interface and thesample collected directly under the overyling hardpan. In the case of wells DM-1(R), DM-4 (R), and DN*-fl~(B), if the sample collected at the apparent bedrockinterfaced found to be contaminated during the screening process, it will be oneof the samples selected from chemical analysis. Where an entire column ofsaprolitic "soil tests .positively for organics contamination by the UV screen, thethree, to fojjr samples collected in the saprolite. for laboratory analysis wouldprovide_jdata._in_approximately 5- to 7-foot intervals through the cross-section.However, if..".an entire'column of-soil is not contaminated, the location of anyadditional samples taken which test positively would be at the discretion of theDames - & Moore Field Operations Manager and the EPA oversight personnelpresent.
As a secondary check on the effectiveness of the UV screening technique, asample ..that is found to be UV nondetect.will be taken from one of the wells andsent to the laboratory for TCL volatiles and semivolatiles analysis. This, of course,assunres that a UV nondetect sample is collected. This method check will beperformed to help ensure that organics^contaminated samples . are. notinappropriately found to'be UV nondetect (i.e., false.negative).
Samples with the "UT" prefix will be collected from the utility trenches thatwere dug when the water and sewer lines were laid. Because the disturbed eartharound utility lines are sometimes found to act as conduits for contaminantmigration, the backfiLLln these trenches will be ..sampled at the depth of the utilityline. These samples will be analyzed for TCL volatiles and semivolatiies andarsenic, chromium, copper, and zinc. The sampling locations were selected so thata comparison could be made, between upgradient and downgradient contamination,if any, found in the-Utility trench.
The 32 soil sampling locations shown in Figure 2-23 (i.e., SO-1 through SO^IS,UT-i through UT-5, DM-l(R) through D_M-4(R), DM-5, DM-ii (B), DM-15. DM-16,
2-65
and DM-1SA) as well as the .two sites to be determined provide broad sampling1coverage over the area withinE the facility boundary and in likely contaminantmigration pathways.. This..initial, .sampling plan is judged to be sufficient tocharacterize contamination at the Site. A second phase of sampling will berequired to establish a boundry line between contaminated and noncontaminatedsoils. This post-RI field "effort will run concurrently with the feasibility study,starting after a full assessment of the additional data requirements has been made.The soil sampling performed during the post-RI data collection effort will follow asystematic design plan such as a grid to minimize the quantity of "clean" soil thatwill require treatment or disposal.
2.7.6.3 Surface Water and Bottom Sediment Sampling, Surface water and bottomsediment sampling and analysis will be. performed to assess - surface transportpathways (Tables 2-2 and 2-3). Dames. & Moore will collect samples from 10offsite locations. Five locations (SW-l/SE-1, through SW-5/SE-05) are situatedalong "North Run Creek to the north of _-_the Site (Figures 2-24 and 2-25). Fourlocations (SW-6/SE-6 through SW-S/SE-8 and SW-1I/SE-11) are located in theseasonally wet area "and the permanently ponded area. Since, groundwater maydischarge to both North Run Creek and the..seasonally wet and permanently pondedareas, these samples will address" two potential migration pathways; groundwaterdischarging tp_ surf ace.. water. and oyerland flow of surface water runoff. In theevent that dry weather causes" standing water to receed in the seasonally wetand/or permanently ponded areas, the sampling" locations 'In these, areas may berelocated so that surface water and water-saturated sediment samples can beobtained. The surface water and sediment sampling location (SW-9/SE-9) will belocated immediately upstream of Tailey's Pond, the site of the reported fish kills in1962 (Figure 225}." SW/SE-9-is considered an appropriate sampling location sincesediments In Tailey's Pond reportedly have been removed by maintenance dredgingjit is unlikely that the creek sediments were dredged upstream of the pond. Oneadditional sample collected onsite will be sediment from the bottom of the lagoon(SE-10) to determine whether of n:o"t~ all contaminated sediments were removedwhen the lagoon was excavated;in 1987. The SE-10...sediment sample will be acomposite of four individual samples taken from quarter sections of the lagoon.
All samples will be analyzed for TCL volatiles and semivolatiles, and arsenic,copper, chromium, and zinc. Surface, water samples will be analyzed for the~withal narameters of alkalinity, hardness, biochemical oxygen demand,
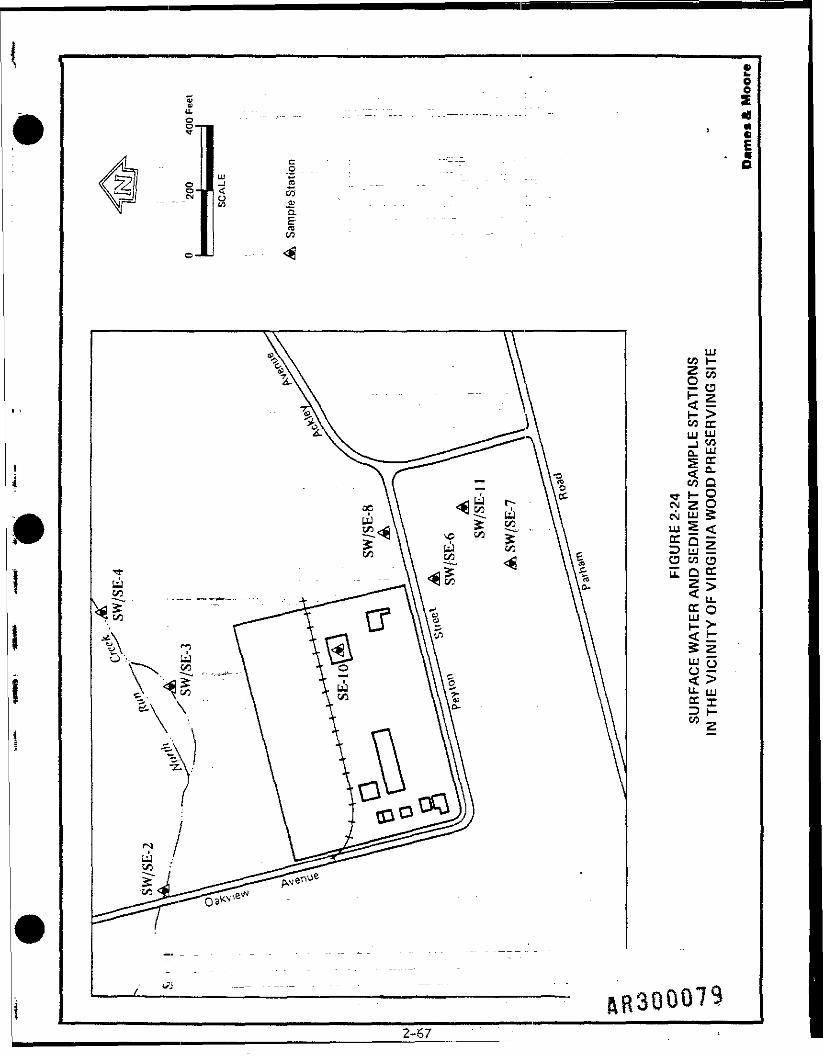
£oo
MftEO
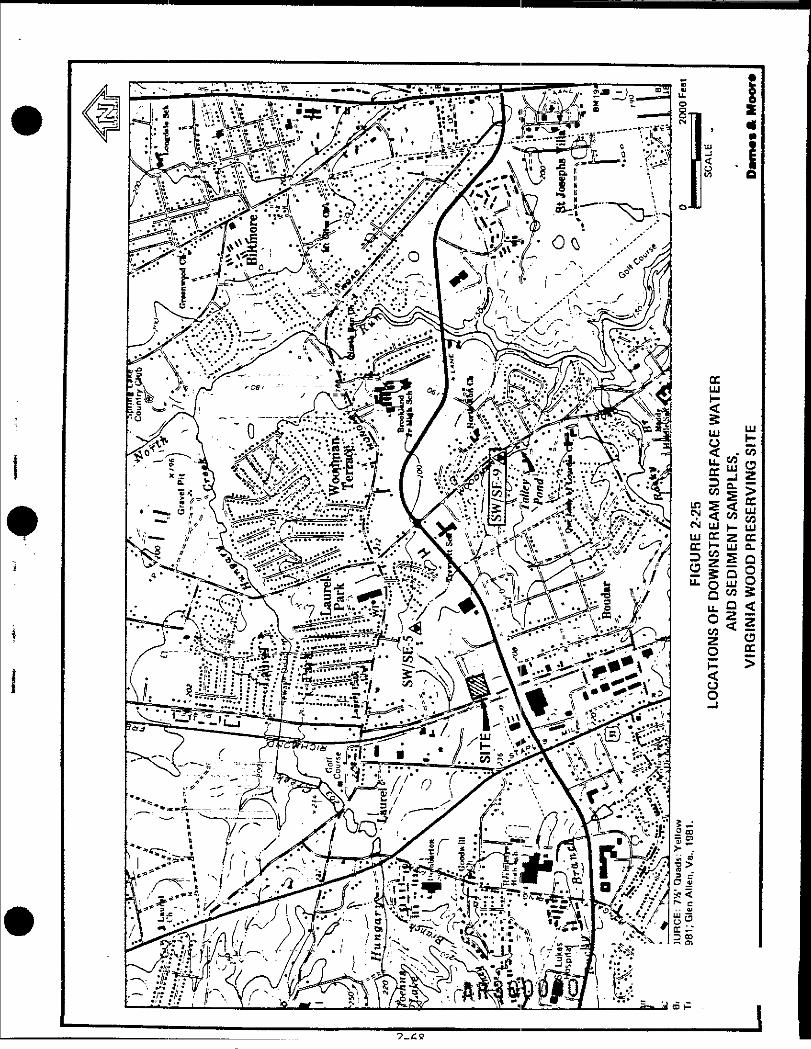
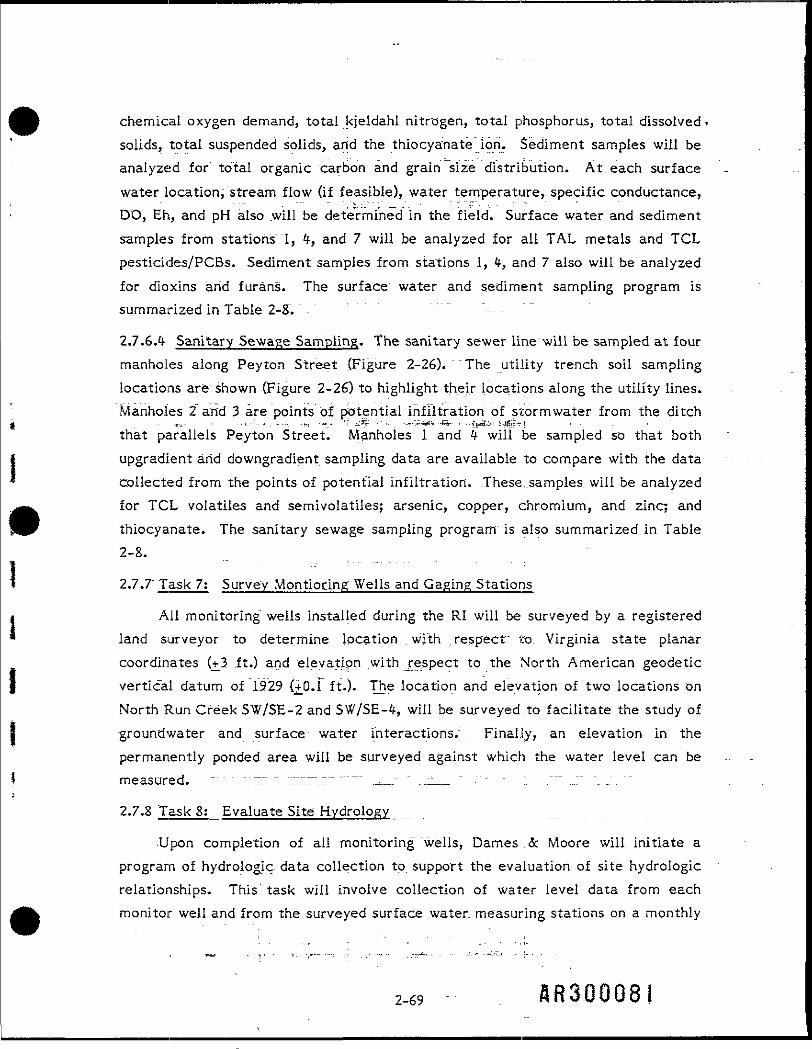
chemical oxygen demand, total kjeldahl nitrogen, total phosphorus, total dissolvedsolids, total suspended solids, and the thiocyanate ion. Sediment samples will beanalyzed for total organic carbon and grain size distribution. At each surfacewater location, stream flow (if feasible), water temperature, specific conductance,DO, Eh, and pH also .will be determined in the field. Surface water and sedimentsamples from stations 1, 4, and 7 will be analyzed for all TAL metals and TCLpesticides/PCBs. Sediment samples from stations 1, 4, and 7 also wilt be analyzedfor dioxins and furans. The surface water and sediment sampling program issummarized in Table 2-8.
2.7.6.4 Sanitary Sewage Sampling. The sanitary sewer line will be sampled at fourmanholes along Peyton Street (Figure 2-26). "The utility trench soil samplinglocations are shown (Figure 2-26) to highlight their locations along the utility lines.Manholes 2 and 3 are points of potential infiltration of stormwater from the ditchthat parallels Peyton Street. Manholes 1 and 4 will be sampled so that bothupgradient arid downgradient sampling data "are available to compare with the datacollected from the points of potential infiltration. These;.samples. will be analyzedfor TCL volatiles and semivolatiles; arsenic, copper, chromium, and zinc; andthiocyanate. The sanitary sewage sampling program is also summarized in Table2-8.
2.7.7"Task 7: Surve'y Moritioring Wells aad Gaging Stations
All monitoring wells installed during the RI will be surveyed by a registeredland surveyor to determine location with ^respect to Virginia state planarcoordinates (+3 .ft.) and elevation ^with jrespect to the North American geodeticvertical datum of 1929 (±0.1 ft.). The location and elevation of two locations onNorth Run Creek SW/SE-2 and SW/SE-4, will be surveyed to facilitate the study ofgroundwater and surface water interactions." Finally, an elevation in thepermanently ponded area will be surveyed against which the water level can bemeasured. .7.'.' "~: " ".77.7~.~~ """ .-—. " ..__ " " " 1 .""" ..." '. ...
2.7.8 Task 8: _ Evaluate Site Hydrology
•Upon completion of ail monitoring "wells, Dames.& Moore will initiate aprogram of hydroiogic data collection to support the evaluation of site hydrologicrelationships. This task will involve collection of water level data from eachmonitor well and from the surveyed surface water, measuring stations on a monthly
2-69
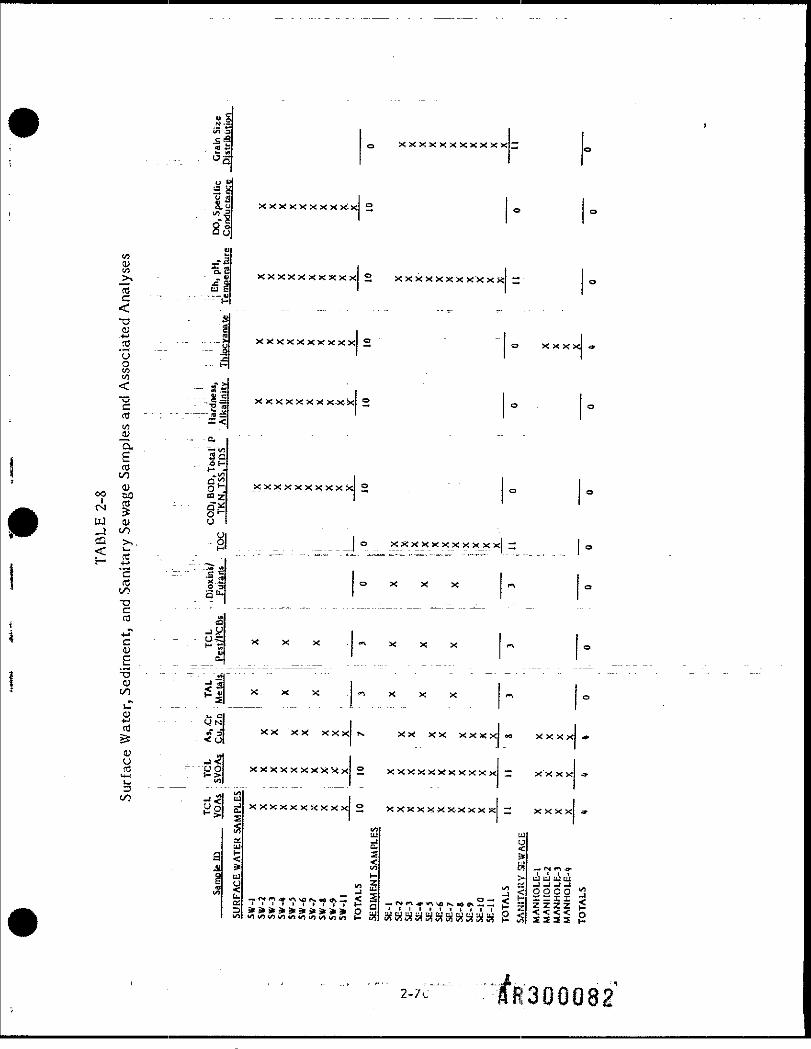
•o
00
*sISw-ia*°u
xxxxxxxxxxx
.2 — " i: xji \ -3]
x xxxxx xxx^xj
XXXXXXXXXX,
XXXXXXXXXX
XXXXXXX XX X K
X X X X,
XXXXXXX XXX!.... ____isx5|
- = Q. ia£rd
_"i|rn«lXXXXXXXXXX
UJ a>-1 °° yi ic Q > > . -r oj _ _ _ _ _ | ° ^x>l_xxx xxx =<x —< | - - -:.-.-:,- -.-- --.T..-___ . ,v__:- ,, - ...
"co X X X
4^ 'C10 "Ijy I- . n?-l . . . I
X X X
- - «» 2
" !-SO 3a*a
jy- ust~ —t)Q.
X X X
o
»
T D - - - - - . -CJI S ) 5 S I X x x l < n X X X
xx xx xxxXXXXX XXXXX;
XX XX XXXX
xxxxxxxxxx 2 xxxxxxxxxx
i/i
wi i/) f» irt to i-i i _>
H
u:
•?|i O uj;
« x x x x;
x-xxx
ao — «r t^
u uj iuuO O O O = - Elz zzz <
< o
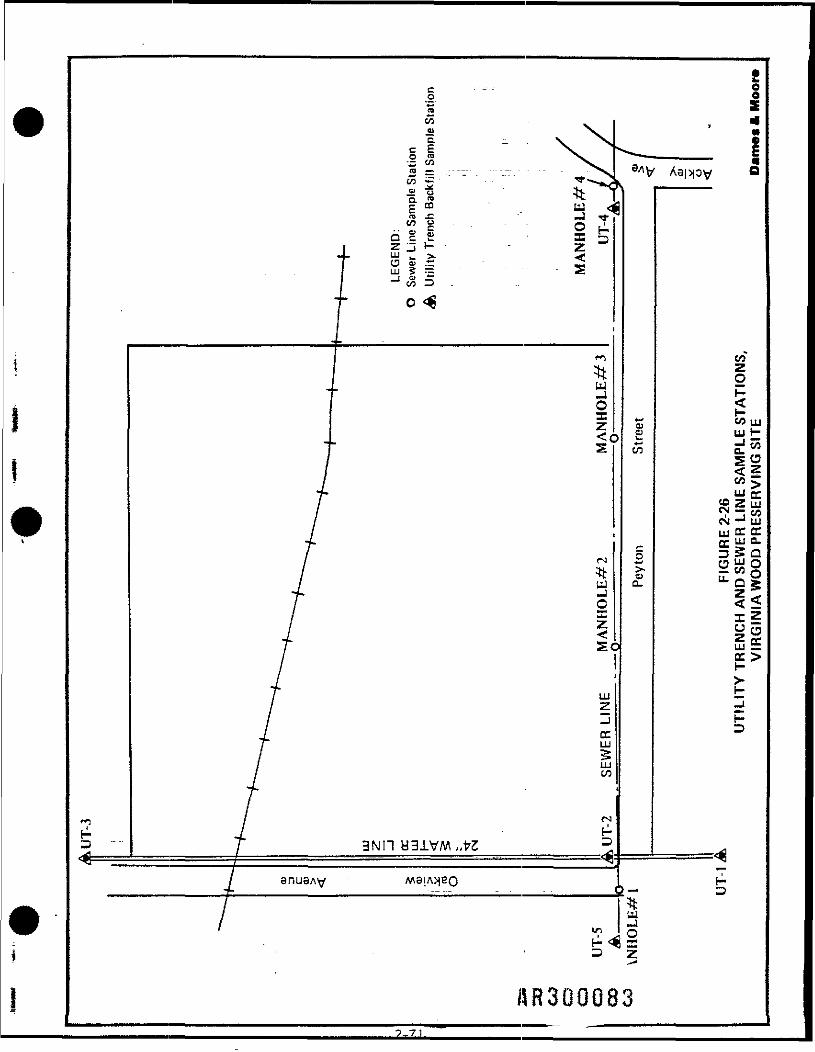
c = - - gf I•e«
81
.2a -_c |
(O — .------ - - - - - - -
o> "SQ. ro "*i.g CQ ' Ura -C " «J« g - . o
O c £ • Xz 3 t- - - z
Sis - s
E
X
oHo "
<o " *" *~
fN
3MI1
,/
«AftSlA^BQ
CO UJ
CO
GJQ-
H
uj a:«S Z LU^ — coC-4 -J ujLU cc ccrr UJ a.
"- Qg-1 -O
X?Ha
sof _ _tr >
cc
o —UJ
oz
«R3000839 7 1
basis (on or about the 10th of-each month) for the duration of the RI/FS. The field1team' will also .delineate areas of standing water on a copy of the Site topographicmap at the time of each .water level collection event.
These'data will be used to prepare potentiometric surface maps for eachaquifer. Since".the production wells may give composite water level data for thebedrock aquifer, the water level data for these wells will be compared to thepressure head of.-the-Uppermost packer test interval at the time of packer testingto determine if the water level measurement for the entire open interval of theproduction wells is significantly different from the pressure head for the upper 50feet of bedrock.
The production wells (//I and #2) are out of service and have been out ofservice for some.time. No data exists on the historical water production fromthese, wells. Therefore, the historical water production characteristics of thesewells._will not be included in the evaluation of site hydrology.
A pump test will be performed if necessary to evaluate the actual inter-connection and isolation characteristics between the three aquifers of concern. Ifthe pump test is performed, an existing onsite"production well would be selected asthe pumping well for the test, based on the findings of. Task 4. Observation wellswould be selected for the test based .on their spatial relationship to the pumpingwell, aquifers being monitored, well construction, etc. The pump test would beperformed following SOP B.II.2.
2.7.9 Task 9: Conduct a"Biological Assessment" ~
The bioassessment plan entails a wetlands delineation as required by EPA inthe LLS. EPA Wetlands Identification and Delineation Manual (1987). The wetlandsdelineation (see.SOP B.V.2) includes.:a faunal survey, as well as an examination ofhydrophytic vegetation, wetland: hydrology, and hydric soils to identify the wetlandareas. The parameters to be examined in the field study will be-done at intervalsof approximately 100 feet in order to determine the extent of any wetlands.Results will be plotted on the topographic map of the Site. All wetlands found willbe clearly delineated. ... - .. .-,-_—., - .. „ ,.. .. .... .
As previously discussed, the RI sampling program includes collecting surfacewater and sediment samples from North Run Creek, the seasonally wet area, andthe permanently ponded area. This sampling and analysis will be conducted to
2-72
assess whether or not contaminants migrated off the Site and then settled in the'sediments of nearby areas. If the chemical testing program indicates that thesesediments have been contaminated at concentrations injurous to aquatic organisms,a biological investigation wo.uld.be warranted.. This investigation would include asediment elutriate bioassay and ambient aquatic" toxicity testing. The proceduresfor conducting these., tests will be prepared at a later time if these tests prove tobe necessary. —
2.7.10 Task 10:. Prepare Remedial Investigation Report Including EndangermentAssessment
After completion of the field investigations, all pertinent field and laboratorydata (pertinent Phase I data for developing an overall description of site, conditions)will be assembled into an RI draft report. This report will include comprehensive..descriptions of the following items:
* Objective.s4of the remedial investigation. :
* The natural setting of the study area.
• Geologic framework and subsurface geologic conditions in the vicinity"of. the site. ~
* Hydrogeologic conditions, at arid in the immediate vicinity of the Site,including the. hydraulic relationships among aquifers and estimates ofthe rates and directions of groundwater flow.
• Groundwater and surface water quality in the study area.
• Transport of the wastes by surface -water in the vicinity of the Site.
* Soil testing data and test procedures, chemical analysis reports, hydro-..geologic test data, and monitoring well water level readings.
• Endangerment assessment.
Preparation of the Remedial Investigation report will follow the "Guidance onRemedial Investigations Under CERCLAa" June 1985 document and will include aLevel 3 Endangerment Assessment.
2.8 FEASIBILITY STUDY .;
General Approach .._..,-, - . . . .
Dames & Moore's approach to analyzing remedial alternatives conforms to allrequirements under Subpart F of the National Contingency Plan, as described in 40CFR Part 300 (Section 300.68). This approach to screening and evaluating remedialoptions contains all of. the elements of procedures described in EPA documents("Guidance Document for Feasibility Studies Under CERCLA," Draft, April 1985;""Methodology for Screening and Evaluation of .Remedial .Responses," Draft, March16, 1984; and "Interim Guidance on Superf.und Selection of Remedy," Office ofSolid Waste and Emergency Response (OSWER) Directive Number 9355.0-19,December 24, 1986)" that provide guidance, for complying with the Subpart Frequirements. OSWER Directive Number 9355.0-19 addresses requirementspromulgated by the Superfund Amendments and Reauthorization Act of 1986(SARA).
Subpart F provides a general framework for conducting a phased evaluationof possible remedial options "and for identifying remedial alternatives that are"consistent "with permanent remedy to prevent or mitigate the migration of arelease of hazardous substances into the environment." The procedures outlined inSubpart F can be divided into two'phases:
Phase -1 - development .and preliminary screening of alternatives (generalresponseTa'ctions)
Phase 2 - detailed analysis'of selected alternatives.
The first phase consists of a two-stage screening process to narrow the rangeof remedial alternatives to be .evaluated in the second phase. Our approach toperforming each of the phases, of a remedial alternatives, analysis is describedbelow. " . - - -- - . . . _ : .
2.8.1 Phase 1: Preliminary Screening of a Range of Control Measures
General Response Actions . . _ _ . . . _ _ : .
The initial phase first involves the development of a comprehensive list ofgeneral remedial actions to be considered. Data from the RI will be reviewed toidentify general categories of response, actions. The remedial alternativesconsidered at this stage_w.ill consist of general response actions that broadly definethe nature of the required response. Selected response actions appropriate, tovarious "site-DTflBlerris are presented in EPA documents and will be.considered in the
2-74
elimination".p'rocessr supplemented by Dames & Moore's knowledge of workable,site-specific procedures for remedial action. By eliminating inapplicable responses'at this stage, the universe of potential remedial actions to be considered in thefollowing steps will be substantially reduced, and the emphasis can be placed onalternatives with greater potential applicability to site problems underconsideration.
In applying technical criteria to the screening of remedial technologies, siteand waste characteristics will be taken into consideration. For example, fororganic contaminants, ion exchange or stabilization by cementitious or pozzuolanicprocesses would be inappropriate. Technical criteria to be employed will includethe following: compatibility with site characteristics; compatibility with wastecharacteristics; reliability; developmental status; technical performance; potential
construction or other implementation problems; and potential maintenanceproblems. As required by SARA, innovative technologies,, even if unproven, will beconsidered if they may- provide better performance or lower costs thandemonstrated technologies. .In addition to various" treatment alternatives, acontainment option involvingiittle or no treatment and a no-action alternative willbe developed. All available data and best engineering judgement will be employedin applying screening criteria'to the remedial alternatives.T
Performance.Standards ...:_;_ . - . . _ _ ; . . --._!.-•--• : =^- -:-- -----
A key factor in the first phase of remedial alternatives analysis for the Siteis the establishment of appropriate performance .standards or cleanup criteria. Thedevelopment of appropriate performance:.standards or cleanup criteria for the sitewill provide a firm basis for the evaluation of remedial alternatives. Suggestedperformance; standards will be.: formulated and presented in the draft FS, butperformance standards "may be presented in the form of cleanup levels (i.e.,concentrations) for speciflcTcontaminants (where such levels are available) and/orgoals for contaminatiorvcontrol (i.e., prevention of further contaminant migration)."Key factors to be considered in establishing and justifying appropriate performancestandards include existing regulations and other applicable criteria, endangermentto the environment and public health, and the capabilities of available remedialaction technologies, and past experiences and case histories for similar orcomparable projects. . . . ..., .. . _ . . - _ . . . .
2-75
To develop performance standards for the Site, Dames & Moore will review'information" on past site cleanups involving similar wastes. Available informationon performance standards established for those sites and the justification for thosestandards will be used in developing appropriate standards for this assessment ifsuch performance standards are consistent with the present requirements of SARA.Existing regulatory standards, if any, and guidelines for drinking water, as well asany applicable toxicologic information on "indicator chemicals" (as defined inSection 3 of the Superfund Public Health Evaluation Manual, dated October 1986)developed during the RI will be integral to the development of performancestandards. Site-specific" factors affecting risks ta public health and the environ-ment—such as the nature and extent of actual and projected containmentmigration; dispersion; arid attenuation effects on contaminant levels at downstreamlocations, human and biotic populations, and systems at risk—-will also be evaluatedin developing cleanup criteria. :
Preliminary Screening of Alternatives -~M ..^ ••:;
The next step in Phase 1 of the remedial alternatives analysis will consist ofa preliminary screening ""process to" further narrow the range of alternativesrequiring detailed analysis." Lists of.specific.remedial technologies included in thegeneral technologies will be combined to develop alternatives required to mitigateany site problems identified. Thus, the potential remedial alternatives wouldconsist of a combination of remedial technologies. As required by EPA, alterna-tives will be examined in each of five categories (see ."Guidance Document forFeasibility Studies Under CERCLA," April 1985, Chapter 2):
1. Offsite treatment arid disposal
2. Alternatives that attain applicable standards
3. Alternatives that exceed applicable standards
4. Alternatives that do not attain applicable .standards but reduce thethreat from hazardous substances at the site
5. No action.
The assembled list of remedial alternatives will then be screened accordingto. specified criteria. To ensure that all potentially feasible alternatives areconsidered, a comprehensive matrix of the remedial alternatives and the screening
-2-76
criteria will be: prepared. The use :of such a matrix has the advantage of clearly»indicating the." specific reasons" for rejecting a remedial alternative. Additionaldocumentation for rejecting alternatives will be provided, as needed.
The remedial alternatives : will be screened according to specified environ-mental/public health, legal/regulatory, and cost criteria. The environmental/publichealth criteria will require that all pathways and points of exposure be addressedby each alternative and that the environment and public health be adequatelyprotected. The legal/regulatory analysis will take into account such considerationsas"" "permitability, conformance with environmental standards criteria, andregulatory agency acceptance. The:objective of the cost screen is to eliminatealternatives with similar reliability and environmental/public health benefits. Atthis stage, cost, es ti mat es_:, will bej?_ased on: data readily available from publishedliterature (e.g., "The .Remedial. .Action Cost Compendium," Environmental LawInstitute, 1983) and will be supplemented with vendor quotes only where necessary.The cost estimates will be based on preliminary conceptual designs of eachremedial alternative and will account for site-specific factors. Both capital andoperating and maintenance costs;will be estimated. -~; ; ;
Innovative technologies will be... carried through this~~screening process if theanalysis demonstrates that there is a reasonable probability that they will providebetter treatment, fewer adverse impacts, or lower costs than demonstratedtreatment technologies. .__. : . .__-..-. ... . . . . .
2-8.2 Phase_-2r- Detailed Evaluation of Selected Alternatives
After applying the ...technical, environmental/public, health, legal/regulatory,and cost screens, the remaining remedial alternatives will be examined in greaterdetail. Depending on the number of remaining alternatives and the nature of theavailable data," the alternatives could be. ranked subjectively by use of bestengineering judgement, or 'by;_a~; numerical.ran.kirjg^scheme that incorporates thetechnical, environmental/public health, legal/regulatory, and cost factorspreviously discussed. Based on these rankings, a~ limited number of alternativeswill be selected." It should be noted that a "no action" alternative will be included .in the detailed analysis. " " " ' _ . . .
Phase 2 requires development and detailed specification of conceptualdesigns of the remaining remedial alternatives.:. .Subpart F states that the detailed
2-77
analysis should include: "detailed cost estimation, including distribution of costs'over time; evaluation in terms of engineering implementation or constructability;an assessment of each alternative in terms of the extent to which it is expected toeffectively mitigate and minimize damage to" land provide adequate protection ofpublic health, welfare, and the environment; and analyze any adverse environ-mental impacts, methods of mitigating these impacts, and costs of mitigation." Tomeet these requirements, Dames & Moore will conduct detailed technical,economic, environmental, legal/regulatory, and public health evaluations.
Each remedial alternative will undergo detailed evaluation of severalimportant technical factors. Performance will be evaluated in terms of theeffectiveness preventing or rriitigating contaminant migration and the useful lifeoi-the remedial technologies. Reliability.will be evaluate.d in terms of technicalrisk. Although most of trie alternatives that pass the technical screen may beproven or demonstrated technologies, there can be significant risk in applying thesetechnologies .to-site-specific wastes and environmental conditions under considera-tion. The ability to construct each remedial technology under the site conditionsand the time required to implement each alternative will also be assessed. Inaddition, the safety of workers, and the public during and after construction will beconsidered. -•-..•=."•- .i...r:±.----—•---—-. -= -•=•::— ..-:- -------- -
The potential impacts, if any, of each remedial alternative on public healthand the environment will be evaluated in detail and will assess potential exposureof people and sensitive environmental systems, potential exposure pathways, andpopulations at risk. The air pathway will be included, as a potential exposurepathway, arid an air "Impact analysis will be performed for those alternatives wheresuch an analysis is applicable. Environmental concentrations of the "indicatorchemicals" will be estimated at all exposure points and compared to applicablestandards and criteria. Results "obtained under other tasks will be used for these.analyses. " . . - - --" --' •-;--.- • •-- "- —- - -"-'-" '. -T" '•-
The detailed cost analyse~s":will include estimates, of capital and operating andmaintenance' costs, present worth analyses, inflation analyses, and sensitivityanalyses. Both the capital and operating costs will be broken down according toindividual components, such as equipment, buildings, contractor fees, overhead,energy, ~raw~~fnaterials, and labor. Conceptual design information will be used toobtain vendor cost estimates, which will be used in addition to the previously
2-78
discussed sources of .cost data. For some remedial alternatives, the schedules *associated with construction and operation may be considerably longer than forother alternatives. Where potentially significant, inflation analyses will be carriedout to determine the effect of such schedules on annual expenditures or cash flows.Many parameters such as the construction schedule, the extent of contaminationand pollutant concentrations, and the future inflation rate are subject to varyingdegrees" of uncertainty. _ Present._worth_analyses will be performed to compare thecosts, of different remedial alternatives on a common basis. Sensitivity analyseswill be conducted to.identify which parameters and associated uncertainties havethe greatest impact on project costs. The sensitivity analyses can be useful inidentifying areas where costs can be significantly reduced and where additionaldata are needed to reduce*uncertainties in the cost estimates. Also, a cost analysiswill be performed for applicable add-on controls for air quality improvements.
The results of the detailed analyses will be summarized in a tabular formatthat compares cost,' health risks, environmental impacts, performance, technicalreliability, and other important factors; the table will facilitate the selection of apreferred alternative. According to Subpart F, the alternative selected should bethe "lowest cost .alternative that is technologically feasible and reliable and whicheffectively mitigates, and minimizes_damage to. and provides adequate protection of .public health, welfare, or the environment." According to OSWER Directive9355.0 -19, the selected remedy should 1) be protective of human health and theenvironment; 2) attain applicable, relevant, and appropriate Federal and Statepublic health and environmental requirements (ARARs) that have been identified.for the.VWP site; 3) be cost effective; and 4) utilize permanent solutions andalternative treatment or resource recovery technologies to the maximum extentpracticable. SARA does provide exceptions to the attainment of ARARs for sixcircumstances, (balancing of the Superfund, technical impracticability, selection ofan interim remedy, greater risk to health and the environment, equivalent standardof performance, 'and inconsistent application of state standards). If, in balancingthe relative advaniages.TarTd" disadvantages of the various alternatives, a singlealternative Is not clearly preferred" as the optimum choice, additional analyses(such as cost/benefit and decision/risk analyses) may be recommended to assist inthe selection process, although these are not part of the present scope of work.
2-79
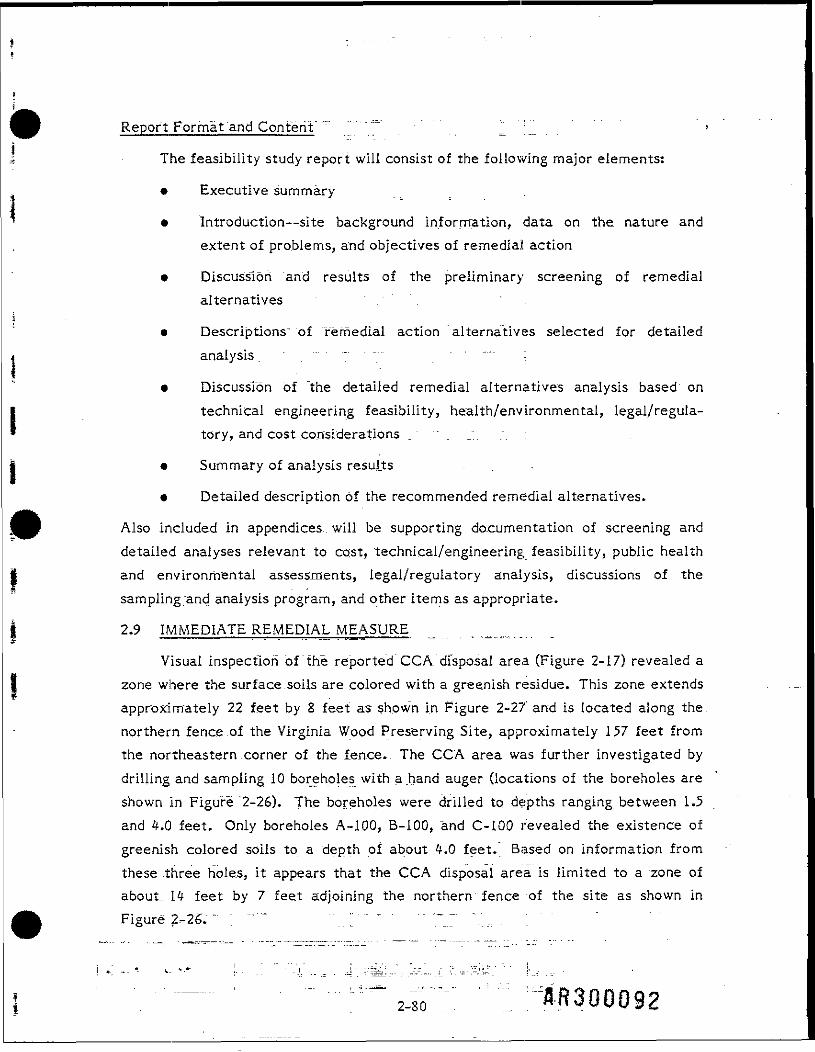
Report Format and""Conten't" " =••••-- - = .
The feasibility study report will consist of the following major elements:
• Executive summary
* Introduction—site background information, data on the nature andextent of problems, and objectives of remedial action
• Discussion and results of the preliminary screening of remedialalternatives " . " " " . ' .
• Descriptions" of remedial action alternatives selected for detailedanalysis. • - - -• - --- - — ;
• Discussion of "the detailed remedial alternatives analysis based ontechnical engineering feasibility, health/environmental, legal/regula-tory, and cost considerations _ " _:. .". :
• Summary of analysis results
• Detailed description of the recommended remedial alternatives.
Also included in appendices., will be supporting documentation of screening anddetailed analyses relevant to cost, technical/engineering feasibility, public healthand environmental assessments, legal/regulatory analysis, discussions of thesamplirig;and analysis.program, and other items as appropriate.
2.9 IMMEDIATE REMEDIAL MEASURE
Visual inspection of the reported CCA. disposal area (Figure 2-17) revealed azone where the surface soils are colored with a greenish residue. This zone extendsapproximately 22 feet by 8 feet as shown in Figure-2-27' and is located along the.northern fence of the Virginia Wood Preserving Site, approximately 157 feet fromthe northeastern .corner of the fence.. The CCA area was further investigated bydrilling and sampling 10 boreholes with a .hand auger (locations of the boreholes areshown in Figure 2-26). The boreholes were drilled to depths ranging between 1.5and 4.0 feet. Only boreholes A-100, B-100, and C-IOO revealed the existence ofgreenish colored soils to a depth of about 4.0 feet. Based on information fromthese three holes, it appears that the CCA disposal area is limited to a zone ofabout.. 14 feet by 7 feet adjoining the northern fence of the site as shown inFigure 2-26. ; " ~ "..['" ' "."..7" "..,= .
2-80
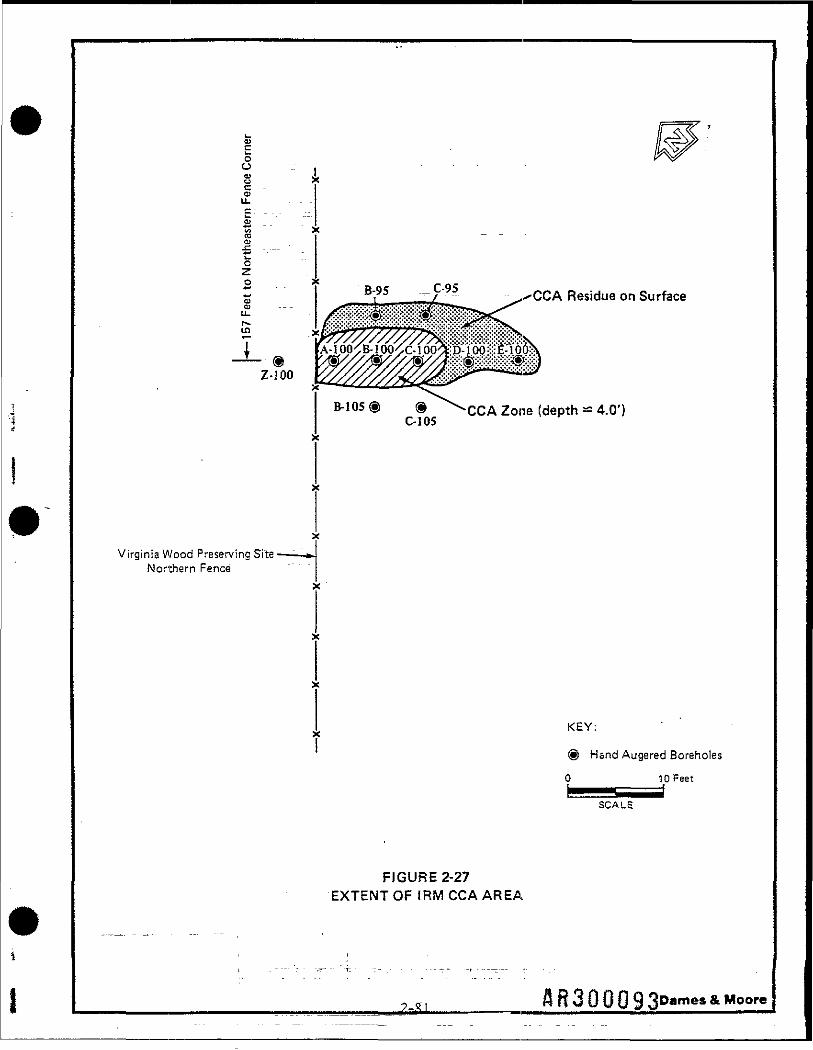
Virginia Wood Preserving SiteNorthern Fence
CCA Residue on Surface
•-••ViwxxX-jgJ
CCA Zone (depth *= 4.0']
KEY:
® Hand Augared Boreholes
0 10 Feet
SCALE
FIGURE 2-27EXTENT OF IRM CCA AREA
«, nfi^tJLj<( n .i & Moore
An IRM is proposed for the CCA disposal area. The proposed action would,consist of removal of the CCA by an approved TSD contractor followed byplacement in RCR A-approved containers and disposal at an approved offsite RCRAdisposal facility. The proposed IRM is supported by the facts that the area forresponse is well definecl, or limited extent, and removal is an obvious response.
In the event that an IRM is not performed during either prior to or during theremedial investigation, the cleanup of this area will be considered during thefeasibility study. The lateral and vertical extent of .contamination would be morefirmly established .during the post-RI field sampling scheduled to be performed. Atthat time, a grid patern sampling scheme would be designed to establish thecleanup area'boundary.
During the course "joi the Rl/FS, it will be Rentokil's policy to propose otherIRMs, if their need or desireability become evident.
2.10 SCHEDULE ^ ... ";"".". _ ; • "
Figure"2-28 "presents thelschedule to carry out the"scope of work described inthis -work plan. The schedule allows time for field investigation tasks, analysis ofthe data gathered_ in the field, and preparation of required reports. It alsoincorporates periods for review by Rentokii and EPA. The schedule will become.effective upon" receipt of EPA's" written approval of this plan (work plan, QAPP,and health and safety plan). A critical path diagram of the work to be performed ispresented in Figure'2-29. " -.-•=-... = ;.." " " --• _ .=. ". . " . . - .
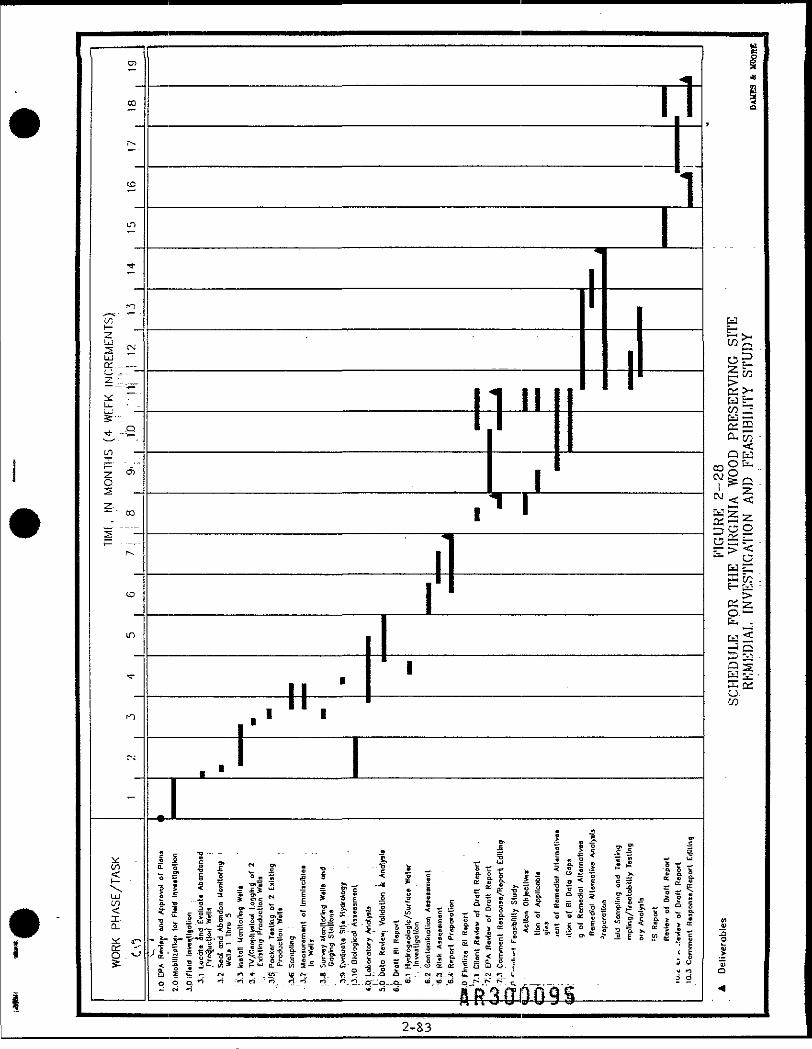
O)
CO
r-.
to
un
-3-
TO
t/TZ^ -,-,.S £?LJ£K._. -21 '.. . _
^ "~L_ • ..
*™-sc/) —
^ d>CS2-~ " CO
t— -------r
<£>
in
•*
n
r-j
-
WORK PHASE/TASK
ttf '
•——————— ¥
11•
————————————— tf ——j
——————— KH1-- ——1
i1 "
———————— —————— H- -,-' '
.J 1J ___________________
I tl .- 3i r v " " i - .1 1. 15 i! * sE 1 1 * Z 1 : ' - - -1 * - . 6 r " -. 5 fr I J ^ •= 1st*f s 5 *- f -IS < I s | £ g. l| s"5l ? 5- £ & f rIJi'.lBJ. 1 511-1 \l., i till lit ,i],.!i^(fglTlv.^-BSo.^ ^ ^ S *- S ?- I < ^ S g r ' B ^ l e J ' S • 3 * 5 " i l g i $ ; l l 0 o &•s !.=.'5*|s,sl|s* - 5^e.5.is|->c§|B S , o E S ^ c - ° c - l 3 « ? 5 & £ , < ?1 - a «*I 111 sg | i|K.J s-r ||s| ! ? 14 j- 1« Jill »| r -f >. -i|-
- S-S-"Hi Z l ^ ^ f T i - ' ^ ^ ^ ^ l ^ ^ a l S ^ E f l l ^ . " - » 3 E S » B . | E
.^•Il|f;ilflli| lM|!H!|!|r|li<lT ;I< | a s^-^s 1 £^ *f |= S J-» 4 | 5 l£ 5 a 1 | S 6 5. T - «tij I i^ -- IN p^* vi i o r * v " n 3 ^^ f^r a a *- .". CJ_Q_* tt PJ. L S ri*-, rt n *S ri H H " ri r^S rj rS rt " "^ rt" 'rt ft fl> ifl tf> U> ^ K K f^~ r - ^
- c J H - - - ^ «i '« fl^SfiFfld^S
g«
a
W^>wo .S5gpw -Is-[d &-00 J£u —Cc: 23ft- So -<Q &J
s§^~*g.w<<wS^cc: '2goooS-^ -IT > <1—1 Ow :Xio .t- fc2 •
K .O- —^^K^^g-Si.E Q;O-w
Deliverobles
•<
2 83
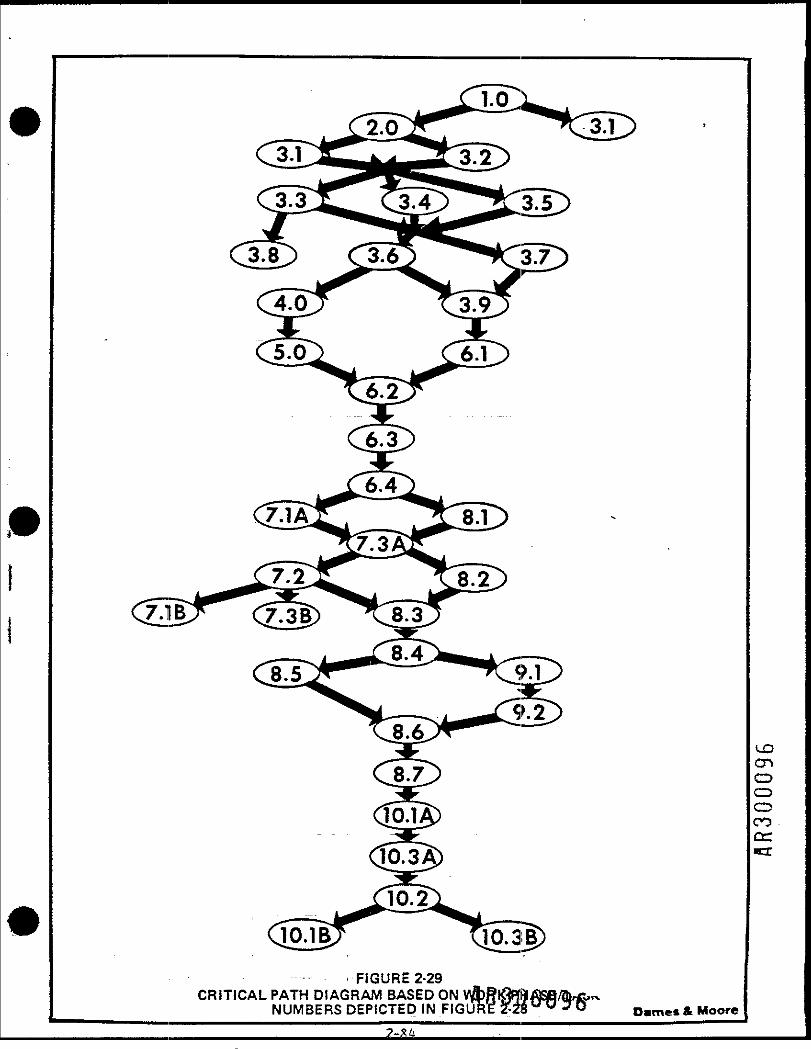
-FIGURE 2-29CRITICAL PATH DIAGRAM BASED ON
NUMBERS DEPICTED IN FIGURE 2T-2S w w * U o.me* * Moore
3.0 PROJECT ORGANIZATION AND RESPONSIBILITIES
3.1 DAMES & MOORE ;V '__ '] . ^_ ^"_^-_H_.-_--. _._.
Dames" &._ Moore's organizational structure for the project is shown inFigure 3-1.. .This figure illustrates the interrelationship of the project team,project team "makeup (personnel assignments in technical disciplines), and projectorganization.. As shown in Figure 3-1, project responsibility within Dames & Mooreproceeds-from the Project Director to" the Project "Manager, to the principal
. investigators. " " ;."." _"'|_"_ '"_ ' . "~" —-_;":" "-" "'•' •'— :.
Overall responsibility for "the project will reside with A. Woloshin, who willserve, as...Project Director.'" 'Mr. Wblosh'in'Va Partner (Ltd.) of the -firm withexpertise "in'hazardous..waste management and environmental engineering. He hasbeen associated with Dame_s & Moore for sixteen years.
John Os'gdod, Senior Hydrogeologist, wilL.serye as_.Project Manager andprincipal investigator for'hydrogeology. He will coordinate and manage the day-to-day technical aspects of the project and project team activities and will beresponsible .for day-to-day management and tracking of. the project schedule andbudget, coordination_with subcontractgrs,'coordination and preparation of requiredreports, and assignment of technical responsibilities for portions of the project toappropriate principal investigators. Administrative support activities will also beunder, his supervision.
The Project Manager will assign technical responsibility to and obtainassistance from the principal investigators, shown in Figure 3-1. The principalinvestigators will "be"ih" ""charge of ^technical .work in their discipline areas. Asspecialists .in their respective.: fields, they are assigned responsibility for theperformance .<5i field activities," anaylsis -of data," performance of detailedassessments, and preparation of reports, as applicable.
QA arid QC wiirbe. handled "b y'S'jjry a"Prasa.d',- Ph.D. Dr. Prasad has extensiveexperience in QA/QC programs'.for. hazardous waste management studies. TheHealth & Safety Of lice r, "Gary Mayer, 'will be responsible for the development andimplementation of the Health & Safety Plan, as well as any other health or safetyconsiderations that might arise. Analytical.chemists Paul Mills, Mark Valentini,Ph.D., and Steve Lemont, Ph.D., will be available on an as-needed basis to assist inthe review of laboratory data where organic compounds are tentatively identified.
3000983-1
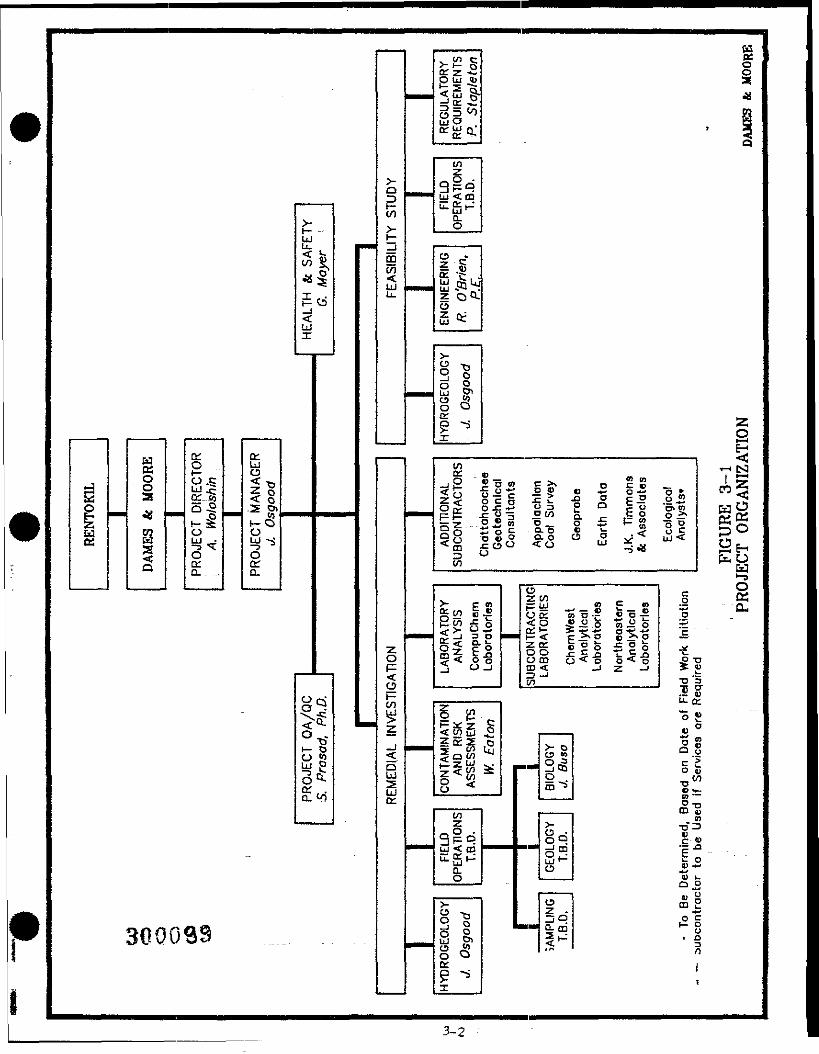
p
UOS
wffioos
ss<Q
3000
DIRECTOf
loshin
,0h- O^ ~3 *ZOo:Q-_ ..;
39
cc.LJo^$ °< 0.S D>»-eo•otr
Q.
--
>[—LJL_<t/)
«
I1—_I<li!T.
C>O<
ROJECT
C
u.
15c$
Q
Q.•D"onoav?
-
•i
>-oto>-
FEASIBIL
zop<C5H-V)
1_J<DUJZLJDl
•M
——
——
——
MM
——
•MM
REGULATORY
REQUIREMENTS
•P. S
tapleton
tn
glqLJ < CD= gl-*O.o
ENGINEERING
/?. O'Brien,
P.£.
HYDROGEOLOGV
J. Osgood
ONAL
R ACTORS
R*- -52 ,§8 -3 «en
LABORATORY
ANALYSIS
CompuChcm
1 £2^ z,
CONTAMIN
AND
RIASSESSME
en
FIELD
OPERATlOf
T.B.D.
HYDROGEOLOGY
J. Osgood
wcco§4
Q
»O*2———————————————————————— 1 <S
<D '"'ES
3 51?; Jo1 0 3 §-£ o*: CO 53 c § Z £ - g ° E - 2 . S - 2 ZS0 .E £ 03 £ Q |=u '& » MO= g 3 ^w S. Eo o>^ SQ*S £ <n 0— o 5 f-S -50 P^i-<U U « a £ -< §:J So———————————————— 1 g
Ift « E « -2 £^ oS -So-g fco-2 -5 C1-o <p * « .is -S o o 5-w ce*— s-t'-*-of-*' co ^ f=< C>*D «>vo ^o zee e ° o - e ° o ,/S oo JzcSr'cS •£0 OtD O<0 0<D £ T3_j m< _ j z — i *u
Z) -I -ten -on.£ $—— 1 u_ce
c o £§ « 0
S gg S|^ r-s^ §si-s40 O s-
£-?
L_..B°: 1-1§? I 5 - - '. , , , . . 9 lci 5 -
I ————— 1 ai "0 ,ggz -: -|J-j O O C1— aai i-g<^ ' s0
Jf
3-2
Dr. Valentini will also available to perform "audits of subcontracting laboratories i£his services_are 'required. _ t r _ ..v ;.-. ;_ , ; ;.,
The. principal investigators working on the RI have been selected for theirexpertise .in particular area's of study. William Eaton will be responsible for thecontamination and risk assessment activities. Mr. Eaton is a hydrogeologist whohas experience in. assessing risks associated with groundwater contamination andexposure .to...hazardous substances. Jeff -Busa will serve as the principal.investigator for biology-related issues, particularly the.wetlands characterizationand delineation. The field operations manager, field geologist, and chief samplingtechnician have not yet been assigned to the project. However, Dames & Mooreemploys many individuals who are qualified to assume these roles. The resumes ofDames & Moore personnel who have either been named and assigned to this projector are candidates to be assigned are provided in Appendix C. 'All projectassignments will be filled-.when a start date for field work can be determined.
For the FS, John Osgood will continue, to serve as; the principal investigatorfor hydrogeoipgy. The engineering'aspects of the study will be led by chemicalengineer Robert O'Brien, P.E.: Identificatipn of the Federal, state, and localregulations. associated.. with, .cleanup alternatives will be performed by PhilStapleton, an enyirojnme_ntar.regula"tions specialist. Field work for the post-RI fieldsampling activities will_b_e performed by personnel to be named at a later date, butwill be selected from those whose resumes are" provided in Appendix C.
3.2" "SUBCONTRACTORS ;" ."_._„..__lu~ _, .. :. - - - .
Certain ~wo?£Titems that require specialized expertise or equipment will besubcontracted, to other firms by Dames <5c Moore. The subcontracting firmsselected are highly qualified in their respective areas of expertise. Chattahoochee-Geotechnical Consultants will provide drilling and well installation services.Geophysical logging will be performed by Appalachian Coal Survey, and Ge op robewill conduct borehole television logging of. the two existing production wells. EarthData will cpnduct_packer testing on the production wells. The survey~or on theproject will be 3. K. Timmons"& Associates. In the^event that, ambient aquatictoxicity testing is.required, this biological testing will be performed by EcologicalAnalysts. _ ..•"."-.-._. --_... '•'"'".-". - ::-" •--• -.•:"•;• -
3-3
CompuCh.eml.Laboratories, an EPA Contract Laboratory Program (CLP)'participant, will be the primary 'subcontract laboratory. CompuChem will performall CLP analyses and may perform selected aon-CLP analyses. CompuChem hassubcontracted arrangements with two other laboratories for non-CLP analyses theychoose'not to perform or are unable to perform in-house. These two laboratoriesare ChemWest Analytical Laboratories and Northeastern Analytical Corporation.ChemWest is an EPA Region Ill-certified dioxin laboratory. A list of thesubcontractors is provided in Table 3-1, along with their respective addresses,phone numbers, and contact persons.
33 QUALITY ASSURANCE.ORGANIZATION ~.
As previously stated, Surya Prasad, Ph.D., will serve as the Quality AssuranceOfficer""for" this project and will have overall responsibility for QA. AssistingDr. Prasad at the laboratory level will be Robert E, Mei.erer and Bob Whitehead of:CompuChem Laboratories. . Mr. Meirer is the laboratory's Quality AssuranceDirector, and Mr. Whitehead is the Quality Assurance Manager. Together they areresponsible for ensuring that the laboratory follows prescribed QC" procedures.Mr. Meierer::aisQ.directs audits and certifications of CompuChem's subcontractinglaboratories to ensure! ..that they meet CompuChem's .standards for precision,accuracy, and quality control. CompuChem's management organization is shown inthe organization charts presented in Section V of their Quality Assurance Plan.Other specific quality as sura nee; roles and the personnel assigned to these projectpositions areJisted in Table 3-2.
3.4 U.5. ENVIRONMENTAL PROTECTION AGENCY OVERSIGHT
Employees./of the EPA or EPA-authorized representatives may be presentonsite:during the field inve.stigation_topb_serve the...conduct and progress of theinvestigation. 5uch_persons may observe the work in progress and will be affordedthe opportunity to- inspect and copy field records at the.end of each day's work.Oversight .personnel may also collect split or duplicate samples of any samplescollected during the field investigation. Oversight activities will be conducted in amanner that does not impede :the orderly conduct or progress of. the fieldinvestigation. :'Dames ^C-Moore.!will submit requests, to receive copies of EPAoversight reports as deemed appropriate.
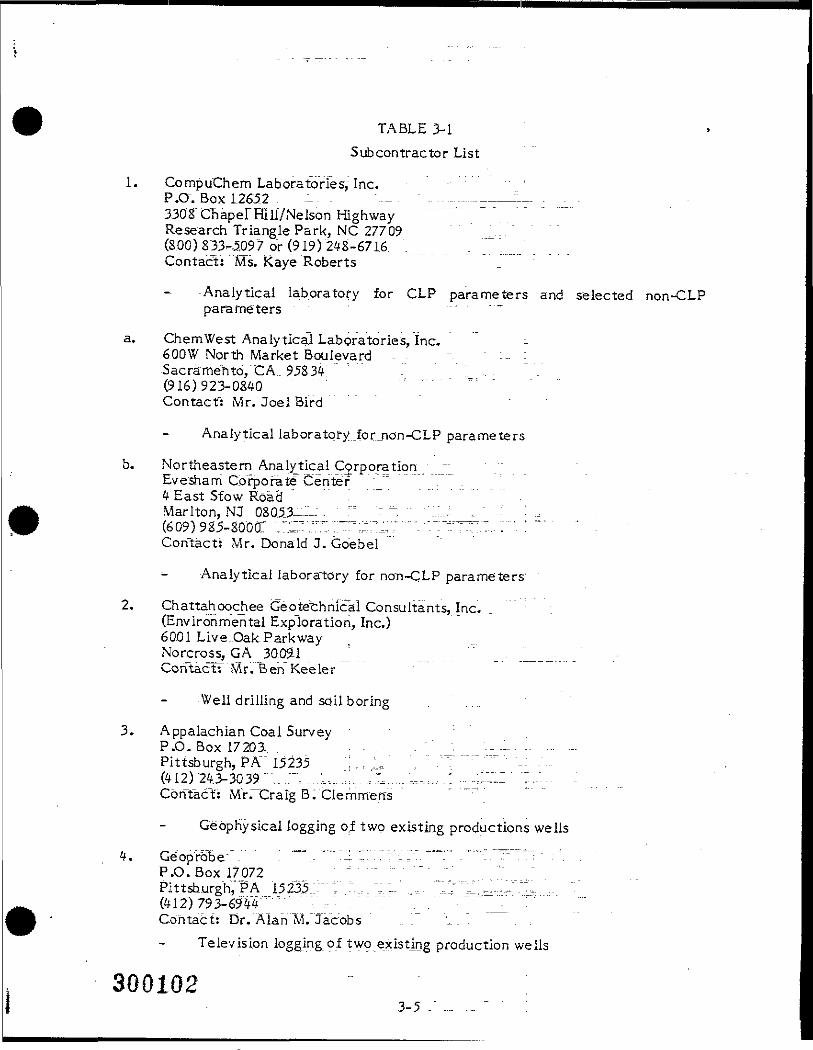
TABLE 3-1Subcontractor List
1. CompuChem Laboratories, Inc. :P.a. Box 1.2652 --- - — -----------——-- - •3308 Chapel Hill/Nelson HighwayResearch Triangle Park, NC 27709(800)833-5=097 or (919)243-6716 . . '~~\Contact: Ms. Kaye Roberts
Analytical laboratory for CLP parameters and selected non-CLPparameters . . . . - _
a. ChemWest Analytical Laboratories, Inc. -6QOW North Market Boulevard - - "- -- :-Sacramento, "CA 95834 " ." " " " _ . .(916)923-0840 ; . . . . , , .Contact: Mr. Joel Bird : " "" :
Analytical laboratpry._for._non-CLP parameters
b. Northeastern Analytical Corporation • ~ -Evesham Corporate "Center' ~ '_J="4 East Stow Road " '. "Marlton, NJ 080.53---:. r= : . " "'.".: -" .:' : :_-(609)9S5-sooa: ;::;":":~;::;.::':'-'. V": :;.:;;;T..;"'. : * ' .Contact: Mr. Donald J. Go'ebel
Analytical laboratory for_no"n-CLP parameters
2. Chattahoochee Geotechnical Consultants,. Inc. :(Environmental Exploration, Inc.)6001 Live..OakParkwayNorcross, GA 30021 _' 1__CoritacfT Mr. Ben Keeler
Well drilling and soil boring
3. Appalachian Coal Survey : :"P.O. Box 1720i. . . . . . . . . . . . ...:" _, "..-.. .. ... -Pittsburgh, PA"" 15235 ". . "- -: -:.,---,-. .^. .(412)24:3-3039"';. r,.........:.l..;.;.._.;..,.: ...i ;:.--. :Contact: Mr.~~Craig B. Clemmen"s
Geophysical logging of two existing productions wells
4. Ge op "robe"" - " - ~~.- -~ ~- - • "":- ="-- " "- • """-- "; ~ ~"^P.O. Box.17072 . , . . . - , . . - . . .PittshurgKPA 15235.::" T :._ -;."- ..,- "^"rV. -.1""".. .(412)793-6944 ~ " ~, ,- . : _ : "Contact: Dr. Alan M. Jacobs ... 1. .
Television logging of two existing production wells
3-5
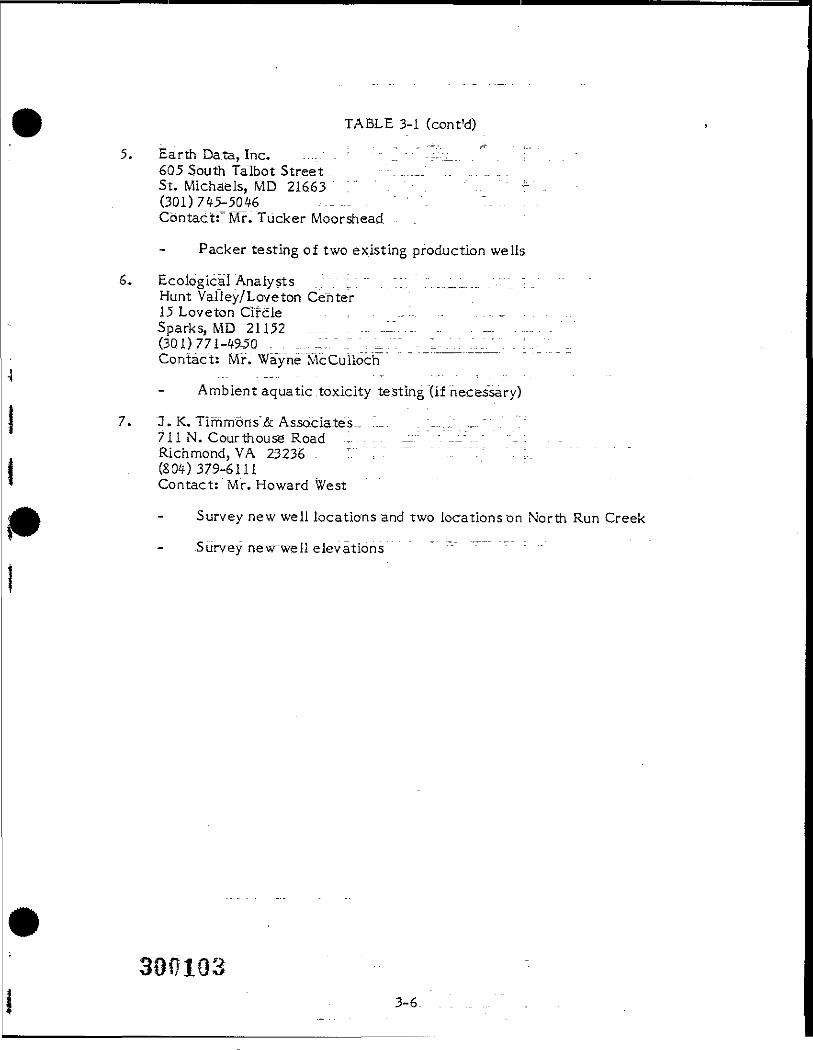
TABLE 3-1 (cont'd)
5. Earth Data, Inc. -..-_.' - : " _. " -~'".L.. . . ;"605 South Talbot Street . _.._." .St. Michaels, MD 21663' '" ' . . ' .. L(301)745-5046 ,.- - -- :Contact:" Mr. Tucker Moorshead.
Packer testing of two existing production wells
6. Ecological Analysts .;.;;." . ";; ."...._.:...._. ."."-" ":.„ . ":Hunt Valiey/Loveton Center15 Loveton Circle . . . . . . - - . . - . = .Sparks,"MD "21152 .". _I.r.. : ... ....... .. _. ....... .(301)771-49 0 . . _...-.:.'.:'.,^.:~: - __^_1"..:..-" ..Contact: Mr. Wayne"McCull6ch.."
Ambient aquatic .toxicity testing (if necessary)
7. J. K. Timm6ns"& As5o.cia.tes-, ~.~. . " — .... .,-. " . ";711 N. Courthouse" Road .;..... — -" ' -'"---...- " % : . _Richmond,VA 23236 . :.::...._..: ".:.:..":"" ".":. ".(8 4)379-6111 ;Contact: Mr. Howard West
Survey new well locations and two locations on North Run Creek
-Survey new~well elevations '2~-~ ~ "
3001033-6.
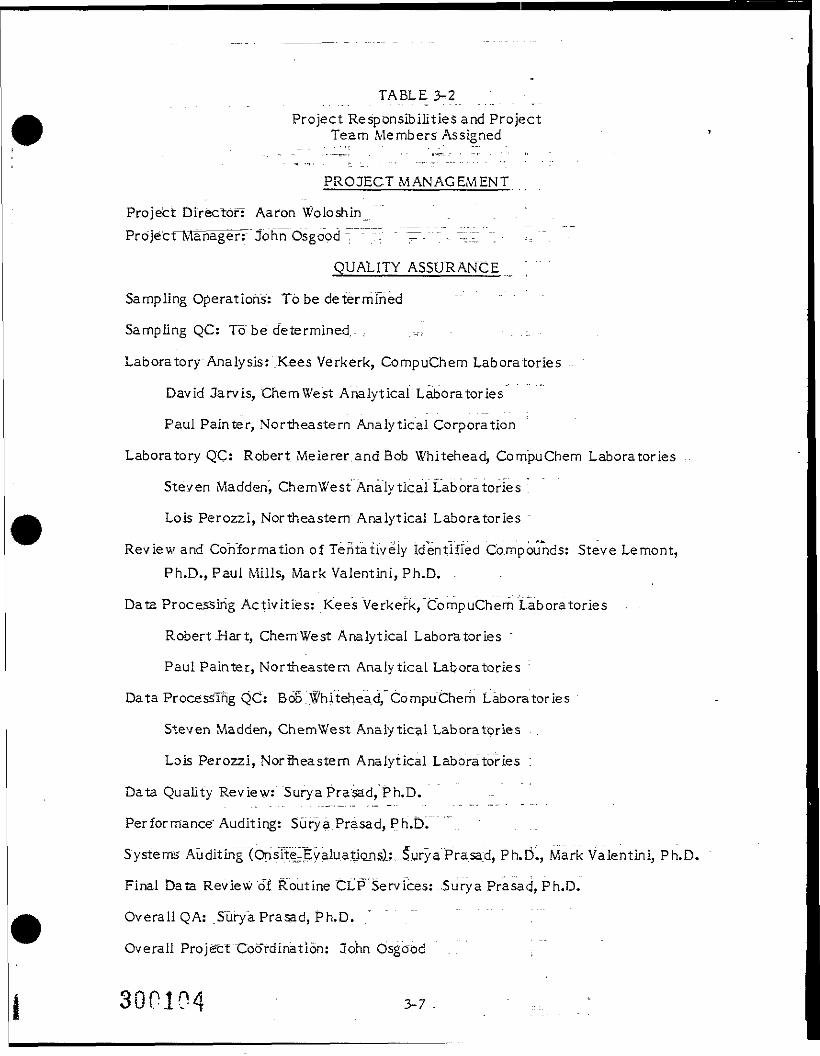
TABLE.Project Responsibilities and Project
Team Members Assigned
PROJECT MANAGEMENT
Project Director: Aaron Woloshin_ProjectTMahager:" John Osgood ~ " ;;:" " ~p~""_ -.. ~iZ -~ • == "".
QUALITY ASSURANCE ;
Sampling Operations: To be determined
Sampling QC: To be determined- : .-_-,. -..:.-
Laboratory Analysis: ...Kees Verkerk, CompuChem Laboratories ..
David Jarvis, ChemWest Analytical Laboratories
Paul Painter, Northeastern Analytical Corporation
Laboratory QC: Robert.Meiererand Bob Whitehead, CompuChem Laboratories ...
Steven Madden, ChemWest'Analytical Laboratories :
Lois Perozzi, Northeastern Analytical Laboratories ~
Review and Conformation of Tentatively identified Compounds: Steve Lemont,Ph.D., Paul Mills, Mark Valentini, Ph.D. . _ -
Data Processing Activities: Kees "Verkerk, "CompuChem Laboratories . .
Robert-Hart, ChemWest Analytical Laboratories "
Paul Painter, Northeastern Analytical Laboratories :
Data Processing QC: Bo^.Whitehead," CompuChem Laboratories
Steven Madden, ChemWest Analytical Laboratories . . .
Lois Perozzi, Northeastern"Analytical Laboratories :
Data Quality Review: Surya Prasad, Ph.D.
Performance" Auditing: Surya.Prasad, Ph.D'. ..
Systems Auditing (Onsite_-E-yaiuatio_nsl:-...5urya Prasad, Ph.D., Mark Valentini, Ph.D.
Final Data Review of .Routine CLP Services: -.Surya Prasad, Ph.D.
Overall QA: .Surya Prasad, Ph.D. / '" ." ~ "" " '.'"
Overall Project"Coordination: John Osgood . . =
300104 3-7
QUALITY ASSURANCE OBJECTIVESFOR DATA MEASUREMENT
The development of appropriate data quality objectives is an importantaspect of the beginning stages of a_remedial investigation. After an initialassessment of the site has been made, the chemical parameters and media wheresamples will be_collected are identified. With this information, project personnelare in a position to consult with environmental testing laboratories and examinepublished literature on available testing methods. The Project Manager is thenable to select the appropriate testing methods with the knowledge of the precisionand accuracy "typically associated with the method.
Some of the chemical analyses to be performed for this project are coveredunder EPA's Contract Laboratory Program (CLP). Laboratories participating in theCLP must meet EPA's criteria-far performing analyses with prescribed accuracyand precision. Dames._& Moore has selected CompuChem Laboratories as theprimary laboratory for this.investigation. CompuChem is an EPA-certified CLPparticipating -laboratory. The quality assurance objectives for CLP datameasurement is provided in CompuChem Laboratories'. Quality Assurance Plan.Details.regarding the precision and accuracy to be expected from the CLP analysesare provided in Section 9' of CompuChem's QA Plan.
For non-CLP analyses, 1he" Project Manager has some discretion in selectingthe analytical procedures that he believes to be mos appropriate. AH of the.methods selected for non-CLP analyses are":either approved or sanctioned by EPA.The specific" method" numbers for the. non-CLP analyses are provided in Table 8-2—the section on analytical procedures. Dames & Moore has taken, the results onaccuracy and precision that can typically be met by state-of-the-art laboratories"..as the data quality objectives for non-CLP analyses. The objectives are provided inTable 4-1. The objectives are suitable for the anticipated concentrations of thelisted, parameters expected to .be found and, if met, would provide data withsuitable accuracy and precision for the treatability analysis.
A special non-CLP parame:ter is dioxins and furans. This difficult analysis isperformed by a relatively small number of. laboratories. ChemWest Analytical
Laboratories is and EPA Region III dioxin-certified laboratory. The precision andaccuracyattainable.for various isomers is discussed in their analysis SOP, which isprovided in Appendix" D. . _ . . . . . _ —
300105. . .. _.:. __...*ri__. ........ .. . .
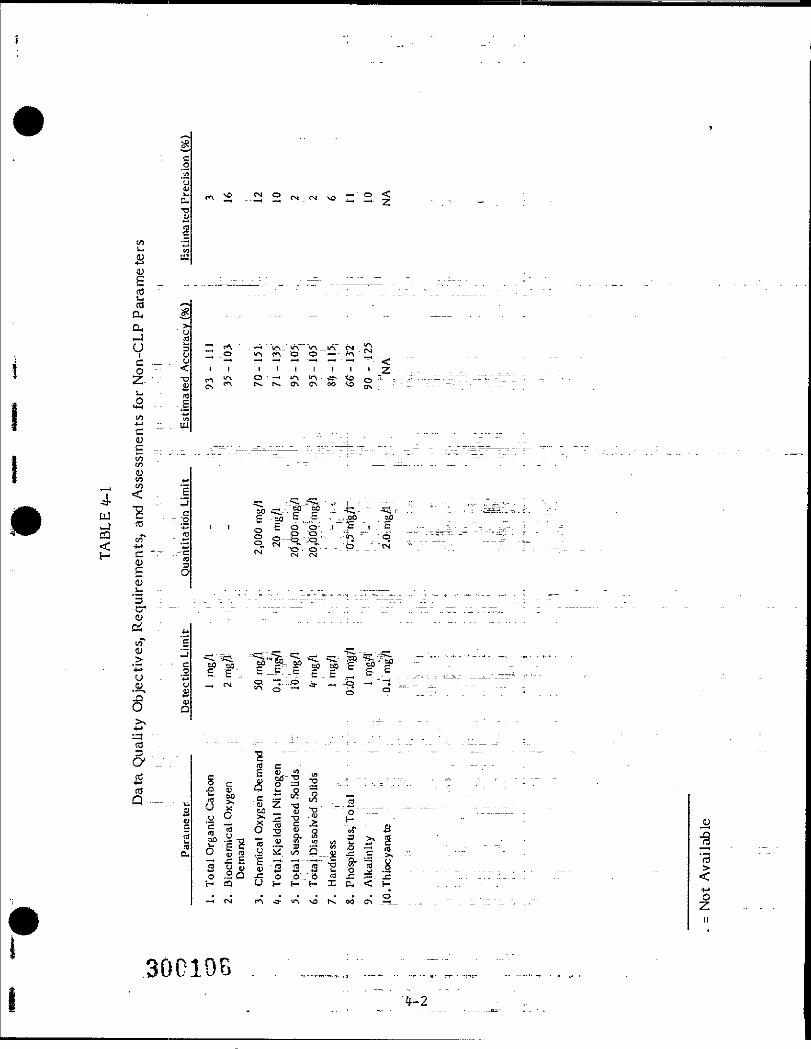
*
td "CLt <£
*~i U
V Ic -_ . • yo -_• ^-... .. _,,- " <o
. . _._I; .0 in ri o o —•
o - —i u-i <o: -a-"<Z
4 '< • Juj "S . .. %-j rt 33C3 — "3™1 cc - **«3T -t-* '*-r_^ C "" "C
« St- o-vs_CP
wT EO --;•s • §u *jO U*» -n GJ
O o
= ""s;" s Ec ~ o - -i i - , £ c j b ;
i (N - ~ - >-)- -o. o- - - - V5-^ (N CX
°" ^ C1 P ~ 2? CO OS fe
- ~ : ~5-- "-|
r * ~ ~ -** /
3cdQ ..__ • v.auc
<5flc.
g•e6_u'E03CO
O
3or"
«
CVBO
Xo"5 -
•i?Jc EU (t>-SOafN
•fi.mS
c"01to
"5u1-Cu("l
coCOoL.
z152."5.
13o
a-
w•u:=J?13V•DCOJg-3VI
Is6S-
iA
U)-•o=3
J?
•s
Dissolv
a6
M3
".- -
- "26 '
in3
« ^
T3 S"
^ SX Q.
rx oo
c .5.o o"<" \-tf< _-T!.
oZ11
300198D
4.1 ACCURACY DETERMINATION
Accuracy" pertains to the degree of agreement of a measurement or "anaverage of measurements of the same sample (X), with an accepted reference ortrue value (T). Accuracy can._be expressed as a difference (X-T), as a percentage((X-T/T)iOO), or as a ratio (X/T). The accuracy'of analytical techniques will bemonitored through the use of reference standards, matrix spike samples, andblanks. " " " "": ~ .—.—- ...-—-.-
For CLP analyses, reference standards are analyzed on a regular basis forEPA. The results of these analyses are satisfactory for establishing their accuracybefore consideration is "given to-possible interferences'" from this site's samplematrices or outside con'tamination sources. For ndn-CLP analyses, the analysis ofreference: standards is dictated by protocols established by the laboratories. Thisinformation is pfese'nted in Table 10-1 under Quality Control Checks.
Matrix spike samples will be run_ to determine whether or not the samplematrix "itself is interfering with the results of any analyses. Matrix spikes will berun for each analysis at the .rate of one per 20 determinations (i.e., 5 percent), ormore frequently if required by QC protocol.
Sample blanks will be run to determine whether or not contamination is beingintroduced-from an outside source other than the field samples. There are severaltypes of blanks that may be run including laboratory blanks, field equipment blanks,trip blanks, etc. The blanks thatare run are usually related to points where samplecontamination's suspecte'd of occurring or is most likely to occur. Laboratoryblanks will be run a.t the EP.A-required rate .for CLP analyses, or as shown in Table10-1 for non-CLP analyses. Field equipment blanks will be obtained as per SOPB.III.7 arid run for the pieces of equipment involved.in sample collection. A tripblank will be_.sh.ipped with each sample cooler that contains-samples for volatileorganics analysis and also analyzed for volatiles. Analysis .of these blanks will givea-good indicatio'rfof whether or not interfering contaminants are being introducedat critical points ..during sample collection, shipping^and analysis.
4.2 PRECISION DETERMINATION
Precision is' a" rrie"asure~bf rhu.tiiCl agreement among" individual measurementsof the same prop"erry,"usually under prescribed similar conditions. Data precision is"evaluated by comparing results of samples anaiyzed__in duplicate. Duplicate
300107 4-3
samples will be collected, and analyzed at the rate of one duplicate per every 10.samples collected as indicated-in Table 4-2. The relative percent difference ofduplicates in each data set wiifbe compared with values previously found in thelab. ..._..._._....__..__...._...._ : : . . _ . . . . . . ... .: . .
4.3 COMPLETENESS ".:..:; '.. -~~. : --i:...:_...;_:::_/.. _Completeness is the measure of the amount of valid data obtained from a
measured system compared to the amount that was expected to be obtained undercorrect normal conditions.
For a remedial investigation, sufficient data must be collected to allow anassessment to be made on the extent of contamination. This assessment can onlybe.-made after any missing data from specified sampling locations are comparedwith the valid, usable data collected at other locations, in the study area. Forexample, if all of the samples collected from one. part of the study area were"missed," a significant data gas; would be present. This data gap would require thearea/where the.sa_mpies were missed to be resampled, even if the missed samplesrepresented a relatively small percentage of the total data, collection program. Onthe other hand, missed samples that were more evenly dispersed throughout theentire study area "might not result in a significant data group for the overall siteassessment. An assessment will be made following the-completion of the RI datacollection phase an"d a determination made regarding the need to resampie.Resampling might take place during the post-RI field sampling phase if the missingdata~do not seriously impede the progress of the RI. Final determinations on thecompleteness of the data will be made by the Project Manager with the approval ofthe EPA Compliance-Officer.
4.4 COMPARABILITY
Comparability expresses ;the confidence w.ith which one data set can becompared, to another. All data collection mechanisms proposed in the plan of studyare designed to produce comparable data. Procedures for field measurements areprovided in Section 6.0 to ensure that tests performed at various locations acrossthe site...are conducted using accepted procedures, in a manner consistent betweenlocations .and over time, and include appropriate QA/QC procedures (i.e., instru-ment calibration) to .ensure the validity of the data.- Any limitations on the
300108_. .4-4
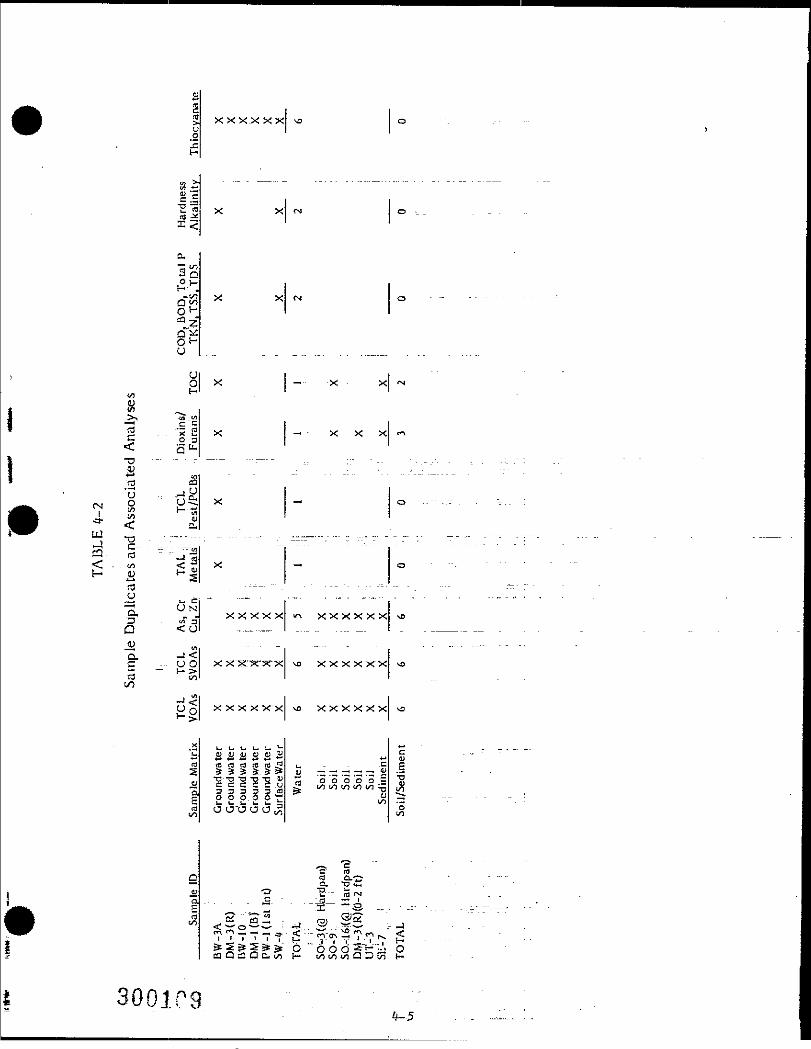
X XX X XX
c i
OV) *""
«>-, w .O
a "TIC ~ " rt< n"H-
X X X
_™
rt3
3 - </ _Q <O
-2, «Q. -J <C - - U O— = f- >ro to
V W~J ff
XXXXX
X
X X X X XX
XXX X X X
XXX XXX
X XX XXX
•O-TI "O -o'-g uc c £ c 2 .u3 3 3 D 3 ao o o. o o tHO U'OO (5,5
O O O O O =l/l l/l trt CO l/l -g
S
c tora CLO. T3" ' •
X— S"ra, ®2
^S a s gfc a- ' 6 "ooci s 'ti oQcaQD.wi J- "vj ui wi Q D tn H-
300109
comparability attest data-will.be noted, and test results will be evaluated on that'basis. _ . . . ' . - • ".;••" - ' " _;7\_ • - - - • • . - " - ; - " " _ - . " _
Sampling procedures for environmental matrices are provided in Section 5.0to ensure that samples are collected using accepted field techniques, in a mannerconsistent between locations and over time, and include appropriate QA/QCprocedures to ensure validity of the data^ ------ - _
All. water and sediment quality samples will be analyzed, using consistentprotocols for sample preservation, holding times, sample preparation, analyticalmethodology, and .QC as described in this.QAPjP.
Data will be reduced, reported, and documented consistently throughout thestudy. For. ..exarnple, water and., sediment quality data, will be reported using aconsistent set of units. Any 'deviations, from established protocols will be noted inthe data base so that data-comparability can be maintained.
4,5 REPRESENTATIVENESS ... . .. ...,.__.._ ,.-7 ;.___ ,..
Representativeness.." expresses?""the. .degree" to which data accurately andprecisely represent a characteristic of a population, parameter variations at asampling point, a process condition, or "an '"enviroKmentai condition. All fieldtesting and measurement procedures are. .designed to produce field data thatrepresent the-conditions found at the site. All sampling" efforts will be conductedfollowing'procedures designed for obtaining samples that are representative of thematrix from which it was taken.
30Cl
5.0 SAMPLING PROCEDURES
Samples will be taken in accordance with the SOPs described in Appendix B.Sample containers, preservation methods, and holding times are detailed in SOPB.III.9. Samples will be collected by Dames &.. Moo re's project staff personnel. Allsamples will be delivered to CompuChem Laboratories, ChemWest AnalyticalLaboratories, or Northeastern Analytical Corporation within 24 hours ofcollection.
A Field Data Record Sheet will be kept by Dames £ Moore's field staff. Thisform'1 will record sample identification number, sample station number, date andtime.of sample collection, sampling conditions, analysis to be performed, and anyrelevant comments.
5.1 -.GROUNDWATER ' .
Gfou fid water samples will be collected in accordance with the methodsdescribed in SOPs B JII .1, B .III .6, B JH .7, and BI~II.19.~~
5.2_ -SOIL - - . - ...... . _ . --.- — — . - - -
Soil samples will be collected in accordance "with SOPs BJII.4 and B JII.7. Soilsamples will be selected for "analysis by following SOP B.III.5.
5.3 SURFACE "WATER .'!!_" ..""'"."„." "...Surface water sampling procedures are'~described in SOP BJII.2. Sampling
equipment will be .cleaned and decontaminated before and after each samplecollection asi.described- in SOP B JII.6. Sample container, volume, preservation, andholding:_times are described in SOP B.III.9; equipment blank preparation is describedin SOP B JII.7.
5.4 BOTTOM SEDIMENTS ' --'- - ' " - - ' - '- - .--"-' -
Sediments "samples will be collected as described in SOP BJII.3. Otherapplicable SOPs are B.II1.6, BJII.7, B.HI.S, andB.III.9.
5.5 V BIO ASSESSMENT SAMPLING ' " _ _ . . , . . . ;
Sampling associated with assessments .of .aquatic life impacts will be con-ducted in accordance with SOP B'.V.l if found to be necessary.
_i
5.6" :.N.APL SAMPLING
Sampling of tfmntScibles, if "detected in wells, will be as described in SOP& .rn.15. •" •••-•.• "•-•• ..:.5 . 7 POST SAMPLING . - - . . . .
All water samples, will be field tested'.for temperature, pH, conductivity, Eh,and dissolved oxygen per SOPs BJV.2 through BJV.6. At the end of sampling, allcontainers "will be rinsed with distilled or organic-free, water, wiped clean anddried, marked with a waterproof marker and label, and stored in a CompuChemsample saver for shipment. Time," date, location, depthj sample type, and sampleidentification number will be recorded on the. label. Record keeping procedures aredetailed in SOP BJH.16. ".' ' "~~ ":":.":" ' -
Field observations and field test data will be recorded on the sample datarecords. These records and other pertinent field .information will be recorded inthe field log. : " :\"=L.__T_: 7" " .".""". • .. ;.
Field equipment blanks will be prepared per SOP B JII.7. At the end ofsample collection "at " each .sampling station, sampling devices will bedecontaminated and cleaned with deionized water as described in SOP BJII.6.
300112

6.0 SAMPLE CUSTODY
Sample custody is regulated and maintained through the chain-of -custodyprocedures. Chain of custody is the_ means by which . the possession and handling ofa -sample and its container will be traced from the source (field team) to its finaldestination, the laboratory. A sample is considered to be. in a person's custody if:It is actually in the person's possession, it is iri the person's view after being in hisor her possession, or it was in the person's possession and the person locked it up toprevent tampering. . . . . . . . . . .
Sample custody forms will be obtained from 'CompuChem Laboratories alongwith sample, containers. " The custody forms will be completed in the field byDames & Moore staff .and will accompany the samples until they are relinquished tothe. laboratory. An .example -of the chain-of -custody form is presented in
Sample custody will be carrie'd out in "accordance ;with "EPA 'NEIC Policiesand Procedures, Manual," May 197S, revised November 1984. Custody procedures atthe laboratories, are. detailed. in the individual laboratories' QA plans (Appendices E,F, and G). Sample containers "will be labeled with the following information on asample label such as: the one. shown in Figure 6-~2. •".... _ _
o Project name or number designationo Sample identification numbero Date of sample collectiono General type "of analysis to be done (i.e., Target Compound List (TCL)
, • volatiles, etc.).
A custody seal will be. : used when Dames & .Moore sampling personnelrelinquish the custo.dy of samples. This would include overnight couriers shippingsamplies to the,, lab oratory. An example oi.the custody seal is also shown inFigure 6-2. " " '." ~ -:""7 -..'-:'~~~-'--~l'.-- ' '.. :.--r'::; L'.:.- -'
6.1 -SAMPLE CONTAINER PREPARATION
Chain of. custody begins with the source and manner of preparation of allsample containers. Sample containers for the investigations under this project willbe.supplied by CorripuChem Laboratories. Procedures and associated QC protocolsfor container "cleaning are documented in CompuChem Laboratories. SOPs underCLP requirements. ~ .. -; .. ..~. -~ :~ ":__ ":..-:r: :.
300113 6-1
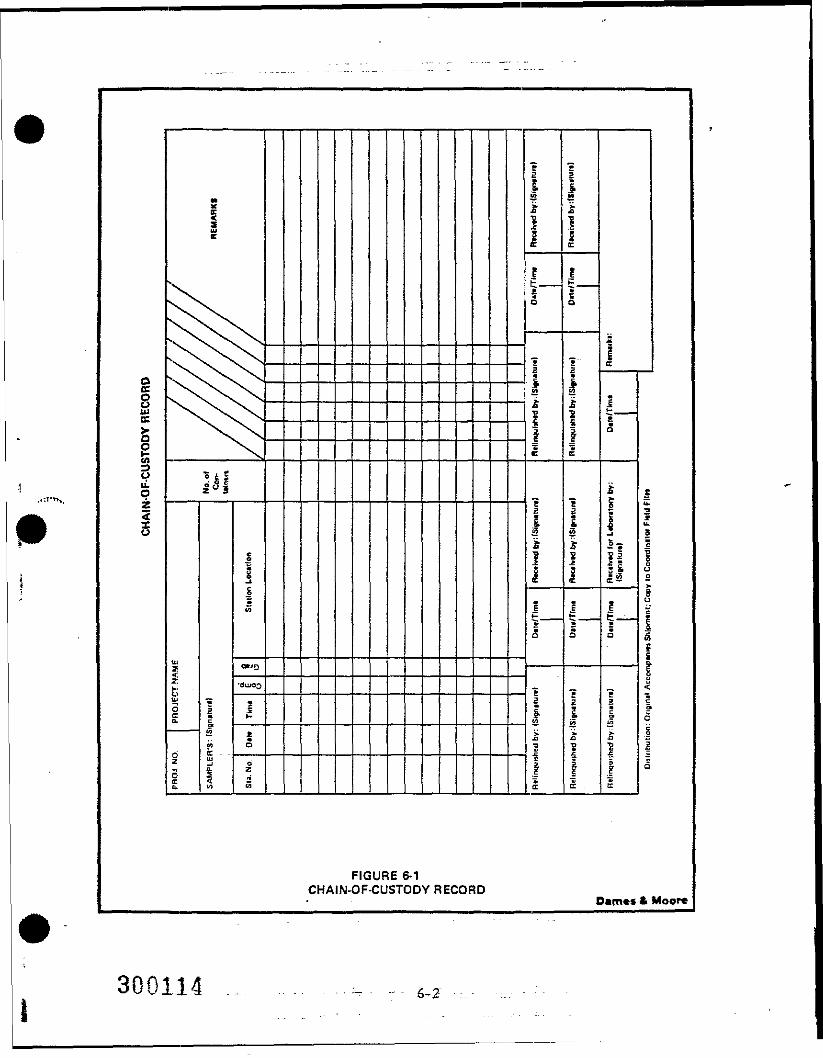
QCC8sI? «**S *JiZ-X
I i
e sB 3
s
t.3
I I
FIGURE 6-1CHAIN-OF-CUSTODY RECORD
D«m*s * Mooi*
300114 6-2
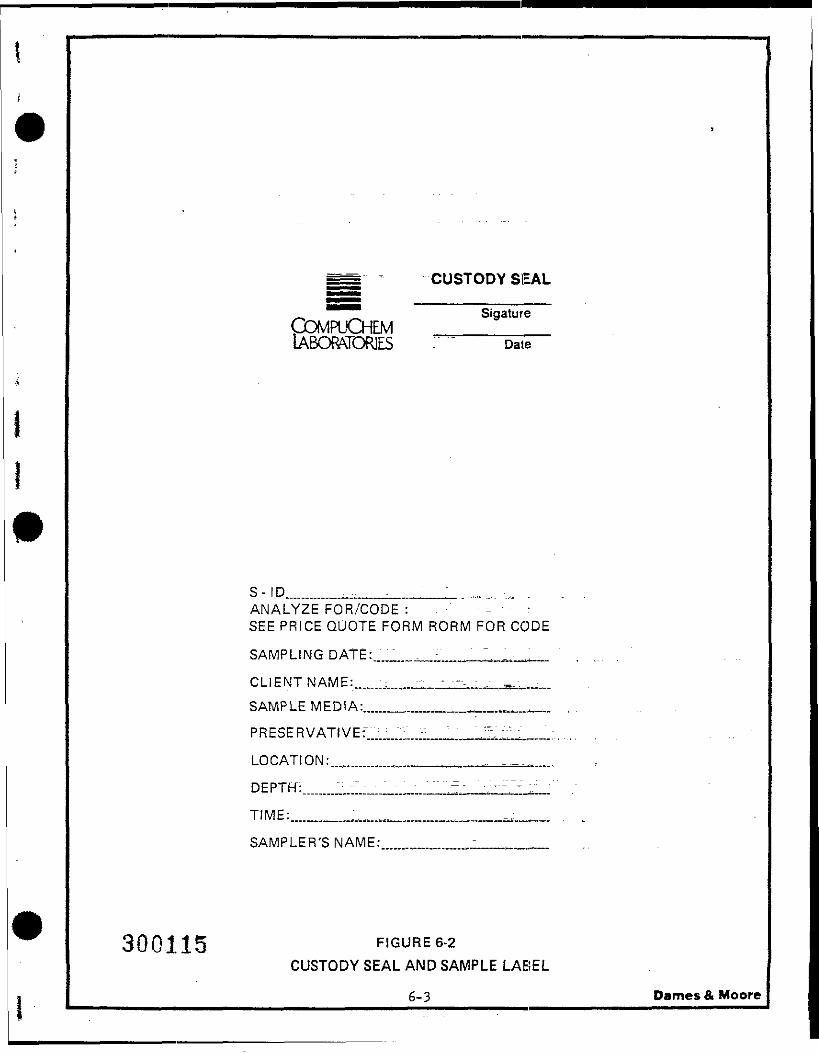
CUSTODY SEAL
^ _ SigatureOOMPUCHEM _______LABORATORIES "" " Date
S- ID_________________ ___ __ „„.,.. -..,. .ANALYZE FOR/CODE : - - - - - - - >.SEE PRICE QUOTE FORM RORM FOR CODE
SAMPLING DATE :____„__„____ __ ;....:. 1. „:_......
CLIENT NAME:.. .- : .,.;;: ,._-..->_.:. ...; .-. ...:...SAMPLE MEDIA:.....___ ___ _..,,. ...... . . . ..
LO CAT! 0 N :
DEPTK:
SAMPLER'S NAME:
300115 FIGURE 6-2CUSTODY SEAL AND SAMPLE LABEL
6-3 Dames & Moore
6.2 "-FIELD ._".. "~=" ." " .. - ... .- = •- -.-. ...
Dames & Moore :lieUd personnel are responsible for the custody of samplesfrom the time they are collected until they are transferred to the sample shipperor the laboratory. As few people as possible will handle the samples to minimizethe number of transfers. Basic chain-of-custody procedures for the project aregiven below. _ . .... ._.__ _._..._._.._ ,_ _.„._._. . _._=—.
Each sample collected will be -identified with a unique Dames & Mooresample number by affixing an adhesive, prenumbered label on the sample container.The -sample number and all sampling information, including sample preservationadditives, will be recorded in the field log. - -—- " " "
"The.sample will be placed on ice in a thermal chest. The chest will remainwithin the sampler's view or will be locked in the sampling vehicle for temporarystorage and transport to the sample staging a r e a . . " " " . "
Upon .arrival at the sample .staging area,' the sampler will rinse each samplecontainer" with organic-free' water to remov.e^any^exterior dirt. He will then fillout a chain-of^custody form to account for each sample. The Dames & Moore copyof the form will be retained as a permanent record in the project files. .
The sampler will sign and record the date and time in the appropriate blockof the fornn"to""relinquish custody. The sample shipper will then sign and record thedate "and time~in the appropriate-block to accept custody. This procedure will befollowed every time the samples are "transferred.
The sample shipper will ensure"that the samples are properly packaged in ice.chests for dispatch to the laboratory. Sample shipment procedures are discussed inSOP BJU.8. The sample shipper will sign and record the date and time in theappropriate block otthe form before the cooler is closed. The laboratory copies of.the custody formswill be;placed.in plastic bags"and taped to the inside cover of theappropriate cooler. The cooler will be sealed at each end with strapping tape. Onestran'd of tape will have..a Custody seal that is wrapped and secured around ail thelayers o|_.tape. " """ •--•- — — - -~-——
The samples.will be shipped., for next-day delivery by common carrier. Thesample .shipping receipt" will "be retained as part of the permanent chain-of-custodydocumentation. - .'.-• • _ " . . . . . .
When" the laboratory receives the_sampies, the chain^of-custody forms will be,signed and the date and time recorded by the laboratory sample custodian. Thesample custodian will immediately inspect the shipment for damage andcompleteness, and report any problems to the Dames <5c Moore sample shipper. Thelaboratory "sample custodian will then complete all the appropriate lab trackingsheets and logs. - _. _ . " " " . "i" : i:: " .-~",7~..._"_.... . .~
6.3 LABORATORIES . J .. „ J_V. _-,_ _ . 1.
The laboratory sample custodian is responsible for the custody of samplesfrorn the time o£ sample, receipt to the time of sample discard. The contractedanalytical laboratories have established .SOPs. for sample handling, storage, anddispersement for analysis/ These "are detailed in laboratory SOPs and includeexamples of the Sample Receiving "and Tracking Information Sheet, Sample LoggingSheets, and Laboratory Assignment Sheet, etc. : Samples will be shipped directlyfrom the field to the laboratory performing the analysis in order to minimizeshipping times and, thus, minirnizl5_the chance of hold .times being exceeded. .Thechain-of-custody procedures.employed by the..laboratories, are detailed in theirrespective Quality Assurance/Plans. . . . . . . .
300117 . _ .... _6-5
7.0 CALIBRATION PROCEDURES AND FREQUENCY
Calibration refers to the checking of physical measurement of both field andlaboratory~instruments_against accepted standards. It also refers to determiningthe response function, which is "the measured net signal as a function of the givenanalyte concentration for. an .analytical instrument. Both these determinationshave a significant impact on data quality and shall be performed regularly.
7.1 .FIELD INSTRUMENTS'" ." "..r.""_"_.",_'." ..-,.".. 1" .' ,
Field meters (including HNu meter, pH, conductivity, temperature, Eh anddissolved oxygen) for use. during sampling will be checked for calibration asdiscussed in SOPs BJV.l through BJV.6, respectively. For purposes of convenience,the -equipment calibratiorTand maintenance schedule ..for field instruments ispresented in Table 7-1. Calibration procedures for complex or sensitive instru-ments such as the HNu meter, will be those recommended by the respectivemanufacturers), unless experie"nce:;dictates a shorter interval. Where a manu-facturer-specified calibration interval for an" instrument was unavailable, one wasestablished -by Dames~& Moore. All calibration, maintenance, repair, and equip-ment usage will be recorded on .sampling/equipment log(s) maintainedby the Dames& Moore laboratory. Other information that will be recorded in log(s) include; thedate.an Instrument is calibrated, the person's.name who performs the calibration,and the. reference, standard(s) used.
7.2 LABORATORY IN5TRUMENt5'"AND STANDARDS '
Laboratory instruments used" for CLP analyses "will be calibrated and main-tained in accordance with CLP requirements. These requirements are discussed inSOPs available from CompuChem Laboratories. For non-CLP analyses, thecalibration requirements are. discussed in the.individual analytical method SOPsthat are presented in Appendix D. The most pertinent calibration information fromthe—SOPs (i.e., calibration frequency, apparatus, or solution calibrated, etc.) issummarized in Table 7-2.- '---^ -...-:--:-.:_ .-' -:-'
All laboratory calibration data will be recorded in laboratory notebooks.Such information will include the instrument being calibrated or titrant beingstandardized; the reference "standard being utilized including its source andstrength; the date of calibration; the person(s) performing the calibration; and anyother instrument-specific tuning'details.
300.118,,-_ ,,,,-„;-,.,.._..-,-=7=L.." '..- . _ .-.. ..
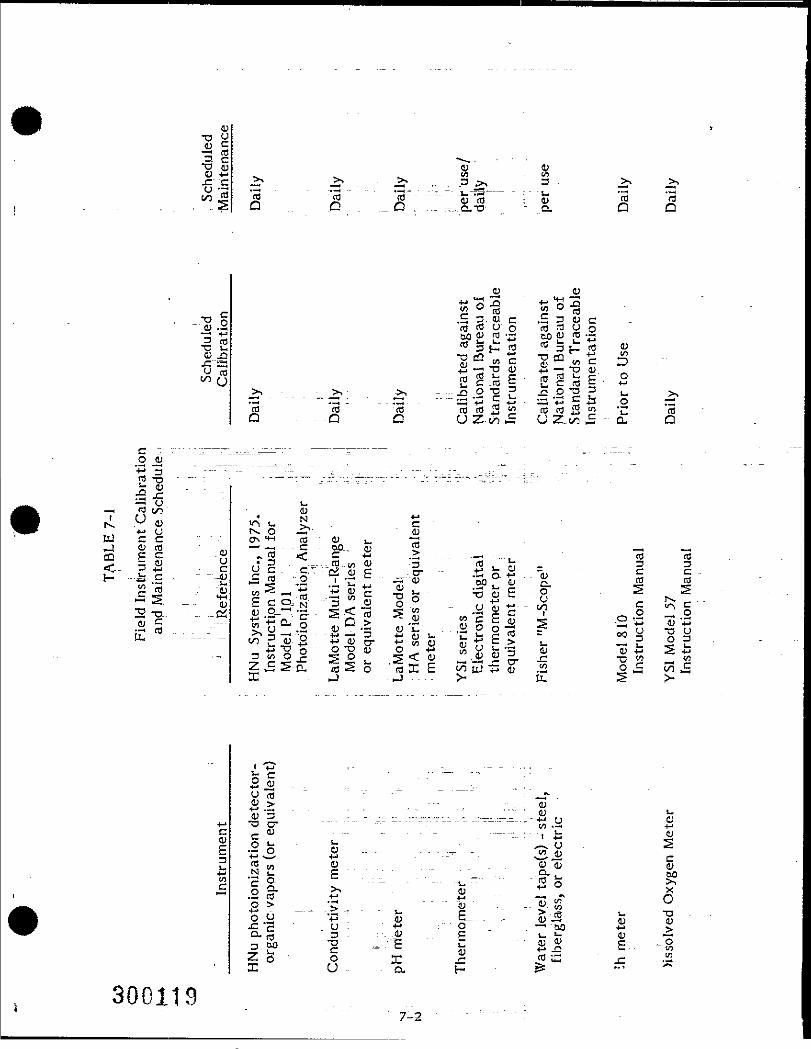
0)TJ 0
"O fljC +Jj=- c
(U 0)OT - Cfl3 >». . . 3
•i Sut/->
.5 3- « C .5 3<o <?. y o to fl
>> >. - - > 2 "2 -^S'H >-=;: • .. rj. . - - =3 •+3 S is = • =a •+: S -t" °(0 R3 c d c O S S c S f O S S ' u-D Q - U 2:-Jtn £ U Z,t/} £ -• cu
T3
rz! ——rd t/i
c c
•- _2 -U- _: .--OS
-:"
u. C C - -=O -S1 <L)*-* C3 UJ u, -rjI! < c" -M -S .. - . -^ ---. 13 "toa
«—' trt +J 9^ £• « I— - -M Cl E G
2-'.§ " "^ J? -2 ° -° -- o"1 S *-• - £'
till !l» III 1 1ll il HZr"-^T_ "S i^t I- ••'^-Jr- *— i— _J-CT ~ Sr^ B- i Sii S-a, «So nsXE t^nj^cj .2 o£ t>n£
u ">
I §= nsc '2 °Wl
2 CO -M- • 43O > ' . .. .__ _ _.. ..<UO ^ "^ i) C_c *e u : " •*-» : oQ_ tJ "1 (1> C
" ^Z '.->- - C
X U
3001197-2
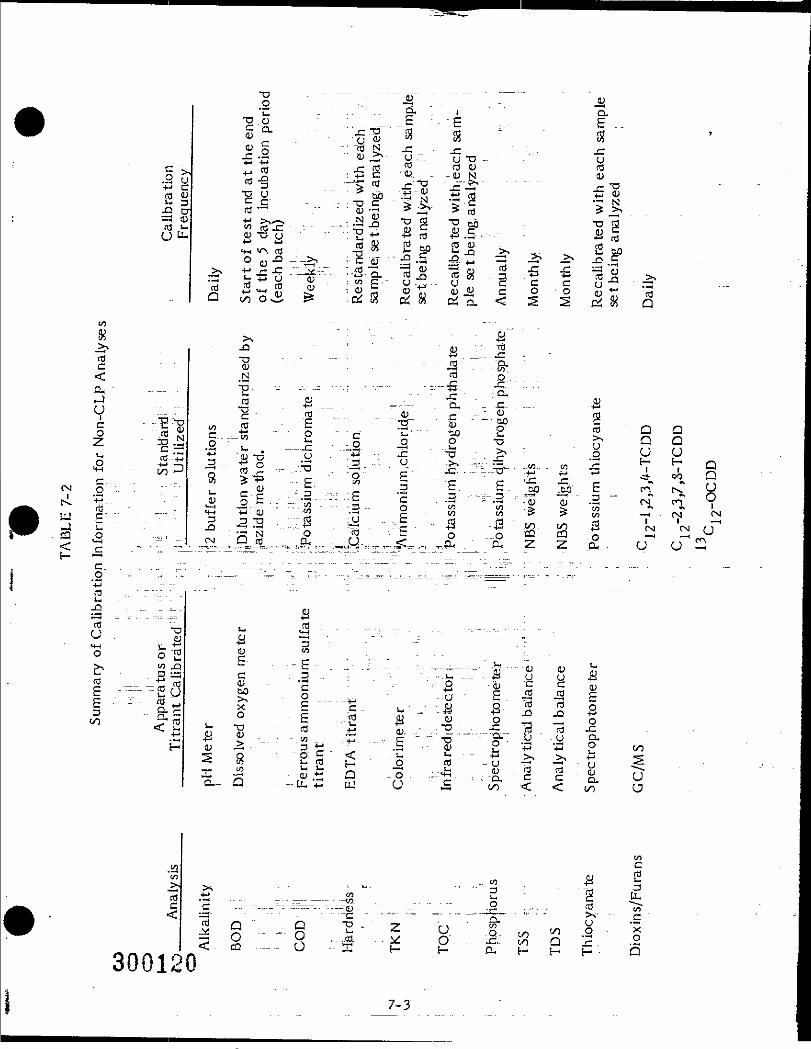
a, _ ,- -
d_c .xQ -. -° >L -C _ - - - - - - _ C
: £ C ""0>, - - fU N(S -•Q U
^o a a __^ - c sj- l . -a. =1 ^ ^ ^S l" "" :tf.-1 ^» -g -f f 'g
" " "
S > s . . . . . . . . | j>,
O, - - - - - --4U .:... :"° -a Nz E '-=«£ rt-VO -4-1 -HH ^ D
CM O .. - "" 7'. i T:
< 1c.
TUuJS
N CO
*2- ": " ""co ST3
.C ^ CLQ. - "-C..
c .fO _ . . . ._ .. O" n -1. 0 G!S ^ -"- "§ "•• -r- "•••?•-• S) £? m a ao"T^ u • o ° ° "° u Q Q*3 -^ - ~"-g . --^p- -- 3c . -a .: . _^ ; .9 P P
^ ^ T! •• E " ° r; ~ -p: c '^, —-. c 3s °^s_ r-11 _ - ; . . . , - .5 E - c - sp .to c en t-N.~ C - c . -J -r P J^ 3 ..-— 3 - ^H .—i ... — »> n
MH ^. • : r:. « - - - = 3 __ o " '« " " *« ~> S^ '« ^ ^ ~iS-. ^QJ V 5 . . - I a - - yj « i? > (X —i - (N CM3 ^^- —:. -^H J^ -- -. fc - $ .^ ^ ^ tO ' ' —(
" *~ o .... o is" CQ o —i —• J^- " cu. Z 2 a . O u 2
to :. •-:--•;:..c .... ..
3 """^'*S uO r>
c<H
C . 3 . . ; . - . -, ...j- ..... - u U
- . §...... - 'J - I l l"
£ .-^ $ " ' < ! > O 5. ^ O
« ^ p "- --' -o~~'•--•Q--; o " u a.3- C - <r- .5 - • - - g _ 2 -P '42 O o,
|S q -O. ,:-:|. ..."I -1 g - « U^ • ^ u - l U £ t / ) < < [ / i O
c<u 2_ ... . .. « -P 5r> ^ • • • - _ , -S
< a R" "" z °300120< "
:- --. - - 10 «< § .._: 8 -:.-£••-£ g"-- f • g a 2
8.0 ANALYTICAL PROCEDURES
S.I FIELD MEASUREMENTS ...,...._ ".. .,~\. ._.:-.
All field measurements: will be obtained in accordance with the SOPsdescribed for the HNu meter in BJV.l, for the pH meter in BJV.2, for theconductivity meter Tn~B~jY.3, for the thermometer in BJV.4, for the Eh meter inBJV.5, and for the dissolved oxygen meter in BJV.6,. The QA objectives forprecision ~artd accuracy of field water quality measurements are summarized inTable 8-1. All analyse_S-_tp be performed will follow the procedures described in theCompendium b"£ Superfuhd Operations Methods and manufacturers' instructionmanuals a.s.appropriate.
8.2 LABORATORY" ANALYTICAL "PROCEDURES'"' .
Laboratory analytical procedures will follow procedures given in Table S-2.These procedures either follow the CLP or are EPA approved. Table S-2 identifiesthe source "of .approval for each analytical group. EPA-approved non-CLPprocedures _were selected only where CLP procedures " do not exist for theparameters listed. .. . . .. -- - .._.....
Ail CLP analytical procedures .will be performed by CompuChem"Laboratorie.3. Most of the non-CLP analyses will be subcontracted by CompuChemto Chem.West Analytical Laboratories and Northeastern Analytical Laboratories.The laboratory proposed for each non-CLP analysis is presented in Table S-2. TheSOPs for the non-CLP .analyses are "presented in Appendix D. The laboratories...Individual quality assurance plans" have been incorporated into the QAPjP asAppendices E, F, and G.""Theserplans have been sent to EPA under separate coverfor review and approval.
0121.
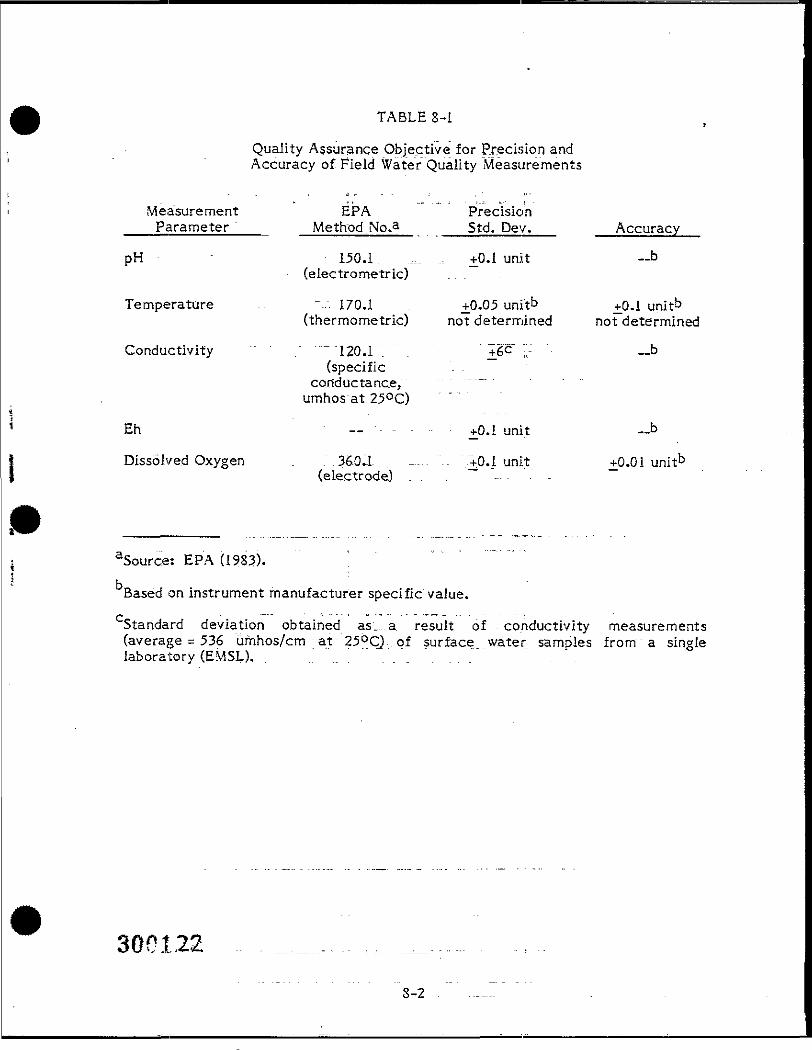
TABLE S-i
Quality Assurance Objective for Precision andAccuracy of Field Water Quality Measurements
Measurement EPA PrecisionParameter Method No.a Std. Dev. Accuracy
pH 150.1 _ ., +0.1 unit -b(electro me trie)
Temperature - - '-.. 170.1 . +p.05 unit0 +p.l unit0(thermometric) not determined not determined
Conductivity / = 120.1 T "" . " ±6C ;;- , __b(specific
conductance, ""umhos at 25°C)
Eh • „ - . . . _ . . . 0.1-unit — b
Dissolved Oxygen . 36.0.1 , -.'.. "... ".. 0.1 unit ±0.01 unitb(electrode) . . . . . . . . . . . . .
aSource: EPA (1983).bBased on instrument manufacturer specific value.
Standard deviation obtained as_..a result of conductivity measurements(average = 536 umhos/cm at 25°Q) of surface, .water samples from a singlelaboratory (EMSL).
0122
S-2
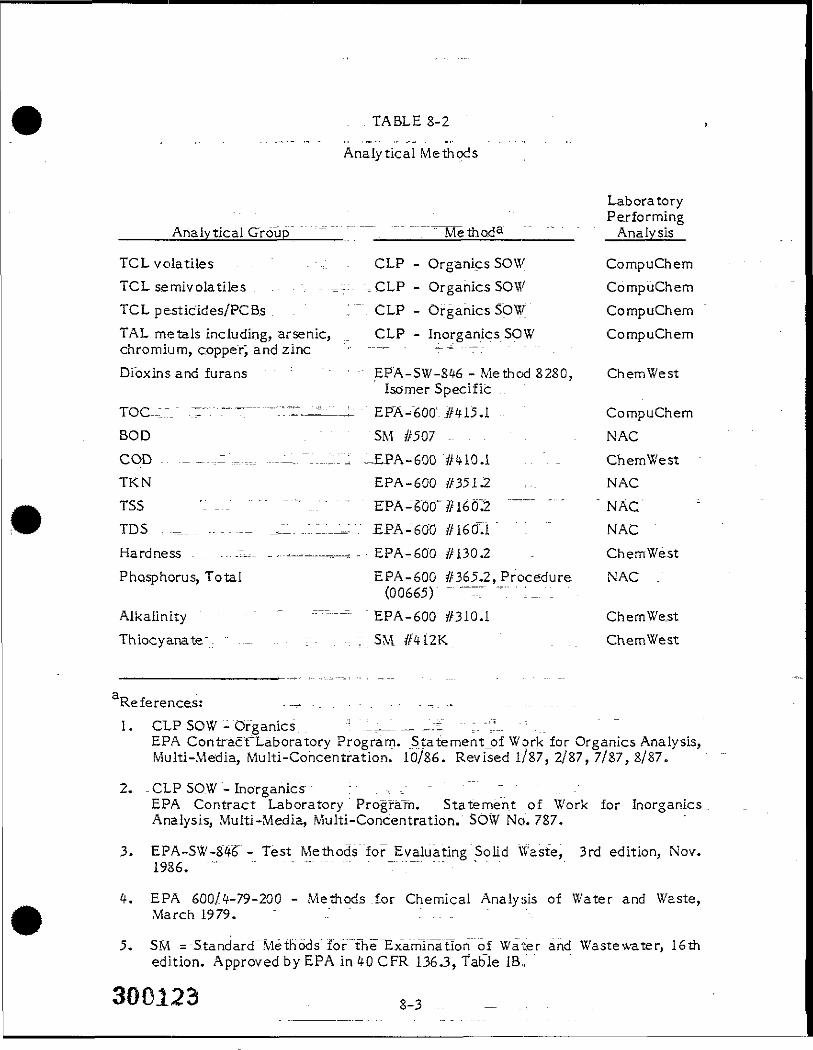
. TABLE S-2
Analytical Methods - ;
Laboratory' __ Performing
_____ Analytical Group . "' Method5 Analysis
TCL volatiles - : CLP - Organics SOW CompuChemTCL semi volatiles . . - ", ...._-:. .= CLP - Organics SOW CompuChemTCL pesticides/PCBs . I". CLP - Organics SOW CompuChemTAL metals including, arsenic, CLP - Inorganics SOW CompuChemchromium, copper^ and zinc " "~^ r^ --r.-Dioxins and furans : "" •- EPA-SW-S46 - Method S2SO, ChemWest
Isomer Specific ..:_~ .TV "~"T~~"~™-- — "" EPA-600:. #415.1 .. CompuChem
B O D S M #507 . . . - • . N A CCOD.. ._-.,^__ ..._. ~J._j;j ^_EPA-60G #410.1 -- ". - ChemWestTKN EPA-600 #351.2 -.-. NACTSS ': -.- " "" ...."" ^ EPA-600 #160"2 """" "" " NAC.'TDS = ._. . ,.....— _i. ..:.::..._:. £pA-"60"o "#i6ou" " : " " NACHardness ,.__. ...~ - _,..,-—_-,.. EPA- 60:0 #130.2 . ChemWestPhosphorus, Total EPA-600 #365,2, Procedure NAC .
(00665) ~- -:.' " :_ :AikaUnity "" " ----- " EPA-600 #3104 ChemWestThiocyanate": ..- .."- ~- . ;:.SM_ #412K. . .. ChemWest
References: — - . . - - . - - . . - - ..-•.-.-.•-...•1. CLP SOW - Organics . "": .1 1. _ _J:1 -.;.. ::2_ "I ... . " ~
EPA ContracTLaboratory Program." Statement_of Work for Organics Analysis,Multi-Media, Multi-Concentration. 10/86. Revised 1/87, 2/87, 7/S7, S/87.
2. - CLP SO.W-Inorganics : .-,.." "" "EPA Contract Laboratory Program. Statement of Work for InorganicsAnalysis, Multi-Media, Multi-Concentration. SOW No. 787.
3. EPA-SW-S4S" - Test Methods "for Evaluating "Solid Waste, 3rd edition, Nov.1986. ""' " "" "" "' •' "" ":"•" - - . ' • •
4. EPA 600/4-79-200 - Methods .for Chemical Analysis of Water and Waste,March 1979. " - . .
5. SM =-Standard"Methods for the Examination o_f Water and Wastewater, 16thedition. Approved by EPA in 40 CFR 136.3, Table IB,
8-3
9.0 DATA REDUCTION, VALIDATION, AND REPORTING
The final link in the data acquisition chain is the conversion of raw laboratorydata to a final valid and usable form. This process begins when samples arecollected and a chain-of-custody form is filled, out, and ends after the datareported by the .laboratory is independently validated. The steps involved in this.process are discussed below. .. _ . . _ . . .
9.1 DATA REDUCTION
Data reduction is the process".of converting raw laboratory data into a formusable by engineers and scientist working on. the ..project. This form is generally anexpression of the concentration of .the constituent being analyzed in the samplemedium. Concentrations a"re:'determined through the use of mathematical formulasthat utilize .the raw laboratory data as input. These formulas are expressed in thespecific SOPs for each^analysis. The SOPs used for CLP analyses follow CLPprotocol and are available from CompuChem Laboratories upon request. The SOPsfor non-CLP analyses are ""provided in Appendix D to this QAPjP. Data reductionwill be performed by the analyst.who conducted the analysis.
9.2 .DATA VALIDATION
Data .validation is.... the overall process, .of .determining whether or notlaboratory data meet quality control requirements and are usable. EPA hasdeveloped a-p"rocedure to. validate data, which can be, found in their series ofdocuments generally titled "Laboratory Data Validation Functions Guidelines."These;"documents provide thorough discus_sions of the validation process and will befollowed by the Quality Assurance Officer land .laboratory Quality AssuranceManagers involved in data validation. "" L "-_'." ~.
To surhrnarizeTthe information provided in the functional guidelines for datavalidation documents, the following items will be checked during the validationprocess;: """ .:: ": - - - - - - - - - --—-,.. -—-, ..._....
o Chain-of-CuSKfdy - Is the custody of samples accounted for at alltimes? ."."' "''." = . . ; " . . . ; .
o Hold Time -• Were :hold times ex.ceed_ed for any samples prior toanalysis?
30012.49-1
o Calibration - Was the instrument properly calibrated before an analysis,_ was conducted? T ... . .
o Blanks - Was contamination detec.te_d..in blank samples?
o Matrix Spikes - Does the sample matrix interfere with the analysis?
o Reference Standards - Is the analysis being performed within prescribed-accuracy limits? _
o Field Duplicates - Is adequate overall precision being obtained?
o " Laboratory Duplicates--- Is .the laboratory analysis being conducted withadequate precision?
o ;: Detection/QuanTitationTTmit"- Do the results being reported fall withinthe prescribed range'for the method?
o Tentatively Identified-Qrganic^Cbrripbunds ~- Has a second opinion been.obtained on the interpretation of laboratory data where organiccompounds are tentatively identified?
o Data Reduction - Have the mathematical formulas used to reduce thedata been applied properly?
that fails QC requirements" will be flagged. However, all data will bereported (w'ith flags) regardless of. whether or not_they pass QC requirements.Data that cannot fae_v.aiidated may still be quite useful in making some judgementsabout the site, "and give". RI personnel some insight when planning follow-upsampling programs," .; " ".. " _ _ T: '/""" .~"'T~" ; ' r.
Data validation will initially be performed in-house by the Quality AssuranceManagers of,.the individual laboratories that performed the analysis. All data, bothraw and final, will be sent to. ""and assembled by CompuCh.em Laboratories.C3"fhpuChem will proof,the data-obtained from subcontractor laboratories and do aspot check of the data's validity. A consistently formatted data package will besent to Dame~s &. Moore's Quality" Assurance .Officer,. Dames & Moore willthoroughly review all data following the .data validation functional guidelines.Data .that cannot be validated will be sent back to CompuChem for an explanationif necessary^ '" " •--•--: __^_ .:!"""::':.-"" "... :.. :V : ./
9.3 -DATA REPORTING" ^ v_ ".',".7. ......—~ . . ~ -- -All of-the pertinent data -associated with an analysis will be-reported. Data
will initially be recorded in laboratory notebooks and. then transferred to a draft
300125 -9-2
hard copy." After in-hou.se data reduction and .validation, a hard copy of the final*data will be. sent to CompuChem Laboratories along with any backup documenta-tion. CompuChem. will put their own data and data from their subcontractinglaboratories in.a consistent format. The final data will be entered onto magneticcomputer diskettes for long term storage, and hard copies will be genera ted. Hardcopies, Copies of the data diskettes, and the raw backup data will all be sent .toDames & Moore .for independent validation. Where questions arise, data will be-.sent back to CompuChem or their subcontracting laboratories for comparison withthe originally recorded .data in the. laboratory, .notebooks.. All final data^and QCresults will be included in the final RI report.
Field data from" aquifeT testing "(i.e., pumping)" "will be reduced .using appro-priate formulae used in standard hydrogeoiogical investigations. All calculationswill be documented ..with raw data "and the methodology recorded. Results will bechecked by the project hydrogeologist for accuracy" and reasonableness within therange of expected parameter values. . . . . . . . -.- .:
9-3
10.0 QUALITY CONTROL CHECKS
Internal QC checks will involve .both field checks and laboratory checks.Field checks will consist of analyses of county-supplied water (used for steamcleaning and certain drilling operations), field blanks, field duplicates, and tripblanks. A field blank will be. prepared for each sample matrix (per SOP B JII.7) toverify sample equipment decontamination. One trip blank (TCL volatiles) will beanalyzed for each day's shipment of samples, ' . ~
Laboratory QC checks..consist of analyzing reference stndards, matrix spikesand matrix spike duplicates, laboratory blanks, and laboratory duplicates. For CLPanalyses, the rate at which these QC samples are run are specified by QC protocol.For non-CLP analyses, the laboratories and Dames & Moore have established theQC protocol for the applicable analyses. The specific.QC requirements for thenon-CLP analyses, are summarized.in Table 10-1.
For ribn-CLP parameters," ConTpuChem" Laboratories runs its'own certifica-tion program'for suScpntractor laboratories.' CompuChem sends these laboratoriesreferences-standards that they must analyze with sufficient accuracy and precision'to satisfy CompTjChem's requirements. " Both of the laboratories identified assubcontractors to C6mp;uCherrrfor this project participate in CompuChem's certi-fication program.' 'The CompuChem-certified parameters for each laboratory arelisted" in Table'10-2. -., .. :- .:- -." —^ -—;.,Y---:-
EPA may conduct ...its owrrexternal QC check by splitting collected samples.for analysis by__an independent laboratory. Should EPA_choose to split samples,Dames & Mooreiwill request to receive these analytical results for comparativepurposes,_ ____„.- ... • " - -^--.i-- : - _- : :
300127 10-1
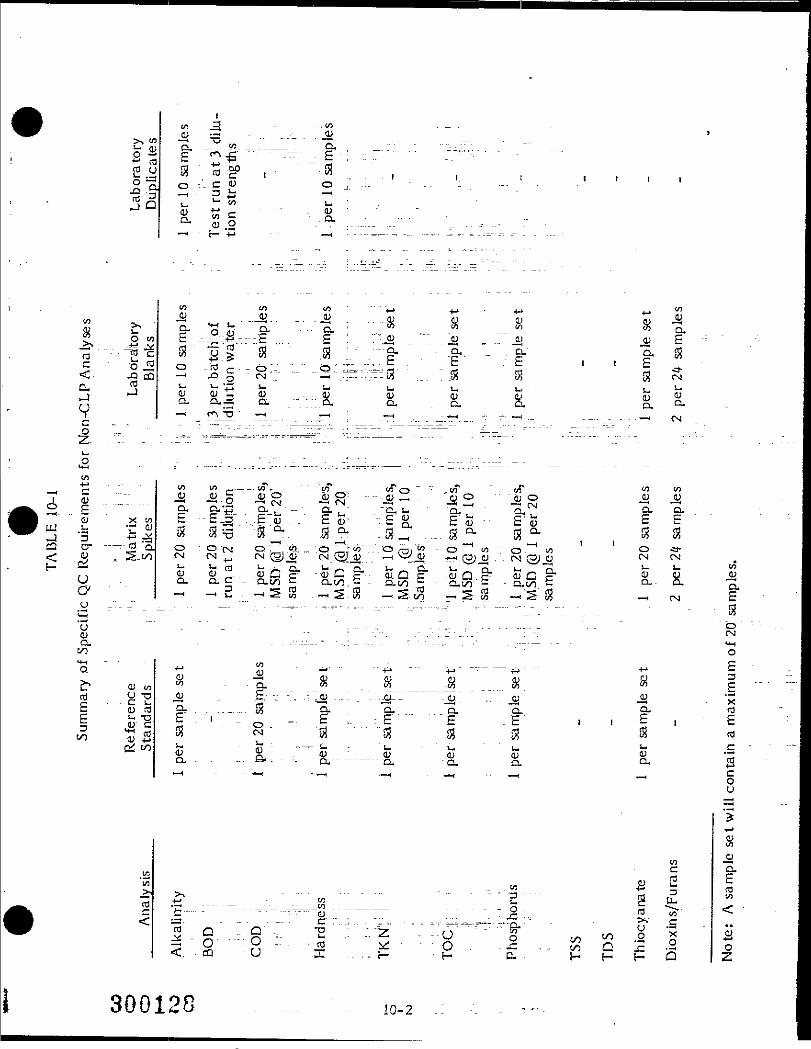
o - °-1- .o *
flc< .
VC
O
->s 'I—O coJ-J jy
13 c
4) X toUJ !_ - - C D-J 3 •+- CQ CT ——r O. Q,
£ -£ - Sj
CJCL
y ~°C L,(U fl.0) C
I t I I
E-
<D E
f-(L> Oj5. M.
v_ i • * ' ' -^^ <__r *"^Q. . - a. • -a. s- a. - a,e: .-• £ £: .--'.E E 'S3 - - E'
o : p -{Nj o.(N (M _, fN (N
Q.H;
o
3Ja, Q. *o_ 9- fl£" " E .£ , i £ , £fl. 3 fl $, fnto yi tfi w *w
V <D <U &"Q. ' ' £. O.. CX
«^ >>cd
£=•< . . .
< .8 -8 -• .5 ....g "-g • •£
300120 10_2
SJ•*->
i>sU• -^JZH
cfdt.
£:.._c'xoQ
CO
JJ"H.£fd
<
aj•*"*2
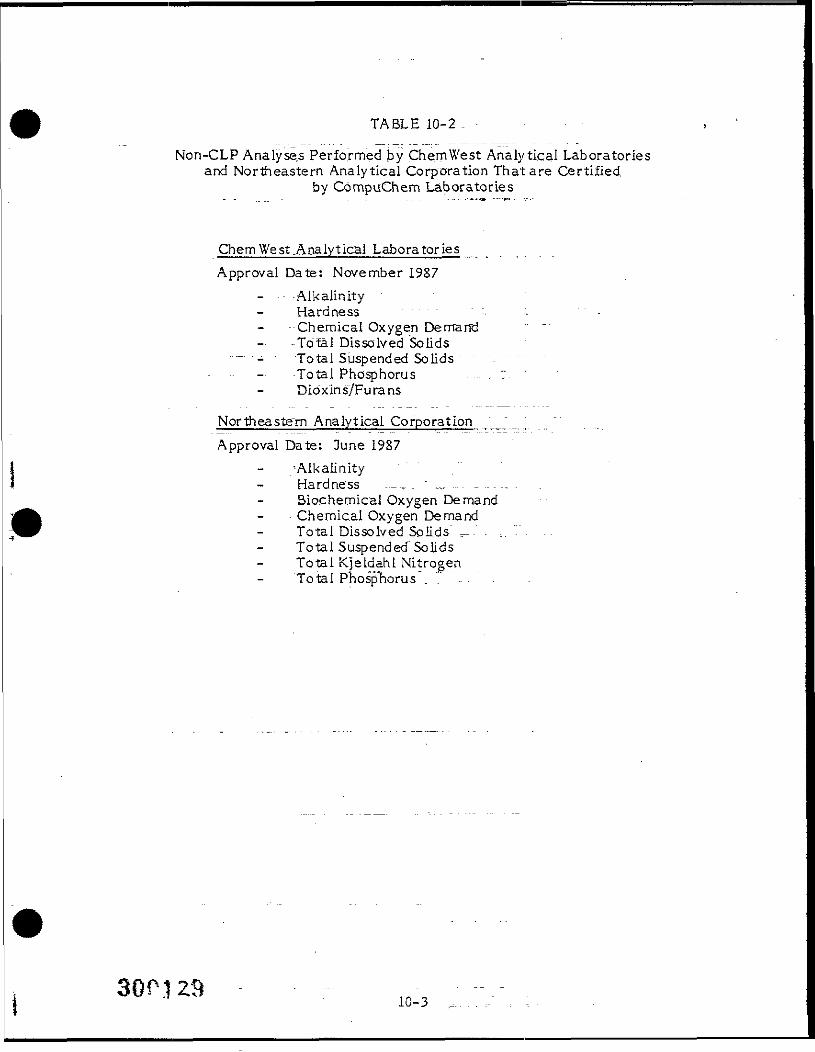
*
TABLE 10-2 . -
Non-CLP Analyses Performed by ChemWest Analytical Laboratoriesand Northeastern Analytical Corporation That are Certified.
by CompuChem Laboratories
Chem We st _Ana.lyt leal Labora tor iesApproval Date: November 1987
- - -AlkalinityHardness - - - - - :Chemical Oxygen DemandTotal Dissolved Solids -
••— - Total Suspended Solids-Total Phosphorus . - ,Diox'ins/Furans
Northeastern Analytical CorporationApproval Date: 3une 1987
/AlkalinityHardness ._.„ _ " ,-, ... -".-"-"Biochemical Oxygen DemandChemical Oxygen DemandTotal Dissolved .Solids ^ .' . :Total Suspended"SolidsTotal Kjeldahi NitrogenTotal Phosphorus _ . . . . .
soma -
11.0 PERFORMANCE AND SYSTEM AUDITS
Audits are conducted to ensure that requirements set forth in the QAPP arefollowed and to-provide feedback to management on quality assurance issues. Aperformance audit consist of an assessment of the accuracy of a measurementsystem" (i.e., are accurate results being obtained). A system audit consists of anevalution of the components of a measurement system (e.g., instruments used,analysis procedures, recordkeeping protocols, etc,). Performance and systemaudits are conducted by, EPA on CLP laboratories such a's CompuChem. Dames &Moore will conduct similar audits on the laboratories peEorming non-CLP analyses,namely ChemWest and NAC?. .System audits w_ill be conducted by onsite evaluationswhile performance audtis "will be conducted_by a review of the results o:f Q.C checkstandards. Dames & Moore will also conduct.the field audit.
11.1 FIELD AUDITS ' _, ' ___'".-....
At least one field audit will be conducted by the Quality Assrance Officerduring the initjai. phase, of sampling activities to verily that field samplers arecorrectly following sampling procedures described in the SOPs. Any deficienciesdetected will be—discussed wtih sampling personnei_and the Field OperationsManager. 'Deficie de Tti .are minor in narure will be corrected"immediately. Ifserious, deficiencies are detected, the Project Manager and EPA ComplianceOfficer w.ill be.notified within 24 hours of detection. Any field work that is beingperformed, improperly will be stopped by the Quality Assurance. Officer. Stoppedfield work will not be restarted until a corrective action plan can be implemented.
Field audit reports will be submitted to the Project Manager and the EPACompliance "Officer"within 15 days of "audit completion. If field work is stoppeddue to dificiencies~and a", corrective action plan is implemented, the QualityAssurance,Officer'o.r his d.esignee w.ill reaudit the field activities to verify that thecorrective .actions wereTTrnplernented and are adequate. Follow-up audit reportswill be generated arid distributed, as described above. The. field audit will followthe checklist shown in Table 11-1.
n.2 LABORATORY AUDITS ": :_ . _"~ ;;..._" "_;:.As a~"~CLP participants CompuChem Laboratories..is audited by the EPA.
Dames & Moo re-will obtain audit reports and performance evaluation reports from
"IT-1
CompuChem "and forward "them to the EPA Project Coordinator for incorporation in*the project file..
The non-CLP laboratories, ChemWest and NAC, will be audited by theQuality Assurance Officer or'his designee. These audits will be conducted duringthe time, frame when field samples are being analyzed. The laboratory audits willfollow the guideline^. ...found :in the American" Association for Laboratory
Accreditation's document entitled "Environmental Field of Testing, AssessorChecklists," July 1987. Audit results will be discussed with the laboratory QualityAssurance Manager so that any minor deficie.nc.es detected can be immediatelycorrected. If serious deficiencies a re detected, the Laboratory Manager, Dames <5cMoore Project Manager, and EPA Compliance Officer will be notifed within 24hoursrof detection. A corrective action"plan will be prepared by the laboratorywith input "from the auditor and implemented by the laboratoryQuality AssuranceManager. No_ sarnp;les will be analyzed by. a methodL.found to be deficient by theaudit until corrected. Laboratories may be reaudited if the findings of the initialaudtis Indicatd that such actions "are warrented.
Written audit reports will be prepared and submitted within 15 days ofaudited co.mpletion. Audit reports will be distributed to the Project Manager, EPACompliance Oficer, and the.respective laboratory's Quality Assurance Manager.
ConipiTChem Laboratories runs a certification program of its own forsubcontractor laboratories. In order for a laboratory to receive CompuChem'scertification, they must undergo: performance and system audits by CompuChem.Performa~nce^udlts are ""conducted" .by sending the laboratories blind referencesamples for analysis. Onsite system audits are conducted by CompuChem's QualityAssurance Director 'and/or Quality Assurance"" Manager," which also follows theguidelines found in the. American Association for . Laboratory Accreditation'sdocument entitled "Environmental Field of Testing, Assessor Checklists," July1987. The two-laboratories that CompXiChem will use.for subcontracted non-CLPanalyses, ChemWest and NAC, have been certified by CompuChem for theparameters listed in Table 1.0-2. ..The.laboratories will have CompuChem certifica-tion status during_the_time" p_eriod when anaiyses.from this project are performed.
11-2
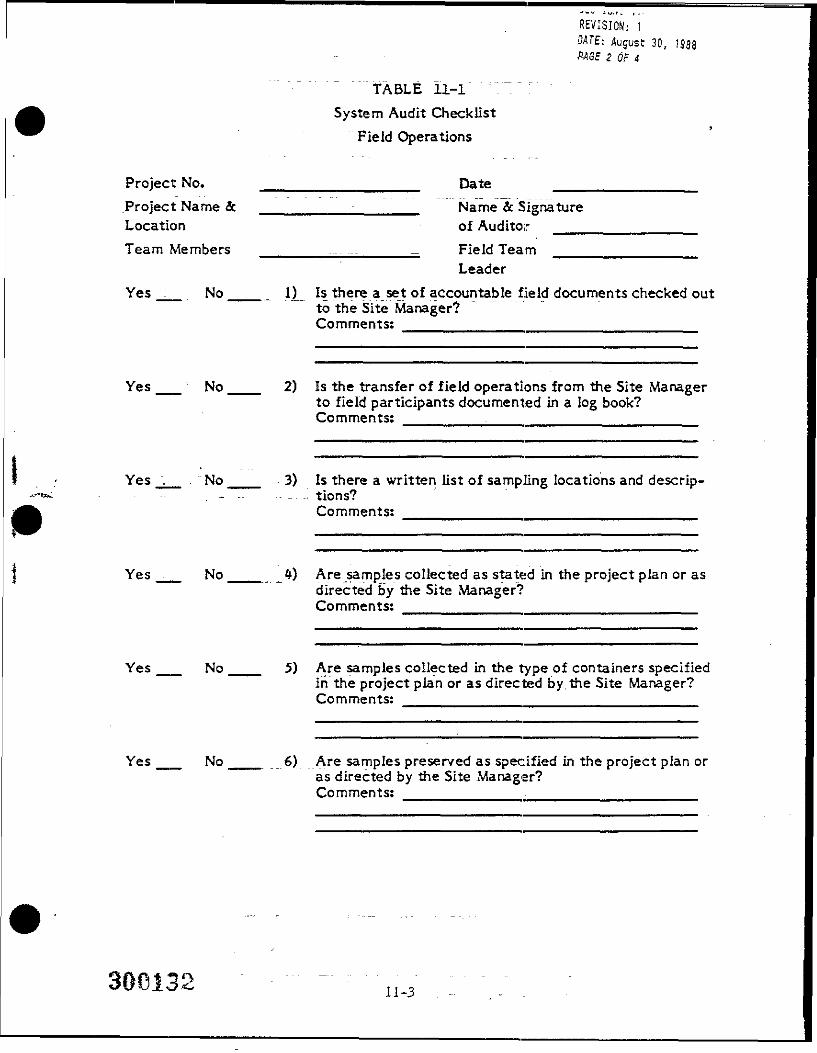
*
REVISION: JOATE: August 30, ]:
Z Or 4
TABLE Il-l" J:System Audit Checklist
Field Operations
Project No. _______________ DateProject Name & ________;______ Name & SignatureLocation of AuditorTeam Members ______^___-______ Field Team _____________
LeaderYes __ No ____ 1)_ Is there a set of accountable field documents checked out
to the Site Manager?Comments:
Yes __ No ___ 2) Is the transfer of field operations from the Site Managerto field participants documented in a log book?Comments:
Yes _._ No ___ 3) Is there a written list of sampling locations and descrip- I. - - - - - . . : tions? I
Comments:
Yes __ No ___ 4) Are samples collected as stated in the project plan or asdirected By the Site Manager?Comments:
Yes __ No ___ 5) Are samples collected in the type of containers specifiedin the project plan or as directed by, the Site Manager?Comments:
Yes __ No ___ 6) Are samples preserved as specified in the project plan oras directed by the Site Manager?Comments:
** 11-3
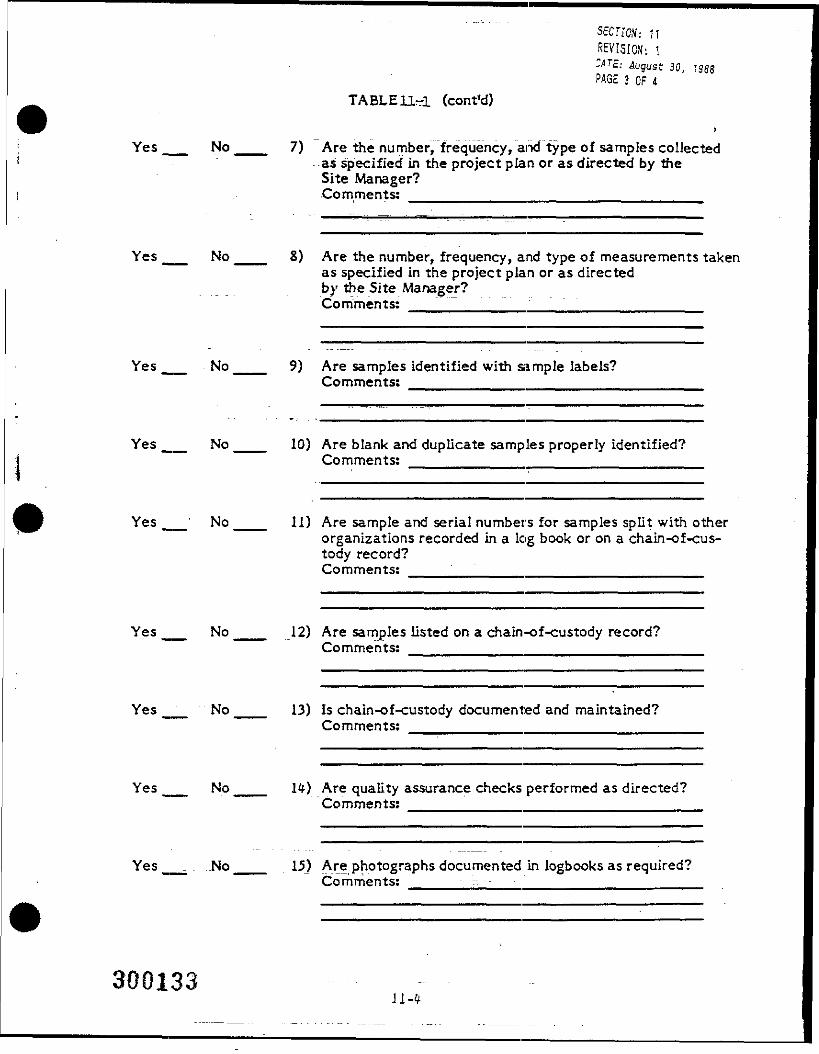
SECTION: 11REVISION: 1"AT£: August 30, :>PAGE 3 OF 4
TABLEUrrl (cont'd)
Yes __ No ___ 7) Are the number, frequency, and type of samples collectedas specified in the project plan or as directed by theSite Manager?Comments:
Yes __ No ___ 8) Are the number, frequency, and type of measurements takenas specified in the project plan or as directedby the Site Manager?Comments:
Yes No 9)
10)
Are samplesComments:
identified with sample labels?
Are blank and duplicate samples properly identified?Comments:
Yes No
Yes __' No ___ 11) Are sample and serial numbers for samples split with otherorganizations recorded in a log book or on a chain-of-cus-tody record?Comments:
Yes __ No __ 12) Are samples listed on a chain-of-custody record?Comments:
Yes ___ No __ 13) Is chain-of-custody documented and maintained?Comments:
Yes __ No ___ 14) Are quality assurance checks performed as directed?Comments:
Yes ___. .No ___ 15) Are photographs documented in logbooks as required?Comments: - - •-
11-4
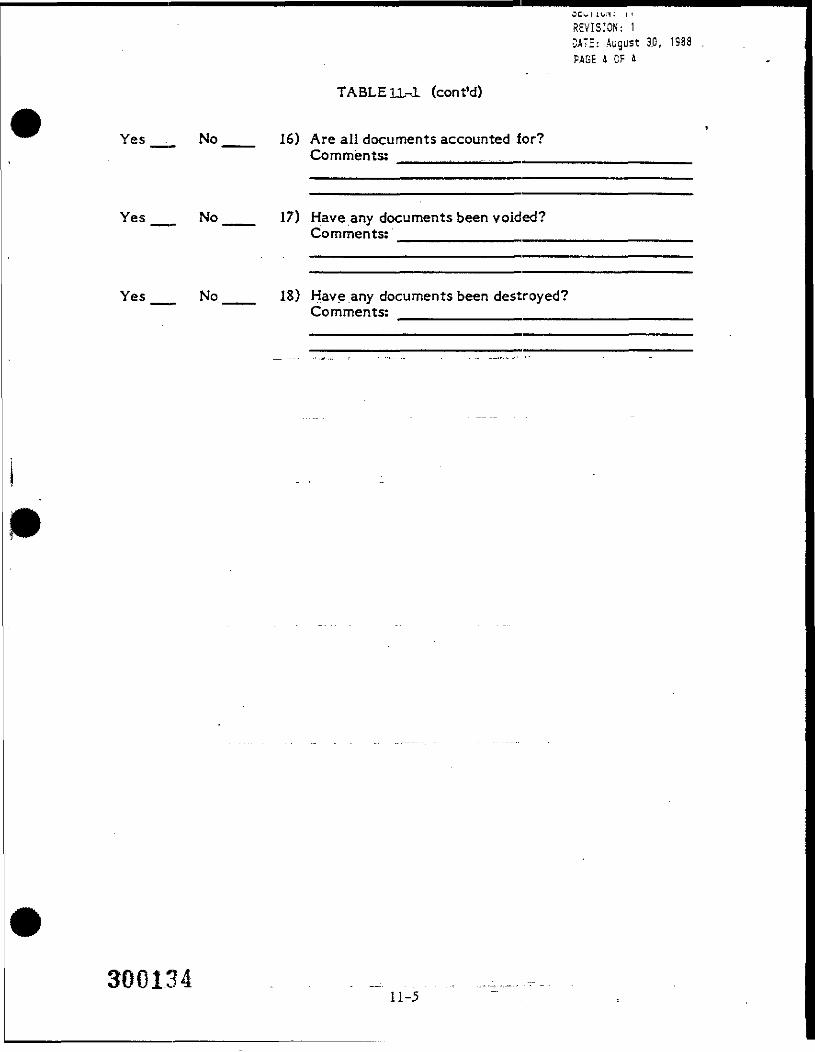
JCui ivti: t iREVISION: 13A7E: August 3.D, 1988PAGE 4 CF 1
TABLE11.-X (cont'd)
Yes ___ No ___ 16) Are all documents accounted ior?Comments:
Yes __ No ___ 17) Have any documents been voided?Comments:
Yes __ No ___ 18) Have any documents been destroyed?Comments:
11-5
12.0 PREVENTIVE MAINTENANCE
Minimal maintenance is required for field testing equipment. Spare parts arekept on hand or can be easily obtained.. :A11 well pumps, flow meters, andautomatic water level recorders are thoroughly checked prior to setup of fieldtests. Battery checks .for all instruments will be made before sampling begins andperiodically through the day. Extra batteries will_be kept with the sampling crewat all times—for example, two D-cell batteries (for the YSI conductivity meter),two 9-volt batteries for the mini-pH meter, four 1.5-volt type 'C alkaline batteriesfor the electronic .water level measuring tape, and one 9-volt alkaline battery forthe. analog data logger/pressure transducer. . Replacements for damagedinstruments" will require only 1 day {within 24 hours) for delivery from the Dames &Moore Bethesda office. Other field maintenance will consist only of keeping theinstruments clean and dry. . . • •
A preventive., maintenance checklist of field equipment is presented inTable 12-1. Conductivity meters will be.inspected for proper working order andsufficient""battery life, before _and. after they go" to the field. Probes will becleaned in the field by project staff with deionized water between eachmeasurement and at the-end of the day.
The HNu meter "will be calibrated, and maintained in accordance with themanufacturer's specifications. rAt the end of each day's use, the HNu batteries willbe charged _for 1.4_ hours. "All.field sampling tools such as trowels, etc., will be.cleaned after each use-depending on the task. All equipment will be calibratedfollowing manufacturers' instruc:tions"a"nd using standard solutions, if applicable, tothat particular instrument. " ;- "
Field monitoring "equipment and measuring devices, are held under anextensive preventive maintenance program. This program allows downtime to becontrolled and scheduled.rather than occurring in a random, unanticipated .manner.It also reduces the likelihood of unscheduled downtime. Experience with partfailure rates allows the .replacement of such components during the scheduledmaintenance":period. - - - - - - - - - : - - - • - - - - - - - - - - -.-_ :....-_ . _
This same experierice^has .enabled. Dames. .& .Moore to tailor spare, partsinventory to .match, that of failure behavior. These "components are kept in
12-1
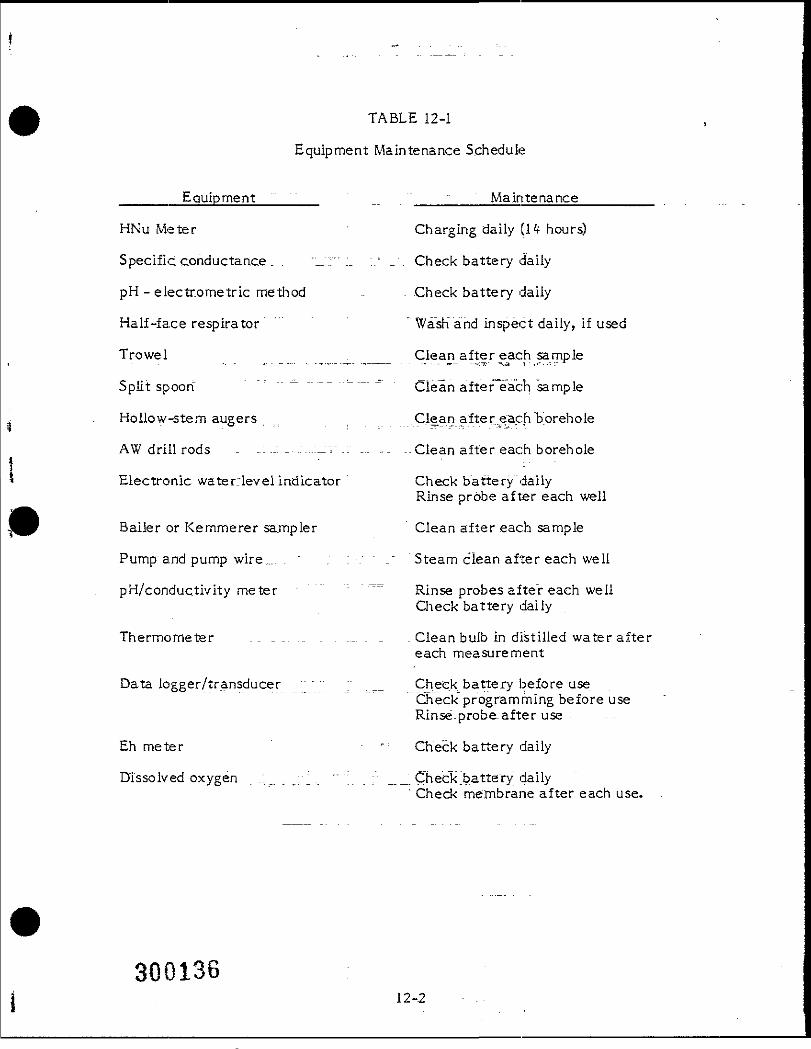
TABLE 12-1
Equipment Maintenance Schedule
______Equipment _ Maintenance_______
HNu Meter Charging daily (14 hours)
Specific conductance, __ r :_ = ='. Check battery daily
pH - electro me trie method .. . Check battery daily
Half-face respirator ' " Wash" and inspect daily, if used
Trowel _ __ Clean after each sample
Split spoon ' "r "~ "" Clean after~e"ach sample
Hollow-stem augers Clean after each borehole
AW drill rods - _: ._ - .:...:_v ." — , - --Clean after each borehole
Electronic water:level indicator Check battery "dailyRinse probe after each well
Bailer or Kemmerer sampler Clean after each sample
Pump"and pump wire,... . * . : . _~ Steam clean after each well
pH/conductivity meter " " " " ""= Rinse probes after each wellCheck battery daily
Thermometer . _ _ ... ... . . .._. . _ . Clean bulb in distilled water aftereach measurement
Data logger/transducer " ^ ^__ _ Cheek^battery before useCheck programming before useRinse-probe after use
Eh meter - * Check battery daily
Dissolved oxygen .; _ , T ; - I . _ "";. ; __ Check _batte"ry. dailyCheck membrane after each use.
30013612-2
inventory, eliminating dependence upon vendor inventories" and potential stock,outagesrand delivery delays. ~ . "" "; " .. '.. . . ;
The instrument maintenance: and repair staff is organized to provide 24-hourcoverage within Dames & Moore. These approaches allow field instrument uptimeto be maintaine'd at greater-than-95-percent levels.
Laboratory equipment used by CompuChem Laboratories will have preven-tative maintenance as described .in Section 6.4 of CompuChem's Generic QA Plan.A critical spare parts list for CompuChem Laboratories analytical instruments isprovided in Appendix H to their QA Plan. The laboratory apparatus required byChemWest Analytical Laboratories and Northeastern Analytical Corporation toperform non-CLP analylses "arei= "standard" for the most part, with replacementapparatus readily available. ChemWest has ;a spare spectrophotometer availablefor the thiocynate analysis, and GC/MS parts can be obtained from CompuChem(the parent company) within 24 house for the dioxin analysis. NAC has a sparespectrophotometer available for the phosphorus analysis, and replacemnt parts fortheir TKN analysis .apparatus (i.e., colorimeter, block digester, Sampler IV, andpump). No other parts are deemed to be critical.. MAC performs preventivemaintenance.... via "^service ".cbntyacts with the., equipment manufacture res whoperform this service at regularity scheduled intervals.
Both ChemWest "and NAC are capable of performing the required non-CLPanalyses (excluding dioxins/furans), which provides the. project with additionalinsurance against...:the. possibility of samples not being analyzed due to thebreakdown of apparatus at one laboratory.
300137-12-3-
13.0 ASSESSMENT OF DATA ACCURACY, PRECISION,- REPRESENTATIVENESS, AND COMPLETENESS
13,1 . DATA ACCURACY
The accuracy of a measurement is defined at the nearness of the measure-ment to the actual or true value of the data. The accuracy of experimental datacamrever be determined with complete surety, as such a determination wouldrequire prior knowledge of the true value being sought in the experiment.Therefore, the scientist is'only'capable of making a judgement as to the probableaccuracy of a measurement.
Conclusions regarding data accuracy will be drawn by analyzing preparedsamples of known chemical makeup following the same analytical procedures usedto analyze field samples. . Prepared samples may "consist of blanks, referencestandards, and matrix spikes. Blanks are run in an effort to expose errors that aredue to the..introduction of interfering contaminants from reagents and vesselsemployed in an analysis. Reference .standards are run to evaluate the magnitude oftotal error associated with the measurement..and to: detect bias in the measure-ment. Matrix spikes are run to evaluate whether or not the sample matrix itself isan interfering .agent"that may cause .inacpjrate, results .to be obtained from ameasurement. The conclusions on accuracy drawn from the analysis of preparedsamples will be extrapolated to the results on measured data from field samples.
The prepared samples to be run to assess accuracy are discussed in Section10, Quality Control" "Checks. ."For CLP analyses, accuracy requirements are"specified and certified by EPA. These requirements are discussed in CompuChem'sQuality Assurance.1 "Elan..(Appendix E of the QAPjP). The prepared samples to beused to assess."accuracy "for non-CLP analyses are presented in Table 10-1.Accuracy will be expressed as a measured value's relative deviation from the truevalue (i.e., ((Xj -:XT)/XT) (100%)).
132 DATA PRECISION ; _ "_ __. _ , ._ .._.__. _..._ "_ '.._ ' ._
Precision is a "measure"""Of-the reproducibility of results. The precision of ameasurement is readily determined by performing replicate anayses on identicalsamples following the same procedures and protocols. Replicates can take theform of prepared samples (as discussed above) or f isId samples. Field samples can
13-1
be used because only the agreement amongst measurements is being sought, rather>than the true value. _ .._ .. _. . _.... . - , . . .
Both prepared and field samples will be used to assess precision. The fieldduplicates ,;to be taken are listed in Table 4-2. The non-CLP analyses QCrequirements are presented in Table 10-1. For CLP analyses, precision require-ments have already been established and are; presented in CompuChem's QualityAssurance^Plan. Precision will be measured and compared as a relative deviationfrom the mean (i.e., ((Xj - X)/X)(IOO%)).
13.3 .DATA .REPRESENTATIVENESS - -„. ,; r .-.„-,-,_....-;
All sampling efforts "will be conducted in a manner to obtain samplesrepresentative of the matrix from which it was taken per sample collection SOPs(BJII). The Field Operations Manager will be responsible for ensuring that theseSOPs are followed. The Quality Assurance Officer1" will make an independentassessemenT of the correctness of the sampling procedures being followed duringthe field audit. " : . " .
The .sampling program has"been designed to provide broad coverage over thesite and surrounding area "in _alL mediums that contamination may reasonably beexpected to be found. Due to the numbers of samples proposed to be taken, thedata generated should.be sufficient tb":~ characterize the site. If new informationpresents itself "during the courser of the investigation, additional sampling may beconsidered in order to develop a representative picture of site conditions.
13.4 DATA COMPLETENESS
Completeness is evaluated by carefully comparing project objectives with thedata acquisition "and any potential "short falls" in needed information. Datacompleteness'-wiii be addressed by a series of protocols, outlined below, that stressevaluation of the quality and adequacy "of data collected during the surface water,sediment, soil, and groundwater investigations.
o Review data collected during the course of. the investigations toevaluate if the study objective is being addressed and met.
o Apply data quality checks and assessments as described in this andother sections of the QA Plan to ensure that the data collected arevalid and significant. .
o Determine" whether or not resampling and analysis are required on^missed samples or samples failing QC checks.
Additional samples will be collected in the event that Dames & Moore isunsatisfied with the completeness of the data set generated to characterize thesite. " """ " """" ;""" :;::: " •=-v """
300140 :13-3
14.0 CORRECTIVE ACTION
A corrective action is" required when a given procedure is found to interferewith the production of data of reliable quality. The quality of data can potentiallybe compromised at any stage;;of the data generation process, from samplecollection to final reporting. Error detection mechanisms are an important part ofthis QAPjP, which have been .incorporated to minimize the quantity of datacollected that fails quality control requirements.
Dames & Moored. Field Operations Manager is responsible for the oversight ofall field work, which ihcludes.seeing^that'all drilling, testing, monitoring, sampling,and shipping procedures are followed as written in the SOPs (Appendix B). Anyprocedures^that deviate from the SOPs will be corrected immediately by the FieldOperations Manager upon detection. As a secondary quality control check, theQuality "Assurance Officer will coaduct_.._a. field_.audit .to independently assesswhether or not the SOPs are being followed. The Quality Assurance Officer willinformally discuss, the field audjt findings with the Field Operations Manager sothat any minor problems can be:quickly corrected.. In the event that the QualityAssurance Officer detectsi"major "deficiencies In" flekf activities, he will have theauthority to~"stbp work in"" the deficient areas until a corrective action plan isdeveloped by the Project. Manager, Field Operations Manager, and himself. TheProject:.".Manager" will be .ultimately responsible for the implementation ofcorrective actions, with the Field Operations Manager continuing to be responsiblefor day-to-day field activities. :_Any corrective actions taken will be documented inwriting a"s irie=o"Tlhe required quality assurance, reports to management (Section15). . . ..:.-:.. - ,-. ~ ":/ ..r:;r\. , :
Corrective actions may also "be necessary at the laboratory level if qualitycontrol requirements are not being met." Examples of laboratory deficienciesinclude: inability "to"" calibrate" instruments, improper" analysis of QC .checkstandards, allowance of hold times on samples to elapse, and failures to adhere tolaboratory SOPs. Each laboratory's Quality Assurance ..Manager will be responsiblefor identifying areas"where deficiencies exist and implementing corrective actionswhere necessary. Laboratory Quality Assurance Managers will be assisted in theirerror detection:.; role by auditors who will independently assess laboratoryoperations. For CLP laboratories, the auditing function is performed by EPA. The
30014114-1
Dames & .Moore Quality Assurance Officer'or his"" desighee will perform the. auditsiof non-CLP laboratories. Problems detected....by laboratory Quality Assurance-Managers or independent auditors .will be .corrected in conjunction with theLaboratory Manager. Any corrective actions taken by the laboratory will be .fullydocumented in writing, with report copies sent to both Dames & Moore's ProjectManager and EPA. Laboratory analyses on samples will not be conducted onsamples while an out-of-control situation exists. " ~
300142.14-2
15.0 QUALITY ASSURANCE REPORTS TO MANAGEMENT
Quality assurance reports to management provide an official communicationschannel between the Quality _Assurajnce Officer, Project, Manager, and EPA on thequality of the data'being generated during the RI/FS. The QA Officer isresponsible for determining whether _ or not the proper procedures, are beingfollowed in the field, assessing the quality of data generated, and seeing that anyneeded corrective actions are: implemented. This information is vital to theProject Manager and .EPA Compliance Officer in determining what course of actionto -follow. Quality assurance reports will be generated following the field audit,the data validation .process, and at the end of the data collection phase of^theproject. In additioTi, if any corrective actions are" found to be necessary toimplement, quality assurance..reports detailing the problem detected, correctiveaction taken, and results of the'corrective action will be prepared.
Another circumstance that would cause a quality assurance report to begenerated would be field change orders or. amendments._ to the Work Plan. SuchWork Plan modifications might be required due to unforeseen field conditions.Because -field change orders hold potential implications for data quality, theQuality Assurance Officer wouTcfrnake an"assessment.of .the.change on tine overalldata goals in his_report.
The Quality Assurance Director and Manager at CompuChem Laboratorieshave responsibility ~for implementing the provisions of their QA Plan at thelaboratory level. The,, quality assurance reporting 'channel at CompuChemLaboratories is described in Section 4 of. their Q A Plan. The Dames & .MooreProject" Manager, Quality Assurance" Officer, and EPA Compliance .Officer willreceive copies of any laboratory-generated QA reports.
The final quality assurance report will summarize the QA issues encounteredduring the project, any'correcfive. actions or change orders made, and the finalassessment of the quality of. the data collected. This final QA report will beincorporated into the final RI report.
15-1
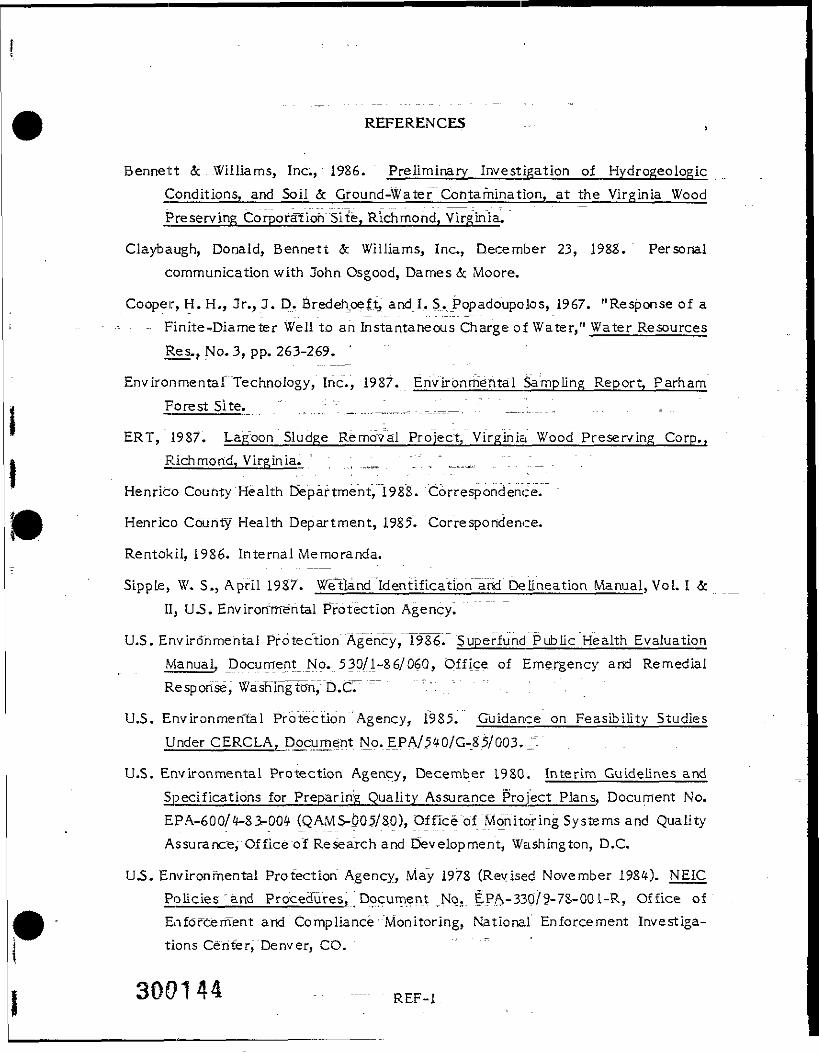
REFERENCES
Bennett & Williams, Inc., 1986. Preliminary Investigation of HydrogeologicConditions, and Soil & Ground-Water Contamination, at the Virginia WoodPreserving Corporation "Site, Richmond, Virginia.
Claybaugh, Donald, Bennett & Williams, Inc., December 23, 198&. Personalcommunication with John Osgood, Dames & Moore.
Cooper, H. H;, 3rv J. D. Bredehpeft, and I. S. Popadoupolos, 1967. "Response of a- Finite-Diameter Well to an Instantaneous Charge of Water," Water Resources
Res., No. 3, pp. 263-2.69. '
Environmental" "Technology, Inc., 1987. Environmental Sampling Report, ParhamForest Site. " __''""_. .....__. ..._____. ."." __.._!_..___.
ERT, 1987. Lagoon Sludge Removal Project, Virginia Wood Preserving Corp.,Richmond, Virginia. ; ; __ ' "_"_ ' __. ":. .:_ .
Henrico County Health Department, 19SS. Correspondence.
Henrico County Health Department, 1985. Correspondence.
Rentokii, 1986. Internal Memoranda.
Sipple, W. S., April 1987. Wetland Identification and Delineation Manual, Vol. I &II, UJ5, EnvironTnetital Protection Agency.
U.S. Environmental Protection Agency, 1986. "Superfund Public Health EvaluationManual, _Document _No. 53Q/1-86/06Q, Office of Emergency and RemedialResponse, Washington, D.C. " '.": .."""-. '.
U.S. Environmental Protection 'Agency, 1985. Guidance on Feasibility StudiesUnder CERCLA, Document No.._EPA/_540/G-_S5/003.. . . .
U.S.- Environmental Protection Agency, December 1980. Interim Guidelines andSpecifications for Preparing Quality Assurance Project Plans, Document No.EPA-600/4-8>004 (QAMS-OQ5/3Q), "Office of. Monitoring Systems and QualityAssurance, Office of Research and Development, Washington, D.C.
U.S. Environmental Protection Agency, May 1978 (Revised November 1984). NEICPolicies and Procedures, 'Document .No, E.PA-33Q79-7S-001-R, Office ofEnforcement and Compliance'Monitoring, National Enforcement Investiga-tions Center, Denver, CO.
300144 REF-l
Worsluff, 195-1. "Time Lag and Soil Permeability in Groundwater Observations,",Bulletin 36, Waste Water Experimental Station, Corps of Engineers.
300U3 REF-2"
•nm2OX
300146
APPENDIX A
Dames & Moore Health & Safety Plan
300147
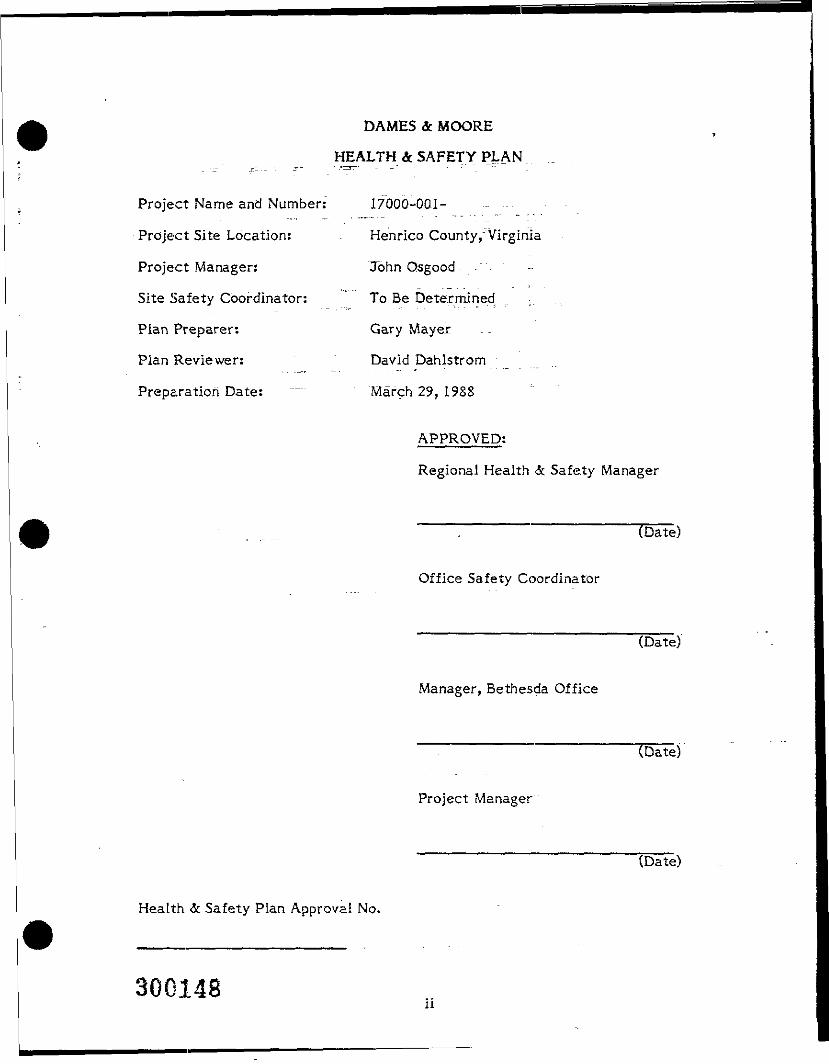
DAMES & MOORE
HEALTH & SAFETY PLAN
Project Name and Number: 17000-001-
Project Site Location: Henrico County," Virginia
Project Manager: John Osgood
Site Safety Coordinator: To Be Determined ;.
Plan Preparer: Gary Mayer
Plan Reviewer: David Dahlstrom
Preparation Date: ~ March 29, 1988
APPROVED:
Regional Health & Safety Manager
[Date)
Office Safety Coordinator
___
Manager, Bethesda Office
[Date)
Project Manager
(Date)
Health & Safety Plan Approval No.
300148ii
CONTENTS »
1.0 PURPOSE..................................................... A-l
2.0 APPLICABILITY............................................... A-l
3.0 SITE DESCRIPTION ............................................ A-23.1 . GENERAL INFORMATION .,......"." i............................ A-23.2 SITE HISTORY ................................................ A-23.3 - FACILITY DESCRIPTION ....................................... A-23.4 HAZARD EVALUATION ........................................ A-2
U.O EMERGENCY INFORMATION ................................... A-34.1 EMERGENCY CONTACTS ............... ....................... A-34.2 LOCATION OF SITE RESOURCES ..."............................. A-34.3 EMERGENCY ROUTE TO HOSPITAL ............................. A-34.4 ADDITIONAL ARTICLES TO BE TAKEN INTO FIELD ............... A-3
5.0 SITE SAFETY WORK PLAN ..................................... A-45.1 MONITORING .............C....... .".V.. ~.. "..................... A-45.1.1 Monitoring Requirements ..................................... A-45.1n.Z Monitoring Schedule .......................................... A-45.1.2.1 Instrument Calibration....................................... A-45.1.2.2 Background Readings .. ..................................... A-45.1.2.3 Air Monitoring Frequency". .................................. A-45.2 LEVELS.OF PROTECTION ...................................... A-55-3 -RESPIRATORY PROTECTION ................................... A-55.4 WORK LIMITATIONS ........................................... A-55.5 . FIELD-PERSONNEL ............................................ A-6
6.0 DECONTAMINATION .......................................... A-76.1 .-STANDARD PROCEDURES ..... ,.\..."...'".".._."„"..".............. A-76.2 "MINIMAL"DECONTAMINATION ................................. A-106.3 CLOSURE OF THE PERSONNEL DECONTAMINATION STATION .... A-IO
7.0 TABLES ...................................................... A-127-1 -Exposure Limits and Recognition Qualities ........................ A-137-2 Acute, and Chronic Effects: and First Aid Treatment"................ A-l 47-3 Hazard Monitoring Methods, Action Levels, and Protective Measures.. A-157-4 Protective Equipment for Onsite Activities ........................ A-J6
300149 ill
CONTENTS (cont'd)
S.O FORMS....................................................... A_17
ATTACHMENT A: Chemical Hazard EvaluationATTACHMENT B: Responsibilities IATTACHMENT C: Standard Safe Work PracticesATTACHMENT D: Emergency ProceduresATTACHMENT E: Heat Stress/Cold StressATTACHMENfF: Respirator CareATTACHMENT G: Certificate for Field EmployeesATTACHMENT H: Site-Specific Data (See Section 2.0 of the QAPP)
300150IV
1.0 PURPOSE
The purpose of this plan is to assign responsibilities, establish personnelprotection standards and mandatory safety practices and procedures, and providefor contingencies that may arise while operations are being conducted at the site.
" - - • - • — •• — 2.0 APPLICABILITY
The provisions of the plan are mandatory for .111 onsite Dames & Mooreemployees. and subcontractors engaged in hazardous .material managementactivities—including, but not limited to, initial site reconnaissance, preliminaryfield investigations, mobilization, project operations, and demobilization. This planhas been developed under U.S. Environmental Protection Agency (EPA) guidelinesand complies with all regulations—including OS'HA 29 CFR 1910, the recent1910.120 interim final rule, and 1926 standards.
Dames. & Moore will encourage the use of proper safety precautions to thosenon-Dames & Moore personnel who are authorized to be onsite. However, Dames &Moore cannot enforce these precautions or accept responsibility for the actions ofpersonnel over whom" Dames & Moore, has "no "control. Rentokii will maintainresponsibility for their own staff and unauthorized entry to the site.
The areas ~o"f the site where work is being conducted requiring restrictedaccess..Will be clearly delineated. Personnel other than those working in therestricted areas will be asked, to sign-in and will be advised of the safety equipmentneeded to enter the area. Site-specific safety reminders will also be given at thattime. However, such information Is not intended to cover the information thatshould be learned in a certified Health and Safety training course. Completion of acertified Health and Safety course is mandatory for Dames & Moore personnel andsubcontractors working onsite and is highly recommended for other personnel whowish to enter restricted areas. Work will be stopped in a restricted area if anypersons in the area refuse to. comply with applicable safety precautions.
300151 A-l
3.0 SITE DESCRIPTION
3.1. GENERAL YNFORMATION " / .'''.."......... ,Site: Virginia Wood Preserving Site ___ _ \^ Job No.: 17QQO-001-
Objectlves: Conduct a Remedial Investigation
Proposed Date of Investigation: .Summer 1988
Background Review: . . _ . Complete: X Preliminary: ___
Documentation/Summary (Overall Hazard): Serious: __ Moderate: X
Low: :._.... Unknown: __
3.2 SITE HISTORY . '. ._ ".."-.'.. -- , ...
Note:See Section 2.0 of; the work plan/quality assurance plan (QAPP) fordetails on site history. :
3.3 FACILITY DESCRIPTION ' '_ . _ „_
Waste Types: Liquid X Solid X - . Sludge __X,' - Gas_
Characteristics: Cofr lve __ JgnJtable .X ; Radioactive __ Carcinogen Suspect
Volatile X Toxic X Reactive __ Unknown __
No unusual site features are identified at this location. However, utility locationswill be confirmed prior to drilling monitoring wells. The utility company phonenumber _is._800/552.-7001.
Status (active, inactive, unknown): Active wood treating facility
3.4 HAZARD EVALUATION _.,.... , ,...„„ „ , ..
Dames & Moore field activities will consist of monitor well installation andsampling of groundwater, surface: water, sediments, and soils.
Prior data are discussed in Section 2.1 of the QAPP. The main constituentsof concern are~pe"ffta:chiorophenol, creosote, arsenic, copper, chromium, xylene, andzinc. -Various dioxin isomers- (but not 2,3,7,8-TCDD) were detected in holding pondsludge. The_exposure limits, recognition qualities, acute and chronic effects, andfirst aid treatments are-presented in Tables 7-1 and 7-2 (Section 7.0). Tables 7-3and 7-4 (Section 7.0) provide monitoring methods, action levels, and protectiveequipment required for this project.
3D 0152 A-2
4.0 EMERGENCY INFORMATION
4.1 EMERGENCY CONTACT^. .._."/. ..... ™ . ...-.-.. 1~ -.-- -. - - . . , . „ , - , Work
Telephone_____Contact :"- Person or Agency "Numbers
Police-- . . _ .:. r '.. "Henrico County, - : . ,,•• .;i .Police -- - : 911
Fire - - -- •" =" —^" "•• Henrico County,L' Fire Department 911
Ambulance..,, =.. - ,=—• - - ---Henrico CountyFire Department 911
Hospital __ ^ St.= Lukes r _;=^r-:=,,.i ,J804) 747-5600Poison Control —-— - - |_g00_c,62-125Q "Client Contact " -- -- " "- ' "Linwood'Farmer "" (804) 266-0262 .D,5cM Project.Manager 3ohn Osgood .... (301) 652-2215D&M Partner" (Ltd,) , = . Aaron Wploshin ._..... J301) 652-2215Office Safety ~"Coordinator : Gary Mayer (301) 652-2215
Regional H&S.Manager _ . . .' David Dahlstrorn _ . l(404) 262-2915Firmwide H&S Director^ ""'" "Chuck' McDaris " - (213) 6S3-1560
Note: Dames & Moore does not have a 24-hour emergency telephone number.However, all Dames & Moore field activities will be conducted duringdaylight hours. Rentokii only operates the plant one shift per day;therefore, no personnel would be onsite during other than normal working
. hours. " " " " "" " "" -•
4.2 LOCATION OF SITE RESOURCES . . :_,_. _/_ .,
Water Supply: On Site Telephone: Plant Office "Shower: Outside Plant Office
4.3 EMERGENCY ROUTE TO HOSPITAL
Emergency"Ambulance/Paramedic services are available. In the event of anemergency call 911 and request medical assistance.
4.4 ADDITIONAL ARTICLES TO BE TAKEN INTO FIELD
i. First aid kit for emergency use. Non-emergency and followup treat-ment will be administered in the Rentokii office. All injuries and use ofthe first-aid kit will be reported to the field supervisor.
2. -Portable eye wash with a 15-minute flow.
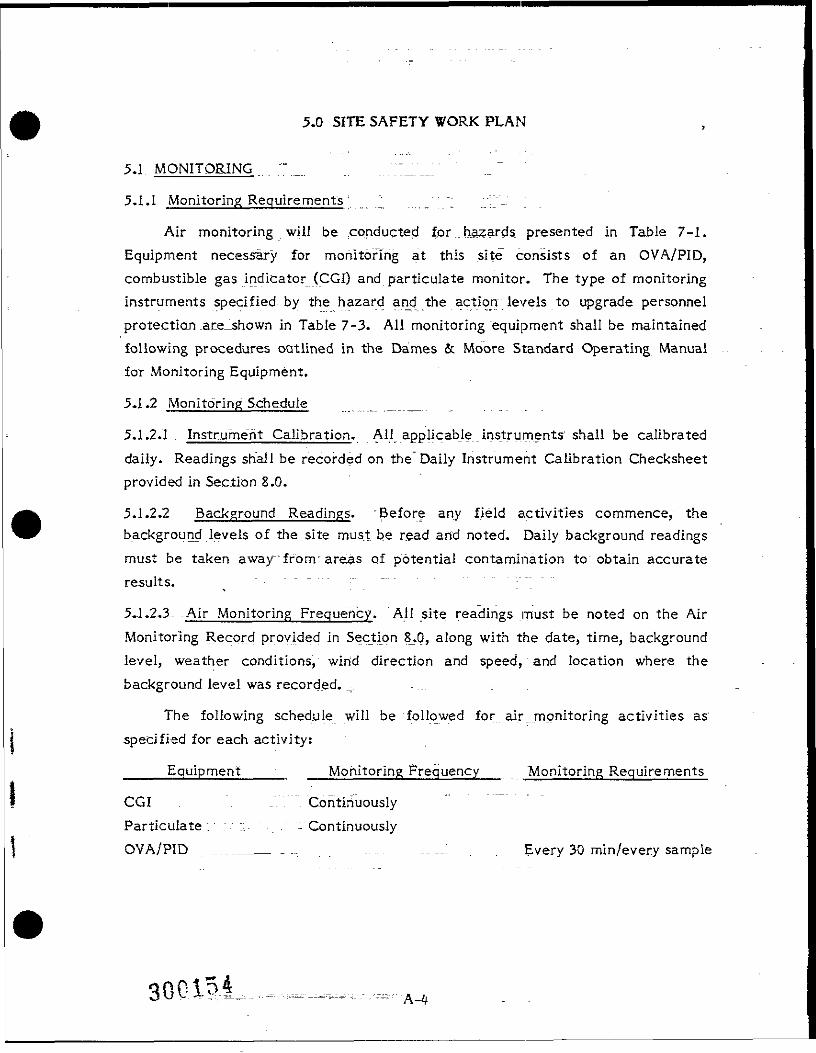
5.0 SITE SAFETY WORK PLAN
5.1 MONITORING .".__. _ ..."::_."_„'
5.1.1 Monitoring Requirements: ^ ....„ : ": .1""-""-' '.
Air monitoring will be conducted for .hazards presented in Table 7-1.Equipment necessary for monitoring at this site consists of an OVA/PID,combustible gas indicator (CGI) and particulate monitor. The type of monitoringinstruments specified-by the hazard and the action levels to upgrade personnelprotection _ar_e_shown in Table 7-3. All monitoring equipment shall be maintainedfollowing procedures outlined in the Dames & Moore Standard Operating Manualfor Monitoring Equipment.
5.1.2 Monitoring Schedule ._._._..
5.1.2.1 Instrument Calibration. All applicable instruments shall be calibrateddaily. Readings shall be recorded on the Daily Instrument Calibration Checksheetprovided in Section 8.0.
5.1.2.2 Background. Readings. rBefore any field activities commence, thebackground levels of the site must be read and noted. Daily background readingsmust be taken away"from1areas of potential contamination to* obtain accurateresults. ^ - - - - - - r - . . . . . . . . . . . . . .
5 .-1.2,3- -Air Monitoring Frequency. All site readings must be noted on the AirMonitoring Record provided in Section 8.0, along with the date, time, backgroundlevel, weather conditions, wind direction and speed, and location where thebackground level was recorded.....
The following schedule will be followed for air monitoring activities asspecified for each activity:
____Equipment Monitoring Frequency Monitoring Requirements
CGI . ContinuouslyParticulate: ;;. . . - ContinuouslyOVA/PID _._..___ _ .:. ..... ..___: Every 30 min/every sample
300.1 1 A-4
5.2 LEVELS OF PROTECTION ... . . „ ._ .__.. ....
A minimum of Level D-f protection is needed to perform work onsite; Level Cprotection may be required, as described in Table 7-4, and will be available onsite.In the event that the personal protection level is changed, the plant manager willbe notified by the Site Safety Coordinator. However, the level of protection willnot be lowered below the Level D+ minimum.
5.3 RESPIRATORY PROTECTION
If air purifying respirators are required, organic vapor, high efficiency dustand mist cartridges will be used. .Cartridges are to be, replaced within the timelimits specified on the cartridge or when a breakthrough occurs, breathingresistance increases oTTeplacedat least daily.
The drilling and sampling 'activities will be initiated at Level D+, If organicvapors~ as "measured on the OVA/PID exceed. 3 ppm as measured in the breathingzone," don respirators. If organic vapors exceed 10 ppm, leave the area. Dustsuppressive measures (wetting'down cuttings) will be implemented at 0.2 rng/m3,and respirators will be donned if readings remain above 0.2 mg/m^ following dustsuppression. All ambient air measurements taken to evaluate personnel exposuremust.be taken within the individual's breathing zone and be fairly constant for aduration of at least 30 seconds.
5.4 WORK LIMITATIONS '. ~ ' .._.'._---- .... _ • - _ - ; •
In general, fieldwork. will be conducted during daylight hours only. At leasttwo persons will be .in.-the field at all times. The Project Manager or RegionalHealth & Safety Manager must grant special permission for any field activitiesconducted beyond daylight hours. All Dames <5e Moore personnel working in thefield must have completed the Dames & Moore 40-hour personnel protection andsafety course, (or its "equivalent), have been declared fit for duty, and—whererespiratory protection is necessary—have been properly trained, fit-tested, anddeclared fit for respirator use. Dames.& Moore maintains physicians' certificationsand training certifications for its employees in company records. At least oneDames" & _Moore employee will be certified,, in first aid and cardiopulmonaryresuscitation and be onsite .at all times. No drilling can take place without firstconfirming with the utility company (800-552-7001) the absence of subsurfacetransmission lines. " ~~ "" "" "~" -
300155 1
5.5 FIELD PERSONNEL. _ ;
The field team will consist of the following persons
Project Manager: John OsgoodSite Safety Coordinator: TBA
300156 ... .A-6
6.0 DECONTAMINATION
6.1 .STANDARD. PROCEDURES .. . _
1. Locate a decontamination area between_the Hot Line (upwind boundary of theExclusionary Area).and the Clean Area boundary.
2. Establish a personnel decontamination station (PDS).
3. Upon leaving the contamination area, all personnel should proceed throughthe appropriate Contamination Reduction Sequence.
i4.- All protection-gear should be left onsite during any lunch break following
decontamination procedures.
The maximum decontamination layout for Level C is shown in Figure 6-1, anda description is given below.
Maximum Measures for Level C Decontamination
Station 1: Segregated Equipment 1. Deposit equipment used onsiteDrop (tools, sampling devices and con-
tainers, monitoring instruments,radios, clipboards, etc.) on plastic
, --•--"-- " ""-" : ""- — --- —-••" ""dropcloths or in different plastk>lined containers. Segregation atthe drop reduces the probabilityof cross, contamination. Duringhot weather operations, a cool-down station may be set up withinthis area.
Station 2: •- Boot Cover and Glove 2. Scrub outer boot covers andWash .. gloves ,with decon solution or
detergent and water.
Station 3: Boot Cover and Glove 3. Rinse off decon solution fromRinse ...::" -- , , ~ Station 2 using as much water as
necessary.
Station 4: Tape Removal 4. Remove tape around boots andgloves and dep.osit them in theplastic-lined container.
Station 5: Boot Cover Removal 5. Remove boot covers and depositthem in the plastic-linedcontainer.
300157
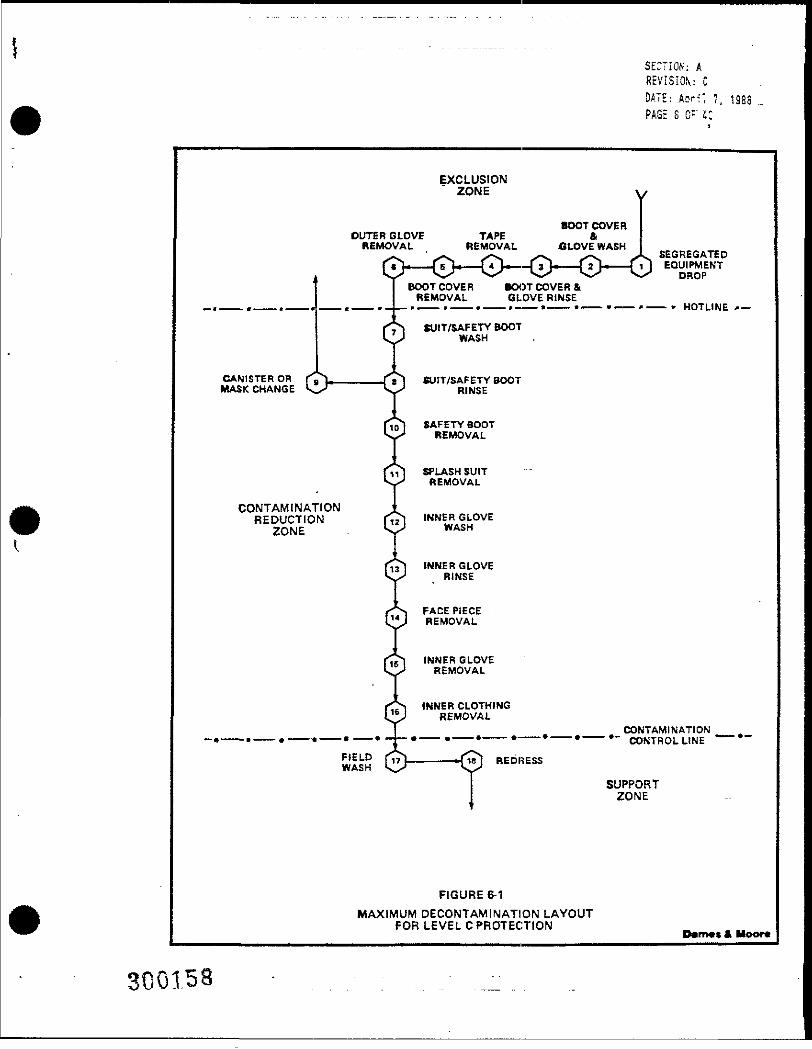
SECTION:; AREVISION cDATE; .Acr-:' 7, 1988PAGE 8 C=~ t:
EXCLUSIONZONE
BOOT COVEROUTER GLOVE TAPE &REMOVAL REMOVAL CLOVE WASH
SEGREGATEDEQUIPMENTDROP
- HOTLINE *—
IBOOT COVERREMOVAL
ROOT COVER &GLOVE RINSE
f SUIT/SAFETY BOOTk/xJ WASH
CANISTER OR (VV———————fft SUIT/SAFETY BOOTMASK CHANGE ** * S RINSE
10 i SAFETY BOOTREMOVAL
SPLASH SUITREMOVAL
CONTAMINATIONREDUCTION r^t INNER GLOVE
ZONE S^ WASH
INNER GLOVERINSE
FACE PIECEREMOVAL
15 INNER GLOVEREMOVAL
INNER CLOTHINGREMOVAL
___ CONT AMI N ATI ON—— 9 —— .——— .——— . —— .——— »_ cQ^RQLLifjg
SUPPORTZONE
FIGURE 6-1MAXIMUM DECONTAMINATION LAYOUT
FOR LEVEL C PROTECTION D*m«K & Hoor*
300158
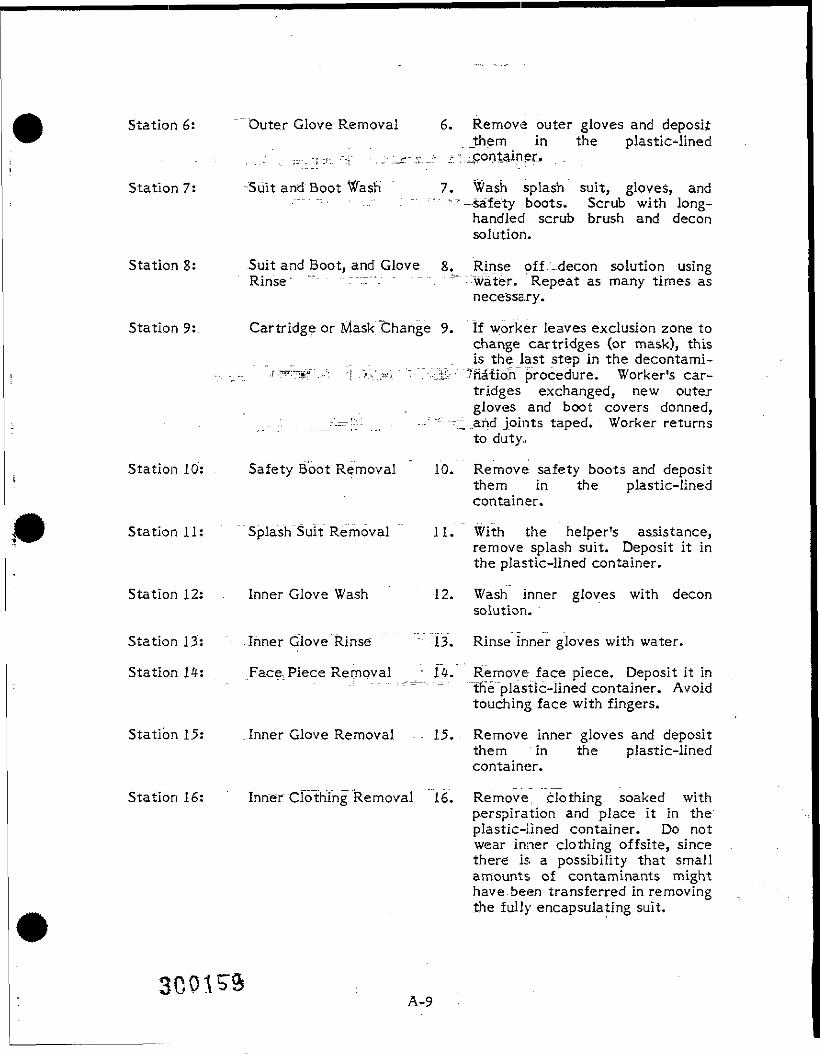
Station 6: Outer Glove Removal 6. Remove outer gloves and deposit_them . in the plastic^lined
- - • : . - - _ - , - ; -j-.. --?: -.:•:.-?-.-.L.T _- "^container, .
Station 7: Suit and Boot Wash 7. Wash splash suit, gloves, and" - - • - • i " " :-- "-sa'fety boots. Scrub with long-
handled scrub brush and deconsolution.
Station 8: Suit and Boot, and Glove 8. Rinse off -decon solution usingRinse1 ""~~ :"~ v - " , ~ = "water. Repeat as many times as
necessary.
Station 9: Cartridge or Mask Change 9. If worker leaves exclusion zone tochange cartridges (or mask), this
.is the last step in the decontami-... v~_ .f-T Tiif ".-••'"• 1 -">\'.*J-' " / -'"-"'Ffiatiah procedure. Worker's car-
tridges exchanged, new outergloves and boot covers donned,
- :. J""~:::"": -:, "\u™ ..and joints taped. Worker returnsto duty,.
Station 10: Safety Boot Removal 10. Remove safety boots and depositthem in the plastic-linedcontainer.
Station 11: Splash Suit Removal 11. With the helper's assistance,remove splash suit. Deposit it inthe plastic-lined container.
Station 12: Inner Glove Wash 12. Wash inner gloves with deconsolution.
Station 13: Inner Glove Rinse '- 13. Rinse inner gloves with water.
Station 14: Face Piece Removal .• 14. Remove face piece. Deposit it in- - ----'^------ "the"plastic-lined container. Avoid
touching face with fingers.
Station 15: .Inner Glove Removal 15. Remove inner gloves and depositthem in the plastic-linedcontainer.
Station 16: Inner Clothing Removal 16. Remove, clothing soaked withperspiration and place it in theplastic-lined container. Do notwear inner clothing offsite, sincethere is a possibility that smallamounts of contaminants mighthave.been transferred in removingthe fully encapsulating suit.
30Q15-9A-9
Station 1-7; Field Wash 17. Shower if highly toxic, skln-corrq-sive, or skin-absorbable materials
--are known or suspected to be--- - - - •* " •-----• present. Wash hands and face if
shower is not available.
Station 18; Redress .. ' - 18. Put on clean clothes.
6.2-.MINIMAL DECONTAMINATION
Less extensive procedures for decontamination can be established when thetype arid degree of con farm i nation are known, or when the potential for transfer isjudged to be minimal by the Site Safety Coordinator. These procedures generallyinvolve one or two washdowns only.
The drill rig and all drilling tools will be steam cleaned prior to sampling andat the completion of-the work. Ail downhole tools, samplers, and other downholeequipment will be steam cleaned between boreholes. Under sloppy conditions, theback end of the drill rig will also be steam cleaned, as needed, between boreholes.It has been assumed that an appropriate decontamination area near the site will bedesignated, by the client for drill rig steam cleaning/decontamination operations.This should consist of a contained concrete or asphalt area where drainage can becollected. If such an area is not available, a decontamination pad will have to beconstructed prior to the start of drilling operations. Collected drainage water willbe tested for hazardous constituents. Based on the test results, the water eitherwill be disposed of as a hazardous waste or discharged to the sanitary sewersystem. Most municipal sewer authorities have set discharge limitations forinfluent water to their system. Typically, the parameters of concern are thepriority pollutant, metals, volatile and semivolatile organics, and cyanide. Themunicipal sewer authority will be contacted to obtain a copy of their dischargelimitations so that all required analyses are performed and permission to dischargeis granted before any water is released to the sanitary sewer "system.
6.3 CLOSURE OF THE PERSONNEL DECONTAMINATION STATION
All disposable clothing and plastic sheeting used during the operation will bedouble-bagged, labeled, and contained onsite prior to disposal as a potentiallyhazardous RCRA waste, Decon and rinse solutions will be collected and tested forhazardous constJtuerits.~~This water either will be disposed of as a hazardous waste
300160.
or discharged to the sanitary sewe_r__system, based on the test results. Reusablerubber clothing will be.dried and prepared for future-use. (If gross contaminationhas occurred, discard the item.) Cloth items will be bagged and removed from thesite "for final cleaning. All wash tubs, pail containers, etc., will be thoroughlywashed, rinsed, and dried prior "to removal from the site.
/•»-*01 A-n
7.0 TABLES
This section consists of tables containing information about the chemicalsexpected to^be encountered ar the Site, the methods of monitoring for potentialhazards, and the protective equipment that may be used.
30C152 -:. ; •___ .. ..A-l2
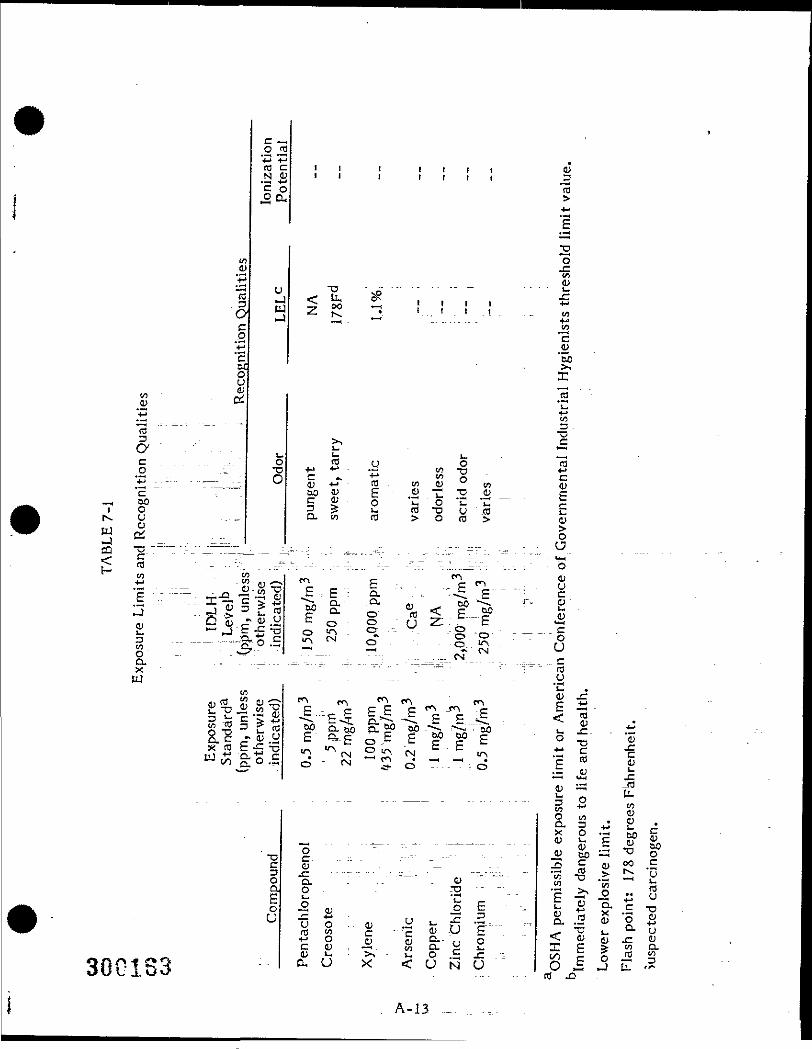
i l r i i 0i r t r t D
I " ™
CQ
£/>0,"£"ffOc.2V'ccu4J
-
C — .O cO'£ "+Jit) c
jj<£
UU01-J
1_o•DO
, ; , ,. . . _ . . . _ . . _ 4-1
«•—<C0)"5b
c ... ... ..= . O 2 (JO " r -D -H " wc » t: wQJ *J fl t/5 0
§ > ^ > - ° " 5 5 - - c10 3 ? i- n) *D o " «J cu ...=, Q. « m > o ra >u - o
<u o U «.y- Jj -e-c-3
-i ---• -- „ :..:. °.-.- -".r ~:.:..__b--:"-.- "-..-.:• - o
S .-, ," c f ._. _ ... . uQ. . .. -<: P : cw S °L «C"E ^T R ^ 5-P : S - CJ «^-
2 • • • . 'CL ., . .._:... ..=.-..-. .j. _...._; v .-— =rrr-rsj.--. ..,._.... C. . . . . .
i = . s •r ai' r-y-rr ' =« < §s -N E -E = -d <^ 3 d -..-;d E
c
30G133
fl fli OCi .ii ' - — *"• - — "-^ ~Z c - c §;-„ o,
<
"- (O .
.2 ..- *«F "5 "S.7 . o< I t o
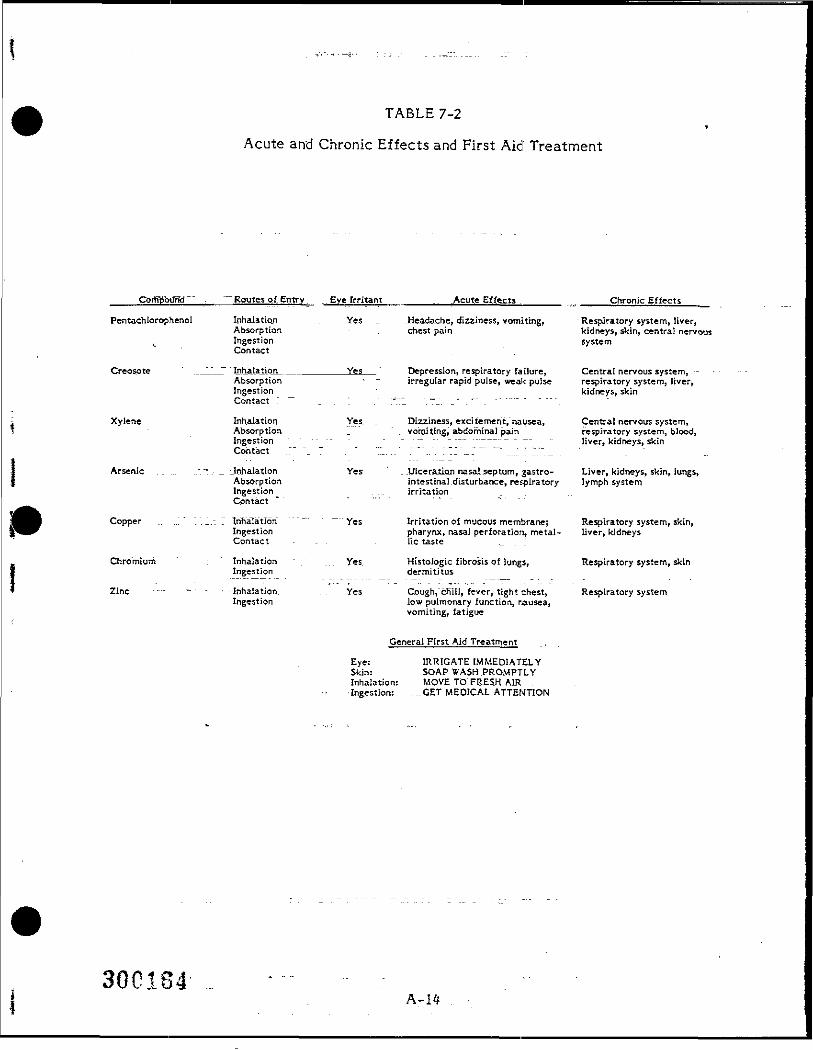
TABLE 7-2
Acute and Chronic Effects and First Aid' Treatment
____CoiB&bdrid ~" : , " RgutgjJtjLEntry. . Eye Irritant________. ..Acute Effects _____ . ____Chronic Effects____
Pentachiorophenol Inhalation . Yes _ .Headache, dizziness, vomiting, Respiratory system, liver,Absorption . chest pain kidneys, skin, centra! nervous
L Ingestion systemContact
Creosote __^_"_^ to.ha_lati_o_n_. ________Yes Depression, respiratory failure, Central nervous system, --Absorption •- - irregular rapid pulse, weak pulse respiratory system, liver,Ingestion _ kidneys, skinContact : _ . : . :v~ .=j. _^ .--" . - - -- - ^ --
Xylene Inhalation Yes . Dizziness, excitement, nausea, Central nervous system,Absorption _ . vomiting, abdominal pain respiratory system, blood,Ingestion ------- - - - - - —- ——-. _ - — liver, kidneys, skinContact .'." 7 . ' ""!...' .""..". !~I ._T~" .....". ! '..'~.._
Arsenic .1 ... :.-.":. _ iloflalation Yes ' _ .Ulcer_aj(io_n nasai.septum, gastro- Liver, kidneys, skin, lungs,Absorption Intestinal .disturbance, respiratory lymph systemIngestion . ... irritationContact
Copper .. ..: " " . „: " "Irihalatrdri "" ~" ~ Yes Irritation of mucous membrane; Respiratory system, skin,Ingestion pharynx, nasal perforation, metal- liver, kidneysContact - - - - lie taste _. . ;
Chromium : Inhalation . ... Yes. Histologic fibrosis of lungs, Respiratory system, skinIngestion - dermititus
Zinc -•— --~ - - Inhalation. .. Yes Cough,"chill, fever, tight chest, Respiratory systemIngestion low pulmonary function, nausea,
vomiting, fatigue
Gene'ral Fi r st Aid_Tre at rn e n t
Eye: IRRIGATE IMMEDIATELYSkin: SOAP WASH PROMPTLYInhalation: MOVE TO FRESH AIRIngestion: ...GET MEDICAL ATTENTION
3QC184 - ;A-14
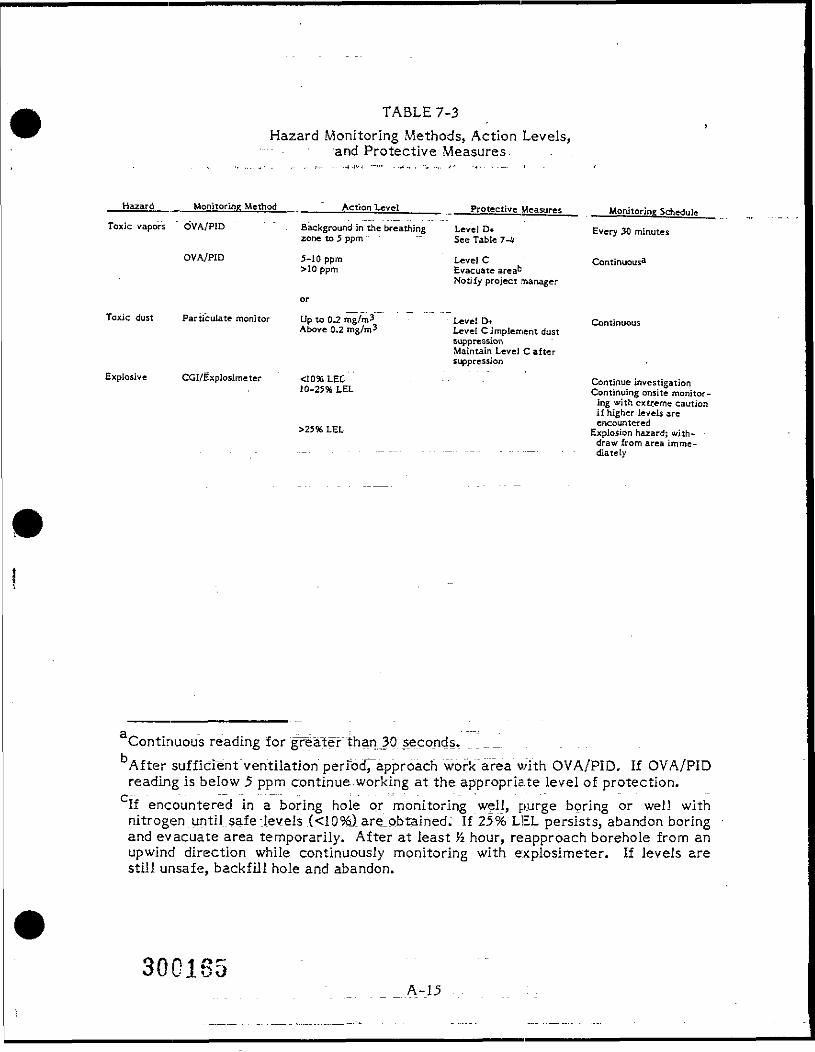
TABLE 7-3Hazard Monitoring Methods, Action Levels,
•and Protective Measures
Hazard_____Monitoring Method " Action Levet_____ Protective Measures Monitoring ScheduleToxic vapors " OVA/PID " . "Background in the breathing LevelD* ' Every 30 minutes
zone to 5 ppm " See Table 7-4
OVA/PID 5-10 ppm Level C Continuous*>10 ppm Evacuate areab
Notify project manager
or
Toxic dust Particulate monitor Up to 0~.2 mg/m3 Level D+ ContinuousAbove 0.2 mg/m3 Level CJmplement dust
suppressionMaintain Level C aftersuppression
Explosive CGI/Explosimeter <IO% LEC- ' " ' Continue investigation10-25% LEL Continuing onsite monitor-
ing with extreme cautionif higher levels areencountered
>25% LEL Explosion hazard; with-draw from area imme-.._. .__...... _.. ._.. .._.. . ....._. diatcly
Continuous reading for greater than JO _s_econds.After sufficient ventilation peribd~7approach work'area with OVA/PID, If OVA/PIDreading is below 5 ppm continue,working at the appropriate level of protection.
/•• — - ——— - -- - ———- .. ! . . . . : , . • - -
If encountered in a boring hole or monitoring well, purge boring or well withnitrogen until safe .levels (<1094).are_obtained. If 25% LEL persists, abandon boringand evacuate area temporarily. After at least J4 hour, reapproach borehole from anupwind direction while continuously monitoring with explosimeter. If levels arestill unsafe, backfill hole and abandon.
300185A-15
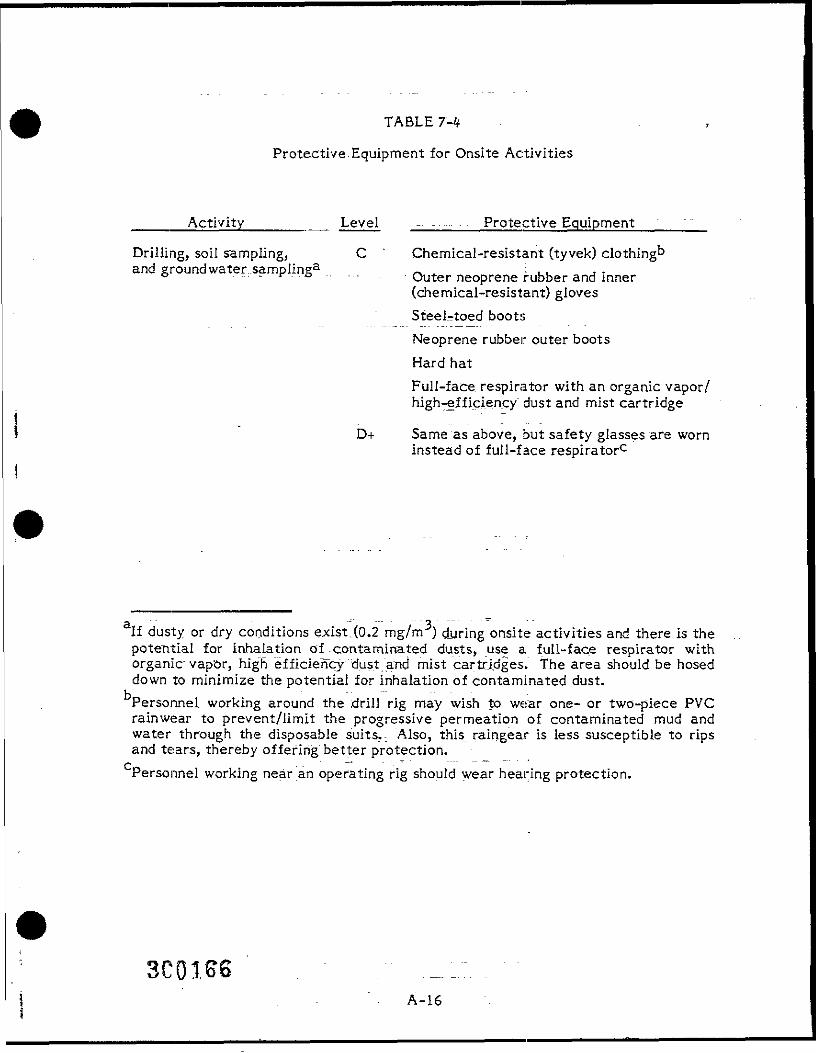
TABLE 7-4
Protective Equipment for Onsite Activities
_____Activity_____ _ Level - - Protective Equipment
Drilling, soil sampling, C ' Chemical-resistant (tyvek) clothing0and ground water .sampling3 - . i ,, . .0 --- - r ..& . . . . . . Outer neoprene rubber and inner
(chemical-resistant) glovesSteel-toed bootsNeoprene rubber outer bootsHard hatFull-face respirator with an organic vapor/high-efficiency dust and mist cartridge
D+ Same as above, but safety glasses are worninstead of full-face respirator0
- - - - - - - Q - - - - - - -
If dusty or dry conditions"exist.(0.2 mg/rrr) during onsite activities and there is thepotential for inhalation of contaminated dusts, use a full-face respirator withorganic" vapor, high efficiencydust."and mist cartridges. The area should be hoseddown to minimize the potential for inhalation of contaminated dust.Personnel, working around the drill rig may wish to wear one- or two-piece PVCrainwear to prevent/limit the progressive permeation of contaminated mud andwater through the disposable suits.- Also, this raingear is less susceptible to ripsand tears, thereby offering better protection.. _j _.Personnel working near an operating rig should wear hearing protection.
3C01.66A-16
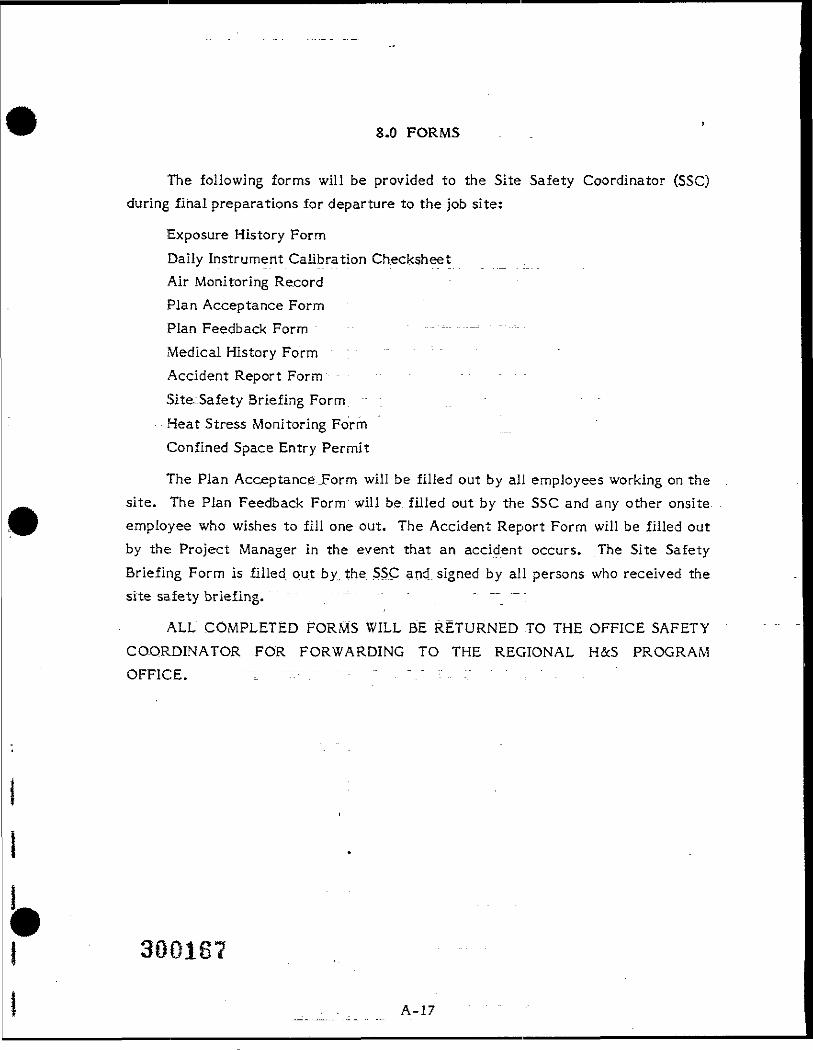
S.O FORMS
The following forms will be provided to the Site Safety Coordinator (SSC)during final preparations for departure to the job site:
Exposure History FormDaily Instrument Calibration ChecksheetAir Monitoring RecordPlan Acceptance FormPlan Feedback Form ^ ~; -Medical History Form - - - - - - -Accident Report Form - - - - - - !Site-.Safety Briefing Form . 'Heat Stress Monitoring FormConfined Space Entry Permit
The Plan Acceptance .Form will be filled out by all employees working on thesite. The Plan Feedback Form will be filled out by the SSC and any other onsiteemployee who wishes to fill one out. The Accident Report Form will be filled outby the Project Manager in the event that an accident occurs. The Site SafetyBriefing Form is filled, out by_the. SSC and signed by all persons who received thesite safety briefing. " "" . " ~ " " . - . — — .
ALL COMPLETED FORMS WILL BE RETURNED TO THE OFFICE SAFETYCOORDINATOR FOR FORWARDING TO THE REGIONAL H&S PROGRAMOFFICE. " " — I " -------- • - . - . - v . . : ; • • : - .
300187
A-17
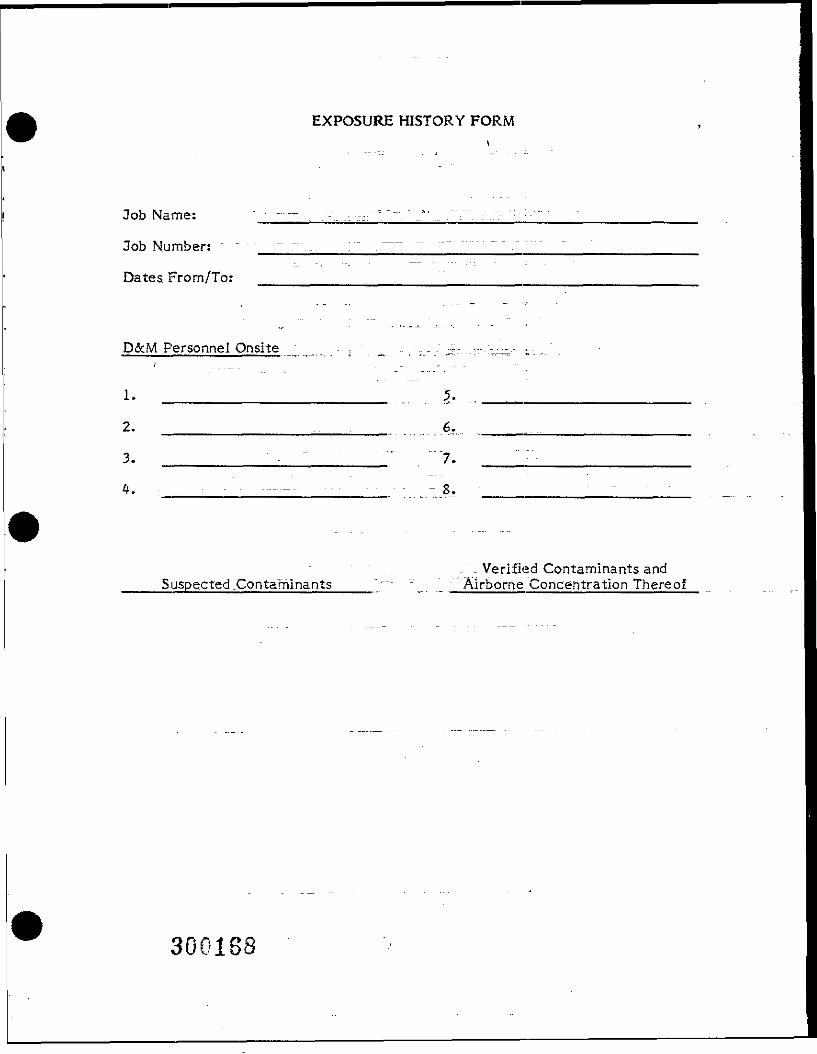
EXPOSURE HISTORY FORM\
Job Name:
Job Number:
Dates. From/To:
D&M Personnel Onsite , _ - -,-..— --"--' _ . -
l. _______________..... 3,2. _______________________. ....... 6-
3. __________ - , ""7.
4. --— S,
" " ... . ". Verified Contaminants andSuspected .Contaminants '""" ~ Airborne Concentration Thereof
300188
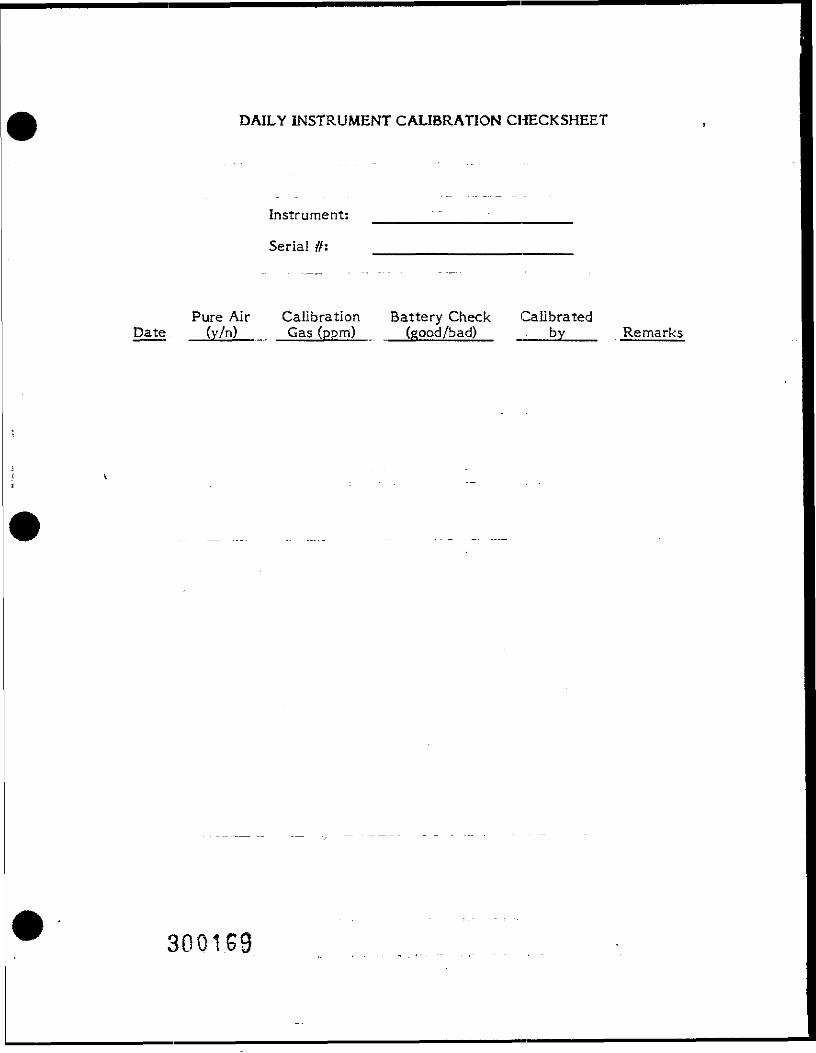
DAILY INSTRUMENT CALIBRATION CHECKSHEET
Instrument:
Serial //:
Pure Air Calibration Battery Check CalibratedDate. ._(y/n) Gas (ppm) (good/bad) by Remarks
3001.69
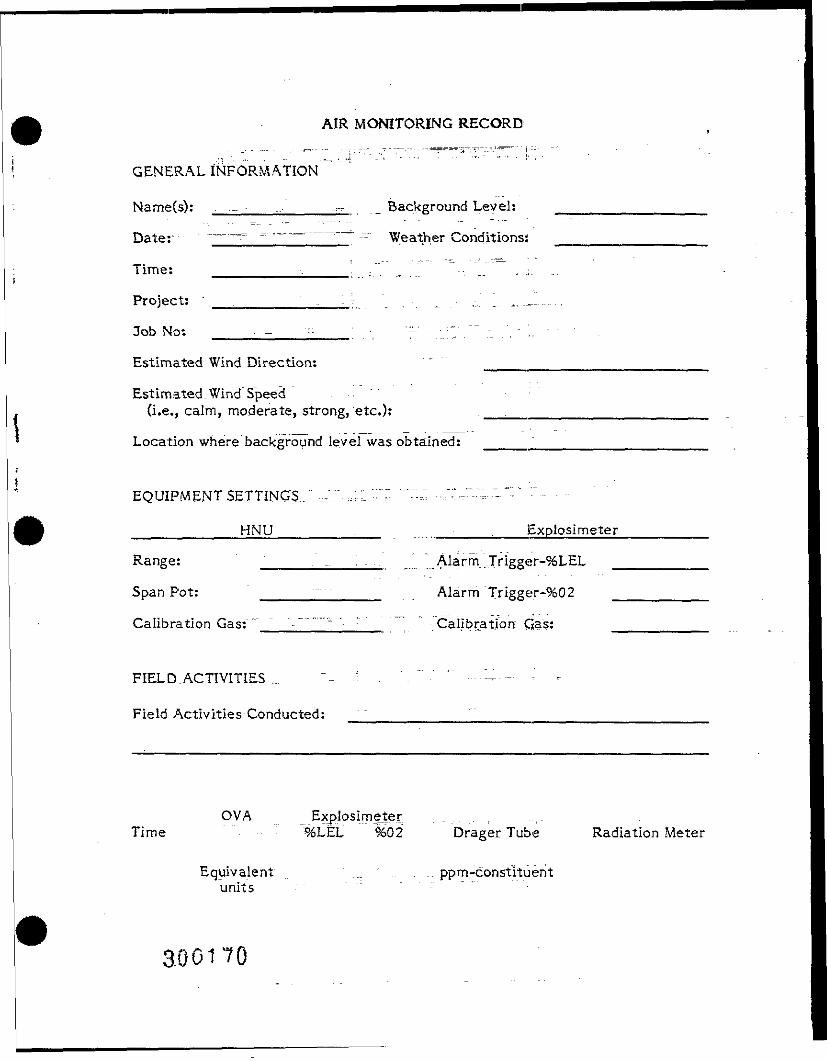
AIR MONITORING RECORD
GENERAL INFORMATION
Name(s): . ._ • ... - ,-.-.- _ Background Level:
Date:1 ~^--^= =- -—-^-——^— ..-- y/eather Conditions;
Time: '_____.____'. ."" a " .--... - .;
Project: '. ______ IT , ^ -_._. _
Job No: ____- -___-: '•-' .;.;"."' ; _ . . " !
Estimated Wind Direction:
Estimated. Wind Spee'd -:(i.e., calm, moderate, strong, etc.):
Location where background level was obtained:
EQUIPMENT SETTINGS.".""-,-."."-':"."-""; "~'-J ..,V^-";----"--v • - • • - -
__________HNU .______- Explosimeter
Range: _____ ! . .. ' Alarm .Trigger-%LEL __
Span Pot: ___________ Alarm Trigger-9602 _
Calibration Gas:""" "" •,---—- • ; -~~ Calibration" Gas:
FIELD ACTIVITIES ._
Field Activities Conducted;
OVA ExplosimeterTime " "- r ""%L£L 9602 Drager Tube Radiation Meter
Equivalent " . . . ' . . . . . pprn-constltuentunits - " ' " " .:
300170
PLAN ACCEPTANCE FORM
PROJECT HEALTH & SAFETY PLAN
Instructions: This form is to be_compJeted by each person to work on the subjectproject work site and returned to the Office Safety Coordinator.
Job No.
Client:
Project:
Location:
Date:
I represent that I have read and understand the contents of the above plan andagree, to perform my work in accordance -with it.
Name (Printed)
Signature
Assigned: Dames & Moore. Office
Date
PLAN FEEDBACK FORM
Job Number:
Job Name:
Date:
Problems with plan requirements:
Unexpected situations encountered:
Recommendations for future revisions:
300172
MEDICAL HISTORY FORM
Name " Allergies . . . . . . . . Other Restrictions
1.- - - - - ; - —— ' ___________________
2. _____ - : -' '•-'•' ' •-"""- — ______________
3. , • : ' . - . " =-"""-""'-'• --' - - -
6
7.
8
9
10.
30C173
ACCIDENT REPORT FORM
To " ...-..-.-.—. -T- ---- — --- - - - - ""prom . _,._
- Telephone (include area code)
Name of Injured or 111 Employee '• ______-___• -- - •____
Date of .Accident Time of Accident Exact Location of Accident
Narrative Description of Accident
Nature of Illness or Injury and Part of Body Involved . Lost TimeYes No
Probable Disability (Check One) . . -Lost Work Day With
Lost Work Day With : _ Days of Restricted No Lost FirstFatal Days Away From Work Activity Work Day Aid Only
Corrective-Action Taken by Reporting Unit
Corrective Action That Remains, to be Taken (by whom and by when)
Name of Supervisor ' ____" "' " " \ Title ,
SignatungUUl t 4_______________ Date. _. .___
SITE SAFETY BRIEFING FORM
Project ..--—-—- -• --- ----- •«- ••— --—• - -'—-• --•Date - •-.. - - - ' Tlrne. '"'."'-.."_'.._'..,. ..- .Job. No.Address — - :Li 5:S --- --~=---i=:".~:" --% ' .-;:->..=-- -= ---— ------ = - ••- -Specific LocationType of Work _
SAFETY TOPICS PRESENTED
Protective Clothing/Equipment "'"L-"'
Chemical Hazards
Physical Hazards
Emergency Procedures
Hospital/Clinic '____"'...-""•' '. '"' ~"~ " - "PhoneHospital Address .__...-. . ~...-- --'-•'~. •• '-—-^^- --— -—— - - - -Special Equipment ~ _______" ' '__________
Other
ATTENDEES
Name (Printed) . - ... Signature
Meeting Conducted by: .„Name (Printed)
Site .Safety Coordinator" "' "."!.. . Team"Leader
300175
HEAT STRESS MONITORING FORM
Date/Time: _
Name: " """" "~~'~ "" - - - Site: ... . . ;
Company: ' : '" -1 -'••• • •• ... ;.- Location:
Pulse Rate Monitoring (30-second reslprior to first measurement):
Starting Time: ~~~~~~ Pulse Rater _„_'.".. .. '" . .. beats/minute
rest 30 sec. •-••-- - .: - • - -- - - -rest 30 ; • _______ b/mrest 30 sec, .".'. '-'• ' • . - • - . . . ---">estTG '."J ________ b/mrest 60 sec. ' --. ' - """rest 60 ,__.,_________ b/m
-,- . - i .. : - - -- -•-• ' . • « - • -
Starting Time: .. ..- .; - Pulse,,Rate,;.. ^ __ _ _i ___ • beats/minute
rest .30 sec. •'•'•''•' .- : ____ /; rest 30 .., ,, .. .______ b/mrest 30 sec.'::' '.. _' " ^ -' "' - Test 60 , ,.________ b/mrest 6-0-sec. __________ _ rest,6p ; _______ b/m
Starting Time: ".T". ...!."''?!.'••".-•-' =-.. Pulse Slate: ,. ,„-... , .. beats/minute
rest 30 sec.,='.::_'. ..-•: : ----- -- - -— --re'st.3Q , , b/mrest 30 sec, -: rest 60 .„__________ b/mrest 60 sec. - ^ rest 60 _ ______ b/m
Starting Time: .____'. '_ Pulse Rate: ._..._ :. , ' . . ' ' beats/minute
rest 30.sec; ' . " ! " ' ' " ". " ""rest'3.0._. .._____. b/mrest 30 sec. -"' "_resr62 '__________ b/mrest 60 sec. •:t=~:..' : :::-"- ' - - "= rest 6F~" " ______ b/m
Method of Measarern'eht: - [_ .. ... „ ,. .., .. _ _ .
Carotid Artery: ' '. " .. ...______ Instrument .(specify type): _____________
Self-Determined & Reported: ___ : ____ -__. ^ .. _...„..,. ._ . . _ . . .
Site Safety Coordinator:Name (Printed) . (Signature)
300176 - ... „:: ... .
^ ATTACHMENT A:
Chemical Hazard Evaluation
(Material safety data sheets are maintained in the project files.)
300177. -, A-l
ATTACHMENT Bt
_ Responsiblli ties
B.I PROJECT MANAGER
The Project Manager will direct onsite investigations and operational efforts.The Project Manager, assisted by the Site Safety Coordinator (SSC), has primaryresponsibility for:
1. Ensuring that appropriate .personnel protective equipment andmonitoring equipment are available and properly used by all onsitepersonnel.
, _ ! . - = • = — — — -
2. "Ensuring that Dames . & Moore personnel receive this plan andunderstand its provisions, are instructed in safe work practices, and arefamiliar with planned emergency procedures*
3. Ensuring that all field personnel hav.e,_had a minimum of 40 hours oftraining. = -. '-'-__ . _ ....... "•" :
4. Ensuring that personnel are aware of the potential hazards associatedwith site operations through their active participation in the initial sitesafety briefing. " " .
5, Monitoring the safety performance of all Dames & Moore personnel toensure that the required work practices,are employed.
6. Correcting any worft practices or conditions that may result in personalinjury, exposure" to hazardous substances, or a release of hazardous.materials to the environment.
7. Preparing any accident/incident reports (see the Accident Report Form)and ensuring that the affected party does the same.
8. Ensuring the completion of Plan. Acceptance and Feedback Forms by allDames & Moore,onsite personnel.
300178B-l
B . 2 SITE-SAFETY COORDINATOR . . .._" _ . . .
The SSC. shall:
1. Implement project 'Health & Safety Plans and report to the ProjectManager for action if there are any deviations from the anticipatedconditions described in the plan and authorize the cessation of work, ifnecessary.
2. Calibrate all monitoring equipment on a daily basis and record resultson the Daily Instrument Calibration Checksheet (see Section S.O).
3. Ensure that all monitoring equipment is operating correctly accordingto manufacturers' instructions and provide maintenance if it is not.
4. Confirm that personnel working onsite have the proper medicalsurveillance program and health & safety training that qualifies them towork at a hazardous waste' site. Also be responsible for identifying allDames & Moore site personnel with special medical problems (i.e.,allergies). .. . ,
5. Conduct and document the initial site safety briefing.
B . 3 PROJECT PERSONNEL . . . . . . , • _ _ - . , . . .
Project personnel involved in onsite investigations and operations areresponsible for:
1. Taking all reasonable precautions to prevent Jnjury to themselves and totheir fellow employees.
2. Performing only those tasks that they believe they can do safely, andimmediately reporting any accidents and/or unsafe conditions to theSSC. • ——-——::- - ; . ---7±.--.—^:.
3. Notifying the Project Manager and SSC of any special medical problems(i.e., allergies) and ensuring that all onsite personnel are aware of anysuch problems.
300179B-2
ATTACHMENT C:
Standard Safe, Work Practices
C.1 GENERAL
1. Eating, "drinking, chewing gum or tobacco, and smoking are prohibited inthe contaminated or potentially contaminated area, or where there is apossibility for the transfer of contamination.
2. Contact with potentially contaminated substances should be avoided.Do not walk through puddles, pools, mud, etc. Avoid, wheneverpossible, kneeling, leaning, or sitting on equipment or the ground. Donot place, monitoring equipment on a potentially contaminated surface(i.e., ground, etc.).
3. Spillage should be prevented, to the extent possible. In the event that aspillage.occurs, contain the liquid, if possible.
4. Splashing of contaminated materials should be prevented.
5. All field crew members should use their senses (all senses) to alert themto potentially dangerous situations (i.e., presence of strong, irritating,or nauseating odors).
6. Field crew members must be familiar with the physical characteristicsof investigations, including:
• Wind direction in relation to the ground zero area• Accessibility to associates, equipment, and vehicles* Communications --• Hot zone (areas of known or suspected contamination)• Site access' ; .. •""""": ,..".""...;..• Nearest, water .sources ..„..,. -"-_.-•"•-,-;:..• Routes and procedures to be. used during emergencies.
7. The number of .personnel and equipment in the contaminated areashould be minimized, but only to the extent consistent with workforcerequirements of safe site operation. The Site Safety Coordinator willestablish exclusion rones on an as-needed basis, in a manner consistentwith safety and plant operations.
C-l
S. All wastes, generated during Dames & Moore or subcontractor activities. at the site must be disposed of as directed by the Project Manager.Wastes from the field investigation will be. stored in RCRA-approvedcontainers and treated or disposed of by a:TSD contractor within 90days. . .
9. No one wearing contact lenses or having a beard will be permitted inthe work area if Level C or higher protection is required.
C.2 DRILLING AND SAMPLING PROCEDURES
The following standard safety procedures should be employed for all drillingand sampling activities: r .., . ,___^__., • .=-- =--
1. All drilling and sampling equipment must be cleaned before proceedingto the site. - :
2, Drilling or sampling equipment must be cleaned after each use. Referto the work plan for instructions.
3. Work in "cleaner" areas should be conducted first, where practical.
4. The minimum number of personnel necessary to achieve the objectives"should be'within 25 feet of. the. drilling or sampling activity.
5. If emergency and backup subcontract personnel are at the site, theyshould remain 25 feet from the drilling or sampling activity, wherepractical.
6. Exclusion zones will be established within designated hot lines.Delineation of a hot line will reflect the interface between areas at orbelow a predetermined hazard or threshold contaminant concentration,based on available data, including the results of monitoring andchemical analyses, information from site personnel regarding historicalsite activities, and general observations. This determination will be.made by the Project Manager in conjunction with the SSC and site-personnel.
C.3 BOAT SAFETY PRACTICES (LAGOON SAMPLING)
1* Two person's will operate the sampling boat, and an onshore supervisorwill be present at all times.
2., All field personnel must wear life preservers.
300181 ,.. - ._ - .- C-2
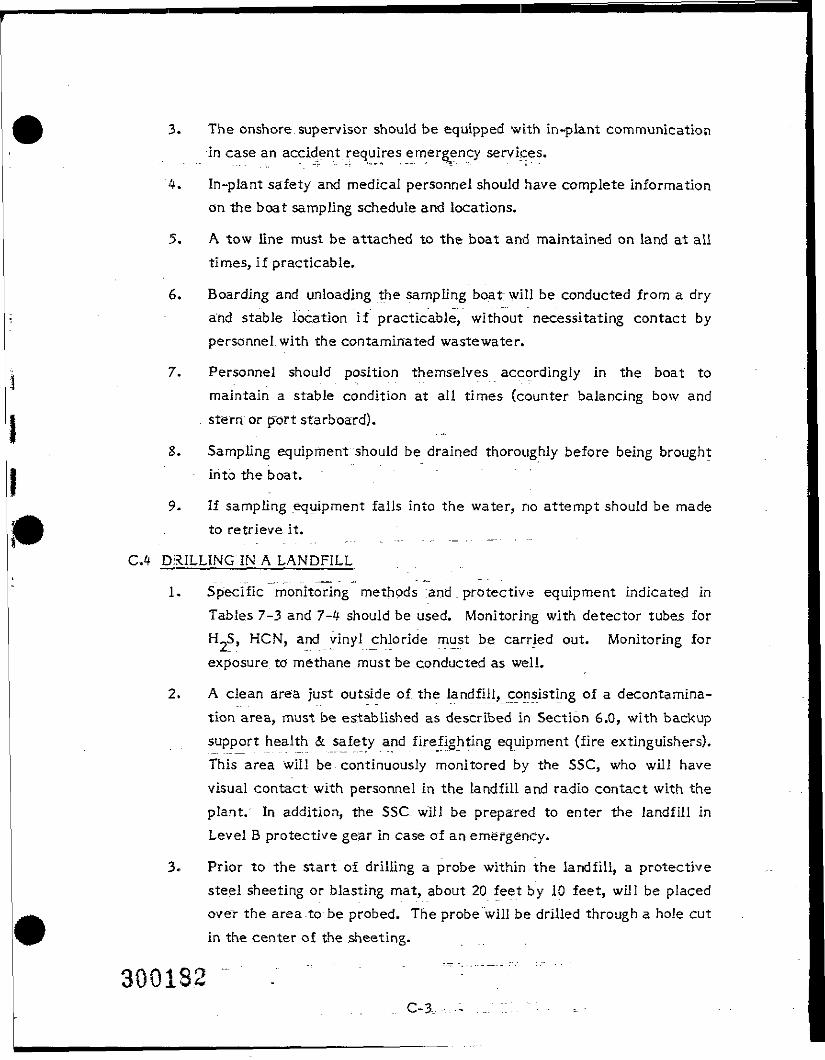
3. The onshore supervisor should be equipped with in-plant communicationin case an accident requires emergency services.
4. In-plant safety and medical personnel should have complete informationon the boat sampling schedule and locations.
5. A tow line must be attached to the boat and maintained on land at alltimes, if practicable.
6. Boarding and unloading the sampling boat will be conducted from a dryand stable location if practicable, without necessitating contact bypersonnel, with the contaminated wastewater.
7. Personnel should position themselves accordingly in the boat tomaintain a stable condition at all times (counter balancing bow andstern or fjort starboard).
8. Sampling equipment should be drained thoroughly before being broughtInto the boat.
9. If sampling equipment falls into the water, no attempt should be madeto retrieve it.
C.4 DRILLING IN A LANDFILL
1, Specific monitoring methods :and . protective equipment indicated inTables 7-3 and 7-4 should be used. Monitoring with detector tubes forH-S, HCN, and vinyl hloride must be carried out. Monitoring forexposure to methane must be conducted as well.
2. A clean area just outside of the iandfill,_consisting of a decontamina-tion area, must be established as described in Section 6.0, with backupsupport health & safety and firefighting equipment (fire extinguishers).This area will be continuously monitored by the SSC, who will havevisual contact with personnel in the landfill and radio contact with theplant. In addition, the SSC will be prepared to enter the landfill inLevel B protective gear in case of an emergency.
3. Prior to the start of drilling a probe within the landfill, a protectivesteel sheeting or blasting mat, about 20 feet by 10 feet, will be placedover the area to be probed. The probe will be .drilled through a hole cutin the center of the sheeting.
C-3-.
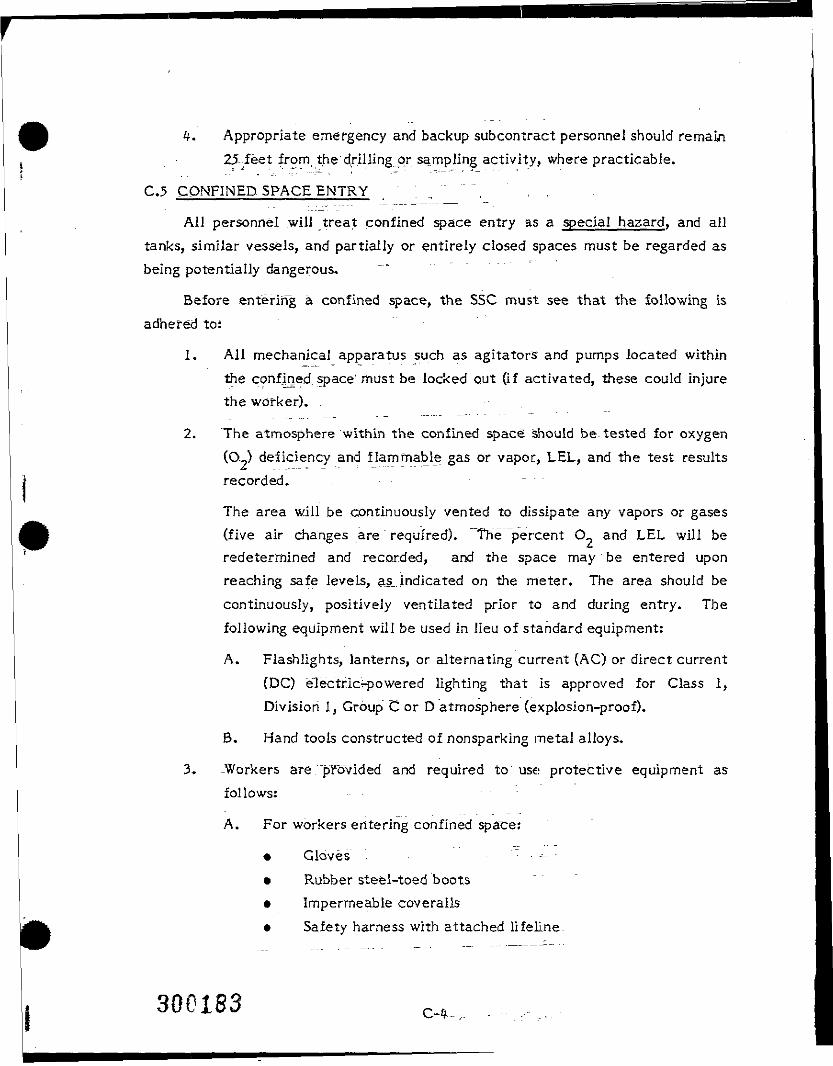
4. Appropriate emergency and backup subcontract personnel should rernam25feet from, t he drilling.or sampling activity, where practicable.
C.5 CONFINED SPACE ENTRY ; _ , " , .
All personnel will treat confined space entry as a special hazard, and ailtanks, similar vessels, and partially or entirely closed spaces must be regarded asbeing potentially dangerous.
Before entering a confined space, the SSC must see that the following isadhered to:
1. All mechanical apparatus such as agitators and pumps located withinthe confined space'must be locked out (if activated, these could injurethe worker).
2. The atmosphere within the confined space should be tested for oxygen(O.~) deficiency and flammable, gas or vapor, LEL, and the test results
,__. _ . _ . _ . _ : : — •- - ------
recorded, -
The area will be continuously vented to dissipate any vapors or gases(five air changes are required). The percent O_ and LEL will beredeterrnined and recorded, and the space may be entered uponreaching safe levels, as_ indicated on the meter. The area should becontinuously, positively ventilated prior to and during entry. Thefollowing equipment will be used in lieu of standard equipment:
A. Flashlights, lanterns, or alternating current (AC) or direct current(DC) eTectricT-powered lighting that is approved for Class 1,Division 1, Group C or D atmosphere (explosion-proof).
B. Hand tools constructed of nonsparking metal alloys.
3. -Workers are "provided and required to use protective equipment asfollows:
A. For workers entering confined space:
• Gloves . ^• Rubber steel-toed boots• Impermeable coveralls• Safety harness with attached lifeline.
300183 C-ft-
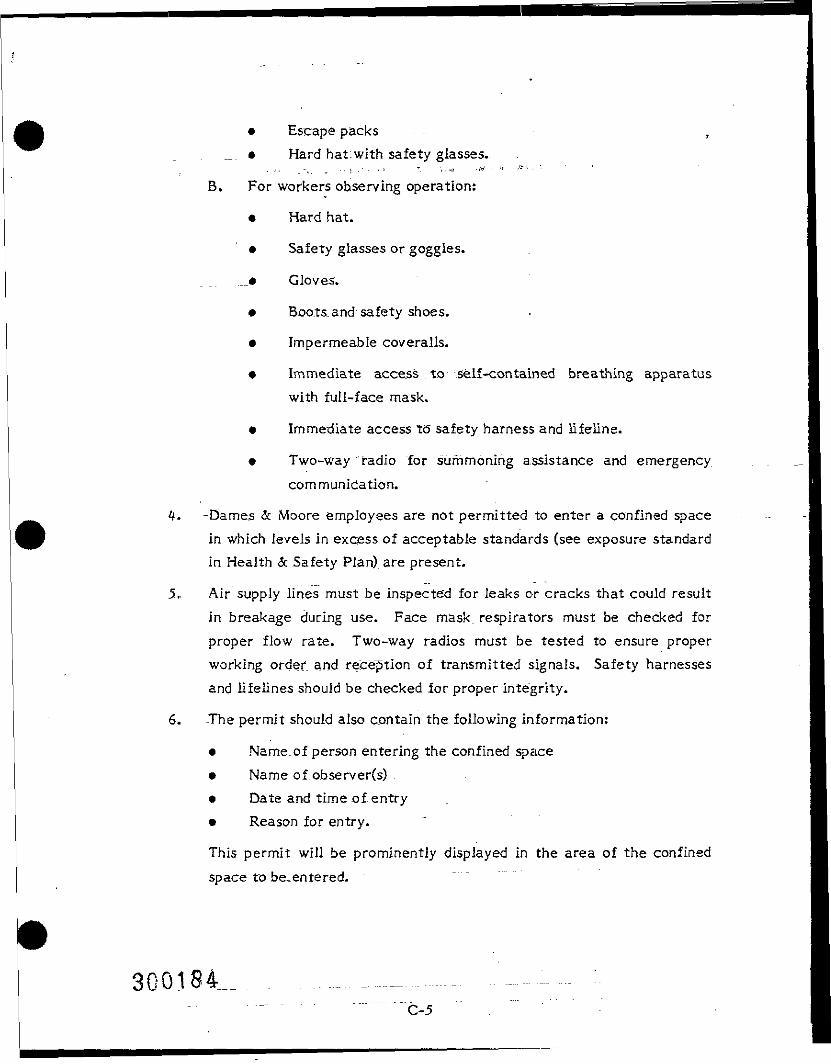
• Escape packs__. • Hard hat:with safety glasses,
B. For workers observing operation:
• Hard hat.
* Safety glasses or goggles.
.__• Gloves.
* Boots and safety shoes.
• Impermeable coveralls.
* Immediate access to "self-contained breathing apparatuswith full-face mask.
• Immediate access to" safety harness and lifeline.
* Two-way radio for summoning assistance and emergencycommunication.
4. -Dames & Moore employees are not permitted to enter a confined spacein which levels in excess of acceptable standards (see exposure standardin Health & Safety Plan) are present.
5- Air supply lines must be Inspected for leaks or cracks that could resultin breakage during use. Face mask, respirators must be checked forproper flow rate. Two-way radios must be tested to ensure properworking order and reception of transmitted signals. Safety harnessesand lifelines should be checked for proper integrity.
6. The permit should also contain the following information:
• Name, of person entering the confined space• Name of observer(s)• Date and time of entry• Reason for entry.
This permit will be prominently displayed in the area of the confinedspace to be^entered.
300184__. . —C-5
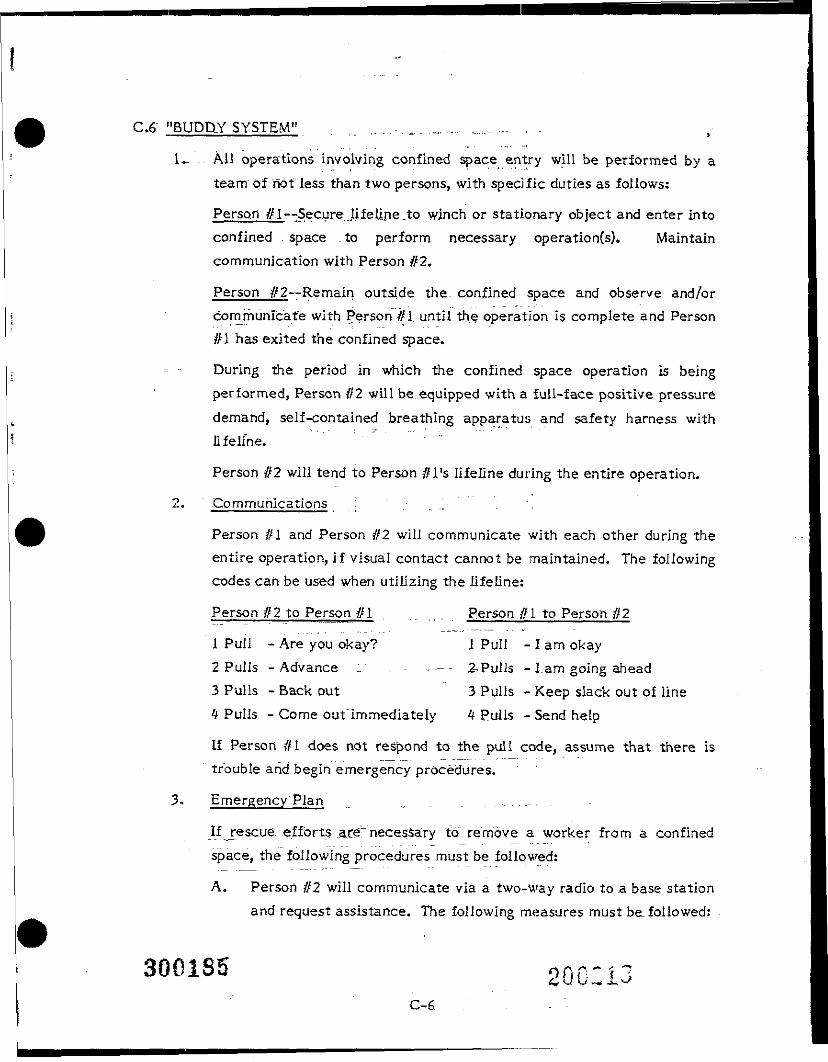
C.6 "BUDDY SYSTEM"
1- - All operations involving confined space entry will be performed by ateam of not less than two persons, with specific duties as follows:
Person #1—Secure lifeline .to winch or stationary object and enter intoconfined space to perform necessary operation(s). Maintaincommunication with Person #2,
Person #2—Remain outside the confined space and observe and/orCommunicate with Person #1. until the operation is complete and Person#1 has exited the confined space.
During the period in which the confined space operation is beingperformed, Person #2 will be_equipped with a full-face positive pressuredemand, self-contained breathing apparatus and safety harness withlifeline.
Person #2 will tend to Person //I's lifeline during the entire operation.
2. .Communications : . . . . ! .
Person #1 and Person #2 will communicate with each other during theentire operation, if visual contact cannot be maintained. The followingcodes cah be used when utilizing the lifeline:
Person ft 2 to Person #1 . . . . Person //i to Person #2
1 Pull - Are you okay? "" 1 Pull - I am okay2 Pulls - Advance : . - - - - 2Pulls - I am going ahead3 Pulls -Back out 3 Pulls - Keep slack out of line4 Pulls - Come out immediately 4 Pulls - Send help
If Person #1 does not respond to the pull code, assume that there istrouble and begin emergency procedures.
3* Emergency Plan _ ..........
If jescue. efforts a:re~necessary to" remove a worker from a confinedspace, the following procedures must be followed:
A. Person #2 will communicate via a two-way radio to a base stationand request assistance. The following measures must be. followed:
300185 200:13C-6 •
1. Give the location. ,
2. Bring emergency oxygen supply and first-aid kit.
3. Bring self-contained air supply with full-face mask, safetyharness, and lifeline.
4. Call for professional medical assistance.
^ — BEFORE^EGINNING^RESCUE, CONFIRM THAT COMMUNICA-TION WAS RECEIVED AS TRANSMITTED AND THAT ASSIST-ANCE IS FORTHCOMING.,.. " ...... .
B. If Person #l's lifeline is .secured to a winch, begin hauling Person, //I out of the confined space. This procedure must be performedat a speed that will not further injure Person //I.
C. If the lifeline is not secured to a winch, Person #2 will securelifeline and enter the continued space wearing SCBA.
ALWAYS SUMMON ASSISTANCE BEFORE BEGINNING AR'ESCUE ATTEMPT.
4. Reporting
Upon completion Of the confined space entry operation, the permitshould be completed, indicating the amount of time the worker orworkers were inside the confined space. This report (permit) is sent tothe Regional Health &_ Safety Manager.
SC0186C-7
ATTACHMENT D:
Emergency Procedures
D.I .CONTACTS
Should any emergency require outside or support services, the appropriatecontacts should be made by the SSC. The list of appropriate contacts is given inSection 4.1.
D.2 PROCEDURES ,, • - . . . _ • - , ; _ - - " , - --„
In the event that an emergency develops onsite, the procedures delineatedherein are. to be immediately followed. Emergency conditions are considered toexist if: . • . ~
• Any member of the'field crew is involved in an accident or experiencesany adverse exposure symptoms while onsite, or
• A condition is discovered that suggests the existence of a situationmore hazardous than anticipated.
The following emergency procedures should be followed:
1. Personnel onsite should use the "buddy system" (pairs). The team shouldprearrange hand signals or other emergency 'signals for communicationin case of lack of radios or radio breakdown (see the following items):
• Hand gripping throat: Out of air, can't breathe.
• Gripping partner's wrist or placing both hands around waist:_ Leave area immediately, no debate.
• Hands on top of head: Need assistance.
• Thumbs up: Okay, I'm alright, I understand.
• Thumbs down: No, negative.
2. Site •: "work area entrance and exit routes should be planned, andemergency escape routes'should be -delineated by the SSC.
3. Visual contact should be maintained between "pairs" onsite, with theteam Temainlng in proximity to assist each other in case ofemergencies'.""". ~" " '•• - -— •
300187
4. In the event'that any member of the field crew expriences any adverseexposure symptoms while onsite, the entire field crew shouldimmediately halt work and act according to the instructions provided bythe SSC. -__ -_ ..-.-~^...^------7--~^---- -] ' -
5. Wind indicators visible to all onsite personnel should be provided by theProject Manager to indicate possible routes for upwind escape.
6. The discovery of any condition that would suggest the existence of a"situation more hazardous than anticipated should result in theevacuation of the field team and re-evaluation of the hazard and thelevel of protection required.
7. In the event that an accident occurs, the Project Manager and theinjured person are to complete an Accident Report Form for submittalto the OSC/wno will forward a copy to the Regional Health &. SafetyManager and the Firmwide Health. & Safety Director. The OSC shouldensure that follow-up action is taken to correct the situation thatcaused the accident.
S. In the event that an accident occurs, the Project Manager and theinjured person are to complete an Accident Report Form for submittalto the manager (Partner (Ltd.)) oi the office. The manager shouldensure, that follow-up action is taken to correct the situation thatcaused the accident.
D-2
ATTACHMENT E:
Heat Stress/Cold Stress
If site work is to be conducted during the winter, cold stress is a concern inthe health and safety of personnel. Of special note for cold stress on this site isthe wearing of tyvek suits, t Disposable clothing does: not breathe; therefore,perspiration cannot evaporate. During strenuous physical activity, an employee'sclothes can become wet. Wet clothes combined with cold temperatures can lead tohypothermia. If the air temperature is less than 40°F and an employee perspires,the employee must change to dry clothes. The onsite heated trailer facility or apersonnel vehicle may be used as a change area.
If site work is to be conducted during the summer, heat stress is a concern inthe health and safety of personnel. Persons required to wear protective equipmentwill be allowed the following rest periods when, wet bulb temperatures fall withinthe indicated ranges:
• 76-80°F: jLSLrninutes each hour• SO-85PF: 3D minutes each hour* S5-90°F: 45 minutes each hour• Over 90°F: No work
When the wet bulb glove temperature exceeds 75°F, the heart rate of eachperson using protective equipment who is working in the field activities zone willbe taken by the SSC when that person leaves the zone (see.Heat Stress MonitoringForm). If the heart rate of a person exceeds 90 plus his/her age in years, or amaximum of 160 beats per minute, the individual will be required to take a restperiod. All persons working in the field activities zone will be trained to recognize-the signs and symptoms of heat-related illness, to prevent such a situation, and toprovide first aid for such illnesses.
Water will be made available to personnel, and Its use will be encouraged.
300183
E-l
ATTACHMENT F:j
.:. "; Respirator Care•• . -i . . ; • , - • • • - • • & • ~-*' • - < - - - - _ •
Respirators belong to, and are only used and maintained by, the individual towhom they have been issued. Each Dames & Moore employee who anticipatesworking onsite must be trained, fit-tested, and declared medically fit to wearrespiratory equipment"prior to participating in field activities. Proper methods forrespirator selection, use, and maintenance are- defined in the Dames &. Moore.Respiratory Protection Manual.
300130
F-l
•u•Dm2OXCD
APPENDIX B
Standard Operating Procedures
•300191ft
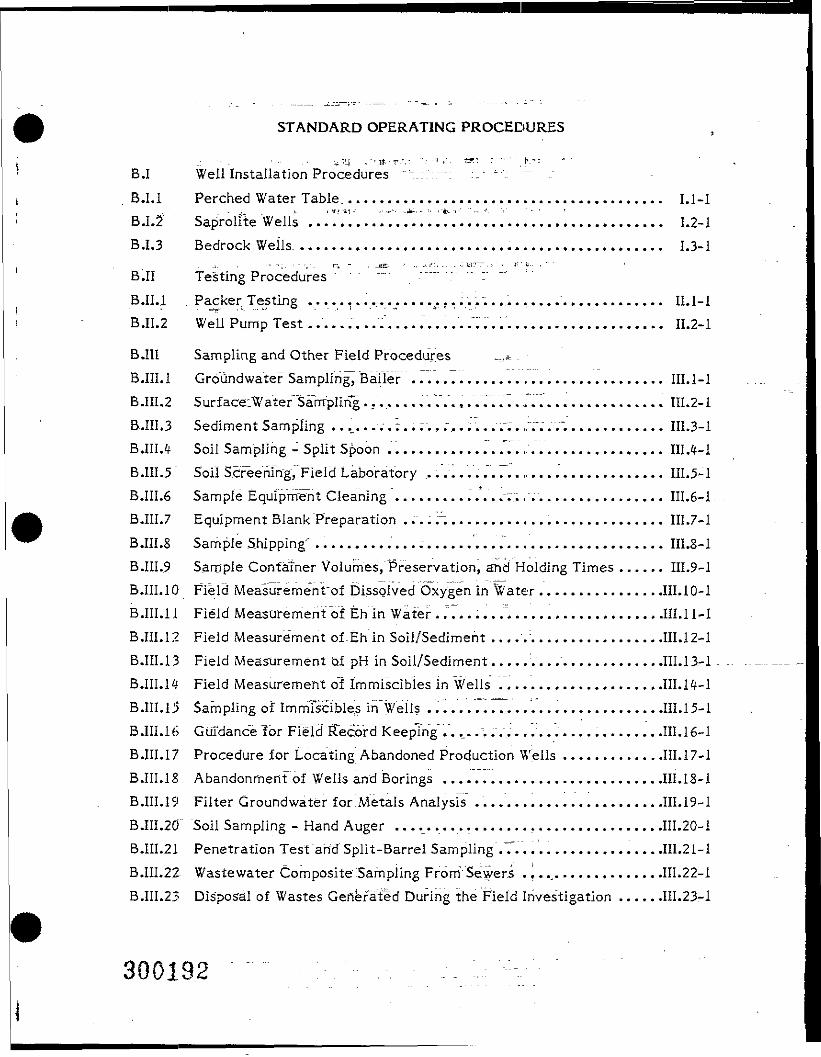
STANDARD OPERATING PROCEDURES
B.I Well Installation Procedures '"-..:::.-'•'-. -..- "•": "B.I.I Perched Water Table......................................... 1.1-1B.I.2: Saprolite Wells ..... 1.......t............................... 1.2-1B.I.3 Bedrock Wells .............................................. 1.3-1
• - - ; . • - • . - . r-i ,- . .JSK. - ., us-.. .. . -:V,T— ,-,- • I'" t'- . - 'B.II Testing Procedures " """ - — •••• :
B.II.l . Packer, Testing ................................................ II.l-lB.II.2 Well Pump Test.... .V.................. 7.................... II.2-1
B.III Sampling and Other Field Procedures ^B.III.1 Gro~uhdwater Sampling, Bailer ................................ III.1-1B.III.2 SurfaceiWater"Sampling . 7..."."...."..V.",, .777." 1. J................. III.2-1B.III.3 Sediment Sampling ..._..... r..;...",........ ,,W."."............. III.3-1B.III.4 Soil Sampling - Split Spoon ................. „................. HI.4-1B.111.5 Soil Screening, Field Laboratory ................................ III.5-1B.III.6 Sample Equipment Cleaning .........."."."...................... III.6-1B.III.7 Equipment Blank Preparation ....,~............................ III.7-1B.111.8 Sample Shipping" ................... 7........................ III.S-1B.III.9 Sample Container Volumes, Preservation, ana1 Holding Times ...... III.9-1B.III.10 Field Measurement'of Dissolved Oxygen in 'Water ................111.10-1B.III.11 Field Measurement "oi Eh in Water . .7..... 7....................HI. 11-1B.HI.12 Field Measurement of.Eh in Soil/Sediment ... .7.................111.12-1B.III.13 Field Measurement of pH in Soil/Sediment..,...................111.13-1B.III.14 Field Measurement of Immiscibles in Wells .................... .111.14-1B.III.15 Sampling of ImmTscibles ifTWeils". - - - .'7.7 77.. 7/................111.15-1B.III.16 Guidance for Field Record Keeping .. . ..;..................... .111.16-1B.III.17 Procedure for Locating Abandoned Production Wells .............111.17-1B.III.IS. Abandonment of Wells and Borings ............................HI.18-1B.III.19 Filter Groundwater for^Metals Analyst ........................III.19-1B.III.20 Soil Sampling - Hand Auger ..................................111.20-1B.111.21 Penetration Test and Split-Barrel Sampling .77. 7................111.21-1B.IIL22 Wastewater Composite5ampiing From Sewers . |.................III.22-1B.III.23 Disposal of Wastes Generated During the Field Investigation ......111.23-1
300192
B.IV Field Monitoring InstrumentsB.IV.l Photoionization Detector—HNu Meter ......................... IV.1-1B.IV.2 pH Meter .................................................. IV.2-1B.IV.3 Conductivity Meter ............. ...*_,......................... IV.3-1B.IV.4 Thermometer ...................".'....."............. 7........ IV.4-1.B.IV.5 Eh Meter .................................................. IV.5-1B.IV.6 Dissolved Oxygen Meter ..................................... IV.6-IB.IV.7 Water Level Meter(s) ....... 7................................ IV.7-1
B.V Bioassessment Procedures . . -B.V.I Ambient Aquatic,Toxicity Testing . ."7.......................... V.l-1B.V.2 Wetland/Upland Delineation and Characterization Procedure ...... V.2-1
300193
SOP NUMBER: BJ.l
TITLE: . ..Perched Water Table Well Installation Procedures
SCOPE;: This operating procedure describes drilling and installation~ of monitor wells in the perched water table formation thatunderlies the Virginia Wood Preserving Site. (See the figureat the epjd, of this section.) A Dames & Moore hydro-geoiogist shall monitor all well drilling and constructionactivities," prepare lithologic logs during well construction,and monitor air. quality using procedures described inAppendix A.
OBJECTIVES: "" "The activities covered by this procedure assure constructionof monitor wells which will:
• Provide representative samples of groundwater for-analysis,
• Permit collection of representative water level data,and
• Effectively isolate the separate hydrogeologic strata.._ . ..,— penetrated during"drilling.
EQUIPMENT: • Drilling rig, drilling tools, arid support truck withwater tanks
• Steam cleaner , _, .......
• GrouTplant"and tremie'pipe
• Portland cement, Types I through V
• Powdered bentonite .
* Tri-Loc well casing and screen, 2-inch, stainless steel......... _._wjtn cap ancj bottom plug.
• Bentonite pellets
• Washed 20/30 quartz sand for filter pack
• Protective casing (4-inc J * **a«;ter No. 3 padlock
I.I-l
* Concrete mix
• Reinforcing wire meshPROCEDURE: ... ~ "--.- .: - ^- - -^ --
ST£A.M "CLEANING REQUIREMENTS
1. Prior to starting first well, steam clean thedrilling rig, drilling tools, support truck, watertanks (inside), and well casing and screen for thefirst well. Use County-treated water for steamcleaning.
2. Cover steam-cleaned drilling tools, well casing,and screen with new clean plastic sheeting
" before moving to the well location.
3. ". Steam clean all drilling tools, well casing, andscreen, if appropriate, prior to moving onto eachwell location after the first well. Cover these
items with clean plastic sheeting.
AT EACH SHALLOW WELL
1. Drill a nominal 6-inch borehole with hollow-stemaugers to the top of the hardpan. Collectcontinuous soil samples by conducting standardpenetration "tests (ASTM D-1586) from the landsurface to.j& inches Into the top of the hardpan.
2. The Dames <!c Moore hydrogeologist shall prepareIlthologic, descriptions of the soils encounteredduring drilling in accordance with the UnifiedSoil Classification System (USCS). (Note:During construction of__well DM-1SA, two soilsamples will be collected following SOP B.III.4.One sample will be from the surface, the otherfrom just above the hardpan.)
300195
1.1-2
3. Flush the drilling fluid from the borehole with 'County-supplied water. All drilling fluid wastesfrom the field investigation will be stored in
_ ._RCRA-approved containers prior to testing anddisposal. Based on the test results, the waterwill either be discharged to the sanitary sewer ordisposed of as a RCRA waste.
4, : Once the hole, drilled slightly into the.top of the^ ;L hardpan, is flushed, open, and stable with the
augers still in place, install and center a stringof 2-inch stainless-steel well casing and screenin the borehole. The screen length will dependupon the .aqui fer thickness. The screen willstraddle, the water table and extend into the topof the hardpan layer. Allow approximately 2.3feet of stlckup.
5. Install 20/30 sand in the annular space aroundthe well screen to approximately 3 feet abovethe top of the screen. The Dames & Moorehydrogeologist will verify placement of the sandby measuring the depth to the top of the fill witha weighted tape measure. Pull the auger backslowly to minimize the disturbance to the sandpack.
6. Install a bentonite pellet seal, 3 feet thick on topof the sand filter pack. The Dames & Moorehydrogeologist will verify placement of the ben-
— - tonite seal by measuring the depth to the top of -the fill with a weighted-tape measure. Pull theauger back slowly to minimize the chance ofcompromising the bentonite seal.
7. Fill the annular space with cement grout mixedaccording to the manufacturer's specifications.
1.1-3
30019?
Grout shall be pumped through a tremie pipe'• ' : with the tremie pipe placed approximately 2 feet
above the bentonite sea].
S. When the grout has filled the annular space, thehollow-stem augers shall be slowly removed one5-foot section at a time. As each 5-foot sectionis removed, grout shall be added as frequently asnecessary to maintain the level of grout at land
- - surface. ... — .. -
9. Install the-protective casing. Allow approxi-mately 2.5 feet of stickup. Install a locking capon the protective casing.
10. : After the grout has cured, develop the well bysurge block and pumping. Continue developmentto remove five times the volume of water ordrilling fluid lost..during well construction anduntil the well produces apparently clear water orfor a maximum "of 2 hours.
11. Install a concrete, pad, 2 feet square, 6 inchesthick, and flush, with the ground surface at theperimeter""ofT'the .pad. The pad shall be con-"structed of concrete reinforced with wire meshand shall be: shaped to direct drainage away fromthe well. Pads may be constructed followingcompletion of all wells at the Site.
12. For these shallow wells, the screen will beinstalled so that approximately 3 feet of screenextend above" rthe static water level to allowseasonal fluctuations within the screened inter-val. Where the water table is shallow, theconstruction dimensions described above will bemodified as needed to keep "the top of the.screenabove the water table. For example, the amount
1.1-4
of sand above the screen can be reduced to 6;-.— , .: .=-.. _ .- inches _a_s_. .can . the bentonite seal, thus
accomodating^ a _water table as shallow as 4.5feet. Should the water table be encountered atstill shallower depths, the bentonite seal thick-ness could be, reduced to as little as 2 inches andthe depth of cement grout reduced. Though theabsolute integrity of the well would be somewhatcompromised, this would not be a concern in thisinstance because surface infiltration along the
- — - - - -well to such a shallow water table would be nodifferent than that through adjacent soil, andgroundwater samples from the well would berepresentative of the shallow aquifer. Proposedwell construction is illustrated on the followingpage. All details of well construction will benoted on a well diagram and placed in theproject files.
REFERENCES ......_.. - .........._:: . . . . . . . . .
EPA OSWER, October 1987, Compendium of Superfund Field Operations Methods,EPA Office of Solid Waste and Emergency Response, Directive 9355, 0-14("Compendium").
3001981.1-5
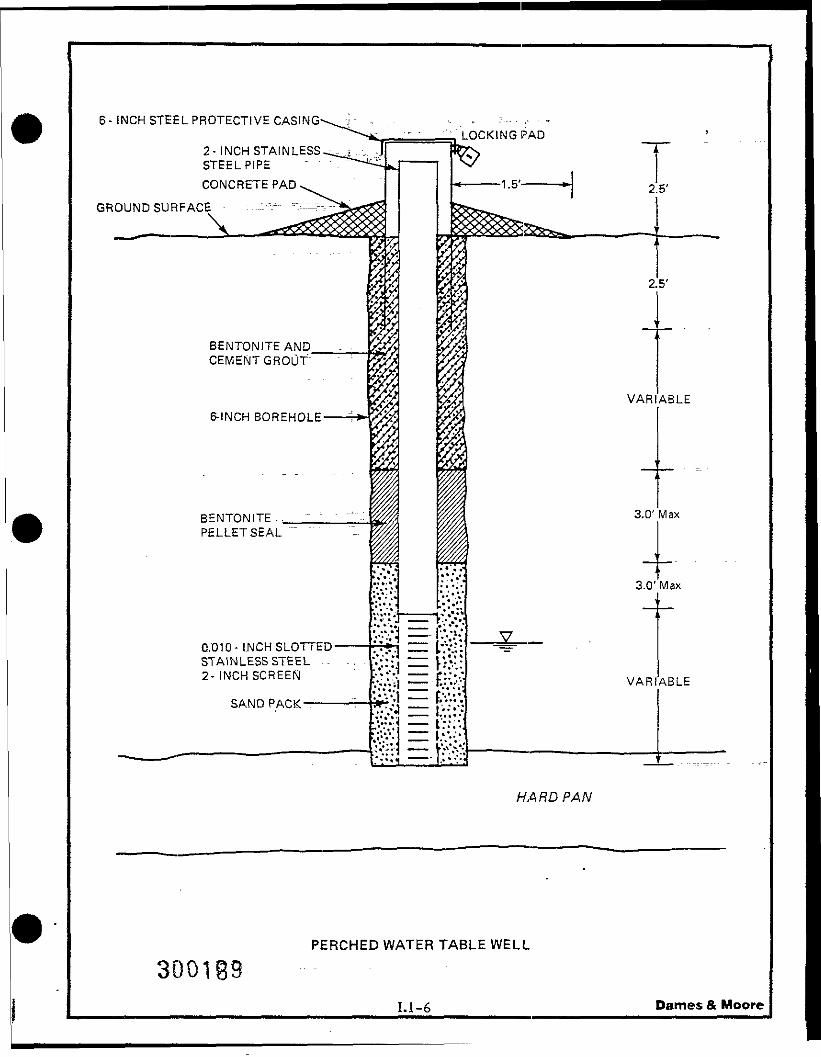
6 - INCH STEEL PROTECTIVE
2-INCH STAINLESSSTEEL PIPECONCRETE PAD
GROUND SURFACE
_ \
BENTONITE ANDCEMENT GROUT"
6-INCH BOREHOLE
BENTONITE -PELLET SEAL
0/010- I.NCH SLOTTEDSTAINLESS STEEL ..2- INCH SCREEN
SAND PACK
PERCHED WATER TABLE WELL
3001891.1-6 Dames & Moore
SOP NUMBER: B.I.2 . _
TITLE: " : Saprolite Well Installation Procedures
SCOPE: This operating procedure describes drilling and installation- , .,. .of monitor wells, into_the saprolite at the Virginia Wood
Preserving Site. "(SeVthe figure at the end of this section.)A Dames & Moore hydrogeologist shall monitor all welldrilling and construction activities, prepare lithogic logsduring well construction, and monitor air quality usingprocedures described in Appendix A.
OBJECTIVES: The act! vities= covered by this procedure assure constructionof monitor "wells which will:
.._ •-------• • .Provide representative samples of groundwater foranalysis,
• Permit collection of representative water level data,- - -and
• Effectively isolate- the. separate hydrogeologic .stratapenetrated during drilling.
EQUIP'MENT: • .... Drilling rig, drilling tools, and support truck withwater tanks
• Steam cleaner
• Grout plant and tremie pipe
• Portland cement, Types I through V
• Powdered bentonite ..___
• Tri-Loc well casing and screen, 2-inch, stainless steelwith cap and bottom plug.
• Bentonite pellets
• Washed 20/30 quartz sand for filter pack.
• Steel casing (8-inch) and Master No. 3 padlock
• Concrete mix "™~" =
300200
1.2-1
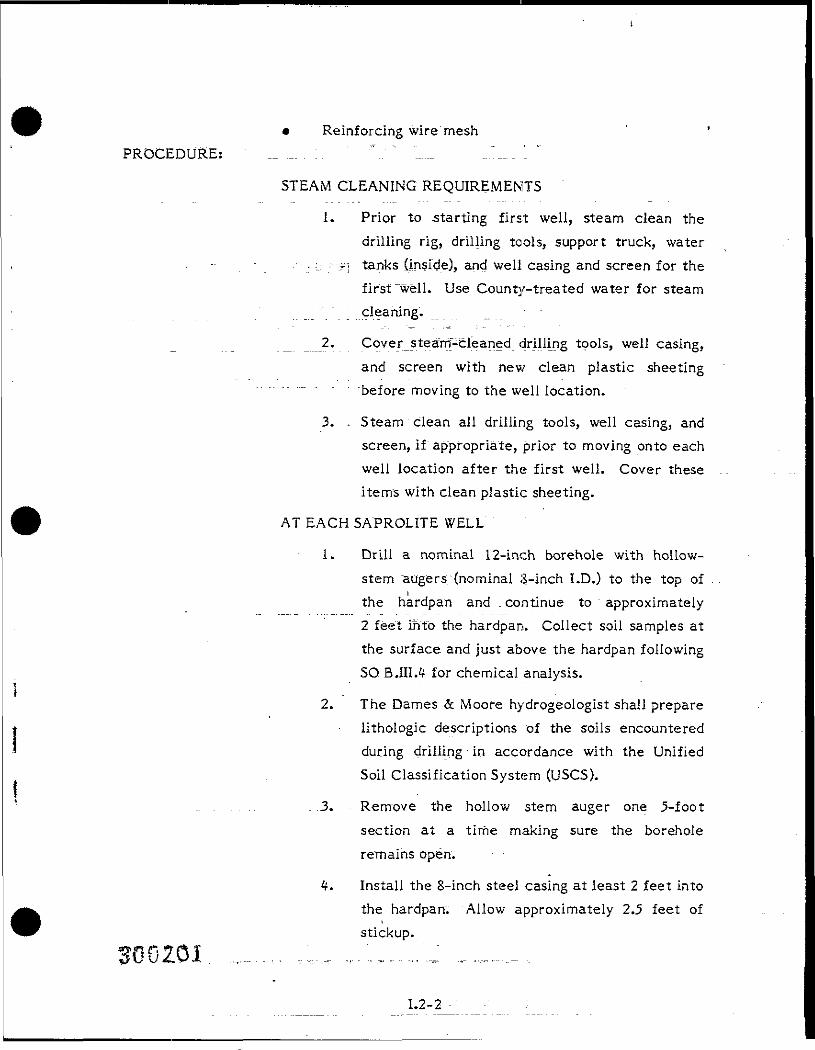
• Reinforcing wire meshPROCEDURE: _ _. . :. *.. "...._ _;_. '. '
STEAM CLEANING REQUIREMENTS
1. Prior to -starting first well, steam clean thedrilling rig, drilling tools, support truck, water
. • • _ • ••_- •; .--?] tanks (inside), and well casing and screen for thefirst "well. Use County-treated water for steamcleaning.
_ 2. Cover steaiTf-cleaned drilling tools, well casing,and screen with new clean plastic sheetingbefore moving to the well location.
3. , Steam clean all drilling tools, well casing, andscreen, if appropriate, prior to moving onto eachwell location after the first well. Cover theseitems with clean plastic sheeting.
AT EACH SAPROLITE WELL
1. Drill a nominal 12-inch borehole with hollow-stem "augers (nominal 3-inch I.D.) to the top ofthe hardpan and . continue to approximately2 feet into the hardpan. Collect soil samples atthe surface and just above the hardpan followingSO B.111.4 for chemical analysis.
2. The Dames & Moore hydrogeologist shall preparelithologic descriptions of the soils encounteredduring drilling in accordance with the UnifiedSoil Classification System (USCS).
. . . . . . . .3. Remove the hollow stem auger one 5-footsection at a time making sure the boreholeremains open.
4. Install the 8-inch steel casing at least 2 feet intothe hardpan. Allow approximately 2.5 feet ofstickup.
-rtT
1.2-2
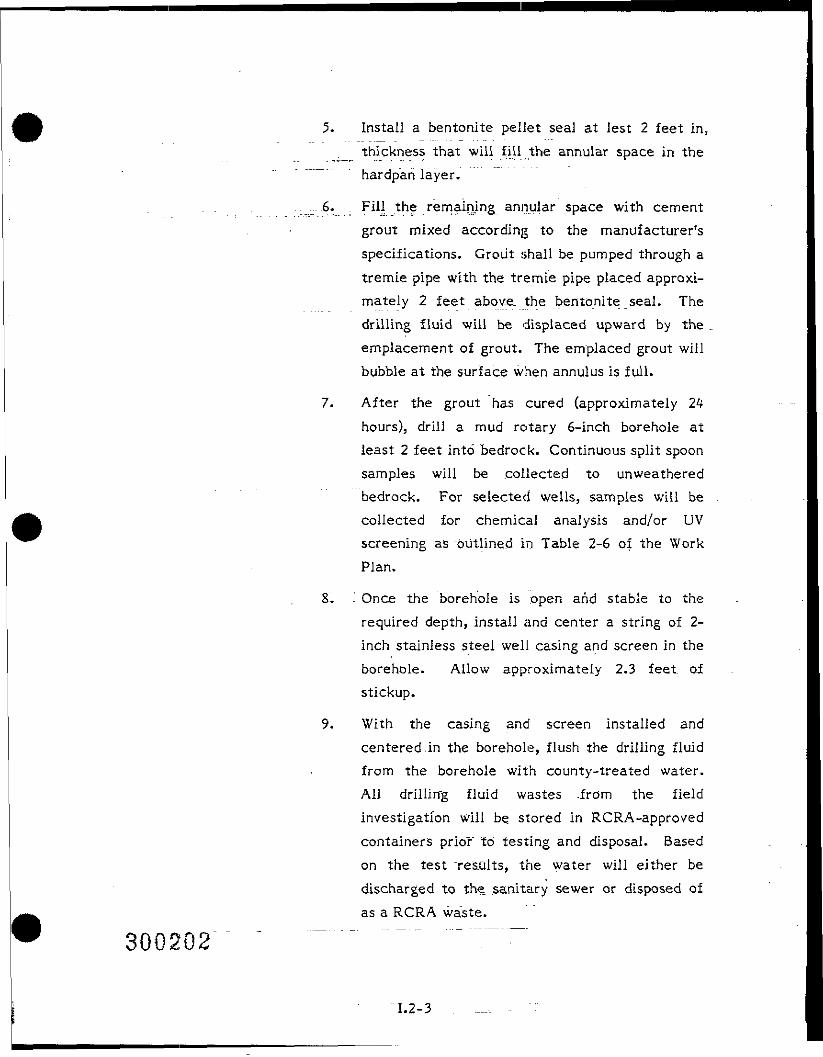
5. Install a bentonite pellet seal at lest 2 feet in,thickness that will fill the annular space in the
"™~"" hardpan layer.
.. 6. . Fill the remaining annular space with cementgrout mixed according to the manufacturer'sspecifications. Grout shall be pumped through atremie pipe with the tremie pipe placed approxi-mately 2 feet above, the bentonite seal. Thedrilling fluid will be displaced upward by the .emplacement of grout. The emplaced grout willbubble at the surface when annulus is full.
7. After the grout has cured (approximately 24hours), drill a mud rotary 6-inch borehole atleast 2 feet into bedrock. Continuous split spoonsamples will be collected to unweatheredbedrock. For selected wells, samples will becollected for chemical analysis and/or UVscreening as "Outlined in Table 2-6 of the WorkPlan.
8. - Once the borehole is open and stable to therequired depth, install and center a string of 2-inch stainless steel well casing and screen in theborehole. Allow approximately 2.3 feet ofstickup.
9. With the casing and screen installed andcentered.in the borehole, flush the drilling fluidfrom the borehole with county-treated water.Ail drilling fluid wastes .from the fieldinvestigation will be stored in RCRA-approvedcontainers prior to testing and disposal. Basedon the test "results, the water will either bedischarged to the_ sanitary sewer or disposed ofas a RCRA waste.
300202 " """" "" -----
1.2-3
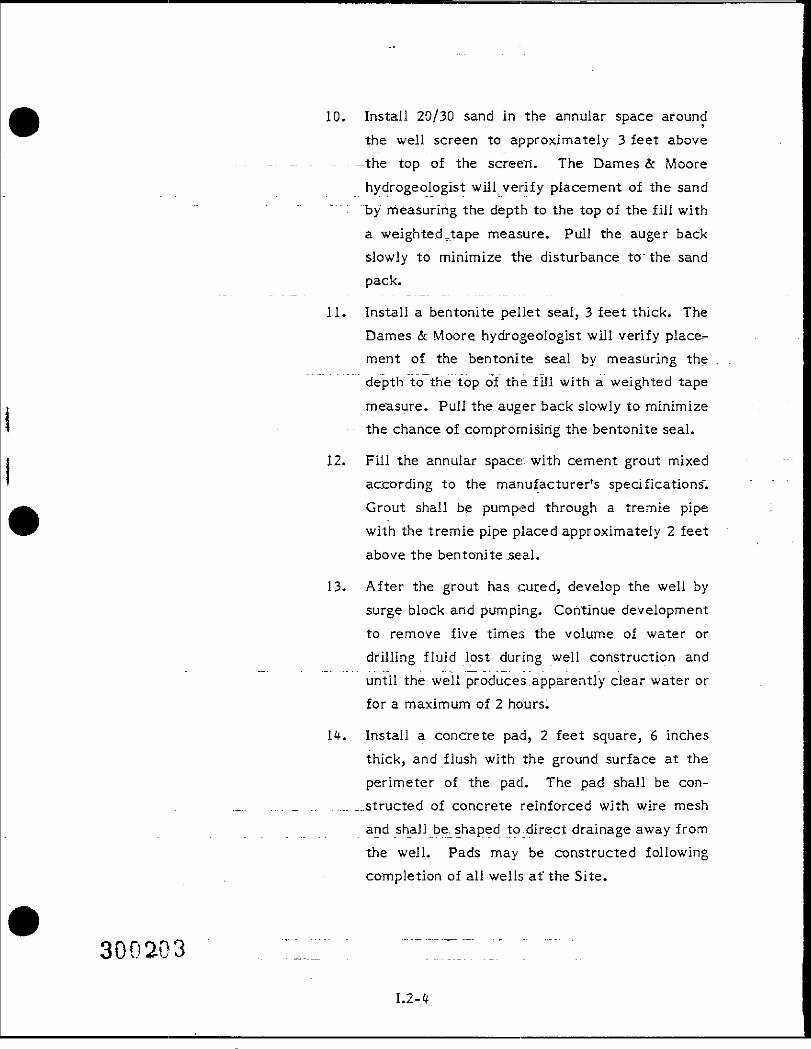
300203
10. Install 20/30 sand in the annular space aroundthe well screen to approximately 3 feet above
-the top of the screen. The Dames & Moorehydrogeologist will verify placement of the sandby measuring the depth to the top of the fill with
a weightecLtape measure. Pull the auger backslowly to minimize the disturbance to the sandpack.
11. Install a bentonite pellet seal, 3 feet thick. TheDames & Moore hydrogeologist will verify place-ment of the bentonite seal by measuring thedepth to the top of the fill with a weighted tape
measure. Pull the auger back slowly to minimizethe chance of compromising the bentonite seal.
12. Fill the annular space; with cement grout mixedaccording to the manufacturer's specifications".Grout shall be pumped through a tremie pipewith the tremie pipe placed approximately 2 feetabove the bentonite .seal.
13. After the grout has cured, develop the well bysurge block and pumping. Continue developmentto remove five times the volume of water ordrilling fluid lost during well construction anduntil the. well produces apparently clear water orfor a maximum of 2 hours.
14. Install a concrete pad, 2 feet square, 6 inchesthick, and flush with the ground surface at theperimeter of the pad. The pad shall be con-
... __structed of concrete reinforced with wire meshand shall be. shaped to-direct drainage away fromthe well. Pads may be constructed followingcompletion of all wells at" the Site.
1.2-4
15. Install a locking cap on the S-inch stickup pipe>and lock... . . . . . .
REFERENCES
EPA OSWER, October 1987, Compendium of Superfund Field Operations Methods,EPA Office of .Solid Waste and Emergency Response, Directive 9355, 0-14("Compendium").
300204
1.2-5
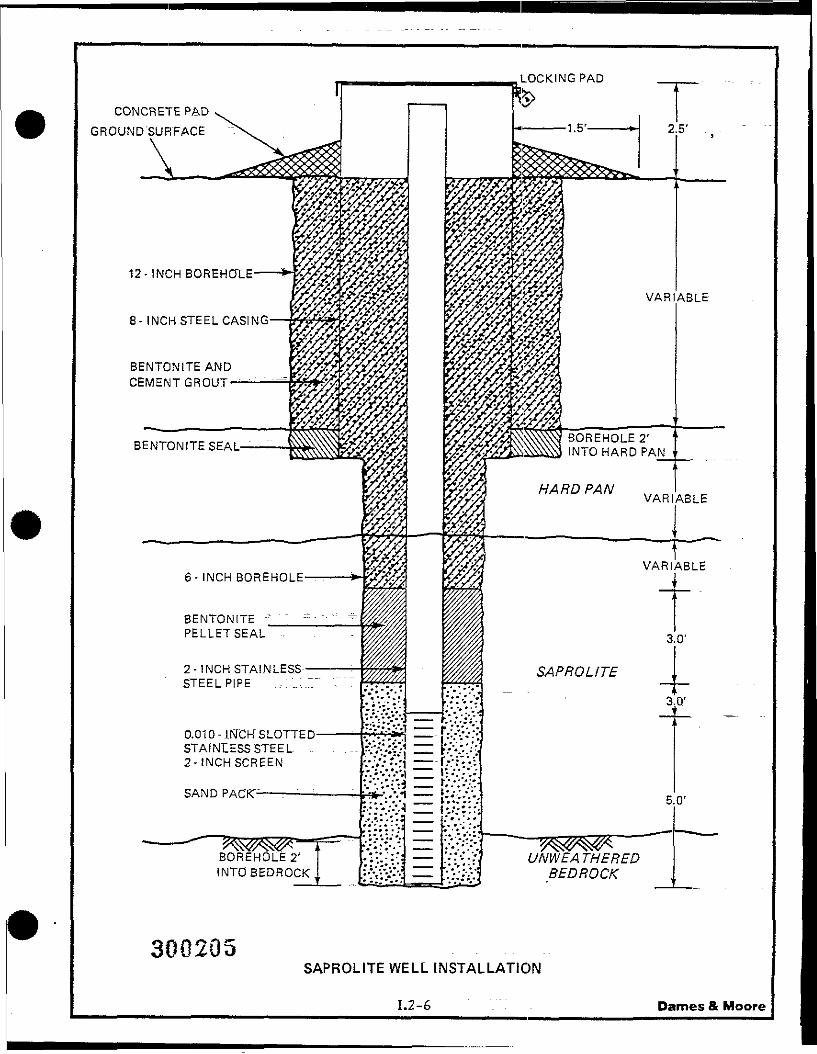
LOCKING PAD
CONCRETE PADGROUND'SURFACE
BENTONITE ANDCEMENT GROUT
8- INCH STEEL CASING
BOREHOLE 2'INTO HARD PAN l
BENTONITEPELLET SEAL
2-INCH STAINLESSSTEEL PIPE .,:..:.
0.010- INCH" SLOTTED-STAINLESS STEEL2-INCH SCREEN
SAND PACKT-
BOREHOLE2'INTO BEDROCK
V*C'/.-q __ I:•'.';".',••.'•:;•.3 _ t::::'-:-
UNWEATHEREDBEDROCK
300205SAPROLITE WELL INSTALLATION
1.2-6 Dames & Moore
SOP NUMBER: " BJf.3
TITLE: Bedrock Well Installation Procedures
SCOPE; This operating procedure describes drilling and installationof monitor wells into the Petersburg granite at the VirginiaWood Preserving Site. (See the figure at the end of thissection.) A Dames & Moore hydrogeologist shall monitor allwell drilling and construction activities, prepare lithogiclogs during well construction, and monitor air quality usingprocedures described in Appendix A.
OBJECTIVES: The activities covered by this procedure assure constructionof monitor'wells which will:
• Provide representative samples of groundwater foranalysis,
• Permit collection of representative water level data,............— . - and
.,_:. . „_,..__.•«=--.•;-— — £jfectively isolate "the separate hydrogeologic strata
penetrated during drilling.
EQUIPMENT: • Drilling rig, drilling tools, and support truck withwater tanks "
• Steam cleaner
• Grout plant and tremie pipe
• Portland cement, Types I through V
* Tri-Loc well casing and screen, 4-inch, steel with capand bottom plug.
• Steel casing (S-inch) and Master No. 3 padlock
• Concrete mix
• Reinforcing wire mesh• Powdered bentonite
• Bentonite pellets
2
I.3-I
PROCEDURE: - "- - ":
STEAM CLEANING REQUIREMENTS
1. Prior to starting first well, steam clean thedrilling rig,"drilling tools, support truck, watertanks (inside), and well casing and screen for thefirst well. Use County-treated water for steam
.... . - .-- cleaning.
2. ... Cover 'stearn-cleaned drilling tools, well casing,and screen with new clean plastic sheetingbefore moving to the well location.
3. Steam clean all drilling tools, well casing, andscreen, if appropriate, prior to moving onto eachwell location after the first well. Cover theseitems with clean plastic sheeting.
AT EACH BEDROCK WELL
I. Drill a nominal 12-inch borehole with hollow-stem augers (nominal S-inch I.D.) to the top ofthe hardpan and continue., to approximately2 feet into the hardpan. For well DM-11 (B),
" " "collect soil samples at the surface andjust abovethe hardpan following SOP B.1II.4 for chemicalanalysis.
2. The Dames, & Moore hydrogeologist shall preparelithologic descriptions of the soils encounteredduring drilling In accordance with the UnifiedSoil Classification System (USCS).
3. Remove the hollow-stem auger one 5-footsection at a time making sure the boreholeremains open,
4. Install the S-inch steel casing at least 2 feet intothe hardpan. Allow approximately 2.5 -feet ofstickup.
3002071.3-2
5. Install a bentonite seal at least 2 feet in thick-"•,.,, ness, that will fill the annular space in the
hardpan layer.
6. Fill the remaining annular space with cementgrout mixed according to the manufacturer'sspecifications. Grout shall be pumped through atremie pipe with the tremie pipe placed approxi-mately 2 feet above the bentonite seal. Drillingfluid will be upwardly displaced by the grout.
7. After the grout has cured (approximately 24hours), drill a 7&-inch borehole at least 2 feet
- into bedrock. Continuous split spoon sampleswill be collected to unweathered bedrock. Forwell DM-11 (B), samples will be collected forchemical analysis and/or UV screening as outlined in Table 2-6 of "the Work Plan.
8. Once the borehole is open and stable to the.required depth, install and center a string of 4-inch stainless-steel well casing and screen in theborehole. Allow approximately 2.3 feet ofstickup.
9. With the casing and screen installed andcentered in the borehole, flush the drilling fluidfrom the borehole with County-supplied water.Ail drilling fluid wastes from the fieldinvestigation will be" stored in RCRA-approvedcontainers-prior to testing and disposal. Basedon the test results, the. water will either bedischarged to the sanitary sewer or disposed ofas a RCRA waste.
10. Install a bentonite seal, at least 2 feet inthickness that will fill the annular space in thebedrock. Fill the remaining annular space with
1.3-3
cement grout mixed according to the ,manufacturer's specifications. Grout shall bepumped through a tremie pipe with the tremiepipe placed approximately 2 feet above thebentonite seal.
11. . After the grout has cured (approximately 24hours), collect 15 feet of rock core (NX) usingwater as the only drilling fluid. The protocolsfor collecting cores as outlined in ASTM D21I3-83 shall be followed. A copy of this protocol will
.,,,,be..j:ncluded,in the field tearrj leader's references .as well as a copy of EPA OSWER "Compendium."
12. Develop the well by surge block and pumpinguntil the well produced apparently clear water.Continue development to remove five times thevolume of .water or drilling fluid lost during wellconstruction and until the well produces clearwater or for a maximum of 2 hours.
13. . Install a concrete pad, 2 feet square, 6 inchesthick, and flush with the ground surface at theperimeter of the pad. The pad shall be con-structed of concrete reinforced with wire meshand shall be_shaped to direct drainage away fromthe well. Pads may be constructed followingcompletion of all- wells at the Site.
14. Install a locking cap on the 8-inch stickup pipeand lock.
REFERENCES
EPA OSWER, October.11987, Compendium of Superifund Field Operations Methods,EPA Office of Solid Waste! and Emergency* Response, Directive 9355, 0-14("Compendium").
ASTM, 1986, "Practice for Diamond Core Drilling lor _Site Investigation, ASTM D-1586, r985"XnnuaI"Book of ASTM Standards, Section 4, Construction, Volume04, OS, Soil and~Roc"k; Buirdlng Stones, Philadelphia,"P"A, pp. 333-337.
1.3-4
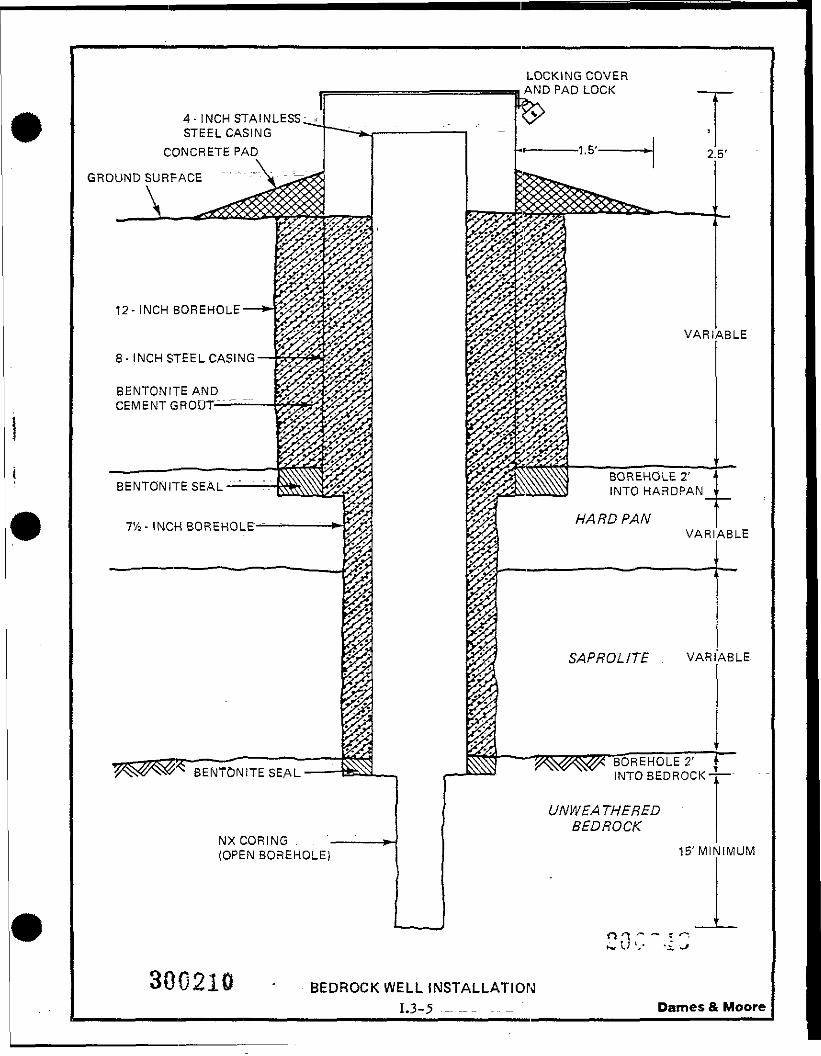
4- INCH STAINLESS;_--STEEL CASING
CONCRETE PAD
GROUND SURFACE
NX CORI.NG . . -(OPEN BOREHOLE)
LOCKING COVERAND PAD LOCK
VARIABLE
12- INCH BOREHOLE
8- INCH STEEL CASING
BENTONITE ANDCEMENT GROUT
BOREHOLE 2'INTO HARDPANBENTONITE SEAL
HARDPAN7% -INCH BOREHOLE"
SAP HO LITE
BENTONiTESEAL
VARIABLE
VARIABLE.
BOREHOLE 2(INTO BEDROCK-
UNWEATHEREDBEDROCK
15'MINIMUM
., i -t~ U V -i v/
300210 - BEDROCK WELL INSTALLATION1.3-5 .--- Dames & Moore
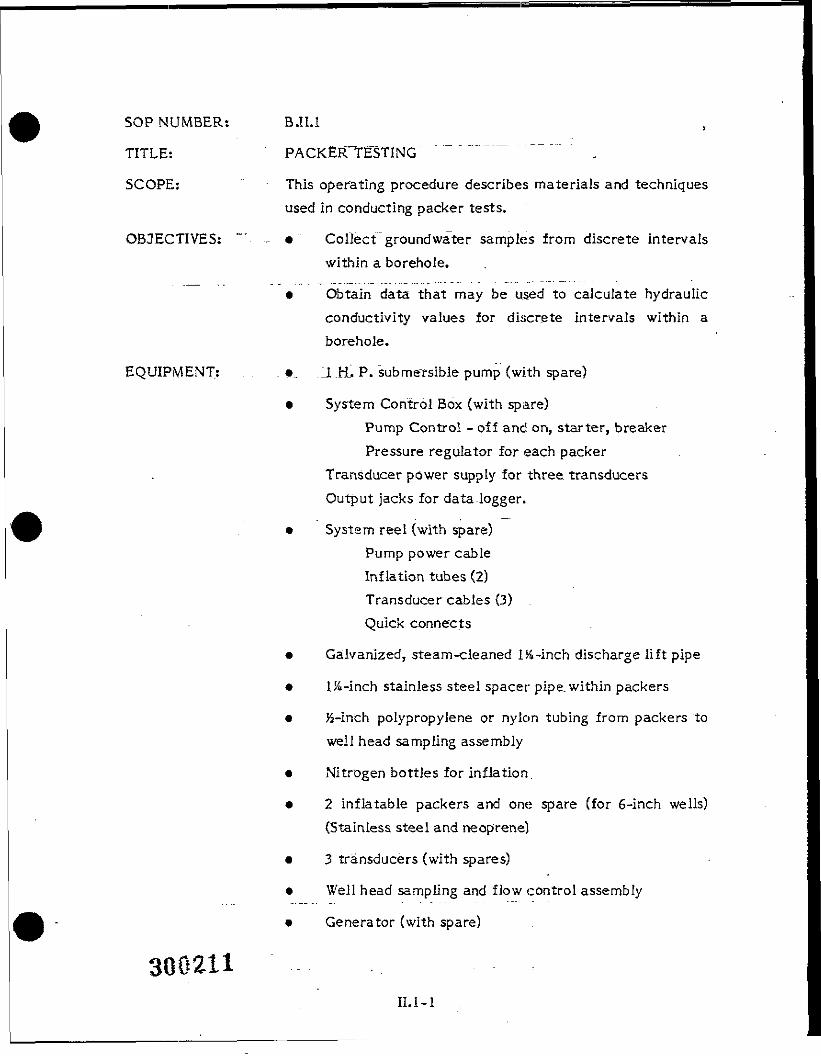
SOP NUMBER: B.II.1
TITLE: PACKERTESTING" " "
SCOPE: This operating procedure describes materials and techniquesused in conducting packer tests.
OBJECTIVES: "". - • Collect groundwater samples from discrete intervalswithin a borehole.
• Obtain data that may be used to calculate hydraulicconductivity values for discrete intervals within aborehole.
EQUIPMENT: . •.. 11 .H_. P. submersible pump (with spare)
• System Control Box (with spare)Pump Control - off and on, starter, breakerPressure regulator for each packer
Transducer power supply for three transducersOutput jacks for data-logger.
• System reel (with spare)Pump power cableInflation tubes (2)Transducer cables (3)Quick connects
• Galvanized, steam-cleaned 1%-inch discharge lift pipe
• 1%-inch stainless steel spacer pipe, within packers
• &-inch polypropylene or nylon tubing from packers towell head sampling assembly
• Nitrogen bottles for inflation.
• 2 inflatable packers and one spare (for 6-inch wells)(Stainless steel and neoprene)
• 3 transducers (with spares)
• Well head sampling and flow control assembly
• Generator (with spare)
* Elevators, pump support and other hardware
* 5T,pump hoist
* Data logger (with spare)
• Flow meter (with spare)
• Portable computer
• Program diskettes .. .
• Data diskettes
• Sample containers
PROCEDURE: Note: All materials which might come in contact with thecollected sample consist of stainless steel, brass, neoprene,polypropylene, or nylon; Galvanized steel riser pipes are used forpurging water from the space between the packers.
Methods, of conducting packer tests
Single- and double.rpacker tests are conducted in a similar manner.
The packers, pump, and pipe are brought to the site as separate units. Steamclean with County-treated water before use and between boreholes. Because ofthe length of the packers and pump, assemble the equipment as it is lowered intothe borehole. Transducers should be mounted on the upper packer and attached tothe pressure tubes. The bundle of cable and inflation tubing can be unrolled fromthe reel and attached to the pump discharge pipe aproximately every 5 feet as thepackers and pump are lowered. '
After the packers, pump, and other equipment are lowered to the test depth,the following steps will be carried out:
Connect cables from the cable reel and flowmeter to the data logger.
Start the data logger.
Start program LOGGER on the portable computer.
Inflate the packers? this may cause changes of up to approximately 3 ftin water levels shown by some of the transducers.
— —-Allow water levels to stabilize.
.v
IU-2 -
Open the cap on the tee fitting at the top of the galvanized steel pumpdischarge pipe. Conduct a~ preliminary packer test to evaluate thetightness of the rock in the isolated, interval by pouring one gallon oforganic-free...water into, the discharge pipe. Observe the resultingwater-level buildup on the computer screen. If more than 2 minutesare required for water in the isolated interval to return to its previouslevel, the interval will produce little water, and pumping must proceedcautiously, with the control valve nearly closed when pumping starts.
Start the pump.
Observe the water level graph on the computer screen. If thedrawdown is excessive, reduce the pumping rate. Drawdown isexcessive if It produces negative pressure (shown by negative outputvoltage) on the transducer. If the control valve was initially nearlyclosed, it may be possible to open it further to increase the drawdown.
If significant drawdown occurs in the intervals above or below theisolated interval, the packer seal is probably defective. The seal isconsidered doubtful If drawdown in these intervals is more than 10percent of that in the isolated interval.
Allow water level in the isolated interval to stabilize. Generally thistakes_10 to 30 minutes.
Measure the pump discharge with a calibrated bucket and a stopwatchevery 5 -to 10 minutes, or after 'changes in pumping rate. This isnecessary even if the Signet flowmeter is used to record pumpdischarge, in order to assure accuraCey of the flowmeter.
After three.volumes of the isolated interval have been pumped, take awater .sample.from'the sample tape.
Samples for chemical analysis will be collected from the polypropyleneor nylon tubing to avoid zinc contamination from the galvanized steeldischarge lift pipe.
The uppermost, packer test in a borehole is conducted with the upperpacker jrom 10 to 20 ft below the water surface. In these tests, deflatethe upper packer and allow the water level to.stabilize again in order toobtain information from all of the borehole above the lower packer.
300213"
The lowest packer test in a borehole is generally not conducted with th,elower packer at the bottom of the borehole. In these tests, deflate thelower packer and allow the water level to stabilize- again in order toobtain information from ail of the borehole below the top packer.
In field notes, record the depth interval tested, diameter of theinterval, water level before the test, starting and ending time of thetest, and the name of the file created by LOGGER.
REFERENCES - ,-_—.".--^
Bliss, Jane C., and Rush ton, K.R., 1984, The Reliability of Packer Tests forEstimating the Hydraulic Conductivity of Aquifers, Quarterly Journal ofEngineering Geology (London), vol. 17, p. 81-91.
300214II.1-4
SOP NUMBER: B.II.2
TITLE: Well Pump Test : ";
SCOPE: ' This operating procedure describes the procedures involved_ .in conducting a pumping test to obtain values of aquiferhydraulic conductivity, specific yield, and/or storativity.
OBJECTIVES: The activities covered by this procedure:
• Ensure~quality control when conducting pumping teststo. determine aquifer parameters
• Proviole quantitative data_ of aquifer parameters suchas saturated hydraulic conductivity, specific yield, andstorativity. ~
EQUIPMENT; "• water-level measuring tape(s)• pressure transducers with data loggers• steel register flow meter* portable, computer• program diskettes .• data diskettes• field log• stop-watches -* calculator ~" " "* stainless steel submersible pump• teflon or polyethylene flexible, piping• 4,500 watt generator* stainless steel hose clamps• pump wiring
PRELIMINARY : - - - - - - - - - -TO OPERATION: 1. Check the water-level measuring tape, pressure trans-
ducers, and cables for cleanliness and any possibledefects. " -
2. Locate an area to' Conduct the pumping test where:the water table or potentiometric surface Is relativelyflat; the aquifer is believed to be relativelyhomogeneous and isotropic and of constant thickness;
300215. " ... . 11.2-1
and there are no nearby influences ,on groundwater,flow such as other pumping wells, streams, lakes, orno-flow boundaries.
3* Choose, weII(s) to use as observation well(s) which arewithin 50 to 3,000 feet of the pumping well.
4. Do not pump water from the pumping well for at leastseveral days prior to conducting pump test.
5. .Install data loggers and pressure transducers into thepumping well and observation wells several days prior
, .. to.Jhe test_to_obtain data_. regarding regional ground-water level fluctuations both natural and artificial.
OPERATING. ."." _:. . "Tii^T"..'.-.:. "^ *""..r.ZT•".'-—.-!. "-- '-PROCEDURE: - 1. Measure and record the distance of the observation
well(s) to the pumping well.
2. Determine general pumping rate to use when conduct-ing pump test from distance of observation wells. Ingeneral, observation well(s) near the pumping well usea lower pumping rate.
3, Program the data loggers to record a reading every 5seconds.
4. Install a pressure tranducer and data logger into the— -•— pumping well and observation wells according to
manufacturer's specifications.
5. Turn on pump at pumping well. Record flow rate fromwell.
6. While maintaining a constant flow rate from thepumping well, allow the data loggers to record dataevery 5 seconds for the first hour of the test.
7. As the water levels stabilize somewhat, approximatelyone hour, remove the data loggers and "dump" the dataonto data diskettes using the portable computer.
300216- -II.2-2
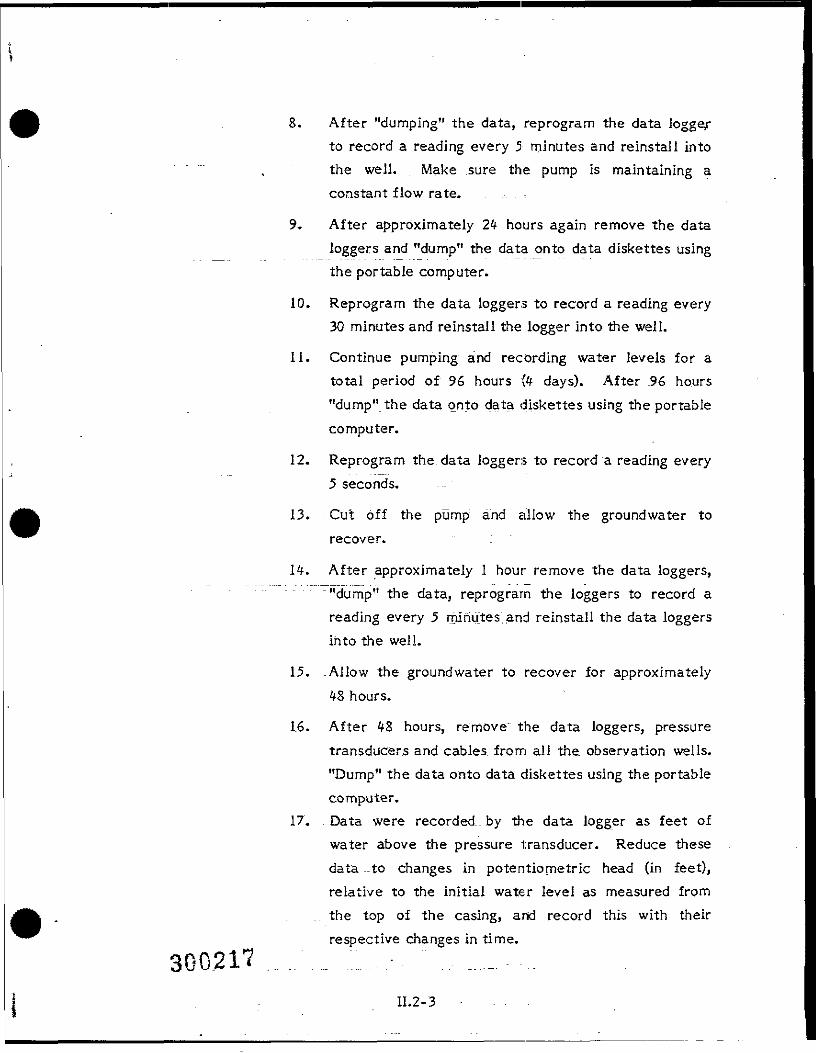
8. After "dumping" the data, reprogram the data logge,rto record a reading every 5 minutes and reinstall into
, the well. Make sure the pump is maintaining aconstant flow rate. - . ,
9, After approximately 24 hours again remove the dataloggers and "dump" the data onto data diskettes usingthe portable computer.
10. Reprogram the data loggers to record a reading every30 minutes and reinstall the logger into the well.
11. Continue pumping and recording water levels for atotal period of 96 hours (4 days). After .96 hours"dump" the data onto data diskettes using the portablecomputer.
12. Reprogram the data loggers to record a reading every5 seconds.
13. Cut off the pump and allow the groundwater torecover. :
14. After approximately 1 hour remove the data loggers,""dump" the data, reprogram the loggers to record areading every 5 minutes.and reinstall the data loggersinto the well.
15. Allow the groundwater to recover for approximately48 hours.
16. After 48 hours, remove the data loggers, pressuretransducers and cables, from all the observation wells."Dump" the data onto data diskettes using the portablecomputer,
17. Data were recorded., by the data logger as feet ofwater above the pressure transducer. Reduce thesedata -to changes in potentiometric head (in feet),relative to the initial water level as measured fromthe top of the casing, arid record this with theirrespective changes in time.
30.0217 .../._ .;:..,.-. ".., ...._.,....II.2-3
Once- data are collected and reduced, a variety ofmethods may be-used to calculate aquifer parametersfrom pump test data. These methods include thestraight line methods and the use of matching curves.-References which may be consulted to interpret pumptest data include:
Lohman, S.W. 1972. Groundwater Hydraulics. USGSProf. Paper 708.
Freeze, R.A. and J.A. Cherry, 1979. Groundwater.Prentice Hall, Inc.
Todd, O.K. 1980. Groundwater Hydrology. John Wileyand Sons, Inc.
II.2-4
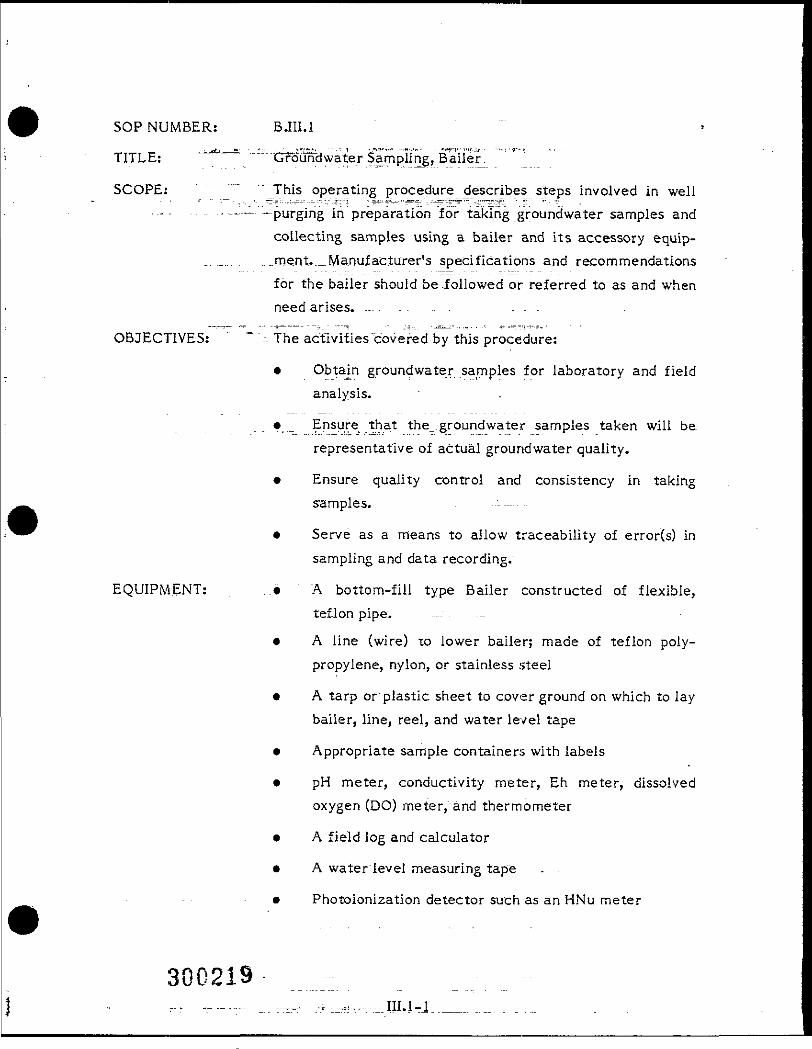
SOP NUMBER: BJII.l
TITLE: —*^—=• -—- --t^uncl water Sampling, Bailer.
SCOPE: ~ _"" This operating procedure describes steps involved in well.,,,..._ -purging in preparation for taking groundwater samples and
collecting samples using a bailer and its accessory equip-... ..... , ....ment.._ Manufacturer's specifications and recommendations
for the bailer should be-followed or referred to as and whenneed arises. — . . . . . . . . .
OBJECTIVES: "*."--- The activities covered by this procedure:
• Obtain groundwater samples for laboratory and fieldanalysis.
that the groundwater samples taken will be.representative of actual groundwater quality.
• Ensure quality control and consistency in takingsamples. . ------ -
• Serve as a means to allow traceability of error(s) insampling and data recording."
EQUIPMENT: . • A bottom-fill type Bailer constructed of flexible,teflon pipe.
• A line (wire) to lower bailer; made of teflon poly-propylene, nylon, or stainless steel
• A tarp" or piastic sheet to cover ground on which to laybailer, line, reel, and water level tape
• Appropriate sample containers with labels
• pH meter, conductivity meter, Eh meter, dissolvedoxygen (DO) meter, and thermometer
• A field log and calculator
• A water level measuring tape . .
• Photoionizatlon detector such as an HNu meter
300219^ ._._...... ....__ _._._..... III.l-l
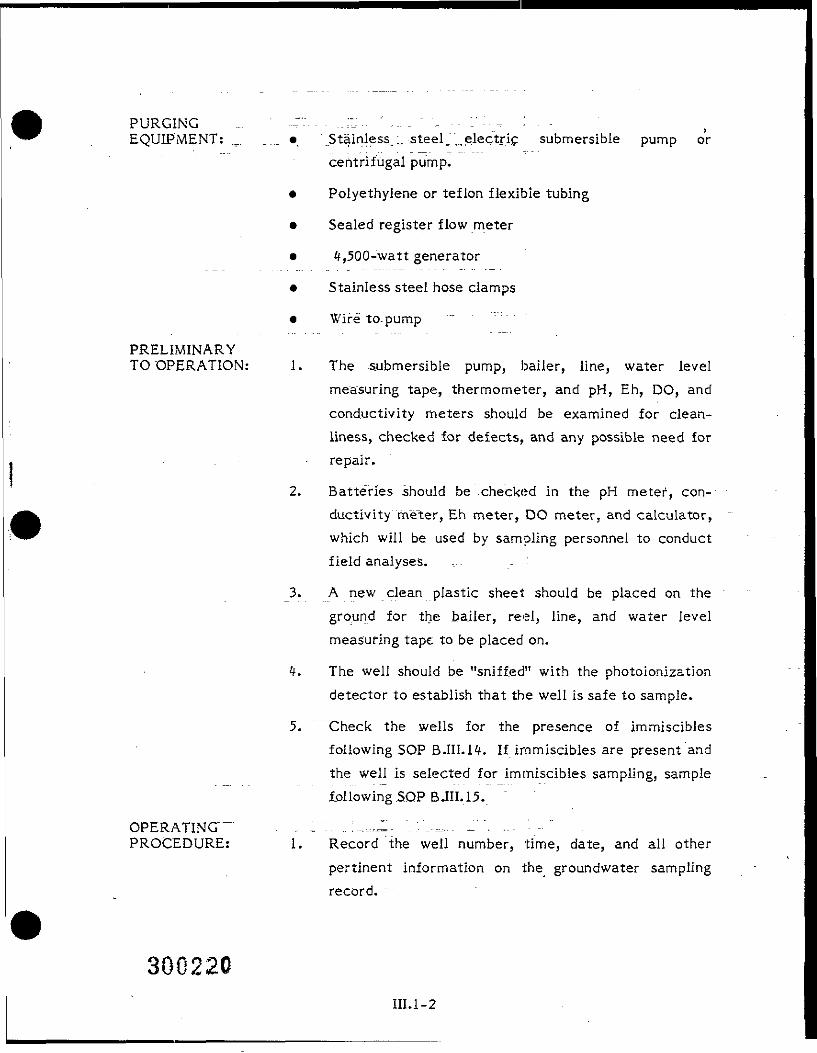
PURGING _. ~ - V - - ..;:_:.. '..... " , -- :' --. : . -EQUIPMENT: _ .... •_ \Stamless_:_. -5teel_",.,electric submersible pump or
centrifugal pump.
• Polyethylene or teflon flexible tubing
• Sealed register flow meter
• 4,500-watt generator
• Stainless steel hose clamps
• Wire~t6-pump
PRELIMINARYTO "OPERATION: 1. The submersible pump, bailer, line, water level
measuring tape, thermometer, and pH, Eh, DO, andconductivity meters should be examined for clean-liness, checked for defects, and any possible need forrepair.
2. Batteries should be checked in the pH meter, con-ductivity meter, Eh meter, DO meter, and calculator,which will be used by sampling personnel to conductfield analyses. .... - -
3. A new clean plastic sheet should be placed on theground for the bailer, reel, line, and water levelmeasuring tape to be placed on.
4. The well should be "sniffed" with the photoionizationdetector to establish that the well is safe to sample.
5. Check the wells for the presence of immisciblesfollowing SOP BJII.14. If immiscibies are present andthe well is selected for immiscibles sampling, samplefollowing SOP B.III.15.. "
OPERATING" . . . . . :•-. .::.-....,— - ".:."_.=,.. -": ..- ' - 'PROCEDURE: 1. Record the well number, time, date, and all other
pertinent information on the groundwater samplingrecord.
300220III.1-2
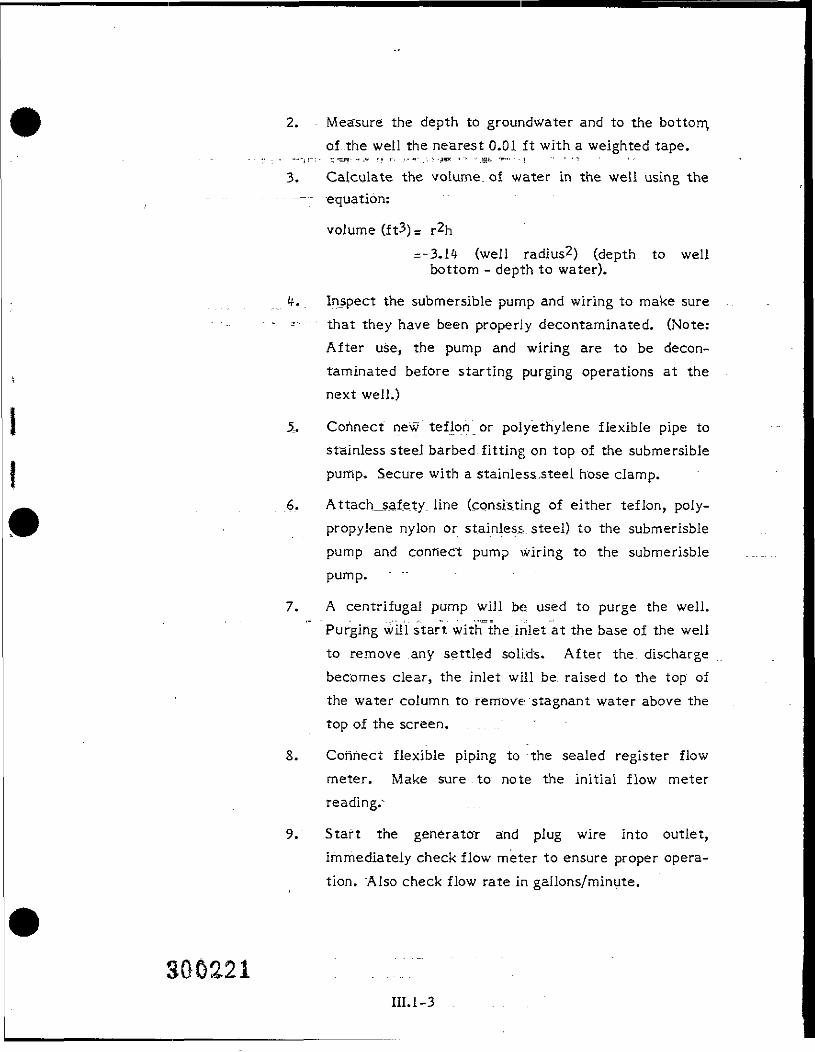
Measure the depth to groundwater and to the bottom,of the well the nearest 0.01 ft with a weighted tape.?_i&i--"j' »« .!•• i •--.;:•''j«pr •> •" •• .;at. •»•••' • • i ' • i
Calculate the volume, of water in the well using theequation:
volume (ft3)= r^h--3.14 (well radius^) (depth to wellbottom - depth to water).
Inspect the submersible pump and wiring to make sure••that they have been properly decontaminated. (Note:After use, the pump and wiring are to be decon-taminated before starting purging operations at thenext well.)
Connect new teflon or polyethylene flexible pipe tostainless steel barbed fitting on top of the submersiblepump. Secure with a stainless .steel hose clamp.
Attach_s.afe.ty. line (consisting of either teflon, poly-propylene nylon or stainless., steel) to the submerisblepump and connect pump wiring to the submerisblepump. - ...
A centrifugal pump will be used to purge the well.Purging will start with the inlet at the base of the wellto remove any settled solids. After the dischargebecomes clear, the inlet will be. raised to the top ofthe water column to remove stagnant water above thetop of the screen. ...
Connect flexible piping to the sealed register flowmeter. Make sure -to note the initial flow meterreading."
Start the generator and plug wire into outlet,immediately check flow meter to ensure proper opera-tion. Also check flow rate in gallons/minute.
III. 1-3
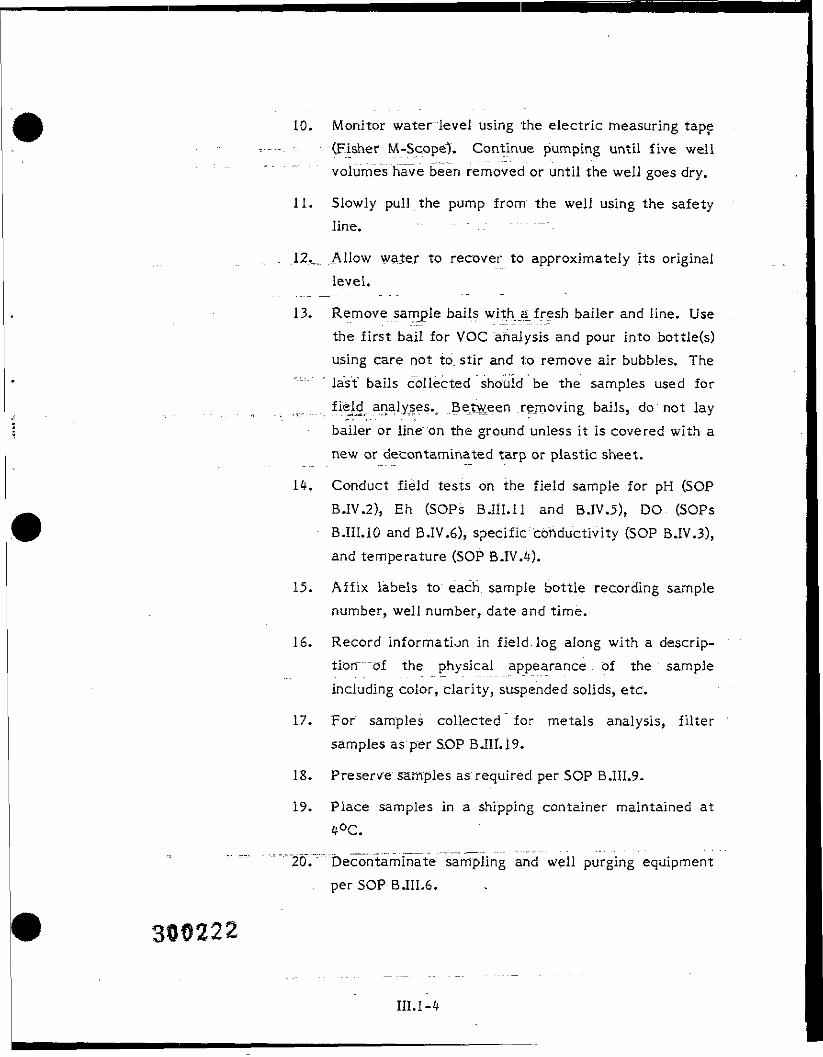
10. Monitor water level using the electric measuring tape•:- --(Fisher M-Scope}. Continue pumping until five well
volumes have been removed or until the well goes dry.
11. Slowly pull the pump from the well using the safetyline. " "
12._ _Allow water to recover to approximately Its originallevel.
13. Remove sample bails with _a_ fresh bailer and line. Usethe first bail for VOC analysis and pour into bottle(s)using care not to_ stir and to remove air bubbles. The
'"""' ' last balls collected should be the samples used forfie Id analyses., .Betw een .removing bails, do not laybailer or line on the ground unless it is covered with anew or decontaminated tarp or plastic sheet.
14. Conduct field tests on the field sample for pH (SOPB.IV.2), Eh (SOPs BJlI.ll and B.IV.5), DO- (SOPsB.III.10 and B.IV.6), specific "conductivity (SOP B.IV.3),and temperature (SOP B.IV.4).
15. Affix labels to each, sample bottle recording samplenumber, well number, date and time.
16. Record information in field log along with a descrip-tion"" "Of the physical appearance. -Of the sampleincluding color, clarity, suspended solids, etc.
17. For samples collected for metals analysis, filtersamples as per SOP BJII.19.
IS. Preserve samples as required per SOP B.III.9.
19. Place samples in a shipping container maintained at4°C.
20. Decontaminate sampling and well purging equipmentper SOP BJII.6.
III.1-4
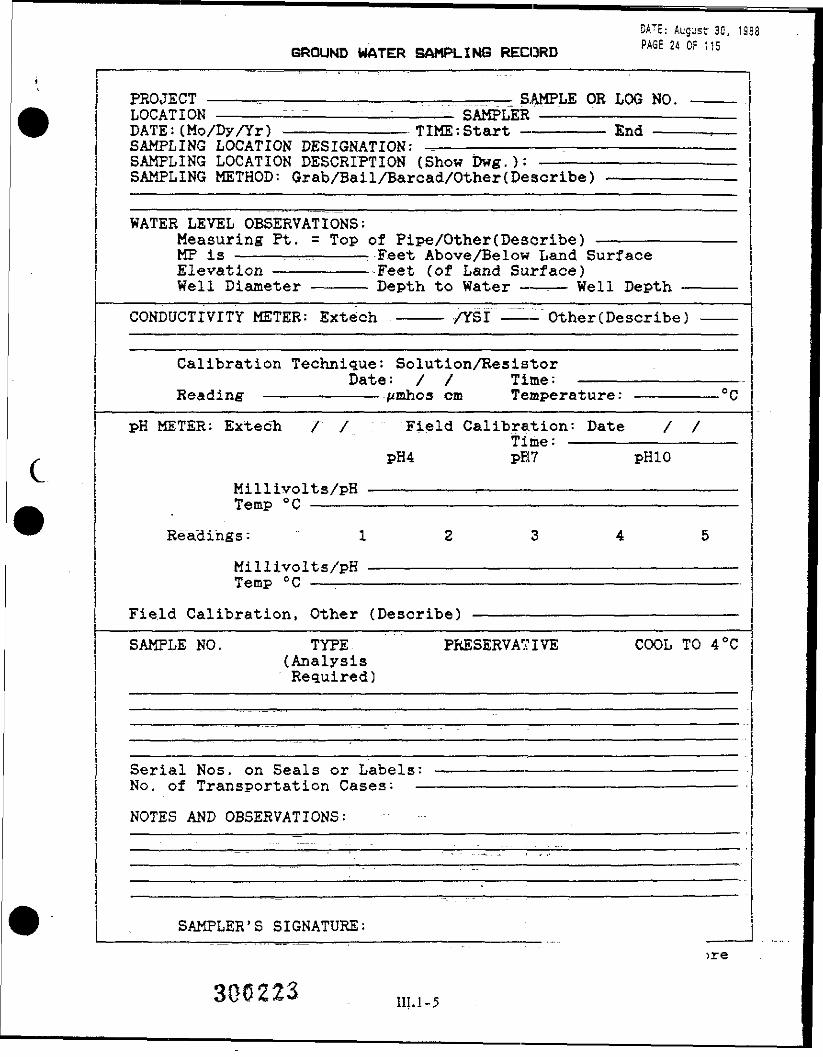
GROUND WATER SAMPLING RECORDOA^c: August 30, 1988 , . |PAGE 24 Or 115
PROJECT ————,————————:————————————— SAMPLE OR LOG NO,LOCATION ——————:————-——:——_— SAMPLERDATE:(Mo/Dy/Yr) ——————————TIME:Start ——————— EndSAMPLING LOCATION DESIGNATION:SAMPLING LOCATION DESCRIPTION (Show Dwg.): —————SAMPLING METHOD: Grab/Bail/Barcad/Other(Describe)
WATER LEVEL OBSERVATIONS;Measuring Pt. = Top of Pipe/Other(Describe)MP is ————. .... .._... _. . Feet Above/Below Land SurfaceElevation ————————-Feet (of Land Surface)Well Diameter ———— Depth to Water ——=— Well Depth
CONDUCTIVITY METER: Extech ———— /YSI-——-" Other(Describe)
Calibration Technique: Solution/ResistorDate: / / Time; ———
Reading ——————————-pmhos cm Temperature:
pH METER: Extech / / '. " Field Calibration: Date / /time; ———————————
PH4 pH7 pHIO
Millivolts/pHTemp °C ————
Readings:
Millivolts/pHTemp °C ——:——
Field Calibration, Other (Describe)
SAMPLE NO. TYPE PRESERVATIVE COOL TO 4°C(AnalysisRequired)
Serial Nos. on Seals or Labels:No. of Transportation Cases: -
NOTES AND OBSERVATIONS:
SAMPLER'S SIGNATURE:
ire
300223 ni.i-5
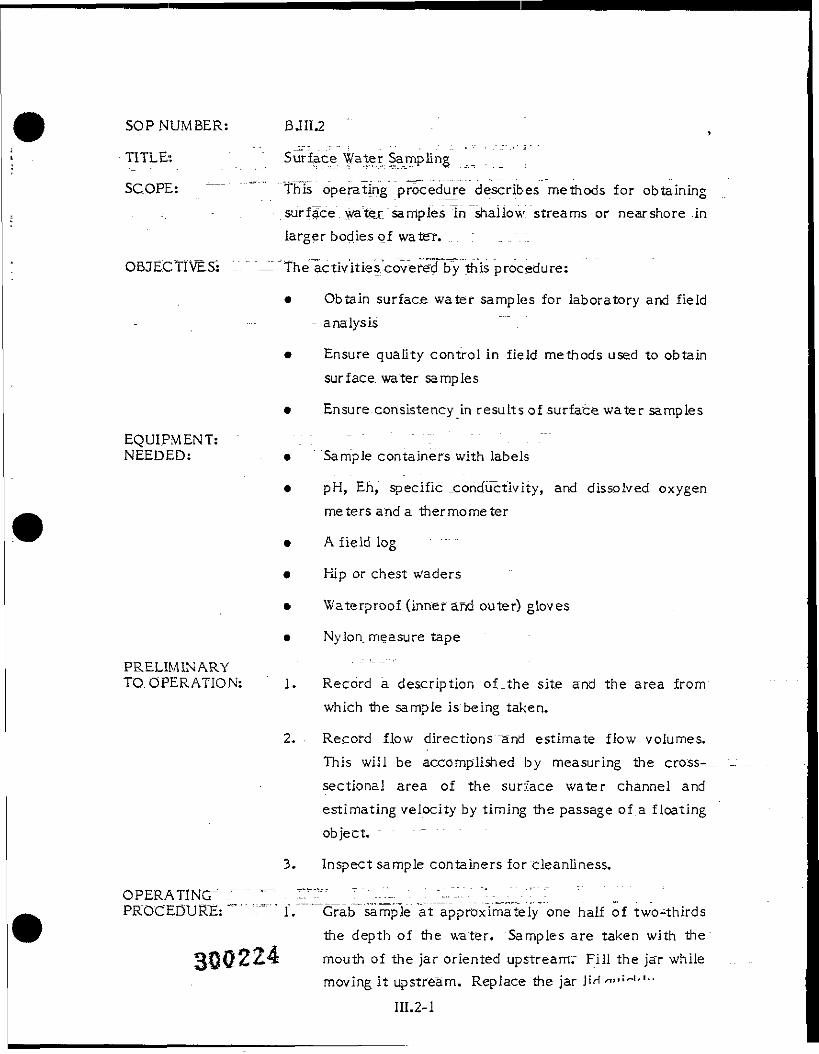
SOP NUMBER: BJII.2
TITLE:: " Surface Water Sampling
SCOPE: This operating procedure describes methods for obtaining--surface water samples in shallow streams or nearshore .in
larger bodies of water. ... ;
OBJECTIVES: "~HThe activities covered by this procedure:
• Obtain surface wate_r_.samples for laboratory and field- analysis
• Ensure quality control in field methods used to obtainsurface, water samples
• Ensure-consistency in results of surface water samples
EQUIPMENT: . :NEEDED: • Sample containers with labels
• pH, Eh, specific" .conductivity, and dissolved oxygenmeters and a thermometer
• A field log
• Hip or chest waders
• Waterproof (inner and outer) gloves
• Nylon_ measure tape
PRELIMINARYTO.OPERATION: I. Record a description of.the site and the area from
which the sample is being taken.
2. • Record flow directions ""and estimate flow volumes.This will be accomplished by measuring the cross-.sectional area of the surface water channel andestimating velocity by timing the passage of a floatingobject. " - - - - -
3. ---Inspect sample containers for cleanliness.
OPERATING- / " "" " ~"2"1_"~ "::rv._. ' _.; ir -•; :..~:__-_"i;~^ "PROCEDURE: -""" i. Grab sample at approximately one half of two-thirds
the depth of the water. "Samples are taken with the3-OOZ24 mouth of the jar oriented upstreamr Fill the jar while^J? Tf- *** * ' *
moving it upstream. Replace the jar Ji^ ~"
III.2-1
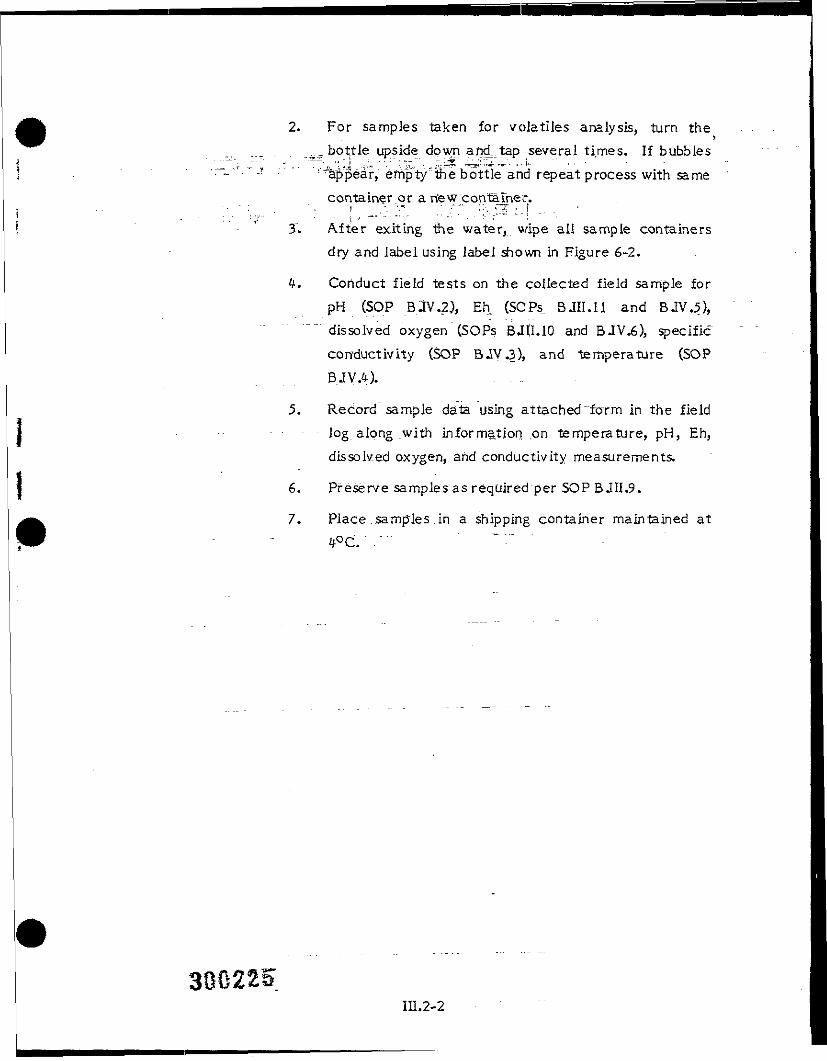
2. For samples taken for volatiles analysis, turn thevT bottle upside down ancLtap several times. If bubblesv^ap$ear, empty'liie bottle and repeat process with samecontainer or a new container.
• " " " " , " : " " •" "" ' ".••. = • • ' ' ; • ?- - - .j . , - - « - - " - - - ..
3. After exiting the water, wipe ail sample containersdry and label using label shown in Figure 6-2.
4. Conduct field tests on the collected field sample forpH (SOP B3V.2), Eh (SOPs -BJII.11 and BJV.5),dissolved oxygen'(SOPs BJlI.10 and BJV.6), specificconductivity (SOP BJV.3), and temperature (SOPBJV.4). . . . .
5. Record sample data using attached "form in the fieldlog along _with information on temperature, pH, Eh,dissolved oxygen, and conductivity measurements.
6. Preserve samples as required per SOP B JII.9.
7. Place ..samples .in a shipping container maintained at
III.2-2
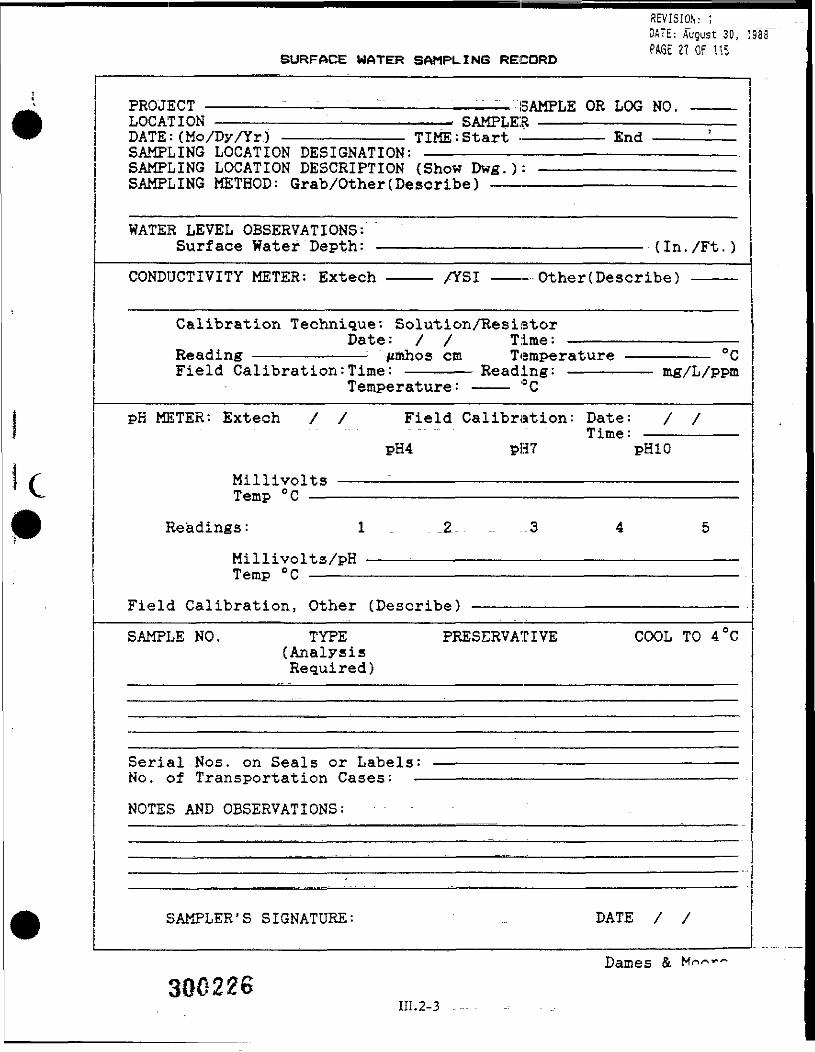
J•
j
1 f1 1•
•
REVISION: \DATE: August 30, ;PAGE 27 Of U5
SURFACE WATER SAMPLING RECORD
"DDi"\ TTTfT " " -- - - luTDf "C1 I"\D T I*°V VTPirKUJBL-1 —— — •*•••• — ——— •- —————— > — — .-...___... _.. . .. BAfirLl!. UK lAA* NO. ————LOCATION —————————— — —————————— = SAMPLER ——————————————————DATE: (Mo/Dy/Yr) - .- . TIME: Start . EndSAMPLING LOCATION DESIGNATION:SAMPLING LOCATION DESCRIPTION (Show Dwg.):SAMPLING METHOD: Grab/Other (Describe)
WATER LEVEL OBSERVATIONS:Surface Water Depth: —————————————————————— (In. /Ft.)
CONDUCTIVITY METER: Extech /YSI -Other (Describe)
Calibration Technique: Solution/ResistorDate: / / Time: ——————————————
Reading ———————— — - j-mhos cm Temperature ——————— °CField Calibration: Time: ————— Reading: ——————— mg/L/ppm
Temperature : ——— °C
PH METER: Extech / / Field Calibration: Date: / /Time: ————————
PH4 pH7 pHIO
Ml 1 1 -1 vnl t -t ,,,... "T*__— , O /^Temp C ————————————————————————————————————————
Readings: l _ _2_ . _ .3 4 5
Millivolts/pHT» A . __ O r*Temp C —————————————————————————————————————
Field Calibration, Other (Describe) ————————————————————— : —
SAMPLE NO. TYPE PRESERVATIVE COOL TO 4°C(AnalysisRequired)
Serial -Nos, on Seals or Labels: ——————————————————————————No. of Transportation Cases: ———— . ———— . ————————————————— __.=
NOTES AND OBSERVATIONS:
SAMPLER'S SIGNATURE: . DATE / /
983
Dames &300226
111.2-3
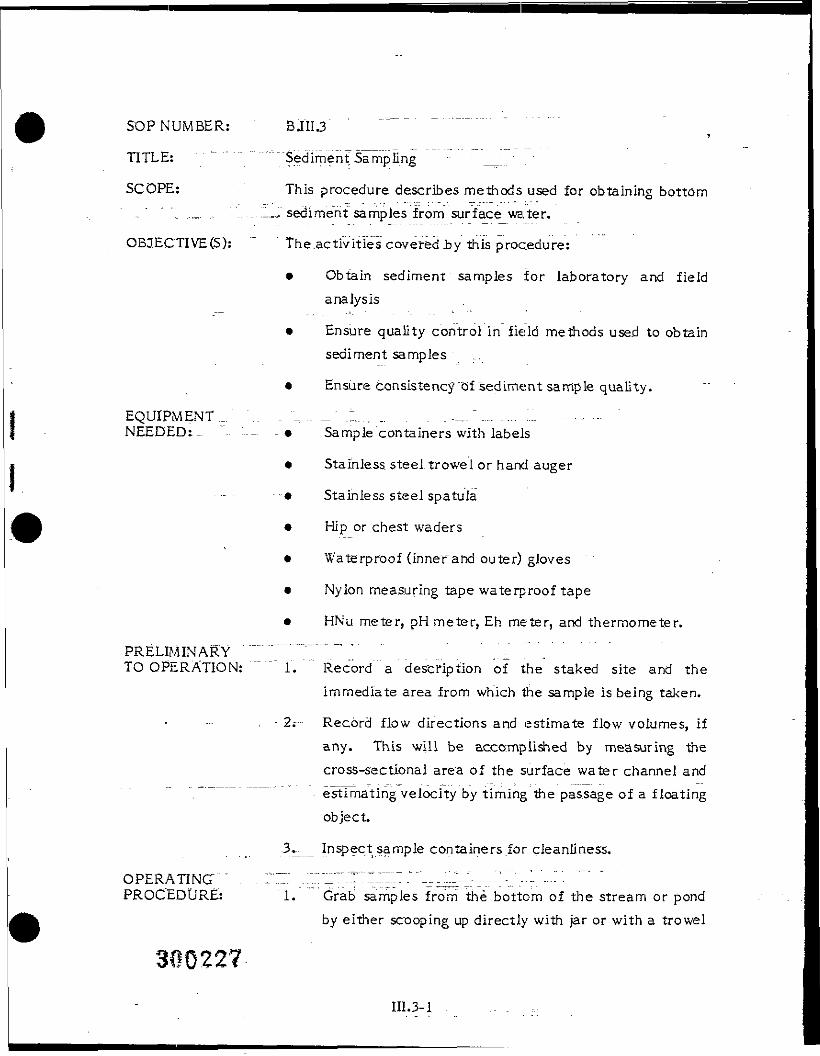
SOP NUMBER: BJII.3 >TITLE: " ~ "" """Sediment Sampling - _ ; .
SCOPE: This procedure describes methods used for obtaining bottom, " " _ _,_. .".'.....1 sediment samples from surface water.
OBJECTIVE (S): The activities covered .by this procedure:
• Obtain sediment samples for laboratory and fieldanalysis
• Ensure quality control in field methods used to obtainsediment samples
• Ensure consistency "Of sediment sample quality.
EQUIPMENT... ".. _ _.. _ .:,._ ... . . .._."..„..... ;.;. .....,.-NEEDED: '-- -• Sample containers with labels
• Stainless steel, trowel or hand, auger
- ~ • • -• Stainless steel spatula
• Hip or chest waders
• Waterproof (inner and outer) gloves
• Nylon measuring tape waterproof tape
• HNu meter, pH meter, Eh meter, and thermometer.
PRELIMINARY ---————•-=• " ' ' _./"""_"TO OPERATION: """" 1. Record a description of the staked site and the
Immediate area from which the sample is being taken.
......... 2s- Record flow directions and estimate flow volumes, ifany. This will be accomplished by measuring thecross-sectional area of the surface water channel and
. estimating velocity by timing the passage of a floatingobject.
3.^ Inspect sample containers for cleanliness.
OPERATING" " . . " .:;:"!....:.____.,- __.^_;-.,-_-^ ,- 7 . - - - -----PROCEDURE: 1. Grab samples from the bottom of the stream or pond
by either scooping up directly with jar or with a trowel
III.3-1
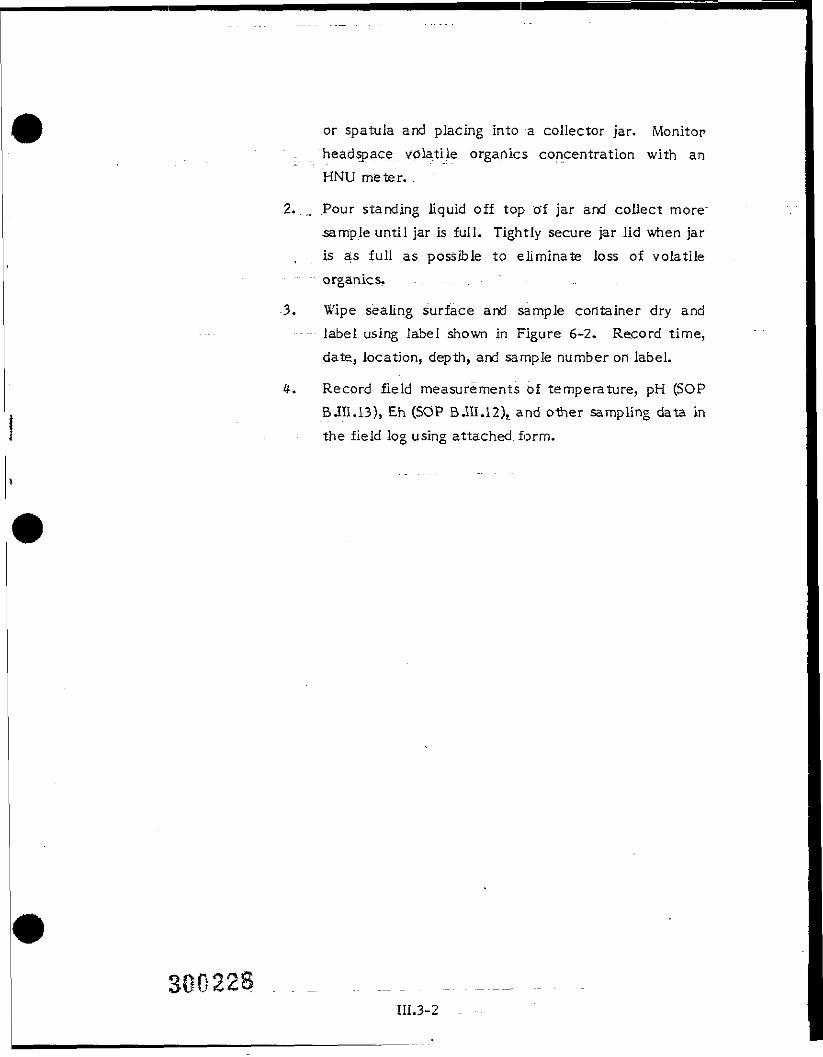
or spatula and placing into a collector jar. Monitorheadspace volatile organics concentration with anHNU meter.
2. . Pour standing liquid off top of jar and collect more-sample until jar is full. Tightly secure jar lid when jaris as full as possible to eliminate loss of volatileorganics.
3. Wipe sealing surface and sample container dry andlabel using label shown in Figure 6-2. Record time,date, location, depth, and sample number on label.
4. Record field measurements of temperature, pH (SOPBJII.13), Eh (SOP B.III.12),_ and other sampling data inthe field log using attached form.
III.3-2
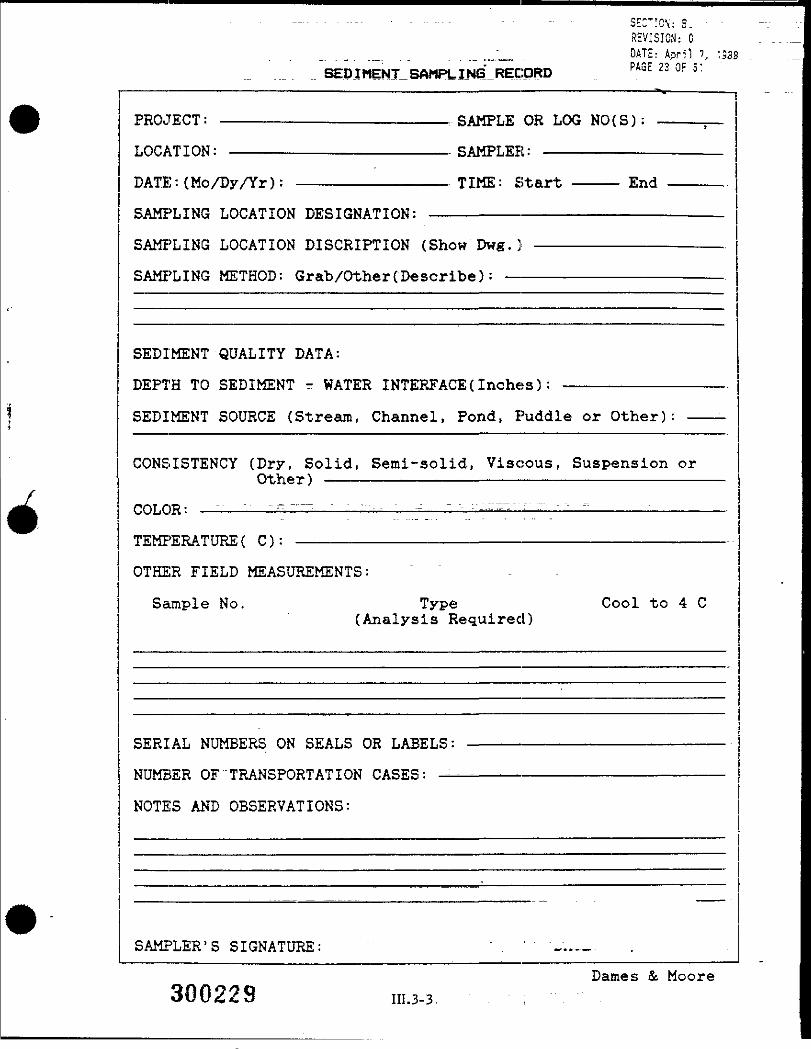
- - - - - - - - - - - - - - - - SEC'ICV; 3. -REVISION: C
__J_ ._ DATE: April 1,SEDIMENT SAMPLING_RECPRD PAGE 23 OF 5:
PROJECT: ———————————————__————..SAMPLE OR LOG NO(S):
LOCATION: —————————————————————SAMPLER: —————————
DATE:(Mo/Dy/Yr): ———————————— TIME: Start ———— End
SAMPLING LOCATION DESIGNATION: ———————————————:————
SAMPLING LOCATION DISCRIPTION (Show Dwg.)
SAMPLING METHOD: Grab/Other(Describe): —
SEDIMENT QUALITY DATA:
DEPTH TO SEDIMENT - WATER INTERFACE(Inches):
SEDIMENT SOURCE (Stream, Channel, Pond, Puddle or Other)
CONSISTENCY (Dry, Solid, Semi-solid, Viscous, Suspension orOther) ————————————————————————————————
fCOLOR:
TEMPERATURE( C):
OTHER FIELD MEASUREMENTS: " -
Sample No. Type Cool to 4 C(Analysis Required)
SERIAL NUMBERS ON SEALS OR LABELS:
NUMBER OF TRANSPORTATION CASES: —
NOTES AND OBSERVATIONS:
SAMPLER'S SIGNATURE:
Dames & MooreIII.3-3, :
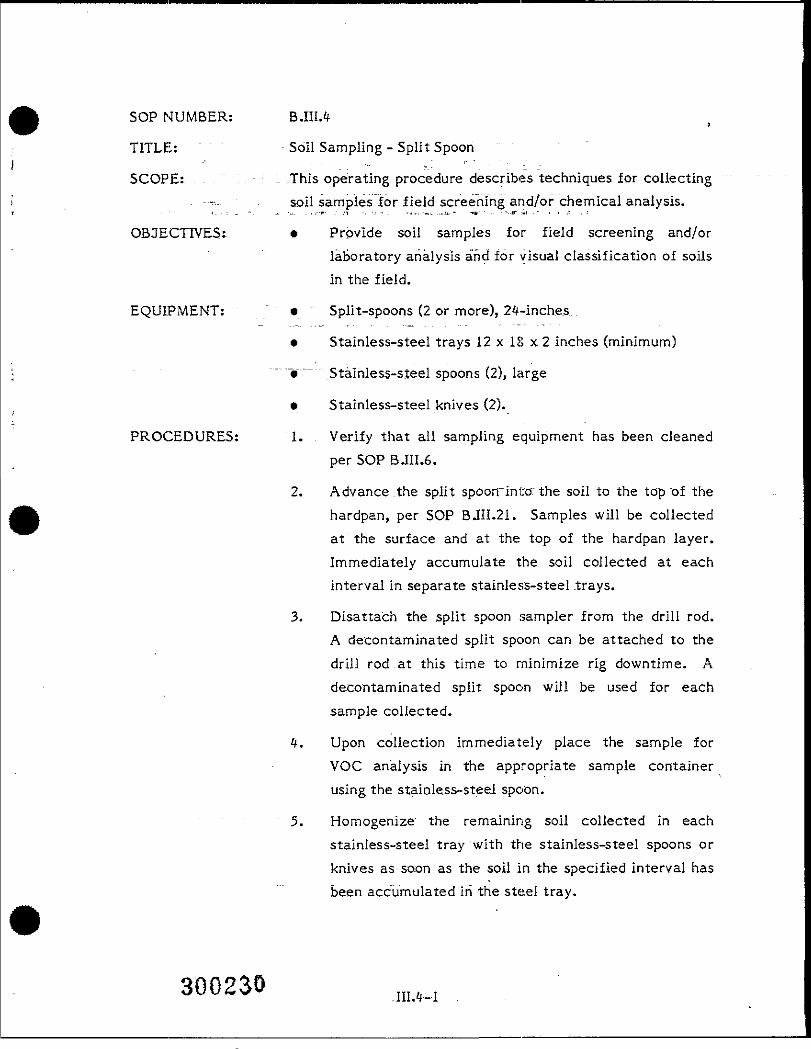
SOP NUMBER: B.III.4
TITLE:.. ", Soil Sampling - Split Spoon
SCOPE: .-."" v. - r i".This operating procedure describes techniques for collectingsoil samples for field screening and/or chemical analysis.
OB3ECTIVES: • Provide soil samples for field screening and/orlaboratory analysis and for visual classification of soilsin the field.
EQUIPMENT: •__ " Split-spoons (2 or more), 24-inches.
• Stainless-steel trays 12x18x2 inches (minimum)
"= 'V'" Stainless-steel spoons (2), large
• Stainless-steel knives (2).
PROCEDURES: 1. Verify that all sampling equipment has been cleanedper SOP BJII.6.
2. Advance the split spoorrinta the soil to the top "of thehardpan, per SOP B.III.21. Samples will be collectedat the surface and at the top of the hardpan layer.Immediately accumulate the soil collected at eachinterval in separate stainless-steel .trays.
3. Disattach the split spoon sampler from the drill rod.A decontaminated split spoon can be attached to thedrill rod -at this time to minimize rig downtime. Adecontaminated split spoon will be used for eachsample collected.
^. Upon collection immediately place the sample forVOC .analysis in the appropriate sample containerusing the stainless-steel spoon.
5. Homogenize the remaining soil collected in eachstainless-steel tray "with the stainless-steel spoons orknives as soon as the soil in the specified interval hasbeen accumulated in the steel tray.
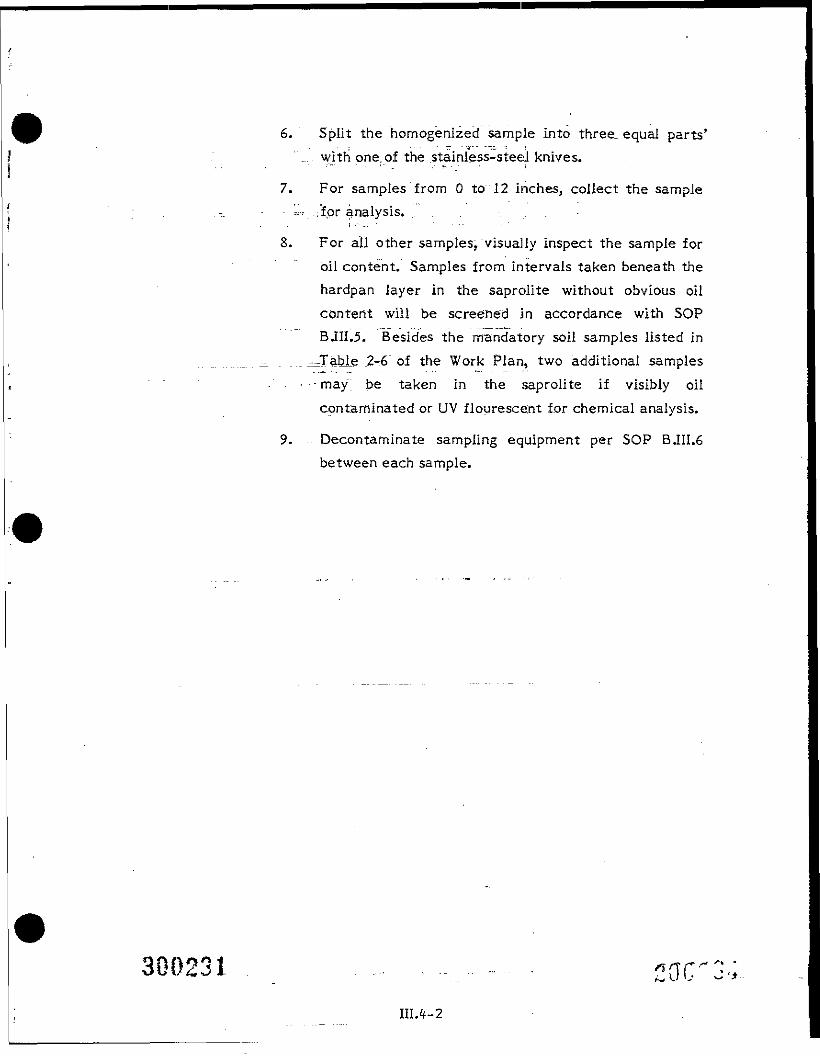
6. Split the homogenized sample Into three, equal parts'"-..,. with one.of the stainless-steel knives.
7. For samples from 0 to 12 Inches, collect the sampleU ,;'fpr analysis. . . . . . . . .
i -"-..'8. For all other samples, visually Inspect the sample for
oil content. Samples from intervals taken beneath thehardpan layer in the saprolite without obvious oilcontent will be screened in accordance with SOPB.111.5. Besides the mandatory soil samples listed in
.._ _—Table 2-6 "of the Work Plan, two additional samplesmay be taken in the saprolite if visibly oilcontaminated or UV flourescent for chemical analysis.
9. - Decontaminate sampling equipment per SOP BJII.6between each sample.
300231IflU-2
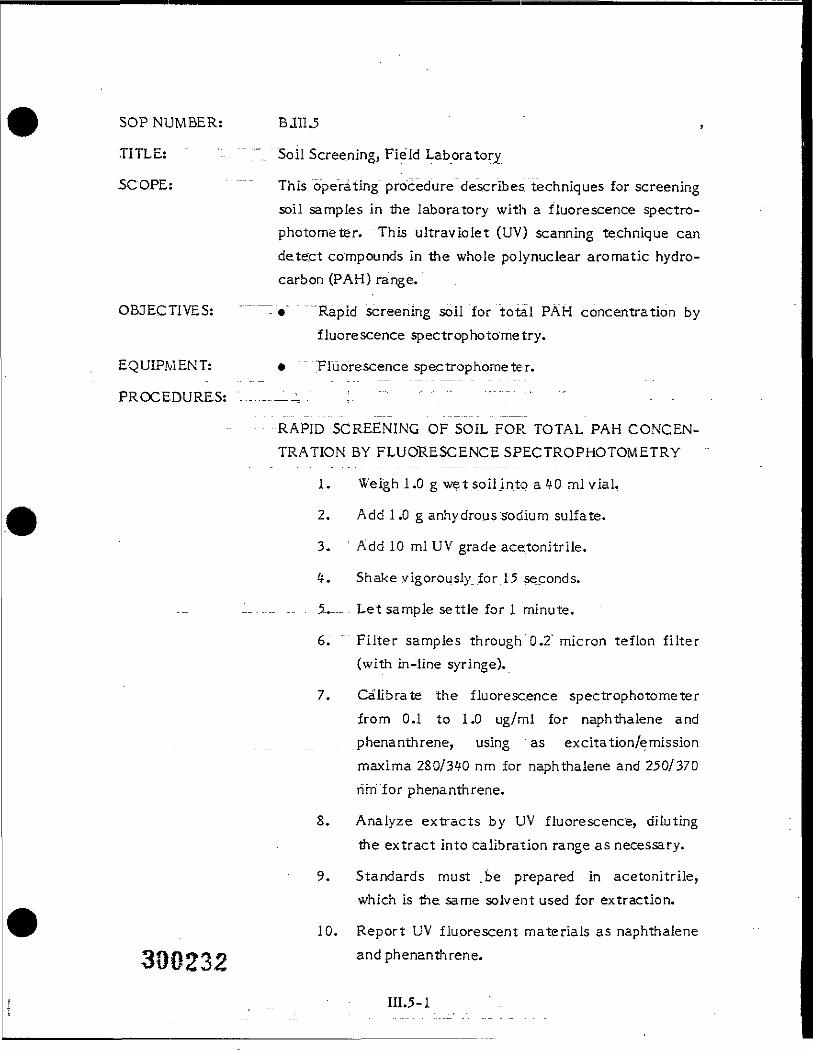
SOP NUMBER: BJIIJ "
TITLE: ."",. Soil Screening, Field Laboratory
SCOPE: " ~ This operating procedure describes techniques for screeningsoil samples in the laboratory with a fluorescence spectro-photometer. This ultraviolet (UV) scanning technique candetect compounds in the whole poly nuclear aromatic hydro-carbon (PAH) range.
OBJECTIVES: --— — "Rapid screening soil for total PAH concentration byfluorescence spectrophotometry.
EQUIPMENT: * Fluorescence spectrophometer.
PROCEDURES: :....... — -_:' :. _:"" - V-- ...-"".';' '- ------ - -
RAPID SCREENING OF SOIL FOR TOTAL PAH CONCEN-TRATION BY FLUORESCENCE SPECTROPHOTOMETRY
1. Weigh 1 .0 g wet soil into a 40 ml vial.
2. Add 1 .0 g anhydrous "sodium sulfate.
3. : Add 10 ml UV grade acetonitrile.
4. Shake vigorously, for 15 seconds.
__ .__ - 5*__ Let sample settle for 1 minute.
6. " Filter samples through 0,2" micron teflon filter(with in-line syringe).
7. Calibrate the fluorescence spectrophotometerfrom 0.1 to 1 .0 ug/ml for naphthalene andphenanthrene, using ' as excitation/emissionmaxima 280/340 nm for naphthalene and 250/370
" rim for phenanthrene.
S. Analyze extracts by UV fluorescence, dilutingthe extract Into calibration range as necessary.
9. Standards must .be prepared in acetonitrile,which is the same solvent used for extraction.
10. Report UV fluorescent materials as naphthaleneand phenanthrene.
III.5-1
Determine the UV fluorescent"materials in background samples in triplicate.'Calculate the average"background after .removal of outliers. A background samplethat is UV non-detect will be sent to the laboratory and analyzed for semivolatileorganics as a method blank. Also, a sample collected from a zone underlying asuspectedicontaminated area that is UV non-detect will be sent to the laboratoryas a check.on this field screening technique. The "check sample" may be a samplethat is already, incorporated in the sampling design plan that meets this criteria.
Determine the UV fluorescent materials in soil samples in duplicate.Subtract background from the highest duplicate value. Samples determined as UVfluorescent by this protocol should be saved for possible full screen analysis.
380233-""" """ III.5-2
SOP NUMBER: B.III.6
TITLE: Sample Equipment Cleaning
SCOPE: Cleaning procedures for sample collection equipment.
OBJECTIVES: Prevention of carry over "of materials from one sample tothe next.
EQUIPMENT: ~ ""• Liquinox detergent
• '"Tap water"
«T Deionized water
* Isopropanol, pesticide grade
• Organic-free water.
OPERATING " .- -' -- -"""' " "" ^~ '" •""'"- ':PROCEDURE: :
Sampling equipment will be cleaned after collecting each sample. Cleaning willconsist of the following steps:
1. The equipment is first cleaned, with tap water andlaboratory detergent1 (Liquinox) and then rinsed withtap water and deionized water.
2. Each piece; is rinsed -twice with pesticide-gradeisopropanol, rinsed with organic-free water, andallowed to air dry.
3. If organic-free water is not available, the equipmentwill be allowed to air dry after rinsing withisopropanol.
4. Equipment will be ..wrapped in aluminum foil aftercleaning whenever there /will be a .delay beforecollecting the next sample.
300234IH..6-1
SOP NUMBER: B JII.7 i
TITLE: Equipment Blank Sampling
SCOPE: The activities covered by this procedure:
• Ensure quality control in field sampling operations.
• Serve as a means to allow traceability of possiblecauses of sampling error or analytical techniques,
• Provide documentation of contamination controlprocedures.
EQUIPMENT: .. ._• _ ..Sample containers with labels.
• Field tracking form (sampling logs or chain-of-custodylog).
• Organic-free distilled water.OPERATING " . ' ' - - -"*" --'--" ~ -"""" - -""" ":PROCEDURE: 1. Obtain appropriate sample containers (see SOP B.III.S).
Blank analyses must include all parameters of interestin the project.
2. Remove aluminum foil from around equipment.
3. Fill the equipment with organic-free distilled water.
-4. Fill each sample container with water from theequipment. For open-ended equipment, fill samplecontainers with rinsate water. Fill more volatilecontainers first, proceeding to the least volatile.
5. Well bailer blanks for metal constituents must befiltered.
IH.7-1
SOP NUMBER: B.III.S
TITLE: .... -- Sample Shipping
SCOPE: " This operating procedure describes methods for properlyshipping environmental samples collected at siteinvestigations. v
OBJECTIVES: The activities covered by this procedure:
• Ensure quality control in the shipping of environmentalsamples -.._.. - - --
• Allow uniformity of.operation between different fieldpersonnel
• Serve as a means to allow traceability of samples inshipment"
• Set forth procedures assuring legal chain of custodyfor environmental samples collected at siteinvestigations.
EQUIPMENT: „ • "Chain-of-custody forms
>~ • CompuChem "Sample._5aver" Shipping Container
• Custody seals . ..
• Shipping tape and packing materials
* Blue icepacks (frozen no less than 12 hours, no morethan IS hours)
• Labels.
PROCEDURE: 1. Place each sample In the shipping cooler ("SampleSaver") as collected.
2. When the cooler is filled, verify that each sample inthe cooler is listed on the sample tracking form.
3. Number each cooler. Note, on the sample trackingform the cooler number In which each sample isshipped.
III.8-1
4. Complete a - chain-of-custody form (Figure 6-1) for,each shipment of samples. Retain field copy; placeothers in "Sample Saver."
5. Custody seal ajid tape shut each cooler ("SampleSaver").
6. Upon the completion of each day, ship coolers to thelaboratory. Do not relinquish custody of the samples
.- to" the shipper "until the chain-of-custody form issigned and a copy made for records. The originalchain-of-custody form and the original field trackingform are" to be submitted to the laboratory sealed Inplastic bag and placed in the cooler.
NOTE:"" Though samples .. containing high and mediumconcentration levels of .hazardous constituents are notanticipated, any that might be collected will requirespecial packaging if _they are to be shipped to thelaboratory by commercial- air. Under thesecircumstance' the packaging protocol that isidentified in the TUsers Guide to the CLP1 will befollowed. . . . "
REFERENCES
EPA OERR, October 1984, Users <5u Id e to the "Certified Laboratory Program,USEPA Office.of Emergency and Remedial Response.
III.S-2
SOP NUMBER: BJII.9 ' .
TITLE: ;;.". -^~ Sample Container Volumes, Preservation, and Holding Times
SCOPE: " This operating procedure describes procedures for selecting. - the appropriate containers for environmental samples.
OBJECTIVES: The activity covered by this procedure:
• Assure that sample volumes and preservations aresufficient for analytical services.
EQUIPMENT::.... .* . Sample containers"
* Shipping containers
• Sample labels.
OPERATION - ' -PROCEDURE: 1. ..Refer to Tables BJII.9-1 and BJII.9-2 for minimum
sample volume, container type, preservation methods,and holding times for particular parameter analyses,
2. Select the appropriate jar(s) from those provided bythe laboratory and verify that the laboratory hasprovided .the correct number of jars for the project persample plan requirements.
3-.- Report any discrepancies to the Project Manager andthe Quality Assurance Officer or his representativeImmediately.
4. Apply sample labels to containers and label projectname. "=
5. Proceed, with sampling.
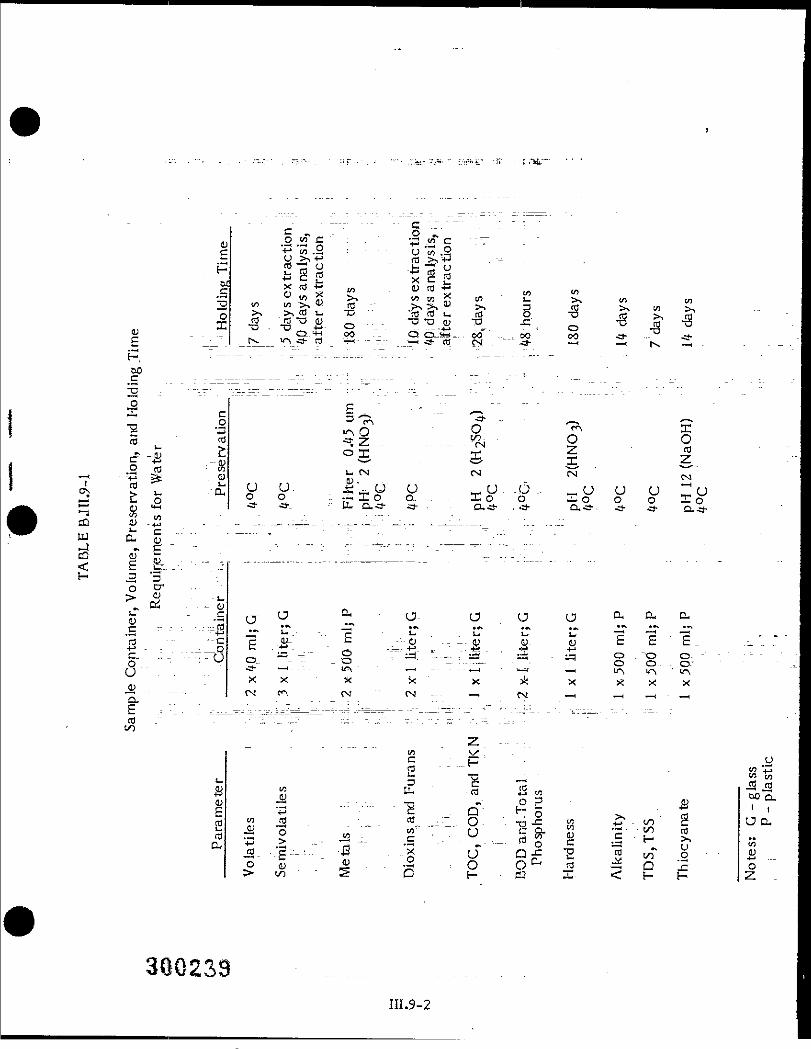
__—3cD
2"o<u ?P 7 —DO
25 " - "-^"o
ra
tfl
ca cj =< .. E £-_H _2 3o cr
.s - 6 fcWC ; . -43 «T c'« .2 . ; - - - u 'w .2
^ " oP J! -D - ,>% >* W >* D £" >, V) £,
^ ' ,~ S? °° -- Q caJS... do" ..... oo oo ^ -.-" ^3-
° n O " ^ XS 9 ^, O O
£« +j -IPO frt - w°S £ f Z-. rx <M KT "T
, QJ . r £^
<*•- -" li. Q, -a- t- . o~ & . -a- a. -a-. j- &
c
( J j W —' ' (Jl- U W (J I J - U U L -
^T u-~ •-- "c " - . L T . I T LT - p - r i . - z Tg .4j- c ^ (U ..... y o. 0 t C C_ ~ - • £? . ;r" =i: "---- ;"a : sa ^q o . o o-^" —(~ - " - - " S - __ -- ~ ; - -— . '. _' O O - -. O*
H £ ' -g
J3 " " • " * ^ :~ O " T5 -C W 5s - g§ .. js r" ..r'r.u . sg- * c T aO u.2- - P - - - - -W . x (j Q_r p m to" o^ —• - *, n :r 7 n l~ -j" v * .-io
3(10233
ao c_
CJ d.
O
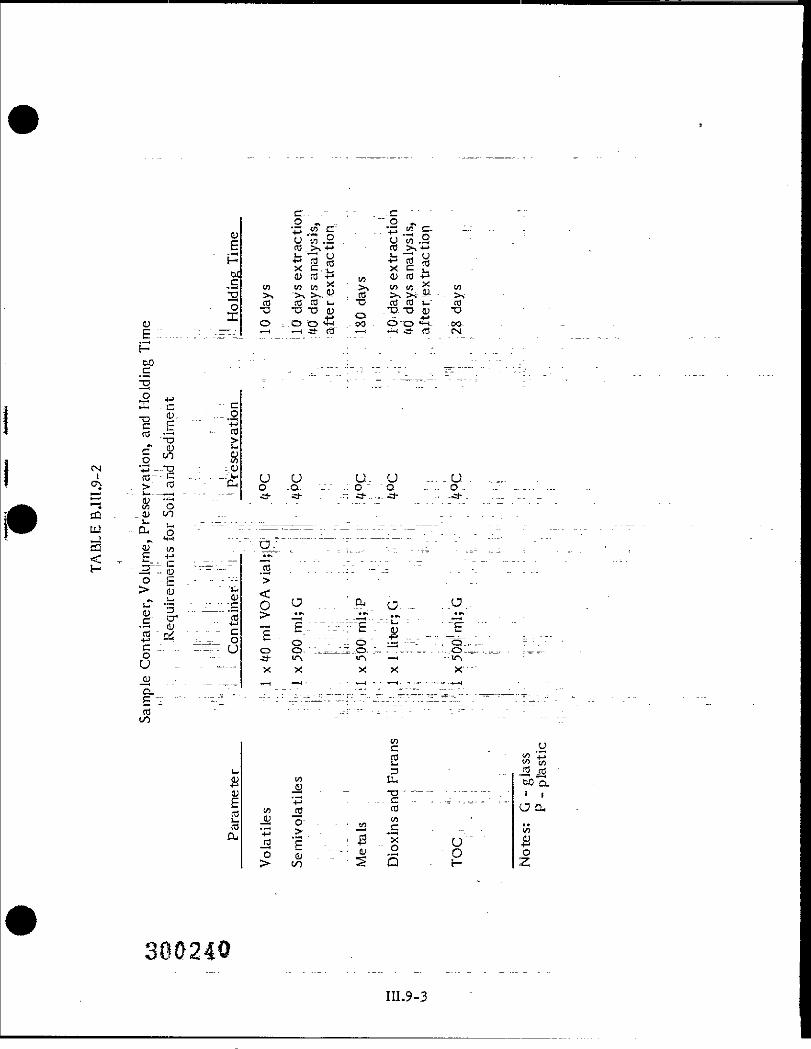
CJEPDO^CTD~O
....«-T ID i-§ "> Si
<N '43 —13 - - <Ut nj~- c ...: . _.->o\ >- co - CU
CD . _ <L>
gu_QJ
"a.£CO
C-- -- I - . -C ".2 « - ~.2 *u "« .2 . u "« .2
X C. j_ X C ,<LI ra -H w <L> fd -Pto t / ) t n ^ > - , t/> w) ^ enco to d i— ' "c nJ cd u." td
4-1 O - 4_>O ..DO *+H.. .90 O "O **-!- - OO-
CJ CJ CJ- U .....CJO -Q. - - - - -- O " O - - O ..
1——\ »* T ' - - y-M
CQ <U « . Si£ 1--~ !- ,-:=- ..... - (0
E<O
o . -. o _ -"--: - . "o;o -Q. •-: J=JjJi:,o.;-. - ----- -- - ...,o.j- u-\ ir% —. -_-.IAX X X X X
« tu-- - - --j•^ - ..... C
t/i rd ^J-J "o- «—< u - - . « —-—* ^ _-i u-COa " o OQ - t-
tO Q.1 io a
oZ
3
SOP NUMBER: ~ B.III.10
TITLE: Field 'Measurement of Dissolved Oxygen in Water
SCOPE: " - "This operation procedure describes steps involved inmeasuring the dissolved oxygen content of aqueous samplescollected .in the field from well and surface water sources.
OBJECTIVE: " • Determine the concentration of dissolved oxygen inaqueous samples.
EQUIPMENT: ... • Y?U°W Springs Instrumentation Model 51B
- -• Barometer
• 300 ml BOD incubation bottle
• Alpha type sampler (for samples collected from depthsof less than 5 feet) ... _
• Kemmerer samples (for samples collected from depthsgreater than 5 feet)
• Distilled water
PROCEDURES:
PREFIELD
1. Check and calibrate analyzer to ensure that it isin proper operating order following manufac-turer's Instructions.
2. Clean samples with distilled water.
3. Assemble sample bottles and distilled bottles forfield use.
AT EACH SAMPLING LOCATION
1. For wells
• Purge water from well equivalent to 5times, its volume.
• Allow water to recover.
O A f) 2.4 1 * Rinse sampler with distilled water.
III. 10-1
• Collect sample with appropriate sampler,(see above).
2. : For surface water
• Dip sampler into water source and rinse.r" """' "Discard rinse water away from collecting
: - T Jocatlo.n. .
• Dip sampler into water and collect sample.
3. Immediately upon collection, place sample into300 ml BOD incubation bottle. Take special
,..._precautions "to avoid entrainment or solution of— atmospheric oxygen or loss of dissolved oxygen.
:4-. When a Kemrnerer type sampler is used, the BODsample bottle will be filled to overflowing, withoverflow occurring for approximately 10seconds." The outlet of the Kern merer will beinserted to the bottom of the BOD bottle. Whilebottle is being filled, care will be taken toprevent turbulence and the formation of bubbles.
5. Record temperature of sample.
6. Place probe into, -sample to be measured andprovide stirring.
7. Adjust salinity knob .to the salinity of sample.
8. Allow sufficient time for probe to stabilizetemperature and dissolved oxygen. Read
dissolved oxygen.
HI.10-2
SOP NUMBER: _ " BJE.II,U_. ._ ..._....,. -..,.„...._.,_......_.
TITLE: - . .... !"Field Measurement ofTEh in Water
SCOPE:" """".? """This procedure describes-steps involved in measuring theoxidation-reduction (Redox) potential (general oxidizing andreducing characteristics ol-.arr environment) while in thefield. Redox potentials make it possible to refinequalitative statements of'.. chemical reactions and toestimate "semi-quantitatively just what concentration ofvarious ions arid compounds would be expected under certainenvironmental conditions.
OBJECTIVES: ""To. 'determine the Redox potential of. aqueous samplescollected in the field from groundwater and surface water.
EQUIPMENT: __ _ •_ ... Model.&lQ..Eh meter.
• Distilled water " "" " "
• Widemouth 1-liter glass orplastic sample bottle.
PROCEDURES: 1. The Model S10 is a ..convenient tool for measuringelectrode potential and indicating results in millivolts.The procedure is similar to that for pH determinationsexcept that a metallic indicator electrode (or elementif_.using a metallic, combination electrode) is employedinstead 01 a glass indicator electode. Additionally,there is .no need,to. standardize the instrument with abuffer solution. Readings can be taken as soon as themillivolt zero reference point is established.
2. With preliminary procedures completed, performmillivolt or Redox-measurements as follows:
• Set FUNCTION selector to STANDBY position.
• Insert one end of shorting jumper (supplied with._._. .. ........ _.—. —._ instrument) into REF jack and attach other end
of jumper to .supplied pin-jack connector.
• Insert pin-jack connector into INPUT jack'andtighten knurled locking screw.
iii.n-i
• Set FUNCTION.selector to MV.
- - • " Adjust STANDARDIZE control until digitaldisplay indicates 0 millivolts.
• Set FUNCTION selector to STANDBY.
• Remove shorting jumper and pin-jack connectorfrom instrument.
• Mount and connect electrode system.
• Immerse electrode system in sample solution.
NOTE: To provide adequate electrolyte flow,make certain that rubber sleeve has beenlowered from over filling hole of reference ormetallic combination electrode.
• Allow sufficient* time for electrode system toreach termal equilibrium with sample solution(normally about 2 minute's).
• Set FUNCTION selector to MV.
• Read potential of sample from digital display.
* Set FUNCTION selector to STANDBY.
• Remove electrode system from solution.
• To" "avoid contamination of one solution withanother, rinse electrode system with distilledwater before "proceeding with next measurement.
-- • Repeat steps 9 through 15 for remainingsamples.
REFERENCES ,..._...: ,.._.__ ..... .."... .
EPA OSWWER, Dec; 19S7, Compendium of Superfund Field Operations Methods,EPA Office of Solid"""Wa'steThd Emergency Response, Directive 9355, 0-14,("Compendium").
III.11-2
SOP NUMBER: BJH.12 _
TITLE: "" :Ti"eId Measurement of Eh in Soil/Sediment
SCOPE: - This procedure describes the steps involved in measuring theoxidation potential (general oxidizing and reducingcharacteristics of an environment) of soil and bottomsamples in the field.
OBJECTIVES: _._-___T6 determine the"ox~Tdation potential of soils and bottomsediments during field sample collection activities.
EQUIPMENT: ._ .'o. . .Model 810 Eh meter
o Distilled water :
o Widemouth, 1 liter sample beaker or bottle, glass orplastic ' :.;... - "„.; " . ;v,... ,.. :\ .
o -- Analytical balance " . ' ". : .
o Graduated cylinder.
PROCEDURES;' .. .. ,1. Add approximately 20 ml of distilled water to-approximate ly 20 grams of soil in a 50-mi beaker orbottle and stir the suspension several times' during "a.30-minute period.
2. Let the soil suspension stand for about 1 hour to allowof . the.su spend ed clay to settle out.
3. The. Model 810 is a convenient tool for measuringelectrode potential and indicating results in millivolts.The procedure is similar to that for pH determinations"except that a metallic indicator electrode (or elementif .using a metallic combination electrode) is employedinstead of a glass indicator electode. Additionally,there is no need to standardize the instrument with abuffer solution. Readings can be taken as soon as themillivolt zero reference point is established.
4. With preliminary procedures completed, performmillivolt or Redox measurements as" follows:
300245III. 12-1
• Set FUNCTION selector to STANDBY position. ,
. -• - Insert one end of shorting jumper (supplied withinstrument) into REF jack and attach other endof jumper to supplied pin-jack connector.
• Insert pin-jack connector into INPUT jack and...._ ..... ....... tighten knurled locking screw.
• Set FUNCTION selector to MV.
" • Adjust STANDARDIZE control until digitaldisplay indicates 0 millivolts.
•__. Set FUNCTION selector to STANDBY.
• Remove shorting jumper and pin-jack connector... _.„ . ,. ... from instrument.
• Mount and connect electrode system.
* Immerse electrode system in sample solution.
NOTE: To provide adequate electrolyte flow,make certain that rubber sleeve has beenlowered from over filling hole of reference ormetallic combination electrode.
• Allow sufficient time .for electrode system to-re ach termal equilibrium with sample solution(normally about 2 minutes).-
• Set FUNCTION selector to MV.\
• Read potential of sample from digital display.
• Set FUNCTION selector to STANDBY.
• Remove electrode system from solution.
• To avoid contamination of one solution withanother, rinse electrode system with distilledwater before proceeding with next measurement.
• Repeat the steps above for the remainingsamples.
0246
.. ..... ___.._. ..... ... III. 12-2
REFERENCES
EPA OSWER, December 1.9.87, Compendium of Superfund FieldOperations Methods, EPA Office of Solid Waste andEmergency Response, Directive 9355, 0-H,("Compendium").
300247IIU2-3
SOP NUMBER: B.IIU3 jTITLE: Field Measurement of pH in Soil/Sediment
SCOPE: " This operating procedure describes the technique lorscreening soil and bottom sediment samples for pH at thetime they are collected in the field.
OBJECTIVES: i— -.Pr.oyid.e uniformity and accuracy to the measurement of soiland bottom sediment pH while in the field.
EQUIPMENT: __. • ~ pH meter* .and its accompanying electrode or probe
• Buffer solutions of known pH (4.0, 7.0, and 10.0)
.I*... . Plastic, or glass, beakers or cups (at least 50-mIvolume)
• Distilled or deionized water
• Polyethylene spray bottle
• Waterproof marking pen or pencil
• Liquid waste container
• Thermometer
• Trash receptacle.
* Portable pH meters available with Dames & Moore for usein field include 1) LaMotte pH meter - model HA series and2) Fisher Scientific Mini Analog pH meter - Model R-598"8-00.
PROCEDURES: " 1, Add 20 ml of distilled water to 20 g of soil in a 50-mIbeaker and stir the suspension several times during a30-minute period.
~ 2. Let the soil suspension stand for about 1 hour to allowmost of the suspended clay to settle out.
3. Immerse the probe of the pH meter just far enoughinto the clear supernatant solution to establish a goodelectrical contact." Then, immerse the probe into thepartly settled suspension and measure the pH.
300248III.13-1
4. Report the results as "soil pH measured in water.
5. Se.e B.IV.2 for operation and maintenance of pH meter.
IIU3-2
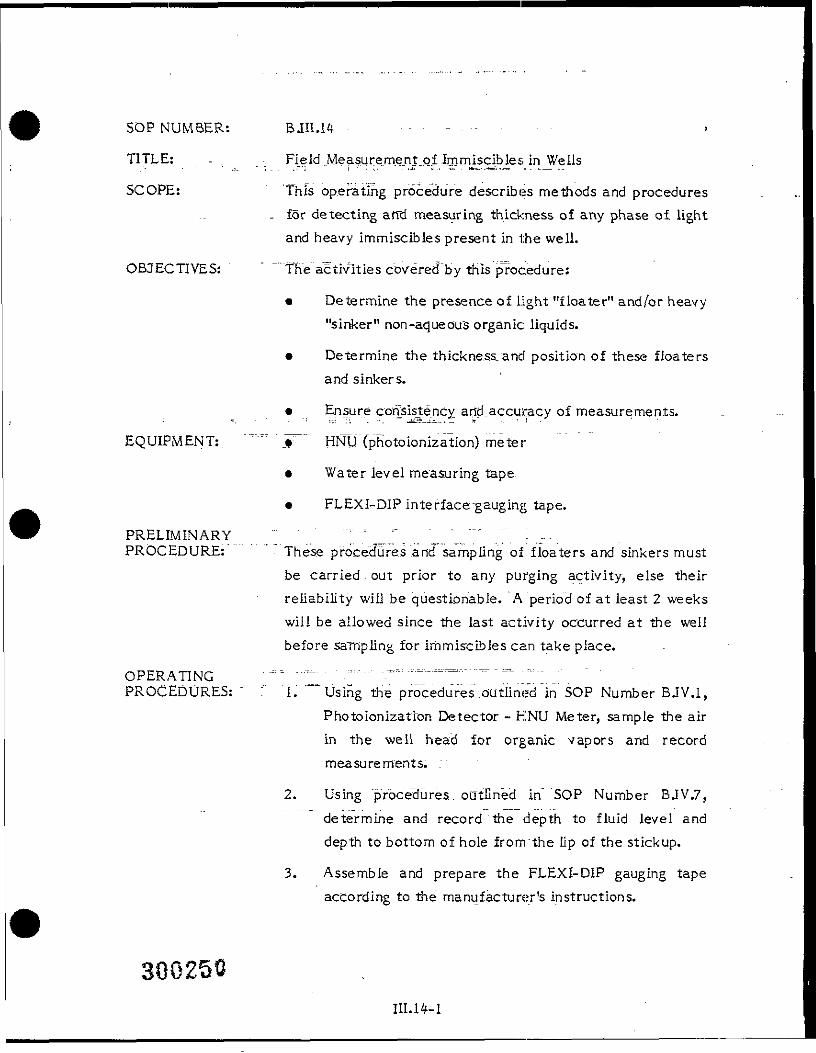
S O P NUMBER: BJJI.14 . . . _ . . . . . .
TITLE: - _ . Field ea5ure.me^nt_of.Immiscibles in Wells
SCOPE: This operating procedure describes methods and procedures„ for detecting and measuring thickness of any phase of light
and heavy immiscibies present in the well.
OBJECTIVES: The activities covered by this procedure:
• Determine the presence of light "floater" and/or heavy"sinker" non-aqueous organic liquids.
• Determine the thickness.and position of these floatersand sinkers.
• Ensure consistency arrd_accu.racy of measurements.
EQUIPMENT: ~""T " jf HNU (pnotoionization) meter
• Water level measuring tape.
• FLEXI-DIP interface-g-auging tape.
PRELIMINARY " " "; = _; _ __ _ _'".: ; ' ] . - - .PROCEDURE: These procedures and sampling of floaters and sinkers must
be carried out prior to any purging activity, else theirreliability will be questionable. A period of at least 2 weekswill be allowed since the last activity occurred at the wellbefore saitipling for immiscibles can take place.
OPERATING l^V'H" ' -—=---——--—-- —PROCEDURES: '"" ' 17 Using the procedures".outlined "in SOP Number BJV.l,
Photolonization Detector - HNU Meter, sample the airin the well head for organic vapors and recordmeasurements. ."
2. Using "procedures, outlined in" SOP Number BJV.7,determine and record the depth to fluid level anddepth to bottom of hole from"the Up of the stickup.
3. Assemble and prepare the FLEXI-DIP gauging tapeaccording to the" manufacturer's instructions.
III. 14-1
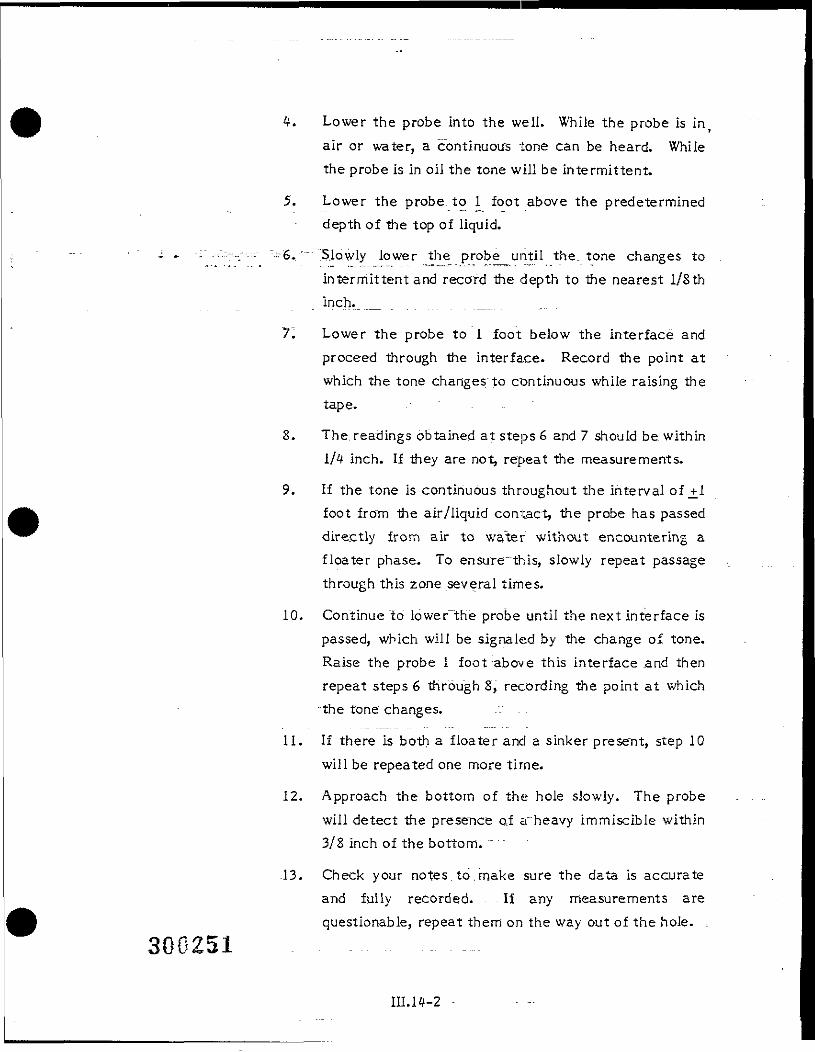
4. Lower the probe into the well. While the probe is inair or water, a continuous tone can be heard. Whilethe probe is in oil the tone will be intermittent.
5. Lower the probe, to 1 foot above the predetermineddepth of the top of liquid.
- - L . K- ~- 6..-'-" Slowly lower the probe_ until the. tone changes tointermittent and record the depth to the nearest 1/Sthinch. _ . . . . . . . . .__...
7. Lower the probe to 1 foot below the interface andproceed through the interface. Record the point atwhich the tone changes to continuous while raising thetape. . "
8. The. readings obtained at steps 6 and 7 should be. within1/4 inch. If they are not, repeat the measurements.
9. If the tone is continuous throughout the interval of _+!foot from the air/liquid contact, the probe has passeddirectly from air to water without encountering afloater phase. To ensure"this, slowly repeat passagethrough this zone several times.
10, Continue "to lower~the probe until the next interface ispassed, which will be signaled by the change of tone.Raise the probe I foot above this interface and thenrepeat steps 6 through 8, recording the point at which
------ -the tone changes. --" - -
11. If there is both a floater and a sinker present, step 10will be repeated one more time.
12.. Approach the bottom of the hole slowly. The probewill detect the presence of a""heavy immiscible within3/8 inch of the bottom.
13. Check your notes, to .make sure the data is accurateand fully recorded. - - If any measurements arequestionable, repeat them on the way out of the hole. ,
300251 _ - -
IIU4-2
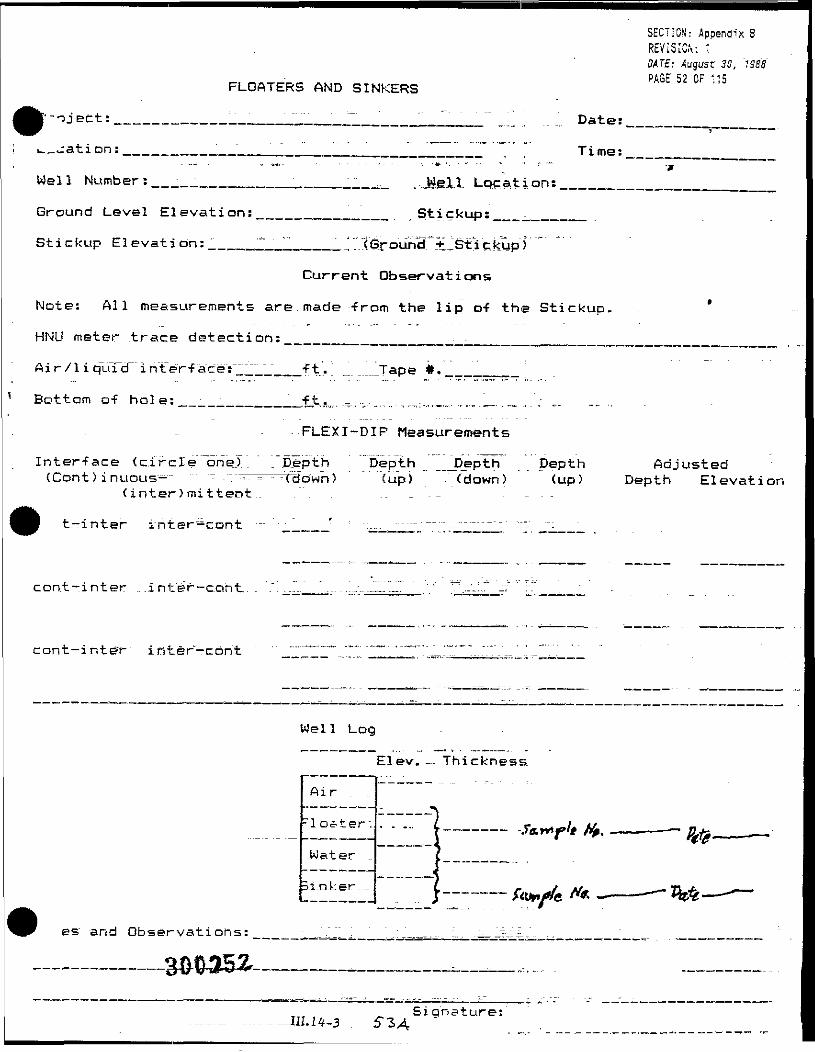
SECTION: Append-ix BREVISION: "HATE: August: 30, '136piGF 50 OF ""i
FLOATERS AND SINKERS
________'._~_'.'.... , _" Date:
>—uati on: ___________________________________ Ti me:
Well Number:__.___________;___________ ,. Jte 11 Locations______
Ground Level Elevation: _____________ Stickup:__ ______
Stickup Elevation: ____'."" _____^ ..TGrounH .V Stic.kup )"""'
Current Observat i ons
Note: All measurements are made :-frorn the lip o-f the Stickup.
HNU meter trace detection:
Air /I iquTcT intVr-f ace:" __"__ft'.." '_. _.!_Tape #.____
Bottom o-f hole: . . -ft. _ ... ... ,....: '.
FLEXI-DIP Measurements
Inter-Face < circle ""oriel . /Djipth "Depth _ _Depth Depth Adjusted(Cont) inuous^-" ~ -~--- = ^cao'wn) (up) fdown) (up) Depth Elevation
(inter)mittent _ _ ._ _ .
t-inter inter-cont — -- ' -:.... -- — - — - _ . — — ----- _---=- -:
cont-inter .. .inter-cant..
con t—inter inter-cbri't
Well Log
Elev. _ Thickness.
Air . ..
-loater".
Water
es and Observations:
ignature:
SOP NUMBER: B.III.15
TITLE: Sampling of Immiscibles in Wells
SCOPE: This operating procedure describes methods and proceduresfor extracting samples from any phase of light and heavyimmiscibles present in the well.
OBJECTIVES: The activities covered by this procedure:
-- - - * Extract a liquid sample from a "floater" non-aqueousorganic liquid.
• Extract a liquid sample from a "sinker" non-aqueousorganic liquid.
EQUIPMENT: •" Peristaltic pump
• Measuring tape
• Tubing for the pump
* Marking tape.
PREREQUISITE ,__ ;: , : . = -- ;PROCEDURES: The floater and/or sinker liquid must have been detected
and depths established, and the sampling must be carried outprior to any purging activity.
OPERATING " "" ' "-'" '" '"" -•-.-—— ..PROCEDURES^ ———— -1. From the intake of the pump tubing, carefully measure
the depth to the middle of the "floater" liquidrecorded on the "Floaters, and Sinkers" sheet. Markthis with tape wrapped on the tubing. Similarly,measure the depth to the middle of the "sinker" liquidphase and mark with tape.
If the floater liquid column is thin, the marker shouldbe situated such that when the intake is lowered, itwill barely submerge in the floater column.
If the sinker liquid column is thin, the marker for thatshould be situated such that the intake will besuspended barely above the bottom of the hole.
III.15-1
2. Lower the pump intake into the well to the depth ofthe first (floater) marker, i.e., the tape mark is at thelip of the stickup. Draw two samples using standard
...procedures. LABEL the samples.
3. Lower the pump intake further down the well to thedepth of the second (sinker) marker. Again draw twosamples -using standard procedures. LABEL thesamples.
4. Record the sample numbers and date on the "Floatersand Sinkers" sheet.
300254III. 15-2
SOP NUMBER: BJIU6
TITLE: -Guidance for Field Record Keeping
SCOPE: This procedure provides guidance for the maintenance of•" . ' " . "records in the field.
OBJECTIVES: To establish uniform methods, of maintaining and preserving; ; records that contain observations, measurements, and other
documentation of field conditions.
EQUIPMENT: • Sample identification tags
• Chain-ofrcustody (COC) forms and records (see\ Exhibits 5-4, 5-5, and 5-6)
• Field notebooks
* • Photographic logs
I • Sample.boring log forms._ ,
PROCEDURES: 1. The Project Manager (PM) or another designatedperson maintains a supply of the documents listedabove, including field notebooks. The PM isresponsible for the inventory of serialized documentsand the assignment of. these documents to specificprojects. The PM notes the return of these documentsin the serialized document logbook. The samplermaintains a personal logbook in which is recorded the
. , . , - . . •_- ;::*.- - F .;. -v, •<: • - r - •• -"0
final disposition of. all relevant field information. A._.. __cross-refe.rence of serialized field documents is
usually maintained in the project files.
2. Sample Identification
• Sample identification tags (see Figure 6-2) are..distributed as needed to field workers by the PM(or designated representative). Generally, serialnumbers,are recorded in the project files, the
~" "field notebook, and the field data record sheet.Individuals are accountable for each tag assigned
III.16-1
to them. A tag is considered to be in anindividual's possession until it has been filled out,attached to a sample, and transferred to anotherindividual along with the corresponding chain-of-custody record. Sample identification tags arenot to be discarded. If tags are lost, voided, ordamaged, the .facts are noted in the appropriatefield notebook, and the PM is notified. For eachsample station, samplers should record thefollowing:
• Case/Number(s): The unique number(s)assigned by the PM to identify the sam-pling event (entered under "Remarks"heading)
• Sampling location, if sa"mple station is notshown on site maps.
• Weather conditions.
• Sample fractions collected, containersused, and preservation techniques.
• Condition of sample.
• Water level or depth, if appropriate.
» Field measurements (pH, Eh, specific con-ductance, and temperature followingmethods in Appendix D).
For instances in which a split sample istaken, samplers should note the method ofsplitting the sample. Samplers also.shouldinspect sample containers used by the EPAOSC (or representative) and note discrep-ancies or. deviations in container materials,preparation, preservation, use, or packing.
300256. .:•-... : ".:- HI.16-2
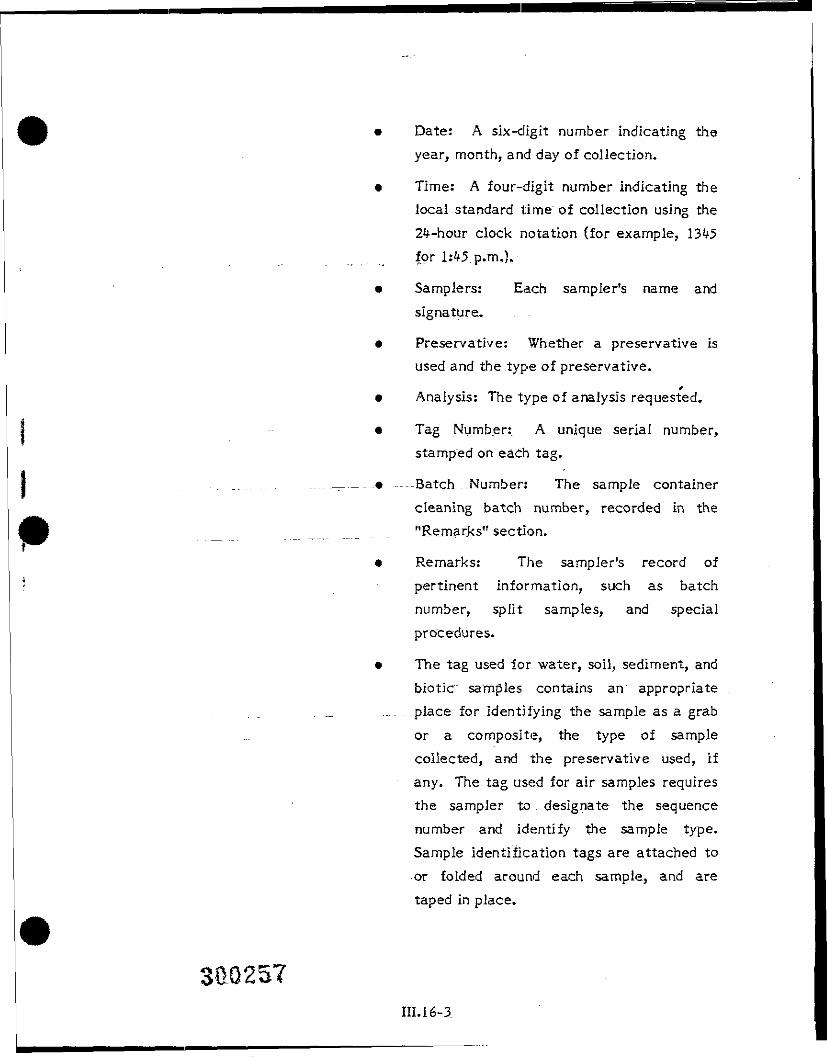
Date: A six-digit number indicating theyear, month, and day of collection.
Time: A four-digit number indicating thelocal standard time of collection using the24-hour clock notation (for example, 1345for 1:45 p.m.).
Samplers: Each sampler's name andsignature.
Preservative: Whether a preservative isused and the type of preservative.
*Analysis: The type of analysis requested.
Tag Number: A unique serial number,stamped on each tag.
Batch Number: The sample containercleaning batch number, recorded in the"Remarks" section.
Remarks: The sampler's record ofpertinent information, such as batchnumber, Split samples, and specialprocedures.
The tag used for water, soil, sediment, andbiotlc samples contains an appropriate.place for Identifying the sample as a grabor a composite, the type of samplecollected, and the preservative used, ifany. The tag used for air samples requiresthe sampler to. designate the sequencenumber and identify the sample type.Sample identification tags are attached toor folded around each sample, and aretaped in place.
SH0257III. 16-3.
3. DAILY WORK LOGS
Each hydrogeologist supervising a drill rig andeach person collecting samples will be assigned abound field notebook in which he/she will main^tain a detailed chronological record of each day'swork. Field notebooks are intended to providesufficient data and observations to enableparticipants to reconstruct events that occurred.during projects and to refresh the memory of thefield personnel If called upon to give testimonyduring legal proceedings. In a legal proceeding,notes, If referred to, are subject to cross-examination and are admissible as evidence. Thefield notebook entries should be factual,detailed, and objective. The following generalrules apply to daily work logs:
• Each day's activities will be started on anew page.
• Each page will have the name of the site inthe top line left and the date in the topline right. Each page will be signed by theperson keeping the log.
* Each entry will begin with the time(military notation) and will contain a briefdescription of a specific event, fieldmeasurement, or communication.
• Discrete water level measurements shouldbe tabulated on a single page.
* Empty space at the bottom of a page willbe voided with a diagonal line.
The daily work logs should be specific concerningthe location being described (well number,
300258IIU6-4
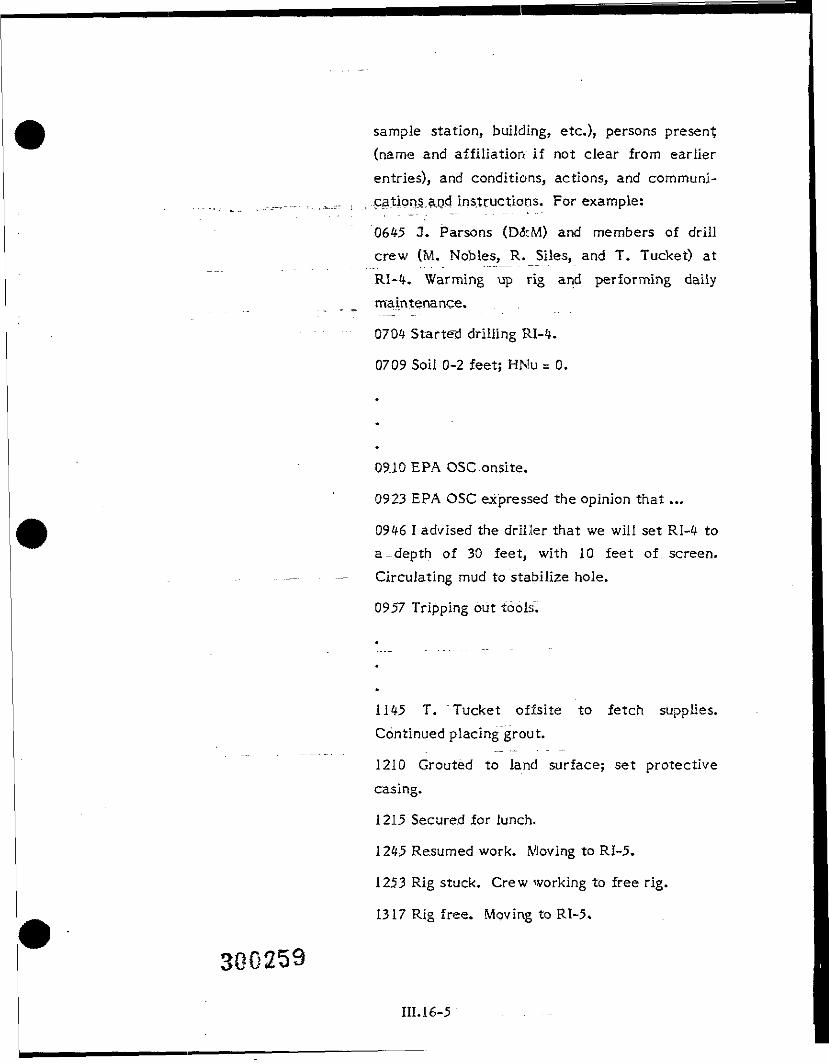
sample station, building, etc.), persons present(name and affiliation if not clear from earlierentries), and conditions, actions, and communi-cation_s.a,nd instructions. For example:
0645 3. Parsons (D&M) and members of drillcrew (M. Nobles, R. Siles, and T. Tucket) atRI-4. Warming up rig and performing dailymaintenance.
0704 Started drilling RI-4.
0709 Soil 0-2 feet; HNu = 0.
0910 EPA OS C onsite.
0923 EPA OSC expressed the opinion that ...
0946 I advised the driller that we will set RI-4 toa-depth of 30 feet, with 10 feet of screen.Circulating mud to stabilize hole.
0957 Tripping out tools;
1145 T. Tucket offsite to fetch supplies.Continued placing grout.
1210 Grouted to land surface; set protectivecasing.
1215 Secured for lunch.
1245 Resumed work. Moving to RI-5.
1253 Rig stuck. Crew working to free rig.
1317 Rig free. Moving to RI-5.
III. 16-5
4. Chain-of-Custody Forms and Records ,
""•"" Because, samples collected during an investiga-tion could be_..;used as evidence in litigation,possession of the samples must be traceablefrom the time each Is collected until it isintroduced as evidence in legal proceedings. Todocument "sample possession, chain-of-custodyprocedures are followed.
• Samples are accompanied by a chain-of-custody.-:. (COC) iorm or record (Figure 6-1). When
transferring samples, the individuals relinquish-ing and receiving them should sign, date, andnote the time on the form. This form documentssample custody transfer from the sampler, oftenthrough another person, to the analyst, who is ina mobile or contract laboratory.
• Samples are packaged properly for shipment anddispatched to the appropriate laboratory foranalysis, with a separate COC recordaccompanying each shipment. Shippingcontainers are padlocked or sealed with custody
--— ---seal? for shipment to the laboratory. Themethod of-shipment, courier name(s), and otherpertinent information such as the laboratory
_ name should be entered in the "Remarks" sectionof. the COC record.
« All shipments are accompanied by a COC recordidentifying their contents. The original formaccompanies the shipment; the copies areretained by the sampler and returned to thesampling coordinator.
3062SO
III.16-6
* Freight bills, postal service receipts, and bills oflading should be retained as part of thepermanent documentation for the COC records.
5. Custody Seals.
• When samples are shipped to the laboratory, theymust be placed in padlocked containers orcontainers sealed with custody seals (Figure
- - - - - - - -6"-2). Some custody seals are serially numbered.These numbers must appear in the cross-reference matrix of the field document and on
i _ •; .the COC report. Other types, of custody sealsinclude unnumbered seals and evidence tape.
• When samples are shipped, two or more seals areto be placed on each shipping container (such asa.cooler), with at least one at the front and oneat the. back, located in a manner that wouldindicate if. the container were opened in transit.Wide, clear tape should be placed over the seals
J- to ensure that seals are not accidentally brokenduring shipment. Nylon packing tape may beused providing that it does not completely coverthe custody seal. Completely covering the sealwith this type of tape may allow the label to bepeeled off. Alternatively, evidence tape may be
_ ... . substituted for custody seals.
• If samples are subject to interim storage beforeshipment, custody seals or evidence tape may beplaced over the lid of the jar or across theopening of the storage box. Custody duringshipping would be the same as described above.Evidence tape may also be used to seal theplastic bags or metal- cans that are used tocontain samples in the cooler or shipping
30C261III.16-7
container. Sealing individual sample containersassures that sample integrity will not becompromised if the :outer container seals areaccidentally broken.
6. Photographic Logs
• For all photographs taken, a photographic Jog iskept; the log records date, time, subject, frameand roll number, and photographer. For "instantphotos," the date, time, subject, and photog-rapher are ..recorded directly on the developedpicture. The serial number of the camera andlens are recorded-in the project notebook. Thephotographer should review the photographs orslides when they return from developing andcompare them to the log, to asure that the logand photographs match. It can be particularlyuseful to photograph the labeled sample jarsbe-iore packing them into shipping containers. Aclear photograph of the sample jar, showing the
... -jabel, any evidence tape sealing the jar, and the
... --cojor and amount of sample, can be most usefulin reconciling any later discrepancies,
7. Correction to Documentation
• Unless restricted by weather conditions, alloriginal data recorded in field notebooks and onsample identification tags, chain-of-custodyrecords, and receipt-for-samples forms arewritten in waterproof, ink. These, accountableserialized documents are not to be destroyed orthrown away, even if they are illegible orcontain inaccuracies that require a replacementdocument.
111.16-i
• If an error is made on an accountable documentassigned to one person, that individual may makecorrections simply by crossing out the error andentering the correct information. The erroneousinformation should not be obliterated. Any errordiscovered on an accountable document shouldJ?e corrected by th.e person who made the entry.All corrections must b.e initaled and dated.
8. Records and Inspection
• All drilling and sampling activities should becontinuously inspected by qualified, experiencedpersonnel. Continuous Inspection Is essential toassure that the intent of the drilling program isbeing followed arid to provide knowledgeabledirection to the field crews when conditionsdictate variance from the original plan.
• Inspection personnel should prepare daily reportsthat include the following:
• Activity logs or field notebooks
• Boring logs
• Sample documentation.
* Reporting is essential to adequately documentthe unusual site conditions, the drilling andsampling quantities, and the personnel onsite forproject control and to thoroughly documenttechnical methods and results.
9. Geological Logging
• Geological logging, as previously defined,includes keeping a detailed record of drilling (orexcavating) and a geological description ofmaterials on a prepared form. Geological logsare used for all types o£_dnlling and exploratory
III. 16-9
300264
excavations and include descriptions of both soijand rock. General guidance for logging soils androck is provided below,
• Methods - Soils
When drilling in soils or unconsolidated deposits,keep the log on a sample boring log form. Thefollowing basic information should be entered onthe heading of each log sheet:
• Project name and number
• Boring or well number
• Location (approximate in relation to anidentifiable landmark; will be surveyed.See Section 14, Land Surveying, AerialPhotography, and Mapping).
• Elevation (approximate at the time; will besurveyed. See Section 14, Land Surveying,Aerial Photography, and Mapping).
• Name "of drilling contractor
• Drilling method and equipment
• Water level
• Start and finish (time and date)
• Name of. logger
In addition to the items listed above, allpertinent observations about drilling rate,equipment opera tionj or unusual conditionsshould be noted.-Such information might includethe following:
• Size" of casing used and method ofinstallation
IIU6-10
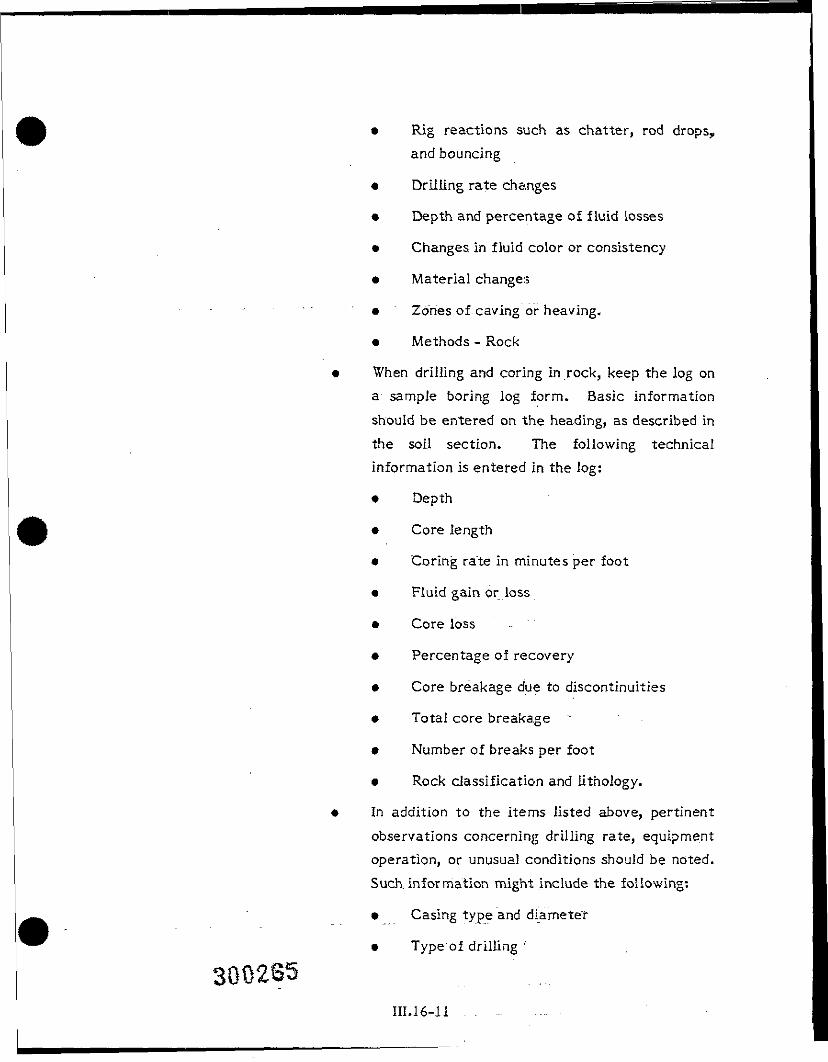
• Rig reactions such as chatter, rod drops,,and bouncing
* Drilling rate changes
• Depth and percentage of fluid losses
• Changes in fluid color or consistency
• Material changes
• Zones of caving or heaving.
• Methods - Rock
• When drilling and coring in rock, keep the log ona sample boring log form. Basic informationshould be entered on the heading, as described inthe soil section. The following technicalinformation is entered in the log:
* Depth
• Core length
• "Coring ra'te In minutes per foot
• Fluid gain or loss
• Core loss
• Percentage of recovery
* Core breakage due to discontinuities
* Total core breakage
» Number of breaks per foot
• Rock classification and iithology.
• In addition to the items listed above, pertinentobservations concerning drilling rate, equipmentoperation, or unusual conditions should be noted.Such. Information might include the following:
* Casing type and diameter
• Type of drilling •'
300285111.16-11 . . . . . . . .
* Rig reactions ,
• ; • Depth and percentage of fluid losses
• ri. Nfaterial changes .
* Zones'of caving.
REFERENCES
EPA OSWER, December 19S7, Compendium of Superfund Field OperationsMethods, EPA OSWER, Directive 9355, 0-14 ("Compentlum").
111.16-12
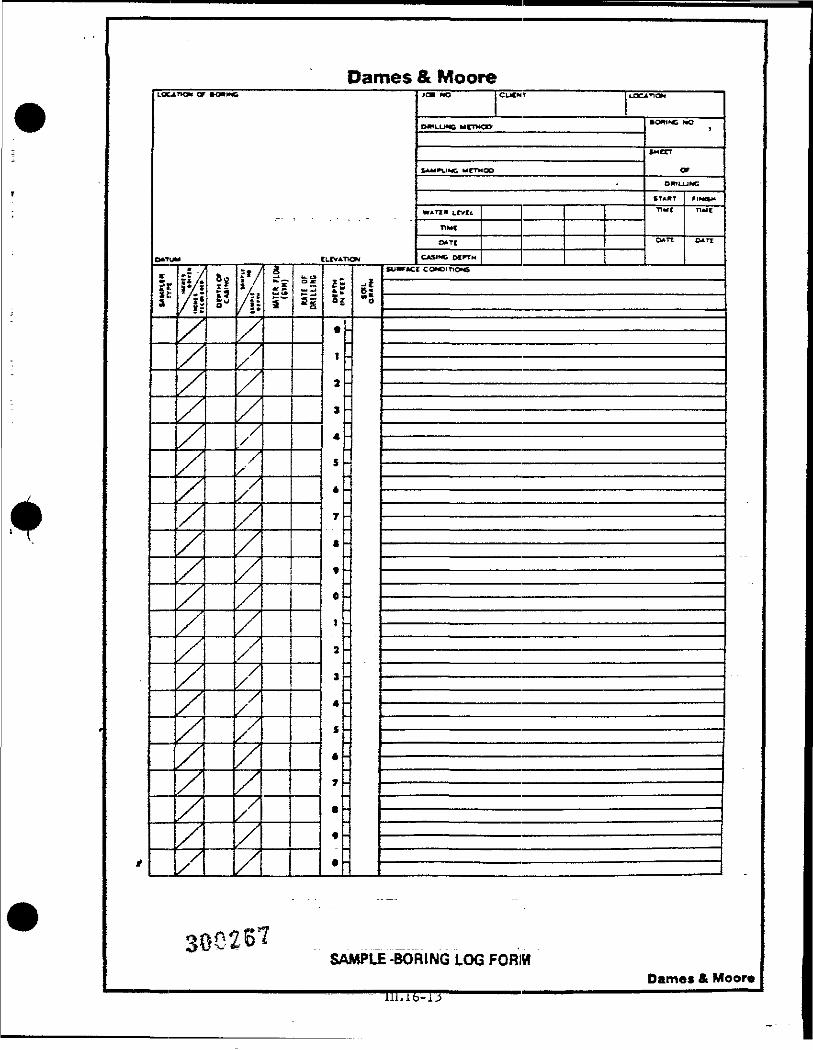
Dames & MooreLQCjno* OF tOftlNC
DATUM
P
a
/f!////[/V///////////////
or»iHor
CUING%///
V/////////////////
&M. —— .
CLIVATKM
MTE
OFMHUNG
OIPTH
IN mi
t
T
3
3
4
5
*
7
t
*
0
1
3
4
S
*
7
•
•
0
H
jcm MO CUCNT LOCATION
O-.LUMO Mrr>4ci> •OW1* •« ,
•HCTT
UM^VING urmoo orOM4JJMC
CTAHT FIMO"
«*n» i.rvtt •""< "«»nwe0*T[ 0*™ 0*
CASJMG DZ TH
»«r«i coMMrro^
3002SAMPLE -BORING LOG FORM
Dames & Moor*
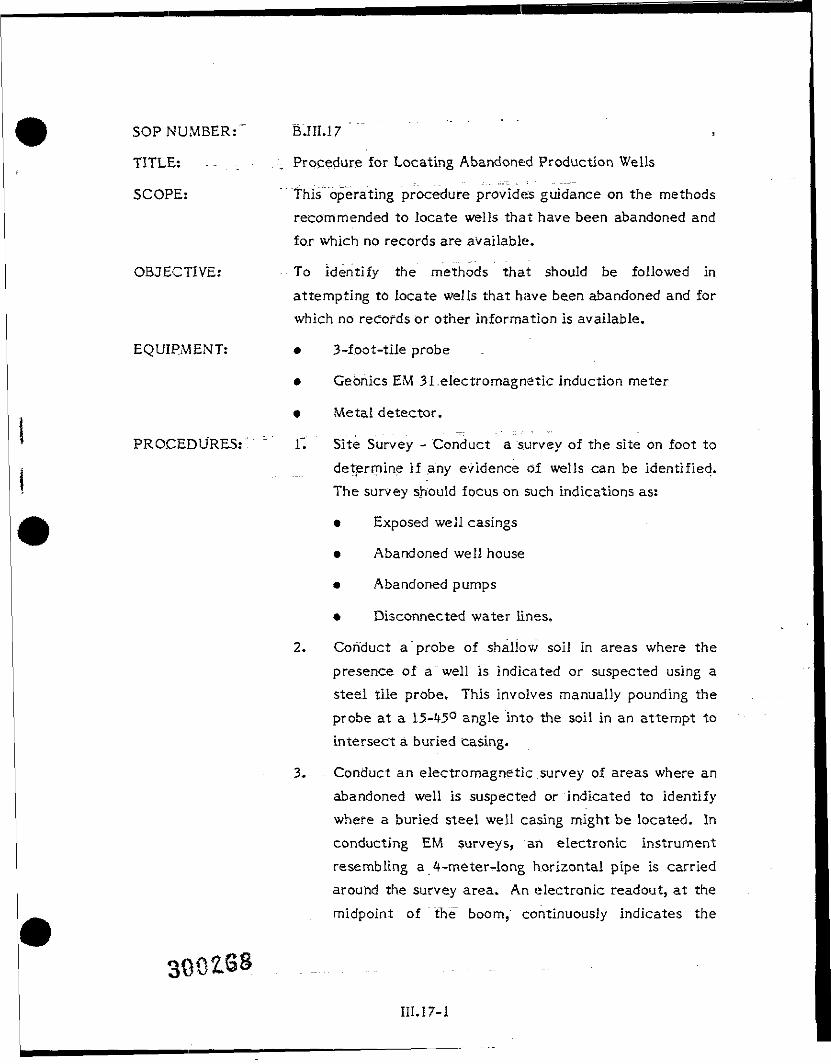
SOP NUMBER:' B.III.17
TITLE: - .-'-, Procedure for Locating Abandoned Production Wells
SCOPE: "This operating procedure provides guidance on the methodsrecommended to locate wells that have been abandoned andfor which no records are available.
OBJECTIVE: To identify the methods that should be followed Inattempting to locate wells that have been abandoned and forwhich no records or other information is available.
EQUIPMENT: • 3-foot-tile probe
• Gebnlcs EM 31 electromagnetic induction meter
• Metal detector.
PROCEDURES:' " 1~. Site Survey - Conduct a survey of the site on foot todetermine if any evidence ol wells can be identified.The survey should focus on such indications as:
• Exposed well casings
• Abandoned well house
• Abandoned pumps
* Disconnected water lines.
2. Conduct a probe of shallow soil in areas where thepresence of a well is indicated or suspected using asteel tile probe. This involves manually pounding theprobe at a 15-45° angle into the soil in an attempt tointersect a buried casing.
3. - Conduct an electromagnetic .survey of areas where anabandoned well is suspected or indicated to identifywhere a buried steel well casing might be located. Inconducting EM surveys, an electronic instrumentresembling a 4-meter-long horizontal pipe is carriedaround the survey area. An electronic readout, at themidpoint of the boom, continuously indicates the
III.17-1
300169
effective conductivity or resistivity of the groundbelow. Measurements are often made at a spacing of2 meters to 10 feet. The spatial pattern of changes inthe recorded measurements indicates anomalous areas.Results are much like those from a four-electroderesistivity, meter; no contact is made with the soil,however, and the speed of survey is much faster. Thesurvey rate is about that of a magnetometer; about1,000 measurements can be made in a day.
4. Traverse the slte~-where abandoned wells are indicatedor suspecated with a metal detector designed toidentify the presence-of buried metallic objects.
HI.17-2
SOP NUMBER:
TITLE: " Abandonment.^ Wells amd Borings
SCOPE: This procedure describes the steps involved in closure of.wells and borings which are to be abandoned.
OBJECTIVES: To Identify an approved method of. well and boring abandon-ment techniques: _._....._.'. ...
• It is important to employ proper procedures inabandoning boreholes or wells, to protect the integrityof the subsurface environment and underlying aquifer.Improperly sealed boreholes/wells can provide a directconduit for surface runoff and contaminants to reachthe subsurface, —• ------ "- - - ' -
NOTE: No wells or borings are to be abandoned withoutEPA approval.
EQUIPMENT: • Drill rig . . . . . . . . ...
• Logging chain, 15" minimum
• 2" PVC, holsting'plug
* PVC glue
• Sheet metal screws
• Clean sand
• Bennett-Williams report boring logs.
* Grout'tank
• Grout mix (cement, bentonite, water)
• Tremie pipe
• Grout pump.
EXISTING-SHALLOW MONITORING WELLS
PROCEDURES: " \f Assess the length of =grout in the annular space byreferring to the'Bennett and .Williams report boringlogs. If the .amount of grout is less than 10 feet, thenattempt to remove the well casing and screen follow-ing steps 2 through 10. If the grout exceeds 10 feet in
III.18-1
length, abandon the well as specified following steps 810.
2. Securely wrap a chain around the protective casingand around the head of the drill stern.
3. Using the hydraulics of the drill rig, pull upward on thechain removing the protective casing from around the.well casing.
4. Glue a 2-inch PVC hoisting plug onto the top of thewell casing using 2 or 3 sheet metal screws to secure.
5* Wait approximately 1 hour for the glue to dry.
6. Attach a chain to the drill stem of the drill rig and tothe hoisting plug. Use. the hydraulics of the drill rig tolift the casing out of the ground. Take care to pull thecasing straight upward so as to not bind and/or breakthe casing. . '. .
7. When the casing has been removed from the boreholeseal the hole following.Steps S through 11.
WELLS CONSTRUCTED UNDER THIS PROJECT •8. Abandoned wells constructed in accordance with SOP
B.I shall be grouted with the well screen and casing inplace by grouting" "from the 5pottorn of the well toground surface. : This shall be done by placing a groutpipe to the bottom" of the well (i.e., to the maximumdepth drilled/bottofrr~of . well screen) and pumpinggrout through this pipe until undiluted grout flowsfrom the well at ground surface...
9. In situations where a well casing and screen cannot beremoved from an uncompleted well to be abandoned,any -open or ungrounted portion of the annular spacebetween the well casing and borehole shall also begrouted in the same manner as identified in Step S
300271 above-
-III.iS-2
10. After 24 hours, the abandoned site shall be checkedfor grout settlement. That day, any settlementdepression shall be filled with grout and checked 24hours later. This process shall be repeated until firmgrout remains at ground surface.
11. Grout shall be composed by weight of 10 parts cement(portland cement, any of types I to V) to % partbentonite with a maximum of- 6.5 gallons of approvedwater per 94-pound bag of cement. Neither additivesnor borehole cuttings shall be mixed with the grout.Bentonite shall be'added after the required amount ofcement is mixed with water. All grout materials shallbe- combined in an aboveground rigid container andmixed onsite to produce_a thick, lump-free mixture.
SOIL BORINGS
12. At the completion of soil sampling, all soil borings willbe abandoned using clean materials as follows:
• Shallow borings which do not penetrate the hardpan will be backfilled with material of ..equal orlower permeability than the surrounding materialto a'.'oid creating a potential contaminantconduit.
* Borings which penetrate the hardpan will be.sealed with grout following Steps 8-11 above.
HI-1S-3
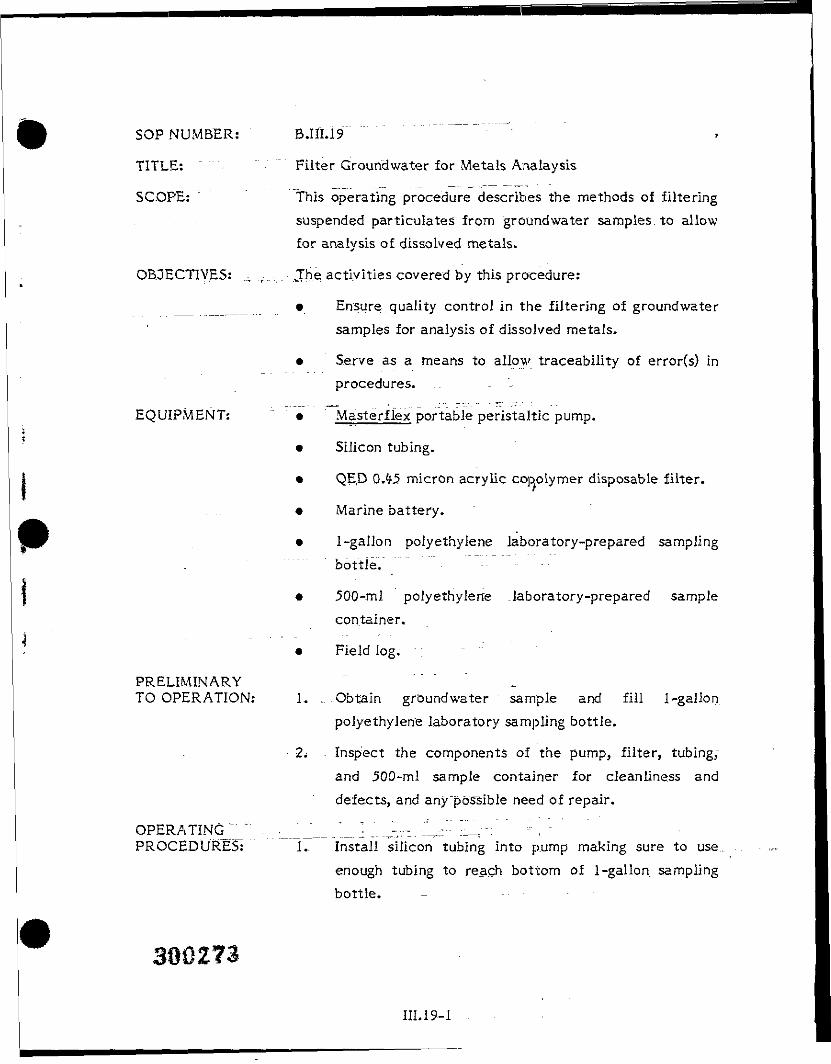
SOP NUMBER: B.IIU9
TITLE: " - Filter Groundwater for Metals Analaysis
SCOPE: This operating procedure describes the methods of filteringsuspended particulates from groundwater samples to allowfor analysis of dissolved metals.
OBJECTIVES: .., .r,,:, .The activities covered by this procedure:
__ • Ensure, quality control in the filtering of groundwatersamples for analysis of dissolved metals.
• Serve as a means to allow traceability of error(s) inprocedures. . ~ '-
EQUIPMENT: • Masterflex portable peristaltic pump.
• Silicon tubing.
• QE£) 0,45 micron acrylic copolymer disposable filter.
• Marine battery.
• 1-gallon polyethylene laboratory-prepared samplingbottle."
* 500-ml polyethylene .laboratory-prepared samplecontainer.
• Field log. ;
PRELIMINARYTO OPERATION: 1. ...Obtain groundwater sample and fill 1-gallon
polyethylene laboratory sampling bottle.
2* Inspect the components of the pump, filter, tubing,and 500-ml sample container for cleanliness anddefects, and any "possible need of repair.
OPERATING^"" -..:______.._. _L.I-V... i. 1:: L_-:PROCEDURES: 1. Install silicon tubing Into pump making sure to use
enough tubing to reach bottom of 1-gallon samplingbottle. -
III. 19-1
2. Insert the inlet fitting of the disposable filter snuglyinto the silicon tubing extending from the left side ofthe pump,
3. Place the other end of the silicon tubing Into the 1-gallon sampling bottle making sure to keep the tubingsuspended in the water and not allowing it to suckagainst the container.wall or bottom.
4. Place the outlet end of the filter over the opened 500-ml polyethylene sample container.
.5-. Switch the pump on. It is normal for the filter housingto bulge slightly when in use. If the filter housing isbulging more than J4 inch from its normal position, theback pressure is too high, and the pump should beturned off to allow the pressure to subside. If thefilter becomes .extremely dirty due to excess silt inthe water casing bulging, a new filter may be requiredto complete filtering of the sample.
6. , -Rinse the 500-ml container at least once with filterand water prior to obtaining the sample for analysis.
7. Discard the filter and silicon tubing after completionof filtering process.
III.19-2
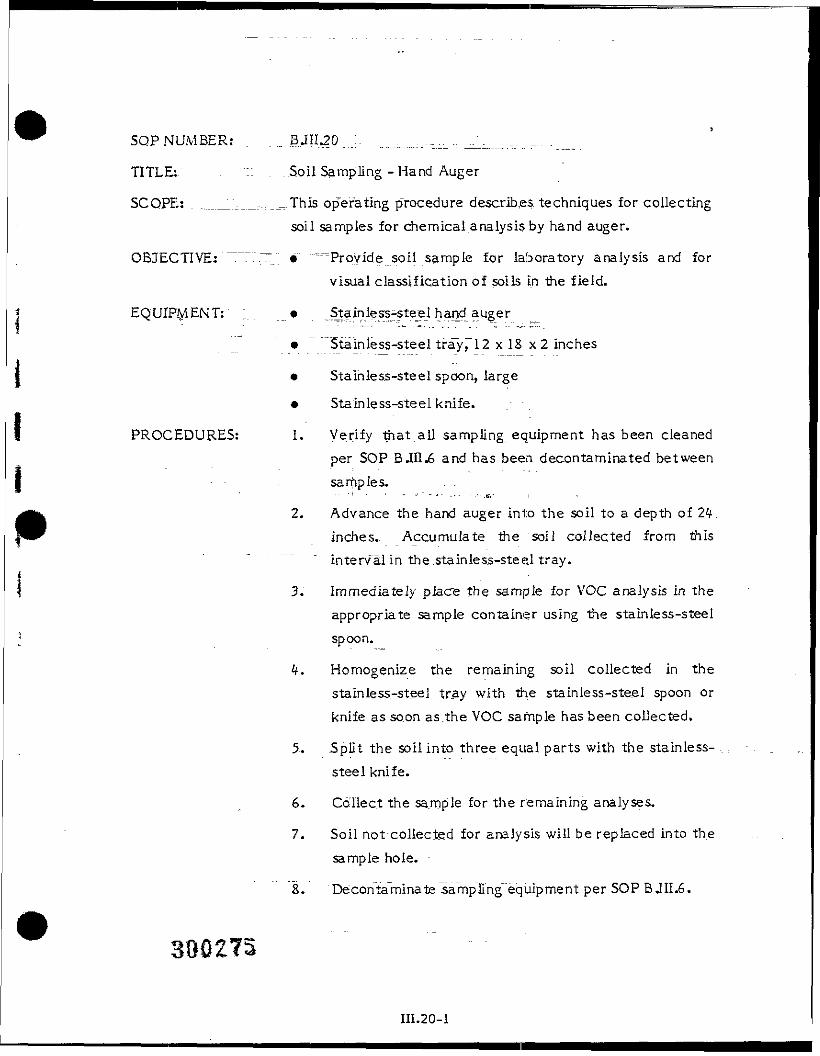
SQP NUMBER: . . _ BJII.20 ...;. __.„_-.,_ -: _!__.,, r- -
TITLE; "i Soil Sampling - Hand Auger
SCOPE: .___.___::___This operating procedure describes techniques for collectingsoil samples for chemical analysis by hand auger.
OBJECTIVE: ~~"~~~~" • """"Provide soil sample for laboratory analysis and forvisual classification of soils m the field.
EQUIPS EN T: :. • Stainless-ste_el hand auger
• Stainless-steel tra~y,"12 x 18 x 2 inches
• Stainless-steel spoon, large
• Stainless-steel knife.
PROCEDURES: 1. Verify that all sampling equipment has been cleanedper SOP B .111.6 and has been decontaminated between
. . sarfiples. - . .
2, Advance the hand auger into the soil to a depth of 24.inches. Accumulate the soil collected from thisinterval In the.stainless-stee_l tray.
3. Immediately place the sample for VOC analysis in theappropriate sample container using the stain less-steelspoon.
4. Homogenize the remaining soil collected in thestainless-steel tray with, the stain less-steel spoon orknife as soon as the VOC sample has been collected.
5. Split the soil into three equal parts with the stainless-steel knife.
6. Collect the sample for the remaining analyses.
7. Soil not-collected for analysis will be replaced into thesample hole.
S. Decontaminate sampling equipment per SOP BJII.6.
III.20-1
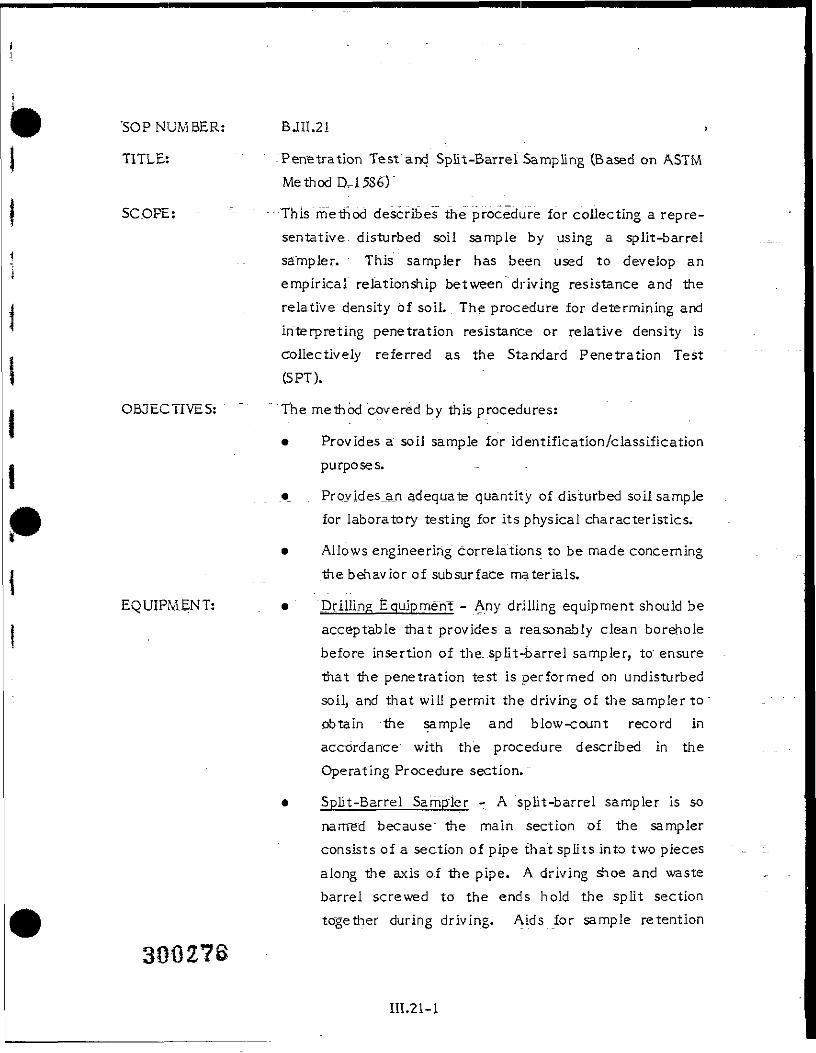
'SOP NUMBER: BJII.21
TITLE: "Penetration Test "and Split-Barrel Sampling (Based on ASTMMethod
SCOPE: - - This method describes the procedure for collecting a repre-sentative disturbed soil sample by using a split-barrel
] sampler. This sampler has been used to develop anempirical relationship bet ween driving resistance and the
f . relative density of soil. The procedure for determining and' interpreting penetration resistance or relative density is. collectively referred, as the Standard Penetration TestI CSPT).
I OBJECTIVES: ~ "'The method covered by this procedures:
• Provides a soil sample for identification/classificationI purposes.
•_ . Proyides_a_n adequate quantity of disturbed soil samplefor laboratory testing for Us physical characteristics.
• Allows engineering correlations to be made concerning.the behavior of subsurface materials.
EQUIPMENT: . • Prilling Equipment - Any drilling equipment should beacceptable that provides a reasonably clean boreholebefore insertion of the..split-barrel sampler, to" ensurethat the penetration test is performed on undisturbedsoil, and that will permit the driving of the sampler toobtain the sample and blow-count record inaccordance" with the procedure described in theOperating Procedure section.
• " Split-Barrel Sampler - A split-barrel sampler is sonamed because" the main section of the samplerconsists of a section of pipe that splits into two piecesalong the axis of the pipe. A driving shoe and wastebarrel screwed to the ends hold the split sectiontogether during driving. Aids for sample retention
30027S
m.21-1
may also be incorporated into the split-barrel sampler.'These would be catchers, spring or gravity traps (inthe lower end) and check valves (in the top end). Thestandard sampler has an outside diameter of 2 inches(50.8-mm) and an inside diameter of 1-3/8 inches(35. mm);
Drive-Weight Assembly - This consists of a rope-cathead or an automatic hammer drop system thatdrives the sampler into the soil. The mechanismallows a 140 Ib weight to free fall 30 inches onto adriving head.. Larger weights or drops may be used forlarger-diameter samplers. Special precaution shouldbe taken to ensure that energy of the falling weight isnot reduced by friction between the drive weight andthe hammer guides used to permit the free fall.
Sampling Rods -.r_FIush .joint steel drill rods should beused to connect the split-barrel sampler to the drive-weight assembly. To avoid "whips" under the blows ofthe hammer the drill rod should have a stiffness equalto or greater than the. A-rod. An "A" rod is a hollowdrill rod having an outside diameter of 1-6/8 in.(41.2 mm) and an inside diameter of 1-1/8 in.(28.5 mm), through which the rotary motion of drillingis transferred from the drilling motor to the cuttingbit. A stiffer drill rod is suggested for sampling inholes deeper than 50 ft. (15 m).
PRELIMINARY TO ' "" "' — '" -~ " "" '— -'" -OPERATION: " "IV " To":prepare the borehole, it should be cleaned out to
the sampling elevation using whatever equipment ispreferred that will ensure that the material to besampled is not disturbed by the operation. Whendrilling in saturated- sands and silts, the fait should bewithdrawn slowly to prevent loosening of the soil
~^~ " ' around the hole.
300277 .III.21-2
2. Several drilling methods produce unacceptable borings.'..... -The following should not be used!
a. Drilling with a_ bottom-discharge bit (side-discharge bits would be permissible)
b. Using the process of.jetting through an open-tube, .sampler and then sampling when thedesired depth is reached
- : . . - c. Using continuous flight solid augers to advancethe boring below the water table or below the
; upper confiningJbed of a confined non-cohesivestratum that is under artesian pressure
d. Driving casing below the sampling elevationbefore collecting a sample
e. Continuously sampling using the SPT method.without advancing the boring between sampleswith the drill bit using acceptable drillingprocedures to ensure access to undisturbed soil,
OPERATING -" —_ - ---- "" ""Vl. T "" "7 , ' ""!PROCEDURE; i. Typically, samples are taken at every change in
stratum and at Intervals not greater than 5 -ft. (unlessotherwise stipulated by the field engineer orgeologist).
2. After the boring has been advanced to the desiredsampling depth, and extracted drill cuttings have beensuitably removed, a standard penetration test Is per-formed as follows: -
a. A split-barrel sampler (outside diameter 2.0 in.inside diameter 1-3/8 in.) attached to drill rods
.... ("A"..rod or larger, that will prevent rod whipduring driving) is lowered to the bottom of the
-—•-•• ——"cleaned-out borehole.
b. Three 6-inch on the dullrods above a c»_ ."... .. . __„__ _„....
III.21-3
300279
c. The sampler is driven by a 140 Ib hammer free'falling a distance of 30 inches onto a collar ordrive head on the drill rods. The sampler isdriven a total of IS inches into the undisturbed
: soil, and the number of blows required toadvance each 6-inch increment is recorded.
C.1 The "blow count" for the standardpenetration test is the total number ofblows required to drive the sampler thelast foot (i.e.j, the sum of the blowsrequired to drive the sampler to thesecond and third 6-inch increments).
_c.2. If an erratic blow cpunt is encounteredin the last 6-inch segment, it may be dueto a " filled sampler, obstruction todriving, or change in strata. The reason
"""" "" ~ for change" should be.noted on the boringlog.
c.3 "If the change can be explained by afactor O-ther than a change in strata,twice the count for the second 6-inchsegment may be used as an approximateSPT "blow count."
c.4 Correlation of 5PT blow counts with soilconsistency or compactness is deter-mined using the-following table:
III.21-4
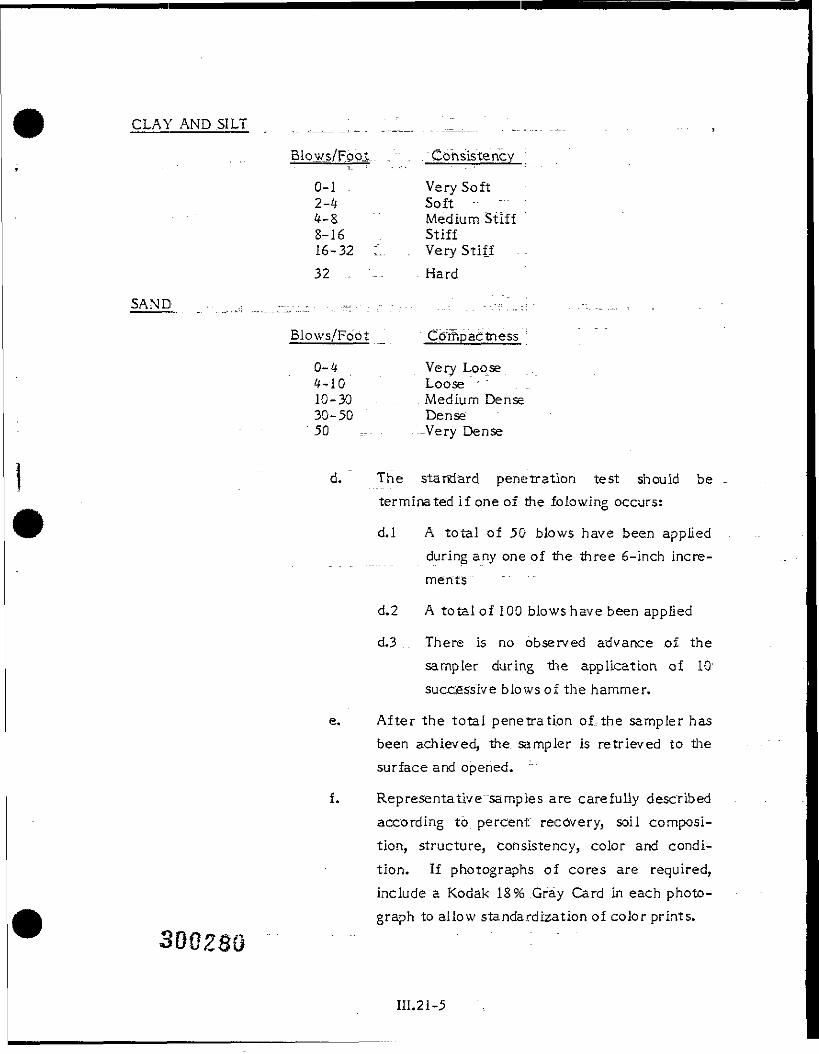
CLAY AND .SILT r ^__ _ _ _" J_ . _.____.._ "."._....__ . ... ,
Blows/Fool.. . " . . Consistency
0-1 . . . Very Soft2-4 Soft - -4-8 Medium Stiff "8-16 Stiff16-32 ::.. . Very Stiff . -32 . - - Hard
SAND _.-•.._..,; .._...._-• .:,:• - . . - ~ - : . . - : . - - - -- ..--/:"..:!• ---__....., -
Blows/Foot _ Co'rhpactness '
0-4 Very Loose4-10 Loose10-30 .. ..... . Medium Dense30-50 Dense50 =,- - --Very Dense
d. The standard penetration test should beterminated if one of the folowing occurs:
d.l A total of 50 blows have been appliedduring any one of the three 6-Inch incre-ments
d.2 A total of 100 blows have been applied
d.3 There is no observed advance o£ thesampler during -the application of 101successive blows of the hammer.
e. After the total penetration of,the sampler hasbeen achieved, the. sampler is retrieved to thesurface and opened.
f. Representative "samples are carefully describedaccording to percent" recovery, soil composi-tion, structure, consistency, color and condi-tion. If photographs of cores are required,include a Kodak 18% .Gray Card in each photo-graph to allow standardization of color prints.
300280
III.21-5
300Z8
g. Representative samples are placed into'moisture-proof containers making sure that thesample is not distorted upon insertion. If thereis a :r~soil change within the- sampler, arepresentative"sample of each stratum is placedin jars and the .depth at which the change tookplace is noted. - - -
h. All samples are protected against extreme tem-perature changes. Freeze indicators should bepacked with each sample shipment during coldweather.
III.21-6
SOP NUMBER: B.III.23 , ' - i
TITLE": "" Disposal of Wastes Generated During the Field Investigation
SCOPE: - This procedure describes the considerations in disposing ofwaste, materials generated as a result of soil borings, wellconstruction, and decontamination activities
OBJECTIVES: "~~ "" To= identify an approved method of handling and disposingwaste materials generated as by-products of investigationactivities such as drill cuttings, fluids, decontaminatedsolutions, etc.
EQUIPMENT: „ '."• Large volume holding tanks
• 55 gallon drums . .
• Plastic tarp
• Centrifungal pump - small
PROCEDURES: "" 1. All handling, transport, and disposal will be performedin accordance -with requirements mandated by theResource Conservation and Recovery Act (RCRA) andother applicable Federal, State, and localrequirements. For wastes to be transported offsite, a
. .. .. .. ... Uniform Manifest will be prepared, signed, and" arrangements will be- made lor proper disposal asappropriate.
2. All drilling fluid wastes from the field investigationwill be stored in RCRA-approved containers prior totesting and disposal. Based on the test results, thewater will either be discharged to the sanitary seweror disposed of as a RCRA waste.
» Sampling equipment rinseates will becontainerized ^ in_ _557gallon drums. Afterchemical profiling, they will be disposed offsiteIn a manner consistent with their compositon.
300232
III.23-1
• The drill rig and all drilling tools will be steamcleaned prior to sampling and at the completionof the work. All downhole tools, samplers, andother downhole equipment will be steam cleanedbetween boreholes. Under sloppy conditions, theback end. of the drill rig will also be steamcleaned, as needed, between boreholes. It hasbeen asssumed that an appropriate
- -decontamination area near the site will bedesignated by the client for drill rig steamcleaning/decontamination operations. Thisshould consist of a contained concrete or asphaltarea where drainage can be collected. If such anarea is not available, a decontamination pad willbe constructed using a large plastic tarp prior tothe start of drilling operations. Collected fluidswill be pumped Into a large holding tank. Theliquid will be chemically profiled and then willbe removed, from the site for disposal in amanner consistent with Its composition.
• Water from well development and well purgingwill be collected and contained in large volumeholding tanks. The liquid will be chemicallyprofiled and. then will be removed from the sitefor disposal In a manner' consistent with itscomposition.
3. Drill cuttings will be containerized in 55-gallon drums,prior to fina"! disposition and segregated according totheir location. Samples of drill cuttings will bechemically profiled or analyses from associated soilborings will be used to .determine the composition ofthe drummed, materials. These results will be used.inconjunction with PID readings and other sampleanalysis results to determine if- the cuttings are
300283III.23-2
hazardous. If found to be contaminated, associated'cuttings will be disposed of as hazardous waste. If not
"hazardous, the cuttings will be spread on the groundnear the corTespon'ding boring location or disposed ofat s.ome other onsite location designated by the client.
4. All disposable clothing and plastic sheeting used duringthe operation will be double-bagged, labeled, andcontained onsite prior to disposal as a potentiallyhazardous RCRA waste.
III.23-3
SOP NUMBER: B.III.22 - -
TITLE: Wastewater Composite Sampling From Sewers
SCOPE: "..This procedure describes methods used for obtainingcomposite wastewater samples from a sewer line at amanhole access point,
OBJECTIVE: Obtain representative composite wastewater samples from asewer line for analysis.
EQUIPMENT: • Portable automatic wastewater sampler
• Composite glass, sample bottle for use with sampler(2 r5 gallon size)
• Teflon tubing
• Teflon-lined or stainless steel strainer
• Sample containers with labels
* Suspension harness for sampler
• Lock and chain to secure sampler
• HNu meter
• Oxygen meter with audible alarm
• Explosimeter with audible alarm
• Parachute type _ suspension harness with clip-onsuspension rope
• Hard hat
• Coil of rope and bucket
• Assorted clamps "
• Tape measure
• Manhole hook
• Traffic cones
• Flashlight and large mirror
• Respirator with organic vapor/acid gas cartridge.
HI.22-1
PRELIMINARY " . . .TO OPERATION: • Contact local sewer authority and obtain permission to
install sampling equipment. Arrange to have sewerauthority personnel present to observe and assist inoperation, if necessary.
OPERATING "- - •_•-'_ : . -.-'-. ~ • T ".:•_——:r—PROCED.URE: 1. Set up traffic cones around manhole to divert traffic
and to" warn people of an open manhole.
2. Remove manhole cover. Assess whether or notmanhole must be entered to install sampler. Manholeentry is to be avoided if possible. Manholes accessingmain sewer trunk lines are. not to be entered at anytime! If sampler cannot be installed without enteringmanhole, go to Step 11.
3. Measure the .manhole depth by lowering tape measureinto hole.
4. Program automatic, sampler to collect a 300-mlsample every hour for 24 hours. Input lift height intosampler program as determined in Step 3.
5. .Lower strainer and tubing down manhole and intowastewater flow. Secure tubing to top rung ofmanhole to prevent it from being washed out.
6. Attach suspension harness to sampler and lower it intothe manhole. Suspend from top rung of manhole withlock and chain.
7. Replace manhole cover and remove traffic cones.
S. Return to manhole to retrieve sampling equipment andsample after the 24-hour sampling period has elapsed.
9. Pour sample from glass. container in sampler intoappropriate sample jars. Wipe off sample jars andaffix labels such as the one shown in Figure 6-2.
"TH.22-2
10. Add appropriate preservatives as indicated in SOPB.III.9. Pack sample containers with ice in a coolerand ship to laboratory as per SOP B.III.S.
The following steps should be taken If the manhole must beentered to install equipment:
11. Lower the oxygen meter into the manhole with a rope.If there is less than 19-percent oxygen, do not enterthe manhole.
12. Lower the explosimeter into the manhole with a rope.If : the concentration of combustible gases In themanhole exceeds 10 percent of the lower explosivelimit, do not enter the manhole.
13. Lower the HNu meter into the manhole with a rope. Ifvolatile organics are detected at a level between 5 and10 ppm, a respirator with an organic vapor/acid gascartridge must be worn. If the volatile organicsconcentration Is greater than 10 ppm, do not enter themanhole.
14. If the manhole cannot be entered due to the findingsfrom Steps 11, 12, or 13, assistance will be requiredfrom the local sewer authority. This would involveventilating the manhole and/or the upgradient sewerline. This action requires high air capacity blowersand fans, available from the sewer authority, and a
_ sewer authority crew.
15. If the findings from Steps 11, 12, or 13 do not precludemanhole entry or the manhole is ventilated to safe airlevels, the .manhole can be entered to install andretrieve the .samples. For manhole entry, a minimumof a 3-man crew is required- The person entering themanhole shall at all times wear the parchute typesuspension harness, and it will be securely attached to.a safety line. A hard hat and eye protection also will
300287>-*—•-
III.22-3 -
be worn. The purpose of the safety line is to prevent a__^ "catastrophic, fall from occurring and to remove an
injured or unconscious worker from the manhole. Thesafety line is not to be used to lower the worker intothe manhole or to lower/raise equipment into/out ofthe manhole. A worker inside a manhole must notdisengage" his safety line for any reason. Finally, thecrew at street level must be able to belay the safetyline to the worker and be capable of rapidly haulingthe worker .out of the manhole should an emergencysituation occur.
16. Workers on the street level should assist the worker in. the manhole by illuminating the hole with a mirror orflashlight and lowering any needed tools or parts tohim with a bucket and rope.
17. Sampler installation should proceed from this point aswas .begun in Step 3. The worker in the manhole mustremain in visual and verbal contact with the streetcrew at all times.
300Z88
HI.22-4
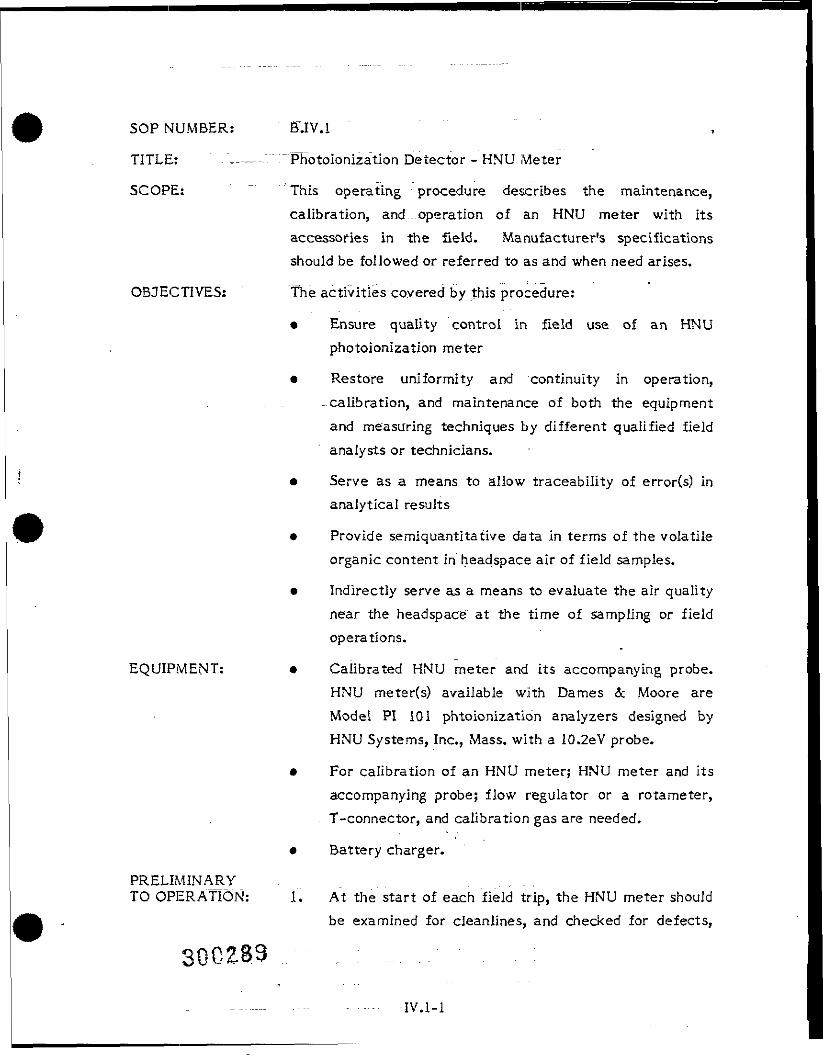
SOP NUMBER: B.IV.1
TITLE: ,-_-_-- :~"Photoionization Detector - HNU Meter
SCOPE: " This operating procedure describes the maintenance,calibration, and ..operation of an HNU meter with itsaccessories in the field. Manufacturer's specificationsshould be followed or referred to as and when need arises.
OBJECTIVES: The activities covered by this procedure:
• Ensure quality control in field use of an HNUphotoionlzation meter
• Restore uniformity and continuity in operation,-calibration, and maintenance of both the equipmentand measuring techniques by different qualified fieldanalysts or technicians.
• Serve as a means to allow traceability of error(s) inanalytical results
• Provide semiquantitative data in terms of the volatileorganic content in headspace air of field samples.
• Indirectly serve as a means to evaluate the air qualitynear the headspace" at the time of sampling or fieldoperations.
EQUIPMENT: • Calibrated HNU meter and its accompanying probe.HNU meter(s) available with Dames <3c Moore areModel PI 101 phtoionization analyzers designed byHNU Systems, Inc., Mass, with a 10.2eV probe.
• For calibration of an HNU meter; HNU meter and Itsaccompanying probe; flow regulator or a rotameter,T-connector, and calibration gas are needed.
• Battery charger.
PRELIMINARYTO OPERATION: i. At the start of each field trip, the HNU meter should
be examined for cleanlines, and checked for defects,
30G283
IV.l-l
and any possible need of repair. The checks shouldinclude whether the batteries and electrodes areoperable.
a. Battery check should include to determine if it isfunctional to full scale. Battery should be rechargedif found weak or as required.
b. Probe check consists of.making sure that the probe isproperly functioning by checking UV light flow whenconnected to the meter. If not,-the probe should beopened and cleaned per the directions in instructionmanual. . - —-- -- -
c; Scheduled Maintenance will include daily checks byDames &: Moore trained personnel according toprocedures provided by the equipment's manufacturer.
d- Repairs will be performed by authorized servicerepresentative.
OPERATING ._""" : •-—————_: .. - ^ " "V "PROCEDURE: 1. HNU meter is a photoionization detector and should be
calibrated in laboratory no more than a day prior to itsuse in the field. Calibration should then be done in thefield everyday the meter is used. If HNU is alreadycalibrated and ready for use, go to step 8. CalibrationProcedure is described _belo\y»..
2. Turn the function switch to the "off" position andattach the probe to the.detector by twisting probeconnector until a distinct snap and lock is felt.
3. Check battery level.
4. Turn the function switch to "standby" and zero thereadout." ' - - - - - - -
5. Connect flow regulator to 'calibration gas and theprobe to the flow regulator.
6. Open the flow regulator on the pressurized container.
3oczso__ ____;; .__ ;IV.l-2
7. Adjust the span potentiometer so that the instrumentreadout matches the exact value of the calibrationgas. A list of readout values for various calibrationtgases is included in the Model PI 101 InstrucitonManual. The Instrument is now calibrated and detailsare logged (see Instrument Calibration Log).
8. Turn the function switch on the calibrated HNU meterto the "off" position if not used immediately.
9. Turn the function switch.to the "standby" position androtate the zero potentiometer until the meter readoutis zero. Allow 15-20 seconds for stabilization. Thisadjustment must be. made each time the span poten-tiometer is adjusted and evey time the power is on.
10. Set the range setting to 0-20. Note the range setting,span potentiometer setting, and time in the field log.
11. Trace-detection limits may be hieghtened by adjustingthe span potentiometer. Record all adjustments in thefield log.
12. Record all positive indications and inform site safetyofficer concentrations levels of volatile gases de-tected, to prepare "for proper level of protection asshown below.
0-5 Level D+ protection5-10 Level C protection>10 Evacuate area, notify project manager
REFERENCES
EPA OSWER, December 19S7, Compendium of Superfund FieldOperations Methods, EPA Office .oj Solid Waste EmergencyResponse, Directive 935,5, 0-14 ("Compendium").
HNU Systems Inc., 1975, Instruction Manual for Model P101Photoionization Meter.
300235-
IV.1-3
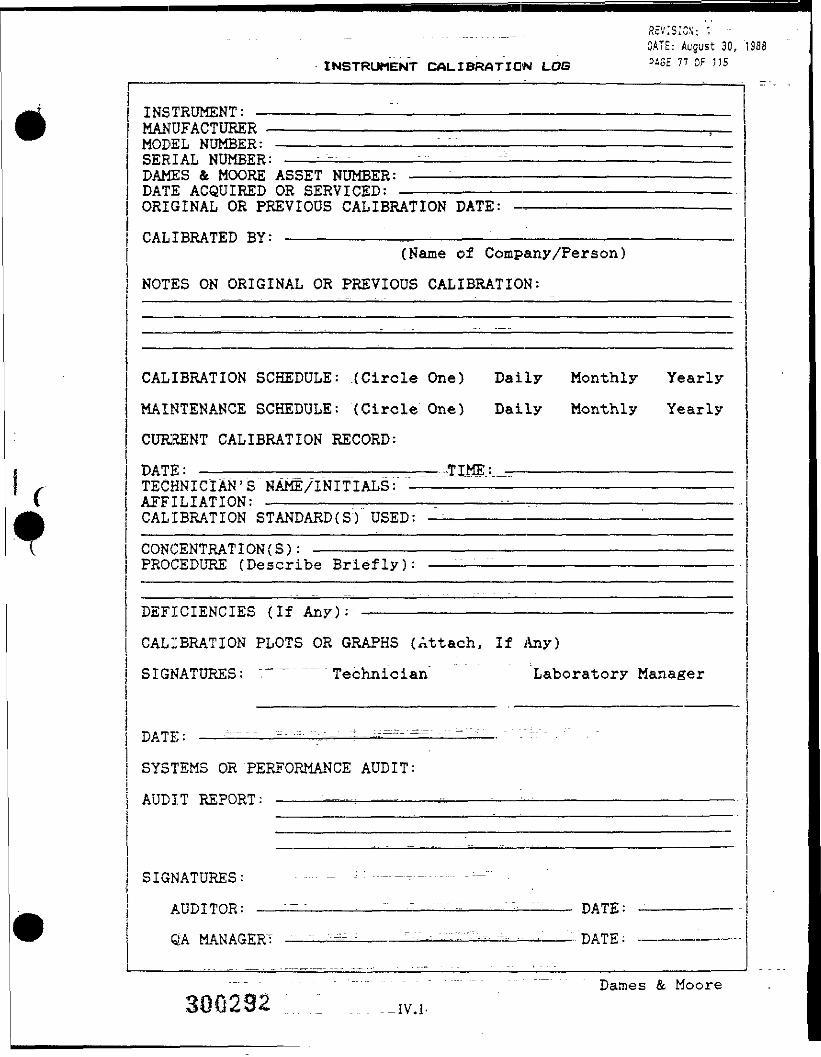
3A7E: August 30, 1933INSTRUMENT CALIBRATION LOS 5iGE 7? "s
INSTRUMENT: ———————————————————————MANUFACTURER ————————————————————MODEL NUMBER: ———————————————__———SERIAL NUMBER: ———-^———————-———:———-DAMES & MOORE ASSET NUMBER: ———:—————DATE ACQUIRED OR SERVICED: —————————ORIGINAL OR PREVIOUS CALIBRATION DATE:
CALIBRATED BY: —————————__———————_(Name of Company/Person)
NOTES ON ORIGINAL OR PREVIOUS CALIBRATION:
CALIBRATION SCHEDULE: .(Circle One) Daily Monthly Yearly
MAINTENANCE SCHEDULE: (Circle One) Daily Monthly Yearly
CURRENT CALIBRATION RECORD:
DATE: ——————————————————————...TIME:TECHNICIAN'S NAME/INITIALS: ———————AFFILIATION: —————————————————————CALIBRATION STANDARD (S") USED:
CONCENTRATION(S): —————————PROCEDURE (Describe Briefly):
DEFICIENCIES (If Any):
CALIBRATION PLOTS OR GRAPHS (Attach, If Any)
SIGNATURES: :~~ "" Technician Laboratory Manager
DATE: ——"•'• '::- := :.::- -!- "
SYSTEMS OR PERFORMANCE AUDIT:
AUDIT REPORT: ----- - : -_-:r.—
SIGNATURES: -- - j: --------- --"
AUDITOR: ————————————-—:—-—— "- —— DATE:
GJA MANAGER": — •--•••"• -- :-———— -'-'-- "-"v:.-'" ..: ... ,.—— . DATE : -————-——-
— - - - - '-••- ------ • •- -- -••• — Dames & Moore
S O P NUMBER: . B.IV.2 . . .
TITLE: . _..pH Meter -
SCOPE: This operating procedure describes the operation,calibration, and maintenance of pH meter and itsaccessories for use _ in. _ the . field. Manufacturer'sspecifications and recommendations should be followed orreferred :as and when need arises.
OBJECTIVE(S): The activities covered by this procedures:
• Ensure quality control in field pH measurement
-----•* Restore unliormity and continuity in operation,calibration, and maintenance of both the equipmentand measuring techniques by different qualified fieldanalysts or technicians
* Serve as a means to allow traceability of error(s) inanalytical results
• Provide a semi-quantitative data in terms of theacidity or alkalinity of the water (surface waterand/or groundwater) samples
• Indirectly serve as a means to evaluate the waterquality at the time of sampling. It is imperative thattemperature compensation is made for precise pHmeasurement. ~ " ~ ~
PRELIMINARYTO OPERATION: 1. At the start of each field trip, the pH meter should be
examined for cleanliness, and checked for defects, andany possible need of-.repair. The checks should includewhether the battery and electrode are operable.
a. Battery check should include . to determine if it isfunctional to full scale. Batteries are replaced if.found weak.
IV.2-1
b. Electrode check consists of .the following:
b.l Make sure the electrode is properly connected tothe meter.
b.2 The electrode tip should be covered by a rubbersleeve or cap which protects the electrolytefrom flowing out_of the opening or from drying.
— Pull the cap off and save for storage. There isnormally no need to soak the electrode beforeuse as the electrolyte makes direct contact withthe outside liquid once the rubber sleeve ismoved away from the opening.
b.3 If bubbles are seen in the bulb area of the_ electrode, shake the electrode downward. Thisaction will help eliminate bubbles that may havebeen generated during storage or earliershipment.
c. Scheduled Maintenance- will include daily checks byDames & Moore trained personnel according to
• procedures provided by the equipment's manufacturer.
d. . Repairs will be performed" by an authorized servicerepresentative."
OPERATING ; 1_ " : 1PROCEDURE:" " "l. " Remove pH meter from the box.
2. Check batteries to ensure they are operable.
3. Turn oh power.
4. Allow meter to stabilize for about three to fiveminutes. Caution: Do not leave or use meter in directsunlight or cold wind.
5. .....Calibrate the meter. "" Calibration Schedule shouldinclude daily calibration, and intermittently whenrequired during,, continuous use of the meter.Instrument calibration consists of the following steps. "
30C294IV .2-2
30G295
a. Select two buffer solutions obtained from acommercial supplier such as Fisher ScientificCompany (pH 4 and 7 if acidic conditions areexpected .of sampling water or pH 7 and 10 ifalkaline conditions are expected). Source ororigin of the buffer solutions should be recordedin field log.
b. Label two clean and dry plastic or glass beakersor cups with the respective pH values of selectedbuffers.
c. Place approximately 10 ml of each buffer in therespective ' cups and replace the buffercontainers in the case.
d. Measure -temperature .of buffers using a cleanthermometer. Ensure that the thermometer isrinsed with distilled water before and after eachuse. - - --- - -
e. Rinse electrode with distilled water and replaceprotective cap.
f. Place pH electrode In pH 7.0 buffer solution andset the temperature knob at the mark indicatingthe solution temperature.
g. .. Switch the control knob to the "pH" position.Gently swirl the solution. Adjust the"STANDARDIZE" knob.until meter reads a pH of
7,0. Switch meter _to the "OFF" position aftercalibration is complete at pH 7.0.
h. Measure- the temperature of the other buffersolution and set the temperature knob at themark indicating the solution temperature.
i. Rinse the electrode with distilled water andplace in the buffer solution. Gently swirl the
IV.2-3
solution. Turn the instrument switch to the "pl-P*setting and read the pH value directly from the
-- " • meter face.
j. If the instrument does not read proper pH unit,adjust to proper pH reading with the calibration
---- dial. (For LaMotte Model HA Series, carefullyremove the panel by unscrewing the four screwson the front of the unit and lift unit out. Slowlyrotate the trimmer potentiometer located nextto the battery while examining meter reading
"" " until meter reads exactly desired pH unit.
Check adjustment by following preceding steps5.f T 5.1 and readjust if necessary as in step 5.Juntil meter and electrode are calibrated to the
._ bxiffer solution(s). Switch meter to "OFF"position. Replace panel and the four screws).Calibration details are logged on the attached
..: .„--- . form,
6. Measure pH of unknown solution as follows:
a. Measure tempertaure of unknown solution andbuffer to calibrate or standardize the meter.
b. Set the temperature knob at the mark indicatingthe buffer solution temperatures. Switch controlknob to "pH" position and with standardize knobadjust instrument to read value of standardbuffer solution(s) as described in step 5.
c. Rinse all parts of electrode that came in contactwith buffer solutions with distilled or deionizedwater and place in unknown solution to betested.
d. Set temperature knob at the mark indicating thesolution temperature.
"IV.2-4
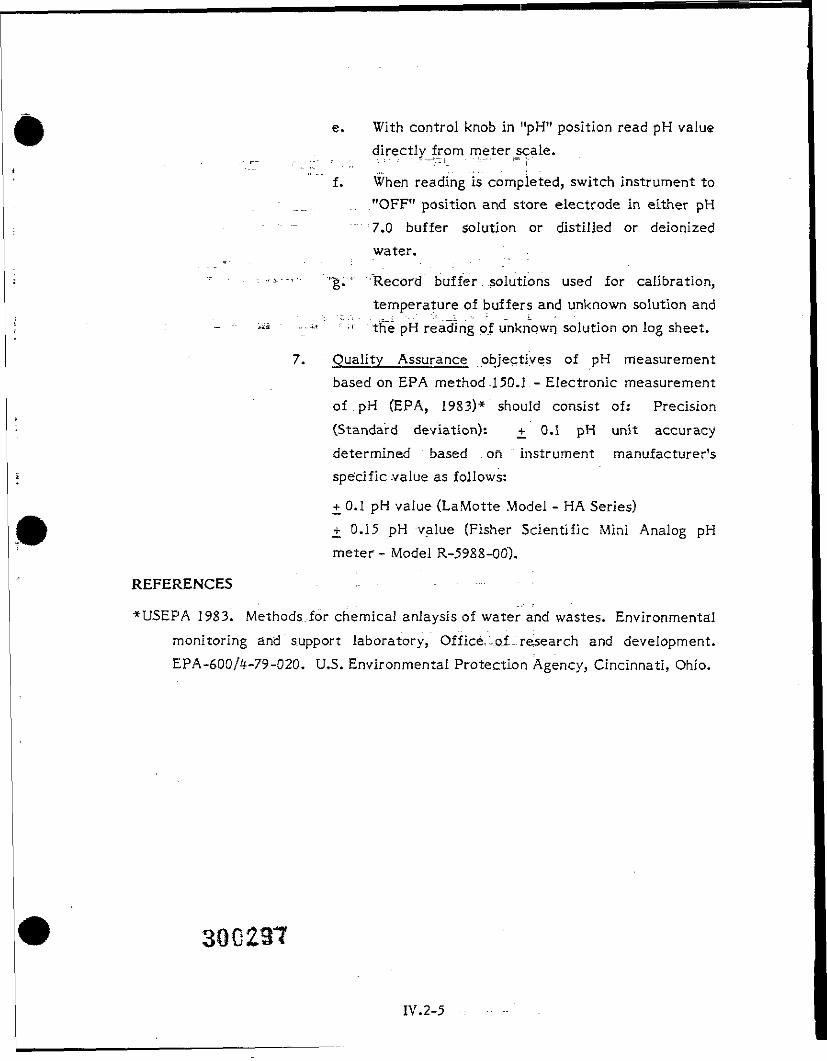
e. With control knob in "pH" position read pH valuedirectly from meter jcale.
f. When reading is completed, switch instrument to"OFF" position and store electrode In either pH7.0 buffer solution or distilled or deionizedwater.
... .,£..j. -Recorcj buffer solutions used for calibration,
temperature of buffers and unknown solution and••••-' r ;i the pH reading of unknown solution on log sheet.
7. Quality Assurance objectives of pH measurementbased on EPA method-150.1 - Electronic measurementof pH (EPA, 1983)* should consist of: Precision(Standard deviation): +_ 0.1 pH unit accuracydetermined based on instrument manufacturer'sspecific value as follows:
i_0.1 pH value (LaMotte .Model - HA Series)_* 0.15 pH value .(Fisher Scientific Mini Analog pHmeter - Model R-59SS-QQ).
REFERENCES
*USEPA 19S3. Method&.for chemical anlaysis of water and wastes. Environmentalmonitoring and support laboratory, Office^jof^research and development.EPA-600/4-79-020, U.S. Environmental Protection Agency, Cincinnati, Ohio.
IV.2-5
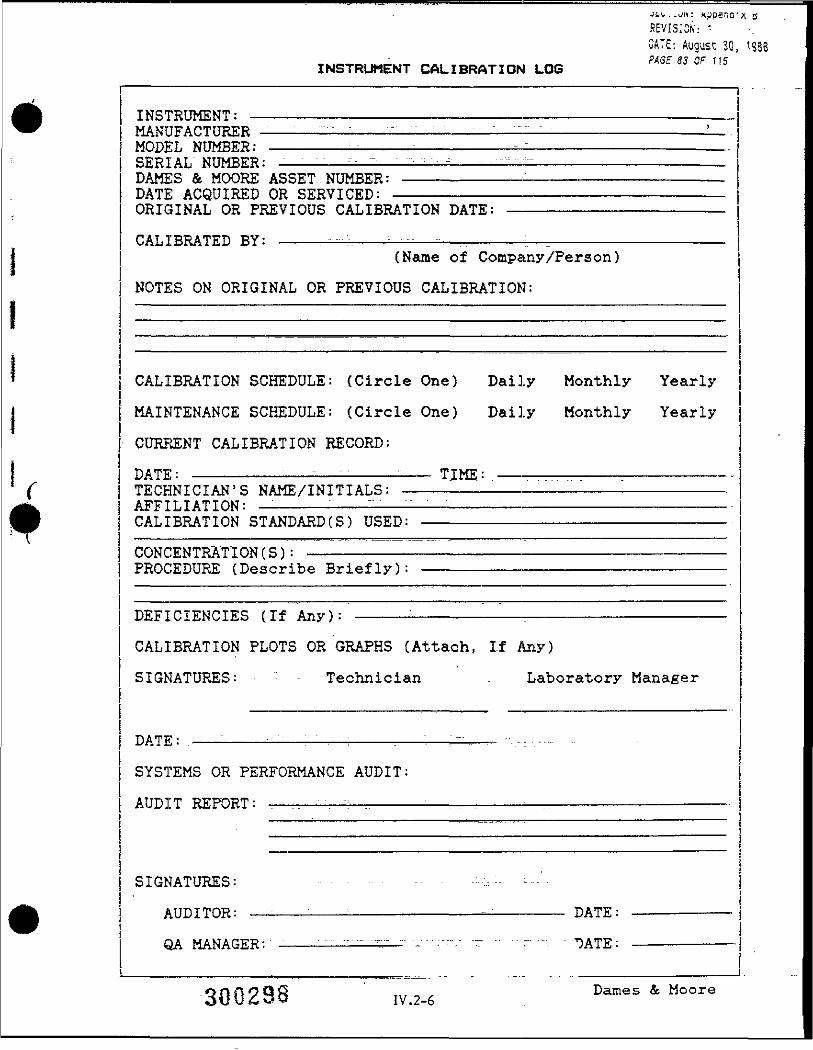
*
11*
I' (•- T
•
jn. i ii/n: *ppsna"REVISION: '-SATE.: August 3Q,WGE S3 OF 115INSTRUMENT CALIBRATION LOG
—— 1
INSTRUMENT:MAWmTAPTrTDT?!? " " " ^ - _ - - - = - . - 5nftiNUr t\\ji uiuLit ————————————————————————————————————————— - —— •-MODEL NUMBER:SERIAL NUMBER: " - -•.-.•-,.=.-=DAMES & MOORE ASSET NUMBER: , - -. .,HATT? ar»nrTT"Dtrn rvo cTDirTmrn-i/AlJii AwyUilUijL' Urt DattVl^lLiJ. ———————————————————————————————————————————ORIGINAL OR PREVIOUS CALIBRATION DATE:
PAT TDd iTTn "DV- - - - -- - ~-
(Name of Company /Person)
NOTES ON ORIGINAL OR PREVIOUS CALIBRATION:
CALIBRATION SCHEDULE: (Circle One) Daily Monthly Yearly
MAINTENANCE SCHEDULE: (Circle One) Daily Monthly Yearly
CURRENT CALIBRATION RECORD:
DVTF" " ; : TIME •TECHNICIAN'S NAME/INITIALS: ——————————————————————————————AFFILIATION: • " - •— " "T •••• - "•---'-CALIBRATION STANDARD(S) USED: ......,.,. ..
rnMr'TTMTPTiT'THK ( Q •PROCEDURE (Describe Briefly): ——————————————————————————
DEFICIENCIES (If Any): —————————————— . —————————————————
CALIBRATION PLOTS OR GRAPHS (Attach, If Any)
SIGNATURES : Technician - Laboratory Manager
TjATF . - . . . - . , . . - • - _ - _ _ _ ......
SYSTEMS OR PERFORMANCE AUDIT:
ATmTT CTT'Pn'DT - - - - =
SIGNATURES: - - -:-:, -- :--' -A TTT>T rnj \T5 • L TN A T'T .AUJJI 1UK- ———————————————————————————————————— JJAiH. • — — —————— — m
QA MANAGER:'- ——— "" - ----- •- v.—.- -, - -• r -. • "OATE: ————————— -
.
X B
t$S8
,
SnnoQS ' „, „ , Dames & MooreUU&3Q IV.2-6
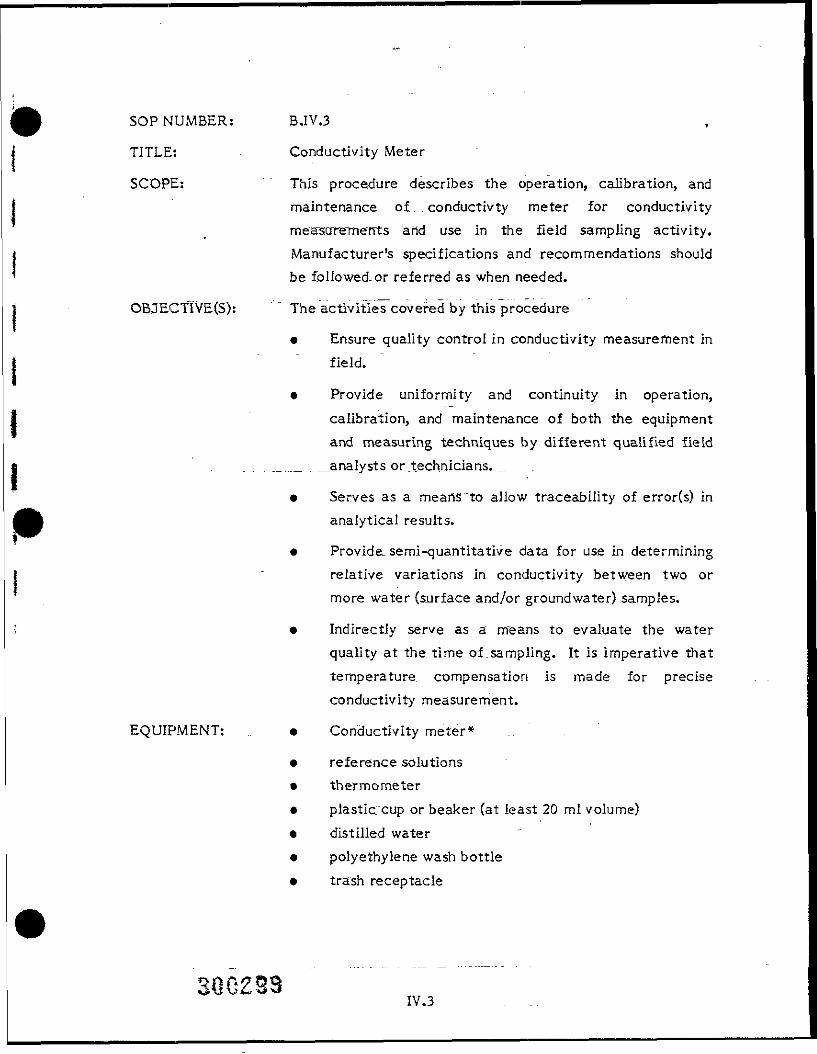
SOP NUMBER: BJV.3
TITLE: Conductivity Meter
SCOPE: This procedure describes the operation, calibration, andmaintenance of conduct* vty meter for conductivitymeasurements and use in the field sampling activity.Manufacturer's specifications and recommendations shouldbe followed.or referred as when needed.
OB3ECTiVE(S): The activifies covered by this procedure
• Ensure quality control in conductivity measurement infield.
• Provide uniformity and continuity in operation,calibration, and maintenance of both the equipmentand measuring techniques by different qualified field
_.__ ,___analysts or .technicians. ...
• Serves as a means "to allow traceability of error(s) inanalytical results.
• Provide, semi-quantitative data for use in determiningrelative variations in conductivity between two ormore water (surface and/or groundwater) samples.
• Indirectly serve as a means to evaluate the waterquality at the time of .sampling. It is imperative thattemperature compensation is made for preciseconductivity measurement.
EQUIPMENT: • Conductivity meter*
• reference solutions• thermometer* plastic cup or beaker (at least 20 ml volume)• distilled water• polyethylene wash bottle• trash receptacle
IV.3
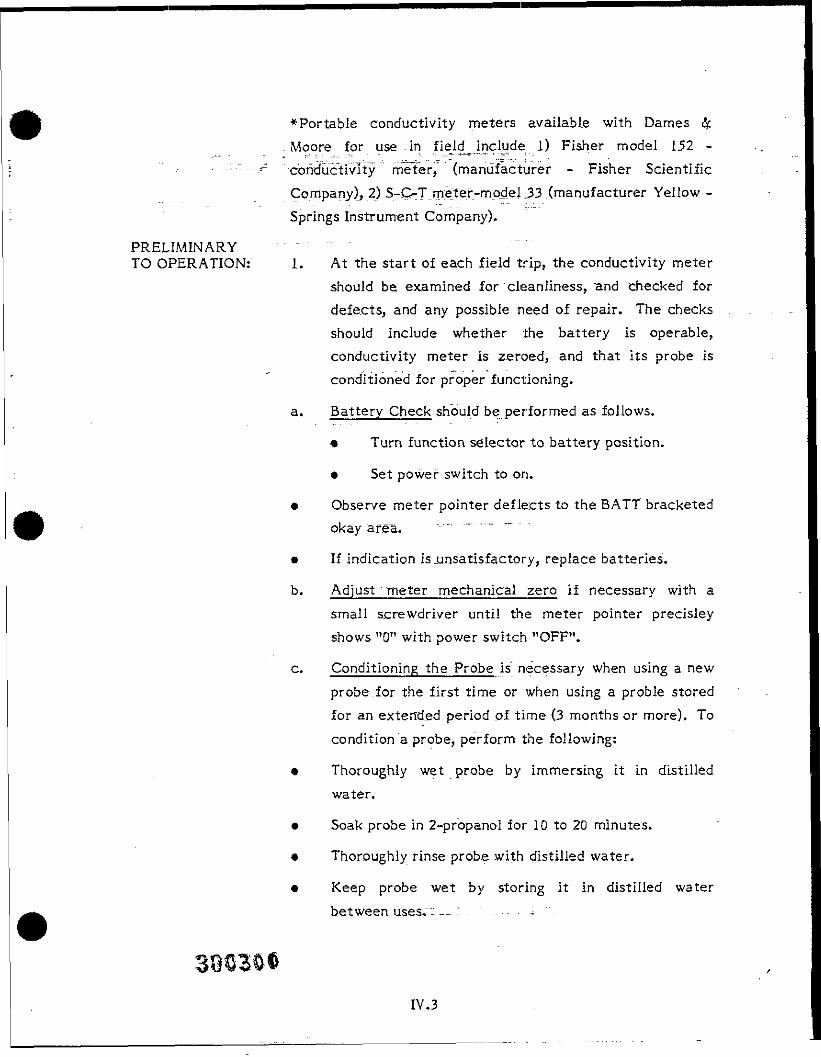
*Portable conductivity meters available with Dames &Moore for use. in field_ include 1) Fisher model 152 -
_:,:_.y: cbhductivlty'"meter, (manufacturer - Fisher ScientificCompany), 2) S-C^T..meter-model 33 (manufacturer Yellow -Springs Instrument Company).
PRELIMINARY - - - - - -TO OPERATION: 1. At the start of each field trip, the conductivity meter
should be examined for cleanliness, and checked fordefects, and any possible need of repair. The checksshould include whether the battery is operable,conductivity meter is zeroed, and that its probe isconditioned for proper functioning.
a. Battery Check should be performed as follows.
• Turn function selector to battery position.
• Set power switch to on.
• Observe meter pointer deflects to the BATT bracketedokay area.
• If indication is unsatisfactory, replace batteries.
b. Adjust meter mechanical zero if necessary with asmall screwdriver until the meter pointer precisleyshows "0" with power switch "OFF".
c. Conditioning the Probe is necessary when using a newprobe.for the first time or when using a proble storedfor an extended period of time (3 months or more). Tocondition a probe, perform the following:
• Thoroughly wet probe by immersing it in distilledwater.
• Soak probe in 2-propanoI for 10 to 20 minutes.
* Thoroughly rinse probe with distilled water.
• Keep probe wet by storing it in distilled waterbetween uses.: __.: ._.. . 4
IV.3
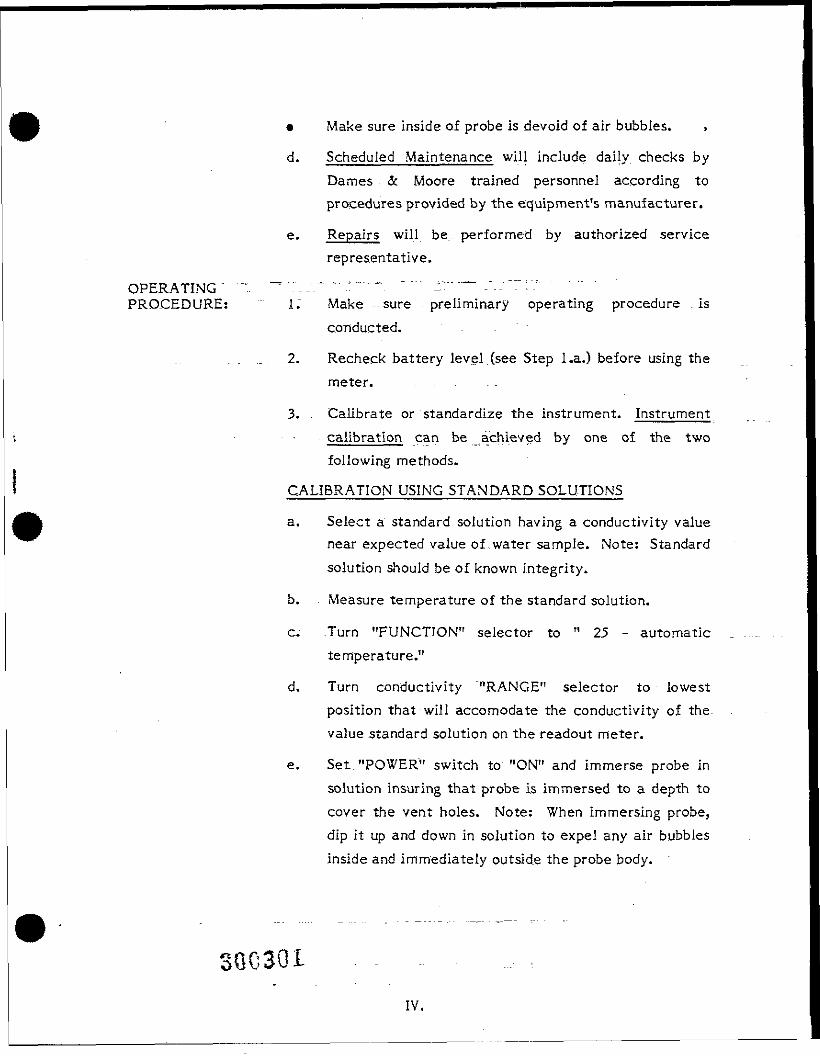
• Make sure inside of probe is devoid of air bubbles.
d. Scheduled Maintenance will include daily, checks byDames <3c Moore trained personnel according toprocedures provided by the equipment's manufacturer.
e" Repairs will be_. performed by authorized servicerepresentative.
OPERATING" ~T~ —;__-—-- ——— -- r - — /.: T i"":-""PROCEDURE: ~" 1. Make -sure preliminary operating procedure is
conducted.
. _ 2. Recheck battery level (see Step l.a.) before using themeter.
3. . Calibrate or standardize the instrument. Instrumentcalibration can be achieved by one of the twofollowing methods.
CALIBRATION USING STANDARD SOLUTIONS
a. Select a standard solution having a conductivity valuenear expected value of water sample. Note: Standardsolution should be of known integrity.
b. Measure temperature of the standard solution.
c. Turn "FUNCTION" selector to n 25 - automatictemperature."
d. Turn conductivity "RANGE" selector to lowestposition that will accomodate the conductivity of thevalue standard solution on the readout meter.
e. Set "POWER" switch to "ON" and immerse probe insolution insuring that probe is immersed to a depth tocover the vent holes. Note: When Immersing probe,dip it up and down in solution to expel any air bubblesinside and immediately outside the probe body.
30C301IV,
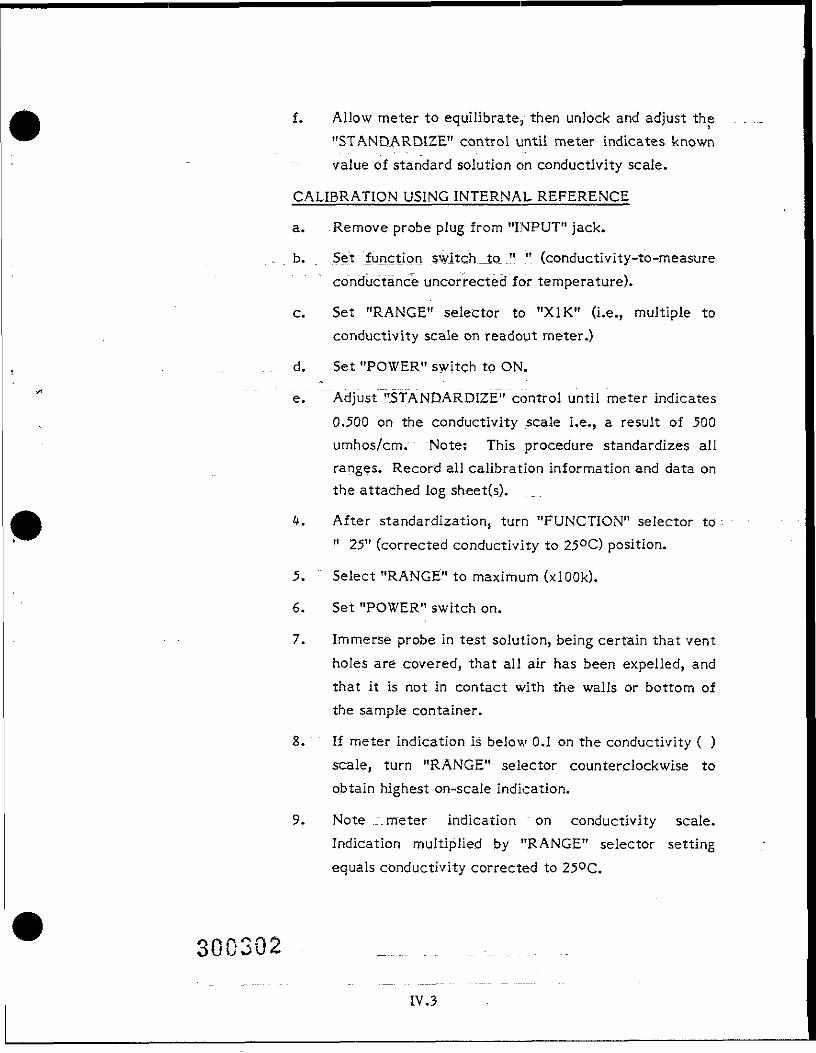
300302
f. Allow meter to equilibrate, then unlock and adjust the"STANDARDIZE" control until meter indicates knownvalue of standard solution on conductivity scale.
CALIBRATION USING INTERNAL REFERENCE
a. Remove probe plug from "INPUT" jack.
b. _ Set function switchJo_." " (conductivity-to-measureconductance uncorrected for temperature).
c. Set "RANGE" selector to "X1K" (i.e., multiple toconductivity scale on readout meter.)
d. - Set "POWER" switch to ON.
e. Adjust ""STANDARDIZE"" control until meter indicates0.500 on the conductivity scale i.e., a result of 500umhos/cm. Note: This procedure standardizes allranges. Record all calibration information and data onthe attached log sheet(s).
fy. After standardization, turn "FUNCTION" selector to" 25" (corrected conductivity to 25°C) position.
5. Select "RANGE" to maximum (xlOOk).
6. Set "POWER" switch on.
7. Immerse probe in test solution, being certain that ventholes are covered, that all air has been expelled, andthat it is not In contact with the walls or bottom ofthe sample container.
S. If meter indication is below 0.1 on the conductivity ( )scale, turn "RANGE" selector counterclockwise toobtain highest on-scale indication.
9. Note ./.meter indication on conductivity scale.Indication multiplied by "RANGE" selector settingequals conductivity corrected to 25°C.
IV.3
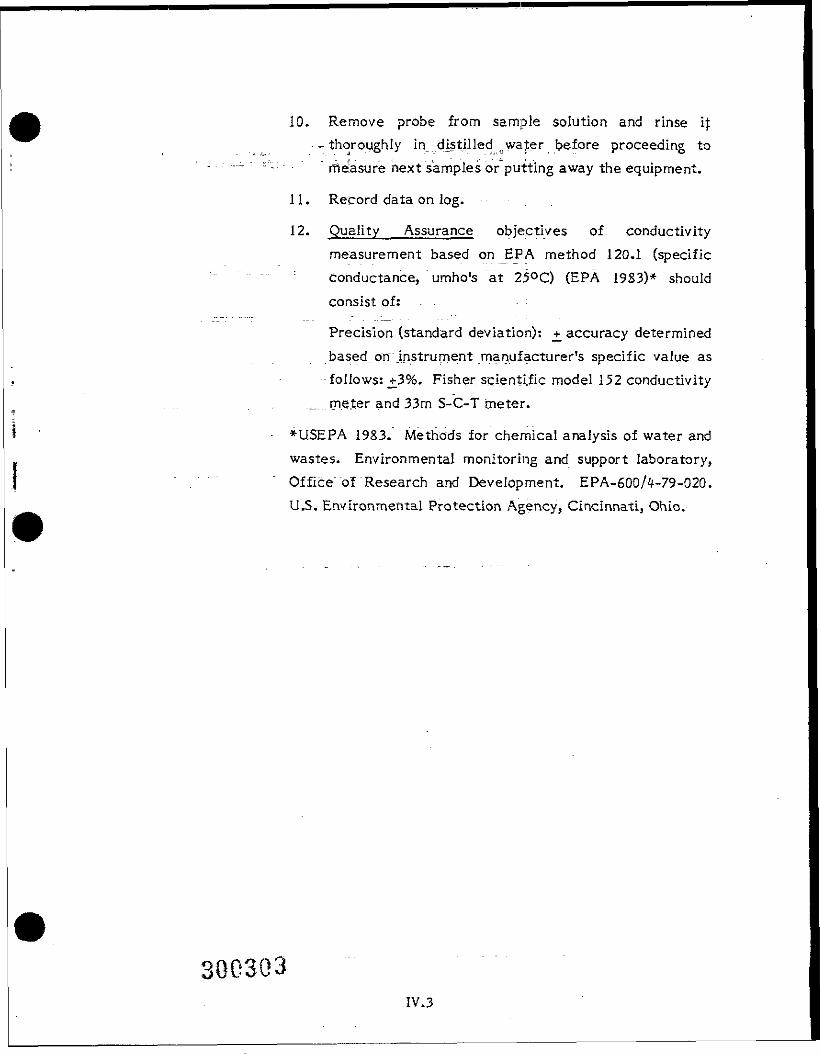
10. Remove probe from sample solution and rinse if- thoroughly In_ .distilled , water before proceeding to" ffieasure next samples or putting away the equipment.
11. Record data on log.
12. Quality Assurance objectives of- conductivitymeasurement based on EPA method 120.1 (specificConductance, umho's "at 25°C) (EPA 19S3)* shouldconsist of: - :
Precision (standard deviation): accuracy determinedbased, on[.instrument manufacturer's specific value asfollows: ±3%. Fisher scientific model 152 conductivity
._ meter and 33m S-C-T meter.
*USEPA 1983. Methods for chemical analysis of water andwastes. Environmental monitoring and support laboratory,Office of Research and Development. EPA-600/4-79-020.U.S. Environmental Protection Agency, Cincinnati, Ohio.
IV.3


