Embed Size (px)
Citation preview

CYPRIOT BYZANTINE GLAZED POTTERY: A STUDY OFTHE PAPHOS WORKSHOPS*
A. C. CHARALAMBOUS,1,2 A. J. SAKALIS,2 N. A. KANTIRANIS,3
L. C. PAPADOPOULOU,3 N. C. TSIRLIGANIS,2 and J. A. STRATIS1†
1Laboratory of Analytical Chemistry, Department of Chemistry, Aristotle University, GR-54124, Thessaloniki, Greece2Laboratory of Archaeometry, Cultural and Educational Technology Institute, ‘Athena’ Research Centre, Tsimiski 58,
GR-67100, Xanthi, Greece3Department of Mineralogy-Petrology-Economic Geology, Aristotle University, GR-54124, Thessaloniki, Greece
Twenty-five samples of Byzantine glazed pottery from two archaeological sites between Limas-sol and Paphos region (Cyprus), dated between the 12th and 15th century AD were studiedusing micro X-ray fluorescence spectroscopy, scanning electron microscopy and X-ray dif-fraction analysis. It was found that all the glazes contain lead, following the main manufac-turing process of medieval pottery in the Mediterranean territory, while some of them containtin, possibly for better opacity. Furthermore, it is shown that copper, iron and cobalt withnickel are responsible for the decoration colours. Finally, the application of principal com-ponent analysis revealed significant differentiation for some of the samples.
KEYWORDS: CYPRUS, MICRO X-RAY FLUORESCENCE SPECTROSCOPY,X-RAY DIFFRACTION ANALYSIS, SCANNING ELECTRON MICROSCOPY,
PRINCIPAL COMPONENT ANALYSIS
INTRODUCTION
Cyprus presents a long tradition in glazed pottery, mainly dated from the 12th to the 15th centuryad. Archaeological findings confirm the presence of several glazed pottery workshops in manyareas of Cyprus. The most important workshops were in the area of Paphos, on the southwesternside of the island, and in the area of Lapithos, on the northern side of the island, near the city ofKyrenia. The specific workshops of Paphos and Lapithos were active from the 12th century andsome of them, especially in the area of Lapithos, until the 19th century. Because of the locationof the island, between three continents and near the Middle East, occupation by the Franks(1192–1489) and the Venetians (1489–1572), and due to trade, the manufacture and the decora-tion technology of the local glazed pottery exhibits significant influences from these areas(Papanikola-Bakirtzis 1996).
Pottery receives more attention perhaps than any other type of artefact since large amountsare continuously excavated at archaeological sites. Its typological and analytical study enablesthe investigation of many interesting aspects of ancient culture, trade and technology (Rice1987). Lead-glazed pottery was widely spread around the regions of the Mediterranean Sea.The main characteristic of the 12th century Byzantine glazed pottery, developed mainly withinthe Byzantine Empire, was the application of the sgraffito technique. Sgraffito is the term usedto describe redware pottery in which, with the aid of a sharp tool, decorations have been
*Received 7 November 2008; accepted 27 June 2009†Corresponding author
Archaeometry 52, 4 (2010) 628–643 doi: 10.1111/j.1475-4754.2009.00502.x
© University of Oxford, 2009
scratched into a thin layer of clay slip. Byzantine potters used to apply a coating of white slipand a colourless lead (Pb) glaze over the ceramic body, and further decorated the surfaces witha colourful variety of incised and painted designs (Papanikola-Bakirtzis 1999). The ByzantinePb glazes are easily formed, obtain lustrousness and opacity at low temperatures and are alsoeasily coloured with oxides of other metals, such as copper (Cu) and iron (Fe). The maincharacteristics of the Paphos workshops are the reddish clay ceramics with white slip coatingand mainly sgraffito decoration with a glaze of green, yellow, brown and orange colour.Cypriot glazed pottery should be considered and studied as a branch of Byzantine glazedpottery displaying the same technology and decorative techniques as pottery in Byzantium(Papanikola-Bakirtzis 1996).
An important category of glazed pottery is the tin-opacified glazes, originally produced in Iraqduring the eighth century ad (Mason and Tite 1997). Initially, tin-opacified glazes were alkaliglazes containing only 1–2% PbO. However, in Spain and for the early production of Italianmajolica, the lead oxide contents tended to be higher (up to about 55% PbO) with lower alkalicontents (down to about 3% Na2O plus K2O) (Tite et al. 1998).
Glazed pottery from Cyprus has not attracted much interest in terms of analytical studies. Todate, only a few studies on the provenance of the Cypriot ceramics have been performed.Specifically, instrumental neutron activation analysis (INAA) was used to study pottery samplesfrom southwestern Cyprus (including the Paphos area) obtained from 38 archaeological sites,dated from the Neolithic through to the Roman period. The results indicated that the largemajority of the ceramics are likely to be local products (King et al. 1986; King 1987).Furthermore, Megaw and Jones studied glazed ceramic material dated from the fifth to the 15thcentury from three regions in Cyprus (Lapithos, Lemba and Dhiorios) with optical emissionspectroscopy, revealing discrimination of the three regions (Megaw and Jones 1983; Jones1986).
Micro X-ray fluorescence spectroscopy (m-XRF) is a non-destructive, fast, multi-elementaltechnique, which analyses the surface layer and determines major, minor and trace elements inthin and thick samples of all sizes and forms (Padilla et al. 2005; Papadopoulou et al. 2006).Together with the micro-XRF technique, X-ray diffraction (XRD) and scanning electron micro-scopy (SEM-EDS) techniques are widely used to complete an archaeometric characterization ofpottery (Rice 1987).
In the present work, a portable m-XRF spectrometer is used for the non-destructive analysis of25 medieval glazed ceramics from two different archaeological sites in Cyprus. Additionally,XRD and SEM-EDS are used to study certain samples in order to confirm the experimentalresults from m-XRF analysis.The basic aims of this study were:(1) To determine the mineralogical and chemical composition of the ceramic bodies in order toinvestigate their manufacture technology and the provenance of the specific samples.(2) To determine the chemical composition of the glazes in order to characterize the colours ofthe decorations.(3) To suggest possible origins of the studied material and to contribute to the explanation ofobserved technological differences based on existing archaeological knowledge which claimsthat the material originates from Paphos workshops.Furthermore, the statistical treatment of the quantitative data using multivariate exploratorytechniques (principal component analysis, PCA) in combination with the archaeological infor-mation provides certain indications concerning the provenance of the studied material and offerspossible justifications for any observed discrimination of the material. This study is expected toprovide useful knowledge on the local glazed pottery technology.
Cypriot Byzantine glazed pottery 629
© University of Oxford, 2009, Archaeometry 52, 4 (2010) 628–643
EXPERIMENTAL PROCEDURE
Description of samples
The investigated glazed ceramic sherds were excavated at the Kepir Mosque in the city ofLimassol and at the church of Panagia Galactotrofousa in the Fasouri area, 15 km west ofLimassol, both located in the south of Cyprus. Kepir Mosque was built during the 16th centurynear a Byzantine church, while Panagia Galactotrofousa was built during the 11th century. Theexcavation of the Kepir Mosque was performed in 1993 and the church of Panagia Galactotro-fousa in 2002 under the supervision of the Cyprus Department of Antiquities (Prokopiou 1997).The samples are dated between the 12th and the 15th century ad. The archaeologists believethat the origin of the samples is from the Paphos area workshops, due to the similarities inthe manufacture technology (plain, painted and especially scraffito decoration with glaze layermainly on the inner side of the ceramic object) and the colour of the glazes (green, yellow, brownand orange). Quantitative analysis was performed for all the samples by non-destructive means,using m-XRF spectroscopy, while further analysis applying SEM-EDS and XRD techniqueswas performed on specific samples of interest in order to minimize the destruction of samples.Samples K1–K18 were excavated in the Kepir Mosque, while the remaining samples, K27 –K33,were excavated in Panagia Galactotrofousa (Table 1). The samples were decorated using green,yellow, orange, brown, black and blue glazes, as shown in Table 1. Furthermore, samples K18,K32 and K33 show optical differences in both the clay microstructure and the glaze decorationstyle compared with all the other samples. Specifically, these samples have painted decoration ofblue and light blue, which is typical of Italian majolica pottery. Therefore they could be tradeproducts due to the occupation of Cyprus by Venice during the 15th century.
Micro X-ray fluorescence spectroscopy
Quantitative analysis of the ceramic bodies was performed using portable m-XRF spectroscopy.The portable m-XRF spectrometer (SPECTRO, COPRA model, Austria) used in this workincorporates a side window X-ray tube with Mo anode (Oxford Instruments, Series 5011 XTF),a straight monocapillary lens and a solid-state Si Peltier-cooled detector (8 mm Be window,3.5 mm2 active area, 300 mm nominal thickness). The maximum tube voltage is 50 kV and itsmaximum current is 1 mA. The nominal beam diameter is <150 mm at the position of the sample.The angle of incidence of the primary X-ray beam on the sample surface is 48° (relative to thesurface), while the angle between the sample and the detector is 42°. All measurements areperformed under atmospheric pressure and no filters were used.
The m-XRF measurements were performed in a point scan mode on several points, which wereselected to cover the entire surface of the glaze. In particular, three to five measurements wereperformed on the surface of the glaze-over-paste in all colour areas. Furthermore, three mea-surements were performed on the ceramic body for each sample, after removal of a small part ofthe surface ceramic body layer with a drill and a tungsten carbide cutter to eliminate possiblesurface contamination effects. All samples were cleaned with ultra-pure water and dried in theoven at 110°C. Reported concentrations are mean values of the three or five measurements persample. The applied voltage was 40 kV, the current 0.7 mA and the measurement time 300 s,based on a preliminary investigation of the optimum experimental parameters. The standardreference material SARM 69 (MINTEK, Republic of South Africa) was used as a calibrationstandard, while the standard reference material Geostandard VS-N (SARM-CNRS, France) was
630 A. C. Charalambous et al.
© University of Oxford, 2009, Archaeometry 52, 4 (2010) 628–643

Tabl
e1
Des
crip
tion
ofth
est
udie
dsa
mpl
es
Sam
ple
inde
xE
xcav
atio
nar
eaC
lay
colo
ur(M
unse
llra
nge)
Mac
rosc
opic
char
acte
riza
tion
Gla
zede
cora
tion
K1
K.M
.R
eddi
sh-2
.5Y
R4/
8Fi
negr
aine
dG
reen
glaz
eK
2K
.M.
Red
dish
-2.5
YR
5/6
Coa
rse
grai
ned
Bro
wn
and
red
glaz
eK
3K
.M.
Red
dish
-2.5
YR
4/6
Fine
grai
ned
Bro
wn
glaz
eK
4K
.M.
Whi
tish-
10Y
R7/
2Fi
negr
aine
dO
rang
egl
aze
K5
K.M
.R
eddi
sh-1
0R5/
2C
oars
egr
aine
dY
ello
w,g
reen
and
brow
ngl
aze
K6
K.M
.W
hitis
h-7.
5YR
7/4
Fine
grai
ned
Yel
low
glaz
eK
7K
.M.
Red
dish
-10R
5/2
Coa
rse
grai
ned
Yel
low
,bro
wn
and
gree
ngl
aze
with
blac
klin
esK
8K
.M.
Red
dish
-2.5
YR
4/6
Coa
rse
grai
ned
Bro
wn
glaz
eK
9K
.M.
Red
dish
-2.5
YR
6/8
Fine
grai
ned
Gre
enan
dbr
own
glaz
eK
10K
.M.
Red
dish
-2.5
YR
5/6
Coa
rse
grai
ned
Yel
low
and
brow
ngl
aze
K11
K.M
.W
hitis
h-10
YR
8/4
Fine
grai
ned
Yel
low
glaz
eK
12K
.M.
Red
dish
-2.5
YR
4/6
Fine
grai
ned
Yel
low
and
brow
ngl
aze
with
blac
klin
esK
13K
.M.
Whi
tish-
10Y
R7/
4C
oars
egr
aine
dB
lue
deco
ratio
nK
14K
.M.
Red
dish
-2.5
YR
6/6
Fine
grai
ned
Ora
nge
glaz
eK
15K
.M.
Red
dish
-7.5
YR
8/4
Fine
grai
ned
Bro
wn
glaz
eK
16K
.M.
Red
dish
-2.5
YR
4/4
Coa
rse
grai
ned
Gre
enan
dbr
own
glaz
ew
ithbl
ack
lines
K17
K.M
.R
eddi
sh-2
.5Y
R5/
6Fi
negr
aine
dY
ello
wan
dbr
own
glaz
eK
18K
.M.
Whi
tish-
5Y9/
2Fi
negr
aine
dB
lue
glaz
eK
27P.
G.
Red
dish
-2.5
YR
6/6
Coa
rse
grai
ned
Gre
engl
aze
with
blac
klin
esK
28P.
G.
Red
dish
-5Y
R7/
8Fi
negr
aine
dY
ello
wan
dgr
een
glaz
eK
29P.
G.
Red
dish
-2.5
YR
6/6
Coa
rse
grai
ned
Bro
wn
glaz
eK
30P.
G.
Red
dish
-5Y
R7/
6Fi
negr
aine
dY
ello
wan
dgr
een
glaz
eK
31P.
G.
Red
dish
-2.5
YR
5/6
Fine
-gra
ined
Yel
low
glaz
eK
32P.
G.
Whi
tish-
2.5Y
9/4
Fine
grai
ned
Lig
htbl
uegl
aze
K33
P.G
.W
hitis
h-2.
5Y9/
4Fi
negr
aine
dB
lue
gree
ngl
aze
K.M
.=K
epir
Mos
que;
P.G
.=Pa
nagi
aG
alac
totr
ofou
sa.
Cypriot Byzantine glazed pottery 631
© University of Oxford, 2009, Archaeometry 52, 4 (2010) 628–643
used for the quantification of Pb and the standard reference material GBW07706 (China NationalAnalysis Center for Iron and Steel, Beijing) was used for the quantification of tin (Sn). Allstandard reference materials were prepared in pressed pellets by thoroughly mixing the powderwith a cellulose binder in a 4:1 (reference material/binder) ratio, while pressing was performedusing an 11-ton hydraulic press (Specac, UK). X-ray spectra were deconvoluted and fitted usinga suitable software package (WinAxil v 4.0.1).
X-ray diffraction
The quantitative mineralogical composition of the samples was determined by powder XRD.Powder XRD analysis was performed using a diffractometer with an Ni-filtered Cu Ka radiation(Philips PW1710, The Netherlands) source on randomly oriented samples. Subsamples were cutoff the glazed ceramic samples and powdered in an agate mortar. The samples were scanned overthe interval 3–63° 2q at a scanning speed of 1.2°/min. Quantitative estimates of the abundance ofthe mineral phases were derived from the powdered XRD data, using the intensity of specificreflections, the density and the mass absorption coefficient for Cu Ka radiation for the mineralspresent. Corrections were made using external standard mixtures of the detected mineral phases(Guinier 1963; Kantiranis et al. 2004). Amorphous phase content was calculated according to themethodology proposed by Kantiranis et al. (2004). The detection limit for crystalline and amor-phous phases was 12% w/w.
Scanning electron microscopy
The morphology and chemical microanalysis of the studied glazed pottery sherds was performedon the outer surface and on polished sections by SEM-EDS (Jeol JSM-840, Japan), a scanningelectron microscope, equipped with an Oxford ISIS300 Energy Dispersion Analyser. To mini-mize volatilization of alkalis in the studied samples, the electron beam spot size was enlarged andthe counting time decreased. The measuring conditions were: voltage 15 kV, electron beamcurrent ~3 nA and spot size 1 mm2, while counting time was 60 s. Different minerals (micas,carbonates, feldspars) and pure metals were used as probe standards.
RESULTS AND DISCUSSION
Micro X-ray fluorescence spectroscopy
Most of the ceramic bodies have a reddish colour while samples K4, K6, K11, K13, K18, K32and K33 are characterized by a yellow-white colour (see Table 1).
The m-XRF spectra of Figure 1 present the differences between the ceramic body and the glazecomposition of sample K18. The main differences were the high amounts of Ca, Ti, Fe and Sr inthe ceramic body and the high amounts of S and Pb in the glaze. These significant differencesexist in the composition of the ceramic body and the glaze in all samples. All ceramic bodiescontain a small amount of Pb as a result of the leaching of Pb from the transparent glaze duringfiring (Fabbri et al. 2000). The main characteristic of the glazes is the high amount of Pb thatfollows the main manufacturing trend in Cyprus during the studied Byzantine period (12th–15thcenturies ad). The two primary methods of producing lead glazes were either to apply Pb, PbOto the surface of the pottery body, or to apply a mixture of PbO and silica (Tite et al. 1998). Thepresence of significant amounts of Sn in the ceramic body (0.08–0.18% w/w) of samples K18,
632 A. C. Charalambous et al.
© University of Oxford, 2009, Archaeometry 52, 4 (2010) 628–643

K32 and K33 is probably due to the leaching of Sn from the transparent glaze during firing(Fig. 1). Sn was used in glazed pottery for the creation of opacified glass (Allan 1973; Al-Saad2002).
The chemical compositions of both the ceramic bodies and the glazes are presented in Tables 2and 3, respectively.
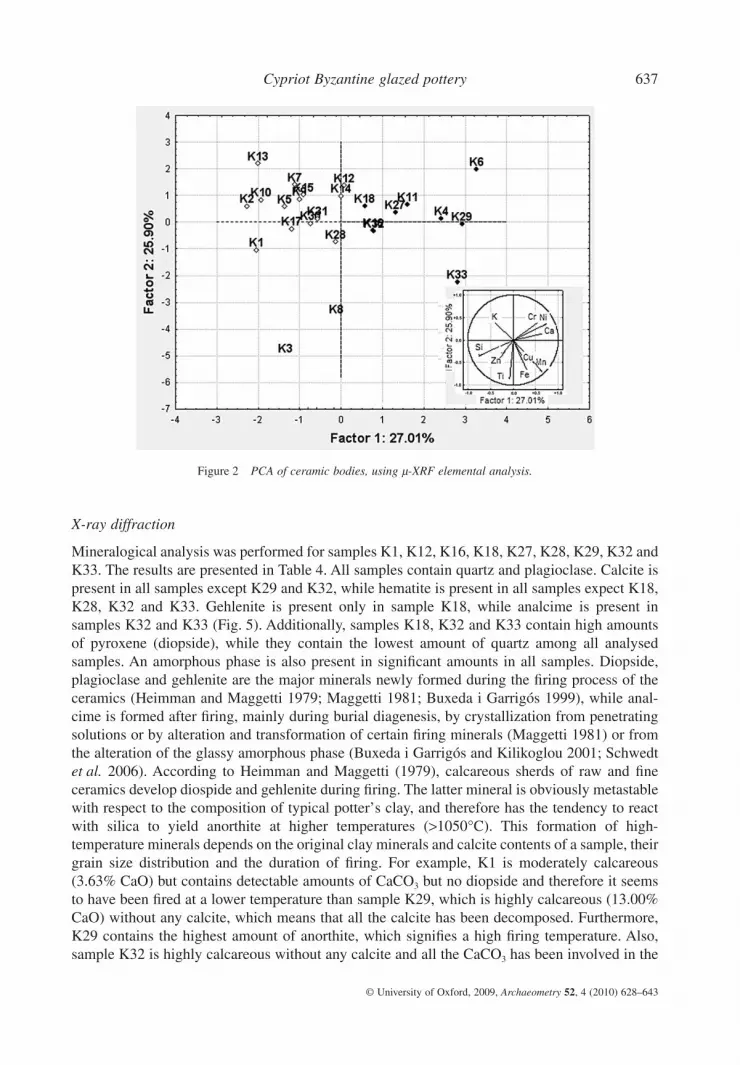
PCA of the ceramic bodies, based on m-XRF elemental analysis data, illustrates the differencesof the samples, as shown in Figure 2. A weak difference of the studied material is observed basedon the first principal component. Samples on the left side of the PCA (K1, K2, K10, K13) showincreased concentration of K and Si together with low concentrations of Cr and Ca. However,samples on the right of the PCA (K4, K6, K29) present high concentrations of Cr, Ca and Ni. Thechemical composition of the ceramic bodies is compared with already analysed material from thePaphos (Lemba, Kouklia) (Megaw and Jones 1983; Jones 1986) and Limassol areas (Amathus)(Jones 1986), taking into consideration the different techniques used for analysis (Fig. 3).According to this comparison, glazed ceramic samples with increased Cr and Ca concentrationsseem to originate from Limassol while samples with low concentration of Cr and Ca couldpossibly originate from Paphos (Fig. 2). Samples K3 and K8 are different from the other samplesdue to their higher content of Ti while sample K33 has a very high amount of Ca and significantamounts of Mn and Cu. Samples K3, K8 and K33 reveal stronger differences and could possiblyhave been manufactured in different workshops from other areas of Cyprus or were tradeproducts from other territories.
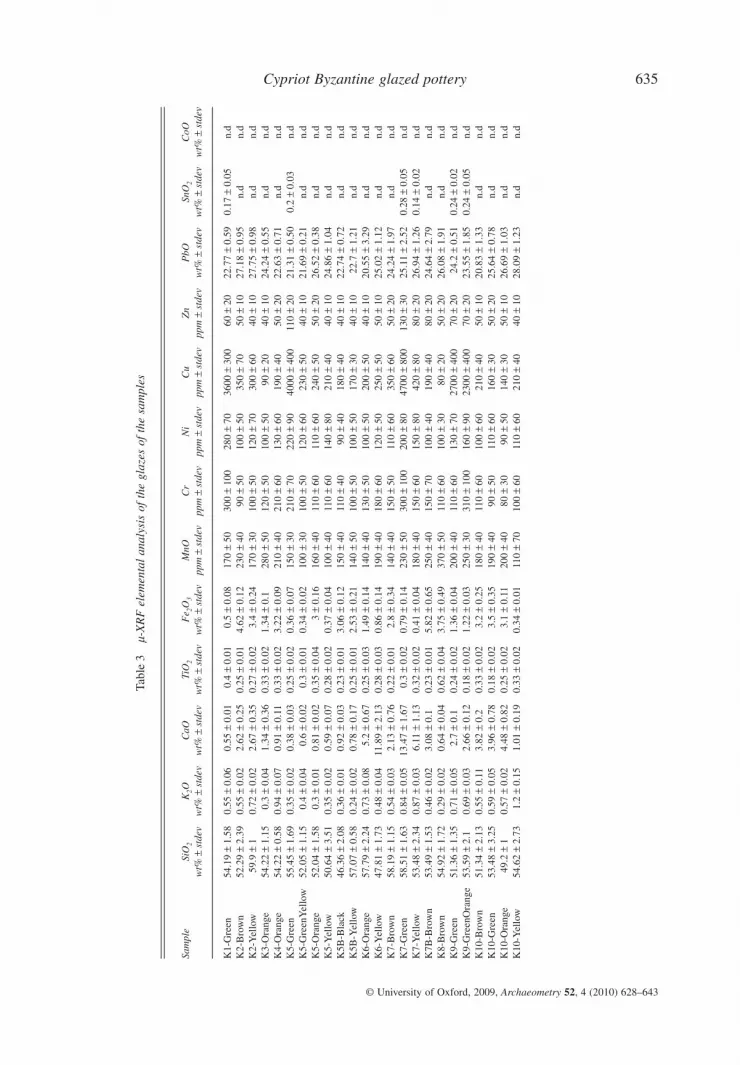
The green colour of the lead glazes is usually related to the presence of Cu2+ or Fe2+ in theglaze, whereas the yellow to brown colours are related to Fe3+ oxides and complexes (Moleraet al. 1999). Elemental analysis of the glazes confirms these observations, showing that greenglazes are rich in Cu, as seen in Figure 4. The blue glaze (sample K18) contains Co, Sn andsignificant amounts of Ni. It seems that Co-based pigments were well known for their beautifulblue colour due to the CoO4 complex. Finally, Fe3+ is responsible for the brown, yellow, black andred in the glazes; however, black glazes also contain Mn and yellow glazes also contain Cr.
Figure 1 m-XRF spectra of the clay and the blue glaze of the sample K18.
Cypriot Byzantine glazed pottery 633
© University of Oxford, 2009, Archaeometry 52, 4 (2010) 628–643

Tabl
e2
m-X
RF
elem
enta
lan
alys
isof
the
clay
sof
the
sam
ples
SiO
2K
2OC
aOTi
O2
Fe 2
O3
MnO
Cr
Ni
Cu
Zn
wt%1
stde
vw
t%1
stde
vw
t%1
stde
vw
t%1
stde
vw
t%1
stde
vw
t%1
stde
vpp
m1
stde
vpp
m1
stde
vpp
m1
stde
vpp
m1
stde
v
K1
61.0
01
2.00
2.441
0.07
3.631
0.20
0.891
0.10
7.601
0.50
0.111
0.02
2501
6012
51
5020
01
4012
51
25K
258
.001
2.00
3.081
0.26
5.871
0.59
0.821
0.16
6.771
0.55
0.071
0.01
1501
80701
20651
10851
20K
354
.001
2.00
1.371
0.11
4.431
0.32
2.231
0.25
12.8
31
0.21
0.221
0.02
1301
70501
10851
2012
01
20K
458
.331
3.51
1.501
0.26
15.8
01
0.66
0.811
0.10
8.801
1.01
0.211
0.02
4701
200
2301
100
701
20901
20K
559
.551
2.08
3.081
0.03
5.731
0.96
0.861
0.12
7.371
0.31
0.091
0.01
3301
6010
01
3012
51
25701
20K
656
.331
2.00
2.001
0.05
22.3
31
1.15
0.661
0.11
6.871
0.32
0.151
0.01
7001
300
3001
130
901
20901
20K
755
.671
2.00
3.311
0.17
3.271
0.31
0.761
0.04
6.831
0.35
0.091
0.01
5001
200
1201
50501
10801
20K
854
.001
3.00
0.841
0.05
3.011
0.53
1.401
0.17
10.0
71
0.90
0.221
0.03
2301
100
1001
5030
01
60801
20K
951
.001
2.00
3.471
0.03
8.571
0.90
0.921
0.08
7.601
0.36
0.091
0.01
5001
300
1401
60731
20901
20K
1053
.501
2.31
3.131
0.62
6.201
0.85
0.711
0.16
7.071
1.47
0.071
0.02
1201
50801
20731
20871
20K
1156
.331
2.52
2.011
0.14
24.3
31
0.58
0.641
0.03
7.301
0.46
0.161
0.01
2301
100
1901
100
901
2011
01
20K
1252
.331
3.79
3.131
0.45
8.001
1.00
0.831
0.12
8.131
1.01
0.101
0.02
4651
100
1601
60701
20501
10K
1352
.671
5.13
0.751
0.06
7.031
1.17
0.121
0.02
0.831
0.15
0.071
0.03
1601
7010
01
50901
20801
20K
1453
.671
2.52
3.141
0.22
6.101
0.20
0.791
0.06
7.301
0.30
0.151
0.01
5001
200
1601
90501
10801
20K
1551
.331
3.51
2.961
0.28
19.7
01
3.16
0.721
0.13
5.601
0.78
0.091
0.01
1201
70821
20801
2010
01
20K
1654
.331
6.35
3.001
0.46
19.3
31
1.23
1.071
0.25
9.271
0.60
0.151
0.04
4001
100
1201
2016
01
50701
15K
1755
.671
3.03
3.421
0.33
6.431
0.32
0.931
0.15
8.201
0.56
0.141
0.02
1901
100
1201
50801
2011
01
20K
1844
.671
2.53
1.631
0.21
19.3
31
3.79
0.731
0.12
6.231
1.33
0.111
0.02
1701
4011
01
2015
01
40901
20K
2756
.001
4.16
2.771
0.59
21.3
31
4.04
0.91
0.11
9.331
0.58
0.131
0.01
5001
100
1901
7014
01
30851
15K
2858
.001
3.00
3.471
0.20
13.1
71
0.32
0.921
0.07
10.5
31
0.49
0.161
0.01
2001
100
1901
3510
01
2012
01
20K
2954
.671
3.13
1.371
0.21
13.0
01
3.46
0.871
0.21
11.6
71
2.52
0.021
0.00
145
01
130
2501
80901
20601
10K
3055
.331
1.53
3.051
0.04
11.9
31
0.55
0.871
0.05
8.471
0.15
0.131
0.01
2301
100
1251
70701
2011
01
20K
3153
.671
1.53
2.501
0.05
8.671
0.49
0.811
0.13
6.731
0.21
0.161
0.03
1601
8012
01
70801
20801
20K
3245
.001
3.46
0.481
0.02
16.1
31
0.51
0.711
0.01
7.231
0.15
0.161
0.02
2601
100
1001
60901
2013
01
30K
3347
.671
2.87
1.201
0.02
23.3
31
2.65
0.871
0.06
8.001
0.52
0.271
0.08
2401
3510
01
2043
01
60701
10
634 A. C. Charalambous et al.
© University of Oxford, 2009, Archaeometry 52, 4 (2010) 628–643
Tabl
e3
m-X
RF
elem
enta
lan
alys
isof
the
glaz
esof
the
sam
ples
Sam
ple
SiO
2K
2OC
aOTi
O2
Fe 2
O3
MnO
Cr
Ni
Cu
Zn
PbO
SnO
2C
oOw
t%1
stde
vw
t%1
stde
vw
t%1
stde
vw
t%1
stde
vw
t%1
stde
vpp
m1
stde
vpp
m1
stde
vpp
m1
stde
vpp
m1
stde
vpp
m1
stde
vw
t%1
stde
vw
t%1
stde
vw
t%1
stde
v
K1-
Gre
en54
.191
1.58
0.551
0.06
0.551
0.01
0.41
0.01
0.51
0.08
1701
5030
01
100
2801
7036
001
300
601
2022
.771
0.59
0.171
0.05
n.d
K2-
Bro
wn
52.2
91
2.39
0.551
0.02
2.621
0.25
0.251
0.01
4.621
0.12
2301
40901
5010
01
5035
01
70501
1027
.181
0.95
n.d
n.d
K2-
Yel
low
59.91
10.
721
0.02
2.671
0.35
0.271
0.02
3.41
0.24
1701
3010
01
5012
01
7030
01
60401
1027
.751
0.98
n.d
n.d
K3-
Ora
nge
54.2
21
1.15
0.31
0.04
1.341
0.36
0.331
0.02
1.341
0.1
2801
5012
01
5010
01
50901
20401
1024
.241
0.55
n.d
n.d
K4-
Ora
nge
54.2
21
0.58
0.941
0.07
0.911
0.11
0.331
0.02
3.221
0.09
2101
4021
01
6013
01
6019
01
40501
2022
.631
0.71
n.d
n.d
K5-
Gre
en55
.451
1.69
0.351
0.02
0.381
0.03
0.251
0.02
0.361
0.07
1501
3021
01
7022
01
9040
001
400
1101
2021
.311
0.50
0.21
0.03
n.d
K5-
Gre
enY
ello
w52
.051
1.15
0.41
0.04
0.61
0.02
0.31
0.01
0.341
0.02
1001
3010
01
5012
01
6023
01
50401
1021
.691
0.21
n.d
n.d
K5-
Ora
nge
52.0
41
1.58
0.31
0.01
0.811
0.02
0.351
0.04
31
0.16
1601
4011
01
6011
01
6024
01
50501
2026
.521
0.38
n.d
n.d
K5-
Yel
low
50.6
41
3.51
0.351
0.02
0.591
0.07
0.281
0.02
0.371
0.04
1001
4011
01
6014
01
8021
01
40401
1024
.861
1.04
n.d
n.d
K5B
-Bla
ck46
.361
2.08
0.361
0.01
0.921
0.03
0.231
0.01
3.061
0.12
1501
4011
01
40901
4018
01
40401
1022
.741
0.72
n.d
n.d
K5B
-Yel
low
57.0
71
0.58
0.241
0.02
0.781
0.17
0.251
0.01
2.531
0.21
1401
5010
01
5010
01
5017
01
30401
1022
.71
1.21
n.d
n.d
K6-
Ora
nge
57.7
91
2.24
0.731
0.08
5.21
0.67
0.251
0.03
1.491
0.14
1401
4013
01
5010
01
5020
01
50401
1020
.551
3.29
n.d
n.d
K6-
Yel
low
47.8
11
1.73
0.481
0.04
11.8
91
2.13
0.281
0.03
0.861
0.14
1901
4018
01
6012
01
5025
01
50501
1025
.021
1.12
n.d
n.d
K7-
Bro
wn
58.1
91
1.15
0.541
0.03
2.131
0.76
0.221
0.01
2.81
0.34
1401
4015
01
5011
01
6035
01
60501
2024
.241
1.97
n.d
n.d
K7-
Gre
en58
.511
1.63
0.841
0.05
13.4
71
1.67
0.31
0.02
0.791
0.14
2301
5030
01
100
2001
8047
001
800
1301
3025
.111
2.52
0.281
0.05
n.d
K7-
Yel
low
53.4
81
2.34
0.871
0.03
6.111
1.13
0.321
0.02
0.411
0.04
1801
4015
01
6015
01
8042
01
80801
2026
.941
1.26
0.141
0.02
n.d
K7B
-Bro
wn
53.4
91
1.53
0.461
0.02
3.081
0.1
0.231
0.01
5.821
0.65
2501
4015
01
7010
01
4019
01
40801
2024
.641
2.79
n.d
n.d
K8-
Bro
wn
54.9
21
1.72
0.291
0.02
0.641
0.04
0.621
0.04
3.751
0.49
3701
5011
01
6010
01
30801
20501
2026
.081
1.91
n.d
n.d
K9-
Gre
en51
.361
1.35
0.711
0.05
2.71
0.1
0.241
0.02
1.361
0.04
2001
4011
01
6013
01
7027
001
400
701
2024
.21
0.51
0.241
0.02
n.d
K9-
Gre
enO
rang
e53
.591
2.1
0.691
0.03
2.661
0.12
0.181
0.02
1.221
0.03
2501
3031
01
100
1601
9023
001
400
701
2023
.551
1.85
0.241
0.05
n.d
K10
-Bro
wn
51.3
41
2.13
0.551
0.11
3.821
0.2
0.331
0.02
3.21
0.25
1801
4011
01
6010
01
6021
01
40501
1020
.831
1.33
n.d
n.d
K10
-Gre
en53
.481
3.25
0.591
0.05
3.961
0.78
0.181
0.02
3.51
0.35
1901
40901
5011
01
6016
01
30501
2025
.641
0.78
n.d
n.d
K10
-Ora
nge
49.21
10.
571
0.02
4.481
0.82
0.251
0.02
3.11
0.11
2001
40801
30901
5014
01
30501
1026
.691
1.03
n.d
n.d
K10
-Yel
low
54.6
21
2.73
1.21
0.15
1.011
0.19
0.331
0.02
0.341
0.01
1101
7010
01
6011
01
6021
01
40401
1028
.091
1.23
n.d
n.d
Cypriot Byzantine glazed pottery 635
© University of Oxford, 2009, Archaeometry 52, 4 (2010) 628–643

Tabl
e3
(Con
tinu
ed)
Sam
ple
SiO
2K
2OC
aOTi
O2
Fe 2
O3
MnO
Cr
Ni
Cu
Zn
PbO
SnO
2C
oOw
t%1
stde
vw
t%1
stde
vw
t%1
stde
vw
t%1
stde
vw
t%1
stde
vpp
m1
stde
vpp
m1
stde
vpp
m1
stde
vpp
m1
stde
vpp
m1
stde
vw
t%1
stde
vw
t%1
stde
vw
t%1
stde
v
K11
-Ora
nge
51.3
41
1.83
1.41
0.34
4.381
0.76
0.231
0.03
1.861
0.06
1601
70701
2012
01
6013
01
30451
1026
.151
3.36
n.d
n.d
K11
-Yel
low
52.91
2.68
0.961
0.26
5.311
1.12
0.351
0.03
0.631
0.12
901
4017
01
8012
01
7021
01
40441
1023
.391
2.99
n.d
n.d
K12
-Red
56.3
51
2.15
0.461
0.08
2.091
0.3
0.231
0.04
2.721
0.3
1601
4011
01
4010
01
4035
01
100
201
1026
.451
1.40
n.d
n.d
K12
-Yel
low
60.0
41
2.52
0.391
0.08
1.121
0.1
0.221
0.03
2.281
0.3
1301
4014
01
4012
01
4030
01
100
201
1024
.781
1.51
n.d
n.d
K12
B-B
lack
52.0
91
2.08
0.461
0.03
13.9
91
1.15
0.221
0.02
1.621
0.15
1801
6013
01
3012
01
4012
01
40301
1026
.541
2.48
n.d
n.d
K14
-Ora
nge*
57.0
71
1.58
0.591
0.02
9.751
1.18
0.391
0.02
2.491
0.37
3601
6013
01
6012
01
60701
20401
1024
.511
0.91
n.d
n.d
K14
-Ora
nge
49.9
11
0.58
0.571
0.07
2.491
0.56
0.191
0.01
1.741
0.09
2801
4050
01
200
2001
70801
20401
2025
.811
1.72
n.d
n.d
K14
B-O
rang
e68
.461
2.89
0.691
0.03
4.571
1.29
0.451
0.05
2.961
0.17
3801
5018
01
8012
01
50901
20401
1022
.81
2.12
n.d
n.d
K15
-Yel
low
52.3
61
1.97
1.181
0.11
8.991
2.15
0.321
0.02
1.791
0.04
2601
4018
01
7011
01
4011
01
2011
01
2023
.051
2.51
n.d
n.d
K16
-Bla
ck54
.911
1.53
0.441
0.03
2.791
0.26
0.351
0.02
1.241
0.15
2401
6014
01
4027
01
8077
001
2000
901
2025
.41
1.72
0.211
0.03
n.d
K16
-Bro
wn
51.3
41
1.77
0.251
0.04
1.921
0.12
0.31
0.01
3.531
0.29
2701
7025
01
100
2201
6035
001
800
501
1027
.511
1.06
0.121
0.02
n.d
K16
-Gre
en59
.91
20.
761
0.06
2.611
0.12
0.431
0.01
0.671
0.03
1301
4013
01
4028
01
7077
001
2000
801
2021
.881
1.50
0.171
0.03
n.d
K16
-Lig
htG
reen
57.7
61
3.43
0.421
0.05
1.441
0.06
0.451
0.06
0.571
0.03
1501
5017
01
5027
01
8051
001
1000
601
2020
.941
0.81
0.111
0.02
n.d
K16
B-R
ed51
.331
1.73
0.511
0.16
6.481
1.18
0.281
0.03
91
1.73
2801
7012
01
4015
01
3010
001
100
301
1022
.231
2.06
0.11
0.02
n.d
K17
-Ora
nge*
51.3
51
3.21
0.541
0.11
1.341
0.44
0.221
0.04
1.211
0.19
2601
4027
01
8017
01
60601
10401
1020
.81
2.95
n.d
n.d
K17
-Yel
low
50.6
31
1.53
0.921
0.11
1.231
0.35
0.171
0.01
0.541
0.03
1601
4014
01
5016
01
50801
20401
2021
.231
1.83
n.d
n.d
K18
-Blu
e53
.11
3.43
4.731
0.12
1.921
0.06
0.181
0.02
2.391
0.12
3001
80801
3018
001
300
1501
50201
1035
.81
1.57
2.241
0.12
0.421
0.05
K18
-Lig
htB
lue
52.81
2.97
5.261
0.12
3.921
0.17
0.251
0.03
1.711
0.2
2701
7010
01
4060
01
100
801
30201
1034
.741
1.67
2.371
0.12
0.111
0.01
K27
-Gre
en57
.771
1.53
0.481
0.06
1.641
0.15
0.351
0.01
0.671
0.02
1201
4014
01
4015
01
5055
001
600
501
2027
.771
1.16
n.d
n.d
K27
-Gre
enL
ine
50.6
41
1.72
0.241
0.02
3.931
0.42
0.151
0.02
0.891
0.11
801
3010
01
3011
01
3031
001
300
301
1025
.071
2.67
n.d
n.d
K28
-Gre
en56
.321
2.08
1.481
0.35
1.361
0.06
0.081
0.02
1.621
0.12
3801
9010
01
3013
01
5064
001
1000
501
2023
.421
2.55
n.d
n.d
K28
-Yel
low
57.0
51
1.58
1.241
0.12
0.711
0.08
0.051
0.02
1.141
0.05
4001
100
2301
5015
01
5046
01
70201
1024
.071
1.45
n.d
n.d
K29
-Bla
ck55
.631
1.74
0.121
0.03
0.941
0.06
0.631
0.03
4.621
0.55
6001
100
1301
4014
01
4046
01
100
301
1026
.451
2.69
n.d
n.d
K30
-Gre
en62
.321
3.41
0.861
0.02
1.781
0.27
0.131
0.02
0.471
0.03
1001
4013
01
4014
01
6024
001
100
901
2021
.81
1.38
n.d
n.d
K30
-Yel
low
59.6
41
2.65
0.761
0.03
1.761
0.5
0.091
0.02
0.31
0.01
1201
3011
01
4010
01
4012
01
20301
1024
.071
2.38
n.d
n.d
K30
-Yel
low
*52
.621
2.31
1.051
0.27
4.111
0.67
0.131
0.04
0.731
0.19
1701
4028
01
7015
01
5019
01
70301
1026
.521
2.64
0.11
0.02
n.d
K31
-Yel
low
54.9
21
1.73
0.251
0.03
1.251
0.24
0.151
0.04
0.411
0.03
2001
4011
01
4014
01
4020
01
40501
2027
.431
1.74
n.d
n.d
K32
-Lig
htB
lue
60.1
61
3.12
2.541
0.04
3.321
0.54
0.231
0.02
0.971
0.16
2901
4011
01
5016
01
50801
20401
1030
.861
1.63
1.571
0.2
n.d
K33
-Blu
eGre
en58
.131
2.67
3.651
0.06
2.791
0.4
0.221
0.02
0.611
0.03
2701
7022
01
6022
01
6051
001
400
601
2032
.281
1.26
1.521
0.1
n.d
*Dec
orat
ive
patte
rn.
636 A. C. Charalambous et al.
© University of Oxford, 2009, Archaeometry 52, 4 (2010) 628–643
X-ray diffraction
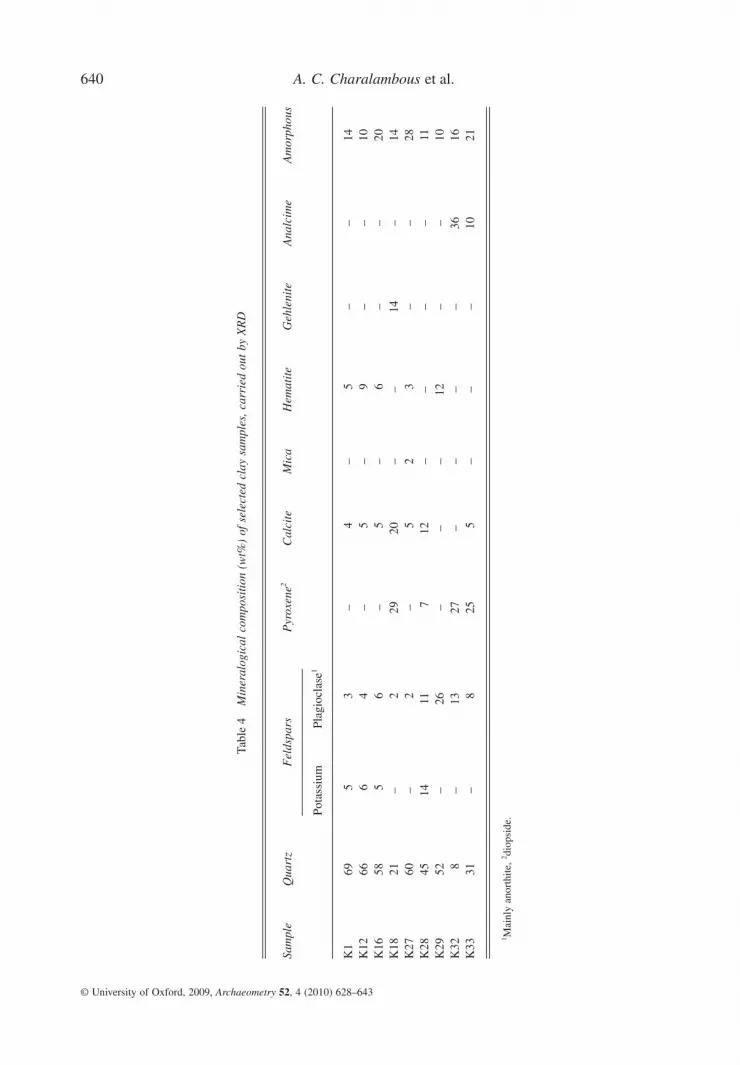
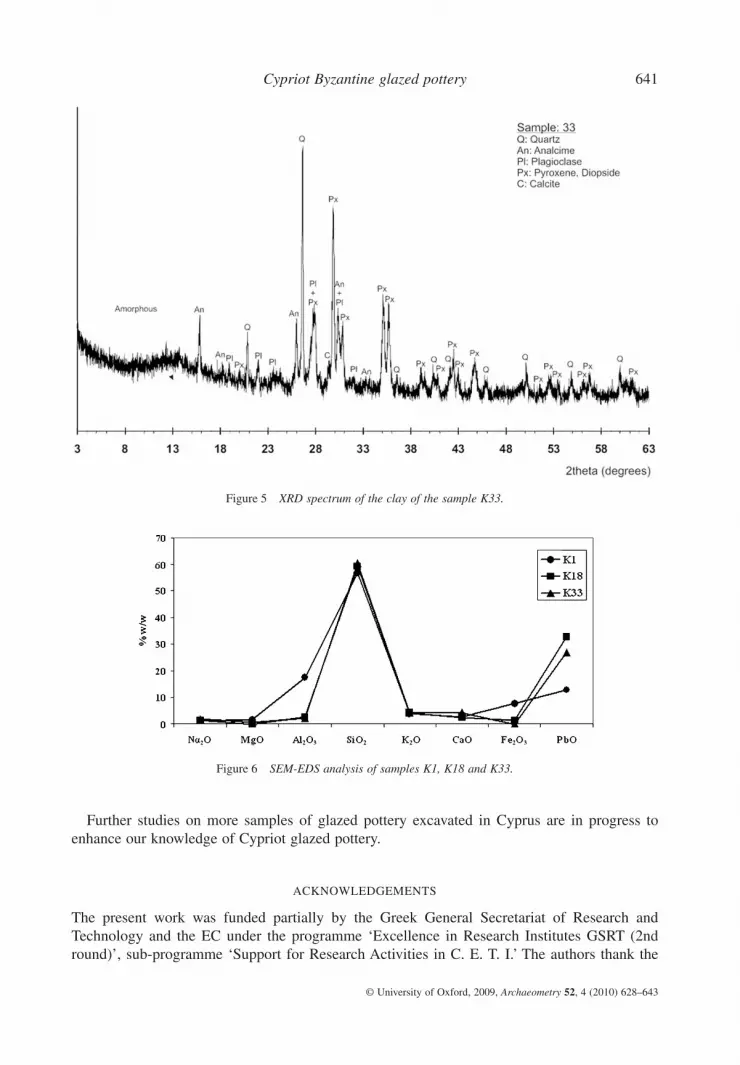
Mineralogical analysis was performed for samples K1, K12, K16, K18, K27, K28, K29, K32 andK33. The results are presented in Table 4. All samples contain quartz and plagioclase. Calcite ispresent in all samples except K29 and K32, while hematite is present in all samples expect K18,K28, K32 and K33. Gehlenite is present only in sample K18, while analcime is present insamples K32 and K33 (Fig. 5). Additionally, samples K18, K32 and K33 contain high amountsof pyroxene (diopside), while they contain the lowest amount of quartz among all analysedsamples. An amorphous phase is also present in significant amounts in all samples. Diopside,plagioclase and gehlenite are the major minerals newly formed during the firing process of theceramics (Heimman and Maggetti 1979; Maggetti 1981; Buxeda i Garrigós 1999), while anal-cime is formed after firing, mainly during burial diagenesis, by crystallization from penetratingsolutions or by alteration and transformation of certain firing minerals (Maggetti 1981) or fromthe alteration of the glassy amorphous phase (Buxeda i Garrigós and Kilikoglou 2001; Schwedtet al. 2006). According to Heimman and Maggetti (1979), calcareous sherds of raw and fineceramics develop diospide and gehlenite during firing. The latter mineral is obviously metastablewith respect to the composition of typical potter’s clay, and therefore has the tendency to reactwith silica to yield anorthite at higher temperatures (>1050°C). This formation of high-temperature minerals depends on the original clay minerals and calcite contents of a sample, theirgrain size distribution and the duration of firing. For example, K1 is moderately calcareous(3.63% CaO) but contains detectable amounts of CaCO3 but no diopside and therefore it seemsto have been fired at a lower temperature than sample K29, which is highly calcareous (13.00%CaO) without any calcite, which means that all the calcite has been decomposed. Furthermore,K29 contains the highest amount of anorthite, which signifies a high firing temperature. Also,sample K32 is highly calcareous without any calcite and all the CaCO3 has been involved in the
Figure 2 PCA of ceramic bodies, using m-XRF elemental analysis.
Cypriot Byzantine glazed pottery 637
© University of Oxford, 2009, Archaeometry 52, 4 (2010) 628–643

formation of high-temperature phases, which means that sample K32 must also have been firedat a higher temperature than the other samples. Mineralogical analysis therefore shows differ-ences in some of the samples such as K29 and K32, which suggests the existence of differentmanufacturing technology probably involving a different firing process.
Scanning electron microscopy
The results of the glaze microanalysis of samples K1, K18 and K33 are presented in Figure 6. Ascan be seen, sample K1 contains a significantly higher amount of alumina and iron oxides (Fe2O3)but a lower amount of PbO compared with the glazes of the other two samples, which is inagreement with Tite et al. (1998). The alkali and the silica content of the glazes are quite similarfor all three samples K1, K18 and K33.
The optical differences of the quality of the ceramic body and glaze of samples K1 and K18are shown in Figures 7 (a) and 7 (b). The ceramic body of sample K1 shows detrital quartz in an
Figure 3 Map of southern Cyprus with the excavation areas of the studied samples and the sites of the other analysedmaterial. Mean values of Cr and Ca concentrations of analysed samples: Lemba (Megaw and Jones 1983), Kouklia(Jones 1986), Amathus 1 and 2 (Jones 1986), analysed samples with low Cr, Ca concentrations, analysed samples withhigh Cr, Ca concentrations.
638 A. C. Charalambous et al.
© University of Oxford, 2009, Archaeometry 52, 4 (2010) 628–643

amorphous matrix. The clay quality of sample K18 is much better. The white bubbles in the glazeof sample K18 (Fig. 7 (d)) are particles of Sn. Therefore SEM-EDS analysis confirms the m-XRFand XRD results on the differences between K18 and K33 compared with K1 (Figs 7 (a) and7 (c)), which is considered to be a local product, possibly from the workshops of Paphos. SamplesK18 (Figs 7 (b) and 7 (d)) and K33 show typical Italian majolica pottery decoration and couldpossibly be regarded as trade products.
CONCLUSIONS
The study of 25 Byzantine glazed ceramics from two archaeological sites in the Limassol areaprovides significant information on the elemental and mineralogical characterization, the prov-enance and the manufacturing techniques used for their production. In particular, the presentstudy has shown that all samples follow the main technological characteristics of lead-glazedByzantine pottery. Some of them (K18, K32, K33) are Sn-opacified glazed pottery and, based onXRD and SEM-EDS analysis, they could be either trade products or local products of workshopsthat followed specific technologies. The chemical composition of the ceramic bodies was com-pared with already analysed material from the Paphos (Lemba, Kouklia) and Limassol areas(Amathus). According to this comparison, the samples with increased Cr and Ca concentrationsseem to originate from the Limassol area while samples with low concentrations of Cr and Cacould originate from the Paphos area. Finally, samples K3 and K8 show significant differencesdue to the high content of TiO2, and together with samples K18, K32 and K33, which show strongarchaeological differences, could be regarded as possible trade products or local products ofdifferent decoration technology.
Concerning the glazes, the blue colour is due to the presence of Co and Ni oxides, the greencolour is due to Cu oxides and the yellow, orange, red and black colours are due mainly to Feoxides, in combination with Mn and Cr oxides.
Figure 4 PCA of glazes using m-XRFelemental analysis.
Cypriot Byzantine glazed pottery 639
© University of Oxford, 2009, Archaeometry 52, 4 (2010) 628–643
Tabl
e4
Min
eral
ogic
alco
mpo
siti
on(w
t%)
ofse
lect
edcl
aysa
mpl
es,c
arri
edou
tby
XR
D
Sam
ple
Qua
rtz
Fel
dspa
rsP
yrox
ene2
Cal
cite
Mic
aH
emat
ite
Geh
leni
teA
nalc
ime
Am
orph
ous
Pota
ssiu
mPl
agio
clas
e1
K1
695
3–
4–
5–
–14
K12
666
4–
5–
9–
–10
K16
585
6–
5–
6–
–20
K18
21–
229
20–
–14
–14
K27
60–
2–
52
3–
–28
K28
4514
117
12–
––
–11
K29
52–
26–
––
12–
–10
K32
8–
1327
––
––
3616
K33
31–
825
5–
––
1021
1 Mai
nly
anor
thite
,2 diop
side
.
640 A. C. Charalambous et al.
© University of Oxford, 2009, Archaeometry 52, 4 (2010) 628–643
Further studies on more samples of glazed pottery excavated in Cyprus are in progress toenhance our knowledge of Cypriot glazed pottery.
ACKNOWLEDGEMENTS
The present work was funded partially by the Greek General Secretariat of Research andTechnology and the EC under the programme ‘Excellence in Research Institutes GSRT (2ndround)’, sub-programme ‘Support for Research Activities in C. E. T. I.’ The authors thank the
Figure 5 XRD spectrum of the clay of the sample K33.
Figure 6 SEM-EDS analysis of samples K1, K18 and K33.
Cypriot Byzantine glazed pottery 641
© University of Oxford, 2009, Archaeometry 52, 4 (2010) 628–643

archaeologist E. Charalambous for cooperation and help during the sampling and the archaeolo-gist E. Prokopiou for the samples and the information about the archaeological sites.
REFERENCES
Allan, J. W., 1973, Abu’l-Qasim’s treatise on Ceramics, Iran, 11, 111–20.Al-Saad, Z., 2002, Chemical composition and manufacturing technology of a collection of various types of Islamic glazes
excavated from Jordan, Journal of Archaeological Science, 29, 803–10.Buxeda i Garrigós, J., 1999, Alteration and contamination of archaeological ceramics: the perturbation problem, Journal
of Archaeological Science, 26, 295–313.Buxeda i Garrigós, J., and Kilikoglou, V., 2001, Chemical and mineralogical alteration of ceramics from a Late Bronze
Age kiln at Kommos, Crete: The effect on the formation of a reference group, Archaeometry, 43, 349–71.Fabbri, B., Gualtieri, S., Mingazzini, C., Spadea, P., Casadio, P., Costantini, R., and Malisani, G., 2000, Archaeometric
investigations of scraffito ceramic tiles (fifteenth-sixteenth centuries) recovered from excavations in Udine (North-East Italy), Archaeometry, 42(2), 317–24.
Guinier, A., 1963. X-Ray diffraction in crystals, imperfect crystals and amorphous bodies, H.W. Freeman and Company,San Francisco.
Heimann, B. R., and Maggetti, M., 1979, Experiments on simulated burial of calcareous Terra Sigillata (Mineralogicalchange) preliminary results, British Museum Occasional Papers No. 19, Scientific Studies in Ancient Ceramics (ed.M. J. Hughes), 163–77.
Jones, R. E., 1986, Greek and Cypriot pottery: a review of scientific studies, The British School at Athens, FitchLaboratory Occasional Paper 1, 314–39, 743–5, 905–10.
Figure 7 Optical microscopy and SEM photomicrographs of the body–glaze interface of the samples K1 (a, c) and K18(b, d).
642 A. C. Charalambous et al.
© University of Oxford, 2009, Archaeometry 52, 4 (2010) 628–643

Kantiranis, N., Stergiou, A., Filippidis, A., and Drakoulis, A., 2004, Calculation of the percentage of amorphous materialusing PXRD patterns, Bulletin of the Geological Society of Greece, 36, 446–53 (in Greek with English abstract).
King, R. H., 1987, Provenance of clay material used in the manufacture of archaeological pottery from Cyprus, AppliedClay Science, 2, 199–213.
King, R. H., Rupp, D. W., and Sorenson L. W., 1986, A multivariate analysis of pottery from southwestern Cyprus usingneutron activation analysis data, Journal of Archaeological Science, 13, 361–74.
Maggetti, M., 1981, Composition of Roman pottery from Lousonna (Switzerland), British Museum Occasional PapersNo. 19, Scientific Studies in Ancient Ceramics (ed. M. J. Hughes), 33–49.
Mason, R. B., and Tite, M. S., 1997, The beginnings of tin-opacification of pottery glazes, Archaeometry, 39, 41–58.Megaw, A. H. S., and Jones, R. E., 1983, Byzantine and allied pottery: a contribution by chemical analysis to problems
of origin and distribution, Annual of the British School at Athens, 78, 235–63.Molera, J., Pradell T., Salvado N., and Vendrell-Saz, M., 1999, Evidence of tin oxide recrystallization in opacified lead
glazes, Journal of the American Ceramic Society, 82(10), 2871–5.Padilla, R., Schalm, O., Janssens, K., Arrazcaeta, R., and Van Espen, P., 2005, Microanalytical characterization of surface
decoration in Majolica pottery, Analytica Chimica Acta, 535, 201–11.Papadopoulou, D. N., Zachariadis, G. A., Anthemidis, A. N., Tsirliganis, N. C., and Stratis, J. A., 2006, Development and
optimisation of a portable micro-XRF method for in-situ multi-element analysis of ancient ceramics, Talanta, 68(5),1692–9.
Papanikola-Bakirtzis, D., 1996, Medieval glazed pottery from Cyprus. The workshops of Paphos and Lapithos, LeventisFoundation, Thessaloniki.
Papanikola-Bakirtzis, D., 1999, Byzantine glazed ceramics. The sgraffito technique, Athens.Prokopiou, E., 1997, Limassol. Zik-Zak road. Results report of saving research excavation of 1993, Report of Department
of Antiquities of Cyprus, 285–322.Rice, P. M. 1987, Pottery analysis, University of Chicago Press, Chicago.Schwedt, A., Mommsen, H., Zacharias, N., and Buxedai Garrigos, J., 2006, Analcime crystallization and compositional
profiles-comparing approaches to detect post-depositional alterations in archaeological pottery, Archaeometry, 48(2),237–51.
Tite, M. S., Freestone, I., Mason, R., Molera, J., Vendrell-Saz, M., and Wood, N., 1998, Lead glazes in antiquity –methods of production and reasons for use, Archaeometry, 40, 241–60.
Cypriot Byzantine glazed pottery 643
© University of Oxford, 2009, Archaeometry 52, 4 (2010) 628–643


