Embed Size (px)
Citation preview
Citation: Chukanov, N.V.; Shendrik,
R.Y.; Vigasina, M.F.; Pekov, I.V.;
Sapozhnikov, A.N.; Shcherbakov,
V.D.; Varlamov, D.A. Crystal
Chemistry, Isomorphism, and
Thermal Conversions of
Extra-Framework Components in
Sodalite-Group Minerals. Minerals
2022, 12, 887. https://doi.org/
10.3390/min12070887
Academic Editor: Luca Bindi
Received: 27 June 2022
Accepted: 12 July 2022
Published: 14 July 2022
Publisher’s Note: MDPI stays neutral
with regard to jurisdictional claims in
published maps and institutional affil-
iations.
Copyright: © 2022 by the authors.
Licensee MDPI, Basel, Switzerland.
This article is an open access article
distributed under the terms and
conditions of the Creative Commons
Attribution (CC BY) license (https://
creativecommons.org/licenses/by/
4.0/).
minerals
Article
Crystal Chemistry, Isomorphism, and Thermal Conversions ofExtra-Framework Components in Sodalite-Group MineralsNikita V. Chukanov 1,2,*, Roman Yu. Shendrik 3 , Marina F. Vigasina 2 , Igor V. Pekov 2,4,Anatoly N. Sapozhnikov 3, Vasily D. Shcherbakov 2 and Dmitry A. Varlamov 1,5
1 Institute of Problems of Chemical Physics, Russian Academy of Sciences, Chernogolovka,142432 Moscow, Russia; [email protected]
2 Faculty of Geology, Moscow State University, 119991 Moscow, Russia; [email protected] (M.F.V.);[email protected] (I.V.P.); [email protected] (V.D.S.)
3 Vinogradov Institute of Geochemistry, Siberian Branch of Russian Academy of Sciences,664033 Irkutsk, Russia; [email protected] (R.Y.S.); [email protected] (A.N.S.)
4 Vernadsky Institute of Geochemistry and Analytical Chemistry, Russian Academy of Sciences,119991 Moscow, Russia
5 Institute of Experimental Mineralogy RAS, Chernogolovka, 142432 Moscow, Russia* Correspondence: [email protected]
Abstract: Isomorphic substitutions of extra-framework components in sodalite-group aluminosilicateminerals and their thermal conversions have been investigated using infrared, Raman, electronspin resonance (ESR), as well as ultraviolet, visible and near infrared (UV–Vis–near IR) absorptionspectroscopy methods and involving chemical and X-ray diffraction data. Sodalite-related mineralsfrom gem lazurite deposits (haüyne, lazurite, and slyudyankaite) are characterized by wide variationsin S-bearing extra-framework components including SO4
2− and various polysulfide groups (S2•−,
S3•−, S4
•− radical anions, and S4 and S6 neutral molecules) as well as the presence of CO2 molecules.Heating at 700 ◦C under reducing conditions results in the transformation of initial S-bearing groupsSO4
2− and S3•− to a mixture of S2−, HS−, S2
•−, and S4•− and transformation of CO2 to a mixture
of CO32− and C2O4
2− or HC2O4− anionic groups. Further heating at 800 ◦C in air results in the
decomposition of carbonate and oxalate groups, restoration of the SO42− and S3
•− groups, and asharp transformation of the framework. The HS− anion is stable only under reducing conditions,whereas the S3
•− radical anion is the most stable polysulfide group. The HS−-dominant sodalite-group mineral sapozhnikovite forms a wide solid-solution series with sodalite. The conditionsrequired for the formation of HS−- and CO2
0-bearing sodalite-group minerals are discussed.
Keywords: sodalite group; isomorphism; solid solutions; infrared spectroscopy; electron (UV-Vis)spectroscopy; Raman spectroscopy; electron spin resonance; photoluminescence
1. Introduction
Minerals belonging to the sodalite group are microporous cubic or pseudo-cubicalumino- and beryllosilicates which occur in different kinds of alkaline magmatic andmetasomatic rocks. Some of them (sodalite, haüyne, and nosean) belong to importantrock-forming minerals.
The unit cell parameters of the “idealized sodalite (SOD-type) framework” depositedin the Database of Zeolite Structures are a = 8.9561 Å; V = 718.4 Å3; and space groupIm-3m (aristotype) [1,2]. However, due to different schemes of the Si/Al ordering as wellas specific features of the occupation of the intra-framework cavities (sodalite cages) byextra-framework components, the observed symmetry is usually lower. A distinctivefeature of sodalite-type compounds is a three-dimensional system of channels consisting ofsodalite cages and running along different directions. The extra-framework constituentsin sodalite-group minerals are more diverse than in the members of the related cancrinite
Minerals 2022, 12, 887. https://doi.org/10.3390/min12070887 https://www.mdpi.com/journal/minerals
Minerals 2022, 12, 887 2 of 31
group and include different cations (Na+, [N(CH3)4]+, Ca2+, Mn2+, Fe2+, and Zn2+), anions(Cl−, F−, OH−, HS−, S2−, and SO4
2−), radical anions (S3•−), and neutral molecules (H2O,
CO2, S6) as species-defining components. Some subordinate, admixed components (K+,H+, S2
•−, S4•−, SO4
•2−, S3, S4, MoO42−, WO4
2−, AsO43−, and COS) were identified in
sodalite-group minerals using a multianalytical approach involving different spectroscopicmethods [3–6].
To date, many dozens of chemically different microporous compounds with theSOD-type framework have been synthesized. Interest in such compounds is caused bytheir specific properties, which make it possible to consider them as advanced materialswith technologically important properties. The hydrothermal method was applied toobtain sodalite-type compounds with aluminosilicate frameworks as well as frameworkscontaining W-, Mo-, Ga-, Be-, Ge-, P-, or As-centered tetrahedra, with a wide varietyof extra-framework cations and anions [7]. Microporous compounds belonging to thetopological type of sodalite are advanced materials that can be used as pigments, sorbentsfor water purification and gas sorption, matrices for immobilization of radioactive isotopesand heavy metals, hydrogen and methane storage, superconductors, catalysts, membranesfor separation of gases and desalination of seawater, etc. [8–37].
This paper provides new data on the isomorphism of extra-framework components insome sodalite-group minerals as well as mechanisms for their thermal conversions.
2. Materials and Methods
The studied samples are listed below. Their empirical formulae are partly takenfrom literature sources. Chemical data for newly analyzed samples are given in Table 1.Samples 1–6 and 9 were collected at the Malo-Bystrinskoe gem lazurite deposit, BaikalLake area, Siberia, Russia.
Table 1. Chemical composition (wt.%) of haüyne from the Malo-Bystrinskoe gem lazurite deposit,Baikal Lake area, Siberia, Russia obtained in this work. Representative chemical analyses of sodalite–sapozhnikovite series minerals (Sample 12) from Karnasurt Mt., Lovozero massif, Kola Peninsula,Russia obtained in this work.
Sample No. 1 2
Color Bluish lilac Deep blue
Na2O 18.04 17.92
K2O 0.21 0.74
CaO 7.83 7.60
Al2O3 28.63 27.79
Fe2O3 0 0.19
SiO2 33.65 33.46
CO2a 0.67 0.25
SO3b 14.58 15.33
F 0.42 0
Cl 0.32 0.31
–O=Cl,F −0.25 −0.07
Total 104.10 103.52
Analysis No. 1 2 3 4 5 6 7 8
Contents, wt. %
Na2O 23.60 24.20 24.60 24.28 24.49 24.34 24.01 24.21

Minerals 2022, 12, 887 3 of 31
Table 1. Cont.
Sample No. 1 2
Al2O3 30.84 31.50 31.37 31.38 31.69 31.29 31.16 31.33
Fe2O3 0.36 - 0.27 - - 0.13 - -
SiO2 36.03 36.88 36.95 36.61 36.82 36.50 36.48 36.26
HS * 2.78 3.10 3.52 3.74 4.17 4.48 4.86 5.27
Cl 3.97 3.41 3.32 3.07 2.68 2.31 1.85 1.35
–O=(Cl,HS) –1.57 –1.52 –1.60 –1.59 –1.61 –1.60 –1.60 –1.58
Total 96.01 97.57 98.43 97.49 98.24 97.45 96.76 96.84
Formula Calculated on the Basis of Al + Fe + Si = 12 Atoms Per Formula Unit
Na 7.56 7.61 7.72 7.68 7.68 7.71 7.56 7.70
Al 6.00 6.02 5.99 6.03 6.04 6.02 6.02 6.05
Fe 0.04 - 0.03 - - 0.02 - -
Si 5.96 5.98 5.98 5.97 5.96 5.96 5.98 5.95
S 0.84 0.91 1.03 1.11 1.22 1.33 1.45 1.57
Cl 1.11 1.06 0.91 0.85 0.73 0.64 0.51 0.38
S + Cl 1.95 1.97 1.94 1.96 1.95 1.97 1.96 1.95a CO2 contents corresponding to CO2 molecules were determined from the IR spectra using a procedure describedin [3]; b All sulfur is given as SO3, which results in high total sums for the samples bearing sulfide groups.* Recalculated from values for S measured by electron microprobe. Dash means Fe content below detection limit.Analyses are ordered by increase of the S: Cl ratio.
Sample 1 is bluish lilac S4-bearing haüyne. The mineral forms granular aggregate(4 cm across) embedded in calciphyre. The associated minerals are calcite, diopside,and pyrite. The charge-balanced empirical formula is (Table 1; the contents of CO2 andHS− were estimated from the IR spectrum; for the identification of H2S and S4, see below):Na6.24Ca1.49K0.05(Si5.99Al6.01O24)(SO4)1.50(H2S)0.075(S4)0.09Cl0.10F0.24(CO2)0.16·nH2O (Z = 1).
Sample 2 is deep blue haüyne. It forms single-crystal grains up to 1 cm across inassociation with calcite, phlogopite, and accessory sphalerite, Zn-bearing spinel, andgrossular. The empirical formula of Sample 2 is (Table 1): Na6.28Ca1.47K0.17(Si6.05Al5.92Fe0.03O24)(SO4
2−)1.68 S00.40Cl0.06(CO2)0.06·nH2O, where S0 is all sulfide sulfur provided
that it occurs in neutral molecules.Sample 3 is lilac haüyne forming a rim around light gray fine-grained aggregates of
earlier silicates up to 2 cm across. The associated minerals are lazurite, sodalite, diopside,and calcite. The empirical formula is Na6.39K0.06Ca1.57(Si6.08Al5.92O24)(SO4)1.78(S4)0.03(S2−)0.02Cl0.07(CO2)0.15·nH2O (Z = 1) [4]. The mineral is cubic, with the unit cell param-eter a = 9.076 Å.
Sample 4 is light blue SO3•−-bearing haüyne with the empirical formula Na6.45K0.03
Ca1.35(Si6.07Al5.93O24)(SO4)1.35(SO3•−)1.35S2
•−0.02Cl0.16(CO2)0.02·nH2O (Z = 1) [4]. The unit
cell parameter is a = 9.067 Å. The mineral forms grains up to 5 mm in calciphyre, inassociation with pyrite.
Sample 5 is bright blue haüyne with the empirical formula Na6.45K0.01Ca1.36(Si6.06Al5.94O24)(SO4)1.58S0
0.43Cl0.09(CO2)0.02·nH2O, where S0 is all sulfide sulfur provided that it occursin neutral molecules. The unit cell parameter is a = 9.071 Å. The mineral forms grains incoarse-grained calciphyre consisting mainly of calcite, with subordinate diopside.
Sample 6 is the holotype specimen of slyudyankaite Na28Ca4(Si24Al24O96)(SO4)6(S6)1/3(CO2)·2H2O [38]. The mineral is triclinic, space group: P1, a = 9.0523 (4) Å, b = 12.8806 (6) Å,c = 25.681 (1) Å, α = 89.988(2)◦, β = 90.052(1)◦, γ = 90.221(1)◦, and V = 2994.4 (2) Å3. The em-pirical formula is Na27.57Ca4.05K0.11(Si24.52Al23.48O96)(SO4)6.06S0
2.42Cl0.12(CO2)1.43·2.21H2O(Z = 1), where S0
2.42 is total sulfide sulfur, mainly occurring as S6 and subordinate S4 neutral

Minerals 2022, 12, 887 4 of 31
molecules, according to the structural data. The color of slyudyankaite is nonuniform: fromblue-green in the major part of grains to pink and yellow in thin peripheral zones. Themineral forms isolated anhedral equant grains up to 0.5 cm across. The associated mineralsare diopside, calcite, fluorapatite, phlogopite, lazurite, and pyrite.
Sample 7 is gray nosean forming crystals up to 0.5 cm across and elongate twins on(111) up to 1 cm long in cavities of nosean sanidinite. The sample originates from theIn den Dellen (Zieglowski) pumice quarry, 1.5 km NE of Mendig, Laach Lake (LaacherSee) paleovolcano, Eifel region, Rhineland-Palatinate, Germany. The associated miner-als are sanidine, augite, annite, and zircon. The empirical formula of Sample 7 is [3]:(H3O)xNa5.72K0.64Ca0.33(Si6.43Al5.51Fe0.06O24)(SO4)1.21Cl0.11F0.09(CO2)0.11·nH2O (Z = 1).
Sample 8 is the holotype specimen of sapozhnikovite Na8(Al6Si6O24)(HS)2 from ahydrothermally altered urtite-like rock at Karnasurt Mountain, Lovozero alkaline massif,Kola Peninsula, Russia [39]. The mineral forms isolated colourless to pale grayish anhedralequant grains up to 0.5 cm across. The empirical formula is Na7.73Al6.08Si5.97O24(HS)1.25Cl0.60·0.16H2O (Z = 1). Sapozhnikovite is cubic, P43n, with a = 8.91462(7) Å.
Sample 9 is the neotype specimen of lazurite with the empirical formula (Na6.97Ca0.88K0.10)7.96(Si6.04Al5.96O24)(SO4)1.09(S3
•−)0.55S2−0.05Cl0.04·0.72H2O [5]. The associated min-
erals are calcite and diopside as well as accessory dolomite, forsterite, and phlogopite.The crystal structure of Sample 9 is characterized by commensurate and incommensuratemodulations; the a parameter of the cubic sub-cell is equal to 9.087(3) Å.
Sample 10 is the holotype specimen of the recently IMA-approved new F-dominantsodalite-group mineral bolotinaite (IMA 2021-088). The mineral occurs as isolated yellowelongate interpenetration twins up to 1 mm long in cavities of a volcanic ejectum oftrachitoid sanidinite collected in the In den Dellen pumice quarry, Eifel region, Rhineland-Palatinate, Germany. The associated minerals are sanidine, nepheline, annite, and zircon.The empirical formula of Sample 10 is (Na5.92K0.82Ca0.10H0.08)(Si6.33Al5.67O24)(SO4)0.17F0.84Cl0.16(CO2)0.38·3.96H2O.
Sample 11 is blue sodalite forming grains up to 3 cm across in a cancrinite-sodalitepegmatite uncovered at the western slope of Mount Kobelikha, Vishnevye Gory, Vish-nevogorskiy syenite-miaskite complex, South Urals, Russia. The associated minerals arepotassic feldspar, cancrinite, annite, muscovite, different zeolites, as well as accessoryzircon, thorite, ilmenite, columbite-(Fe), Nb-bearing rutile, a pyrochlore-group mineral,various sulfides, etc. The composition of Sample 10 is close to the end-member formulaNa8(Si6Al6O24)Cl2 [3].
Sample 12 was collected from the same area as sapozhnikovite (Sample 8), north slopeof Karnasurt Mountain located in the northern part of the Lovozero alkaline massif. Thissample includes several similar but not identical to each other pieces of hydrothermallyaltered highly agpaitic urtite-like rocks containing rock-forming minerals of the sodalite–sapozhnikovite solid-solution series. Their share in a rock varies from 5 to 20 vol.%. Otherrock-forming minerals are nepheline (the major constituent: >60 vol.%), aegirine, albite,potassic feldspar, natrolite, and kyanoxalite in different proportions; accessory minerals aremurmanite (sometimes with lomonosovite relics), fluorapatite, and loparite-(Ce). Sodalite–sapozhnikovite series minerals form white or colourless, with strong orange fluorescencein longwave UV light (λ = 330 nm), grains up to 1 cm across. The representative chemicalcompositions of these minerals are given in Table 1.
Chemical analyses of haüyne Samples 1 and 2 (Table 1) were carried out using a TescanVEGA-II XMU INCA Energy 450 (TESCAN, Brno, Czech Republic) (EDS mode, 20 kV,120–150 pA, beam size 120 nm, excitation zone < 5 µm). The following standards were used:CaF2 for F, albite for Na, synthetic Al2O3 for Al, wollastonite for Ca, potassium feldspar forK, SiO2 for Si, Fe metal for Fe, and FeS2 for S. Chemical analyses of sodalite–sapozhnikoviteseries minerals (Sample 12, Table 1) were carried out using a Jeol JSM-6480LV scanningelectron microscope equipped with an INCA-Wave 500 wavelength-dispersive spectrometer(Laboratory of Analytical Techniques of High Spatial Resolution, Department of Petrology,Geological Faculty, Moscow State University), with an acceleration voltage of 20 kV, a beam
Minerals 2022, 12, 887 5 of 31
current of 10 nA, and a 10 µm beam diameter. The standards used are as follows: jadeitefor Na, Al and Si, FeS2 for Fe, ZnS for S, and NaCl for Cl. Contents of other elements withatomic numbers >6 are below detection limits.
Additionally, chemical compositions of 55 samples of minerals belonging to thesodalite–sapozhnikovite solution series were investigated.
The diffuse absorption spectra in the near infrared, visible, and ultraviolet (NIR/Vis/UV)ranges were measured at room temperature using a Lambda 950 spectrophotometer (Perkin-Elmer, Shelton, CT, USA). In particular, the absorption spectra of platelets of Sample 1 (about1 mm thick) were measured in the transmission mode through a circular diaphragm 0.8 mmin diameter. The spectra were measured in an integrating sphere at room temperature. Todo this, small crystals of the studied mineral were placed in a quartz test tube, transparentin the region of 250–2000 nm, and the test tube was placed in an integrating sphere.
The ESR spectra were measured with a RE-1306 X-band spectrometer (KBST, Smolensk,Russia) with a frequency of 9.3841 GHz at room temperature and 9.1841 GHz at 77 K.For low-temperature measurements, a quartz ampoule with the sample was placed in aflooded cryostat.
Heating of Samples 3 and 4 was carried out according to the following scheme. Thesamples were placed in a muffle furnace in air and sequentially heated every 50 ◦C for10 min. After holding at each of the temperatures, ESR and NIR/Vis/UV diffuse absorptionspectra were measured.
Thermal conversions of other studied samples were carried out in two stages. In thefirst stage, the samples were heated for three days at 700 ◦C in reducing atmosphere (overthe Fe-FeS buffer). Thereafter, parts of the preheated samples were annealed at 800 ◦C inair for 24–36 h.
The powder X-ray diffraction study was carried out at room temperature with anautomatic powder diffractometer (D8 ADVANCE, Bruker, Germany) equipped with aGöbel mirror. The powder X-ray diffraction patterns were obtained in step scan mode(in the 2θ range of 10 to 80◦) using CuKα radiation at an accelerating voltage of 40 kV,with a current of 40 mA, time per step of 1 s, and a 2θ step of 0.02◦. Calculations ofinterplanar distances were performed using the software that was delivered with thediffractometer (DIFFRAC Plus Evaluation package EVA, Bruker AXS, Bruker, Germany).Unit cell parameters were refined using the (440), (611), (622), and (721) reflections.
3. Results3.1. Isomorphism of Extra-Framework Components in Cubic Sodalite-Group Minerals
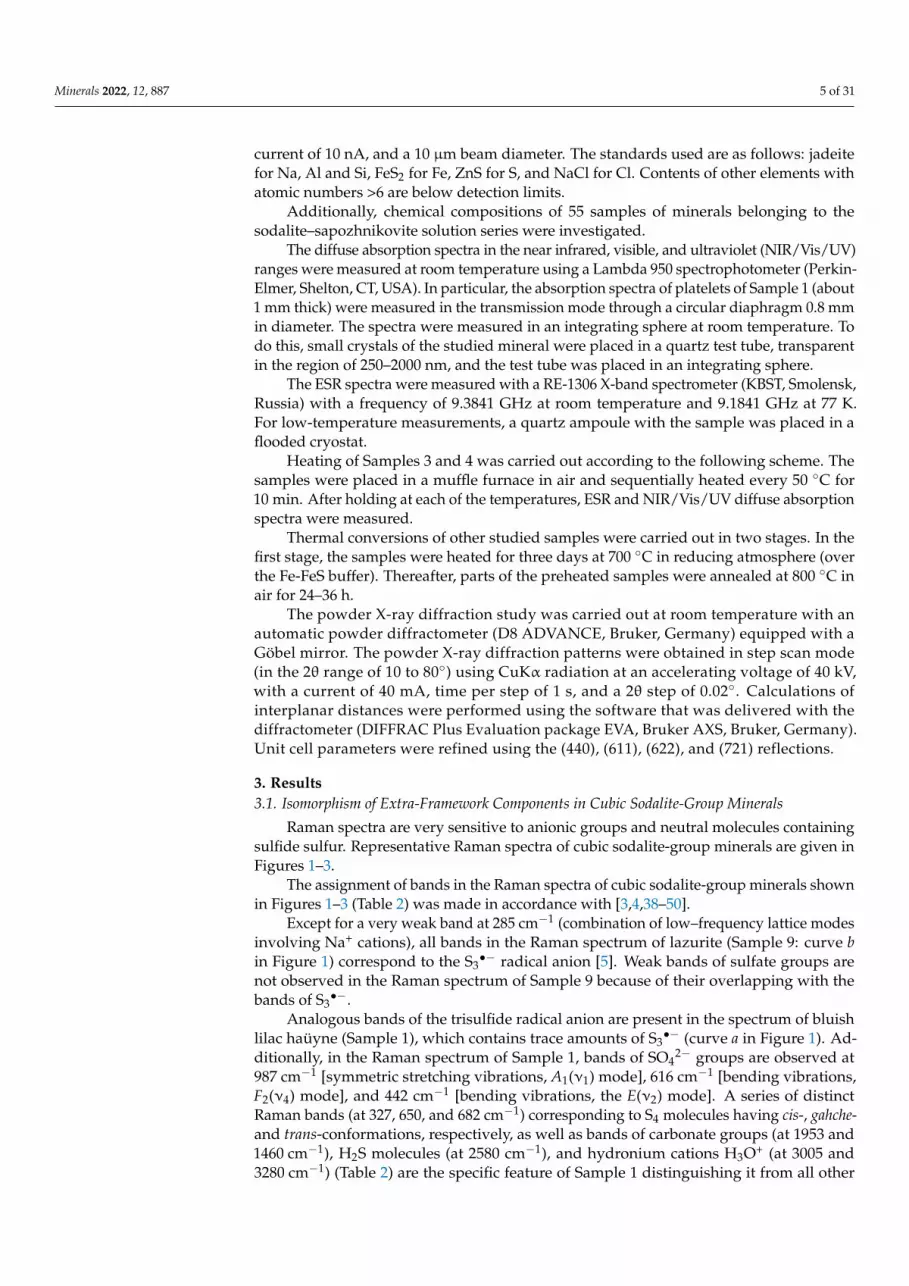
Raman spectra are very sensitive to anionic groups and neutral molecules containingsulfide sulfur. Representative Raman spectra of cubic sodalite-group minerals are given inFigures 1–3.
The assignment of bands in the Raman spectra of cubic sodalite-group minerals shownin Figures 1–3 (Table 2) was made in accordance with [3,4,38–50].
Except for a very weak band at 285 cm−1 (combination of low–frequency lattice modesinvolving Na+ cations), all bands in the Raman spectrum of lazurite (Sample 9: curve bin Figure 1) correspond to the S3
•− radical anion [5]. Weak bands of sulfate groups arenot observed in the Raman spectrum of Sample 9 because of their overlapping with thebands of S3
•−.Analogous bands of the trisulfide radical anion are present in the spectrum of bluish
lilac haüyne (Sample 1), which contains trace amounts of S3•− (curve a in Figure 1). Ad-
ditionally, in the Raman spectrum of Sample 1, bands of SO42− groups are observed at
987 cm−1 [symmetric stretching vibrations, A1(ν1) mode], 616 cm−1 [bending vibrations,F2(ν4) mode], and 442 cm−1 [bending vibrations, the E(ν2) mode]. A series of distinctRaman bands (at 327, 650, and 682 cm−1) corresponding to S4 molecules having cis-, gahche-and trans-conformations, respectively, as well as bands of carbonate groups (at 1953 and1460 cm−1), H2S molecules (at 2580 cm−1), and hydronium cations H3O+ (at 3005 and3280 cm−1) (Table 2) are the specific feature of Sample 1 distinguishing it from all other
Minerals 2022, 12, 887 6 of 31
haüyne samples studied in this work and elsewhere [1,2,48]. The presence of hydronium inSample 1 is in agreement with the deficit of extra-framework cations determined by theelectron microprobe analysis (Table 1).
Minerals 2022, 12, x FOR PEER REVIEW 5 of 31
The ESR spectra were measured with a RE-1306 X-band spectrometer (KBST, Smo-lensk, Russia) with a frequency of 9.3841 GHz at room temperature and 9.1841 GHz at 77 K. For low-temperature measurements, a quartz ampoule with the sample was placed in a flooded cryostat.
Heating of Samples 3 and 4 was carried out according to the following scheme. The samples were placed in a muffle furnace in air and sequentially heated every 50 °C for 10 min. After holding at each of the temperatures, ESR and NIR/Vis/UV diffuse absorption spectra were measured.
Thermal conversions of other studied samples were carried out in two stages. In the first stage, the samples were heated for three days at 700 C in reducing atmosphere (over the Fe-FeS buffer). Thereafter, parts of the preheated samples were annealed at 800 C in air for 24–36 h.
The powder X-ray diffraction study was carried out at room temperature with an automatic powder diffractometer (D8 ADVANCE, Bruker, Germany) equipped with a Göbel mirror. The powder X-ray diffraction patterns were obtained in step scan mode (in the 2θ range of 10 to 80°) using CuKα radiation at an accelerating voltage of 40 kV, with a current of 40 mA, time per step of 1 s, and a 2θ step of 0.02°. Calculations of interplanar distances were performed using the software that was delivered with the diffractometer (DIFFRAC Plus Evaluation package EVA, Bruker AXS, Bruker, Germany). Unit cell pa-rameters were refined using the (440), (611), (622), and (721) reflections.
3. Results 3.1. Isomorphism of Extra-Framework Components in Cubic Sodalite-Group Minerals
Raman spectra are very sensitive to anionic groups and neutral molecules contain-ing sulfide sulfur. Representative Raman spectra of cubic sodalite-group minerals are given in Figures 1–3.
Figure 1. Raman spectra of (a) S4-bearing haüyne (Sample 1) and (b) lazurite (Sample 9). Figure 1. Raman spectra of (a) S4-bearing haüyne (Sample 1) and (b) lazurite (Sample 9).
Minerals 2022, 12, x FOR PEER REVIEW 6 of 31
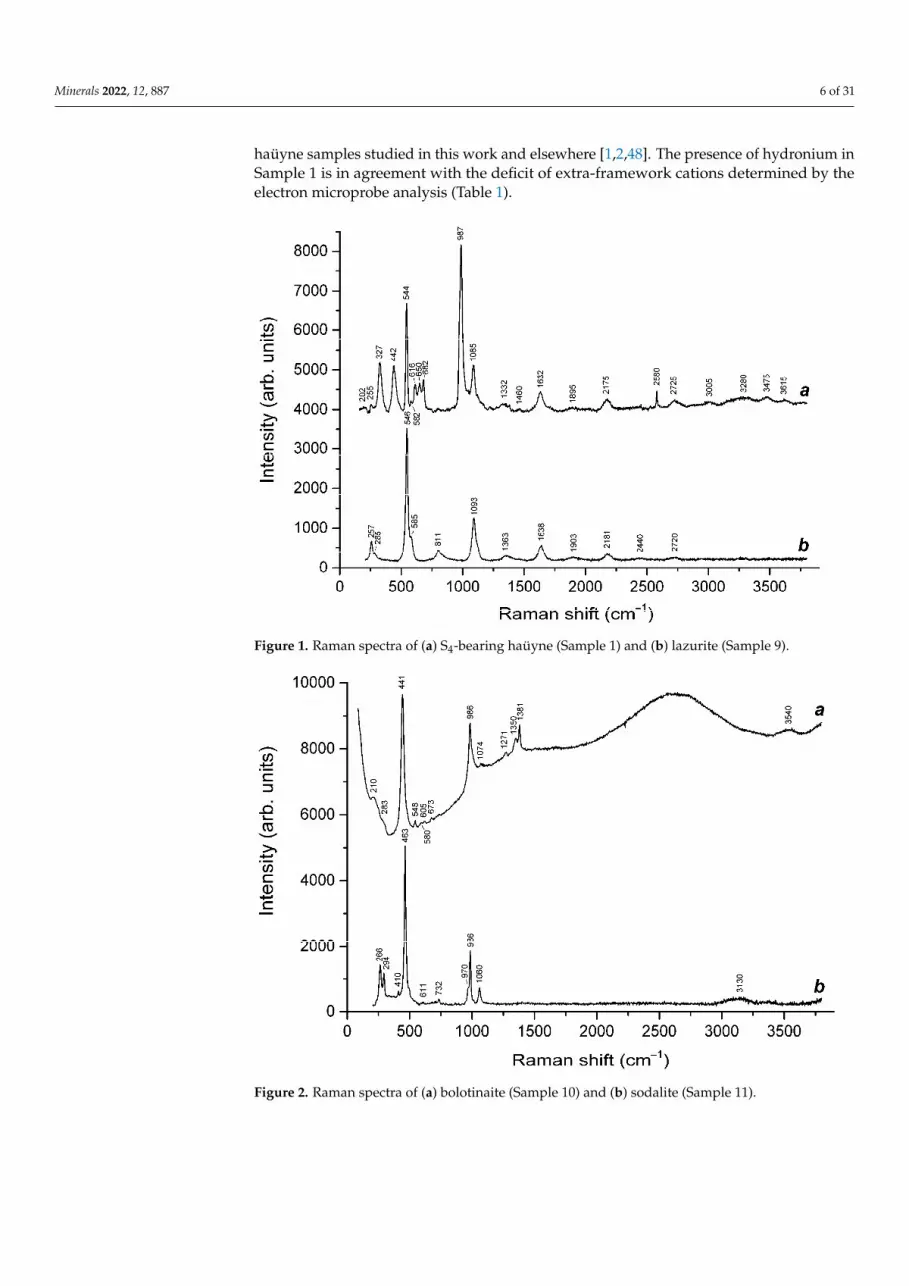
Figure 2. Raman spectra of (a) bolotinaite (Sample 10) and (b) sodalite (Sample 11).
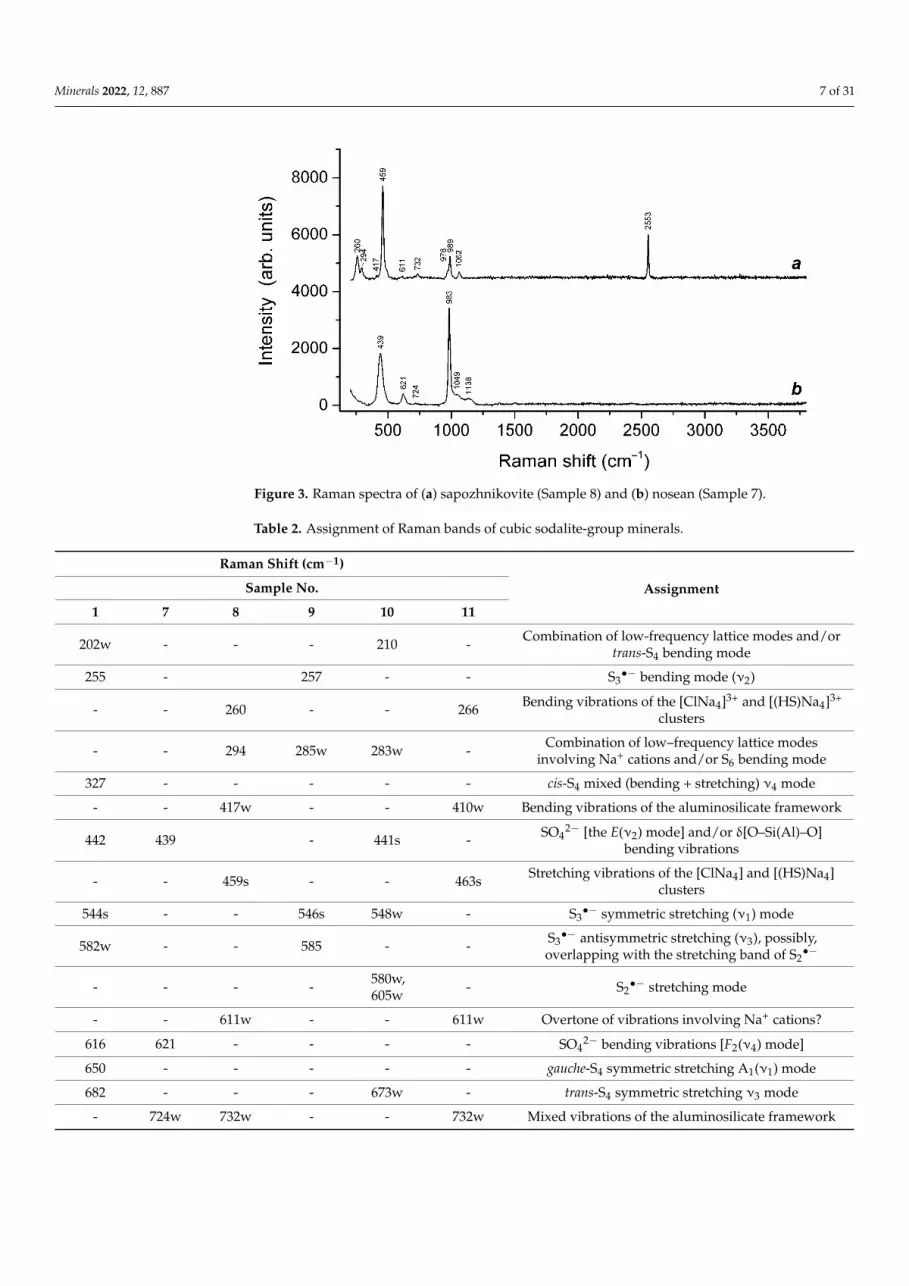
Figure 3. Raman spectra of (a) sapozhnikovite (Sample 8) and (b) nosean (Sample 7).
The assignment of bands in the Raman spectra of cubic sodalite-group minerals shown in Figures 1–3 (Table 2) was made in accordance with [3,4,38–50].
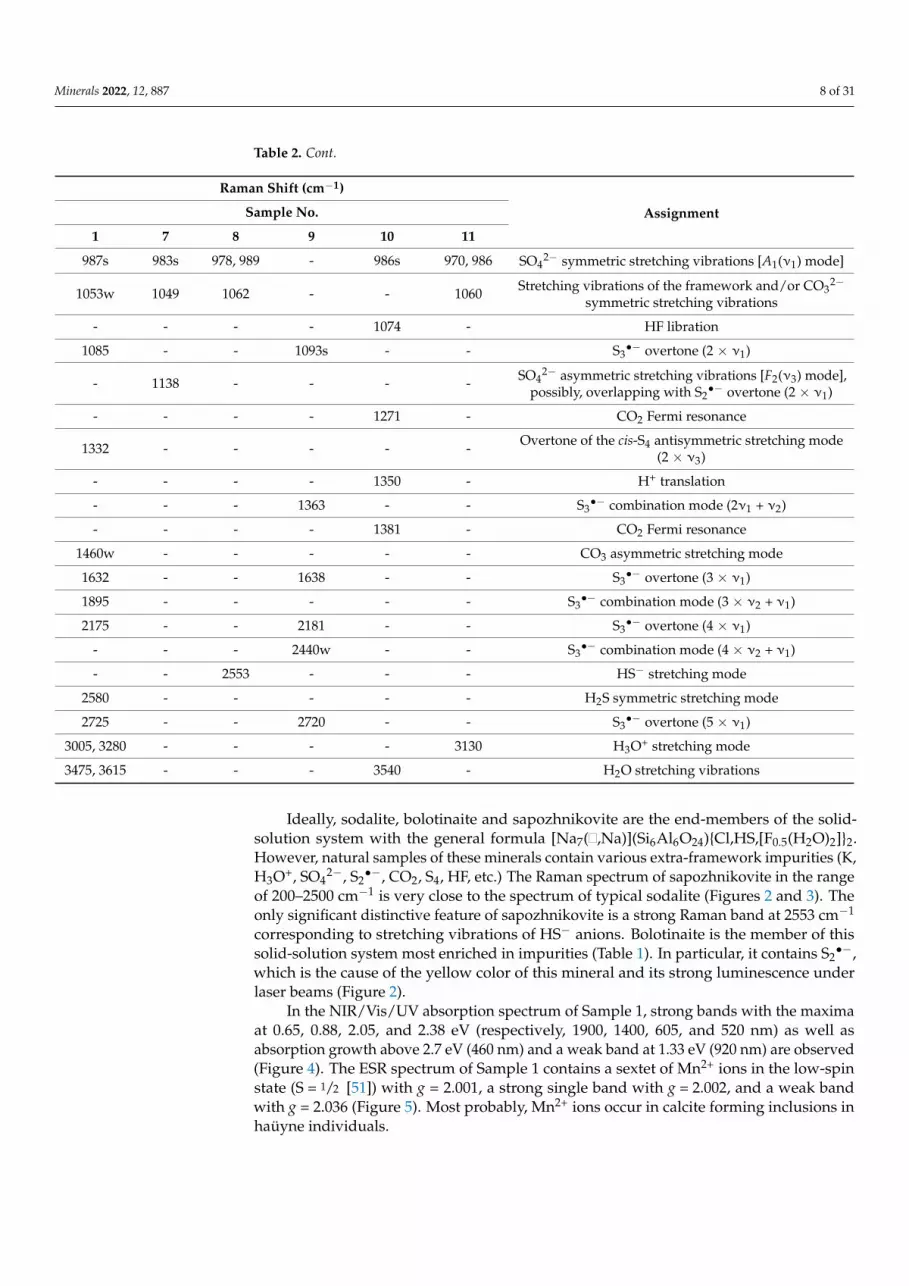
Table 2. Assignment of Raman bands of cubic sodalite-group minerals. Raman Shift (cm−1)
Assignment Sample No. 1 7 8 9 10 11
202w - - - 210 - Combination of low-frequency lattice modes and/or trans-S4 bending
mode 255 - 257 - - S3− bending mode (2)
- - 260 - - 266 Bending vibrations of the [ClNa4]3+ and [(HS)Na4]3+ clusters
- - 294 285w 283w - Combination of low–frequency lattice modes involving Na+ cations
and/or S6 bending mode
Figure 2. Raman spectra of (a) bolotinaite (Sample 10) and (b) sodalite (Sample 11).
Minerals 2022, 12, 887 7 of 31
Minerals 2022, 12, x FOR PEER REVIEW 6 of 31
Figure 2. Raman spectra of (a) bolotinaite (Sample 10) and (b) sodalite (Sample 11).
Figure 3. Raman spectra of (a) sapozhnikovite (Sample 8) and (b) nosean (Sample 7).
The assignment of bands in the Raman spectra of cubic sodalite-group minerals shown in Figures 1–3 (Table 2) was made in accordance with [3,4,38–50].
Table 2. Assignment of Raman bands of cubic sodalite-group minerals. Raman Shift (cm−1)
Assignment Sample No. 1 7 8 9 10 11
202w - - - 210 - Combination of low-frequency lattice modes and/or trans-S4 bending
mode 255 - 257 - - S3− bending mode (2)
- - 260 - - 266 Bending vibrations of the [ClNa4]3+ and [(HS)Na4]3+ clusters
- - 294 285w 283w - Combination of low–frequency lattice modes involving Na+ cations
and/or S6 bending mode
Figure 3. Raman spectra of (a) sapozhnikovite (Sample 8) and (b) nosean (Sample 7).
Table 2. Assignment of Raman bands of cubic sodalite-group minerals.
Raman Shift (cm−1)
AssignmentSample No.
1 7 8 9 10 11
202w - - - 210 - Combination of low-frequency lattice modes and/ortrans-S4 bending mode
255 - 257 - - S3•− bending mode (ν2)
- - 260 - - 266 Bending vibrations of the [ClNa4]3+ and [(HS)Na4]3+
clusters
- - 294 285w 283w - Combination of low–frequency lattice modesinvolving Na+ cations and/or S6 bending mode
327 - - - - - cis-S4 mixed (bending + stretching) ν4 mode
- - 417w - - 410w Bending vibrations of the aluminosilicate framework
442 439 - 441s - SO42− [the E(ν2) mode] and/or δ[O–Si(Al)–O]
bending vibrations
- - 459s - - 463s Stretching vibrations of the [ClNa4] and [(HS)Na4]clusters
544s - - 546s 548w - S3•− symmetric stretching (ν1) mode
582w - - 585 - - S3•− antisymmetric stretching (ν3), possibly,
overlapping with the stretching band of S2•−
- - - - 580w,605w - S2
•− stretching mode
- - 611w - - 611w Overtone of vibrations involving Na+ cations?
616 621 - - - - SO42− bending vibrations [F2(ν4) mode]
650 - - - - - gauche-S4 symmetric stretching A1(ν1) mode
682 - - - 673w - trans-S4 symmetric stretching ν3 mode
- 724w 732w - - 732w Mixed vibrations of the aluminosilicate framework
Minerals 2022, 12, 887 8 of 31
Table 2. Cont.
Raman Shift (cm−1)
AssignmentSample No.
1 7 8 9 10 11
987s 983s 978, 989 - 986s 970, 986 SO42− symmetric stretching vibrations [A1(ν1) mode]
1053w 1049 1062 - - 1060 Stretching vibrations of the framework and/or CO32−
symmetric stretching vibrations
- - - - 1074 - HF libration
1085 - - 1093s - - S3•− overtone (2 × ν1)
- 1138 - - - - SO42− asymmetric stretching vibrations [F2(ν3) mode],
possibly, overlapping with S2•− overtone (2 × ν1)
- - - - 1271 - CO2 Fermi resonance
1332 - - - - - Overtone of the cis-S4 antisymmetric stretching mode(2 × ν3)
- - - - 1350 - H+ translation
- - - 1363 - - S3•− combination mode (2ν1 + ν2)
- - - - 1381 - CO2 Fermi resonance
1460w - - - - - CO3 asymmetric stretching mode
1632 - - 1638 - - S3•− overtone (3 × ν1)
1895 - - - - - S3•− combination mode (3 × ν2 + ν1)
2175 - - 2181 - - S3•− overtone (4 × ν1)
- - - 2440w - - S3•− combination mode (4 × ν2 + ν1)
- - 2553 - - - HS− stretching mode
2580 - - - - - H2S symmetric stretching mode
2725 - - 2720 - - S3•− overtone (5 × ν1)
3005, 3280 - - - - 3130 H3O+ stretching mode
3475, 3615 - - - 3540 - H2O stretching vibrations
Ideally, sodalite, bolotinaite and sapozhnikovite are the end-members of the solid-solution system with the general formula [Na7(
Minerals 2022, 12, x FOR PEER REVIEW 8 of 31
Ideally, sodalite, bolotinaite and sapozhnikovite are the end-members of the sol-id-solution system with the general formula [Na7( ,Na)](Si6Al6O24){Cl,HS,[F0.5(H2O)2]}2. However, natural samples of these minerals contain various extra-framework impurities (K, H3O+, SO42−, S2−, CO2, S4, HF, etc.) The Raman spectrum of sapozhnikovite in the range of 200–2500 cm−1 is very close to the spectrum of typical sodalite (Figures 2 and 3). The only significant distinctive feature of sapozhnikovite is a strong Raman band at 2553 cm−1 corresponding to stretching vibrations of HS− anions. Bolotinaite is the member of this solid-solution system most enriched in impurities (Table 1). In particular, it contains S2−, which is the cause of the yellow color of this mineral and its strong luminescence under laser beams (Figure 2).
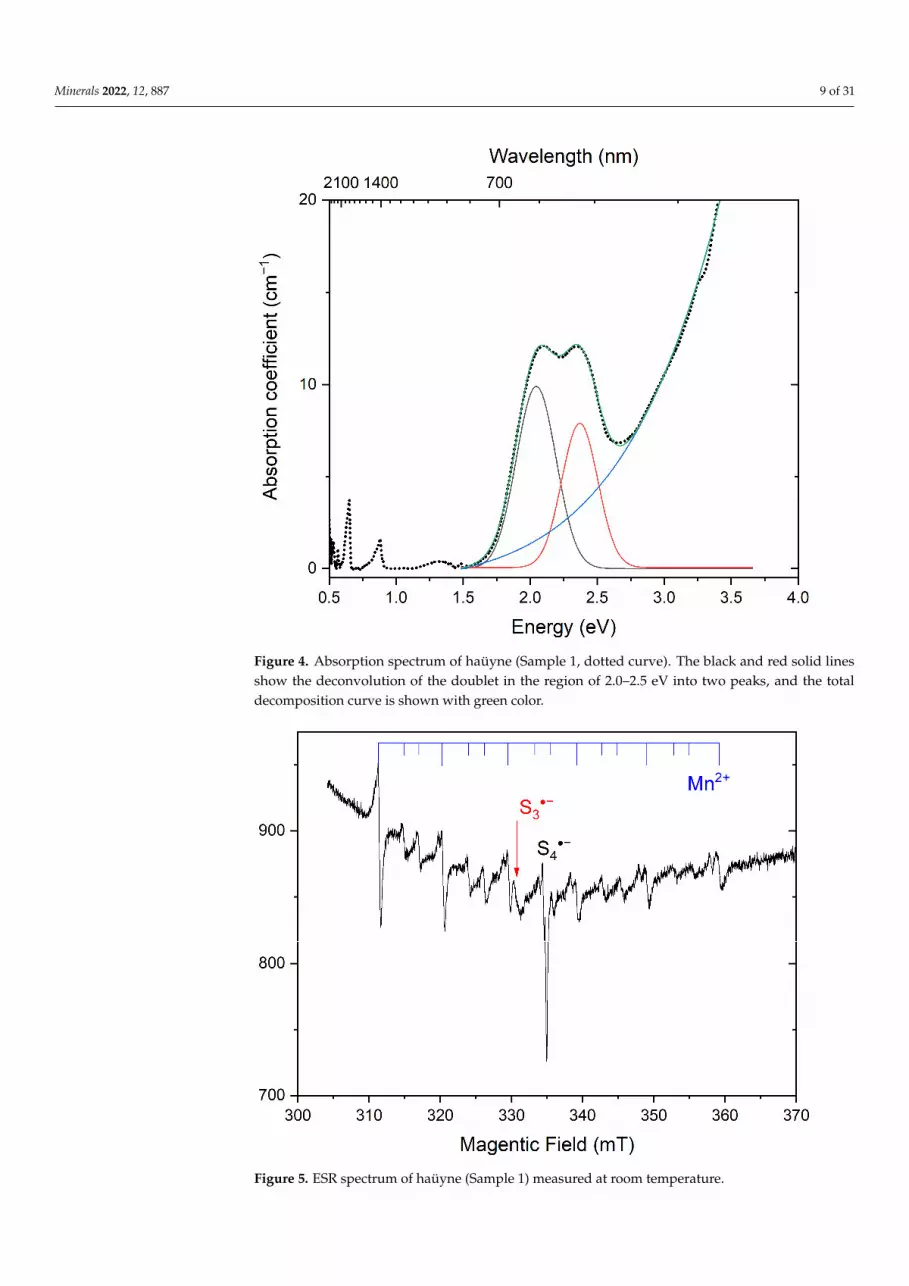
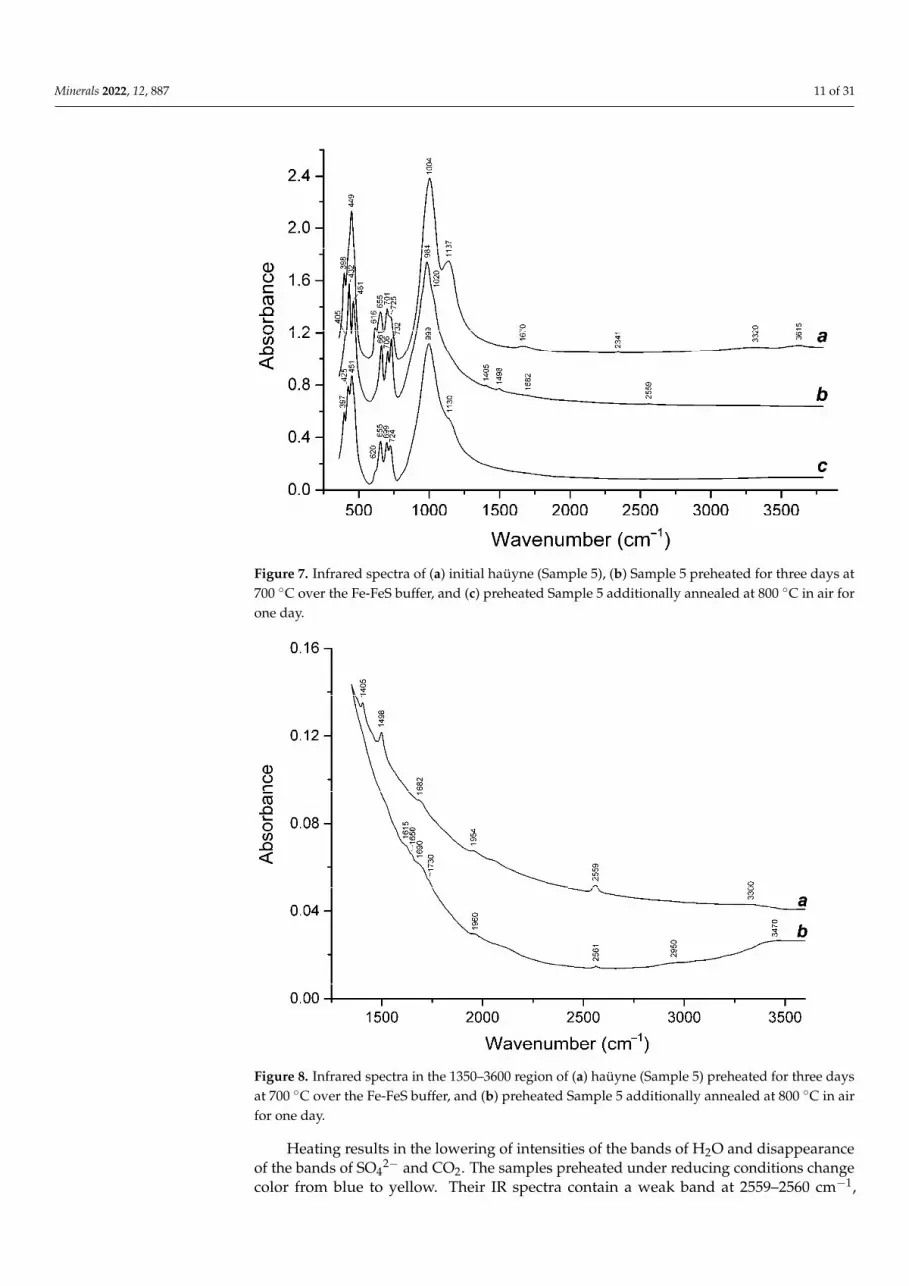
In the NIR/Vis/UV absorption spectrum of Sample 1, strong bands with the maxima at 0.65, 0.88, 2.05, and 2.38 eV (respectively, 1900, 1400, 605, and 520 nm) as well as ab-sorption growth above 2.7 eV (460 nm) and a weak band at 1.33 eV (920 nm) are observed (Figure 4). The ESR spectrum of Sample 1 contains a sextet of Mn2+ ions in the low-spin state (S = ½ [51]) with g = 2.001, a strong single band with g = 2.002, and a weak band with g = 2.036 (Figure 5). Most probably, Mn2+ ions occur in calcite forming inclusions in haüyne individuals.
Figure 4. Absorption spectrum of haüyne (Sample 1, dotted curve). The black and red solid lines show the deconvolution of the doublet in the region of 2.0–2.5 eV into two peaks, and the total decomposition curve is shown with green color.
,Na)](Si6Al6O24){Cl,HS,[F0.5(H2O)2]}2.However, natural samples of these minerals contain various extra-framework impurities (K,H3O+, SO4
2−, S2•−, CO2, S4, HF, etc.) The Raman spectrum of sapozhnikovite in the range
of 200–2500 cm−1 is very close to the spectrum of typical sodalite (Figures 2 and 3). Theonly significant distinctive feature of sapozhnikovite is a strong Raman band at 2553 cm−1
corresponding to stretching vibrations of HS− anions. Bolotinaite is the member of thissolid-solution system most enriched in impurities (Table 1). In particular, it contains S2
•−,which is the cause of the yellow color of this mineral and its strong luminescence underlaser beams (Figure 2).
In the NIR/Vis/UV absorption spectrum of Sample 1, strong bands with the maximaat 0.65, 0.88, 2.05, and 2.38 eV (respectively, 1900, 1400, 605, and 520 nm) as well asabsorption growth above 2.7 eV (460 nm) and a weak band at 1.33 eV (920 nm) are observed(Figure 4). The ESR spectrum of Sample 1 contains a sextet of Mn2+ ions in the low-spinstate (S = 1/2 [51]) with g = 2.001, a strong single band with g = 2.002, and a weak bandwith g = 2.036 (Figure 5). Most probably, Mn2+ ions occur in calcite forming inclusions inhaüyne individuals.
Minerals 2022, 12, 887 9 of 31
Minerals 2022, 12, x FOR PEER REVIEW 8 of 31
Ideally, sodalite, bolotinaite and sapozhnikovite are the end-members of the sol-id-solution system with the general formula [Na7( ,Na)](Si6Al6O24){Cl,HS,[F0.5(H2O)2]}2. However, natural samples of these minerals contain various extra-framework impurities (K, H3O+, SO42−, S2−, CO2, S4, HF, etc.) The Raman spectrum of sapozhnikovite in the range of 200–2500 cm−1 is very close to the spectrum of typical sodalite (Figures 2 and 3). The only significant distinctive feature of sapozhnikovite is a strong Raman band at 2553 cm−1 corresponding to stretching vibrations of HS− anions. Bolotinaite is the member of this solid-solution system most enriched in impurities (Table 1). In particular, it contains S2−, which is the cause of the yellow color of this mineral and its strong luminescence under laser beams (Figure 2).
In the NIR/Vis/UV absorption spectrum of Sample 1, strong bands with the maxima at 0.65, 0.88, 2.05, and 2.38 eV (respectively, 1900, 1400, 605, and 520 nm) as well as ab-sorption growth above 2.7 eV (460 nm) and a weak band at 1.33 eV (920 nm) are observed (Figure 4). The ESR spectrum of Sample 1 contains a sextet of Mn2+ ions in the low-spin state (S = ½ [51]) with g = 2.001, a strong single band with g = 2.002, and a weak band with g = 2.036 (Figure 5). Most probably, Mn2+ ions occur in calcite forming inclusions in haüyne individuals.
Figure 4. Absorption spectrum of haüyne (Sample 1, dotted curve). The black and red solid lines show the deconvolution of the doublet in the region of 2.0–2.5 eV into two peaks, and the total decomposition curve is shown with green color.
Figure 4. Absorption spectrum of haüyne (Sample 1, dotted curve). The black and red solid linesshow the deconvolution of the doublet in the region of 2.0–2.5 eV into two peaks, and the totaldecomposition curve is shown with green color.
Minerals 2022, 12, x FOR PEER REVIEW 9 of 31
Figure 5. ESR spectrum of haüyne (Sample 1) measured at room temperature.
The absorption bands with maxima at 0.65 and 0.88 eV are associated with the vi-brational modes of water in the studied mineral. The absorption bands with maxima at 2.05 and 2.38 eV, which impart a blue color to the studied mineral, can be associated with the presence of S3●− radical anions, which are easily detected by ESR [4,5], while the lilac hue can be associated with the presence of S4 molecules (red chromophore). In the sam-ples under study, the ESR signal characteristic of S3●− (with g = 2.036) is practically not observed, which indicates a very low concentration of S3●− radical anions in Sample 1. The absorption spectrum of S3●− radical anions is characterized by a plateau at about 1.77 eV. However, the shape of the absorption spectrum of Sample 1 differs from the characteris-tic absorption of S3●− of lazurite [4,5]. Thus, the absorption band at 2.05 eV is not related to S3●− radical anions. On the other hand, in a number of works [40,41,52,53] it is noted that absorption bands at 2.05 and 2.38 eV, as well as a much less intense band about 1.33 eV, can be attributed to the absorption of trans- and cis-conformers of the neutral S4 molecule. The authors of [40] calculated the oscillator strengths f for these conformals, which are equal to 0.07 and 0.047, respectively.
The observed intense ESR signal with a g-factor of 2.002 can be attributed to the presence of some amount of O●− radical anions (Figure 5). Previously, blue sodalite, in which a similar ESR signal and absorption spectrum were observed, was studied in [54,55], but the nature of the color of the mineral was not fully elucidated in this work.
When this sample is heated above a temperature of 500 C, the studied sodalite loses its color. Along with this, an absorption band appears at 3.1 eV (400 nm) upon excitation, in which intense luminescence is observed with a maximum at 1.9 eV (650 nm). Such luminescence is characteristic of S2●− radical anions [4].
3.2. Crystal Chemistry, Isomorphism, and Thermal Conversions of Haüyne The IR spectra of initial and heated haüyne (Samples 2 and 5) are given in Figures
6–8. The spectra of initial samples contain bands of O–H stretching and bending vibra-tions of H2O molecules (in the ranges of 3300–3700 and 1640–1670 cm−1, respectively), antisymmetric vibrations of the CO2 molecules (at 2341 cm−1), asymmetric stretching
Figure 5. ESR spectrum of haüyne (Sample 1) measured at room temperature.

Minerals 2022, 12, 887 10 of 31
The absorption bands with maxima at 0.65 and 0.88 eV are associated with the vi-brational modes of water in the studied mineral. The absorption bands with maximaat 2.05 and 2.38 eV, which impart a blue color to the studied mineral, can be associatedwith the presence of S3
•− radical anions, which are easily detected by ESR [4,5], while thelilac hue can be associated with the presence of S4 molecules (red chromophore). In thesamples under study, the ESR signal characteristic of S3
•− (with g = 2.036) is practically notobserved, which indicates a very low concentration of S3
•− radical anions in Sample 1. Theabsorption spectrum of S3
•− radical anions is characterized by a plateau at about 1.77 eV.However, the shape of the absorption spectrum of Sample 1 differs from the characteristicabsorption of S3
•− of lazurite [4,5]. Thus, the absorption band at 2.05 eV is not related toS3•− radical anions. On the other hand, in a number of works [40,41,52,53] it is noted that
absorption bands at 2.05 and 2.38 eV, as well as a much less intense band about 1.33 eV, canbe attributed to the absorption of trans- and cis-conformers of the neutral S4 molecule. Theauthors of [40] calculated the oscillator strengths f for these conformals, which are equal to0.07 and 0.047, respectively.
The observed intense ESR signal with a g-factor of 2.002 can be attributed to thepresence of some amount of O•− radical anions (Figure 5). Previously, blue sodalite, inwhich a similar ESR signal and absorption spectrum were observed, was studied in [54,55],but the nature of the color of the mineral was not fully elucidated in this work.
When this sample is heated above a temperature of 500 ◦C, the studied sodalite losesits color. Along with this, an absorption band appears at 3.1 eV (400 nm) upon excitation,in which intense luminescence is observed with a maximum at 1.9 eV (650 nm). Suchluminescence is characteristic of S2
•− radical anions [4].
3.2. Crystal Chemistry, Isomorphism, and Thermal Conversions of Haüyne
The IR spectra of initial and heated haüyne (Samples 2 and 5) are given in Figures 6–8.The spectra of initial samples contain bands of O–H stretching and bending vibrations ofH2O molecules (in the ranges of 3300–3700 and 1640–1670 cm−1, respectively), antisym-metric vibrations of the CO2 molecules (at 2341 cm−1), asymmetric stretching [F2(ν3) mode1135–1137 cm−1] and bending [F2(ν4) mode, 616 cm−1] vibrations of the SO4 tetrahedra,as well as stretching (1002–1004 cm−1), O–(Si,Al)–O (650–730 cm−1), and Si–O–Al (in therange of 390–450 cm−1) modes of the aluminosilicate framework.
Minerals 2022, 12, x FOR PEER REVIEW 10 of 31
[F2(ν3) mode 1135–1137 cm−1] and bending [F2(ν4) mode, 616 cm−1] vibrations of the SO4 tetrahedra, as well as stretching (1002–1004 cm−1), O–(Si,Al)–O (650–730 cm−1), and Si–O–Al (in the range of 390–450 cm−1) modes of the aluminosilicate framework.
Figure 6. Infrared spectra of (a) initial haüyne (Sample 2), (b) Sample 2 preheated for three days at 700 C, over the Fe-FeS buffer, and (c) preheated Sample 2 additionally annealed at 800 C in air for one day.
Figure 7. Infrared spectra of (a) initial haüyne (Sample 5), (b) Sample 5 preheated for three days at 700 C over the Fe-FeS buffer, and (c) preheated Sample 5 additionally annealed at 800 C in air for one day.
Figure 6. Infrared spectra of (a) initial haüyne (Sample 2), (b) Sample 2 preheated for three days at 700 ◦C,over the Fe-FeS buffer, and (c) preheated Sample 2 additionally annealed at 800 ◦C in air for one day.
Minerals 2022, 12, 887 11 of 31
Minerals 2022, 12, x FOR PEER REVIEW 10 of 31
[F2(ν3) mode 1135–1137 cm−1] and bending [F2(ν4) mode, 616 cm−1] vibrations of the SO4 tetrahedra, as well as stretching (1002–1004 cm−1), O–(Si,Al)–O (650–730 cm−1), and Si–O–Al (in the range of 390–450 cm−1) modes of the aluminosilicate framework.
Figure 6. Infrared spectra of (a) initial haüyne (Sample 2), (b) Sample 2 preheated for three days at 700 C, over the Fe-FeS buffer, and (c) preheated Sample 2 additionally annealed at 800 C in air for one day.
Figure 7. Infrared spectra of (a) initial haüyne (Sample 5), (b) Sample 5 preheated for three days at 700 C over the Fe-FeS buffer, and (c) preheated Sample 5 additionally annealed at 800 C in air for one day.
Figure 7. Infrared spectra of (a) initial haüyne (Sample 5), (b) Sample 5 preheated for three days at700 ◦C over the Fe-FeS buffer, and (c) preheated Sample 5 additionally annealed at 800 ◦C in air forone day.
Minerals 2022, 12, x FOR PEER REVIEW 11 of 31
Figure 8. Infrared spectra in the 1350–3600 region of (a) haüyne (Sample 5) preheated for three days at 700 C over the Fe-FeS buffer, and (b) preheated Sample 5 additionally annealed at 800 C in air for one day.
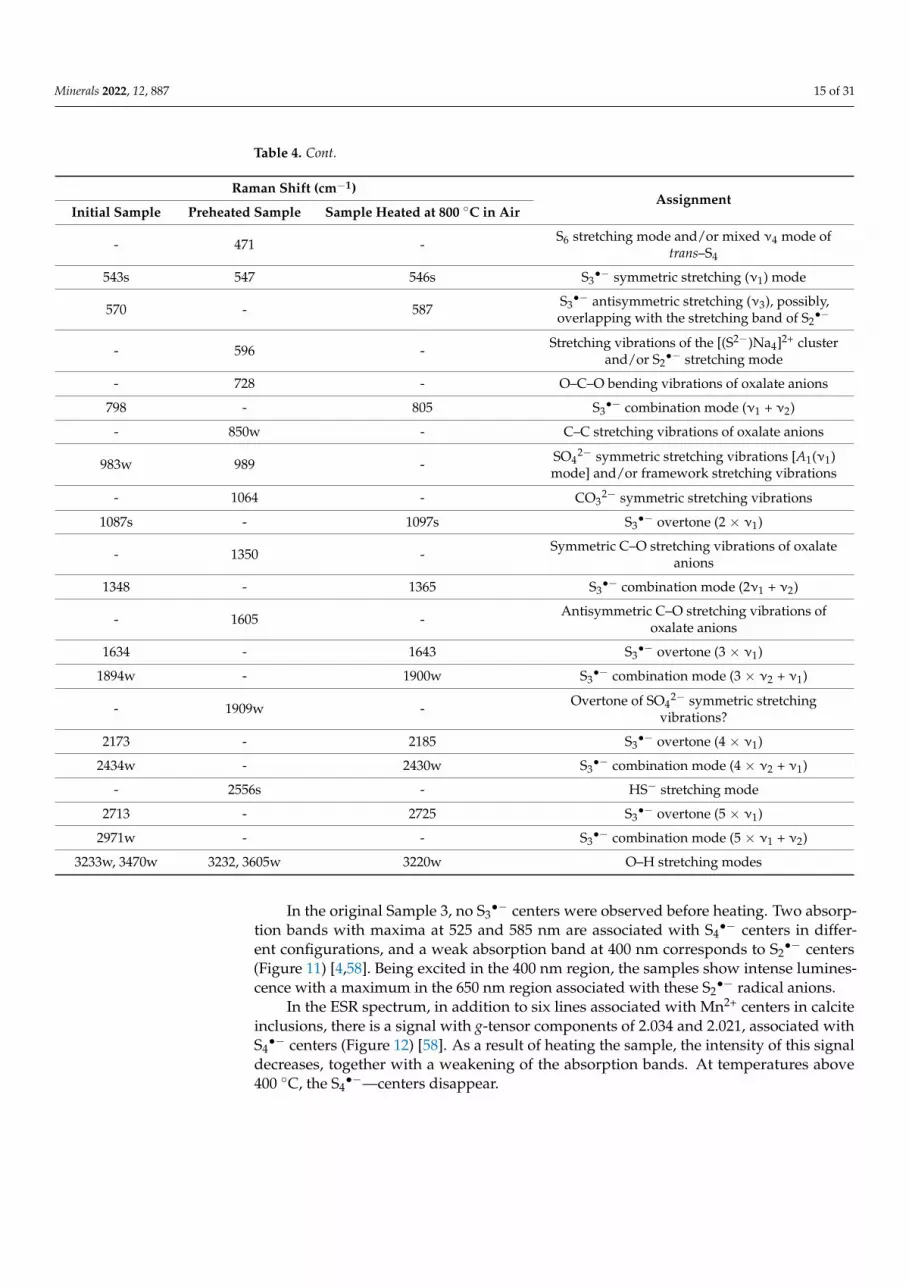
Heating results in the lowering of intensities of the bands of H2O and disappearance of the bands of SO42− and CO2. The samples preheated under reducing conditions change color from blue to yellow. Their IR spectra contain a weak band at 2559–2560 cm−1, which is due to stretching vibrations of the HS− anion [39]. The weak bands at 1405–1411 and 1498 cm−1 in the IR spectra of the preheated samples correspond to asymmetric stretching vibrations of carbonate groups required for the charge compensation. The weak band at 1954 cm−1 (curve a in Figure 8) is an overtone of stretching vibrations of the aluminosili-cate framework.
It is worth noting that bands of the isolated S2– anion are absent in the middle IR range, but the transformation of SO42− into S2− as a result of annealing of lazurite at 800 °C was reported [56,57]. Thus, the main scheme of transformations in the first step includes reduction of sulfate anions, and formation of S2− and HS−.
Splittings and shifts of IR bands in the preheated samples are mainly due to trans-formations of the framework. However, the band at 461 cm−1 may be partly due to vibra-tions of the trans-S4 molecule (C2h conformation) [40].
Annealing of the preheated haüyne samples at 800 C in air results in the change of color from yellow to blue, disappearance or weakening of the band of HS− and in the case of Sample 5, disappearance of the bands of CO32− (Figures 1–3).
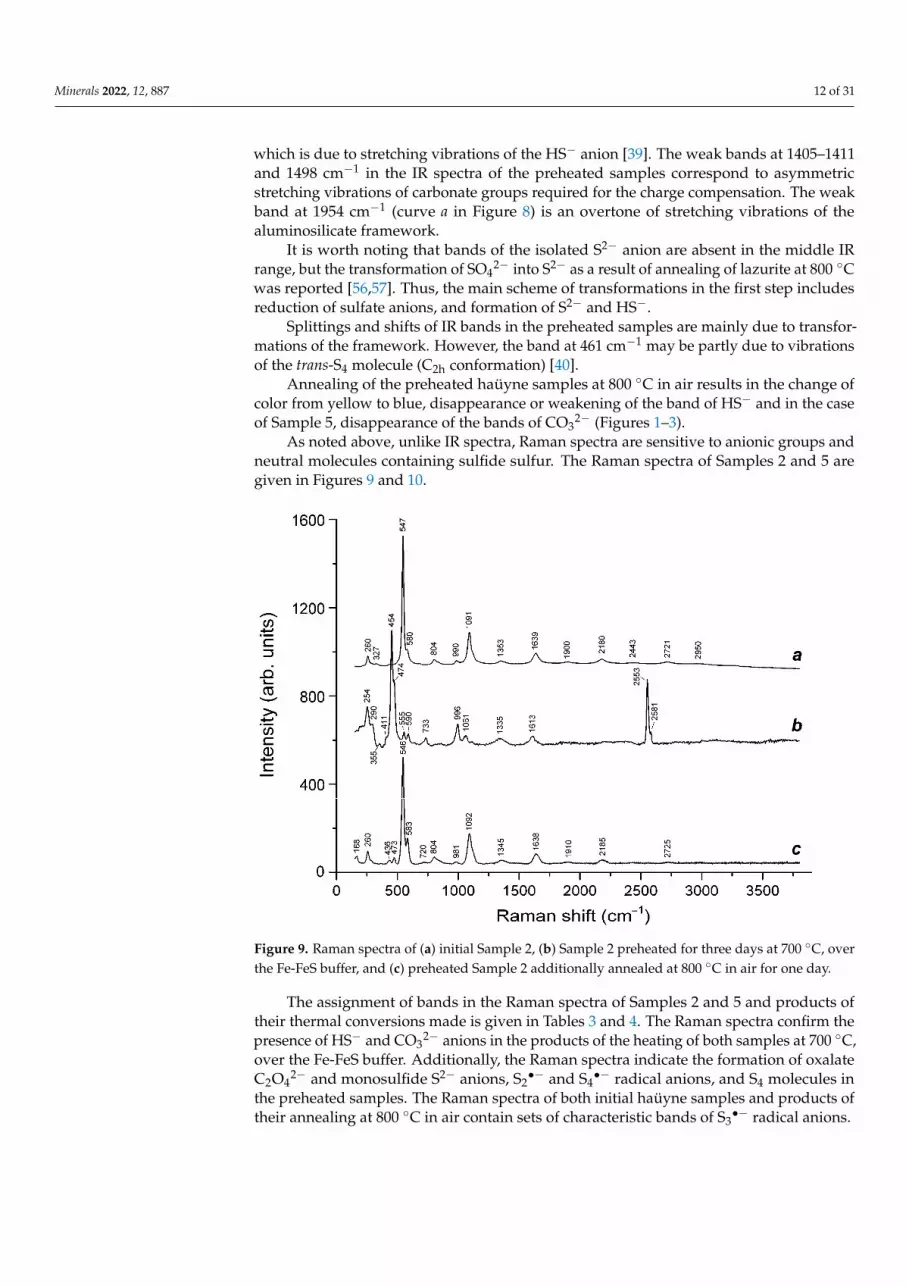
As noted above, unlike IR spectra, Raman spectra are sensitive to anionic groups and neutral molecules containing sulfide sulfur. The Raman spectra of Samples 2 and 5 are given in Figures 9 and 10.
Figure 8. Infrared spectra in the 1350–3600 region of (a) haüyne (Sample 5) preheated for three daysat 700 ◦C over the Fe-FeS buffer, and (b) preheated Sample 5 additionally annealed at 800 ◦C in airfor one day.
Heating results in the lowering of intensities of the bands of H2O and disappearanceof the bands of SO4
2− and CO2. The samples preheated under reducing conditions changecolor from blue to yellow. Their IR spectra contain a weak band at 2559–2560 cm−1,
Minerals 2022, 12, 887 12 of 31
which is due to stretching vibrations of the HS− anion [39]. The weak bands at 1405–1411and 1498 cm−1 in the IR spectra of the preheated samples correspond to asymmetricstretching vibrations of carbonate groups required for the charge compensation. The weakband at 1954 cm−1 (curve a in Figure 8) is an overtone of stretching vibrations of thealuminosilicate framework.
It is worth noting that bands of the isolated S2− anion are absent in the middle IRrange, but the transformation of SO4
2− into S2− as a result of annealing of lazurite at 800 ◦Cwas reported [56,57]. Thus, the main scheme of transformations in the first step includesreduction of sulfate anions, and formation of S2− and HS−.
Splittings and shifts of IR bands in the preheated samples are mainly due to transfor-mations of the framework. However, the band at 461 cm−1 may be partly due to vibrationsof the trans-S4 molecule (C2h conformation) [40].
Annealing of the preheated haüyne samples at 800 ◦C in air results in the change ofcolor from yellow to blue, disappearance or weakening of the band of HS− and in the caseof Sample 5, disappearance of the bands of CO3
2− (Figures 1–3).As noted above, unlike IR spectra, Raman spectra are sensitive to anionic groups and
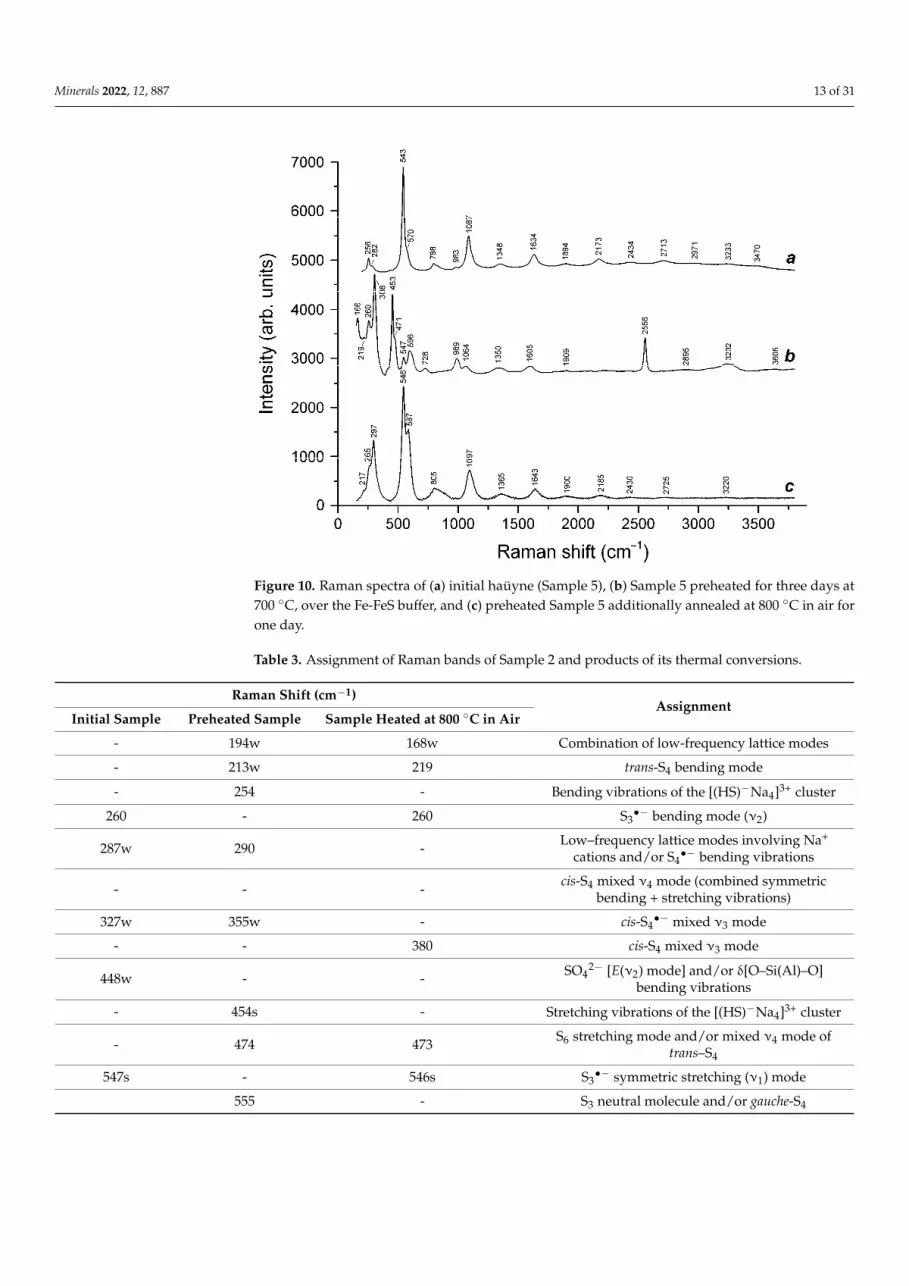
neutral molecules containing sulfide sulfur. The Raman spectra of Samples 2 and 5 aregiven in Figures 9 and 10.
Minerals 2022, 12, x FOR PEER REVIEW 12 of 31
Figure 9. Raman spectra of (a) initial Sample 2, (b) Sample 2 preheated for three days at 700 C, over the Fe-FeS buffer, and (c) preheated Sample 2 additionally annealed at 800 C in air for one day.
Figure 10. Raman spectra of (a) initial haüyne (Sample 5), (b) Sample 5 preheated for three days at 700 C, over the Fe-FeS buffer, and (c) preheated Sample 5 additionally annealed at 800 C in air for one day.
The assignment of bands in the Raman spectra of Samples 2 and 5 and products of their thermal conversions made is given in Tables 3 and 4. The Raman spectra confirm the presence of HS− and CO32− anions in the products of the heating of both samples at 700
Figure 9. Raman spectra of (a) initial Sample 2, (b) Sample 2 preheated for three days at 700 ◦C, overthe Fe-FeS buffer, and (c) preheated Sample 2 additionally annealed at 800 ◦C in air for one day.
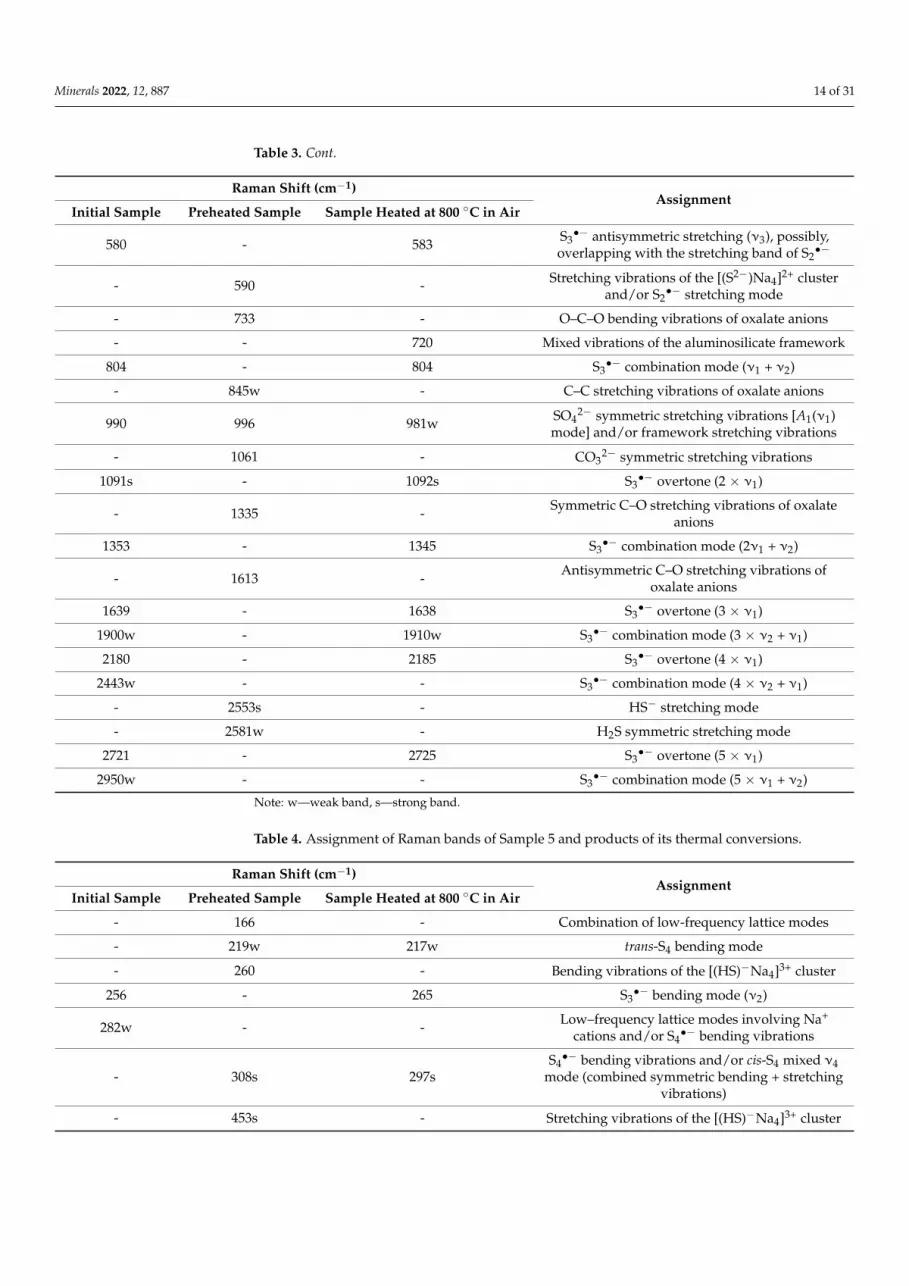
The assignment of bands in the Raman spectra of Samples 2 and 5 and products oftheir thermal conversions made is given in Tables 3 and 4. The Raman spectra confirm thepresence of HS− and CO3
2− anions in the products of the heating of both samples at 700 ◦C,over the Fe-FeS buffer. Additionally, the Raman spectra indicate the formation of oxalateC2O4
2− and monosulfide S2− anions, S2•− and S4
•− radical anions, and S4 molecules inthe preheated samples. The Raman spectra of both initial haüyne samples and products oftheir annealing at 800 ◦C in air contain sets of characteristic bands of S3
•− radical anions.
Minerals 2022, 12, 887 13 of 31
Minerals 2022, 12, x FOR PEER REVIEW 12 of 31
Figure 9. Raman spectra of (a) initial Sample 2, (b) Sample 2 preheated for three days at 700 C, over the Fe-FeS buffer, and (c) preheated Sample 2 additionally annealed at 800 C in air for one day.
Figure 10. Raman spectra of (a) initial haüyne (Sample 5), (b) Sample 5 preheated for three days at 700 C, over the Fe-FeS buffer, and (c) preheated Sample 5 additionally annealed at 800 C in air for one day.
The assignment of bands in the Raman spectra of Samples 2 and 5 and products of their thermal conversions made is given in Tables 3 and 4. The Raman spectra confirm the presence of HS− and CO32− anions in the products of the heating of both samples at 700
Figure 10. Raman spectra of (a) initial haüyne (Sample 5), (b) Sample 5 preheated for three days at700 ◦C, over the Fe-FeS buffer, and (c) preheated Sample 5 additionally annealed at 800 ◦C in air forone day.
Table 3. Assignment of Raman bands of Sample 2 and products of its thermal conversions.
Raman Shift (cm−1)Assignment
Initial Sample Preheated Sample Sample Heated at 800 ◦C in Air
- 194w 168w Combination of low-frequency lattice modes
- 213w 219 trans-S4 bending mode
- 254 - Bending vibrations of the [(HS)−Na4]3+ cluster
260 - 260 S3•− bending mode (ν2)
287w 290 - Low–frequency lattice modes involving Na+
cations and/or S4•− bending vibrations
- - - cis-S4 mixed ν4 mode (combined symmetricbending + stretching vibrations)
327w 355w - cis-S4•− mixed ν3 mode
- - 380 cis-S4 mixed ν3 mode
448w - - SO42− [E(ν2) mode] and/or δ[O–Si(Al)–O]
bending vibrations
- 454s - Stretching vibrations of the [(HS)−Na4]3+ cluster
- 474 473 S6 stretching mode and/or mixed ν4 mode oftrans–S4
547s - 546s S3•− symmetric stretching (ν1) mode
555 - S3 neutral molecule and/or gauche-S4
Minerals 2022, 12, 887 14 of 31
Table 3. Cont.
Raman Shift (cm−1)Assignment
Initial Sample Preheated Sample Sample Heated at 800 ◦C in Air
580 - 583 S3•− antisymmetric stretching (ν3), possibly,
overlapping with the stretching band of S2•−
- 590 - Stretching vibrations of the [(S2−)Na4]2+ clusterand/or S2
•− stretching mode
- 733 - O–C–O bending vibrations of oxalate anions
- - 720 Mixed vibrations of the aluminosilicate framework
804 - 804 S3•− combination mode (ν1 + ν2)
- 845w - C–C stretching vibrations of oxalate anions
990 996 981w SO42− symmetric stretching vibrations [A1(ν1)
mode] and/or framework stretching vibrations
- 1061 - CO32− symmetric stretching vibrations
1091s - 1092s S3•− overtone (2 × ν1)
- 1335 - Symmetric C–O stretching vibrations of oxalateanions
1353 - 1345 S3•− combination mode (2ν1 + ν2)
- 1613 - Antisymmetric C–O stretching vibrations ofoxalate anions
1639 - 1638 S3•− overtone (3 × ν1)
1900w - 1910w S3•− combination mode (3 × ν2 + ν1)
2180 - 2185 S3•− overtone (4 × ν1)
2443w - - S3•− combination mode (4 × ν2 + ν1)
- 2553s - HS− stretching mode
- 2581w - H2S symmetric stretching mode
2721 - 2725 S3•− overtone (5 × ν1)
2950w - - S3•− combination mode (5 × ν1 + ν2)
Note: w—weak band, s—strong band.
Table 4. Assignment of Raman bands of Sample 5 and products of its thermal conversions.
Raman Shift (cm−1)Assignment
Initial Sample Preheated Sample Sample Heated at 800 ◦C in Air
- 166 - Combination of low-frequency lattice modes
- 219w 217w trans-S4 bending mode
- 260 - Bending vibrations of the [(HS)−Na4]3+ cluster
256 - 265 S3•− bending mode (ν2)
282w - - Low–frequency lattice modes involving Na+
cations and/or S4•− bending vibrations
- 308s 297sS4•− bending vibrations and/or cis-S4 mixed ν4
mode (combined symmetric bending + stretchingvibrations)
- 453s - Stretching vibrations of the [(HS)−Na4]3+ cluster
Minerals 2022, 12, 887 15 of 31
Table 4. Cont.
Raman Shift (cm−1)Assignment
Initial Sample Preheated Sample Sample Heated at 800 ◦C in Air
- 471 - S6 stretching mode and/or mixed ν4 mode oftrans–S4
543s 547 546s S3•− symmetric stretching (ν1) mode
570 - 587 S3•− antisymmetric stretching (ν3), possibly,
overlapping with the stretching band of S2•−
- 596 - Stretching vibrations of the [(S2−)Na4]2+ clusterand/or S2
•− stretching mode
- 728 - O–C–O bending vibrations of oxalate anions
798 - 805 S3•− combination mode (ν1 + ν2)
- 850w - C–C stretching vibrations of oxalate anions
983w 989 - SO42− symmetric stretching vibrations [A1(ν1)
mode] and/or framework stretching vibrations
- 1064 - CO32− symmetric stretching vibrations
1087s - 1097s S3•− overtone (2 × ν1)
- 1350 - Symmetric C–O stretching vibrations of oxalateanions
1348 - 1365 S3•− combination mode (2ν1 + ν2)
- 1605 - Antisymmetric C–O stretching vibrations ofoxalate anions
1634 - 1643 S3•− overtone (3 × ν1)
1894w - 1900w S3•− combination mode (3 × ν2 + ν1)
- 1909w - Overtone of SO42− symmetric stretching
vibrations?
2173 - 2185 S3•− overtone (4 × ν1)
2434w - 2430w S3•− combination mode (4 × ν2 + ν1)
- 2556s - HS− stretching mode
2713 - 2725 S3•− overtone (5 × ν1)
2971w - - S3•− combination mode (5 × ν1 + ν2)
3233w, 3470w 3232, 3605w 3220w O–H stretching modes
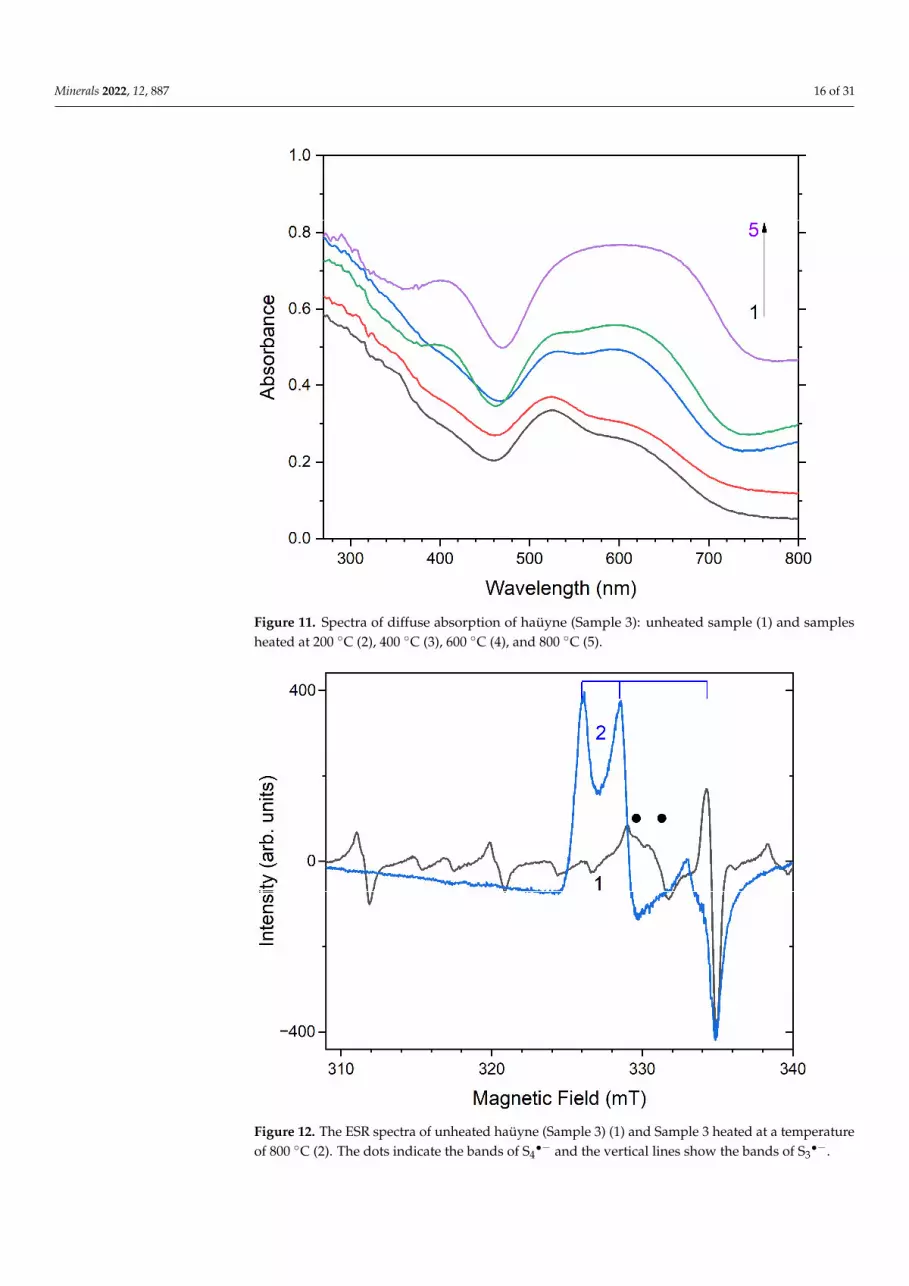
In the original Sample 3, no S3•− centers were observed before heating. Two absorp-
tion bands with maxima at 525 and 585 nm are associated with S4•− centers in differ-
ent configurations, and a weak absorption band at 400 nm corresponds to S2•− centers
(Figure 11) [4,58]. Being excited in the 400 nm region, the samples show intense lumines-cence with a maximum in the 650 nm region associated with these S2
•− radical anions.In the ESR spectrum, in addition to six lines associated with Mn2+ centers in calcite
inclusions, there is a signal with g-tensor components of 2.034 and 2.021, associated withS4•− centers (Figure 12) [58]. As a result of heating the sample, the intensity of this signal
decreases, together with a weakening of the absorption bands. At temperatures above400 ◦C, the S4
•−—centers disappear.
Minerals 2022, 12, 887 16 of 31Minerals 2022, 12, x FOR PEER REVIEW 15 of 31
Figure 11. Spectra of diffuse absorption of haüyne (Sample 3): unheated sample (1) and samples heated at 200 C (2), 400 C (3), 600 C (4), and 800 C (5).
Figure 12. The ESR spectra of unheated haüyne (Sample 3) (1) and Sample 3 heated at a tempera-ture of 800 C (2). The dots indicate the bands of S4●− and the vertical lines show the bands of S3●−.
Figure 11. Spectra of diffuse absorption of haüyne (Sample 3): unheated sample (1) and samplesheated at 200 ◦C (2), 400 ◦C (3), 600 ◦C (4), and 800 ◦C (5).
Minerals 2022, 12, x FOR PEER REVIEW 15 of 31
Figure 11. Spectra of diffuse absorption of haüyne (Sample 3): unheated sample (1) and samples heated at 200 C (2), 400 C (3), 600 C (4), and 800 C (5).
Figure 12. The ESR spectra of unheated haüyne (Sample 3) (1) and Sample 3 heated at a tempera-ture of 800 C (2). The dots indicate the bands of S4●− and the vertical lines show the bands of S3●−. Figure 12. The ESR spectra of unheated haüyne (Sample 3) (1) and Sample 3 heated at a temperatureof 800 ◦C (2). The dots indicate the bands of S4
•− and the vertical lines show the bands of S3•−.
Minerals 2022, 12, 887 17 of 31
The intensities of the absorption band and luminescence associated with S2•− centers
increase in this case. At temperatures above 700 ◦C, a signal with g1 = 2.056, g2 = 2.041, andg3 = 2.008, associated with S3
•− centers, appears in the ESR spectrum. At the same time,the shape of the absorption band in the region of 600 nm changes, it acquires a table-likeshape, and its intensity also begins to grow. The sample acquires an intense blue color, alsoassociated with the S3
•− radical anion [4]. In this case, the absorption band in the regionof 400 nm and the luminescence associated with the S2
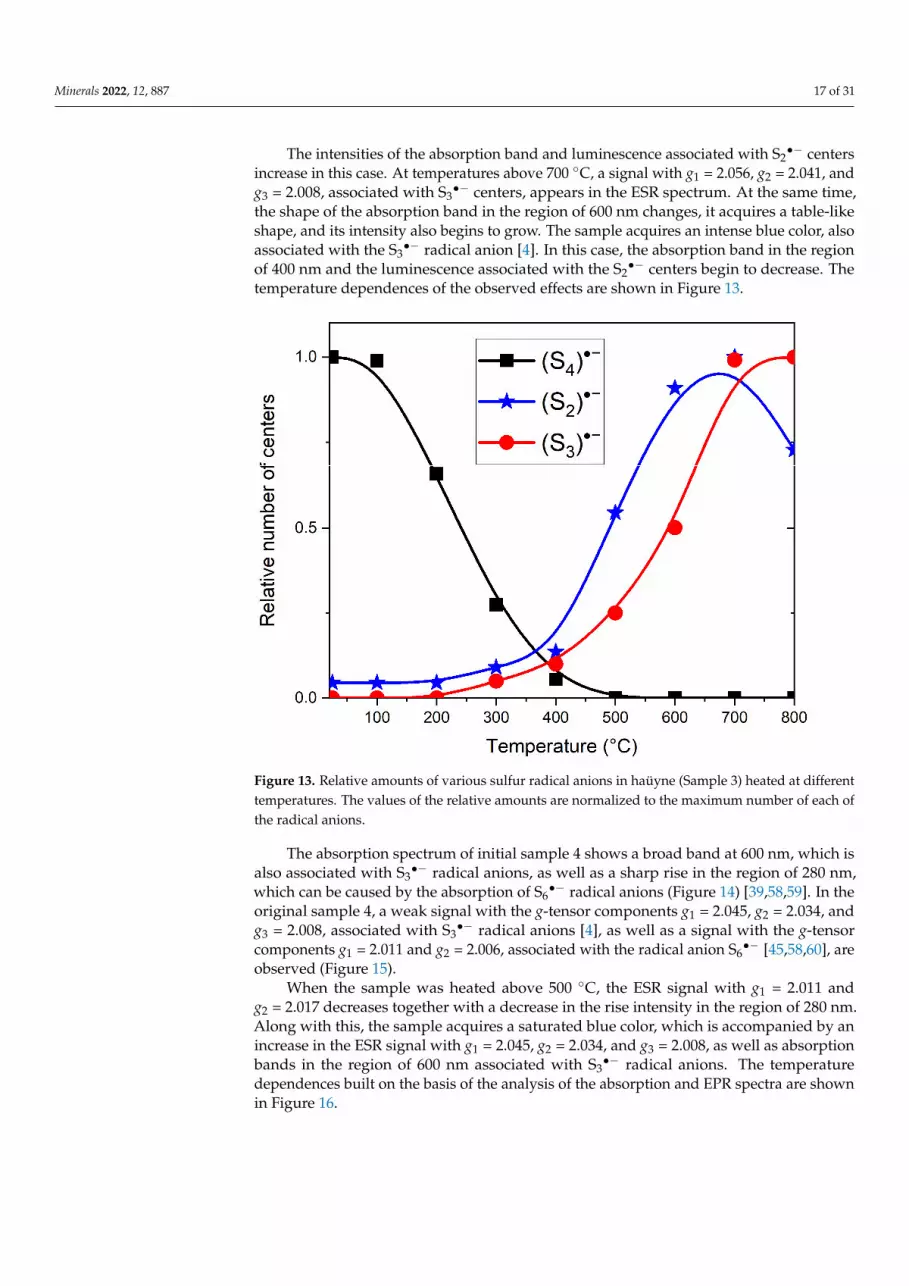
•− centers begin to decrease. Thetemperature dependences of the observed effects are shown in Figure 13.
Minerals 2022, 12, x FOR PEER REVIEW 16 of 31
Figure 13. Relative amounts of various sulfur radical anions in haüyne (Sample 3) heated at dif-ferent temperatures. The values of the relative amounts are normalized to the maximum number of each of the radical anions.
The absorption spectrum of initial sample 4 shows a broad band at 600 nm, which is also associated with S3●− radical anions, as well as a sharp rise in the region of 280 nm, which can be caused by the absorption of S6●− radical anions (Figure 14) [39,58,59]. In the original sample 4, a weak signal with the g-tensor components g1 = 2.045, g2 = 2.034, and g3 = 2.008, associated with S3●− radical anions [4], as well as a signal with the g-tensor com-ponents g1 = 2.011 and g2 = 2.006, associated with the radical anion S6●− [45,58,60], are ob-served (Figure 15).
Figure 13. Relative amounts of various sulfur radical anions in haüyne (Sample 3) heated at differenttemperatures. The values of the relative amounts are normalized to the maximum number of each ofthe radical anions.
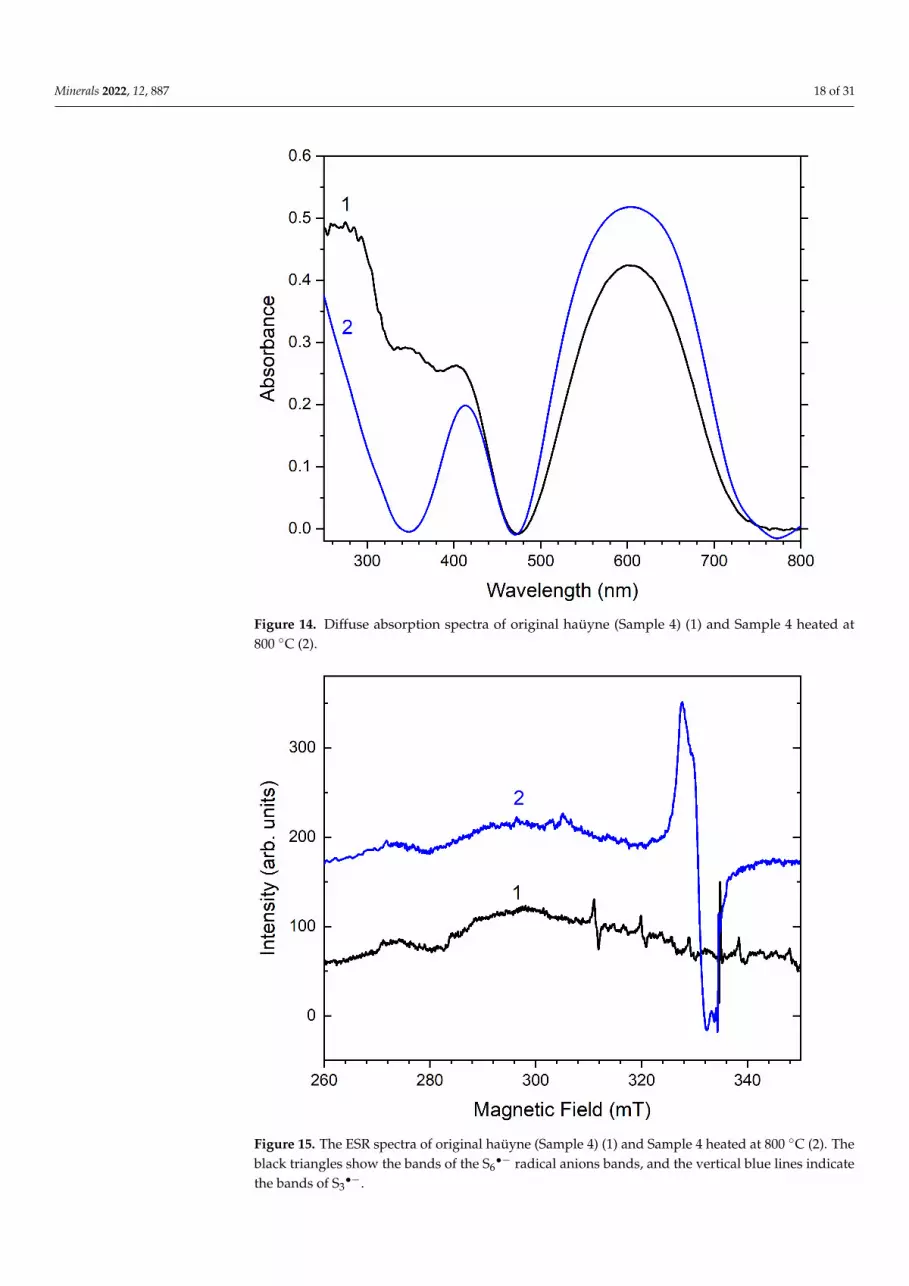
The absorption spectrum of initial sample 4 shows a broad band at 600 nm, which isalso associated with S3
•− radical anions, as well as a sharp rise in the region of 280 nm,which can be caused by the absorption of S6
•− radical anions (Figure 14) [39,58,59]. In theoriginal sample 4, a weak signal with the g-tensor components g1 = 2.045, g2 = 2.034, andg3 = 2.008, associated with S3
•− radical anions [4], as well as a signal with the g-tensorcomponents g1 = 2.011 and g2 = 2.006, associated with the radical anion S6
•− [45,58,60], areobserved (Figure 15).
When the sample was heated above 500 ◦C, the ESR signal with g1 = 2.011 andg2 = 2.017 decreases together with a decrease in the rise intensity in the region of 280 nm.Along with this, the sample acquires a saturated blue color, which is accompanied by anincrease in the ESR signal with g1 = 2.045, g2 = 2.034, and g3 = 2.008, as well as absorptionbands in the region of 600 nm associated with S3
•− radical anions. The temperaturedependences built on the basis of the analysis of the absorption and EPR spectra are shownin Figure 16.
Minerals 2022, 12, 887 18 of 31Minerals 2022, 12, x FOR PEER REVIEW 17 of 31
Figure 14. Diffuse absorption spectra of original haüyne (Sample 4) (1) and Sample 4 heated at 800 C (2).
Figure 15. The ESR spectra of original haüyne (Sample 4) (1) and Sample 4 heated at 800 C (2). The black triangles show the bands of the S6●− radical anions bands, and the vertical blue lines indicate the bands of S3●−.
Figure 14. Diffuse absorption spectra of original haüyne (Sample 4) (1) and Sample 4 heated at800 ◦C (2).
Minerals 2022, 12, x FOR PEER REVIEW 17 of 31
Figure 14. Diffuse absorption spectra of original haüyne (Sample 4) (1) and Sample 4 heated at 800 C (2).
Figure 15. The ESR spectra of original haüyne (Sample 4) (1) and Sample 4 heated at 800 C (2). The black triangles show the bands of the S6●− radical anions bands, and the vertical blue lines indicate the bands of S3●−.
Figure 15. The ESR spectra of original haüyne (Sample 4) (1) and Sample 4 heated at 800 ◦C (2). Theblack triangles show the bands of the S6
•− radical anions bands, and the vertical blue lines indicatethe bands of S3
•−.
Minerals 2022, 12, 887 19 of 31
Minerals 2022, 12, x FOR PEER REVIEW 18 of 31
When the sample was heated above 500 C, the ESR signal with g1 = 2.011 and g2 = 2.017 decreases together with a decrease in the rise intensity in the region of 280 nm. Along with this, the sample acquires a saturated blue color, which is accompanied by an increase in the ESR signal with g1 = 2.045, g2 = 2.034, and g3 = 2.008, as well as absorption bands in the region of 600 nm associated with S3●– radical anions. The temperature de-pendences built on the basis of the analysis of the absorption and EPR spectra are shown in Figure 16.
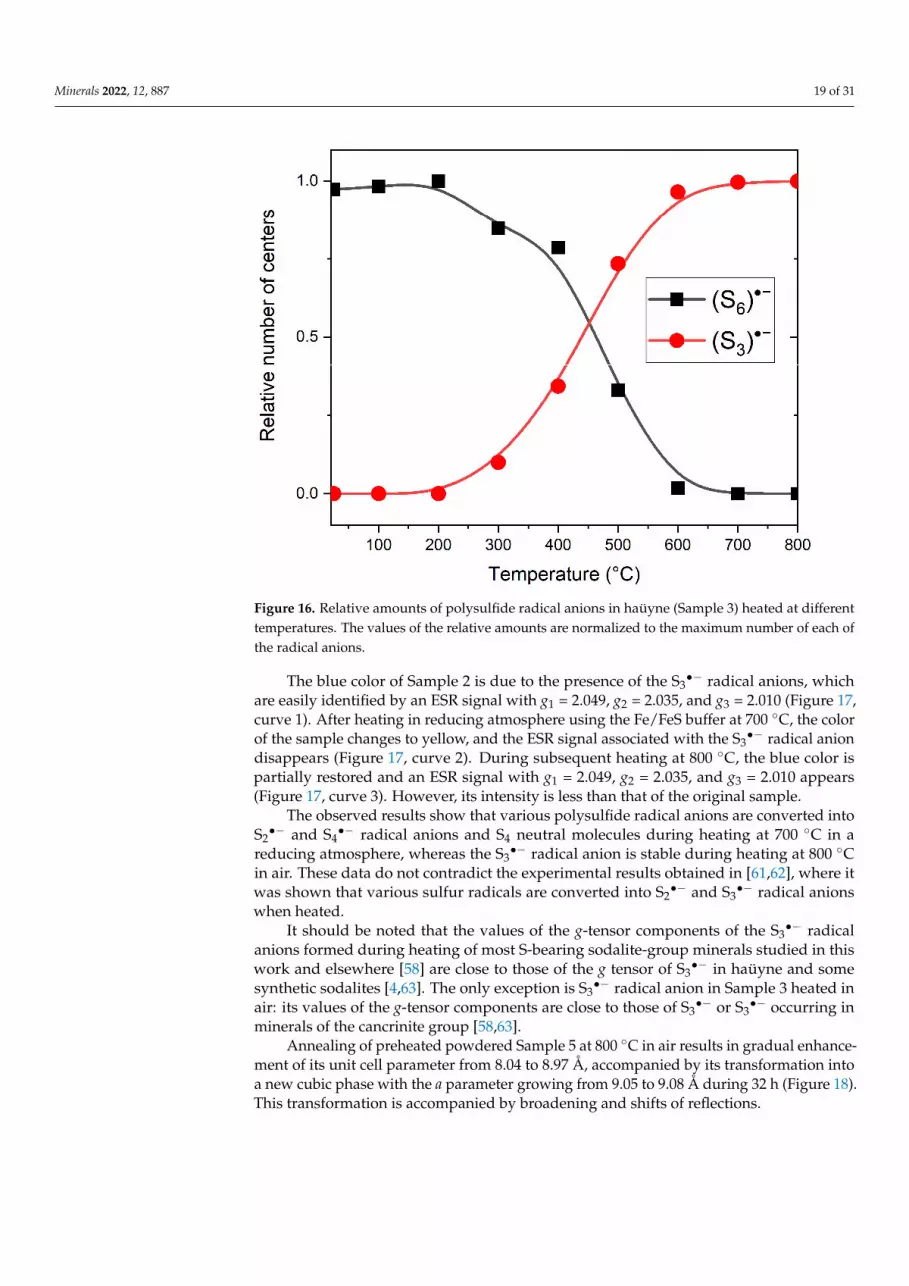
Figure 16. Relative amounts of polysulfide radical anions in haüyne (Sample 3) heated at different temperatures. The values of the relative amounts are normalized to the maximum number of each of the radical anions.
The blue color of Sample 2 is due to the presence of the S3●− radical anions, which are easily identified by an ESR signal with g1 = 2.049, g2 = 2.035, and g3 = 2.010 (Figure 17, curve 1). After heating in reducing atmosphere using the Fe/FeS buffer at 700 C, the color of the sample changes to yellow, and the ESR signal associated with the S3●− radical anion disappears (Figure 17, curve 2). During subsequent heating at 800 C, the blue color is partially restored and an ESR signal with g1 = 2.049, g2 = 2.035, and g3 = 2.010 appears (Figure 17, curve 3). However, its intensity is less than that of the original sample.
Figure 16. Relative amounts of polysulfide radical anions in haüyne (Sample 3) heated at differenttemperatures. The values of the relative amounts are normalized to the maximum number of each ofthe radical anions.
The blue color of Sample 2 is due to the presence of the S3•− radical anions, which
are easily identified by an ESR signal with g1 = 2.049, g2 = 2.035, and g3 = 2.010 (Figure 17,curve 1). After heating in reducing atmosphere using the Fe/FeS buffer at 700 ◦C, the colorof the sample changes to yellow, and the ESR signal associated with the S3
•− radical aniondisappears (Figure 17, curve 2). During subsequent heating at 800 ◦C, the blue color ispartially restored and an ESR signal with g1 = 2.049, g2 = 2.035, and g3 = 2.010 appears(Figure 17, curve 3). However, its intensity is less than that of the original sample.
The observed results show that various polysulfide radical anions are converted intoS2•− and S4
•− radical anions and S4 neutral molecules during heating at 700 ◦C in areducing atmosphere, whereas the S3
•− radical anion is stable during heating at 800 ◦Cin air. These data do not contradict the experimental results obtained in [61,62], where itwas shown that various sulfur radicals are converted into S2
•− and S3•− radical anions
when heated.It should be noted that the values of the g-tensor components of the S3
•− radicalanions formed during heating of most S-bearing sodalite-group minerals studied in thiswork and elsewhere [58] are close to those of the g tensor of S3
•− in haüyne and somesynthetic sodalites [4,63]. The only exception is S3
•− radical anion in Sample 3 heated inair: its values of the g-tensor components are close to those of S3
•− or S3•− occurring in
minerals of the cancrinite group [58,63].Annealing of preheated powdered Sample 5 at 800 ◦C in air results in gradual enhance-
ment of its unit cell parameter from 8.04 to 8.97 Å, accompanied by its transformation intoa new cubic phase with the a parameter growing from 9.05 to 9.08 Å during 32 h (Figure 18).This transformation is accompanied by broadening and shifts of reflections.

Minerals 2022, 12, 887 20 of 31Minerals 2022, 12, x FOR PEER REVIEW 19 of 31
Figure 17. ESR spectra of initial haüyne (Sample 2) (1), and Sample 2 heated at 700 C under buffer (2) and at 800 C in air (3).
The observed results show that various polysulfide radical anions are converted into S2●− and S4●− radical anions and S4 neutral molecules during heating at 700 C in a reduc-ing atmosphere, whereas the S3●− radical anion is stable during heating at 800 C in air. These data do not contradict the experimental results obtained in [61,62], where it was shown that various sulfur radicals are converted into S2●− and S3●− radical anions when heated.
It should be noted that the values of the g-tensor components of the S3●− radical an-ions formed during heating of most S-bearing sodalite-group minerals studied in this work and elsewhere [58] are close to those of the g tensor of S3●− in haüyne and some synthetic sodalites [4,63]. The only exception is S3●− radical anion in Sample 3 heated in air: its values of the g-tensor components are close to those of S3●− or S3●− occurring in minerals of the cancrinite group [58,63].
Annealing of preheated powdered Sample 5 at 800 C in air results in gradual en-hancement of its unit cell parameter from 8.04 to 8.97 Å, accompanied by its transfor-mation into a new cubic phase with the a parameter growing from 9.05 to 9.08 Å during 32 h (Figure 18). This transformation is accompanied by broadening and shifts of reflec-tions.
The initial phase with a smaller a parameter disappears five hours after the start of annealing. The final product of annealing is pale blue. Annealing of preheated sin-gle-crystal grains of Sample 5 at 800 C during 32 h results in the formation of a greenish blue cubic phase. Based on the above spectroscopic data, one can conclude that the en-hancement of the unit cell parameter during annealing is caused by the transformation of small extra-framework anions (S2− and HS−) into larger ones (SO42− and, to a lesser extent, S3−). Thus, the process observed during annealing has the character of a phase transition, and both in the initial and in the final phase, the degree of sulfur oxidation (and, conse-quently, the unit cell parameter) can vary smoothly within relatively narrow limits.
Figure 17. ESR spectra of initial haüyne (Sample 2) (1), and Sample 2 heated at 700 ◦C under buffer (2)and at 800 ◦C in air (3).
Minerals 2022, 12, x FOR PEER REVIEW 20 of 31
Figure 18. Kinetics of changes of the cubic unit cell parameter of the initial phase of the preheated haüyne (Sample 5, circles) and product of its annealing at 800 C (squares).
The observed abrupt increase in the unit cell parameter may indicate that the for-mation of the new phase proceeds by the nucleation mechanism. Partial oxidation of sulfur in the preheated sample at the initial stage of calcination leads to a broadening of the lines in the diffraction patterns, which may indicate the inhomogeneity of the com-position and associated mechanical stresses in the crystal.
3.3. Thermal Conversions of Slyudyankaite Slyudyankaite, ideally Na28Ca4(Si24Al24O96)(SO4)6(S6)1/3(CO2)·2H2O, is a triclinic soda-
lite-group mineral containing sodalite cages of two kinds. Cages of the first type contain Na+ and Ca2+ cations and SO42− anions as well as trace amounts of S3− radical anions. Cages of the second type contain only neutral molecules (cyclic S6 having chair-like con-formation, CO2, H2O, and subordinate S4).
The IR spectrum of slyudyankaite (curve a in Figure 19) contains bands of O–H stretching vibrations of hydrogen bonds of medium strength (3380 to 3610 cm−1), strong hydrogen bond or strong dipole-dipole interactions with CO2 molecules (shoulder at 3240 cm−1), antisymmetric stretching vibrations of free 12CO2 molecules and 12CO2 mole-cules which are acceptors of strong hydrogen bonds (2341 and 2385 cm−1, respectively), antisymmetric stretching vibrations of the 13CO2 molecules (2275 cm−1), C–O stretching vibrations of trace admixture of O=C=S molecules (a very weak band at 2040 cm−1), bending vibrations of H2O molecules (at 1632 cm−1 with an indistinct shoulder at ~1680 cm−1 which may correspond to H2O molecules forming strong hydrogen bonds), asym-metric stretching vibrations of the SO42− anionic groups [the degenerate F2(ν3) mode] (1138 and 1107 cm−1), stretching vibrations of the aluminosilicate framework (1002 cm–1), mixed vibrations of the aluminosilicate framework (in the range of 650–720 cm−1), stretching vibrations of the neutral S4 molecule having cis conformation (641 cm−1), bending vibrations of the SO42− anionic groups [the degenerate F2(ν4) mode] (614 cm−1), and lattice modes involving bending vibrations of the aluminosilicate framework and librations of SO42− and extra-framework molecules (below 550 cm−1). An indistinct
Figure 18. Kinetics of changes of the cubic unit cell parameter of the initial phase of the preheatedhaüyne (Sample 5, circles) and product of its annealing at 800 ◦C (squares).
The initial phase with a smaller a parameter disappears five hours after the start ofannealing. The final product of annealing is pale blue. Annealing of preheated single-crystal grains of Sample 5 at 800 ◦C during 32 h results in the formation of a greenish bluecubic phase. Based on the above spectroscopic data, one can conclude that the enhancement
Minerals 2022, 12, 887 21 of 31
of the unit cell parameter during annealing is caused by the transformation of small extra-framework anions (S2− and HS−) into larger ones (SO4
2− and, to a lesser extent, S3•−).
Thus, the process observed during annealing has the character of a phase transition, andboth in the initial and in the final phase, the degree of sulfur oxidation (and, consequently,the unit cell parameter) can vary smoothly within relatively narrow limits.
The observed abrupt increase in the unit cell parameter may indicate that the formationof the new phase proceeds by the nucleation mechanism. Partial oxidation of sulfur in thepreheated sample at the initial stage of calcination leads to a broadening of the lines inthe diffraction patterns, which may indicate the inhomogeneity of the composition andassociated mechanical stresses in the crystal.
3.3. Thermal Conversions of Slyudyankaite
Slyudyankaite, ideally Na28Ca4(Si24Al24O96)(SO4)6(S6)1/3(CO2)·2H2O, is a triclinicsodalite-group mineral containing sodalite cages of two kinds. Cages of the first typecontain Na+ and Ca2+ cations and SO4
2− anions as well as trace amounts of S3•− radical
anions. Cages of the second type contain only neutral molecules (cyclic S6 having chair-likeconformation, CO2, H2O, and subordinate S4).
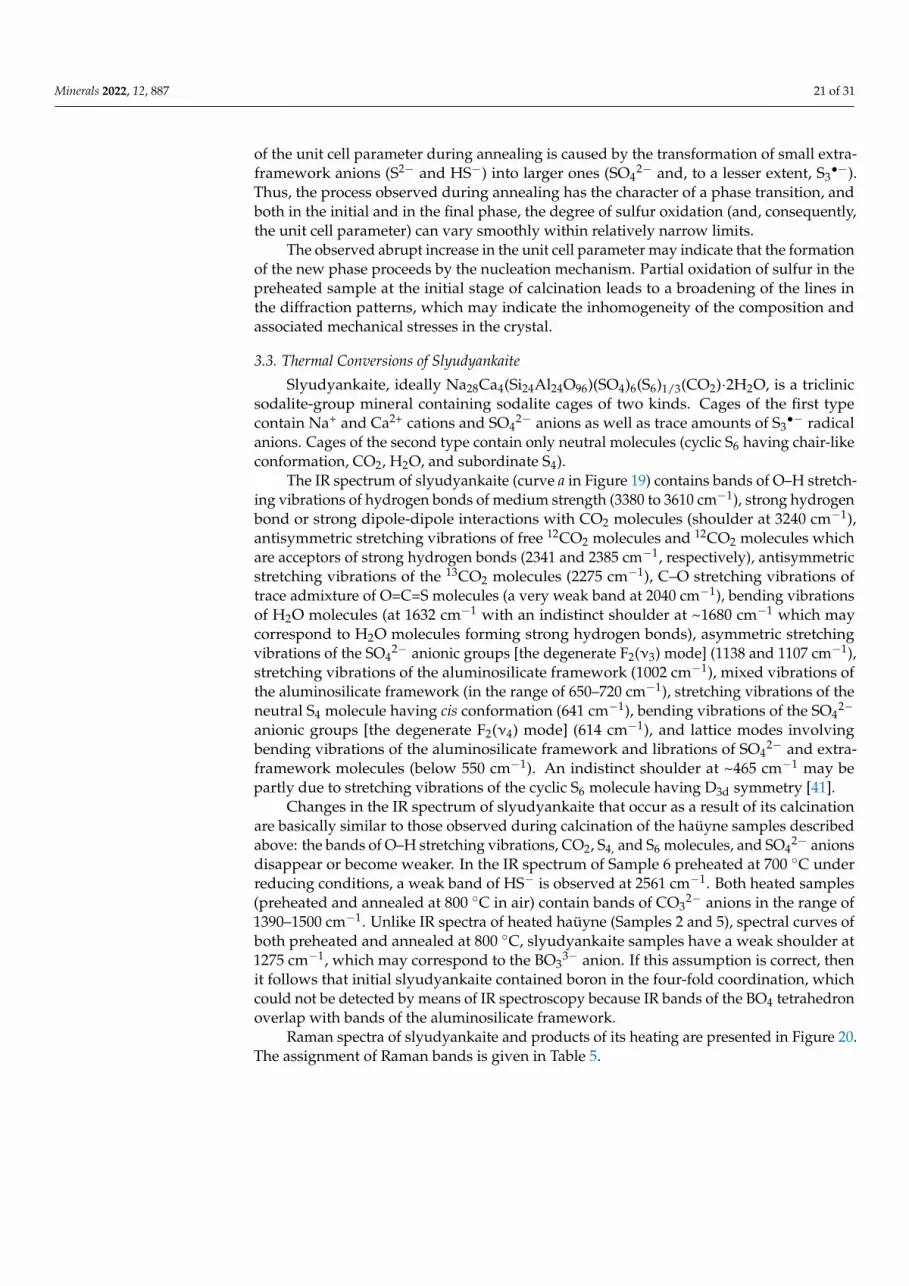
The IR spectrum of slyudyankaite (curve a in Figure 19) contains bands of O–H stretch-ing vibrations of hydrogen bonds of medium strength (3380 to 3610 cm−1), strong hydrogenbond or strong dipole-dipole interactions with CO2 molecules (shoulder at 3240 cm−1),antisymmetric stretching vibrations of free 12CO2 molecules and 12CO2 molecules whichare acceptors of strong hydrogen bonds (2341 and 2385 cm−1, respectively), antisymmetricstretching vibrations of the 13CO2 molecules (2275 cm−1), C–O stretching vibrations oftrace admixture of O=C=S molecules (a very weak band at 2040 cm−1), bending vibrationsof H2O molecules (at 1632 cm−1 with an indistinct shoulder at ~1680 cm−1 which maycorrespond to H2O molecules forming strong hydrogen bonds), asymmetric stretchingvibrations of the SO4
2− anionic groups [the degenerate F2(ν3) mode] (1138 and 1107 cm−1),stretching vibrations of the aluminosilicate framework (1002 cm−1), mixed vibrations ofthe aluminosilicate framework (in the range of 650–720 cm−1), stretching vibrations of theneutral S4 molecule having cis conformation (641 cm−1), bending vibrations of the SO4
2−
anionic groups [the degenerate F2(ν4) mode] (614 cm−1), and lattice modes involvingbending vibrations of the aluminosilicate framework and librations of SO4
2− and extra-framework molecules (below 550 cm−1). An indistinct shoulder at ~465 cm−1 may bepartly due to stretching vibrations of the cyclic S6 molecule having D3d symmetry [41].
Changes in the IR spectrum of slyudyankaite that occur as a result of its calcinationare basically similar to those observed during calcination of the haüyne samples describedabove: the bands of O–H stretching vibrations, CO2, S4, and S6 molecules, and SO4
2− anionsdisappear or become weaker. In the IR spectrum of Sample 6 preheated at 700 ◦C underreducing conditions, a weak band of HS− is observed at 2561 cm−1. Both heated samples(preheated and annealed at 800 ◦C in air) contain bands of CO3
2− anions in the range of1390–1500 cm−1. Unlike IR spectra of heated haüyne (Samples 2 and 5), spectral curves ofboth preheated and annealed at 800 ◦C, slyudyankaite samples have a weak shoulder at1275 cm−1, which may correspond to the BO3
3− anion. If this assumption is correct, thenit follows that initial slyudyankaite contained boron in the four-fold coordination, whichcould not be detected by means of IR spectroscopy because IR bands of the BO4 tetrahedronoverlap with bands of the aluminosilicate framework.
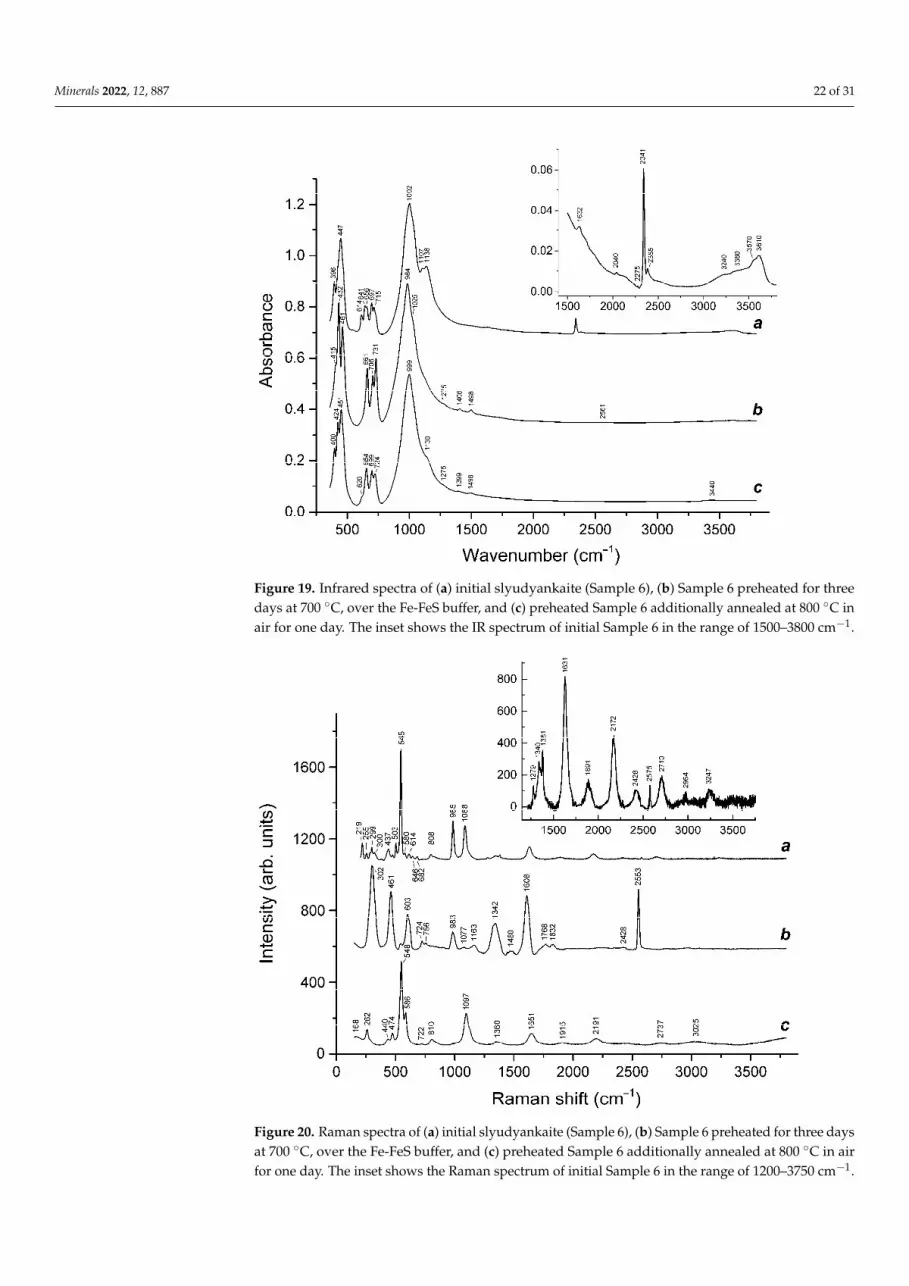
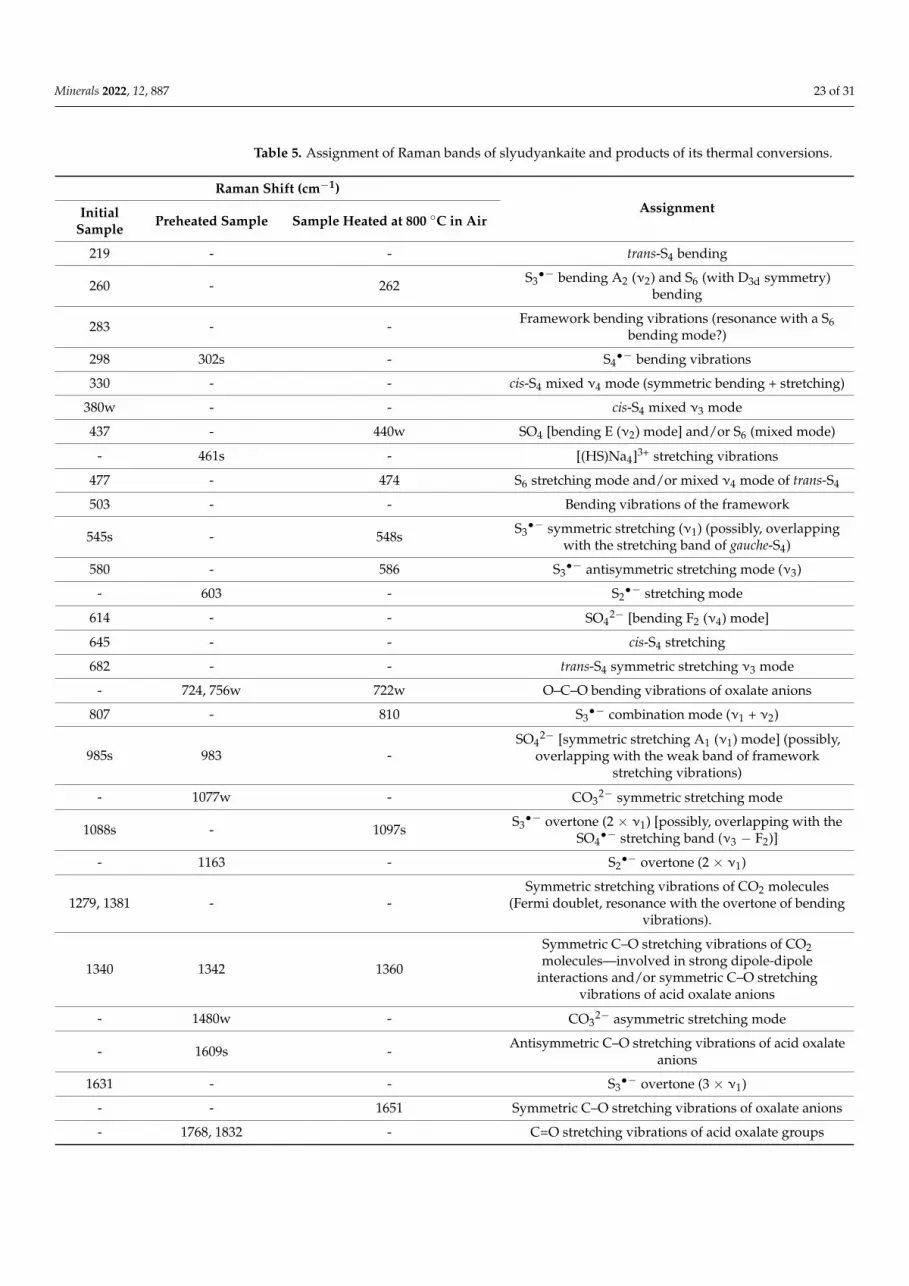
Raman spectra of slyudyankaite and products of its heating are presented in Figure 20.The assignment of Raman bands is given in Table 5.
Minerals 2022, 12, 887 22 of 31
Minerals 2022, 12, x FOR PEER REVIEW 21 of 31
shoulder at ~465 cm−1 may be partly due to stretching vibrations of the cyclic S6 molecule having D3d symmetry [41].
Figure 19. Infrared spectra of (a) initial slyudyankaite (Sample 6), (b) Sample 6 preheated for three days at 700 C, over the Fe-FeS buffer, and (c) preheated Sample 6 additionally annealed at 800 C in air for one day. The inset shows the IR spectrum of initial Sample 6 in the range of 1500–3800 cm−1.
Changes in the IR spectrum of slyudyankaite that occur as a result of its calcination are basically similar to those observed during calcination of the haüyne samples de-scribed above: the bands of O–H stretching vibrations, CO2, S4, and S6 molecules, and SO42− anions disappear or become weaker. In the IR spectrum of Sample 6 preheated at 700 C under reducing conditions, a weak band of HS− is observed at 2561 cm−1. Both heated samples (preheated and annealed at 800 C in air) contain bands of CO32− anions in the range of 1390–1500 cm−1. Unlike IR spectra of heated haüyne (Samples 2 and 5), spectral curves of both preheated and annealed at 800C, slyudyankaite samples have a weak shoulder at 1275 cm−1, which may correspond to the BO33− anion. If this assumption is cor-rect, then it follows that initial slyudyankaite contained boron in the four-fold coordination, which could not be detected by means of IR spectroscopy because IR bands of the BO4 tet-rahedron overlap with bands of the aluminosilicate framework.
Raman spectra of slyudyankaite and products of its heating are presented in Figure 20. The assignment of Raman bands is given in Table 5.
Figure 19. Infrared spectra of (a) initial slyudyankaite (Sample 6), (b) Sample 6 preheated for threedays at 700 ◦C, over the Fe-FeS buffer, and (c) preheated Sample 6 additionally annealed at 800 ◦C inair for one day. The inset shows the IR spectrum of initial Sample 6 in the range of 1500–3800 cm−1.
Minerals 2022, 12, x FOR PEER REVIEW 22 of 31
Figure 20. Raman spectra of (a) initial slyudyankaite (Sample 6), (b) Sample 6 preheated for three days at 700 C, over the Fe-FeS buffer, and (c) preheated Sample 6 additionally annealed at 800 C in air for one day. The inset shows the Raman spectrum of initial Sample 6 in the range of 1200–3750 cm−1.
Table 5. Assignment of Raman bands of slyudyankaite and products of its thermal conversions.
Raman Shift (cm–1) Assignment Initial
Sample Preheated
Sample Sample Heated at
800 C in Air 219 - - trans-S4 bending 260 - 262 S3− bending A2 (2) and S6 (with D3d symmetry) bending 283 - - Framework bending vibrations (resonance with a S6 bending mode?) 298 302s - S4− bending vibrations 330 - - cis-S4 mixed 4 mode (symmetric bending + stretching)
380w - - cis-S4 mixed 3 mode 437 - 440w SO4 [bending E (2) mode] and/or S6 (mixed mode)
- 461s - [(HS)Na4]3+ stretching vibrations 477 - 474 S6 stretching mode and/or mixed 4 mode of trans-S4 503 - - Bending vibrations of the framework
545 s -
548s S3− symmetric stretching (1) (possibly, overlapping with the stretching band
of gauche-S4) 580 - 586 S3− antisymmetric stretching mode (3)
- 603 - S2− stretching mode 614 - - SO42– [bending F2 (4) mode] 645 - - cis-S4 stretching 682 - - trans-S4 symmetric stretching 3 mode
- 724, 756w 722w O–C–O bending vibrations of oxalate anions 807 - 810 S3− combination mode (1 + 2) 985s 983 - SO42− [symmetric stretching A1 (1) mode] (possibly, overlapping with the weak
Figure 20. Raman spectra of (a) initial slyudyankaite (Sample 6), (b) Sample 6 preheated for three daysat 700 ◦C, over the Fe-FeS buffer, and (c) preheated Sample 6 additionally annealed at 800 ◦C in airfor one day. The inset shows the Raman spectrum of initial Sample 6 in the range of 1200–3750 cm−1.
Minerals 2022, 12, 887 23 of 31
Table 5. Assignment of Raman bands of slyudyankaite and products of its thermal conversions.
Raman Shift (cm−1)AssignmentInitial
Sample Preheated Sample Sample Heated at 800 ◦C in Air
219 - - trans-S4 bending
260 - 262 S3•− bending A2 (ν2) and S6 (with D3d symmetry)
bending
283 - - Framework bending vibrations (resonance with a S6bending mode?)
298 302s - S4•− bending vibrations
330 - - cis-S4 mixed ν4 mode (symmetric bending + stretching)
380w - - cis-S4 mixed ν3 mode
437 - 440w SO4 [bending E (ν2) mode] and/or S6 (mixed mode)
- 461s - [(HS)Na4]3+ stretching vibrations
477 - 474 S6 stretching mode and/or mixed ν4 mode of trans-S4
503 - - Bending vibrations of the framework
545s - 548s S3•− symmetric stretching (ν1) (possibly, overlapping
with the stretching band of gauche-S4)
580 - 586 S3•− antisymmetric stretching mode (ν3)
- 603 - S2•− stretching mode
614 - - SO42− [bending F2 (ν4) mode]
645 - - cis-S4 stretching
682 - - trans-S4 symmetric stretching ν3 mode
- 724, 756w 722w O–C–O bending vibrations of oxalate anions
807 - 810 S3•− combination mode (ν1 + ν2)
985s 983 -SO4
2− [symmetric stretching A1 (ν1) mode] (possibly,overlapping with the weak band of framework
stretching vibrations)
- 1077w - CO32− symmetric stretching mode
1088s - 1097s S3•− overtone (2 × ν1) [possibly, overlapping with the
SO4•− stretching band (ν3 − F2)]
- 1163 - S2•− overtone (2 × ν1)
1279, 1381 - -Symmetric stretching vibrations of CO2 molecules
(Fermi doublet, resonance with the overtone of bendingvibrations).
1340 1342 1360
Symmetric C–O stretching vibrations of CO2molecules—involved in strong dipole-dipole
interactions and/or symmetric C–O stretchingvibrations of acid oxalate anions
- 1480w - CO32− asymmetric stretching mode
- 1609s - Antisymmetric C–O stretching vibrations of acid oxalateanions
1631 - - S3•− overtone (3 × ν1)
- - 1651 Symmetric C–O stretching vibrations of oxalate anions
- 1768, 1832 - C=O stretching vibrations of acid oxalate groups
Minerals 2022, 12, 887 24 of 31
Table 5. Cont.
Raman Shift (cm−1)AssignmentInitial
Sample Preheated Sample Sample Heated at 800 ◦C in Air
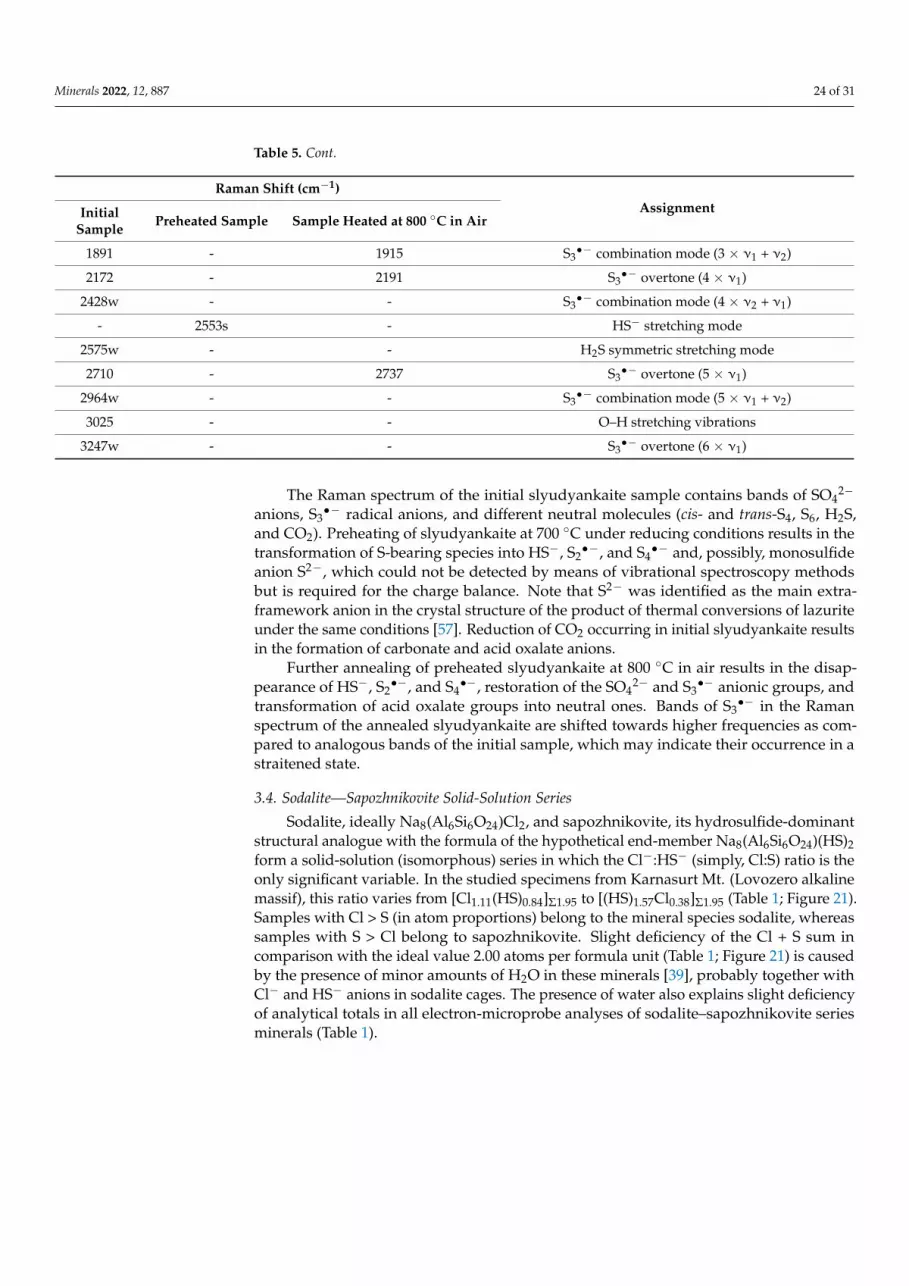
1891 - 1915 S3•− combination mode (3 × ν1 + ν2)
2172 - 2191 S3•− overtone (4 × ν1)
2428w - - S3•− combination mode (4 × ν2 + ν1)
- 2553s - HS− stretching mode
2575w - - H2S symmetric stretching mode
2710 - 2737 S3•− overtone (5 × ν1)
2964w - - S3•− combination mode (5 × ν1 + ν2)
3025 - - O–H stretching vibrations
3247w - - S3•− overtone (6 × ν1)
The Raman spectrum of the initial slyudyankaite sample contains bands of SO42−
anions, S3•− radical anions, and different neutral molecules (cis- and trans-S4, S6, H2S,
and CO2). Preheating of slyudyankaite at 700 ◦C under reducing conditions results in thetransformation of S-bearing species into HS−, S2
•−, and S4•− and, possibly, monosulfide
anion S2−, which could not be detected by means of vibrational spectroscopy methodsbut is required for the charge balance. Note that S2− was identified as the main extra-framework anion in the crystal structure of the product of thermal conversions of lazuriteunder the same conditions [57]. Reduction of CO2 occurring in initial slyudyankaite resultsin the formation of carbonate and acid oxalate anions.
Further annealing of preheated slyudyankaite at 800 ◦C in air results in the disap-pearance of HS−, S2
•−, and S4•−, restoration of the SO4
2− and S3•− anionic groups, and
transformation of acid oxalate groups into neutral ones. Bands of S3•− in the Raman
spectrum of the annealed slyudyankaite are shifted towards higher frequencies as com-pared to analogous bands of the initial sample, which may indicate their occurrence in astraitened state.
3.4. Sodalite—Sapozhnikovite Solid-Solution Series
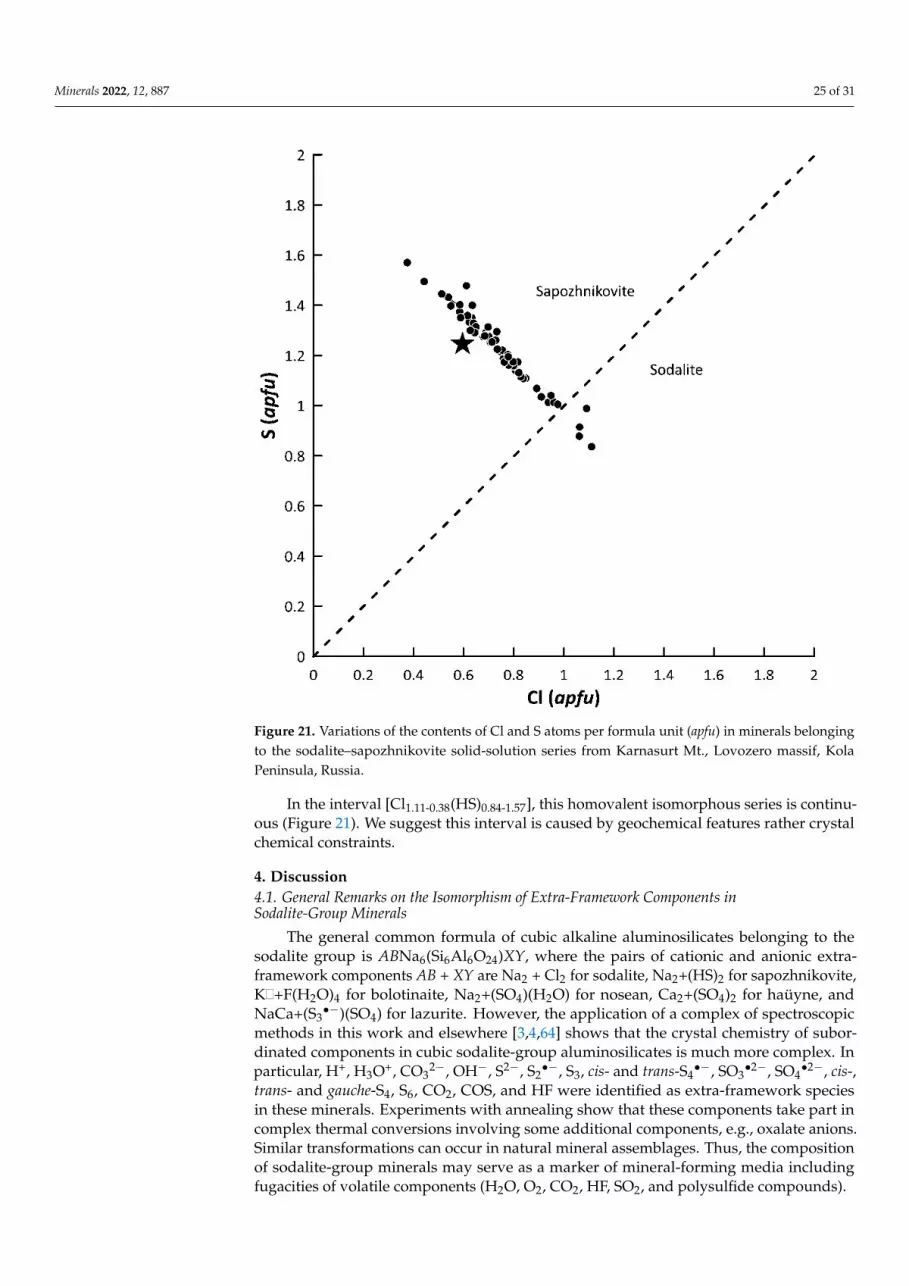
Sodalite, ideally Na8(Al6Si6O24)Cl2, and sapozhnikovite, its hydrosulfide-dominantstructural analogue with the formula of the hypothetical end-member Na8(Al6Si6O24)(HS)2form a solid-solution (isomorphous) series in which the Cl−:HS− (simply, Cl:S) ratio is theonly significant variable. In the studied specimens from Karnasurt Mt. (Lovozero alkalinemassif), this ratio varies from [Cl1.11(HS)0.84]Σ1.95 to [(HS)1.57Cl0.38]Σ1.95 (Table 1; Figure 21).Samples with Cl > S (in atom proportions) belong to the mineral species sodalite, whereassamples with S > Cl belong to sapozhnikovite. Slight deficiency of the Cl + S sum incomparison with the ideal value 2.00 atoms per formula unit (Table 1; Figure 21) is causedby the presence of minor amounts of H2O in these minerals [39], probably together withCl− and HS− anions in sodalite cages. The presence of water also explains slight deficiencyof analytical totals in all electron-microprobe analyses of sodalite–sapozhnikovite seriesminerals (Table 1).
Minerals 2022, 12, 887 25 of 31
Minerals 2022, 12, x FOR PEER REVIEW 24 of 31
In the interval [Cl1.11-0.38(HS)0.84-1.57], this homovalent isomorphous series is continu-ous (Figure 21). We suggest this interval is caused by geochemical features rather crystal chemical constraints.
Figure 21. Variations of the contents of Cl and S atoms per formula unit (apfu) in minerals belong-ing to the sodalite–sapozhnikovite solid-solution series from Karnasurt Mt., Lovozero massif, Kola Peninsula, Russia.
4. Discussion 4.1. General Remarks on the Isomorphism of Extra-Framework Components in Sodalite-Group Minerals
The general common formula of cubic alkaline aluminosilicates belonging to the sodalite group is ABNa6(Si6Al6O24)XY, where the pairs of cationic and anionic ex-tra-framework components AB + XY are Na2 + Cl2 for sodalite, Na2+(HS)2 for sapozhni-kovite, K +F(H2O)4 for bolotinaite, Na2+(SO4)(H2O) for nosean, Ca2+(SO4)2 for haüyne, and NaCa+(S3−)(SO4) for lazurite. However, the application of a complex of spectroscopic methods in this work and elsewhere [3,4,64] shows that the crystal chemistry of subor-dinated components in cubic sodalite-group aluminosilicates is much more complex. In particular, H+, H3O+, CO32−, OH−, S2−, S2−, S3, cis- and trans-S4−, SO32−, SO42−, cis-, trans- and gauche-S4, S6, CO2, COS, and HF were identified as extra-framework species in these minerals. Experiments with annealing show that these components take part in complex thermal conversions involving some additional components, e.g., oxalate anions. Similar transformations can occur in natural mineral assemblages. Thus, the composition of so-dalite-group minerals may serve as a marker of mineral-forming media including fugac-ities of volatile components (H2O, O2, CO2, HF, SO2, and polysulfide compounds).
Figure 21. Variations of the contents of Cl and S atoms per formula unit (apfu) in minerals belongingto the sodalite–sapozhnikovite solid-solution series from Karnasurt Mt., Lovozero massif, KolaPeninsula, Russia.
In the interval [Cl1.11-0.38(HS)0.84-1.57], this homovalent isomorphous series is continu-ous (Figure 21). We suggest this interval is caused by geochemical features rather crystalchemical constraints.
4. Discussion4.1. General Remarks on the Isomorphism of Extra-Framework Components inSodalite-Group Minerals
The general common formula of cubic alkaline aluminosilicates belonging to thesodalite group is ABNa6(Si6Al6O24)XY, where the pairs of cationic and anionic extra-framework components AB + XY are Na2 + Cl2 for sodalite, Na2+(HS)2 for sapozhnikovite,K
Minerals 2022, 12, x FOR PEER REVIEW 8 of 31
Ideally, sodalite, bolotinaite and sapozhnikovite are the end-members of the sol-id-solution system with the general formula [Na7( ,Na)](Si6Al6O24){Cl,HS,[F0.5(H2O)2]}2. However, natural samples of these minerals contain various extra-framework impurities (K, H3O+, SO42−, S2−, CO2, S4, HF, etc.) The Raman spectrum of sapozhnikovite in the range of 200–2500 cm−1 is very close to the spectrum of typical sodalite (Figures 2 and 3). The only significant distinctive feature of sapozhnikovite is a strong Raman band at 2553 cm−1 corresponding to stretching vibrations of HS− anions. Bolotinaite is the member of this solid-solution system most enriched in impurities (Table 1). In particular, it contains S2−, which is the cause of the yellow color of this mineral and its strong luminescence under laser beams (Figure 2).
In the NIR/Vis/UV absorption spectrum of Sample 1, strong bands with the maxima at 0.65, 0.88, 2.05, and 2.38 eV (respectively, 1900, 1400, 605, and 520 nm) as well as ab-sorption growth above 2.7 eV (460 nm) and a weak band at 1.33 eV (920 nm) are observed (Figure 4). The ESR spectrum of Sample 1 contains a sextet of Mn2+ ions in the low-spin state (S = ½ [51]) with g = 2.001, a strong single band with g = 2.002, and a weak band with g = 2.036 (Figure 5). Most probably, Mn2+ ions occur in calcite forming inclusions in haüyne individuals.
Figure 4. Absorption spectrum of haüyne (Sample 1, dotted curve). The black and red solid lines show the deconvolution of the doublet in the region of 2.0–2.5 eV into two peaks, and the total decomposition curve is shown with green color.
+F(H2O)4 for bolotinaite, Na2+(SO4)(H2O) for nosean, Ca2+(SO4)2 for haüyne, andNaCa+(S3
•−)(SO4) for lazurite. However, the application of a complex of spectroscopicmethods in this work and elsewhere [3,4,64] shows that the crystal chemistry of subor-dinated components in cubic sodalite-group aluminosilicates is much more complex. Inparticular, H+, H3O+, CO3
2−, OH−, S2−, S2•−, S3, cis- and trans-S4
•−, SO3•2−, SO4
•2−, cis-,trans- and gauche-S4, S6, CO2, COS, and HF were identified as extra-framework speciesin these minerals. Experiments with annealing show that these components take part incomplex thermal conversions involving some additional components, e.g., oxalate anions.Similar transformations can occur in natural mineral assemblages. Thus, the compositionof sodalite-group minerals may serve as a marker of mineral-forming media includingfugacities of volatile components (H2O, O2, CO2, HF, SO2, and polysulfide compounds).
Minerals 2022, 12, 887 26 of 31
In general, similar processes were observed in sulfur-enriched fluids [61,62]. Appar-ently, when heated, the channel widths increase, which allows complex anion radicals tomigrate and disproportionate with the formation of the most stable radical anion radicals(S3•− or S2
•−, depending on the redox conditions). Along with this, dehydration of thestudied samples also occurs, which also facilitates the migration of polysulfide species.
4.2. Sapozhnikovite as a Marker of Reducing Conditions
Experiments with heating of haüyne under reducing conditions (in the presence of Fe-FeS buffer) show that the main scheme of transformations of extra-framework componentsis SO4
2− → S2− + 2O2(gas), and a subordinate process is CO2 + 2SO42− + H2O→ 2HS−
+ CO32− + 4O2(gas). The conversions 3SO4
2− → S3•− +5e +6O2(gas), 2S3
•− → S2•− +
S4•−, and 2CO2 + 2e → C2O4
2− (e = electron) are the additional channels of haüynetransformations during their heating at 700 ◦C under reducing conditions.
Thus, HS− and C2O42− anions are stable only under reducing conditions. Data on the
occurrence of sapozhnikovite Na8(Al6Si6O24)(HS)2 confirm this conclusion. Crystallizationof aegirine NaFe3+Si2O6, which precedes formation of sapozhnikovite, could be accompa-nied by the following redox reactions: Na2O + 2FeO + 4SiO2 + CO2 → 2NaFeSi2O6 + CO;Na2O + 2FeO + 4SiO2 + 0.5CO2→ 2NaFeSi2O6 + 0.5C, where C is carbon with the oxidationdegree of 0 [39]. During the crystallization of aegirine, iron occurring as Fe2+ in the fluid isfixed as Fe3+ in the solid phase. Such processes are possible only in peralkaline media witha high Na:Ca ratio (otherwise, hedenbergite CaFe2+Si2O6 is formed instead of aegirine).Similar reactions, e.g., 2Na2O + 4FeO + 4SiO2 + 2SO3 + 2OH− + O2→ 4NaFeSi2O6 + 2HS−,could lead to the formation of reduced forms of sulfur, including HS− anions.
The redox processes in sodalite-group minerals discussed above involve species hostedby sodalite cages as well as gaseous O2. However, in the case of sapozhnikovite, analternative mechanism including incorporation of HS− as a result of the exchange reactionof sodalite with a late reduced fluid is not excluded.
Unlike CO2 molecules, carbonate anions rarely occur in sodalite-group minerals insignificant amounts. An unusual CO3
2−-bearing mineral with the sodalite-type framework,empirical formula (Na5.28K0.40Ca1.23Fe0.01)(Si5.93Al6.07O24.01)(SO4)0.77Cl0.94(CO3)0.30 andunit cell parameter a = 9.0352 Å has been discovered in a metasomatic ejectum from MountVesuvio, Italy and its crystal structure has been solved [65]. Taking into account above-described thermal transformations of CO2 in haüyne and the fact that the CO3-bearingsodalite-group mineral from Vesuvio underwent heating during metasomatism, it is rea-sonable to suppose that CO3
2− anions in this mineral were formed as a result of thetransformation CO2 + 2SO4
2− + H2O→ 2HS− + CO32− + 4O2(gas) in an initial sodalite-
group mineral. In the experiments with heating of haüyne under reducing conditions, CO2molecules occurring in sodalite cages partly transformed into neutral or acid oxalate an-ions. In this regard, the association of sapozhnikovite with kyanoxalite (a cancrinite-groupmineral containing neutral or acid oxalate anions) is indicative.
Experiments with annealing of sulfate sodalite-group minerals show that under high-temperature oxidizing conditions (in air, at 800 ◦C) S3
•− is the most stable sulfide species.Annealing of the preheated samples in air at 800 ◦C results in partial reverse transfor-mations: S2
•− + S2− + 2O2(gas)→ SO42−, S4
•− + S2•− → 2S3
•−, as well as subordinateprocesses S3
•− + 5e +6O2(gas)→ 3SO42− and C2O4
2− → 2CO2(gas) + 2e. The oxidation ofS3•− into SO4
2− can proceed only partly due to the charge-balance requirement.As noted above, S3
•− is a very strong blue chromophore and even trace amountsof this radical anion are detectable by Raman spectroscopy. However, S3
•− was notdetected in sapozhnikovite. The possible cause of this fact is a high concentration of lithiumin peralkaline rocks of the Lovozero massif (55 ppm, in average [66], whereas, e.g., inperalkaline rocks of the Khibiny massif, the mean Li content is only 20 ppm). Unlike othermetal cations, Li+ reacts with S3
•− to form a cyclic radical anion LiS3• with strong covalent
Li–S bonds [67], which results in the immobilization of S3•−. Kyanoxalite containing trace
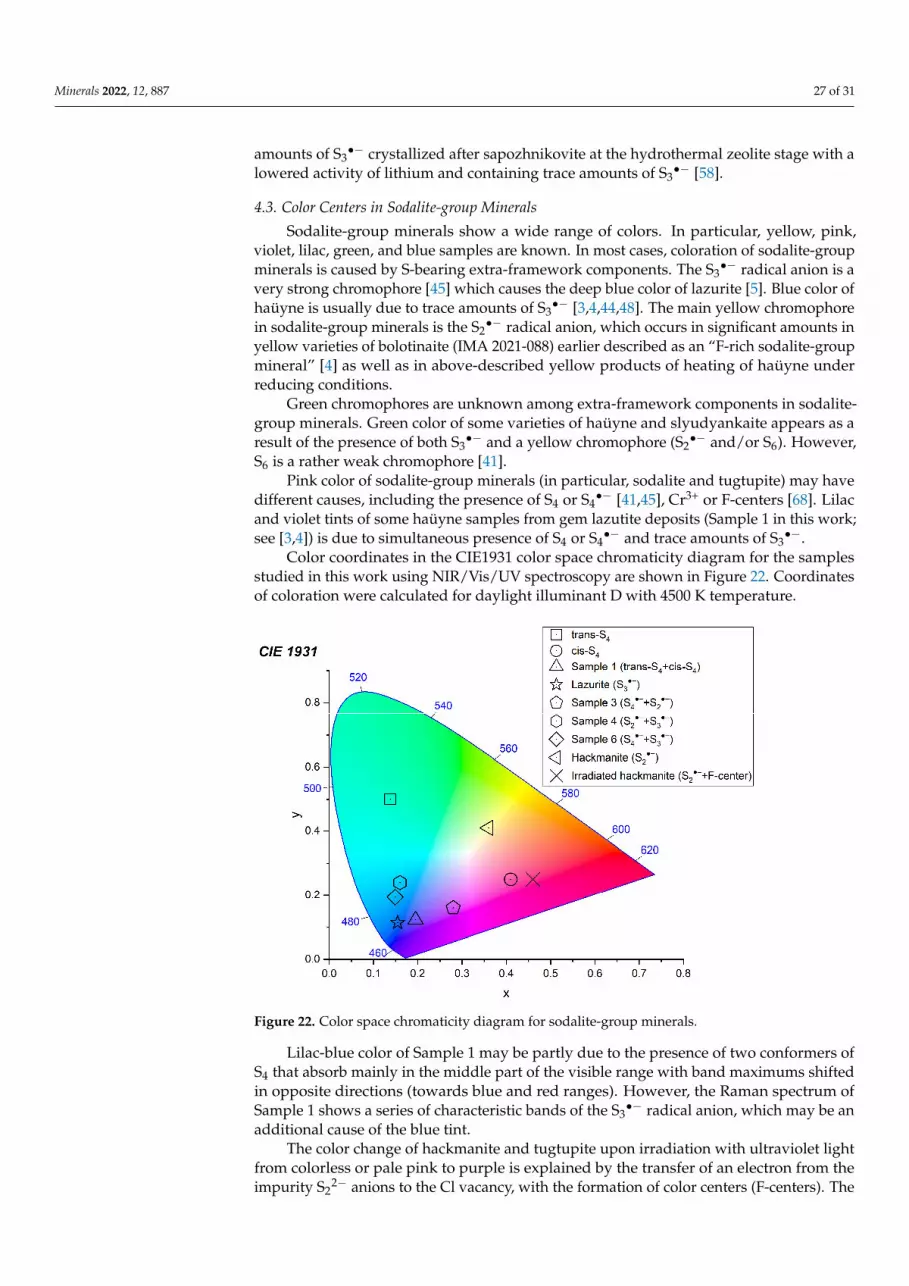
Minerals 2022, 12, 887 27 of 31
amounts of S3•− crystallized after sapozhnikovite at the hydrothermal zeolite stage with a
lowered activity of lithium and containing trace amounts of S3•− [58].
4.3. Color Centers in Sodalite-group Minerals
Sodalite-group minerals show a wide range of colors. In particular, yellow, pink,violet, lilac, green, and blue samples are known. In most cases, coloration of sodalite-groupminerals is caused by S-bearing extra-framework components. The S3
•− radical anion is avery strong chromophore [45] which causes the deep blue color of lazurite [5]. Blue color ofhaüyne is usually due to trace amounts of S3
•− [3,4,44,48]. The main yellow chromophorein sodalite-group minerals is the S2
•− radical anion, which occurs in significant amounts inyellow varieties of bolotinaite (IMA 2021-088) earlier described as an “F-rich sodalite-groupmineral” [4] as well as in above-described yellow products of heating of haüyne underreducing conditions.
Green chromophores are unknown among extra-framework components in sodalite-group minerals. Green color of some varieties of haüyne and slyudyankaite appears as aresult of the presence of both S3
•− and a yellow chromophore (S2•− and/or S6). However,
S6 is a rather weak chromophore [41].Pink color of sodalite-group minerals (in particular, sodalite and tugtupite) may have
different causes, including the presence of S4 or S4•− [41,45], Cr3+ or F-centers [68]. Lilac
and violet tints of some haüyne samples from gem lazutite deposits (Sample 1 in this work;see [3,4]) is due to simultaneous presence of S4 or S4
•− and trace amounts of S3•−.
Color coordinates in the CIE1931 color space chromaticity diagram for the samplesstudied in this work using NIR/Vis/UV spectroscopy are shown in Figure 22. Coordinatesof coloration were calculated for daylight illuminant D with 4500 K temperature.
Minerals 2022, 12, x FOR PEER REVIEW 26 of 31
amounts of S3− crystallized after sapozhnikovite at the hydrothermal zeolite stage with a lowered activity of lithium and containing trace amounts of S3− [58].
4.3. Color Centers in Sodalite-group Minerals Sodalite-group minerals show a wide range of colors. In particular, yellow, pink,
violet, lilac, green, and blue samples are known. In most cases, coloration of soda-lite-group minerals is caused by S-bearing extra-framework components. The S3– radical anion is a very strong chromophore [45] which causes the deep blue color of lazurite [5]. Blue color of haüyne is usually due to trace amounts of S3− [3,4,44,48]. The main yellow chromophore in sodalite-group minerals is the S2– radical anion, which occurs in signif-icant amounts in yellow varieties of bolotinaite (IMA 2021-088) earlier described as an “F-rich sodalite-group mineral” [4] as well as in above-described yellow products of heating of haüyne under reducing conditions.
Green chromophores are unknown among extra-framework components in soda-lite-group minerals. Green color of some varieties of haüyne and slyudyankaite appears as a result of the presence of both S3− and a yellow chromophore (S2− and/or S6). How-ever, S6 is a rather weak chromophore [41].
Pink color of sodalite-group minerals (in particular, sodalite and tugtupite) may have different causes, including the presence of S4 or S4− [41,45], Cr3+ or F-centers [68]. Lilac and violet tints of some haüyne samples from gem lazutite deposits (Sample 1 in this work; see [3,4]) is due to simultaneous presence of S4 or S4− and trace amounts of S3−.
Color coordinates in the CIE1931 color space chromaticity diagram for the samples studied in this work using NIR/Vis/UV spectroscopy are shown in Figure 22. Coordinates of coloration were calculated for daylight illuminant D with 4500 K temperature.
Lilac-blue color of Sample 1 may be partly due to the presence of two conformers of S4 that absorb mainly in the middle part of the visible range with band maximums shifted in opposite directions (towards blue and red ranges). However, the Raman spectrum of Sample 1 shows a series of characteristic bands of the S3●− radical anion, which may be an additional cause of the blue tint.
Figure 22. Color space chromaticity diagram for sodalite-group minerals.
Figure 22. Color space chromaticity diagram for sodalite-group minerals.
Lilac-blue color of Sample 1 may be partly due to the presence of two conformers ofS4 that absorb mainly in the middle part of the visible range with band maximums shiftedin opposite directions (towards blue and red ranges). However, the Raman spectrum ofSample 1 shows a series of characteristic bands of the S3
•− radical anion, which may be anadditional cause of the blue tint.
The color change of hackmanite and tugtupite upon irradiation with ultraviolet lightfrom colorless or pale pink to purple is explained by the transfer of an electron from theimpurity S2
2− anions to the Cl vacancy, with the formation of color centers (F-centers). The
Minerals 2022, 12, 887 28 of 31
absorption band of the F-centers is located at about 550 nm. The resulting S2•− radical
anions practically do not affect the color due to their low concentration and relativelylow oscillator strength. When irradiated with visible light, the F-centers disappear dueto the phototransfer of an electron back to S2
•−, and the crystals become colorless. Thisreversible color change is called tenebrescence or photochromism. It is noteworthy that thepresence of significant amounts of potassium in the mineral leads to the disappearance ofphotochromism: in hackmanite and tugtupite, where sodium sharply predominates amongthe extraframework cations, photochromism is observed, unlike haüyne, despite hauineusually containing a fairly large number of S2
•− centers. The causes of this are still beingdiscussed. Perhaps this phenomenon is due to the fact that when sodium is replaced bypotassium, either the value of the energy barrier for electron phototransfer from sulfur to avacancy changes, or the excited state of the F-center enters the conduction band. Radiationcoloring of haüyne does not change the visible color caused by F-centers. The presence ofFe3+ and Ti3+ impurities also affects the intensity of photochromic color and luminescenceof S2
•− radical anions [69].Other possible radical anions in minerals of the sodalite group are SO4
•− и SO3•−.
The most intense absorption band of SO4•− is located at about 450 nm and the second band
is at about 300 nm in Na2S2O8 [70]. It was noted in [71] that there is an electron transferbetween Fe2+ и SO4
•− with the formation of Fe3+ и SO42−. Thus, the presence of SO4
•− inthe mineral can lead to the loss of the blue color. The radical anion SO3
•− absorbs in theregion of about 280 nm and does not affect the color [70].
5. Conclusions
Application of a complex of spectroscopic methods to sodalite-group minerals andproducts of their thermal conversions made it possible to identify various S- and C-bearingextra-framework components, including SO4
2−, HS−, S2−, CO32−, C2O4
2−, HC2O4−, Cl−,
and F− anions S2•−, S3
•−, S4•−, and S6
•− radical anions as well as CO2, H2O, and S4 neutralmolecules. The composition of extra-framework species in sodalite-group minerals mayserve as a marker of mineral-forming media including fugacities of volatile components(H2O, O2, CO2, HF, SO2, and polysulfide compounds). Complex mutual transformationsof these components are observed during heating at high temperatures. The schemeof transformations of extra-framework components in SO4
2−-bearing members of thesodalite group during their heating at 700 ◦C under reducing conditions includes theelementary processes SO4
2− → S2− + 2O2(gas), CO2 + 2SO42− + H2O→ 2HS− + CO3
2−
+ 4O2(gas). 3SO42− → S3
•− +5e +6O2(gas), 2S3•− → S2
•− + S4•−, and 2CO2 + 2e →
C2O42− (e = electron). Subsequent annealing in air at 800 ◦C results in the partial reverse
transformations S2•− + S2− + 2O2(gas)→ SO4
2−, S4•− + S2
•−→ 2S3•−, S3
•− + 5e +6O2(gas)→ 3SO4
2−, and C2O42− → 2CO2(gas) + 2e.
Based on these data, it can be concluded that natural HS−- and CO20-bearing sodalite-
group minerals can be formed under reducing conditions and as a result of thermal trans-formation of an initial mineral, respectively. In this respect, the occurrence of the HS−-dominant mineral sapozhnikovite in association with the oxalate-rich cancrinite-type min-eral kyanoxalite in agpaitic rocks [58] and the occurrence of a CO3
2−-bearing sodalite-groupmineral in a metasomatic volcanic ejectum [65] are indicative.
Normally, the oxalate group is unstable at temperatures higher than 500 ◦C. However,it was shown that the occurrence of oxalate anions in wide channels of cancrinite-groupminerals is a stabilizing factor. In particular, oxalate anions in kyanoxalite decompose at700 ◦C [72]. New data obtained in this work show that oxalate groups in sodalite cages arerelatively stable up to 700 ◦C and decompose at 800 ◦C. Earlier we have shown that similarstabilization of nitrate anion takes place in cancrinite channels [73].
Color variations of sodalite-group minerals are mainly caused by the presence ofS-bearing chromophores, S3
•− (blue), S2•− and/or S6 (yellow), S4
•− and/or S4 (red). Greencolor is due to the simultaneous presence of blue and yellow chromophores.
Minerals 2022, 12, 887 29 of 31
Author Contributions: Conceptualization, N.V.C., R.Y.S. and I.V.P.; methodology, N.V.C., R.Y.S.,M.F.V., V.D.S. and D.A.V.; collecting of minerals, A.N.S.; investigation, R.Y.S., M.F.V., V.D.S., I.V.P.and D.A.V.; original manuscript draft preparation, N.V.C., A.N.S. and R.Y.S.; manuscript review andediting, R.Y.S., N.V.C., I.V.P. and D.A.V.; figures, N.V.C., R.Y.S. and V.D.S. All authors have read andagreed to the published version of the manuscript.
Funding: All spectroscopic studies, as well as full investigation of the sodalite-sapozhnikovite seriesof minerals from the Lovozero massif, were supported by the Russian Science Foundation, grantNo. 22-17-00006, https://rscf.ru/project/22-17-00006/. Collecting of sodalite-group minerals andidentification and chemical analyses of minerals from the Malo-Bystrinskoe deposit were carried outin accordance with the state task, state registration No. AAA-A19-119092390076-7.
Data Availability Statement: Not applicable.
Conflicts of Interest: The authors declare no conflict of interest.
References1. Baerlocher, C.; McCusker, L.B. Database of Zeolite Structures, (n.d.). Available online: http://www.iza-structure.org/databases/
(accessed on 16 June 2022).2. Fischer, R.X.; Baur, W.H. Symmetry relationships of sodalite (SOD)-type crystal structures. Z. Krist. 2009, 224, 185–197. [CrossRef]3. Chukanov, N.V.; Vigasina, M.F.; Zubkova, N.V.; Pekov, I.V.; Schäfer, C.; Kasatkin, A.V.; Yapaskurt, V.O.; Pushcharovsky, D.Y.
Extra-framework content in sodalite-group minerals: Complexity and new aspects of its study using infrared and Ramanspectroscopy. Minerals 2020, 10, 363. [CrossRef]
4. Chukanov, N.V.; Sapozhnikov, A.N.; Shendrik, R.Y.; Vigasina, M.F.; Steudel, R. Spectroscopic and crystal-chemical features ofsodalite-group minerals from gem lazurite deposits. Minerals 2020, 10, 1042. [CrossRef]
5. Sapozhnikov, A.N.; Chukanov, N.V.; Shendrik, R.Y.; Vigasina, M.F.; Tauson, V.L.; Lipko, S.V.; Belakovskiy, D.I.; Levitskiy, V.I.;Suvorova, L.F.; Ivanova, L.A. Lazurite: Confirmation of the status as a mineral species with the formula Na7Ca(Al6Si6O24)(SO4)S3•−·H2O and new data. Zap. Ross. Mineral. Obs. (Proc. Russ. Mineral Soc.) 2021, 150, 92–102. [CrossRef]
6. Shchipalkina, N.V.; Pekov, I.V.; Koshlyakova, N.N.; Britvin, S.N.; Zubkova, N.V.; Varlamov, D.A.; Sidorov, E.G. Unusual silicatemineralization in fumarolic sublimates of the Tolbachik volcano, Kamchatka, Russia—Part 2: Tectosilicates. Eur. J. Mineral. 2020,32, 121–136. [CrossRef]
7. Chukanov, N.V.; Aksenov, S.M.; Rastsvetaeva, R.K. Structural chemistry, IR spectroscopy, properties, and genesis of natural andsynthetic microporous cancrinite- and sodalite-related materials: A review. Micropor. Mesopor. Mater. 2021, 323, 111098. [CrossRef]
8. Gobeltz-Hautecoeur, N.; Demortier, A.; Lede, B.; Lelieur, J.P.; Duhayon, C. Occupancy of the sodalite cages in the blue ultramarinepigments. Inorg. Chem. 2002, 41, 2848–2854. [CrossRef]
9. Heil, C.; Cataldo, S.; Bachelet, G.B.; Boeri, L. Superconductivity in sodalite-like yttrium hydride clathrates. Phys. Rev. B Condens.Matter. 2019, 99, 220502(R). [CrossRef]
10. Ogura, M.; Morozumi, K.; Elangovan, S.P.; Tanada, H.; Ando, H.; Okubo, T. Potassium-Doped sodalite: A tectoaluminosilicate forthe catalytic material towards continuous combustion of carbonaceous matters. Appl. Catal. B 2008, 77, 294–299. [CrossRef]
11. Shanbhag, G.V.; Choi, M.; Kim, J.; Ryoo, R. Mesoporous sodalite: A novel, stable solid catalyst for base-catalyzed organictransformations. J. Catal. 2009, 264, 88–92. [CrossRef]
12. Sachse, A.; Galarneau, A.; Renzo, F.D.; Fajula, F.; Coq, B. Synthesis of zeolite monoliths for flow continuous processes. The case ofsodalite as a basic catalyst. Chem. Mater. 2010, 22, 4123–4125. [CrossRef]
13. Hiyoshi, N. Nanocrystalline sodalite: Preparation and application to epoxidation of 2-cyclohexen-1-one with hydrogen peroxide.Appl. Catal. 2012, 419–420, 164–169. [CrossRef]
14. Manique, M.C.; Lacerda, L.V.; Alves, A.K.; Bergmann, C.P. Biodiesel production using coal fly ash-derived sodalite as aheterogeneous catalyst. Fuel 2017, 190, 268–273. [CrossRef]
15. Wang, S.; Zhao, Z.-J.; Chang, X.; Zhao, J.; Tian, H.; Yang, C.; Li, M.; Fu, Q.; Mu, R.; Gong, J. Activation and spillover of hydrogenon sub-1 nm palladium nanoclusters confined within sodalite zeolite for the semi-hydrogenation of alkynes. Angew. Chem. Int.Ed. 2019, 58, 7668–7672. [CrossRef]
16. Khajavi, S.; Jansen, J.C.; Kapteijn, F. Production of ultra pure water by desalination of seawater using a hydroxyl sodalitemembrane. J. Membr. Sci. 2010, 356, 52–57. [CrossRef]
17. Nabavi, M.S.; Mohammadi, T.; Kazemimoghadam, M. Hydrothermal synthesis of hydroxyl sodalite zeolite membrane: Separationof H2/CH4. Ceram. Int. 2014, 40, 5889–5896. [CrossRef]
18. Kalantari, N.; Vaezi, M.J.; Yadollahi, M.; Babaluo, A.A.; Bayati, B.; Kazemzadeh, A. Synthesis of nanostructure hydroxysodalitecomposite membranes via hydrothermal method: Support surface modification and synthesis method effects. Asia-Pac. J. Chem.Eng. 2015, 10, 45–55. [CrossRef]
19. Wei, X.-L.; Pan, W.-Y.; Li, X.; Pan, M.; Huo, C.-F.; Yang, R.; Chao, Z.-S. MCM-22 zeolite-induced synthesis of thin sodalite zeolitemembranes. Chem. Mater. 2020, 32, 333–340. [CrossRef]
Minerals 2022, 12, 887 30 of 31
20. Yang, G.; Guo, H.; Kang, Z.; Feng, S.; Zhao, L.; Mintova, S. Sandwich-type H2/CO2 membranes comprising of graphene oxideand sodalite crystals with adjustable morphology and size. Micropor. Mesopor. Mater. 2020, 300, 110120. [CrossRef]
21. Eterigho-Ikelegbe, O.; Bada, S.O.; Daramola, M.O. Preparation and evaluation of nanocomposite sodalite/α-Al2O3 tubularmembranes for H2/CO2 separation. Membranes 2020, 10, 312. [CrossRef]
22. Eden, C.L.; Daramola, M.O. Evaluation of silica sodalite infused polysulfone mixed matrix membranes during H2/CO2 separation.Mater. Today Proc. 2021, 38, 522–527. [CrossRef]
23. Ntshangase, N.C.; Sadare, O.O.; Daramola, M.O. Effect of silica sodalite functionalization and PVA coating on performance ofsodalite infused PSF membrane during treatment of acid mine drainage. Membranes 2021, 11, 315. [CrossRef] [PubMed]
24. Navarro, J.A.R.; Barea, E.; Salas, J.M.; Masciocchi, N.; Galli, S.; Sironi, A.; Ania, C.O.; Parra, J.B. H2, N2, CO, and CO2 sorptionproperties of a series of robust sodalite-type microporous coordination polymers. Inorg. Chem. 2006, 45, 2397–2399. [CrossRef][PubMed]
25. Asgari, A.; Jawahery, S.; Bloch, E.D.; Hudson, M.R.; Flacau, R.; Vlaisavljevich, B.; Long, J.R.; Brown, C.M.; Queen, W.L. Anexperimental and computational study of CO2 adsorption in the sodalite-type M-BTT (M = Cr, Mn, Fe, Cu) metal–organicframeworks featuring open metal sites. Chem. Sci. 2018, 9, 4579–4588. [CrossRef]
26. Wang, Y.; Jiang, Y.; Hu, S.; Peng, S.; Xu, C.; Lu, A. Dehydrated Na6[AlSiO4]6 sodalite as a promising SO2 sorbent material: A firstprinciples thermodynamics prediction. J. Amer. Ceram. Soc. 2019, 102, 3663–3672. [CrossRef]
27. Asgari, M.; Semino, R.; Schouwink, P.A.; Kochetygov, I.; Tarver, J. Understanding how ligand functionalization influences CO2and N2 adsorption in a sodalite metal-organic framework. Chem. Mater. 2020, 32, 1526–1536. [CrossRef]
28. Dickson, J.O.; Harsh, J.B.; Lukens, W.W.; Pierce, E.M. Perrhenate incorporation into binary mixed sodalites: The role of anion sizeand implications for technetium-99 sequestration. Chem. Geol. 2015, 395, 138–143. [CrossRef]
29. Gilbert, M.R. Pressureless sintering of sodalite waste-forms for the immobilization of pyroprocessing wastes. In MRS OnlineProceedings Library (OPL): Symposium EE—Scientific Basis for Nuclear Waste Management XXXVIII; Cambridge University Press:cambrige, UK, 2015; Volume 1744, pp. 61–66. [CrossRef]
30. Luksic, S.A.; Riley, B.J.; Parker, K.E.; Hrma, P. Sodalite as a vehicle to increase Re retention in waste glass stimulant duringvitrification. J. Nucl. Mater. 2016, 479, 331–337. [CrossRef]
31. Vance, E.R.; Gregg, D.J.; Grant, C.; Stopic, A.; Maddrell, E.R. Silver iodide sodalite for 129I immobilization. J. Nucl. Mater. 2016,480, 177–181. [CrossRef]
32. Lilova, K.; Pierce, E.M.; Wu, L.; Jubb, A.M.; Subramani, T.; Navrotsky, A. Energetics of salt-bearing sodalites, Na8Al6Si6O24X2(X = SO4, ReO4, Cl, I): A treatment option for pertechnetate-enriched nuclear waste streams. ACS Earth Space Chem. 2020, 4,2153–2161. [CrossRef]
33. Grajciar, L. PbS clusters embedded in sodalite zeolite cavities of different compositions: Unraveling the structural evolution andoptical properties using ab initio calculations. J. Phys. Chem. 2016, C120, 27050–27065. [CrossRef]
34. Van den Berg, A.W.C.; Bromley, S.T.; Jansen, J.C. Thermodynamic limits on hydrogen storage in sodalite framework materials:A molecular mechanics investigation. Micropor. Mesopor. Mater. 2005, 78, 63–71. [CrossRef]
35. Zheng, Z.; Guliants, V.V.; Misture, S. Sodalites as ultramicroporous frameworks for hydrogen separation at elevated temperatures:Thermal stability, template removal, and hydrogen accessibility. J. Porous Mater. 2009, 16, 343–347. [CrossRef]
36. Rüscher, C.H.; Stemme, F.; Schomborg, L.; Buhl, J.-C. Low temperature hydrogen release from borontetrahydride-sodalite and itsreloading: Observations in in situ and ex situ TIR experiments. In Ceramics for Environmental and Energy Applications; Boccaccini,A., Marra, J., Dogan, F., Lin, H.-T., Watanabe, T., Eds.; John Wiley & Sons, Inc.: Hoboken, NJ, USA, 2010; pp. 65–70.
37. Gong, Y.-N.; Meng, M.; Zhong, D.-C.; Huang, Y.-L.; Jiang, L.; Lu, T.-B. Counter-Cation modulation of hydrogen and methanestorage in a sodalite-type porous metal–organic framework. Chem. Commun. 2012, 48, 12002–12004. [CrossRef]
38. Sapozhnikov, A.N.; Bolotina, N.B.; Chukanov, N.V.; Kaneva, E.V.; Shendrik, R.Y.; Vigasina, M.F.; Ivanova, L.A. IMA Commissionon New Minerals, Nomenclature and Classification (CNMNC)—Newsletter 65. Eur. J. Mineral. 2022, 34, 143–148. [CrossRef]
39. Chukanov, N.V.; Zubkova, N.V.; Pekov, I.V.; Shendrik, R.Y.; Varlamov, D.A.; Vigasina, M.F.; Belakovskiy, D.I.; Britvin, S.N.;Yapaskurt, V.O.; Pushcharovsky, D.Y. Sapozhnikovite, Na8(Al6Si6O24)(HS)2, a new sodalite-group mineral from the Lovozeroalkaline massif, Kola Peninsula. Mineral. Mag. 2022, 86, 49–59. [CrossRef]
40. Rejmak, P. Computational refinement of the puzzling red tetrasulfur chromophore in ultramarine pigments. Phys. Chem. Chem.Phys. 2020, 22, 22684–22698. [CrossRef]
41. Eckert, B.; Steudel, F. Molecular spectra of sulfur molecules and solid sulfur allotropes. Top. Curr. Chem. 2003, 231, 31–97.[CrossRef]
42. Hettmann, K.; Wenzel, T.; Marks, M.; Markl, G. The sulfur speciation in S-bearing minerals: New constraints by a combination ofelectron microprobe analysis and DFT calculations with special reference to sodalite-group minerals. Amer. Mineral. 2012, 97,1653–1661. [CrossRef]
43. Ling, Z.C.; Wang, A.; Jolliff, B.L. Mineralogy and geochemistry of four lunar soils by laser-Raman study. Icarus 2011, 211, 101–113.[CrossRef]
44. Sapozhnikov, A.N.; Tauson, V.L.; Lipko, S.V.; Shendrik, R.Y.; Levitskii, V.I.; Suvorova, L.F.; Chukanov, N.V.; Vigasina, M.F. On thecrystal chemistry of sulfur-rich lazurite, ideally Na7Ca(Al6Si6O24)(SO4)(S3)–·nH2O. Amer. Mineral. 2021, 106, 226–234. [CrossRef]
45. Steudel, R. Inorganic polysulfides Sn2− and radical anions Sn
•−. In Elemental Sulfur und Sulfur-Rich Compounds II. Topics in CurrentChemistry; Steudel, R., Ed.; Springer: Berlin/Heidelberg, Germany, 2003; Volume 231.

Minerals 2022, 12, 887 31 of 31
46. Steudel, R.; Chivers, T. The role of polysulfide dianions and radical anions in the chemical, physical and biological sciences,including sulfur-based batteries. Chem. Soc. Rev. 2019, 48, 3279–3319 and 4338. [CrossRef]
47. Wong, M.W.; Steudel, R. Structure and spectra of tetrasulfur S4—An ab initio MO study. Chem. Phys. Lett. 2003, 379, 162–169.[CrossRef]
48. Caggiani, M.C.; Mangone, A.; Aquafredda, P. Blue coloured haüyne from Mt. Vulture (Italy) volcanic rocks: SEM-EDS and Ramaninvestigation of natural and heated crystals. J. Raman Spectrosc. 2022, 53, 956–968. [CrossRef]
49. Bény, C.; Guilhaumou, N.; Touray, J.-C. Native-Sulphur-Bearing fluid inclusions in the CO2-H2S-H2O-S system—Microthermometryand Raman microprobe (MOLE) analysis—Thermochemical interpretations. Chem. Geol. 1982, 37, 113–127. [CrossRef]
50. Dubessy, J.; Boiron, M.-C.; Moissette, A.; Monnion, C.; Sretenskaya, N. Determination of water, hydrates and pH in fluid inclusionsby micro-Raman spectrometry. Eur. J. Mineral. 1992, 4, 885–894. [CrossRef]
51. Kaneva, E.; Shendrik, R.; Mesto, E.; Bogdanov, A.; Vladykin, N. Spectroscopy and crystal chemical properties of NaCa2[Si4O10]Fnatural agrellite with tubular structure. Chem. Phys. Lett. 2020, 738, 136868. [CrossRef]
52. Weser, G.; Hensel, F.; Warren, W.W. The optical absorption spectrum of fluid sulfur up to supercritical conditions. Ber. Bunsenges.Phys. Chem. 1978, 82, 588–594. [CrossRef]
53. Paniz, H.; Lester, A. Vibronic absorption spectra of S3 and S4, in solid argon. J. Phys. Chem. 1992, 96, 6579–6585.54. Annersten, H.; Haseeb, A. Blue sodalite. Canad. Mineral. 1979, 17, 39–46.55. Radomskaya, T.A.; Kaneva, E.V.; Shendrik, R.Y.; Suvorova, L.F.; Vladykin, N.V. Sulfur-Bearing sodalite, hackmanite, in alkaline
pegmatites of the Inagli massif (Aldan Shield): Crystal chemistry, photochromism, and luminescence. Geol. Ore Depos. 2021, 63,696–704. [CrossRef]
56. Tauson, V.L.; Akimov, V.V.; Sapozhnikov, A.N.; Kuznetzov, K.E. Investigation of the stability conditions and structural-chemicaltransformations of Baikal lazurite. Geochem. Int. 1998, 36, 717–733.
57. Rastsvetaeva, R.K.; Sapozhnikov, A.N.; Tauson, V.L.; Kashaev, A.A. Crystal structure of sulfide sodalite, a product of sulfatesulfur reduction in lazurite. Dokl. Akad. Nauk. 1997, 356, 773–776. (In Russian)
58. Chukanov, N.V.; Vigasina, M.F.; Shendrik, R.Y.; Varlamov, D.A.; Pekov, I.V.; Zubkova, N.V. Nature and Isomorphism of Extra-Framework Components in cancrinite- and sodalite-related minerals: New data. Minerals 2022, 12, 729. [CrossRef]
59. Steudel, R.; Jensen, D.; Göbel, P.; Hugo, P. Optical absorption spectra of the homocyclic sulfur molecules Sn (n = 6, 7, 8, 9, 10, 12,15, 20) in solution. Ber. Bunsenges. Phys. Chem. 1988, 92, 118–122. [CrossRef]
60. Raulin, K.; Gobeltz, N.; Vezin, H.; Touat, N.; Ledé, B.; Moissette, A. Identification of the EPR signal of S2− in green ultramarine
pigments. Phys. Chem. Chem. Phys. 2011, 13, 9253–9259. [CrossRef]61. Pokrovski, G.S.; Dubrovinsky, L.S. The S3
− ion is stable in geological fluids at elevated temperatures and pressures. Science 2011,331, 1052–1054. [CrossRef]
62. Pokrovski, G.S.; Dubessy, J. Stability and abundance of the trisulfur radical ion S3− in hydrothermal fluids. Earth Planet. Sci. Lett.
2015, 411, 298–309. [CrossRef]63. Arieli, D.; Vaughan, D.E.W.; Goldfarb, D. New synthesis and insight into the structure of blue ultramarine pigments. J. Amer.
Chem. Soc. 2004, 126, 5776–5788. [CrossRef]64. Ostroumov, M.; Fritsch, E.; Faulques, E.; Chauvet, O. Etude spectrometrique de la lazurite du Pamir, Tajikistan. Canad. Mineral.
2002, 40, 885–893. [CrossRef]65. Ballirano, O.; Maras, A. Crystal chemical and structural characterization of an unusual CO3-bearing sodalite-group mineral. Eur.
J. Mineral. 2005, 17, 805–812. [CrossRef]66. Gerasimovskiy, V.I.; Volkov, V.P.; Kogarko, L.N.; Polyalov, A.I.; Saprykina, T.V.; Balashov, Y.A. Geochemistry of the Lovozero Alkaline
Massif ; Nauka: Moskow, Russia, 1966. (In Russian)67. Zhang, B.; Wu, J.; Gu, J.; Li, S.; Yan, T.; Gao, X.-P. The fundamental understanding of lithium polysulfides in ether-based electrolyte
for lithium-sulfur batteries. ACS Energy Lett. 2021, 6, 537–546. [CrossRef]68. Finch, A.A.; Friis, H.; Maghrabi, M. Defects in sodalite-group minerals determined from X-ray-induced luminescence. Phys.
Chem. Miner. 2016, 43, 481–491. [CrossRef]69. Agamah, C.; Vuori, S.; Colinet, P.; Norrbo, I.; Miranda de Carvalho, J.; Key, L.; Nakamura, O.; Lindblom, J.; van Goethem, L.;
Emmermann, A.; et al. Hackmanite—The natural glow-in-the-dark material. Chem. Mater. 2020, 32, 8895–8905. [CrossRef]70. Huie, R.E.; Clifton, C.L.; Altstein, N. A pulse radiolysis and flash photolysis study of the radicals SO2
−, SO3−, SO4
− and SO5−.
Int. J. Radiat. Appl. Instr. Part C Radiat. Phys. Chem. 1989, 33, 361–370. [CrossRef]71. McElroy, W.J.; Waygood, S.J. Kinetics of the reactions of the SO4
− radical with SO4−, S2O8
2−, H2O and Fe2+. J. Chem. Soc. FaradayTrans. 1990, 86, 2557. [CrossRef]
72. Olysych, L.V.; Vigasina, M.F.; Melchakova, L.V.; Pekov, I.V.; Chukanov, N.V. Study of thermal decomposition of the cancrinite-kyanoxalite solid-solution series minerals. In Proceedings of the Abstracts of XXVII International Conference “Geochemistry ofMagmatic Rocks”, Moscow, Russia, 9–16 September 2010; pp. 135–136.
73. Chukanov, N.V.; Zubkova, N.V.; Buhl, J.-C.; Pekov, I.V.; Ksenofontov, D.A.; Depmeier, W.; Pushcharovskii, D.Y. Crystal structureof nitrate cancrinite synthesized under low-temperature hydrothermal conditions. Dokl. Earth Sci. 2011, 438, 669–672. [CrossRef]


