Embed Size (px)
Citation preview
Abstract When driving a vehicle on the road, the driver has to compensate continuously for small directional deviations from the desired course due to disturbances such as crosswinds, road irregularities and unintended driver inputs. These types of deviations have a tiring effect on the driver and should therefore be minimised. When the magnitude of these disturbances increases, especially with crosswind, the directional deviation might become so large that the driver will have difficulties in compensating for it, and will thereby affect the traffic safety. The objective of this research work is to increase the understanding of the crosswind sensitivity of buses and to find solutions to the problem of improving the safety of buses with respect to crosswind performance. The work presented in this thesis contributes to increased knowledge about the directional stability of buses under the influence of crosswind gusts through parameter studies using detailed vehicle simulation models, through full-scale experiments and through studies of the effect of steering feel on the subjective and objective evaluation of crosswind performance.
A natural crosswind gust model has been derived from wind tunnel measurements and implemented in a multi-body dynamics simulation tool. The aerodynamic loads of the crosswind gust model have been applied on a detailed vehicle model and the behaviour of the vehicle model has been studied for various vehicle configurations in both open- and closed-loop manoeuvres. The vehicle model, with parameters corresponding to real vehicle data, has been validated and the agreement with measurements is good. A method for estimating the aerodynamic loads on a bus due to crosswind on a road section is also presented. Aerodynamic loads under real conditions were estimated using this method and these data were thereafter used in a study where the effect of steering feel on the subjective and objective evaluation of crosswind performance was investigated using a moving-base driving simulator, with the aim of finding a relationship between steering feel and crosswind sensitivity.
The thesis covers the influence of changing chassis-related parameters and aerodynamics-related parameters on the crosswind sensitivity, as well as the influence of the setting of the steering system on the crosswind performance of the driver-vehicle system. The results identify areas of high potential for improving the crosswind sensitivity of buses, such as the centre of gravity location and the yaw moment overshoot at gust entry. Furthermore, the study shows the importance of having a vehicle that facilitates prompt driver corrections for reducing the lateral deviation under crosswind excitation; i.e. it is shown that a steering system with the possibility of changing the yaw rate gradient referencing the steering-wheel input when the vehicle is subjected to a sudden crosswind has a good potential for improving the crosswind performance of the driver-vehicle system.
i

Acknowledgements
The research work forming this thesis has been carried out at SCANIA in Södertälje and at KTH Vehicle Dynamics at the Department of Aeronautical and Vehicle Engineering in Stockholm, and its duration was from September 2002 until December 2008. Financial support was provided by Vägverket (The Swedish National Road Administration) and SCANIA, which is gratefully acknowledged. This research project has since 2006 been integrated in the Crosswind Project within the “Centre for ECO2 Vehicle Design”.
There are a number of persons to whom I would like to express my gratitude:
My supervisor, Professor Annika Stensson Trigell, for giving me the opportunity to perform this research work and for her never-ending enthusiasm in the pursuit of interesting research projects. Dr Peter Eriksson, my co-supervisor, for his solid support throughout this project.
The members of the Steering Committee of the Directional Stability of Buses and Trucks Project, especially Jan Petzäll at Vägverket, who initiated the project, and Erik Dahlberg and Dick Andersson for supporting my choices concerning the direction of the research.
Göran Palmkvist and Håkan Jansson at VTI for their help with the driving simulator vehicle model and the layout of the driving scenario, and for sharing their vast experience of driving simulators and related experiments.
Björn Rickfält for the invaluable support when the measuring rims broke down and for letting Markuu Ovaska help me with the calibration. Lars-Åke Dahlqvist for his expertise in data acquisition and invaluable help with troubleshooting. Per Elofsson for the help regarding the instrumentation for measuring the wind velocity. Fredrik Sjödin for the introduction to the RPC Pro software.
The mechanics at the bus workshop at SCANIA R&D for helping me with various tasks when setting up buses for experiments.
The staff at the SCANIA Library, Göran Henriksson and Iréne Wahlqvist, for enormous help with finding and providing literature and being service-minded.
Present and former colleagues for support concerning simulation models and software and for providing an inspiring working environment.
I would also like to extend my gratitude to present and former managers at SCANIA for giving me the opportunity to carry out this research as an industrial PhD student.
Finally, I would like to express my gratitude to my family, Sara and Isac, for their support and patience.
Södertälje, April 2009
Magnus Juhlin
iii

Dissertation This thesis comprises an introduction to the area, an overview of the performed research and five appended papers:
Paper A Directional stability of buses under influence of crosswind gusts. Magnus Juhlin Presented at the 18th IAVSD Symposium, Kanagawa, Japan, August 25-29, 2003. Published in Supplement to Vehicle System Dynamics, Vol. 41, pp. 93-102, 2004. Contribution by author: Proposed the method, derived the crosswind gust model, implemented the crosswind gust model, planned and performed the simulations, analysed the results and wrote the paper.
Paper B A vehicle parameter study on crosswind sensitivity of buses. Magnus Juhlin and Peter Eriksson Presented at the Commercial Vehicles Engineering Congress and Exhibition, Rosemont, Illinois, October 26-28, 2004. Published as SAE Technical Paper, 2004-01-2612, 2004. Contribution by author: Proposed the method, planned and performed the simulations, analysed the results and wrote the paper.
Paper C Aerodynamic loads on buses due to crosswind gusts – on-road measurements. Magnus Juhlin Presented at the 20th IAVSD Symposium, Berkeley, USA, August 13-17, 2007. Published in Vehicle System Dynamics, Vol. 46:1, pp. 827-835, 2008. Contribution by author: Proposed the method, planned, prepared and performed the experiment, performed the simulations, analysed the results and wrote the paper.
Paper D The effect of steering feel on the crosswind performance of buses – Part I: Subjective assessment. Magnus Juhlin, Peter Eriksson and Annika Stensson Trigell Submitted for publication. Contribution by author: Proposed the method, planned, prepared and performed the experiment, analysed the results and wrote the paper.
v
Paper E The effect of steering feel on the crosswind performance of buses – Part II: Objective assessment. Magnus Juhlin, Peter Eriksson and Annika Stensson Trigell Submitted for publication. Contribution by author: Proposed the method, planned, prepared and performed the experiment, analysed the results and wrote the paper.
vi
Contents 1 Introduction ..........................................................................................................1
1.1 Buses and coaches ...........................................................................................1 1.2 Crosswind performance ...................................................................................2 1.3 Objectives ........................................................................................................3 1.4 Outline of thesis...............................................................................................3
2 Dynamics of road vehicles .................................................................................5 2.1 Road vehicle dynamics ....................................................................................5 2.2 Road vehicle aerodynamics ...........................................................................10
3 Previous work on crosswind performance....................................................15 3.1 The 1960s ......................................................................................................15 3.2 The 1970s ......................................................................................................16 3.3 The 1980s ......................................................................................................18 3.4 The 1990s ......................................................................................................22 3.5 The 21st century ............................................................................................24
4 Contributions to assessment of crosswind performance ...........................27 4.1 Modelling of crosswind performance ............................................................27 4.2 Estimating aerodynamic load.........................................................................33 4.3 Simulation of crosswind performance ...........................................................34 4.4 Moving-base driving simulator tests..............................................................38 4.5 Improved driver-vehicle performance ...........................................................41
5 Discussion and conclusions .............................................................................45 6 Recommendations for future work ................................................................47 7 Summary of papers ...........................................................................................49 References ...................................................................................................................53 Notation.......................................................................................................................57
vii

1 Introduction
1.1 Buses and coaches
In the early 19th century mankind started to travel in a modern way. This was due to industrialisation, which was in need of mobile labour. The first efficient transport system for long-distance travel was the railway. In the 1830s and 1840s public transport systems were established in major European cities, and the horse-drawn omnibus became a common feature in city traffic. The horse-drawn buses were followed by steam engine buses, although the latter were not always appreciated due to contamination and noise. At the end of the 19th century the steam engine was replaced by electric motors and soon came the internal combustion engine.
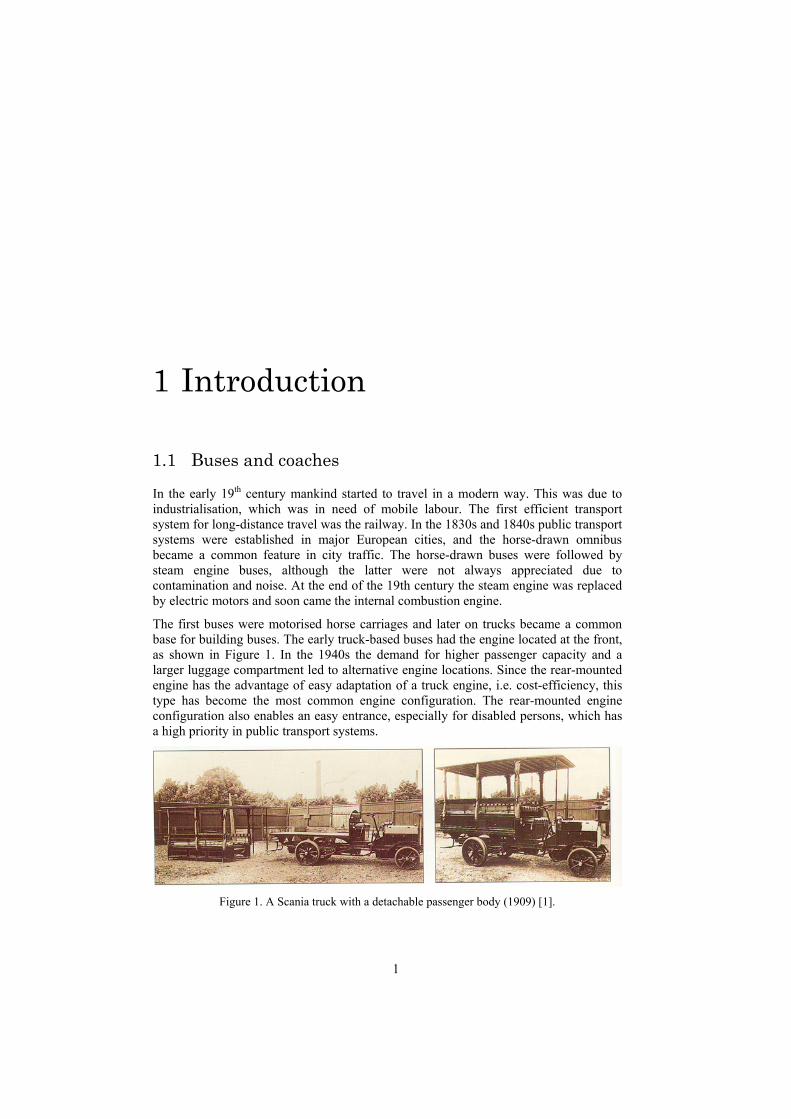
The first buses were motorised horse carriages and later on trucks became a common base for building buses. The early truck-based buses had the engine located at the front, as shown in Figure 1. In the 1940s the demand for higher passenger capacity and a larger luggage compartment led to alternative engine locations. Since the rear-mounted engine has the advantage of easy adaptation of a truck engine, i.e. cost-efficiency, this type has become the most common engine configuration. The rear-mounted engine configuration also enables an easy entrance, especially for disabled persons, which has a high priority in public transport systems.
Figure 1. A Scania truck with a detachable passenger body (1909) [1].
1
Magnus Juhlin 2
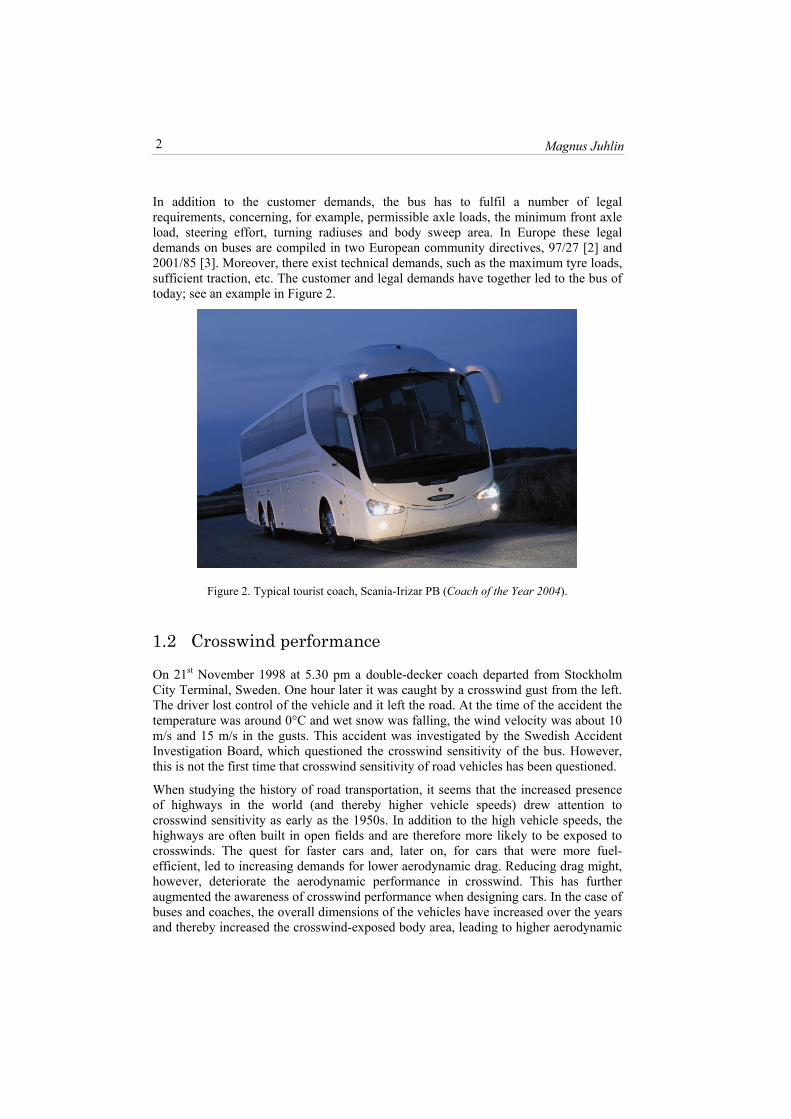
In addition to the customer demands, the bus has to fulfil a number of legal requirements, concerning, for example, permissible axle loads, the minimum front axle load, steering effort, turning radiuses and body sweep area. In Europe these legal demands on buses are compiled in two European community directives, 97/27 [2] and 2001/85 [3]. Moreover, there exist technical demands, such as the maximum tyre loads, sufficient traction, etc. The customer and legal demands have together led to the bus of today; see an example in Figure 2.
Figure 2. Typical tourist coach, Scania-Irizar PB (Coach of the Year 2004).
1.2 Crosswind performance
On 21st November 1998 at 5.30 pm a double-decker coach departed from Stockholm City Terminal, Sweden. One hour later it was caught by a crosswind gust from the left. The driver lost control of the vehicle and it left the road. At the time of the accident the temperature was around 0°C and wet snow was falling, the wind velocity was about 10 m/s and 15 m/s in the gusts. This accident was investigated by the Swedish Accident Investigation Board, which questioned the crosswind sensitivity of the bus. However, this is not the first time that crosswind sensitivity of road vehicles has been questioned.
When studying the history of road transportation, it seems that the increased presence of highways in the world (and thereby higher vehicle speeds) drew attention to crosswind sensitivity as early as the 1950s. In addition to the high vehicle speeds, the highways are often built in open fields and are therefore more likely to be exposed to crosswinds. The quest for faster cars and, later on, for cars that were more fuel-efficient, led to increasing demands for lower aerodynamic drag. Reducing drag might, however, deteriorate the aerodynamic performance in crosswind. This has further augmented the awareness of crosswind performance when designing cars. In the case of buses and coaches, the overall dimensions of the vehicles have increased over the years and thereby increased the crosswind-exposed body area, leading to higher aerodynamic
Assessment of crosswind performance of buses
3
loads. With the increasing demands for reducing the energy consumption of vehicles, it can be expected that the vehicle mass will decrease in the future and thereby worsen the crosswind sensitivity.
When a vehicle is driven on a road, it is continuously exposed to disturbances that affect the direction of travel. There are several possible disturbances, such as road irregularities, crosswind and now and then the driver, who can also be considered as a source of disturbance. The directional stability of the vehicle will determine the magnitude of the deviation relative to the desired course and whether the driver will still be able to control the vehicle. When the lateral deviation becomes larger than what the traffic environment allows, an accident is likely to occur. The directional stability is a combination of vehicle sensitivity to disturbances and driver-vehicle interaction. In addition, reducing the directional deviation to zero is probably not realistic, and therefore it is important to design both vehicles and the road environment with directional stability in mind.
Since the vehicle is driven by a driver who is acting as a regulator, the whole driver-vehicle system must be considered when studying the crosswind performance of vehicles. The extent to which the driver is able to correct a deviation from the desired course is a combination of skill and how well the vehicle and driver interact. In some situations a crosswind gust might result in an accident regardless of the driver’s corrections. The reason for this might be that the directional deviation might become too large before the driver reacts or that the vehicle might not respond to the driver’s effort to control the vehicle.
1.3 Objectives
The objectives of this research work are to:
• clarify how crosswind-sensitive buses are, • determine which parameters have the largest influence on the crosswind
performance of the driver-vehicle system, • propose remedies for improving the crosswind performance.
This was achieved by studying the effect of several vehicle parameters on the crosswind sensitivity through simulations using a vehicle model and a crosswind model representative of natural crosswind gusts. In addition, the influence of steering feel on the subjective and objective evaluation of crosswind performance was studied using a moving-base driving simulator. Based on these findings, actions for improving the safety of buses with respect to crosswind sensitivity are proposed.
1.4 Outline of thesis
In addition to the five appended papers, Papers A – E, this thesis begins with an introduction to the subject of the crosswind performance of buses. The purpose of this
Magnus Juhlin 4
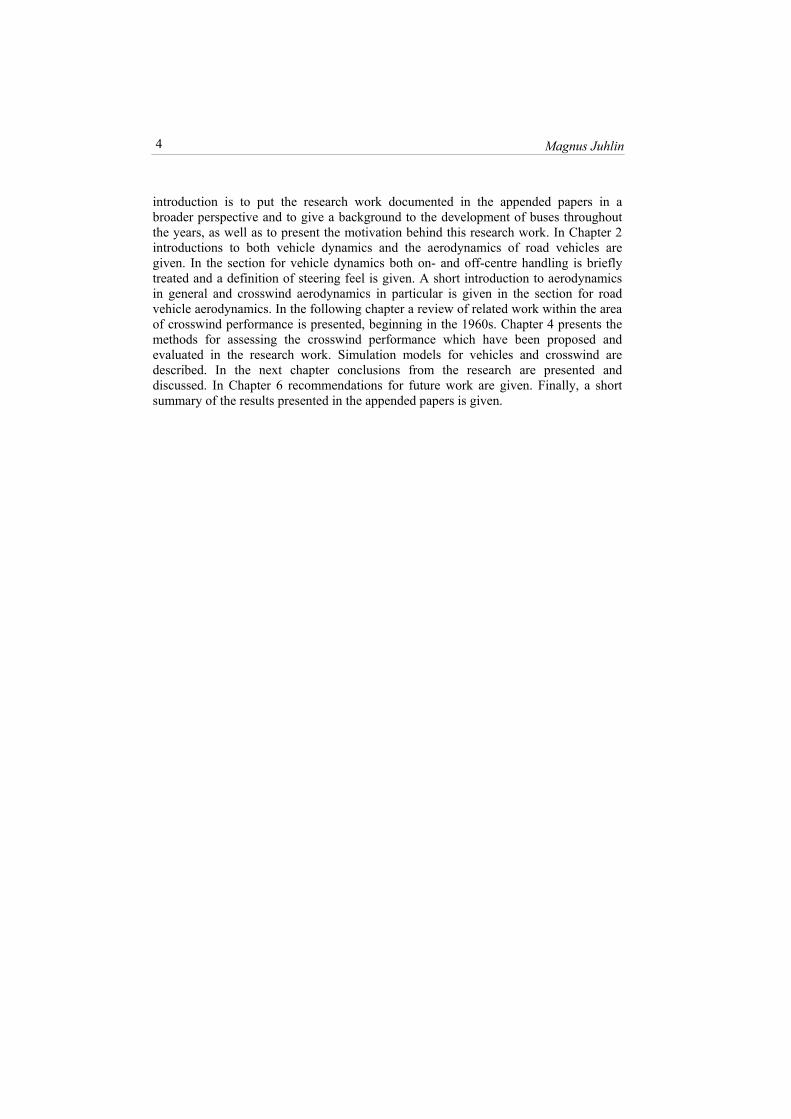
introduction is to put the research work documented in the appended papers in a broader perspective and to give a background to the development of buses throughout the years, as well as to present the motivation behind this research work. In Chapter 2 introductions to both vehicle dynamics and the aerodynamics of road vehicles are given. In the section for vehicle dynamics both on- and off-centre handling is briefly treated and a definition of steering feel is given. A short introduction to aerodynamics in general and crosswind aerodynamics in particular is given in the section for road vehicle aerodynamics. In the following chapter a review of related work within the area of crosswind performance is presented, beginning in the 1960s. Chapter 4 presents the methods for assessing the crosswind performance which have been proposed and evaluated in the research work. Simulation models for vehicles and crosswind are described. In the next chapter conclusions from the research are presented and discussed. In Chapter 6 recommendations for future work are given. Finally, a short summary of the results presented in the appended papers is given.
2 Dynamics of road vehicles The topic of the crosswind performance of road vehicles comprises at least two disciplines, namely road vehicle dynamics and road vehicle aerodynamics. Therefore, short introductions to these two disciplines are given below.
2.1 Road vehicle dynamics
Road vehicle dynamics can be divided into vertical and lateral dynamics, with vertical dynamics being more often referred to as comfort and lateral dynamics as vehicle handling. Vehicle handling is a description of the way in which road vehicles perform transverse to their direction of motion, particularly during cornering, but it also includes their stability when moving in a nominally straight line. Therefore, it is possible to divide vehicle handling further into on-centre handling and off-centre handling. On-centre handling covers the situation when a vehicle is running in a nominally straight line and when it is negotiating large-radius bends at high speeds but low lateral accelerations. Off-centre handling covers the other handling situations. Vehicle handling is a major component of a vehicle's "active" safety.
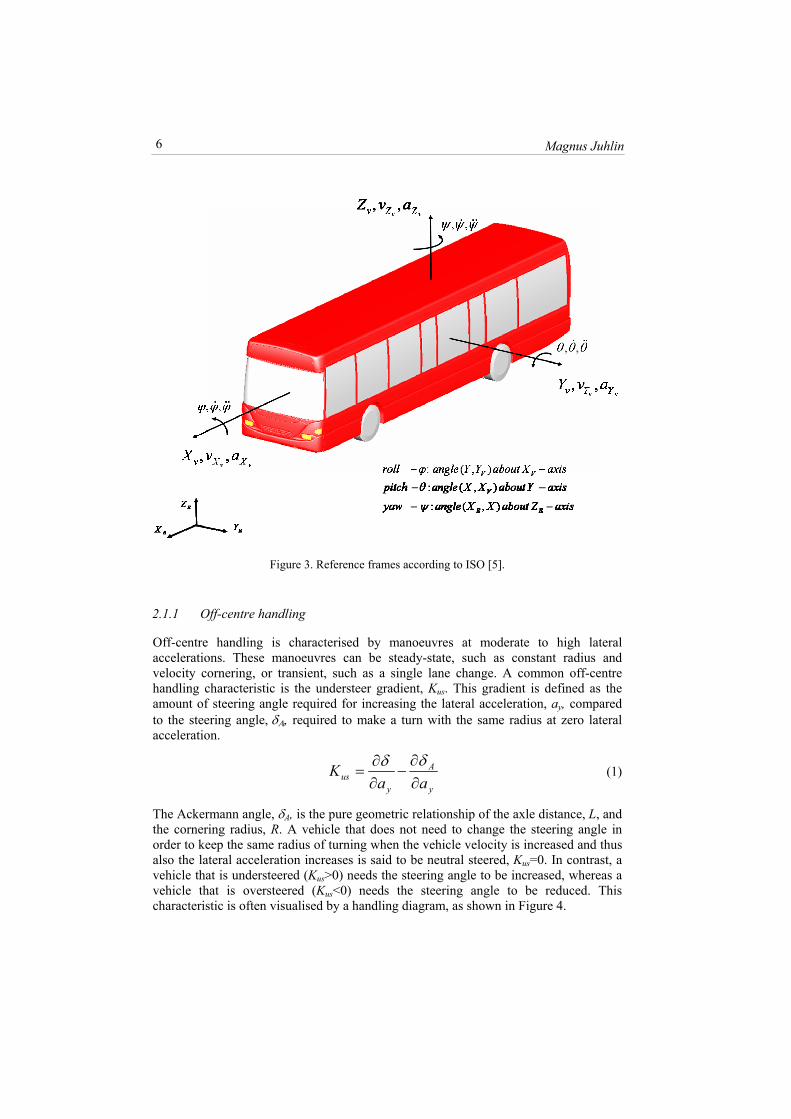
When studying road vehicle dynamics, three different reference frames are used for describing the vehicle motion. The first is the earth-fixed reference frame (XE, YE, ZE), the second is the body-fixed reference frame as proposed by Segel [4] (XV, YV, ZV) and the third is an intermediate system (X, Y, Z), where the XY-plane coincides with the XEYE-plane and the X-axis is the projection of the XV-axis onto the XEYE-plane. In Figure 3 the definition of the vehicle motion according to ISO [5] is shown. One of the pioneers of the study of the motion of road vehicles was Maurice Olley [6]. His collected work shows a deep and practical understanding of the subject. Another profound source of knowledge of vehicle dynamics is Mitschke [7].
5
Magnus Juhlin 6
Figure 3. Reference frames according to ISO [5].
2.1.1 Off-centre handling
Off-centre handling is characterised by manoeuvres at moderate to high lateral accelerations. These manoeuvres can be steady-state, such as constant radius and velocity cornering, or transient, such as a single lane change. A common off-centre handling characteristic is the understeer gradient, Kus. This gradient is defined as the amount of steering angle required for increasing the lateral acceleration, ay, compared to the steering angle, δΑ, required to make a turn with the same radius at zero lateral acceleration.
y
A
yus aa
K∂∂
−∂∂
=δδ
(1)
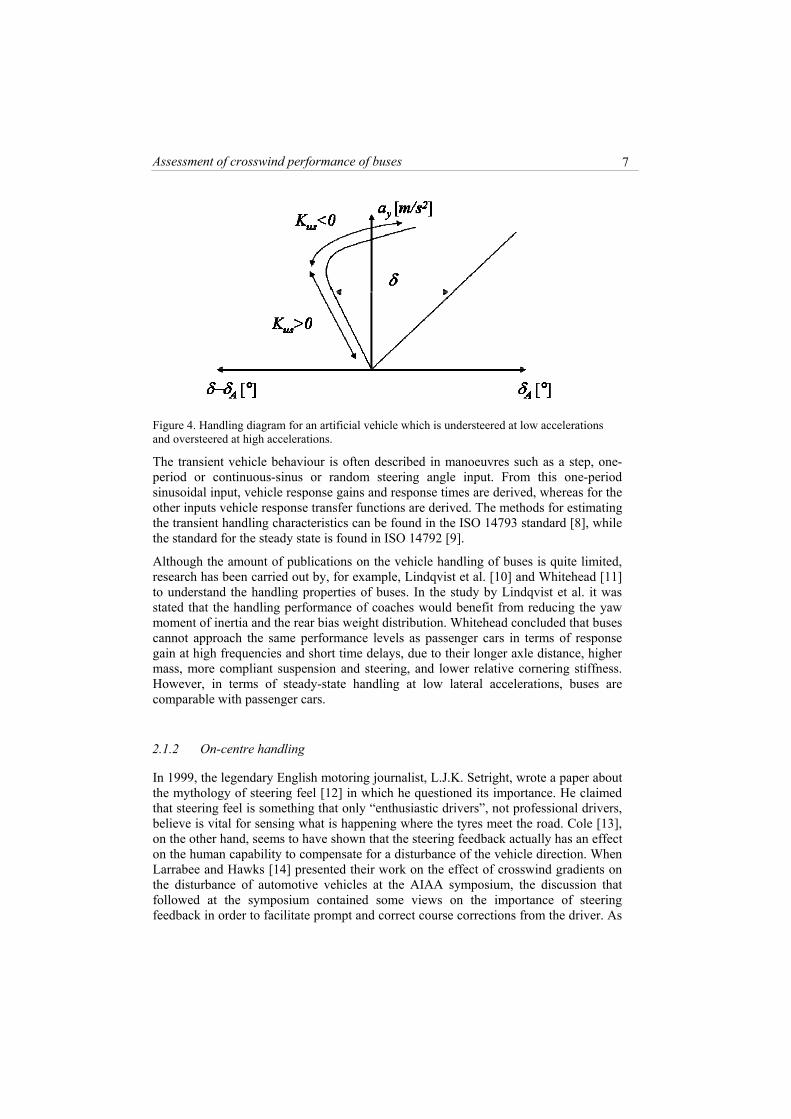
The Ackermann angle, δA, is the pure geometric relationship of the axle distance, L, and the cornering radius, R. A vehicle that does not need to change the steering angle in order to keep the same radius of turning when the vehicle velocity is increased and thus also the lateral acceleration increases is said to be neutral steered, Kus=0. In contrast, a vehicle that is understeered (Kus>0) needs the steering angle to be increased, whereas a vehicle that is oversteered (Kus<0) needs the steering angle to be reduced. This characteristic is often visualised by a handling diagram, as shown in Figure 4.
Assessment of crosswind performance of buses
7
Figure 4. Handling diagram for an artificial vehicle which is understeered at low accelerations and oversteered at high accelerations.
The transient vehicle behaviour is often described in manoeuvres such as a step, one-period or continuous-sinus or random steering angle input. From this one-period sinusoidal input, vehicle response gains and response times are derived, whereas for the other inputs vehicle response transfer functions are derived. The methods for estimating the transient handling characteristics can be found in the ISO 14793 standard [8], while the standard for the steady state is found in ISO 14792 [9].
Although the amount of publications on the vehicle handling of buses is quite limited, research has been carried out by, for example, Lindqvist et al. [10] and Whitehead [11] to understand the handling properties of buses. In the study by Lindqvist et al. it was stated that the handling performance of coaches would benefit from reducing the yaw moment of inertia and the rear bias weight distribution. Whitehead concluded that buses cannot approach the same performance levels as passenger cars in terms of response gain at high frequencies and short time delays, due to their longer axle distance, higher mass, more compliant suspension and steering, and lower relative cornering stiffness. However, in terms of steady-state handling at low lateral accelerations, buses are comparable with passenger cars.
2.1.2 On-centre handling
In 1999, the legendary English motoring journalist, L.J.K. Setright, wrote a paper about the mythology of steering feel [12] in which he questioned its importance. He claimed that steering feel is something that only “enthusiastic drivers”, not professional drivers, believe is vital for sensing what is happening where the tyres meet the road. Cole [13], on the other hand, seems to have shown that the steering feedback actually has an effect on the human capability to compensate for a disturbance of the vehicle direction. When Larrabee and Hawks [14] presented their work on the effect of crosswind gradients on the disturbance of automotive vehicles at the AIAA symposium, the discussion that followed at the symposium contained some views on the importance of steering feedback in order to facilitate prompt and correct course corrections from the driver. As
Magnus Juhlin 8
vehicles have become more refined and the vehicle speed has increased, the on-centre handling performance has received more attention. Efforts have been made to improve on-centre handling for at least a half-century, and today two ISO standards exist for quantifying on-centre handling. The definition of on-centre handling according to ISO [15, 16] is:
“description of the steering “feel” and precision of a vehicle during nominally straight-line driving and in negotiating large radius bends at high speeds but low lateral accelerations”.
One of the first researchers to address the effect of steering feel on the on-centre handling performance was Segel [17]. In his study five drivers drove a vehicle with the possibility of altering the vehicle response as a function of the steering-wheel torque. Two manoeuvres, low-acceleration steady-state turning and high-speed overtaking, were used to evaluate the performance of different settings, and the drivers had to respond to 7 questions regarding the steering feel. According to Segel there exists an optimum steering force gradient below which the straight-ahead position of the steering is poorly defined. A lower steering force gradient results in both under- and overshooting of the desired path, and a high steering force gradient results in undershooting at the turn entry and overshooting at the turn exit. Segel also stated that for driving tasks requiring less attention, i.e. highway driving, the driving strategy tends towards “open-loop” control and the driver relies more on steering force cues than the steering-wheel angle.
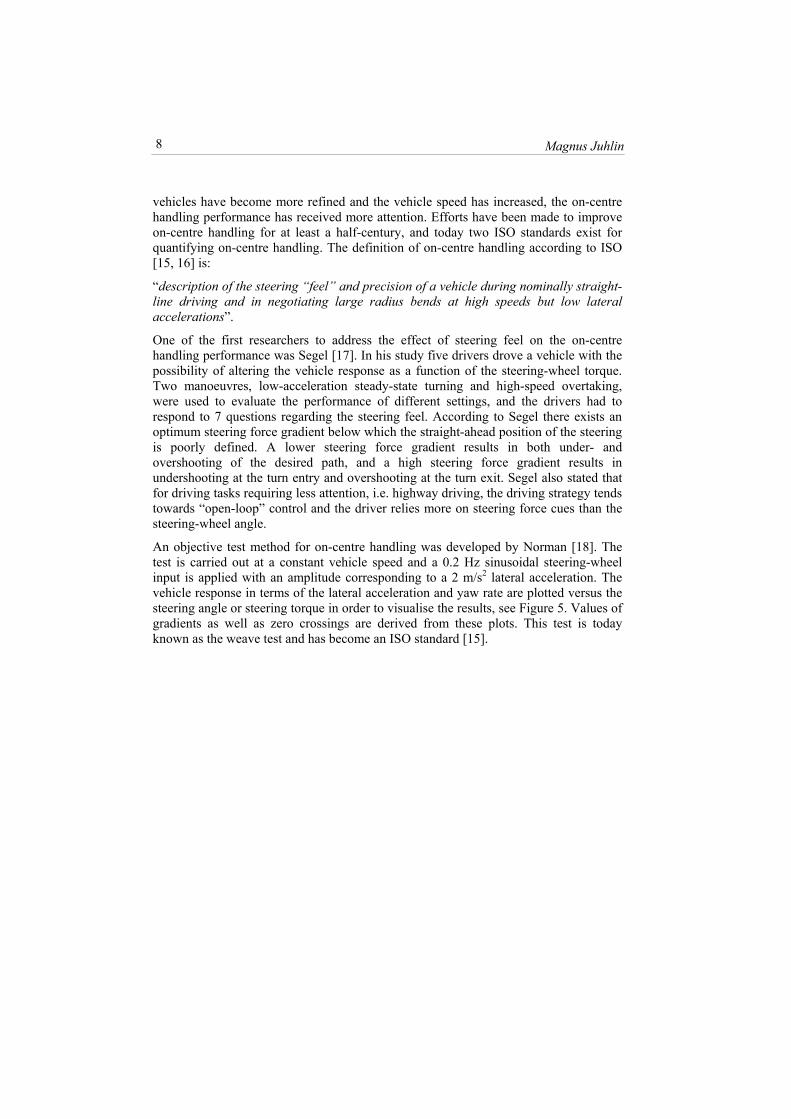
An objective test method for on-centre handling was developed by Norman [18]. The test is carried out at a constant vehicle speed and a 0.2 Hz sinusoidal steering-wheel input is applied with an amplitude corresponding to a 2 m/s2 lateral acceleration. The vehicle response in terms of the lateral acceleration and yaw rate are plotted versus the steering angle or steering torque in order to visualise the results, see Figure 5. Values of gradients as well as zero crossings are derived from these plots. This test is today known as the weave test and has become an ISO standard [15].
Assessment of crosswind performance of buses
9
Figure 5. Weave test result plot, yaw rate vs. steering-wheel torque.
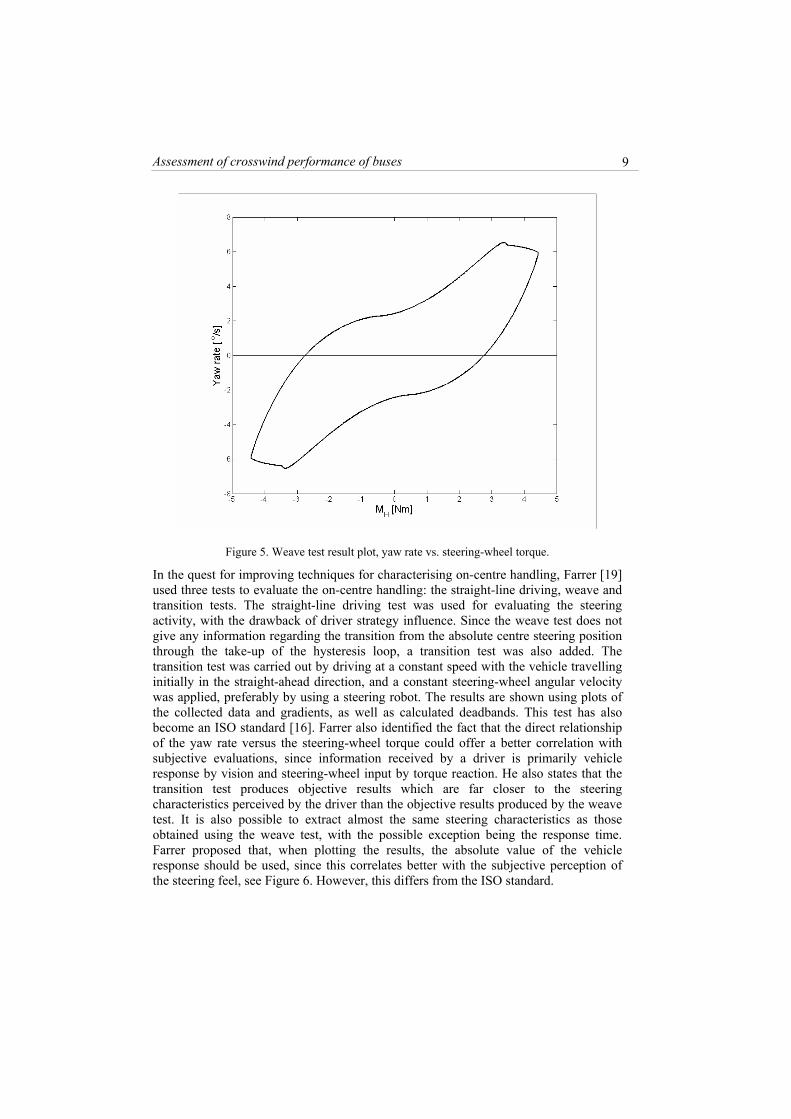
In the quest for improving techniques for characterising on-centre handling, Farrer [19] used three tests to evaluate the on-centre handling: the straight-line driving, weave and transition tests. The straight-line driving test was used for evaluating the steering activity, with the drawback of driver strategy influence. Since the weave test does not give any information regarding the transition from the absolute centre steering position through the take-up of the hysteresis loop, a transition test was also added. The transition test was carried out by driving at a constant speed with the vehicle travelling initially in the straight-ahead direction, and a constant steering-wheel angular velocity was applied, preferably by using a steering robot. The results are shown using plots of the collected data and gradients, as well as calculated deadbands. This test has also become an ISO standard [16]. Farrer also identified the fact that the direct relationship of the yaw rate versus the steering-wheel torque could offer a better correlation with subjective evaluations, since information received by a driver is primarily vehicle response by vision and steering-wheel input by torque reaction. He also states that the transition test produces objective results which are far closer to the steering characteristics perceived by the driver than the objective results produced by the weave test. It is also possible to extract almost the same steering characteristics as those obtained using the weave test, with the possible exception being the response time. Farrer proposed that, when plotting the results, the absolute value of the vehicle response should be used, since this correlates better with the subjective perception of the steering feel, see Figure 6. However, this differs from the ISO standard.
Magnus Juhlin 10
Figure 6. A plot of steering-wheel moment versus yaw rate that illustrates steering feel, according to Farrer [19].
2.2 Road vehicle aerodynamics
In early studies of road vehicle aerodynamics, the focus was mainly on the reduction of drag in order to increase the maximum speed and lower the fuel consumption. As the performance increased, the need to reduce lift forces increased, and the expansion of highways with increased exposure to crosswinds led to a need to improve crosswind aerodynamics. In the late sixties crosswind sensitivity became an issue for car designers.
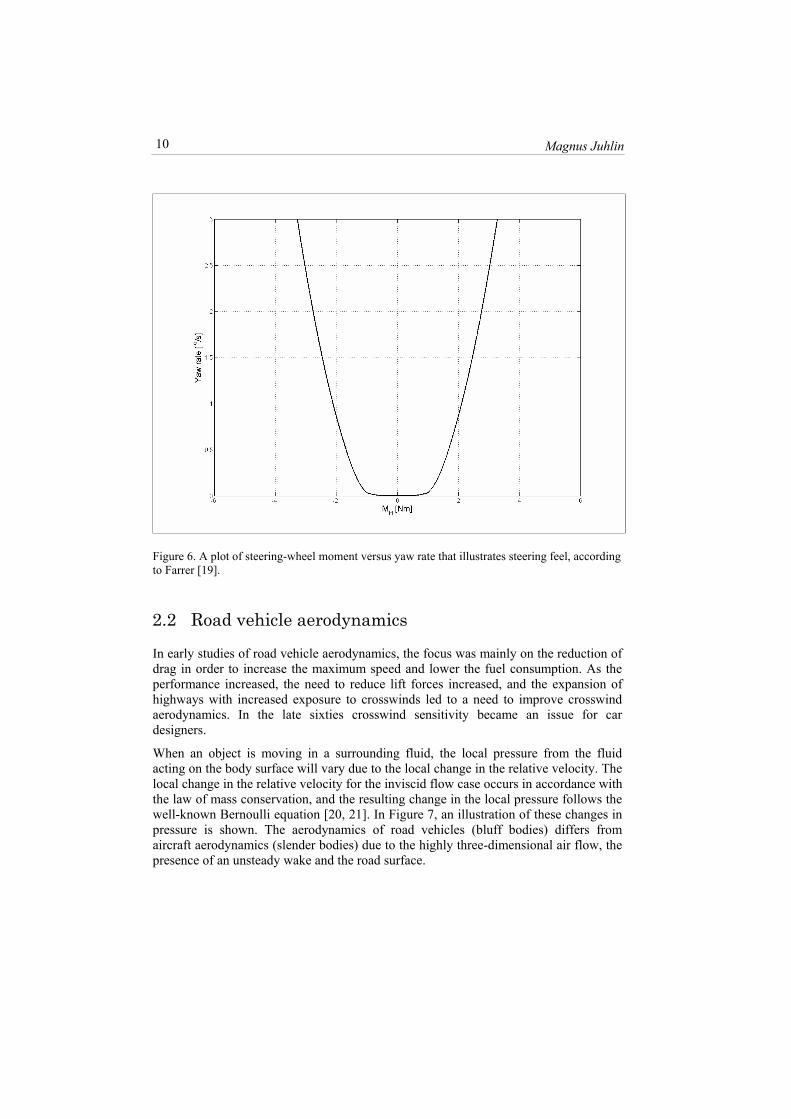
When an object is moving in a surrounding fluid, the local pressure from the fluid acting on the body surface will vary due to the local change in the relative velocity. The local change in the relative velocity for the inviscid flow case occurs in accordance with the law of mass conservation, and the resulting change in the local pressure follows the well-known Bernoulli equation [20, 21]. In Figure 7, an illustration of these changes in pressure is shown. The aerodynamics of road vehicles (bluff bodies) differs from aircraft aerodynamics (slender bodies) due to the highly three-dimensional air flow, the presence of an unsteady wake and the road surface.
Assessment of crosswind performance of buses
11
Figure 7. Illustration of the pressure and velocity change of a fluid passing a vehicle body [20].
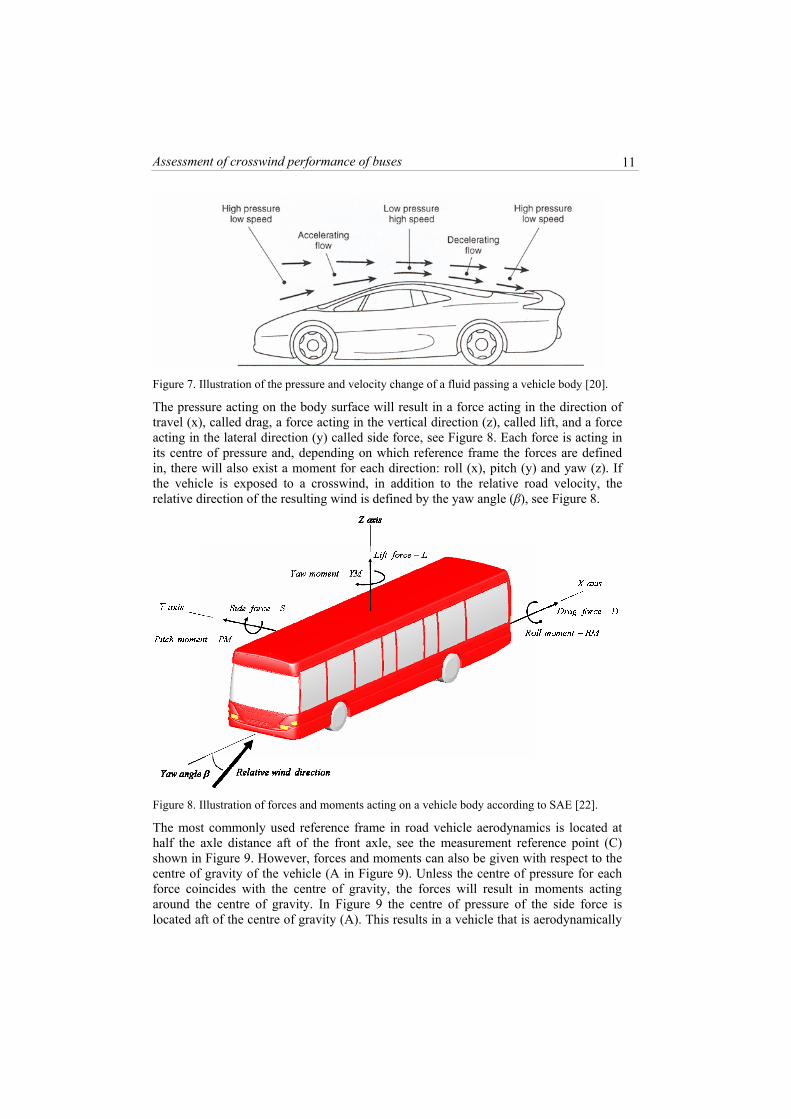
The pressure acting on the body surface will result in a force acting in the direction of travel (x), called drag, a force acting in the vertical direction (z), called lift, and a force acting in the lateral direction (y) called side force, see Figure 8. Each force is acting in its centre of pressure and, depending on which reference frame the forces are defined in, there will also exist a moment for each direction: roll (x), pitch (y) and yaw (z). If the vehicle is exposed to a crosswind, in addition to the relative road velocity, the relative direction of the resulting wind is defined by the yaw angle (β), see Figure 8.
Figure 8. Illustration of forces and moments acting on a vehicle body according to SAE [22].
The most commonly used reference frame in road vehicle aerodynamics is located at half the axle distance aft of the front axle, see the measurement reference point (C) shown in Figure 9. However, forces and moments can also be given with respect to the centre of gravity of the vehicle (A in Figure 9). Unless the centre of pressure for each force coincides with the centre of gravity, the forces will result in moments acting around the centre of gravity. In Figure 9 the centre of pressure of the side force is located aft of the centre of gravity (A). This results in a vehicle that is aerodynamically
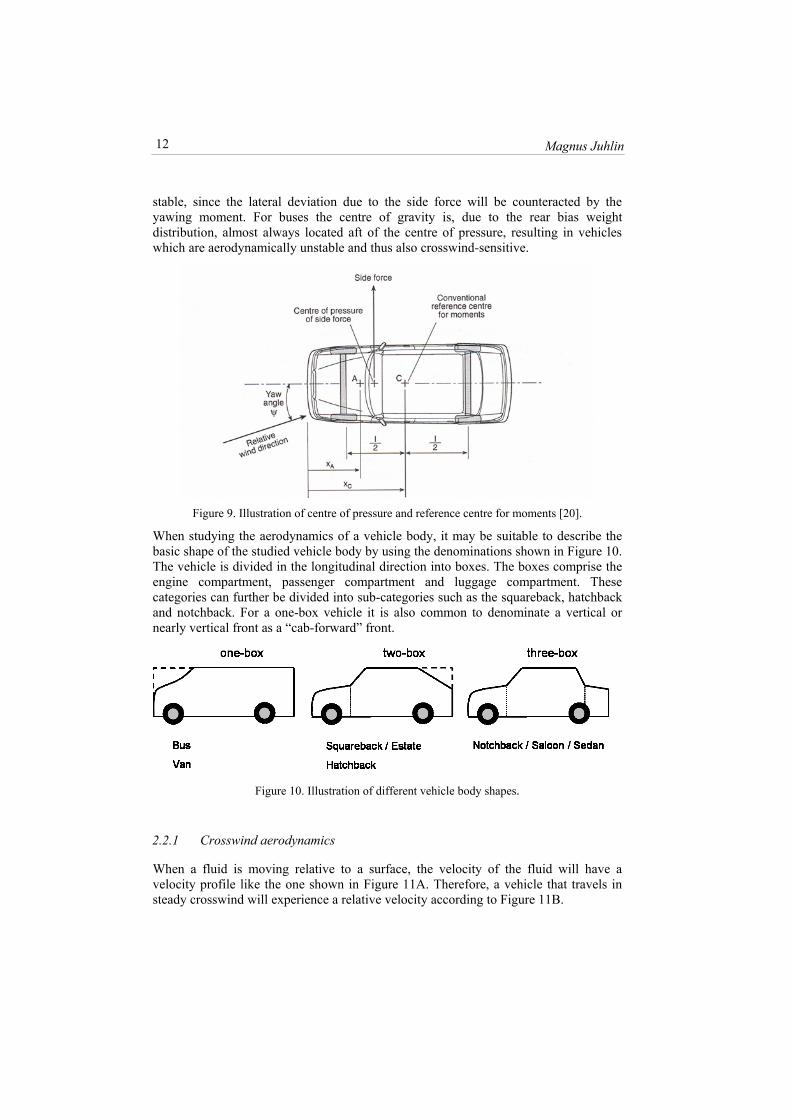
Magnus Juhlin 12
stable, since the lateral deviation due to the side force will be counteracted by the yawing moment. For buses the centre of gravity is, due to the rear bias weight distribution, almost always located aft of the centre of pressure, resulting in vehicles which are aerodynamically unstable and thus also crosswind-sensitive.
Figure 9. Illustration of centre of pressure and reference centre for moments [20].
When studying the aerodynamics of a vehicle body, it may be suitable to describe the basic shape of the studied vehicle body by using the denominations shown in Figure 10. The vehicle is divided in the longitudinal direction into boxes. The boxes comprise the engine compartment, passenger compartment and luggage compartment. These categories can further be divided into sub-categories such as the squareback, hatchback and notchback. For a one-box vehicle it is also common to denominate a vertical or nearly vertical front as a “cab-forward” front.
Figure 10. Illustration of different vehicle body shapes.
2.2.1 Crosswind aerodynamics
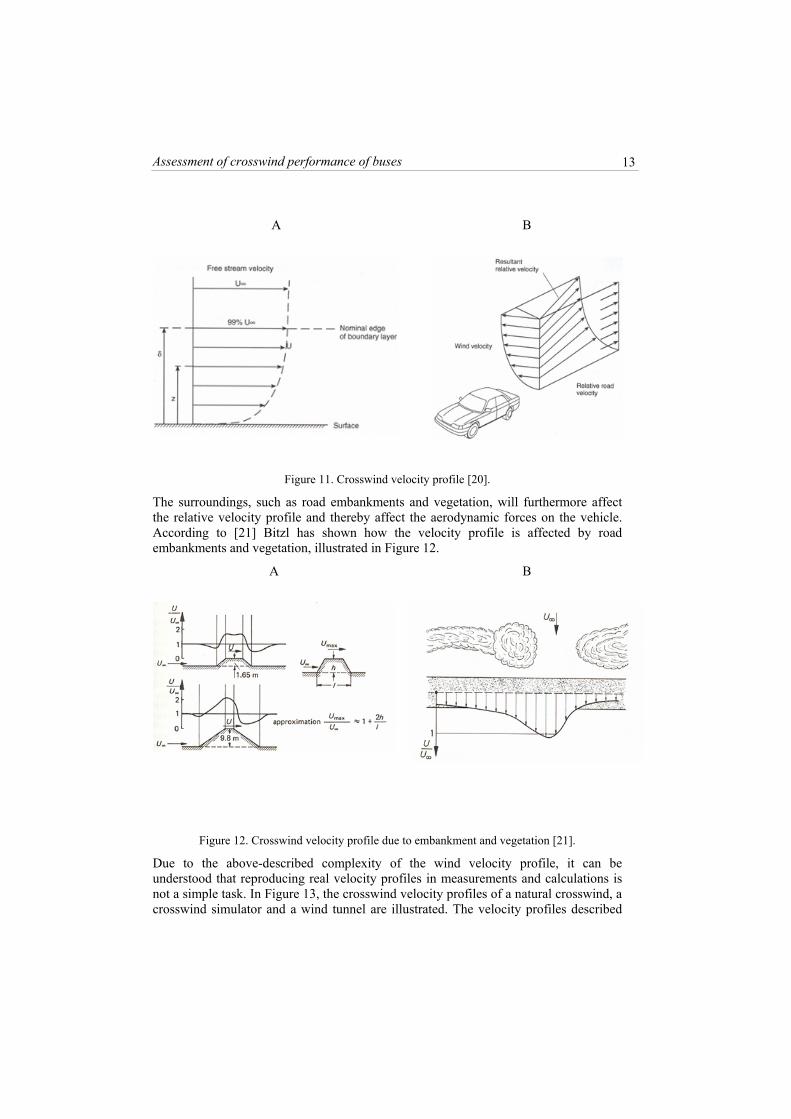
When a fluid is moving relative to a surface, the velocity of the fluid will have a velocity profile like the one shown in Figure 11A. Therefore, a vehicle that travels in steady crosswind will experience a relative velocity according to Figure 11B.
Assessment of crosswind performance of buses
13
A
B
Figure 11. Crosswind velocity profile [20].
The surroundings, such as road embankments and vegetation, will furthermore affect the relative velocity profile and thereby affect the aerodynamic forces on the vehicle. According to [21] Bitzl has shown how the velocity profile is affected by road embankments and vegetation, illustrated in Figure 12.
A
B
Figure 12. Crosswind velocity profile due to embankment and vegetation [21].
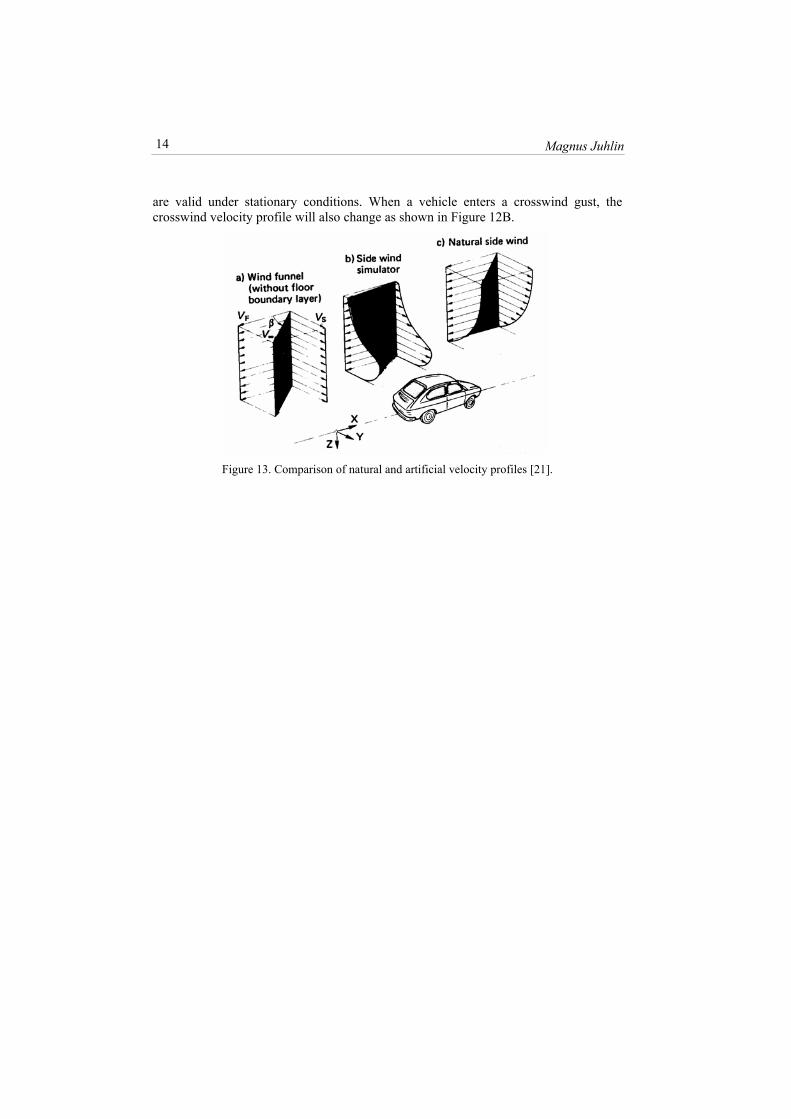
Due to the above-described complexity of the wind velocity profile, it can be understood that reproducing real velocity profiles in measurements and calculations is not a simple task. In Figure 13, the crosswind velocity profiles of a natural crosswind, a crosswind simulator and a wind tunnel are illustrated. The velocity profiles described
Magnus Juhlin 14
are valid under stationary conditions. When a vehicle enters a crosswind gust, the crosswind velocity profile will also change as shown in Figure 12B.
Figure 13. Comparison of natural and artificial velocity profiles [21].
3 Previous work on crosswind performance
The interest in aerodynamic loads on road vehicles in a yawed condition started to develop in the 1950s. A vehicle in a yawed condition means that, in addition to the “wind” resulting from the relative road velocity, a crosswind component exists. Many of the researchers of that time claim that the reason for this interest was the increased presence of motorways and thereby increased vehicle speeds. Another important feature of motorways is that they are often located in open fields and thereby wind-exposed. Below follows a historical summary of published research within the area of crosswind performance, beginning in the 1960s.
3.1 The 1960s
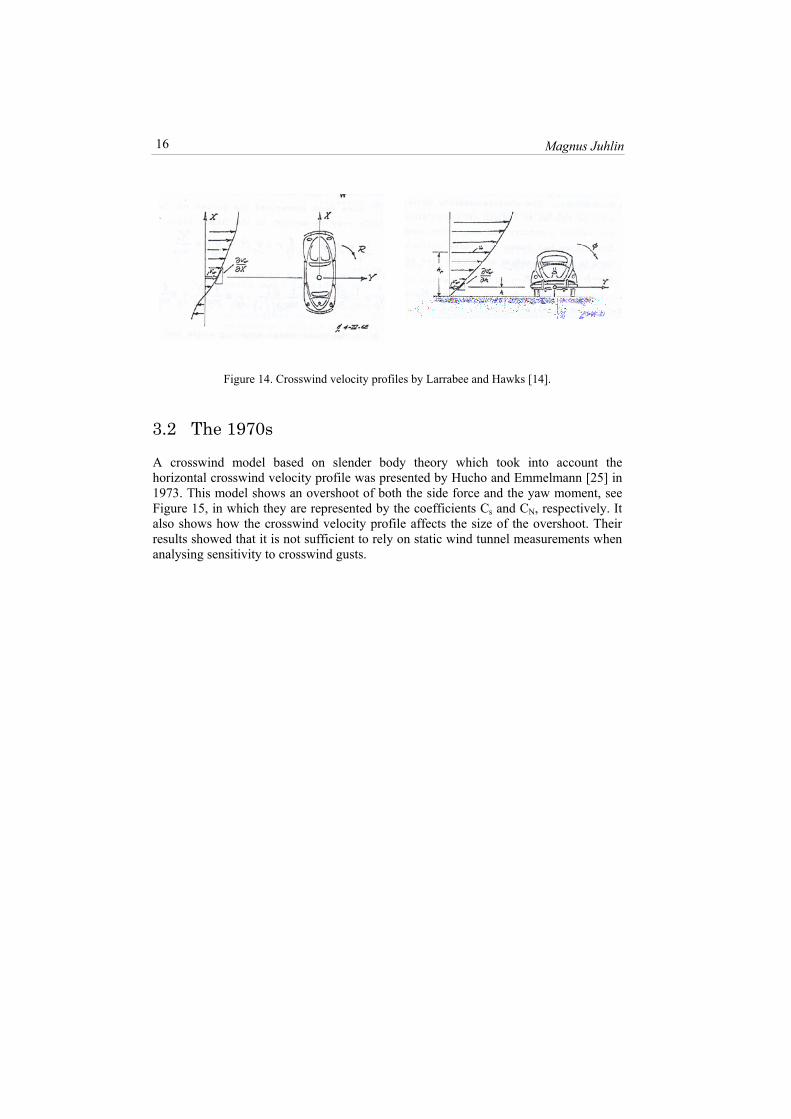
In 1966 Bowman [23] performed wind tunnel tests of 21 different 3/8 scale sedan models in a yawed condition. Based on these wind tunnel measurements, he presented empirical equations for estimating the static aerodynamic coefficients at different yaw angles. In the same year Bunning and Beauvais [24] studied the transient side force and yaw moment acting on a vehicle when exposed to a crosswind gust. To accomplish this they propelled a vehicle model across a wind tunnel. The effect of crosswind velocity gradients, both horizontal and vertical, on the aerodynamic loads was modelled by Larrabee and Hawks [14] in 1968, see Figure 14. The load from this crosswind model was inserted in the equations of motion for three types of vehicles, one being a ‘high-speed intercity bus’, and the directional deviation was studied. Their work showed the importance of considering the effects of the crosswind velocity profile.
15
Magnus Juhlin 16
Figure 14. Crosswind velocity profiles by Larrabee and Hawks [14].
3.2 The 1970s
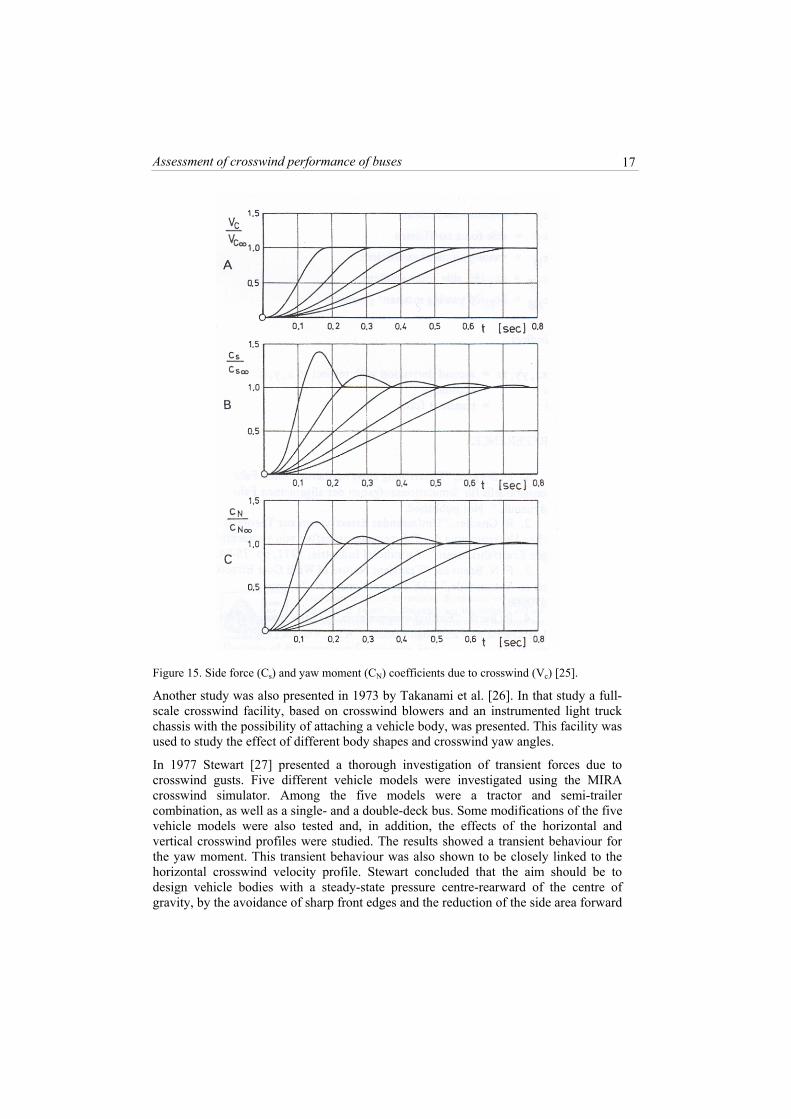
A crosswind model based on slender body theory which took into account the horizontal crosswind velocity profile was presented by Hucho and Emmelmann [25] in 1973. This model shows an overshoot of both the side force and the yaw moment, see Figure 15, in which they are represented by the coefficients Cs and CN, respectively. It also shows how the crosswind velocity profile affects the size of the overshoot. Their results showed that it is not sufficient to rely on static wind tunnel measurements when analysing sensitivity to crosswind gusts.
Assessment of crosswind performance of buses
17
Figure 15. Side force (Cs) and yaw moment (CN) coefficients due to crosswind (Vc) [25].
Another study was also presented in 1973 by Takanami et al. [26]. In that study a full-scale crosswind facility, based on crosswind blowers and an instrumented light truck chassis with the possibility of attaching a vehicle body, was presented. This facility was used to study the effect of different body shapes and crosswind yaw angles.
In 1977 Stewart [27] presented a thorough investigation of transient forces due to crosswind gusts. Five different vehicle models were investigated using the MIRA crosswind simulator. Among the five models were a tractor and semi-trailer combination, as well as a single- and a double-deck bus. Some modifications of the five vehicle models were also tested and, in addition, the effects of the horizontal and vertical crosswind profiles were studied. The results showed a transient behaviour for the yaw moment. This transient behaviour was also shown to be closely linked to the horizontal crosswind velocity profile. Stewart concluded that the aim should be to design vehicle bodies with a steady-state pressure centre-rearward of the centre of gravity, by the avoidance of sharp front edges and the reduction of the side area forward
Magnus Juhlin 18
of the centre of gravity. In addition, he suggested that the rise time should be reduced by, for example, graded road-side screening to reduce the sharpness of gust edges.
At the end of the 1970s, Alexandridis et al. [64] used a moving-base simulator in order to study the effects of the longitudinal location of the centre of pressure, the understeer gradient and the steering sensitivity on the crosswind stability. Both subjective and objective measures were used. The results showed that the location of the centre of pressure had an effect on both the subjective and the objective measures, with the rearward location being the most favourable. The understeer gradient and the control sensitivity, i.e. the steering ratio, had an effect on the objective, but not the subjective measures. When the control sensitivity increased, the lane deviation decreased. This was also the case when the understeer increased and the centre of pressure was in the forward position. Steering-wheel activity was reduced by increased control sensitivity and understeer and by a rearward location of the centre of pressure. The same moving-base simulator was later used by Wierwille et al. [65] in order to study the driver’s steering reaction time to abrupt-onset crosswinds. The results showed reaction times between 0.3 and 0.6 s and an equation for calculating the reaction time was derived.
3.3 The 1980s
A study of the crosswind performance of five different vehicles was presented by Klein and Hogue [28] in 1980. For these full-scale tests they used crosswind generators. Only one of the tested vehicles required “substantial control demands”. This was a one-box-type vehicle with a rear bias weight distribution.
In 1984 Noguchi [29] used a crosswind generator producing a 0.5 s wind gust and he also used simulations in order to study the effect of compliance steer and roll steer on a vehicle with a fixed steering wheel. In the simulations the aerodynamic forces and moments were modelled by a step function. The rear wheel compliance understeer proved to have the largest reduction of the yaw rate response, whereas the rear wheel roll understeer reduced the yaw rate damping. The effects of front wheel roll and compliance steer were only minor.
One year later Buchheim et al. [30] studied the possibilities of reducing the aerodynamic drag without deteriorating the crosswind stability. This was accomplished by using the stability index determined by Milliken [31] for an analytical investigation of different car body shapes: the fastback, notchback and squareback, and body details such as a front and a rear spoiler. Experimental investigations in a wind tunnel were also carried out, and the stability index was found to be only valid for relative comparisons and no correlation with real crosswind sensitivity as judged by drivers was found. The results showed, for example, that the curvature of the front fender has a potential in decreasing drag as well as crosswind sensitivity. Buchheim et al. stated that no generally accepted and reliable analytical or experimental procedure for quantifying the crosswind sensitivity of cars existed at that time. They also stated that unfavourable crosswind characteristics due to reduced drag can be offset by weight distribution or improved steering, suspension or tyre characteristics. It is also possible to reduce the drag with only a small deterioration of the crosswind performance if the geometrical parameters are carefully optimised.
Assessment of crosswind performance of buses
19
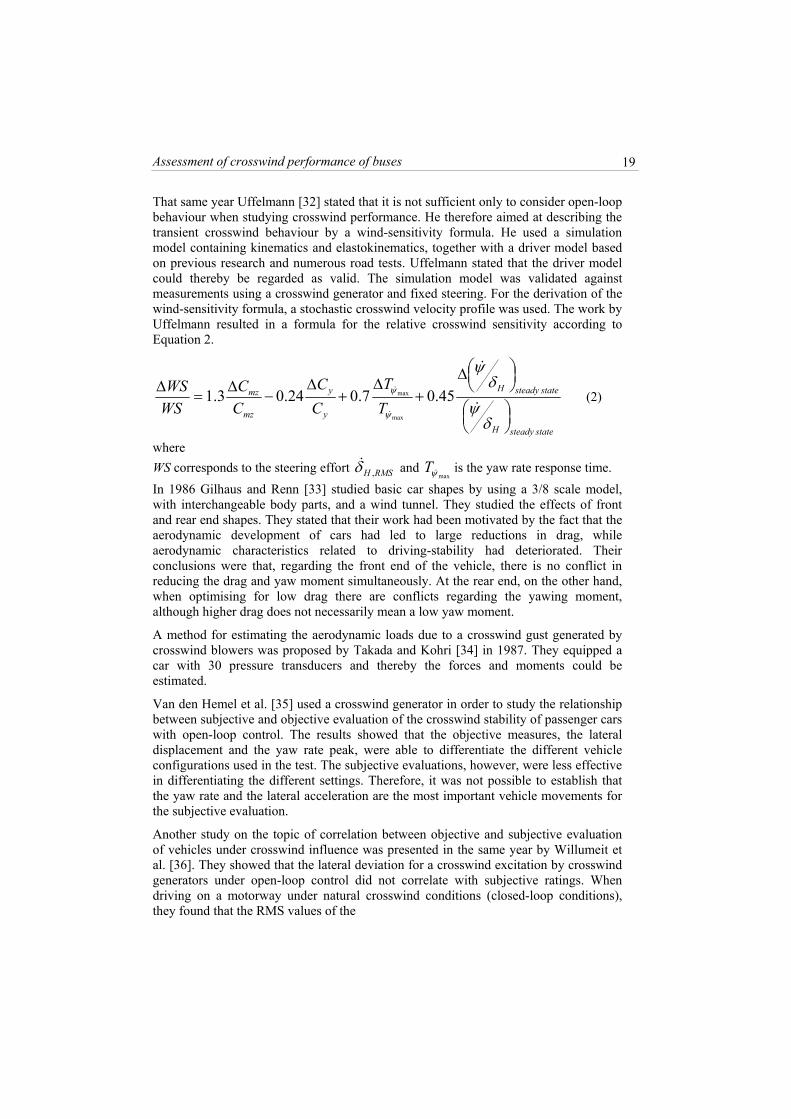
That same year Uffelmann [32] stated that it is not sufficient only to consider open-loop behaviour when studying crosswind performance. He therefore aimed at describing the transient crosswind behaviour by a wind-sensitivity formula. He used a simulation model containing kinematics and elastokinematics, together with a driver model based on previous research and numerous road tests. Uffelmann stated that the driver model could thereby be regarded as valid. The simulation model was validated against measurements using a crosswind generator and fixed steering. For the derivation of the wind-sensitivity formula, a stochastic crosswind velocity profile was used. The work by Uffelmann resulted in a formula for the relative crosswind sensitivity according to Equation 2.
statesteadyH
statesteadyH
y
y
mz
mz
TT
CC
CC
WSWS
⎟⎠⎞⎜
⎝⎛
⎟⎠⎞⎜
⎝⎛Δ
+Δ
+Δ
−Δ
=Δ
δψ
δψ
ψ
ψ
&
&
&
& 45.07.024.03.1max
max (2)
where WS corresponds to the steering effort and is the yaw rate response time. RMSH ,δ&
maxψ&TIn 1986 Gilhaus and Renn [33] studied basic car shapes by using a 3/8 scale model, with interchangeable body parts, and a wind tunnel. They studied the effects of front and rear end shapes. They stated that their work had been motivated by the fact that the aerodynamic development of cars had led to large reductions in drag, while aerodynamic characteristics related to driving-stability had deteriorated. Their conclusions were that, regarding the front end of the vehicle, there is no conflict in reducing the drag and yaw moment simultaneously. At the rear end, on the other hand, when optimising for low drag there are conflicts regarding the yawing moment, although higher drag does not necessarily mean a low yaw moment.
A method for estimating the aerodynamic loads due to a crosswind gust generated by crosswind blowers was proposed by Takada and Kohri [34] in 1987. They equipped a car with 30 pressure transducers and thereby the forces and moments could be estimated.
Van den Hemel et al. [35] used a crosswind generator in order to study the relationship between subjective and objective evaluation of the crosswind stability of passenger cars with open-loop control. The results showed that the objective measures, the lateral displacement and the yaw rate peak, were able to differentiate the different vehicle configurations used in the test. The subjective evaluations, however, were less effective in differentiating the different settings. Therefore, it was not possible to establish that the yaw rate and the lateral acceleration are the most important vehicle movements for the subjective evaluation.
Another study on the topic of correlation between objective and subjective evaluation of vehicles under crosswind influence was presented in the same year by Willumeit et al. [36]. They showed that the lateral deviation for a crosswind excitation by crosswind generators under open-loop control did not correlate with subjective ratings. When driving on a motorway under natural crosswind conditions (closed-loop conditions), they found that the RMS values of the
Magnus Juhlin 20
• yaw rate
• lateral acceleration
• steering-wheel angle
• yaw angle
correlated well with subjective ratings, while the lateral deviation and lateral velocity did not. One interesting finding was that high values of yaw acceleration resulted in high subjective ratings. They also found that the largest course deviations occurred after steering input, which is a result of a steering input that is too large and delayed.
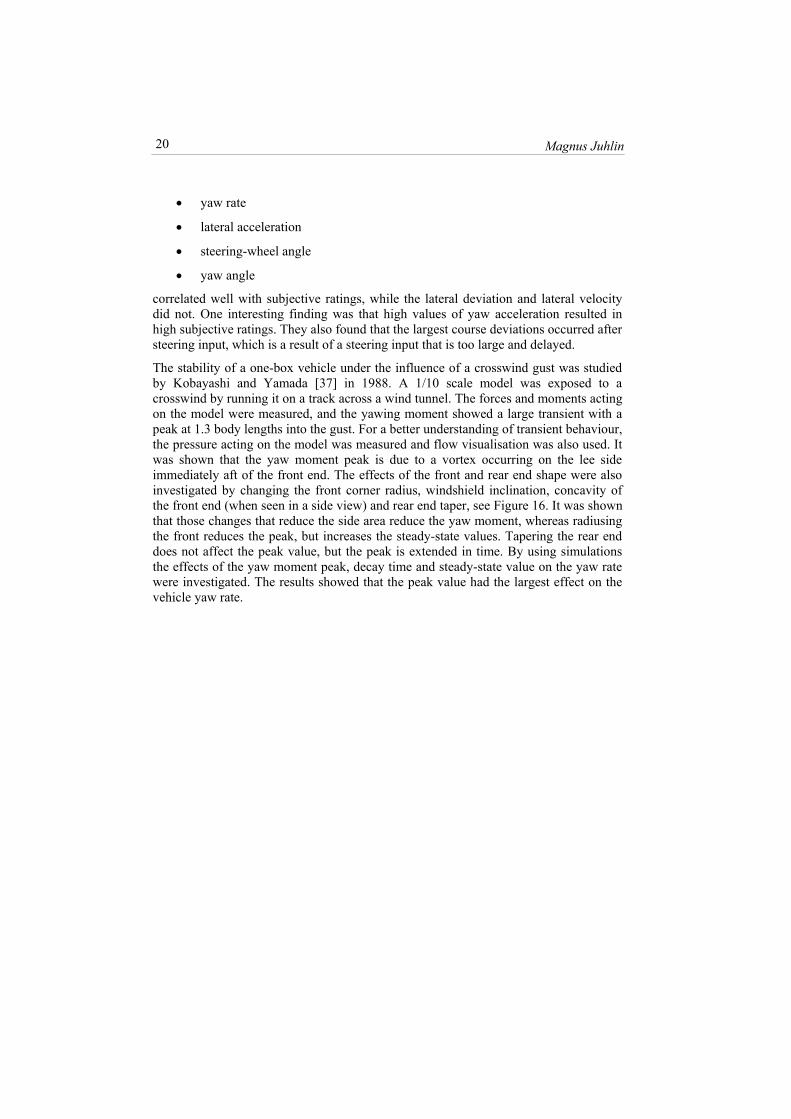
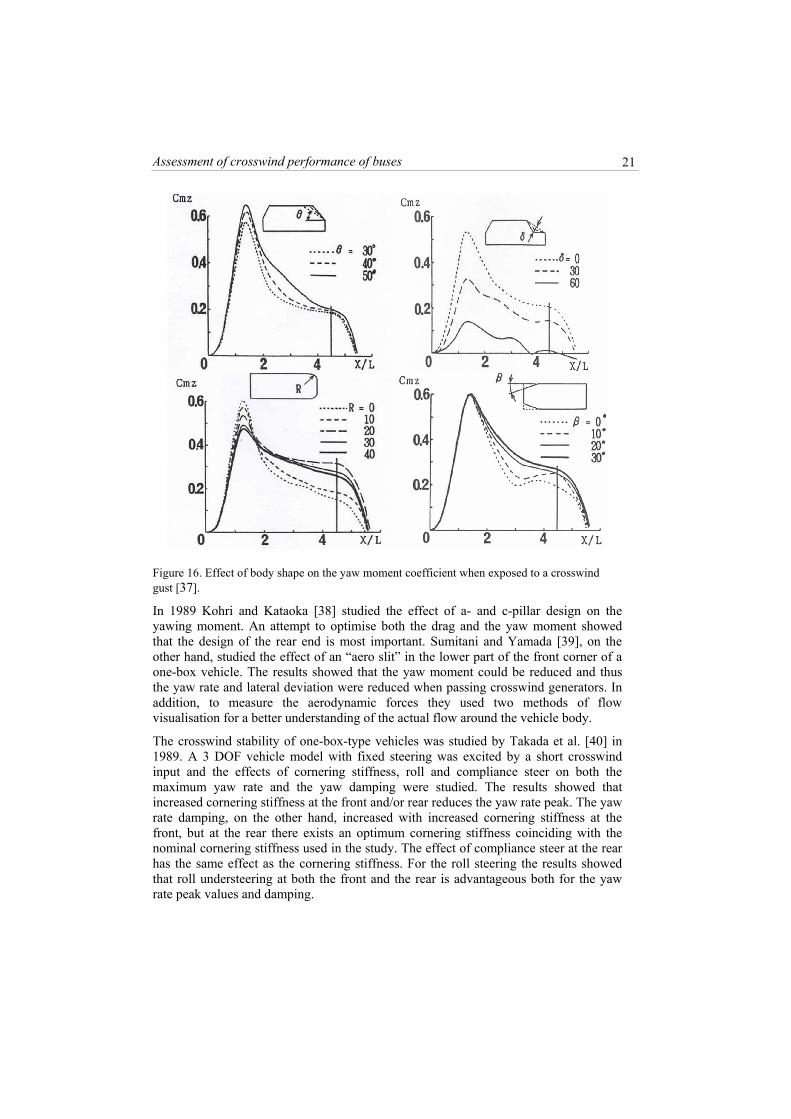
The stability of a one-box vehicle under the influence of a crosswind gust was studied by Kobayashi and Yamada [37] in 1988. A 1/10 scale model was exposed to a crosswind by running it on a track across a wind tunnel. The forces and moments acting on the model were measured, and the yawing moment showed a large transient with a peak at 1.3 body lengths into the gust. For a better understanding of transient behaviour, the pressure acting on the model was measured and flow visualisation was also used. It was shown that the yaw moment peak is due to a vortex occurring on the lee side immediately aft of the front end. The effects of the front and rear end shape were also investigated by changing the front corner radius, windshield inclination, concavity of the front end (when seen in a side view) and rear end taper, see Figure 16. It was shown that those changes that reduce the side area reduce the yaw moment, whereas radiusing the front reduces the peak, but increases the steady-state values. Tapering the rear end does not affect the peak value, but the peak is extended in time. By using simulations the effects of the yaw moment peak, decay time and steady-state value on the yaw rate were investigated. The results showed that the peak value had the largest effect on the vehicle yaw rate.
Assessment of crosswind performance of buses
21
Figure 16. Effect of body shape on the yaw moment coefficient when exposed to a crosswind gust [37].
In 1989 Kohri and Kataoka [38] studied the effect of a- and c-pillar design on the yawing moment. An attempt to optimise both the drag and the yaw moment showed that the design of the rear end is most important. Sumitani and Yamada [39], on the other hand, studied the effect of an “aero slit” in the lower part of the front corner of a one-box vehicle. The results showed that the yaw moment could be reduced and thus the yaw rate and lateral deviation were reduced when passing crosswind generators. In addition, to measure the aerodynamic forces they used two methods of flow visualisation for a better understanding of the actual flow around the vehicle body.
The crosswind stability of one-box-type vehicles was studied by Takada et al. [40] in 1989. A 3 DOF vehicle model with fixed steering was excited by a short crosswind input and the effects of cornering stiffness, roll and compliance steer on both the maximum yaw rate and the yaw damping were studied. The results showed that increased cornering stiffness at the front and/or rear reduces the yaw rate peak. The yaw rate damping, on the other hand, increased with increased cornering stiffness at the front, but at the rear there exists an optimum cornering stiffness coinciding with the nominal cornering stiffness used in the study. The effect of compliance steer at the rear has the same effect as the cornering stiffness. For the roll steering the results showed that roll understeering at both the front and the rear is advantageous both for the yaw rate peak values and damping.
Magnus Juhlin 22
The influence of vehicle-aerodynamic properties and steering system characteristics on passenger car handling for both open-loop and closed-loop crosswind driving scenarios was examined by Mac Adam [41] in 1989. His simulation model incorporated a 5 DOF vehicle model, a detailed steering system and a driver model. Two crosswind manoeuvres were used; one involved an open-loop scenario where the crosswind was represented by a step input, and one a closed-loop scenario where a random crosswind input was used. The effects of the centre of pressure location, projected area, tyre cornering stiffness, roll stiffness, steering stiffness, steering lash and vehicle speed on the yaw rate response were studied. The centre of pressure location had the largest effect on the yaw rate response in the open-loop case. For the closed-loop case the mean steering power proved to be a more discriminatory measure than the yaw rate response. A relative measure of crosswind performance was suggested based on open-loop vehicle response and closed-loop steering.
3.4 The 1990s
In the early 1990s Baker published several studies on the crosswind performance topic. The first study [42] reviewed previous studies of steady-state crosswind forces and moments and concluded that the upstream turbulence levels and scales cause substantial variations in forces and moments. In the second study [43] he extended a theory for aerodynamic admittance in the frequency domain into the time domain, and thereby transients for the lift force, pitch and yaw moment could be predicted. The third study [44] dealt with the interaction of aerodynamic forces and the vehicle system. The method used derives from methods adopted in building aerodynamics and the calculations were carried out in the time domain. Together with Reynolds, Baker studied wind–induced accidents during a major storm in the UK [45]. In that study heavy vehicles were overrepresented in the statistics and 90% of all the accidents occurred at wind speeds above 20 m/s. Coleman and Baker studied the aerodynamic behaviour of a tractor and semi-trailer combination [46]. A study using the previous tractor and semi-trailer combination with a focus on the difference between static and dynamic tests was presented by Humphreys and Baker [47], together with results for the effect of wind fences on the aerodynamic loads. The study was conducted using a moving model and the results showed an increase in the aerodynamic loads for the moving model when compared to the static test. The use of wind fences showed a large potential in reducing crosswind loads on vehicles. Unfortunately, these results only include mean values and therefore lack information on transient effects at gust entry.
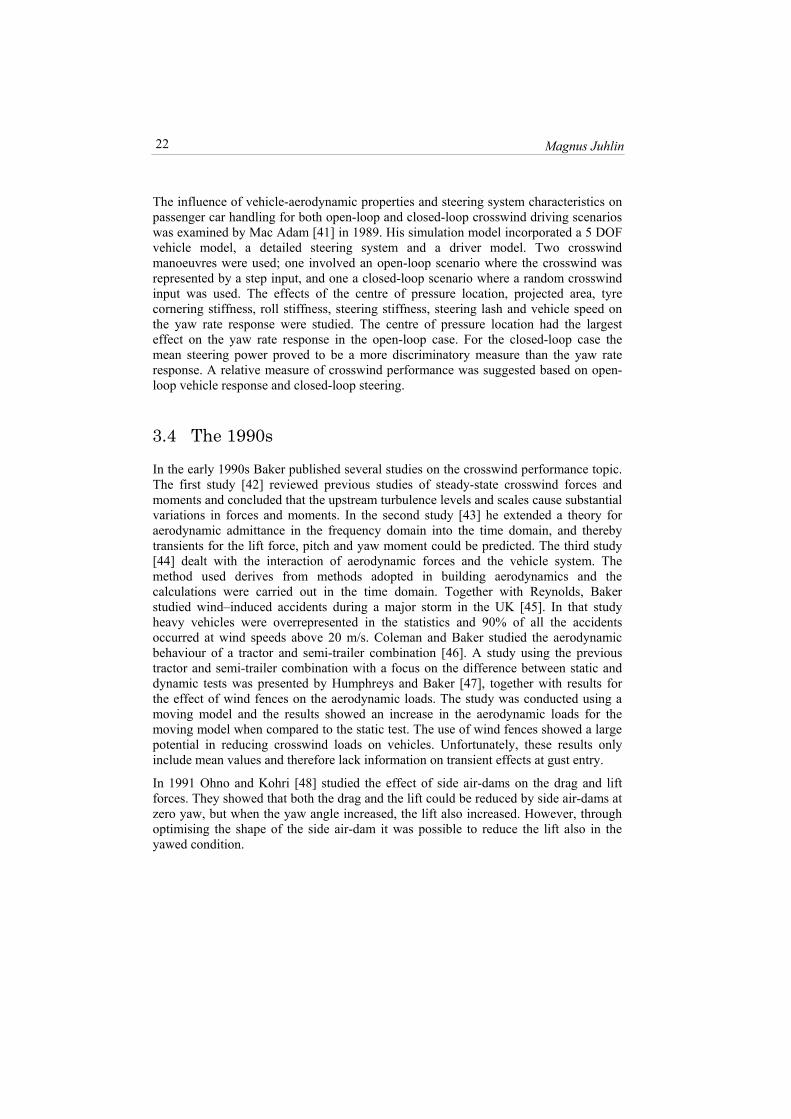
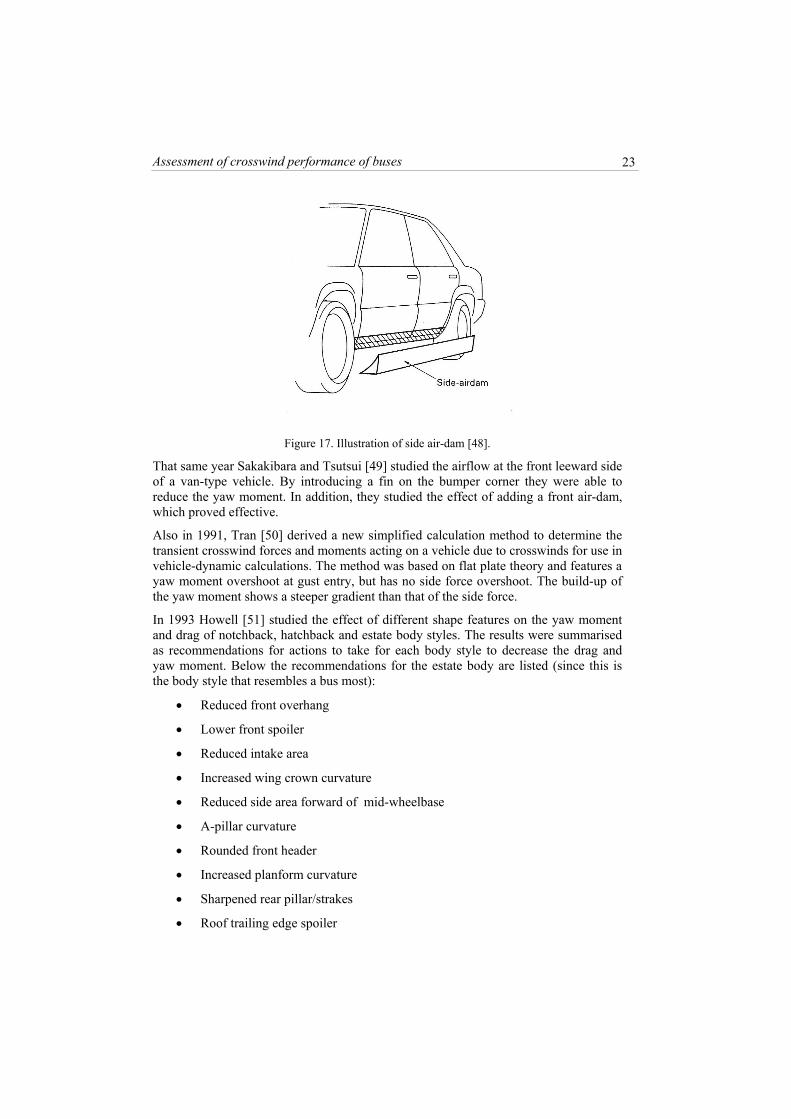
In 1991 Ohno and Kohri [48] studied the effect of side air-dams on the drag and lift forces. They showed that both the drag and the lift could be reduced by side air-dams at zero yaw, but when the yaw angle increased, the lift also increased. However, through optimising the shape of the side air-dam it was possible to reduce the lift also in the yawed condition.
Assessment of crosswind performance of buses
23
Figure 17. Illustration of side air-dam [48].
That same year Sakakibara and Tsutsui [49] studied the airflow at the front leeward side of a van-type vehicle. By introducing a fin on the bumper corner they were able to reduce the yaw moment. In addition, they studied the effect of adding a front air-dam, which proved effective.
Also in 1991, Tran [50] derived a new simplified calculation method to determine the transient crosswind forces and moments acting on a vehicle due to crosswinds for use in vehicle-dynamic calculations. The method was based on flat plate theory and features a yaw moment overshoot at gust entry, but has no side force overshoot. The build-up of the yaw moment shows a steeper gradient than that of the side force.
In 1993 Howell [51] studied the effect of different shape features on the yaw moment and drag of notchback, hatchback and estate body styles. The results were summarised as recommendations for actions to take for each body style to decrease the drag and yaw moment. Below the recommendations for the estate body are listed (since this is the body style that resembles a bus most):
• Reduced front overhang
• Lower front spoiler
• Reduced intake area
• Increased wing crown curvature
• Reduced side area forward of mid-wheelbase
• A-pillar curvature
• Rounded front header
• Increased planform curvature
• Sharpened rear pillar/strakes
• Roof trailing edge spoiler
Magnus Juhlin 24
• Sharpening the cantrail
• Vertical tailgate
Howell also concludes that there are not many items which both improve the crosswind sensitivity and increase the drag when the front end of the car is disregarded. This was not expected.
Okumura et al. [52] used CFD, wind tunnel measurements and crosswind generators for evaluating the effect of adding a front spoiler on a one-box vehicle. The results showed a large reduction of the yaw moment, lift, drag and vehicle yaw rate response.
In order to measure the sensitivity to crosswind under repeatable conditions, crosswind generators can be used. These generators are large fans positioned along a straight test track. Since 1996, in the case of open-loop tests, there exists an ISO-standard [53]. This standard is intended for cars rather than heavy vehicles and requires a wind zone that is 15 m long and preferably more than 25 m. The wind generators should produce an average wind velocity of 20 m/s over the whole vehicle body height. The length of the wind zone corresponds to 3 to 6 body lengths of a normal car. Such a test facility for buses would require a test track of at least 40 m and preferably 90 m. Today no such facility exists to the knowledge of the author.
In 1996 Docton and Dominy [54] presented a CFD calculation of transient crosswinds acting on a basic 2D model. The results showed an overshoot at gust entry for both the side force and the yaw moment. They also showed a steeper build-up of the yaw moment than that of the side force.
3.5 The 21st century
At the beginning of the 21st century, measurements were performed on a one-box model at the Cranfield crosswind track facility by Chadwick et al. [55]. These measurements show the overshoot at gust entry of the side force and yaw moment. They also show the relationship between the distance travelled into the gust and the load overshoot. The measurements were carried out with one sharp-edged and one radiused box. The models were also equipped with pressure transducers, which made it possible to analyse the pressure variations during the crosswind excitation. Their conclusion was that the transient response of a sharp-edged bluff body is characterised by the formation and collapse of a leeward separation bubble, which results in a yaw moment peak. Furthermore, radiusing the sharp edges results in an increasing steady-state yawing moment due to increased localised pressures.
Jarlmark [56] found, using inverse simulations on road test measurements of a car, a side force and yaw moment overshoot at gust entry, with the yaw moment overshoot showing a double peak. In addition, a moving-base vehicle simulator test was performed. The drivers were subjected to different gust types and they were asked to rank them by stating how natural they felt. The results showed that Jarlmark’s proposed transient crosswind gust model was perceived as the most natural one.
Assessment of crosswind performance of buses
25
In 2006 Demuth and Buck [57] used time-dependent CFD simulations in order to compare the aerodynamic forces of two car vehicles when exposed to sinusoidal crosswind gusts.
Petzäll et al. [58] studied in 2008 the effect of changing the edges of the body, from sharp to radiused edges, on the crosswind performance and drag using wind tunnel experiments. They also studied the effect of a front spoiler and side skirts. They found that the best compromises were rounded front edges, a rounded cantrail and sharp rear edges. The front spoiler had a positive effect in most cases, whereas the side skirts were always unfavourable. The difference in aerodynamic load was 123% when comparing the best and worst combination.
The increased computational power available has made it possible to use CFD for estimating the unsteady aerodynamic loads generated by crosswind gusts. Favre et al. [59] have used time-dependent inflow boundary conditions to show that it is possible to estimate the aerodynamic loads acting on a simplified vehicle model exposed to a crosswind gust. The computations were based on the same setup as that used by Chadwick et al. [55].
Billing [61] presented an investigation of off-tracking and rollover for tractor and semi-trailer combinations due to crosswinds. A vehicle model with freedom in yaw and roll was used and the crosswind was applied to the centre of the lateral projected area. The effect of the total vehicle weight, crosswind velocity and vehicle velocity was studied. The results showed that, when the payload was reduced by more than 20% from the full load, the vehicle would roll over at crosswind gusts above 22 m/s and the off-tracking could be in the region of 1-2 m.

4 Contributions to assessment of crosswind performance
The models and methods that have been developed and used in the research work forming this thesis are described in this chapter, together with examples of the results that have been achieved using these models and methods.
4.1 Modelling of crosswind performance
Simulations provide a powerful tool when analysing the effect of several parameters on the vehicle performance. This is due to the simplicity of changing vehicle parameters and the repeatability of the manoeuvres used for the evaluation. The repeatability of simulations is especially valuable when studying crosswind performance, since the ambient conditions are very hard to monitor and to control when performing field experiments. In addition, simulations provide the possibility of evaluating manoeuvres that are potentially dangerous without jeopardising the safety of the driver and his fellow road users.
In order to avoid the inherent random behaviour of crosswinds and the potential danger when investigating the crosswind performance of buses, simulations have been used in Papers A and B. In Paper C, on the other hand, inverse simulations were used on measured vehicle data in order to estimate the aerodynamic loads on a bus when exposed to natural crosswind gusts.
4.1.1 Vehicle modelling
When modelling a road vehicle for the purpose of estimating the vehicle response to a steering input or an external disturbance, the level of detail has to be adapted to the need for accuracy and the computational power available. When the available computational power is low and the need for real-time execution is important, i.e. in a driving simulator or for an ESC system, simplified models such as planar single or
27
Magnus Juhlin 28
dual-track models are appropriate. These models only have 3 DOF, two translational and one rotational, and therefore the effect of load transfer is not considered. However, the effect of suspension kinematics and elastokinematics can be included through adapting the cornering stiffness of the tyres. The level of detail is increased when a roll-axle model is added to the planar model, thereby incorporating the effect of the lateral load transfer, and thus the roll behaviour can be analysed. These models can be further refined by adding degrees of freedom for each wheel etc. Today, with the existence of software that has the capability to handle multi-body dynamics and even flexible bodies, the vehicle model can be rather detailed. A software package such as MSC.ADAMS has the capability of auto-generating the equations of motion for the multi-body system of interest, and thereby facilitates a high level of detail and thus the inclusion of non-linear characteristics
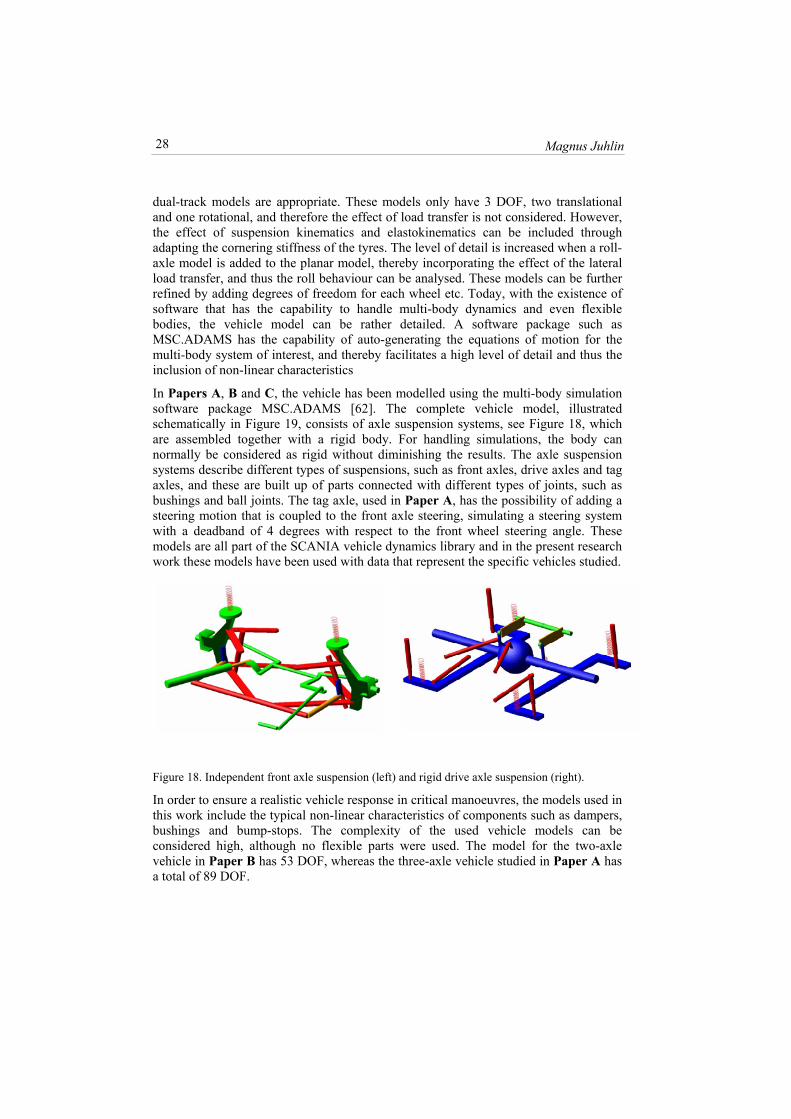
In Papers A, B and C, the vehicle has been modelled using the multi-body simulation software package MSC.ADAMS [62]. The complete vehicle model, illustrated schematically in Figure 19, consists of axle suspension systems, see Figure 18, which are assembled together with a rigid body. For handling simulations, the body can normally be considered as rigid without diminishing the results. The axle suspension systems describe different types of suspensions, such as front axles, drive axles and tag axles, and these are built up of parts connected with different types of joints, such as bushings and ball joints. The tag axle, used in Paper A, has the possibility of adding a steering motion that is coupled to the front axle steering, simulating a steering system with a deadband of 4 degrees with respect to the front wheel steering angle. These models are all part of the SCANIA vehicle dynamics library and in the present research work these models have been used with data that represent the specific vehicles studied.
Figure 18. Independent front axle suspension (left) and rigid drive axle suspension (right).
In order to ensure a realistic vehicle response in critical manoeuvres, the models used in this work include the typical non-linear characteristics of components such as dampers, bushings and bump-stops. The complexity of the used vehicle models can be considered high, although no flexible parts were used. The model for the two-axle vehicle in Paper B has 53 DOF, whereas the three-axle vehicle studied in Paper A has a total of 89 DOF.
Assessment of crosswind performance of buses
29
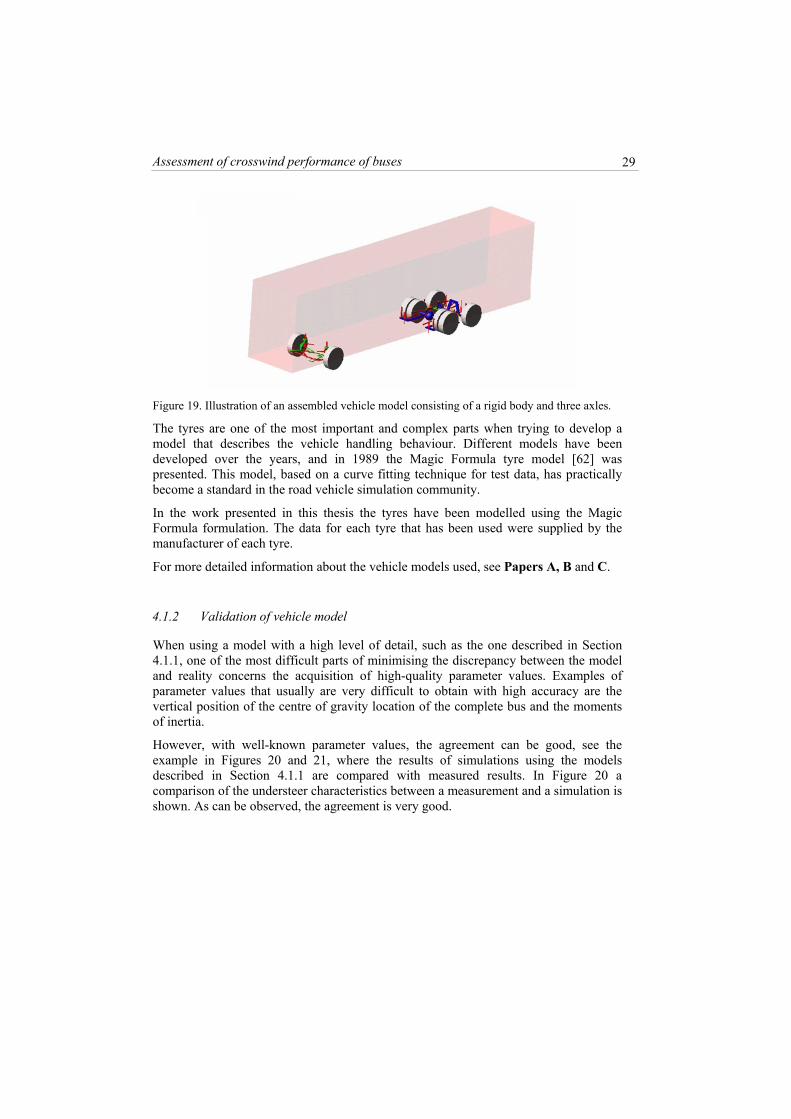
Figure 19. Illustration of an assembled vehicle model consisting of a rigid body and three axles.
The tyres are one of the most important and complex parts when trying to develop a model that describes the vehicle handling behaviour. Different models have been developed over the years, and in 1989 the Magic Formula tyre model [62] was presented. This model, based on a curve fitting technique for test data, has practically become a standard in the road vehicle simulation community.
In the work presented in this thesis the tyres have been modelled using the Magic Formula formulation. The data for each tyre that has been used were supplied by the manufacturer of each tyre.
For more detailed information about the vehicle models used, see Papers A, B and C.
4.1.2 Validation of vehicle model
When using a model with a high level of detail, such as the one described in Section 4.1.1, one of the most difficult parts of minimising the discrepancy between the model and reality concerns the acquisition of high-quality parameter values. Examples of parameter values that usually are very difficult to obtain with high accuracy are the vertical position of the centre of gravity location of the complete bus and the moments of inertia.
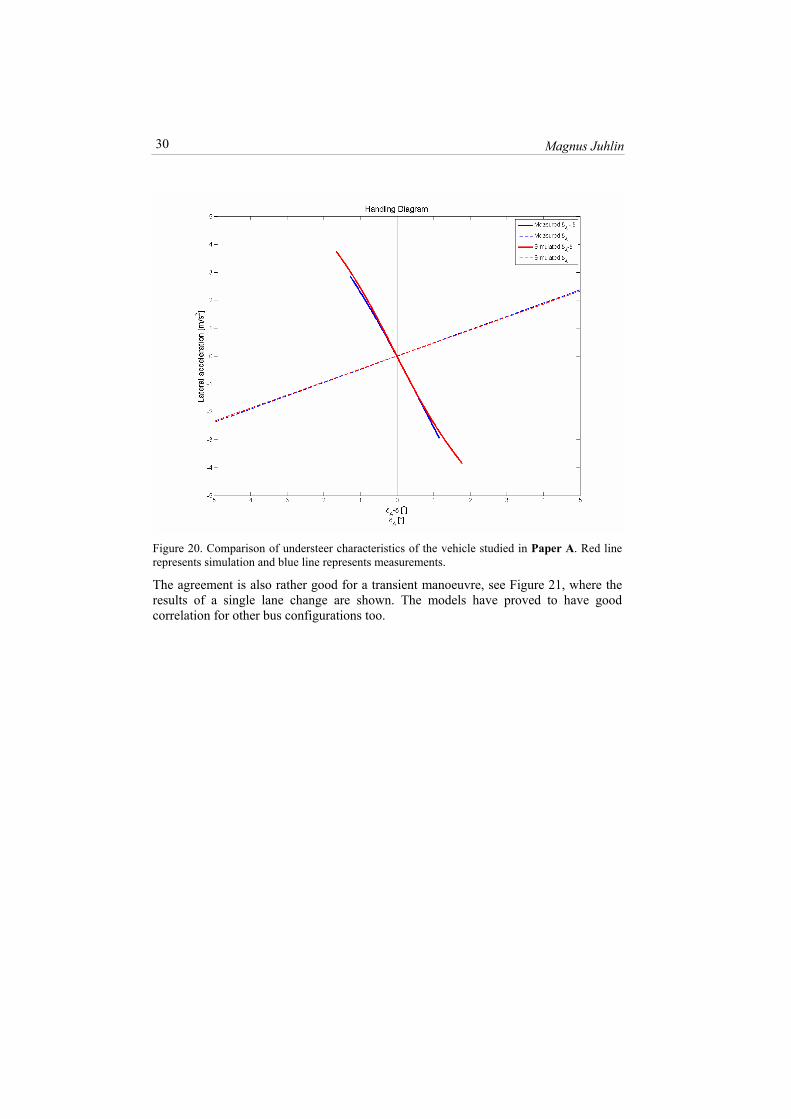
However, with well-known parameter values, the agreement can be good, see the example in Figures 20 and 21, where the results of simulations using the models described in Section 4.1.1 are compared with measured results. In Figure 20 a comparison of the understeer characteristics between a measurement and a simulation is shown. As can be observed, the agreement is very good.
Magnus Juhlin 30
Figure 20. Comparison of understeer characteristics of the vehicle studied in Paper A. Red line represents simulation and blue line represents measurements.
The agreement is also rather good for a transient manoeuvre, see Figure 21, where the results of a single lane change are shown. The models have proved to have good correlation for other bus configurations too.
Assessment of crosswind performance of buses
31
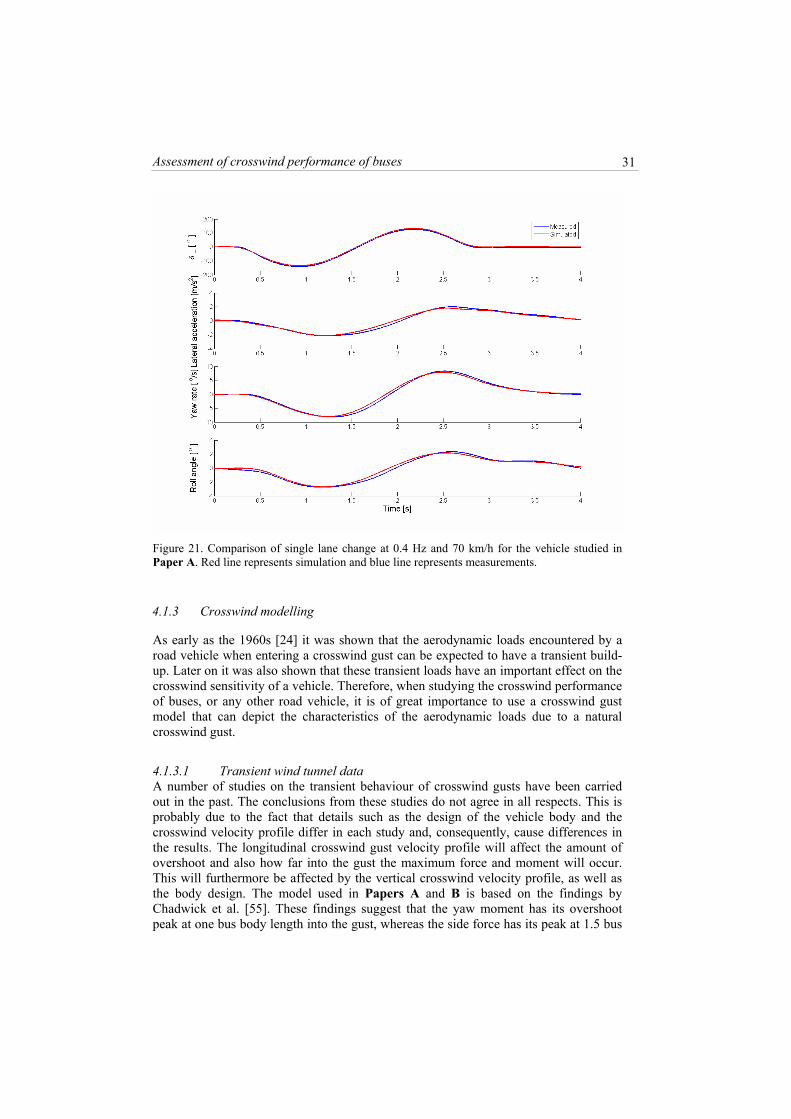
Figure 21. Comparison of single lane change at 0.4 Hz and 70 km/h for the vehicle studied in Paper A. Red line represents simulation and blue line represents measurements.
4.1.3 Crosswind modelling
As early as the 1960s [24] it was shown that the aerodynamic loads encountered by a road vehicle when entering a crosswind gust can be expected to have a transient build-up. Later on it was also shown that these transient loads have an important effect on the crosswind sensitivity of a vehicle. Therefore, when studying the crosswind performance of buses, or any other road vehicle, it is of great importance to use a crosswind gust model that can depict the characteristics of the aerodynamic loads due to a natural crosswind gust.
4.1.3.1 Transient wind tunnel data A number of studies on the transient behaviour of crosswind gusts have been carried out in the past. The conclusions from these studies do not agree in all respects. This is probably due to the fact that details such as the design of the vehicle body and the crosswind velocity profile differ in each study and, consequently, cause differences in the results. The longitudinal crosswind gust velocity profile will affect the amount of overshoot and also how far into the gust the maximum force and moment will occur. This will furthermore be affected by the vertical crosswind velocity profile, as well as the body design. The model used in Papers A and B is based on the findings by Chadwick et al. [55]. These findings suggest that the yaw moment has its overshoot peak at one bus body length into the gust, whereas the side force has its peak at 1.5 bus
Magnus Juhlin 32
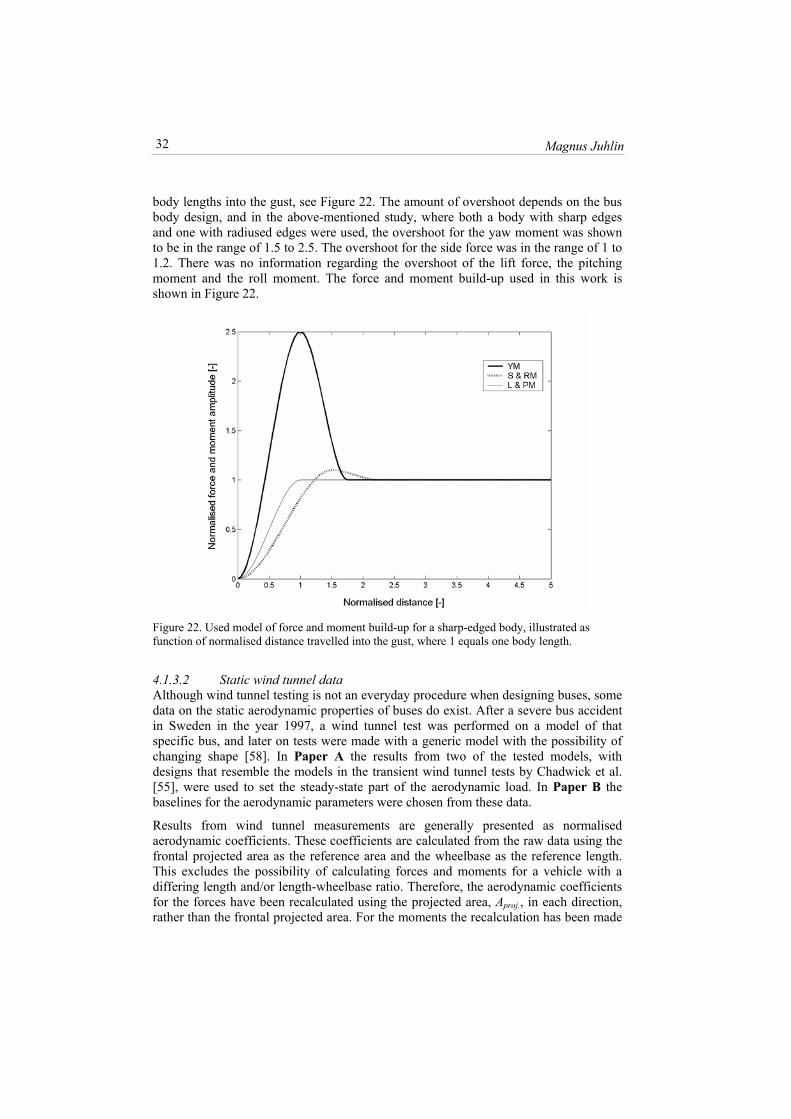
body lengths into the gust, see Figure 22. The amount of overshoot depends on the bus body design, and in the above-mentioned study, where both a body with sharp edges and one with radiused edges were used, the overshoot for the yaw moment was shown to be in the range of 1.5 to 2.5. The overshoot for the side force was in the range of 1 to 1.2. There was no information regarding the overshoot of the lift force, the pitching moment and the roll moment. The force and moment build-up used in this work is shown in Figure 22.
Figure 22. Used model of force and moment build-up for a sharp-edged body, illustrated as function of normalised distance travelled into the gust, where 1 equals one body length.
4.1.3.2 Static wind tunnel data Although wind tunnel testing is not an everyday procedure when designing buses, some data on the static aerodynamic properties of buses do exist. After a severe bus accident in Sweden in the year 1997, a wind tunnel test was performed on a model of that specific bus, and later on tests were made with a generic model with the possibility of changing shape [58]. In Paper A the results from two of the tested models, with designs that resemble the models in the transient wind tunnel tests by Chadwick et al. [55], were used to set the steady-state part of the aerodynamic load. In Paper B the baselines for the aerodynamic parameters were chosen from these data.
Results from wind tunnel measurements are generally presented as normalised aerodynamic coefficients. These coefficients are calculated from the raw data using the frontal projected area as the reference area and the wheelbase as the reference length. This excludes the possibility of calculating forces and moments for a vehicle with a differing length and/or length-wheelbase ratio. Therefore, the aerodynamic coefficients for the forces have been recalculated using the projected area, Aproj., in each direction, rather than the frontal projected area. For the moments the recalculation has been made
Assessment of crosswind performance of buses
33
using the total length Lbody and frontal area Afront instead of the wheelbase and frontal area.
4.1.3.3 Implementation of crosswind gust model The forces (Fi) and moments (Mj) according to the description in Sections 4.1.3.1 and 4.1.3.2 and Equations 3 and 4 were implemented with directions according to Figure 8 in MSC.ADAMS using a GFORCE element. The GFORCE element was located at a fixed distance, relative to the bus body length, from the front of the bus body. In Paper A the forces and moments were described using spline curves and in Paper B a 3rd order polynomial described the transient behaviour.
( ) )d(FCAvdF normnorm
ii.projnormi ⋅⋅⋅⋅⋅= 2
21 ρ (3)
( ) )(21
.2
normnormjjbodyfrontnormj dMCLAvdM ⋅⋅⋅⋅⋅⋅= ρ (4)
where ρ is the density of air, v is the resulting wind velocity, and are the normalised force and moment respectively,
normiF norm
jML,Si = and PMRMYMj ,,= .
4.2 Estimating aerodynamic load
Several methods exist for estimating the aerodynamic load due to a crosswind gust. If the transient force and moment build-up at gust entry is of interest, an ordinary steady-state wind tunnel test is not enough, since the pressure distribution over the body at gust entry differs from that in a steady state. Instead a moving model propelled through a wind tunnel test section can be used. One disadvantage of this method is the discrepancy of the boundary layer compared to natural conditions. Another is the need for a wind tunnel with the possibility of propelling a model through the test section. Today it is possible to calculate the aerodynamic loads through CFD and time-dependent inflow boundary conditions. This method demands high computational power, especially when a detailed model is used.
If the pressure on the vehicle body is measured and integrated over the surface, the aerodynamic load due to natural crosswind gusts or due to crosswind generators can be estimated. Measuring the pressure over the whole body surface is, however, a laborious task. Therefore Tran [60] presented a method where the forces and moments were accurately estimated from measurements of pressure at a limited number of positions.
In Paper C a method for estimating the aerodynamic load on a bus exposed to natural crosswind gusts was proposed. The method was evaluated by utilizing on-road measurements. The tyre forces, driver input, wind velocity and vehicle response were measured on a real bus running on a road subjected to crosswind. Based on these measurements, and a detailed MBS vehicle model, the MTS RPC Pro software was used for estimating the aerodynamic load through inverse simulations. This method was inspired by the work of Jarlmark [56], although in the present work a detailed MBS vehicle model was used and the wind velocity and tyre forces were measured by other
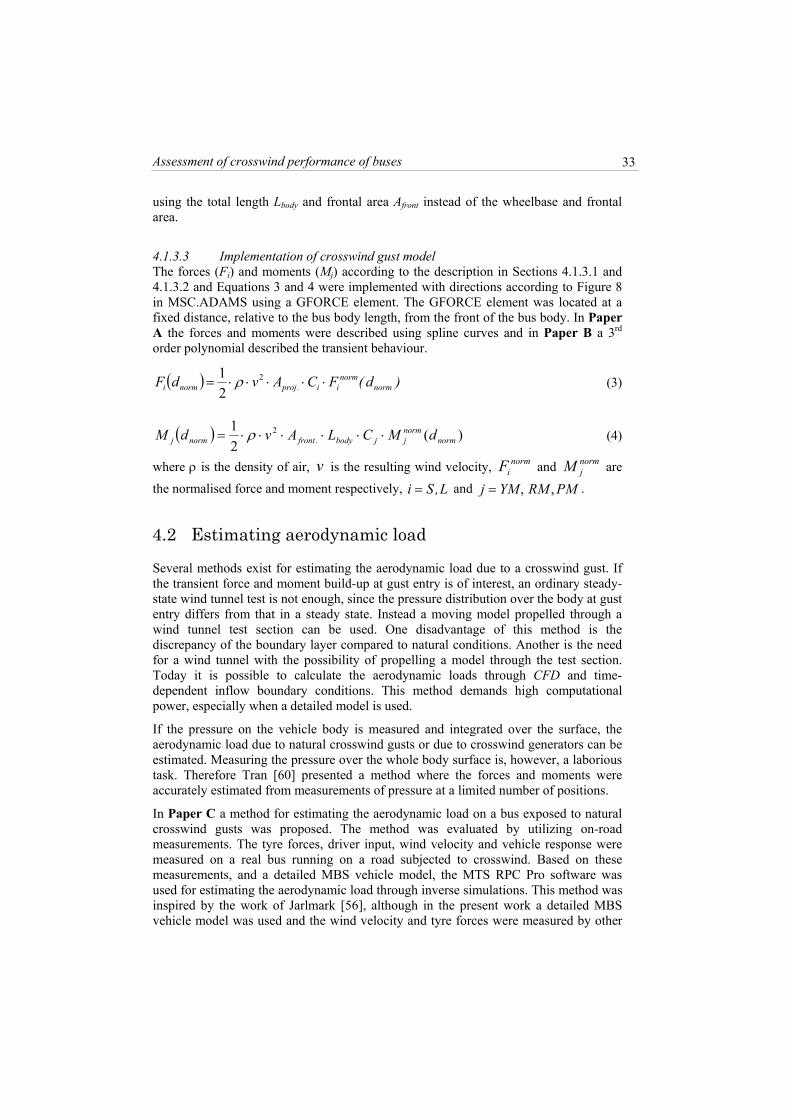
Magnus Juhlin 34
means. In addition, the inverse simulations were carried out by using the MTS RPC Pro software. One example of results from these inverse simulations is shown in Figure 23.
Figure 23. Aerodynamic loads estimated through inverse simulations on measured data using the method developed in Paper C and later used in Papers D and E.
Although the crosswind velocity build-up is slower than that in wind-tunnel experiments found in the literature and despite the lack of a clear steady-state condition, it is clear that the estimated aerodynamic loads agree well with the crosswind model used in Papers A and B. The build-up of the yaw moment is faster than that of the side force and the transient peak of the yaw moment is larger than that of the side force.
4.3 Simulation of crosswind performance
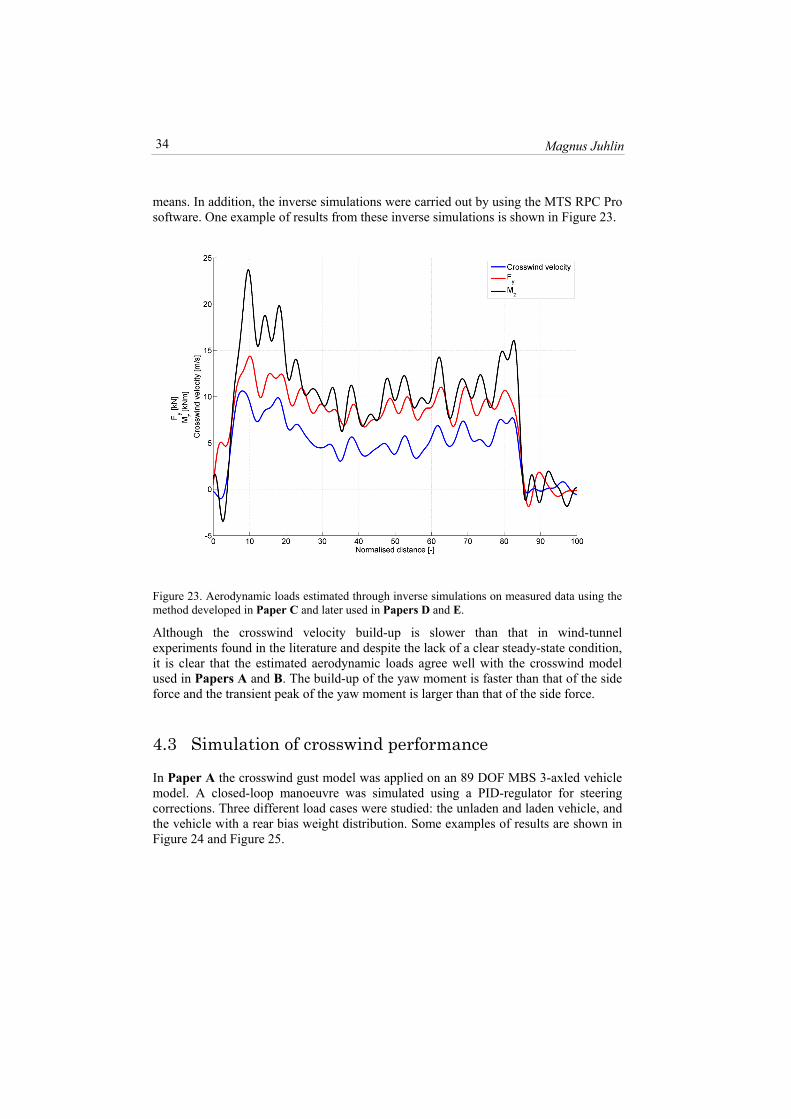
In Paper A the crosswind gust model was applied on an 89 DOF MBS 3-axled vehicle model. A closed-loop manoeuvre was simulated using a PID-regulator for steering corrections. Three different load cases were studied: the unladen and laden vehicle, and the vehicle with a rear bias weight distribution. Some examples of results are shown in Figure 24 and Figure 25.
Assessment of crosswind performance of buses
35
Figure 24. Comparison of lateral deviation and steering-wheel angle for three different load conditions.
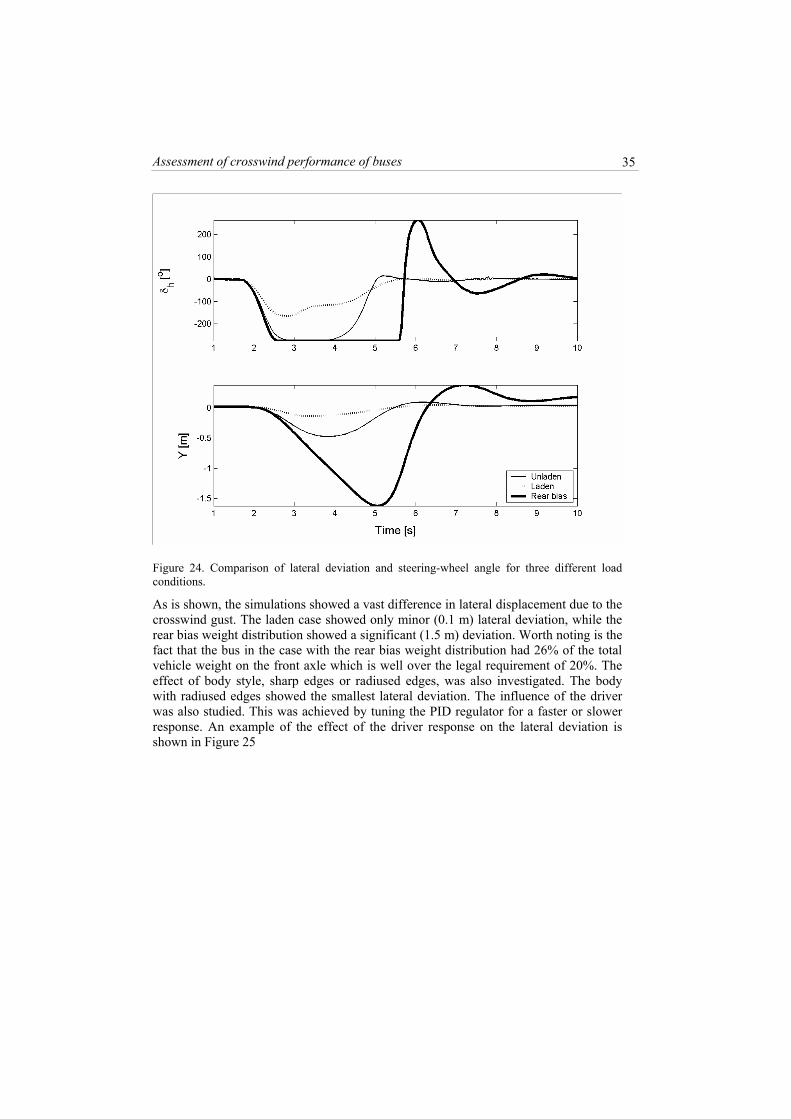
As is shown, the simulations showed a vast difference in lateral displacement due to the crosswind gust. The laden case showed only minor (0.1 m) lateral deviation, while the rear bias weight distribution showed a significant (1.5 m) deviation. Worth noting is the fact that the bus in the case with the rear bias weight distribution had 26% of the total vehicle weight on the front axle which is well over the legal requirement of 20%. The effect of body style, sharp edges or radiused edges, was also investigated. The body with radiused edges showed the smallest lateral deviation. The influence of the driver was also studied. This was achieved by tuning the PID regulator for a faster or slower response. An example of the effect of the driver response on the lateral deviation is shown in Figure 25
Magnus Juhlin 36
Figure 25. Comparison of lateral deviation for one fast and one slow driver model setting.
The driver with a fast response was shown to be able to achieve a considerable reduction of the lateral deviation; i.e. it is shown that the driver can affect the crosswind performance of the driver-vehicle system significantly.
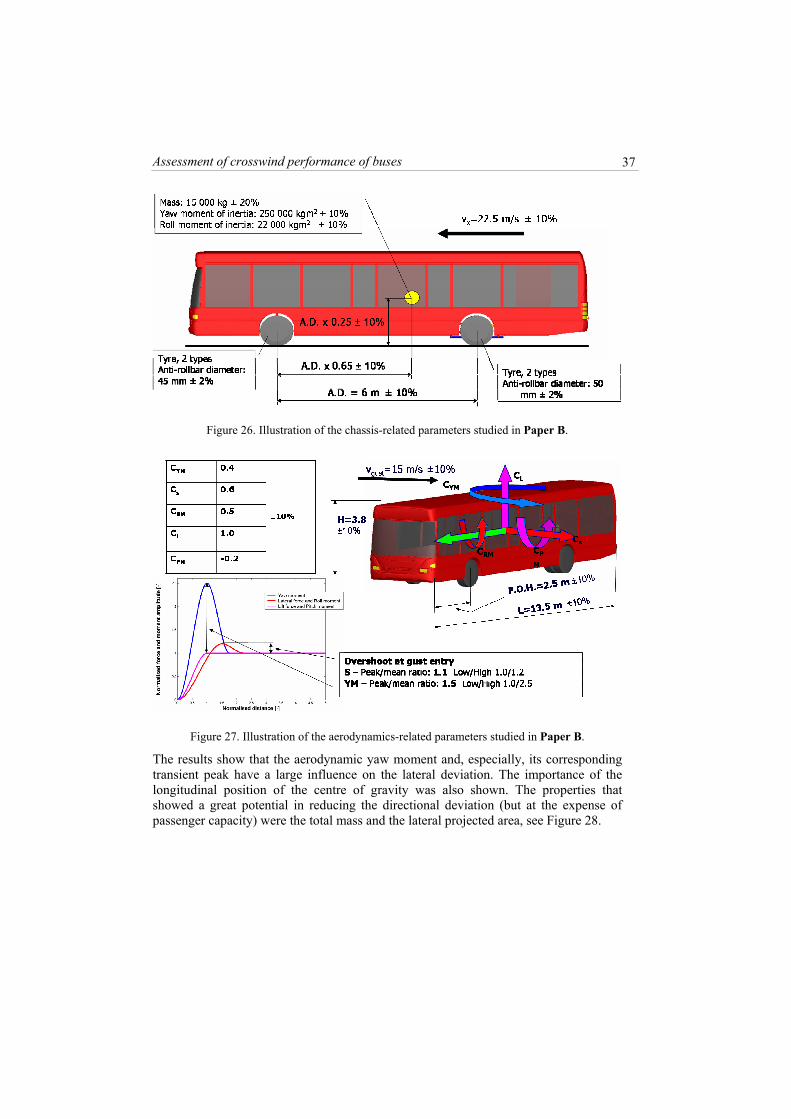
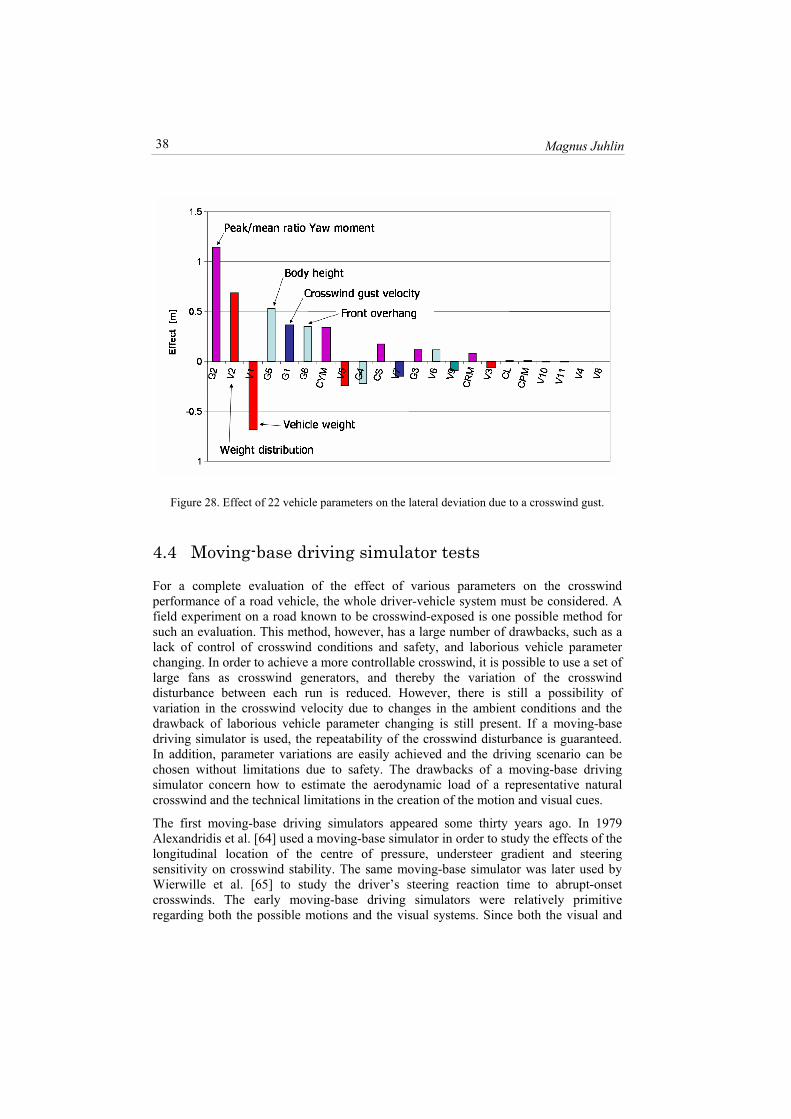
In Paper B the crosswind sensitivity of a parameterised 53 DOF MBS 2-axled bus-model was studied. The influence of 22 parameters on the vehicle response for an open-loop manoeuvre with fixed steering was investigated. Half of the parameters were related to the chassis, see Figure 26, and the other half were related to the aerodynamic properties, see Figure 27. In Figure 28 the effects of these parameters on the lateral deviation are shown with the most important parameters pointed out.
Assessment of crosswind performance of buses
37
Figure 26. Illustration of the chassis-related parameters studied in Paper B.
Figure 27. Illustration of the aerodynamics-related parameters studied in Paper B.
The results show that the aerodynamic yaw moment and, especially, its corresponding transient peak have a large influence on the lateral deviation. The importance of the longitudinal position of the centre of gravity was also shown. The properties that showed a great potential in reducing the directional deviation (but at the expense of passenger capacity) were the total mass and the lateral projected area, see Figure 28.
Magnus Juhlin 38
Figure 28. Effect of 22 vehicle parameters on the lateral deviation due to a crosswind gust.
4.4 Moving-base driving simulator tests
For a complete evaluation of the effect of various parameters on the crosswind performance of a road vehicle, the whole driver-vehicle system must be considered. A field experiment on a road known to be crosswind-exposed is one possible method for such an evaluation. This method, however, has a large number of drawbacks, such as a lack of control of crosswind conditions and safety, and laborious vehicle parameter changing. In order to achieve a more controllable crosswind, it is possible to use a set of large fans as crosswind generators, and thereby the variation of the crosswind disturbance between each run is reduced. However, there is still a possibility of variation in the crosswind velocity due to changes in the ambient conditions and the drawback of laborious vehicle parameter changing is still present. If a moving-base driving simulator is used, the repeatability of the crosswind disturbance is guaranteed. In addition, parameter variations are easily achieved and the driving scenario can be chosen without limitations due to safety. The drawbacks of a moving-base driving simulator concern how to estimate the aerodynamic load of a representative natural crosswind and the technical limitations in the creation of the motion and visual cues.
The first moving-base driving simulators appeared some thirty years ago. In 1979 Alexandridis et al. [64] used a moving-base simulator in order to study the effects of the longitudinal location of the centre of pressure, understeer gradient and steering sensitivity on crosswind stability. The same moving-base simulator was later used by Wierwille et al. [65] to study the driver’s steering reaction time to abrupt-onset crosswinds. The early moving-base driving simulators were relatively primitive regarding both the possible motions and the visual systems. Since both the visual and
Assessment of crosswind performance of buses
39
motion cues have to be created in real time and, in addition, need to be well synchronised, the demand on the computational effort is high. As computer performance has developed over the years, the graphics of the visual systems has become more detailed. In addition, it has been possible to use more detailed vehicle models, although there are still limitations on how detailed a vehicle model can be to enable real-time use.
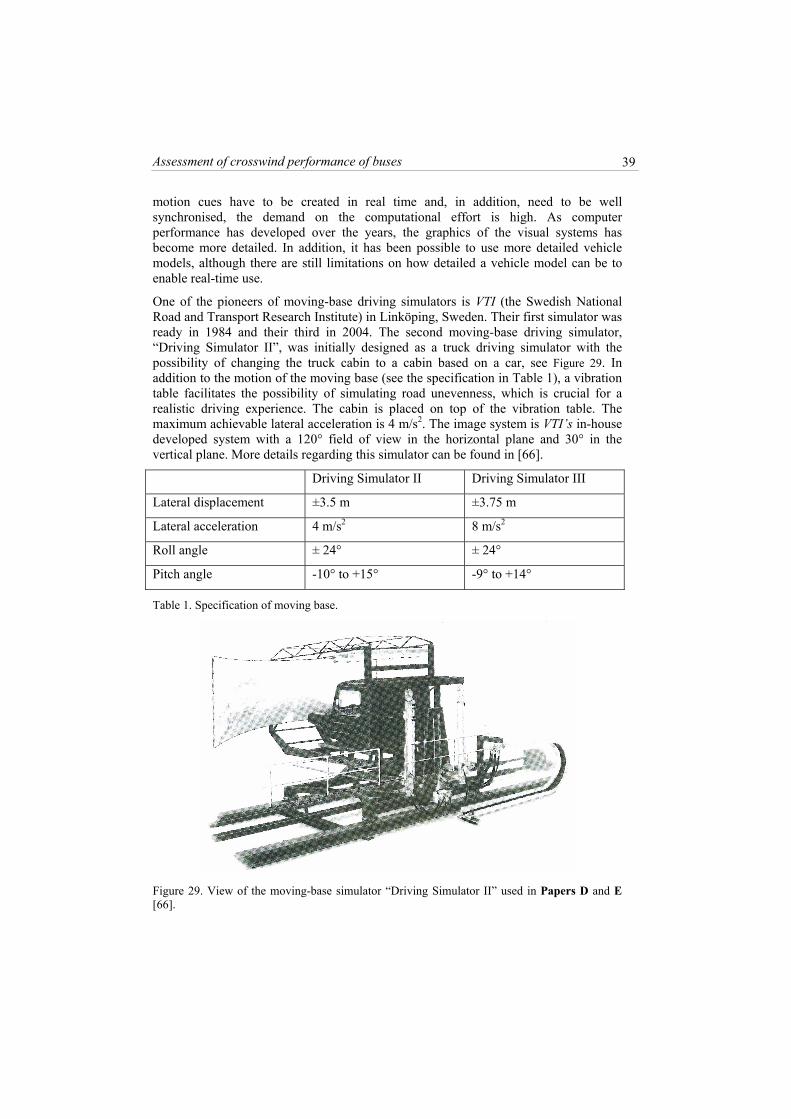
One of the pioneers of moving-base driving simulators is VTI (the Swedish National Road and Transport Research Institute) in Linköping, Sweden. Their first simulator was ready in 1984 and their third in 2004. The second moving-base driving simulator, “Driving Simulator II”, was initially designed as a truck driving simulator with the possibility of changing the truck cabin to a cabin based on a car, see Figure 29. In addition to the motion of the moving base (see the specification in Table 1), a vibration table facilitates the possibility of simulating road unevenness, which is crucial for a realistic driving experience. The cabin is placed on top of the vibration table. The maximum achievable lateral acceleration is 4 m/s2. The image system is VTI’s in-house developed system with a 120° field of view in the horizontal plane and 30° in the vertical plane. More details regarding this simulator can be found in [66].
Driving Simulator II Driving Simulator III
Lateral displacement ±3.5 m ±3.75 m
Lateral acceleration 4 m/s2 8 m/s2
Roll angle ± 24° ± 24°
Pitch angle -10° to +15° -9° to +14°
Table 1. Specification of moving base.
Figure 29. View of the moving-base simulator “Driving Simulator II” used in Papers D and E [66].
Magnus Juhlin 40
In December 2007 Toyota unveiled a new moving-base driving simulator. This simulator and the National Advanced Driving Simulator (NADS) at the University of Iowa are probably the most advanced simulators today. They both feature a 360-degree video screen and the moving base has the possibility of moving in two directions over an area of approximately 700 m2.
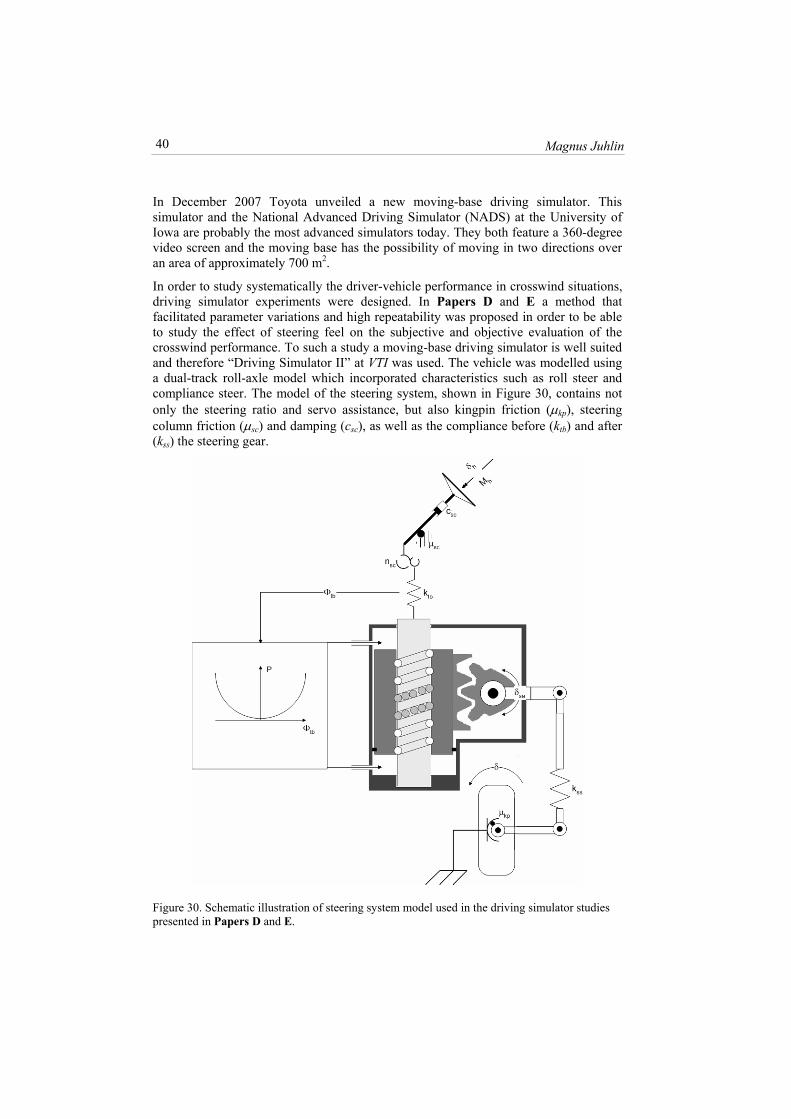
In order to study systematically the driver-vehicle performance in crosswind situations, driving simulator experiments were designed. In Papers D and E a method that facilitated parameter variations and high repeatability was proposed in order to be able to study the effect of steering feel on the subjective and objective evaluation of the crosswind performance. To such a study a moving-base driving simulator is well suited and therefore “Driving Simulator II” at VTI was used. The vehicle was modelled using a dual-track roll-axle model which incorporated characteristics such as roll steer and compliance steer. The model of the steering system, shown in Figure 30, contains not only the steering ratio and servo assistance, but also kingpin friction (μkp), steering column friction (μsc) and damping (csc), as well as the compliance before (ktb) and after (kss) the steering gear.
Figure 30. Schematic illustration of steering system model used in the driving simulator studies presented in Papers D and E.
Assessment of crosswind performance of buses
41
The aerodynamic load utilised was derived using the method developed in Paper C. This method of evaluating the crosswind performance made it possible to investigate the effect of steering feel on subjective as well as objective crosswind performance by changing the centre of gravity, steering ratio and servo characteristics.
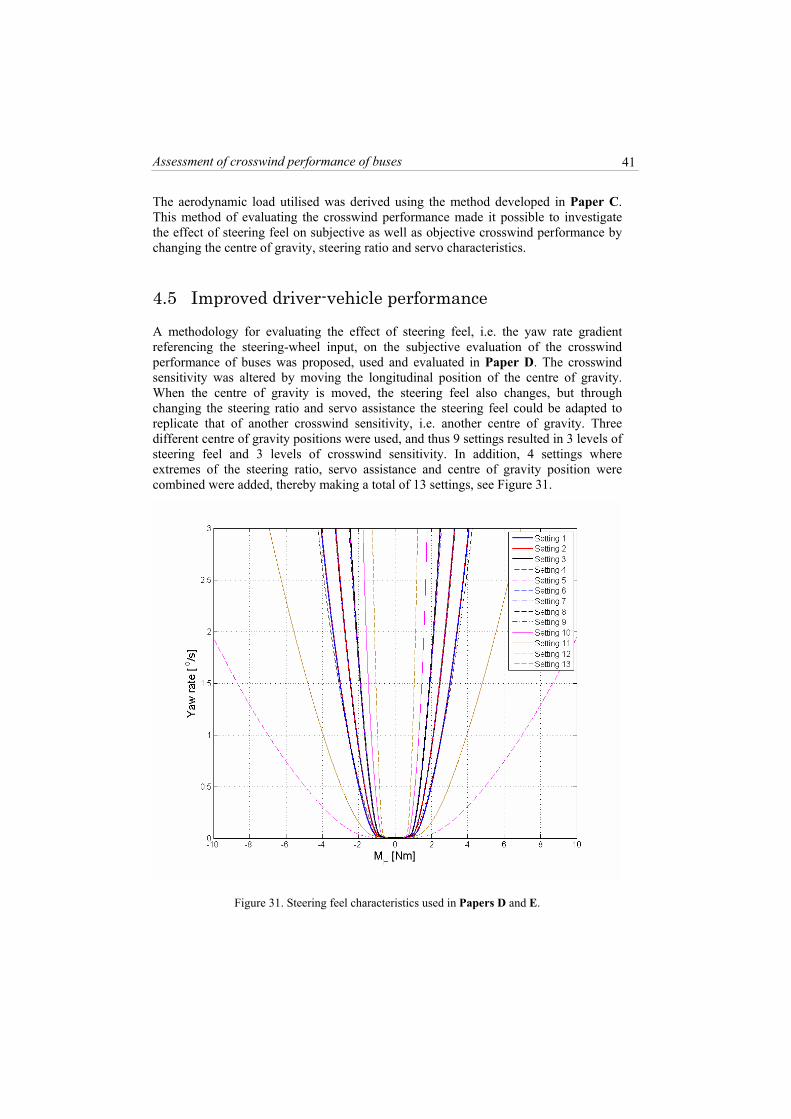
4.5 Improved driver-vehicle performance
A methodology for evaluating the effect of steering feel, i.e. the yaw rate gradient referencing the steering-wheel input, on the subjective evaluation of the crosswind performance of buses was proposed, used and evaluated in Paper D. The crosswind sensitivity was altered by moving the longitudinal position of the centre of gravity. When the centre of gravity is moved, the steering feel also changes, but through changing the steering ratio and servo assistance the steering feel could be adapted to replicate that of another crosswind sensitivity, i.e. another centre of gravity. Three different centre of gravity positions were used, and thus 9 settings resulted in 3 levels of steering feel and 3 levels of crosswind sensitivity. In addition, 4 settings where extremes of the steering ratio, servo assistance and centre of gravity position were combined were added, thereby making a total of 13 settings, see Figure 31.
Figure 31. Steering feel characteristics used in Papers D and E.
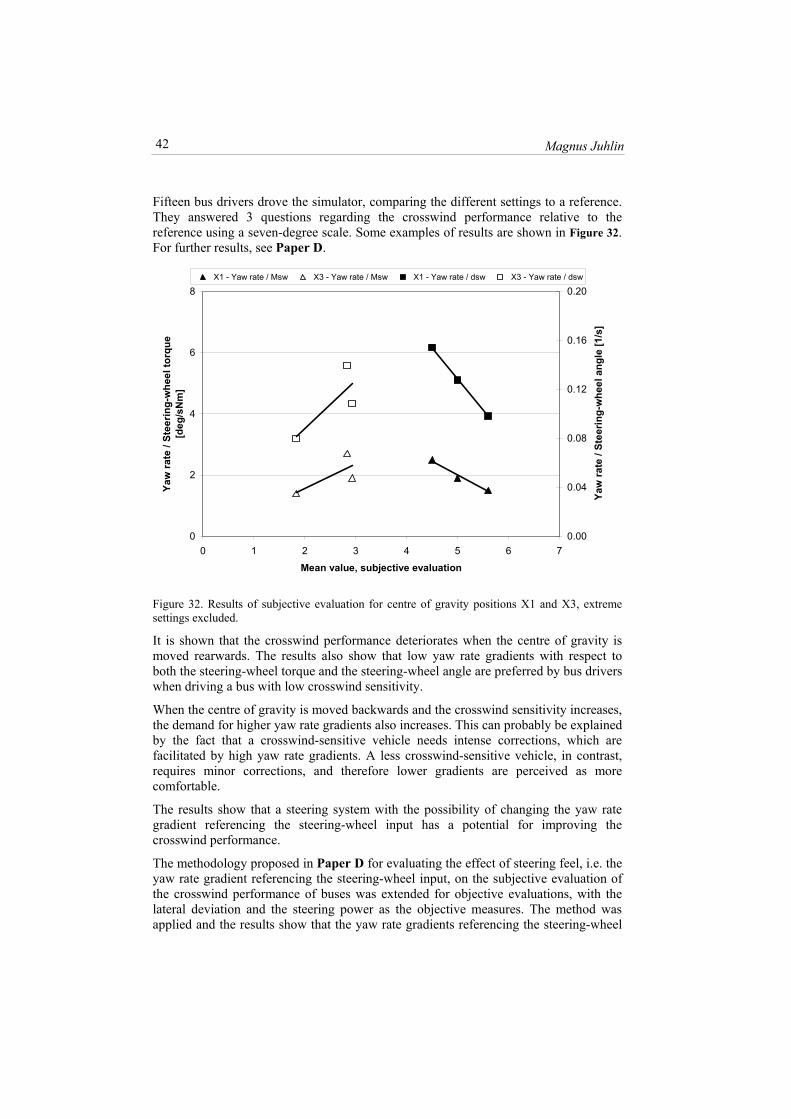
Magnus Juhlin 42
Fifteen bus drivers drove the simulator, comparing the different settings to a reference. They answered 3 questions regarding the crosswind performance relative to the reference using a seven-degree scale. Some examples of results are shown in Figure 32. For further results, see Paper D.
0
2
4
6
8
0 1 2 3 4 5 6 7
Mean value, subjective evaluation
Yaw
rate
/ St
eerin
g-w
heel
torq
ue
[deg
/sN
m]
0.00
0.04
0.08
0.12
0.16
0.20
Yaw
rate
/ St
eerin
g-w
heel
ang
le [1
/s]
X1 - Yaw rate / Msw X3 - Yaw rate / Msw X1 - Yaw rate / dsw X3 - Yaw rate / dsw
Figure 32. Results of subjective evaluation for centre of gravity positions X1 and X3, extreme settings excluded.
It is shown that the crosswind performance deteriorates when the centre of gravity is moved rearwards. The results also show that low yaw rate gradients with respect to both the steering-wheel torque and the steering-wheel angle are preferred by bus drivers when driving a bus with low crosswind sensitivity.
When the centre of gravity is moved backwards and the crosswind sensitivity increases, the demand for higher yaw rate gradients also increases. This can probably be explained by the fact that a crosswind-sensitive vehicle needs intense corrections, which are facilitated by high yaw rate gradients. A less crosswind-sensitive vehicle, in contrast, requires minor corrections, and therefore lower gradients are perceived as more comfortable.
The results show that a steering system with the possibility of changing the yaw rate gradient referencing the steering-wheel input has a potential for improving the crosswind performance.
The methodology proposed in Paper D for evaluating the effect of steering feel, i.e. the yaw rate gradient referencing the steering-wheel input, on the subjective evaluation of the crosswind performance of buses was extended for objective evaluations, with the lateral deviation and the steering power as the objective measures. The method was applied and the results show that the yaw rate gradients referencing the steering-wheel
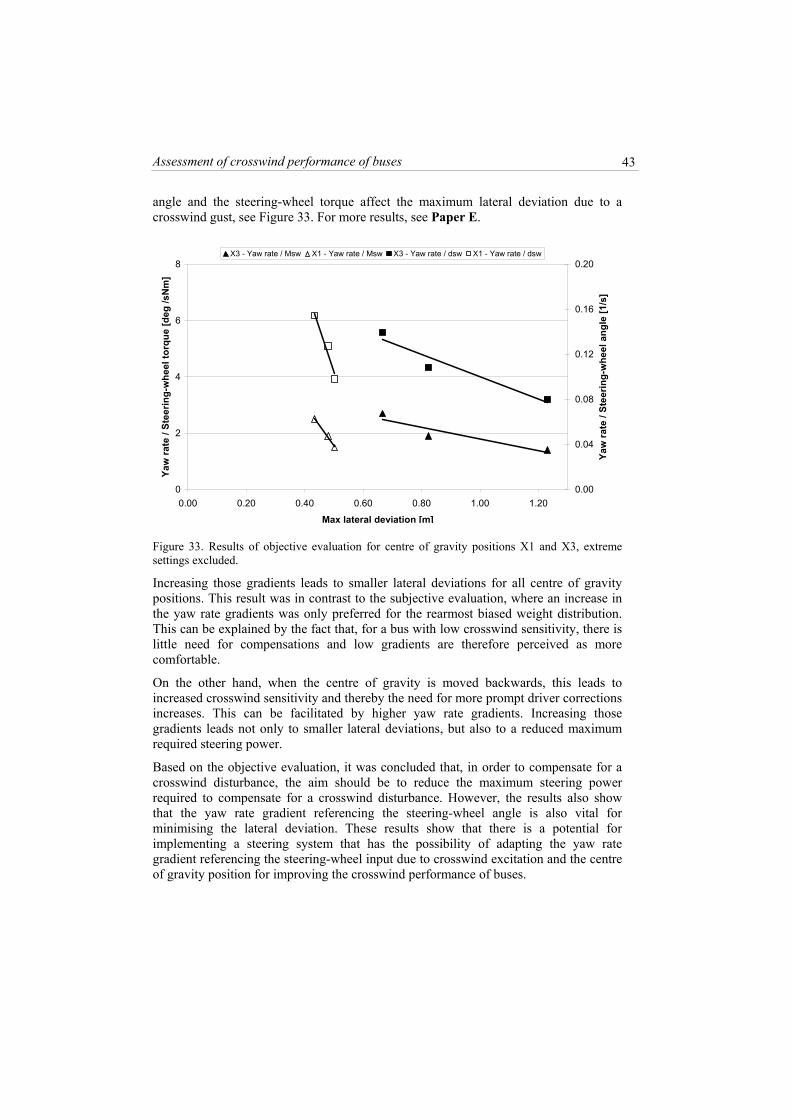
Assessment of crosswind performance of buses
43
angle and the steering-wheel torque affect the maximum lateral deviation due to a crosswind gust, see Figure 33. For more results, see Paper E.
0
2
4
6
8
0.00 0.20 0.40 0.60 0.80 1.00 1.20
Max lateral deviation [m]
Yaw
rate
/ St
eerin
g-w
heel
torq
ue [d
eg /s
Nm
]
0.00
0.04
0.08
0.12
0.16
0.20
Yaw
rate
/ St
eerin
g-w
heel
ang
le [1
/s]
X3 - Yaw rate / Msw X1 - Yaw rate / Msw X3 - Yaw rate / dsw X1 - Yaw rate / dsw
Figure 33. Results of objective evaluation for centre of gravity positions X1 and X3, extreme settings excluded.
Increasing those gradients leads to smaller lateral deviations for all centre of gravity positions. This result was in contrast to the subjective evaluation, where an increase in the yaw rate gradients was only preferred for the rearmost biased weight distribution. This can be explained by the fact that, for a bus with low crosswind sensitivity, there is little need for compensations and low gradients are therefore perceived as more comfortable.
On the other hand, when the centre of gravity is moved backwards, this leads to increased crosswind sensitivity and thereby the need for more prompt driver corrections increases. This can be facilitated by higher yaw rate gradients. Increasing those gradients leads not only to smaller lateral deviations, but also to a reduced maximum required steering power.
Based on the objective evaluation, it was concluded that, in order to compensate for a crosswind disturbance, the aim should be to reduce the maximum steering power required to compensate for a crosswind disturbance. However, the results also show that the yaw rate gradient referencing the steering-wheel angle is also vital for minimising the lateral deviation. These results show that there is a potential for implementing a steering system that has the possibility of adapting the yaw rate gradient referencing the steering-wheel input due to crosswind excitation and the centre of gravity position for improving the crosswind performance of buses.

5 Discussion and conclusions The general aim of the research work presented in this thesis was to increase the understanding of the crosswind performance of buses. One goal was to identify the most important parameters that affect the crosswind performance. Another goal was to find solutions to the problem of how these should be set to improve the crosswind performance of buses.
When this research work was initiated, the first question was: Are buses really crosswind-sensitive? Taking a test drive under crosswind conditions and considering the result of this work and the work presented by others, the answer is: Yes, when compared to passenger cars.
The second question was: Why are buses crosswind-sensitive? There are several reasons for this and they are related to both aerodynamics and vehicle layout. Beginning with the aerodynamic influence, a one-box vehicle with a cab-forward design has a large projected area, seen from the side, ahead of the centre of gravity. This will generate a considerable amount of yaw moment when exposed to a steady-state crosswind. In addition, the yaw moment transient peak when entering a crosswind gust will also be large. The most common layout of a bus has a rear bias weight distribution, which in combination with the large amount of yaw moment generates large course deviations when exposed to crosswind. The present work has identified the yaw moment, the yaw moment transient and the longitudinal centre of gravity position as the parameters that have the largest effects on the crosswind sensitivity of buses. When the crosswind is combined with a low friction surface, the low front axle load might not be sufficient for generating the lateral forces required to keep the bus on the road.
The third question was: How can the crosswind performance be improved? There are several possibilities of improving the crosswind performance, some of which are more easily implemented than others and some of which are associated with unwanted effects. An increase in the total mass reduces the crosswind sensitivity, but also decreases the load-carrying capacity and increases the energy consumption, and is therefore unwanted. Another unwanted measure is to increase the yaw moment of inertia, since this has a negative influence on the basic handling performance. However, in the literature there are many studies on the topic of how to reduce the aerodynamic
45
Magnus Juhlin 46
load on a vehicle that is exposed to crosswind by changing the shape of the vehicle body or by adding some device to control the air flow around it. Using this knowledge it is most certainly possible to reduce the yaw moment and the yaw moment transient and thereby reduce the crosswind sensitivity. One of these effective aerodynamic measures is to reduce the projected area of the body, when seen from the side, especially at the forward part of the body. Moving the centre of gravity forward is one of the most effective measures for reducing the crosswind sensitivity. This is something that the load-carrying capacity of most two-axle buses would benefit from, since rear axle overload is more common than front axle overload. There are some challenges associated with moving the centre of gravity forwards, regarding tyres and steering effort. Today wider tyres or more tyres are needed if the front axle load is to be increased, and therefore the possibility of resorting to this measure has to be available. The legal demands on the steering effort can be fulfilled by a dual-circuit system, which entails the disadvantage of higher cost. In addition, the vehicle layout must enable the centre of gravity to be moved. This could be facilitated by the introduction of a hybrid driveline. The above-mentioned design parameters are the most effective ones for decreasing the crosswind sensitivity.
Another way to improve the crosswind performance is to improve the driver-vehicle interaction. It has been shown here that prompt driver corrections significantly reduce the lateral deviation. Moreover, in this work the effect of steering feel on the subjective and objective evaluation of crosswind performance has been studied. It has been shown that a steering feel, i.e. a yaw rate gradient referencing the steering-wheel input, that enables prompt driver corrections has a large potential in reducing the directional deviation due to a crosswind gust. The objective evaluation showed that high yaw rate gradients improved the crosswind performance of vehicles with both high and low crosswind sensitivity. On the other hand, according to the subjective evaluation, the drivers only preferred high yaw rate gradients for a bus with high crosswind sensitivity, whereas low gradients were preferred for a bus with low crosswind sensitivity. The steering feel required for a good crosswind performance is probably not a steering feel that a driver would prefer under normal driving conditions, and therefore there is a potential for using an adaptive steering or even active steering system to help the driver in a crosswind situation.
Last but not least, there is the crosswind velocity. Controlling this may seem to be an impossible task, but using wind fences at locations known to be crosswind-exposed in order to reduce the yaw moment transient due to a sudden change in crosswind velocity would also be effective.
6 Recommendations for future work
Based on the presented knowledge of how the body design affects the aerodynamic yaw moment and how the position of the centre of gravity affects the vehicle response due to a crosswind disturbance, it should be possible to improve the crosswind sensitivity of buses. However, this requires further research with a view to designing a vehicle layout that would enable the necessary changes of the body design and the centre of gravity position, without impairing other qualities of the bus, such as the transport efficiency, comfort and crash worthiness. By using CFD with time-dependent inflow boundary conditions, it is possible to optimise the body shape with respect to the transient yaw moment. However, today this requires a large computational effort. When computational power allows the co-simulation of an unsteady crosswind acting on detailed vehicle models, together with detailed MBS models and representative driver models, it will be possible to optimise the crosswind performance of the complete vehicle system efficiently.
The potential improvement of the crosswind performance by using an adaptive steering feel requires a steering system with the possibility of quickly altering the steering ratio and servo assistance. Such systems are today available for passenger cars and will probably be available for heavy vehicles in the future. In order to take the full advantage of an adaptive steering feel, a steer-by-wire system will probably be needed. This will also require fast and reliable methods for detecting a crosswind disturbance for input to the adaptive steering system.
The maximum lateral deviation due to a crosswind gust is an important measure of the crosswind performance of the driver-vehicle system. However, since it is hard to determine the driver’s desired path, the actual maximum lateral deviation is difficult to determine. On the other hand, the yaw rate error measure has proven to be an excellent measure of crosswind sensitivity, since it is able to capture small differences in the crosswind sensitivity. However, due to the driver-independence of this measure, it is not suitable for analysing the performance of the driver-vehicle system. Therefore, an objective measure needs to be found that can capture the driver-vehicle performance more accurately than the maximum lateral deviation.
47

Magnus Juhlin 48
Improving the method for estimating aerodynamic loads under natural crosswind conditions by adding road disturbances in the simulation model will provide a powerful tool for estimating natural crosswind loads from field measurements. This is of interest since it will give information on the loads under real conditions, and not under artificial conditions as in a wind tunnel
7 Summary of papers This chapter presents a short summary of the results presented in the appended papers.
Paper A
Based on transient wind tunnel measurements of a one-box-type vehicle, a generalised crosswind model was developed for the purpose of studying the crosswind sensitivity of buses. The aerodynamic coefficients used were estimated from steady-state wind tunnel measurements of several bus-shaped models. The crosswind gust model was applied on an 89 DOF MBS 3-axled vehicle model. A closed-loop manoeuvre was simulated using a PID-regulator for steering corrections. Three different load cases were studied: an unladen bus, a laden bus and a bus with a rear bias weight distribution. The simulations showed a vast difference in the lateral displacement due to the crosswind gust. The laden case showed only a minor (0.1 m) lateral deviation, while the case with the rear bias weight distribution showed a significant (1.5 m) deviation. The effect of the body style, sharp edges or radiused edges, was also investigated. The body with radiused edges showed the smallest lateral deviation. Moreover, the influence of the driver was studied. This was achieved by tuning the PID regulator for a faster or slower response, and a fast response showed a considerable reduction of the lateral deviation; i.e. the driver can affect the crosswind performance of the driver-vehicle system significantly.
Paper B
The work reported in Paper B concerns the application of the generalised crosswind gust model previously developed in Paper A on a parameterised 53 DOF MBS 2-axled bus-model, in order to study the effect of various parameters on the vehicle response when a bus is exposed to a crosswind gust. An open-loop manoeuvre with fixed steering was simulated. In total, the influence of 22 parameters on the crosswind sensitivity was studied. Half of them were related to the chassis and the other half were related to the aerodynamic properties. The results show that the aerodynamic yaw moment and, especially, its corresponding transient peak have a large influence on the lateral deviation. The importance of the longitudinal position of the centre of gravity was also shown. Properties that showed a great potential in reducing the directional deviation (but at the expense of passenger capacity) were the total mass and the lateral projected area.
49
Magnus Juhlin 50
Paper C
A method for estimating the aerodynamic load on a bus exposed to natural crosswind gusts was developed. A coach equipped for measuring the tyre forces, vehicle response, driver input and wind velocity was driven on a motorway under crosswind conditions. The recorded data were later used in inverse simulations and the aerodynamic forces and moments were estimated. It was found that the estimated aerodynamic loads agree well with the crosswind model used in Papers A and B, although the crosswind velocity build-up was slower. Due to the lack of road disturbances in the simulation model, the lift force, roll and pitch moment could not be estimated. By introducing road disturbances in the simulation model, it should be possible to estimate all the aerodynamic forces and moments.
Paper D
A methodology for evaluating the effect of steering feel, i.e. the yaw rate gradient referencing the steering-wheel input, on the subjective evaluation of the crosswind performance of buses was proposed, used and evaluated. The aerodynamic loads due to a crosswind gust were applied on a vehicle model in a moving-base driving simulator. The aerodynamic load was estimated using the method described in Paper C. Fifteen bus drivers drove the simulator, comparing 13 settings to a reference and answering 3 questions regarding the crosswind performance relative to the reference. The crosswind sensitivity was altered by moving the longitudinal position of the centre of gravity. The steering feel was varied by changing the steering ratio and servo assistance. It is clear that the crosswind performance deteriorates when the centre of gravity is moved rearwards. The results also show that low yaw rate gradients with respect to both the steering-wheel torque and the steering-wheel angle are preferred by bus drivers when driving a bus with low crosswind sensitivity. When the centre of gravity is moved backwards and the crosswind sensitivity increases, the demand for higher yaw rate gradients also increases. This can probably be explained by the fact that a crosswind-sensitive vehicle needs intense corrections, which are facilitated by high yaw rate gradients. A less crosswind-sensitive vehicle, in contrast, requires minor corrections and therefore lower gradients are perceived as more comfortable. The results show that a steering system with the possibility of changing the yaw rate gradient referencing the steering-wheel input has a potential for improving the crosswind performance.
Paper E
In Paper E, the methodology proposed in Paper D for evaluating the effect of steering feel, i.e. the yaw rate gradient referencing the steering-wheel input, on the subjective evaluation of the crosswind performance of buses was extended for objective evaluations with the lateral deviation and the steering power as the objective measures. The method was applied and the results show that the yaw rate gradients referencing the steering-wheel angle and the steering-wheel torque affect the maximum lateral deviation due to a crosswind gust. Increasing those gradients leads to smaller lateral deviations for all the centre of gravity positions. This result was in contrast to the subjective evaluation, where an increase in the yaw rate gradients was only preferred for the rearmost biased weight distribution. This can be explained by the fact that for a bus with low crosswind sensitivity there is little need for compensations, and low
Assessment of crosswind performance of buses
51
gradients are therefore perceived as more comfortable. On the other hand, when the centre of gravity is moved backwards, this leads to increased crosswind sensitivity and thereby the need for more prompt driver corrections increases. This can be facilitated by higher yaw rate gradients. Increasing those gradients leads not only to smaller lateral deviations, but also to a reduced maximum required steering power. Based on the objective evaluation, it was concluded that, in order to compensate for a crosswind disturbance, the aim should be to reduce the maximum steering power required for compensating a crosswind disturbance. However, the results also show that the yaw rate gradient referencing the steering-wheel angle is also vital for minimising the lateral deviation. These results show that there is a potential for implementing a steering system that has the possibility of adapting the yaw rate gradient referencing the steering-wheel input due to crosswind excitation and the centre of gravity position for improving the crosswind performance of buses.

References 1. Nordström, P-E., Nyström, N. E., Scania bus parade 1911-1991, 1991. 2. Directive 97/27/EC of the European Parliament and of the Council, 1997. 3. Directive 2001/85/EC of the European Parliament and of the Council, 2001. 4. Segel, L., Theoretical prediction and experimental substantiation of the response of the automobile to
steering control, IMechE, Research in automobile stability & control & tyre performance, pp. 26-46, 1956.
5. Road vehicles - Vehicle dynamics and road-holding ability – Vocabulary, ISO 8855, 1991. 6. Milliken, W. F., Milliken, D. L., Chassis design principles and analysis, ISBN 0-7680-0826-3, 2002. 7. Mitschke, M., Wallentowitz, H., Dynamik der Kraftfahrzeuge 4. Auflage, ISBN: 3-540-42011-8, 2004. 8. Road vehicles - Heavy commercial vehicles and buses - Lateral transient test methods, ISO 14793,
2003. 9. Road vehicles - Heavy commercial vehicles and buses –Steady-state transient test methods, ISO 14792,
2003. 10. Lindqvist, Ö., Andersson, K., Plummer, J., A study of the influence of some parameters on the stability
and handling of inter-city coaches, Proceedings of the International Conference on the Bus ’86, 1986. 11. Whitehead, J. P., The handling characteristics of European intercity buses, SAE paper 912678, 1991. 12. Setright, L. J. K., The mythology of steering feel, Automotive Engineering Vol. 24 No. 6, pp. 88, 1999. 13. Cole, D., Steering feedback mathematical simulation of effects on driver and vehicle, ATZ, Vol. 8,
No.11-12, pp. 52-56, 2008. 14. Larrabee, E. E., Hawks, R. J., The calculated effects of cross wind gradients on the disturbance of
automotive vehicles, Proceedings of the AIAA Symposium on the Aerodynamics of Sports & Competition Automobiles, 1968.
15. Road vehicles - Test method for the quantification of on-centre handling - Part 1: Weave test, ISO 13674-1, 2003.
16. Road vehicles - Test methods for the quantification of on-centre handling - Part 2: Transition test, ISO 13674-2, 2006.
17. Segel, L., An investigation of automobile handling as implemented by a variable-steering automobile, Human Factors, Vol. 6, No. 4, pp. 333-341, 1964.
18. Norman, K. D., Objective evaluation of on-center handling performance, SAE paper 840069, 1984. 19. Farrer, D. G., An objective measurement technique for the quantification of on-center handling quality,
SAE paper 930827, 1993. 20. Barnard, R.H., Road vehicle aerodynamic design - an introduction, 2nd edition, ISBN 0-9540734-0-1,
2001. 21. Hucho, W. H., Aerodynamics of road vehicles, 4th edition, ISBN 0-7680-0029-7, 1998.
53
Magnus Juhlin 54
22. Aerodynamic testing of road vehicles – testing methods and procedures, SAE J2084, 1993. 23. Bowman, W. D., Generalizations on the aerodynamic characteristics of sedan type automobile bodies,
SAE paper 660389, 1966. 24. Buning, H., Beauvais, F. N., The transient character of aerodynamic side force and yawing moment on
an automobile in a wind gust, Presented at the 11th FISITA Congress, Munich, 12th-16th June 1966. 25. Hucho, W. H., Emmelmann, H. J., Theoretical prediction of the aerodynamic derivatives of a vehicle in
cross wind gusts, SAE Paper 730232, 1973. 26. Takanami, K., Sakai, T., Matsushita, A., Measurements of transient aerodynamic forces and some
consideration of their effects when a vehicle passes side wind blower, Transactions of the Society of Automotive Engineers of Japan, Inc., No. 6, 1973.
27. Stewart, M. J., Transient aerodynamic forces on simple road vehicle shapes in simulated cross-wind gusts, MIRA research report No. 1977/5, 1977.
28. Klein, R., Hogue, J., Effects of crosswinds on vehicle response - full-scale tests and analytical predictions, SAE paper 800848, 1980.
29. Noguchi, H., An analysis of vehicle behaviour in a cross wind, JSAE Review, March 1984, pp. 60-67, 1984.
30. Buchheim, R., Maretzke, J., Piatek, R., The control of aerodynamic parameters influencing vehicle dynamics, SAE paper 850279, 1985.
31. Milliken, W. F., Dell’Amico, F., Rice, R. S., The static directional stability and control of the automobile, SAE paper 760712, 1976.
32. Uffelman, F., Influence of aerodynamics and suspension on the cross-wind behaviour of passenger cars - theoretical investigation under consideration of the driver's response, Supplement to Vehicle System Dynamics, Vol. 15, 1985.
33. Gilhaus, A., Renn, V., Drag and driving-stability-related aerodynamic forces and their interdependence - results of measurements on 3/8-scale basic car shapes, SAE paper 860211, 1986.
34. Takada, H., Kohri, I., Aerodynamic derivatives on vehicle stability passing through crosswind, Proceedings of the International Symposium on Automotive technology and automation, Vol. 16, No. 2, 1987.
35. van den Hemel, H., Blaauw, G., Riemersma, J., Elink Schuurman, R., The cross-wind stability of passenger cars: development of an objective measuring method, Int. J. of Vehicle Design, IAVD Congress on Vehicle Design and Components, 1987.
36. Willumeit, H. P., Müller, K., Dödelbacher, G., Matheis, A., Method to correlate vehicular behaviour and driver’s judgement under side wind disturbances, Supplement to Vehicle System Dynamics, Vol. 17, 1987.
37. Kobayashi, N., Yamada, M., Stability of a one box type vehicle in a cross-wind - an analysis of transient aerodynamic forces and moments, SAE paper 881878, 1988.
38. Kohri, I., Kataoka, T., Research on improvement of cross-wind properties of passenger vehicles, JSAE-Review, Vol. 10, No. 3, pp. 46-51, 1989.
39. Sumitani, K., Yamada, M., Development of "aero slit" - improvement of aerodynamic yaw characteristics for commercial vehicles, SAE paper 890372, 1989.
40. Takada, H., Nakagawa, K., Shinoda, H., Crosswind stability of 1-Boxcar, JSAE-Review, Vol. 11, No. 1, pp. 30-37, 1990.
41. Mac Adam, C. C., The interpretation of aerodynamic properties and the steering system characteristics of passenger car handling, Supplement to Vehicle System Dynamics, Vol. 18, 1989.
42. Baker, C. J., Ground vehicles in high cross winds, Part I: Steady aerodynamic forces, Journal of Fluids and Structures, Vol. 5, pp. 69-90, 1991.
43. Baker, C. J., Ground vehicles in high cross winds, Part II: Unsteady aerodynamic forces, Journal of Fluids and Structures, Vol. 5, pp. 91-111, 1991.
44. Baker, C. J., Ground vehicles in high cross winds, Part III: The interaction of aerodynamic forces and the vehicle system, Journal of Fluids and Structures, Vol. 5, pp. 221-241, 1991.
45. Baker, C. J., Reynolds, S., Wind-induced accidents of road vehicles, Accident Analysis & Prevention Vol. 24, No. 6, pp. 559-575, 1992.
46. Coleman, S. A., Baker, C. J., An experimental study of the aerodynamic behaviour of high sided lorries in cross winds. Journal of Wind Engineering and Industrial Aerodynamics, Vol. 53, pp. 401-429, 1994.
47. Humphreys, N. D., Baker, C. J., The application of wind engineering techniques to moving ground vehicles, Proceedings of the Royal Aeronautical Society Vehicle Aerodynamics Conference, 1994.
48. Ohno, H., Kohri, I., Improvement of aerodynamic characteristics of a passenger car by side-airdams, International Journal of Vehicle Design, Vol. 12, No. 5/6, 1991.
49. Sakakibara, K., Tsutsui, T., Aerodynamic yaw characteristics of commercial vehicles influenced by front side vortices, JSAE-Review, Vo. 13, No. 3, pp. 54-59, 1992.
Assessment of crosswind performance of buses
55
50. Tran, V. T., A calculation method for estimating the transient wind force and moment acting on a vehicle, SAE paper 910315, 1991.
51. Howell, J.P., Shape features which influence crosswind sensitivity, Proceedings of the Vehicle Ride and Handling IMechE Conference, ImechE, No. C466/036, pp. 43-52, 1993.
52. Okumura, K., Kuriyama, T., Kato, A., Hayashi, Y., Development of crosswind spoiler, JSAE Review Vol. 17, pp. 293-299, 1996.
53. Road vehicles – sensitivity to lateral wind - Part1: Open-loop test method using wind generator input, ISO 1221-1, 1996.
54. Docton, M., Dominy, R., The simulation of transient cross winds on passenger vehicles, MIRA International Conference on Vehicle Aerodynamics, 1996.
55. Chadwick, A., Garry, K., Howell, J., Transient aerodynamic characteristics of simple vehicle shapes by the measurement of surface pressures, SAE paper 2001-01-0876, 2001.
56. Jarlmark, J., Driver-vehicle interaction under influence of crosswind gusts. Licentiate thesis, KTH Vehicle Dynamics, Sweden, ISRN KTH//FKT/L—02/18-SE, 2002.
57. Demuth, R., Buck, P., Numerical investigations on the unsteady aerodynamics of road vehicles under gusty weather conditions. 6th MIRA International Conference on Vehicle Aerodynamics, 2006.
58. Petzäll, J., Torlund, P. Å., Falkmer, T., Albertsson, P., Björnstig U., Aerodynamic design of high-sided coaches to reduce cross-wind sensitivity, based on wind tunnel tests, International Journal of Crashworthiness, Vol. 13, No. 2, pp. 185-194, 2008.
59. Favre, T., Efraimsson G., Diedrichs B., Numerical investigations of unsteady crosswind vehicle aerodynamics using time-dependent inflow conditions, 7th MIRA international conference on vehicle aerodynamics, 2008.
60. Tran, V. T., Determining the wind forces and moments acting on vehicles by means of pressure sensors, SAE 900313, 1990.
61. Billing, J, The effect of wind on heavy vehicles, Proceedings of the 10th International Conference on Heavy Vehicle Transport Technology, pp. 328-337, 2008.
62. MSC Software, available at: http://www.mscsoftware.com (accessed 16 April 2009). 63. Backer, E., Lidner, L., Pacejka, H. B., A new tire model with an application in vehicle dynamic studies,
SAE Paper 890087, 1989. 64. Alexandridis, A. A., Repa, B. S., Wierwille, W. W., The influence of vehicle aerodynamics and control
response characteristics on driver-vehicle performance. SAE paper 790385, 1979. 65. Wierville, W. W., Casalli, J. G., Repa, B. S., Driver steering reaction time to abrupt-onset crosswinds,
as measured in a moving-base driving simulator, Human Factors Vol. 25, No. 1, pp. 103-116, 1983. 66. Nordmark, S. The new Trygg Hansa truck driving simulator - an advanced tool for research and
training, Proceedings of the International Symposium on Advanced Vehicle Control, 1992.

Notation
Symbols
A Projected area proj
A Frontal projected area front
vvv zyx aaa ,, Acceleration in vehicle-fixed reference frame
β Yaw angle of relative wind direction
C Coefficient of aerodynamic force or moment, j=D, S, L, RM, PM, YM j
c Steering column damping sc
D Aerodynamic drag force
δ Steering angle
δ Ackermann steering angle A
δ Steering-wheel angle H
F Aerodynamic force, j=D, S, L j
normjF Normalised aerodynamic force, j=D, S, L
ϕϕϕ &&&,, Roll angle, velocity, acceleration
K Understeer gradient us
L Aerodynamic lift force
L Bus body length body
M Aerodynamic moment, j=RM, PM, YM j
normjM Normalised aerodynamic moment, j=RM, PM, YM
μ King pin friction KP
μ Steering column friction SC
PM Aerodynamic pitch moment
RM Aerodynamic roll moment
ρ Density of air
S Aerodynamic side force
57
Magnus Juhlin 58
max,ψ&T Yaw rate response time
θθθ &&&,, Pitch angle, velocity, acceleration
vvv zyx vvv ,, Velocity in vehicle-fixed reference frame
WS, ΔWS Steering effort, change in steering effort
X , Y , Z Coordinates in vehicle-fixed reference frame v v v
YM Aerodynamic yaw moment
ψψψ &&& ,, Yaw angle, velocity, acceleration
Abbreviations
CFD Computational Fluid Dynamics
DOF Degrees Of Freedom
ESC Electronic stability control
ISO International Organization for Standardization
KTH Royal Institute of Technology, Stockholm
MBS Multi-Body System
RMS Root mean square
VTI Swedish National Road and Transport Research Institute
2D 2-Dimensional
3D 3-Dimensional


