Embed Size (px)
Citation preview
Cost of Environmental Degradation in Croatia 1
CROATIA: COST OF ENVIRONMENTAL DEGRADATION
Europe and Central Asia | Sustainable Development | Environment, Natural Resources and Blue Economy Global Practice | The World BankJanuary 2021
Pub
lic D
iscl
osur
e A
utho
rized
Pub
lic D
iscl
osur
e A
utho
rized
Pub
lic D
iscl
osur
e A
utho
rized
Pub
lic D
iscl
osur
e A
utho
rized

Cost of Environmental Degradation in Croatia 2
Cost of Environmental Degradation in Croatia 3
Europe and Central Asia | Sustainable Development | Environment, Natural Resources and Blue Economy Global Practice |
The World Bank
January 2021
CROATIA: COST OF ENVIRONMENTAL
DEGRADATION
Cost of Environmental Degradation in Croatia 4
CONTENTSPREFACE 3ACKNOWLEDGEMENTS ...............................................................................................................................................................................................................6ACRONYMS ....................................................................................................................................................................................................................................... 7LIST OF FIGURES .............................................................................................................................................................................................................................8LIST OF TABLES ...............................................................................................................................................................................................................................8LIST OF MAPS ...................................................................................................................................................................................................................................9LIST OF BOXES .................................................................................................................................................................................................................................9EXECUTIVE SUMMARY ................................................................................................................................................................................................................111 INTRODUCTION ................................................................................................................................................................................................................. 232 METHODOLOGY ................................................................................................................................................................................................................ 27
2.1 Objective and Scope ..............................................................................................................................................................................................282.2 What does CoED measure? ................................................................................................................................................................................282.3 Report limitations ..................................................................................................................................................................................................30
3 BIODIVERSITY .....................................................................................................................................................................................................................313.1 Background ............................................................................................................................................................................................................... 323.2 Annual cost of ecosystem services loss ........................................................................................................................................................363.3 Discussion .................................................................................................................................................................................................................39
4 WASTEWATER ..................................................................................................................................................................................................................... 414.1 Background .......................................................................................................................................................................................................................... 424.2 Valuing impacts on the environment: Shadow price estimation of pollutants ..............................................................................444.3 Valuing impacts on the environment: Floodplain ecosystem services ..............................................................................................464.4 Discussion ..................................................................................................................................................................................................................47
5 SOLID WASTE .....................................................................................................................................................................................................................495.1 Background ...............................................................................................................................................................................................................505.2 Property value depreciation due to landfill proximity ...............................................................................................................................525.3 Economic cost of waterborne waste transport ..........................................................................................................................................545.4 Marine Litter .............................................................................................................................................................................................................555.5 Discussion ................................................................................................................................................................................................................. 57
6 AIR QUALITY .......................................................................................................................................................................................................................596.1 Background ...............................................................................................................................................................................................................606.2 Health burden of exposure to ambient air pollution .................................................................................................................................626.3 Economic cost of exceeding the EU national exposure reduction target (NERT) ..........................................................................656.4 Discussion and link to COVID-19 pandemic .................................................................................................................................................69
7 TOURISM ............................................................................................................................................................................................................................... 717.1 Background ............................................................................................................................................................................................................... 727.2 Treatment cost of solid waste generated by tourists .............................................................................................................................. 757.3 Treatment cost of wastewater generated by tourists ............................................................................................................................. 757.4 Treatment cost of solid waste, hazardous waste and wastewater generated by cruise tourism ........................................... 767.5 Cost of environmental degradation attributable to the tourism industry ....................................................................................... 787.6 Discussion and impact of COVID-19 ............................................................................................................................................................... 79
8 THE WAY FORWARD ........................................................................................................................................................................................................819 REFERENCES ......................................................................................................................................................................................................................85ANNEXES 86
A. Estimation of health burden attributed to air pollution ..........................................................................................................................92B. Estimation of economic value of health burden attributed to air pollution ....................................................................................92C. Shadow price estimation of pollutants ..........................................................................................................................................................94D. Freshwater ecosystem services ........................................................................................................................................................................95E. Property value depreciation due to landfill proximity ...............................................................................................................................96F. Economic cost of waterborne waste transport .......................................................................................................................................... 97G. Estimation of survey-based cost of marine litter ......................................................................................................................................98H. Estimation of ecosystem losses .......................................................................................................................................................................99
Cost of Environmental Degradation in Croatia 5
PREFACE This Cost of Environmental Degradation (CoED) report has been prepared by the World Bank. It presents estimates of cost of inaction to reduce environmental degradation in Croatia and proposes preliminary policy recommendations to reduce them. The report identifies environmental issues with significant environmental degradation potential, including air pollution, solid waste and wastewater management, marine litter and ecosystem losses. It also focuses on sectors, like tourism and agriculture, that are most dependent on sound environmental management and the availability of natural resources.
The CoED report is based on a review of literature, and aligns with the World Bank Group Croatia Country Partnership Framework (CPF, 2019-24) and the National Development Strategy 2030 for Croatia (proposed draft on national strategic development directions and strategic goals at the time of writing the report). The conclusions and recommendations reflect the diverse views of the Bank team. Unfortunately, because of the ongoing COVID-19 pandemic consultations with government counterparts were limited.
The current global crisis associated with COVID-19 has various economic implications with a range of impacts on environmental governance; accordingly, the report underlines the need to for a green economic stimulus and well-structured interventions to achieve long-term sustainable economic stability. The Government of Croatia’s ongoing deliberations on environmental and natural resource issues with the EU would benefit from the external perspective provided in this document to enhance the country’s contribution to environment and economy, particularly during the post-pandemic economic recovery.
Cost of Environmental Degradation in Croatia 6
ACKNOWLEDGEMENTSThis report was prepared by a World Bank team that was led by Sameer Akbar (Senior Environmental Specialist) and Elena Strukova Golub (Senior Economist), and included Camilla Sophie Erencin (Consultant), Blerian Ania (Voice Secondee), Ivana Ivicic (Consultant), Ivana Novakovic (Environment Specialist), and Irena Relic (Consultant). Administrative support for the task team provided by Grace Aguilar and Linh Van Nguyen is gratefully acknowledged. Special thanks are due to Rome Chavapricha (Senior Energy Specialist), Stjepan Gabric (Senior Water Supply and Sanitation Specialist), Amelia Midgley (Economist), Vladimir Kalinski (Consultant), and Klas Sander (Senior Environmental Economist) for advice and feedback at critical stages of the report preparation process.
The team would like to thank Ms. Kseniya Lvovsky, Practice Manager, Environment, Natural Resources and Blue Economy for the Europe and Central Asia Region, and Elisabetta Capannelli, Country Manager for Croatia, who provided overall guidance to the team. The team is grateful to the peer reviewers, Helena Naber (Senor Environmental Specialist) and Lelia Croitoru (Consultant), as well as Andrea Liverani (Program Leader for EU member states) for their review and feedback.
The team gratefully acknowledges the support, information and insights provided by officials of the Ministry of Economy and Sustainable Development, Government of Croatia.ACRONYMS
Cost of Environmental Degradation in Croatia 7
AAP Ambient Air Pollution
AEI Average Exposure Indicator
BAU Business as Usual
CBS Croatian Bureau of Statistics
CEA Country Environmental Analysis
CEA Croatian Environment and Nature Agency
CEE Central and Eastern Europe
CO2 Carbon Dioxide
COD Chemical Oxygen Demand
CoED Cost of Environmental Degradation
COPD Chronic Obstructive Pulmonary Disease
COVID-19 Coronavirus Disease 2019
ECO Exposure Concentration Obligation
EEA European Environmental Agency
EU European Union
EUR Euro
GBD Global Burden of Disease
GDP Gross Domestic Product
HAP Households Air Pollution
HPP Hydro Power Plant
ICDInternational Statistical Classification of Diseases and Related Health problems
IHD Ischemic Heart Disease
IUCN International Union for Conserva-tion of Nature
JLS Jedinice lokalne samouprave
KIP INCA
Knowledge Innovation Project on an Integrated system of Natural Capital and ecosystem services Accounting
km2 square kilometer
LULUCF Land Use, Land-Use Change, and Forestry
m3 cubic meter
MAES Mapping and Assessment of Eco-systems and their Services
MEPPPCMinistry of Environmental Protection, Physical Planning and Construction
mtoe million tons of oil equivalent
MSW Municipal Solid Waste
NC7 Seventh National Communications
NERT National Exposure Reduction Target
NGO
NO2
Non-Governmental Organization
Nitrogen Dioxide
NPV Net Present Value
NTFP Non-Timber Forest Products
NVNP Northern Velebit National Park
OECD Organization for Economic Co-operation and Development
PAs Protected Areas
PM Particulate Matter
PM10 Particles with 10 micrometers
PM2.5 Particles with 2.5 micrometers
RBD River Basin District
RR Relative Risk
SCI Special Areas Conservation
SEEA
United Nations System of Environmental-Economic Accounting - Experimental Ecosystem Accounts
SEM Sustainable Ecosystem Management
SPA Special Protection Areas
SS Suspended Solids
UNEP United Nations Environment Programme
UNESCOUnited Nations Educational, Scientific and Cultural Organization
US United States
UWWTD Urban Wastewater Treatment Directive
VNP Velebit Nature Park
VSL Value of Statistical Life
WHO World Health Organization
WMC Waste Management Center
WTA Willingness to Accept
WTO World Tourism Organization
WTP Willingness to Pay
WWF World Wildlife Fund
WWTP Wastewater Treatment Plant
μg/m3 micrograms per cubic meter
Cost of Environmental Degradation in Croatia 8
LIST OF FIGURESFigure 1: Annual welfare loss associated with the exceedance of the NERT in selected EU countries in 2018 18
Figure 2: Natural capital per capita in Southern Europe 24
Figure 3: Volume of the distributed public water supply in 2018 43
Figure 4: Treatment status of wastewater in percentage, based on total collected wastewater 43
by the public sewage system services between 2001 and 2018 34
Figure 5: Produced MSW by treatment in Croatia, 2009-2018 50
Figure 6: Share of MSW produced by inhabitants and tourists for each county in 2018 51
Figure 7: MSW in kilograms per person adjusted for tourist produced waste in 2018 52
Figure 8 Transport of MSW on Island of Lopud, Dubrovnik-Neretva County. Source: Vladimir Kalinski. 2020. 47
Figure 9: Daily ambient PM2.5 concentration in Zagreb City, Ksaverska cesta monitoring station, in 2018 61
Figure 10: Average PM2.5 concentration in Zagreb (Zagreb City and County), industrial areas
(Slavonski Brod-Posavina and Sisak-Moslavina) and other counties in Croatia
compared to EU-cities, 2016 to 2018 62
Figure 11: Estimated annual morality by cause and age groups attributed to PM2.5 concentration in 2018 64
Figure 12: Annual mortality due to PM2.5 concentration per 100,000 habitants in Croatia compared to
other EU countries 65
Figure 13: Annual welfare loss associated with the exceedance of the NERT in selected EU countries in 2018 66
Figure 14: Contribution of travel and tourism to the country’s economy 73
Figure 15: Direct support to three pillars of the European Green Deal 84
LIST OF TABLESTable 1: The estimated annual CoED in Croatia, 2018 14
Table 2: Treatment and environmental degradation costs related to the tourism industry in Croatia, 2018 18
Table 3: CoED Methods used in the report 29
Table 4: Methods used to estimate treatment costs and CoED related to tourism in Croatia, 2018 30
Table 5: The terrestrial area of different ecosystems in Croatia 53
Table 6: Protected areas in Croatia, ha 36
Table 7: Ecosystem services accounts and cost of degradation in Croatia 37
Table 8: Ecosystem services provided by PAs in Lika-Senj County 38
Table 9: The estimated annual cost of ecosystem services loss in Croatia 39
Table 10: Average shadow prices for pollutants (€/kg) 45
Table 11: Environmental cost of pollutant discharge into waters 45
Table 12: Cost of property value depreciation due to landfill proximity in 2018 46
Table 13: DeFishGear survey target groups and completed questionnaires 56
Table 14: Annual costs arising from marine litter [based on DeFishGear Survey (2017)] 57
Table 15: Air quality standards for protecting human health from PM 60
Table 16: Welfare loss associated with the exceedance in PM2.5, 2018 66
Table 17: Biomass combustion technology shares in Croatia 62
Cost of Environmental Degradation in Croatia 9
Table 18: Tourist arrivals by county in 2017 73
Table 19: Tourist generated MSW by county in 2018 75
Table 20: Cost of treatment of wastewater attributed to tourism in 2018 76
Table 21: Total cost of solid waste, wastewater and hazardous waste treatment generated
by cruise ships operating in Croatia in 2018 76
Table 22: Costs of solid waste generated by cruise ships operating in Croatia in 2018 77
Table 23: Cost of wastewater generated by cruise ships operating in Croatia in 2018 77
Table 24: Estimated annual treatment and degradation costs related to tourism in Croatia, 2018 78
Table B1: Low- to high-end VSL estimates for Croatia, 2018 93
Table C1: Average shadow prices of pollutants (EUR/kg) 94
Table F1: Standard Volume-to-Weight Conversion Factors for mixed MSW 98
Table G1: Annual cost arising from marine litter 99
Table I1: Annual cost of the loss of water regulation by Velebit (EUR million) 101
Table I2: Annual Cost of Pollination reduction, EUR million 102
LIST OF MAPSMap 1: Mapping of the ecosystem in Croatia using EUNIS classification, level 1 32
Map 2: Protected Areas in Croatia 33
Map 3: NATURA 2000 sites in Croatia 35
Map 4: Croatia with two RBDs and major river courses (dashed line represents the basin boundary) 42
Map 5: Intersection of settlements with active landfills in Croatia 55
Map 6: Islands of Croatia 48
Map 7: Air quality zones, based on PM2.5 concentration levels between 2016 and 2018 62
Map 8: NO2 emission reductions due to COVID-19 lockdown mobility restrictions 69
LIST OF BOXES Box 1: Climate change impact assessment and National Adaptation Strategy in Croatia 25
Box 2: Threats to major inland national parks in Croatia 36
Box 3: Air pollution and diabetes mellitus type 2 63
Box 4: Household Air Pollution (HAP) in Croatia 68
Box 5: Increased environmental pressure on Lastovo Islands Natural Park 74

Cost of Environmental Degradation in Croatia 10
Cost of Environmental Degradation in Croatia 11
EXECUTIVE SUMMARY
SAŽETAK
Cost of Environmental Degradation in Croatia 12
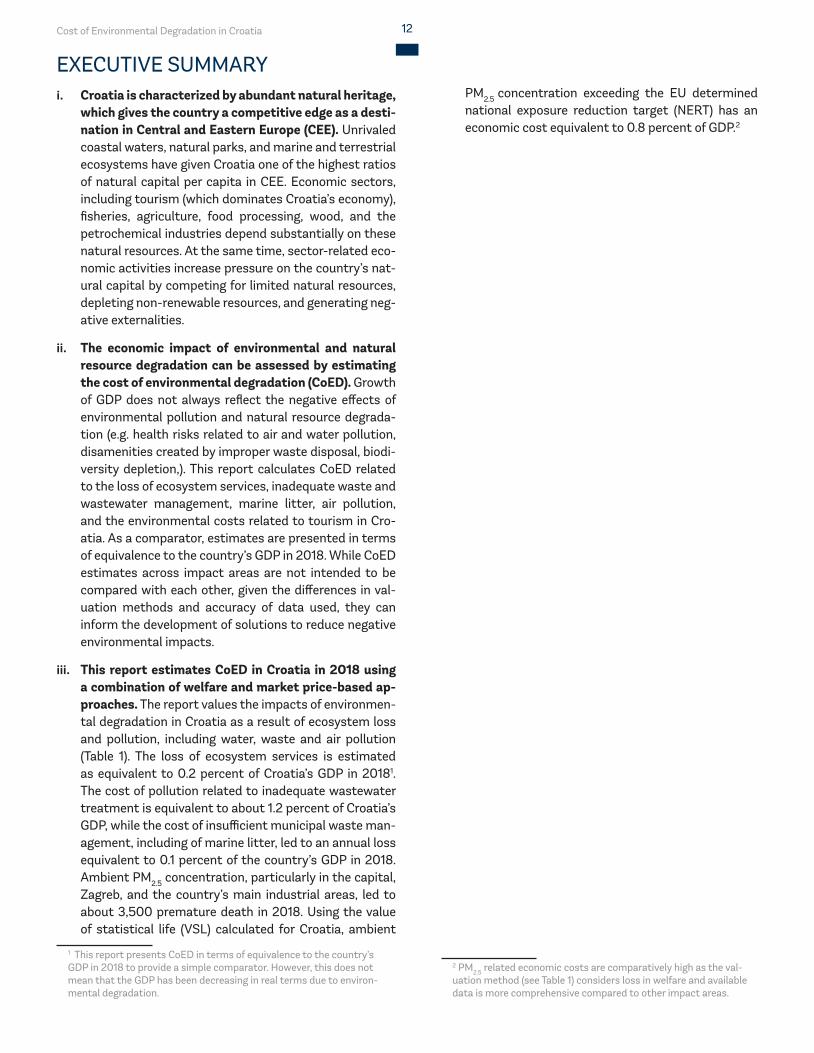
EXECUTIVE SUMMARYi. Croatia is characterized by abundant natural heritage,
which gives the country a competitive edge as a desti-nation in Central and Eastern Europe (CEE). Unrivaled coastal waters, natural parks, and marine and terrestrial ecosystems have given Croatia one of the highest ratios of natural capital per capita in CEE. Economic sectors, including tourism (which dominates Croatia’s economy), fisheries, agriculture, food processing, wood, and the petrochemical industries depend substantially on these natural resources. At the same time, sector-related eco-nomic activities increase pressure on the country’s nat-ural capital by competing for limited natural resources, depleting non-renewable resources, and generating neg-ative externalities.
ii. The economic impact of environmental and natural resource degradation can be assessed by estimating the cost of environmental degradation (CoED). Growth of GDP does not always reflect the negative effects of environmental pollution and natural resource degrada-tion (e.g. health risks related to air and water pollution, disamenities created by improper waste disposal, biodi-versity depletion,). This report calculates CoED related to the loss of ecosystem services, inadequate waste and wastewater management, marine litter, air pollution, and the environmental costs related to tourism in Cro-atia. As a comparator, estimates are presented in terms of equivalence to the country’s GDP in 2018. While CoED estimates across impact areas are not intended to be compared with each other, given the differences in val-uation methods and accuracy of data used, they can inform the development of solutions to reduce negative environmental impacts.
iii. This report estimates CoED in Croatia in 2018 using a combination of welfare and market price-based ap-proaches. The report values the impacts of environmen-tal degradation in Croatia as a result of ecosystem loss and pollution, including water, waste and air pollution (Table 1). The loss of ecosystem services is estimated as equivalent to 0.2 percent of Croatia’s GDP in 20181. The cost of pollution related to inadequate wastewater treatment is equivalent to about 1.2 percent of Croatia’s GDP, while the cost of insufficient municipal waste man-agement, including of marine litter, led to an annual loss equivalent to 0.1 percent of the country’s GDP in 2018. Ambient PM2.5 concentration, particularly in the capital, Zagreb, and the country’s main industrial areas, led to about 3,500 premature death in 2018. Using the value of statistical life (VSL) calculated for Croatia, ambient
1 This report presents CoED in terms of equivalence to the country’s GDP in 2018 to provide a simple comparator. However, this does not mean that the GDP has been decreasing in real terms due to environ-mental degradation.
PM2.5 concentration exceeding the EU determined national exposure reduction target (NERT) has an economic cost equivalent to 0.8 percent of GDP.2
2 PM2.5 related economic costs are comparatively high as the val-uation method (see Table 1) considers loss in welfare and available data is more comprehensive compared to other impact areas.
Cost of Environmental Degradation in Croatia 13
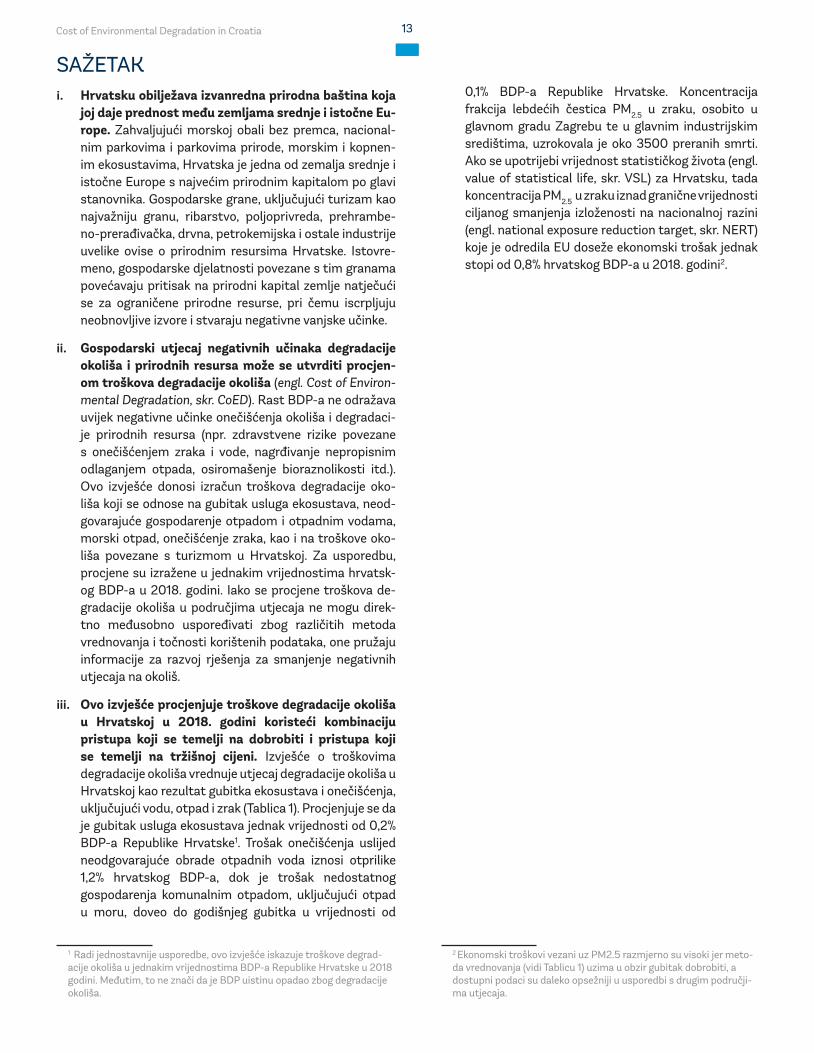
SAŽETAKi. Hrvatsku obilježava izvanredna prirodna baština koja
joj daje prednost među zemljama srednje i istočne Eu-rope. Zahvaljujući morskoj obali bez premca, nacional-nim parkovima i parkovima prirode, morskim i kopnen-im ekosustavima, Hrvatska je jedna od zemalja srednje i istočne Europe s najvećim prirodnim kapitalom po glavi stanovnika. Gospodarske grane, uključujući turizam kao najvažniju granu, ribarstvo, poljoprivreda, prehrambe-no-prerađivačka, drvna, petrokemijska i ostale industrije uvelike ovise o prirodnim resursima Hrvatske. Istovre-meno, gospodarske djelatnosti povezane s tim granama povećavaju pritisak na prirodni kapital zemlje natječući se za ograničene prirodne resurse, pri čemu iscrpljuju neobnovljive izvore i stvaraju negativne vanjske učinke.
ii. Gospodarski utjecaj negativnih učinaka degradacije okoliša i prirodnih resursa može se utvrditi procjen-om troškova degradacije okoliša (engl. Cost of Environ-mental Degradation, skr. CoED). Rast BDP-a ne odražava uvijek negativne učinke onečišćenja okoliša i degradaci-je prirodnih resursa (npr. zdravstvene rizike povezane s onečišćenjem zraka i vode, nagrđivanje nepropisnim odlaganjem otpada, osiromašenje bioraznolikosti itd.). Ovo izvješće donosi izračun troškova degradacije oko-liša koji se odnose na gubitak usluga ekosustava, neod-govarajuće gospodarenje otpadom i otpadnim vodama, morski otpad, onečišćenje zraka, kao i na troškove oko-liša povezane s turizmom u Hrvatskoj. Za usporedbu, procjene su izražene u jednakim vrijednostima hrvatsk-og BDP-a u 2018. godini. Iako se procjene troškova de-gradacije okoliša u područjima utjecaja ne mogu direk-tno međusobno uspoređivati zbog različitih metoda vrednovanja i točnosti korištenih podataka, one pružaju informacije za razvoj rješenja za smanjenje negativnih utjecaja na okoliš.
iii. Ovo izvješće procjenjuje troškove degradacije okoliša u Hrvatskoj u 2018. godini koristeći kombinaciju pristupa koji se temelji na dobrobiti i pristupa koji se temelji na tržišnoj cijeni. Izvješće o troškovima degradacije okoliša vrednuje utjecaj degradacije okoliša u Hrvatskoj kao rezultat gubitka ekosustava i onečišćenja, uključujući vodu, otpad i zrak (Tablica 1). Procjenjuje se da je gubitak usluga ekosustava jednak vrijednosti od 0,2% BDP-a Republike Hrvatske1. Trošak onečišćenja uslijed neodgovarajuće obrade otpadnih voda iznosi otprilike 1,2% hrvatskog BDP-a, dok je trošak nedostatnog gospodarenja komunalnim otpadom, uključujući otpad u moru, doveo do godišnjeg gubitka u vrijednosti od
1 Radi jednostavnije usporedbe, ovo izvješće iskazuje troškove degrad-acije okoliša u jednakim vrijednostima BDP-a Republike Hrvatske u 2018 godini. Međutim, to ne znači da je BDP uistinu opadao zbog degradacije okoliša.
0,1% BDP-a Republike Hrvatske. Koncentracija frakcija lebdećih čestica PM2.5 u zraku, osobito u glavnom gradu Zagrebu te u glavnim industrijskim središtima, uzrokovala je oko 3500 preranih smrti. Ako se upotrijebi vrijednost statističkog života (engl. value of statistical life, skr. VSL) za Hrvatsku, tada koncentracija PM2.5 u zraku iznad granične vrijednosti ciljanog smanjenja izloženosti na nacionalnoj razini (engl. national exposure reduction target, skr. NERT) koje je odredila EU doseže ekonomski trošak jednak stopi od 0,8% hrvatskog BDP-a u 2018. godini2.
2 Ekonomski troškovi vezani uz PM2.5 razmjerno su visoki jer meto-da vrednovanja (vidi Tablicu 1) uzima u obzir gubitak dobrobiti, a dostupni podaci su daleko opsežniji u usporedbi s drugim područji-ma utjecaja.
Cost of Environmental Degradation in Croatia 14
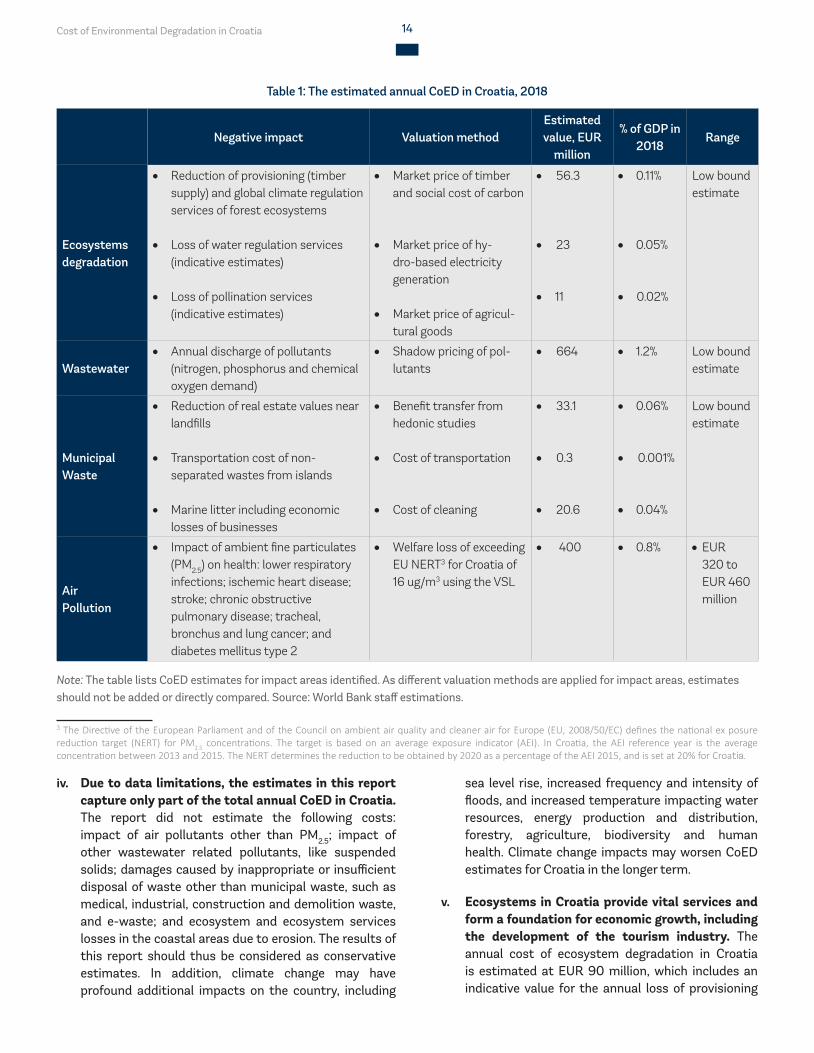
Table 1: The estimated annual CoED in Croatia, 2018
Negative impact Valuation methodEstimated value, EUR
million
% of GDP in 2018
Range
Ecosystems degradation
• Reduction of provisioning (timber supply) and global climate regulation services of forest ecosystems
• Loss of water regulation services (indicative estimates)
• Loss of pollination services (indicative estimates)
• Market price of timber and social cost of carbon
• Market price of hy-dro-based electricity generation
• Market price of agricul-tural goods
• 56.3
• 23
• 11
• 0.11%
• 0.05%
• 0.02%
Low bound estimate
Wastewater• Annual discharge of pollutants
(nitrogen, phosphorus and chemical oxygen demand)
• Shadow pricing of pol-lutants
• 664 • 1.2% Low bound estimate
Municipal Waste
• Reduction of real estate values near landfills
• Transportation cost of non-separated wastes from islands
• Marine litter including economic losses of businesses
• Benefit transfer from hedonic studies
• Cost of transportation
• Cost of cleaning
• 33.1
• 0.3
• 20.6
• 0.06%
• 0.001%
• 0.04%
Low bound estimate
Air Pollution
• Impact of ambient fine particulates (PM2.5) on health: lower respiratory infections; ischemic heart disease; stroke; chronic obstructive pulmonary disease; tracheal, bronchus and lung cancer; and diabetes mellitus type 2
• Welfare loss of exceeding EU NERT3 for Croatia of 16 ug/m3 using the VSL
• 400 • 0.8% •EUR 320 to EUR 460 million
Note: The table lists CoED estimates for impact areas identified. As different valuation methods are applied for impact areas, estimates should not be added or directly compared. Source: World Bank staff estimations.
3 The Directive of the European Parliament and of the Council on ambient air quality and cleaner air for Europe (EU, 2008/50/EC) defines the national ex posure reduction target (NERT) for PM2.5 concentrations. The target is based on an average exposure indicator (AEI). In Croatia, the AEI reference year is the average concentration between 2013 and 2015. The NERT determines the reduction to be obtained by 2020 as a percentage of the AEI 2015, and is set at 20% for Croatia.
iv. Due to data limitations, the estimates in this report capture only part of the total annual CoED in Croatia. The report did not estimate the following costs: impact of air pollutants other than PM2.5; impact of other wastewater related pollutants, like suspended solids; damages caused by inappropriate or insufficient disposal of waste other than municipal waste, such as medical, industrial, construction and demolition waste, and e-waste; and ecosystem and ecosystem services losses in the coastal areas due to erosion. The results of this report should thus be considered as conservative estimates. In addition, climate change may have profound additional impacts on the country, including
sea level rise, increased frequency and intensity of floods, and increased temperature impacting water resources, energy production and distribution, forestry, agriculture, biodiversity and human health. Climate change impacts may worsen CoED estimates for Croatia in the longer term.
v. Ecosystems in Croatia provide vital services and form a foundation for economic growth, including the development of the tourism industry. The annual cost of ecosystem degradation in Croatia is estimated at EUR 90 million, which includes an indicative value for the annual loss of provisioning

Cost of Environmental Degradation in Croatia 15
Tablica 1: Procijenjeni godišnji troškovi degradacije okoliša u Hrvatskoj, 2018.
Negativni utjecaj Metoda vrednovanjaProcijenjena vrijednost u
milijunima eura
% BDP-a u 2018. godini
Raspon
Degradacija ekosustava
• Smanjenje opskrbe drvnom sirovinom iz šumskih ekosus-tava i njihovih usluga regulacije klime na globalnoj razini
• Gubitak usluga regulacije voda (indikativne procjene)
• Gubitak usluga oprašivanja (indikativne procjene)
• Tržišna cijena drvne sirovine i društveni trošak ugljena
• Tržišna cijena proizvod-nje električne energije iz vodnog potencijala
• Tržišna cijena poljop-
rivrednih proizvoda
• 56,3
• 23
• 11
• 0,11%
• 0,05%
• 0,02%
Donja granica procjene
Otpadne vode• Godišnje ispuštanje onečišću-
jućih tvari (dušik, fosfor, kemijska potrošnja kisika-KPK)
• Određivanje prikrivene cijene onečišćujućih tvari
• 664 • 1,2%Donja granica procjene
Komunalni otpad
• Smanjenje vrijednosti nekretni-na u blizini odlagališta
• Troškovi prijevoza nerazvrstanog otpada s otoka
• Otpad u moru, uključujući ekonomske gubitke tvrtki na čije poslovanje utječe taj otpad
• Prijenos koristi iz he-donskih studija
• Troškovi prijevoza
• Troškovi čišćenja
• 33,1
• 0,3
• 20,6
• 0,06%
• 0,001%
• 0,04%
Donja granica procjene
Onečišćenje zraka
• Utjecaj čestica PM2.5 na zdravlje: infekcije donjih dišnih putova; ishemijska bolest srca; moždani udar; kronična opstruktivna
plućna bolest - KOPB; rak dušnika, bronha i pluća; dijabetes melitus tip 2
• Gubitak dobrobiti zbog prekoračenja vrijednosti EU NERT3 za Hrvatsku od 16 ug/m3 koristeći vrijednost statističkog života
• 400 • 0,8%
•od 320 do 460 milijuna eura
Napomena: U tablici su navedene procjene troškova degradacije okoliša za utvrđena područja utjecaja. Budući da se za područja utjecaja primjenjuju različite metode vrednovanja, procjene se ne bi smjele zbrajati ili izravno uspoređivati.Izvor: Procjene stručnjaka Svjetske banke.
3 Direktiva Europskog parlamenta i Vijeća o kvaliteti zraka i čišćem zraku za Europu (EU, 2008/50/EC) definira ciljano smanjenje izloženosti na nacionalnoj razini (NERT) za koncentracije frakcija lebdećih čestica PM2.5. Ciljna vrijednost temelji se na pokazatelju prosječne izloženosti (PPI). U Hrvatskoj, referentna godina za PPI jednaka je prosječnoj koncentraciji između 2013. i 2015. godine. NERT označava smanjenje koje treba postići do 2020. godine izraženo u pos-totku PPI za 2015. godinu, a za Hrvatsku ta je vrijednost postavljena na 20%.
iv. Zbog ograničenja dostupnosti podataka, procjene u ovom izvješću sadrže samo dio ukupnih godišnjih troškova degradacije okoliša u Hrvatskoj. U izvješću nisu procijenjeni sljedeći troškovi: utjecaj ostalih onečišćujućih tvari u zraku osim PM2.5; utjecaj ostalih onečišćujućih tvari u otpadnim vodama, poput suspendiranih krutih tvari; šteta uzrokovana neodgovarajućim/nedostatnim odlaganjem ostalih vrsta otpada osim komunalnog, poput medicinskog, industrijskog, građevinskog i EE otpada; gubici ekosustava u obalnom području uslijed erozije (npr. gubitak obalnih ekosustava i njihovih usluga). Iz tih se razloga rezultati ovoga izvješća trebaju
smatrati konzervativnim procjenama. Nadalje, klimatske promjene mogle bi ostaviti značajne posljedice, uključujući porast razine mora, veću učestalost i jačinu poplava i porast temperature, što će utjecati na vodne resurse, proizvodnju i distribuciju energije, šumarstvo, poljoprivredu, bioraznolikost i ljudsko zdravlje. Dugoročnije gledano, posljedice klimatskih promjena mogu povećati troškove degradacije okoliša za Hrvatsku.
v. Ekosustavi u Hrvatskoj pružaju usluge od vitalne važnosti te čine osnovu za gospodarski rast, uključujući i razvoj turizma. Godišnji trošak degradacije ekosustava
Cost of Environmental Degradation in Croatia 16
benefits of forest ecosystems, the regulating services of carbon sequestration, water supply for hydropower, and pollination. A comprehensive analysis of ecosystem values based on Natural Capital Accounting (NCA) should be undertaken to mainstream ecosystem valuation in development planning. Such analysis would combine innovative economic modelling approaches with high resolution land use and ecosystem service models for all ecosystems, both terrestrial and marine, in Croatia.
vi. Aquatic ecosystems support the delivery of crucial ecosystem services, such as water provisioning, water purification, and recreation. The benefits of water related ecosystem services need to be quantified according to both the value benefits and costs of sewage connections and wastewater treatment. This report estimates the environmental damage due to pollutant discharge in wastewater at EUR 664 million in 2018. The estimate reflects lower-bound annual costs, as data on some pollutants discharged into water, such as suspended solids, is not available.
vii. Improvements of the existing waste management system in line with EU Directives is one of the main challenges faced by the Croatian Government. While Croatia is beginning its transition to a circular economy, the current waste management system still depends to a large extent on landfilling. The area around the Prudinec-Jakuševec landfill, close to Zagreb City, has the highest property value loss in Croatia at EUR 26 million, followed by the Karepovac landfill in Split-Dalmatia County. Suboptimal planning of waste management, including insufficient separate collection and low recycling rates of solid waste, cost the country at least EUR 33 million per year. Based on 2018 data, the report concludes that Croatia must make exceptional progress to meet the targets of the Waste Framework Directive by 2021.
viii. Marine litter, human-created waste discharged into coastal or marine environment, has harmful impacts on ocean ecosystems. In Croatia, marine litter leads to annual economic losses for the sectors most dependent on coastal and marine environments, such as tourism, fisheries and aquaculture, and maritime transport. Based on survey data of the DeFishGear project,4 this report estimates the annual cost of marine litter in Croatia at EUR 21 million. The estimate reflects additional economic costs arising from the cleaning of beach areas, removing litter from marine areas and around fish farm sites, and fouled propellers on work boats. To minimize the costs of marine litter, Croatia will need to increase
4 The DeFishGear study estimates increased costs and potential losses of revenue associated with marine litter for vital economic sectors, including tourism, fisheries, aquaculture and navigation.
its effort to reinforce the adequate collection of waste otherwise disposed of into the sea, to increase recycling rates, and to ensure the appropriate treatment of waste.
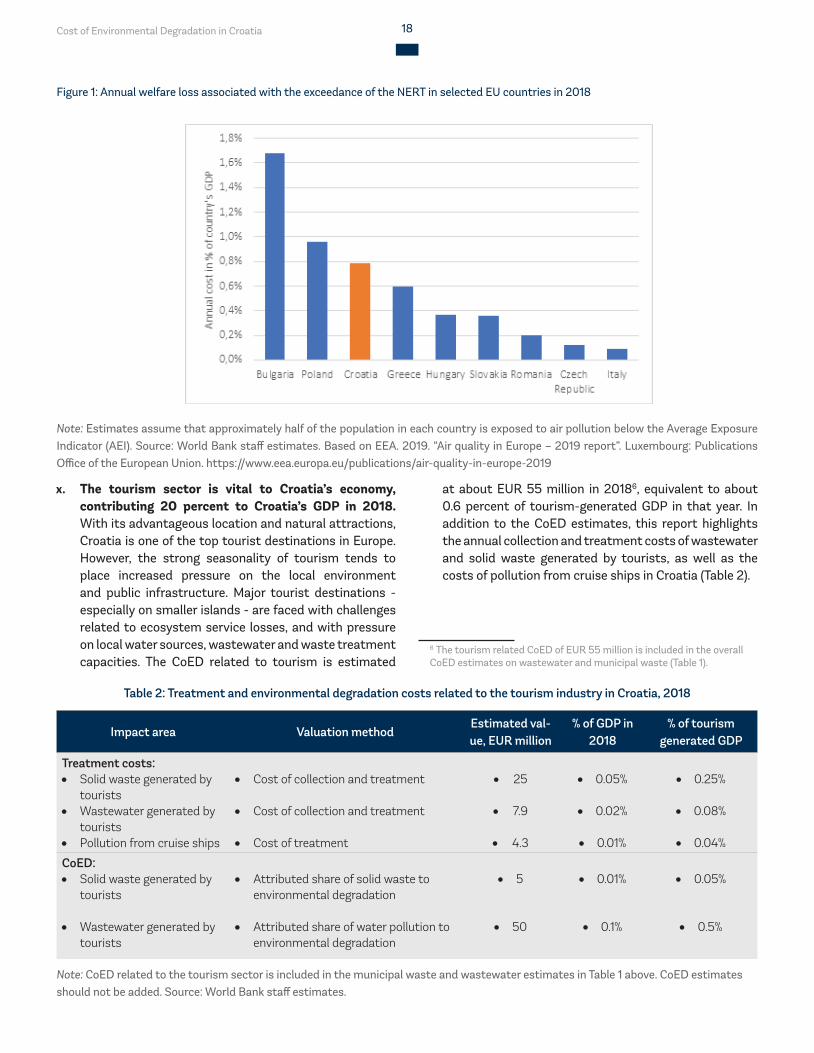
ix. Despite Croatia’s progress in strengthening its air quality policy framework, urban and industrial areas still have PM2.5 concentrations exceeding EU limit values. Ambient PM2.5 concentration is a leading environmental risk factor in Croatia, with an annual mortality rate of about 3,500 in 20185. While ambient air pollution (AAP) is not at the level of magnitude in some other EU members states and neighboring countries, Croatia will need to act proactively to control air pollution and reduce negative health impacts on the country’s population. Measured as an equivalent of GDP in 2018, Croatia has a total welfare loss associated with the exceedance of the NERT lower than Bulgaria and Poland, but higher than other selected EU member states (Figure 1 ). High costs are associated with a sizable air pollution level in Zagreb and industrial areas in the east of Croatia. The complexity of challenges associated with air pollution calls for a strategic and cross-sectoral action plan that is based on a comprehensive understanding of air pollution sources and that provides context-specific solutions.
5 The estimate is a statistical relationship to reflect the order of magni-tude of premature death related to PM2.5 concentration in Croatia.
Cost of Environmental Degradation in Croatia 17
procijenjen je na 90 milijuna eura i predstavlja indikativnu vrijednost godišnjeg gubitka koristi od opskrbe iz šumskih ekosustava i njihovih usluga regulacije pohrane ugljika, opskrbe vodom za hidroenergiju i oprašivanja. Trebala bi se provesti opsežna analiza vrijednosti ekosustava temeljena na računovodstvu prirodnog kapitala (engl. Natural Capital Accounting, skr. NCA) kako bi se vrednovanje ekosustava uvrstilo u planiranje razvoja. Takva bi analiza spojila inovativne pristupe ekonomskog modeliranja s modelima visoke razlučivosti o uporabi zemljišta i uslugama ekosustava za sve ekosustave (kopnene i morske) u Hrvatskoj.
vi. Vodeni ekosustavi podržavaju isporuku najvažnijih usluga ekosustava, kao što su opskrba vodom, pročišćavanje vode i rekreacija. Koristi od usluga ekosustava povezanih s vodom trebaju se brojčano odrediti kako bi se vrednovale koristi i troškovi kanalizacijskih priključaka i pročišćavanja otpadnih voda. U ovom izvješću procjenjuje se da je 2018. godine šteta nastala u okolišu zbog ispuštanja onečišćujućih tvari u otpadnim vodama iznosila oko 664 milijuna eura. Ta procjena odražava donju granicu godišnjih troškova budući da podaci o nekim drugim onečišćivačima koji se ispuštaju u vode, npr. o suspendiranim krutim tvarima, nisu dostupni.
vii. Jedan od najvećih izazova za Vladu Republike Hrvatske provedba je poboljšanja postojećeg sustava gospodarenja otpadom u skladu s Direktivama Europske unije. Hrvatska započinje svoj prelazak na kružno gospodarstvo, ali sadašnji sustav gospodarenja otpadom i dalje uvelike ovisi o odlagalištima. Područje oko odlagališta Prudinec-Jakuševec, u neposrednoj blizini grada Zagreba, bilježi najveći pad vrijednosti nekretnina u Hrvatskoj od čak 26 milijuna eura, a na drugom mjestu nalazi se područje oko odlagališta Karepovac u Splitsko-dalmatinskoj županiji. Manjkavo planiranje gospodarenja otpadom, zajedno s nedovoljnim razvrstavanjem krutog otpada te niskim stopama recikliranja, Hrvatsku košta barem 33 milijuna eura godišnje. Na osnovi podataka za 2018. godinu, zaključak ovoga izvješća je da Hrvatska mora postići izniman napredak kako bi dostigla ciljeve Direktive o otpadu zacrtane do 2021. godine.
viii. Morski otpad, tj. otpad koji su napravili ljudi te su ga ispustili u obalni ili morski okoliš, štetno utječe na ekosustave mora i oceana. U Hrvatskoj, morski otpad uzrokuje godišnje ekonomske gubitke u sektorima koji najviše ovise o obalnom i morskom okolišu, kao što su turizam, ribarstvo i akvakultura te pomorski prijevoz. Na temelju podataka iz ankete provedene u sklopu projekta
DeFishGear4, ovo izvješće procjenjuje da godišnji trošak morskog otpada u Hrvatskoj iznosi oko 21 milijun eura. Procjena odražava dodatne ekonomske troškove za te sektore, nastale uslijed čišćenja plaža, uklanjanja otpada iz mora i oko ribogojilišta, kao i troškove povezane s kvarovima propelera na brodicama. Kako bi smanjila troškove morskoga otpada, Hrvatska će morati povećati svoje napore te ojačati odgovarajući sustav prikupljanja otpada koji inače završi u moru, povećati stope recikliranja i osigurati odgovarajuću obradu takvog otpada.
ix. Unatoč napretku što ga je Hrvatska postigla u jačanju okvira politike o kvaliteti zraka, neka gradska i industrijska područja i dalje bilježe koncentracije PM2.5 iznad graničnih vrijednosti koje je postavila EU. U Hrvatskoj, koncentracija PM2.5 u zraku jedan je od vodećih čimbenika rizika vezanih uz okoliš sa stopom smrtnosti od oko 3500 slučajeva u 2018. godini5. Onečišćenje zraka nije toliko visoko kao kod nekih drugih država članica Europske unije i susjednih zemalja, ali Hrvatska mora djelovati proaktivno kako bi uspostavila kontrolu nad onečišćenjem zraka i smanjila njegove negativne utjecaje na zdravlje stanovništva. Ako se mjeri ekvivalent BDP-a u 2018. godini, Hrvatska bilježi ukupan gubitak dobrobiti povezan s prekoračenjem graničnih vrijednosti niži od Bugarske i Poljske, ali viši od drugih država članica Europske unije s kojima je uspoređena (Slika 1). Visoki troškovi povezani su s primjetnom razinom onečišćenja zraka u Zagrebu i industrijskim područjima istočne Hrvatske. Složenost problema onečišćenja zraka zahtijeva strateški i međusektorski akcijski plan koji se temelji na sveobuhvatnom razumijevanju izvora onečišćenja zraka i pruža rješenja primjerena kontekstu.
4 tudija u sklopu projekta DeFishGear procjenjuje da će vitalni gospodarski sektori, uključujući turizam, ribarstvo, akvakulturu i plovidbu, snositi povećane troškove i potencijalne gubitke prihoda zbog morskog otpada.5 Procjena prikazuje statističku vezu koja odražava broj preranih smrti povezanih s koncentracijom PM2.5 u Hrvatskoj.
Cost of Environmental Degradation in Croatia 18
Figure 1: Annual welfare loss associated with the exceedance of the NERT in selected EU countries in 2018
Note: Estimates assume that approximately half of the population in each country is exposed to air pollution below the Average Exposure Indicator (AEI). Source: World Bank staff estimates. Based on EEA. 2019. “Air quality in Europe – 2019 report”. Luxembourg: Publications Office of the European Union. https://www.eea.europa.eu/publications/air-quality-in-europe-2019
x. The tourism sector is vital to Croatia’s economy, contributing 20 percent to Croatia’s GDP in 2018. With its advantageous location and natural attractions, Croatia is one of the top tourist destinations in Europe. However, the strong seasonality of tourism tends to place increased pressure on the local environment and public infrastructure. Major tourist destinations - especially on smaller islands - are faced with challenges related to ecosystem service losses, and with pressure on local water sources, wastewater and waste treatment capacities. The CoED related to tourism is estimated
at about EUR 55 million in 20186, equivalent to about 0.6 percent of tourism-generated GDP in that year. In addition to the CoED estimates, this report highlights the annual collection and treatment costs of wastewater and solid waste generated by tourists, as well as the costs of pollution from cruise ships in Croatia (Table 2).
6 The tourism related CoED of EUR 55 million is included in the overall CoED estimates on wastewater and municipal waste (Table 1).
Table 2: Treatment and environmental degradation costs related to the tourism industry in Croatia, 2018
Impact area Valuation methodEstimated val-ue, EUR million
% of GDP in 2018
% of tourism generated GDP
Treatment costs:• Solid waste generated by
tourists• Wastewater generated by
tourists• Pollution from cruise ships
• Cost of collection and treatment
• Cost of collection and treatment
• Cost of treatment
• 25
• 7.9
• 4.3
• 0.05%
• 0.02%
• 0.01%
• 0.25%
• 0.08%
• 0.04%
CoED:• Solid waste generated by
tourists
• Wastewater generated by tourists
• Attributed share of solid waste to environmental degradation
• Attributed share of water pollution to environmental degradation
• 5
• 50
• 0.01%
• 0.1%
• 0.05%
• 0.5%
Note: CoED related to the tourism sector is included in the municipal waste and wastewater estimates in Table 1 above. CoED estimates should not be added. Source: World Bank staff estimates.
Cost of Environmental Degradation in Croatia 19
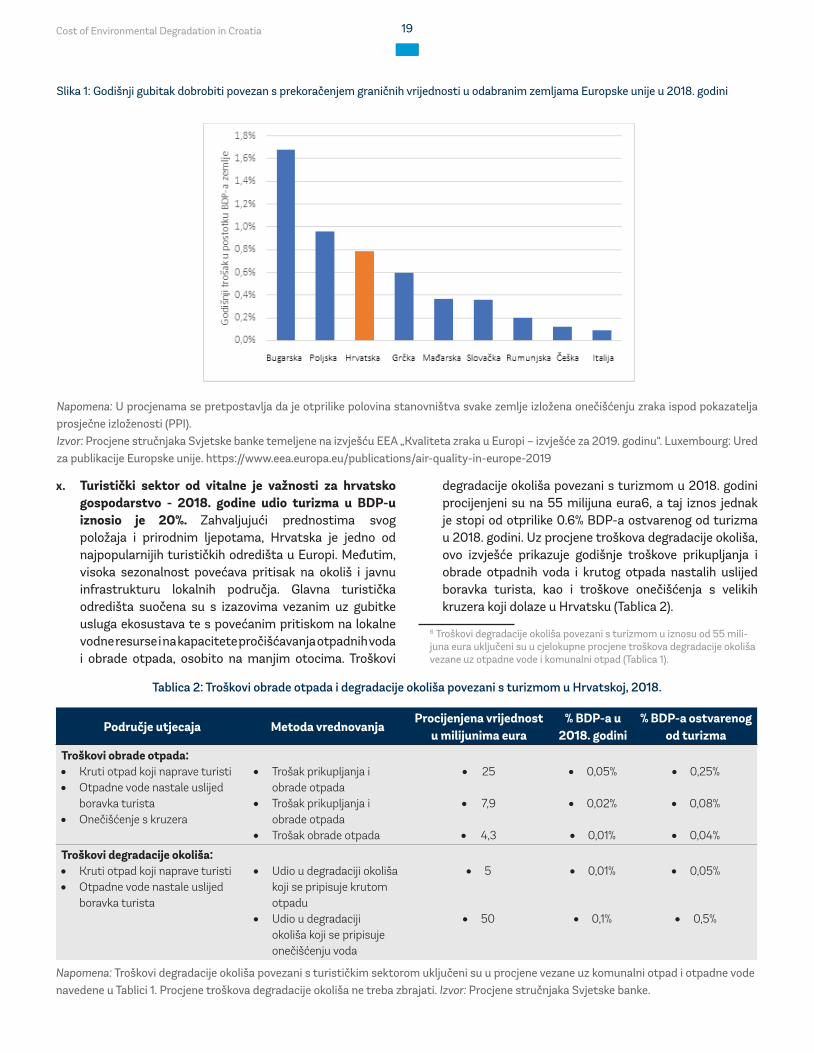
Slika 1: Godišnji gubitak dobrobiti povezan s prekoračenjem graničnih vrijednosti u odabranim zemljama Europske unije u 2018. godini
Napomena: U procjenama se pretpostavlja da je otprilike polovina stanovništva svake zemlje izložena onečišćenju zraka ispod pokazatelja prosječne izloženosti (PPI). Izvor: Procjene stručnjaka Svjetske banke temeljene na izvješću EEA „Kvaliteta zraka u Europi – izvješće za 2019. godinu“. Luxembourg: Ured za publikacije Europske unije. https://www.eea.europa.eu/publications/air-quality-in-europe-2019
x. Turistički sektor od vitalne je važnosti za hrvatsko gospodarstvo - 2018. godine udio turizma u BDP-u iznosio je 20%. Zahvaljujući prednostima svog položaja i prirodnim ljepotama, Hrvatska je jedno od najpopularnijih turističkih odredišta u Europi. Međutim, visoka sezonalnost povećava pritisak na okoliš i javnu infrastrukturu lokalnih područja. Glavna turistička odredišta suočena su s izazovima vezanim uz gubitke usluga ekosustava te s povećanim pritiskom na lokalne vodne resurse i na kapacitete pročišćavanja otpadnih voda i obrade otpada, osobito na manjim otocima. Troškovi
degradacije okoliša povezani s turizmom u 2018. godini procijenjeni su na 55 milijuna eura6, a taj iznos jednak je stopi od otprilike 0.6% BDP-a ostvarenog od turizma u 2018. godini. Uz procjene troškova degradacije okoliša, ovo izvješće prikazuje godišnje troškove prikupljanja i obrade otpadnih voda i krutog otpada nastalih uslijed boravka turista, kao i troškove onečišćenja s velikih kruzera koji dolaze u Hrvatsku (Tablica 2).
6 Troškovi degradacije okoliša povezani s turizmom u iznosu od 55 mili-juna eura uključeni su u cjelokupne procjene troškova degradacije okoliša vezane uz otpadne vode i komunalni otpad (Tablica 1).
Tablica 2: Troškovi obrade otpada i degradacije okoliša povezani s turizmom u Hrvatskoj, 2018.
Područje utjecaja Metoda vrednovanjaProcijenjena vrijednost
u milijunima eura% BDP-a u
2018. godini% BDP-a ostvarenog
od turizmaTroškovi obrade otpada:• Kruti otpad koji naprave turisti• Otpadne vode nastale uslijed
boravka turista• Onečišćenje s kruzera
• Trošak prikupljanja i obrade otpada
• Trošak prikupljanja i obrade otpada
• Trošak obrade otpada
• 25
• 7,9
• 4,3
• 0,05%
• 0,02%
• 0,01%
• 0,25%
• 0,08%
• 0,04%
Troškovi degradacije okoliša:• Kruti otpad koji naprave turisti• Otpadne vode nastale uslijed
boravka turista
• Udio u degradaciji okoliša koji se pripisuje krutom otpadu
• Udio u degradaciji okoliša koji se pripisuje onečišćenju voda
• 5
• 50
• 0,01%
• 0,1%
• 0,05%
• 0,5%
Napomena: Troškovi degradacije okoliša povezani s turističkim sektorom uključeni su u procjene vezane uz komunalni otpad i otpadne vode navedene u Tablici 1. Procjene troškova degradacije okoliša ne treba zbrajati. Izvor: Procjene stručnjaka Svjetske banke.
Cost of Environmental Degradation in Croatia 20
xi. The strong reliance of Croatia’s economy on tourism creates vulnerabilities to economic and other shocks, as revealed by the impacts of COVID-19. The tourism economy has been heavily hit by the COVID-19 pandemic and by measures introduced to contain its spread. Depending on the duration of the crisis, revised scenarios indicate that the potential shock could range between a 60-80 percent decline in the international tourism economy in 2020.7 However, while it has led to a large decline in tourist arrivals, the COVID-19 crisis may offer an opportunity to re-build Croatia’s tourism industry more sustainably. Croatia’s government could support the development and implementation of recovery plans which contribute towards a stronger, more sustainable and resilient tourism economy.
xii. The European Green Deal (EGD) presents an opportunity for Croatia to stimulate its economy in conjunction with sustainable and resilient growth. The EGD, launched by the European Commission in 2019, is a unique support mechanism for tackling short-term economic needs in tandem with long-term sustainability goals including climate change adaption. Financial support for COVID-19 recovery under the program provides a chance for Croatia to “grow back better and greener”. Economic policies, which address immediate shocks and ensure a sustainable development of the country compatible with the EU long-term strategy for the EGD, could be given priority. The results of this CoED directly support three pillars of the EGD, which may be considered a priority for Croatia: (i) preserving Europe’s natural capital, which could benefit from analyzing the alternatives of land use in Croatia; (ii) transition to a circular economy supported by reducing waste generation and over-packaging, while increasing waste recovery and reuse; and (iii) a zero pollution Europe, with the aim of reaching by 2050 a “pollution-free environment” that is closely linked to clean air and water action plans. While Croatia has already started to work on circular economy, it is recommended that the country strengthens the analytical basis for addressing the other two pillars.
7 OECD. 2020a. “Tourism Policy Response to the coronavirus (COVID-19).” https://www.oecd.org/coronavirus/policy-responses/tourism-policy-responses-to-the-coronavirus-covid-19-6466aa20/ (accessed September 1, 2020).
Cost of Environmental Degradation in Croatia 21
xi. Hrvatsko gospodarstvo snažno se oslanja na turizam te je zbog toga ranjivo u slučaju gospodarskih i ostalih šokova, kao što je pojava bolesti izazvane koronavirusom (COVID-19). Turistički sektor jako je pogođen pandemijom bolesti COVID-19 i mjerama uvedenim kako bi se obustavilo njezino širenje. Ovisno o trajanju ove krize, revidirani scenariji ukazuju na to da bi u 2020. godini potencijalni šok mogao izazvati pad međunarodnog turizma između 60 i 80%7. Iako će uz-rokovati veliki pad dolazaka turista, kriza izazvana Covi-dom-19 mogla bi ponuditi mogućnost za razvoj održivije turističke industrije u Hrvatskoj. Vlada Republike Hr-vatske mogla bi podržati razvoj i provedbu planova opo-ravka koji doprinose jačem, održivijem i otpornijem tur-ističkom gospodarstvu.
xii. Europski zeleni plan (engl. European Green Deal, skr. EGD) pruža Hrvatskoj priliku za jačanje gospodarstva kroz održiv i otporan rast. Europska komisija pokrenu-la je Europski zeleni plan 2019. godine, a on predstavl-ja jedinstveni mehanizam potpore za rješavanje krat-koročnih gospodarskih potreba uz dugoročne ciljeve održivog razvoja, uključujući prilagodbu klimatskim promjenama. Financijska potpora za oporavak od krize izazvane Covidom-19 prilika je da se Hrvatska oporavi kao snažnija i zelenija zemlja. Prednost bi se mogla dati ekonomskim politikama koje ublažavaju neposredne šokove i osiguravaju održivi razvoj zemlje sukladan s du-goročnom strategijom Europske unije za Europski zeleni plan. Rezultati ovog izvješća o troškovima degradacije okoliša direktno podupiru tri stupa Europskog zelenog plana koji bi se mogli smatrati prioritetom za Hrvatsku: i) očuvanje prirodnog kapitala Europe – u tom smislu, mogle bi biti korisne analize alternativnih mogućnosti korištenja zemljišta u Hrvatskoj; ii) prelazak na kružno gospodarstvo – podržava se smanjenjem stvaranja otpada i prekomjernog pakiranja te povećanjem oporabe i ponovne uporabe otpada; iii) Europa s nultom stopom onečišćenja za postizanje okoliša bez onečišćenja do 2050. godine - ovaj stup usko je povezan s akcijskim planovima za čisti zrak i vodu. Hrvatska je već započela aktivnosti vezane uz kružno gospodarstvo, ali preporuča se da ojača analitičku podlogu koja je potrebna za postizanje ciljeva iz druga dva stupa.
7 OECD. 2020a. “Odgovor turističke politike na koronavirus (COVID-19).” https://www.oecd.org/coronavirus/policy-responses/tourism-policy-re-sponses-to-the-coronavirus-covid-19-6466aa20/ (accessed September 1, 2020).

Cost of Environmental Degradation in Croatia 22
Cost of Environmental Degradation in Croatia 23
INTRODUCTIONPhoto: Damir Fabijanić
Cost of Environmental Degradation in Croatia 24
1 INTRODUCTION1. Croatia officially became a high-income country in
2018, with a GDP per capita that year of EUR 12.6 thousand8. Croatia became an EU member state in 2013 with the most recent enlargement of the European Union (EU), and during a six-year long recession stemming from the 2008 global financial crisis. Croatia’s recovery started only in 2015, with the tourism sector emerging as a key driver of the country’s economic growth9. Manufacturing and other secondary industries account for a smaller but still important portion of GDP. Significant industries include food processing and wine making, as well as the production and refining of petroleum. The global recession induced by COVID-19 has affected important sectors of the economy and could reduce Croatia’s GDP by 10.8 percent in 202010.
8 World Development Indicators (WDI). 2020. DataBank. Washington D.C.: The World Bank. https://databank.worldbank.org/source/world-de-velopment-indicators (accessed on July 12, 2020).9 The World Bank. 2019a. “Croatia – Country Partnership Framework for the Period of FY19-FY24.” Washington DC.: The World Bank. http://documents.worldbank.org/curated/en/501721557239562800/Croatia-Country-Partnership-Framework-for-the-Period-of-FY19-FY24.10 European Commission (EC). 2020c. “Economic forecast for Croatia.” https://ec.europa.eu/info/business-economy-euro/economic-perfor-mance-and-forecasts/economic-performance-country/croatia/econom-ic-forecast-croatia_en (accessed September 1, 2020).
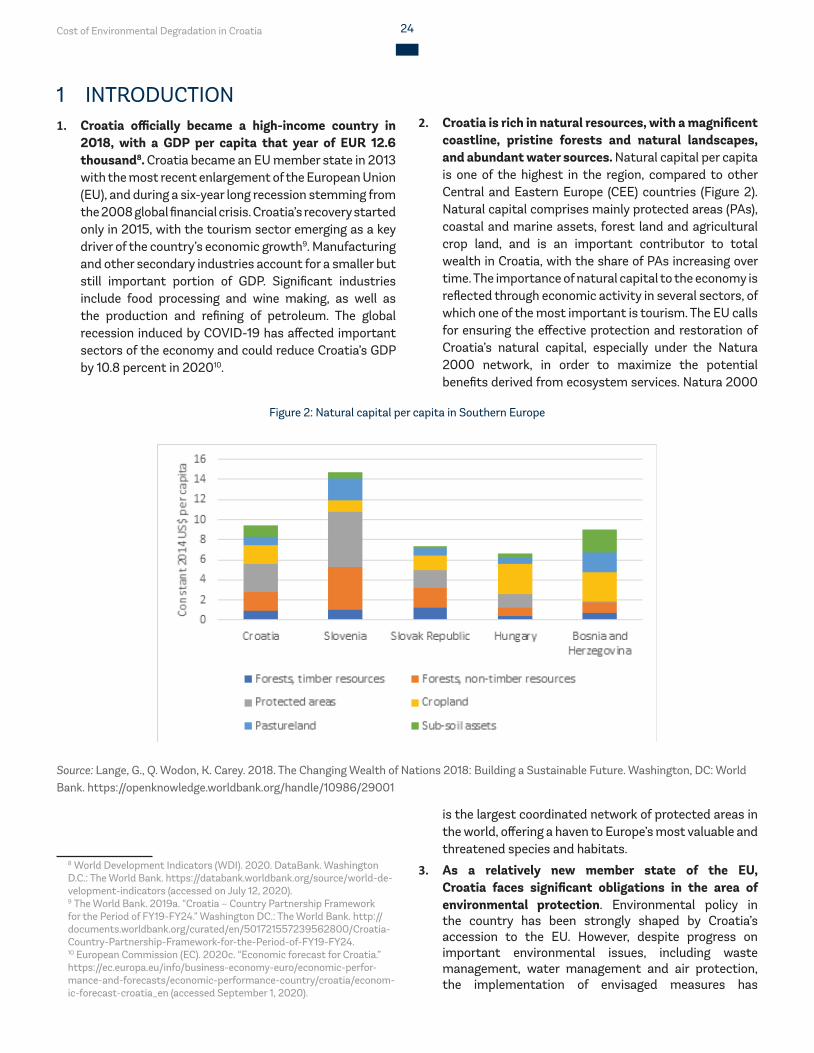
2. Croatia is rich in natural resources, with a magnificent coastline, pristine forests and natural landscapes, and abundant water sources. Natural capital per capita is one of the highest in the region, compared to other Central and Eastern Europe (CEE) countries (Figure 2). Natural capital comprises mainly protected areas (PAs), coastal and marine assets, forest land and agricultural crop land, and is an important contributor to total wealth in Croatia, with the share of PAs increasing over time. The importance of natural capital to the economy is reflected through economic activity in several sectors, of which one of the most important is tourism. The EU calls for ensuring the effective protection and restoration of Croatia’s natural capital, especially under the Natura 2000 network, in order to maximize the potential benefits derived from ecosystem services. Natura 2000
is the largest coordinated network of protected areas in the world, offering a haven to Europe’s most valuable and threatened species and habitats.
3. As a relatively new member state of the EU, Croatia faces significant obligations in the area of environmental protection. Environmental policy in the country has been strongly shaped by Croatia’s accession to the EU. However, despite progress on important environmental issues, including waste management, water management and air protection, the implementation of envisaged measures has
Figure 2: Natural capital per capita in Southern Europe
Source: Lange, G., Q. Wodon, K. Carey. 2018. The Changing Wealth of Nations 2018: Building a Sustainable Future. Washington, DC: World Bank. https://openknowledge.worldbank.org/handle/10986/29001
Cost of Environmental Degradation in Croatia 25
advanced slowly. The European Commission identified three main challenges for Croatia in implementing EU environmental policy and law11: (i) improving waste management, particularly by increasing the recycling of municipal waste and facilitate the transition to a more circular economy; (ii) ensuring the effective management of Croatia’s Natura 2000 sites; and (iii) prioritizing the implementation of projects in the water sector that are needed to fulfil requirements of the EU’s Urban Waste Water Treatment (UWWT) Directive and the Drinking Water Directive.
11 European Commission (EC). 2019b. The Environmental Implementation Review. Croatia. Luxembourg: Publications Office of the European Union. https://ec.europa.eu/environment/eir/pdf/factsheet_hr_en.pdf.
4. Climate Change has one of the highest impacts on Croatia among Southern Europe countries12. The main expected impacts are sea level rise; the increased frequency and intensity of precipitation events resulting in floods or droughts; an increase in avarage air temperature; and warming of the sea, affecting marine fisheries and ecosystems (Box 1).
12 Szewczyk, W., J. C. Ciscar Martinez, I. Mongelli, and A. Soria Ramirez. 2018. “JRC PESETA III Project: Economic integration and spillover analy-sis”. Publications Office of the European Union. https://ec.europa.eu/jrc/en/publication/jrc-peseta-iii-project-economic-integration-and-spill-over-analysis.
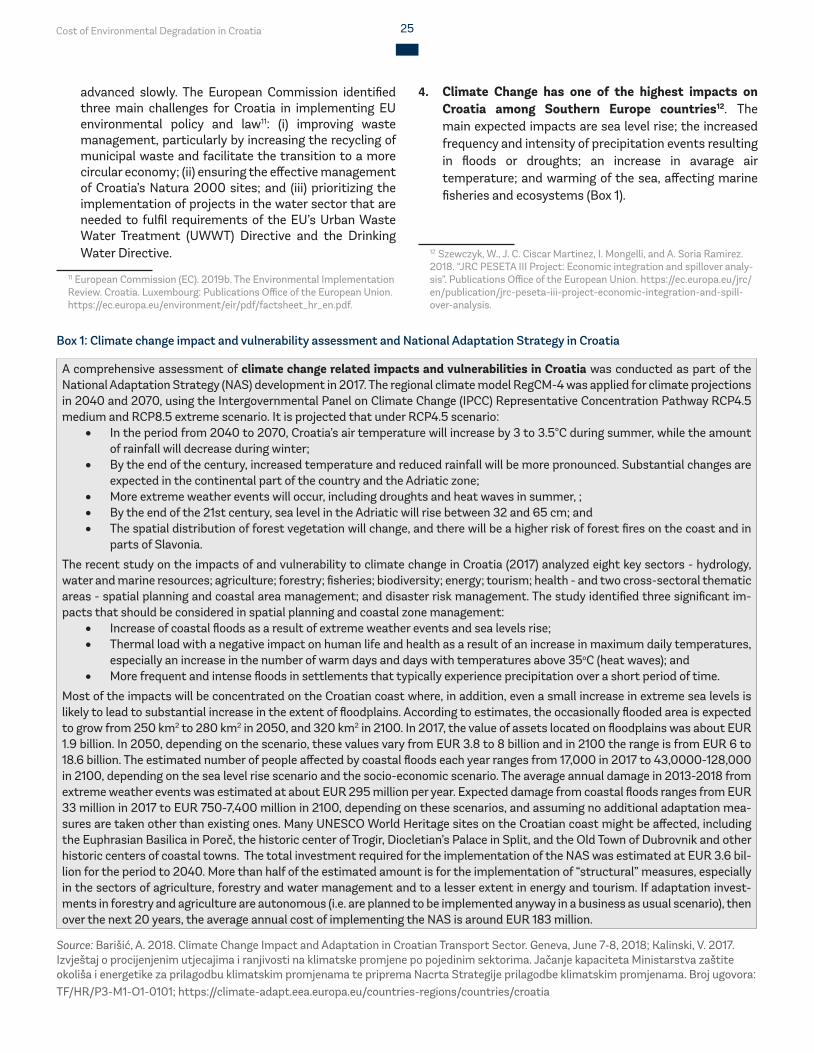
Box 1: Climate change impact and vulnerability assessment and National Adaptation Strategy in Croatia
A comprehensive assessment of climate change related impacts and vulnerabilities in Croatia was conducted as part of the National Adaptation Strategy (NAS) development in 2017. The regional climate model RegCM-4 was applied for climate projections in 2040 and 2070, using the Intergovernmental Panel on Climate Change (IPCC) Representative Concentration Pathway RCP4.5 medium and RCP8.5 extreme scenario. It is projected that under RCP4.5 scenario:
• In the period from 2040 to 2070, Croatia’s air temperature will increase by 3 to 3.5°C during summer, while the amount of rainfall will decrease during winter;
• By the end of the century, increased temperature and reduced rainfall will be more pronounced. Substantial changes are expected in the continental part of the country and the Adriatic zone;
• More extreme weather events will occur, including droughts and heat waves in summer, ; • By the end of the 21st century, sea level in the Adriatic will rise between 32 and 65 cm; and• The spatial distribution of forest vegetation will change, and there will be a higher risk of forest fires on the coast and in
parts of Slavonia.
The recent study on the impacts of and vulnerability to climate change in Croatia (2017) analyzed eight key sectors - hydrology, water and marine resources; agriculture; forestry; fisheries; biodiversity; energy; tourism; health - and two cross-sectoral thematic areas - spatial planning and coastal area management; and disaster risk management. The study identified three significant im-pacts that should be considered in spatial planning and coastal zone management:
• Increase of coastal floods as a result of extreme weather events and sea levels rise;• Thermal load with a negative impact on human life and health as a result of an increase in maximum daily temperatures,
especially an increase in the number of warm days and days with temperatures above 35oC (heat waves); and• More frequent and intense floods in settlements that typically experience precipitation over a short period of time.
Most of the impacts will be concentrated on the Croatian coast where, in addition, even a small increase in extreme sea levels is likely to lead to substantial increase in the extent of floodplains. According to estimates, the occasionally flooded area is expected to grow from 250 km2 to 280 km2 in 2050, and 320 km2 in 2100. In 2017, the value of assets located on floodplains was about EUR 1.9 billion. In 2050, depending on the scenario, these values vary from EUR 3.8 to 8 billion and in 2100 the range is from EUR 6 to 18.6 billion. The estimated number of people affected by coastal floods each year ranges from 17,000 in 2017 to 43,0000-128,000 in 2100, depending on the sea level rise scenario and the socio-economic scenario. The average annual damage in 2013-2018 from extreme weather events was estimated at about EUR 295 million per year. Expected damage from coastal floods ranges from EUR 33 million in 2017 to EUR 750-7,400 million in 2100, depending on these scenarios, and assuming no additional adaptation mea-sures are taken other than existing ones. Many UNESCO World Heritage sites on the Croatian coast might be affected, including the Euphrasian Basilica in Poreč, the historic center of Trogir, Diocletian’s Palace in Split, and the Old Town of Dubrovnik and other historic centers of coastal towns. The total investment required for the implementation of the NAS was estimated at EUR 3.6 bil-lion for the period to 2040. More than half of the estimated amount is for the implementation of “structural” measures, especially in the sectors of agriculture, forestry and water management and to a lesser extent in energy and tourism. If adaptation invest-ments in forestry and agriculture are autonomous (i.e. are planned to be implemented anyway in a business as usual scenario), then over the next 20 years, the average annual cost of implementing the NAS is around EUR 183 million.
Source: Barišić, A. 2018. Climate Change Impact and Adaptation in Croatian Transport Sector. Geneva, June 7‐8, 2018; Kalinski, V. 2017. Izvještaj o procijenjenim utjecajima i ranjivosti na klimatske promjene po pojedinim sektorima. Jačanje kapaciteta Ministarstva zaštite okoliša i energetike za prilagodbu klimatskim promjenama te priprema Nacrta Strategije prilagodbe klimatskim promjenama. Broj ugovora: TF/HR/P3-M1-O1-0101; https://climate-adapt.eea.europa.eu/countries-regions/countries/croatia
Cost of Environmental Degradation in Croatia 26
5. GDP growth does not directly reflect negative effects of environmental pollution and natural resource degradation. Health risks from air and water pollution, disamentities resulting from improper waste disposal, and biodiversity depletion all impose a burden on local populations and ecosystems. This burden often goes undetected and unaccounted for, but it negatively affects the local economy and people’s welfare. These negative impacts are assessed by estimating CoED in Croatia.
6. CoED, as an upstream diagnostic, is used in many countries13 to evaluate the annual cost of inaction in areas of pollution and ecosystem services. Estimates for each category of impact, including biodiversity, wastewater, waste and air, are not intended to be compared with the others, given the difference of valuation methods and accuracy of data used. However, such estimates can provide a solid analytical foundation to inform decision making proccesses within each category. Results of this analysis can ecourage Croatia to recognize diverse environmental challenges, and to develop and prioritize solutions for each environmental problem.
7. Estimating CoED in monetary terms provides an indication of the real magnitude of environmental damage in Croatia. Chapter 2 provides an overview of the methods used for estimating CoED, while outlining the report’s limitations. Five sectors were selected for the analysis according to their significant environmental degradation potential and impact on well-being of population and ecosystems. They are biodiversity (Chapter 3); wastewater (Chapter 4); solid waste, including marine litter (Chapter 5); and air quality (Chapter 6). Tourism is analyzed as the sector that is most dependent on sound environmental components and on the availability of natural resources (Chapter 7).
13 Amongst others: Georgia CEA 2015 by the World Bank; Air quality management in Poland 2019 by the World Bank; and Mexican CEA 2015 by the World Bank informing selection of prior actions.
Cost of Environmental Degradation in Croatia 27
Photo: Renco Kosinožić
METHODOLOGY
Cost of Environmental Degradation in Croatia 28
2 METHODOLOGY
2.1 Objective and Scope8. This report is aimed at estimating in monetary terms
annual CoED in Croatia. It assesses damages at three levels: (i) economic, such as losses in timber production due to ecosystem losses; (ii) environmental, for example, reduced aesthetic value of areas located near landfills; and (iii) social, such as premature death caused by expo-sure to air pollution. The report also estimates the collec-tion and treatment costs of solid waste and wastewater management attributed to tourism, as well as CoED related to the growing tourism industry. The results are expressed in 2018 prices, are reflected in absolute (EUR), and in relative terms, as a percentage of GDP. The CoED report values the impacts of environmental degradation that occurred in 2018 due to pollution (related to air, wa-ter, waste, and marine litter), and the loss of ecosystem services. In addition, valuation of CoED covers, to a lim-ited extent, the impact of climate change (e.g. increased sedimentation due to soil erosion in national parks). However, it is important to note that: (i) the impacts of climate change cannot be separated from those of oth-er factors; and (ii) since the valuation refers only to one year, impacts captured are likely to be minor.
2.2 What does CoED measure?9. CoED estimates annual changes in net economic ben-
efits caused by current environmental management practices. At any given time, Croatia’s environment pro-vides certain benefits (e.g. clean air, agricultural produc-tion, recreational value), depending on various types of management and on the socioeconomic context. The fu-ture value of these benefits is assumed to be lower, due to either (i) sub-optimal management (e.g. the discharge of untreated municipal wastewater, the discharge of pol-lutants into the air, marine litter, and inadequate man-agement of municipal waste); or (ii) to natural factors, exacerbated by climate change (e.g. losses of ecosystem services). CoED is thus the difference between current and future net economic benefits. It is important to note that CoED indicates only the extent of damage for areas that need urgent interventions for improvement. It pro-vides no information on the best choice of interventions, or their likely profitability.
10. Estimation of the CoED involves valuation of damage to goods and services. These include those for which there are market prices (e.g. houses and timber), but also those services without clear market prices (e.g. non-mar-ket services, such as pollution due to particulate matter or nutrients in wastewater). While the valuation of mar-ketable goods tends to be straightforward (e.g. by using
the market price after eliminating distortions), estimat-ing the value of non-market goods and services poses considerable practical challenges, and rests on many assumptions.
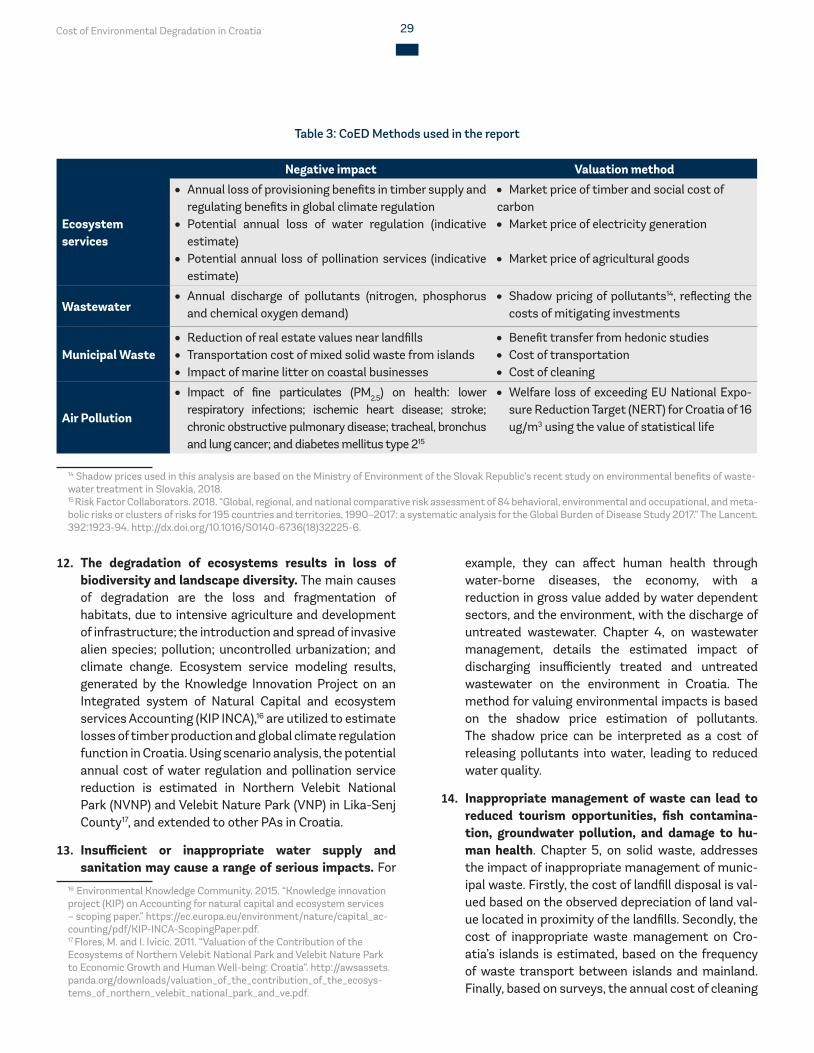
11. This report estimates annual environmental degrada-tion costs in Croatia to the extent that negative im-pacts can be captured with available information and data. Negative impacts within selected thematic areas – namely ecosystem services, wastewater, municipal waste and air pollution - are monetized applying differ-ent valuation methods (Table 3). The methods used in this report reflect welfare-based approaches (e.g. in case of the air pollution) as well as cost-based approaches (e.g. replacement costs). The specific application of each method is outlined in more detail in the ANNEXES.
Cost of Environmental Degradation in Croatia 29
Table 3: CoED Methods used in the report
Negative impact Valuation method
Ecosystem services
• Annual loss of provisioning benefits in timber supply and regulating benefits in global climate regulation
• Potential annual loss of water regulation (indicative estimate)
• Potential annual loss of pollination services (indicative estimate)
• Market price of timber and social cost of carbon• Market price of electricity generation
• Market price of agricultural goods
Wastewater• Annual discharge of pollutants (nitrogen, phosphorus
and chemical oxygen demand)• Shadow pricing of pollutants14, reflecting the
costs of mitigating investments
Municipal Waste• Reduction of real estate values near landfills• Transportation cost of mixed solid waste from islands• Impact of marine litter on coastal businesses
• Benefit transfer from hedonic studies• Cost of transportation• Cost of cleaning
Air Pollution
• Impact of fine particulates (PM2.5) on health: lower respiratory infections; ischemic heart disease; stroke; chronic obstructive pulmonary disease; tracheal, bronchus and lung cancer; and diabetes mellitus type 215
• Welfare loss of exceeding EU National Expo-sure Reduction Target (NERT) for Croatia of 16 ug/m3 using the value of statistical life
14 Shadow prices used in this analysis are based on the Ministry of Environment of the Slovak Republic’s recent study on environmental benefits of waste-water treatment in Slovakia, 2018.15 Risk Factor Collaborators. 2018. “Global, regional, and national comparative risk assessment of 84 behavioral, environmental and occupational, and meta-bolic risks or clusters of risks for 195 countries and territories, 1990–2017: a systematic analysis for the Global Burden of Disease Study 2017.” The Lancent. 392:1923-94. http://dx.doi.org/10.1016/S0140-6736(18)32225-6.
12. The degradation of ecosystems results in loss of biodiversity and landscape diversity. The main causes of degradation are the loss and fragmentation of habitats, due to intensive agriculture and development of infrastructure; the introduction and spread of invasive alien species; pollution; uncontrolled urbanization; and climate change. Ecosystem service modeling results, generated by the Knowledge Innovation Project on an Integrated system of Natural Capital and ecosystem services Accounting (KIP INCA),16 are utilized to estimate losses of timber production and global climate regulation function in Croatia. Using scenario analysis, the potential annual cost of water regulation and pollination service reduction is estimated in Northern Velebit National Park (NVNP) and Velebit Nature Park (VNP) in Lika-Senj County17, and extended to other PAs in Croatia.
13. Insufficient or inappropriate water supply and sanitation may cause a range of serious impacts. For
16 Environmental Knowledge Community. 2015. “Knowledge innovation project (KIP) on Accounting for natural capital and ecosystem services – scoping paper.” https://ec.europa.eu/environment/nature/capital_ac-counting/pdf/KIP-INCA-ScopingPaper.pdf.17 Flores, M. and I. Ivicic. 2011. “Valuation of the Contribution of the Ecosystems of Northern Velebit National Park and Velebit Nature Park to Economic Growth and Human Well-being: Croatia”. http://awsassets.panda.org/downloads/valuation_of_the_contribution_of_the_ecosys-tems_of_northern_velebit_national_park_and_ve.pdf.
example, they can affect human health through water-borne diseases, the economy, with a reduction in gross value added by water dependent sectors, and the environment, with the discharge of untreated wastewater. Chapter 4, on wastewater management, details the estimated impact of discharging insufficiently treated and untreated wastewater on the environment in Croatia. The method for valuing environmental impacts is based on the shadow price estimation of pollutants. The shadow price can be interpreted as a cost of releasing pollutants into water, leading to reduced water quality.
14. Inappropriate management of waste can lead to reduced tourism opportunities, fish contamina-tion, groundwater pollution, and damage to hu-man health. Chapter 5, on solid waste, addresses the impact of inappropriate management of munic-ipal waste. Firstly, the cost of landfill disposal is val-ued based on the observed depreciation of land val-ue located in proximity of the landfills. Secondly, the cost of inappropriate waste management on Cro-atia’s islands is estimated, based on the frequency of waste transport between islands and mainland. Finally, based on surveys, the annual cost of cleaning
Cost of Environmental Degradation in Croatia 30
related to marine litter is estimated for sectors depend-ing on marine resources (e.g. tourism, fisheries and mar-itime transport).
15. Air pollution is a major contributor to human mortality and morbidity. Chapter 6, on air quality, estimates the impact of exposure to ambient PM2.5 on health in Zagreb City and Zagreb County, industrial centers and other areas with lower pollution levels. Health impacts include lower respiratory infections, ischemic heart disease, stroke, chronic obstructive pulmonary disease, tracheal, bronchus and lung cancer, and diabetes mellitus type 2. The cost of mortality is estimated based on the value of a statistical life (VSL), which reflects society’s willingness to pay (WTP) to avoid death. In addition, the cost of morbidity is valued as a fraction (10 percent) of the cost of mortality.18
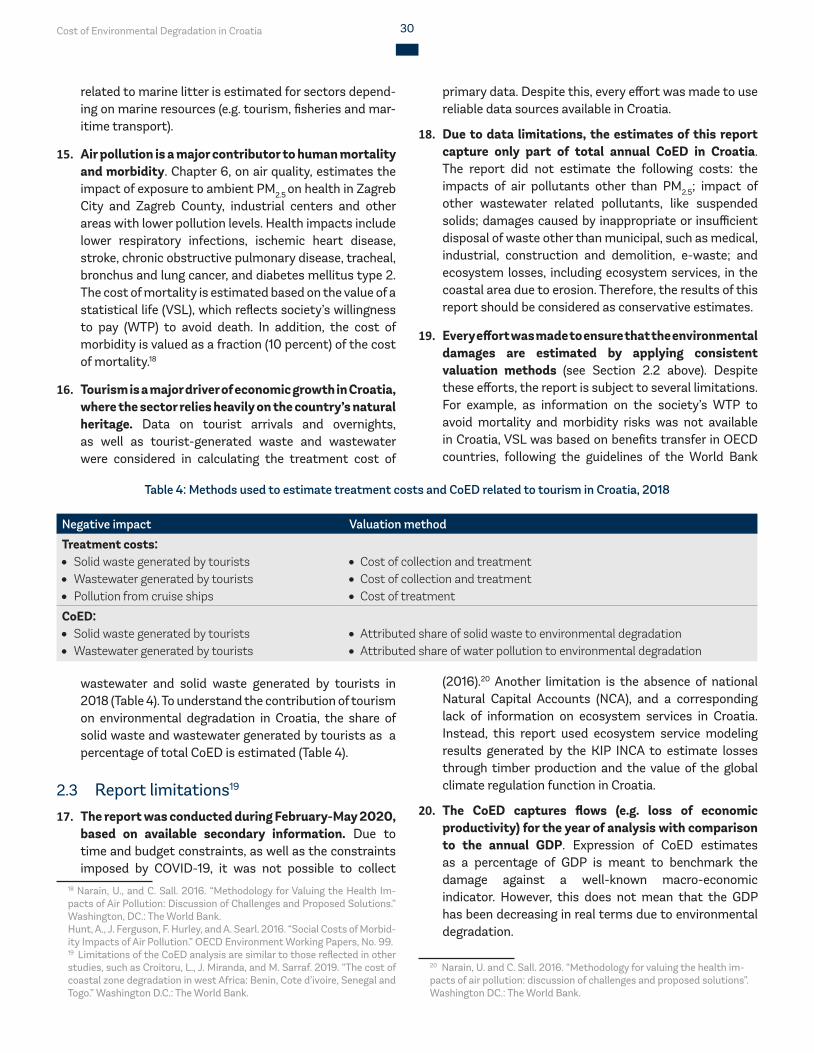
16. Tourism is a major driver of economic growth in Croatia, where the sector relies heavily on the country’s natural heritage. Data on tourist arrivals and overnights, as well as tourist-generated waste and wastewater were considered in calculating the treatment cost of
wastewater and solid waste generated by tourists in 2018 (Table 4). To understand the contribution of tourism on environmental degradation in Croatia, the share of solid waste and wastewater generated by tourists as a percentage of total CoED is estimated (Table 4).
2.3 Report limitations19
17. The report was conducted during February-May 2020, based on available secondary information. Due to time and budget constraints, as well as the constraints imposed by COVID-19, it was not possible to collect
18 Narain, U., and C. Sall. 2016. “Methodology for Valuing the Health Im-pacts of Air Pollution: Discussion of Challenges and Proposed Solutions.” Washington, DC.: The World Bank.Hunt, A., J. Ferguson, F. Hurley, and A. Searl. 2016. “Social Costs of Morbid-ity Impacts of Air Pollution.” OECD Environment Working Papers, No. 99.19 Limitations of the CoED analysis are similar to those reflected in other studies, such as Croitoru, L., J. Miranda, and M. Sarraf. 2019. “The cost of coastal zone degradation in west Africa: Benin, Cote d’ivoire, Senegal and Togo.” Washington D.C.: The World Bank.
primary data. Despite this, every effort was made to use reliable data sources available in Croatia.
18. Due to data limitations, the estimates of this report capture only part of total annual CoED in Croatia. The report did not estimate the following costs: the impacts of air pollutants other than PM2.5; impact of other wastewater related pollutants, like suspended solids; damages caused by inappropriate or insufficient disposal of waste other than municipal, such as medical, industrial, construction and demolition, e-waste; and ecosystem losses, including ecosystem services, in the coastal area due to erosion. Therefore, the results of this report should be considered as conservative estimates.
19. Every effort was made to ensure that the environmental damages are estimated by applying consistent valuation methods (see Section 2.2 above). Despite these efforts, the report is subject to several limitations. For example, as information on the society’s WTP to avoid mortality and morbidity risks was not available in Croatia, VSL was based on benefits transfer in OECD countries, following the guidelines of the World Bank
(2016).20 Another limitation is the absence of national Natural Capital Accounts (NCA), and a corresponding lack of information on ecosystem services in Croatia. Instead, this report used ecosystem service modeling results generated by the KIP INCA to estimate losses through timber production and the value of the global climate regulation function in Croatia.
20. The CoED captures flows (e.g. loss of economic productivity) for the year of analysis with comparison to the annual GDP. Expression of CoED estimates as a percentage of GDP is meant to benchmark the damage against a well-known macro-economic indicator. However, this does not mean that the GDP has been decreasing in real terms due to environmental degradation.
20 Narain, U. and C. Sall. 2016. “Methodology for valuing the health im-pacts of air pollution: discussion of challenges and proposed solutions”. Washington DC.: The World Bank.
Table 4: Methods used to estimate treatment costs and CoED related to tourism in Croatia, 2018
Negative impact Valuation method
Treatment costs:• Solid waste generated by tourists• Wastewater generated by tourists• Pollution from cruise ships
•Cost of collection and treatment•Cost of collection and treatment•Cost of treatment
CoED:• Solid waste generated by tourists• Wastewater generated by tourists
•Attributed share of solid waste to environmental degradation•Attributed share of water pollution to environmental degradation
Cost of Environmental Degradation in Croatia 31
BIODIVERSITYPhoto: Vladimir Kalinski
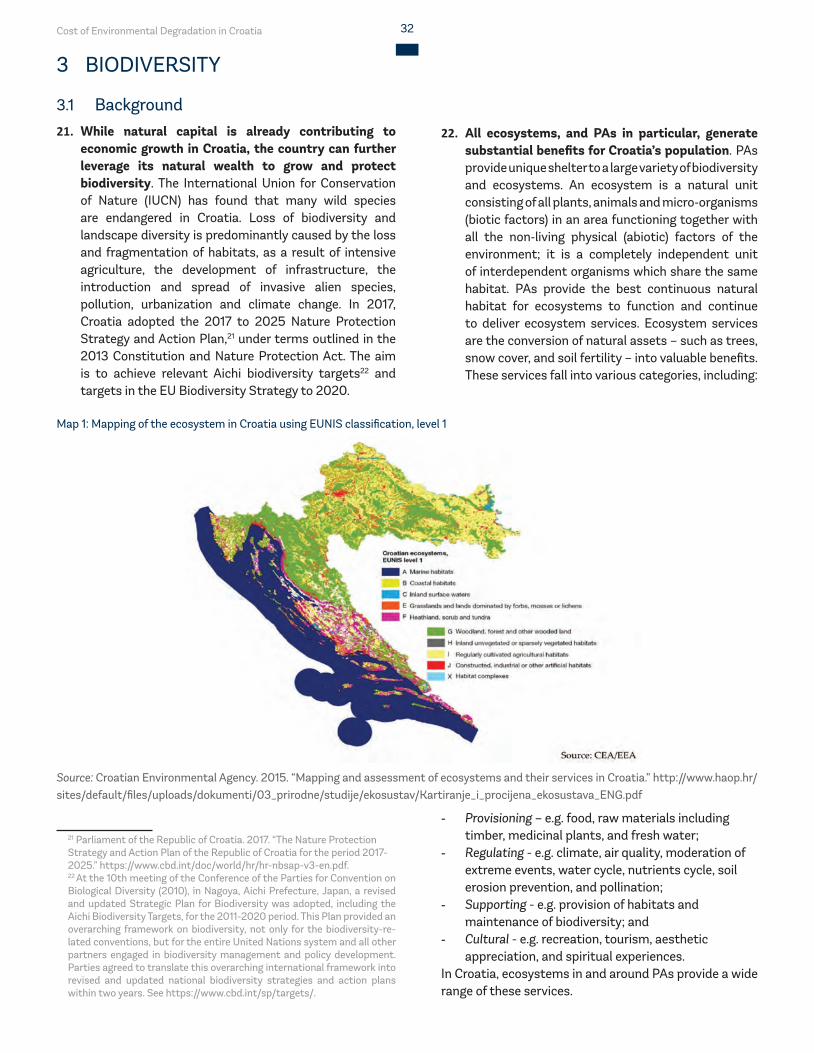
Cost of Environmental Degradation in Croatia 32
3 BIODIVERSITY
3.1 Background21. While natural capital is already contributing to
economic growth in Croatia, the country can further leverage its natural wealth to grow and protect biodiversity. The International Union for Conservation of Nature (IUCN) has found that many wild species are endangered in Croatia. Loss of biodiversity and landscape diversity is predominantly caused by the loss and fragmentation of habitats, as a result of intensive agriculture, the development of infrastructure, the introduction and spread of invasive alien species, pollution, urbanization and climate change. In 2017, Croatia adopted the 2017 to 2025 Nature Protection Strategy and Action Plan,21 under terms outlined in the 2013 Constitution and Nature Protection Act. The aim is to achieve relevant Aichi biodiversity targets22 and targets in the EU Biodiversity Strategy to 2020.
21 Parliament of the Republic of Croatia. 2017. “The Nature Protection Strategy and Action Plan of the Republic of Croatia for the period 2017-2025.” https://www.cbd.int/doc/world/hr/hr-nbsap-v3-en.pdf.22 At the 10th meeting of the Conference of the Parties for Convention on Biological Diversity (2010), in Nagoya, Aichi Prefecture, Japan, a revised and updated Strategic Plan for Biodiversity was adopted, including the Aichi Biodiversity Targets, for the 2011-2020 period. This Plan provided an overarching framework on biodiversity, not only for the biodiversity-re-lated conventions, but for the entire United Nations system and all other partners engaged in biodiversity management and policy development. Parties agreed to translate this overarching international framework into revised and updated national biodiversity strategies and action plans within two years. See https://www.cbd.int/sp/targets/.
22. All ecosystems, and PAs in particular, generate substantial benefits for Croatia’s population. PAs provide unique shelter to a large variety of biodiversity and ecosystems. An ecosystem is a natural unit consisting of all plants, animals and micro‐organisms (biotic factors) in an area functioning together with all the non‐living physical (abiotic) factors of the environment; it is a completely independent unit of interdependent organisms which share the same habitat. PAs provide the best continuous natural habitat for ecosystems to function and continue to deliver ecosystem services. Ecosystem services are the conversion of natural assets – such as trees, snow cover, and soil fertility – into valuable benefits. These services fall into various categories, including:
- Provisioning – e.g. food, raw materials including timber, medicinal plants, and fresh water;
- Regulating - e.g. climate, air quality, moderation of extreme events, water cycle, nutrients cycle, soil erosion prevention, and pollination;
- Supporting - e.g. provision of habitats and maintenance of biodiversity; and
- Cultural - e.g. recreation, tourism, aesthetic appreciation, and spiritual experiences.
In Croatia, ecosystems in and around PAs provide a wide range of these services.
Map 1: Mapping of the ecosystem in Croatia using EUNIS classification, level 1
Source: Croatian Environmental Agency. 2015. “Mapping and assessment of ecosystems and their services in Croatia.” http://www.haop.hr/sites/default/files/uploads/dokumenti/03_prirodne/studije/ekosustav/Kartiranje_i_procijena_ekosustava_ENG.pdf
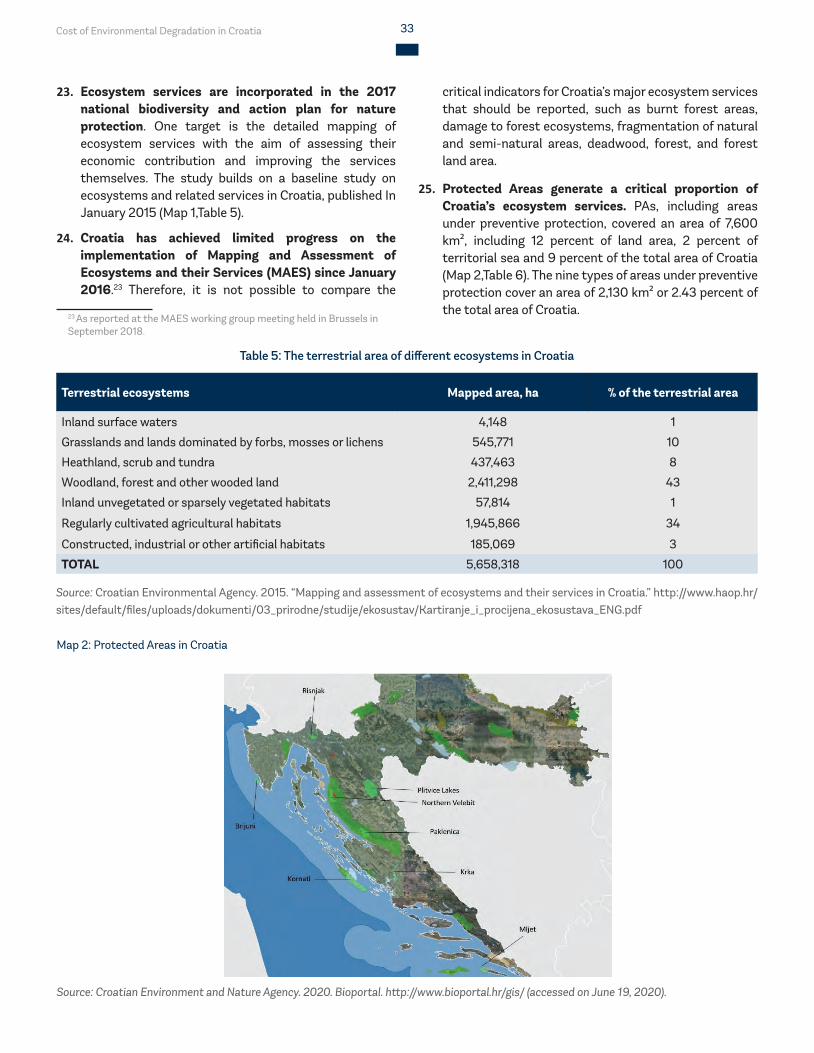
Cost of Environmental Degradation in Croatia 33
23. Ecosystem services are incorporated in the 2017 national biodiversity and action plan for nature protection. One target is the detailed mapping of ecosystem services with the aim of assessing their economic contribution and improving the services themselves. The study builds on a baseline study on ecosystems and related services in Croatia, published In January 2015 (Map 1,Table 5).
24. Croatia has achieved limited progress on the implementation of Mapping and Assessment of Ecosystems and their Services (MAES) since January 2016.23 Therefore, it is not possible to compare the
23 As reported at the MAES working group meeting held in Brussels in September 2018.
critical indicators for Croatia’s major ecosystem services that should be reported, such as burnt forest areas, damage to forest ecosystems, fragmentation of natural and semi-natural areas, deadwood, forest, and forest land area.
25. Protected Areas generate a critical proportion of Croatia’s ecosystem services. PAs, including areas under preventive protection, covered an area of 7,600 km², including 12 percent of land area, 2 percent of territorial sea and 9 percent of the total area of Croatia (Map 2,Table 6). The nine types of areas under preventive protection cover an area of 2,130 km² or 2.43 percent of the total area of Croatia.
Table 5: The terrestrial area of different ecosystems in Croatia
Terrestrial ecosystems Mapped area, ha % of the terrestrial area
Inland surface waters 4,148 1
Grasslands and lands dominated by forbs, mosses or lichens 545,771 10
Heathland, scrub and tundra 437,463 8
Woodland, forest and other wooded land 2,411,298 43
Inland unvegetated or sparsely vegetated habitats 57,814 1
Regularly cultivated agricultural habitats 1,945,866 34
Constructed, industrial or other artificial habitats 185,069 3
TOTAL 5,658,318 100
Source: Croatian Environmental Agency. 2015. “Mapping and assessment of ecosystems and their services in Croatia.” http://www.haop.hr/sites/default/files/uploads/dokumenti/03_prirodne/studije/ekosustav/Kartiranje_i_procijena_ekosustava_ENG.pdf
Map 2: Protected Areas in Croatia
Source: Croatian Environment and Nature Agency. 2020. Bioportal. http://www.bioportal.hr/gis/ (accessed on June 19, 2020).
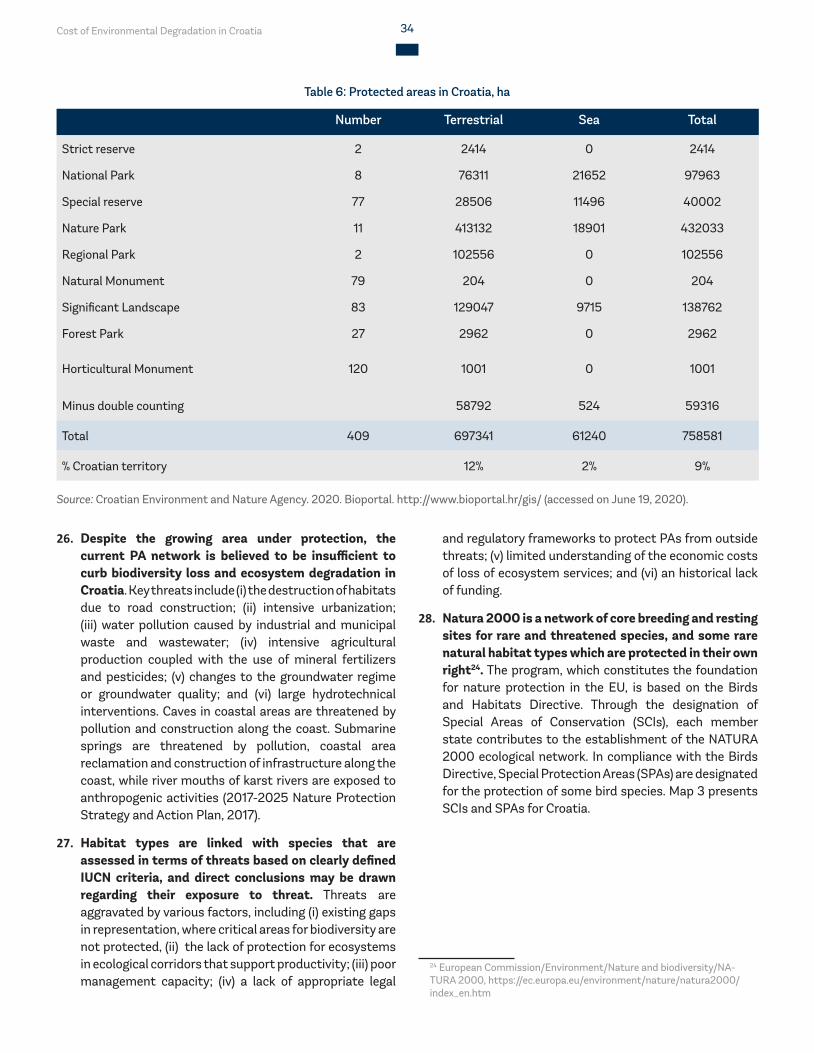
Cost of Environmental Degradation in Croatia 34
Table 6: Protected areas in Croatia, ha
Number Terrestrial Sea Total
Strict reserve 2 2414 0 2414
National Park 8 76311 21652 97963
Special reserve 77 28506 11496 40002
Nature Park 11 413132 18901 432033
Regional Park 2 102556 0 102556
Natural Monument 79 204 0 204
Significant Landscape 83 129047 9715 138762
Forest Park 27 2962 0 2962
Horticultural Monument 120 1001 0 1001
Minus double counting 58792 524 59316
Total 409 697341 61240 758581
% Croatian territory 12% 2% 9%
Source: Croatian Environment and Nature Agency. 2020. Bioportal. http://www.bioportal.hr/gis/ (accessed on June 19, 2020).
26. Despite the growing area under protection, the current PA network is believed to be insufficient to curb biodiversity loss and ecosystem degradation in Croatia. Key threats include (i) the destruction of habitats due to road construction; (ii) intensive urbanization; (iii) water pollution caused by industrial and municipal waste and wastewater; (iv) intensive agricultural production coupled with the use of mineral fertilizers and pesticides; (v) changes to the groundwater regime or groundwater quality; and (vi) large hydrotechnical interventions. Caves in coastal areas are threatened by pollution and construction along the coast. Submarine springs are threatened by pollution, coastal area reclamation and construction of infrastructure along the coast, while river mouths of karst rivers are exposed to anthropogenic activities (2017-2025 Nature Protection Strategy and Action Plan, 2017).
27. Habitat types are linked with species that are assessed in terms of threats based on clearly defined IUCN criteria, and direct conclusions may be drawn regarding their exposure to threat. Threats are aggravated by various factors, including (i) existing gaps in representation, where critical areas for biodiversity are not protected, (ii) the lack of protection for ecosystems in ecological corridors that support productivity; (iii) poor management capacity; (iv) a lack of appropriate legal
and regulatory frameworks to protect PAs from outside threats; (v) limited understanding of the economic costs of loss of ecosystem services; and (vi) an historical lack of funding.
28. Natura 2000 is a network of core breeding and resting sites for rare and threatened species, and some rare natural habitat types which are protected in their own right24. The program, which constitutes the foundation for nature protection in the EU, is based on the Birds and Habitats Directive. Through the designation of Special Areas of Conservation (SCIs), each member state contributes to the establishment of the NATURA 2000 ecological network. In compliance with the Birds Directive, Special Protection Areas (SPAs) are designated for the protection of some bird species. Map 3 presents SCIs and SPAs for Croatia.
24 European Commission/Environment/Nature and biodiversity/NA-TURA 2000, https://ec.europa.eu/environment/nature/natura2000/index_en.htm
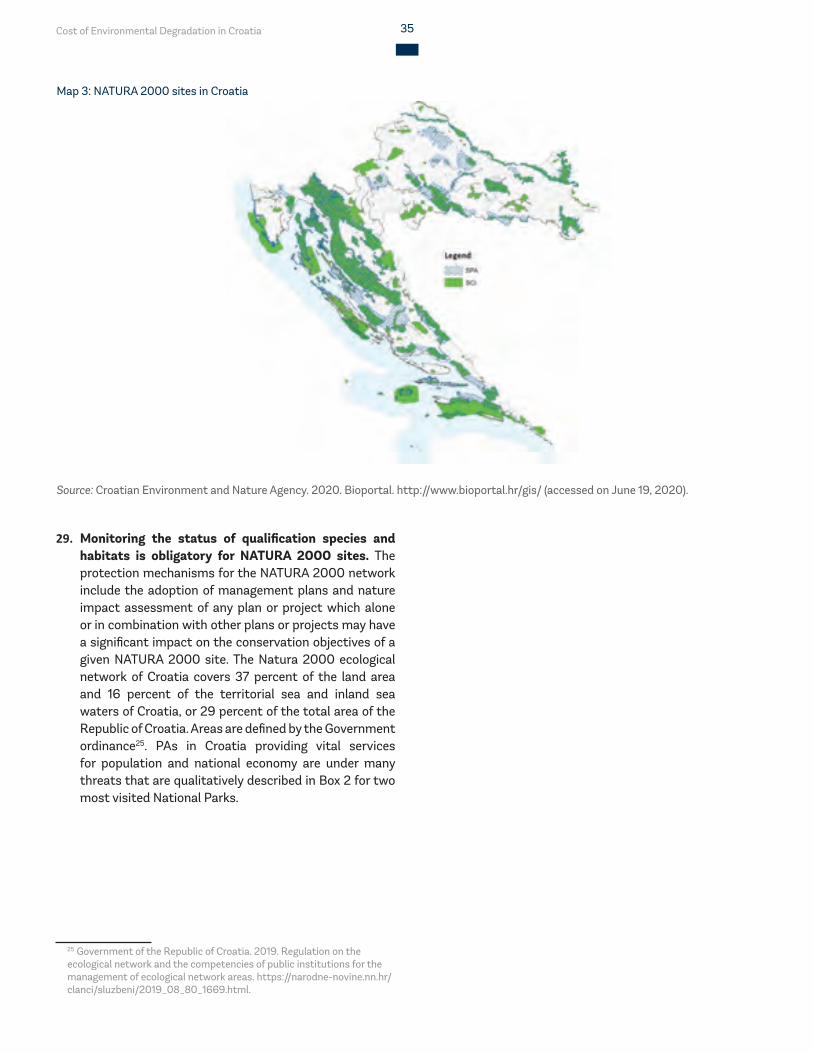
Cost of Environmental Degradation in Croatia 35
Map 3: NATURA 2000 sites in Croatia
Source: Croatian Environment and Nature Agency. 2020. Bioportal. http://www.bioportal.hr/gis/ (accessed on June 19, 2020).
29. Monitoring the status of qualification species and habitats is obligatory for NATURA 2000 sites. The protection mechanisms for the NATURA 2000 network include the adoption of management plans and nature impact assessment of any plan or project which alone or in combination with other plans or projects may have a significant impact on the conservation objectives of a given NATURA 2000 site. The Natura 2000 ecological network of Croatia covers 37 percent of the land area and 16 percent of the territorial sea and inland sea waters of Croatia, or 29 percent of the total area of the Republic of Croatia. Areas are defined by the Government ordinance25. PAs in Croatia providing vital services for population and national economy are under many threats that are qualitatively described in Box 2 for two most visited National Parks.
25 Government of the Republic of Croatia. 2019. Regulation on the ecological network and the competencies of public institutions for the management of ecological network areas. https://narodne-novine.nn.hr/clanci/sluzbeni/2019_08_80_1669.html.
Cost of Environmental Degradation in Croatia 36
Box 2: Threats to major inland national parks in Croatia
Plitvice Lakes National Park was founded in 1949 and is situated in the mountainous karst area of central Croatia. About 90 per-cent of the area is part of Lika-Senj County, while the remaining 10 percent is part of Karlovac County. The protected area extends over 297 km2. It is the most visited park in Croatia: 1.3 million people are estimated to visit Plitvice National Park annually, and since 2010, overnight stays in Plitvice have increased 12-fold to about 39,000. In addition to its status as a UNESCO World Heritage site, Plitvice National Park is also part of the Natura 2000 network of PAs, requiring the Croatian government to ensure legal protection of the site against destructive projects26.
The forests in the park are home to bears, wolves and many rare bird species27. However, the most important natural asset of Plit-vice Lakes National Park is its travertine dams – natural limestone barriers formed over thousands of years over which water flows, creating waterfalls and lakes. The natural travertine dams and lakes are particularly threatened by intense pressure of visitors in a very limited area, constituting only about 10 percent of the whole park. Excessive water use has left the park’s great waterfall running dry, with only 40 percent of its maximum water capacity currently available.
Recently, the Park and its ecosystems have been threatened by a rapid expansion of tourism facilities, including the construction of 35 new private apartments, bed and breakfasts and restaurants in the nearby area. In addition to posing a threat to the site’s sensitive hydrogeological system, growing tourism infrastructure and uncontrolled visitor numbers are affecting the visual integ-rity of the site. As visits increase, it is critical that the park adopts a sustainable management plan that balances the potential for growth with the need for greater environmental protection.
Krka National Park lies within Šibenik-Knin County and covers a total area of 109 km2, incorporating some sections of the Krka river, and the lower course of the Čikola river. It was formed to protect the Krka River and is used for scientific, cultural, education-al, recreational, and tourism activities. The area was proclaimed a national park in 1985 and includes the 72.5 km long submerged section of the Krka River, which alone is the 22nd longest river in Croatia. It springs in the foothills of the Dinara mountain range, 2.5 km northeast of Knin. With its seven travertine waterfalls and a total drop in altitude of 242 m, the Krka is a natural karst phe-nomenon. Krka National Park is the second most visited park in Croatia.
The Plitvice Lakes and Krka waterfalls face many anthropogenic threats, including
• A high number of visitor’s pressure lake areas;• Disturbance of the specialized habitats of some of the emblematic species like large carnivores;• Damages to travertine dams due to changes of chemical properties of water caused by pollution and increased level of
absorbed CO2 (acidification of water);• Erosion of travertine dams due to lowering of water table caused by climate change;• Modifications to natural system with excessive water drawn from lakes;• Natural eutrophication intensified by anthropogenic influence;• Encroachment of forests into meadows;• Pollution that damages aquatic ecosystems, that arises from inadequate treatment system of sewage water, organic
pollution of water from tourism infrastructure and nearby villages, and organic pollution of water from agricultural activ-ities); and
• Threats like littering, related to roads that pass through the parks.
26 WWF. 2017. “Croatia: Watershed moment for the Great Waterfall and Plitvice Lakes National Park.” https://mediterranean.panda.org/?uNews-ID=303394 (accessed June 19, 2020).27 IUCN World Heritage Outlook. 2017. Plitvice Lakes National Parks. https://worldheritageoutlook.iucn.org/explore-sites/wdpaid/2016 (accessed on June 19, 2020).
3.2 Annual cost of ecosystem services loss30. CoED due to ecosystem service degradation on a
national level is estimated with application of results of ecosystem service modeling generated by KIP INCA. KIP INCA is aimed at developing a set of experimental accounts at EU level, following the United Nations System of Environmental-Economic Accounting - Experimental Ecosystem Accounts (SEEA EEA). The application of the SEEA EEA framework is useful in illustrating ecosystem
accounts with clear examples, in further developing the methodology outlined in the United Nations Technical Recommendations, and in providing guidance for natural capital accounting.
31. To estimate annual CoED, the annual flow of the ecosystem service in question is compared for 2006 and 2012. In any country, if the flow reduces during the six-year period, the annual reduction in the ecosystem service flow constitutes CoED. For Croatia, such a
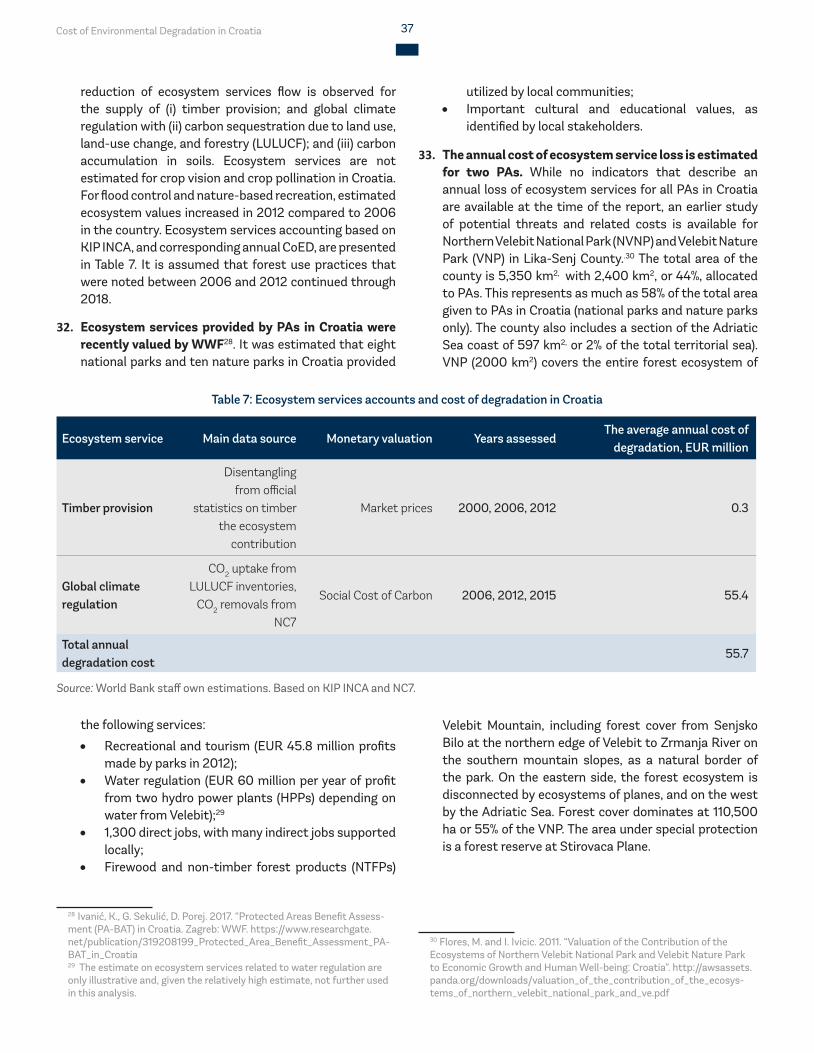
Cost of Environmental Degradation in Croatia 37
reduction of ecosystem services flow is observed for the supply of (i) timber provision; and global climate regulation with (ii) carbon sequestration due to land use, land-use change, and forestry (LULUCF); and (iii) carbon accumulation in soils. Ecosystem services are not estimated for crop vision and crop pollination in Croatia. For flood control and nature-based recreation, estimated ecosystem values increased in 2012 compared to 2006 in the country. Ecosystem services accounting based on KIP INCA, and corresponding annual CoED, are presented in Table 7. It is assumed that forest use practices that were noted between 2006 and 2012 continued through 2018.
32. Ecosystem services provided by PAs in Croatia were recently valued by WWF28. It was estimated that eight national parks and ten nature parks in Croatia provided
the following services:
• Recreational and tourism (EUR 45.8 million profits made by parks in 2012);
• Water regulation (EUR 60 million per year of profit from two hydro power plants (HPPs) depending on water from Velebit);29
• 1,300 direct jobs, with many indirect jobs supported locally;
• Firewood and non-timber forest products (NTFPs)
28 Ivanić, K., G. Sekulić, D. Porej. 2017. “Protected Areas Benefit Assess-ment (PA-BAT) in Croatia. Zagreb: WWF. https://www.researchgate.net/publication/319208199_Protected_Area_Benefit_Assessment_PA-BAT_in_Croatia29 The estimate on ecosystem services related to water regulation are only illustrative and, given the relatively high estimate, not further used in this analysis.
Table 7: Ecosystem services accounts and cost of degradation in Croatia
Ecosystem service Main data source Monetary valuation Years assessedThe average annual cost of
degradation, EUR million
Timber provision
Disentangling from official
statistics on timber the ecosystem
contribution
Market prices 2000, 2006, 2012 0.3
Global climate regulation
CO2 uptake from LULUCF inventories,
CO2 removals from NC7
Social Cost of Carbon 2006, 2012, 2015 55.4
Total annual degradation cost
55.7
Source: World Bank staff own estimations. Based on KIP INCA and NC7.
utilized by local communities;• Important cultural and educational values, as
identified by local stakeholders.
33. The annual cost of ecosystem service loss is estimated for two PAs. While no indicators that describe an annual loss of ecosystem services for all PAs in Croatia are available at the time of the report, an earlier study of potential threats and related costs is available for Northern Velebit National Park (NVNP) and Velebit Nature Park (VNP) in Lika-Senj County..30 The total area of the county is 5,350 km2, with 2,400 km2, or 44%, allocated to PAs. This represents as much as 58% of the total area given to PAs in Croatia (national parks and nature parks only). The county also includes a section of the Adriatic Sea coast of 597 km2, or 2% of the total territorial sea). VNP (2000 km2) covers the entire forest ecosystem of
Velebit Mountain, including forest cover from Senjsko Bilo at the northern edge of Velebit to Zrmanja River on the southern mountain slopes, as a natural border of the park. On the eastern side, the forest ecosystem is disconnected by ecosystems of planes, and on the west by the Adriatic Sea. Forest cover dominates at 110,500 ha or 55% of the VNP. The area under special protection is a forest reserve at Stirovaca Plane.
30 Flores, M. and I. Ivicic. 2011. “Valuation of the Contribution of the Ecosystems of Northern Velebit National Park and Velebit Nature Park to Economic Growth and Human Well-being: Croatia”. http://awsassets.panda.org/downloads/valuation_of_the_contribution_of_the_ecosys-tems_of_northern_velebit_national_park_and_ve.pdf
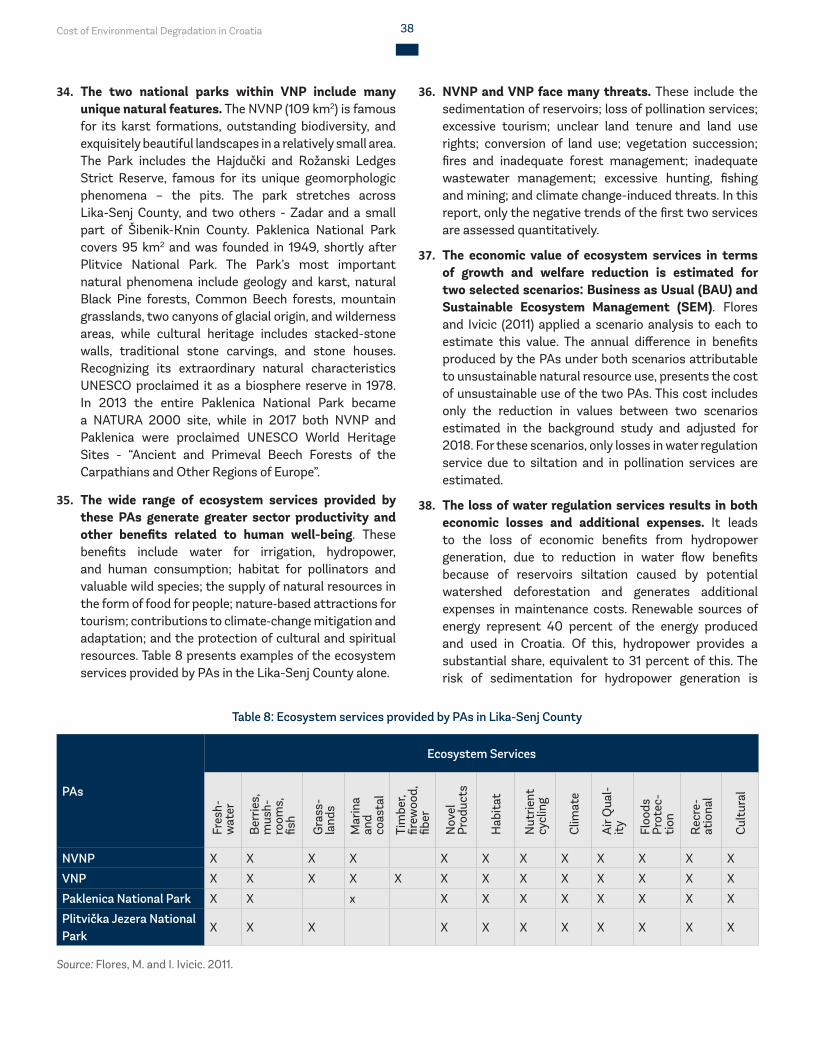
Cost of Environmental Degradation in Croatia 38
34. The two national parks within VNP include many unique natural features. The NVNP (109 km2) is famous for its karst formations, outstanding biodiversity, and exquisitely beautiful landscapes in a relatively small area. The Park includes the Hajdučki and Rožanski Ledges Strict Reserve, famous for its unique geomorphologic phenomena – the pits. The park stretches across Lika-Senj County, and two others - Zadar and a small part of Šibenik-Knin County. Paklenica National Park covers 95 km2 and was founded in 1949, shortly after Plitvice National Park. The Park’s most important natural phenomena include geology and karst, natural Black Pine forests, Common Beech forests, mountain grasslands, two canyons of glacial origin, and wilderness areas, while cultural heritage includes stacked-stone walls, traditional stone carvings, and stone houses. Recognizing its extraordinary natural characteristics UNESCO proclaimed it as a biosphere reserve in 1978. In 2013 the entire Paklenica National Park became a NATURA 2000 site, while in 2017 both NVNP and Paklenica were proclaimed UNESCO World Heritage Sites - “Ancient and Primeval Beech Forests of the Carpathians and Other Regions of Europe”.
35. The wide range of ecosystem services provided by these PAs generate greater sector productivity and other benefits related to human well-being. These benefits include water for irrigation, hydropower, and human consumption; habitat for pollinators and valuable wild species; the supply of natural resources in the form of food for people; nature‐based attractions for tourism; contributions to climate‐change mitigation and adaptation; and the protection of cultural and spiritual resources. Table 8 presents examples of the ecosystem services provided by PAs in the Lika-Senj County alone.
36. NVNP and VNP face many threats. These include the sedimentation of reservoirs; loss of pollination services; excessive tourism; unclear land tenure and land use rights; conversion of land use; vegetation succession; fires and inadequate forest management; inadequate wastewater management; excessive hunting, fishing and mining; and climate change-induced threats. In this report, only the negative trends of the first two services are assessed quantitatively.
37. The economic value of ecosystem services in terms of growth and welfare reduction is estimated for two selected scenarios: Business as Usual (BAU) and Sustainable Ecosystem Management (SEM). Flores and Ivicic (2011) applied a scenario analysis to each to estimate this value. The annual difference in benefits produced by the PAs under both scenarios attributable to unsustainable natural resource use, presents the cost of unsustainable use of the two PAs. This cost includes only the reduction in values between two scenarios estimated in the background study and adjusted for 2018. For these scenarios, only losses in water regulation service due to siltation and in pollination services are estimated.
38. The loss of water regulation services results in both economic losses and additional expenses. It leads to the loss of economic benefits from hydropower generation, due to reduction in water flow benefits because of reservoirs siltation caused by potential watershed deforestation and generates additional expenses in maintenance costs. Renewable sources of energy represent 40 percent of the energy produced and used in Croatia. Of this, hydropower provides a substantial share, equivalent to 31 percent of this. The risk of sedimentation for hydropower generation is
Table 8: Ecosystem services provided by PAs in Lika-Senj County
PAs
Ecosystem Services
Fres
h-w
ater
Ber
ries,
m
ush-
room
s,
fish
Gra
ss-
land
s
Mar
ina
and
coas
tal
Tim
ber,
firew
ood,
fib
er
Nov
el
Prod
ucts
Hab
itat
Nut
rient
cy
clin
g
Clim
ate
Air
Qua
l-it
y
Floo
ds
Prot
ec-
tion
Rec
re-
atio
nal
Cul
tura
l
NVNP X X X X X X X X X X X X
VNP X X X X X X X X X X X X X
Paklenica National Park X X x X X X X X X X X
Plitvička Jezera National Park
X X X X X X X X X X X
Source: Flores, M. and I. Ivicic. 2011.
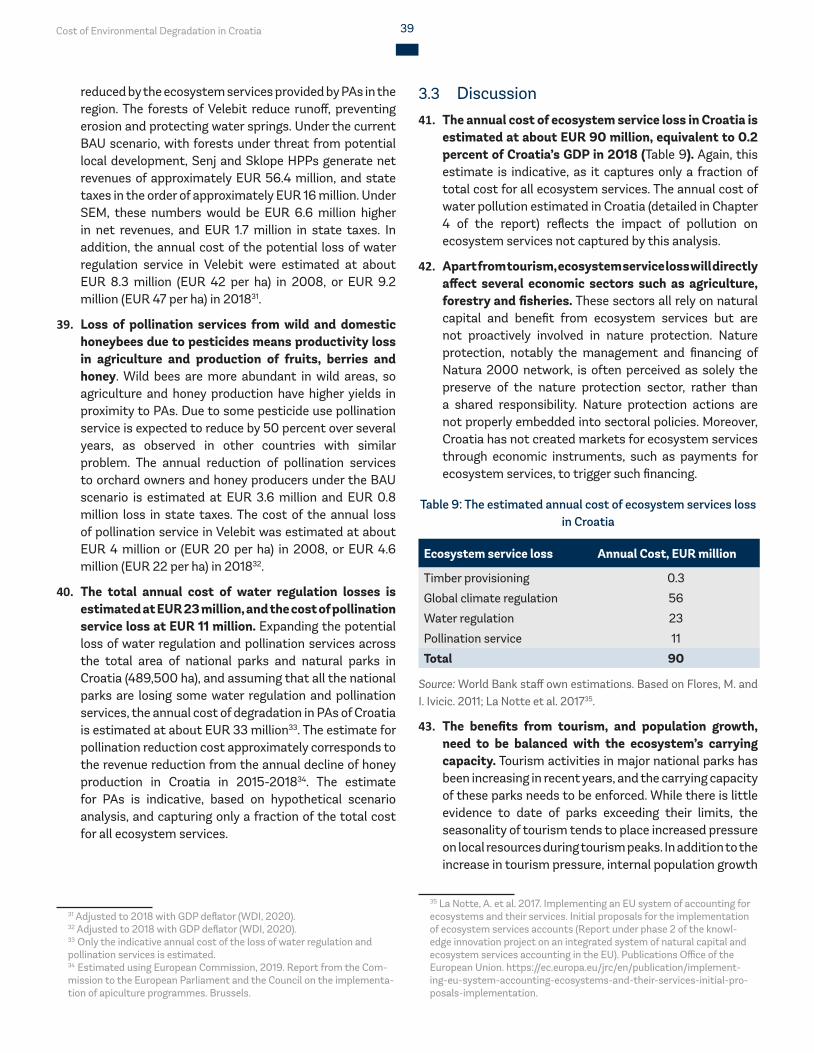
Cost of Environmental Degradation in Croatia 39
reduced by the ecosystem services provided by PAs in the region. The forests of Velebit reduce runoff, preventing erosion and protecting water springs. Under the current BAU scenario, with forests under threat from potential local development, Senj and Sklope HPPs generate net revenues of approximately EUR 56.4 million, and state taxes in the order of approximately EUR 16 million. Under SEM, these numbers would be EUR 6.6 million higher in net revenues, and EUR 1.7 million in state taxes. In addition, the annual cost of the potential loss of water regulation service in Velebit were estimated at about EUR 8.3 million (EUR 42 per ha) in 2008, or EUR 9.2 million (EUR 47 per ha) in 201831.
39. Loss of pollination services from wild and domestic honeybees due to pesticides means productivity loss in agriculture and production of fruits, berries and honey. Wild bees are more abundant in wild areas, so agriculture and honey production have higher yields in proximity to PAs. Due to some pesticide use pollination service is expected to reduce by 50 percent over several years, as observed in other countries with similar problem. The annual reduction of pollination services to orchard owners and honey producers under the BAU scenario is estimated at EUR 3.6 million and EUR 0.8 million loss in state taxes. The cost of the annual loss of pollination service in Velebit was estimated at about EUR 4 million or (EUR 20 per ha) in 2008, or EUR 4.6 million (EUR 22 per ha) in 201832.
40. The total annual cost of water regulation losses is estimated at EUR 23 million, and the cost of pollination service loss at EUR 11 million. Expanding the potential loss of water regulation and pollination services across the total area of national parks and natural parks in Croatia (489,500 ha), and assuming that all the national parks are losing some water regulation and pollination services, the annual cost of degradation in PAs of Croatia is estimated at about EUR 33 million33. The estimate for pollination reduction cost approximately corresponds to the revenue reduction from the annual decline of honey production in Croatia in 2015-201834. The estimate for PAs is indicative, based on hypothetical scenario analysis, and capturing only a fraction of the total cost for all ecosystem services.
31 Adjusted to 2018 with GDP deflator (WDI, 2020).32 Adjusted to 2018 with GDP deflator (WDI, 2020).33 Only the indicative annual cost of the loss of water regulation and pollination services is estimated.34 Estimated using European Commission, 2019. Report from the Com-mission to the European Parliament and the Council on the implementa-tion of apiculture programmes. Brussels.
3.3 Discussion41. The annual cost of ecosystem service loss in Croatia is
estimated at about EUR 90 million, equivalent to 0.2 percent of Croatia’s GDP in 2018 (Table 9). Again, this estimate is indicative, as it captures only a fraction of total cost for all ecosystem services. The annual cost of water pollution estimated in Croatia (detailed in Chapter 4 of the report) reflects the impact of pollution on ecosystem services not captured by this analysis.
42. Apart from tourism, ecosystem service loss will directly affect several economic sectors such as agriculture, forestry and fisheries. These sectors all rely on natural capital and benefit from ecosystem services but are not proactively involved in nature protection. Nature protection, notably the management and financing of Natura 2000 network, is often perceived as solely the preserve of the nature protection sector, rather than a shared responsibility. Nature protection actions are not properly embedded into sectoral policies. Moreover, Croatia has not created markets for ecosystem services through economic instruments, such as payments for ecosystem services, to trigger such financing.
Table 9: The estimated annual cost of ecosystem services loss in Croatia
Ecosystem service loss Annual Cost, EUR million
Timber provisioning 0.3
Global climate regulation 56
Water regulation 23
Pollination service 11
Total 90
Source: World Bank staff own estimations. Based on Flores, M. and I. Ivicic. 2011; La Notte et al. 201735.
43. The benefits from tourism, and population growth, need to be balanced with the ecosystem’s carrying capacity. Tourism activities in major national parks has been increasing in recent years, and the carrying capacity of these parks needs to be enforced. While there is little evidence to date of parks exceeding their limits, the seasonality of tourism tends to place increased pressure on local resources during tourism peaks. In addition to the increase in tourism pressure, internal population growth
35 La Notte, A. et al. 2017. Implementing an EU system of accounting for ecosystems and their services. Initial proposals for the implementation of ecosystem services accounts (Report under phase 2 of the knowl-edge innovation project on an integrated system of natural capital and ecosystem services accounting in the EU). Publications Office of the European Union. https://ec.europa.eu/jrc/en/publication/implement-ing-eu-system-accounting-ecosystems-and-their-services-initial-pro-posals-implementation.
Cost of Environmental Degradation in Croatia 40
and/or migration to areas that have greater economic benefits, like PAs, is placing additional pressure on local resources. Population growth is greater in districts with a higher concentration of PAs, and is positively correlated with lower poverty rates, suggesting that tourism in PAs may be driving these trends. While this may be the case, unmanaged population growth can result in pressure on the environment and landscapes outside of PAs.
44. Potential benefits from ecosystem services derived from the Natura 2000 network can be unlocked using economic instruments and innovative financial mechanisms. A range of benefits can be achieved by the effective restoration and protection of Croatia’s natural capital, especially under the Natura 2000 network. The Nature Protection Strategy and Action Plan requires the integration of nature protection-related objectives and activities into all sectors whose activities depend on or may have impacts – whether positive or negative - on biodiversity. However, the level of this integration is still not sufficient, including within key sectors such as agriculture, fisheries, forestry, hunting and water management.
Cost of Environmental Degradation in Croatia 41
WASTEWATERPhoto: Zagrebačke otpadne vode d.o.o. (ZOV)
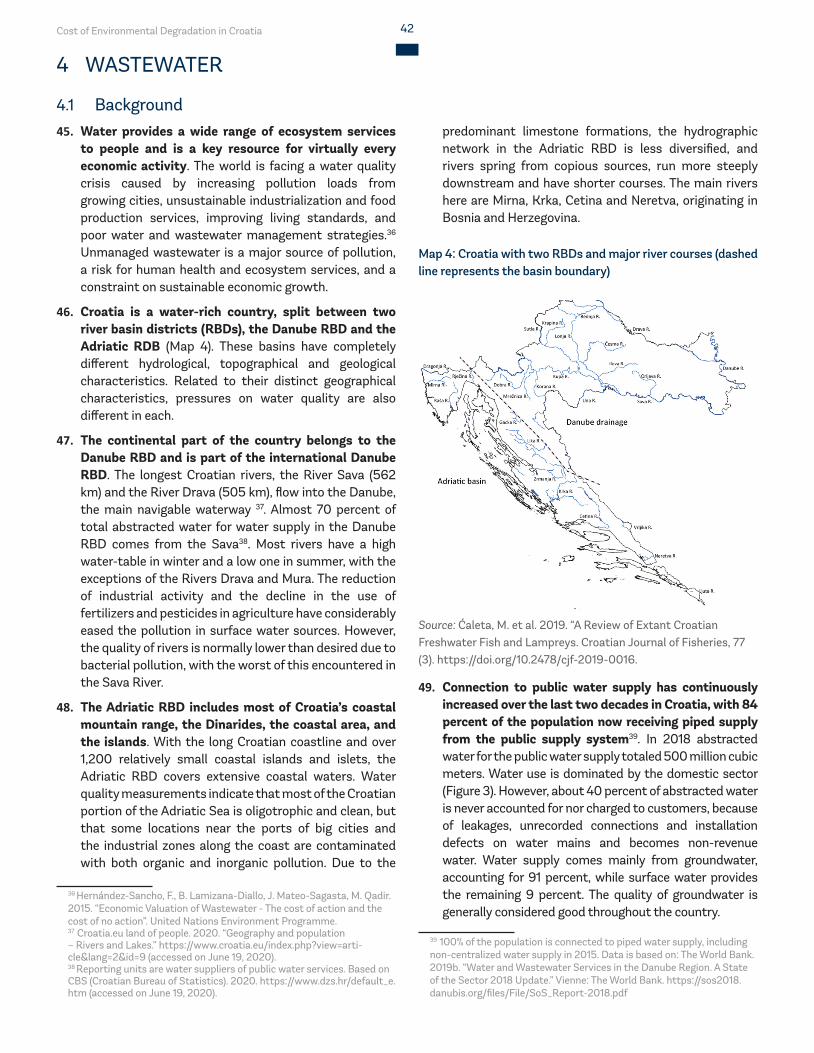
Cost of Environmental Degradation in Croatia 42
4 WASTEWATER
4.1 Background45. Water provides a wide range of ecosystem services
to people and is a key resource for virtually every economic activity. The world is facing a water quality crisis caused by increasing pollution loads from growing cities, unsustainable industrialization and food production services, improving living standards, and poor water and wastewater management strategies.36 Unmanaged wastewater is a major source of pollution, a risk for human health and ecosystem services, and a constraint on sustainable economic growth.
46. Croatia is a water-rich country, split between two river basin districts (RBDs), the Danube RBD and the Adriatic RDB (Map 4). These basins have completely different hydrological, topographical and geological characteristics. Related to their distinct geographical characteristics, pressures on water quality are also different in each.
47. The continental part of the country belongs to the Danube RBD and is part of the international Danube RBD. The longest Croatian rivers, the River Sava (562 km) and the River Drava (505 km), flow into the Danube, the main navigable waterway 37. Almost 70 percent of total abstracted water for water supply in the Danube RBD comes from the Sava38. Most rivers have a high water-table in winter and a low one in summer, with the exceptions of the Rivers Drava and Mura. The reduction of industrial activity and the decline in the use of fertilizers and pesticides in agriculture have considerably eased the pollution in surface water sources. However, the quality of rivers is normally lower than desired due to bacterial pollution, with the worst of this encountered in the Sava River.
48. The Adriatic RBD includes most of Croatia’s coastal mountain range, the Dinarides, the coastal area, and the islands. With the long Croatian coastline and over 1,200 relatively small coastal islands and islets, the Adriatic RBD covers extensive coastal waters. Water quality measurements indicate that most of the Croatian portion of the Adriatic Sea is oligotrophic and clean, but that some locations near the ports of big cities and the industrial zones along the coast are contaminated with both organic and inorganic pollution. Due to the
36 Hernández-Sancho, F., B. Lamizana-Diallo, J. Mateo-Sagasta, M. Qadir. 2015. “Economic Valuation of Wastewater - The cost of action and the cost of no action”. United Nations Environment Programme. 37 Croatia.eu land of people. 2020. “Geography and population – Rivers and Lakes.” https://www.croatia.eu/index.php?view=arti-cle&lang=2&id=9 (accessed on June 19, 2020).38 Reporting units are water suppliers of public water services. Based on CBS (Croatian Bureau of Statistics). 2020. https://www.dzs.hr/default_e.htm (accessed on June 19, 2020).
predominant limestone formations, the hydrographic network in the Adriatic RBD is less diversified, and rivers spring from copious sources, run more steeply downstream and have shorter courses. The main rivers here are Mirna, Krka, Cetina and Neretva, originating in Bosnia and Herzegovina.
Map 4: Croatia with two RBDs and major river courses (dashed line represents the basin boundary)
Source: Ćaleta, M. et al. 2019. “A Review of Extant Croatian Freshwater Fish and Lampreys. Croatian Journal of Fisheries, 77 (3). https://doi.org/10.2478/cjf-2019-0016.
49. Connection to public water supply has continuously increased over the last two decades in Croatia, with 84 percent of the population now receiving piped supply from the public supply system39. In 2018 abstracted water for the public water supply totaled 500 million cubic meters. Water use is dominated by the domestic sector (Figure 3). However, about 40 percent of abstracted water is never accounted for nor charged to customers, because of leakages, unrecorded connections and installation defects on water mains and becomes non-revenue water. Water supply comes mainly from groundwater, accounting for 91 percent, while surface water provides the remaining 9 percent. The quality of groundwater is generally considered good throughout the country.
39 100% of the population is connected to piped water supply, including non-centralized water supply in 2015. Data is based on: The World Bank. 2019b. “Water and Wastewater Services in the Danube Region. A State of the Sector 2018 Update.” Vienne: The World Bank. https://sos2018.danubis.org/files/File/SoS_Report-2018.pdf
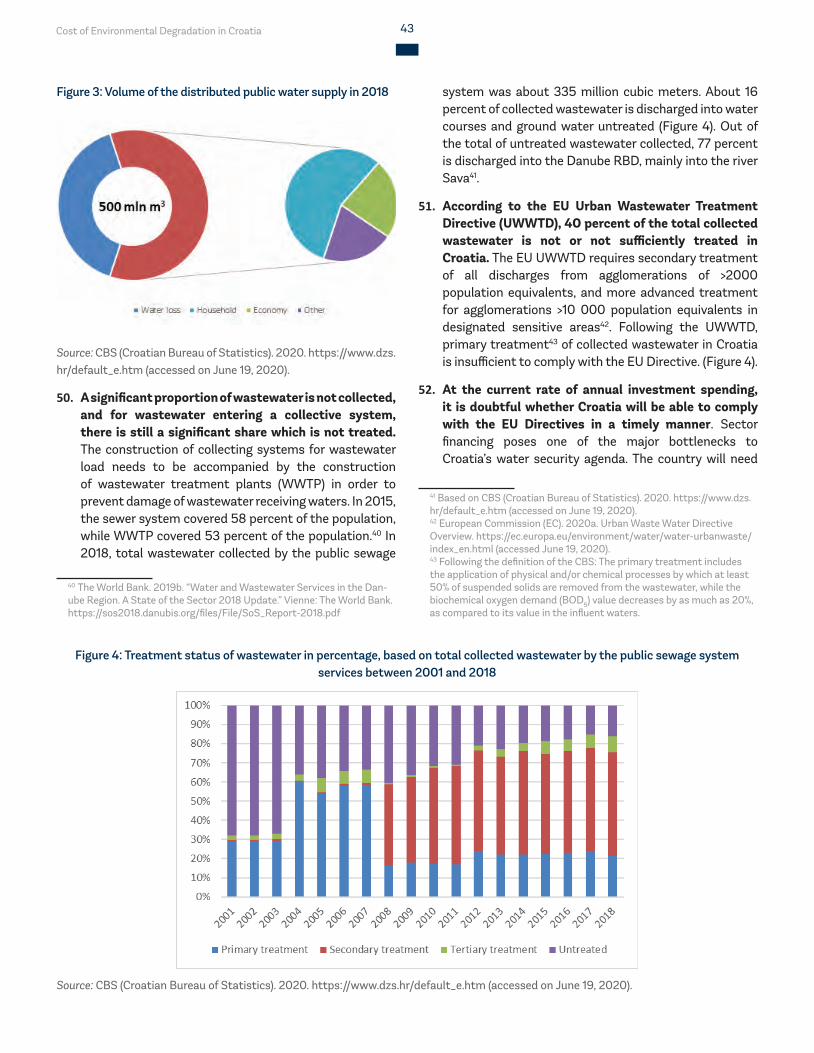
Cost of Environmental Degradation in Croatia 43
Figure 3: Volume of the distributed public water supply in 2018
Source: CBS (Croatian Bureau of Statistics). 2020. https://www.dzs.hr/default_e.htm (accessed on June 19, 2020).
50. A significant proportion of wastewater is not collected, and for wastewater entering a collective system, there is still a significant share which is not treated. The construction of collecting systems for wastewater load needs to be accompanied by the construction of wastewater treatment plants (WWTP) in order to prevent damage of wastewater receiving waters. In 2015, the sewer system covered 58 percent of the population, while WWTP covered 53 percent of the population.40 In 2018, total wastewater collected by the public sewage
40 The World Bank. 2019b. “Water and Wastewater Services in the Dan-ube Region. A State of the Sector 2018 Update.” Vienne: The World Bank. https://sos2018.danubis.org/files/File/SoS_Report-2018.pdf
system was about 335 million cubic meters. About 16 percent of collected wastewater is discharged into water courses and ground water untreated (Figure 4). Out of the total of untreated wastewater collected, 77 percent is discharged into the Danube RBD, mainly into the river Sava41.
51. According to the EU Urban Wastewater Treatment Directive (UWWTD), 40 percent of the total collected wastewater is not or not sufficiently treated in Croatia. The EU UWWTD requires secondary treatment of all discharges from agglomerations of >2000 population equivalents, and more advanced treatment for agglomerations >10 000 population equivalents in designated sensitive areas42. Following the UWWTD, primary treatment43 of collected wastewater in Croatia is insufficient to comply with the EU Directive. (Figure 4).
52. At the current rate of annual investment spending, it is doubtful whether Croatia will be able to comply with the EU Directives in a timely manner. Sector financing poses one of the major bottlenecks to Croatia’s water security agenda. The country will need
41 Based on CBS (Croatian Bureau of Statistics). 2020. https://www.dzs.hr/default_e.htm (accessed on June 19, 2020).42 European Commission (EC). 2020a. Urban Waste Water Directive Overview. https://ec.europa.eu/environment/water/water-urbanwaste/index_en.html (accessed June 19, 2020).43 Following the definition of the CBS: The primary treatment includes the application of physical and/or chemical processes by which at least 50% of suspended solids are removed from the wastewater, while the biochemical oxygen demand (BOD5) value decreases by as much as 20%, as compared to its value in the influent waters.
Figure 4: Treatment status of wastewater in percentage, based on total collected wastewater by the public sewage system services between 2001 and 2018
Source: CBS (Croatian Bureau of Statistics). 2020. https://www.dzs.hr/default_e.htm (accessed on June 19, 2020).
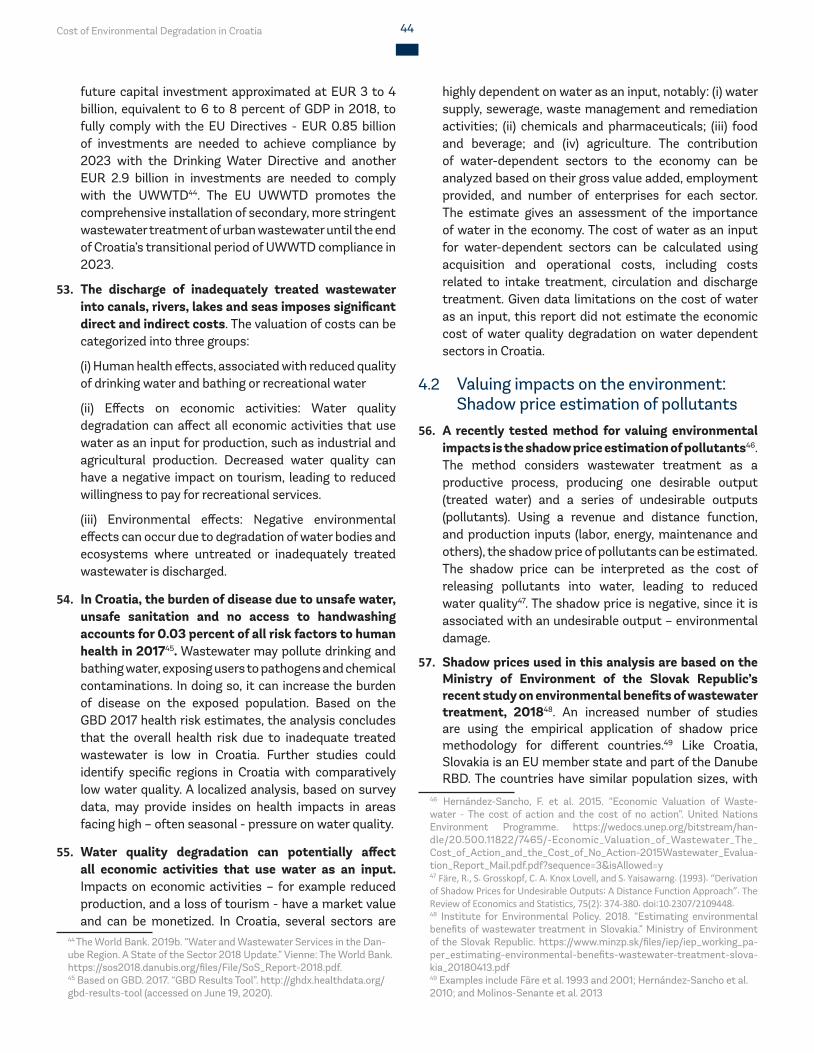
Cost of Environmental Degradation in Croatia 44
future capital investment approximated at EUR 3 to 4 billion, equivalent to 6 to 8 percent of GDP in 2018, to fully comply with the EU Directives - EUR 0.85 billion of investments are needed to achieve compliance by 2023 with the Drinking Water Directive and another EUR 2.9 billion in investments are needed to comply with the UWWTD44. The EU UWWTD promotes the comprehensive installation of secondary, more stringent wastewater treatment of urban wastewater until the end of Croatia’s transitional period of UWWTD compliance in 2023.
53. The discharge of inadequately treated wastewater into canals, rivers, lakes and seas imposes significant direct and indirect costs. The valuation of costs can be categorized into three groups:
(i) Human health effects, associated with reduced quality of drinking water and bathing or recreational water
(ii) Effects on economic activities: Water quality degradation can affect all economic activities that use water as an input for production, such as industrial and agricultural production. Decreased water quality can have a negative impact on tourism, leading to reduced willingness to pay for recreational services.
(iii) Environmental effects: Negative environmental effects can occur due to degradation of water bodies and ecosystems where untreated or inadequately treated wastewater is discharged.
54. In Croatia, the burden of disease due to unsafe water, unsafe sanitation and no access to handwashing accounts for 0.03 percent of all risk factors to human health in 201745. Wastewater may pollute drinking and bathing water, exposing users to pathogens and chemical contaminations. In doing so, it can increase the burden of disease on the exposed population. Based on the GBD 2017 health risk estimates, the analysis concludes that the overall health risk due to inadequate treated wastewater is low in Croatia. Further studies could identify specific regions in Croatia with comparatively low water quality. A localized analysis, based on survey data, may provide insides on health impacts in areas facing high – often seasonal - pressure on water quality.
55. Water quality degradation can potentially affect all economic activities that use water as an input. Impacts on economic activities – for example reduced production, and a loss of tourism - have a market value and can be monetized. In Croatia, several sectors are
44 The World Bank. 2019b. “Water and Wastewater Services in the Dan-ube Region. A State of the Sector 2018 Update.” Vienne: The World Bank. https://sos2018.danubis.org/files/File/SoS_Report-2018.pdf.45 Based on GBD. 2017. “GBD Results Tool”. http://ghdx.healthdata.org/gbd-results-tool (accessed on June 19, 2020).
highly dependent on water as an input, notably: (i) water supply, sewerage, waste management and remediation activities; (ii) chemicals and pharmaceuticals; (iii) food and beverage; and (iv) agriculture. The contribution of water-dependent sectors to the economy can be analyzed based on their gross value added, employment provided, and number of enterprises for each sector. The estimate gives an assessment of the importance of water in the economy. The cost of water as an input for water-dependent sectors can be calculated using acquisition and operational costs, including costs related to intake treatment, circulation and discharge treatment. Given data limitations on the cost of water as an input, this report did not estimate the economic cost of water quality degradation on water dependent sectors in Croatia.
4.2 Valuing impacts on the environment: Shadow price estimation of pollutants
56. A recently tested method for valuing environmental impacts is the shadow price estimation of pollutants46. The method considers wastewater treatment as a productive process, producing one desirable output (treated water) and a series of undesirable outputs (pollutants). Using a revenue and distance function, and production inputs (labor, energy, maintenance and others), the shadow price of pollutants can be estimated. The shadow price can be interpreted as the cost of releasing pollutants into water, leading to reduced water quality47. The shadow price is negative, since it is associated with an undesirable output – environmental damage.
57. Shadow prices used in this analysis are based on the Ministry of Environment of the Slovak Republic’s recent study on environmental benefits of wastewater treatment, 201848. An increased number of studies are using the empirical application of shadow price methodology for different countries.49 Like Croatia, Slovakia is an EU member state and part of the Danube RBD. The countries have similar population sizes, with
46 Hernández-Sancho, F. et al. 2015. “Economic Valuation of Waste-water - The cost of action and the cost of no action”. United Nations Environment Programme. https://wedocs.unep.org/bitstream/han-dle/20.500.11822/7465/-Economic_Valuation_of_Wastewater_The_Cost_of_Action_and_the_Cost_of_No_Action-2015Wastewater_Evalua-tion_Report_Mail.pdf.pdf?sequence=3&isAllowed=y47 Färe, R., S. Grosskopf, C. A. Knox Lovell, and S. Yaisawarng. (1993). “Derivation of Shadow Prices for Undesirable Outputs: A Distance Function Approach”. The Review of Economics and Statistics, 75(2): 374-380. doi:10.2307/2109448.48 Institute for Environmental Policy. 2018. “Estimating environmental benefits of wastewater treatment in Slovakia.” Ministry of Environment of the Slovak Republic. https://www.minzp.sk/files/iep/iep_working_pa-per_estimating-environmental-benefits-wastewater-treatment-slova-kia_20180413.pdf49 Examples include Färe et al. 1993 and 2001; Hernández-Sancho et al. 2010; and Molinos-Senante et al. 2013
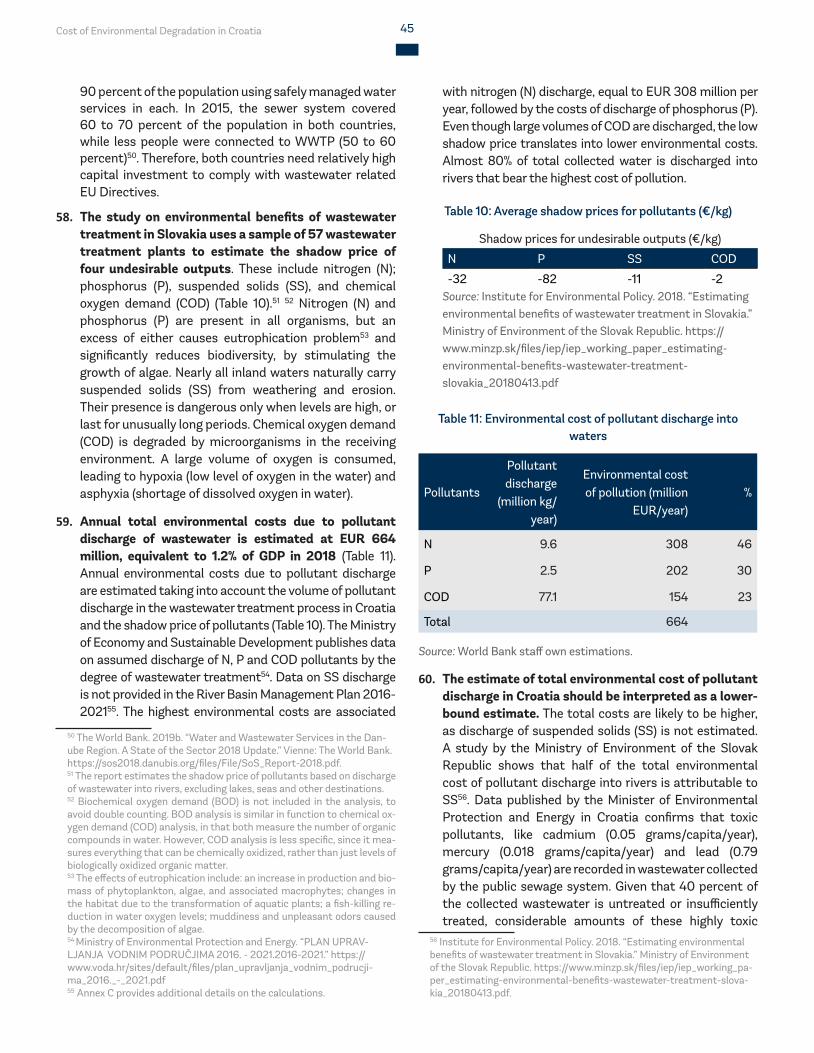
Cost of Environmental Degradation in Croatia 45
90 percent of the population using safely managed water services in each. In 2015, the sewer system covered 60 to 70 percent of the population in both countries, while less people were connected to WWTP (50 to 60 percent)50. Therefore, both countries need relatively high capital investment to comply with wastewater related EU Directives.
58. The study on environmental benefits of wastewater treatment in Slovakia uses a sample of 57 wastewater treatment plants to estimate the shadow price of four undesirable outputs. These include nitrogen (N); phosphorus (P), suspended solids (SS), and chemical oxygen demand (COD) (Table 10).51 52 Nitrogen (N) and phosphorus (P) are present in all organisms, but an excess of either causes eutrophication problem53 and significantly reduces biodiversity, by stimulating the growth of algae. Nearly all inland waters naturally carry suspended solids (SS) from weathering and erosion. Their presence is dangerous only when levels are high, or last for unusually long periods. Chemical oxygen demand (COD) is degraded by microorganisms in the receiving environment. A large volume of oxygen is consumed, leading to hypoxia (low level of oxygen in the water) and asphyxia (shortage of dissolved oxygen in water).
59. Annual total environmental costs due to pollutant discharge of wastewater is estimated at EUR 664 million, equivalent to 1.2% of GDP in 2018 (Table 11). Annual environmental costs due to pollutant discharge are estimated taking into account the volume of pollutant discharge in the wastewater treatment process in Croatia and the shadow price of pollutants (Table 10). The Ministry of Economy and Sustainable Development publishes data on assumed discharge of N, P and COD pollutants by the degree of wastewater treatment54. Data on SS discharge is not provided in the River Basin Management Plan 2016-202155. The highest environmental costs are associated
50 The World Bank. 2019b. “Water and Wastewater Services in the Dan-ube Region. A State of the Sector 2018 Update.” Vienne: The World Bank. https://sos2018.danubis.org/files/File/SoS_Report-2018.pdf.51 The report estimates the shadow price of pollutants based on discharge of wastewater into rivers, excluding lakes, seas and other destinations. 52 Biochemical oxygen demand (BOD) is not included in the analysis, to avoid double counting. BOD analysis is similar in function to chemical ox-ygen demand (COD) analysis, in that both measure the number of organic compounds in water. However, COD analysis is less specific, since it mea-sures everything that can be chemically oxidized, rather than just levels of biologically oxidized organic matter.53 The effects of eutrophication include: an increase in production and bio-mass of phytoplankton, algae, and associated macrophytes; changes in the habitat due to the transformation of aquatic plants; a fish-killing re-duction in water oxygen levels; muddiness and unpleasant odors caused by the decomposition of algae.54 Ministry of Environmental Protection and Energy. “PLAN UPRAV-LJANJA VODNIM PODRUČJIMA 2016. - 2021.2016-2021.” https://www.voda.hr/sites/default/files/plan_upravljanja_vodnim_podrucji-ma_2016._-_2021.pdf55 Annex C provides additional details on the calculations.
with nitrogen (N) discharge, equal to EUR 308 million per year, followed by the costs of discharge of phosphorus (P). Even though large volumes of COD are discharged, the low shadow price translates into lower environmental costs. Almost 80% of total collected water is discharged into rivers that bear the highest cost of pollution.
Table 10: Average shadow prices for pollutants (€/kg)
Shadow prices for undesirable outputs (€/kg)
N P SS COD
-32 -82 -11 -2 Source: Institute for Environmental Policy. 2018. “Estimating environmental benefits of wastewater treatment in Slovakia.” Ministry of Environment of the Slovak Republic. https://www.minzp.sk/files/iep/iep_working_paper_estimating-environmental-benefits-wastewater-treatment-slovakia_20180413.pdf
Table 11: Environmental cost of pollutant discharge into waters
Pollutants
Pollutant discharge
(million kg/year)
Environmental cost of pollution (million
EUR/year)%
N 9.6 308 46
P 2.5 202 30
COD 77.1 154 23
Total 664
Source: World Bank staff own estimations.
60. The estimate of total environmental cost of pollutant discharge in Croatia should be interpreted as a lower-bound estimate. The total costs are likely to be higher, as discharge of suspended solids (SS) is not estimated. A study by the Ministry of Environment of the Slovak Republic shows that half of the total environmental cost of pollutant discharge into rivers is attributable to SS56. Data published by the Minister of Environmental Protection and Energy in Croatia confirms that toxic pollutants, like cadmium (0.05 grams/capita/year), mercury (0.018 grams/capita/year) and lead (0.79 grams/capita/year) are recorded in wastewater collected by the public sewage system. Given that 40 percent of the collected wastewater is untreated or insufficiently treated, considerable amounts of these highly toxic
56 Institute for Environmental Policy. 2018. “Estimating environmental benefits of wastewater treatment in Slovakia.” Ministry of Environment of the Slovak Republic. https://www.minzp.sk/files/iep/iep_working_pa-per_estimating-environmental-benefits-wastewater-treatment-slova-kia_20180413.pdf.
Cost of Environmental Degradation in Croatia 46
pollutants are discharged into rivers, lakes, seas and other bodies of water. Exposure to toxic pollutants can have adverse effects on human health: exposure to cadmium compounds, for example, is associated with increased risk of lung cancer; exposure to lead can affect the development of the brain and nervous system, particularly dangerous for children; exposure to mercury may lead to neurological and behavioral disorders.
4.3 Valuing impacts on the environment: Floodplain ecosystem services
61. Aquatic ecosystems, including rivers, lakes, ground-water, coastal waters, and seas, support the delivery of crucial ecosystem services, such as habitat, water provisioning and recreation. Key ecosystem services are also connected to the hydrological cycle in the riv-er basin; these include water purification, water reten-tion, and climate regulation. Increasing damage to nat-ural ecosystems and loss of their functions has led to increased awareness of the benefits they provide. The monetary valuation of ecosystem services is crucial for informed and sustainable decision-making processes. The benefits of water-related ecosystem services need to be quantified to value both the benefits and the costs of sewage connections and WWTP investment. The first step in an economic assessment of clean water consists of identifying and valuing benefits provided by ecosys-tem services related to water. Due to limited time and data, analysis in this section uses existing values of eco-system services in Croatia. One study used, for example, estimates the value of floodplain ecosystem services in the Danube RBD of Croatia57. However, all ecosystem services must be considered for informed decision-mak-ing, to ensure the sustainable use and management of water resources.
62. This analysis uses the estimated monetary values of floodplain habitats to approach the evaluation of ecosystem services related to clean water in the Danube RBD in Croatia58. Floodplains are some of the most valuable ecosystems on Earth, providing many ecosystem services, including provision services like water supply; regulating services like water purification; and cultural services. Floodplain ecosystem services are complex and highly correlated -. regulating services
57 Pithart D. et al. 2014. “Study of Freshwater Ecosystem Services in Croatia”. Ministry of Environmental and Natural Protection. http://www.haop.hr/sites/default/files/uploads/dokumenti/03_prirodne/studije/ekosustav/Study_of_Freshwater_Ecosystem_Services_in_Croatia.pdf58 Values are converted from USD to Euro, based on the average ex-change rate between 2015 and 2019. https://www.ofx.com/en-us/forex-news/historical-exchange-rates/yearly-average-rates/
like water purification, for example, also increase and diversify habitat services. To prevent double counting of ecosystem services, this analysis focuses on habitat services of floodplains in the Danube RBD in Croatia. Due to their relatively well-preserved river and floodplain ecosystems, Croatian floodplains provide a unique set of habitat services.59
63. The total value of floodplain habitat services is calculated at EUR 6.1 billion per year in the Croatian Danube RBD.60 Compared with other ecosystems, the overall ecosystem services of floodplains expressed as monetary flow per hectare per year, are among the highest. For evaluation of floodplain habitats, Pithart et al. used the so-called Hesen method, reflecting the average cost of investments necessary for the revitalization of natural habitats. The study used the average cost of completed revitalization projects in the Czech Republic, a Central European country with landscapes and habitat types comparable to those of Northern Croatia. The most valuable habitats in Croatia are floodplain forests; the least valuable are intensively cultivated arable fields or urbanized rural areas. Pithart et al. estimated an average value of floodplain habitats in the Danube RBD in Croatia at EUR 16,600 per hectare.
64. The habitat value of the Danube RBD in Croatia is comparatively high as the floodplain includes hard floodplain forest, an alluvial forest of pedunculate oak and mixed oak-hornbeam. For the purposes of comparison, the average value of floodplain habitats in the Danube RBD is contrasted with the values arrived at in the meta-analysis of de Groot et al. (2012). The paper screened over 320 publications covering 300 case study locations to value the ecosystem services of 10 main biomes (e.g. open oceans, coral reeds, coastal wetlands, and inland wetlands). De Groot et al. estimated an average monetary value of inland wetland habitats, including floodplain habitats, of EUR 2,300 per hectare per year.61 The monetary value of EUR 16,600 per hectare of the Danube RBD in Croatia used in this report is comparatively high, and similar to the maximum monetary value for inland wetland habitats provided by de Groot et al. The reason for this high value is that the
59 The Drava, Sava and Danube rivers include some of the most threat-ened wetland habitats in Europe: alluvial forests, wet grasslands, gravel and sand bars, islands, steep banks, oxbow lakes, stagnant backwater, abandoned riverbeds and meanders. They are surrounded by riparian forests and arable land with scattered pastures, providing shelter for a significant number of species. 60 Based on estimates provided by Pithart et al. 2014.61 De Groot, R. et al. 2012. “Global estimates of the value of ecosystems and their services in monetary units.” Ecosystem Services: 1(1):50-61. https://doi.org/10.1016/j.ecoser.2012.07.005
Cost of Environmental Degradation in Croatia 47
alluvial forest in the Danube RBD provides the highest contribution to the value of floodplain habitats.
65. The value of floodplain ecosystem services per person equates to EUR 2,200 per year. Around 70 percent of the total population of Croatia lives in the Danube RBD. Dividing the total benefit of ecosystem services, equal to EUR 6.1 billion, by the Danube RBD population, the value of floodplain ecosystem services per person per year is calculated. Without adequate wastewater treatment, part of these annual environmental benefits will turn into costs over time.
66. Specific models of water pollution are needed to estimate the extent to which ecosystem benefits are reduced when untreated or insufficiently treated wastewater is discharged into freshwater sources. By using a coefficient for ecosystem service reduction, it is possible to approximate the annual loss of ecosystem services due to discharge of untreated wastewater in Croatia. The next step would be to compare the avoided costs of ecosystem service loss obtained from the treatment of wastewater with the costs of such treatment to guide informed decision-making, to the extent that remedial actions are justifiable from an economic point of view.
67. Due to missing estimates of ecosystem service reduction caused by untreated wastewater discharge in Croatia, this report undertakes a hypothetical analysis62. The analysis estimates the so-called break-even point, defined as a point where total costs per person to comply with the UWWTD equal the total avoided costs of ecosystem service degradation. That is, the break-even point shows the annual rate of degradation to validate investment in wastewater management infrastructure. If the rate were lower than the break-even point, Croatia would experience an economic loss; any rate above the break-even would translate into an economic gain that could be achieved by investing in wastewater infrastructure.
68. The World Bank estimated a total investment costs of EUR 2.9 billion to achieve compliance with the UWWTD till 2023.63 Wastewater networks and WWTPs are reliant on equipment that is subject to heavy wear and tear and needs to be maintained and refurbished periodically to stay operational. In Croatia, operational water supply costs of 1.4 EUR/m3 are covered by revenue of average tariffs for water and sanitation services at
62 Assumptions made for the hypothetical analysis are listed in Annex D.63 (reference year is 2015; see 4.1 Background)
1.8 EUR/m3.64 Assuming coverage of operational and maintenance costs by consumer tariffs, Croatia will need to invest EUR 700 per person between 2015 and 2023 to achieve compliance with UWWTD.
69. The annual break-even degradation rate of floodplain ecosystem services is estimated at 1.3 percent in the Danube RBD, assuming a time frame of 30 years (Annex D). The calculation assumes investment costs of EUR 700 per capita over eight years from 2015 to 2023, and an annual floodplain ecosystem service value of EUR 2,200 per capita (total value of floodplain habitat services of EUR 6.1 billion divided by the total population of the Danube RBD). An annual environmental degradation of 1.3 percent due to wastewater discharge would equalize the investment and benefits of preserving floodplain ecosystem services. The hypothetical analysis, although based on various assumptions and imprecise data, justifies investment for sewage networks and WWTPs in Croatia, assuming that without collection and adequate treatment of wastewater, the environment in the Danube RBD would degrade at 1.3 percent per year.
4.4 Discussion70. Informed decision making must consider both the
economic costs of investment in wastewater man-agement and the economic benefits or avoided costs derived from good water quality and water bodies. In 2018, Croatia finished transposing the requirements of the UWWTD into its national legal framework.
71. On the cost side, capital investment to build up needed infrastructure for wastewater treatment to comply with the UWWTD is estimated at EUR 2.9 billion. Operation and maintenance costs of wastewater collection and treatment system are assumed to be covered by tariffs charged to consumers. Periodic reinvestment is needed to sustain the functionality of the sanitation infrastructure. Total reinvestment after full compliance with the UWWTD and until 2040 is approximated at EUR 1.8 billion.65
72. On the benefit side, health, environmental and eco-nomic benefits must be considered. This analysis de-
64 The World Bank. 2019b. “Water and Wastewater Services in the Dan-ube Region. A State of the Sector 2018 Update.” Vienne: The World Bank. https://sos2018.danubis.org/files/File/SoS_Report-2018.pdf.65 The World Bank. 2019b. “Water and Wastewater Services in the Dan-ube Region. A State of the Sector 2018 Update.” Vienne: The World Bank. https://sos2018.danubis.org/files/File/SoS_Report-2018.pdf.

Cost of Environmental Degradation in Croatia 48
scribes and, where possible, attempts to estimate the benefits or avoided losses of clean water in Croatia. While health impacts are low, annual environmental costs due to the undesirable output of pollutant discharge of wastewater are estimated at EUR 664 million. Focusing on the Danube RBD, the benefit of habitat services relat-ed to floodplains is estimated at EUR 6.1 billion per year. The continuous release of pollutants into rivers leads to the slow degradation of these valuable ecosystem services, and the revitalization of these services is very costly. Assuming a degradation rate of 1.3 percent of the floodplain ecosystems, within 30 years, economic costs of the UWWTD would be equal to the avoided costs of degradation of ecosystems.
Cost of Environmental Degradation in Croatia 49
SOLID WASTEPhoto: Henry Kravchenko
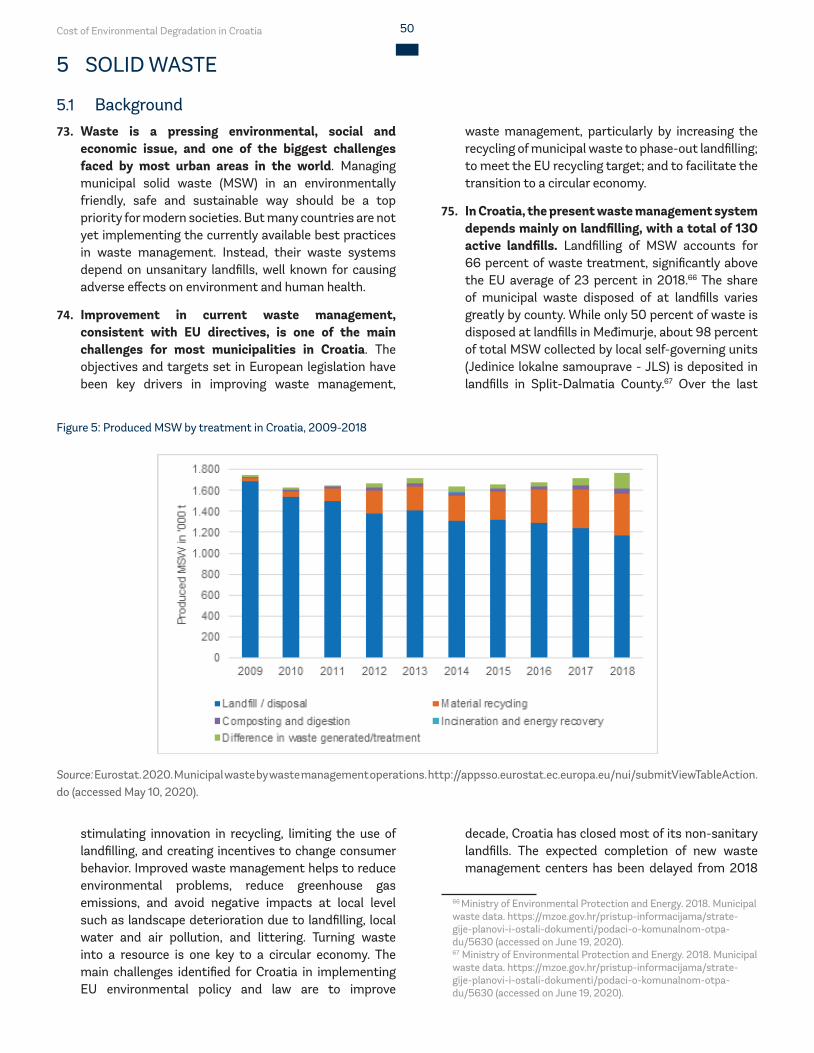
Cost of Environmental Degradation in Croatia 50
5 SOLID WASTE
5.1 Background73. Waste is a pressing environmental, social and
economic issue, and one of the biggest challenges faced by most urban areas in the world. Managing municipal solid waste (MSW) in an environmentally friendly, safe and sustainable way should be a top priority for modern societies. But many countries are not yet implementing the currently available best practices in waste management. Instead, their waste systems depend on unsanitary landfills, well known for causing adverse effects on environment and human health.
74. Improvement in current waste management, consistent with EU directives, is one of the main challenges for most municipalities in Croatia. The objectives and targets set in European legislation have been key drivers in improving waste management,
stimulating innovation in recycling, limiting the use of landfilling, and creating incentives to change consumer behavior. Improved waste management helps to reduce environmental problems, reduce greenhouse gas emissions, and avoid negative impacts at local level such as landscape deterioration due to landfilling, local water and air pollution, and littering. Turning waste into a resource is one key to a circular economy. The main challenges identified for Croatia in implementing EU environmental policy and law are to improve
waste management, particularly by increasing the recycling of municipal waste to phase-out landfilling; to meet the EU recycling target; and to facilitate the transition to a circular economy.
75. In Croatia, the present waste management system depends mainly on landfilling, with a total of 130 active landfills. Landfilling of MSW accounts for 66 percent of waste treatment, significantly above the EU average of 23 percent in 2018.66 The share of municipal waste disposed of at landfills varies greatly by county. While only 50 percent of waste is disposed at landfills in Međimurje, about 98 percent of total MSW collected by local self-governing units (Jedinice lokalne samouprave - JLS) is deposited in landfills in Split-Dalmatia County.67 Over the last
decade, Croatia has closed most of its non-sanitary landfills. The expected completion of new waste management centers has been delayed from 2018
66 Ministry of Environmental Protection and Energy. 2018. Municipal waste data. https://mzoe.gov.hr/pristup-informacijama/strate-gije-planovi-i-ostali-dokumenti/podaci-o-komunalnom-otpa-du/5630 (accessed on June 19, 2020).67 Ministry of Environmental Protection and Energy. 2018. Municipal waste data. https://mzoe.gov.hr/pristup-informacijama/strate-gije-planovi-i-ostali-dokumenti/podaci-o-komunalnom-otpa-du/5630 (accessed on June 19, 2020).
Figure 5: Produced MSW by treatment in Croatia, 2009-2018
Source: Eurostat. 2020. Municipal waste by waste management operations. http://appsso.eurostat.ec.europa.eu/nui/submitViewTableAction.do (accessed May 10, 2020).
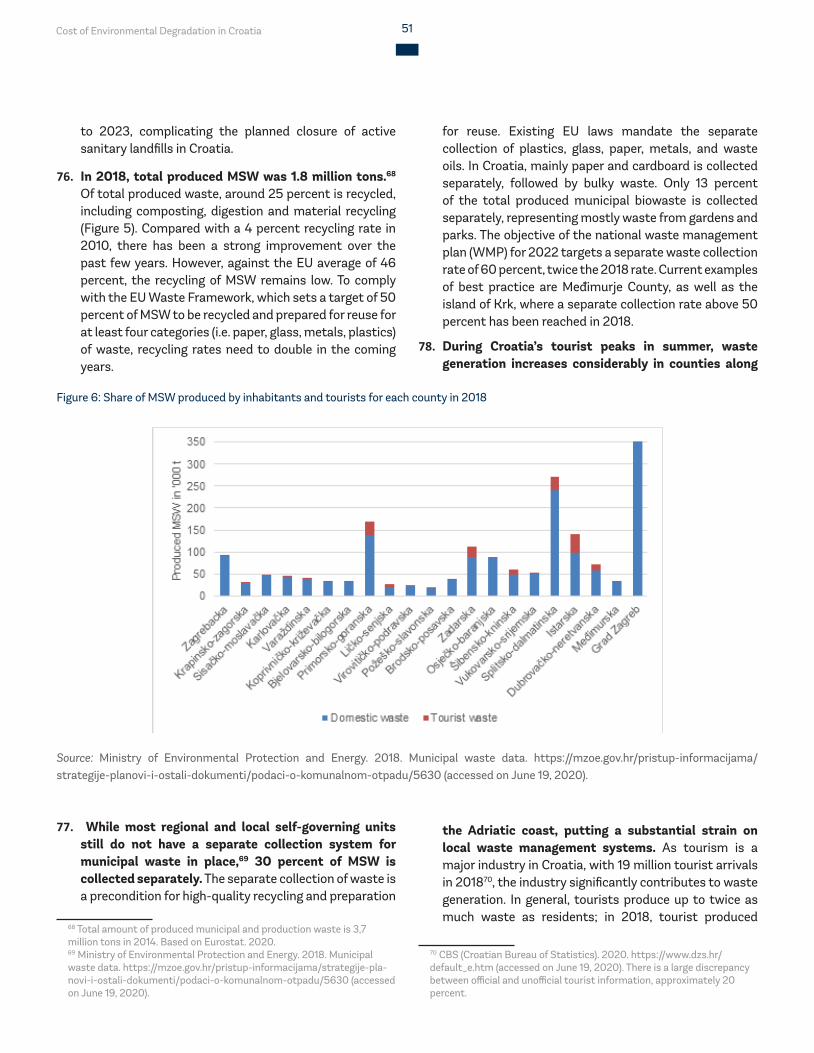
Cost of Environmental Degradation in Croatia 51
to 2023, complicating the planned closure of active sanitary landfills in Croatia.
76. In 2018, total produced MSW was 1.8 million tons.68 Of total produced waste, around 25 percent is recycled, including composting, digestion and material recycling (Figure 5). Compared with a 4 percent recycling rate in 2010, there has been a strong improvement over the past few years. However, against the EU average of 46 percent, the recycling of MSW remains low. To comply with the EU Waste Framework, which sets a target of 50 percent of MSW to be recycled and prepared for reuse for at least four categories (i.e. paper, glass, metals, plastics) of waste, recycling rates need to double in the coming years.
77. While most regional and local self-governing units still do not have a separate collection system for municipal waste in place,69 30 percent of MSW is collected separately. The separate collection of waste is a precondition for high-quality recycling and preparation
68 Total amount of produced municipal and production waste is 3,7 million tons in 2014. Based on Eurostat. 2020.69 Ministry of Environmental Protection and Energy. 2018. Municipal waste data. https://mzoe.gov.hr/pristup-informacijama/strategije-pla-novi-i-ostali-dokumenti/podaci-o-komunalnom-otpadu/5630 (accessed on June 19, 2020).
for reuse. Existing EU laws mandate the separate collection of plastics, glass, paper, metals, and waste oils. In Croatia, mainly paper and cardboard is collected separately, followed by bulky waste. Only 13 percent of the total produced municipal biowaste is collected separately, representing mostly waste from gardens and parks. The objective of the national waste management plan (WMP) for 2022 targets a separate waste collection rate of 60 percent, twice the 2018 rate. Current examples of best practice are Međimurje County, as well as the island of Krk, where a separate collection rate above 50 percent has been reached in 2018.
78. During Croatia’s tourist peaks in summer, waste generation increases considerably in counties along
the Adriatic coast, putting a substantial strain on local waste management systems. As tourism is a major industry in Croatia, with 19 million tourist arrivals in 201870, the industry significantly contributes to waste generation. In general, tourists produce up to twice as much waste as residents; in 2018, tourist produced
70 CBS (Croatian Bureau of Statistics). 2020. https://www.dzs.hr/default_e.htm (accessed on June 19, 2020). There is a large discrepancy between official and unofficial tourist information, approximately 20 percent.
Figure 6: Share of MSW produced by inhabitants and tourists for each county in 2018
Source: Ministry of Environmental Protection and Energy. 2018. Municipal waste data. https://mzoe.gov.hr/pristup-informacijama/strategije-planovi-i-ostali-dokumenti/podaci-o-komunalnom-otpadu/5630 (accessed on June 19, 2020).
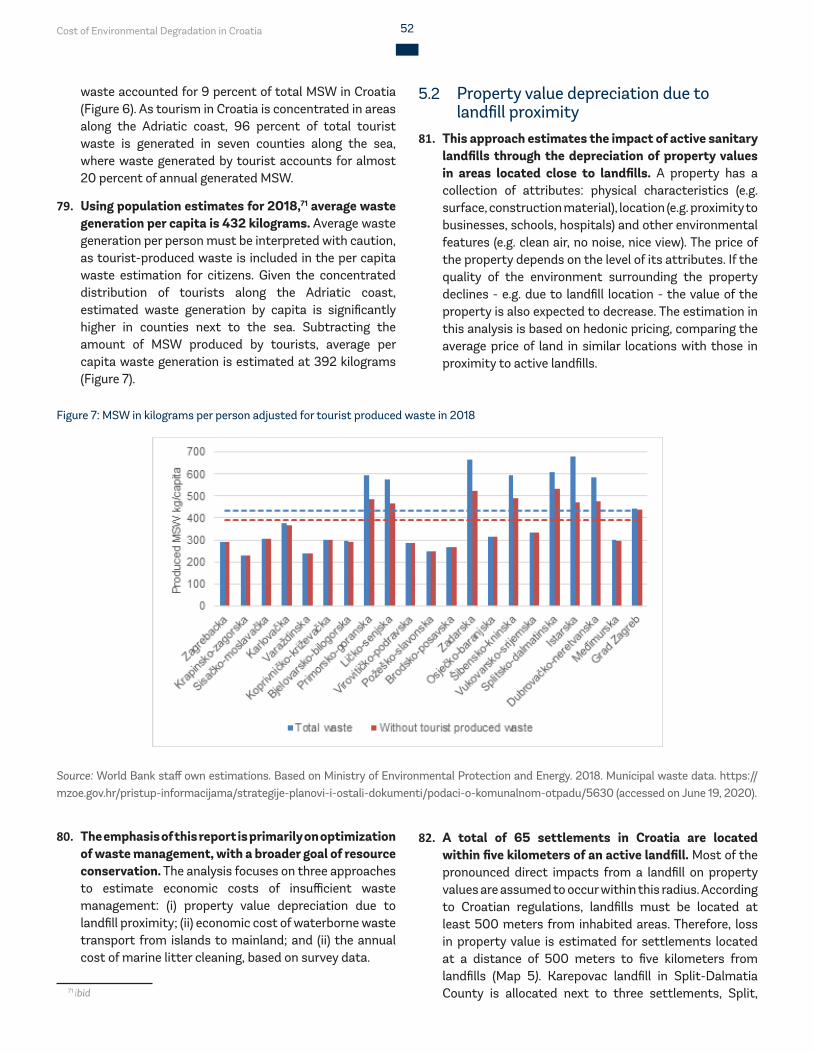
Cost of Environmental Degradation in Croatia 52
waste accounted for 9 percent of total MSW in Croatia (Figure 6). As tourism in Croatia is concentrated in areas along the Adriatic coast, 96 percent of total tourist waste is generated in seven counties along the sea, where waste generated by tourist accounts for almost 20 percent of annual generated MSW.
79. Using population estimates for 2018,71 average waste generation per capita is 432 kilograms. Average waste generation per person must be interpreted with caution, as tourist-produced waste is included in the per capita waste estimation for citizens. Given the concentrated distribution of tourists along the Adriatic coast, estimated waste generation by capita is significantly higher in counties next to the sea. Subtracting the amount of MSW produced by tourists, average per capita waste generation is estimated at 392 kilograms (Figure 7).
80. The emphasis of this report is primarily on optimization of waste management, with a broader goal of resource conservation. The analysis focuses on three approaches to estimate economic costs of insufficient waste management: (i) property value depreciation due to landfill proximity; (ii) economic cost of waterborne waste transport from islands to mainland; and (ii) the annual cost of marine litter cleaning, based on survey data.
71 ibid
Figure 7: MSW in kilograms per person adjusted for tourist produced waste in 2018
Source: World Bank staff own estimations. Based on Ministry of Environmental Protection and Energy. 2018. Municipal waste data. https://mzoe.gov.hr/pristup-informacijama/strategije-planovi-i-ostali-dokumenti/podaci-o-komunalnom-otpadu/5630 (accessed on June 19, 2020).
5.2 Property value depreciation due to landfill proximity
81. This approach estimates the impact of active sanitary landfills through the depreciation of property values in areas located close to landfills. A property has a collection of attributes: physical characteristics (e.g. surface, construction material), location (e.g. proximity to businesses, schools, hospitals) and other environmental features (e.g. clean air, no noise, nice view). The price of the property depends on the level of its attributes. If the quality of the environment surrounding the property declines - e.g. due to landfill location - the value of the property is also expected to decrease. The estimation in this analysis is based on hedonic pricing, comparing the average price of land in similar locations with those in proximity to active landfills.
82. A total of 65 settlements in Croatia are located within five kilometers of an active landfill. Most of the pronounced direct impacts from a landfill on property values are assumed to occur within this radius. According to Croatian regulations, landfills must be located at least 500 meters from inhabited areas. Therefore, loss in property value is estimated for settlements located at a distance of 500 meters to five kilometers from landfills (Map 5). Karepovac landfill in Split-Dalmatia County is allocated next to three settlements, Split,
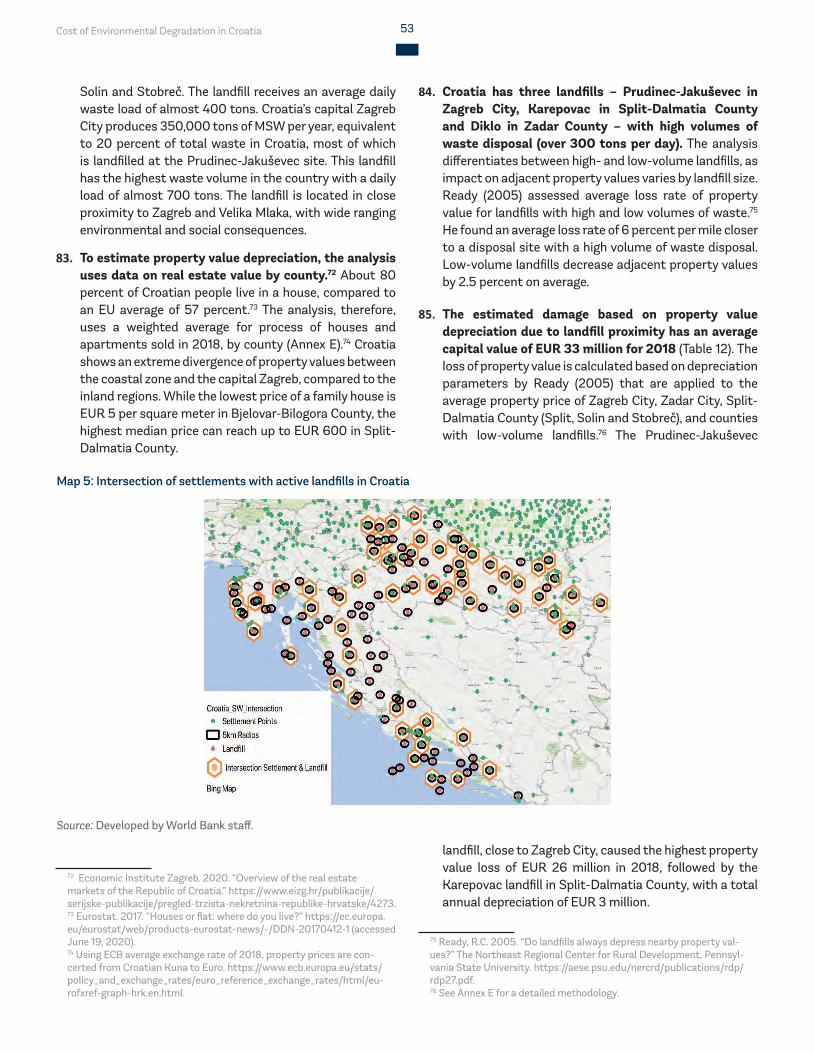
Cost of Environmental Degradation in Croatia 53
Solin and Stobreč. The landfill receives an average daily waste load of almost 400 tons. Croatia’s capital Zagreb City produces 350,000 tons of MSW per year, equivalent to 20 percent of total waste in Croatia, most of which is landfilled at the Prudinec-Jakuševec site. This landfill has the highest waste volume in the country with a daily load of almost 700 tons. The landfill is located in close proximity to Zagreb and Velika Mlaka, with wide ranging environmental and social consequences.
83. To estimate property value depreciation, the analysis uses data on real estate value by county.72 About 80 percent of Croatian people live in a house, compared to an EU average of 57 percent.73 The analysis, therefore, uses a weighted average for process of houses and apartments sold in 2018, by county (Annex E).74 Croatia shows an extreme divergence of property values between the coastal zone and the capital Zagreb, compared to the inland regions. While the lowest price of a family house is EUR 5 per square meter in Bjelovar-Bilogora County, the highest median price can reach up to EUR 600 in Split-Dalmatia County.
72 Economic Institute Zagreb. 2020. “Overview of the real estate markets of the Republic of Croatia.” https://www.eizg.hr/publikacije/serijske-publikacije/pregled-trzista-nekretnina-republike-hrvatske/4273.73 Eurostat. 2017. “Houses or flat: where do you live?” https://ec.europa.eu/eurostat/web/products-eurostat-news/-/DDN-20170412-1 (accessed June 19, 2020).74 Using ECB average exchange rate of 2018, property prices are con-certed from Croatian Kuna to Euro. https://www.ecb.europa.eu/stats/policy_and_exchange_rates/euro_reference_exchange_rates/html/eu-rofxref-graph-hrk.en.html.
84. Croatia has three landfills – Prudinec-Jakuševec in Zagreb City, Karepovac in Split-Dalmatia County and Diklo in Zadar County – with high volumes of waste disposal (over 300 tons per day). The analysis differentiates between high- and low-volume landfills, as impact on adjacent property values varies by landfill size. Ready (2005) assessed average loss rate of property value for landfills with high and low volumes of waste.75 He found an average loss rate of 6 percent per mile closer to a disposal site with a high volume of waste disposal. Low-volume landfills decrease adjacent property values by 2.5 percent on average.
85. The estimated damage based on property value depreciation due to landfill proximity has an average capital value of EUR 33 million for 2018 (Table 12). The loss of property value is calculated based on depreciation parameters by Ready (2005) that are applied to the average property price of Zagreb City, Zadar City, Split-Dalmatia County (Split, Solin and Stobreč), and counties with low-volume landfills.76 The Prudinec-Jakuševec
landfill, close to Zagreb City, caused the highest property value loss of EUR 26 million in 2018, followed by the Karepovac landfill in Split-Dalmatia County, with a total annual depreciation of EUR 3 million.
75 Ready, R.C. 2005. “Do landfills always depress nearby property val-ues?” The Northeast Regional Center for Rural Development, Pennsyl-vania State University. https://aese.psu.edu/nercrd/publications/rdp/rdp27.pdf.76 See Annex E for a detailed methodology.
Map 5: Intersection of settlements with active landfills in Croatia
Source: Developed by World Bank staff.
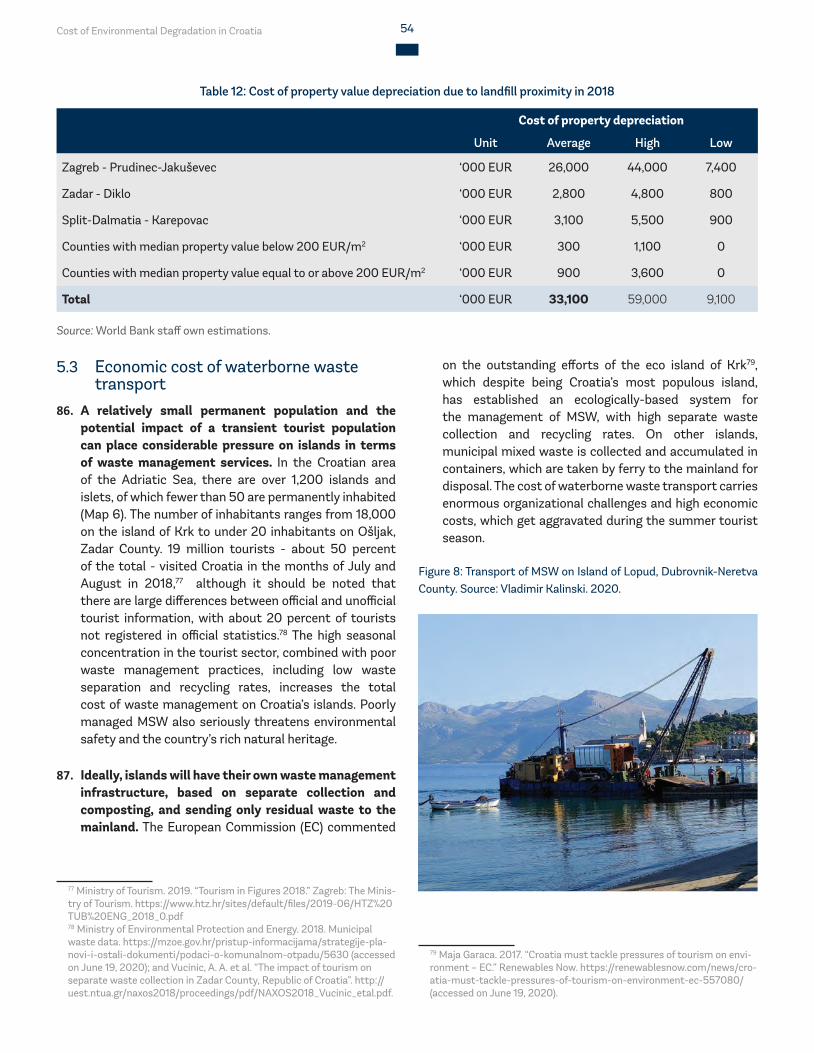
Cost of Environmental Degradation in Croatia 54
Table 12: Cost of property value depreciation due to landfill proximity in 2018
Cost of property depreciation
Unit Average High Low
Zagreb - Prudinec-Jakuševec ‘000 EUR 26,000 44,000 7,400
Zadar - Diklo ‘000 EUR 2,800 4,800 800
Split-Dalmatia - Karepovac ‘000 EUR 3,100 5,500 900
Counties with median property value below 200 EUR/m2 ‘000 EUR 300 1,100 0
Counties with median property value equal to or above 200 EUR/m2 ‘000 EUR 900 3,600 0
Total ‘000 EUR 33,100 59,000 9,100
Source: World Bank staff own estimations.
5.3 Economic cost of waterborne waste transport
86. A relatively small permanent population and the potential impact of a transient tourist population can place considerable pressure on islands in terms of waste management services. In the Croatian area of the Adriatic Sea, there are over 1,200 islands and islets, of which fewer than 50 are permanently inhabited (Map 6). The number of inhabitants ranges from 18,000 on the island of Krk to under 20 inhabitants on Ošljak, Zadar County. 19 million tourists - about 50 percent of the total - visited Croatia in the months of July and August in 2018,77 although it should be noted that there are large differences between official and unofficial tourist information, with about 20 percent of tourists not registered in official statistics.78 The high seasonal concentration in the tourist sector, combined with poor waste management practices, including low waste separation and recycling rates, increases the total cost of waste management on Croatia’s islands. Poorly managed MSW also seriously threatens environmental safety and the country’s rich natural heritage.
87. Ideally, islands will have their own waste management infrastructure, based on separate collection and composting, and sending only residual waste to the mainland. The European Commission (EC) commented
77 Ministry of Tourism. 2019. “Tourism in Figures 2018.” Zagreb: The Minis-try of Tourism. https://www.htz.hr/sites/default/files/2019-06/HTZ%20TUB%20ENG_2018_0.pdf78 Ministry of Environmental Protection and Energy. 2018. Municipal waste data. https://mzoe.gov.hr/pristup-informacijama/strategije-pla-novi-i-ostali-dokumenti/podaci-o-komunalnom-otpadu/5630 (accessed on June 19, 2020); and Vucinic, A. A. et al. “The impact of tourism on separate waste collection in Zadar County, Republic of Croatia”. http://uest.ntua.gr/naxos2018/proceedings/pdf/NAXOS2018_Vucinic_etal.pdf.
on the outstanding efforts of the eco island of Krk79, which despite being Croatia’s most populous island, has established an ecologically-based system for the management of MSW, with high separate waste collection and recycling rates. On other islands, municipal mixed waste is collected and accumulated in containers, which are taken by ferry to the mainland for disposal. The cost of waterborne waste transport carries enormous organizational challenges and high economic costs, which get aggravated during the summer tourist season.
Figure 8: Transport of MSW on Island of Lopud, Dubrovnik-Neretva County. Source: Vladimir Kalinski. 2020.
79 Maja Garaca. 2017. “Croatia must tackle pressures of tourism on envi-ronment – EC.” Renewables Now. https://renewablesnow.com/news/cro-atia-must-tackle-pressures-of-tourism-on-environment-ec-557080/ (accessed on June 19, 2020).
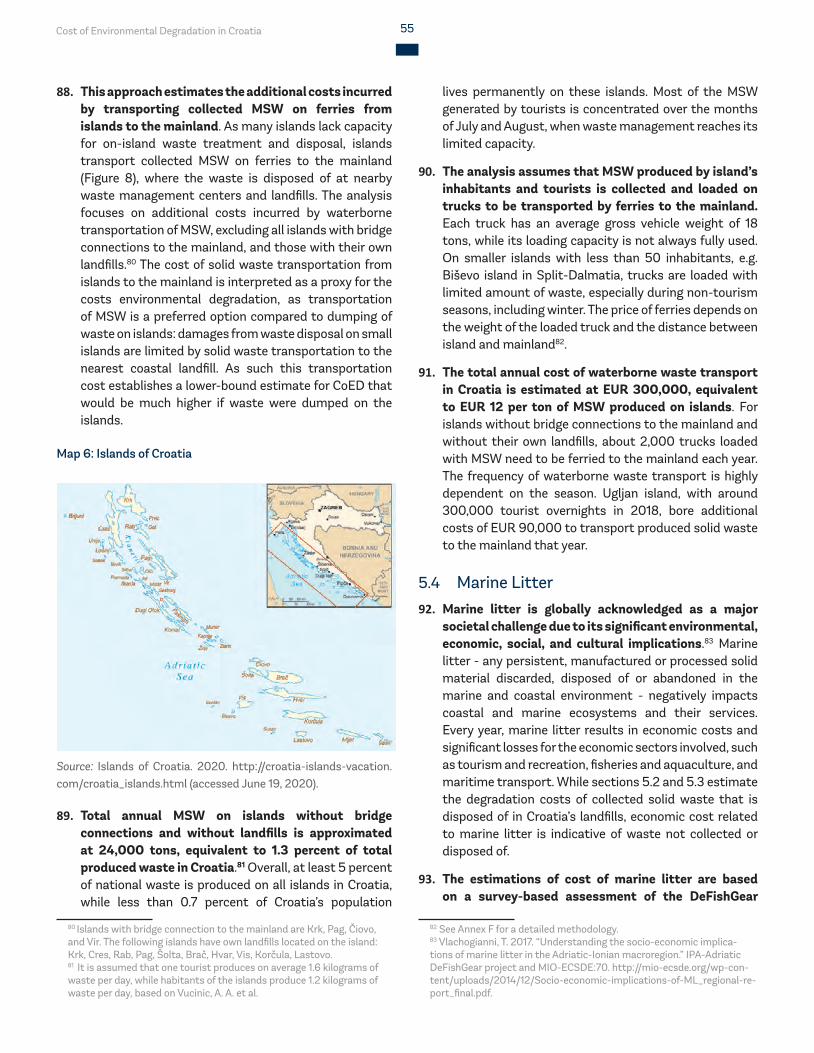
Cost of Environmental Degradation in Croatia 55
88. This approach estimates the additional costs incurred by transporting collected MSW on ferries from islands to the mainland. As many islands lack capacity for on-island waste treatment and disposal, islands transport collected MSW on ferries to the mainland (Figure 8), where the waste is disposed of at nearby waste management centers and landfills. The analysis focuses on additional costs incurred by waterborne transportation of MSW, excluding all islands with bridge connections to the mainland, and those with their own landfills.80 The cost of solid waste transportation from islands to the mainland is interpreted as a proxy for the costs environmental degradation, as transportation of MSW is a preferred option compared to dumping of waste on islands: damages from waste disposal on small islands are limited by solid waste transportation to the nearest coastal landfill. As such this transportation cost establishes a lower-bound estimate for CoED that would be much higher if waste were dumped on the islands.
Map 6: Islands of Croatia
Source: Islands of Croatia. 2020. http://croatia-islands-vacation.com/croatia_islands.html (accessed June 19, 2020).
89. Total annual MSW on islands without bridge connections and without landfills is approximated at 24,000 tons, equivalent to 1.3 percent of total produced waste in Croatia.81 Overall, at least 5 percent of national waste is produced on all islands in Croatia, while less than 0.7 percent of Croatia’s population
80 Islands with bridge connection to the mainland are Krk, Pag, Čiovo, and Vir. The following islands have own landfills located on the island: Krk, Cres, Rab, Pag, Šolta, Brač, Hvar, Vis, Korčula, Lastovo.81 It is assumed that one tourist produces on average 1.6 kilograms of waste per day, while habitants of the islands produce 1.2 kilograms of waste per day, based on Vucinic, A. A. et al.
lives permanently on these islands. Most of the MSW generated by tourists is concentrated over the months of July and August, when waste management reaches its limited capacity.
90. The analysis assumes that MSW produced by island’s inhabitants and tourists is collected and loaded on trucks to be transported by ferries to the mainland. Each truck has an average gross vehicle weight of 18 tons, while its loading capacity is not always fully used. On smaller islands with less than 50 inhabitants, e.g. Biševo island in Split-Dalmatia, trucks are loaded with limited amount of waste, especially during non-tourism seasons, including winter. The price of ferries depends on the weight of the loaded truck and the distance between island and mainland82.
91. The total annual cost of waterborne waste transport in Croatia is estimated at EUR 300,000, equivalent to EUR 12 per ton of MSW produced on islands. For islands without bridge connections to the mainland and without their own landfills, about 2,000 trucks loaded with MSW need to be ferried to the mainland each year. The frequency of waterborne waste transport is highly dependent on the season. Ugljan island, with around 300,000 tourist overnights in 2018, bore additional costs of EUR 90,000 to transport produced solid waste to the mainland that year.
5.4 Marine Litter92. Marine litter is globally acknowledged as a major
societal challenge due to its significant environmental, economic, social, and cultural implications.83 Marine litter - any persistent, manufactured or processed solid material discarded, disposed of or abandoned in the marine and coastal environment - negatively impacts coastal and marine ecosystems and their services. Every year, marine litter results in economic costs and significant losses for the economic sectors involved, such as tourism and recreation, fisheries and aquaculture, and maritime transport. While sections 5.2 and 5.3 estimate the degradation costs of collected solid waste that is disposed of in Croatia’s landfills, economic cost related to marine litter is indicative of waste not collected or disposed of.
93. The estimations of cost of marine litter are based on a survey-based assessment of the DeFishGear
82 See Annex F for a detailed methodology. 83 Vlachogianni, T. 2017. “Understanding the socio-economic implica-tions of marine litter in the Adriatic-Ionian macroregion.” IPA-Adriatic DeFishGear project and MIO-ECSDE:70. http://mio-ecsde.org/wp-con-tent/uploads/2014/12/Socio-economic-implications-of-ML_regional-re-port_final.pdf.
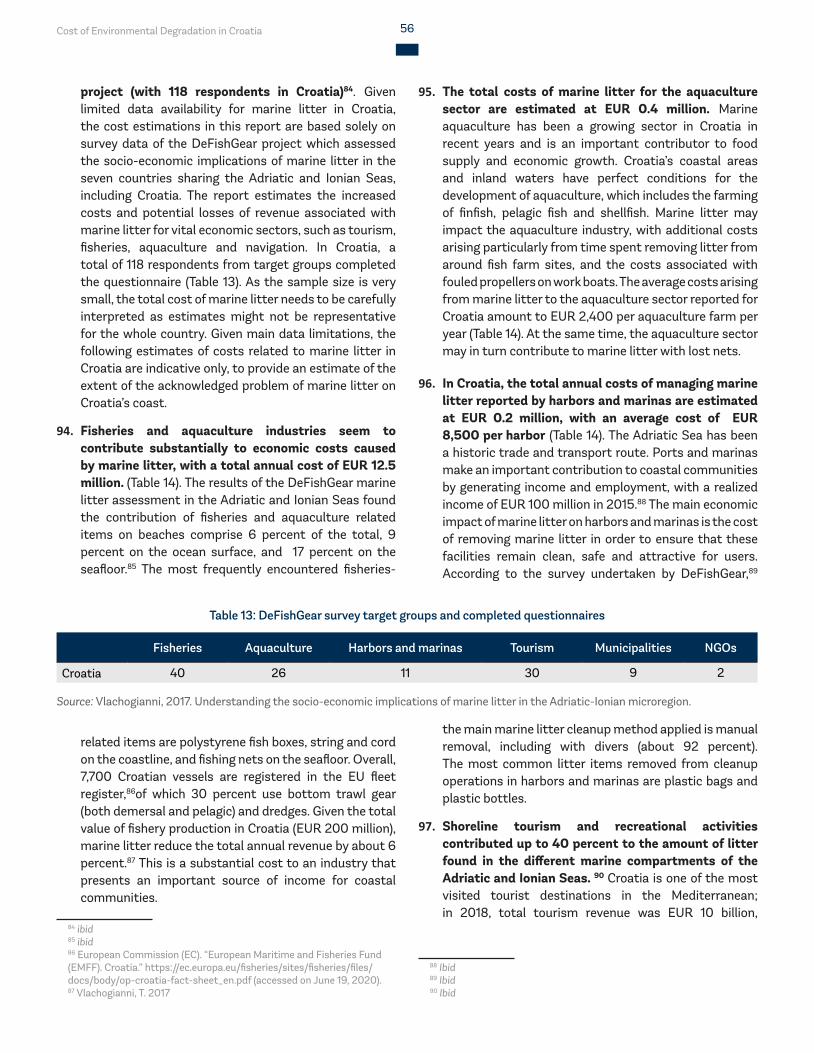
Cost of Environmental Degradation in Croatia 56
project (with 118 respondents in Croatia)84. Given limited data availability for marine litter in Croatia, the cost estimations in this report are based solely on survey data of the DeFishGear project which assessed the socio-economic implications of marine litter in the seven countries sharing the Adriatic and Ionian Seas, including Croatia. The report estimates the increased costs and potential losses of revenue associated with marine litter for vital economic sectors, such as tourism, fisheries, aquaculture and navigation. In Croatia, a total of 118 respondents from target groups completed the questionnaire (Table 13). As the sample size is very small, the total cost of marine litter needs to be carefully interpreted as estimates might not be representative for the whole country. Given main data limitations, the following estimates of costs related to marine litter in Croatia are indicative only, to provide an estimate of the extent of the acknowledged problem of marine litter on Croatia’s coast.
94. Fisheries and aquaculture industries seem to contribute substantially to economic costs caused by marine litter, with a total annual cost of EUR 12.5 million. (Table 14). The results of the DeFishGear marine litter assessment in the Adriatic and Ionian Seas found the contribution of fisheries and aquaculture related items on beaches comprise 6 percent of the total, 9 percent on the ocean surface, and 17 percent on the seafloor.85 The most frequently encountered fisheries-
related items are polystyrene fish boxes, string and cord on the coastline, and fishing nets on the seafloor. Overall, 7,700 Croatian vessels are registered in the EU fleet register,86of which 30 percent use bottom trawl gear (both demersal and pelagic) and dredges. Given the total value of fishery production in Croatia (EUR 200 million), marine litter reduce the total annual revenue by about 6 percent.87 This is a substantial cost to an industry that presents an important source of income for coastal communities.
84 ibid85 ibid86 European Commission (EC). “European Maritime and Fisheries Fund (EMFF). Croatia.” https://ec.europa.eu/fisheries/sites/fisheries/files/docs/body/op-croatia-fact-sheet_en.pdf (accessed on June 19, 2020).87 Vlachogianni, T. 2017
Table 13: DeFishGear survey target groups and completed questionnaires
Fisheries Aquaculture Harbors and marinas Tourism Municipalities NGOs
Croatia 40 26 11 30 9 2
Source: Vlachogianni, 2017. Understanding the socio-economic implications of marine litter in the Adriatic-Ionian microregion.
95. The total costs of marine litter for the aquaculture sector are estimated at EUR 0.4 million. Marine aquaculture has been a growing sector in Croatia in recent years and is an important contributor to food supply and economic growth. Croatia’s coastal areas and inland waters have perfect conditions for the development of aquaculture, which includes the farming of finfish, pelagic fish and shellfish. Marine litter may impact the aquaculture industry, with additional costs arising particularly from time spent removing litter from around fish farm sites, and the costs associated with fouled propellers on work boats. The average costs arising from marine litter to the aquaculture sector reported for Croatia amount to EUR 2,400 per aquaculture farm per year (Table 14). At the same time, the aquaculture sector may in turn contribute to marine litter with lost nets.
96. In Croatia, the total annual costs of managing marine litter reported by harbors and marinas are estimated at EUR 0.2 million, with an average cost of EUR 8,500 per harbor (Table 14). The Adriatic Sea has been a historic trade and transport route. Ports and marinas make an important contribution to coastal communities by generating income and employment, with a realized income of EUR 100 million in 2015.88 The main economic impact of marine litter on harbors and marinas is the cost of removing marine litter in order to ensure that these facilities remain clean, safe and attractive for users. According to the survey undertaken by DeFishGear,89
the main marine litter cleanup method applied is manual removal, including with divers (about 92 percent). The most common litter items removed from cleanup operations in harbors and marinas are plastic bags and plastic bottles.
97. Shoreline tourism and recreational activities contributed up to 40 percent to the amount of litter found in the different marine compartments of the Adriatic and Ionian Seas. 90 Croatia is one of the most visited tourist destinations in the Mediterranean; in 2018, total tourism revenue was EUR 10 billion,
88 Ibid89 Ibid90 Ibid
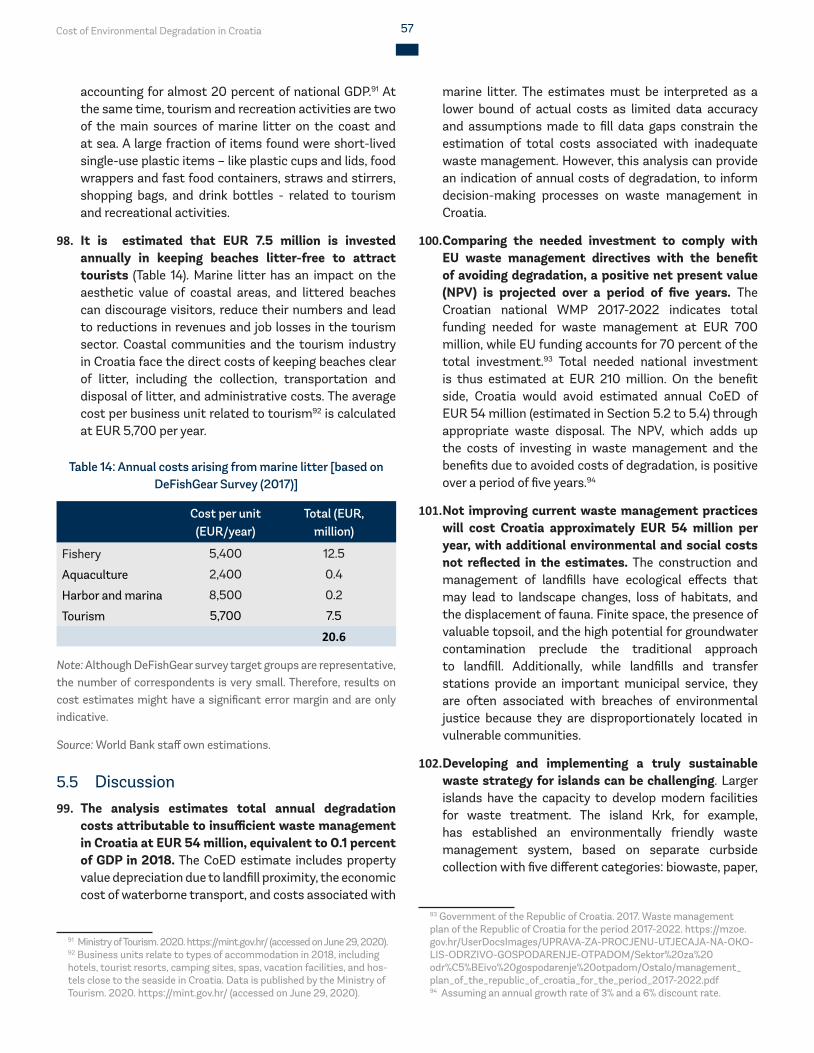
Cost of Environmental Degradation in Croatia 57
accounting for almost 20 percent of national GDP.91 At the same time, tourism and recreation activities are two of the main sources of marine litter on the coast and at sea. A large fraction of items found were short-lived single-use plastic items – like plastic cups and lids, food wrappers and fast food containers, straws and stirrers, shopping bags, and drink bottles - related to tourism and recreational activities.
98. It is estimated that EUR 7.5 million is invested annually in keeping beaches litter-free to attract tourists (Table 14). Marine litter has an impact on the aesthetic value of coastal areas, and littered beaches can discourage visitors, reduce their numbers and lead to reductions in revenues and job losses in the tourism sector. Coastal communities and the tourism industry in Croatia face the direct costs of keeping beaches clear of litter, including the collection, transportation and disposal of litter, and administrative costs. The average cost per business unit related to tourism92 is calculated at EUR 5,700 per year.
Table 14: Annual costs arising from marine litter [based on DeFishGear Survey (2017)]
Cost per unit (EUR/year)
Total (EUR, million)
Fishery 5,400 12.5
Aquaculture 2,400 0.4
Harbor and marina 8,500 0.2
Tourism 5,700 7.5
20.6
Note: Although DeFishGear survey target groups are representative, the number of correspondents is very small. Therefore, results on cost estimates might have a significant error margin and are only indicative.
Source: World Bank staff own estimations.
5.5 Discussion 99. The analysis estimates total annual degradation
costs attributable to insufficient waste management in Croatia at EUR 54 million, equivalent to 0.1 percent of GDP in 2018. The CoED estimate includes property value depreciation due to landfill proximity, the economic cost of waterborne transport, and costs associated with
91 Ministry of Tourism. 2020. https://mint.gov.hr/ (accessed on June 29, 2020).92 Business units relate to types of accommodation in 2018, including hotels, tourist resorts, camping sites, spas, vacation facilities, and hos-tels close to the seaside in Croatia. Data is published by the Ministry of Tourism. 2020. https://mint.gov.hr/ (accessed on June 29, 2020).
marine litter. The estimates must be interpreted as a lower bound of actual costs as limited data accuracy and assumptions made to fill data gaps constrain the estimation of total costs associated with inadequate waste management. However, this analysis can provide an indication of annual costs of degradation, to inform decision-making processes on waste management in Croatia.
100. Comparing the needed investment to comply with EU waste management directives with the benefit of avoiding degradation, a positive net present value (NPV) is projected over a period of five years. The Croatian national WMP 2017-2022 indicates total funding needed for waste management at EUR 700 million, while EU funding accounts for 70 percent of the total investment.93 Total needed national investment is thus estimated at EUR 210 million. On the benefit side, Croatia would avoid estimated annual CoED of EUR 54 million (estimated in Section 5.2 to 5.4) through appropriate waste disposal. The NPV, which adds up the costs of investing in waste management and the benefits due to avoided costs of degradation, is positive over a period of five years.94
101. Not improving current waste management practices will cost Croatia approximately EUR 54 million per year, with additional environmental and social costs not reflected in the estimates. The construction and management of landfills have ecological effects that may lead to landscape changes, loss of habitats, and the displacement of fauna. Finite space, the presence of valuable topsoil, and the high potential for groundwater contamination preclude the traditional approach to landfill. Additionally, while landfills and transfer stations provide an important municipal service, they are often associated with breaches of environmental justice because they are disproportionately located in vulnerable communities.
102. Developing and implementing a truly sustainable waste strategy for islands can be challenging. Larger islands have the capacity to develop modern facilities for waste treatment. The island Krk, for example, has established an environmentally friendly waste management system, based on separate curbside collection with five different categories: biowaste, paper,
93 Government of the Republic of Croatia. 2017. Waste management plan of the Republic of Croatia for the period 2017-2022. https://mzoe.gov.hr/UserDocsImages/UPRAVA-ZA-PROCJENU-UTJECAJA-NA-OKO-LIS-ODRZIVO-GOSPODARENJE-OTPADOM/Sektor%20za%20odr%C5%BEivo%20gospodarenje%20otpadom/Ostalo/management_plan_of_the_republic_of_croatia_for_the_period_2017-2022.pdf94 Assuming an annual growth rate of 3% and a 6% discount rate.
Cost of Environmental Degradation in Croatia 58
plastics and metals, glass and remaining waste, while dumpsters are removed from the streets. All the collected material is transported to centrally-placed recycling and disposal centers for further separation, biological treatment and disposal. On Croatia’s smaller islands, or on islands with fewer inhabitants, the development and operation of on-island waste treatment and disposal facilities to meet increasingly stringent EU requirements is a greater challenge. For islands close to a mainland market, separate collection and recycling should be strongly encouraged, and established transport routes utilized to transfer materials to mainland markets for adequate treatment.
Cost of Environmental Degradation in Croatia 59
AIR QUALITY
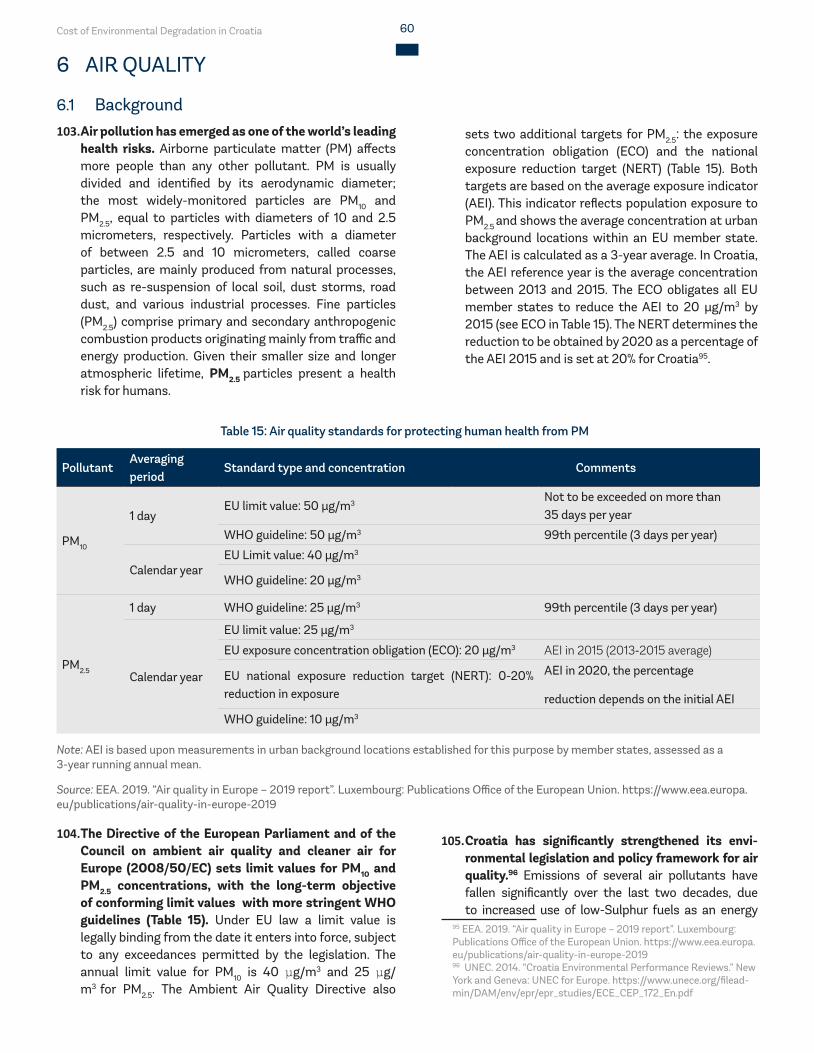
Cost of Environmental Degradation in Croatia 60
6 AIR QUALITY
6.1 Background103. Air pollution has emerged as one of the world’s leading
health risks. Airborne particulate matter (PM) affects more people than any other pollutant. PM is usually divided and identified by its aerodynamic diameter; the most widely-monitored particles are PM10 and PM2.5, equal to particles with diameters of 10 and 2.5 micrometers, respectively. Particles with a diameter of between 2.5 and 10 micrometers, called coarse particles, are mainly produced from natural processes, such as re-suspension of local soil, dust storms, road dust, and various industrial processes. Fine particles (PM2.5) comprise primary and secondary anthropogenic combustion products originating mainly from traffic and energy production. Given their smaller size and longer atmospheric lifetime, PM2.5 particles present a health risk for humans.
104. The Directive of the European Parliament and of the Council on ambient air quality and cleaner air for Europe (2008/50/EC) sets limit values for PM10 and PM2.5 concentrations, with the long-term objective of conforming limit values with more stringent WHO guidelines (Table 15). Under EU law a limit value is legally binding from the date it enters into force, subject to any exceedances permitted by the legislation. The annual limit value for PM10 is 40 μg/m3 and 25 μg/m3 for PM2.5. The Ambient Air Quality Directive also
sets two additional targets for PM2.5: the exposure concentration obligation (ECO) and the national exposure reduction target (NERT) (Table 15). Both targets are based on the average exposure indicator (AEI). This indicator reflects population exposure to PM2.5 and shows the average concentration at urban background locations within an EU member state. The AEI is calculated as a 3-year average. In Croatia, the AEI reference year is the average concentration between 2013 and 2015. The ECO obligates all EU member states to reduce the AEI to 20 µg/m3 by 2015 (see ECO in Table 15). The NERT determines the reduction to be obtained by 2020 as a percentage of the AEI 2015 and is set at 20% for Croatia95.
105. Croatia has significantly strengthened its envi-ronmental legislation and policy framework for air quality.96 Emissions of several air pollutants have fallen significantly over the last two decades, due to increased use of low-Sulphur fuels as an energy
95 EEA. 2019. “Air quality in Europe – 2019 report”. Luxembourg: Publications Office of the European Union. https://www.eea.europa.eu/publications/air-quality-in-europe-201996 UNEC. 2014. “Croatia Environmental Performance Reviews.” New York and Geneva: UNEC for Europe. https://www.unece.org/filead-min/DAM/env/epr/epr_studies/ECE_CEP_172_En.pdf
Table 15: Air quality standards for protecting human health from PM
PollutantAveraging period
Standard type and concentration Comments
PM10
1 dayEU limit value: 50 μg/m3
Not to be exceeded on more than35 days per year
WHO guideline: 50 μg/m3 99th percentile (3 days per year)
Calendar yearEU Limit value: 40 μg/m3
WHO guideline: 20 μg/m3
PM2.5
1 day WHO guideline: 25 μg/m3 99th percentile (3 days per year)
Calendar year
EU limit value: 25 μg/m3
EU exposure concentration obligation (ECO): 20 μg/m3 AEI in 2015 (2013‐2015 average)
EU national exposure reduction target (NERT): 0-20% reduction in exposure
AEI in 2020, the percentage
reduction depends on the initial AEI
WHO guideline: 10 μg/m3
Note: AEI is based upon measurements in urban background locations established for this purpose by member states, assessed as a 3-year running annual mean.
Source: EEA. 2019. “Air quality in Europe – 2019 report”. Luxembourg: Publications Office of the European Union. https://www.eea.europa.eu/publications/air-quality-in-europe-2019
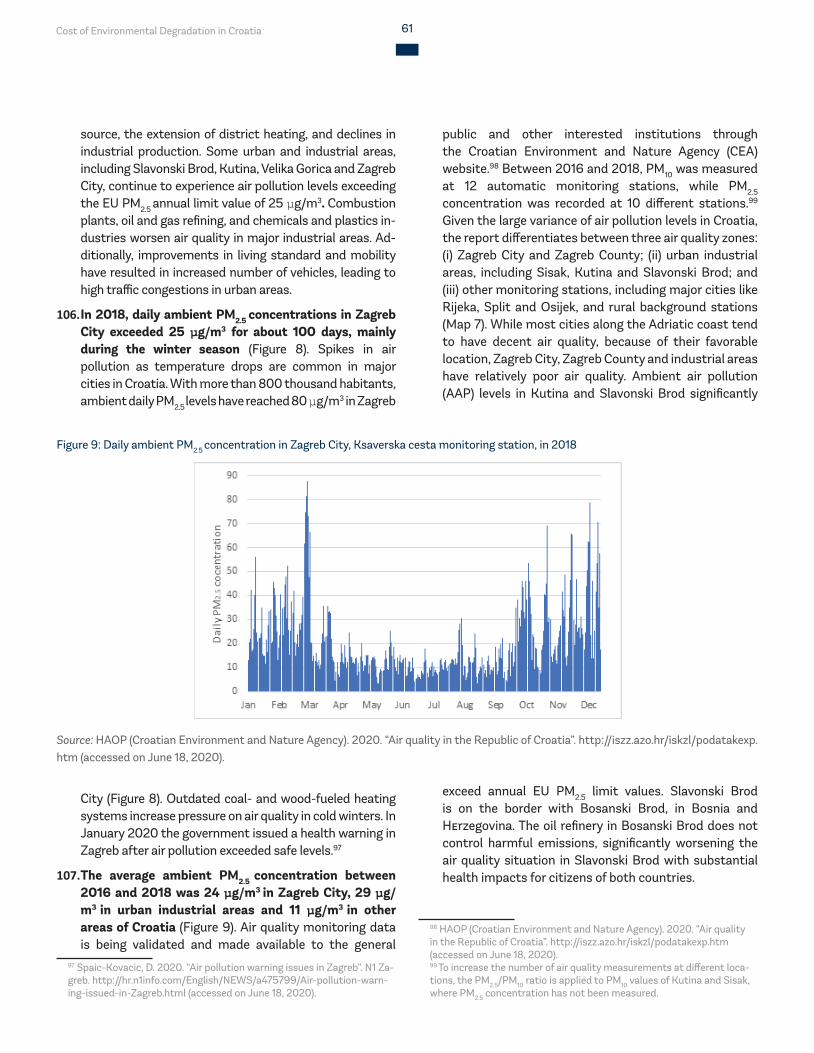
Cost of Environmental Degradation in Croatia 61
source, the extension of district heating, and declines in industrial production. Some urban and industrial areas, including Slavonski Brod, Kutina, Velika Gorica and Zagreb City, continue to experience air pollution levels exceeding the EU PM2.5 annual limit value of 25 μg/m3. Combustion plants, oil and gas refining, and chemicals and plastics in-dustries worsen air quality in major industrial areas. Ad-ditionally, improvements in living standard and mobility have resulted in increased number of vehicles, leading to high traffic congestions in urban areas.
106. In 2018, daily ambient PM2.5 concentrations in Zagreb City exceeded 25 μg/m3 for about 100 days, mainly during the winter season (Figure 8). Spikes in air pollution as temperature drops are common in major cities in Croatia. With more than 800 thousand habitants, ambient daily PM2.5 levels have reached 80 μg/m3 in Zagreb
City (Figure 8). Outdated coal- and wood-fueled heating systems increase pressure on air quality in cold winters. In January 2020 the government issued a health warning in Zagreb after air pollution exceeded safe levels.97
107. The average ambient PM2.5 concentration between 2016 and 2018 was 24 μg/m3 in Zagreb City, 29 μg/m3 in urban industrial areas and 11 μg/m3 in other areas of Croatia (Figure 9). Air quality monitoring data is being validated and made available to the general
97 Spaic-Kovacic, D. 2020. “Air pollution warning issues in Zagreb”. N1 Za-greb. http://hr.n1info.com/English/NEWS/a475799/Air-pollution-warn-ing-issued-in-Zagreb.html (accessed on June 18, 2020).
Figure 9: Daily ambient PM2.5 concentration in Zagreb City, Ksaverska cesta monitoring station, in 2018
Source: HAOP (Croatian Environment and Nature Agency). 2020. “Air quality in the Republic of Croatia”. http://iszz.azo.hr/iskzl/podatakexp.htm (accessed on June 18, 2020).
public and other interested institutions through the Croatian Environment and Nature Agency (CEA) website.98 Between 2016 and 2018, PM10 was measured at 12 automatic monitoring stations, while PM2.5
concentration was recorded at 10 different stations.99 Given the large variance of air pollution levels in Croatia, the report differentiates between three air quality zones: (i) Zagreb City and Zagreb County; (ii) urban industrial areas, including Sisak, Kutina and Slavonski Brod; and (iii) other monitoring stations, including major cities like Rijeka, Split and Osijek, and rural background stations (Map 7). While most cities along the Adriatic coast tend to have decent air quality, because of their favorable location, Zagreb City, Zagreb County and industrial areas have relatively poor air quality. Ambient air pollution (AAP) levels in Kutina and Slavonski Brod significantly
exceed annual EU PM2.5 limit values. Slavonski Brod is on the border with Bosanski Brod, in Bosnia and HErzegovina. The oil refinery in Bosanski Brod does not control harmful emissions, significantly worsening the air quality situation in Slavonski Brod with substantial health impacts for citizens of both countries.
98 HAOP (Croatian Environment and Nature Agency). 2020. “Air quality in the Republic of Croatia”. http://iszz.azo.hr/iskzl/podatakexp.htm (accessed on June 18, 2020).99 To increase the number of air quality measurements at different loca-tions, the PM2.5/PM10 ratio is applied to PM10 values of Kutina and Sisak, where PM2.5 concentration has not been measured.
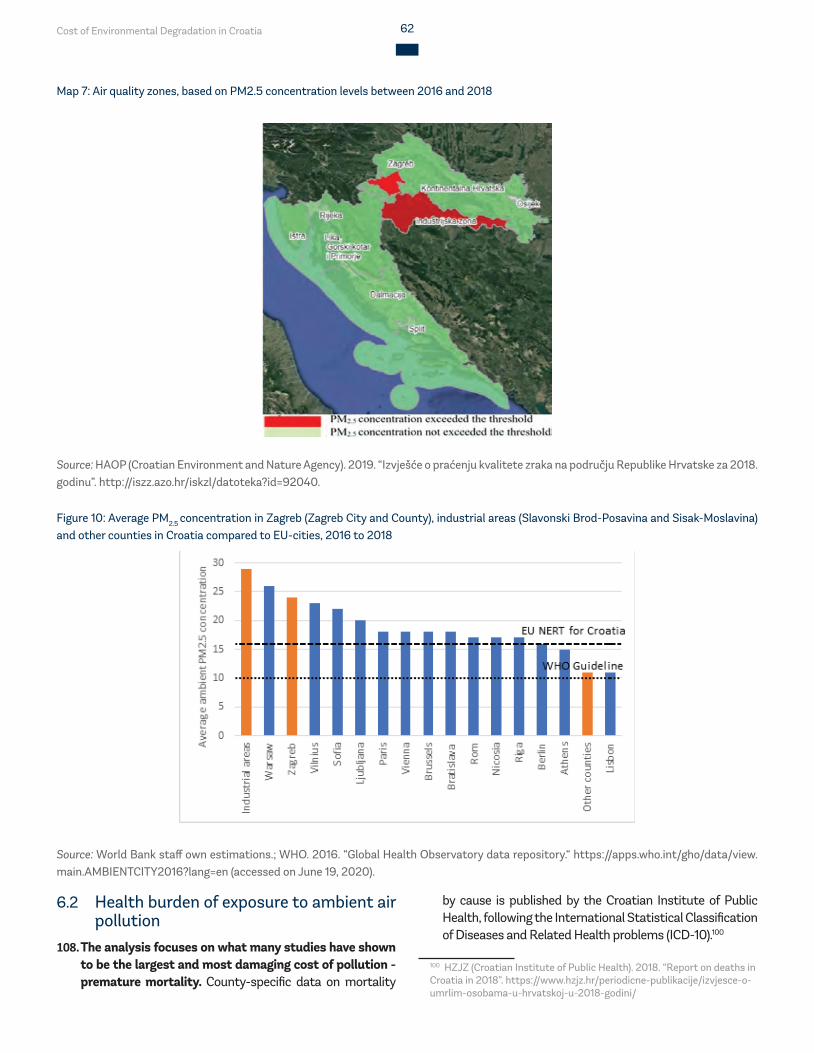
Cost of Environmental Degradation in Croatia 62
Map 7: Air quality zones, based on PM2.5 concentration levels between 2016 and 2018
Source: HAOP (Croatian Environment and Nature Agency). 2019. “Izvješće o praćenju kvalitete zraka na području Republike Hrvatske za 2018. godinu”. http://iszz.azo.hr/iskzl/datoteka?id=92040.
Figure 10: Average PM2.5 concentration in Zagreb (Zagreb City and County), industrial areas (Slavonski Brod-Posavina and Sisak-Moslavina) and other counties in Croatia compared to EU-cities, 2016 to 2018
Source: World Bank staff own estimations.; WHO. 2016. “Global Health Observatory data repository.“ https://apps.who.int/gho/data/view.main.AMBIENTCITY2016?lang=en (accessed on June 19, 2020).
6.2 Health burden of exposure to ambient air pollution
108. The analysis focuses on what many studies have shown to be the largest and most damaging cost of pollution - premature mortality. County-specific data on mortality
by cause is published by the Croatian Institute of Public Health, following the International Statistical Classification of Diseases and Related Health problems (ICD-10).100
100 HZJZ (Croatian Institute of Public Health). 2018. “Report on deaths in Croatia in 2018”. https://www.hzjz.hr/periodicne-publikacije/izvjesce-o-umrlim-osobama-u-hrvatskoj-u-2018-godini/
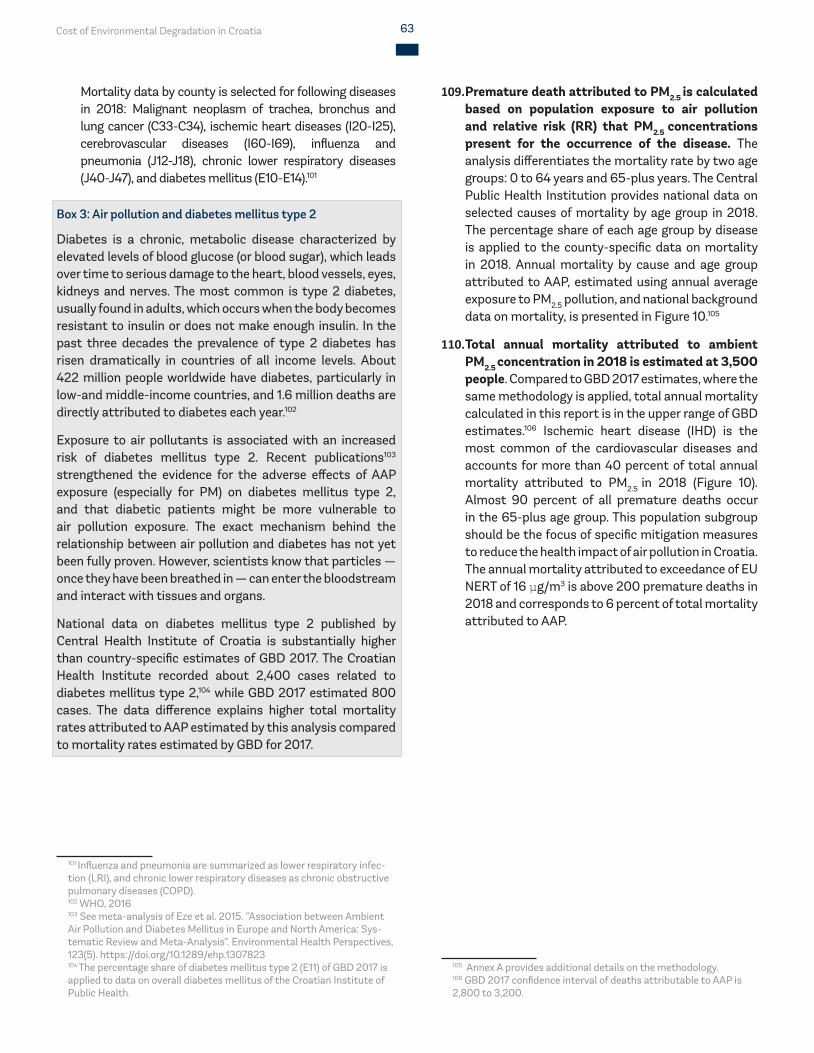
Cost of Environmental Degradation in Croatia 63
Mortality data by county is selected for following diseases in 2018: Malignant neoplasm of trachea, bronchus and lung cancer (C33-C34), ischemic heart diseases (I20-I25), cerebrovascular diseases (I60-I69), influenza and pneumonia (J12-J18), chronic lower respiratory diseases (J40-J47), and diabetes mellitus (E10-E14).101
Box 3: Air pollution and diabetes mellitus type 2
Diabetes is a chronic, metabolic disease characterized by elevated levels of blood glucose (or blood sugar), which leads over time to serious damage to the heart, blood vessels, eyes, kidneys and nerves. The most common is type 2 diabetes, usually found in adults, which occurs when the body becomes resistant to insulin or does not make enough insulin. In the past three decades the prevalence of type 2 diabetes has risen dramatically in countries of all income levels. About 422 million people worldwide have diabetes, particularly in low-and middle-income countries, and 1.6 million deaths are directly attributed to diabetes each year.102
Exposure to air pollutants is associated with an increased risk of diabetes mellitus type 2. Recent publications103
strengthened the evidence for the adverse effects of AAP exposure (especially for PM) on diabetes mellitus type 2, and that diabetic patients might be more vulnerable to air pollution exposure. The exact mechanism behind the relationship between air pollution and diabetes has not yet been fully proven. However, scientists know that particles — once they have been breathed in — can enter the bloodstream and interact with tissues and organs.
National data on diabetes mellitus type 2 published by Central Health Institute of Croatia is substantially higher than country-specific estimates of GBD 2017. The Croatian Health Institute recorded about 2,400 cases related to diabetes mellitus type 2,104 while GBD 2017 estimated 800 cases. The data difference explains higher total mortality rates attributed to AAP estimated by this analysis compared to mortality rates estimated by GBD for 2017.
101 Influenza and pneumonia are summarized as lower respiratory infec-tion (LRI), and chronic lower respiratory diseases as chronic obstructive pulmonary diseases (COPD).102 WHO, 2016103 See meta-analysis of Eze et al. 2015. “Association between Ambient Air Pollution and Diabetes Mellitus in Europe and North America: Sys-tematic Review and Meta-Analysis”. Environmental Health Perspectives, 123(5). https://doi.org/10.1289/ehp.1307823104 The percentage share of diabetes mellitus type 2 (E11) of GBD 2017 is applied to data on overall diabetes mellitus of the Croatian Institute of Public Health.
109. Premature death attributed to PM2.5 is calculated based on population exposure to air pollution and relative risk (RR) that PM2.5 concentrations present for the occurrence of the disease. The analysis differentiates the mortality rate by two age groups: 0 to 64 years and 65-plus years. The Central Public Health Institution provides national data on selected causes of mortality by age group in 2018. The percentage share of each age group by disease is applied to the county-specific data on mortality in 2018. Annual mortality by cause and age group attributed to AAP, estimated using annual average exposure to PM2.5 pollution, and national background data on mortality, is presented in Figure 10.105
110. Total annual mortality attributed to ambient PM2.5 concentration in 2018 is estimated at 3,500 people. Compared to GBD 2017 estimates, where the same methodology is applied, total annual mortality calculated in this report is in the upper range of GBD estimates.106 Ischemic heart disease (IHD) is the most common of the cardiovascular diseases and accounts for more than 40 percent of total annual mortality attributed to PM2.5 in 2018 (Figure 10). Almost 90 percent of all premature deaths occur in the 65-plus age group. This population subgroup should be the focus of specific mitigation measures to reduce the health impact of air pollution in Croatia. The annual mortality attributed to exceedance of EU NERT of 16 μg/m3 is above 200 premature deaths in 2018 and corresponds to 6 percent of total mortality attributed to AAP.
105 Annex A provides additional details on the methodology.106 GBD 2017 confidence interval of deaths attributable to AAP is 2,800 to 3,200.
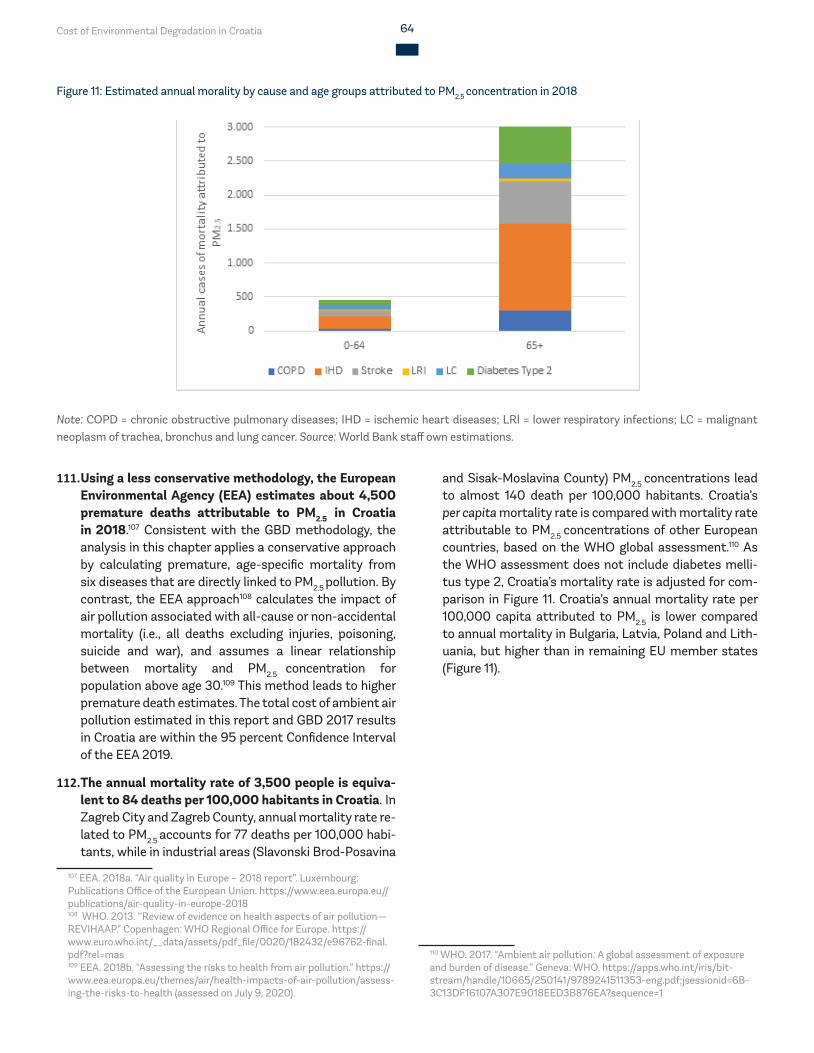
Cost of Environmental Degradation in Croatia 64
Figure 11: Estimated annual morality by cause and age groups attributed to PM2.5 concentration in 2018
Note: COPD = chronic obstructive pulmonary diseases; IHD = ischemic heart diseases; LRI = lower respiratory infections; LC = malignant neoplasm of trachea, bronchus and lung cancer. Source: World Bank staff own estimations.
111. Using a less conservative methodology, the European Environmental Agency (EEA) estimates about 4,500 premature deaths attributable to PM2.5 in Croatia in 2018.107 Consistent with the GBD methodology, the analysis in this chapter applies a conservative approach by calculating premature, age-specific mortality from six diseases that are directly linked to PM2.5 pollution. By contrast, the EEA approach108 calculates the impact of air pollution associated with all-cause or non-accidental mortality (i.e., all deaths excluding injuries, poisoning, suicide and war), and assumes a linear relationship between mortality and PM2.5 concentration for population above age 30.109 This method leads to higher premature death estimates. The total cost of ambient air pollution estimated in this report and GBD 2017 results in Croatia are within the 95 percent Confidence Interval of the EEA 2019.
112. The annual mortality rate of 3,500 people is equiva-lent to 84 deaths per 100,000 habitants in Croatia. In Zagreb City and Zagreb County, annual mortality rate re-lated to PM2.5 accounts for 77 deaths per 100,000 habi-tants, while in industrial areas (Slavonski Brod-Posavina
107 EEA. 2018a. “Air quality in Europe – 2018 report”. Luxembourg: Publications Office of the European Union. https://www.eea.europa.eu//publications/air-quality-in-europe-2018108 WHO. 2013. ‘‘Review of evidence on health aspects of air pollution—REVIHAAP.” Copenhagen: WHO Regional Office for Europe. https://www.euro.who.int/__data/assets/pdf_file/0020/182432/e96762-final.pdf?rel=mas109 EEA. 2018b. “Assessing the risks to health from air pollution.” https://www.eea.europa.eu/themes/air/health-impacts-of-air-pollution/assess-ing-the-risks-to-health (assessed on July 9, 2020).
and Sisak-Moslavina County) PM2.5 concentrations lead to almost 140 death per 100,000 habitants. Croatia’s per capita mortality rate is compared with mortality rate attributable to PM2.5 concentrations of other European countries, based on the WHO global assessment.110 As the WHO assessment does not include diabetes melli-tus type 2, Croatia’s mortality rate is adjusted for com-parison in Figure 11. Croatia’s annual mortality rate per 100,000 capita attributed to PM2.5 is lower compared to annual mortality in Bulgaria, Latvia, Poland and Lith-uania, but higher than in remaining EU member states (Figure 11).
110 WHO. 2017. “Ambient air pollution: A global assessment of exposure and burden of disease.” Geneva: WHO. https://apps.who.int/iris/bit-stream/handle/10665/250141/9789241511353-eng.pdf;jsessionid=6B-3C13DF16107A307E9018EED3B876EA?sequence=1
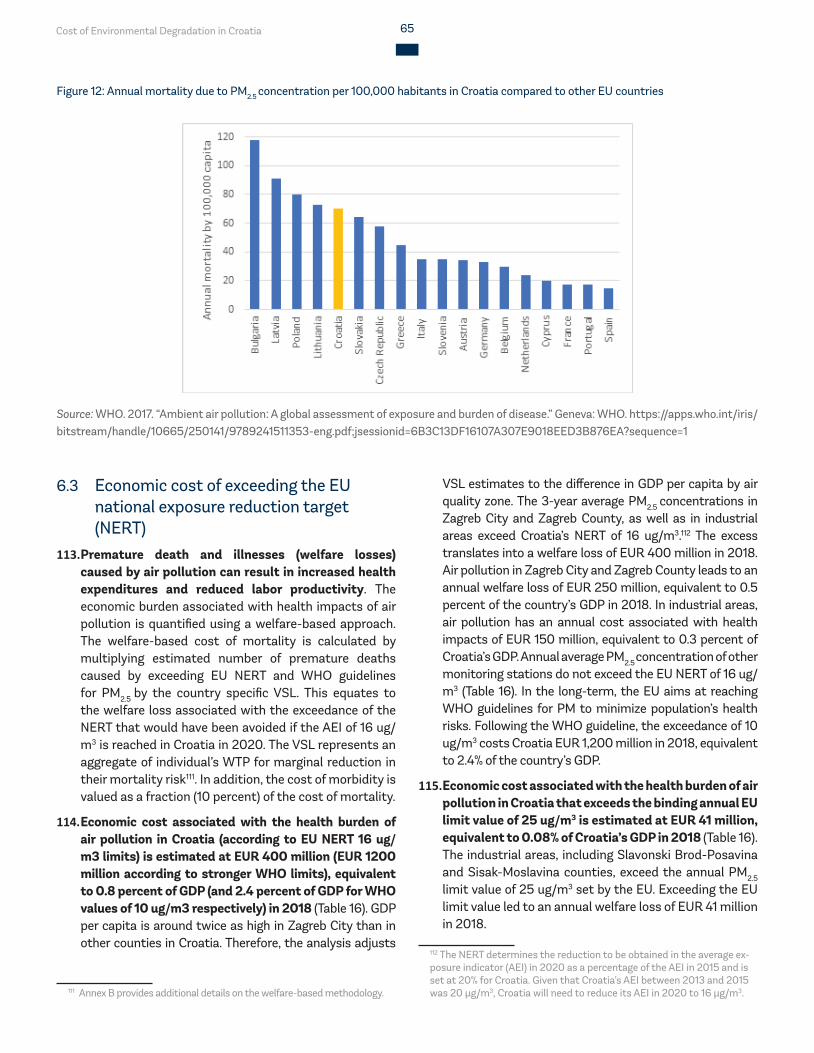
Cost of Environmental Degradation in Croatia 65
Figure 12: Annual mortality due to PM2.5 concentration per 100,000 habitants in Croatia compared to other EU countries
Source: WHO. 2017. “Ambient air pollution: A global assessment of exposure and burden of disease.” Geneva: WHO. https://apps.who.int/iris/bitstream/handle/10665/250141/9789241511353-eng.pdf;jsessionid=6B3C13DF16107A307E9018EED3B876EA?sequence=1
6.3 Economic cost of exceeding the EU national exposure reduction target (NERT)
113. Premature death and illnesses (welfare losses) caused by air pollution can result in increased health expenditures and reduced labor productivity. The economic burden associated with health impacts of air pollution is quantified using a welfare-based approach. The welfare-based cost of mortality is calculated by multiplying estimated number of premature deaths caused by exceeding EU NERT and WHO guidelines for PM2.5 by the country specific VSL. This equates to the welfare loss associated with the exceedance of the NERT that would have been avoided if the AEI of 16 ug/m3 is reached in Croatia in 2020. The VSL represents an aggregate of individual’s WTP for marginal reduction in their mortality risk111. In addition, the cost of morbidity is valued as a fraction (10 percent) of the cost of mortality.
114. Economic cost associated with the health burden of air pollution in Croatia (according to EU NERT 16 ug/m3 limits) is estimated at EUR 400 million (EUR 1200 million according to stronger WHO limits), equivalent to 0.8 percent of GDP (and 2.4 percent of GDP for WHO values of 10 ug/m3 respectively) in 2018 (Table 16). GDP per capita is around twice as high in Zagreb City than in other counties in Croatia. Therefore, the analysis adjusts
111 Annex B provides additional details on the welfare-based methodology.
VSL estimates to the difference in GDP per capita by air quality zone. The 3-year average PM2.5 concentrations in Zagreb City and Zagreb County, as well as in industrial areas exceed Croatia’s NERT of 16 ug/m3.112 The excess translates into a welfare loss of EUR 400 million in 2018. Air pollution in Zagreb City and Zagreb County leads to an annual welfare loss of EUR 250 million, equivalent to 0.5 percent of the country’s GDP in 2018. In industrial areas, air pollution has an annual cost associated with health impacts of EUR 150 million, equivalent to 0.3 percent of Croatia’s GDP. Annual average PM2.5 concentration of other monitoring stations do not exceed the EU NERT of 16 ug/m3 (Table 16). In the long-term, the EU aims at reaching WHO guidelines for PM to minimize population’s health risks. Following the WHO guideline, the exceedance of 10 ug/m3 costs Croatia EUR 1,200 million in 2018, equivalent to 2.4% of the country’s GDP.
115. Economic cost associated with the health burden of air pollution in Croatia that exceeds the binding annual EU limit value of 25 ug/m3 is estimated at EUR 41 million, equivalent to 0.08% of Croatia’s GDP in 2018 (Table 16). The industrial areas, including Slavonski Brod-Posavina and Sisak-Moslavina counties, exceed the annual PM2.5
limit value of 25 ug/m3 set by the EU. Exceeding the EU limit value led to an annual welfare loss of EUR 41 million in 2018.
112 The NERT determines the reduction to be obtained in the average ex-posure indicator (AEI) in 2020 as a percentage of the AEI in 2015 and is set at 20% for Croatia. Given that Croatia’s AEI between 2013 and 2015 was 20 μg/m3, Croatia will need to reduce its AEI in 2020 to 16 μg/m3.
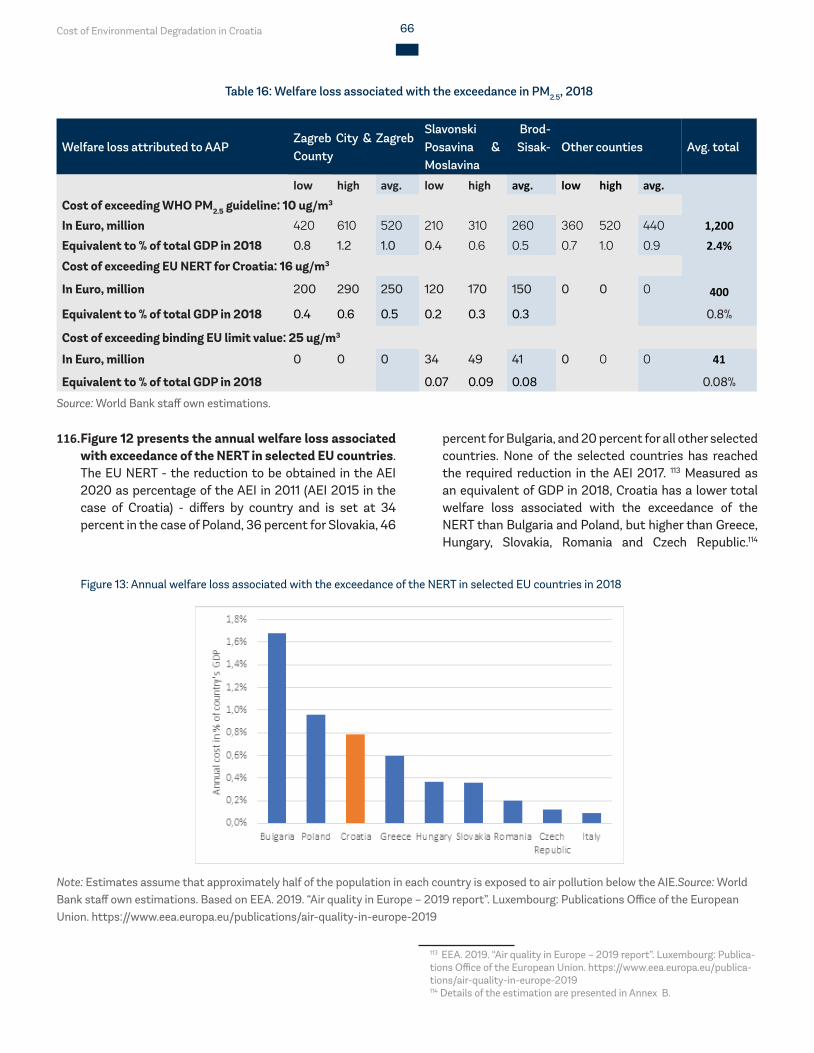
Cost of Environmental Degradation in Croatia 66
Table 16: Welfare loss associated with the exceedance in PM2.5, 2018
Figure 13: Annual welfare loss associated with the exceedance of the NERT in selected EU countries in 2018
Note: Estimates assume that approximately half of the population in each country is exposed to air pollution below the AIE.Source: World Bank staff own estimations. Based on EEA. 2019. “Air quality in Europe – 2019 report”. Luxembourg: Publications Office of the European Union. https://www.eea.europa.eu/publications/air-quality-in-europe-2019
Welfare loss attributed to AAPZagreb City & Zagreb County
Slavonski Brod-Posavina & Sisak-Moslavina
Other counties Avg. total
low high avg. low high avg. low high avg.
Cost of exceeding WHO PM2.5 guideline: 10 ug/m3
In Euro, million 420 610 520 210 310 260 360 520 440 1,200
Equivalent to % of total GDP in 2018 0.8 1.2 1.0 0.4 0.6 0.5 0.7 1.0 0.9 2.4%
Cost of exceeding EU NERT for Croatia: 16 ug/m3
In Euro, million 200 290 250 120 170 150 0 0 0 400
Equivalent to % of total GDP in 2018 0.4 0.6 0.5 0.2 0.3 0.3 0.8%
Cost of exceeding binding EU limit value: 25 ug/m3
In Euro, million 0 0 0 34 49 41 0 0 0 41
Equivalent to % of total GDP in 2018 0.07 0.09 0.08 0.08%
Source: World Bank staff own estimations.
116. Figure 12 presents the annual welfare loss associated with exceedance of the NERT in selected EU countries. The EU NERT - the reduction to be obtained in the AEI 2020 as percentage of the AEI in 2011 (AEI 2015 in the case of Croatia) - differs by country and is set at 34 percent in the case of Poland, 36 percent for Slovakia, 46
percent for Bulgaria, and 20 percent for all other selected countries. None of the selected countries has reached the required reduction in the AEI 2017. 113 Measured as an equivalent of GDP in 2018, Croatia has a lower total welfare loss associated with the exceedance of the NERT than Bulgaria and Poland, but higher than Greece, Hungary, Slovakia, Romania and Czech Republic.114
113 EEA. 2019. “Air quality in Europe – 2019 report”. Luxembourg: Publica-tions Office of the European Union. https://www.eea.europa.eu/publica-tions/air-quality-in-europe-2019 114 Details of the estimation are presented in Annex B.
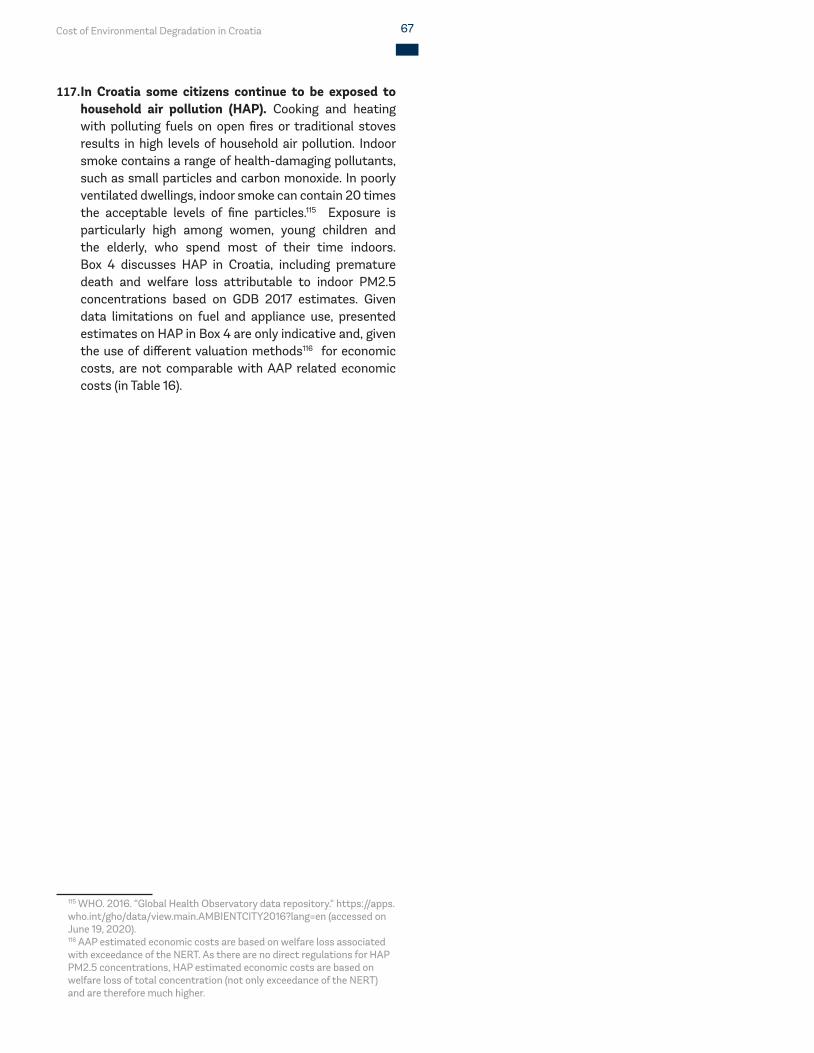
Cost of Environmental Degradation in Croatia 67
117. In Croatia some citizens continue to be exposed to household air pollution (HAP). Cooking and heating with polluting fuels on open fires or traditional stoves results in high levels of household air pollution. Indoor smoke contains a range of health-damaging pollutants, such as small particles and carbon monoxide. In poorly ventilated dwellings, indoor smoke can contain 20 times the acceptable levels of fine particles.115 Exposure is particularly high among women, young children and the elderly, who spend most of their time indoors. Box 4 discusses HAP in Croatia, including premature death and welfare loss attributable to indoor PM2.5 concentrations based on GDB 2017 estimates. Given data limitations on fuel and appliance use, presented estimates on HAP in Box 4 are only indicative and, given the use of different valuation methods116 for economic costs, are not comparable with AAP related economic costs (in Table 16).
115 WHO. 2016. “Global Health Observatory data repository.“ https://apps.who.int/gho/data/view.main.AMBIENTCITY2016?lang=en (accessed on June 19, 2020).116 AAP estimated economic costs are based on welfare loss associated with exceedance of the NERT. As there are no direct regulations for HAP PM2.5 concentrations, HAP estimated economic costs are based on welfare loss of total concentration (not only exceedance of the NERT) and are therefore much higher.
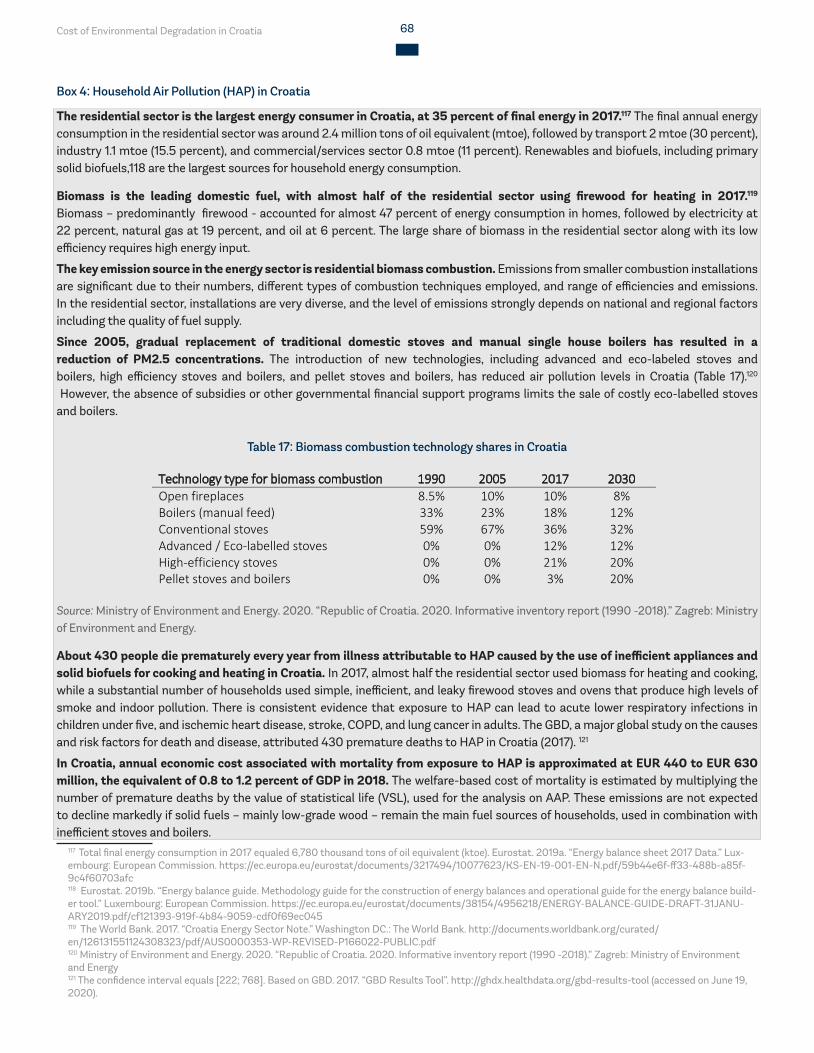
Cost of Environmental Degradation in Croatia 68
Box 4: Household Air Pollution (HAP) in Croatia
The residential sector is the largest energy consumer in Croatia, at 35 percent of final energy in 2017.117 The final annual energy consumption in the residential sector was around 2.4 million tons of oil equivalent (mtoe), followed by transport 2 mtoe (30 percent), industry 1.1 mtoe (15.5 percent), and commercial/services sector 0.8 mtoe (11 percent). Renewables and biofuels, including primary solid biofuels,118 are the largest sources for household energy consumption.
Biomass is the leading domestic fuel, with almost half of the residential sector using firewood for heating in 2017.119
Biomass – predominantly firewood - accounted for almost 47 percent of energy consumption in homes, followed by electricity at 22 percent, natural gas at 19 percent, and oil at 6 percent. The large share of biomass in the residential sector along with its low efficiency requires high energy input.
The key emission source in the energy sector is residential biomass combustion. Emissions from smaller combustion installations are significant due to their numbers, different types of combustion techniques employed, and range of efficiencies and emissions. In the residential sector, installations are very diverse, and the level of emissions strongly depends on national and regional factors including the quality of fuel supply.
Since 2005, gradual replacement of traditional domestic stoves and manual single house boilers has resulted in a reduction of PM2.5 concentrations. The introduction of new technologies, including advanced and eco-labeled stoves and boilers, high efficiency stoves and boilers, and pellet stoves and boilers, has reduced air pollution levels in Croatia (Table 17).120
However, the absence of subsidies or other governmental financial support programs limits the sale of costly eco-labelled stoves and boilers.
Table 17: Biomass combustion technology shares in Croatia
Technology type for biomass combustion 1990 2005 2017 2030 Open fireplaces 8.5% 10% 10% 8% Boilers (manual feed) 33% 23% 18% 12% Conventional stoves 59% 67% 36% 32% Advanced / Eco-labelled stoves 0% 0% 12% 12% High-efficiency stoves 0% 0% 21% 20% Pellet stoves and boilers 0% 0% 3% 20%
Source: Ministry of Environment and Energy. 2020. “Republic of Croatia. 2020. Informative inventory report (1990 -2018).” Zagreb: Ministry of Environment and Energy.
About 430 people die prematurely every year from illness attributable to HAP caused by the use of inefficient appliances and solid biofuels for cooking and heating in Croatia. In 2017, almost half the residential sector used biomass for heating and cooking, while a substantial number of households used simple, inefficient, and leaky firewood stoves and ovens that produce high levels of smoke and indoor pollution. There is consistent evidence that exposure to HAP can lead to acute lower respiratory infections in children under five, and ischemic heart disease, stroke, COPD, and lung cancer in adults. The GBD, a major global study on the causes and risk factors for death and disease, attributed 430 premature deaths to HAP in Croatia (2017). 121
In Croatia, annual economic cost associated with mortality from exposure to HAP is approximated at EUR 440 to EUR 630 million, the equivalent of 0.8 to 1.2 percent of GDP in 2018. The welfare-based cost of mortality is estimated by multiplying the number of premature deaths by the value of statistical life (VSL), used for the analysis on AAP. These emissions are not expected to decline markedly if solid fuels – mainly low-grade wood – remain the main fuel sources of households, used in combination with inefficient stoves and boilers.
117 Total final energy consumption in 2017 equaled 6,780 thousand tons of oil equivalent (ktoe). Eurostat. 2019a. “Energy balance sheet 2017 Data.” Lux-embourg: European Commission. https://ec.europa.eu/eurostat/documents/3217494/10077623/KS-EN-19-001-EN-N.pdf/59b44e6f-ff33-488b-a85f-9c4f60703afc 118 Eurostat. 2019b. “Energy balance guide. Methodology guide for the construction of energy balances and operational guide for the energy balance build-er tool.” Luxembourg: European Commission. https://ec.europa.eu/eurostat/documents/38154/4956218/ENERGY-BALANCE-GUIDE-DRAFT-31JANU-ARY2019.pdf/cf121393-919f-4b84-9059-cdf0f69ec045 119 The World Bank. 2017. “Croatia Energy Sector Note.” Washington DC.: The World Bank. http://documents.worldbank.org/curated/en/126131551124308323/pdf/AUS0000353-WP-REVISED-P166022-PUBLIC.pdf 120 Ministry of Environment and Energy. 2020. “Republic of Croatia. 2020. Informative inventory report (1990 -2018).” Zagreb: Ministry of Environment and Energy121 The confidence interval equals [222; 768]. Based on GBD. 2017. “GBD Results Tool”. http://ghdx.healthdata.org/gbd-results-tool (accessed on June 19, 2020).
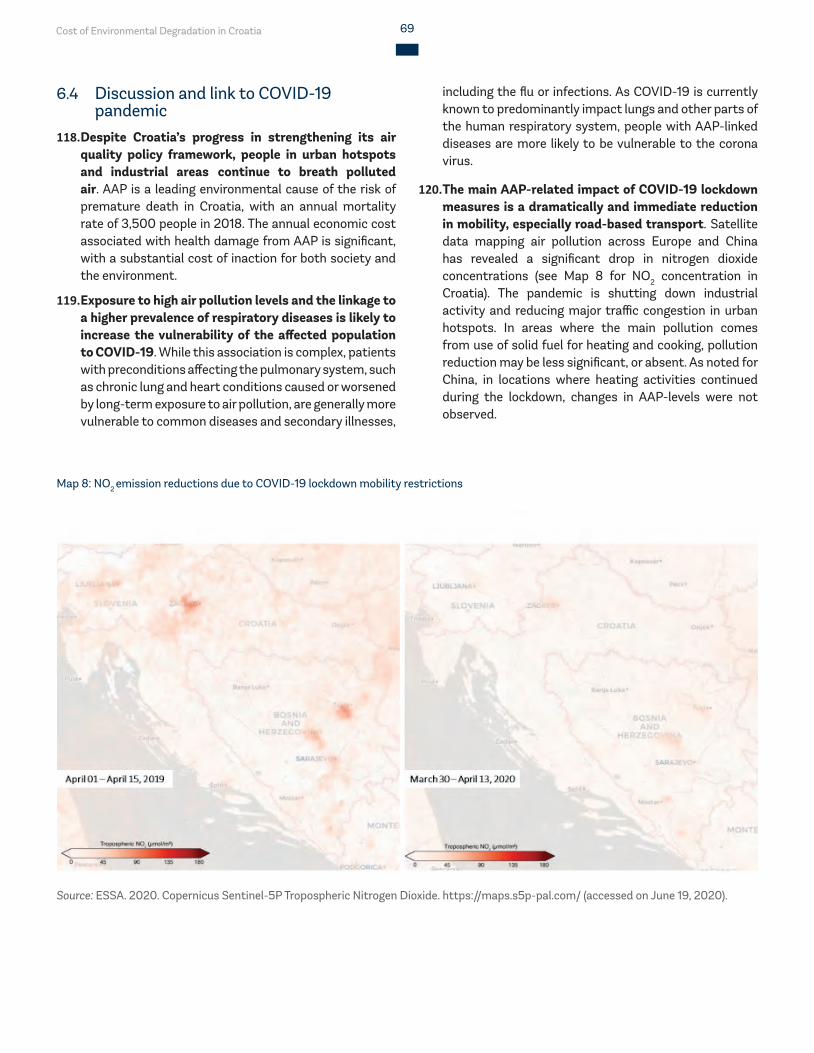
Cost of Environmental Degradation in Croatia 69
6.4 Discussion and link to COVID-19 pandemic
118. Despite Croatia’s progress in strengthening its air quality policy framework, people in urban hotspots and industrial areas continue to breath polluted air. AAP is a leading environmental cause of the risk of premature death in Croatia, with an annual mortality rate of 3,500 people in 2018. The annual economic cost associated with health damage from AAP is significant, with a substantial cost of inaction for both society and the environment.
119. Exposure to high air pollution levels and the linkage to a higher prevalence of respiratory diseases is likely to increase the vulnerability of the affected population to COVID-19. While this association is complex, patients with preconditions affecting the pulmonary system, such as chronic lung and heart conditions caused or worsened by long-term exposure to air pollution, are generally more vulnerable to common diseases and secondary illnesses,
Map 8: NO2 emission reductions due to COVID-19 lockdown mobility restrictions
Source: ESSA. 2020. Copernicus Sentinel-5P Tropospheric Nitrogen Dioxide. https://maps.s5p-pal.com/ (accessed on June 19, 2020).
including the flu or infections. As COVID-19 is currently known to predominantly impact lungs and other parts of the human respiratory system, people with AAP-linked diseases are more likely to be vulnerable to the corona virus.
120. The main AAP-related impact of COVID-19 lockdown measures is a dramatically and immediate reduction in mobility, especially road-based transport. Satellite data mapping air pollution across Europe and China has revealed a significant drop in nitrogen dioxide concentrations (see Map 8 for NO2 concentration in Croatia). The pandemic is shutting down industrial activity and reducing major traffic congestion in urban hotspots. In areas where the main pollution comes from use of solid fuel for heating and cooking, pollution reduction may be less significant, or absent. As noted for China, in locations where heating activities continued during the lockdown, changes in AAP-levels were not observed.
Map 8: NO2 emission reductions due to COVID-19 lockdown mobility restrictions
Cost of Environmental Degradation in Croatia 70
121. The complexity of air pollution calls for a strategic and integrated approach that is based on a comprehensive understanding of air pollution sources and context-specific solutions. Given the ongoing COVID-19 pandemic, short-term measures should focus on three aspects: (i) avoiding any further aggravation of the pollution situation, e.g. by strictly enforcing and avoid relaxing existing air quality regulations; (ii) effectively reducing air pollution, e.g. with more stringent enforcement of quality standards for heating and cooking fuels, including adopting of social protection measures to compensate households for higher fuel prices; and (iii) reducing exposure to air pollution. In the long term, countries need to continue investing in their air quality management capacity, from technical and institutional capacity development, to policy and institutional reforms, and infrastructure investments.
Cost of Environmental Degradation in Croatia 71
TOURISM
Cost of Environmental Degradation in Croatia 72
7 TOURISM
122. While the tourism industry is vital to Croatia’s economy, the strong seasonality of tourism tends to place increased pressure on the local environment and public infrastructure. Section 7.1 describes the overall importance of the tourist industry to the Croatian economy, while emphasizing increased environmental pressure and impacts related to the growth in tourist arrivals. Section 7.2 and 7.3 analyze the collection and treatment costs of solid waste and wastewater generated by tourists. Cruise ships have a particular impact on the marine environment due to the discharge of wastewater and solid waste, discussed in Section 7.4. While the earlier sections estimate collection and treatment costs of tourist related waste and wastewater, Section 7.5 calculates costs related to environmental degradation. Importantly, these costs are already reflected in previous chapters (Chapter 4 on wastewater and Chapter 5 on solid waste), reflecting the scale of environmental degradation attributable to the tourism industry. The final section discusses the impact of COVID-19 on the tourism industry in Croatia.
7.1 Background123. The total contribution of tourism to Croatia’s GDP
accounted for EUR 10 billion, equivalent to 20 percent of GDP in 2018.122 With its advantageous location and abundant natural attractions, Croatia is an important tourist destination in Europe. The natural environment of Croatia is a crucial asset for the country’s economy; tourism is a major source for Croatia’s revenue, employment and other related services. In addition to its direct economic impact, tourism generates significant indirect and induced impacts (Figure 14).
124. The Ministry of Tourism in Croatia counted 19 million tourist arrivals in 2018,123 with about half of the total number of visits between July and August. Tourism in Croatia has a very strong seasonal component. Over the last five years, about 75 percent of tourist arrivals (there were 19 million tourist arrivals in 2018 alone) were registered between June and September, with the highest peaks in July and August. Istria, Split-Dalmatia, and Primorje-Gorski Kotar counties are the top tourist destinations in Croatia, hosting 24 percent, 18 percent and 16 percent of total tourists respectively (Table 18). On average, tourists spend five nights at their destinations.
122 Ministry of Tourism. 2019. “Tourism in Figures 2018.” Zagreb: The Ministry of Tourism. https://www.htz.hr/sites/default/files/2019-06/HTZ%20TUB%20ENG_2018_0.pdf.123 Ministry of Tourism. 2019. “Tourism in Figures 2018.” Zagreb: The Ministry of Tourism. https://www.htz.hr/sites/default/files/2019-06/HTZ%20TUB%20ENG_2018_0.pdf.
125. Along with its positive impact on economic development, tourism imposes increased pressure on Croatia’s environment. The surge of tourist arrivals (including by car and cruise tourism) and the increased frequency of holidays cause environmental impacts at the regional and local level, reinforced by the strong seasonality of tourist flows. Negative environmental impacts occur when the level of visitor use is greater than the environment’s ability to cope with this use. In many national parks, ecosystem services are negatively affected by a seasonal inflow of tourists, but also by excessive development and road construction in buffer zones. In Croatia, major tourist destinations face challenges related to ecosystem service losses, water supply, pressure on local water sources, and waste and wastewater collection and treatment, which may exceed the carrying capacity, especially on small islands. Other consequences of tourism development that may compromise vulnerable natural habitats include land take and soil sealing, air and noise pollution from local means of transport, and visual pollution from the expansion of built-up areas.
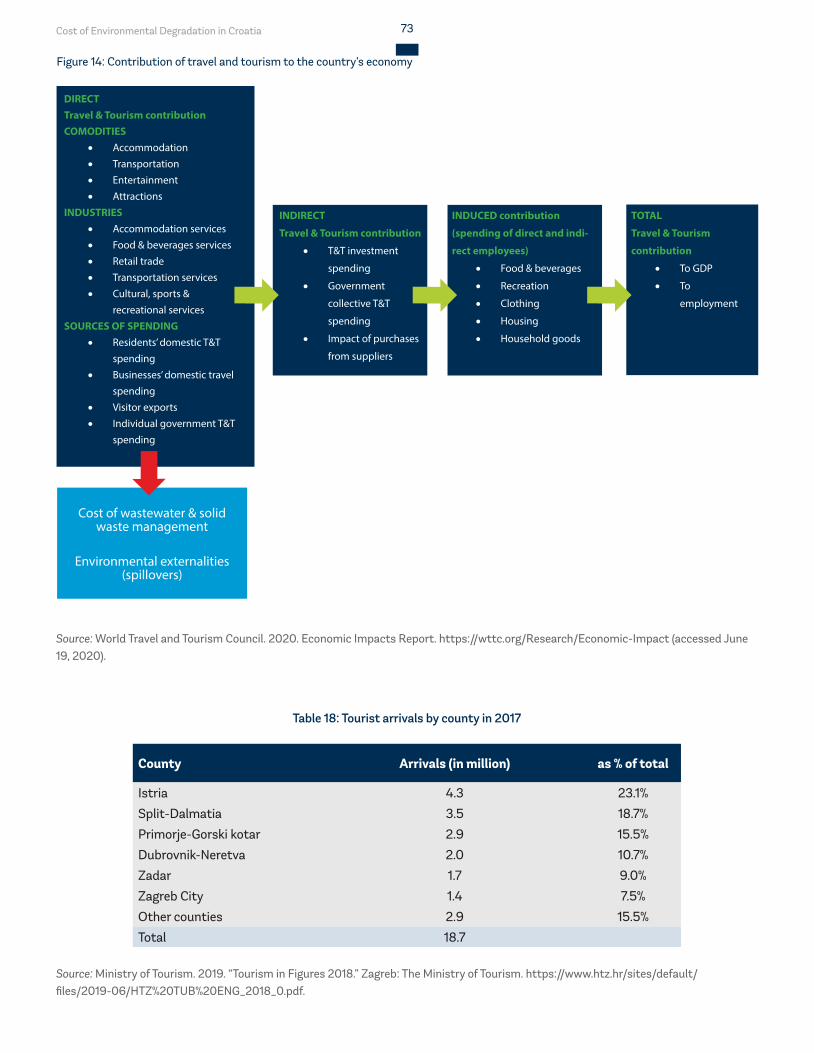
Cost of Environmental Degradation in Croatia 73
Source: World Travel and Tourism Council. 2020. Economic Impacts Report. https://wttc.org/Research/Economic-Impact (accessed June 19, 2020).
Figure 14: Contribution of travel and tourism to the country’s economy
DIRECT Travel & Tourism contributionCOMODITIES
• Accommodation• Transportation• Entertainment• Attractions
INDUSTRIES• Accommodation services• Food & beverages services• Retail trade• Transportation services• Cultural, sports &
recreational servicesSOURCES OF SPENDING
• Residents’ domestic T&T spending
• Businesses’ domestic travel spending
• Visitor exports• Individual government T&T
spending
INDIRECT
Travel & Tourism contribution
• T&T investment
spending
• Government
collective T&T
spending
• Impact of purchases
from suppliers
INDUCED contribution
(spending of direct and indi-
rect employees)
• Food & beverages
• Recreation
• Clothing
• Housing
• Household goods
TOTAL
Travel & Tourism
contribution
• To GDP
• To
employment
Cost of wastewater & solid waste management
Environmental externalities (spillovers)
Table 18: Tourist arrivals by county in 2017
County Arrivals (in million) as % of total
Istria 4.3 23.1%
Split-Dalmatia 3.5 18.7%
Primorje-Gorski kotar 2.9 15.5%
Dubrovnik-Neretva 2.0 10.7%
Zadar 1.7 9.0%
Zagreb City 1.4 7.5%
Other counties 2.9 15.5%
Total 18.7
Source: Ministry of Tourism. 2019. “Tourism in Figures 2018.” Zagreb: The Ministry of Tourism. https://www.htz.hr/sites/default/files/2019-06/HTZ%20TUB%20ENG_2018_0.pdf.
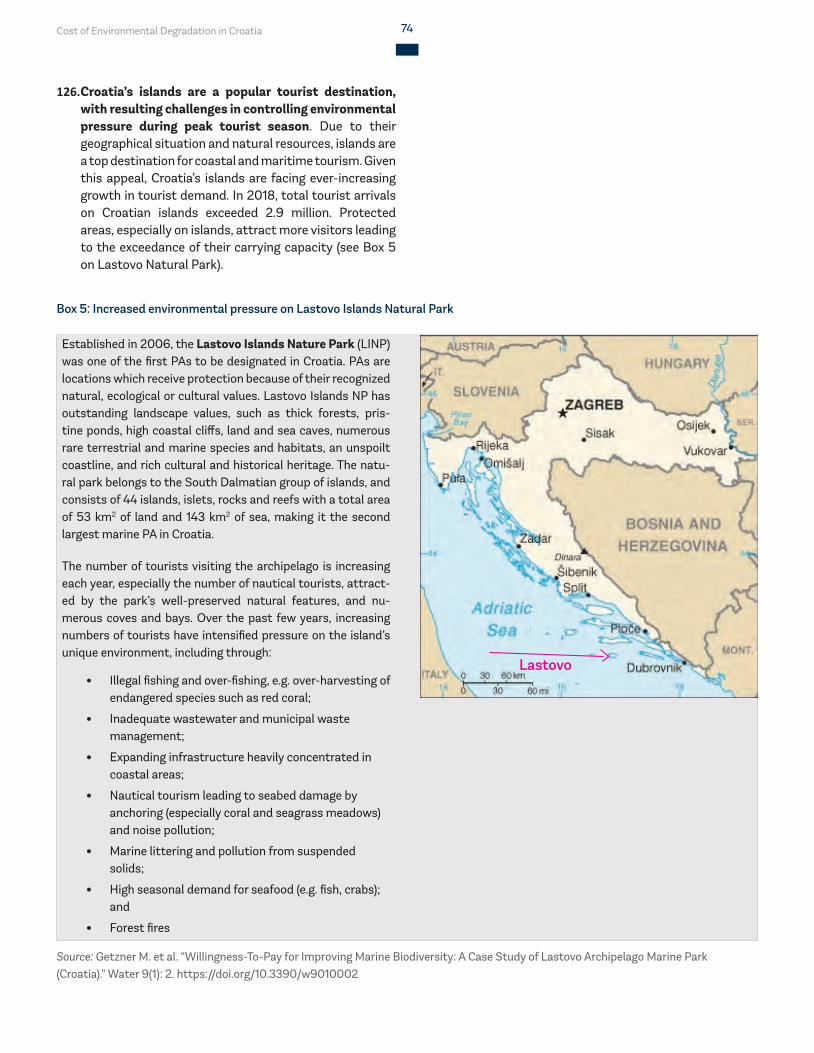
Cost of Environmental Degradation in Croatia 74
126. Croatia’s islands are a popular tourist destination, with resulting challenges in controlling environmental pressure during peak tourist season. Due to their geographical situation and natural resources, islands are a top destination for coastal and maritime tourism. Given this appeal, Croatia’s islands are facing ever-increasing growth in tourist demand. In 2018, total tourist arrivals on Croatian islands exceeded 2.9 million. Protected areas, especially on islands, attract more visitors leading to the exceedance of their carrying capacity (see Box 5 on Lastovo Natural Park).
Box 5: Increased environmental pressure on Lastovo Islands Natural Park
Established in 2006, the Lastovo Islands Nature Park (LINP) was one of the first PAs to be designated in Croatia. PAs are locations which receive protection because of their recognized natural, ecological or cultural values. Lastovo Islands NP has outstanding landscape values, such as thick forests, pris-tine ponds, high coastal cliffs, land and sea caves, numerous rare terrestrial and marine species and habitats, an unspoilt coastline, and rich cultural and historical heritage. The natu-ral park belongs to the South Dalmatian group of islands, and consists of 44 islands, islets, rocks and reefs with a total area of 53 km2 of land and 143 km2 of sea, making it the second largest marine PA in Croatia.
The number of tourists visiting the archipelago is increasing each year, especially the number of nautical tourists, attract-ed by the park’s well-preserved natural features, and nu-merous coves and bays. Over the past few years, increasing numbers of tourists have intensified pressure on the island’s unique environment, including through:
• Illegal fishing and over-fishing, e.g. over-harvesting of endangered species such as red coral;
• Inadequate wastewater and municipal waste management;
• Expanding infrastructure heavily concentrated in coastal areas;
• Nautical tourism leading to seabed damage by anchoring (especially coral and seagrass meadows) and noise pollution;
• Marine littering and pollution from suspended solids;
• High seasonal demand for seafood (e.g. fish, crabs); and
• Forest fires
Source: Getzner M. et al. “Willingness-To-Pay for Improving Marine Biodiversity: A Case Study of Lastovo Archipelago Marine Park (Croatia).” Water 9(1): 2. https://doi.org/10.3390/w9010002
Lastovo
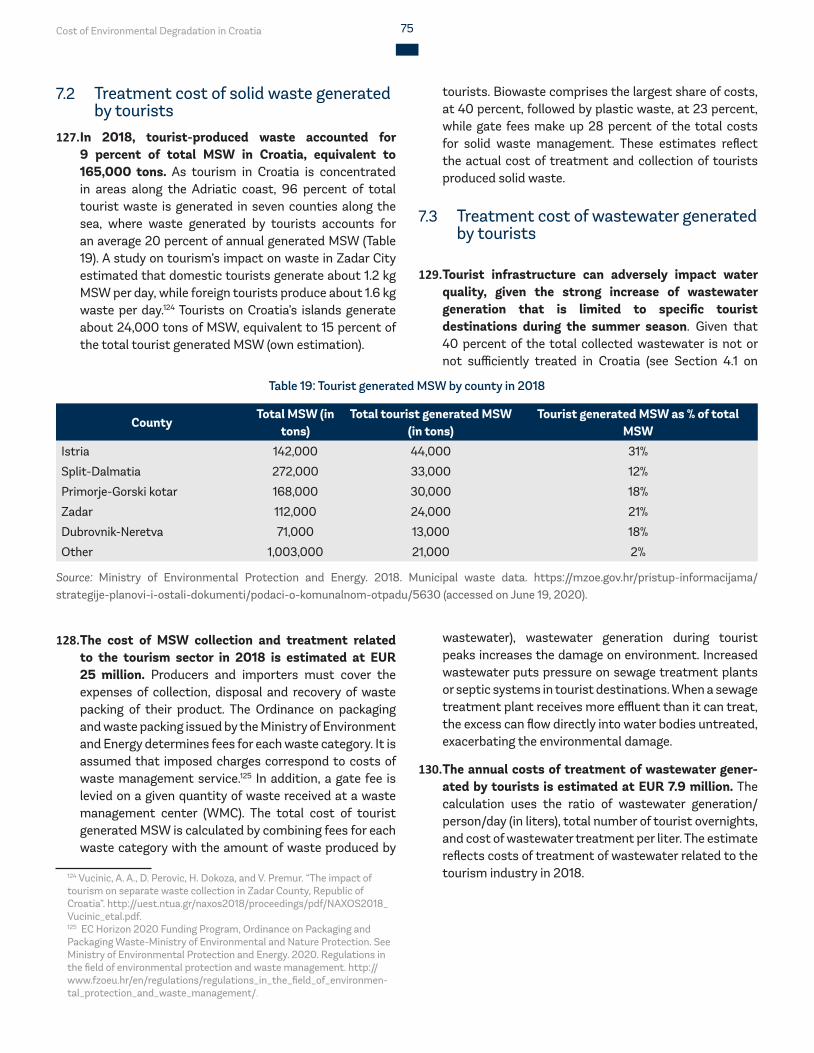
Cost of Environmental Degradation in Croatia 75
7.2 Treatment cost of solid waste generated by tourists
127. In 2018, tourist-produced waste accounted for 9 percent of total MSW in Croatia, equivalent to 165,000 tons. As tourism in Croatia is concentrated in areas along the Adriatic coast, 96 percent of total tourist waste is generated in seven counties along the sea, where waste generated by tourists accounts for an average 20 percent of annual generated MSW (Table 19). A study on tourism’s impact on waste in Zadar City estimated that domestic tourists generate about 1.2 kg MSW per day, while foreign tourists produce about 1.6 kg waste per day.124 Tourists on Croatia’s islands generate about 24,000 tons of MSW, equivalent to 15 percent of the total tourist generated MSW (own estimation).
128. The cost of MSW collection and treatment related to the tourism sector in 2018 is estimated at EUR 25 million. Producers and importers must cover the expenses of collection, disposal and recovery of waste packing of their product. The Ordinance on packaging and waste packing issued by the Ministry of Environment and Energy determines fees for each waste category. It is assumed that imposed charges correspond to costs of waste management service.125 In addition, a gate fee is levied on a given quantity of waste received at a waste management center (WMC). The total cost of tourist generated MSW is calculated by combining fees for each waste category with the amount of waste produced by
124 Vucinic, A. A., D. Perovic, H. Dokoza, and V. Premur. “The impact of tourism on separate waste collection in Zadar County, Republic of Croatia”. http://uest.ntua.gr/naxos2018/proceedings/pdf/NAXOS2018_Vucinic_etal.pdf.125 EC Horizon 2020 Funding Program, Ordinance on Packaging and Packaging Waste-Ministry of Environmental and Nature Protection. See Ministry of Environmental Protection and Energy. 2020. Regulations in the field of environmental protection and waste management. http://www.fzoeu.hr/en/regulations/regulations_in_the_field_of_environmen-tal_protection_and_waste_management/.
tourists. Biowaste comprises the largest share of costs, at 40 percent, followed by plastic waste, at 23 percent, while gate fees make up 28 percent of the total costs for solid waste management. These estimates reflect the actual cost of treatment and collection of tourists produced solid waste.
7.3 Treatment cost of wastewater generated by tourists
129. Tourist infrastructure can adversely impact water quality, given the strong increase of wastewater generation that is limited to specific tourist destinations during the summer season. Given that 40 percent of the total collected wastewater is not or not sufficiently treated in Croatia (see Section 4.1 on
wastewater), wastewater generation during tourist peaks increases the damage on environment. Increased wastewater puts pressure on sewage treatment plants or septic systems in tourist destinations. When a sewage treatment plant receives more effluent than it can treat, the excess can flow directly into water bodies untreated, exacerbating the environmental damage.
130. The annual costs of treatment of wastewater gener-ated by tourists is estimated at EUR 7.9 million. The calculation uses the ratio of wastewater generation/person/day (in liters), total number of tourist overnights, and cost of wastewater treatment per liter. The estimate reflects costs of treatment of wastewater related to the tourism industry in 2018.
Table 19: Tourist generated MSW by county in 2018
CountyTotal MSW (in
tons)Total tourist generated MSW
(in tons)Tourist generated MSW as % of total
MSWIstria 142,000 44,000 31%
Split-Dalmatia 272,000 33,000 12%
Primorje-Gorski kotar 168,000 30,000 18%
Zadar 112,000 24,000 21%
Dubrovnik-Neretva 71,000 13,000 18%
Other 1,003,000 21,000 2%
Source: Ministry of Environmental Protection and Energy. 2018. Municipal waste data. https://mzoe.gov.hr/pristup-informacijama/strategije-planovi-i-ostali-dokumenti/podaci-o-komunalnom-otpadu/5630 (accessed on June 19, 2020).
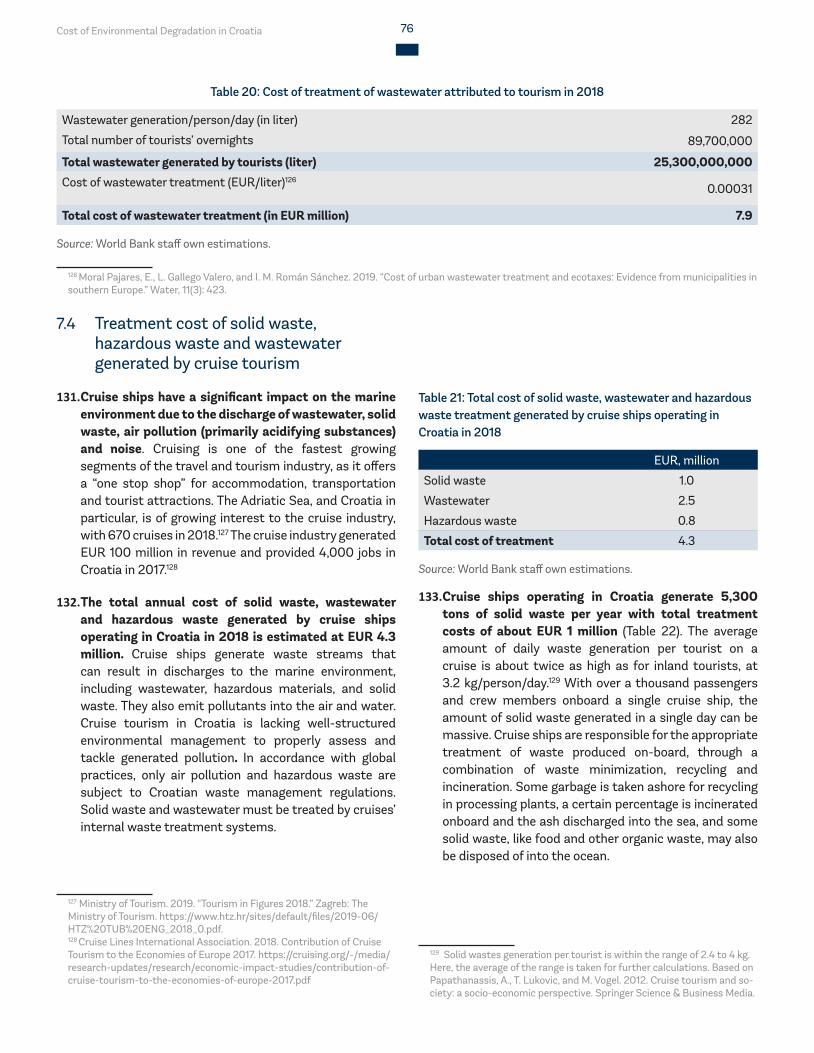
Cost of Environmental Degradation in Croatia 76
Table 20: Cost of treatment of wastewater attributed to tourism in 2018
Wastewater generation/person/day (in liter) 282
Total number of tourists’ overnights 89,700,000
Total wastewater generated by tourists (liter) 25,300,000,000Cost of wastewater treatment (EUR/liter)126
0.00031
Total cost of wastewater treatment (in EUR million) 7.9
Source: World Bank staff own estimations.
126 Moral Pajares, E., L. Gallego Valero, and I. M. Román Sánchez. 2019. “Cost of urban wastewater treatment and ecotaxes: Evidence from municipalities in southern Europe.” Water, 11(3): 423.
7.4 Treatment cost of solid waste, hazardous waste and wastewater generated by cruise tourism
131. Cruise ships have a significant impact on the marine environment due to the discharge of wastewater, solid waste, air pollution (primarily acidifying substances) and noise. Cruising is one of the fastest growing segments of the travel and tourism industry, as it offers a “one stop shop” for accommodation, transportation and tourist attractions. The Adriatic Sea, and Croatia in particular, is of growing interest to the cruise industry, with 670 cruises in 2018.127 The cruise industry generated EUR 100 million in revenue and provided 4,000 jobs in Croatia in 2017.128
132. The total annual cost of solid waste, wastewater and hazardous waste generated by cruise ships operating in Croatia in 2018 is estimated at EUR 4.3 million. Cruise ships generate waste streams that can result in discharges to the marine environment, including wastewater, hazardous materials, and solid waste. They also emit pollutants into the air and water. Cruise tourism in Croatia is lacking well-structured environmental management to properly assess and tackle generated pollution. In accordance with global practices, only air pollution and hazardous waste are subject to Croatian waste management regulations. Solid waste and wastewater must be treated by cruises’ internal waste treatment systems.
127 Ministry of Tourism. 2019. “Tourism in Figures 2018.” Zagreb: The Ministry of Tourism. https://www.htz.hr/sites/default/files/2019-06/HTZ%20TUB%20ENG_2018_0.pdf.128 Cruise Lines International Association. 2018. Contribution of Cruise Tourism to the Economies of Europe 2017. https://cruising.org/-/media/research-updates/research/economic-impact-studies/contribution-of-cruise-tourism-to-the-economies-of-europe-2017.pdf
Table 21: Total cost of solid waste, wastewater and hazardous waste treatment generated by cruise ships operating in Croatia in 2018
EUR, million
Solid waste 1.0
Wastewater 2.5
Hazardous waste 0.8
Total cost of treatment 4.3
Source: World Bank staff own estimations.
133. Cruise ships operating in Croatia generate 5,300 tons of solid waste per year with total treatment costs of about EUR 1 million (Table 22). The average amount of daily waste generation per tourist on a cruise is about twice as high as for inland tourists, at 3.2 kg/person/day.129 With over a thousand passengers and crew members onboard a single cruise ship, the amount of solid waste generated in a single day can be massive. Cruise ships are responsible for the appropriate treatment of waste produced on-board, through a combination of waste minimization, recycling and incineration. Some garbage is taken ashore for recycling in processing plants, a certain percentage is incinerated onboard and the ash discharged into the sea, and some solid waste, like food and other organic waste, may also be disposed of into the ocean.
129 Solid wastes generation per tourist is within the range of 2.4 to 4 kg. Here, the average of the range is taken for further calculations. Based on Papathanassis, A., T. Lukovic, and M. Vogel. 2012. Cruise tourism and so-ciety: a socio-economic perspective. Springer Science & Business Media.
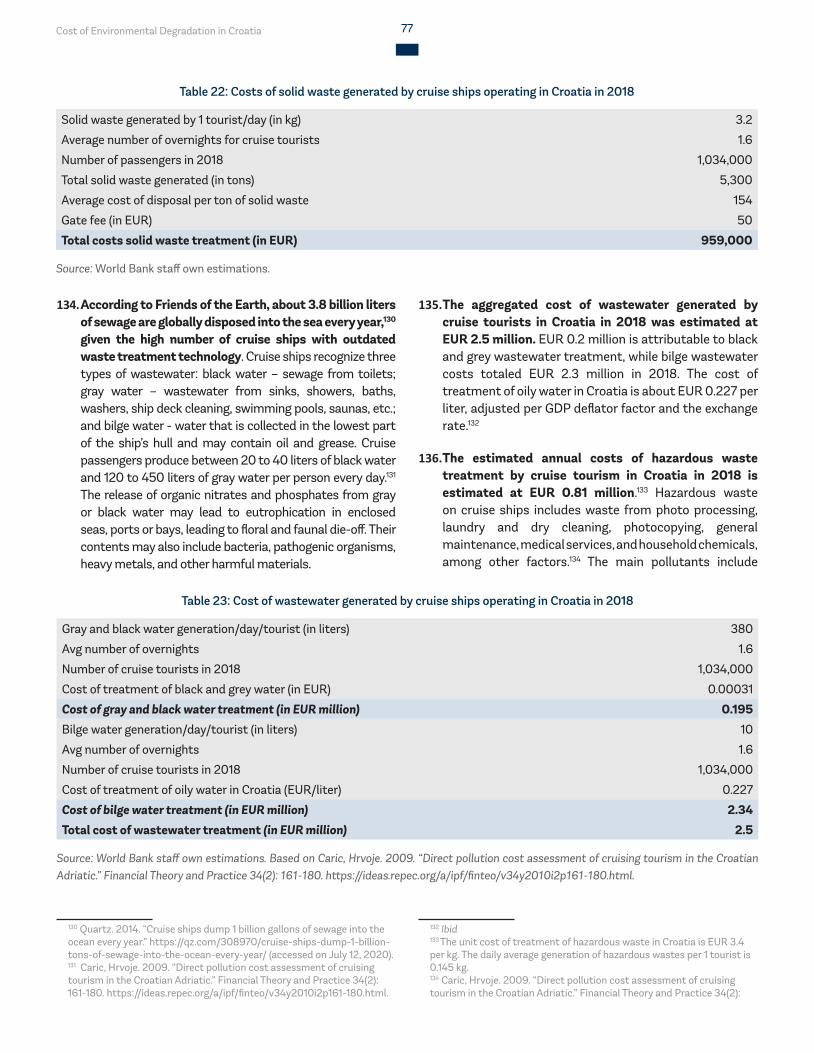
Cost of Environmental Degradation in Croatia 77
Table 22: Costs of solid waste generated by cruise ships operating in Croatia in 2018
Solid waste generated by 1 tourist/day (in kg) 3.2
Average number of overnights for cruise tourists 1.6
Number of passengers in 2018 1,034,000
Total solid waste generated (in tons) 5,300
Average cost of disposal per ton of solid waste 154
Gate fee (in EUR) 50
Total costs solid waste treatment (in EUR) 959,000
Source: World Bank staff own estimations.
134. According to Friends of the Earth, about 3.8 billion liters of sewage are globally disposed into the sea every year,130 given the high number of cruise ships with outdated waste treatment technology. Cruise ships recognize three types of wastewater: black water – sewage from toilets; gray water – wastewater from sinks, showers, baths, washers, ship deck cleaning, swimming pools, saunas, etc.; and bilge water - water that is collected in the lowest part of the ship’s hull and may contain oil and grease. Cruise passengers produce between 20 to 40 liters of black water and 120 to 450 liters of gray water per person every day.131 The release of organic nitrates and phosphates from gray or black water may lead to eutrophication in enclosed seas, ports or bays, leading to floral and faunal die-off. Their contents may also include bacteria, pathogenic organisms, heavy metals, and other harmful materials.
130 Quartz. 2014. “Cruise ships dump 1 billion gallons of sewage into the ocean every year.” https://qz.com/308970/cruise-ships-dump-1-billion-tons-of-sewage-into-the-ocean-every-year/ (accessed on July 12, 2020).131 Caric, Hrvoje. 2009. “Direct pollution cost assessment of cruising tourism in the Croatian Adriatic.” Financial Theory and Practice 34(2): 161-180. https://ideas.repec.org/a/ipf/finteo/v34y2010i2p161-180.html.
Table 23: Cost of wastewater generated by cruise ships operating in Croatia in 2018
Gray and black water generation/day/tourist (in liters) 380
Avg number of overnights 1.6
Number of cruise tourists in 2018 1,034,000
Cost of treatment of black and grey water (in EUR) 0.00031
Cost of gray and black water treatment (in EUR million) 0.195Bilge water generation/day/tourist (in liters) 10
Avg number of overnights 1.6
Number of cruise tourists in 2018 1,034,000
Cost of treatment of oily water in Croatia (EUR/liter) 0.227
Cost of bilge water treatment (in EUR million) 2.34Total cost of wastewater treatment (in EUR million) 2.5
Source: World Bank staff own estimations. Based on Caric, Hrvoje. 2009. “Direct pollution cost assessment of cruising tourism in the Croatian Adriatic.” Financial Theory and Practice 34(2): 161-180. https://ideas.repec.org/a/ipf/finteo/v34y2010i2p161-180.html.
135. The aggregated cost of wastewater generated by cruise tourists in Croatia in 2018 was estimated at EUR 2.5 million. EUR 0.2 million is attributable to black and grey wastewater treatment, while bilge wastewater costs totaled EUR 2.3 million in 2018. The cost of treatment of oily water in Croatia is about EUR 0.227 per liter, adjusted per GDP deflator factor and the exchange rate.132
136. The estimated annual costs of hazardous waste treatment by cruise tourism in Croatia in 2018 is estimated at EUR 0.81 million.133 Hazardous waste on cruise ships includes waste from photo processing, laundry and dry cleaning, photocopying, general maintenance, medical services, and household chemicals, among other factors.134 The main pollutants include
132 Ibid133 The unit cost of treatment of hazardous waste in Croatia is EUR 3.4 per kg. The daily average generation of hazardous wastes per 1 tourist is 0.145 kg.134 Caric, Hrvoje. 2009. “Direct pollution cost assessment of cruising tourism in the Croatian Adriatic.” Financial Theory and Practice 34(2):
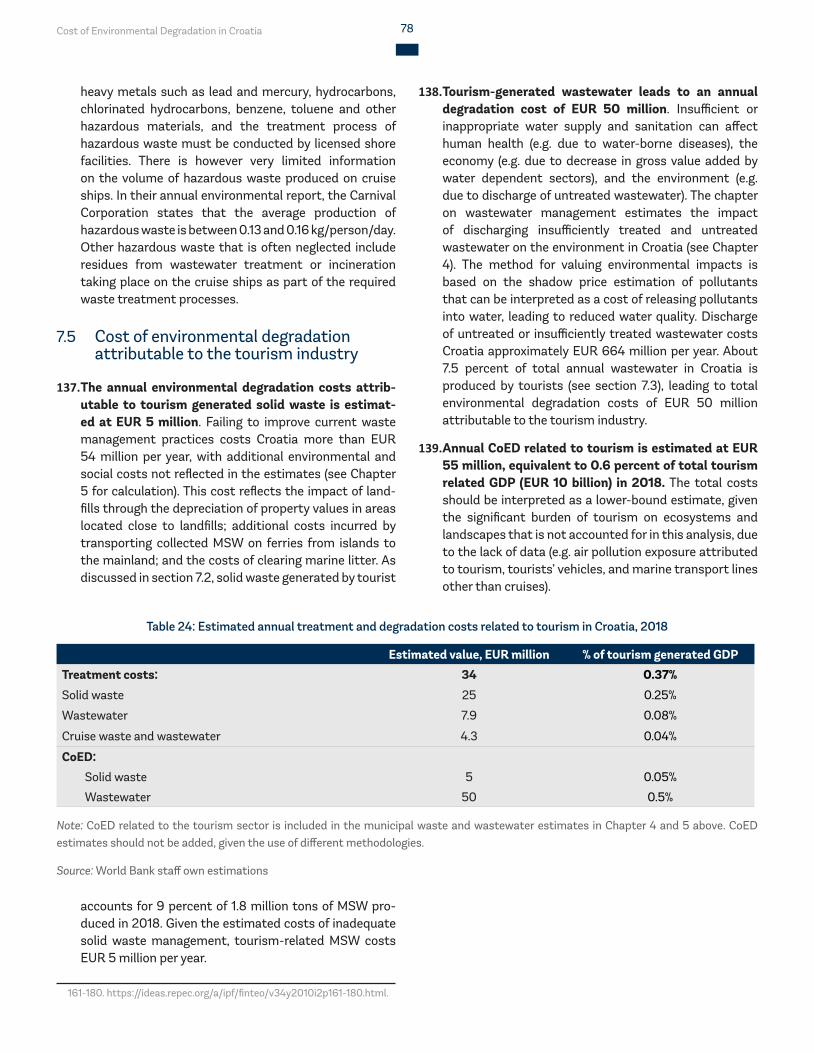
Cost of Environmental Degradation in Croatia 78
heavy metals such as lead and mercury, hydrocarbons, chlorinated hydrocarbons, benzene, toluene and other hazardous materials, and the treatment process of hazardous waste must be conducted by licensed shore facilities. There is however very limited information on the volume of hazardous waste produced on cruise ships. In their annual environmental report, the Carnival Corporation states that the average production of hazardous waste is between 0.13 and 0.16 kg/person/day. Other hazardous waste that is often neglected include residues from wastewater treatment or incineration taking place on the cruise ships as part of the required waste treatment processes.
7.5 Cost of environmental degradation attributable to the tourism industry
137. The annual environmental degradation costs attrib-utable to tourism generated solid waste is estimat-ed at EUR 5 million. Failing to improve current waste management practices costs Croatia more than EUR 54 million per year, with additional environmental and social costs not reflected in the estimates (see Chapter 5 for calculation). This cost reflects the impact of land-fills through the depreciation of property values in areas located close to landfills; additional costs incurred by transporting collected MSW on ferries from islands to the mainland; and the costs of clearing marine litter. As discussed in section 7.2, solid waste generated by tourist
accounts for 9 percent of 1.8 million tons of MSW pro-duced in 2018. Given the estimated costs of inadequate solid waste management, tourism-related MSW costs EUR 5 million per year.
161-180. https://ideas.repec.org/a/ipf/finteo/v34y2010i2p161-180.html.
138. Tourism-generated wastewater leads to an annual degradation cost of EUR 50 million. Insufficient or inappropriate water supply and sanitation can affect human health (e.g. due to water-borne diseases), the economy (e.g. due to decrease in gross value added by water dependent sectors), and the environment (e.g. due to discharge of untreated wastewater). The chapter on wastewater management estimates the impact of discharging insufficiently treated and untreated wastewater on the environment in Croatia (see Chapter 4). The method for valuing environmental impacts is based on the shadow price estimation of pollutants that can be interpreted as a cost of releasing pollutants into water, leading to reduced water quality. Discharge of untreated or insufficiently treated wastewater costs Croatia approximately EUR 664 million per year. About 7.5 percent of total annual wastewater in Croatia is produced by tourists (see section 7.3), leading to total environmental degradation costs of EUR 50 million attributable to the tourism industry.
139. Annual CoED related to tourism is estimated at EUR 55 million, equivalent to 0.6 percent of total tourism related GDP (EUR 10 billion) in 2018. The total costs should be interpreted as a lower-bound estimate, given the significant burden of tourism on ecosystems and landscapes that is not accounted for in this analysis, due to the lack of data (e.g. air pollution exposure attributed to tourism, tourists’ vehicles, and marine transport lines other than cruises).
Table 24: Estimated annual treatment and degradation costs related to tourism in Croatia, 2018
Estimated value, EUR million % of tourism generated GDPTreatment costs: 34 0.37%Solid waste 25 0.25%
Wastewater 7.9 0.08%
Cruise waste and wastewater 4.3 0.04%
CoED: Solid waste 5 0.05%
Wastewater 50 0.5%
Note: CoED related to the tourism sector is included in the municipal waste and wastewater estimates in Chapter 4 and 5 above. CoED estimates should not be added, given the use of different methodologies.
Source: World Bank staff own estimations
Cost of Environmental Degradation in Croatia 79
7.6 Discussion and impact of COVID-19140. The annual cost of treatment of tourist generated
waste and wastewater is estimated at EUR 34 million, equivalent to 0.4 percent of the direct contribution of tourism to Croatia’s GDP (EUR 10 billion) in 2018. The economic cost includes costs of waste and wastewater management generated by “land-based” tourism, as well as by cruise tourism (Table 24). Moreover, the estimation of the environmental degradation costs related to solid waste generated by tourism is EUR 5 million, and EUR 50 million related to tourism produced wastewater (Table 24). Total costs must be interpreted as lower-bound estimates, given limitations in data to account for other aspects of tourism-related environmental damages.
141. Rising vulnerability to climate change impacts, biodiversity losses and quality of ecosystems are putting coastal territories and local communities at risk, requiring urgent policy actions. It is necessary to consider long-term trends of tourism production and consumption patterns to anticipate growth scenarios and increase resilience to natural, social and economic shocks for local communities and socio-economic structures.135 Considering the economic importance of tourism in Croatia and its potential future growth, it is important to introduce sustainable management, tourism destination strategies and planning, as well as addressing current disputes, such as land property ownership.
142. The COVID-19 pandemic has severely affected the tourism industry. Since the World Health Organization (WHO) declared COVID-19 a pandemic, many countries have implemented nationwide lockdowns, closing international borders and restricting public movement. Given the huge effect of travel restrictions on tourism, the Croatian government expects revenues from tourism to drastically drop compared to previous year’s revenues. While in May 2020, the Government and the Croatian Tourism Union announced plans for the opening of the tourist season, the tourism sector delivered only around 60 to 70 percent of the previous year’s results.136
135 Healy, H., J. Martínez-Alier, L. Temper, M. Walter, J. Gerber. 2013. Eco-logical Economics from Ground up. Routledge. ISBN 9781849713993.136 OECD. 2020b. “The COVID-19 crisis in Croatia.” https://www.oecd.org/south-east-europe/COVID-19-Crisis-in-Croatia.pdf (accessed Sep-tember 1, 2020).

Cost of Environmental Degradation in Croatia 80
Cost of Environmental Degradation in Croatia 81
THE WAY FORWARDPhoto: Vladimir Kalinski
Cost of Environmental Degradation in Croatia 82
8 THE WAY FORWARD143. This report estimates in monetary terms CoED in
Croatia for 2018. The loss of ecosystem services is equivalent to about 0.2 percent of Croatia’s GDP in 2018. Cost of pollution related to inadequate wastewater treatment is equivalent to about 1.2 percent of Croatia’s GDP, while cost of insufficient solid waste management, including marine litter, led to an annual loss equivalent to 0.1 percent of the country’s GDP in 2018. Using the VSL calculated for Croatia, ambient air pollution exceeding the EU NERT has an economic cost that is equivalent to 0.8 percent of Croatia’s GDP in 2018. The CoED attributable to the tourism industry is estimated at 0.1 percent of Croatia’s GDP. As different valuation methods are applied for each impact area, these estimates should not be added or otherwise directly compared.
144. This report presents indicative lower-bound costs of selected ecosystem service losses. The estimate of EUR 90 million, for example, is an indicative value for the annual loss of provisioning benefits of forest ecosystems, and regulating services of carbon sequestration, water supply for hydropower, and pollination in Croatia. Other essential provisioning, regulating, and cultural services are not estimated. Robust estimations of ecosystem services should be based on Natural Capital Accounting (NCA) where there are internationally agreed accounting standards. Wealth Accounting and the Valuation of Ecosystem Services (WAVES)137 aims to promote sustainable development by ensuring that natural resources are integrated into development planning and national economic accounts. This activity is cross sectoral and involves working with ministries of economy and finance to integrate natural resources into development planning to enable better-informed decision-making processes. A national NCA program will help to develop Croatia-specific ecosystem accounting methodologies, to adopt and implement NCA’s relevant for specific policies, and to contribute to preserve Croatia’s natural capital.
145. Loss of ecosystem services is intensified by water pollution, through discharge of untreated or insufficiently treated wastewater. In Croatia, a large proportion of wastewater is not collected, and a significant share of wastewater entering a collective system still goes untreated. Pollutants discharged into rivers, lakes and the sea are leading to annual damages of about EUR 664 million. While Croatia transposed requirements of the UWWTD into the country’s national
137 The World Bank Group leads the WAVES partnership to advance NCA internationally. See the following webpage: https://www.wavespartner-ship.org/en/natural-capital-accounting
legal framework, it is doubtful whether Croatia will be able to comply with the EU Directives in a timely manner at the current state of annual investment spending.
146. Despite improvements in bringing Croatia’s national legislation in line with EU directives on solid waste management, practical progress on waste management strategies is lagging. Croatia is just beginning its transition to a circular economy. Due to suboptimal planning of waste management with lack of incentives to manage waste according to the waste hierarchy, insufficient separate collection of waste, a lack of a clear allocation of tasks and coordination between the different administrative levels, and insufficient enforcement capacity, Croatia is lagging behind in achieving the EU’s waste targets. Croatia was late in adopting the national WMP and the waste prevention program (WPP), which are necessary tools to achieve EU waste management targets and to secure funds under the EU’s Cohesion Policy.138 To meet the target of the Waste Framework Directive by 2021, Croatia has initiated a process to review and update its national WMP and WPP for alignment with the EU Waste Package.139 The country will also receive support from the World Bank140 to mainstream circular economy approaches in waste management.
147. Seasonal variations related to tourist activities, which although valuable to the local economy, bring additional pressures to the local environment, particularly on Croatia’s islands. Larger islands like Krk have the capacity to develop modern facilities for waste treatment. On Croatia’s smaller islands, the development and operation of on-island waste treatment and disposal facilities to meet increasingly stringent legislative EU requirements is a greater challenge. For islands close to a mainland market, separate collection and recycling should be strongly encouraged, and established transport routes utilized to transfer materials to mainland markets for adequate
138 Dinkelberg, M. 2018. “Waste management and circular economy efforts in Croatia.” Ministry of Foreign Affairs of the Netherlands. https://www.rvo.nl/sites/default/files/2018/07/circular-economy-and-waste-man-agement-in-croatia.pdf.139 Comprising of the following Directives: 1. Directive (EU) 2018/851 amending Waste Framework Directive (WFD), 2. Directive (EU) 2018/850 amending Landfill Directive (LD), 3. Directive (EU) 2018/852 amending Directive on Packaging and Packaging Waste (PPWD), 4. Directive (EU) 2018/849 amending Directive on End of Life Vehicles (ELV), Waste Elec-trical and Electronic Equipment (WEEE) Directive and Batteries Directive (BATT).140 Through Reimbursable Advisory Services (RAS) project “Circular Econ-omy approaches in Solid Waste Management in Croatia”, which was signed with the Ministry of Economy and Sustainable Development in September 2020.
Cost of Environmental Degradation in Croatia 83
recycling. Policy actions should be informed by a dialogue with relevant stakeholders on the long-term benefits of regional planning of municipal waste management and its contribution to a circular economy. An important element is the definition of roles of relevant stakeholders at the national and local levels, and capacity building support for better implementation of the national waste management plan.141
148. Marine litter negatively impacts coastal and marine ecosystems and the services they provide. Every year, marine litter results in economic costs and significant losses for the economic sectors involved, such as tourism and recreation, fisheries and aquaculture, and maritime transport. Cleaning up the oceans is one option; it is however not the most efficient method in addressing marine litter. To minimize the costs of marine litter, Croatia will need to increase its efforts to reinforce adequate collection of waste otherwise disposed of into the sea, increase recycling rates, and ensure the appropriate treatment of waste. Marine litter is one of the clearest symbols of a resource-inefficient economy. Therefore, a circular economy approach, as promoted by the EU, which puts the emphasis on preventing waste, and on recycling and reuse of materials and products in the first place, is the best solution to the marine litter problem.142
149. The tourism sector is vital to Croatia’s economy, but has been heavily hit by restrictions induced by the COVID-19 pandemic. While the Government and the Croatian Tourism Union announced plans for the opening of the tourist season in May 2020, the tourism sector has performed at approximately 60 to 70 percent of its previous year’s capacity143. While leading to a large decline in tourist arrivals, the COVID-19 crisis may offer an opportunity to re-build Croatia’s tourism industry in a more sustainable manner. Croatia’s government could support the development and implementation of recovery plans which contribute towards a stronger, more sustainable and resilient tourism economy. Recovery plans could identify the following areas as key priorities:
141 The above-mentioned RAS on Circular Economy in Croatia will initiate these actions.142 European Commission (EC). 2019a. Environment: Our Oceans, Seas and Coasts. Marine Litter. https://ec.europa.eu/environment/marine/good-environmental-status/descriptor-10/index_en.htm (accessed on June 19, 2020).143 OECD. 2020b. “The COVID-19 crisis in Croatia.” https://www.oecd.org/south-east-europe/COVID-19-Crisis-in-Croatia.pdf (accessed Septem-ber 1, 2020).
• Re-thinking the tourism sector: The crisis presents an opportunity to rethink the tourism system for a more sustainable and resilient future. Policy intervention will be necessary to address the sector’s structural problems, avoid the return to issues of tourism management (e.g. over-tourism and strong seasonality), and advance key priorities. Sustainability should be a guiding principle in the recovery, and should include the aim of limiting tourism as a vector of pandemic (e.g. through issues related to waste management).
• Rebuilding destinations and the tourism system: Support and recovery measures need to be comprehensive across related sector branches, focusing on the sustainable and green recovery of local economies.
• Innovating and investing in tourism: Investments will be needed to make structural and physical changes to address health requirements in the short-term. Measures should incentivize and support green innovation, focusing on small-and-medium sized enterprises to ensure stronger long-term economic resilience.
150. The complexity of air pollution calls for a strategic and integrated approach that is based on a comprehensive understanding of air pollution sources and context-specific solutions. While AAP has not reached the level of magnitude of other EU member states and neighboring countries, Croatia will need to be proactive in controlling air pollution in industrial and urban areas. Given the ongoing COVID-19 pandemic, short-term measures should focus on three aspects: (i) avoiding any further aggravation of the pollution situation, e.g. by strictly enforcing and avoid relaxing existing air quality regulations; (ii) effectively reducing air pollution, e.g. through more stringent enforcement of quality standards for heating and cooking fuels, including adopting of social protection measures to compensate households for higher fuel prices; and (iii) reducing exposure to air pollution in the future as part of a “build back better” post-COVID approach. In the long-term, Croatia needs to maintain its harmonized investments in air quality improvement and low-carbon development capacity, ranging from technical and institutional capacity improvement, to policy and institutional reforms, and infrastructure investments.
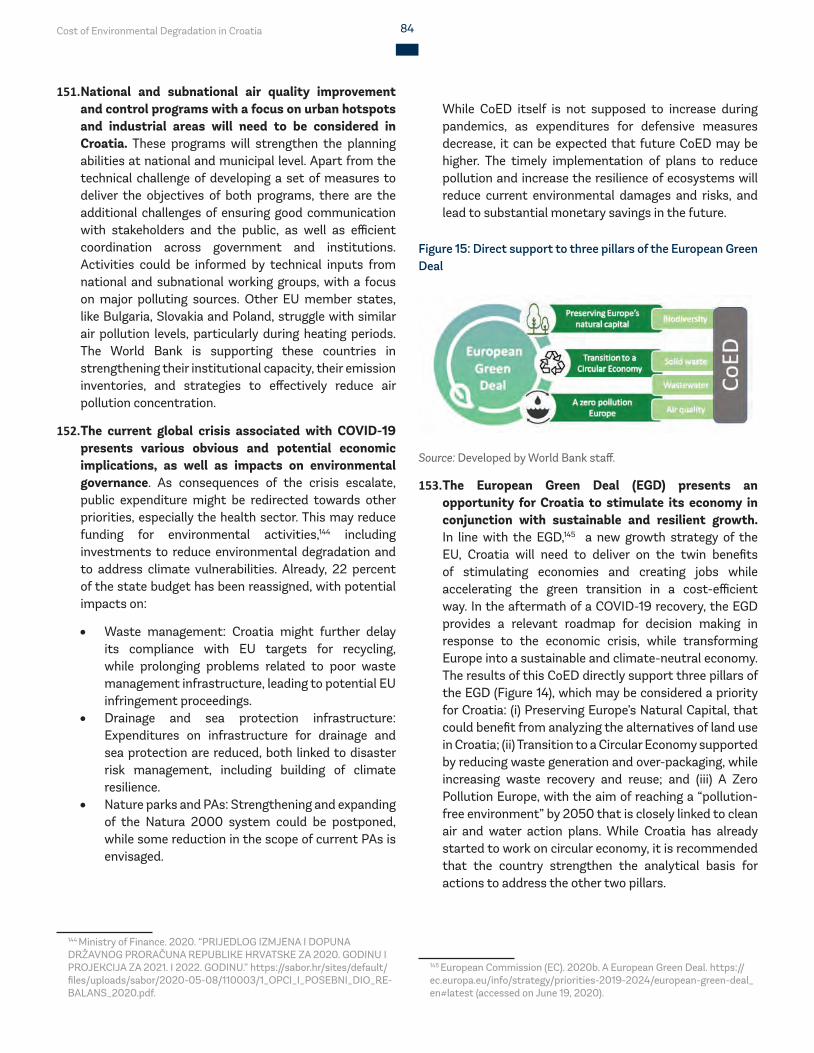
Cost of Environmental Degradation in Croatia 84
151. National and subnational air quality improvement and control programs with a focus on urban hotspots and industrial areas will need to be considered in Croatia. These programs will strengthen the planning abilities at national and municipal level. Apart from the technical challenge of developing a set of measures to deliver the objectives of both programs, there are the additional challenges of ensuring good communication with stakeholders and the public, as well as efficient coordination across government and institutions. Activities could be informed by technical inputs from national and subnational working groups, with a focus on major polluting sources. Other EU member states, like Bulgaria, Slovakia and Poland, struggle with similar air pollution levels, particularly during heating periods. The World Bank is supporting these countries in strengthening their institutional capacity, their emission inventories, and strategies to effectively reduce air pollution concentration.
152. The current global crisis associated with COVID-19 presents various obvious and potential economic implications, as well as impacts on environmental governance. As consequences of the crisis escalate, public expenditure might be redirected towards other priorities, especially the health sector. This may reduce funding for environmental activities,144 including investments to reduce environmental degradation and to address climate vulnerabilities. Already, 22 percent of the state budget has been reassigned, with potential impacts on:
• Waste management: Croatia might further delay its compliance with EU targets for recycling, while prolonging problems related to poor waste management infrastructure, leading to potential EU infringement proceedings.
• Drainage and sea protection infrastructure: Expenditures on infrastructure for drainage and sea protection are reduced, both linked to disaster risk management, including building of climate resilience.
• Nature parks and PAs: Strengthening and expanding of the Natura 2000 system could be postponed, while some reduction in the scope of current PAs is envisaged.
144 Ministry of Finance. 2020. “PRIJEDLOG IZMJENA I DOPUNA DRŽAVNOG PRORAČUNA REPUBLIKE HRVATSKE ZA 2020. GODINU I PROJEKCIJA ZA 2021. I 2022. GODINU.” https://sabor.hr/sites/default/files/uploads/sabor/2020-05-08/110003/1_OPCI_I_POSEBNI_DIO_RE-BALANS_2020.pdf.
While CoED itself is not supposed to increase during pandemics, as expenditures for defensive measures decrease, it can be expected that future CoED may be higher. The timely implementation of plans to reduce pollution and increase the resilience of ecosystems will reduce current environmental damages and risks, and lead to substantial monetary savings in the future.
Figure 15: Direct support to three pillars of the European Green Deal
Source: Developed by World Bank staff.
153. The European Green Deal (EGD) presents an opportunity for Croatia to stimulate its economy in conjunction with sustainable and resilient growth. In line with the EGD,145 a new growth strategy of the EU, Croatia will need to deliver on the twin benefits of stimulating economies and creating jobs while accelerating the green transition in a cost-efficient way. In the aftermath of a COVID-19 recovery, the EGD provides a relevant roadmap for decision making in response to the economic crisis, while transforming Europe into a sustainable and climate-neutral economy. The results of this CoED directly support three pillars of the EGD (Figure 14), which may be considered a priority for Croatia: (i) Preserving Europe’s Natural Capital, that could benefit from analyzing the alternatives of land use in Croatia; (ii) Transition to a Circular Economy supported by reducing waste generation and over-packaging, while increasing waste recovery and reuse; and (iii) A Zero Pollution Europe, with the aim of reaching a “pollution-free environment” by 2050 that is closely linked to clean air and water action plans. While Croatia has already started to work on circular economy, it is recommended that the country strengthen the analytical basis for actions to address the other two pillars.
145 European Commission (EC). 2020b. A European Green Deal. https://ec.europa.eu/info/strategy/priorities-2019-2024/european-green-deal_en#latest (accessed on June 19, 2020).
Cost of Environmental Degradation in Croatia 85
REFERENCESPhoto: Vladimir Kalinski
Cost of Environmental Degradation in Croatia 86
9 REFERENCESBarišić, A. 2018. Climate Change Impact and Adaptation in
Croatian Transport Sector. Geneva, June 7‐8, 2018.
Ćaleta, M., Z. Marčić, I. Buj, D. Zanella, P. Mustafić, A. Duplić, and S. Horvatić. 2019. “A Review of Extant Croatian Freshwater Fish and Lampreys. Croatian Journal of Fisheries, 77 (3). https://doi.org/10.2478/cjf-2019-0016.
Carić, H. 2009. “Direct pollution cost assessment of cruising tourism in the Croatian Adriatic.” Financial Theory and Practice 34(2): 161-180. https://ideas.repec.org/a/ipf/finteo/v34y2010i2p161-180.html.
Croatian Bureau of Statistics (CBS). 2020. https://www.dzs.hr/default_e.htm (accessed on June 19, 2020).
Croatian Environmental Agency. 2015. “Mapping and assessment of ecosystems and their services in Croatia.” http://www.haop.hr/sites/default/files/uploads/dokumenti/03_prirodne/studije/ekosustav/Kartiranje_i_procijena_ekosustava_ENG.pdf.
Croatian Environment and Nature Agency. 2020. Bioportal. http://www.bioportal.hr/gis/ (accessed on June 19, 2020).
Croatia.eu land of people. 2020. “Geography and population – Rivers and Lakes.” https://www.croatia.eu/index.php?view=article&lang=2&id=9 (accessed on June 19, 2020).
Croitoru, L., J. Miranda, and M. Sarraf. 2019. “The cost of coastal zone degradation in west Africa: Benin, Cote d’ivoire, Senegal and Togo.” Washington D.C.: The World Bank.
Cruise Lines International Association. 2018. Contribution of Cruise Tourism to the Economies of Europe 2017.https://cruising.org/-/media/research-updates/research/economic-impact-studies/contribution-of-cruise-tourism-to-the-economies-of-europe-2017.pdf
De Groot, R., L. Brander, S. van der Ploeg, R. Costanza, F. Bernard, L. Braat, M. Christie et al. 2012. “Global estimates of the value of ecosystems and their services in monetary units.” Ecosystem Services: 1(1):50-61. https://doi.org/10.1016/j.ecoser.2012.07.005.
Dinkelberg, M. 2018. “Waste management and circular economy efforts in Croatia.” Ministry of Foreign Affairs of the Netherlands. https://www.rvo.nl/sites/default/files/2018/07/circular-economy-and-
waste-management-in-croatia.pdf.
Dixon, J. A., L. F. Scura, R. A. Carpenter, and P. B. Sherman. 1994. Economic Analysis of Environmental Impacts. London, UK: Earthscan.
Economic Institute Zagreb. 2020. “Overview of the real estate markets of the Republic of Croatia.” https://www.eizg.hr/publikacije/serijske-publikacije/pregled-trzista-nekretnina-republike-hrvatske/4273.
EEA. 2018a. “Air quality in Europe – 2018 report”. Luxembourg: Publications Office of the European Union. https://www.eea.europa.eu//publications/air-quality-in-europe-2018.
EEA. 2018b. “Assessing the risks to health from air pollution.” https://www.eea.europa.eu/themes/air/health-impacts-of-air-pollution/assessing-the-risks-to-health (assessed on July 9, 2020).
EEA. 2019. “Air quality in Europe – 2019 report”. Luxembourg: Publications Office of the European Union. https://www.eea.europa.eu/publications/air-quality-in-europe-2019.
Environmental Knowledge Community. 2015. “Knowledge innovation project (KIP) on Accounting for natural capital and ecosystem services – scoping paper.” https://ec.europa.eu/environment/nature/capital_accounting/pdf/KIP-INCA-ScopingPaper.pdf.
ESSA. 2020. Copernicus Sentinel-5P Tropospheric Nitrogen Dioxide. https://maps.s5p-pal.com/ (accessed on June 19, 2020).
European Commission (EC). “European Maritime and Fisheries Fund (EMFF). Croatia.” https://ec.europa.eu/fisheries/sites/fisheries/files/docs/body/op-croatia-fact-sheet_en.pdf (accessed on June 19, 2020).
European Commission (EC). 2019a. Environment: Our Oceans, Seas and Coasts. Marine Litter. https://ec.europa.eu/environment/marine/good-environmental-status/descriptor-10/index_en.htm (accessed on June 19, 2020).
European Commission (EC). 2019b. The Environmental Implementation Review. Croatia. Luxembourg: Publications Office of the European Union. https://ec.europa.eu/environment/eir/pdf/factsheet_hr_en.pdf.
European Commission (EC). 2019c. Report from the Commission to the European Parliament and
Cost of Environmental Degradation in Croatia 87
the Council on the implementation of apiculture programmes. Brussels. https://op.europa.eu/en/publication-detail/-/publication/c5eae4e3-20bb-11ea-95ab-01aa75ed71a1/language-en.
European Commission (EC). 2020a. Urban Waste Water Directive Overview. https://ec.europa.eu/environment/water/water-urbanwaste/index_en.html (accessed June 19, 2020).
European Commission (EC). 2020b. A European Green Deal. https://ec.europa.eu/info/strategy/priorities-2019-2024/european-green-deal_en#latest (accessed on June 19, 2020).
European Commission (EC). 2020c. “Economic forecast for Croatia.” https://ec.europa.eu/info/business-economy-euro/economic-performance-and-forecasts/economic-performance-country/croatia/economic-forecast-croatia_en (accessed September 1, 2020).
Eurostat. 2017. “Houses or flat: where do you live?” https://ec.europa.eu/eurostat/web/products-eurostat-news/-/DDN-20170412-1 (accessed June 19, 2020).
Eurostat. 2019a. “Energy balance sheet 2017 Data.” Luxembourg: European Commission. https://ec.europa.eu/eurostat/documents/3217494/10077623/KS-EN-19-001-EN-N.pdf/59b44e6f-ff33-488b-a85f-9c4f60703afc.
Eurostat. 2019b. “Energy balance guide. Methodology guide for the construction of energy balances and operational guide for the energy balance builder tool.” Luxembourg: European Commission. https://ec.europa.eu/eurostat/documents/38154/4956218/ENERGY-BALANCE-GUIDE-DRAFT-31JANUARY2019.pdf/cf121393-919f-4b84-9059-cdf0f69ec045.
Eurostat. 2020. Municipal waste by waste management operations. http://appsso.eurostat.ec.europa.eu/nui/submitViewTableAction.do (accessed May 10, 2020).
Eze, I. C., L. G. Hemkens, H. C. Bucher, B. Hoffmann, C. Schindler, N. Künzli, T. Schikowski, and N. M. Probst-Hensch. 2015. “Association between Ambient Air Pollution and Diabetes Mellitus in Europe and North America: Systematic Review and Meta-Analysis”. Environmental Health Perspectives, 123(5). https://doi.org/10.1289/ehp.1307823.
Färe, R., S. Grosskopf, C. A. Knox Lovell, and S. Yaisawarng.
(1993). “Derivation of Shadow Prices for Undesirable Outputs: A Distance Function Approach”. The Review of Economics and Statistics, 75(2): 374-380. doi:10.2307/2109448.
Flores, M. and I. Ivicic. 2011. “Valuation of the Contribution of the Ecosystems of Northern Velebit National Park and Velebit Nature Park to Economic Growth and Human Well-being: Croatia”. http://awsassets.panda.org/downloads/valuation_of_the_contribution_of_the_ecosystems_of_northern_velebit_national_park_and_ve.pdf.
Freeman III., A. M. 2003. The Measurement of Environmental and Resource Values: Theory and Methods. 2nd edition. Washington, DC: Resources for the Future.
GBD. 2017. “GBD Results Tool”. http://ghdx.healthdata.org/gbd-results-tool (accessed on June 19, 2020).
Getzner, M., M. Jungmeier, and M. Špika. “Willingness-To-Pay for Improving Marine Biodiversity: A Case Study of Lastovo Archipelago Marine Park (Croatia).” Water 9(1): 2. https://doi.org/10.3390/w9010002
Government of the Republic of Croatia. 2017. Waste management plan of the Republic of Croatia for the period 2017-2022. https://mzoe.gov.hr/UserDocsImages/UPRAVA-ZA-PROCJENU-UTJECAJA-NA-OKOLIS-ODRZIVO-GOSPODARENJE-OTPADOM/Sektor%20za%20odr%C5%BEivo%20gospodarenje%20otpadom/Ostalo/management_plan_of_the_republic_of_croatia_for_the_period_2017-2022.pdf.
Government of the Republic of Croatia. 2019. Regulation on the ecological network and the competencies of public institutions for the management of ecological network areas. https://narodne-novine.nn.hr/clanci/sluzbeni/2019_08_80_1669.html.
Grizzetti, B., D. Lanzanova, C. Liquete, A. Reynaud, A. C. Cardoso. 2016. “Assessing water ecosystem services for water resource management.” Environmental Science & Policy, 61:194-203. https://doi.org/10.1016/j.envsci.2016.04.008.
Guilford, G. 2014. Filthy Business. Cruise ships dump 1 billion gallons of sewage into the ocean every year. https://qz.com/308970/cruise-ships-dump-1-billion-tons-of-sewage-into-the-ocean-every-year/.
HAOP (Croatian Environment and Nature Agency). 2019. “Izvješće o praćenju kvalitete zraka na području Republike Hrvatske za 2018. godinu”. http://iszz.azo.hr/iskzl/datoteka?id=92040.
Cost of Environmental Degradation in Croatia 88
HAOP (Croatian Environment and Nature Agency). 2020. “Air quality in the Republic of Croatia”. http://iszz.azo.hr/iskzl/podatakexp.htm (accessed on June 18, 2020).
Healy, H., J. Martínez-Alier, L. Temper, M. Walter, J. Gerber. 2013. Ecological Economics from Ground up. Routledge. ISBN 9781849713993.
Hernández-Sancho, F., B. Lamizana-Diallo, J. Mateo-Sagasta, M. Qadir. 2015. “Economic Valuation of Wastewater - The cost of action and the cost of no action”. United Nations Environment Programme. https://wedocs.unep.org/bitstream/handle/20.500.11822/7465/-Economic_Valuation_of_Wastewater_The_Cost_of_Action_and_the_Cost_of_No_Action-2015Wastewater_Evaluation_Report_Mail.pdf.pdf?sequence=3&isAllowed=y
Hunt, A., J. Ferguson, F. Hurley, and A. Searl. 2016. “Social Costs of Morbidity Impacts of Air Pollution.” OECD Environment Working Papers, No. 99.
HZJZ (Central Medical Institution of Public Health in Croatia). 2018. “Report on deaths in Croatia in 2018”. https://www.hzjz.hr/periodicne-publikacije/izvjesce-o-umrlim-osobama-u-hrvatskoj-u-2018-godini/.
Islands of Croatia. 2020. http://croatia-islands-vacation.com/croatia_islands.html (accessed June 19, 2020).
Institute for Environmental Policy. 2018. “Estimating environmental benefits of wastewater treatment in Slovakia.” Ministry of Environment of the Slovak Republic. https://www.minzp.sk/files/iep/iep_working_paper_estimating-environmental-benefits-wastewater-treatment-slovakia_20180413.pdf.
Ivanić, K., G. Sekulić, D. Porej. 2017. “Protected Areas Benefit Assessment (PA-BAT) in Croatia. Zagreb: WWF.https://www.researchgate.net/publication/319208199_Protected_Area_Benefit_Assessment_PA-BAT_in_Croatia.
IUCN World Heritage Outlook. 2017. Plitvice Lakes National Parks. https://worldheritageoutlook.iucn.org/explore-sites/wdpaid/2016 (accessed on June 19, 2020).
Johnston, R. J., J. Rolfe, J. Rosenberger, and R. Brouwer. 2015. Benefit Transfer of Environmental and Resource Values: A Handbook for Researchers and Practitioners. Springer.
Kalinski, V. 2017. Izvještaj o procijenjenim utjecajima i ranjivosti na klimatske promjene po pojedinim sektorima. Jačanje kapaciteta Ministarstva zaštite okoliša i energetike za prilagodbu klimatskim promjenama te priprema Nacrta Strategije prilagodbe klimatskim promjenama. Contract number: TF/HR/P3-M1-O1-0101.
Lange, G., Q. Wodon, K. Carey. 2018. The Changing Wealth of Nations 2018: Building a Sustainable Future. Washington, DC: World Bank. https://openknowledge.worldbank.org/handle/10986/29001
La Notte, A., S. Vallecillo, C. Polce, G. Zulian, and J. Maes. 2017. Implementing an EU system of accounting for ecosystems and their services. Initial proposals for the implementation of ecosystem services accounts (Report under phase 2 of the knowledge innovation project on an integrated system of natural capital and ecosystem services accounting in the EU). Publications Office of the European Union. https://ec.europa.eu/jrc/en/publication/implementing-eu-system-accounting-ecosystems-and-their-services-initial-proposals-implementation.
Markandya, A., P. Harou, L. G. Bellu, and V. Cistulli. 2002. Environmental Economics for Sustainable Growth: A Handbook for Practitioners. Chelthenam, UK:Edward Elgar.
Ministry of Environment and Energy. 2020. “Republic of Croatia. 2020. Informative inventory report (1990 -2018).” Zagreb: The Ministry of Environment and Energy.
Ministry of Environmental Protection and Energy. “PLAN UPRAVLJANJA VODNIM PODRUČJIMA 2016. - 2021.2016-2021.” https://www.voda.hr/sites/default/files/plan_upravljanja_vodnim_podrucjima_2016._-_2021.pdf.
Ministry of Environmental Protection and Energy. 2018. Municipal waste data. https://mzoe.gov.hr/pristup-informacijama/strategije-planovi-i-ostali-dokumenti/podaci-o-komunalnom-otpadu/5630 (accessed on June 19, 2020).
Ministry of Environmental Protection and Energy. 2020. Regulations in the field of environmental protection and waste management. http://www.fzoeu.hr/en/regulations/regulations_in_the_field_of_environmental_protection_and_waste_management/.
Cost of Environmental Degradation in Croatia 89
Ministry of Finance. 2020. “PRIJEDLOG IZMJENA I DOPUNA DRŽAVNOG PRORAČUNA REPUBLIKE HRVATSKE ZA 2020. GODINU I PROJEKCIJA ZA 2021. I 2022. GODINU.” https://sabor.hr/sites/default/files/uploads/sabor/2020-05-08/110003/1_OPCI_I_POSEBNI_DIO_REBALANS_2020.pdf.
Ministry of Tourism. 2019. “Tourism in Figures 2018.” Zagreb: The Ministry of Tourism. https://www.htz.hr/sites/default/files/2019-06/HTZ%20TUB%20ENG_2018_0.pdf.
Ministry of Tourism. 2020. https://mint.gov.hr/ (accessed on June 29, 2020).
Moral Pajares, E., L. Gallego Valero, and I. M. Román Sánchez. 2019. “Cost of urban wastewater treatment and ecotaxes: Evidence from municipalities in southern Europe.” Water, 11(3): 423.
Narain, U., and C. Sall. 2016. “Methodology for Valuing the Health Impacts of Air Pollution: Discussion of Challenges and Proposed Solutions.” Washington, DC.: The World Bank.
OECD. 2020a. “Tourism Policy Response to the coronavirus (COVID-19).” https://www.oecd.org/coronavirus/policy-responses/tourism-policy-responses-to-the-coronavirus-covid-19-6466aa20/ (accessed September 1, 2020).
OECD. 2020b. “The COVID-19 crisis in Croatia.” https://www.oecd.org/south-east-europe/COVID-19-Crisis-in-Croatia.pdf (accessed September 1, 2020).
Papathanassis, A., T. Lukovic, and M. Vogel. 2012. Cruise tourism and society: a socio-economic perspective. Springer Science & Business Media.
Parliament of the Republic of Croatia. 2017. “The Nature Protection Strategy and Action Plan of the Republic of Croatia for the period 2017-2025.” https://www.cbd.int/doc/world/hr/hr-nbsap-v3-en.pdf.
Pithart D., I. P. Rančić, P. Kutleša, and A. Duplić. 2014. “Study of Freshwater Ecosystem Services in Croatia”. Ministry of Environmental and Natural Protection. http://www.haop.hr/sites/default/files/uploads/dokumenti/03_prirodne/studije/ekosustav/Study_of_Freshwater_Ecosystem_Services_in_Croatia.pdf
Quartz. 2014. “Cruise ships dump 1 billion gallons of sewage into the ocean every year.” https://qz.com/308970/cruise-ships-dump-1-billion-tons-of-sewage-into-the-ocean-every-year/ (accessed on July 12, 2020).
Ready, R.C. 2005. “Do landfills always depress nearby
property values?” The Northeast Regional Center for Rural Development, Pennsylvania State University. https://aese.psu.edu/nercrd/publications/rdp/rdp27.pdf.
Risk Factor Collaborators. 2018. “Global, regional, and national comparative risk assessment of 84 behavioral, environmental and occupational, and metabolic risks or clusters of risks for 195 countries and territories, 1990–2017: a systematic analysis for the Global Burden of Disease Study 2017.” The Lancet. 392:1923-94. http://dx.doi.org/10.1016/S0140-6736(18)32225-6.
Spaic-Kovacic, D. 2020. “Air pollution warning issues in Zagreb”. N1 Zagreb. http://hr.n1info.com/English/NEWS/a475799/Air-pollution-warning-issued-in-Zagreb.html (accessed on June 18, 2020).
Szewczyk, W., J. C. Ciscar Martinez, I. Mongelli, and A. Soria Ramirez. 2018. “JRC PESETA III Project: Economic integration and spillover analysis”. Publications Office of the European Union. https://ec.europa.eu/jrc/en/publication/jrc-peseta-iii-project-economic-integration-and-spillover-analysis
The World Bank. 2017. “Croatia Energy Sector Note.” Washington DC.: The World Bank. http://documents.worldbank.org/curated/en/126131551124308323/pdf/AUS0000353-WP-REVISED-P166022-PUBLIC.pdf.
The World Bank. 2019a. “Croatia – Country Partnership Framework for the Period of FY19-FY24.” Washington DC.: The World Bank. http://documents.worldbank.org/curated/en/501721557239562800/Croatia-Country-Partnership-Framework-for-the-Period-of-FY19-FY24.
The World Bank. 2019b. “Water and Wastewater Services in the Danube Region. A State of the Sector 2018 Update.” Vienne: The World Bank. https://sos2018.danubis.org/files/File/SoS_Report-2018.pdf.
UNECE. 2014. “Croatia Environmental Performance Reviews.” New York and Geneva: UNEC for Europe. https://www.unece.org/fileadmin/DAM/env/epr/epr_studies/ECE_CEP_172_En.pdf
Vlachogianni, T. 2017. “Understanding the socio-economic implications of marine litter in the Adriatic-Ionian macroregion.” IPA-Adriatic DeFishGear project and MIO-ECSDE:70. http://mio-ecsde.org/wp-content/uploads/2014/12/Socio-economic-implications-of-ML_regional-report_final.pdf
Cost of Environmental Degradation in Croatia 90
Vucinic, A. A., D. Perovic, H. Dokoza, and V. Premur. “The impact of tourism on separate waste collection in Zadar County, Republic of Croatia”. http://uest.ntua.gr/naxos2018/proceedings/pdf/NAXOS2018_Vucinic_etal.pdf
WHO. 2013. ‘‘Review of evidence on health aspects of air pollution—REVIHAAP.” Copenhagen: WHO Regional Office for Europe. https://www.euro.who.int/__data/assets/pdf_file/0020/182432/e96762-final.pdf?rel=mas.
WHO. 2016. “Global Health Observatory data repository.“ https://apps.who.int/gho/data/view.main.AMBIENTCITY2016?lang=en (accessed on June 19, 2020).
WHO. 2017. “Ambient air pollution: A global assessment of exposure and burden of disease.” Geneva: WHO. https://apps.who.int/iris/bitstream/handle/10665/250141/9789241511353-eng. pdf; jsessionic= 6B3C13DF161O7A 307E9018EED3B876EA?sequence=1
World Development Indicators (WDI). 2020. DataBank. Washington D.C.: The World Bank. https://databank.worldbank.org/source/world-development-indicators (accessed on July 12, 2020).
World Travel and Tourism Council. 2020. Economic Impacts Report. https://wttc.org/Research/Economic-Impact (accessed June 19, 2020).
WWF. 2017. “Croatia: Watershed moment for the Great Waterfall and Plitivce Lakes National Park.” https://mediterranean.panda.org/?uNewsID=303394 (accessed June 19, 2020).
Cost of Environmental Degradation in Croatia 91
ANNEXES
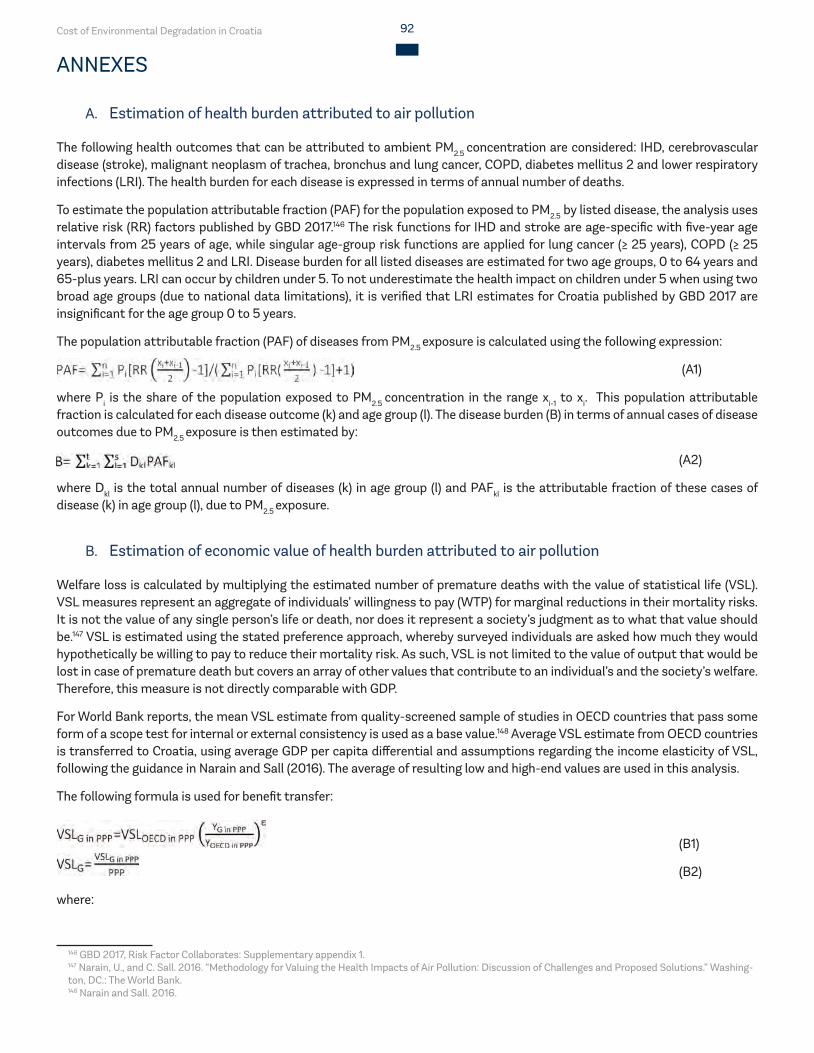
Cost of Environmental Degradation in Croatia 92
ANNEXES
A. Estimation of health burden attributed to air pollution
The following health outcomes that can be attributed to ambient PM2.5 concentration are considered: IHD, cerebrovascular disease (stroke), malignant neoplasm of trachea, bronchus and lung cancer, COPD, diabetes mellitus 2 and lower respiratory infections (LRI). The health burden for each disease is expressed in terms of annual number of deaths.
To estimate the population attributable fraction (PAF) for the population exposed to PM2.5 by listed disease, the analysis uses relative risk (RR) factors published by GBD 2017.146 The risk functions for IHD and stroke are age-specific with five-year age intervals from 25 years of age, while singular age-group risk functions are applied for lung cancer (≥ 25 years), COPD (≥ 25 years), diabetes mellitus 2 and LRI. Disease burden for all listed diseases are estimated for two age groups, 0 to 64 years and 65-plus years. LRI can occur by children under 5. To not underestimate the health impact on children under 5 when using two broad age groups (due to national data limitations), it is verified that LRI estimates for Croatia published by GBD 2017 are insignificant for the age group 0 to 5 years.
The population attributable fraction (PAF) of diseases from PM2.5 exposure is calculated using the following expression:
(A1)
where Pi is the share of the population exposed to PM2.5 concentration in the range xi-1 to xi. This population attributable fraction is calculated for each disease outcome (k) and age group (l). The disease burden (B) in terms of annual cases of disease outcomes due to PM2.5 exposure is then estimated by:
(A2)
where Dkl is the total annual number of diseases (k) in age group (l) and PAFkl is the attributable fraction of these cases of disease (k) in age group (l), due to PM2.5 exposure.
B. Estimation of economic value of health burden attributed to air pollution
Welfare loss is calculated by multiplying the estimated number of premature deaths with the value of statistical life (VSL). VSL measures represent an aggregate of individuals’ willingness to pay (WTP) for marginal reductions in their mortality risks. It is not the value of any single person’s life or death, nor does it represent a society’s judgment as to what that value should be.147 VSL is estimated using the stated preference approach, whereby surveyed individuals are asked how much they would hypothetically be willing to pay to reduce their mortality risk. As such, VSL is not limited to the value of output that would be lost in case of premature death but covers an array of other values that contribute to an individual’s and the society’s welfare. Therefore, this measure is not directly comparable with GDP.
For World Bank reports, the mean VSL estimate from quality-screened sample of studies in OECD countries that pass some form of a scope test for internal or external consistency is used as a base value.148 Average VSL estimate from OECD countries is transferred to Croatia, using average GDP per capita differential and assumptions regarding the income elasticity of VSL, following the guidance in Narain and Sall (2016). The average of resulting low and high-end values are used in this analysis.
The following formula is used for benefit transfer:
(B1)
(B2)
where:
146 GBD 2017, Risk Factor Collaborates: Supplementary appendix 1. 147 Narain, U., and C. Sall. 2016. “Methodology for Valuing the Health Impacts of Air Pollution: Discussion of Challenges and Proposed Solutions.” Washing-ton, DC.: The World Bank.148 Narain and Sall. 2016.
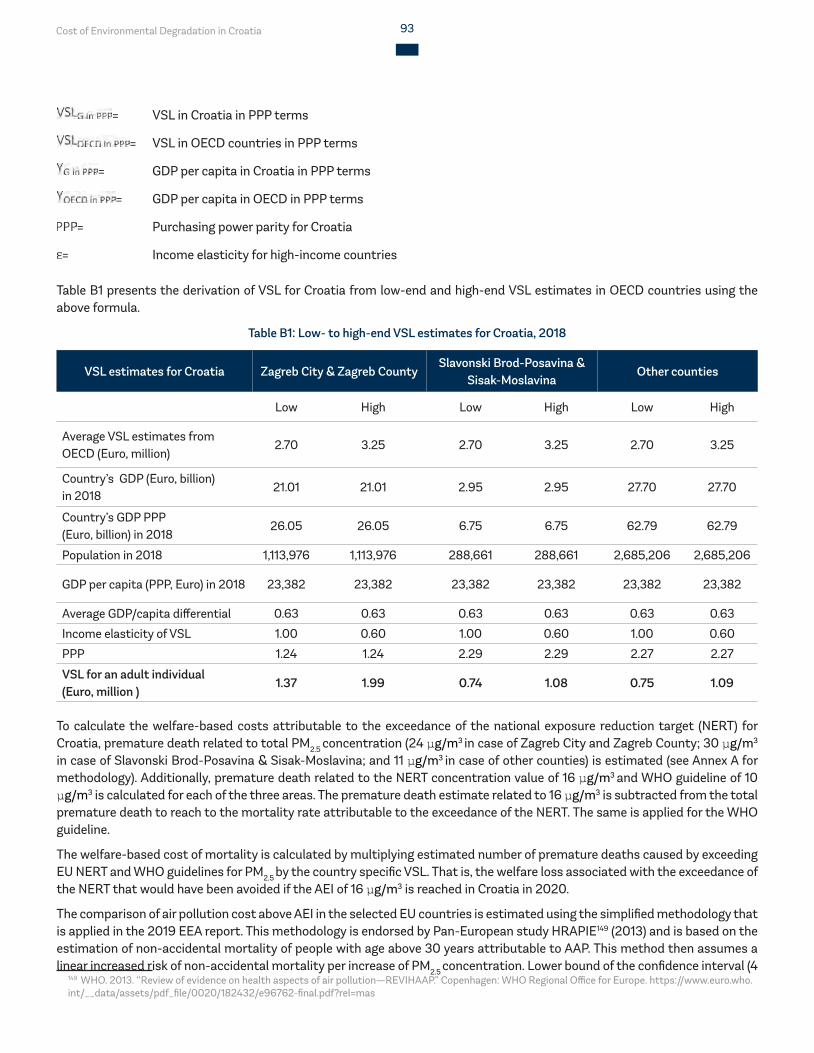
Cost of Environmental Degradation in Croatia 93
= VSL in Croatia in PPP terms
= VSL in OECD countries in PPP terms
= GDP per capita in Croatia in PPP terms
= GDP per capita in OECD in PPP terms
= Purchasing power parity for Croatia
= Income elasticity for high-income countries
Table B1 presents the derivation of VSL for Croatia from low-end and high-end VSL estimates in OECD countries using the above formula.
Table B1: Low- to high-end VSL estimates for Croatia, 2018
VSL estimates for Croatia Zagreb City & Zagreb CountySlavonski Brod-Posavina &
Sisak-MoslavinaOther counties
Low High Low High Low High
Average VSL estimates from OECD (Euro, million)
2.70 3.25 2.70 3.25 2.70 3.25
Country’s GDP (Euro, billion) in 2018
21.01 21.01 2.95 2.95 27.70 27.70
Country’s GDP PPP (Euro, billion) in 2018
26.05 26.05 6.75 6.75 62.79 62.79
Population in 2018 1,113,976 1,113,976 288,661 288,661 2,685,206 2,685,206
GDP per capita (PPP, Euro) in 2018 23,382 23,382 23,382 23,382 23,382 23,382
Average GDP/capita differential 0.63 0.63 0.63 0.63 0.63 0.63
Income elasticity of VSL 1.00 0.60 1.00 0.60 1.00 0.60
PPP 1.24 1.24 2.29 2.29 2.27 2.27
VSL for an adult individual (Euro, million )
1.37 1.99 0.74 1.08 0.75 1.09
To calculate the welfare-based costs attributable to the exceedance of the national exposure reduction target (NERT) for Croatia, premature death related to total PM2.5 concentration (24 μg/m3 in case of Zagreb City and Zagreb County; 30 μg/m3
in case of Slavonski Brod-Posavina & Sisak-Moslavina; and 11 μg/m3 in case of other counties) is estimated (see Annex A for methodology). Additionally, premature death related to the NERT concentration value of 16 μg/m3 and WHO guideline of 10 μg/m3 is calculated for each of the three areas. The premature death estimate related to 16 μg/m3 is subtracted from the total premature death to reach to the mortality rate attributable to the exceedance of the NERT. The same is applied for the WHO guideline.
The welfare-based cost of mortality is calculated by multiplying estimated number of premature deaths caused by exceeding EU NERT and WHO guidelines for PM2.5 by the country specific VSL. That is, the welfare loss associated with the exceedance of the NERT that would have been avoided if the AEI of 16 μg/m3 is reached in Croatia in 2020.
The comparison of air pollution cost above AEI in the selected EU countries is estimated using the simplified methodology that is applied in the 2019 EEA report. This methodology is endorsed by Pan-European study HRAPIE149 (2013) and is based on the estimation of non-accidental mortality of people with age above 30 years attributable to AAP. This method then assumes a linear increased risk of non-accidental mortality per increase of PM2.5 concentration. Lower bound of the confidence interval (4
149 WHO. 2013. ‘‘Review of evidence on health aspects of air pollution—REVIHAAP.” Copenhagen: WHO Regional Office for Europe. https://www.euro.who.int/__data/assets/pdf_file/0020/182432/e96762-final.pdf?rel=mas
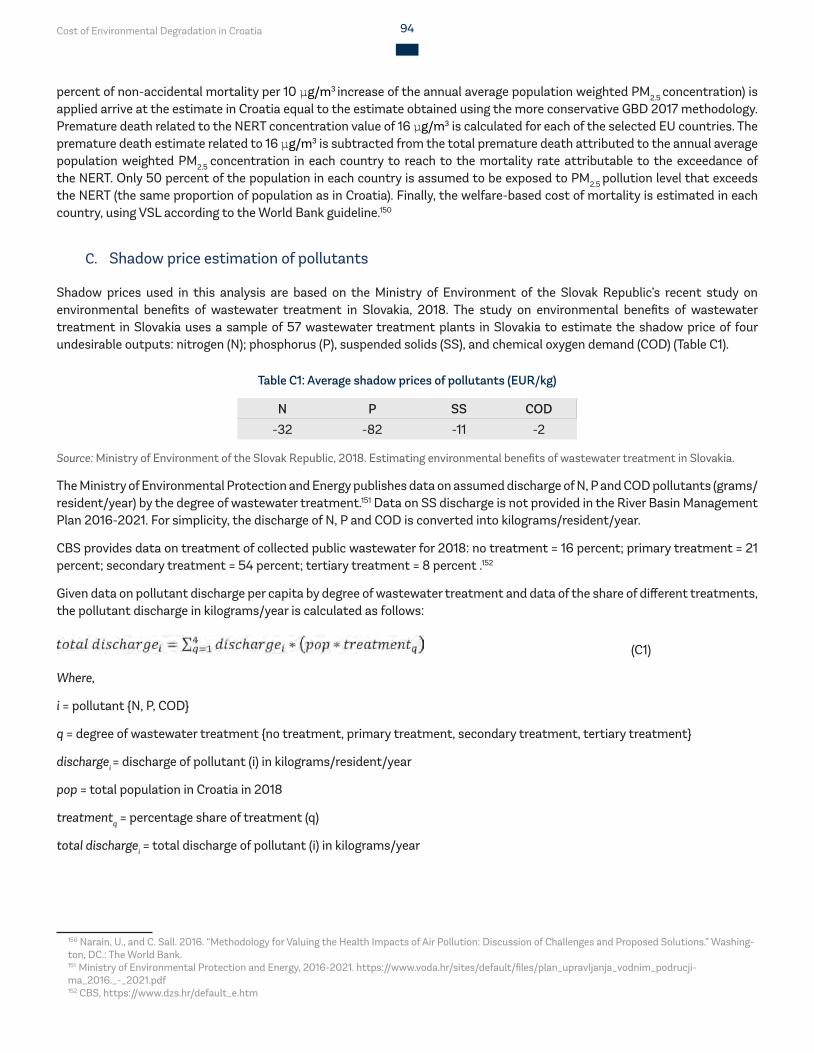
Cost of Environmental Degradation in Croatia 94
percent of non-accidental mortality per 10 μg/m3 increase of the annual average population weighted PM2.5 concentration) is applied arrive at the estimate in Croatia equal to the estimate obtained using the more conservative GBD 2017 methodology. Premature death related to the NERT concentration value of 16 μg/m3 is calculated for each of the selected EU countries. The premature death estimate related to 16 μg/m3 is subtracted from the total premature death attributed to the annual average population weighted PM2.5 concentration in each country to reach to the mortality rate attributable to the exceedance of the NERT. Only 50 percent of the population in each country is assumed to be exposed to PM2.5 pollution level that exceeds the NERT (the same proportion of population as in Croatia). Finally, the welfare-based cost of mortality is estimated in each country, using VSL according to the World Bank guideline.150
C. Shadow price estimation of pollutants
Shadow prices used in this analysis are based on the Ministry of Environment of the Slovak Republic’s recent study on environmental benefits of wastewater treatment in Slovakia, 2018. The study on environmental benefits of wastewater treatment in Slovakia uses a sample of 57 wastewater treatment plants in Slovakia to estimate the shadow price of four undesirable outputs: nitrogen (N); phosphorus (P), suspended solids (SS), and chemical oxygen demand (COD) (Table C1).
Table C1: Average shadow prices of pollutants (EUR/kg)
N P SS COD -32 -82 -11 -2
Source: Ministry of Environment of the Slovak Republic, 2018. Estimating environmental benefits of wastewater treatment in Slovakia.
The Ministry of Environmental Protection and Energy publishes data on assumed discharge of N, P and COD pollutants (grams/resident/year) by the degree of wastewater treatment.151 Data on SS discharge is not provided in the River Basin Management Plan 2016-2021. For simplicity, the discharge of N, P and COD is converted into kilograms/resident/year.
CBS provides data on treatment of collected public wastewater for 2018: no treatment = 16 percent; primary treatment = 21 percent; secondary treatment = 54 percent; tertiary treatment = 8 percent .152
Given data on pollutant discharge per capita by degree of wastewater treatment and data of the share of different treatments, the pollutant discharge in kilograms/year is calculated as follows:
(C1)
Where,
i = pollutant {N, P, COD}
q = degree of wastewater treatment {no treatment, primary treatment, secondary treatment, tertiary treatment}
dischargei = discharge of pollutant (i) in kilograms/resident/year
pop = total population in Croatia in 2018
treatmentq = percentage share of treatment (q)
total dischargei = total discharge of pollutant (i) in kilograms/year
150 Narain, U., and C. Sall. 2016. “Methodology for Valuing the Health Impacts of Air Pollution: Discussion of Challenges and Proposed Solutions.” Washing-ton, DC.: The World Bank.151 Ministry of Environmental Protection and Energy, 2016-2021. https://www.voda.hr/sites/default/files/plan_upravljanja_vodnim_podrucji-ma_2016._-_2021.pdf152 CBS, https://www.dzs.hr/default_e.htm
Cost of Environmental Degradation in Croatia 95
Considering the total pollutant discharge and the shadow price of pollutants in Table C1, annual environmental costs due to pollutant discharge are estimated as follows:
(C2)
Where,
pi = shadow price of pollutant (i)
D. Freshwater ecosystem services
Pithart et al. (2014) estimate the value of floodplain ecosystem services in the Danube RBD. This analysis uses the estimated monetary values of floodplain habitats to approach the evaluation of ecosystem services related to clean water in the Danube RBD in Croatia.153
Value of floodplain habitat: For monetary evaluation, Pithart et al. use the average cost of habitat restoration based on revitalization experience for the Danube and Drava rivers of other countries. The total benefit of wetland habitat services related to floodplains in the Danube RBD is estimated at EUR 6.1 billion.154
Around 70 percent of the total population in Croatia lives in the Danube RBD. The value of floodplain ecosystem services per person is estimated as follows:
(D1)
The analysis estimates the so-called break-even point, defined as a point where total costs per person to comply with the UWWTD equal total benefit per person of ecosystem services (see result of B2). Following assumptions are made to estimate the break-even point of ecosystem service degradation:
- Annual average growth rate is assumed to be 3 percent 155;- Cost of environmental degradation is estimated over a period of 30 years;- Annual discount rate is assumed to be 6 percent 156;- Total investment to comply with the UWWTD in 2023 is estimated at EUR 2.9 billion,157 equivalent to EUR 710 per
person (reference year 2015). It is assumed that Croatia adds an equal investment to comply with the EU Directive each year between 2015 and 2023.
Given investment costs per capita and the value ecosystem service per person the break-even point is estimated as follows:
(D2)
where,
PV = present value of investment
a = annual investment (total investment/time frame of 8 years)
r = discount rate (6 percent)
n = years (8 years)
Considering the PV of investment estimated in D2, the following equation needs to be computed to reach to the degradation rate of ecosystem services (a) when investment and avoided costs of ecosystem degradation break-even within a 30 years’ time frame.
153 Values are converted from USD to Euro, based on the average exchange rate between 2015 and 2019. https://www.ofx.com/en-us/forex-news/histor-ical-exchange-rates/yearly-average-rates/154 Pithart et al. 2014. “Study of freshwater ecosystem services in Croatia”.155 World Bank, 2016. Methodology for valuing the health impacts of air pollution.156 World Bank, 2016. Methodology for valuing the health impacts of air pollution.157 World Bank, 2019. Water and wastewater services in the Danube region: A state of the sector 2018 update.
Cost of Environmental Degradation in Croatia 96
(D3)
where,
g = annual growth rate (3 percent)
All values, despite a are known and can be plugged in equation B4:
(D4)
(D5)
That is, at an annual ecosystem degradation of EUR 29 per person in the Danube RBD, investment would equal avoided costs / benefits of clean water and a conserved ecosystem.
(D6)
E. Property value depreciation due to landfill proximity
Information on active landfill locations is collected and published by the Croatian Environmental Agency (CEA). The Environmental Atlas, managed by the CEA, visualizes data, amongst others, on active landfills and provides related GIS coordinates. Public settlement coordinates are used from the global settlement dataset, published by the NASA Socioeconomic Data and Application Center (SEDAC).158 Using the QGIS open-source platform, active landfill coordinates are uploaded and crossed with the database on settlements in Croatia. With QGIS tools, buffer zones of five-kilometer radius around each active landfill are created. Data on buffer zones that intersect with one or more settlements are extracted from the software.
To estimate property value depreciation, the analysis uses data on median price of houses and apartments sold in 2018 by county published by the Economic Institute Zagreb.159 About 80 percent of Croatians live in a house. The analysis, therefore, uses a weighted average for house and apartment prices by county sold in 2018.
(E1)
Where,
Pc = Weighted average price in county (c) in EUR;
MHc = Median price of a family house in county (c) in EUR;
MAc = Median price of an apartment in county (c) in EUR.
Zagreb City is the only exception, where it is assumed that more people live in apartments than in family houses. The Economic Institute Zagreb provides data on the number of family houses and apartments sold by county. The number of houses and apartments sold in settlements that intersect with one or more landfills is calculated as follows:
(E2)
Where,
Tci = Number of sales in county (c) in settlement (i)
Pci = Population in county (c) in settlement (i)
Tc = Number of sales in county (c)
Pc = Population in county (c)
158 SEDAC. https://sedac.ciesin.columbia.edu/159 Economic Institute Zagreb, 2018. https://www.eizg.hr/publikacije/serijske-publikacije/pregled-trzista-nekretnina-republike-hrvatske/4273
Cost of Environmental Degradation in Croatia 97
The analysis differentiates between high- and low volume landfills, as impact on adjacent property values varies by landfill size. Ready (2005) assessed average loss rate of property value for landfills with high and low volumes of waste.160 He found an average loss rate of 6 percent per mile the closer the property to a disposal site with high volume of waste discharge. Low-volume landfills decrease adjacent property values by 2.5 percent on average. Loss in property value is estimated for settlements located at 500 meters (equivalent to 0.3 miles) to five kilometers (equivalent to 3.1 miles) distance to the landfill.
The value of property with no proximity to landfill is calculated as follows:
(E3)
Where,
Vi = Value of property with no proximity to landfill site in settlement (i).
Property value depreciation due to landfill proximity is calculated as follows:
(E4)
Where,
VLi = Value of property within five kilometers (3.1 miles) to landfill site (L) in settlement (i);
δv = Rate of decline per mile by volume (V) of landfill (L)
The value of property loss is estimated for high-volume landfills (Prudinec-Jakuševec, Diklo and Karepovac) and low-volume landfills. Loss in property value of low-volume landfills is further differentiated by property price. Costs are estimated separately for landfills locating in areas below median price of property and above median price.
F. Economic cost of waterborne waste transport
It is assumed that one tourist produces on average 1.6 kilograms of waste per day, while inhabitants produce 1.2 kilograms of waste per day, based on Vucinic et al. (2018). MSW produced by inhabitants in 2018 is calculated as follows:
(F1)
Where,
MSWHi = Produced municipal solid waste of inhabitants (H) on island (i) in tons;
Populationi = Total population on island (i).
MSW produced by tourists in 2018 is calculated as follows:
(F2)
Where,
MSWTi = Produced municipal solid waste of tourists (T) on island (i) in tons;
Overnightsi = Total overnights of tourists on island (i).
Data on tourist overnights is increased by factor of 0.2, as the number of unofficial stays is estimated at 20 percent.161
It is assumed that the truck for waste transport has an average gross vehicle weight of 18 tons. 8 tons are loading capacity,
160 Ready, Richard C. (2005), https://aese.psu.edu/nercrd/publications/rdp/rdp27.pdf161 Minister of Environmental Protection and Energy (2018), https://mzoe.gov.hr/pristup-informacijama/strategije-planovi-i-ostali-dokumenti/poda-ci-o-komunalnom-otpadu/5630 and Vucinic et al. (2018), http://uest.ntua.gr/naxos2018/proceedings/pdf/NAXOS2018_Vucinic_etal.pdf
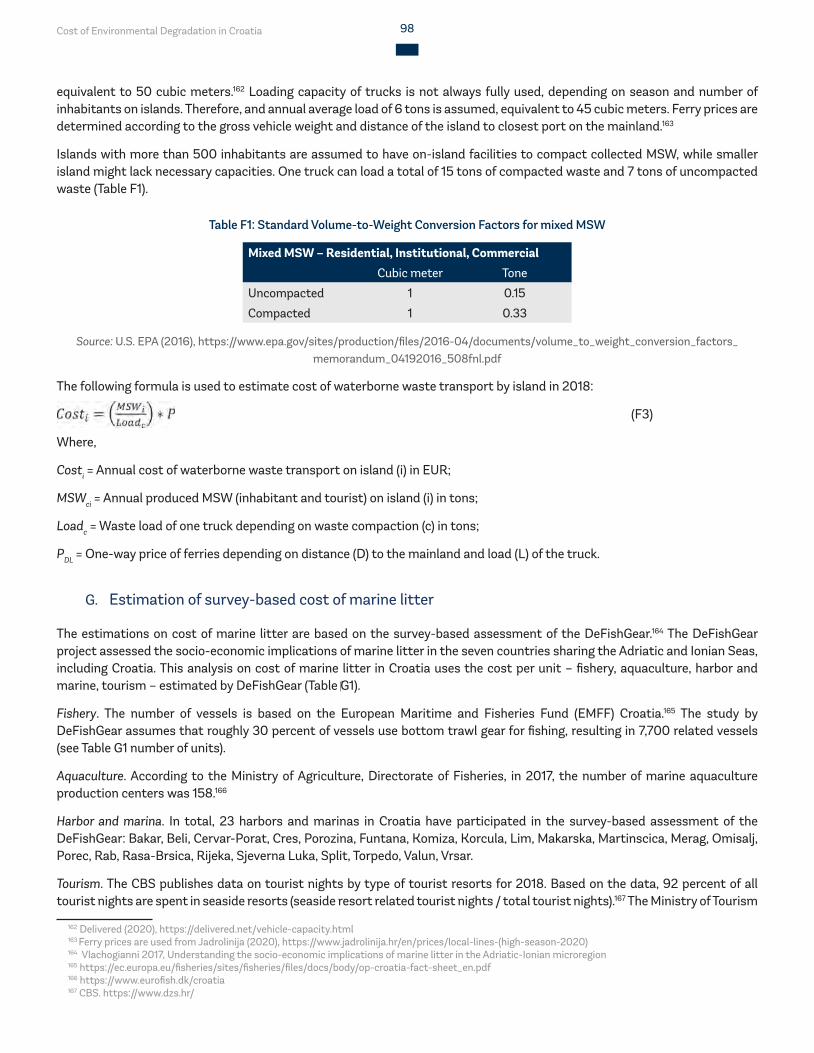
Cost of Environmental Degradation in Croatia 98
equivalent to 50 cubic meters.162 Loading capacity of trucks is not always fully used, depending on season and number of inhabitants on islands. Therefore, and annual average load of 6 tons is assumed, equivalent to 45 cubic meters. Ferry prices are determined according to the gross vehicle weight and distance of the island to closest port on the mainland.163
Islands with more than 500 inhabitants are assumed to have on-island facilities to compact collected MSW, while smaller island might lack necessary capacities. One truck can load a total of 15 tons of compacted waste and 7 tons of uncompacted waste (Table F1).
Table F1: Standard Volume-to-Weight Conversion Factors for mixed MSW
Mixed MSW – Residential, Institutional, CommercialCubic meter Tone
Uncompacted 1 0.15
Compacted 1 0.33
Source: U.S. EPA (2016), https://www.epa.gov/sites/production/files/2016-04/documents/volume_to_weight_conversion_factors_memorandum_04192016_508fnl.pdf
The following formula is used to estimate cost of waterborne waste transport by island in 2018:
(F3)
Where,
Costi = Annual cost of waterborne waste transport on island (i) in EUR;
MSWci = Annual produced MSW (inhabitant and tourist) on island (i) in tons;
Loadc = Waste load of one truck depending on waste compaction (c) in tons;
PDL = One-way price of ferries depending on distance (D) to the mainland and load (L) of the truck.
G. Estimation of survey-based cost of marine litter
The estimations on cost of marine litter are based on the survey-based assessment of the DeFishGear.164 The DeFishGear project assessed the socio-economic implications of marine litter in the seven countries sharing the Adriatic and Ionian Seas, including Croatia. This analysis on cost of marine litter in Croatia uses the cost per unit – fishery, aquaculture, harbor and marine, tourism – estimated by DeFishGear (Table G1).
Fishery. The number of vessels is based on the European Maritime and Fisheries Fund (EMFF) Croatia.165 The study by DeFishGear assumes that roughly 30 percent of vessels use bottom trawl gear for fishing, resulting in 7,700 related vessels (see Table G1 number of units).
Aquaculture. According to the Ministry of Agriculture, Directorate of Fisheries, in 2017, the number of marine aquaculture production centers was 158.166
Harbor and marina. In total, 23 harbors and marinas in Croatia have participated in the survey-based assessment of the DeFishGear: Bakar, Beli, Cervar-Porat, Cres, Porozina, Funtana, Komiza, Korcula, Lim, Makarska, Martinscica, Merag, Omisalj, Porec, Rab, Rasa-Brsica, Rijeka, Sjeverna Luka, Split, Torpedo, Valun, Vrsar.
Tourism. The CBS publishes data on tourist nights by type of tourist resorts for 2018. Based on the data, 92 percent of all tourist nights are spent in seaside resorts (seaside resort related tourist nights / total tourist nights).167 The Ministry of Tourism
162 Delivered (2020), https://delivered.net/vehicle-capacity.html163 Ferry prices are used from Jadrolinija (2020), https://www.jadrolinija.hr/en/prices/local-lines-(high-season-2020)164 Vlachogianni 2017, Understanding the socio-economic implications of marine litter in the Adriatic-Ionian microregion165 https://ec.europa.eu/fisheries/sites/fisheries/files/docs/body/op-croatia-fact-sheet_en.pdf166 https://www.eurofish.dk/croatia167 CBS. https://www.dzs.hr/
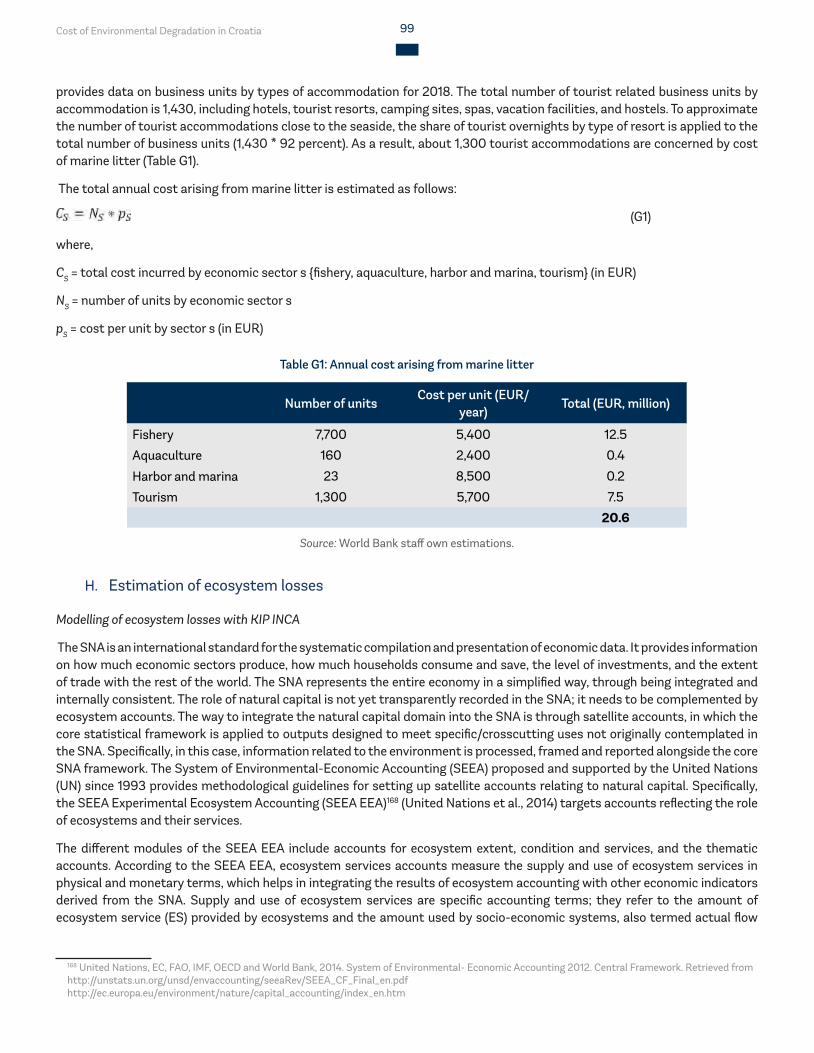
Cost of Environmental Degradation in Croatia 99
provides data on business units by types of accommodation for 2018. The total number of tourist related business units by accommodation is 1,430, including hotels, tourist resorts, camping sites, spas, vacation facilities, and hostels. To approximate the number of tourist accommodations close to the seaside, the share of tourist overnights by type of resort is applied to the total number of business units (1,430 * 92 percent). As a result, about 1,300 tourist accommodations are concerned by cost of marine litter (Table G1).
The total annual cost arising from marine litter is estimated as follows:
(G1)
where,
CS = total cost incurred by economic sector s {fishery, aquaculture, harbor and marina, tourism} (in EUR)
NS = number of units by economic sector s
pS = cost per unit by sector s (in EUR)
Table G1: Annual cost arising from marine litter
Number of units
Cost per unit (EUR/year)
Total (EUR, million)
Fishery 7,700 5,400 12.5
Aquaculture 160 2,400 0.4
Harbor and marina 23 8,500 0.2
Tourism 1,300 5,700 7.5
20.6
Source: World Bank staff own estimations.
H. Estimation of ecosystem losses
Modelling of ecosystem losses with KIP INCA
The SNA is an international standard for the systematic compilation and presentation of economic data. It provides information on how much economic sectors produce, how much households consume and save, the level of investments, and the extent of trade with the rest of the world. The SNA represents the entire economy in a simplified way, through being integrated and internally consistent. The role of natural capital is not yet transparently recorded in the SNA; it needs to be complemented by ecosystem accounts. The way to integrate the natural capital domain into the SNA is through satellite accounts, in which the core statistical framework is applied to outputs designed to meet specific/crosscutting uses not originally contemplated in the SNA. Specifically, in this case, information related to the environment is processed, framed and reported alongside the core SNA framework. The System of Environmental-Economic Accounting (SEEA) proposed and supported by the United Nations (UN) since 1993 provides methodological guidelines for setting up satellite accounts relating to natural capital. Specifically, the SEEA Experimental Ecosystem Accounting (SEEA EEA)168 (United Nations et al., 2014) targets accounts reflecting the role of ecosystems and their services.
The different modules of the SEEA EEA include accounts for ecosystem extent, condition and services, and the thematic accounts. According to the SEEA EEA, ecosystem services accounts measure the supply and use of ecosystem services in physical and monetary terms, which helps in integrating the results of ecosystem accounting with other economic indicators derived from the SNA. Supply and use of ecosystem services are specific accounting terms; they refer to the amount of ecosystem service (ES) provided by ecosystems and the amount used by socio-economic systems, also termed actual flow
168 United Nations, EC, FAO, IMF, OECD and World Bank, 2014. System of Environmental- Economic Accounting 2012. Central Framework. Retrieved from http://unstats.un.org/unsd/envaccounting/seeaRev/SEEA_CF_Final_en.pdfhttp://ec.europa.eu/environment/nature/capital_accounting/index_en.htm
Cost of Environmental Degradation in Croatia 100
(United Nations et al., 2014). While ‘supply’ refers to the contribution of different ecosystem types to generate the actual flow, ‘use’ refers to the contribution of the actual ES flow to the economic sectors and households. Importantly, both the supply and use table record the actual flow, thereby respecting the ‘accounting identity’ which means that supply must equal use (La Notte et al., 2017169; United Nations et al., 2014).
In parallel with the progress made on the SEEA EEA, the EU 7th Environment Action Program and the EU Biodiversity Strategy to 2020 include objectives to develop natural capital accounts in the EU, with a focus on ecosystems and their services (EC, 2011). In this context, the Knowledge Innovation Project on an Integrated system for Natural Capital and ecosystem services Accounting (KIP INCA)170 was set up in 2016 by several services of the European Commission – Directorate-General for Environment, Directorate-General for Research and Innovation, Joint Research Centre (JRC) and European Statistical Office (Eurostat) – and the European Environment Agency. The main objective of the project is to design and implement an integrated accounting system for ecosystems and their services in the EU, by testing and further developing, the technical recommendations provided by the SEEA EEA (United Nations et al., 2014). KIP INCA builds on the first phase of the EU initiative on Mapping and Assessment of Ecosystems and Services (MAES), which aims to map and assess ecosystems and their services in the EU. Ultimately, the key role of KIP INCA is to give support to the second phase of MAES, which focuses on the monetary valuation of ecosystem services and their integration into accounting and reporting systems by 2020.
In KIP INCA, at the EU level, experimental accounts for the actual flow of a range of ecosystem services are developed and the integrated results for the six ecosystem services accounted for so far at the EU level: crop provision, timber provision, global climate regulation, crop pollination, flood control and nature-based recreation, are provided. The results for all these ecosystem services include mapping of different components of ecosystem services, supply and use tables, and an analysis of changes over time. Ecosystem services accounts are provided for the years 2000, 2006 and 2012, matching the years in which CORINE land cover (CLC) maps are available. The KIP INCA framework for ES accounts follows three main steps: (i) biophysical assessment of the ecosystem service; (ii) translation into monetary terms; and (iii) compilation of supply and use tables. This framework is consistent with the accounting structure of the SNA and SEEA EEA (United Nations et al., 2014).
Estimation of the annual cost of losses in timber provision
Timber provision as an ecosystem service is defined as the ecological contribution to the production of timber that can be harvested and used as raw material (Vallecillio et al. 2019).171 As most of European forests are managed, timber provision is partially driven by human action. On the one hand, there are features beyond the control of forest management, such as biophysical site conditions and climate. On the other hand, tree species composition, tree growth, and shape are influenced by silvicultural operations such as thinning, clear cut or selective cutting, plantation, seeding or natural regeneration. The ecosystem contribution to timber provision is estimated at 0.67 the total output to the forestry sector in Croatia. The annual reduction of net increment of forestry in Croatia is estimated at 22 thousand m3 and valued at EUR 0.33 million.172
Estimation of the annual loss of global climate regulation service - reduction of carbon intake
Global climate regulation as an ecosystem service includes the sequestration of greenhouse gases from the atmosphere by ecosystems. Carbon sequestration by terrestrial ecosystems is used as proxy to measure the regulating effect that ecosystems may have. Annual CO2 intake reduction in Croatia is translated into the annual carbon sink change using information on the annual CO2 removals reduction from the Seventh National Communication, Croatia (2018) .173 Annual CO2 removals reduced by 2.77 Gt of CO2 in 2010-2015 with the carbon sink loss reduction at 6.93 Gt of CO2 and annual carbon sink reduction at 1.4 Gt of CO2. This estimate approximately corresponds to the net annual CO2 intake reduction, accumulated over the period of five years reflecting an irreversible character of LULUCF during this period. Social cost of carbon at EUR 30-50 per t of CO2 is utilized as a lower bound and a higher bound of carbon prices (as in Vallecillo et al, 2019). Then the annual loss of carbon intake is estimated at EUR 42-69 million.
169 La Notte, A., Vallecillo, S., Polce, C., Zulian, G. and Maes, J., 2017. Implementing an EU system of accounting for ecosystems and their services. Initial proposals for the implementation of ecosystem services accounts (Report under phase 2 of the knowledge innovation project on an integrated system of natural capital and ecosystem services accounting in the EU). JRC107150. Retrieved from http://publications.jrc.ec.europa.eu/repository/handle/JRC107150?mode=full.170 http://ec.europa.eu/environment/nature/capital_accounting/index_en.htm171 Vallecillo, S., La Notte, A., Kakoulaki, G., Kamberaj, J., Robert, N., Dottori, F., Feyen, L., Rega, C., Maes, J., 2019a. Ecosystem services accounting. Part II-Pilot accounts for crop and timber provision, global climate regulation and flood control, EUR 29731 EN, Publications Office of the European Union, Luxembourg. Retrieved from http://publications.jrc.ec.europa.eu/repository/handle/JRC116334.172 Market price used in 15 EUR/m3 as in Vallecillo et al, 2019173 https://unfccc.int/NC7
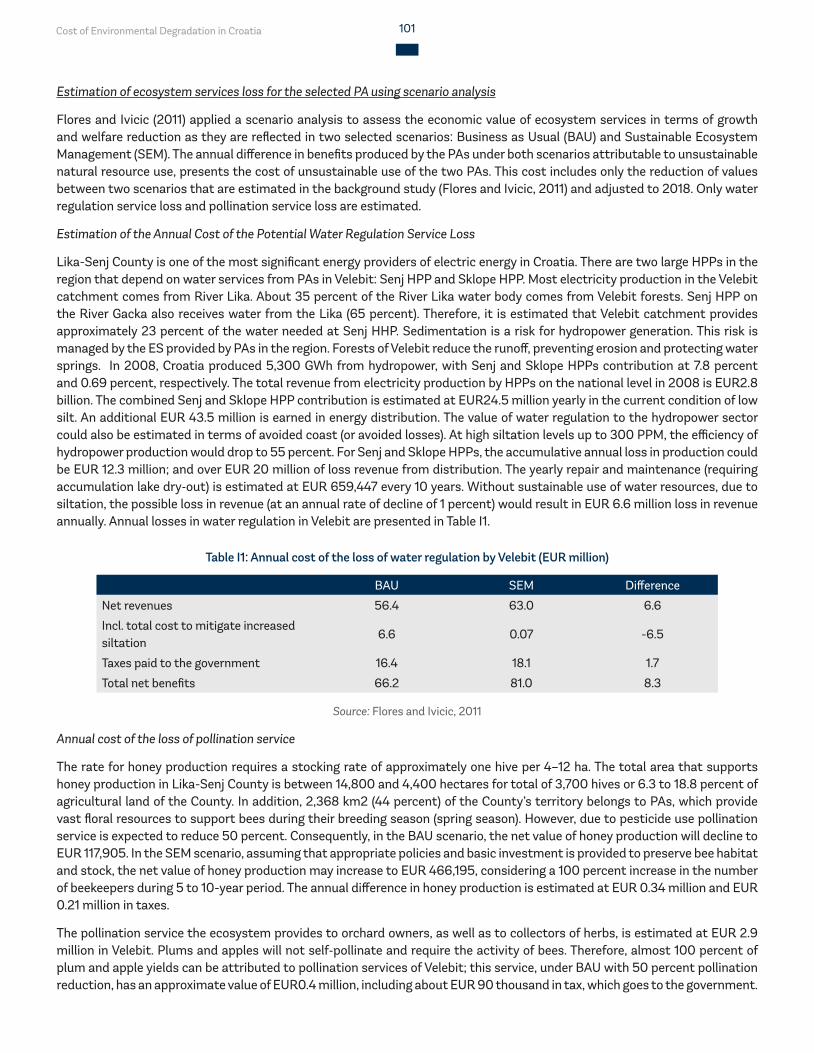
Cost of Environmental Degradation in Croatia 101
Estimation of ecosystem services loss for the selected PA using scenario analysis
Flores and Ivicic (2011) applied a scenario analysis to assess the economic value of ecosystem services in terms of growth and welfare reduction as they are reflected in two selected scenarios: Business as Usual (BAU) and Sustainable Ecosystem Management (SEM). The annual difference in benefits produced by the PAs under both scenarios attributable to unsustainable natural resource use, presents the cost of unsustainable use of the two PAs. This cost includes only the reduction of values between two scenarios that are estimated in the background study (Flores and Ivicic, 2011) and adjusted to 2018. Only water regulation service loss and pollination service loss are estimated.
Estimation of the Annual Cost of the Potential Water Regulation Service Loss
Lika-Senj County is one of the most significant energy providers of electric energy in Croatia. There are two large HPPs in the region that depend on water services from PAs in Velebit: Senj HPP and Sklope HPP. Most electricity production in the Velebit catchment comes from River Lika. About 35 percent of the River Lika water body comes from Velebit forests. Senj HPP on the River Gacka also receives water from the Lika (65 percent). Therefore, it is estimated that Velebit catchment provides approximately 23 percent of the water needed at Senj HHP. Sedimentation is a risk for hydropower generation. This risk is managed by the ES provided by PAs in the region. Forests of Velebit reduce the runoff, preventing erosion and protecting water springs. In 2008, Croatia produced 5,300 GWh from hydropower, with Senj and Sklope HPPs contribution at 7.8 percent and 0.69 percent, respectively. The total revenue from electricity production by HPPs on the national level in 2008 is EUR2.8 billion. The combined Senj and Sklope HPP contribution is estimated at EUR24.5 million yearly in the current condition of low silt. An additional EUR 43.5 million is earned in energy distribution. The value of water regulation to the hydropower sector could also be estimated in terms of avoided coast (or avoided losses). At high siltation levels up to 300 PPM, the efficiency of hydropower production would drop to 55 percent. For Senj and Sklope HPPs, the accumulative annual loss in production could be EUR 12.3 million; and over EUR 20 million of loss revenue from distribution. The yearly repair and maintenance (requiring accumulation lake dry‐out) is estimated at EUR 659,447 every 10 years. Without sustainable use of water resources, due to siltation, the possible loss in revenue (at an annual rate of decline of 1 percent) would result in EUR 6.6 million loss in revenue annually. Annual losses in water regulation in Velebit are presented in Table I1.
Table I1: Annual cost of the loss of water regulation by Velebit (EUR million)
BAU SEM Difference
Net revenues 56.4 63.0 6.6
Incl. total cost to mitigate increased siltation
6.6 0.07 -6.5
Taxes paid to the government 16.4 18.1 1.7
Total net benefits 66.2 81.0 8.3
Source: Flores and Ivicic, 2011
Annual cost of the loss of pollination service
The rate for honey production requires a stocking rate of approximately one hive per 4–12 ha. The total area that supports honey production in Lika-Senj County is between 14,800 and 4,400 hectares for total of 3,700 hives or 6.3 to 18.8 percent of agricultural land of the County. In addition, 2,368 km2 (44 percent) of the County’s territory belongs to PAs, which provide vast floral resources to support bees during their breeding season (spring season). However, due to pesticide use pollination service is expected to reduce 50 percent. Consequently, in the BAU scenario, the net value of honey production will decline to EUR 117,905. In the SEM scenario, assuming that appropriate policies and basic investment is provided to preserve bee habitat and stock, the net value of honey production may increase to EUR 466,195, considering a 100 percent increase in the number of beekeepers during 5 to 10-year period. The annual difference in honey production is estimated at EUR 0.34 million and EUR 0.21 million in taxes.
The pollination service the ecosystem provides to orchard owners, as well as to collectors of herbs, is estimated at EUR 2.9 million in Velebit. Plums and apples will not self‐pollinate and require the activity of bees. Therefore, almost 100 percent of plum and apple yields can be attributed to pollination services of Velebit; this service, under BAU with 50 percent pollination reduction, has an approximate value of EUR0.4 million, including about EUR 90 thousand in tax, which goes to the government.
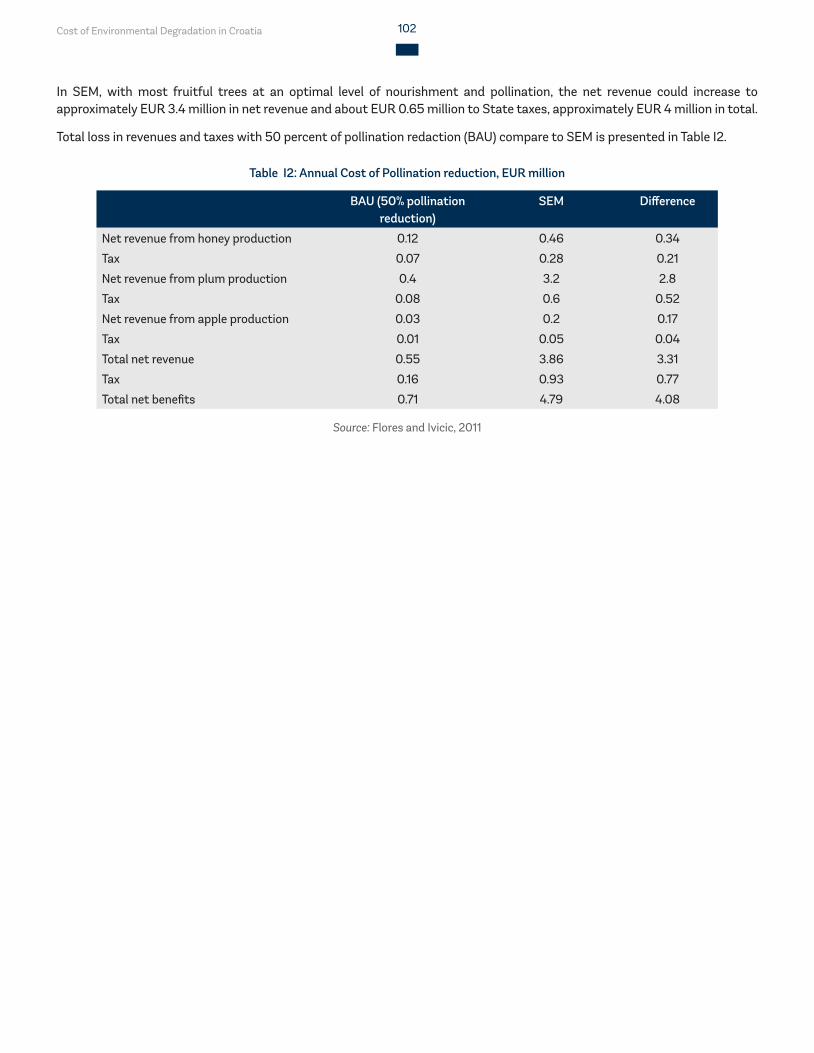
Cost of Environmental Degradation in Croatia 102
In SEM, with most fruitful trees at an optimal level of nourishment and pollination, the net revenue could increase to approximately EUR 3.4 million in net revenue and about EUR 0.65 million to State taxes, approximately EUR 4 million in total.
Total loss in revenues and taxes with 50 percent of pollination redaction (BAU) compare to SEM is presented in Table I2.
Table I2: Annual Cost of Pollination reduction, EUR million
BAU (50% pollination reduction)
SEM Difference
Net revenue from honey production 0.12 0.46 0.34
Tax 0.07 0.28 0.21
Net revenue from plum production 0.4 3.2 2.8
Tax 0.08 0.6 0.52
Net revenue from apple production 0.03 0.2 0.17
Tax 0.01 0.05 0.04
Total net revenue 0.55 3.86 3.31
Tax 0.16 0.93 0.77
Total net benefits 0.71 4.79 4.08
Source: Flores and Ivicic, 2011

Cost of Environmental Degradation in Croatia 103
Photo:
Vladimir Kalinski
Hrvatska turistička zajednica
shutterstock.com
unsplash.com
design by rappa.hr
Cost of Environmental Degradation in Croatia 104
Europe and Central Asia | Sustainable Development | Environment, Natural Resources and Blue Economy Global Practice | The World BankJanuary 2021
CROATIA: COST OF ENVIRONMENTAL DEGRADATION


![Antika: Hrvatska, SR, [Antiquity: Croatia, Socialist Republic of.]](https://img.dokumen.tips/doc/110x75/6344769958efaca902044247/antika-hrvatska-sr-antiquity-croatia-socialist-republic-of-.jpg)


