Embed Size (px)
Citation preview
www.elsevier.com/locate/visres
Vision Research 45 (2005) 2523–2532
Criteria interactions across visual attributes
Andrei Gorea a,*, Florent Caetta a, Dov Sagi b
a Laboratoire de Psychologie Experimentale, CNRS & Rene Descartes University, 71 Avenue Edouard Vaillant, 92774 Boulogne-Billancourt, Franceb Department of Neurobiology/Brain Research, Weizmann Institute of Science Rehovot, 76100 Israel
Received 21 September 2004; received in revised form 28 February 2005
Abstract
Judgmental interference in dual tasks has been demonstrated in conditions where the detection or discrimination of different con-
trast increments applied to two stimuli presented simultaneously or in sequence. The present work demonstrates such interference
for changes along two distinct visual features, namely contrast and orientation, when simultaneously applied to the same or to two
distinct objects (Gabor-patches). The interference reveals itself in the use of quasi-equal decision criteria for both dimensions, in
conflict with an optimal behavior requiring that criteria be proportional to the sensitivities for the distinct changes. The quasi-equal-
ity of the criteria assessed for contrast and orientation changes implies the equality of the internal noises characterizing the respec-
tive detection process, hence suggesting that they are limited at the decision level. Among the conceptual consequences of this
limitation are the existence of a meta-attribute decisional dimension (tantamount to that of a ‘‘central executive system’’) and
the questionable merits of probability summation over spatial channels. In addition, the data show a significant sensitivity drop
in the dual- with respect to the single-task conditions, all the more so when the modulated features belong to two objects rather
than to the same object. While the sensitivity drop in dual tasks is the standard trademark of distributed attention, it is argued that
decisional interference is yet another aspect of it.
� 2005 Elsevier Ltd. All rights reserved.
Keywords: Decision; Sensitivity; Signal detection theory; Internal noise; Dual task; Attention
1. Introduction
In 1999 we presented data supporting the notion that
in a multi-decision visual task involving different
strength (i.e. contrast), non-interfering stimuli presented
simultaneously, observers behave non-optimally: instead
of independently modulating their response behavior in
accordance with the specifics of the stimuli they report
upon (as required by Signal Detection Theory; Greenand Swets, 1966), their decision behavior exhibits strong
criteria interactions (Gorea and Sagi, 1999, 2000, 2001,
2002a,b). More specifically, with stimuli differing in
strength but with equal probability of occurrence, our
0042-6989/$ - see front matter � 2005 Elsevier Ltd. All rights reserved.
doi:10.1016/j.visres.2005.03.018
* Corresponding author. Tel.: +33 1 5520 5927.
E-mail addresses: [email protected], andrei.gorea@
univ-paris5.fr (A. Gorea).
results indicated that response criteria shifted to higherand lower values for the less and the more salient stim-
uli, respectively, as if attracted by each other. Criteria
attraction was observed in a number of experimental
conditions involving detection (Gorea and Sagi, 2000,
2002b), discrimination (Gorea and Sagi, 2001) and
suprathreshold matching experiments (Gorea and Sagi,
unpublished) for both simultaneously and sequentially
presented stimuli (Gorea and Sagi, unpublished, 2003).We interpreted this criteria attraction as the consequence
of a unitary internal representation of the (physically)
distinct events along the dimension under study (i.e.
contrast). This judgmental interference is close to intui-
tion: in multiple stimulus environments, the weaker (less
visible) stimuli are reported less and the stronger (more
visible) ones are reported more frequently than when
they are presented in isolation. Such a behavior fits well
2524 A. Gorea et al. / Vision Research 45 (2005) 2523–2532
within the wide spectrum of older (for a review see Bor-
ing, 1942) and more recent (e.g. Adelson et al., 2000;
Gilchrist et al., 1999) context theories including Gestalt
(Koffka, 1935, fourth print, 1955), adaptation-level
(Helson, 1964) and other anchoring effects.
To date, all the experimental conditions yielding crite-ria attraction involved one single visual attribute (con-
trast), with its different values ‘‘attached’’ to spatially
(for simultaneous presentations), or temporally (for
sequential presentations) distinct visual objects. The pur-
pose of the present study is to test the generality of crite-
ria attraction over distinct visual attributes belonging to
either the same object or to two distinct visual objects.
The issue of limitations in the co-processing of dis-tinct (visual) attributes has been addressed from at least
two different perspectives. One relates to the capacity of
short term (or working) memory originally addressed by
Miller (1956) and recently updated by Luck and Vogel�swork (Luck and Vogel, 1997; Vogel et al., 2001). The
main observation to be drawn from that literature and
relevant to the present inquiry is that the number of
attributes that can be stored at a time depends on howthey are distributed over distinct visual objects: this
number can be substantially increased when more than
one attribute is ‘‘attached’’ to the same object. The sec-
ond perspective put forth by Duncan (1984) bears on the
attentional limitations in visual processing as they relate
to the number of attributes one can attend to and report
on depending on whether or not they belong to the same
visual object. Quite recently, Han et al. (2003) haveshown that, with low-noise stimuli, sensitivity deficits
in dual- (as compared to a single-) attribute reports
are observed only if the two attributes are different
and belong to distinct objects; equivalent dual-attribute
deficits were also observed with high-noise stimuli for
distinct attributes belonging to the same object.
There are two ways in which the literature above is
relevant to the present study. On the one hand, itencompasses the issue of objecthood which is critical to
our inquiry as it pertains to the problem of judgmental
interference within and across visual attributes and ob-
jects. The general question at hand is whether or not
the notion of a visual dimension/attribute can be con-
founded with that of an object, namely a spatially and
temporally limited visual entity. On the other hand, it
connects to our previous account of judgmental interfer-ence as an attentional relaxation process (Gorea and
Sagi, 2003, 2005). While attentional limitations in gener-
al and in dual-task conditions, in particular, are typical-
ly assessed in terms of sensitivity losses (e.g. Han et al.,
2003), we have proposed that they may also be quanti-
fied in terms of criteria attraction (i.e. judgmental inter-
ference). In view of Han et al.�s (2003) work, it is
legitimate to ask whether criteria attraction (hence‘‘attention relaxation’’) across attributes can be equally
observed within and across visual objects.
2. Methods
The specific purpose of the present study is the assess-
ment of sensitivity (d 0) and decision criterion (c 0) in a
task where observers have to decide on the presence of
one (contrast or orientation; single task) or two (contrastand orientation; dual task) changes applied to one or two
visual objects. The main question to be answered re-
gards the putative interference between the decisions
made on each of these attributes. Decisional interference
(in the dual task) is to be assessed in terms of ‘‘criteria
attraction’’ which can be evidenced only inasmuch as
the absolute criteria (c 0; see Fig. 2 and section ‘‘Data for-
mat and operationalization’’) assessed in the single tasksare unequal (Gorea and Sagi, 2000). Achieving such a c 0
inequality requires that the potentially decisionally
interfering stimuli yield different sensitivities. Hence,
the contrast and orientation changes used here were
each applied at two distinct levels yielding d 0 values of
about 1 and 2.
2.1. Stimuli
They were Gabor patches presented on a Philips
monitor (1024 · 750 px) with a 100 Hz raster under
the control of a PC. The mean luminance of the screen
was 48 cd/m2. The Gabors had a spatial frequency of
3.8 cpd and a standard deviation of 0.26� at 100 cm
from the observer�s eyes. They were presented either at
fixation (Experiment 1) or ±1.6� to the left and to theright of a small (0.4� diameter) fixation white circle
(Experiment 2). The spatial phase of the Gabors� carrierwas randomized across trials. The reference Gabors
were vertical and had a contrast of 20%. The target Ga-
bors could differ from the reference ones in contrast
(increments), in orientation (clockwise rotations), or in
both. They were chosen for each observer so as to yield
discrimination (from reference) d 0 values close to 1 and2. This was done based on preliminary experiments
where discrimination performances were independently
assessed for a range of contrast increments and orienta-
tion rotations. Black or white (see below) circles 1.3� indiameter and 1 pixel thick circumscribed the targets and
were displayed until the observer�s response. Reference
and target Gabors were each presented for 80 ms.
2.2. Procedure
Sensitivities (d 0) and response criteria (c 0) were as-
sessed by means of a standard Yes/No procedure where
observers had to decide whether or not the target
differed from the reference either in contrast (C) or in
orientation (O).
Experiment 1: Two attributes, one object. In thisexperiment only one reference and one target were
displayed in succession at fixation, with the latter
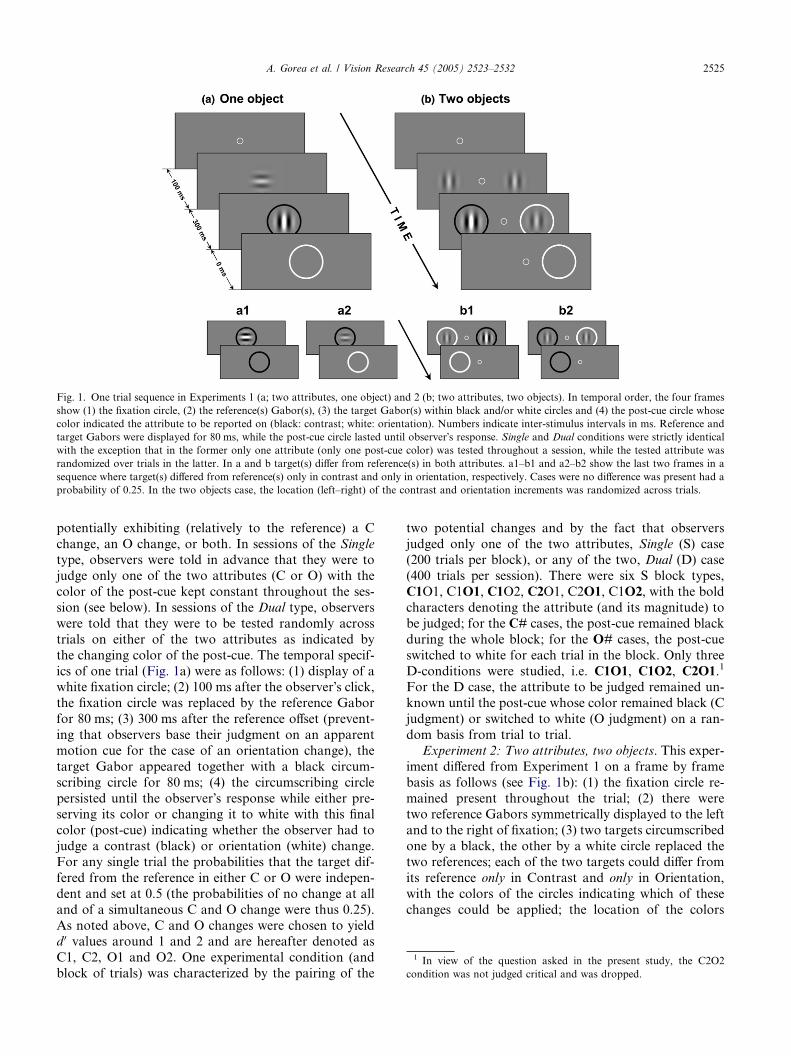
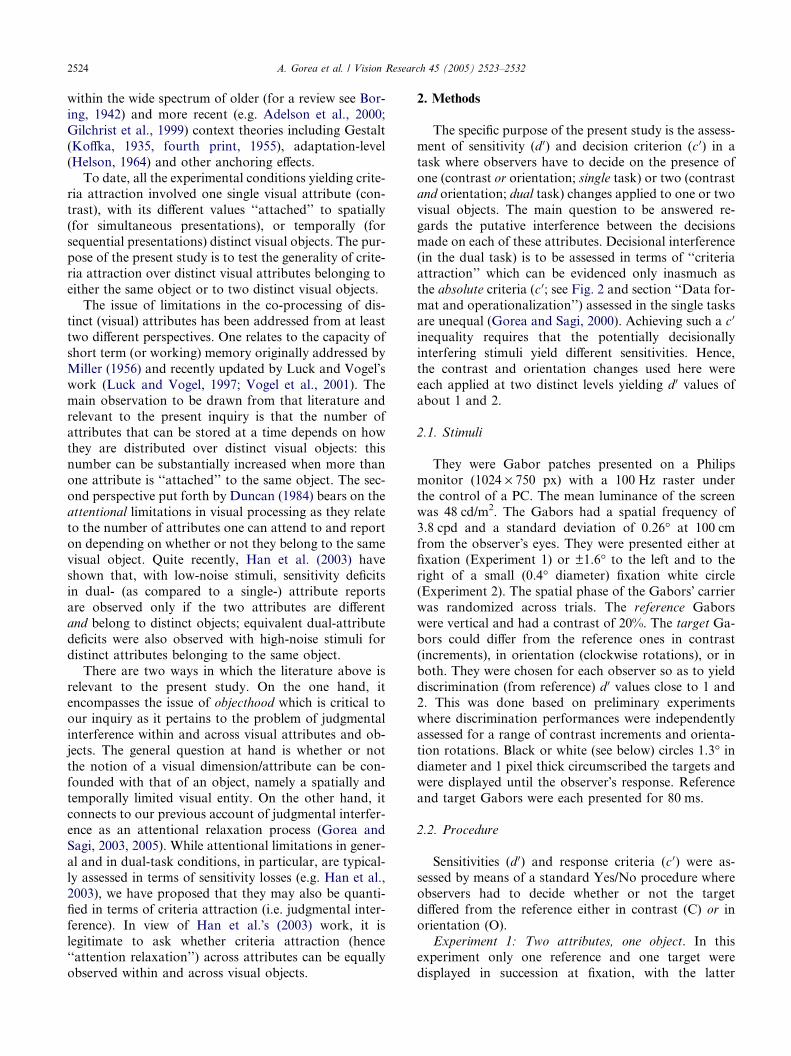
Fig. 1. One trial sequence in Experiments 1 (a; two attributes, one object) and 2 (b; two attributes, two objects). In temporal order, the four frames
show (1) the fixation circle, (2) the reference(s) Gabor(s), (3) the target Gabor(s) within black and/or white circles and (4) the post-cue circle whose
color indicated the attribute to be reported on (black: contrast; white: orientation). Numbers indicate inter-stimulus intervals in ms. Reference and
target Gabors were displayed for 80 ms, while the post-cue circle lasted until observer�s response. Single and Dual conditions were strictly identical
with the exception that in the former only one attribute (only one post-cue color) was tested throughout a session, while the tested attribute was
randomized over trials in the latter. In a and b target(s) differ from reference(s) in both attributes. a1–b1 and a2–b2 show the last two frames in a
sequence where target(s) differed from reference(s) only in contrast and only in orientation, respectively. Cases were no difference was present had a
probability of 0.25. In the two objects case, the location (left–right) of the contrast and orientation increments was randomized across trials.
1 In view of the question asked in the present study, the C2O2condition was not judged critical and was dropped.
A. Gorea et al. / Vision Research 45 (2005) 2523–2532 2525
potentially exhibiting (relatively to the reference) a C
change, an O change, or both. In sessions of the Single
type, observers were told in advance that they were to
judge only one of the two attributes (C or O) with the
color of the post-cue kept constant throughout the ses-
sion (see below). In sessions of the Dual type, observers
were told that they were to be tested randomly across
trials on either of the two attributes as indicated by
the changing color of the post-cue. The temporal specif-
ics of one trial (Fig. 1a) were as follows: (1) display of awhite fixation circle; (2) 100 ms after the observer�s click,the fixation circle was replaced by the reference Gabor
for 80 ms; (3) 300 ms after the reference offset (prevent-
ing that observers base their judgment on an apparent
motion cue for the case of an orientation change), the
target Gabor appeared together with a black circum-
scribing circle for 80 ms; (4) the circumscribing circle
persisted until the observer�s response while either pre-serving its color or changing it to white with this final
color (post-cue) indicating whether the observer had to
judge a contrast (black) or orientation (white) change.
For any single trial the probabilities that the target dif-
fered from the reference in either C or O were indepen-
dent and set at 0.5 (the probabilities of no change at all
and of a simultaneous C and O change were thus 0.25).
As noted above, C and O changes were chosen to yieldd 0 values around 1 and 2 and are hereafter denoted as
C1, C2, O1 and O2. One experimental condition (and
block of trials) was characterized by the pairing of the
two potential changes and by the fact that observers
judged only one of the two attributes, Single (S) case(200 trials per block), or any of the two, Dual (D) case
(400 trials per session). There were six S block types,
C1O1, C1O1, C1O2, C2O1, C2O1, C1O2, with the bold
characters denoting the attribute (and its magnitude) to
be judged; for the C# cases, the post-cue remained black
during the whole block; for the O# cases, the post-cue
switched to white for each trial in the block. Only three
D-conditions were studied, i.e. C1O1, C1O2, C2O1.1
For the D case, the attribute to be judged remained un-
known until the post-cue whose color remained black (C
judgment) or switched to white (O judgment) on a ran-
dom basis from trial to trial.
Experiment 2: Two attributes, two objects. This exper-
iment differed from Experiment 1 on a frame by frame
basis as follows (see Fig. 1b): (1) the fixation circle re-
mained present throughout the trial; (2) there weretwo reference Gabors symmetrically displayed to the left
and to the right of fixation; (3) two targets circumscribed
one by a black, the other by a white circle replaced the
two references; each of the two targets could differ from
its reference only in Contrast and only in Orientation,
with the colors of the circles indicating which of these
changes could be applied; the location of the colors
Fig. 2. Signal Detection Theory (SDT) and the unique criterion
illustrated for equally likely Signal (S) and Noise (N) trials. All plots
represent the probabilities (ordinates) of the internal responses
(represented as standard z-scores on the sensory continuum; abscissae)
evoked by N and S trials (dashed and continuous Gaussians).
Continuous and dashed vertical lines show the mean of the N
distribution(s) and the location of the absolute response criteria (c 0).
Hatched areas show the cumulated probabilities of False Alarms. (a):
2526 A. Gorea et al. / Vision Research 45 (2005) 2523–2532
(and hence of the denoted changes) was randomized
across trials; (4) both targets and one cue circle disap-
peared with the persisting circle (post-cue) denoting
the target and the attribute to be judged. Experiment 2
also included 6 S and 3 D block types. In the S-condi-
tions, the observer was told in advance which attributehe will be judging throughout the session and the color
of the persistent post-cue was correspondingly fixed dur-
ing the whole session. In the D-conditions the color of
the persistent circle was randomized across trials so that
the observer did not know which attribute he�ll be askedto judge over trials.
For each of the two experiments, the order of the nine
experimental conditions was randomized across observ-ers with each condition repeated two or three times so
that the final d 0-s and c 0-s were computed from a mini-
mum of 400 and a maximum of 600 trials. The assess-
ment of two C and two O values yielding d 0-s close to 1
and 2 (for each observer) was performed under S-condi-
tions, started with at least four training sessions (800 tri-
als) per attribute and continued with four to six C and O
values. All in all, the preliminary stage involved an aver-age of 3400 trials per observer for each Experiment. The
preliminary and main phases of each Experiment were
run over one to four weeks for each observer.
2.3. Observers
They were four for each experiment. The two first
authors and one naıve observer were run in bothexperiments. The remaining observer was also naıve
and different across experiments. All observers had
normal or corrected to normal vision.
The case for one S; (b) and (c): the case for two S of unequal variances
(r1,r2). For equally likely N and S trials, an optimal observer places
his c 0 at the intersection of the N and S Gaussians, whether tested with
one (a) or two different S (b), provided that the two S are
unambiguously labeled. A departure from this optimal behavior is
shown in (c) where the observer uses a unique criterion ðc0UÞ located
somewhere in-between the optimal criteria.
3. Data format and operationalization
The main question asked here concerns the putativeattraction of response criteria across contrast (C) and
orientation (O) attributes characterizing one (Experi-
ment 1) or two distinct objects (Experiment 2) when they
are to be discriminated from a reference within the same
trial. Criteria equality represents an extreme attraction
case. Here we define the criterion as usually (see Gorea
and Sagi, 2000, 2001, 2002a,b, unpublished), namely
as the decision point on the sensory continuum mea-sured with reference to the mean of the noise (Fig. 2);
this is but the (negative) z score of False Alarms, �zFA.
Under standard Signal Detection Theory (SDT; Green
and Swets, 1966), the zFA of an optimal observer (for
a signal probability of 0.5) should equal half his sensitiv-
ity, i.e. zFA = d 0/2. It follows that the zFA ratio for any
arbitrary pair of independent stimuli, 1 and 2, should
equal the corresponding d 0 ratio
zFA1 ¼ d 010 ð1Þ
zFA2 d2
In contrast, a unique criterion (uc) behavior requires that
zFA1 = zFA2. As zFA scores are given in unknownnoise units (r), the proper expression of the uc is given
by
r1zFA1 ¼ r2zFA2 ð2Þwhich is equivalent to
zFA1
zFA2
¼ r2
r1
¼ k ð20Þ
Eq. (2 0) is useful as it allows comparison of criteria
across stimuli addressing perceptual processes with
unknown noise (in the present case those underlying
contrast and orientation discrimination). What is
more, an observed constancy of the zFA ratio (i.e. its
A. Gorea et al. / Vision Research 45 (2005) 2523–2532 2527
independence of the d 0 ratio) also specifies the noise ra-
tio, k, between these processes.
Under the specific format of the present experiments,
Eq. (2 0) translates into
zFACi
zFAOj¼ rO
rC
¼ k ð200Þ
with i and j the two sensitivity levels used when pairing
C and O increments in the Dual task, namely conditions
C1O1, C1O2 and C2O1 as defined in the Procedure
section.
The present data are hence presented as the zFA ra-
tios of the paired (D condition) and of the correspond-
ing unpaired (S condition) stimuli as a function of thecorresponding d 0 ratios. SDT predicts a linear function
of slope 1 for both S and D conditions. The uc behavior
is applicable only to the latter for which it predicts a
slope of 0. For the purpose of the regression analysis,
these ratios were transformed into their log equivalents.
4. Results
4.1. Criteria ratios vs. sensitivity ratios
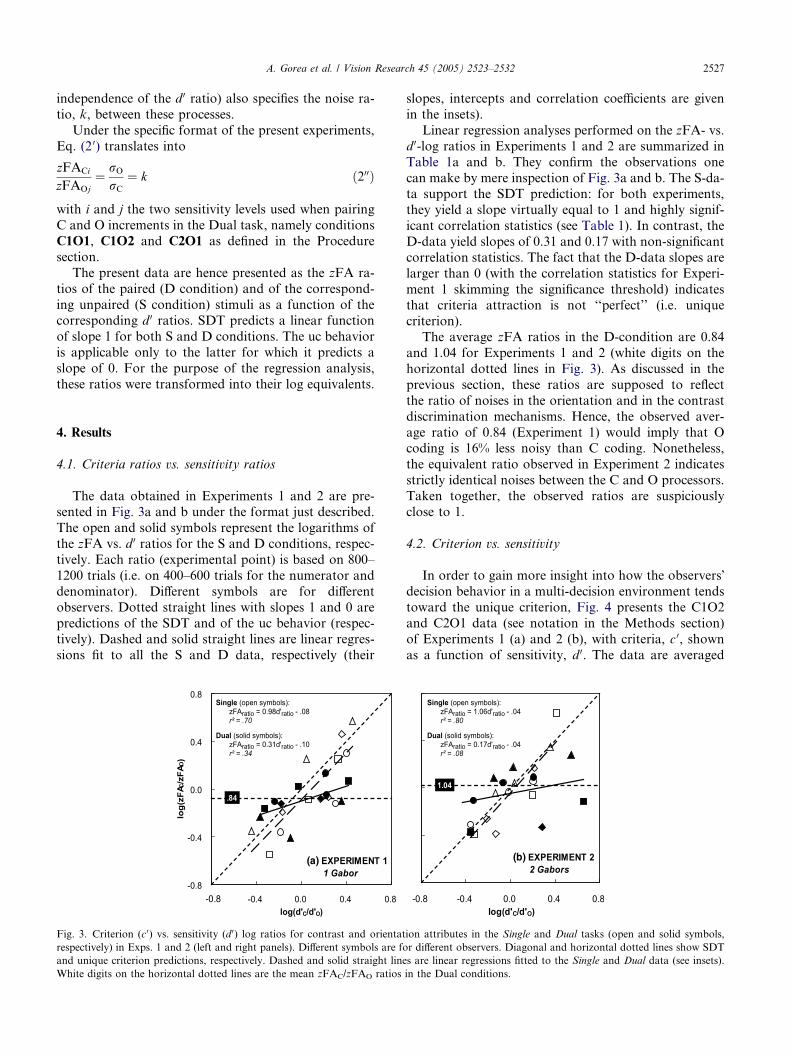
The data obtained in Experiments 1 and 2 are pre-sented in Fig. 3a and b under the format just described.
The open and solid symbols represent the logarithms of
the zFA vs. d 0 ratios for the S and D conditions, respec-
tively. Each ratio (experimental point) is based on 800–
1200 trials (i.e. on 400–600 trials for the numerator and
denominator). Different symbols are for different
observers. Dotted straight lines with slopes 1 and 0 are
predictions of the SDT and of the uc behavior (respec-tively). Dashed and solid straight lines are linear regres-
sions fit to all the S and D data, respectively (their
Fig. 3. Criterion (c 0) vs. sensitivity (d 0) log ratios for contrast and orientat
respectively) in Exps. 1 and 2 (left and right panels). Different symbols are fo
and unique criterion predictions, respectively. Dashed and solid straight line
White digits on the horizontal dotted lines are the mean zFAC/zFAO ratios
slopes, intercepts and correlation coefficients are given
in the insets).
Linear regression analyses performed on the zFA- vs.
d 0-log ratios in Experiments 1 and 2 are summarized in
Table 1a and b. They confirm the observations one
can make by mere inspection of Fig. 3a and b. The S-da-ta support the SDT prediction: for both experiments,
they yield a slope virtually equal to 1 and highly signif-
icant correlation statistics (see Table 1). In contrast, the
D-data yield slopes of 0.31 and 0.17 with non-significant
correlation statistics. The fact that the D-data slopes are
larger than 0 (with the correlation statistics for Experi-
ment 1 skimming the significance threshold) indicates
that criteria attraction is not ‘‘perfect’’ (i.e. uniquecriterion).
The average zFA ratios in the D-condition are 0.84
and 1.04 for Experiments 1 and 2 (white digits on the
horizontal dotted lines in Fig. 3). As discussed in the
previous section, these ratios are supposed to reflect
the ratio of noises in the orientation and in the contrast
discrimination mechanisms. Hence, the observed aver-
age ratio of 0.84 (Experiment 1) would imply that Ocoding is 16% less noisy than C coding. Nonetheless,
the equivalent ratio observed in Experiment 2 indicates
strictly identical noises between the C and O processors.
Taken together, the observed ratios are suspiciously
close to 1.
4.2. Criterion vs. sensitivity
In order to gain more insight into how the observers�decision behavior in a multi-decision environment tends
toward the unique criterion, Fig. 4 presents the C1O2
and C2O1 data (see notation in the Methods section)
of Experiments 1 (a) and 2 (b), with criteria, c 0, shown
as a function of sensitivity, d 0. The data are averaged
ion attributes in the Single and Dual tasks (open and solid symbols,
r different observers. Diagonal and horizontal dotted lines show SDT
s are linear regressions fitted to the Single and Dual data (see insets).
in the Dual conditions.
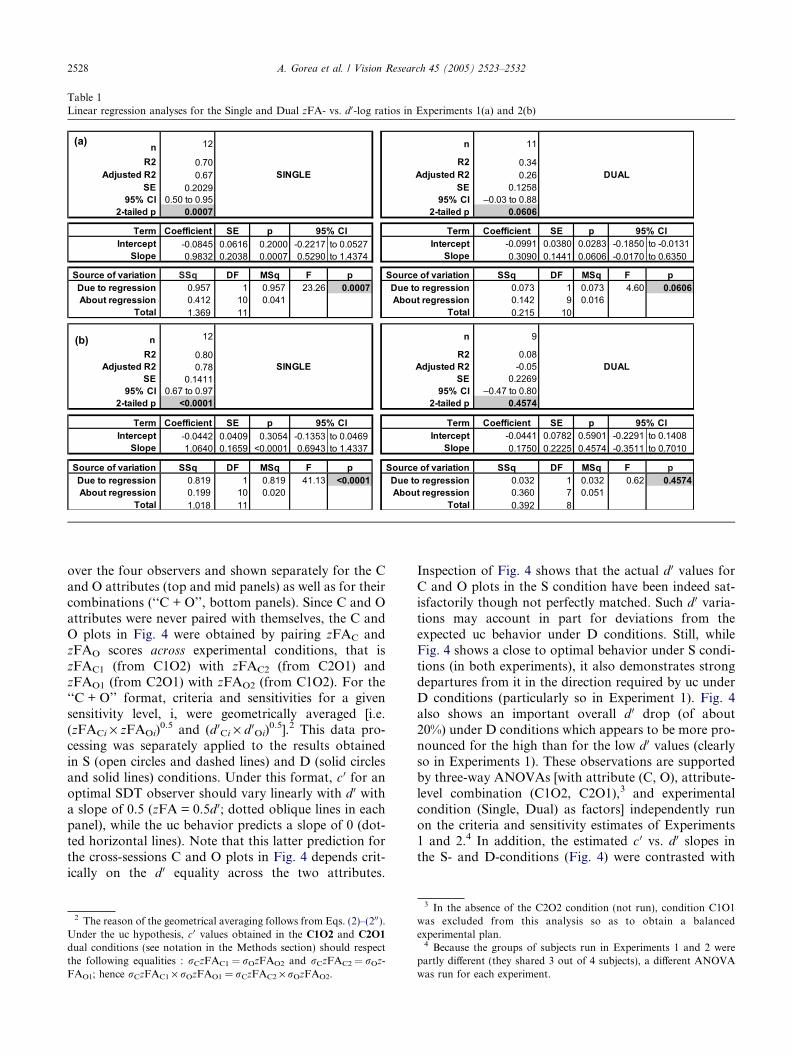
Table 1
Linear regression analyses for the Single and Dual zFA- vs. d 0-log ratios in Experiments 1(a) and 2(b)
2528 A. Gorea et al. / Vision Research 45 (2005) 2523–2532
over the four observers and shown separately for the C
and O attributes (top and mid panels) as well as for their
combinations (‘‘C + O’’, bottom panels). Since C and O
attributes were never paired with themselves, the C and
O plots in Fig. 4 were obtained by pairing zFAC and
zFAO scores across experimental conditions, that is
zFAC1 (from C1O2) with zFAC2 (from C2O1) and
zFAO1 (from C2O1) with zFAO2 (from C1O2). For the‘‘C + O’’ format, criteria and sensitivities for a given
sensitivity level, i, were geometrically averaged [i.e.
(zFACi · zFAOi)0.5 and (d 0
Ci · d 0Oi)
0.5].2 This data pro-
cessing was separately applied to the results obtained
in S (open circles and dashed lines) and D (solid circles
and solid lines) conditions. Under this format, c 0 for an
optimal SDT observer should vary linearly with d 0 with
a slope of 0.5 (zFA = 0.5d 0; dotted oblique lines in eachpanel), while the uc behavior predicts a slope of 0 (dot-
ted horizontal lines). Note that this latter prediction for
the cross-sessions C and O plots in Fig. 4 depends crit-
ically on the d 0 equality across the two attributes.
2 The reason of the geometrical averaging follows from Eqs. (2)–(200).Under the uc hypothesis, c 0 values obtained in the C1O2 and C2O1
dual conditions (see notation in the Methods section) should respectthe following equalities : rCzFAC1 = rOzFAO2 and rCzFAC2 = rOz-FAO1; hence rCzFAC1 · rOzFAO1 = rCzFAC2 · rOzFAO2.
Inspection of Fig. 4 shows that the actual d 0 values for
C and O plots in the S condition have been indeed sat-
isfactorily though not perfectly matched. Such d 0 varia-
tions may account in part for deviations from the
expected uc behavior under D conditions. Still, while
Fig. 4 shows a close to optimal behavior under S condi-
tions (in both experiments), it also demonstrates strong
departures from it in the direction required by uc underD conditions (particularly so in Experiment 1). Fig. 4
also shows an important overall d 0 drop (of about
20%) under D conditions which appears to be more pro-
nounced for the high than for the low d 0 values (clearly
so in Experiments 1). These observations are supported
by three-way ANOVAs [with attribute (C, O), attribute-
level combination (C1O2, C2O1),3 and experimental
condition (Single, Dual) as factors] independently runon the criteria and sensitivity estimates of Experiments
1 and 2.4 In addition, the estimated c 0 vs. d 0 slopes in
the S- and D-conditions (Fig. 4) were contrasted with
3 In the absence of the C2O2 condition (not run), condition C1O1was excluded from this analysis so as to obtain a balancedexperimental plan.4 Because the groups of subjects run in Experiments 1 and 2 were
partly different (they shared 3 out of 4 subjects), a different ANOVAwas run for each experiment.
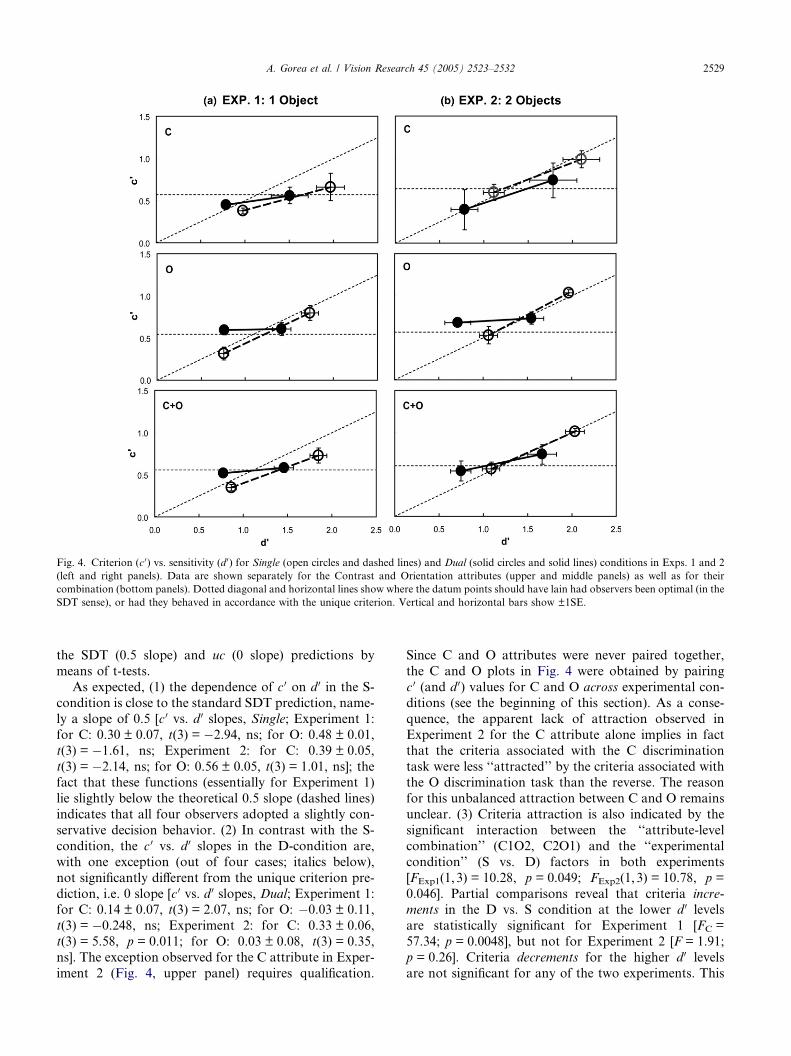
Fig. 4. Criterion (c 0) vs. sensitivity (d 0) for Single (open circles and dashed lines) and Dual (solid circles and solid lines) conditions in Exps. 1 and 2
(left and right panels). Data are shown separately for the Contrast and Orientation attributes (upper and middle panels) as well as for their
combination (bottom panels). Dotted diagonal and horizontal lines show where the datum points should have lain had observers been optimal (in the
SDT sense), or had they behaved in accordance with the unique criterion. Vertical and horizontal bars show ±1SE.
A. Gorea et al. / Vision Research 45 (2005) 2523–2532 2529
the SDT (0.5 slope) and uc (0 slope) predictions by
means of t-tests.
As expected, (1) the dependence of c 0 on d 0 in the S-
condition is close to the standard SDT prediction, name-
ly a slope of 0.5 [c 0 vs. d 0 slopes, Single; Experiment 1:
for C: 0.30 ± 0.07, t(3) = �2.94, ns; for O: 0.48 ± 0.01,
t(3) = �1.61, ns; Experiment 2: for C: 0.39 ± 0.05,
t(3) = �2.14, ns; for O: 0.56 ± 0.05, t(3) = 1.01, ns]; thefact that these functions (essentially for Experiment 1)
lie slightly below the theoretical 0.5 slope (dashed lines)
indicates that all four observers adopted a slightly con-
servative decision behavior. (2) In contrast with the S-
condition, the c 0 vs. d 0 slopes in the D-condition are,
with one exception (out of four cases; italics below),
not significantly different from the unique criterion pre-
diction, i.e. 0 slope [c 0 vs. d 0 slopes, Dual; Experiment 1:for C: 0.14 ± 0.07, t(3) = 2.07, ns; for O: �0.03 ± 0.11,
t(3) = �0.248, ns; Experiment 2: for C: 0.33 ± 0.06,
t(3) = 5.58, p = 0.011; for O: 0.03 ± 0.08, t(3) = 0.35,
ns]. The exception observed for the C attribute in Exper-
iment 2 (Fig. 4, upper panel) requires qualification.
Since C and O attributes were never paired together,
the C and O plots in Fig. 4 were obtained by pairing
c 0 (and d 0) values for C and O across experimental con-
ditions (see the beginning of this section). As a conse-
quence, the apparent lack of attraction observed in
Experiment 2 for the C attribute alone implies in fact
that the criteria associated with the C discrimination
task were less ‘‘attracted’’ by the criteria associated withthe O discrimination task than the reverse. The reason
for this unbalanced attraction between C and O remains
unclear. (3) Criteria attraction is also indicated by the
significant interaction between the ‘‘attribute-level
combination’’ (C1O2, C2O1) and the ‘‘experimental
condition’’ (S vs. D) factors in both experiments
[FExp1(1,3) = 10.28, p = 0.049; FExp2(1,3) = 10.78, p =
0.046]. Partial comparisons reveal that criteria incre-
ments in the D vs. S condition at the lower d 0 levels
are statistically significant for Experiment 1 [FC =
57.34; p = 0.0048], but not for Experiment 2 [F = 1.91;
p = 0.26]. Criteria decrements for the higher d 0 levels
are not significant for any of the two experiments. This
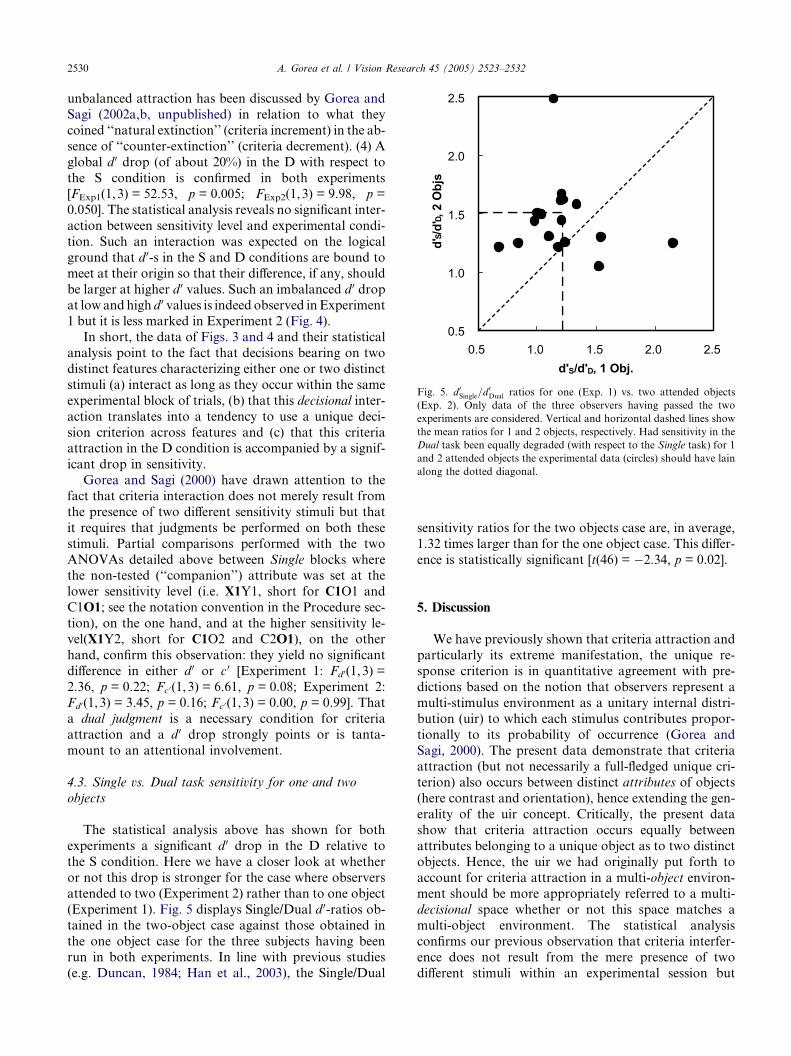
Fig. 5. d 0Single=d
0Dual ratios for one (Exp. 1) vs. two attended objects
(Exp. 2). Only data of the three observers having passed the two
experiments are considered. Vertical and horizontal dashed lines show
the mean ratios for 1 and 2 objects, respectively. Had sensitivity in the
Dual task been equally degraded (with respect to the Single task) for 1
and 2 attended objects the experimental data (circles) should have lain
along the dotted diagonal.
2530 A. Gorea et al. / Vision Research 45 (2005) 2523–2532
unbalanced attraction has been discussed by Gorea and
Sagi (2002a,b, unpublished) in relation to what they
coined ‘‘natural extinction’’ (criteria increment) in the ab-
sence of ‘‘counter-extinction’’ (criteria decrement). (4) A
global d 0 drop (of about 20%) in the D with respect to
the S condition is confirmed in both experiments[FExp1(1,3) = 52.53, p = 0.005; FExp2(1,3) = 9.98, p =
0.050]. The statistical analysis reveals no significant inter-
action between sensitivity level and experimental condi-
tion. Such an interaction was expected on the logical
ground that d 0-s in the S and D conditions are bound to
meet at their origin so that their difference, if any, should
be larger at higher d 0 values. Such an imbalanced d 0 drop
at low and high d 0 values is indeed observed inExperiment1 but it is less marked in Experiment 2 (Fig. 4).
In short, the data of Figs. 3 and 4 and their statistical
analysis point to the fact that decisions bearing on two
distinct features characterizing either one or two distinct
stimuli (a) interact as long as they occur within the same
experimental block of trials, (b) that this decisional inter-
action translates into a tendency to use a unique deci-
sion criterion across features and (c) that this criteriaattraction in the D condition is accompanied by a signif-
icant drop in sensitivity.
Gorea and Sagi (2000) have drawn attention to the
fact that criteria interaction does not merely result from
the presence of two different sensitivity stimuli but that
it requires that judgments be performed on both these
stimuli. Partial comparisons performed with the two
ANOVAs detailed above between Single blocks wherethe non-tested (‘‘companion’’) attribute was set at the
lower sensitivity level (i.e. X1Y1, short for C1O1 and
C1O1; see the notation convention in the Procedure sec-
tion), on the one hand, and at the higher sensitivity le-
vel(X1Y2, short for C1O2 and C2O1), on the other
hand, confirm this observation: they yield no significant
difference in either d 0 or c 0 [Experiment 1: Fd 0(1,3) =
2.36, p = 0.22; Fc 0(1,3) = 6.61, p = 0.08; Experiment 2:Fd 0(1,3) = 3.45, p = 0.16; Fc 0(1,3) = 0.00, p = 0.99]. That
a dual judgment is a necessary condition for criteria
attraction and a d 0 drop strongly points or is tanta-
mount to an attentional involvement.
4.3. Single vs. Dual task sensitivity for one and two
objects
The statistical analysis above has shown for both
experiments a significant d 0 drop in the D relative to
the S condition. Here we have a closer look at whether
or not this drop is stronger for the case where observers
attended to two (Experiment 2) rather than to one object
(Experiment 1). Fig. 5 displays Single/Dual d 0-ratios ob-
tained in the two-object case against those obtained in
the one object case for the three subjects having beenrun in both experiments. In line with previous studies
(e.g. Duncan, 1984; Han et al., 2003), the Single/Dual
sensitivity ratios for the two objects case are, in average,
1.32 times larger than for the one object case. This differ-
ence is statistically significant [t(46) = �2.34, p = 0.02].
5. Discussion
We have previously shown that criteria attraction and
particularly its extreme manifestation, the unique re-
sponse criterion is in quantitative agreement with pre-
dictions based on the notion that observers represent a
multi-stimulus environment as a unitary internal distri-
bution (uir) to which each stimulus contributes propor-
tionally to its probability of occurrence (Gorea and
Sagi, 2000). The present data demonstrate that criteriaattraction (but not necessarily a full-fledged unique cri-
terion) also occurs between distinct attributes of objects
(here contrast and orientation), hence extending the gen-
erality of the uir concept. Critically, the present data
show that criteria attraction occurs equally between
attributes belonging to a unique object as to two distinct
objects. Hence, the uir we had originally put forth to
account for criteria attraction in a multi-object environ-ment should be more appropriately referred to a multi-
decisional space whether or not this space matches a
multi-object environment. The statistical analysis
confirms our previous observation that criteria interfer-
ence does not result from the mere presence of two
different stimuli within an experimental session but
A. Gorea et al. / Vision Research 45 (2005) 2523–2532 2531
requires that decisions be taken on each of them (Gorea
and Sagi, 1999, 2000).
The present data also bear on the general issue of the
sensory interference (i.e. as assessed via d 0 measurements)
between visual attributes. Many studies having used sin-
gle-task conditions evidenced the separability and inde-pendent processing of spatial frequency and orientation
features at the detection threshold (for a recent review
see Shimozaki et al., 2002), but not at suprathreshold lev-
els as long as the two features are spatially overlapping or
contiguous (Olzak and Thomas, 1992; Thomas and
Olzak, 1990, 1996). Separability and independent senso-
ry processing of contrast and orientation have also been
demonstrated for suprathreshold stimuli (such as thoseused here; see Gorea and Papathomas, 1999). An ab-
sence of decisional interference for spatial frequency
and orientation in a dual categorization task was demon-
strated by Chua (1990). This author looked at decisional
biases for a given task when performed concurrently with
another task, that is, at the dependency of decision
boundaries on the magnitude of concurrent stimuli or,
equivalently, on their evoked internal responses. Our un-ique internal representation model is mute concerning
such a bias, but is certainly consistent with its absence,
as it refers to decision biases resulting from changes in
the statistical properties of the stimuli and not from the
momentary sensory event. Be it as it may, the present
data are the first to our knowledge to show that decision-
al interference (i.e. criteria attraction) occurs between
two sensory independent visual attributes and that thestrength of this interference is independent of these attri-
butes� belongingness to one or more objects. Taken
together with our previous results showing decisional
interference within the same attribute distributed over
two objects (Gorea and Sagi, 2000, 2002a,b, unpub-
lished, 2003), the present data bear with the notion that,
for the decisional system, an object is a volatile concept
determined by the nature of the task.The present results show that contrast and orienta-
tion processing yields practically identical noise sources
(see Fig. 3 and related discussion). Whether the equiva-
lence of the C and O (and, for that reason, of any other
attribute) related noises is likely or not is debatable. The
literature may surely be sampled so as to provide equal
support to the former (e.g. Wiener et al., 2001) as to the
latter (e.g. Asaad et al., 2000). The fact is that the issueof the processing noise variability across tasks and cor-
tical areas has not been addressed explicitly. Basing our
argument on the observation that, contrary to the
neurophysiologically assessed neural noise dependency
on the baseline response frequency (Itti et al., 2000),
the inferred noise characterizing a contrast discrimina-
tion task is independent of the baseline contrast, we
have previously argued in favor of a unique limitingnoise at the decision level (Gorea and Sagi, 2001). This
is pretty much tantamount to posing the existence of a
central executive system in charge with all (within
modality) decisions (see Pashler, 1998, Chapter 8). With-
in this context, the presently observed criteria attraction
between unrelated dimensions suggests that these attri-
butes can be represented at a unifying meta-attribute le-
vel, a reminiscence of Stevens� (1969) unifying metric forcross-modal matching experiments. It is interesting to
note that the existence of a unique internal noise limiting
detection at a central level would render the concept of
probability summation over distinct detectors inappro-
priate. Indeed, probability summation (Graham and
Nachmias, 1971; Watson, 1979) requires that the noises
associated with different stimulations be uncorrelated.
While the present data do not have a direct bearing onprobability summation within a single attribute (partic-
ularly on contrast summation over space and time at the
detection level), they do strengthen the doubts raised
about the merits of this concept by a number of recent
studies (Bonneh and Sagi, 1999; Tyler and Chen, 2000).
The present data also confirm some basic knowledge
on divided attention (as it pertains to dual-task experi-
ments; see a review in Pashler, 1998, Chapter 3). Theydemonstrate a significant sensitivity drop of about 20%
in the Dual vs. Single conditions and show that this drop
is more pronounced (by about 30%) when attention is
‘‘distributed’’ over two objects rather than one (see
Fig. 5). Other studies have reached similar conclusions
(Duncan, 1984; Han et al., 2003).
The criteria attraction presently observed for both
one and two objects conditions adds a new angle inthe way one may interpret the attentional process. Crite-
ria attraction has been successfully modeled as the con-
sequence of the merging of the internal response
distributions evoked by the distinct stimuli—the unitary
internal representation hypothesis (Gorea and Sagi,
2000). Such a merging testifies to observers discarding
information relevant to achieving an optimal decision
behavior. This is another way to say that observers� deci-sional behavior reflects an ineffective selective attention
process (Gorea and Sagi, 2005). The fact that criteria
attraction between two features occurs equally whether
they belong to the same object or not, together with pre-
vious findings showing the same attraction effect for the
same feature distributed over two objects (Gorea and
Sagi, 2000, 2001, 2002b) implies that, for the selective
attention operator, features and objects are equivalententities. Obviously, the relationship between the sensory
and decisional aspects of distributed/selective attention
remains a question for future research.
References
Adelson, E. H. (2000). Lightness perception and lightness illusions. In
M. Gazzaniga (Ed.), The new cognitive neurosciences (2nd ed.,
pp. 339–351). Cambridge, MA: MIT Press.
2532 A. Gorea et al. / Vision Research 45 (2005) 2523–2532
Asaad, W. F., Rainer, G., & Miller, E. K. (2000). Task-specific neural
activity in the primate prefrontal cortex. Journal of Neurophysiol-
ogy, 84, 451–459.
Bonneh, Y., & Sagi, D. (1999). Contrast integration across space.
Vision Research, 39, 2597–2602.
Boring, E. G. (1942). Sensation and perception in the history of
experimental psychology. New York: D. Appleton-Century Co.
Chua, F. K. (1990). The processing of spatial frequency and
orientation information. Perception & Psychophysics, 47, 79–
86.
Duncan, J. (1984). Selective attention and the organization of visual
information. Journal of Experimental Psychology: General, 113,
501–517.
Gilchrist, A., Kossyfidis, C., Bonato, F., Agostini, T., Cataliotti, J., Li,
X., et al. (1999). An anchoring theory of lightness perception.
Psychological Review, 106, 795–834.
Gorea, A., & Papathomas, T. V. (1999). Local vs. global contrasts in
texture segregation. Journal of the Optical Society of America A, 16,
728–741.
Gorea, A., & Sagi, D. (1999). Explorations into the psychophysics of
decision: Criteria attraction. Investigative Ophthalmology & Visual
Science, 40(Suppl.), S796.
Gorea, A., & Sagi, D. (2000). Failure to handle more than one internal
representation in visual detection tasks. Proceedings of the National
Academy of Science USA, 97, 12380–12384.
Gorea, A., & Sagi, D. (2001). Disentangling signal from noise in visual
contrast discrimination. Nature Neuroscience, 4, 146–1150.
Gorea, A., & Sagi, D. (2002a). The unique criterion constraint: A false
alarm? (response to Kontsevich et al.). Nature Neuroscience, 5,
707–708.
Gorea, A., & Sagi, D. (2002b). Natural extinction: A criterion shift
phenomenon. Visual Cognition, 9, 913–936.
Gorea, A., & Sagi, D. Testing the unique criterion constraint across
the audio-visual modalities, Perception, unpublished.
Gorea, A., & Sagi, D. (2003). Selective attention as the substrate of
optimal decision behavior in multistimulus environments. Percep-
tion, 32(Suppl.), 5.
Gorea, A., & Sagi, D. (2005). On attention and decision. In L. Itti, G.
Rees, & J. Tsotsos (Eds.), Neurobiology of attention. Academic
Press/Elsevier.
Graham, N., & Nachmias, J. (1971). Detection of grating patterns
containing two spatial frequencies: A comparison of single-channel
and multiple channel models. Vision Ressearch, 11, 251–259.
Green, D. M., & Swets, J. A. (1966). Signal detection theory. New
York: Wiley.
Han, S., Dosher, B. A., & Lu, Z.-L. (2003). Object attention revisited:
Identifying mechanisms and boundary conditions. Psychological
Science, 14, 598–604.
Helson, H. (1964). Adaptation-level theory. New York: Harper & Row.
Itti, L., Koch, C., & Braun, J. (2000). Revisiting spatial vision: toward
a unifying model. Journal of the Optical Society of America, A, 17,
1899–1917.
Koffka, K. (1935). Principles of Gestalt psychology. London: Routledge
& Keagan Paul Ltd (fourth print, 1955).
Luck, S., & Vogel, E. K. (1997). The capacity of visual working
memory for features and conjunctions. Nature, 390, 279–281.
Miller, G. A. (1956). The magical number seven plus or minus two:
Some limits on our capacity for processing information. Psycho-
logical Review, 62, 81–97.
Olzak, L. A., & Thomas, J. P. (1992). Configural effects constrain
Fourier models of pattern discrimination. Vision Research, 32,
1885–1898.
Pashler, H. E. (1998). The psychology of attention. Cambridge: MIT
Press.
Shimozaki, S. S., Eckstein, M. P., & Abbey, C. K. (2002). Stimulus
information contaminates summation tests of independent neural
representations of features. Journal of Vision, 2, 354–370.
Stevens, S. S. (1969). On predicting exponents for cross-modal
matches. Perception & Psychophysics, 6, 251–256.
Thomas, J. P., & Olzak, L. A. (1990). Cue summation in spatial
discrimination. Vision Research, 30, 1865–1875.
Thomas, J. P., & Olzak, L. A. (1996). Uncertainty experiments support
the roles of second-order mechanisms in spatial frequency and
orientation discriminations. Vision Research, 30, 689–696.
Tyler, C. W., & Chen, C.-C. (2000). Signal detection theory in the
2AFC paradigm: Attention, channel uncertainty and probability
summation. Vision Research, 40, 3121–3144.
Watson, A. B. (1979). Probability summation over time. Vision
Research, 19, 515–522.
Wiener, M. C., Oram, M. W., Liu, Z., & Richmond, B. J. (2001).
Consistency of encoding in monkey visual cortex. Journal of
Neuroscience, 2(1), 8210–8221.
Vogel, S., Woodman, G. F., & Luck, S. J. (2001). Storage of features,
conjunctions, and objects in visual working memory. Journal of
Experimental Psychology: Human Perception & Performance, 27,
92–114.


