Embed Size (px)
Citation preview
0
Crawford CountyConference Center Analysis
Hunden Strategic PartnersFinal Report
October 18, 2020

1
Table of Contents
v Executive Summary
v Chapter 1: Project Profile
v Chapter 2: Economic, Demographic & Tourism Analysis
v Chapter 3: Conference & Meetings Industry Trends
v Chapter 4: Conference & Meetings Market Analysis
v Chapter 5: Hotel Market Analysis
v Chapter 6: Site Analysis & Test Fits
v Chapter 7: Implications & Recommendations
v Chapter 8: Demand and Financial Projections
v Chapter 9: Economic, Fiscal, and Employment Impact
1
2
PandemicCaveat
Given the global public health crisis impacting the world’s economy,the data and analysis should be considered to be from, andapplicable to, the pre-COVID-19 pandemic timeframe that began inFebruary and March of 2020.
HSP suggests planning for an update to this study once the economyhas generally recovered for a measurable period.
2

Executive Summary
4
Key Questions
Hunden Strategic Partners (HSP), was engaged by the CrawfordCounty Convention & Visitors Bureau and the City of Pittsburg toidentify the market demand and financial feasibility of a newconference center development in Crawford County, Kansas.
HSP explored the following key questions:
§ What are the existing market conditions locally and regionally?
§ What is the market opportunity for meetings, conferences andconventions?
§ What best practices may be learned from comparable situations?
§ What is the best site for the proposed project?
§ How will the proposed project perform?
4

5HEADLINES
THE LOCAL MARKET THE PROJECT SITE THE INDUSTRY
Crawford County benefits greatlyfrom its location and access. Thecounty offers a University as well asseveral large employers.
Downtown attractions and otherregional draws such as the KansasCrossing Casino are beneficial formeeting planners and bode well for anew conference center project.
Crawford County is fortunate tohave multiple sites to assess for thispotential development. There aremany considerations that lead toselecting an optimal site. Awalkable environment with plenty ofrestaurants, hotel rooms, retail andentertainment options is of theutmost priority.
Of the four sites assessed for thisstudy, HSP recommends that theKansas Crossing site be givenpriority.
While the industry is ever-changing,the expectations for ease,convenience and affordability haveincreased, while the demand forauthenticity and large blocks ofgeneric/branded hotel rooms andattached high-quality flexible spaceshas also increased.
Often, a single event will use manydifferent types of spaces, includingexhibit halls, banquet facilities andbreakout meeting rooms increasingthe need for well-designed multi-purpose facilities and flexible breakout rooms.
The following slides summarize the key findings and headlines. In order to assess the viability of any project andmake informed recommendations, there are six key elements that must be considered.
5

6HEADLINES
THE DEMAND THE SUPPLY THE CASE STUDIES
There is a gap and need in CrawfordCounty for a small conference andevent center.
HSP recommends a small, flexiblefacility with 20,000 square feet offunction space and approximately28,000 square feet of support space.
In order to be competitive, the facilitymust have flexible breakout spaceand meeting rooms, state of the arttechnology, and a walkableenvironment with sufficient hotelrooms and restaurant options.
HSP does not recommend exhibitspace at this time.
The local supply lacks the type, sizeand flexibility of spaces that wouldallow it to accommodate mostconferences and event types. Theexisting Memorial Convention Centeris dated and small, with little flexibility.
Regionally, most competitive facilitieswithin a three-hour drive time rangefrom 40,000 to 110,000 SF of totalmeeting space.
Crawford County has an opportunityto create a successful, profitably-operated convention center, butemphasis must be placed oncreating a flexible space in awalkable environment with theproper amenities and sizing.
The information provided about HQhotels around the country yieldsvaluable lessons for the CrawfordCounty study, as the site locationwill largely be dependent onproximity to a suitable hotelpackage.
The following slides summarize the key findings and headlines. In order to assess the viability of any project andmake informed recommendations, there are six key elements that must be considered.
6
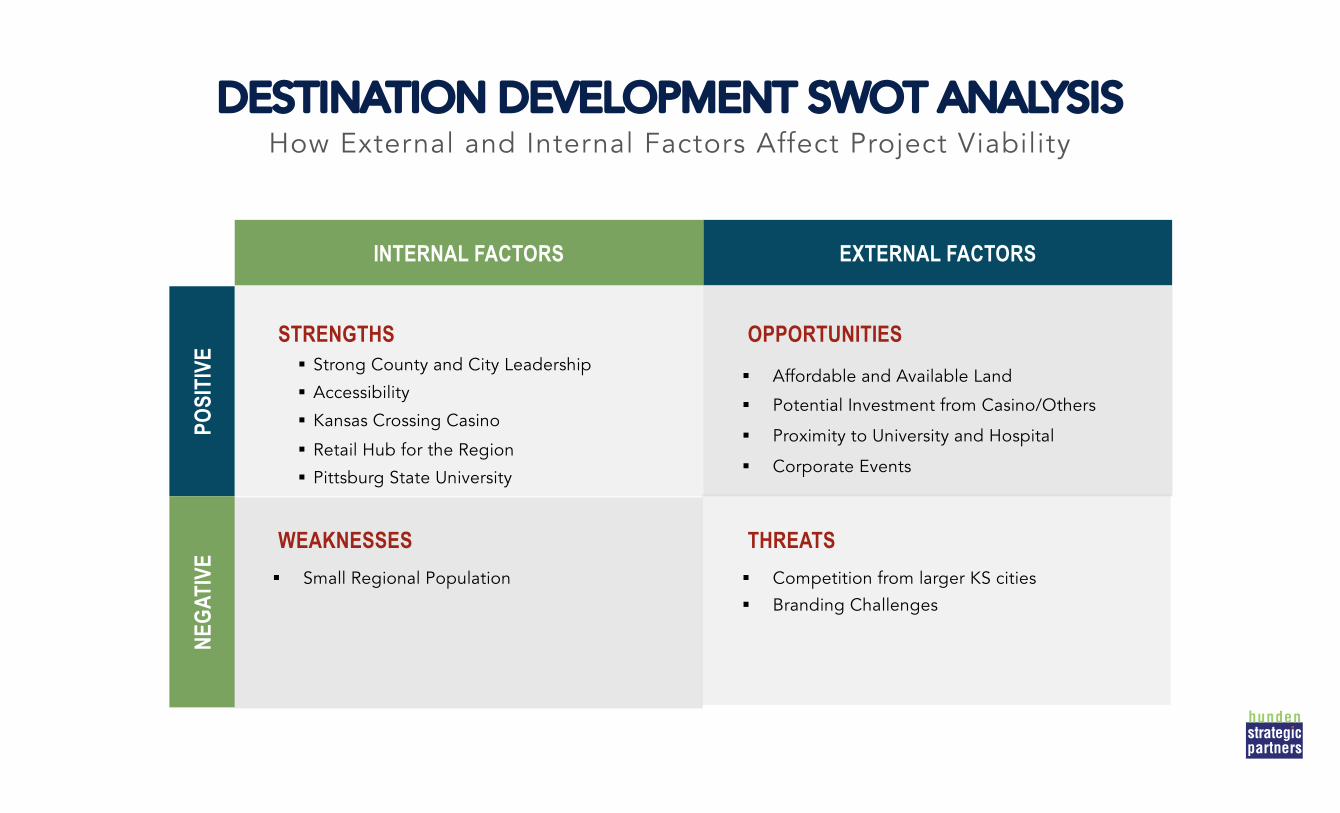
7DESTINATION DEVELOPMENT SWOT ANALYSIS
INTERNAL FACTORS EXTERNAL FACTORS
POSI
TIVE
NEGA
TIVE
§ Strong County and City Leadership
§ Accessibility
§ Kansas Crossing Casino
§ Retail Hub for the Region
§ Pittsburg State University
STRENGTHS
§ Small Regional Population
WEAKNESSES
§ Affordable and Available Land
§ Potential Investment from Casino/Others
§ Proximity to University and Hospital
§ Corporate Events
OPPORTUNITIES
§ Competition from larger KS cities
§ Branding Challenges
THREATS
How External and Internal Factors Affect Project Viability

8
Recommendations
HSP recommends that a new conference and event center bedeveloped with the following program specifications:
8
Proposed Program
CapacityArea Square Feet Divisions Square Feet Booths Theater Banquet
Grand Ballroom 15,000 6 2,500 75 1,364 1,000Meeting Rooms/Jr Ballroom 6,000 7 857 71 n/a
Total 21,000 13
Pre-Function/Back of House 27,820 Total Building SF 48,820
Source: HSP Conceptual Buildout Cost Model
HSP’s analysis found that of the four potential sites, the KansasCrossing site is the most compelling. As such, this site was used inthe recommended scenario and accompanying projections.

9
Conceptual Diagram
Convergence Design proposes the following space program:
9
10
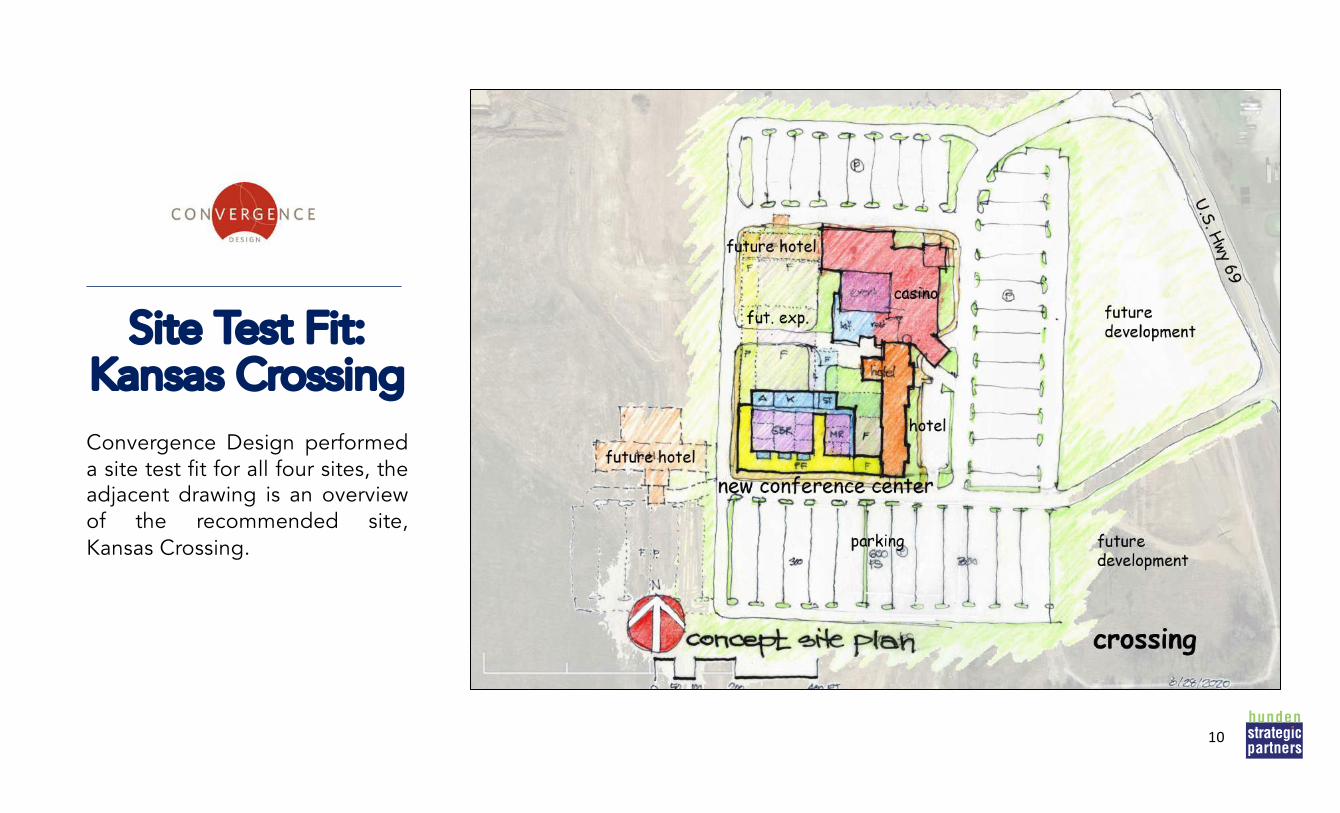
Site Test Fit: Kansas CrossingConvergence Design performeda site test fit for all four sites, theadjacent drawing is an overviewof the recommended site,Kansas Crossing.
10

11
Cost Estimate: Kansas CrossingConvergence Design preparedan order of magnitude costestimate for the recommendeddevelopment at the KansasCrossing site. The Project isexpected to cost approximately$24 million.
11
Construction CostsNew Building 48,820 SF @ $350 /SF = $17,087,000Link to Hotel 1500 SF @ $400 /SF = $600,000New Parking 600 PS @ $2,200 /PS = $1,320,000General Sitework 1 LS @ $250,000 ea. = $250,000Subtotal Construction $19,300,000
Project CostsDesign, Testing, etc. 9% of $19,300,000 = $1,737,000Furnishings, Fixtures, Equipment 7% of $19,300,000 = $1,351,000Design/Construction Contingency 10% of $19,300,000 = $1,930,000Subtotal Project Soft Costs $5,100,000
Project SummaryConstruction Total $19,300,000Project Costs $5,100,000Total Project Cost $24,400,000
Project Pro Forma
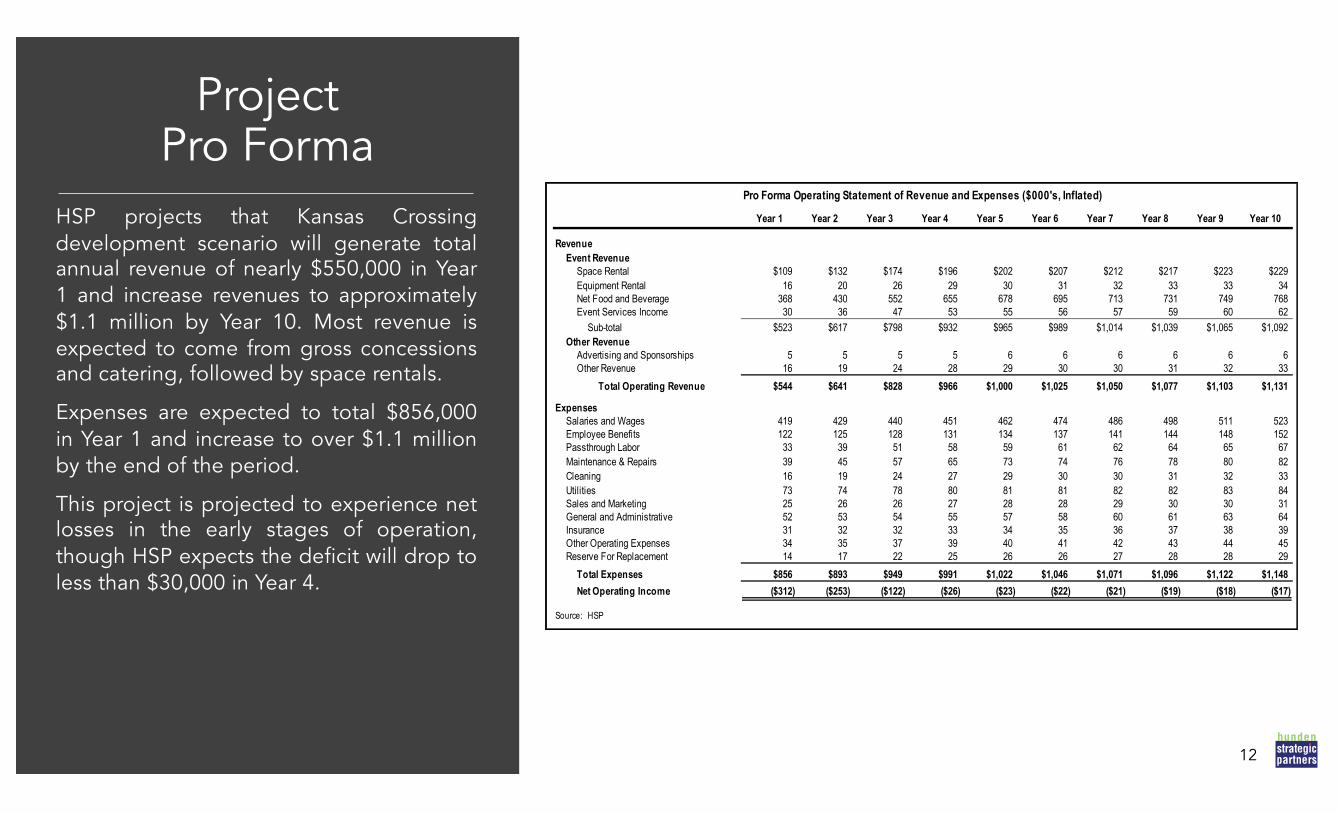
HSP projects that Kansas Crossingdevelopment scenario will generate totalannual revenue of nearly $550,000 in Year1 and increase revenues to approximately$1.1 million by Year 10. Most revenue isexpected to come from gross concessionsand catering, followed by space rentals.
Expenses are expected to total $856,000in Year 1 and increase to over $1.1 millionby the end of the period.
This project is projected to experience netlosses in the early stages of operation,though HSP expects the deficit will drop toless than $30,000 in Year 4.
12
Pro Forma Operating Statement of Revenue and Expenses ($000's, Inflated)
Year 1 Year 2 Year 3 Year 4 Year 5 Year 6 Year 7 Year 8 Year 9 Year 10
RevenueEvent Revenue
Space Rental $109 $132 $174 $196 $202 $207 $212 $217 $223 $229Equipment Rental 16 20 26 29 30 31 32 33 33 34Net Food and Beverage 368 430 552 655 678 695 713 731 749 768Event Services Income 30 36 47 53 55 56 57 59 60 62
Sub-total $523 $617 $798 $932 $965 $989 $1,014 $1,039 $1,065 $1,092Other Revenue
Advertising and Sponsorships 5 5 5 5 6 6 6 6 6 6Other Revenue 16 19 24 28 29 30 30 31 32 33
Total Operating Revenue $544 $641 $828 $966 $1,000 $1,025 $1,050 $1,077 $1,103 $1,131
Expenses Salaries and Wages 419 429 440 451 462 474 486 498 511 523Employee Benefits 122 125 128 131 134 137 141 144 148 152Passthrough Labor 33 39 51 58 59 61 62 64 65 67Maintenance & Repairs 39 45 57 65 73 74 76 78 80 82Cleaning 16 19 24 27 29 30 30 31 32 33Utilities 73 74 78 80 81 81 82 82 83 84Sales and Marketing 25 26 26 27 28 28 29 30 30 31General and Administrative 52 53 54 55 57 58 60 61 63 64Insurance 31 32 32 33 34 35 36 37 38 39Other Operating Expenses 34 35 37 39 40 41 42 43 44 45Reserve For Replacement 14 17 22 25 26 26 27 28 28 29
Total Expenses $856 $893 $949 $991 $1,022 $1,046 $1,071 $1,096 $1,122 $1,148Net Operating Income ($312) ($253) ($122) ($26) ($23) ($22) ($21) ($19) ($18) ($17)
Source: HSP

Summary of20-Year Impacts
The Project, in the Kansas Crossing Scenario,is expected to generate $82 million in netnew spending, nearly $26 million in net newearnings and 40 new full-time equivalent jobsat stabilization.
Capturable fiscal impact accruing to CrawfordCounty and the City of Pittsburg is expectedto total approximately $2.5 million from sales,hotel, food & beverage and real estate taxes.
13
Summary of 20-Year Estimated Impacts
Net New Spending (millions)Direct $47Indirect $16Induced $19Total $82
Net New Earnings (millions)From Direct $15From Indirect $5From Induced $6Total $26
Net New FTE Jobs ActualFrom Direct 23From Indirect 8From Induced 9Total 40
Taxes Collected (millions)County Hotel Tax (6%) $1.1Local Portion of Sales Tax (2.5%)
Portion to County (1%) $0.6Portion to City (1.5%) $0.8
Total $2.5 Construction Impact (millions)
New Materials Spending $16.8New Labor Spending $14.6
Job-Years, Actual 270
Source: Hunden Strategic Partners

Chapter 1:Project Profile
15
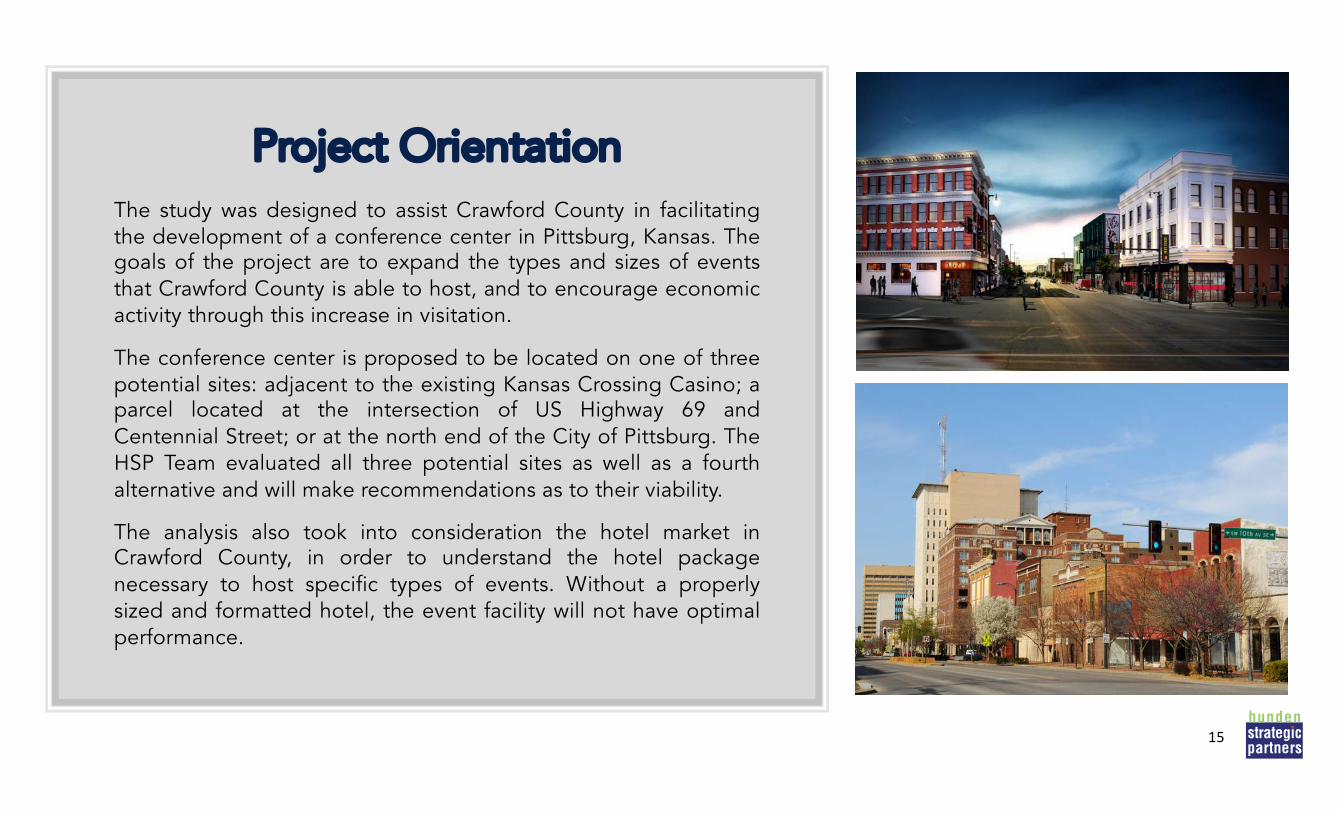
Project OrientationThe study was designed to assist Crawford County in facilitatingthe development of a conference center in Pittsburg, Kansas. Thegoals of the project are to expand the types and sizes of eventsthat Crawford County is able to host, and to encourage economicactivity through this increase in visitation.
The conference center is proposed to be located on one of threepotential sites: adjacent to the existing Kansas Crossing Casino; aparcel located at the intersection of US Highway 69 andCentennial Street; or at the north end of the City of Pittsburg. TheHSP Team evaluated all three potential sites as well as a fourthalternative and will make recommendations as to their viability.
The analysis also took into consideration the hotel market inCrawford County, in order to understand the hotel packagenecessary to host specific types of events. Without a properlysized and formatted hotel, the event facility will not have optimalperformance.
15

16
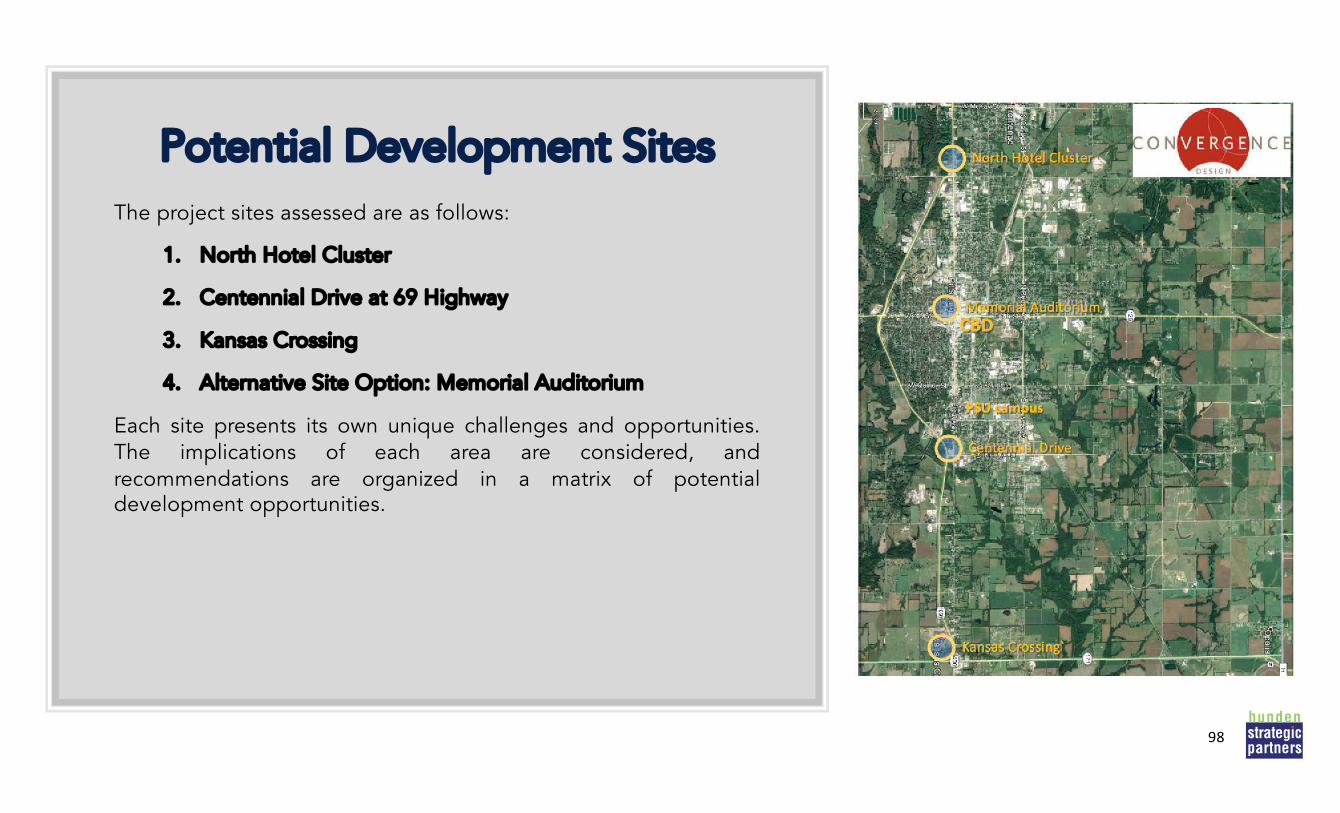
Potential Development SitesThe project sites assessed are as follows:
1. North Hotel Cluster
2. Centennial Drive at 69 Highway
3. Kansas Crossing
4. Alternative Site Option: Memorial Auditorium
Each site presents its own unique challenges and opportunities.The implications of each area were considered, andrecommendations organized in a matrix of potential developmentopportunities.
16

17POTENTIAL DEVELOPMENT SITES
NORTH HOTEL CLUSTERThe North Hotel Cluster site, as its name suggests, wasselected for its proximity to a number of lodgingoptions, including the Comfort Inn, Holiday Inn Expressand others.
CENTENNIAL DRIVEThe Centennial Drive site is located near the PittsburgState University campus, as well as near a restaurant andretail core.
18POTENTIAL DEVELOPMENT SITES
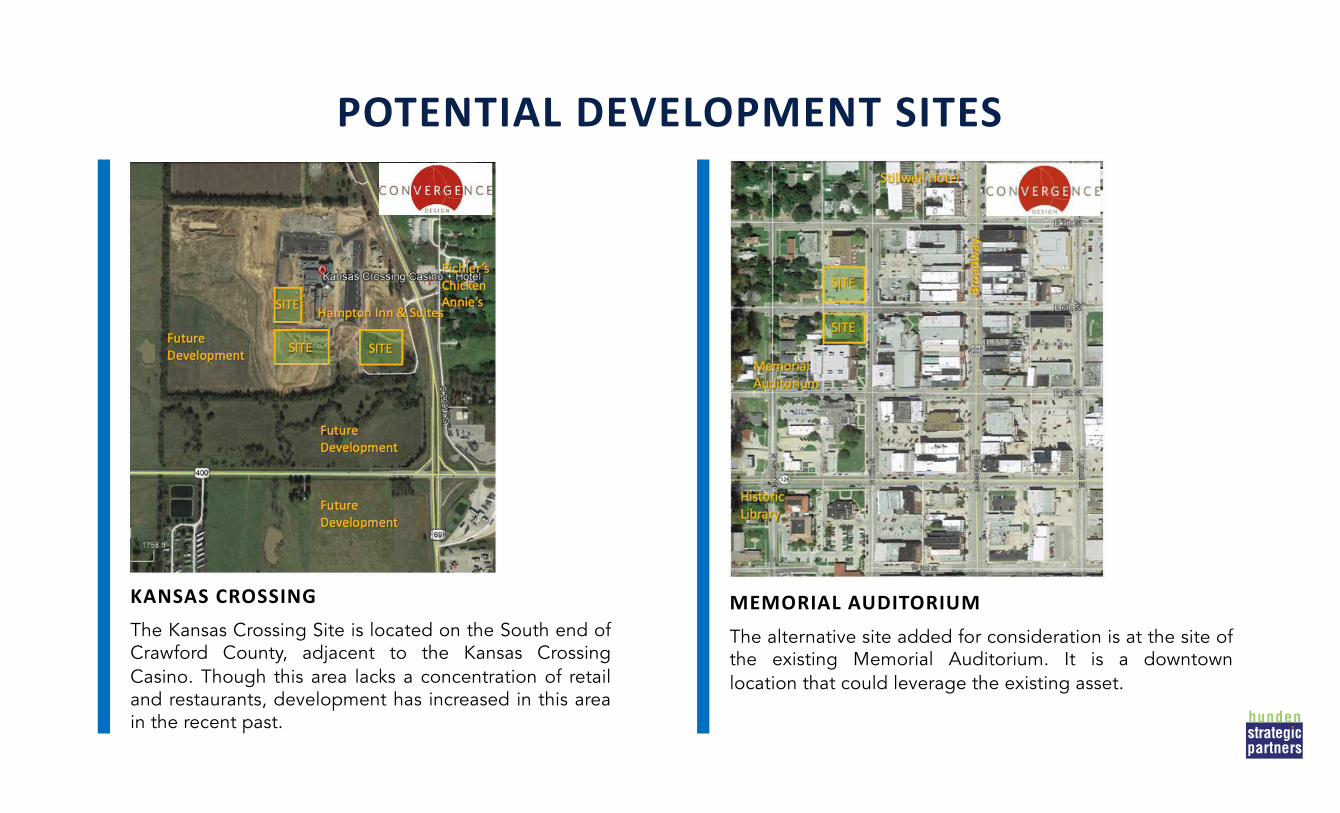
KANSAS CROSSINGThe Kansas Crossing Site is located on the South end ofCrawford County, adjacent to the Kansas CrossingCasino. Though this area lacks a concentration of retailand restaurants, development has increased in this areain the recent past.
MEMORIAL AUDITORIUMThe alternative site added for consideration is at the site ofthe existing Memorial Auditorium. It is a downtownlocation that could leverage the existing asset.
Stakeholder FeedbackAs part of the project kickoff, the HSP Team engaged with several key stakeholders and industry professionals in theCrawford County area. Highlights of this feedback is summarized in the following slides.
§ Lack of Function Space. In general, the County struggles with a supply of contiguous function space for businessmeetings and conferences. The current local supply is focused on weddings and private events, with several barnvenues and other alternative spaces. The PSU Ballroom and the Memorial Convention Center are the largestavailable appropriate spaces, though they struggle to accommodate larger regional events.
§ Sizing. In order to compete for annual events either regionally or statewide, the new center would need to becapable of accommodating 500 to 1,000 attendees.
§ Corporate Presence. Though Crawford County has several large employers in the area, most of these companieshave their own on-site space for meetings and regular events. In addition, corporate events have dwindled over theyears due to executives traveling less and companies utilizing virtual platforms like Zoom.
§ On-Site Amenities. The most important amenities for event planners are parking and a walkable environment withadequate hotel rooms, dining and retail.
§ Flexible Space is Key. Meeting planners and industry stakeholders prefer a flexible facility, capable of multipleconfigurations and breakout rooms.
§ Attracting Professional Functions. The Client and the key stakeholders have prioritized professional functions, as theCounty already has a sufficient supply of entertainment and sports facilities. A business conference center that canattract professional associations is the goal. 19
Chapter 2: Economic, Demographic &
Tourism Analysis
20
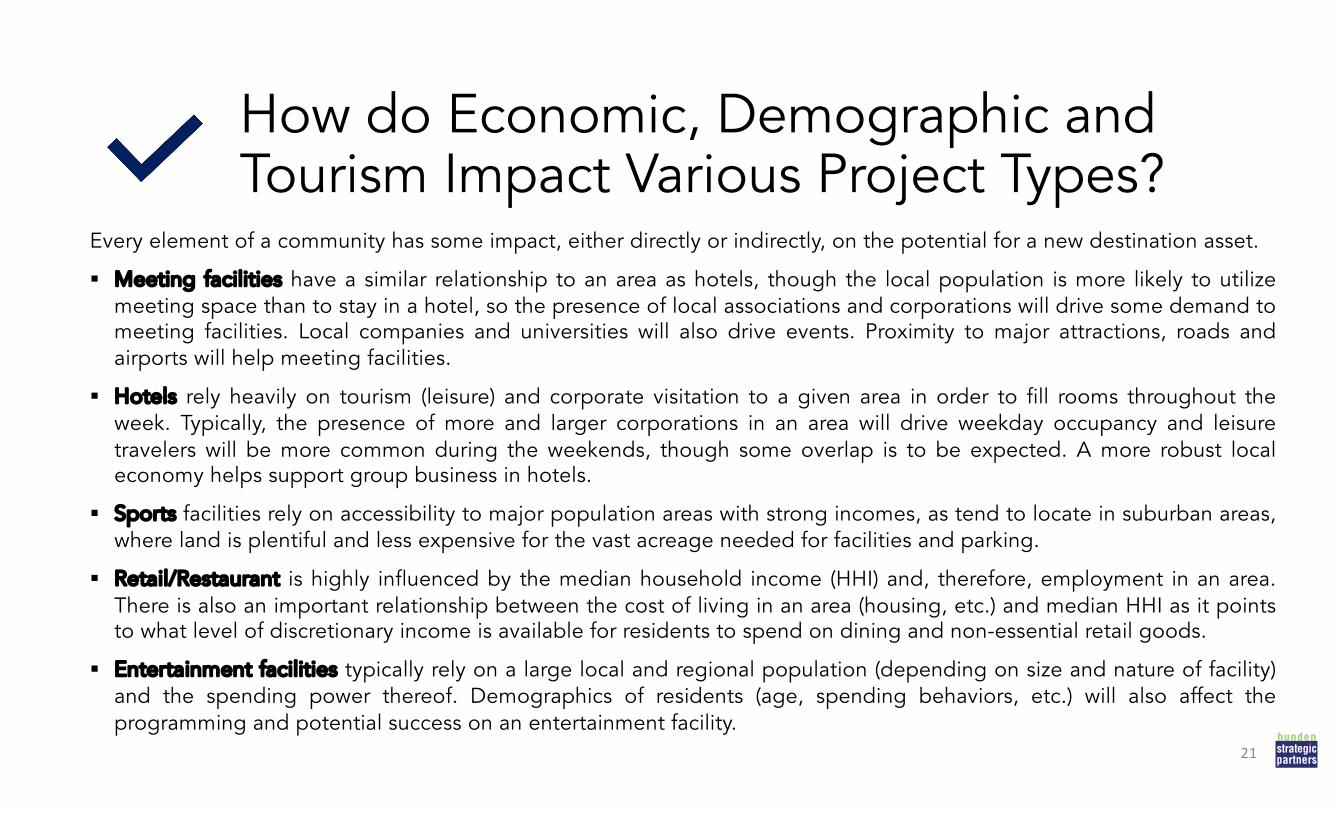
How do Economic, Demographic and Tourism Impact Various Project Types?
Every element of a community has some impact, either directly or indirectly, on the potential for a new destination asset.
§ Meeting facilities have a similar relationship to an area as hotels, though the local population is more likely to utilizemeeting space than to stay in a hotel, so the presence of local associations and corporations will drive some demand tomeeting facilities. Local companies and universities will also drive events. Proximity to major attractions, roads andairports will help meeting facilities.
§ Hotels rely heavily on tourism (leisure) and corporate visitation to a given area in order to fill rooms throughout theweek. Typically, the presence of more and larger corporations in an area will drive weekday occupancy and leisuretravelers will be more common during the weekends, though some overlap is to be expected. A more robust localeconomy helps support group business in hotels.
§ Sports facilities rely on accessibility to major population areas with strong incomes, as tend to locate in suburban areas,where land is plentiful and less expensive for the vast acreage needed for facilities and parking.
§ Retail/Restaurant is highly influenced by the median household income (HHI) and, therefore, employment in an area.There is also an important relationship between the cost of living in an area (housing, etc.) and median HHI as it pointsto what level of discretionary income is available for residents to spend on dining and non-essential retail goods.
§ Entertainment facilities typically rely on a large local and regional population (depending on size and nature of facility)and the spending power thereof. Demographics of residents (age, spending behaviors, etc.) will also affect theprogramming and potential success on an entertainment facility.
21

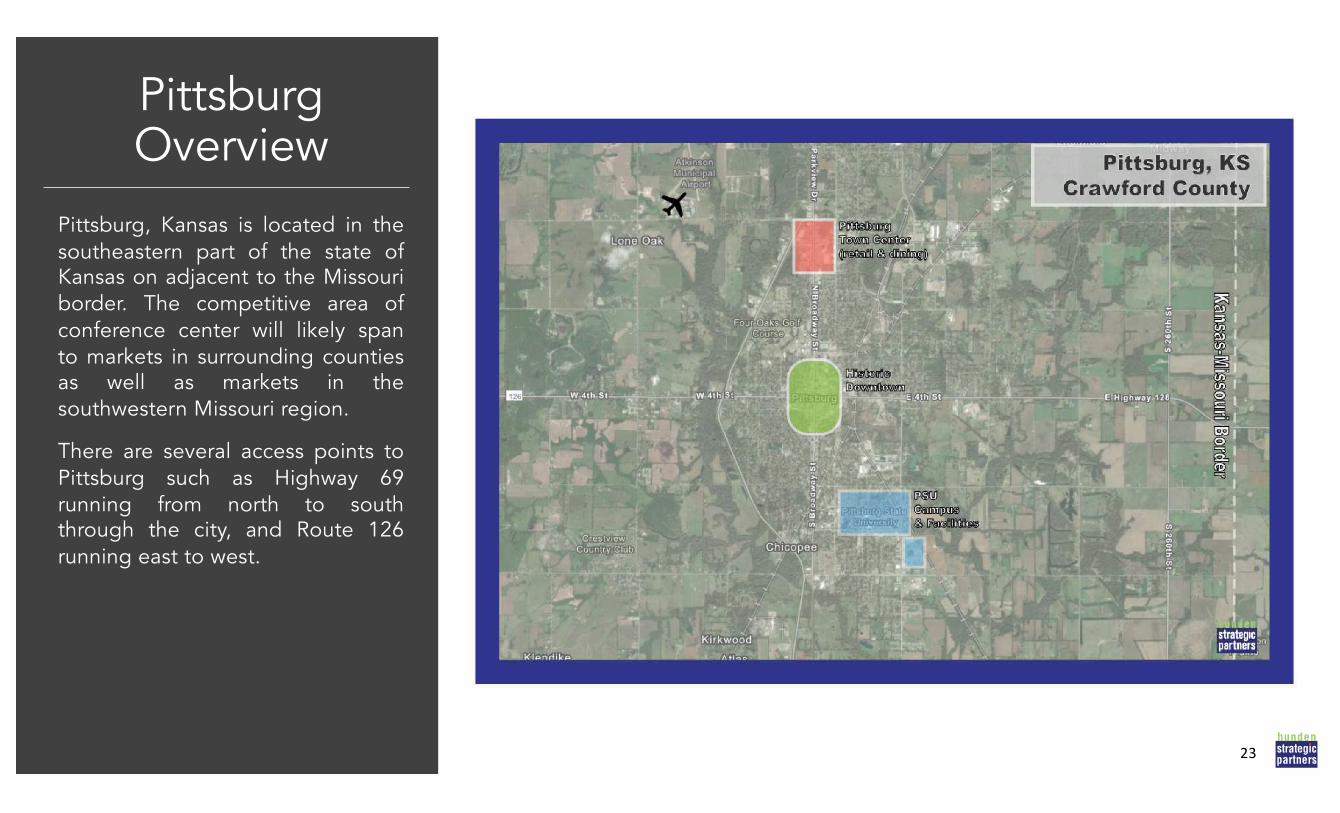
Pittsburg OverviewPittsburg is located in Crawford County in southeastern Kansasand is home to 20,302 people as of 2020. Pittsburg lies close tothe Missouri border and is located approximately 2 hours southof Kansas City and approximately 40 minutes from Joplin,Missouri.
Although small, Pittsburg is home to many of the amenities andattractions found in larger cities across the country and offers alow cost of living. Pittsburg is the home to Pittsburg StateUniversity, with a total enrollment of 6,645.
22
PittsburgOverview
23
Pittsburg, Kansas is located in thesoutheastern part of the state ofKansas on adjacent to the Missouriborder. The competitive area ofconference center will likely spanto markets in surrounding countiesas well as markets in thesouthwestern Missouri region.
There are several access points toPittsburg such as Highway 69running from north to souththrough the city, and Route 126running east to west.
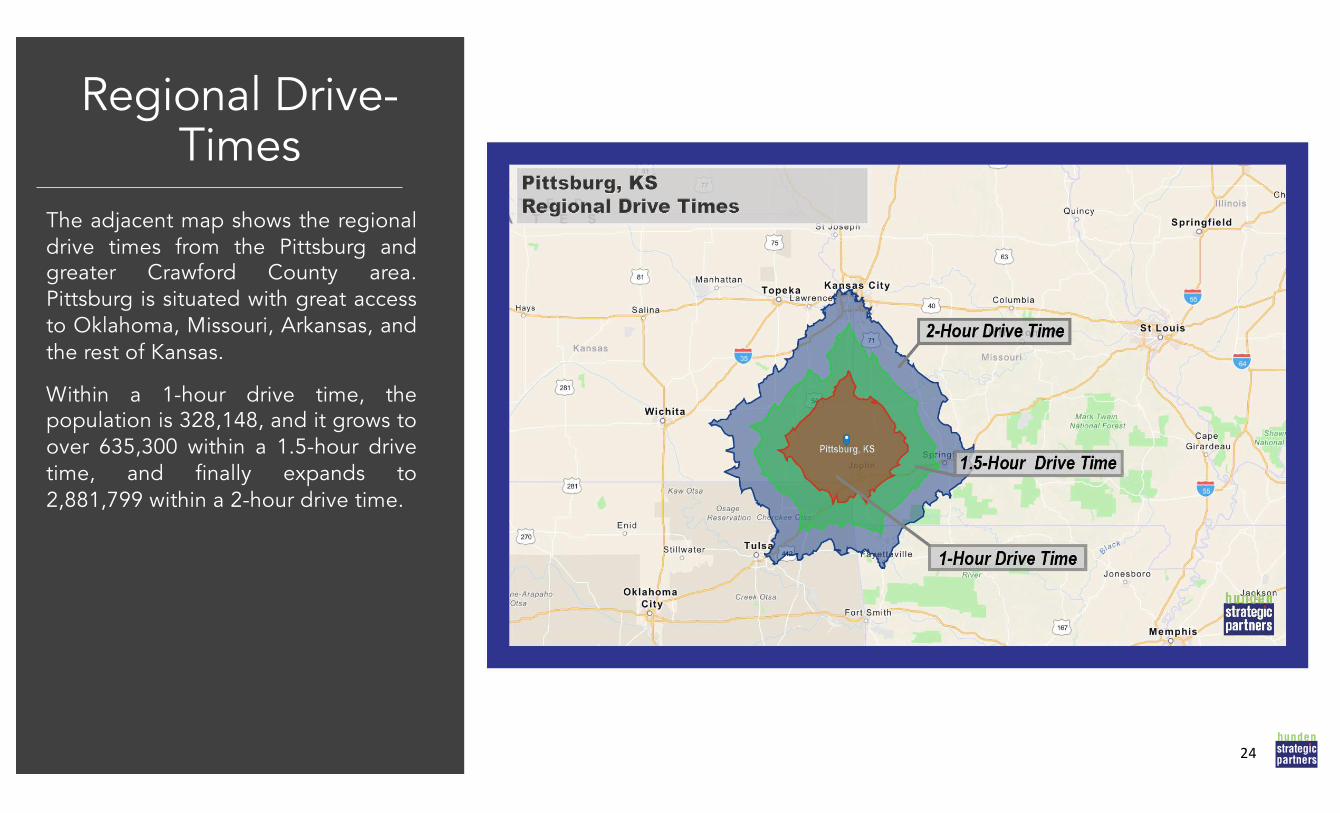
Regional Drive-Times
24
The adjacent map shows the regionaldrive times from the Pittsburg andgreater Crawford County area.Pittsburg is situated with great accessto Oklahoma, Missouri, Arkansas, andthe rest of Kansas.
Within a 1-hour drive time, thepopulation is 328,148, and it grows toover 635,300 within a 1.5-hour drivetime, and finally expands to2,881,799 within a 2-hour drive time.
Demographic Analysis
25
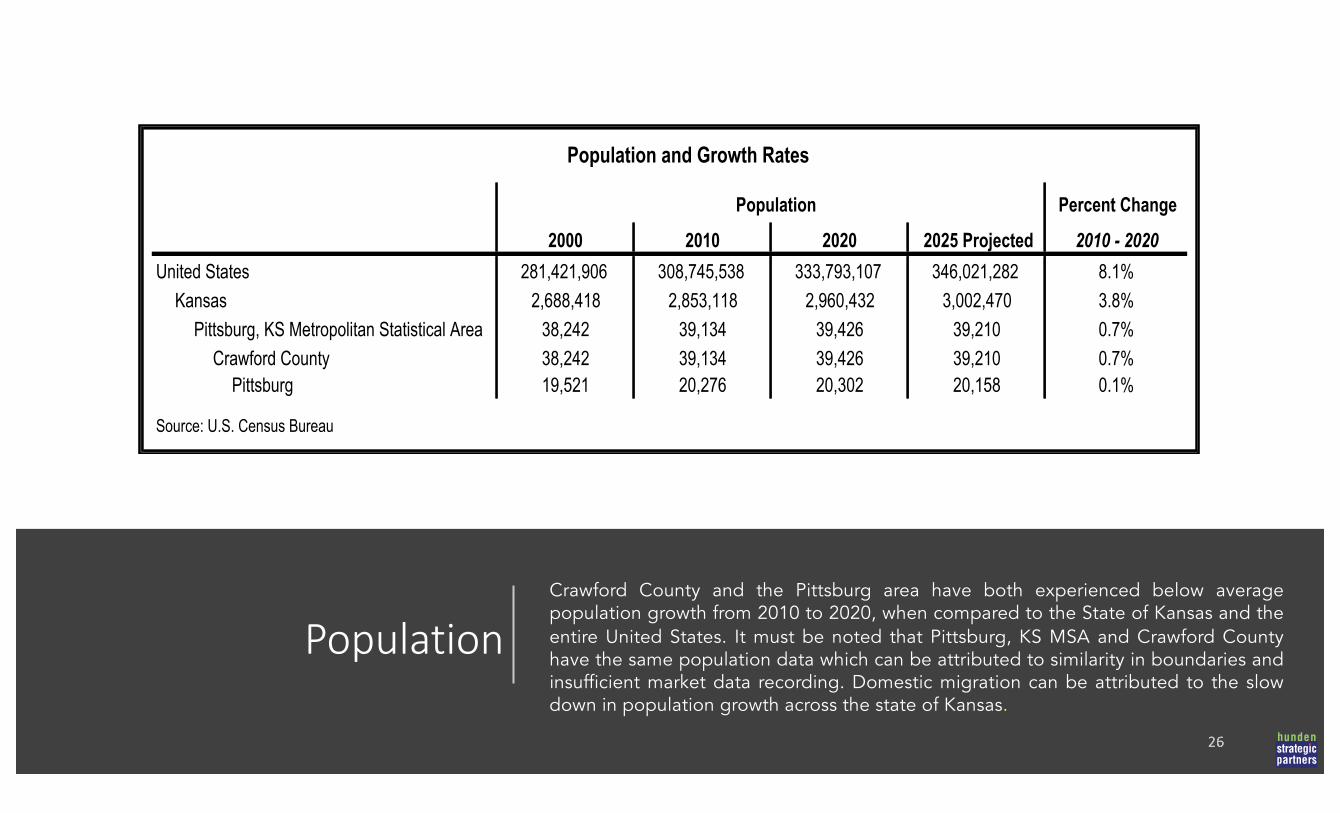
PopulationCrawford County and the Pittsburg area have both experienced below averagepopulation growth from 2010 to 2020, when compared to the State of Kansas and theentire United States. It must be noted that Pittsburg, KS MSA and Crawford Countyhave the same population data which can be attributed to similarity in boundaries andinsufficient market data recording. Domestic migration can be attributed to the slowdown in population growth across the state of Kansas.
Population Percent Change
2000 2010 2020 2025 Projected 2010 - 2020
United States 281,421,906 308,745,538 333,793,107 346,021,282 8.1%Kansas 2,688,418 2,853,118 2,960,432 3,002,470 3.8%
Pittsburg, KS Metropolitan Statistical Area 38,242 39,134 39,426 39,210 0.7%Crawford County 38,242 39,134 39,426 39,210 0.7%
Pittsburg 19,521 20,276 20,302 20,158 0.1%
Source: U.S. Census Bureau
Population and Growth Rates
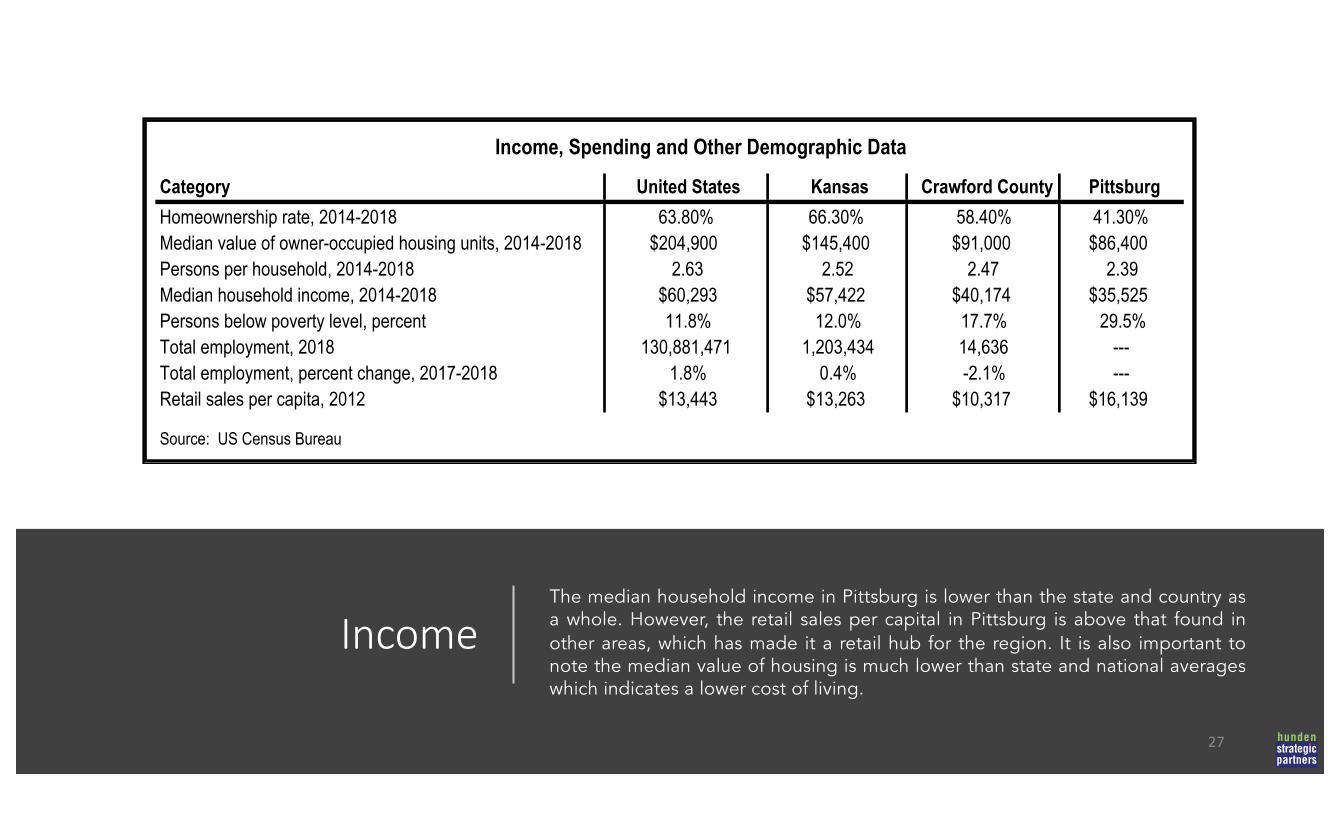
IncomeThe median household income in Pittsburg is lower than the state and country asa whole. However, the retail sales per capital in Pittsburg is above that found inother areas, which has made it a retail hub for the region. It is also important tonote the median value of housing is much lower than state and national averageswhich indicates a lower cost of living.
27
Income, Spending and Other Demographic Data
Category United States Kansas Crawford County PittsburgHomeownership rate, 2014-2018 63.80% 66.30% 58.40% 41.30%Median value of owner-occupied housing units, 2014-2018 $204,900 $145,400 $91,000 $86,400Persons per household, 2014-2018 2.63 2.52 2.47 2.39Median household income, 2014-2018 $60,293 $57,422 $40,174 $35,525Persons below poverty level, percent 11.8% 12.0% 17.7% 29.5%Total employment, 2018 130,881,471 1,203,434 14,636 ---Total employment, percent change, 2017-2018 1.8% 0.4% -2.1% ---Retail sales per capita, 2012 $13,443 $13,263 $10,317 $16,139
Source: US Census Bureau
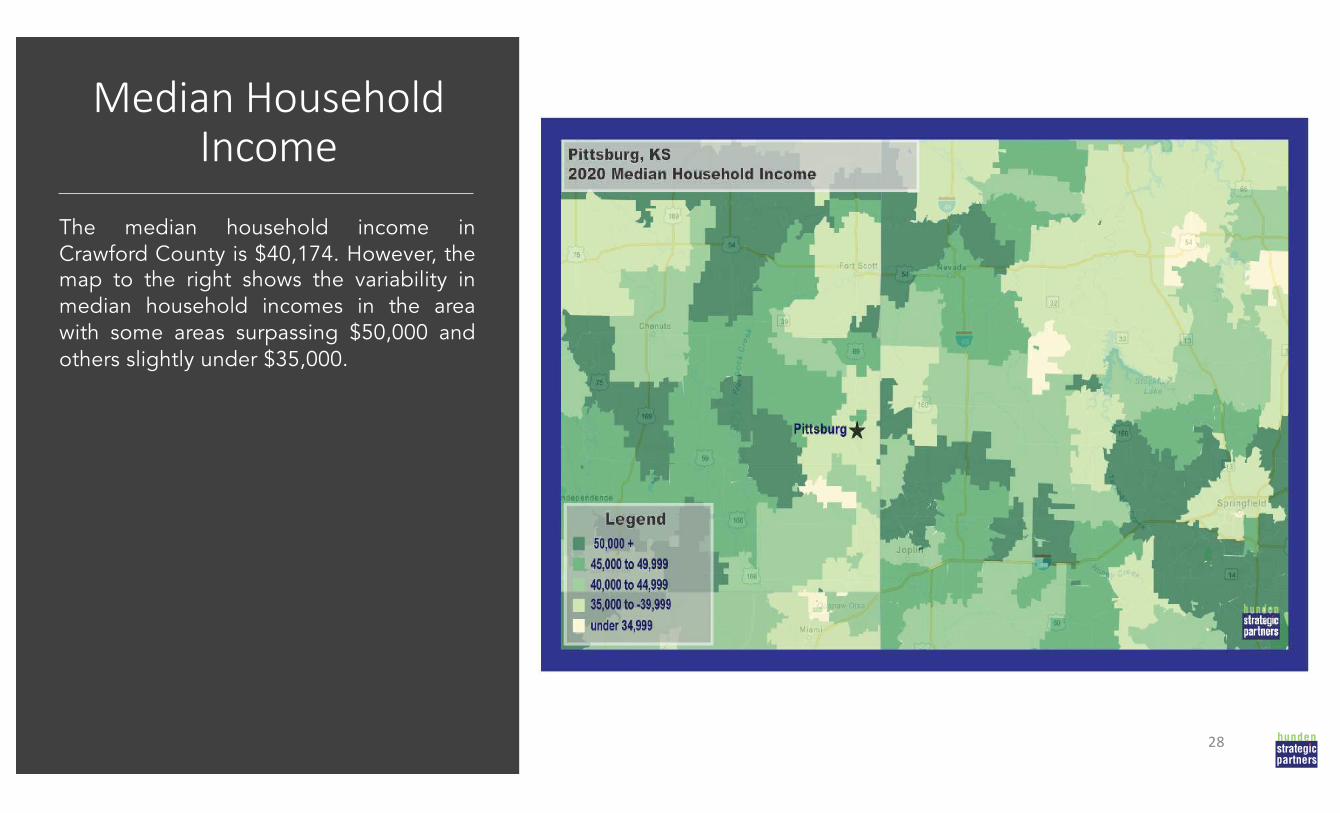
Median Household Income
The median household income inCrawford County is $40,174. However, themap to the right shows the variability inmedian household incomes in the areawith some areas surpassing $50,000 andothers slightly under $35,000.
28
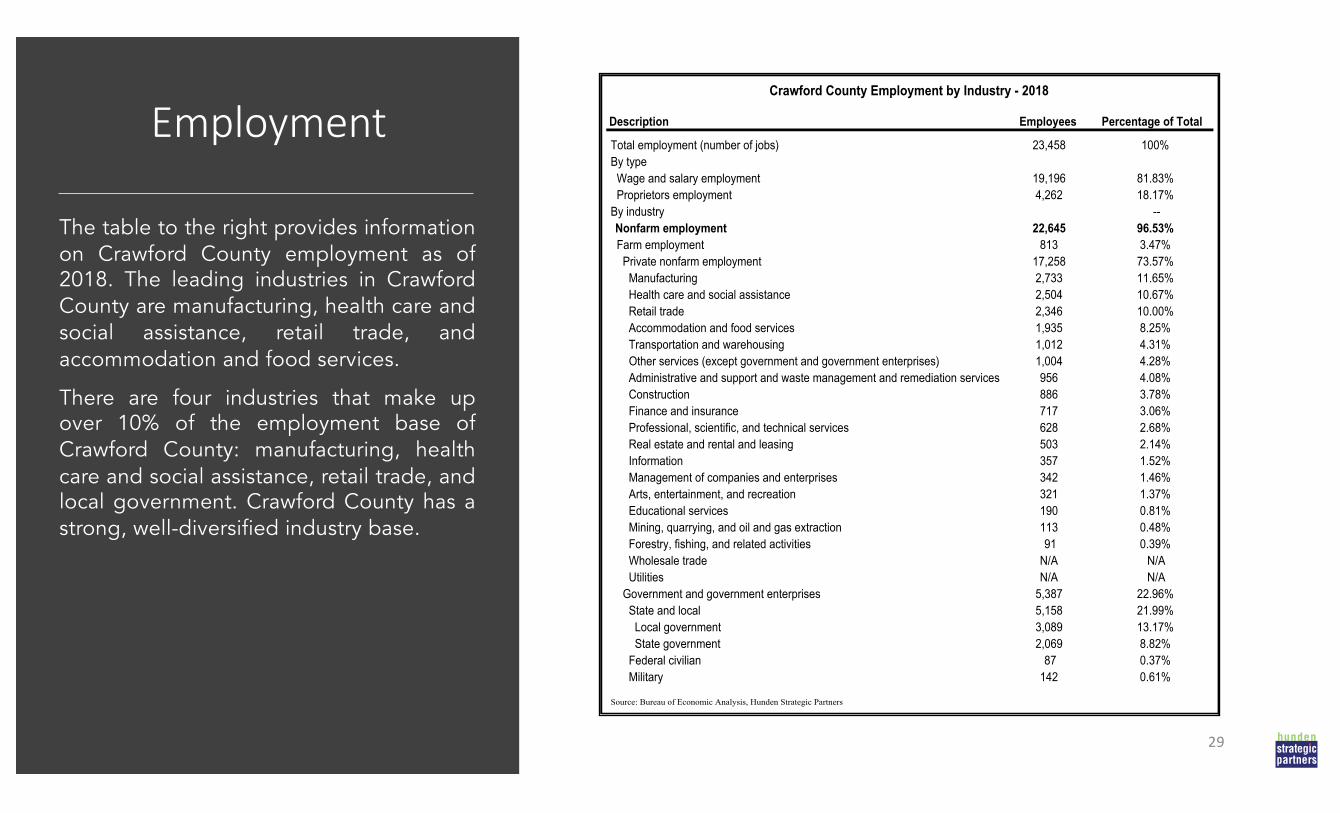
Employment
The table to the right provides informationon Crawford County employment as of2018. The leading industries in CrawfordCounty are manufacturing, health care andsocial assistance, retail trade, andaccommodation and food services.
There are four industries that make upover 10% of the employment base ofCrawford County: manufacturing, healthcare and social assistance, retail trade, andlocal government. Crawford County has astrong, well-diversified industry base.
29
Crawford County Employment by Industry - 2018
Description Employees Percentage of Total
Total employment (number of jobs) 23,458 100%By type Wage and salary employment 19,196 81.83% Proprietors employment 4,262 18.17%By industry -- Nonfarm employment 22,645 96.53% Farm employment 813 3.47% Private nonfarm employment 17,258 73.57% Manufacturing 2,733 11.65% Health care and social assistance 2,504 10.67% Retail trade 2,346 10.00% Accommodation and food services 1,935 8.25% Transportation and warehousing 1,012 4.31% Other services (except government and government enterprises) 1,004 4.28% Administrative and support and waste management and remediation services 956 4.08% Construction 886 3.78% Finance and insurance 717 3.06% Professional, scientific, and technical services 628 2.68% Real estate and rental and leasing 503 2.14% Information 357 1.52% Management of companies and enterprises 342 1.46% Arts, entertainment, and recreation 321 1.37% Educational services 190 0.81% Mining, quarrying, and oil and gas extraction 113 0.48% Forestry, fishing, and related activities 91 0.39% Wholesale trade N/A N/A Utilities N/A N/A Government and government enterprises 5,387 22.96% State and local 5,158 21.99% Local government 3,089 13.17% State government 2,069 8.82% Federal civilian 87 0.37% Military 142 0.61%
Source: Bureau of Economic Analysis, Hunden Strategic Partners
Major Employers
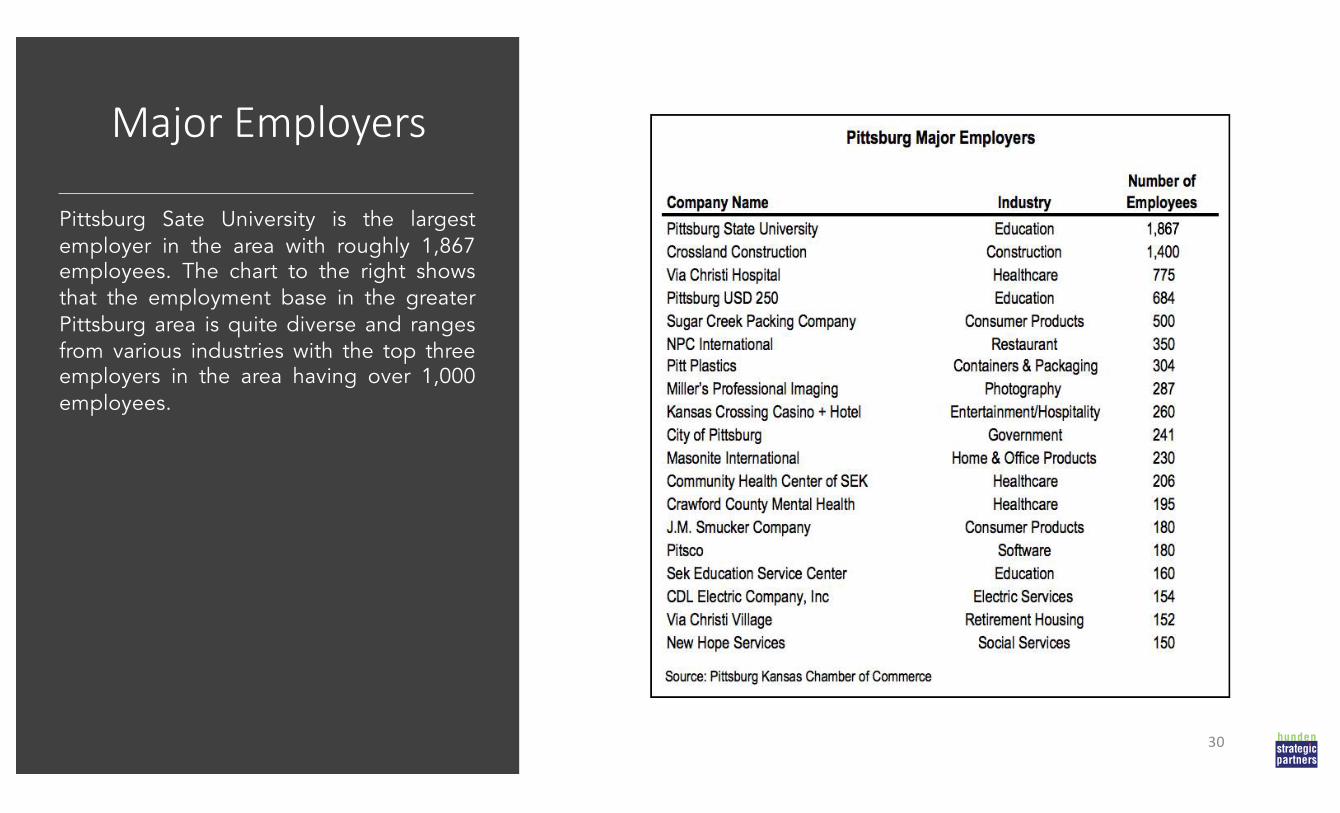
Pittsburg Sate University is the largestemployer in the area with roughly 1,867employees. The chart to the right showsthat the employment base in the greaterPittsburg area is quite diverse and rangesfrom various industries with the top threeemployers in the area having over 1,000employees.
30
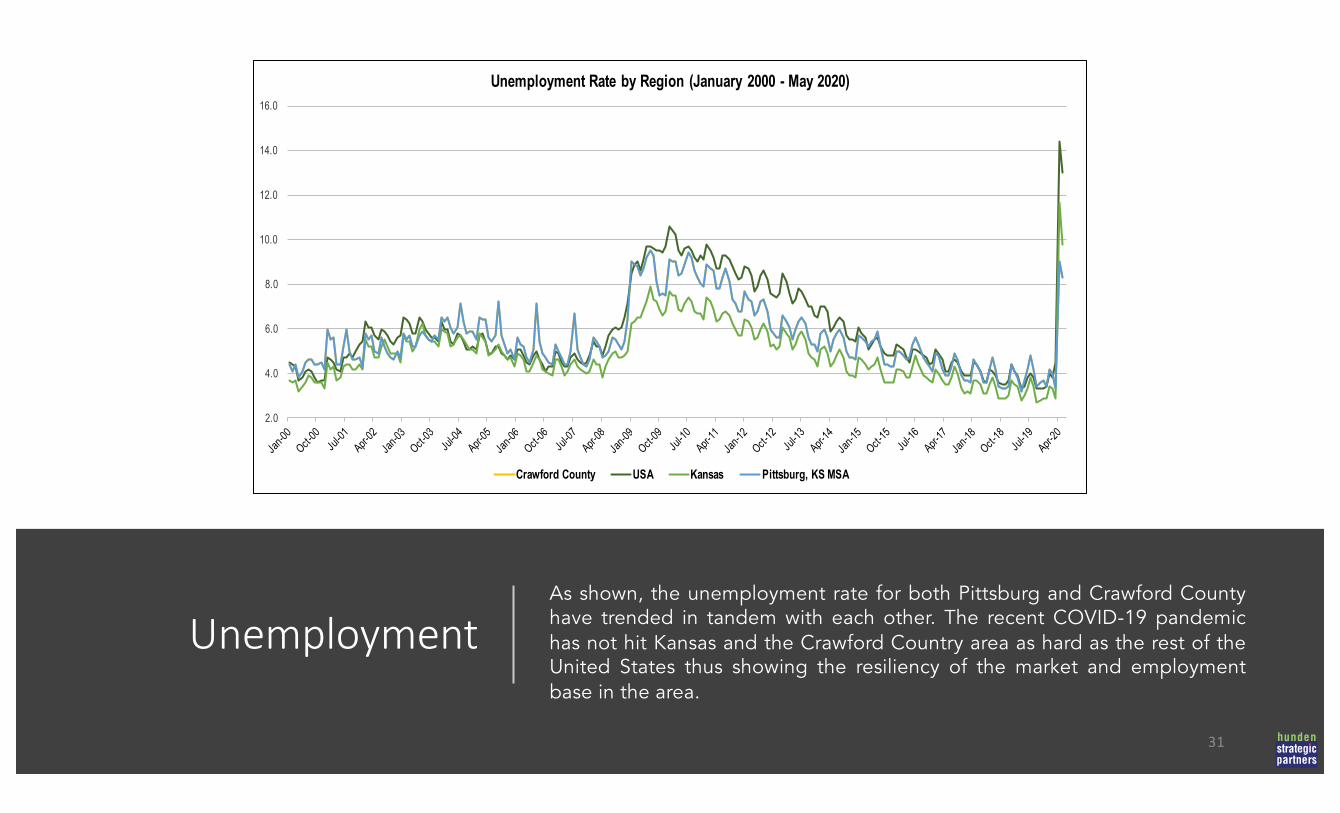
UnemploymentAs shown, the unemployment rate for both Pittsburg and Crawford Countyhave trended in tandem with each other. The recent COVID-19 pandemichas not hit Kansas and the Crawford Country area as hard as the rest of theUnited States thus showing the resiliency of the market and employmentbase in the area.
31
2.0
4.0
6.0
8.0
10.0
12.0
14.0
16.0
Unemployment Rate by Region (January 2000 - May 2020)
Crawford County USA Kansas Pittsburg, KS MSA
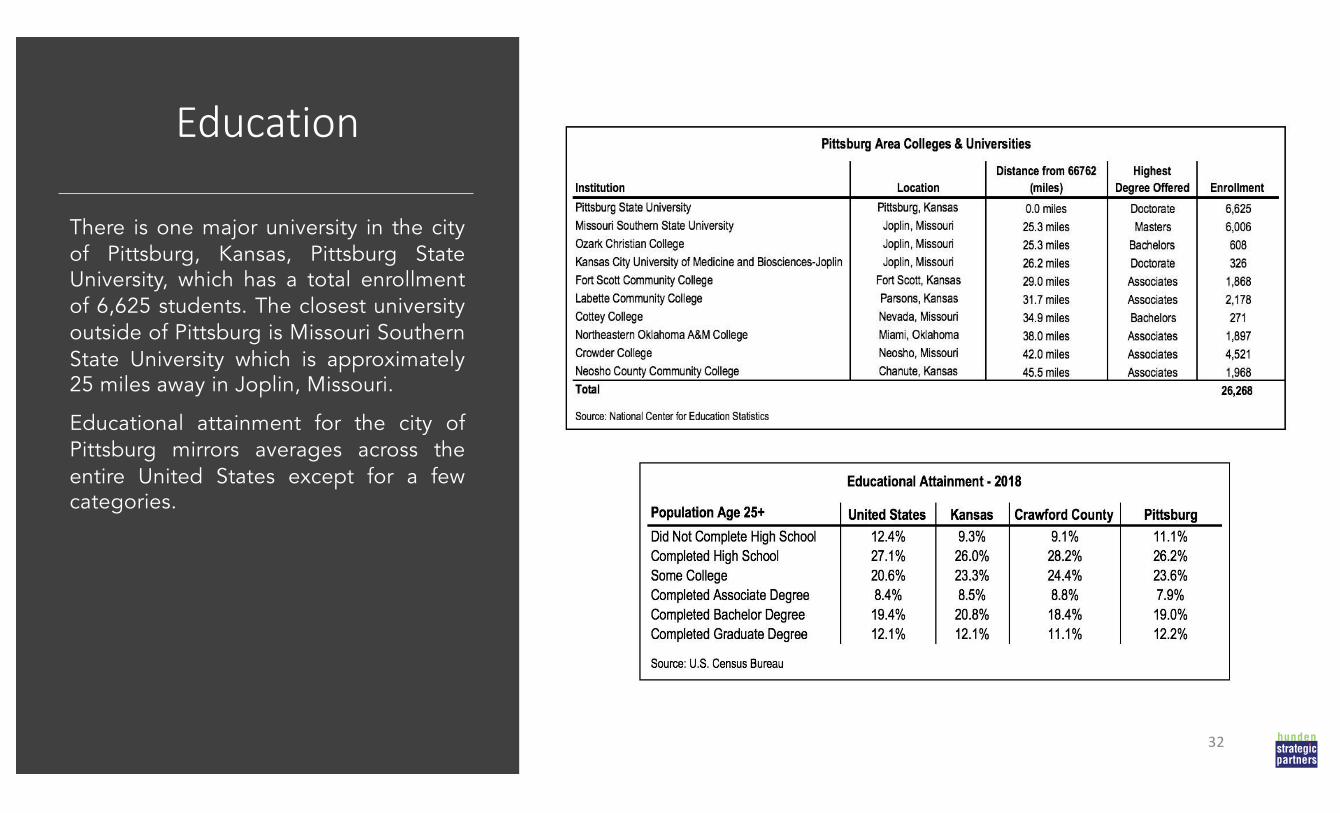
Education
There is one major university in the cityof Pittsburg, Kansas, Pittsburg StateUniversity, which has a total enrollmentof 6,625 students. The closest universityoutside of Pittsburg is Missouri SouthernState University which is approximately25 miles away in Joplin, Missouri.
Educational attainment for the city ofPittsburg mirrors averages across theentire United States except for a fewcategories.
32

Pittsburg Attractions
33
Pittsburg Area Attractions
34
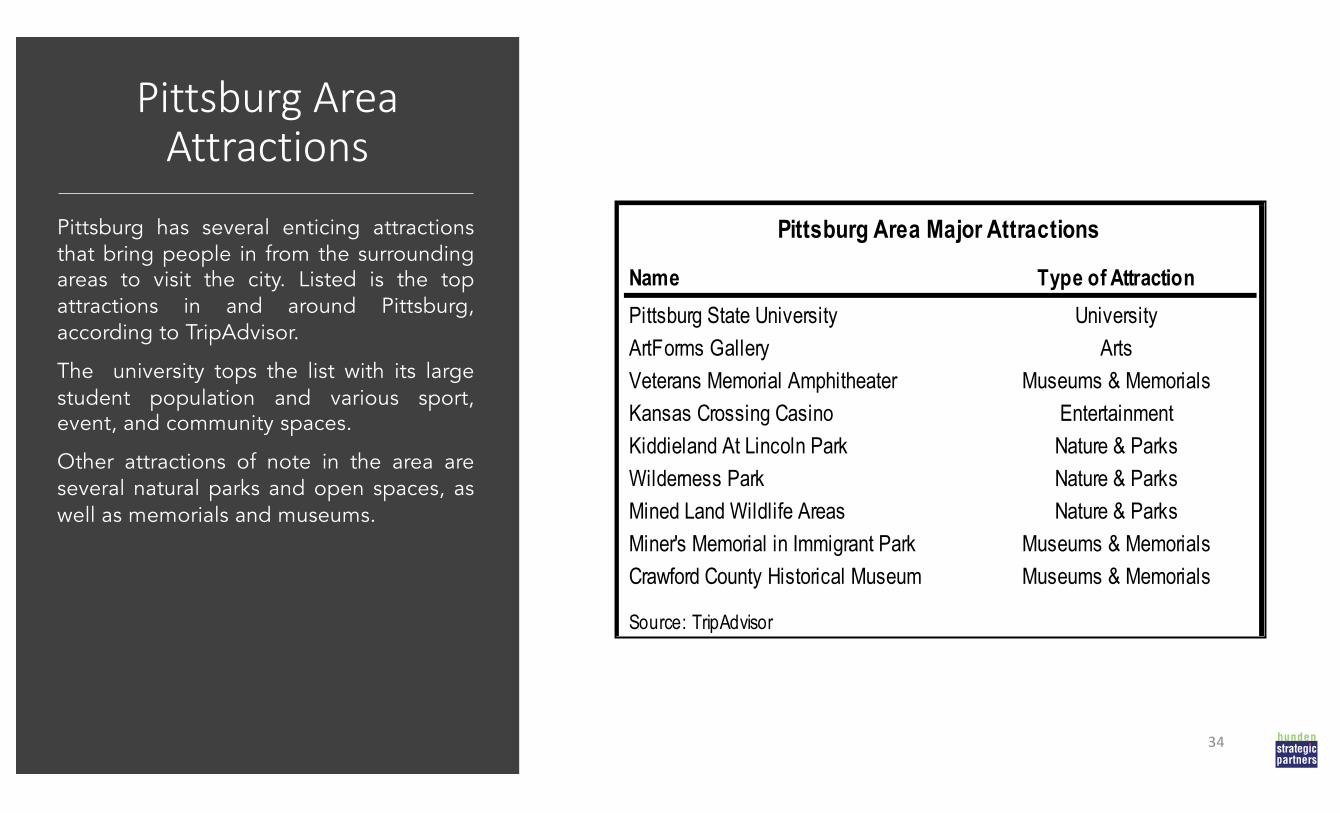
Pittsburg has several enticing attractionsthat bring people in from the surroundingareas to visit the city. Listed is the topattractions in and around Pittsburg,according to TripAdvisor.
The university tops the list with its largestudent population and various sport,event, and community spaces.
Other attractions of note in the area areseveral natural parks and open spaces, aswell as memorials and museums.
Pittsburg Area Major Attractions
Name Type of Attraction
Pittsburg State University University ArtForms Gallery ArtsVeterans Memorial Amphitheater Museums & MemorialsKansas Crossing Casino EntertainmentKiddieland At Lincoln Park Nature & ParksWilderness Park Nature & ParksMined Land Wildlife Areas Nature & ParksMiner's Memorial in Immigrant Park Museums & MemorialsCrawford County Historical Museum Museums & Memorials
Source: TripAdvisor

Pittsburg Area AttractionsPittsburg State University – PSU is a public university with a totalenrollment of approximately 6,600 students. The campus is 223acres and contains the $30 million Kansas Technology Center.The university is the backbone of the Pittsburg economy and isclosely intertwined with city life. Pittsburg students make upnearly 30% of the entire Pittsburg population.
ArtForms Gallery– ArtForms is a local cooperative gallery locatedcentrally in downtown Pittsburg. The gallery contains art for salefrom Southeast Kansas artists as well as spaces for artists tocollaborate, teach, and work.
Veterans Memorial Amphitheater – The Veterans MemorialAmphitheater is a large memorial containing a reflection pool,flag rampart, arch with an eternal flame, and a half sized replicaof the prominent Vietnam War Memorial Wall in Washington,D.C..
35
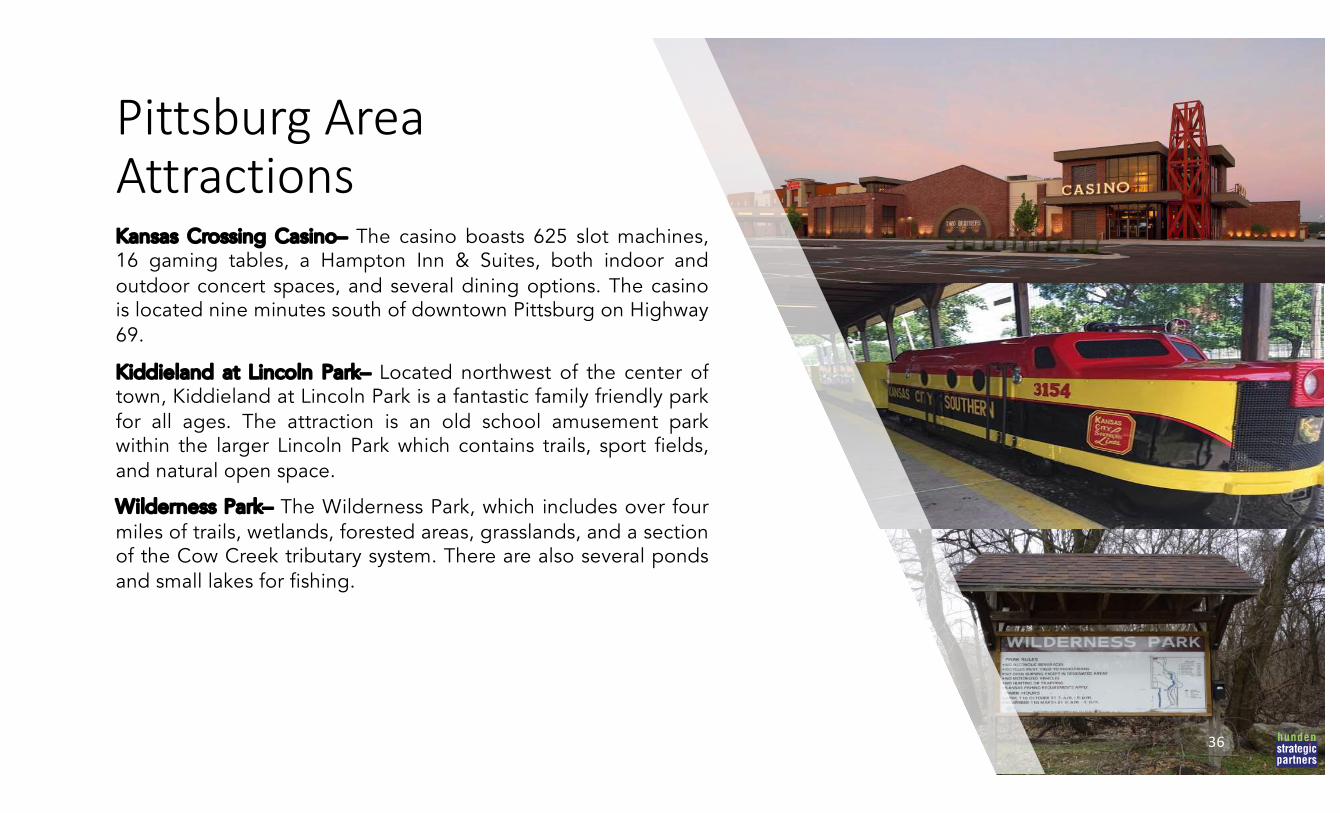
Pittsburg Area AttractionsKansas Crossing Casino– The casino boasts 625 slot machines,16 gaming tables, a Hampton Inn & Suites, both indoor andoutdoor concert spaces, and several dining options. The casinois located nine minutes south of downtown Pittsburg on Highway69.
Kiddieland at Lincoln Park– Located northwest of the center oftown, Kiddieland at Lincoln Park is a fantastic family friendly parkfor all ages. The attraction is an old school amusement parkwithin the larger Lincoln Park which contains trails, sport fields,and natural open space.
Wilderness Park– The Wilderness Park, which includes over fourmiles of trails, wetlands, forested areas, grasslands, and a sectionof the Cow Creek tributary system. There are also several pondsand small lakes for fishing.
36
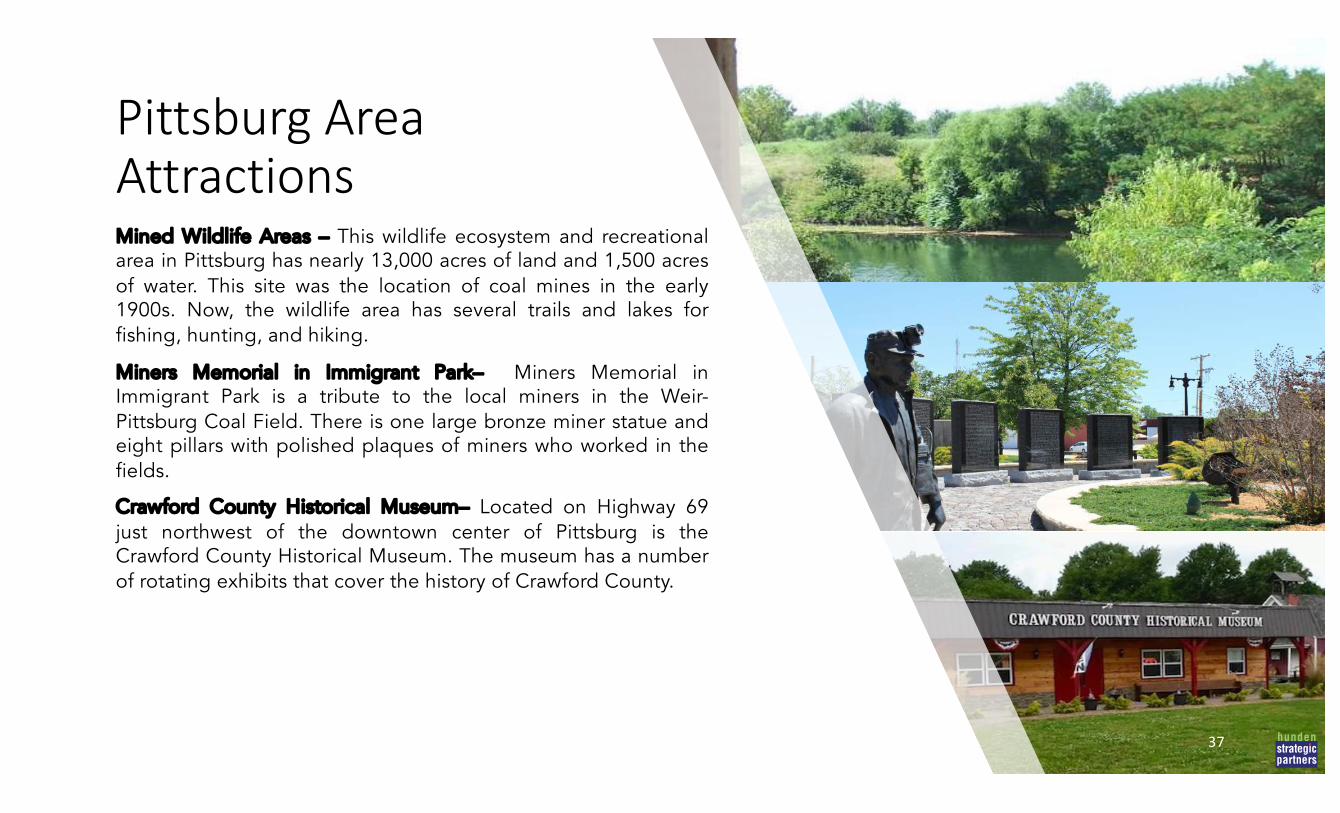
Pittsburg Area AttractionsMined Wildlife Areas – This wildlife ecosystem and recreationalarea in Pittsburg has nearly 13,000 acres of land and 1,500 acresof water. This site was the location of coal mines in the early1900s. Now, the wildlife area has several trails and lakes forfishing, hunting, and hiking.
Miners Memorial in Immigrant Park– Miners Memorial inImmigrant Park is a tribute to the local miners in the Weir-Pittsburg Coal Field. There is one large bronze miner statue andeight pillars with polished plaques of miners who worked in thefields.
Crawford County Historical Museum– Located on Highway 69just northwest of the downtown center of Pittsburg is theCrawford County Historical Museum. The museum has a numberof rotating exhibits that cover the history of Crawford County.
37
Chapter 3: Convention & Meetings Industry Trends
Introduction to Industry TrendsTrends in the North American convention and tourism industries provide benchmarks against which destinations andexecutive staff can compare their own facilities to gauge performance. It is important that the client understandindustry trends in order to remain competitive.
In this section, HSP compiled the most recent and relevant information available about current trends regarding theconvention and tourism industries.
Unless otherwise noted, tables and figures in the following slides are courtesy of the 2018 Price Waterhouse Coopers(PWC) Convention Center Report regarding national convention center trends. This report surveyed over 100convention centers across the United States, Canada and Mexico and is an accepted industry standard.
For the purposes of industry consistency, facilities are categorized based on the size of their exhibit space. Largefacilities are 500,000 or more square feet. Medium facilities are typically 200,000 to 499,999 square feet. Medium-small facilities consist of 100,000 to 199,999 square feet. Small facilities include anything below 100,000 square feet.
Destinations are broken down based on size. Gateway destinations are metropolitan areas with at least 30,000 hotelrooms and at least 100,000 square feet of exhibit space. National destinations are metropolitan areas with 15,000 to30,000 hotel rooms or areas with at least 30,000 rooms and less than 100,000 square feet of exhibit space. Regionaldestinations are metropolitan areas with less than 15,000 hotel rooms or secondary/tertiary convention facilitieslocated in areas with less than 30,000 rooms.
39
Convention and Meeting SpaceIndustry Trends
It is important for stakeholders in Crawford County to understand the forces shapingthe convention and meetings business. While the industry is ever-changing, theexpectations for ease, convenience and affordability have increased, while the demandfor authenticity and large blocks of generic/branded hotel rooms and attached high-quality flexible spaces has also increased. Often, a single event will use many differenttypes of spaces, including exhibit halls, banquet facilities and breakout meeting roomsincreasing the need for well-designed multi-purpose facilities.
Facility Types & Requirements for Various Event Types
Event TypeConventions with Exhibits Conventions Tradeshows
Consumer Shows Assemblies Sports Events Conferences Meetings Trainings Banquets
Attendance Range 150 - 50,000 150 - 15,000 250 - 50,000
8,000 - 1,000,000 5,000 - 50,000 500 - 100,000 50 - 2,000 10 - 300 10 - 300 50 - 2,000
Primary PurposeInfo Exchange &
Sales Info Exchange SalesAdvertising &
Sales Info Exchange Sports Info Exchange Info Exchange TrainingSocial, Business
& Charity
Facility Requirements
Exhibit Halls, Ballroom,
Meeting Rooms, Hotel Block
Ballroom, Meeting Rooms,
Hotel Block
Exhibit Halls, Hotel Block Exhibit Halls
Arena or Exhibit Halls, Hotel
Block
Arena, Stadium or Exhibit Halls,
Hotel Block
Ballroom, Meeting Rooms,
Hotel Block
Meeting Rooms, Hotel Block
Meeting Rooms, Hotel Block Ballroom
Typical Facility Used
Convention Center & Large
Hotels
Convention Center & Large
Hotels
Expo Facilities & Convention
Centers
Expo Facilities & Convention
Centers
Arenas or Convention
Centers
Arena, Stadiums,
Convention Centers
Convention/ Conference Centers and
Hotels
Convention/ Conference Centers and
Hotels
Convention/ Conference Centers and
Hotels
Convention/ Conference Centers and
Hotels
Source: HSP
40
Meeting Industry TrendsThe various types of convention and conference center events are listed below and on the following slide.
Conventions are high-impact events from an economic standpoint because a large percentage of attendees originatefrom outside the local area and typically stay several nights in the host city while spending money onaccommodations, food, transportation, retail goods, and entertainment. Spouses, family, or companions typicallyaccompany a significant number of attendees. Associations, professional groups and other membership organizationshold conventions and attendance generally ranges from 150 to 50,000 attendees. The larger meetings take place inconvention centers with large exhibit halls, but the majority of events require less than 50,000 square feet.
Trade Shows offer a forum for exchanging industry ideas. They are more product- and sales-oriented than conventions.Trade shows typically attract a large number of attendees, who often originate from outside the host city, but tend tohave a shorter average stay.
Consumer Shows are public, ticketed events featuring exhibitions of merchandise for sale or display. Consumer showsrange in size from small local and specialized shows with a few hundred attendees to large shows with thousands ofattendees. The larger consumer shows may occur in convention centers, shopping malls, fairgrounds and other public-assembly facilities with large exhibition areas. The majority of attendees are local, but exhibitors often come from outof town.
Sports events are high-impact events similar to conventions due to the typically high number of attendees comingfrom beyond the local area. Indoor sports, such as basketball, volleyball, dance, cheerleading, wrestling, boxing, tabletennis, pickleball, etc., typically require large exhibit spaces, changing rooms for athletes and spectator seating.
41
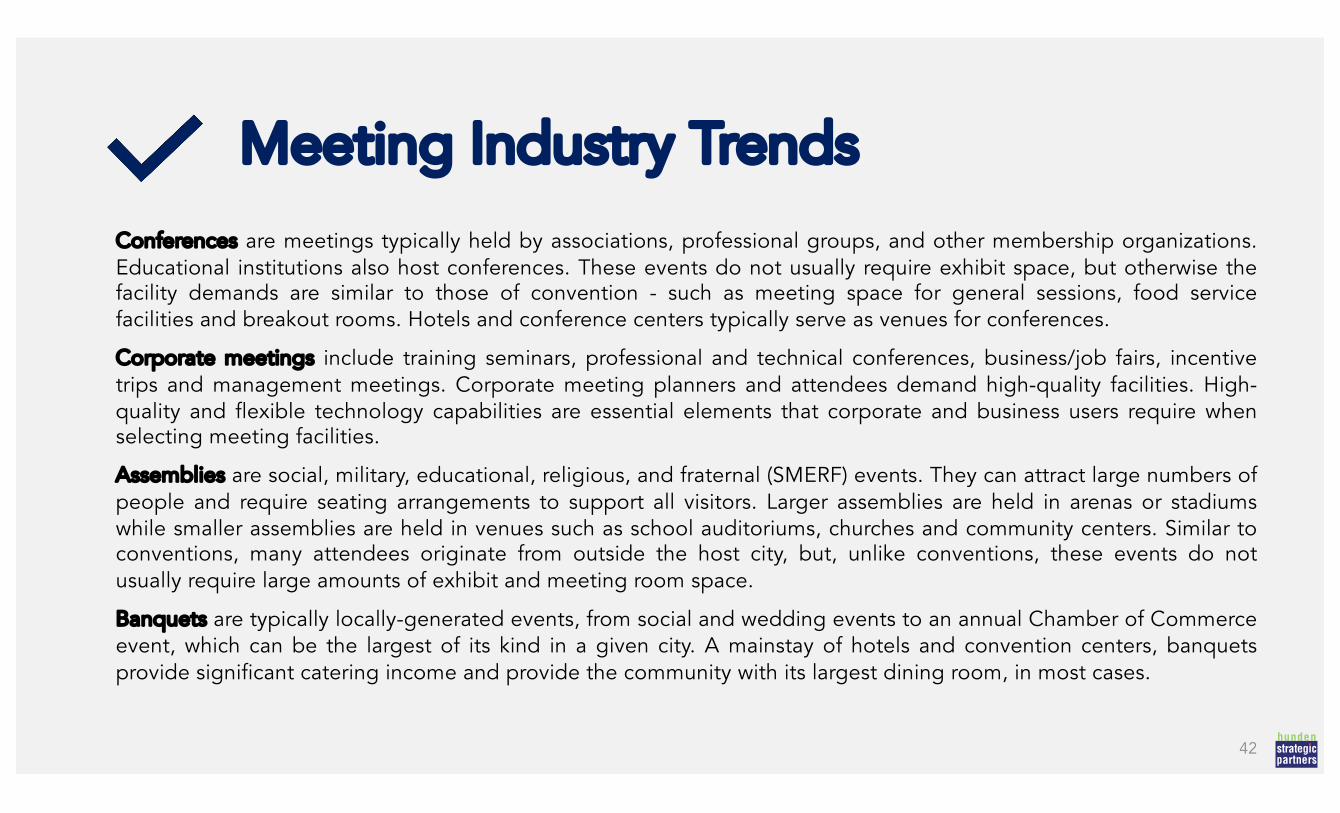
Conferences are meetings typically held by associations, professional groups, and other membership organizations.Educational institutions also host conferences. These events do not usually require exhibit space, but otherwise thefacility demands are similar to those of convention - such as meeting space for general sessions, food servicefacilities and breakout rooms. Hotels and conference centers typically serve as venues for conferences.
Corporate meetings include training seminars, professional and technical conferences, business/job fairs, incentivetrips and management meetings. Corporate meeting planners and attendees demand high-quality facilities. High-quality and flexible technology capabilities are essential elements that corporate and business users require whenselecting meeting facilities.
Assemblies are social, military, educational, religious, and fraternal (SMERF) events. They can attract large numbers ofpeople and require seating arrangements to support all visitors. Larger assemblies are held in arenas or stadiumswhile smaller assemblies are held in venues such as school auditoriums, churches and community centers. Similar toconventions, many attendees originate from outside the host city, but, unlike conventions, these events do notusually require large amounts of exhibit and meeting room space.
Banquets are typically locally-generated events, from social and wedding events to an annual Chamber of Commerceevent, which can be the largest of its kind in a given city. A mainstay of hotels and convention centers, banquetsprovide significant catering income and provide the community with its largest dining room, in most cases.
Meeting Industry Trends
42
Convention and Meeting SpaceIndustry Trends
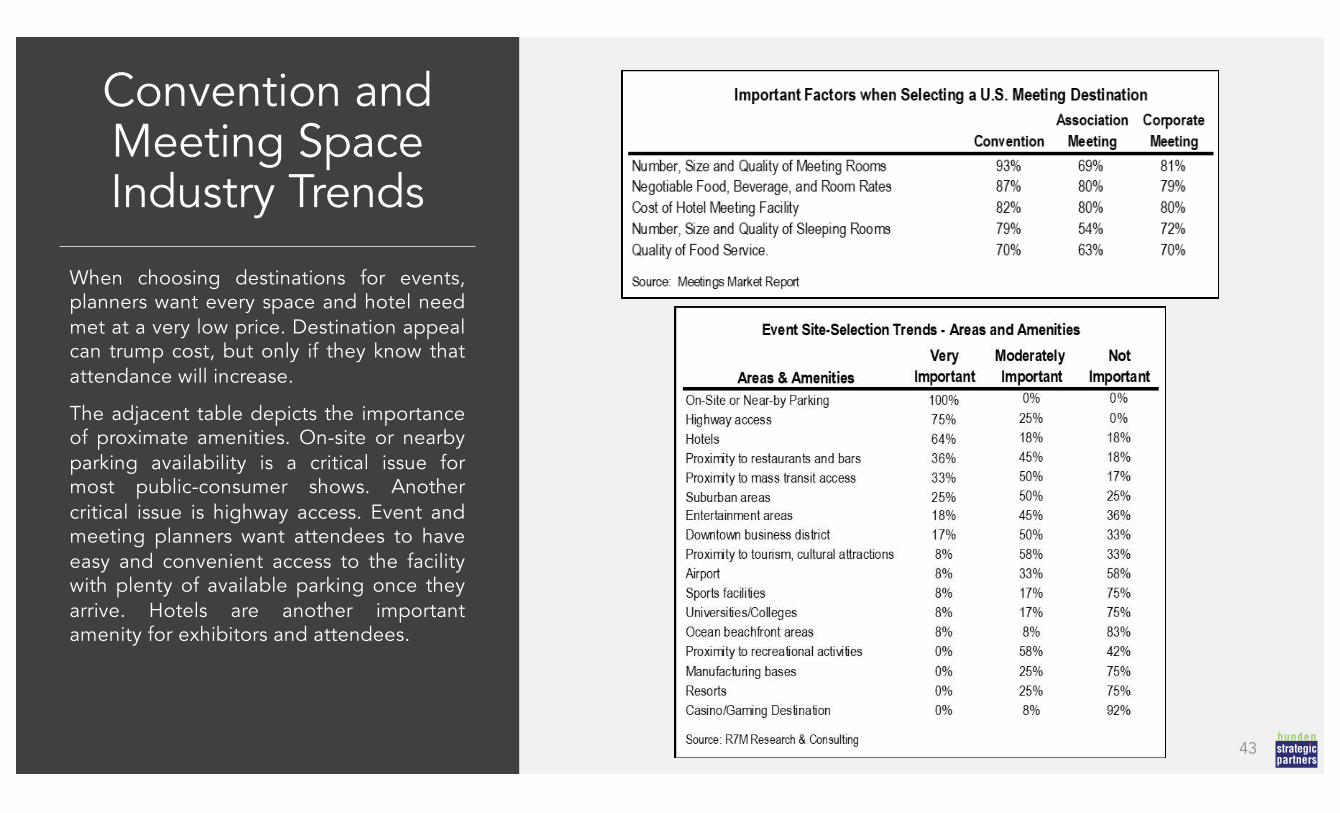
When choosing destinations for events,planners want every space and hotel needmet at a very low price. Destination appealcan trump cost, but only if they know thatattendance will increase.
The adjacent table depicts the importanceof proximate amenities. On-site or nearbyparking availability is a critical issue formost public-consumer shows. Anothercritical issue is highway access. Event andmeeting planners want attendees to haveeasy and convenient access to the facilitywith plenty of available parking once theyarrive. Hotels are another importantamenity for exhibitors and attendees.
43

Convention and Meeting SpaceIndustry Trends
Event and meeting planners are utilizingtheir leverage, being in a buyer’s market,to negotiate better deals.
Events require more telecom/internetbandwidth and higher-quality food andbeverage than the average customer.
Even though 68 percent of events andshows are being booked closer to theevent date compared to only eight percentbeing booked further in advance, 32percent of events and shows are requiringattendance promotion assistance, whichputs more pressure on convention centers.
44
Chapter 4: Convention & Meetings
Market Analysis
45
LocalMeeting Facilities
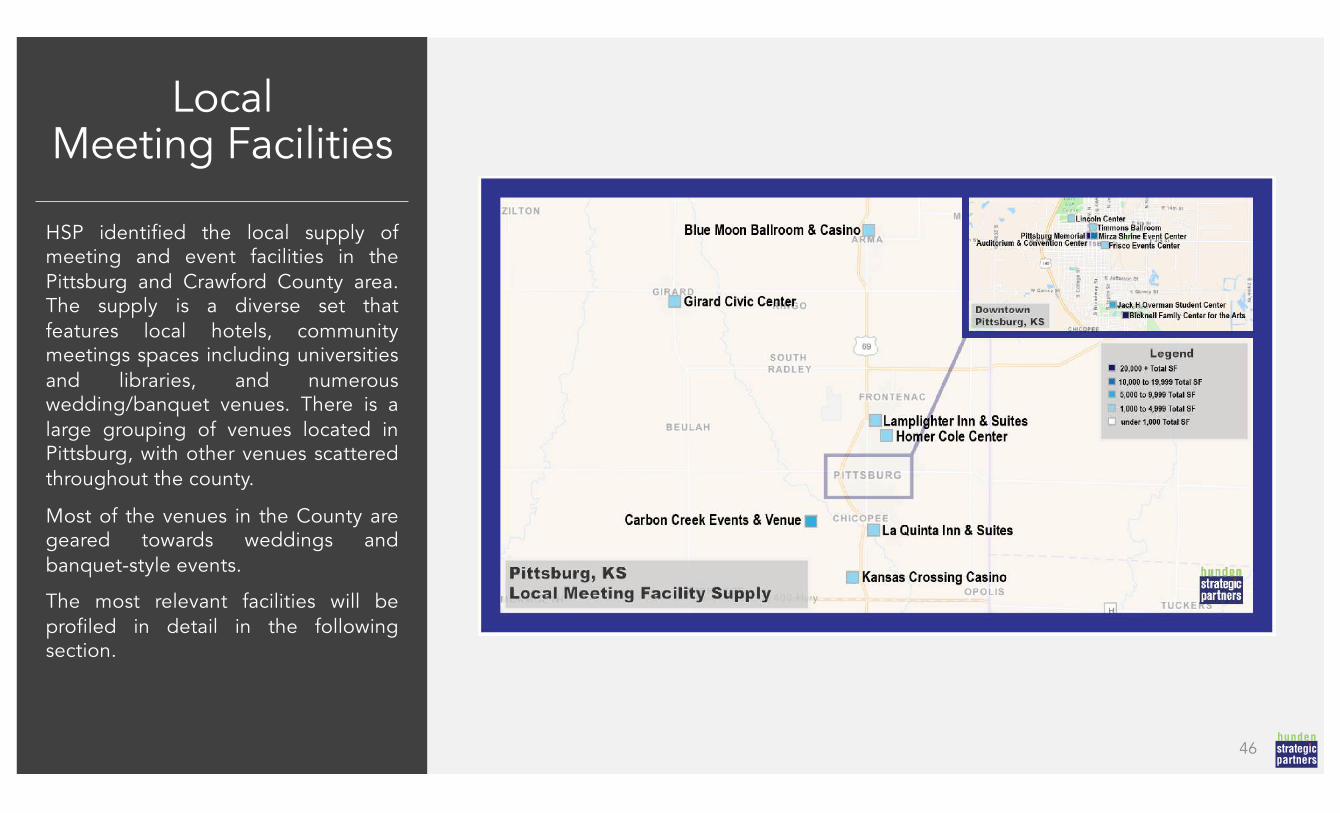
HSP identified the local supply ofmeeting and event facilities in thePittsburg and Crawford County area.The supply is a diverse set thatfeatures local hotels, communitymeetings spaces including universitiesand libraries, and numerouswedding/banquet venues. There is alarge grouping of venues located inPittsburg, with other venues scatteredthroughout the county.
Most of the venues in the County aregeared towards weddings andbanquet-style events.
The most relevant facilities will beprofiled in detail in the followingsection.
46
LocalMeeting Facilities
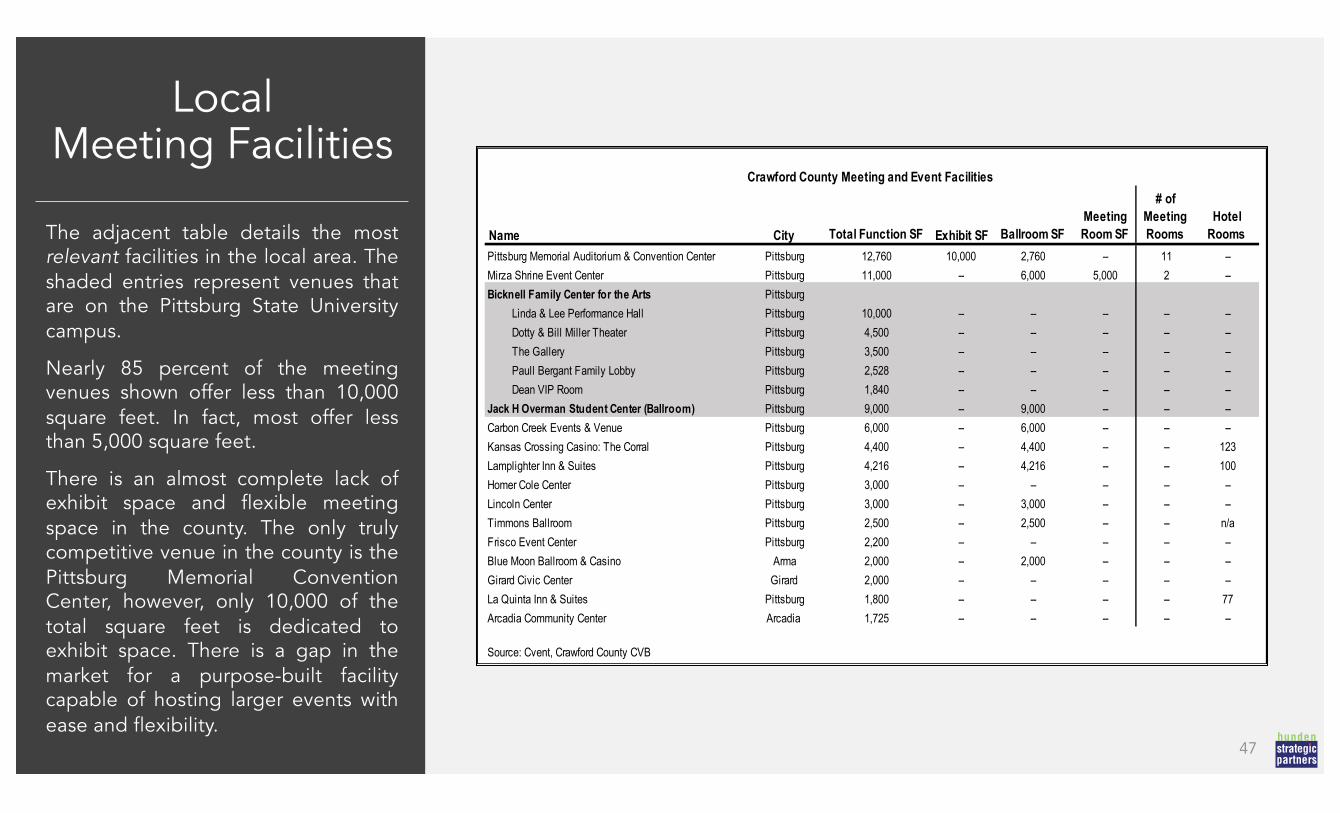
The adjacent table details the mostrelevant facilities in the local area. Theshaded entries represent venues thatare on the Pittsburg State Universitycampus.
Nearly 85 percent of the meetingvenues shown offer less than 10,000square feet. In fact, most offer lessthan 5,000 square feet.
There is an almost complete lack ofexhibit space and flexible meetingspace in the county. The only trulycompetitive venue in the county is thePittsburg Memorial ConventionCenter, however, only 10,000 of thetotal square feet is dedicated toexhibit space. There is a gap in themarket for a purpose-built facilitycapable of hosting larger events withease and flexibility.
47
Crawford County Meeting and Event Facilities
Name City Total Function SF Exhibit SF Ballroom SFMeeting Room SF
# of Meeting Rooms
Hotel Rooms
Pittsburg Memorial Auditorium & Convention Center Pittsburg 12,760 10,000 2,760 -- 11 --Mirza Shrine Event Center Pittsburg 11,000 -- 6,000 5,000 2 --Bicknell Family Center for the Arts Pittsburg
Linda & Lee Performance Hall Pittsburg 10,000 -- -- -- -- --Dotty & Bill Miller Theater Pittsburg 4,500 -- -- -- -- --The Gallery Pittsburg 3,500 -- -- -- -- --Paull Bergant Family Lobby Pittsburg 2,528 -- -- -- -- --Dean VIP Room Pittsburg 1,840 -- -- -- -- --
Jack H Overman Student Center (Ballroom) Pittsburg 9,000 -- 9,000 -- -- --Carbon Creek Events & Venue Pittsburg 6,000 -- 6,000 -- -- --Kansas Crossing Casino: The Corral Pittsburg 4,400 -- 4,400 -- -- 123Lamplighter Inn & Suites Pittsburg 4,216 -- 4,216 -- -- 100Homer Cole Center Pittsburg 3,000 -- -- -- -- --Lincoln Center Pittsburg 3,000 -- 3,000 -- -- --Timmons Ballroom Pittsburg 2,500 -- 2,500 -- -- n/aFrisco Event Center Pittsburg 2,200 -- -- -- -- --Blue Moon Ballroom & Casino Arma 2,000 -- 2,000 -- -- --Girard Civic Center Girard 2,000 -- -- -- -- --La Quinta Inn & Suites Pittsburg 1,800 -- -- -- -- 77Arcadia Community Center Arcadia 1,725 -- -- -- -- --
Source: Cvent, Crawford County CVB
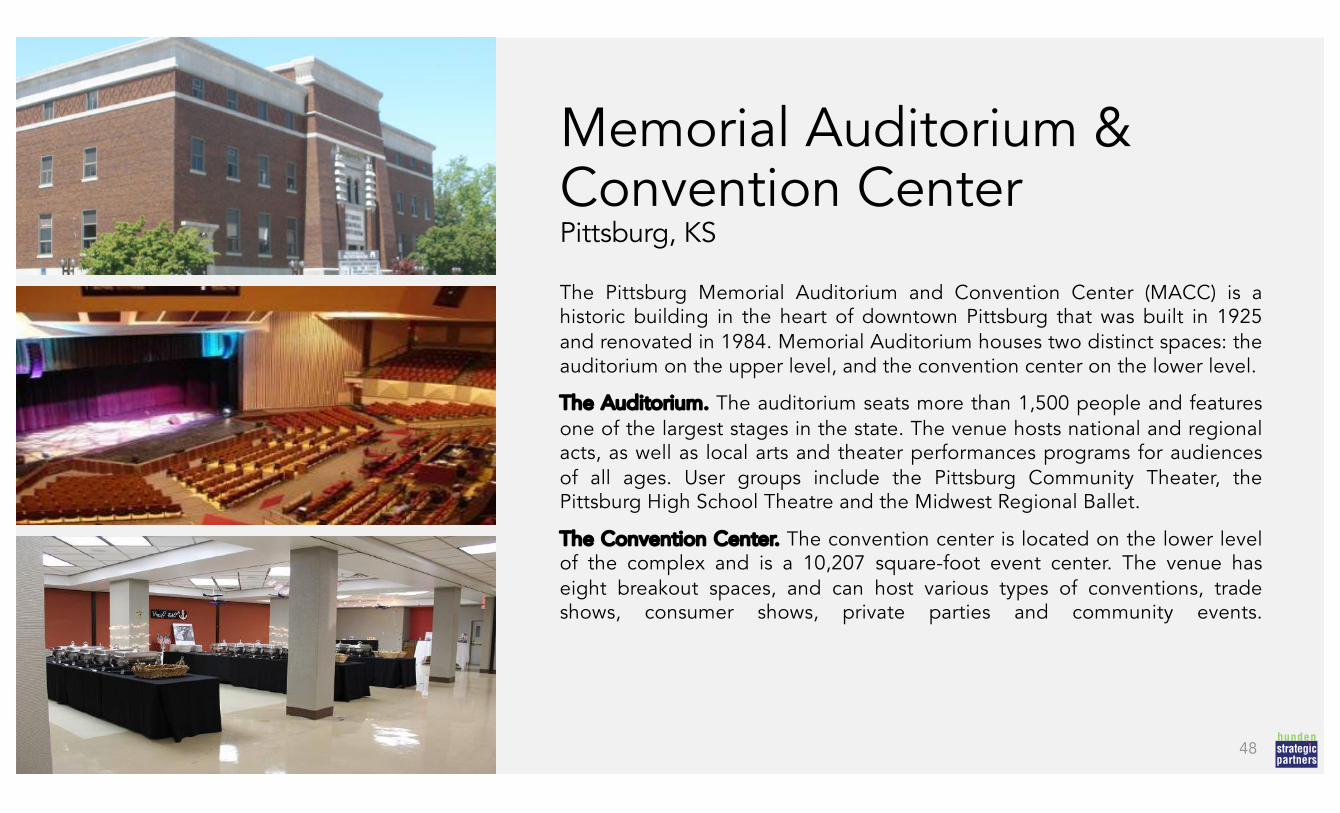
Memorial Auditorium & Convention CenterPittsburg, KS
The Pittsburg Memorial Auditorium and Convention Center (MACC) is ahistoric building in the heart of downtown Pittsburg that was built in 1925and renovated in 1984. Memorial Auditorium houses two distinct spaces: theauditorium on the upper level, and the convention center on the lower level.
The Auditorium. The auditorium seats more than 1,500 people and featuresone of the largest stages in the state. The venue hosts national and regionalacts, as well as local arts and theater performances programs for audiencesof all ages. User groups include the Pittsburg Community Theater, thePittsburg High School Theatre and the Midwest Regional Ballet.
The Convention Center. The convention center is located on the lower levelof the complex and is a 10,207 square-foot event center. The venue haseight breakout spaces, and can host various types of conventions, tradeshows, consumer shows, private parties and community events.
48
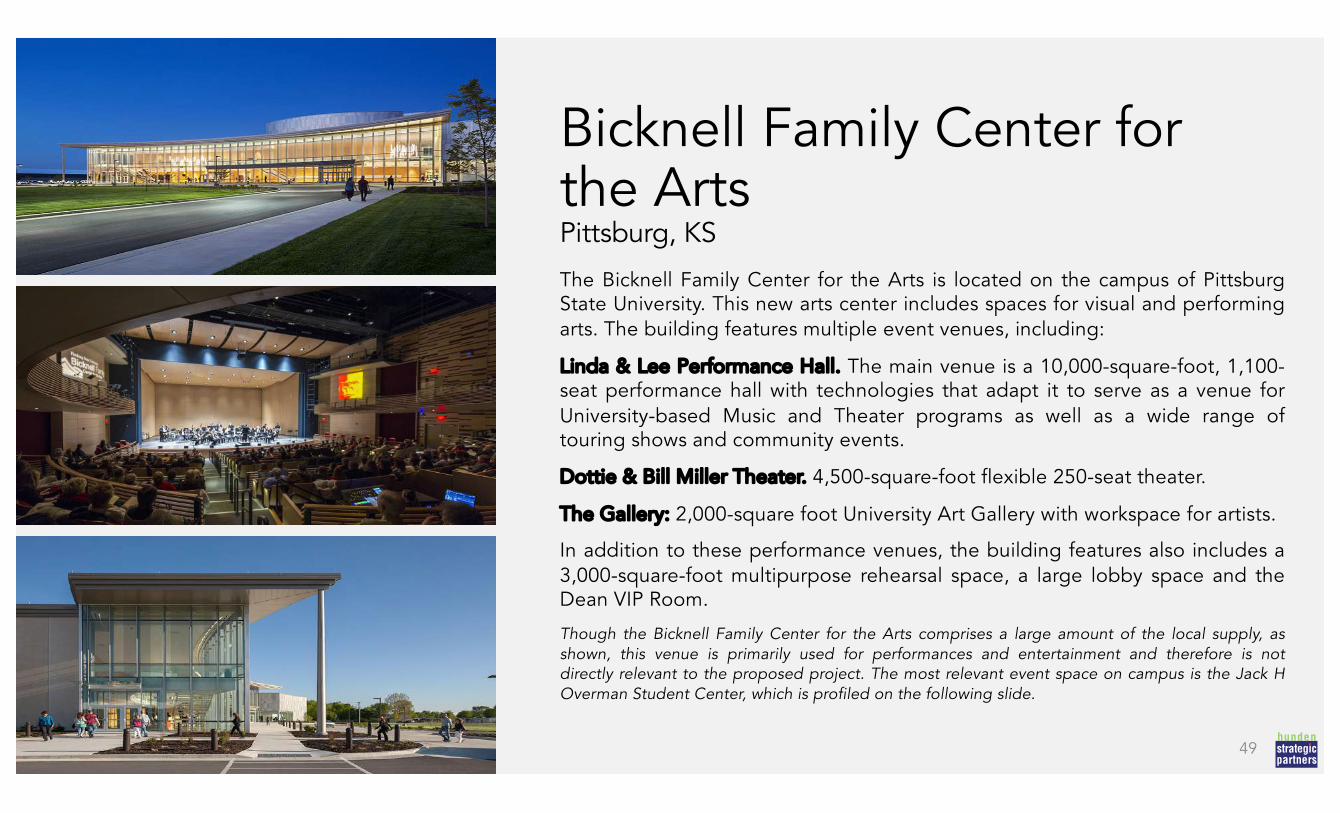
Bicknell Family Center for the ArtsPittsburg, KS
The Bicknell Family Center for the Arts is located on the campus of PittsburgState University. This new arts center includes spaces for visual and performingarts. The building features multiple event venues, including:
Linda & Lee Performance Hall. The main venue is a 10,000-square-foot, 1,100-seat performance hall with technologies that adapt it to serve as a venue forUniversity-based Music and Theater programs as well as a wide range oftouring shows and community events.
Dottie & Bill Miller Theater. 4,500-square-foot flexible 250-seat theater.
The Gallery: 2,000-square foot University Art Gallery with workspace for artists.
In addition to these performance venues, the building features also includes a3,000-square-foot multipurpose rehearsal space, a large lobby space and theDean VIP Room.
Though the Bicknell Family Center for the Arts comprises a large amount of the local supply, asshown, this venue is primarily used for performances and entertainment and therefore is notdirectly relevant to the proposed project. The most relevant event space on campus is the Jack HOverman Student Center, which is profiled on the following slide.
49
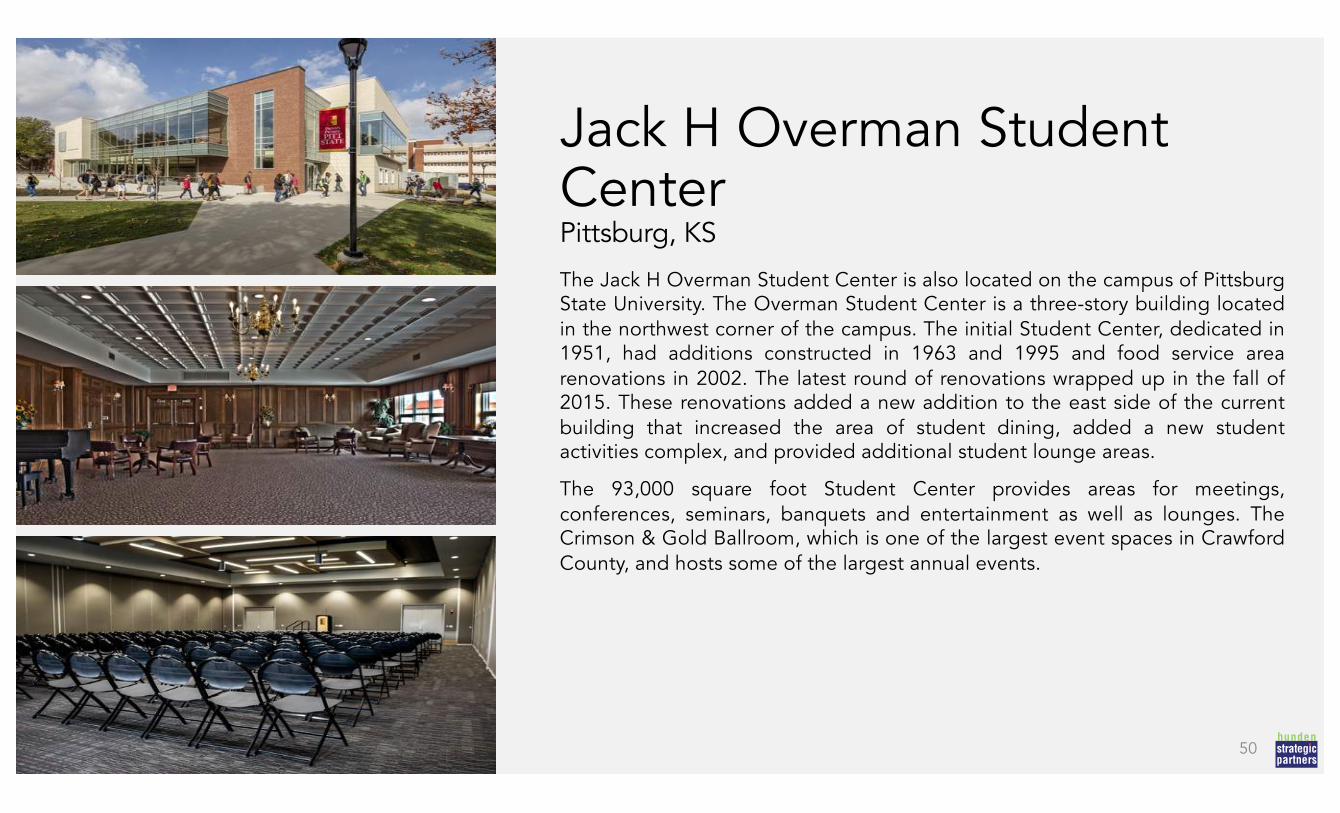
Jack H Overman Student CenterPittsburg, KS
The Jack H Overman Student Center is also located on the campus of PittsburgState University. The Overman Student Center is a three-story building locatedin the northwest corner of the campus. The initial Student Center, dedicated in1951, had additions constructed in 1963 and 1995 and food service arearenovations in 2002. The latest round of renovations wrapped up in the fall of2015. These renovations added a new addition to the east side of the currentbuilding that increased the area of student dining, added a new studentactivities complex, and provided additional student lounge areas.
The 93,000 square foot Student Center provides areas for meetings,conferences, seminars, banquets and entertainment as well as lounges. TheCrimson & Gold Ballroom, which is one of the largest event spaces in CrawfordCounty, and hosts some of the largest annual events.
50
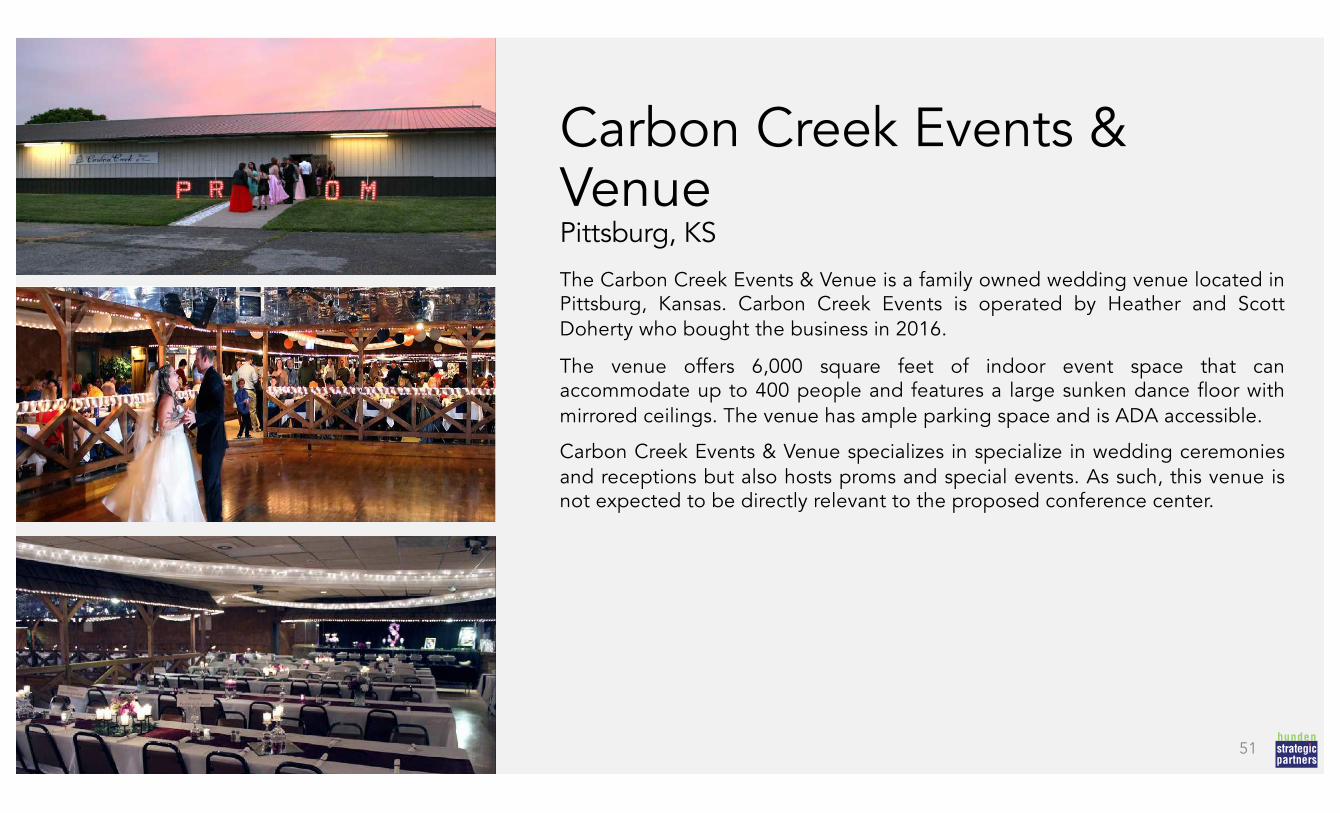
Carbon Creek Events & VenuePittsburg, KS
The Carbon Creek Events & Venue is a family owned wedding venue located inPittsburg, Kansas. Carbon Creek Events is operated by Heather and ScottDoherty who bought the business in 2016.
The venue offers 6,000 square feet of indoor event space that canaccommodate up to 400 people and features a large sunken dance floor withmirrored ceilings. The venue has ample parking space and is ADA accessible.
Carbon Creek Events & Venue specializes in specialize in wedding ceremoniesand receptions but also hosts proms and special events. As such, this venue isnot expected to be directly relevant to the proposed conference center.
51
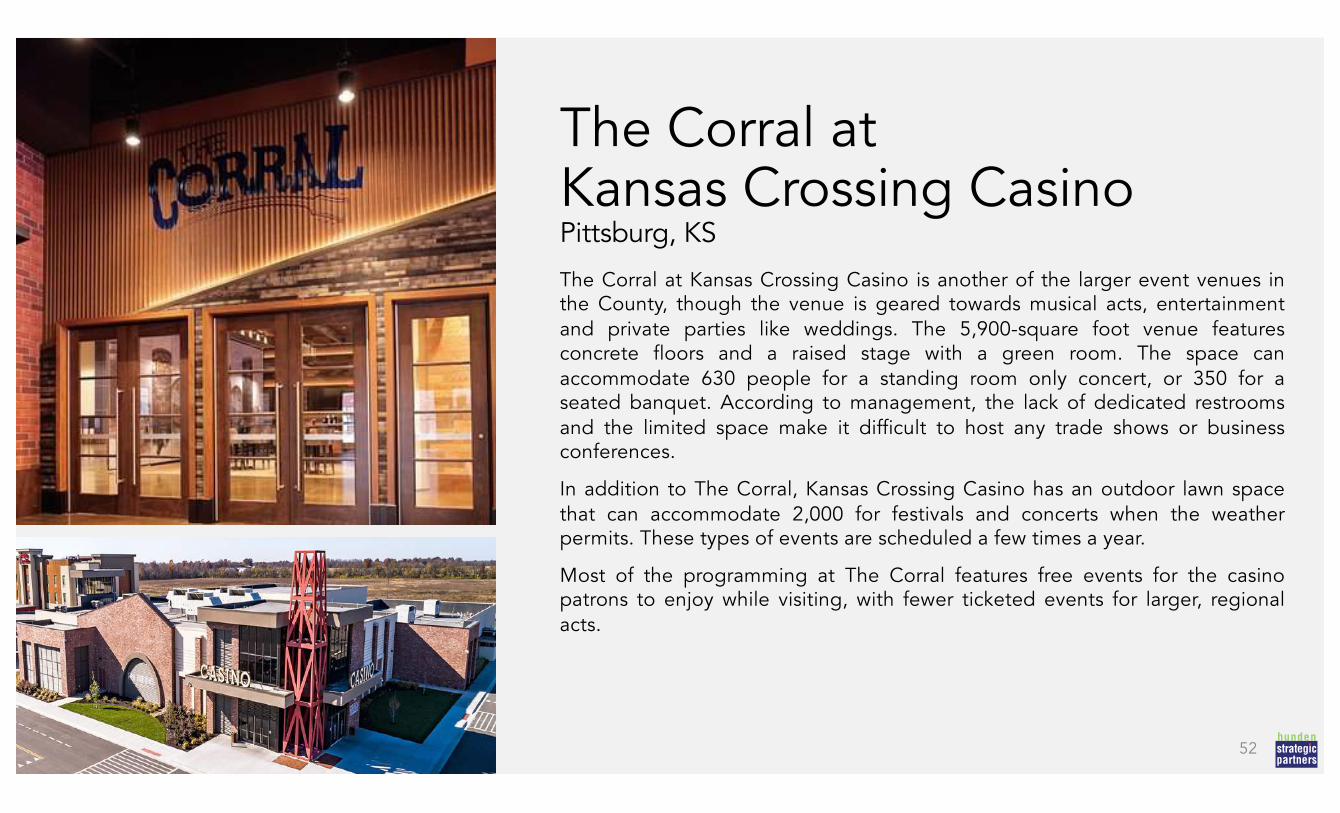
The Corral atKansas Crossing CasinoPittsburg, KS
The Corral at Kansas Crossing Casino is another of the larger event venues inthe County, though the venue is geared towards musical acts, entertainmentand private parties like weddings. The 5,900-square foot venue featuresconcrete floors and a raised stage with a green room. The space canaccommodate 630 people for a standing room only concert, or 350 for aseated banquet. According to management, the lack of dedicated restroomsand the limited space make it difficult to host any trade shows or businessconferences.
In addition to The Corral, Kansas Crossing Casino has an outdoor lawn spacethat can accommodate 2,000 for festivals and concerts when the weatherpermits. These types of events are scheduled a few times a year.
Most of the programming at The Corral features free events for the casinopatrons to enjoy while visiting, with fewer ticketed events for larger, regionalacts.
52

Local/Metro Visitation
53
HSP, using data from Placer.ai, analyzed2019 visitation to the Kansas CrossingCasino and Hotel.
This regional map shows that KansasCrossing generates significant local use,but also attracts visitors from Oklahoma,Missouri and Arkansas, as well as fromthe Dallas metro area.
Nearly 28 percent are local and comemore than six times per year. Another 28percent come from the region 25-75miles away.
Approximately 45 percent of visitors toKansas Crossing in 2019 came from morethan 75 miles away.
Visitor Origins by Distance from Site Colors correspond to charts & maps
Est. Numberof Visits
Percent ofTotal Visits
Est. Numberof Customers
Percent ofTotal Customers
Avg. Visitsper Customer
Locals - Within 25 miles 251,000 44.6% 42,400 27.3% 6.50Regional & Long Distance - 25-75 miles 158,500 28.2% 42,800 27.6% 4.00Long Distance only - Over 75 miles 152,900 27.2% 69,900 45.1% 4.50
Total Visits 562,400 100.0% 155,100 100.0% --
Source: Placer.ai
Kansas Crossing Casino and HotelJanuary 1, 2019 - December 31, 2019 (365 Days)
Total Visits Total Unique Customers
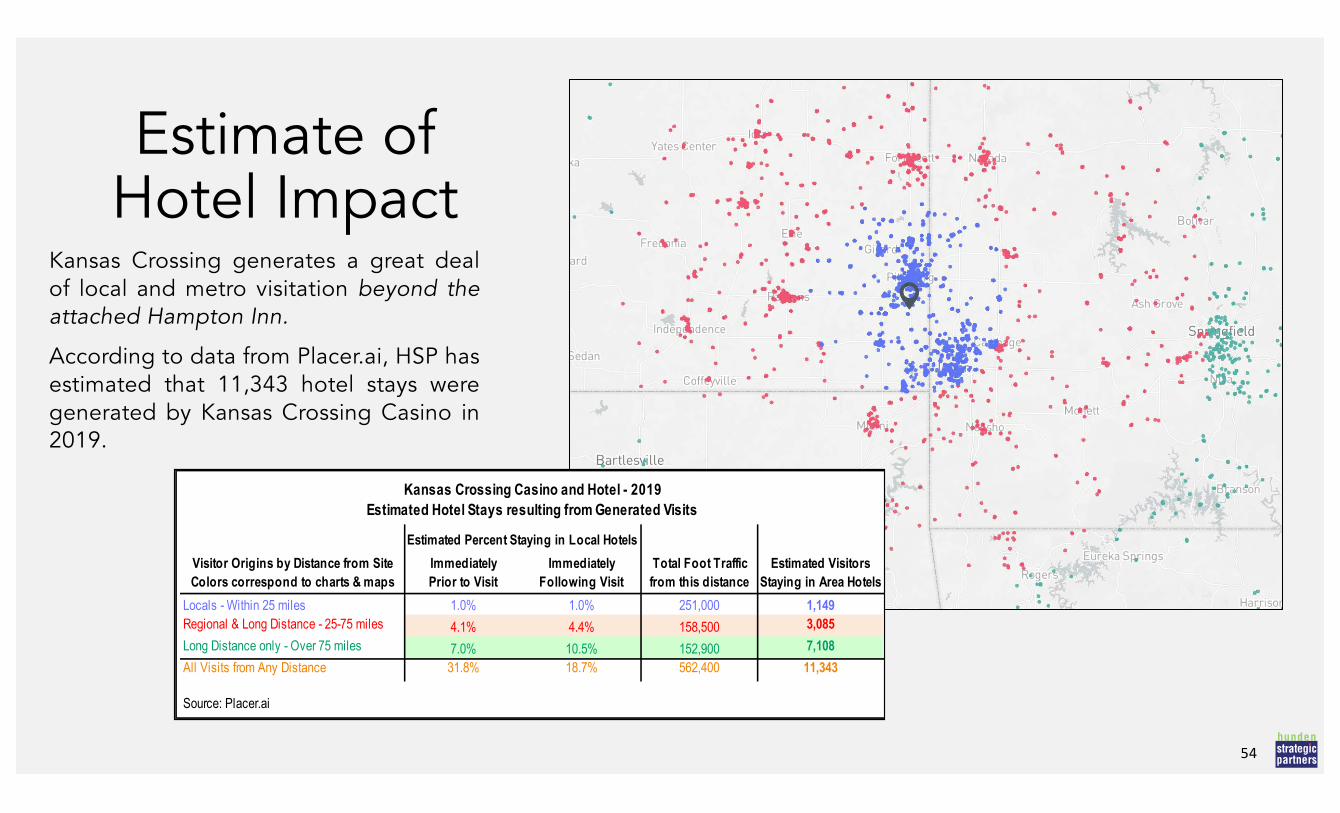
Estimate of Hotel Impact
54
Kansas Crossing generates a great dealof local and metro visitation beyond theattached Hampton Inn.
According to data from Placer.ai, HSP hasestimated that 11,343 hotel stays weregenerated by Kansas Crossing Casino in2019.
Visitor Origins by Distance from Site Colors correspond to charts & maps
ImmediatelyPrior to Visit
Immediately Following Visit
Total Foot Traffic from this distance
Estimated Visitors Staying in Area Hotels
Locals - Within 25 miles 1.0% 1.0% 251,000 1,149Regional & Long Distance - 25-75 miles 4.1% 4.4% 158,500 3,085Long Distance only - Over 75 miles 7.0% 10.5% 152,900 7,108All Visits from Any Distance 31.8% 18.7% 562,400 11,343
Source: Placer.ai
Kansas Crossing Casino and Hotel - 2019Estimated Hotel Stays resulting from Generated Visits
Estimated Percent Staying in Local Hotels
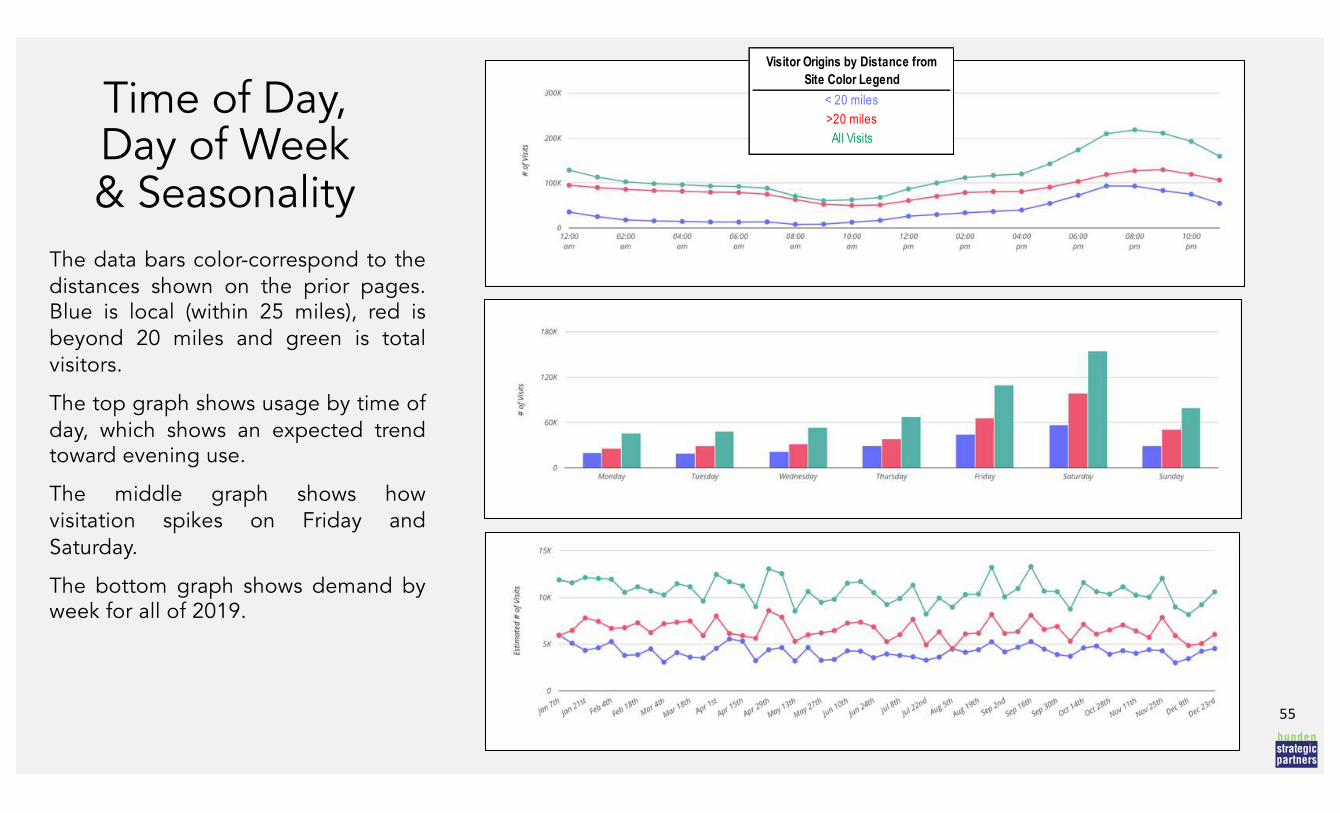
Time of Day, Day of Week & Seasonality
55
The data bars color-correspond to thedistances shown on the prior pages.Blue is local (within 25 miles), red isbeyond 20 miles and green is totalvisitors.
The top graph shows usage by time ofday, which shows an expected trendtoward evening use.
The middle graph shows howvisitation spikes on Friday andSaturday.
The bottom graph shows demand byweek for all of 2019.
Visitor Origins by Distance from Site Color Legend
< 20 miles>20 milesAll Visits
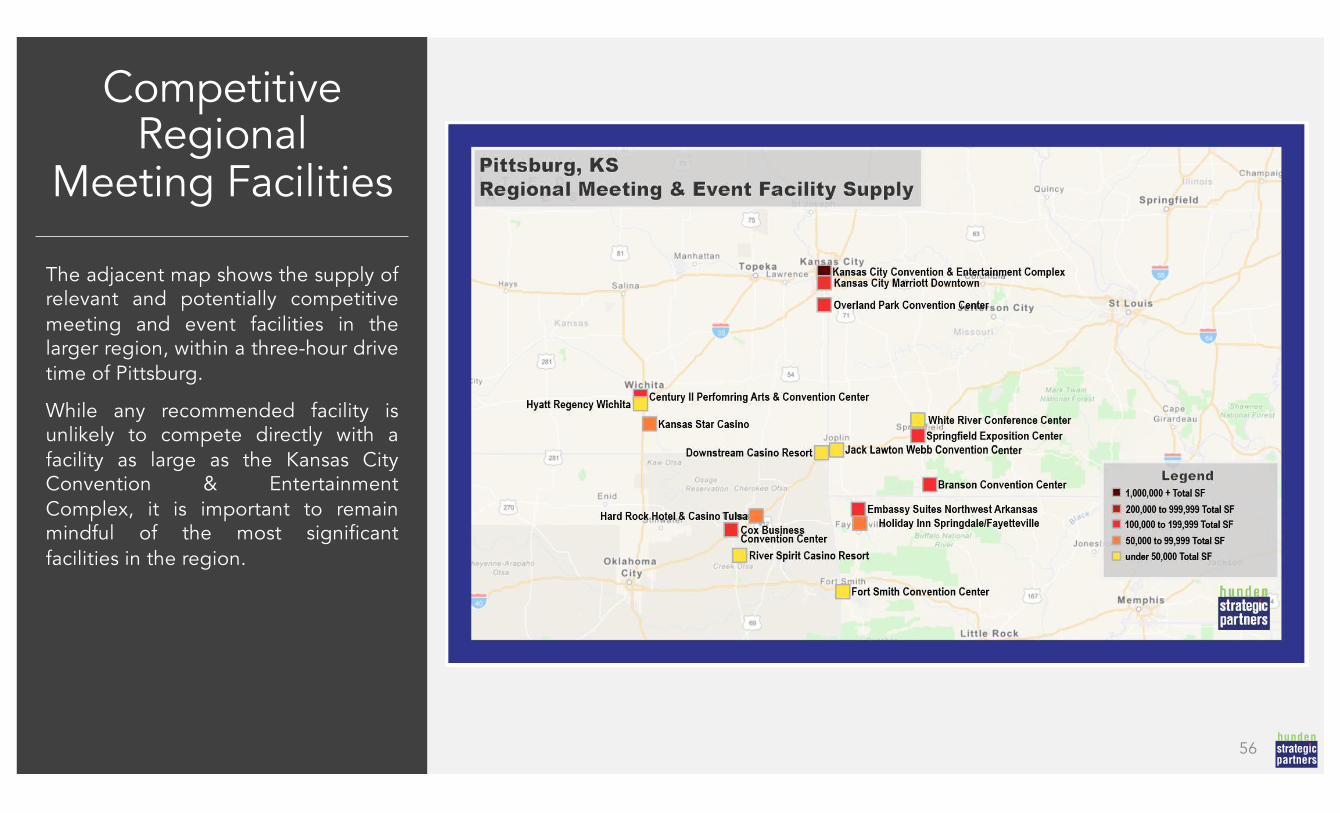
Competitive Regional
Meeting Facilities
The adjacent map shows the supply ofrelevant and potentially competitivemeeting and event facilities in thelarger region, within a three-hour drivetime of Pittsburg.
While any recommended facility isunlikely to compete directly with afacility as large as the Kansas CityConvention & EntertainmentComplex, it is important to remainmindful of the most significantfacilities in the region.
56

Competitive Regional
Meeting Facilities
In order to recommend an optimalmeeting or event facility in CrawfordCounty, a thorough analysis of itscompetition is necessary.
The adjacent table above is a list ofthe relevant regional supply, whichincludes both regional hotels as wellas convention and conference centers.
HSP has filtered out many smaller andwedding-specific venues in thesurrounding area that would not bedirectly competitive with a businessconference center.
The most directly competitive facilitiesare shown in the shaded portion, dueto similar size, proximity, or othersimilar features.
57
Crawford County Regional Meeting and Event Facilities
Name LocationMiles from Pittsburg Total SF Exhibit SF Ballroom SF
Meeting Room SF
# of Meeting Rooms
Walkable Hotel Rooms
Kansas City Convention & Entertainment Complex Kansas City , MO 128 589,661 434,800 61,323 93,538 42 3,433
Cox Business Convention Center Tulsa, OK 104 203,575 144,070 29,800 29,705 25 1,020
Century II Performing Arts & Convention Center Wichita, KS 146 199,020 173,000 12,380 13,640 10 751
Springfield Exposition Center Springfield, MO 79 128,167 91,700 34,400 2,067 4 272
Overland Park Convention Center Overland Park, KS 105 97,630 58,494 24,991 14,145 7 936
Branson Convention Center Branson, MO 98 79,938 46,031 22,703 11,204 8 674
Hard Rock Hotel & Casino Tulsa Tulsa, OK 104 76,965 45,000 20,022 11,943 12 764
Kansas City Marriott Downtown Kansas City , MO 128 73,818 12,000 32,480 29,338 35 2,473
Embassy Suites Northwest Arkansas Rogers, AR 82 68,861 -- 63,255 5,606 7 400
Kansas Star Casino Mulvane, KS 144 54,105 42,000 11,234 871 3 300
Holiday Inn Springdale/Fayettev ille Springdale, AR 90 51,455 28,800 14,928 7,727 6 814
Fort Smith Convention Center Fort Smith, AR 141 45,440 40,000 -- 5,440 15 523
Jack Lawton Webb Convention Center Joplin, MO 30 33,000 -- 33,000 -- -- --
River Spirit Casino Resort Tulsa, OK 118 19,783 -- 14,616 5,167 7 769
Hyatt Regency Wichita Wichita, KS 146 18,055 -- 13,829 4,226 5 697
White River Conference Center Springfield, MO 79 17,340 -- 9,700 7,640 8 --
Downstream Casino Resort Quapaw, OK 28 15,000 -- 10,000 5,000 6 374
*represents non-tradtional exhibit space/arena
Source: Cvent, HSP
Kansas Star CasinoMulvane, KS
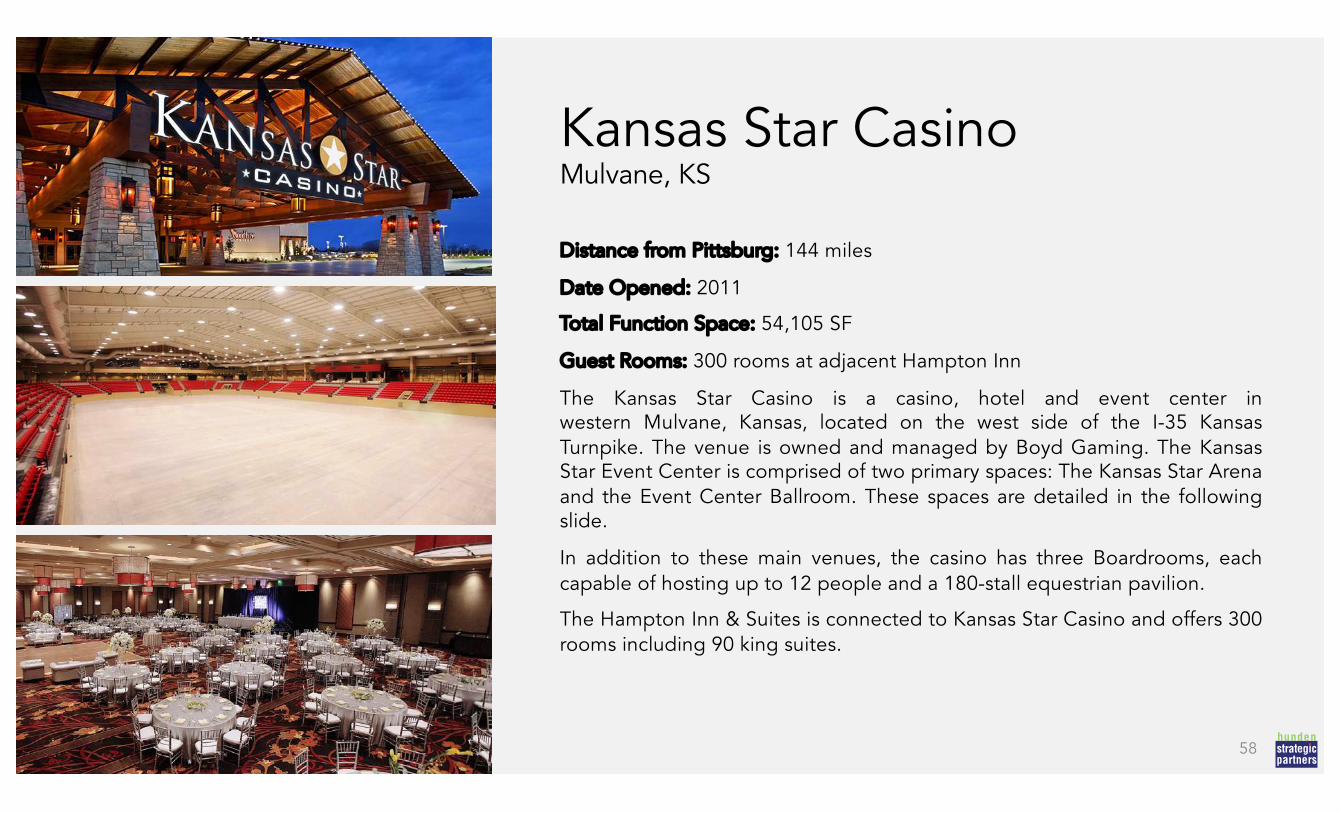
Distance from Pittsburg: 144 miles
Date Opened: 2011
Total Function Space: 54,105 SF
Guest Rooms: 300 rooms at adjacent Hampton Inn
The Kansas Star Casino is a casino, hotel and event center inwestern Mulvane, Kansas, located on the west side of the I-35 KansasTurnpike. The venue is owned and managed by Boyd Gaming. The KansasStar Event Center is comprised of two primary spaces: The Kansas Star Arenaand the Event Center Ballroom. These spaces are detailed in the followingslide.
In addition to these main venues, the casino has three Boardrooms, eachcapable of hosting up to 12 people and a 180-stall equestrian pavilion.
The Hampton Inn & Suites is connected to Kansas Star Casino and offers 300rooms including 90 king suites.
58

Kansas Star Casino
Kansas Star Arena is a multipurposeentertainment venue that has hostedconcerts by notable performing artists, aswell as the Miss Kansas USA pageant,mixed martial arts events by Bellator MMA,and equestrian eventsincluding Championship Bull Riding andthe Professional Rodeo CowboysAssociation. The arena floor offers anadditional 42,000 square feet oftradeshow/convention space.
The Event Center Ballroom is a 11,234-square-foot expansive Ballroom which canbe divided into six separate rooms or usedin full for a capacity of 1,600 guests.Additional amenities include on-sitecatering, high-speed internet, and fullaudio/visual equipment.
59
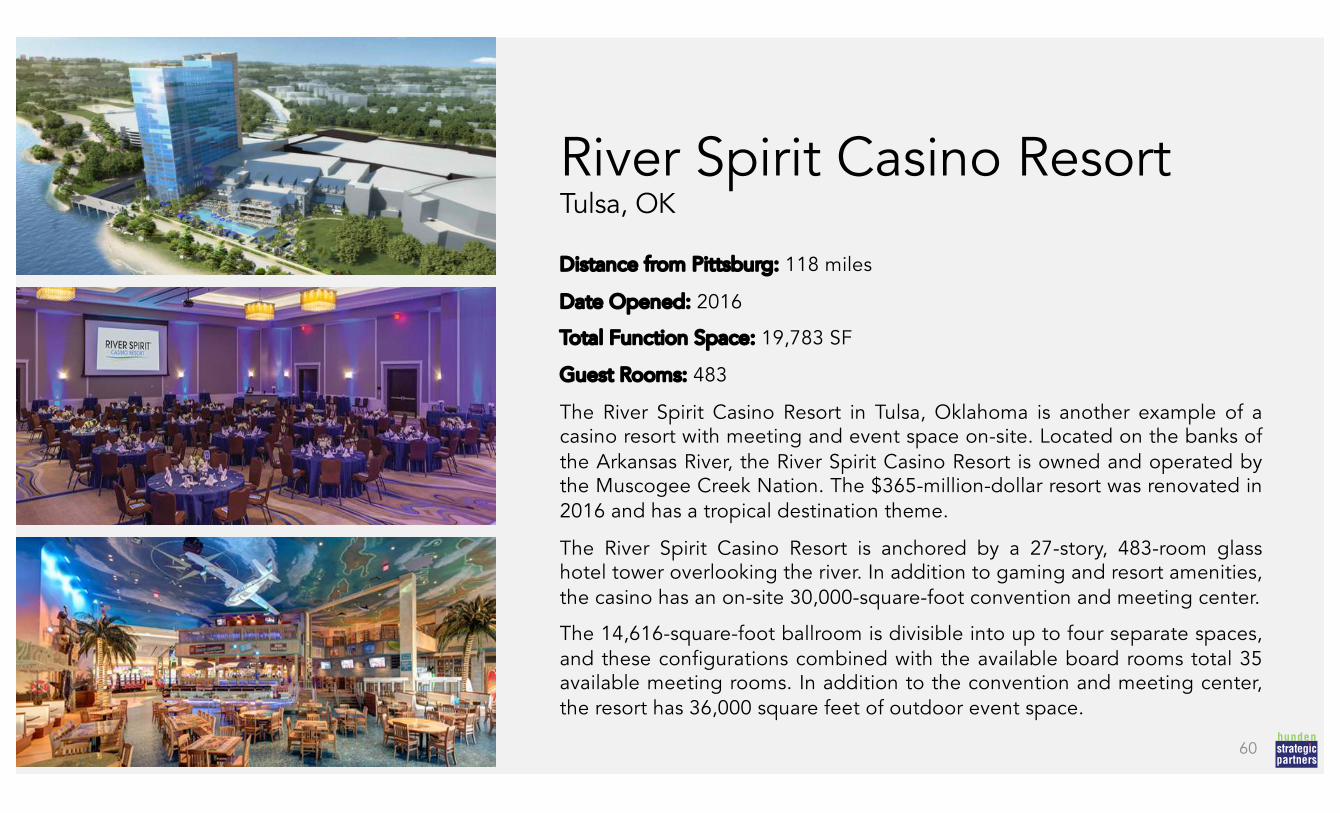
River Spirit Casino ResortTulsa, OK
Distance from Pittsburg: 118 miles
Date Opened: 2016
Total Function Space: 19,783 SF
Guest Rooms: 483
The River Spirit Casino Resort in Tulsa, Oklahoma is another example of acasino resort with meeting and event space on-site. Located on the banks ofthe Arkansas River, the River Spirit Casino Resort is owned and operated bythe Muscogee Creek Nation. The $365-million-dollar resort was renovated in2016 and has a tropical destination theme.
The River Spirit Casino Resort is anchored by a 27-story, 483-room glasshotel tower overlooking the river. In addition to gaming and resort amenities,the casino has an on-site 30,000-square-foot convention and meeting center.
The 14,616-square-foot ballroom is divisible into up to four separate spaces,and these configurations combined with the available board rooms total 35available meeting rooms. In addition to the convention and meeting center,the resort has 36,000 square feet of outdoor event space.
60

River Spirit Casino Resort
As shown in the layout above, another important component of the River SpiritCasino Resort is the Paradise Cove Theater, which hosts regional and nationalentertainment acts and sporting events. The venue can accommodate up to3,000 attendees. The theater, along with the previously mentioned amenities,mean that the River Spirit Casino is truly offering an all-inclusive experiencewhich can be attractive to meeting and event planners.
61
Hard Rock Hotel & Casino Tulsa, OK
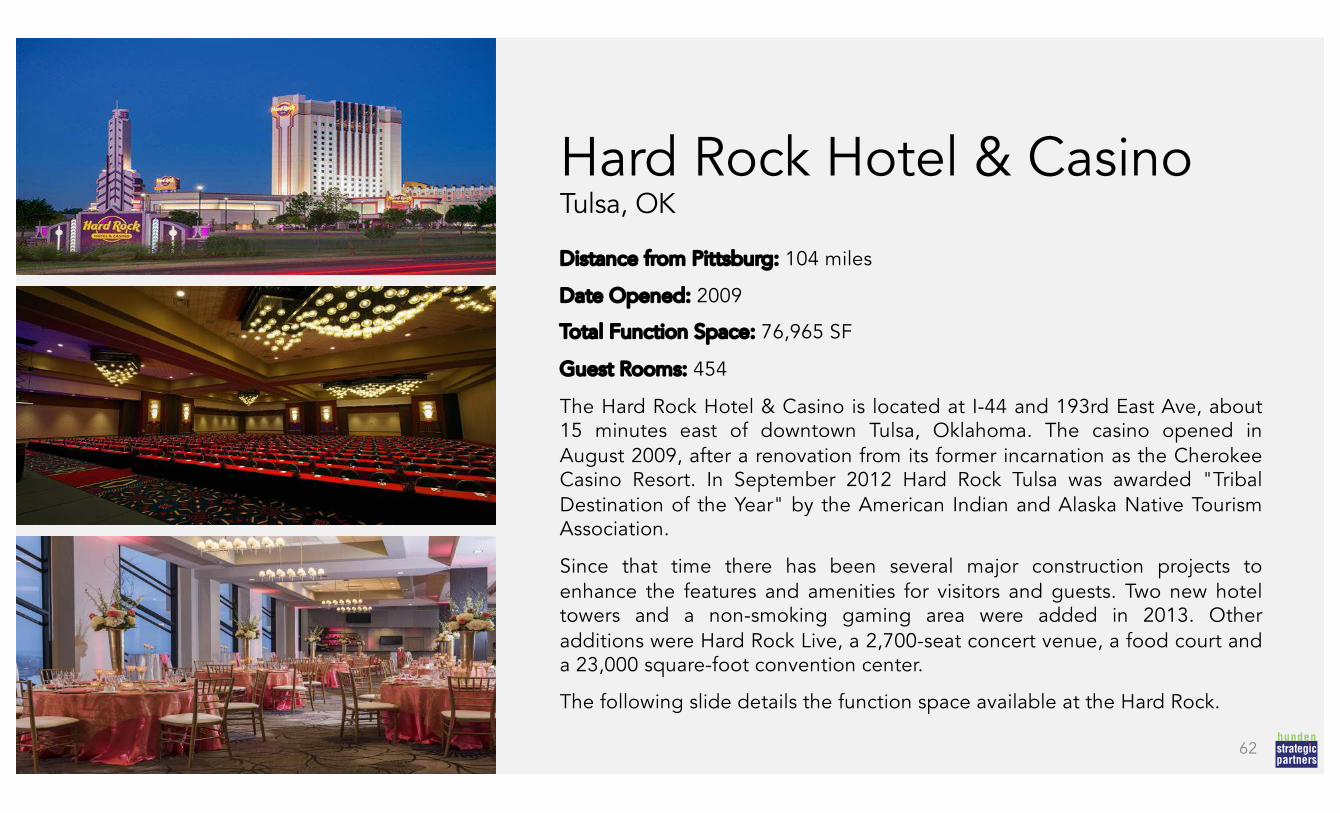
Distance from Pittsburg: 104 miles
Date Opened: 2009
Total Function Space: 76,965 SF
Guest Rooms: 454
The Hard Rock Hotel & Casino is located at I-44 and 193rd East Ave, about15 minutes east of downtown Tulsa, Oklahoma. The casino opened inAugust 2009, after a renovation from its former incarnation as the CherokeeCasino Resort. In September 2012 Hard Rock Tulsa was awarded "TribalDestination of the Year" by the American Indian and Alaska Native TourismAssociation.
Since that time there has been several major construction projects toenhance the features and amenities for visitors and guests. Two new hoteltowers and a non-smoking gaming area were added in 2013. Otheradditions were Hard Rock Live, a 2,700-seat concert venue, a food court anda 23,000 square-foot convention center.
The following slide details the function space available at the Hard Rock.
62
Hard Rock Hotel & Casino
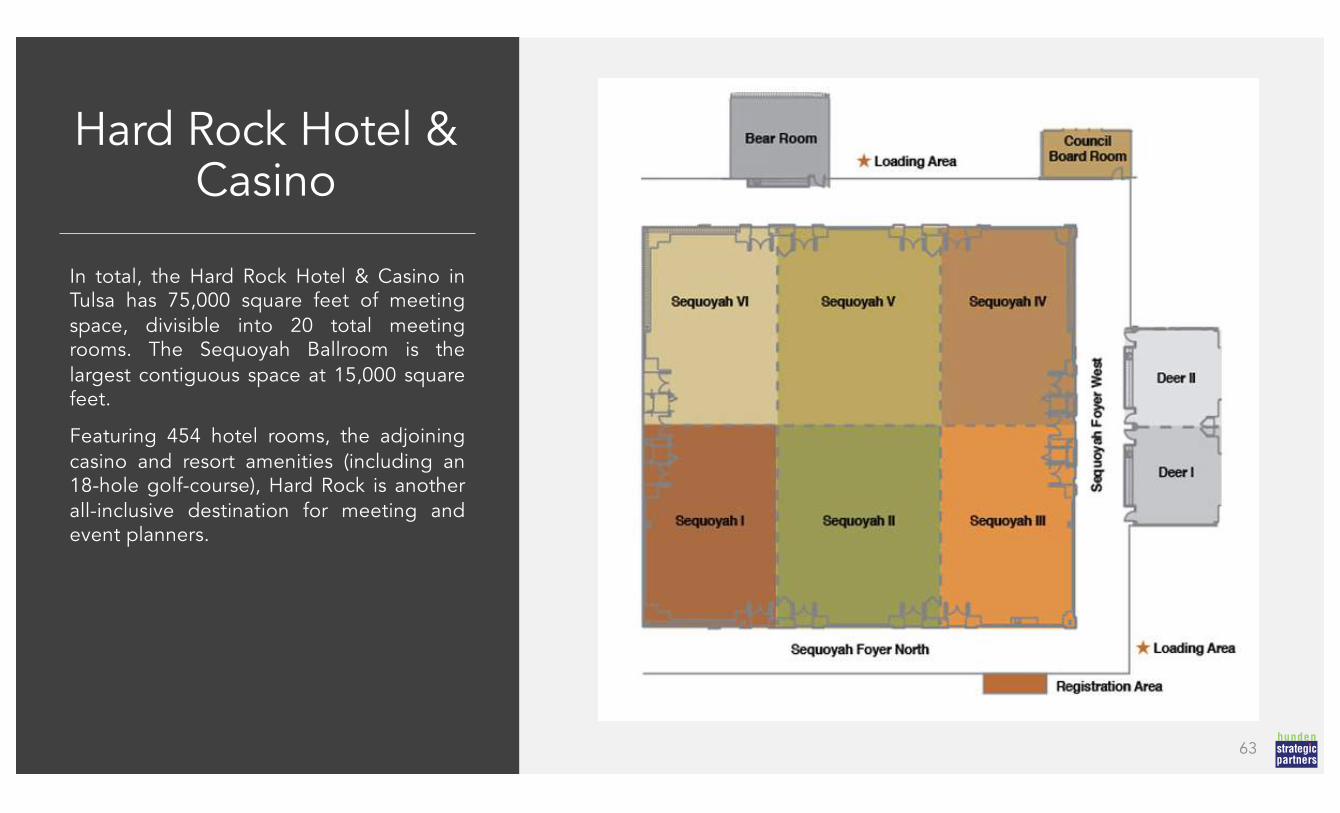
In total, the Hard Rock Hotel & Casino inTulsa has 75,000 square feet of meetingspace, divisible into 20 total meetingrooms. The Sequoyah Ballroom is thelargest contiguous space at 15,000 squarefeet.
Featuring 454 hotel rooms, the adjoiningcasino and resort amenities (including an18-hole golf-course), Hard Rock is anotherall-inclusive destination for meeting andevent planners.
63
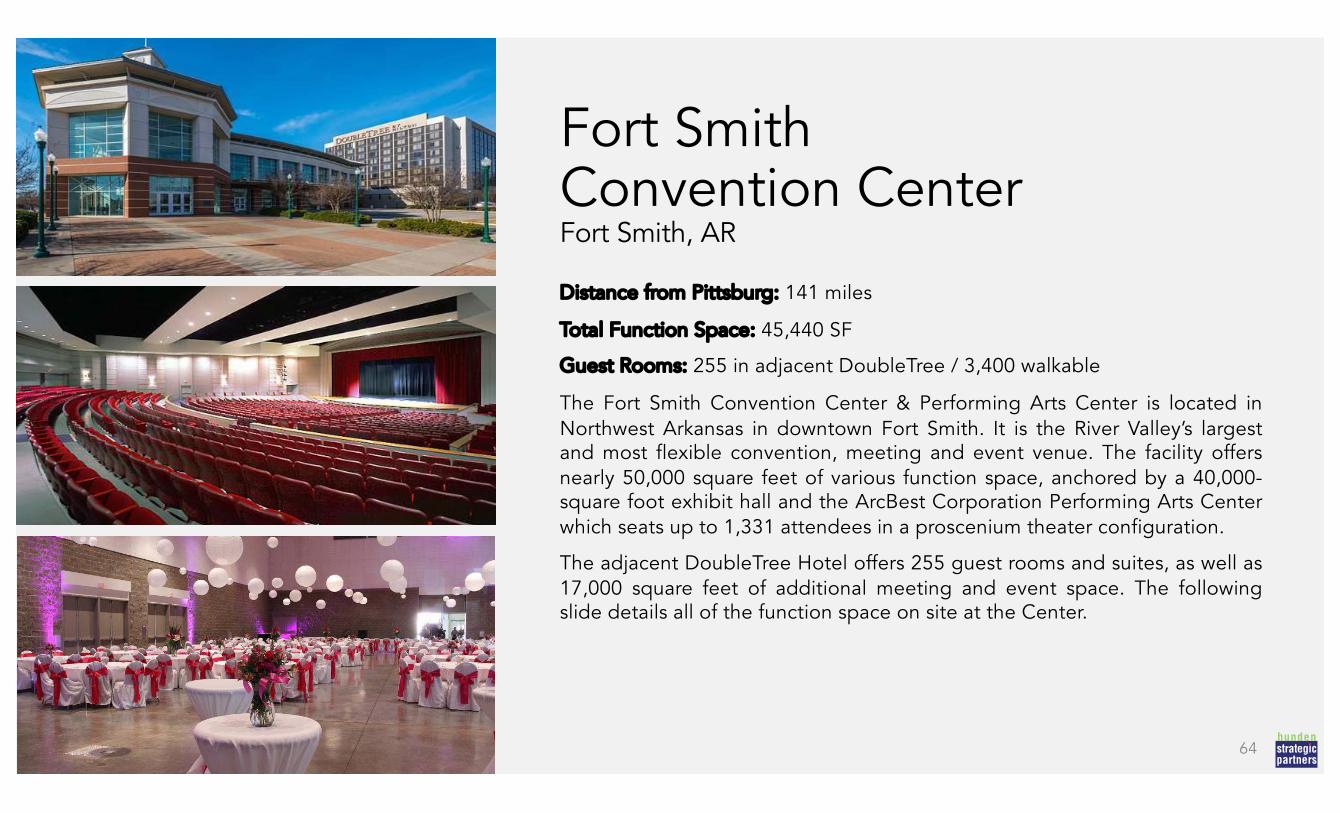
Fort SmithConvention CenterFort Smith, AR
Distance from Pittsburg: 141 miles
Total Function Space: 45,440 SF
Guest Rooms: 255 in adjacent DoubleTree / 3,400 walkable
The Fort Smith Convention Center & Performing Arts Center is located inNorthwest Arkansas in downtown Fort Smith. It is the River Valley’s largestand most flexible convention, meeting and event venue. The facility offersnearly 50,000 square feet of various function space, anchored by a 40,000-square foot exhibit hall and the ArcBest Corporation Performing Arts Centerwhich seats up to 1,331 attendees in a proscenium theater configuration.
The adjacent DoubleTree Hotel offers 255 guest rooms and suites, as well as17,000 square feet of additional meeting and event space. The followingslide details all of the function space on site at the Center.
64
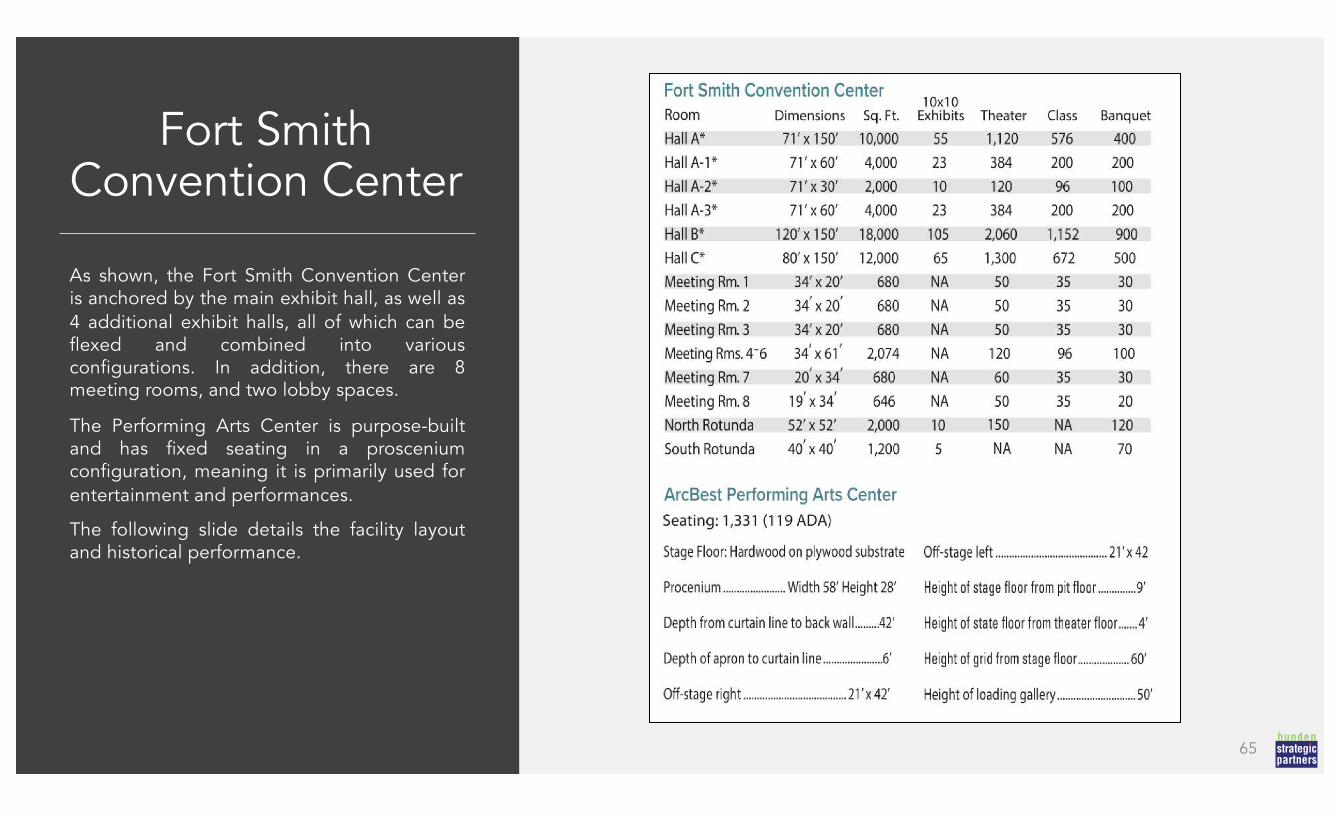
Fort Smith Convention Center
As shown, the Fort Smith Convention Centeris anchored by the main exhibit hall, as well as4 additional exhibit halls, all of which can beflexed and combined into variousconfigurations. In addition, there are 8meeting rooms, and two lobby spaces.
The Performing Arts Center is purpose-builtand has fixed seating in a prosceniumconfiguration, meaning it is primarily used forentertainment and performances.
The following slide details the facility layoutand historical performance.
65
Fort Smith Convention Center
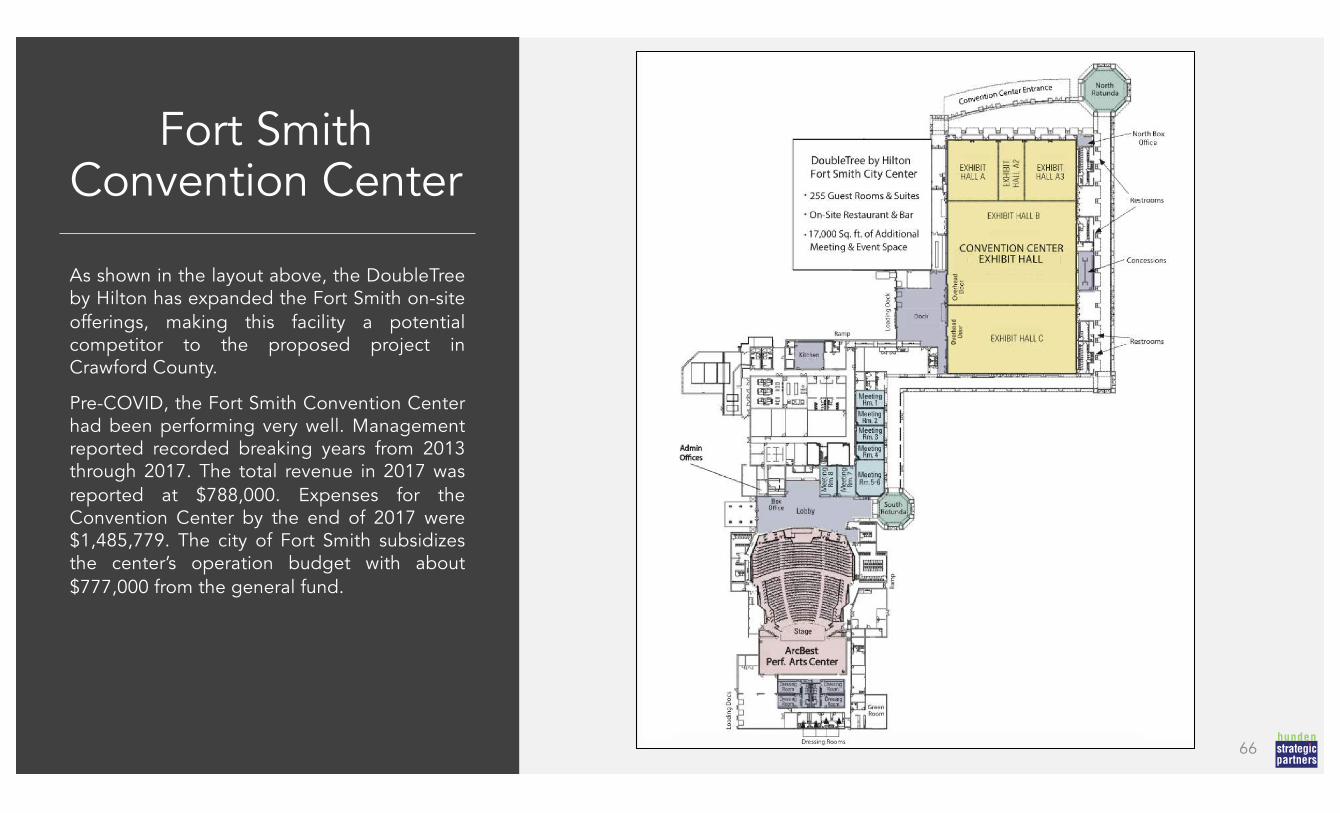
As shown in the layout above, the DoubleTreeby Hilton has expanded the Fort Smith on-siteofferings, making this facility a potentialcompetitor to the proposed project inCrawford County.
Pre-COVID, the Fort Smith Convention Centerhad been performing very well. Managementreported recorded breaking years from 2013through 2017. The total revenue in 2017 wasreported at $788,000. Expenses for theConvention Center by the end of 2017 were$1,485,779. The city of Fort Smith subsidizesthe center’s operation budget with about$777,000 from the general fund.
66
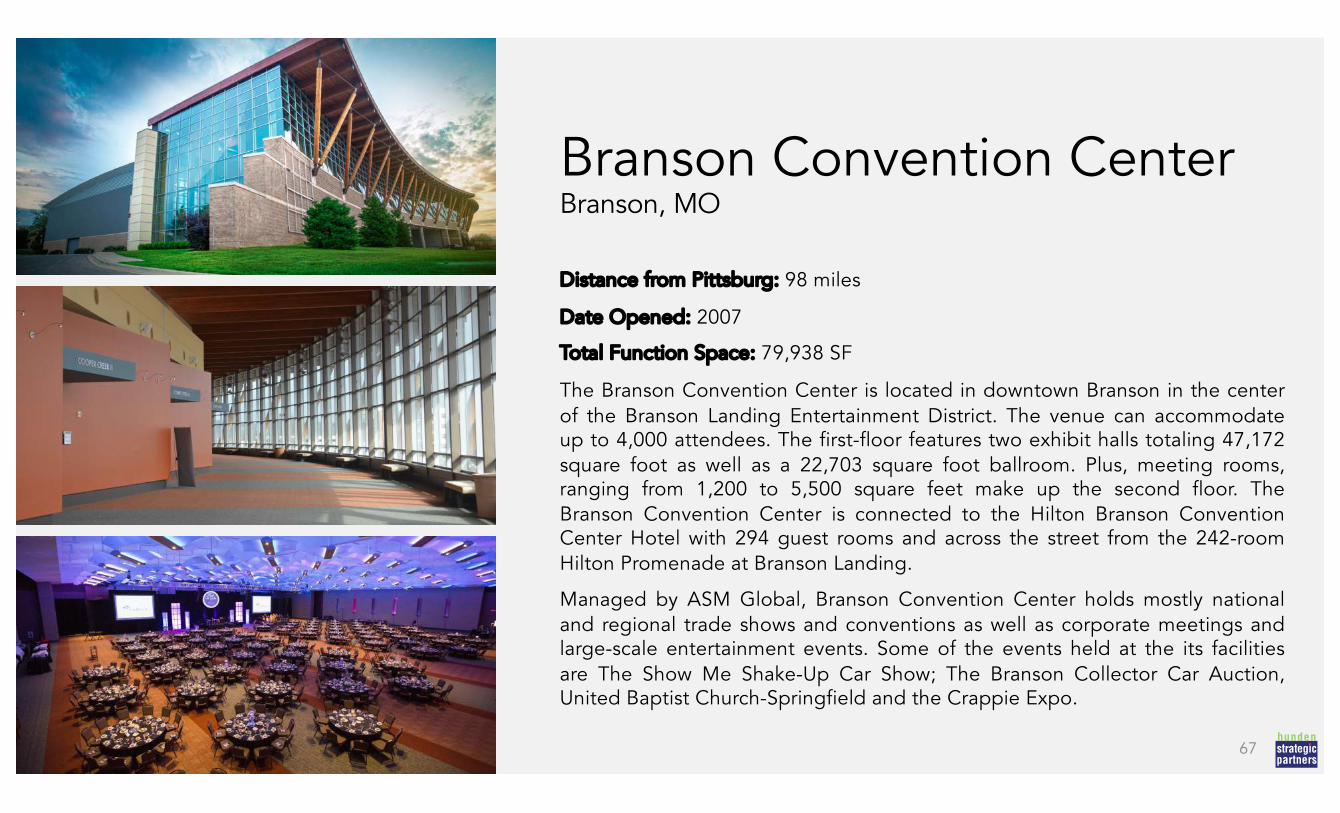
Branson Convention CenterBranson, MO
Distance from Pittsburg: 98 miles
Date Opened: 2007
Total Function Space: 79,938 SF
The Branson Convention Center is located in downtown Branson in the centerof the Branson Landing Entertainment District. The venue can accommodateup to 4,000 attendees. The first-floor features two exhibit halls totaling 47,172square foot as well as a 22,703 square foot ballroom. Plus, meeting rooms,ranging from 1,200 to 5,500 square feet make up the second floor. TheBranson Convention Center is connected to the Hilton Branson ConventionCenter Hotel with 294 guest rooms and across the street from the 242-roomHilton Promenade at Branson Landing.
Managed by ASM Global, Branson Convention Center holds mostly nationaland regional trade shows and conventions as well as corporate meetings andlarge-scale entertainment events. Some of the events held at the its facilitiesare The Show Me Shake-Up Car Show; The Branson Collector Car Auction,United Baptist Church-Springfield and the Crappie Expo.
67
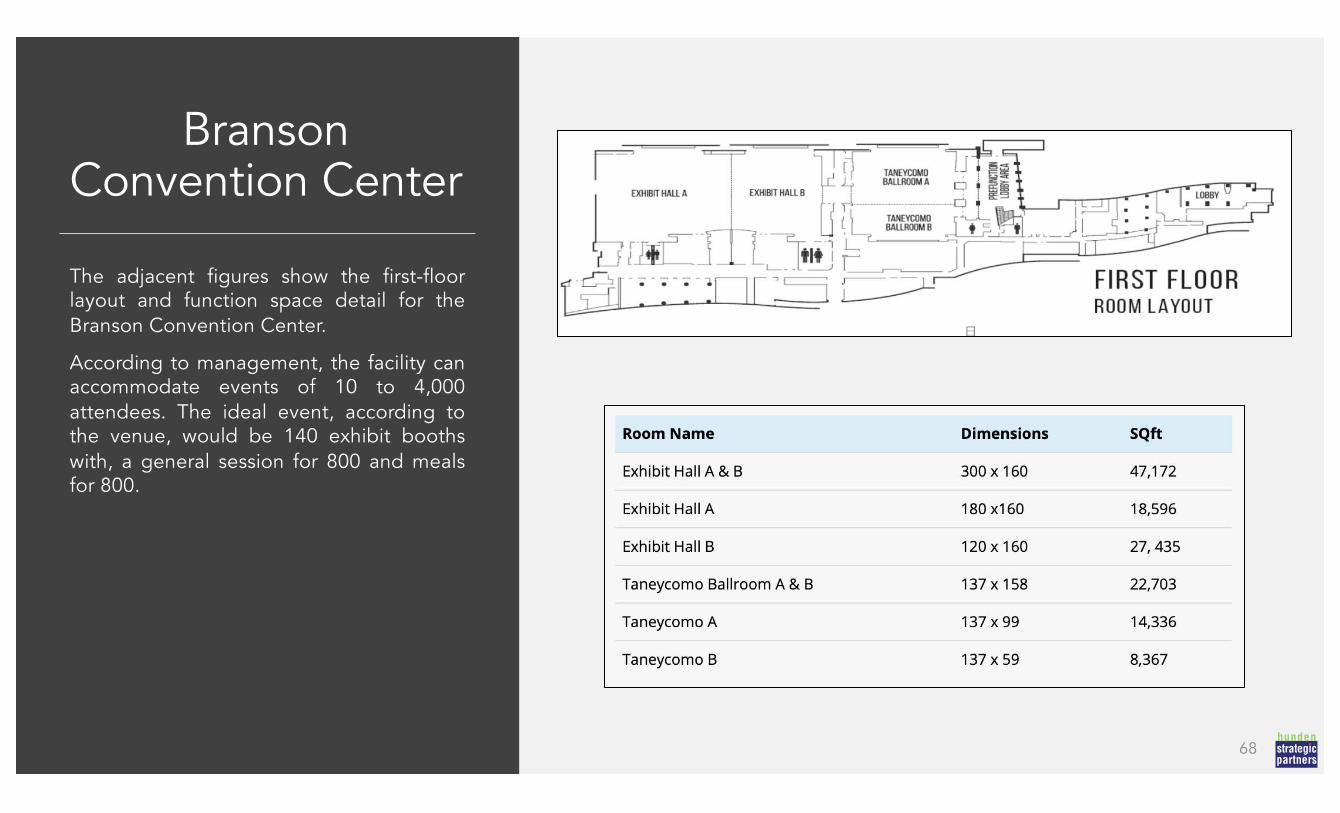
Branson Convention Center
The adjacent figures show the first-floorlayout and function space detail for theBranson Convention Center.
According to management, the facility canaccommodate events of 10 to 4,000attendees. The ideal event, according tothe venue, would be 140 exhibit boothswith, a general session for 800 and mealsfor 800.
68

Branson Convention Center
The adjacent figures show the second-floorlayout and function space detail for theBranson Convention Center.
The Branson Convention Center has operatedon a net loss since it’s opening in 2007 andrequires subsidy from the City of Branson tobreak even. Though the losses are narrowingover time, the venue is a loss leader for thecity, with an average economic impact to thecity at $16 million, according to theSpringfield Business Journal.
For 2018, officials estimated a net loss of$280,329, compared with a loss of $444,997in 2017. In 2019, losses were expected to be$264,974, according to the board’s agenda.
69
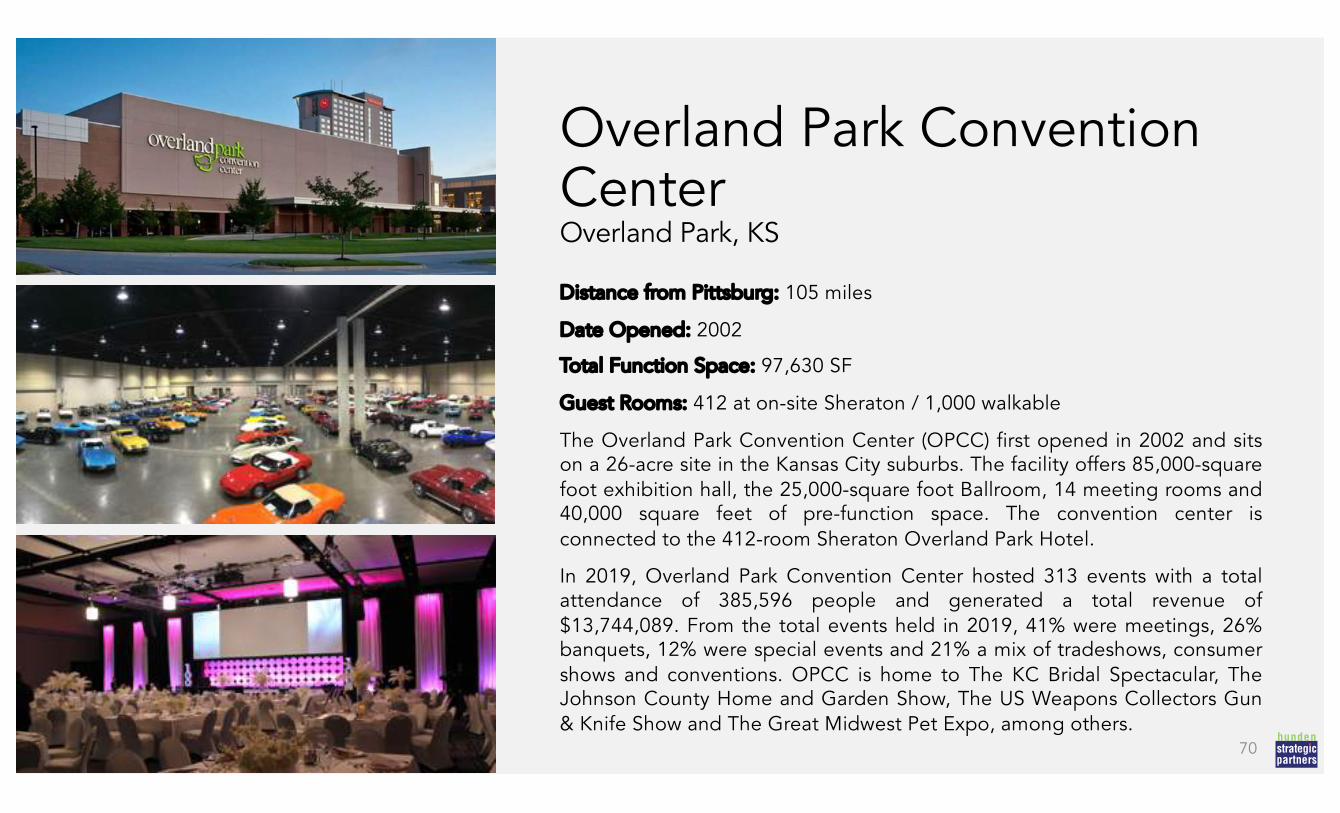
Overland Park Convention CenterOverland Park, KS
Distance from Pittsburg: 105 miles
Date Opened: 2002
Total Function Space: 97,630 SF
Guest Rooms: 412 at on-site Sheraton / 1,000 walkable
The Overland Park Convention Center (OPCC) first opened in 2002 and sitson a 26-acre site in the Kansas City suburbs. The facility offers 85,000-squarefoot exhibition hall, the 25,000-square foot Ballroom, 14 meeting rooms and40,000 square feet of pre-function space. The convention center isconnected to the 412-room Sheraton Overland Park Hotel.
In 2019, Overland Park Convention Center hosted 313 events with a totalattendance of 385,596 people and generated a total revenue of$13,744,089. From the total events held in 2019, 41% were meetings, 26%banquets, 12% were special events and 21% a mix of tradeshows, consumershows and conventions. OPCC is home to The KC Bridal Spectacular, TheJohnson County Home and Garden Show, The US Weapons Collectors Gun& Knife Show and The Great Midwest Pet Expo, among others.
70
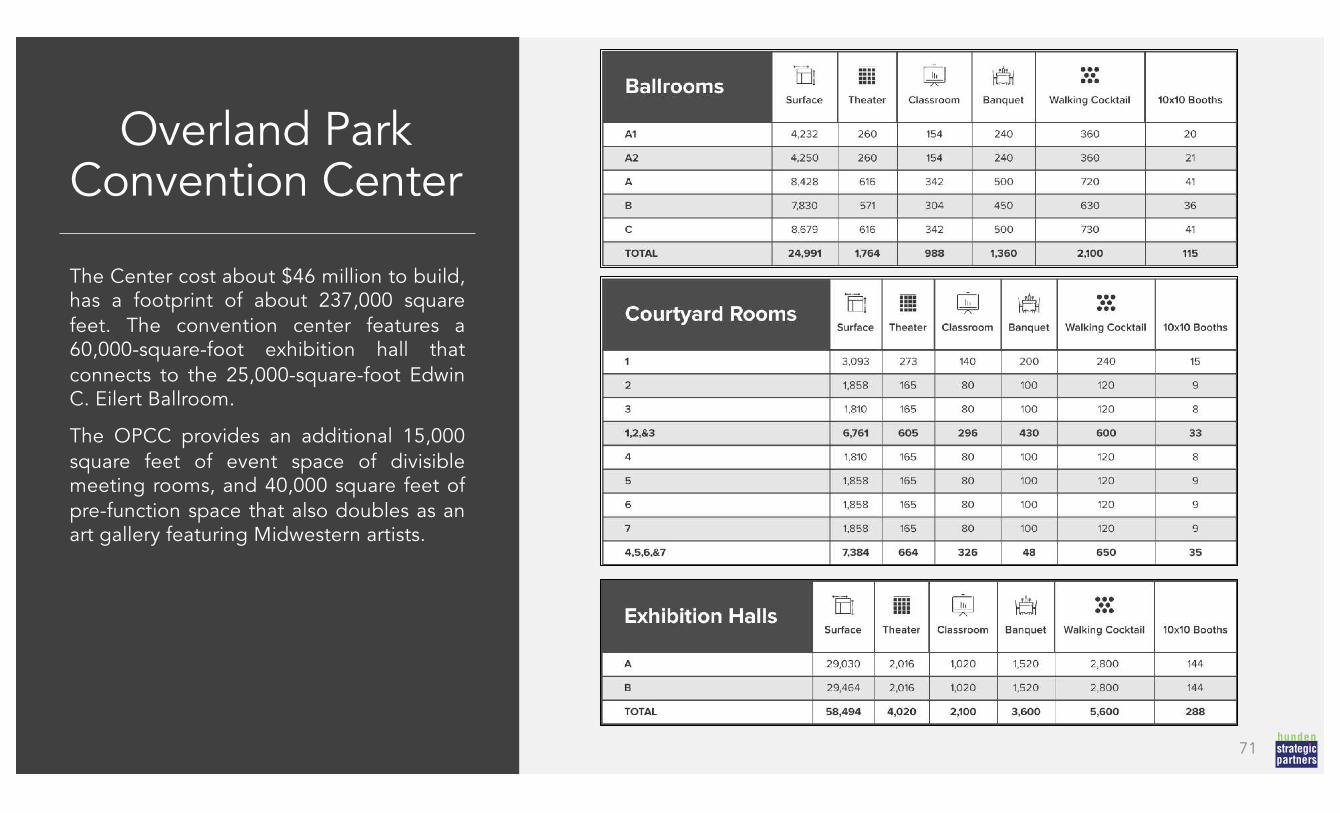
Overland Park Convention Center
The Center cost about $46 million to build,has a footprint of about 237,000 squarefeet. The convention center features a60,000-square-foot exhibition hall thatconnects to the 25,000-square-foot EdwinC. Eilert Ballroom.
The OPCC provides an additional 15,000square feet of event space of divisiblemeeting rooms, and 40,000 square feet ofpre-function space that also doubles as anart gallery featuring Midwestern artists.
71

Overland Park Convention Center
The Overland Park Convention Centerperforms well for a facility of its size and hadits most successful year to date in 2019,before the COVID-19 pandemic, with a totalrevenue of over $13.7 million.
Notable events hosted in 2019 includeCerener Devcon, The International Lineman’sRodeo, the US Youth Soccer Association, andthe Associated Wholesale Grocers Incconference.
The adjacent tables detail historicalperformance for the venue.
72
Overland Park Convention Center Operating IncomeTypical Year
Operating Revenue $11,014,000Operating Expense $10,345,000Operating Income $669,000
Source: Overland Park Convention Center
2019 Actuals
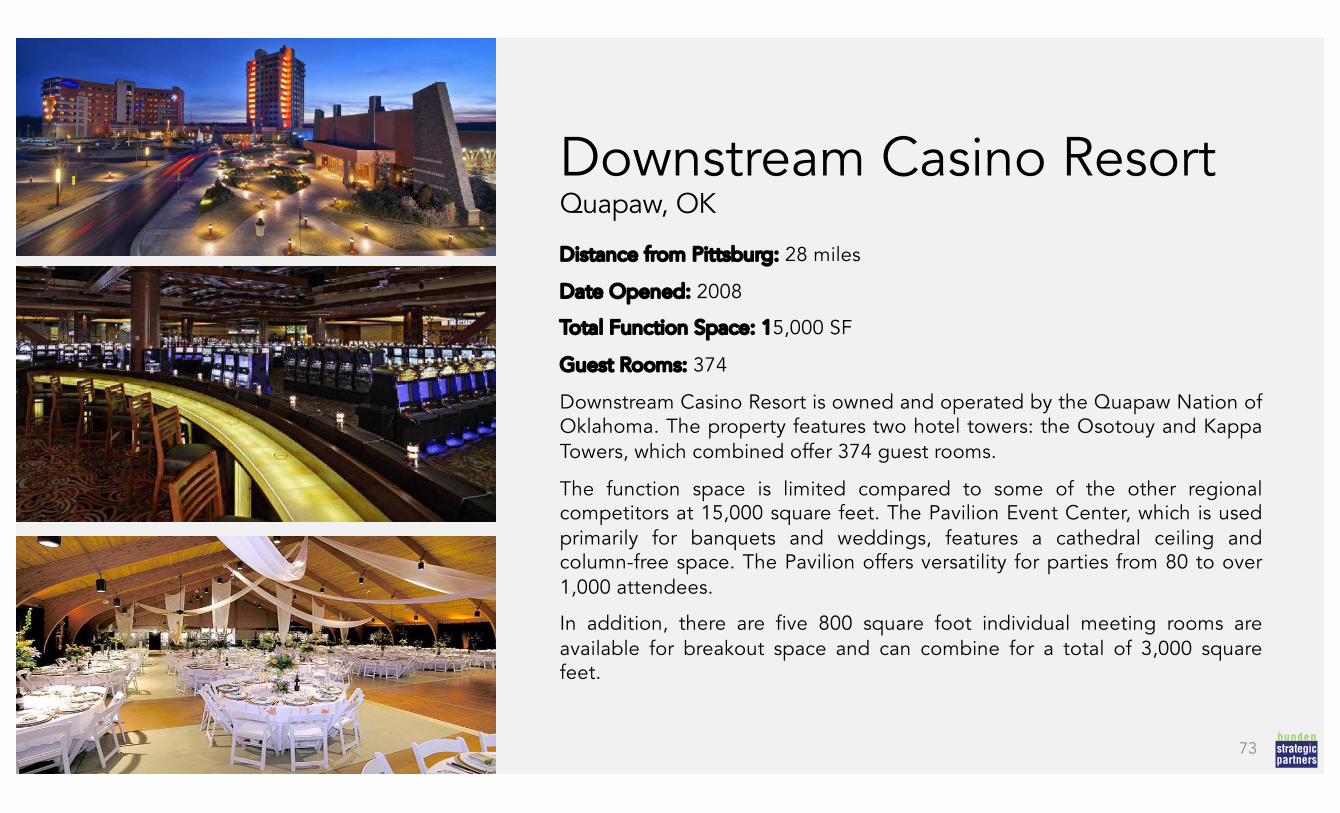
Downstream Casino ResortQuapaw, OK
Distance from Pittsburg: 28 miles
Date Opened: 2008
Total Function Space: 15,000 SF
Guest Rooms: 374
Downstream Casino Resort is owned and operated by the Quapaw Nation ofOklahoma. The property features two hotel towers: the Osotouy and KappaTowers, which combined offer 374 guest rooms.
The function space is limited compared to some of the other regionalcompetitors at 15,000 square feet. The Pavilion Event Center, which is usedprimarily for banquets and weddings, features a cathedral ceiling andcolumn-free space. The Pavilion offers versatility for parties from 80 to over1,000 attendees.
In addition, there are five 800 square foot individual meeting rooms areavailable for breakout space and can combine for a total of 3,000 squarefeet.
73

Stakeholder and User Group Interviews
74
League of Kansas MunicipalitiesHSP interviewed representatives at the League of Kansas Municipalities to learn about their annual events andconference center needs. This interview indicated the following:
§ The group has an annual conference that occurs in October
§ The conference rotates between Wichita, Topeka and Overland Park
§ 60,000 square feet of exhibit space is needed
§ Attendance is 400 – 500 city officials and 100 – 125 vendors
§ Meal space and 5 -6 breakout rooms are also expected
§ The group also hosts three smaller conferences of 200 people or less including The Mayor’s Association (April), CityAttorney Association (June), City Manager Group (November – December)
§ These events do not require any exhibit space
§ Used Pittsburg State in the past, but had to adapt and use the indoor track facility
§ The League of Kansas Municipalities would consider Pittsburg for more conferences, especially if the spaces offeredimproved
75
Kansas Crossing CasinoHSP interviewed representatives at the Kansas Crossing Casino to learn about their events spaces and the need for a newconference center in the community. This interview indicated the following:
§ The Corral is currently the largest event space at the casino
§ 5,900 Square feet
§ Capacity of 250 banquet-style
§ Capacity of roughly 630 for a standing room concert
§ Roughly 10,000 square feet of additional meeting space with breakout rooms would be ideal
§ The Corral primarily hosts concerts, but is limited in terms of hosting corporate meetings and events
§ The casino is a significant regional draw with good access, quality hotel space in the Hampton Inn
§ The casino has averaged roughly $20 per tickets for indoor and outdoor concert events
§ Dodge City and Mulvane – both have casinos with attached convention centers that offer the capacity to host largerevents
§ Sales department leads suggest that there is an opportunity for corporate business that is not being captured inPittsburg
§ Nearly 60 independent bus tour organizers in Kansas
§ Over 1,000 corporate and special events in the regional circuit per Tour Tracker76
Jake’s FireworksHSP interviewed representatives at Jake’s Fireworks to learn about their annual events and conference center needs. Thisinterview indicated the following:
§ In addition to retail stores, Jake’s Fireworks host shoot-off events for potential wholesale clients. These events includeinviting guests, fireworks shows, dining and more
§ One smaller shoot-off event occurs in the fall and a larger event occurs each year in April. The large event has broughtbetween 1,500 - 2,000 people to Pittsburg
§ Securing a location that is large enough to accommodate their needs has been difficult in the past
§ In addition to indoor spaces, outdoor space is also needed to set up bleachers, food trucks and more for potentialclients. The ideal space would include:
§ Prep kitchen
§ Conference room
§ Restrooms
§ A large parking lot
§ Jake’s Fireworks believes that they can expand their event if the right space is available
§ Additionally, ownership at Jake’s Fireworks has expressed interest in partnering on the new space and would be willingto set up a call with the City and County down the road
77

WatcoHSP interviewed representatives at Watco, one of Pittsburg’s largest employers, to learn about their annual events andconference center needs. This interview indicated the following:
§ Watco currently has about 200 employees located in Pittsburg and brings various clients to the city from around thecountry
§ Watco has their own meeting facilities at their corporate office where they host the majority of their events andmeetings
§ The group would likely use a new conference center sporadically for events that cannot be accommodate at theirheadquarters
78
Chapter 5: Hotel Market Analysis
Crawford County Lodging Summary
80
HSP, using data from Smith TravelResearch, identified the lodging supplyin Crawford County. This supply includes8 hotels, all located in Pittsburg,equating to 589 rooms. The largestpercentage of room nights comes fromupper midscale properties, closelyfollowed by independent properties.
Lodging Summary - Crawford County
Chainscale Rooms% of Total
Rooms HotelsRooms per
HotelAvg Opening
YearAvg Age in Years
Luxury -- -- -- -- -- --
Upper Upscale -- -- -- -- -- --
Upscale -- -- -- -- -- --
Upper Midscale 342 58% 4 86 Apr-11 9
Midscale -- -- -- -- -- --
Economy 64 11% 1 64 Mar-78 43
Independent 183 31% 3 61 n/a n/a
Total/Average 589 100% 8 70 Sep-94 26
Source: Smith Travel Research, Hunden Strategic Partners
Local Market Analysis
81

Local HotelCompetitive Set
82
HSP identified eight hotels in Pittsburg aspart of the local hotel competitive set.
Six of these hotel properties are locatednorth of Pittsburg on Interstate 160, nearthe site dubbed the “North HotelCluster”. There are another two hotels,with a total of approximately 200 keys,located south of Pittsburg on Interstate160.
All branded hotels in the competitive setare of upper-mid chain scale, except forthe Super 8 which is economy. Theremaining three hotels are independentlyowned and operated.
Local HotelCompetitive Set
HSP identified the Pittsburg local hotel competitive set by conducting marketresearch and interviewing local hoteliers. HSP believes that this competitiveset best reflects the local Pittsburg hotel market and its performance. Thiscompetitive set contains eight hotels within five miles of the MemorialAuditorium, ranging from 64 to 123 keys.
Pittsburg Hotel Competitive Set
Property # of Rooms Chainscale Open DateHoliday Lodge 22 Indep N/ALa Quinta Inn & Suites Pittsburg 77 Upper Mid Dec-17Hampton Inn & Suites Pittsburg Kansas Crossing 123 Upper Mid Apr-17Holiday Inn Express & Suites Pittsburg 72 Upper Mid May-09Comfort Inn & Suites Pittsburg 70 Upper Mid Aug-00Super 8 Pittsburg 64 Economy Jul-87Regency Inn & Suites 61 Indep Jun-77Lamplighter Inn & Suites 100 Indep Oct-69Total/Average 589 -- Feb-97
Source: Smith Travel Research
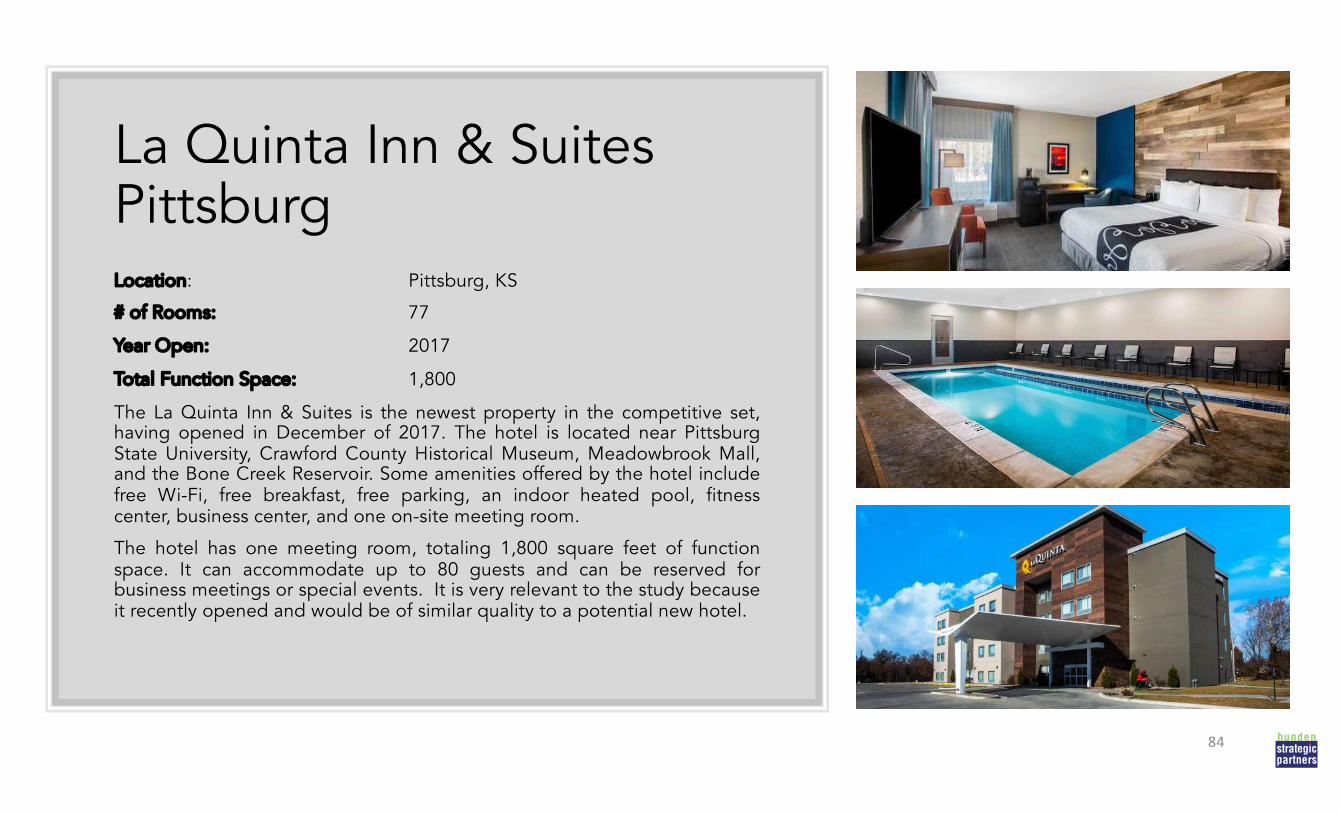
La Quinta Inn & Suites PittsburgLocation: Pittsburg, KS
# of Rooms: 77
Year Open: 2017
Total Function Space: 1,800
The La Quinta Inn & Suites is the newest property in the competitive set,having opened in December of 2017. The hotel is located near PittsburgState University, Crawford County Historical Museum, Meadowbrook Mall,and the Bone Creek Reservoir. Some amenities offered by the hotel includefree Wi-Fi, free breakfast, free parking, an indoor heated pool, fitnesscenter, business center, and one on-site meeting room.
The hotel has one meeting room, totaling 1,800 square feet of functionspace. It can accommodate up to 80 guests and can be reserved forbusiness meetings or special events. It is very relevant to the study becauseit recently opened and would be of similar quality to a potential new hotel.
84
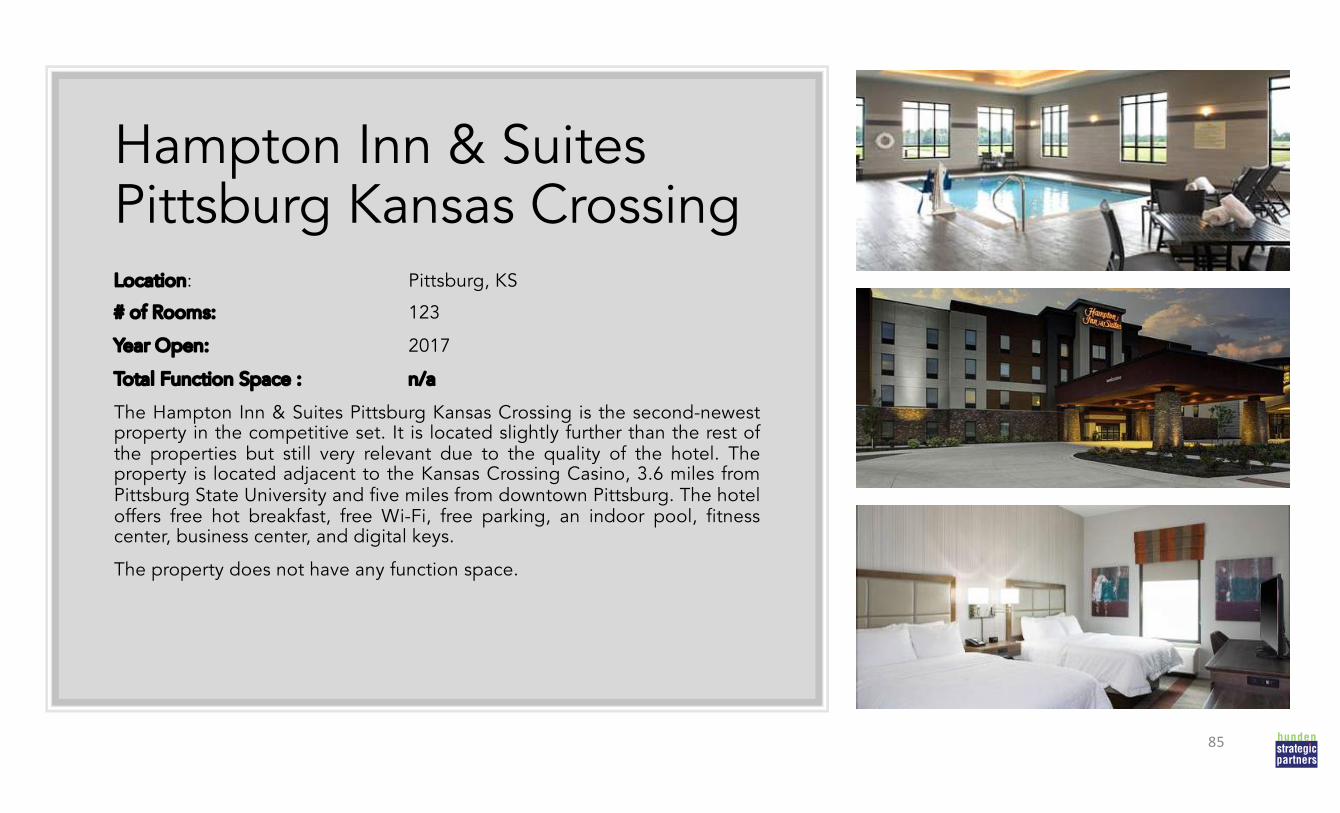
Hampton Inn & Suites Pittsburg Kansas CrossingLocation: Pittsburg, KS
# of Rooms: 123
Year Open: 2017
Total Function Space : n/a
The Hampton Inn & Suites Pittsburg Kansas Crossing is the second-newestproperty in the competitive set. It is located slightly further than the rest ofthe properties but still very relevant due to the quality of the hotel. Theproperty is located adjacent to the Kansas Crossing Casino, 3.6 miles fromPittsburg State University and five miles from downtown Pittsburg. The hoteloffers free hot breakfast, free Wi-Fi, free parking, an indoor pool, fitnesscenter, business center, and digital keys.
The property does not have any function space.
85
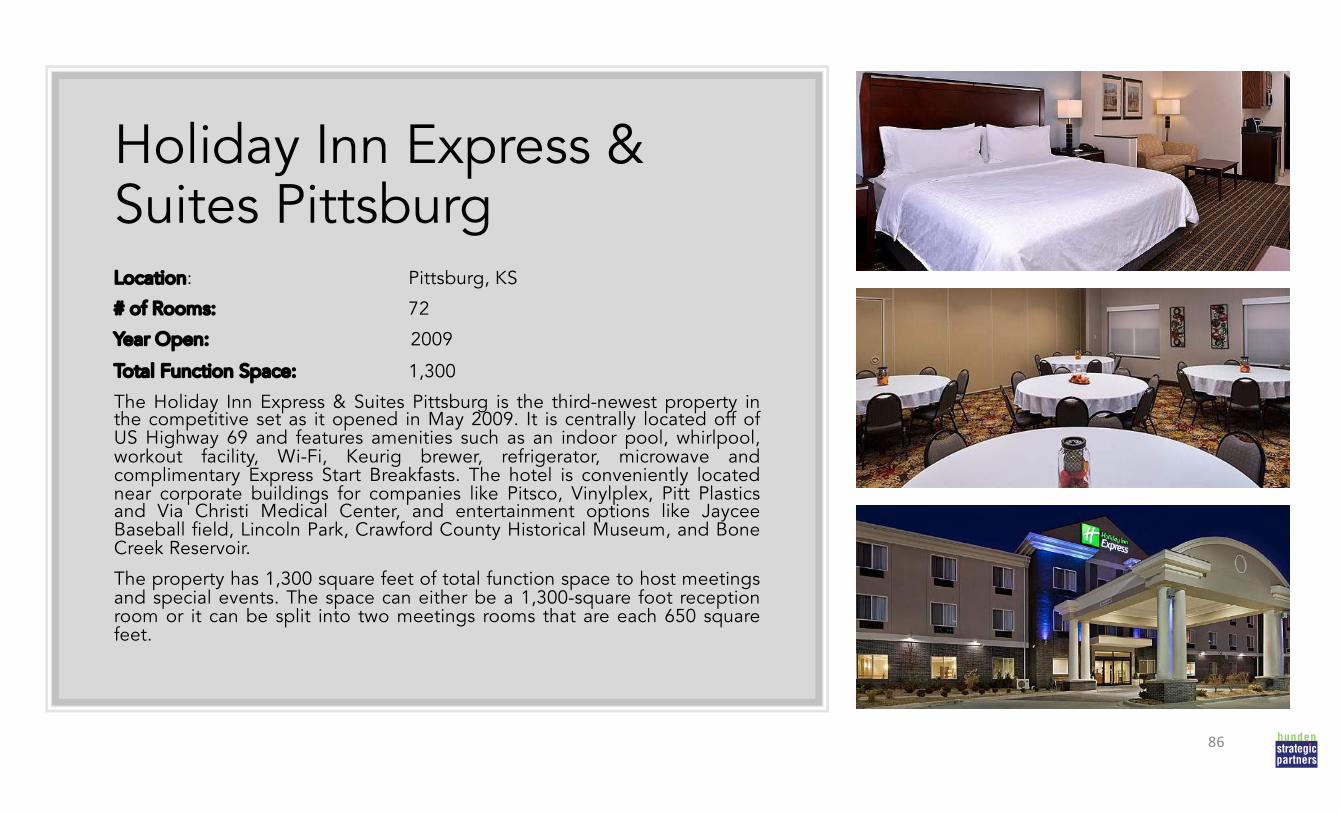
Holiday Inn Express & Suites PittsburgLocation: Pittsburg, KS
# of Rooms: 72
Year Open: 2009
Total Function Space: 1,300
The Holiday Inn Express & Suites Pittsburg is the third-newest property inthe competitive set as it opened in May 2009. It is centrally located off ofUS Highway 69 and features amenities such as an indoor pool, whirlpool,workout facility, Wi-Fi, Keurig brewer, refrigerator, microwave andcomplimentary Express Start Breakfasts. The hotel is conveniently locatednear corporate buildings for companies like Pitsco, Vinylplex, Pitt Plasticsand Via Christi Medical Center, and entertainment options like JayceeBaseball field, Lincoln Park, Crawford County Historical Museum, and BoneCreek Reservoir.
The property has 1,300 square feet of total function space to host meetingsand special events. The space can either be a 1,300-square foot receptionroom or it can be split into two meetings rooms that are each 650 squarefeet.
86
Competitive Hotel Performance
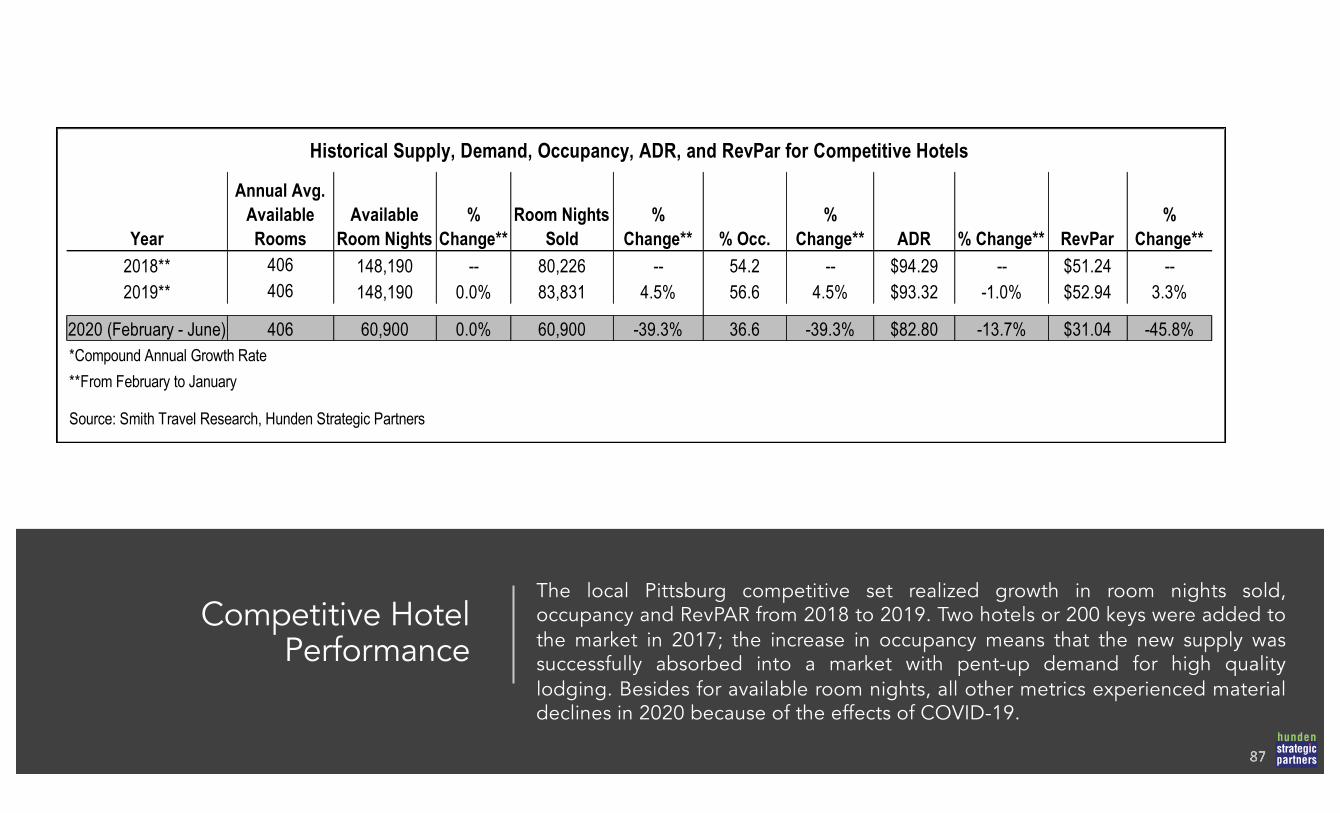
The local Pittsburg competitive set realized growth in room nights sold,occupancy and RevPAR from 2018 to 2019. Two hotels or 200 keys were added tothe market in 2017; the increase in occupancy means that the new supply wassuccessfully absorbed into a market with pent-up demand for high qualitylodging. Besides for available room nights, all other metrics experienced materialdeclines in 2020 because of the effects of COVID-19.
Historical Supply, Demand, Occupancy, ADR, and RevPar for Competitive Hotels
Year
Annual Avg. Available Rooms
Available Room Nights
% Change**
Room Nights Sold
% Change** % Occ.
% Change** ADR % Change** RevPar
% Change**
2018** 406 148,190 -- 80,226 -- 54.2 -- $94.29 -- $51.24 --2019** 406 148,190 0.0% 83,831 4.5% 56.6 4.5% $93.32 -1.0% $52.94 3.3%
2020 (February - June) 406 60,900 0.0% 60,900 -39.3% 36.6 -39.3% $82.80 -13.7% $31.04 -45.8%*Compound Annual Growth Rate**From February to January
Source: Smith Travel Research, Hunden Strategic Partners
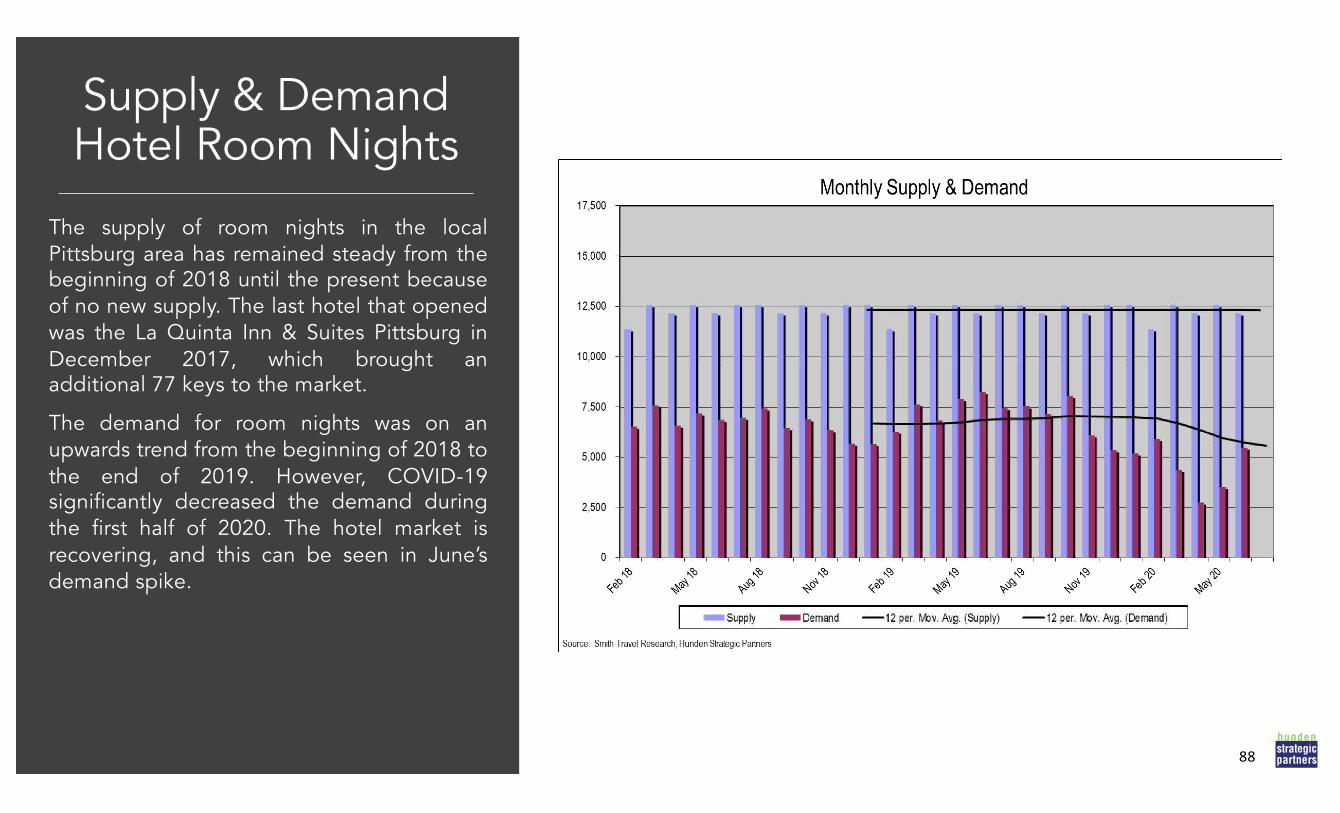
Supply & DemandHotel Room Nights
88
The supply of room nights in the localPittsburg area has remained steady from thebeginning of 2018 until the present becauseof no new supply. The last hotel that openedwas the La Quinta Inn & Suites Pittsburg inDecember 2017, which brought anadditional 77 keys to the market.
The demand for room nights was on anupwards trend from the beginning of 2018 tothe end of 2019. However, COVID-19significantly decreased the demand duringthe first half of 2020. The hotel market isrecovering, and this can be seen in June’sdemand spike.

Room Revenue Change
89
Any data point greater than zero is apositive indicator for the competitive set.
The year-over-year room revenue changefor the competitive set in Pittsburg wasrelatively stable from February 2019 toJanuary 2020. When COVID-19 causedcities to shutdown, room revenuesexperienced harsh declines. In April 2020,the Pittsburg competitive set room revenuedecreased approximately 70% year-over-year. The trend reversal since this pointshows that the hotel market is beginning torecover as hotels and cities open again.
Revenue per Available Room
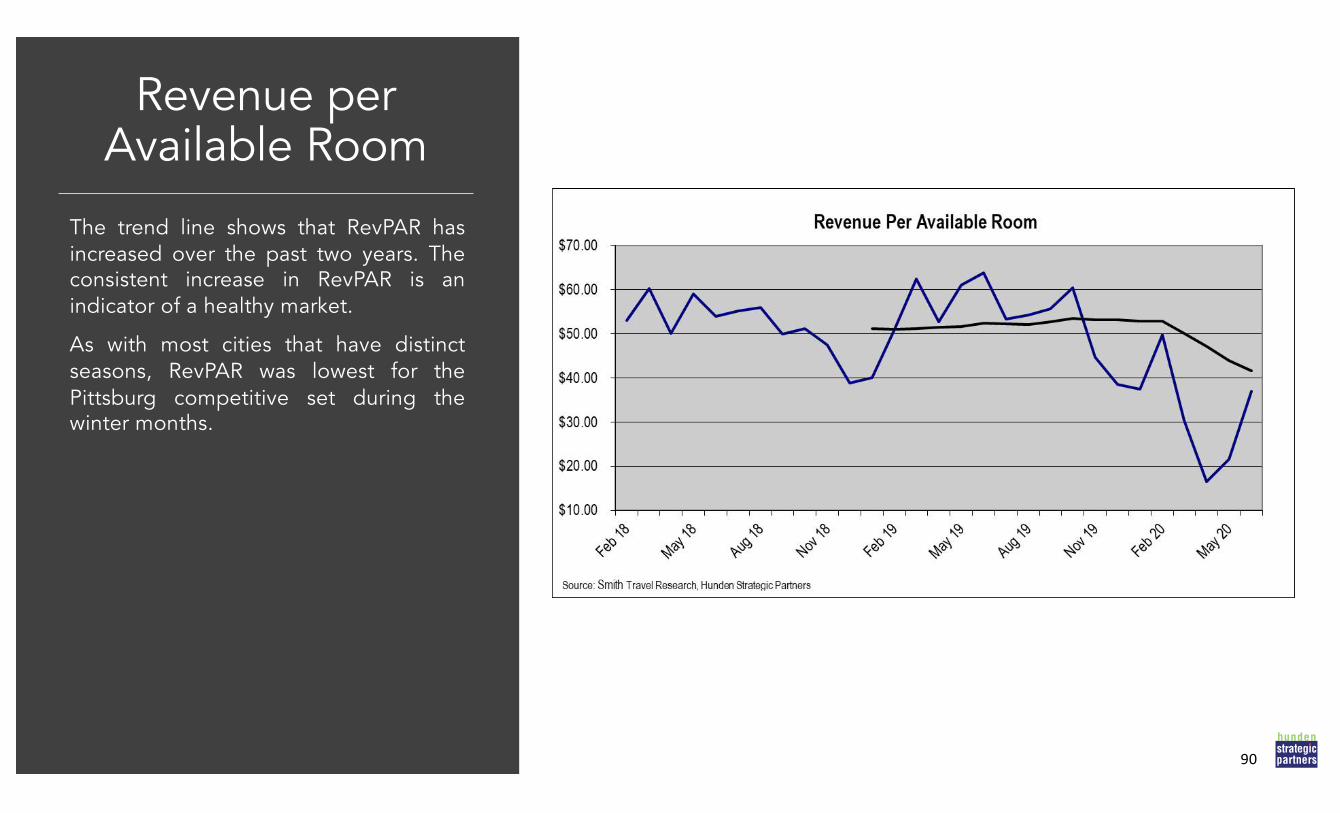
90
The trend line shows that RevPAR hasincreased over the past two years. Theconsistent increase in RevPAR is anindicator of a healthy market.
As with most cities that have distinctseasons, RevPAR was lowest for thePittsburg competitive set during thewinter months.
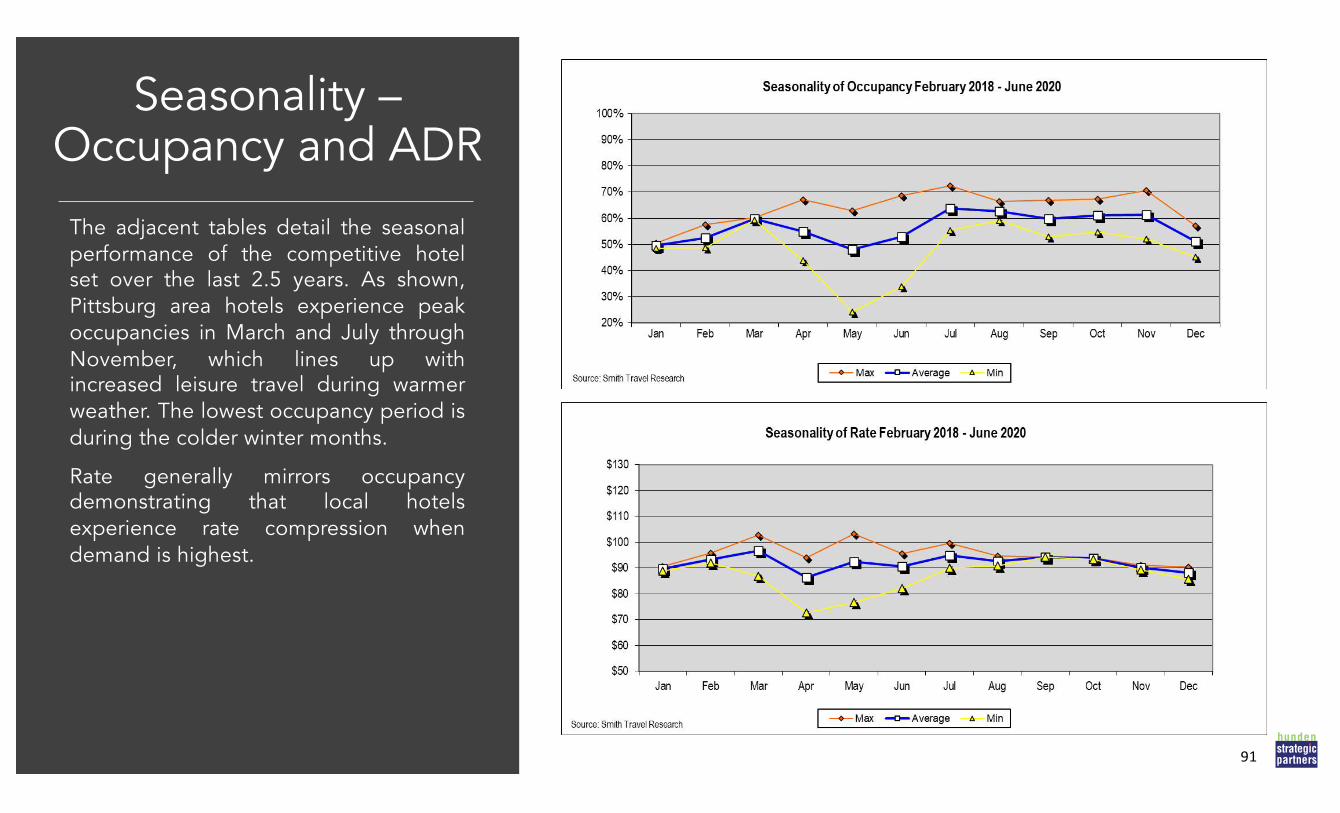
Seasonality –Occupancy and ADR
91
The adjacent tables detail the seasonalperformance of the competitive hotelset over the last 2.5 years. As shown,Pittsburg area hotels experience peakoccupancies in March and July throughNovember, which lines up withincreased leisure travel during warmerweather. The lowest occupancy period isduring the colder winter months.
Rate generally mirrors occupancydemonstrating that local hotelsexperience rate compression whendemand is highest.
Day of Week –Occupancy and ADR
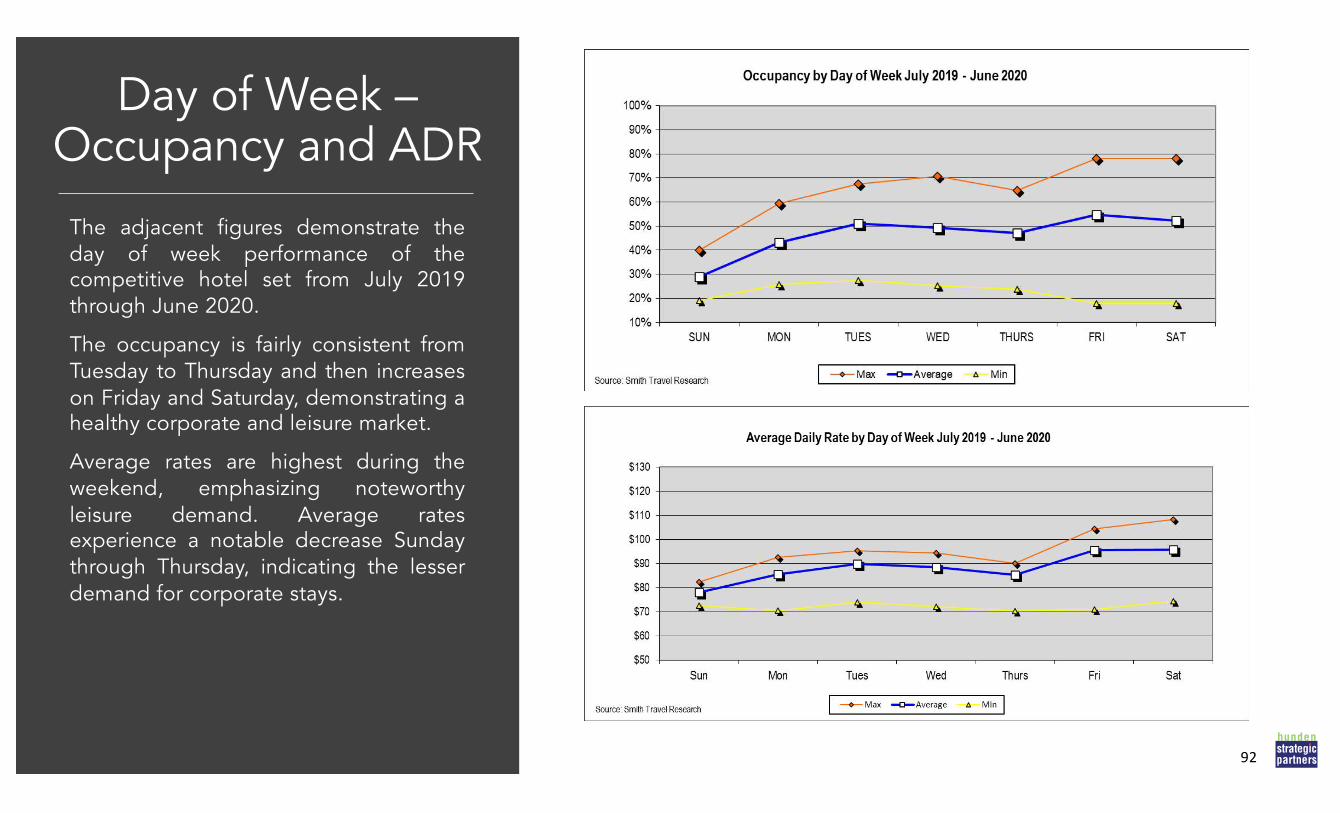
92
The adjacent figures demonstrate theday of week performance of thecompetitive hotel set from July 2019through June 2020.
The occupancy is fairly consistent fromTuesday to Thursday and then increaseson Friday and Saturday, demonstrating ahealthy corporate and leisure market.
Average rates are highest during theweekend, emphasizing noteworthyleisure demand. Average ratesexperience a notable decrease Sundaythrough Thursday, indicating the lesserdemand for corporate stays.
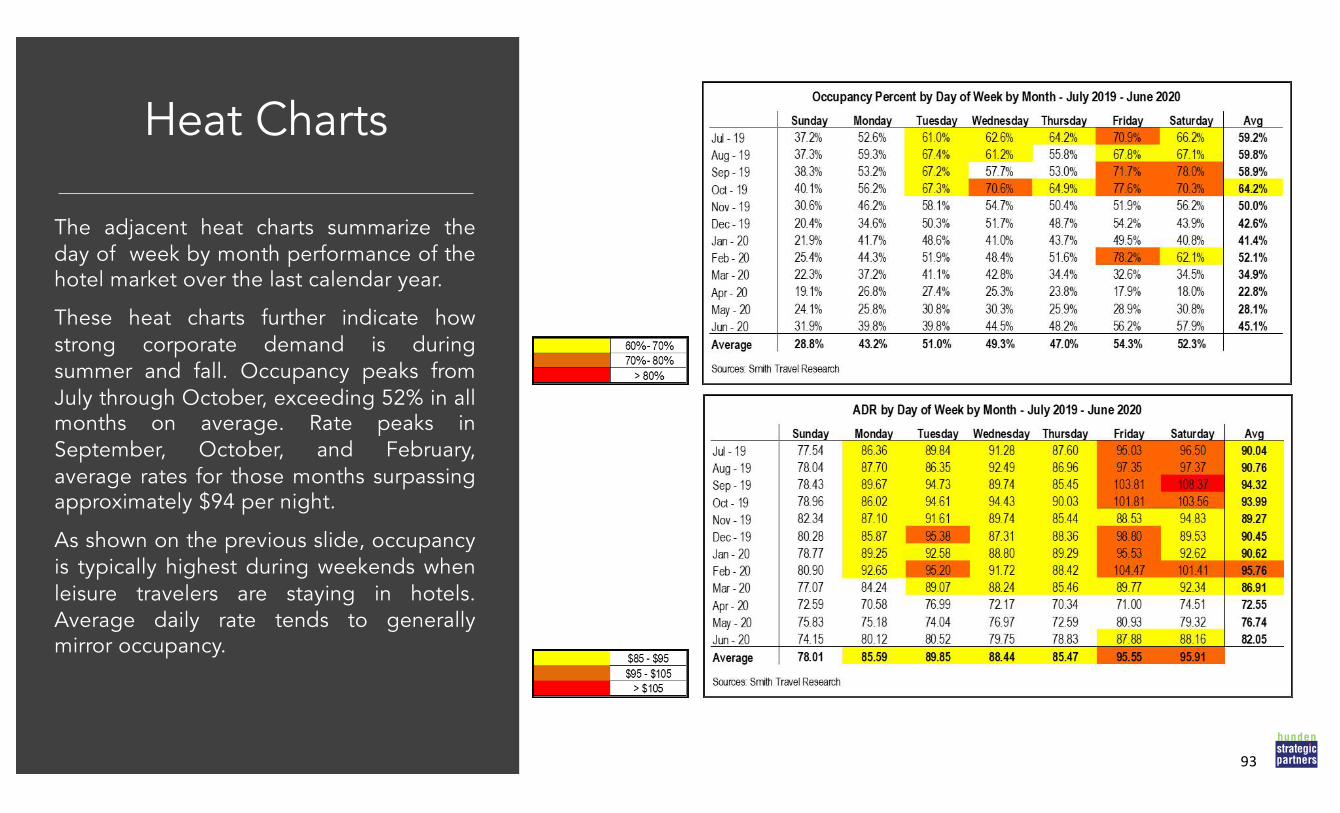
Heat Charts
93
The adjacent heat charts summarize theday of week by month performance of thehotel market over the last calendar year.
These heat charts further indicate howstrong corporate demand is duringsummer and fall. Occupancy peaks fromJuly through October, exceeding 52% in allmonths on average. Rate peaks inSeptember, October, and February,average rates for those months surpassingapproximately $94 per night.
As shown on the previous slide, occupancyis typically highest during weekends whenleisure travelers are staying in hotels.Average daily rate tends to generallymirror occupancy.
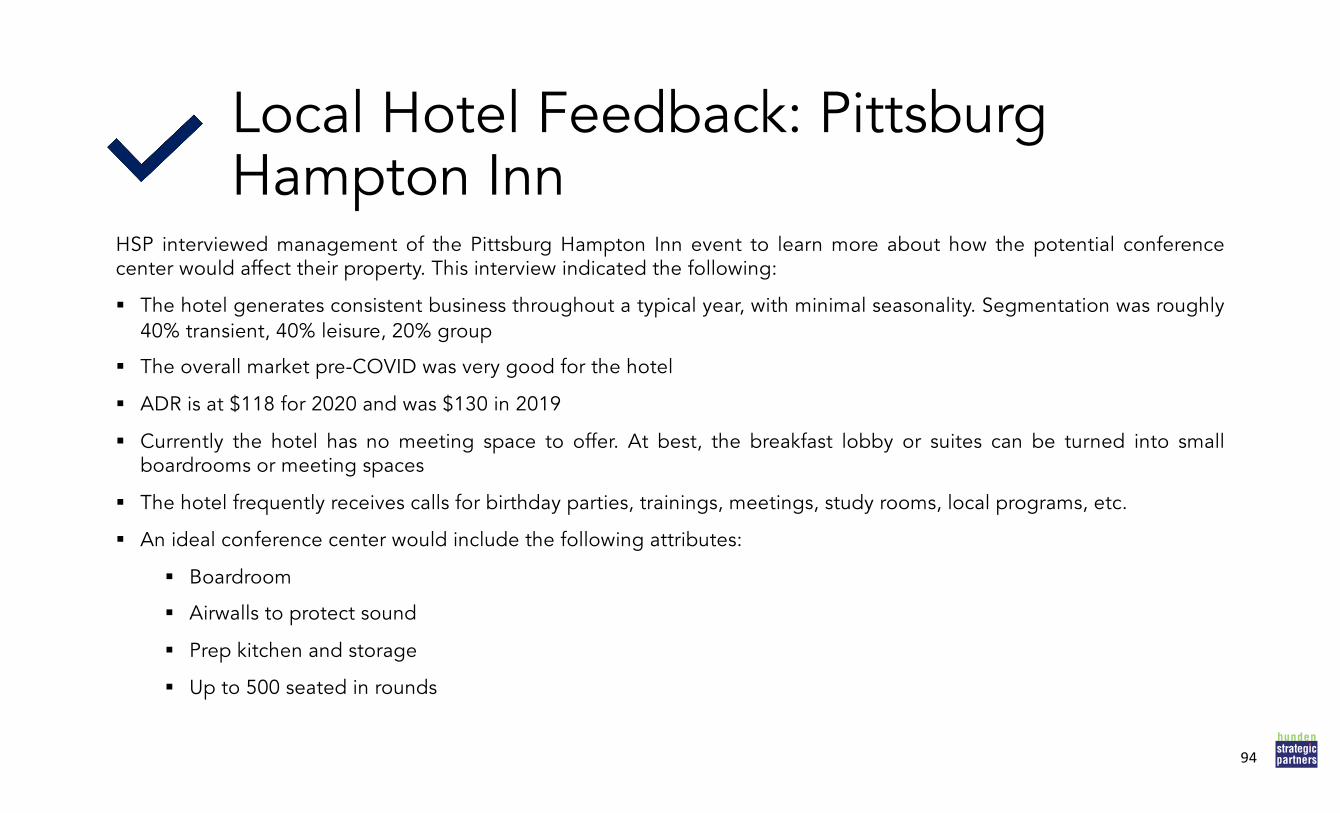
Local Hotel Feedback: Pittsburg Hampton Inn
HSP interviewed management of the Pittsburg Hampton Inn event to learn more about how the potential conferencecenter would affect their property. This interview indicated the following:
§ The hotel generates consistent business throughout a typical year, with minimal seasonality. Segmentation was roughly40% transient, 40% leisure, 20% group
§ The overall market pre-COVID was very good for the hotel
§ ADR is at $118 for 2020 and was $130 in 2019
§ Currently the hotel has no meeting space to offer. At best, the breakfast lobby or suites can be turned into smallboardrooms or meeting spaces
§ The hotel frequently receives calls for birthday parties, trainings, meetings, study rooms, local programs, etc.
§ An ideal conference center would include the following attributes:
§ Boardroom
§ Airwalls to protect sound
§ Prep kitchen and storage
§ Up to 500 seated in rounds
94
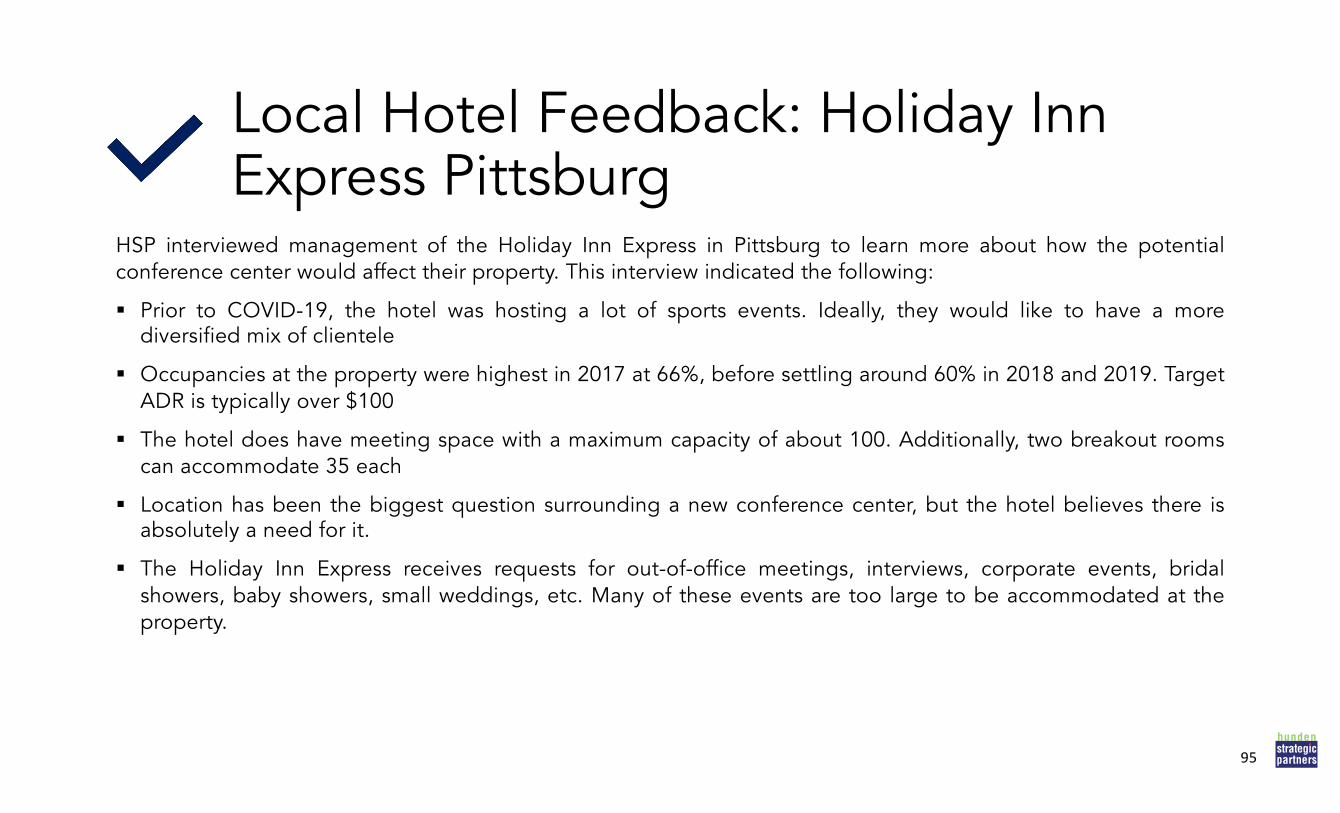
Local Hotel Feedback: Holiday Inn Express Pittsburg
HSP interviewed management of the Holiday Inn Express in Pittsburg to learn more about how the potentialconference center would affect their property. This interview indicated the following:
§ Prior to COVID-19, the hotel was hosting a lot of sports events. Ideally, they would like to have a morediversified mix of clientele
§ Occupancies at the property were highest in 2017 at 66%, before settling around 60% in 2018 and 2019. TargetADR is typically over $100
§ The hotel does have meeting space with a maximum capacity of about 100. Additionally, two breakout roomscan accommodate 35 each
§ Location has been the biggest question surrounding a new conference center, but the hotel believes there isabsolutely a need for it.
§ The Holiday Inn Express receives requests for out-of-office meetings, interviews, corporate events, bridalshowers, baby showers, small weddings, etc. Many of these events are too large to be accommodated at theproperty.
95
Hotel Market ImplicationsHSP examined the lodging market performance for local hotels in Crawford County to better understand howthe Project could support the existing hotels.
§ The recovery period post-COVID-19 will take one to two years at the minimum.
§ The occupancy in the market was rising and rate had steadied just under $100 – both signs of a healthymarket prior to the pandemic.
§ Hotels in the market are lacking meeting spaces of their own and have indicated opportunity and lost businessdue to this limited space.
§ The increase in room nights from a new conference center could create substantial opportunity for the localhotels.
96

Chapter 6: Site Analysis & Test Fits
98
Potential Development SitesThe project sites assessed are as follows:
1. North Hotel Cluster
2. Centennial Drive at 69 Highway
3. Kansas Crossing
4. Alternative Site Option: Memorial Auditorium
Each site presents its own unique challenges and opportunities.The implications of each area are considered, andrecommendations are organized in a matrix of potentialdevelopment opportunities.
98

North Hotel Cluster
99
The first site analyzed is being referredto as the North Hotel Cluster, is locatedjust west of Parkview Drive at thenorthern end of Pittsburg. The name isdue to its proximity to a number oflodging options including the RegencyInn &. Suites, the Holiday Inn Express,the Lamplighter Inn & Suites, theComfort Inn, and Super 8.
Total walkable rooms for this site are367 keys.
The following slide gives an overview ofthe pros and cons of the site.
100Site 1: North Hotel Cluster
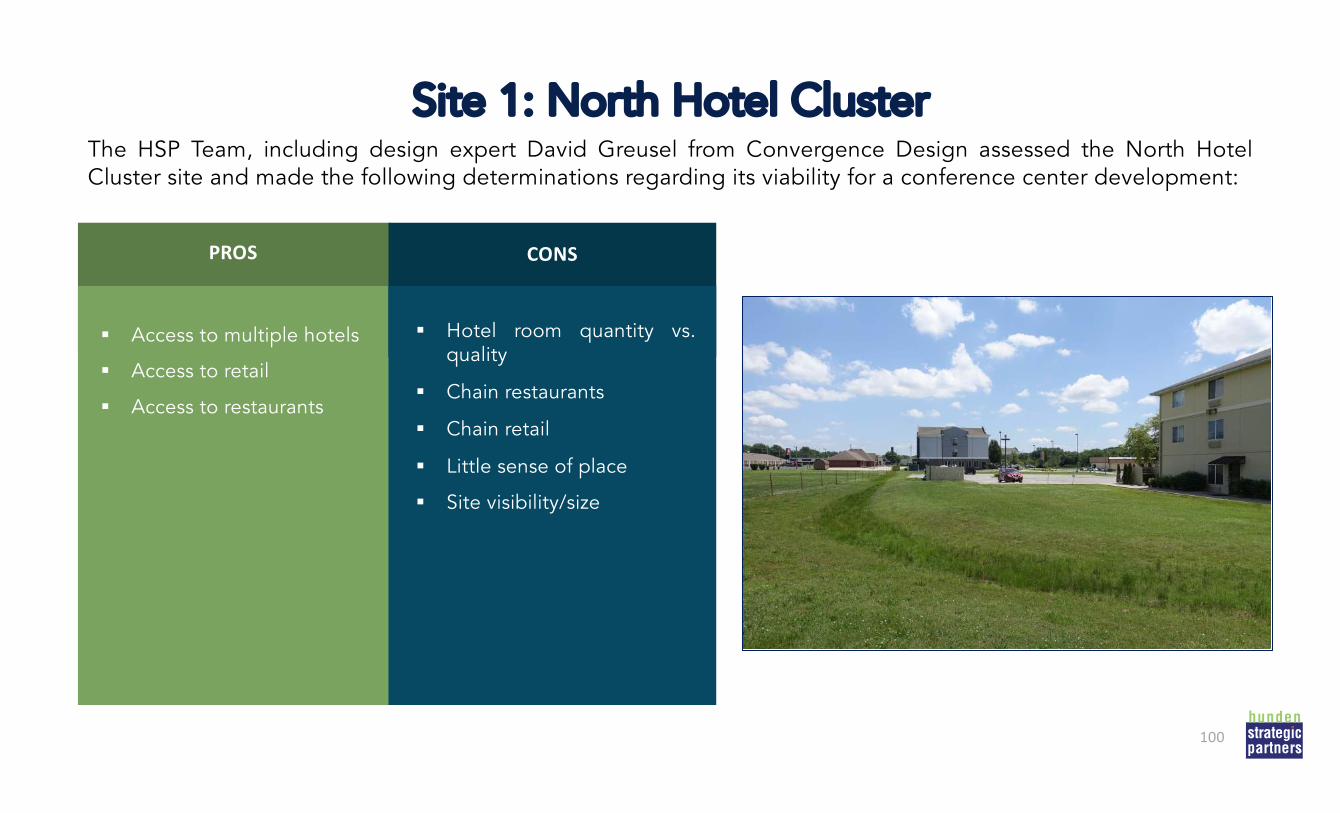
PROSTHE SUPPLY
CONS
§ Access to multiple hotels
§ Access to retail
§ Access to restaurants
§ Hotel room quantity vs.quality
§ Chain restaurants
§ Chain retail
§ Little sense of place
§ Site visibility/size
The HSP Team, including design expert David Greusel from Convergence Design assessed the North HotelCluster site and made the following determinations regarding its viability for a conference center development:
100
101
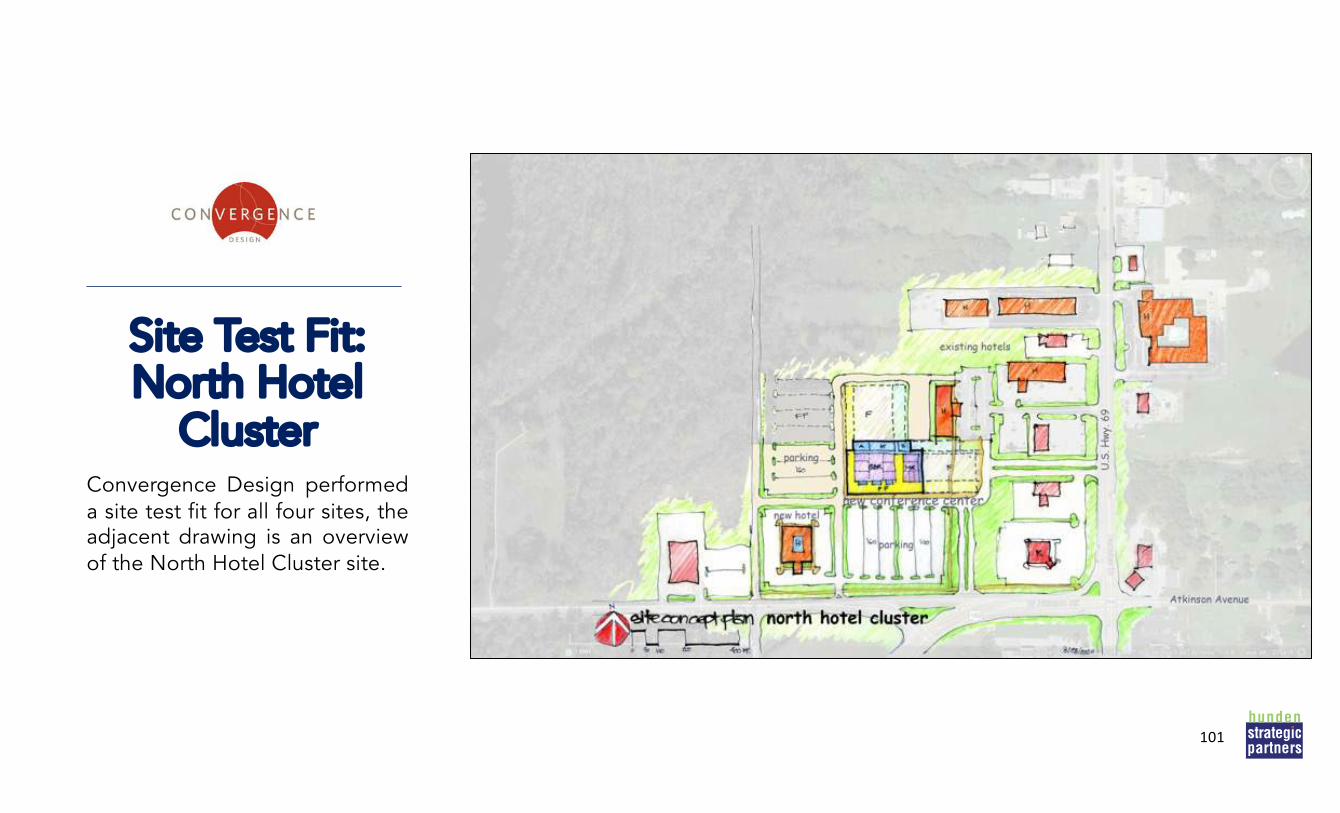
Site Test Fit: North Hotel
ClusterConvergence Design performeda site test fit for all four sites, theadjacent drawing is an overviewof the North Hotel Cluster site.
101
Centennial Drive
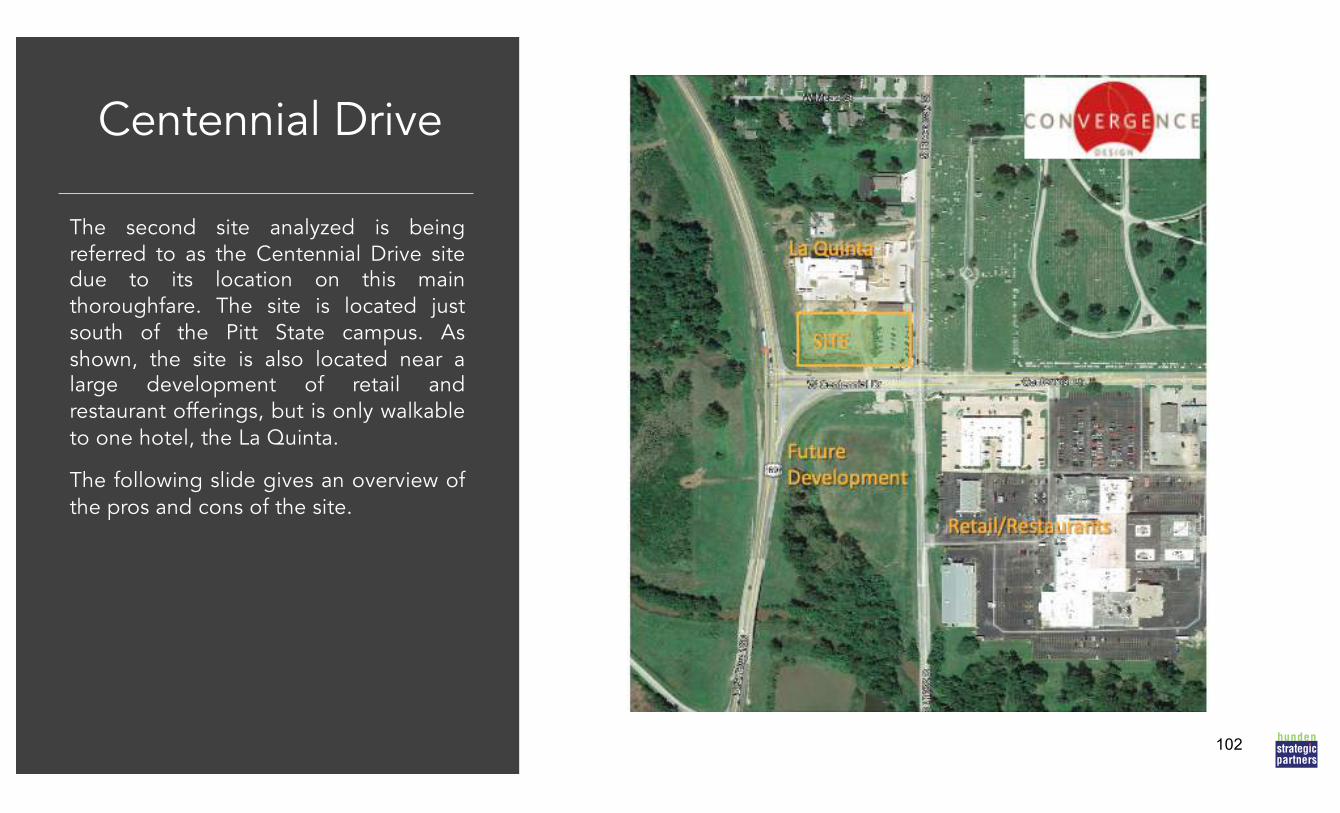
102
The second site analyzed is beingreferred to as the Centennial Drive sitedue to its location on this mainthoroughfare. The site is located justsouth of the Pitt State campus. Asshown, the site is also located near alarge development of retail andrestaurant offerings, but is only walkableto one hotel, the La Quinta.
The following slide gives an overview ofthe pros and cons of the site.
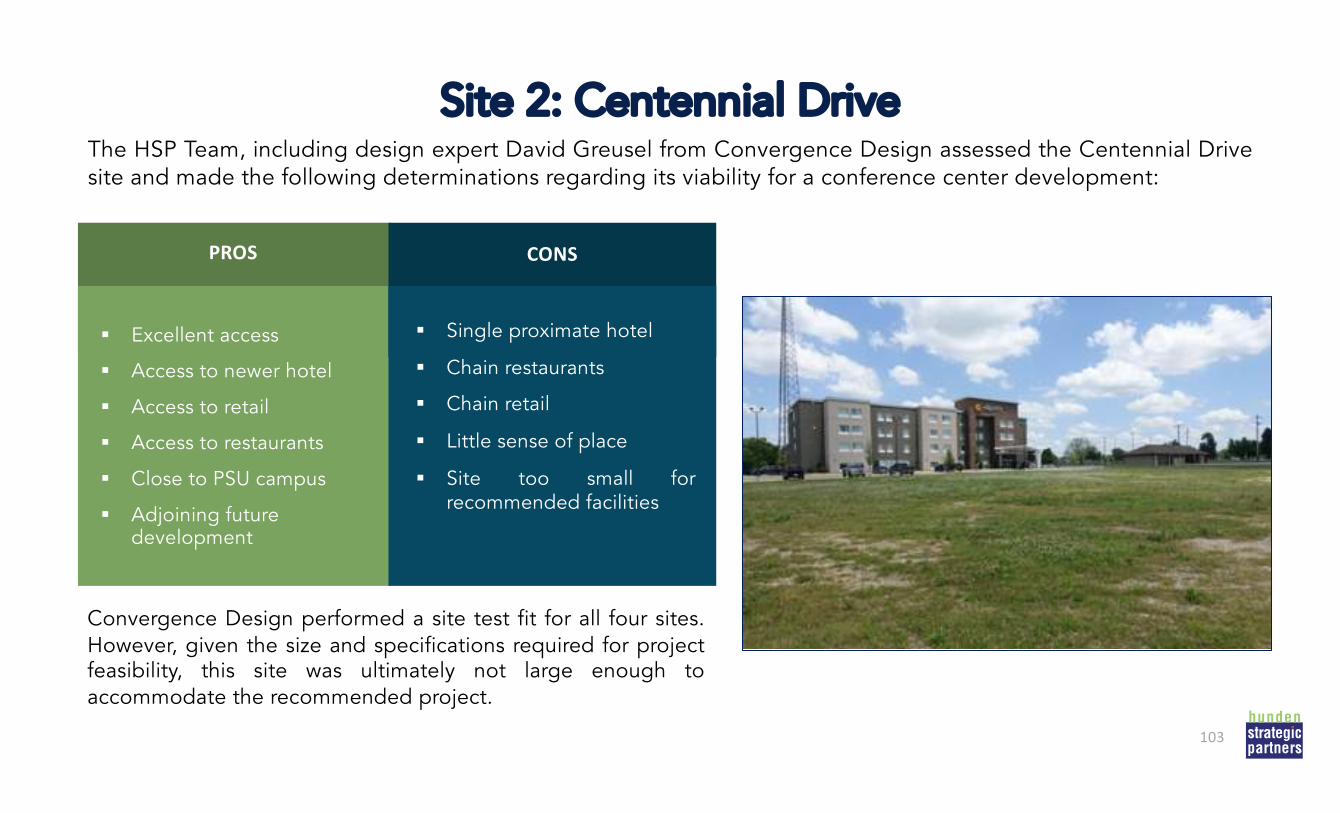
103Site 2: Centennial Drive
PROSTHE SUPPLY
CONS
§ Excellent access
§ Access to newer hotel
§ Access to retail
§ Access to restaurants
§ Close to PSU campus
§ Adjoining future development
§ Single proximate hotel
§ Chain restaurants
§ Chain retail
§ Little sense of place
§ Site too small forrecommended facilities
The HSP Team, including design expert David Greusel from Convergence Design assessed the Centennial Drivesite and made the following determinations regarding its viability for a conference center development:
103
Convergence Design performed a site test fit for all four sites.However, given the size and specifications required for projectfeasibility, this site was ultimately not large enough toaccommodate the recommended project.
Kansas Crossing
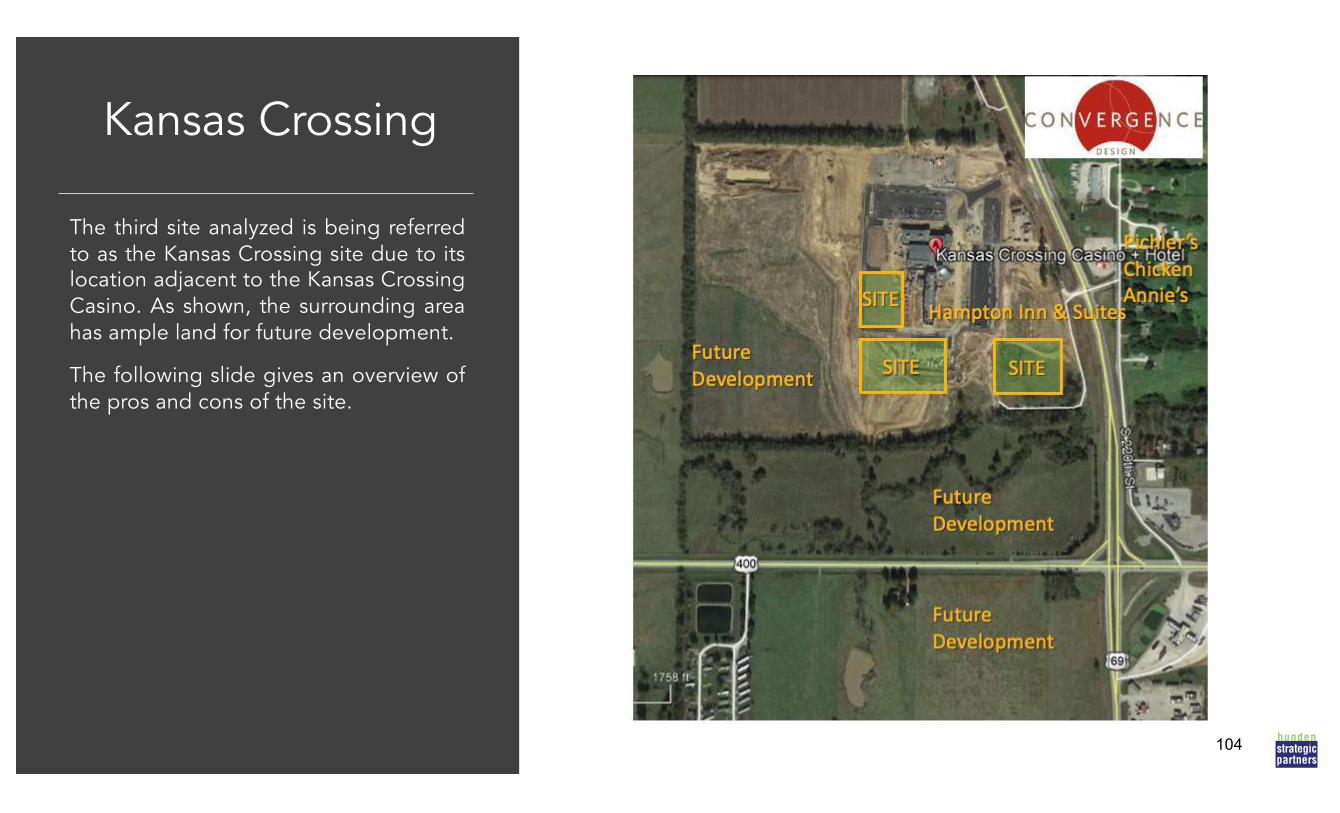
104
The third site analyzed is being referredto as the Kansas Crossing site due to itslocation adjacent to the Kansas CrossingCasino. As shown, the surrounding areahas ample land for future development.
The following slide gives an overview ofthe pros and cons of the site.
105Site 3: Kansas Crossing
PROSTHE SUPPLY
CONS
§ Excellent access
§ Access to newer hotel
§ Site visibility/size
§ Multiple siting options
§ Future development
§ Access to restaurants
§ Adjacency to casino
§ Other activities remote
§ Single proximate hotel
§ No retail nearby
§ Little sense of place
The HSP Team, including design expert David Greusel from Convergence Design assessed the Kansas Crossingsite and made the following determinations regarding its viability for a conference center development:
105

106
Site Test Fit: Kansas CrossingConvergence Design performeda site test fit for all four sites, theadjacent drawing is an overviewof the recommended site,Kansas Crossing.
106
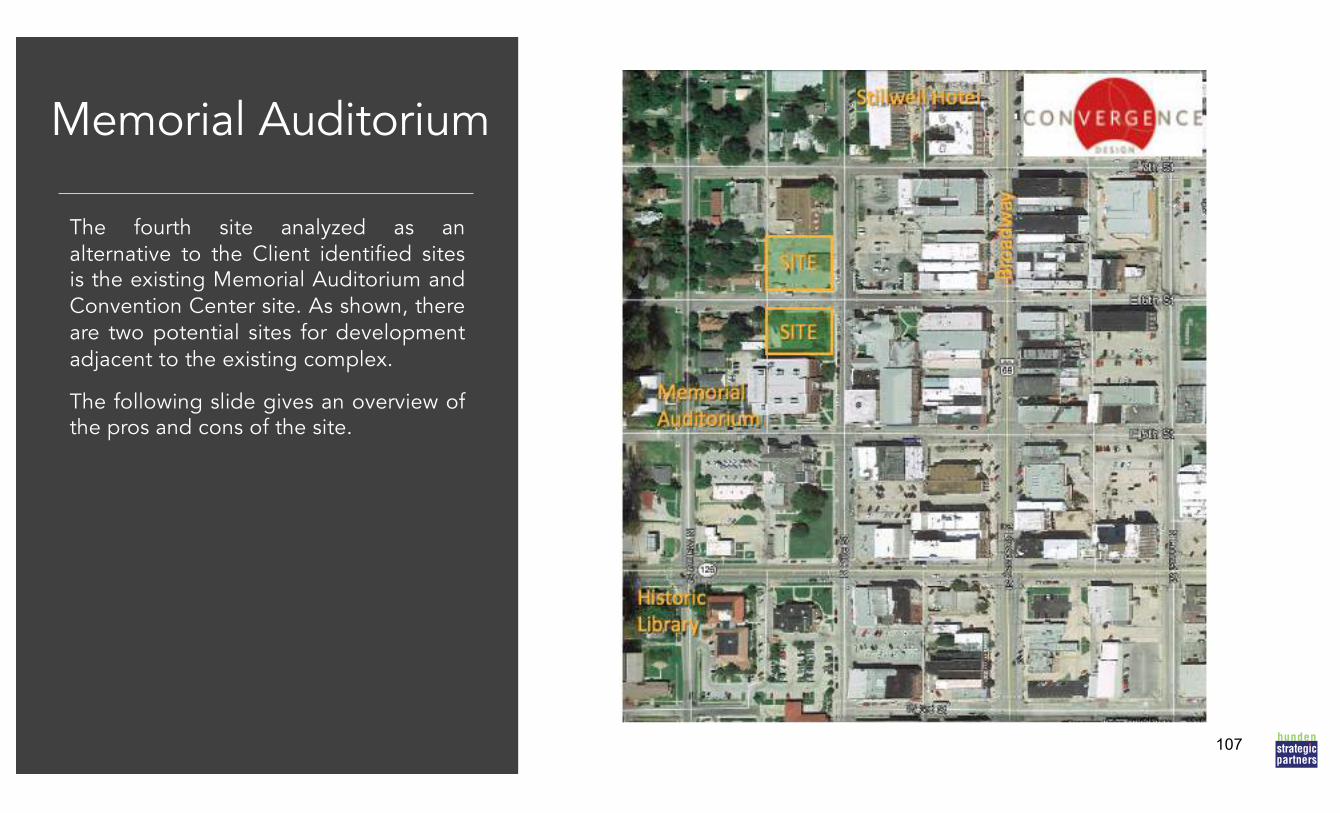
Memorial Auditorium
107
The fourth site analyzed as analternative to the Client identified sitesis the existing Memorial Auditorium andConvention Center site. As shown, thereare two potential sites for developmentadjacent to the existing complex.
The following slide gives an overview ofthe pros and cons of the site.
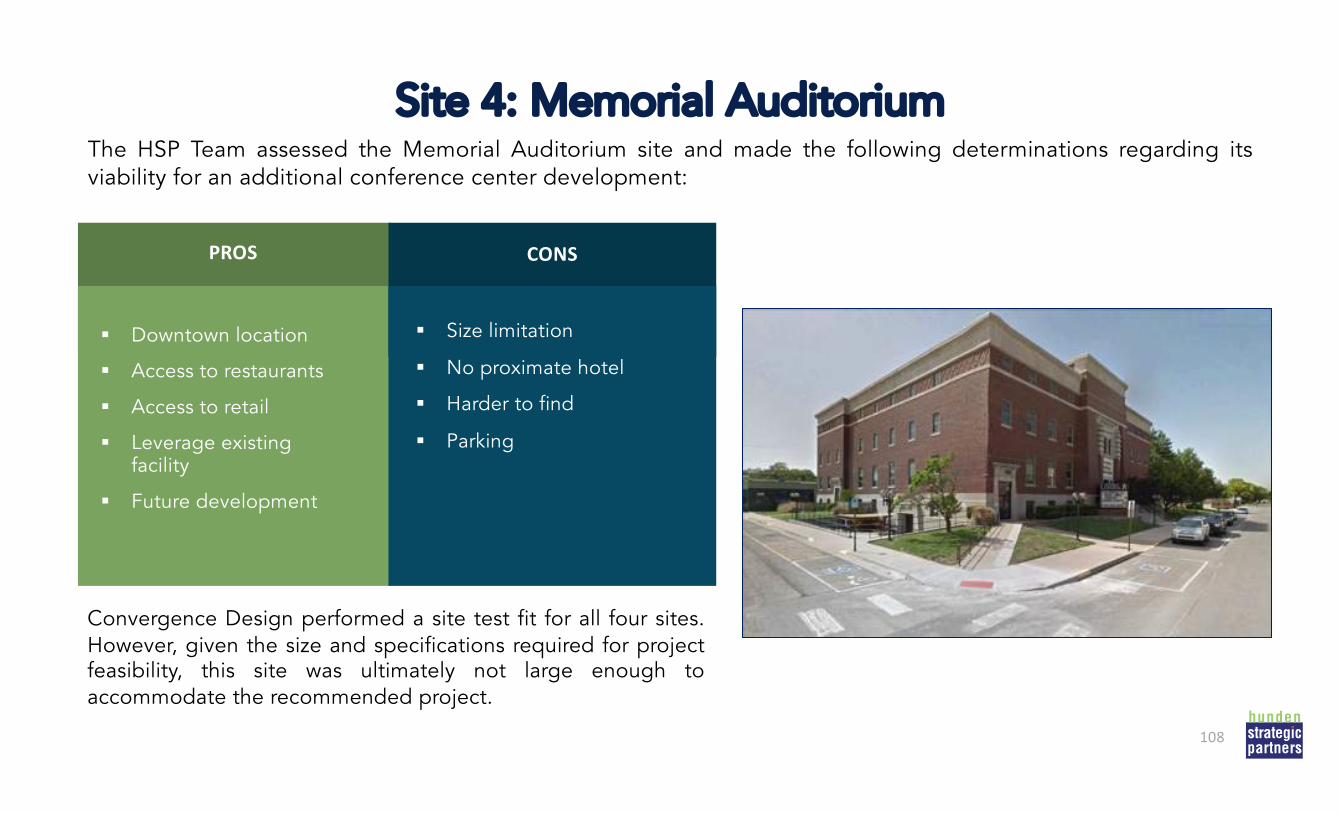
108Site 4: Memorial Auditorium
PROSTHE SUPPLY
CONS
§ Downtown location
§ Access to restaurants
§ Access to retail
§ Leverage existing facility
§ Future development
§ Size limitation
§ No proximate hotel
§ Harder to find
§ Parking
The HSP Team assessed the Memorial Auditorium site and made the following determinations regarding itsviability for an additional conference center development:
108
Convergence Design performed a site test fit for all four sites.However, given the size and specifications required for projectfeasibility, this site was ultimately not large enough toaccommodate the recommended project.
109
HSP’s analysis found the Kansas Crossing site to be the most compelling. Relative to the other potentialand available sites, it offers the most optimal conditions for a development of this type. The site offersexcellent access, as well as land to potentially develop more restaurants, retail, hotel, etc. in the future.
As such, HSP used the Kansas Crossing scenario to complete our assumptions and projections of demandand financial performance, as well as economic and fiscal impact.
109
Site Recommendation

Chapter 7: Implications and Recommendations
111HEADLINES
THE LOCAL MARKET THE PROJECT SITE THE INDUSTRY
Crawford County benefits greatlyfrom its location and access. Thecounty offers a University as well asseveral large employers.
Downtown attractions and otherregional draws such as the KansasCrossing Casino are beneficial formeeting planners and bode well for anew conference center project.
Crawford County is fortunate tohave multiple sites to assess for thispotential development. There aremany considerations that lead toselecting an optimal site. Awalkable environment with plenty ofrestaurants, hotel rooms, retail andentertainment options is of theutmost priority.
Of the four sites assessed for thisstudy, HSP recommends that theKansas Crossing site be givenpriority.
While the industry is ever-changing,the expectations for ease,convenience and affordability haveincreased, while the demand forauthenticity and large blocks ofgeneric/branded hotel rooms andattached high-quality flexible spaceshas also increased.
Often, a single event will use manydifferent types of spaces, includingexhibit halls, banquet facilities andbreakout meeting rooms increasingthe need for well-designed multi-purpose facilities and flexible breakout rooms.
The following slides summarize the key findings and headlines. In order to assess the viability of any project andmake informed recommendations, there are six key elements that must be considered.
111
112HEADLINES
THE DEMAND THE SUPPLY THE CASE STUDIES
There is a gap and need in CrawfordCounty for a small conference andevent center.
HSP recommends a small, flexiblefacility with 20,000 square feet offunction space and approximately28,000 square feet of support space.
In order to be competitive, the facilitymust have flexible breakout spaceand meeting rooms, state of the arttechnology, and a walkableenvironment with sufficient hotelrooms and restaurant options.
HSP does not recommend exhibitspace at this time.
The local supply lacks the type, sizeand flexibility of spaces that wouldallow it to accommodate mostconferences and event types. Theexisting Memorial Convention Centeris dated and small, with little flexibility.
Regionally, most competitive facilitieswithin a three-hour drive time rangefrom 40,000 to 110,000 SF of totalmeeting space.
Crawford County has an opportunityto create a successful, profitably-operated convention center, butemphasis must be placed oncreating a flexible space in awalkable environment with theproper amenities and sizing.
The information provided about HQhotels around the country yieldsvaluable lessons for the CrawfordCounty study, as the site locationwill largely be dependent onproximity to a suitable hotelpackage.
The following slides summarize the key findings and headlines. In order to assess the viability of any project andmake informed recommendations, there are six key elements that must be considered.
112

113DESTINATION DEVELOPMENT SWOT ANALYSIS
INTERNAL FACTORS EXTERNAL FACTORS
POSI
TIVE
NEGA
TIVE
§ Strong County and City Leadership
§ Accessibility
§ Kansas Crossing Casino
§ Retail Hub for the Region
§ Pittsburg State University
STRENGTHS
§ Small Regional Population
WEAKNESSES
§ Affordable and Available Land
§ Potential Investment from Casino/Others
§ Proximity to University and Hospital
§ Corporate Events
OPPORTUNITIES
§ Competition from larger KS cities
§ Branding Challenges
THREATS
How External and Internal Factors Affect Project Viability
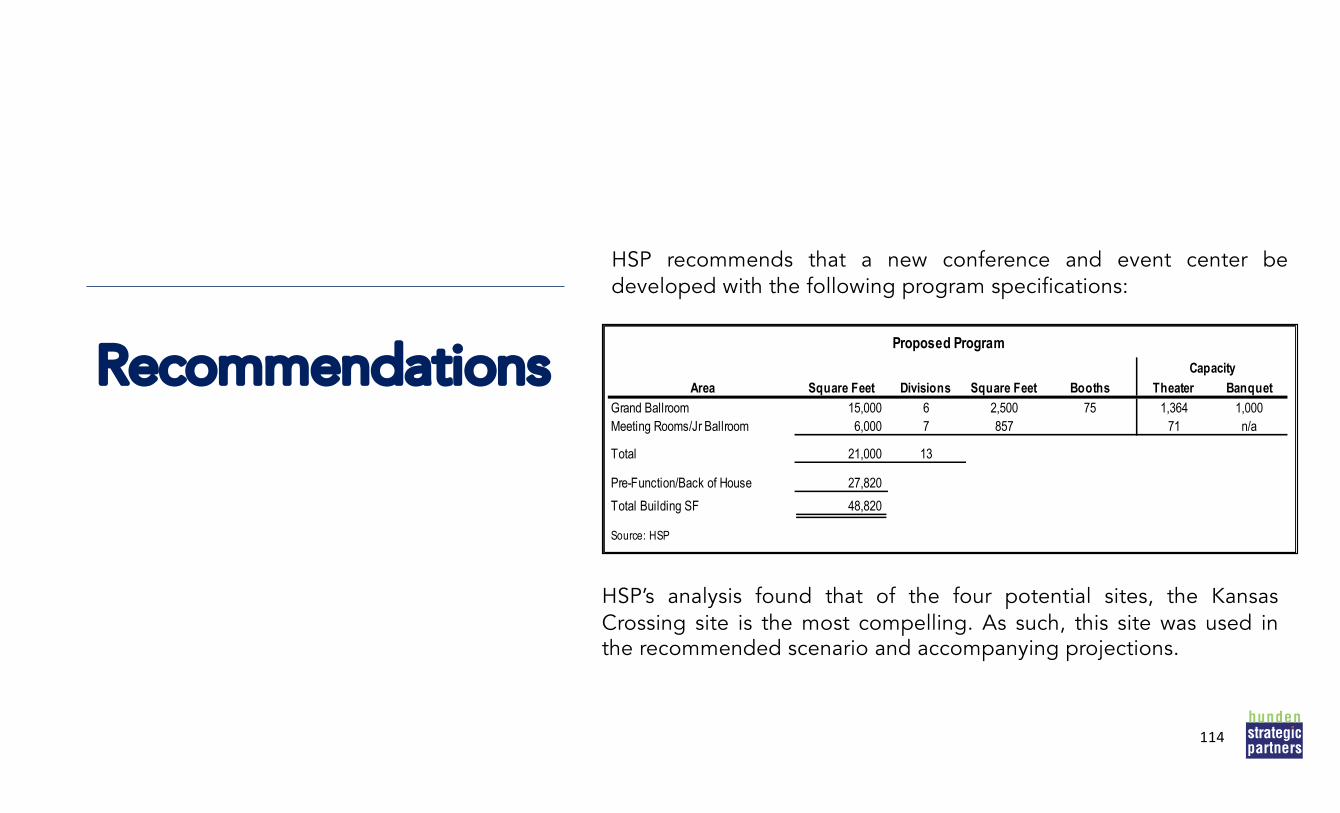
114
Recommendations
HSP recommends that a new conference and event center bedeveloped with the following program specifications:
114
Proposed Program
CapacityArea Square Feet Divisions Square Feet Booths Theater Banquet
Grand Ballroom 15,000 6 2,500 75 1,364 1,000Meeting Rooms/Jr Ballroom 6,000 7 857 71 n/a
Total 21,000 13
Pre-Function/Back of House 27,820 Total Building SF 48,820
Source: HSP Conceptual Buildout Cost Model
HSP’s analysis found that of the four potential sites, the KansasCrossing site is the most compelling. As such, this site was used inthe recommended scenario and accompanying projections.
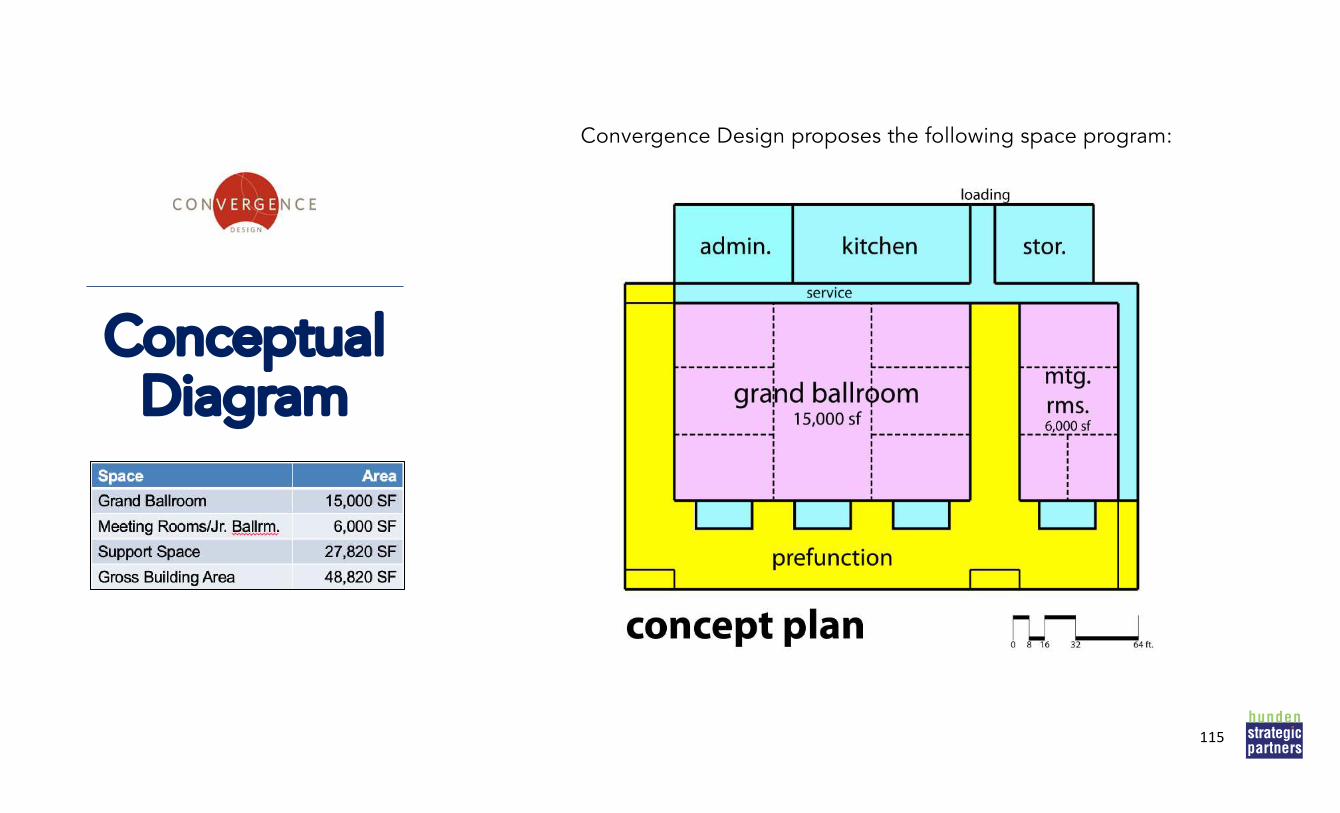
115
Conceptual Diagram
Convergence Design proposes the following space program:
115

116
Site Test Fit: Kansas CrossingConvergence Design performeda site test fit for all four sites, theadjacent drawing is an overviewof the recommended site,Kansas Crossing.
116
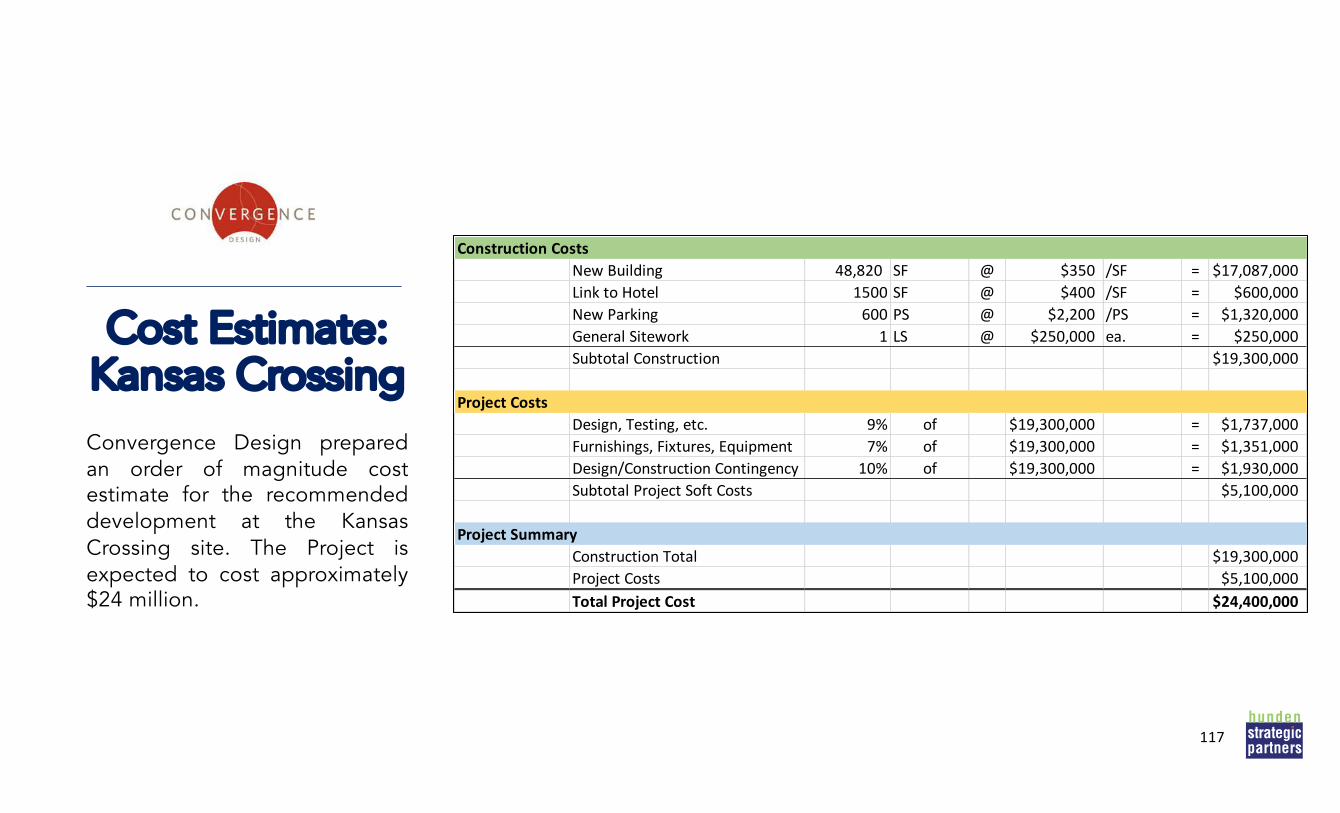
117
Cost Estimate: Kansas CrossingConvergence Design preparedan order of magnitude costestimate for the recommendeddevelopment at the KansasCrossing site. The Project isexpected to cost approximately$24 million.
117
Construction CostsNew Building 48,820 SF @ $350 /SF = $17,087,000Link to Hotel 1500 SF @ $400 /SF = $600,000New Parking 600 PS @ $2,200 /PS = $1,320,000General Sitework 1 LS @ $250,000 ea. = $250,000Subtotal Construction $19,300,000
Project CostsDesign, Testing, etc. 9% of $19,300,000 = $1,737,000Furnishings, Fixtures, Equipment 7% of $19,300,000 = $1,351,000Design/Construction Contingency 10% of $19,300,000 = $1,930,000Subtotal Project Soft Costs $5,100,000
Project SummaryConstruction Total $19,300,000Project Costs $5,100,000Total Project Cost $24,400,000
Chapter 8:Demand & Financial Projections
118
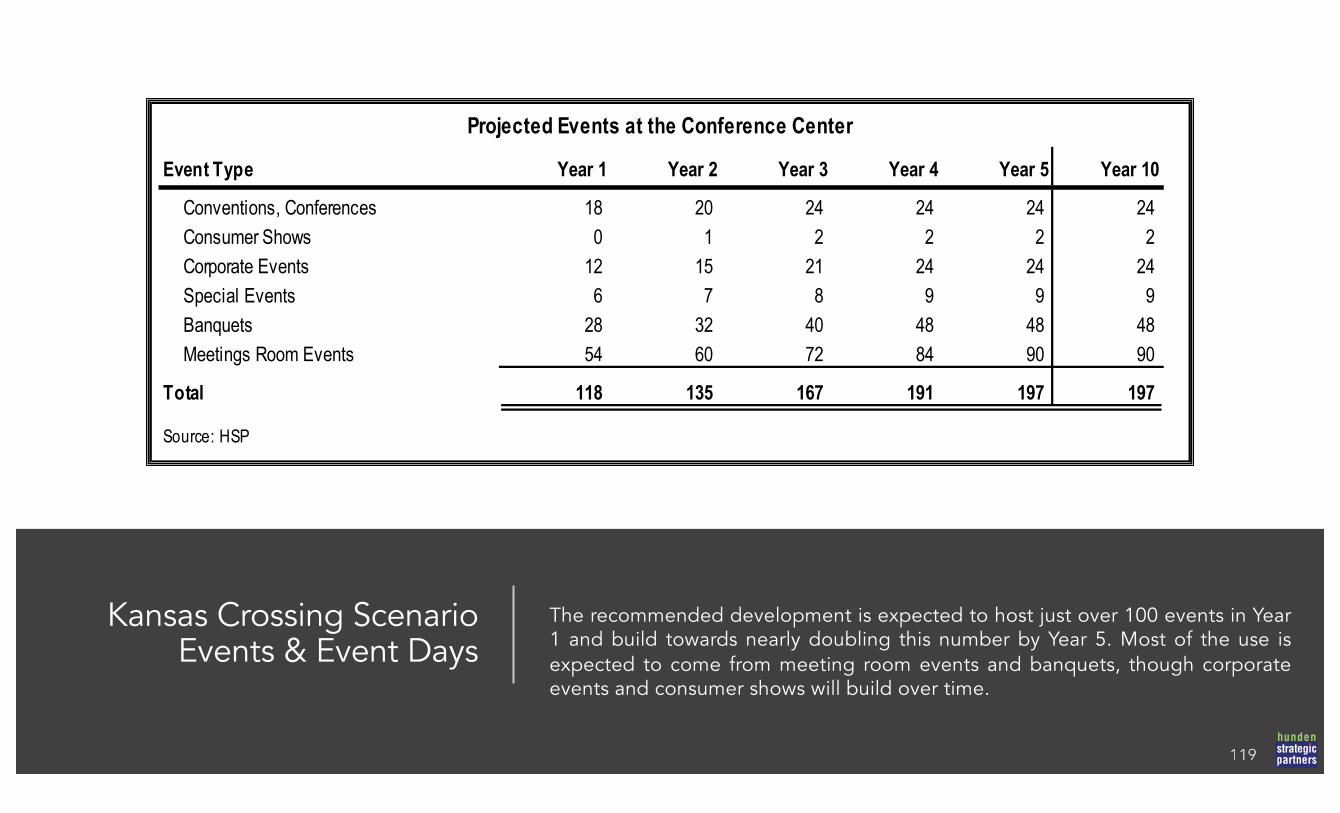
Kansas Crossing ScenarioEvents & Event Days
The recommended development is expected to host just over 100 events in Year1 and build towards nearly doubling this number by Year 5. Most of the use isexpected to come from meeting room events and banquets, though corporateevents and consumer shows will build over time.
Projected Events at the Conference Center
Event Type Year 1 Year 2 Year 3 Year 4 Year 5 Year 10
Conventions, Conferences 18 20 24 24 24 24Consumer Shows 0 1 2 2 2 2Corporate Events 12 15 21 24 24 24Special Events 6 7 8 9 9 9Banquets 28 32 40 48 48 48Meetings Room Events 54 60 72 84 90 90
Total 118 135 167 191 197 197
Source: HSP
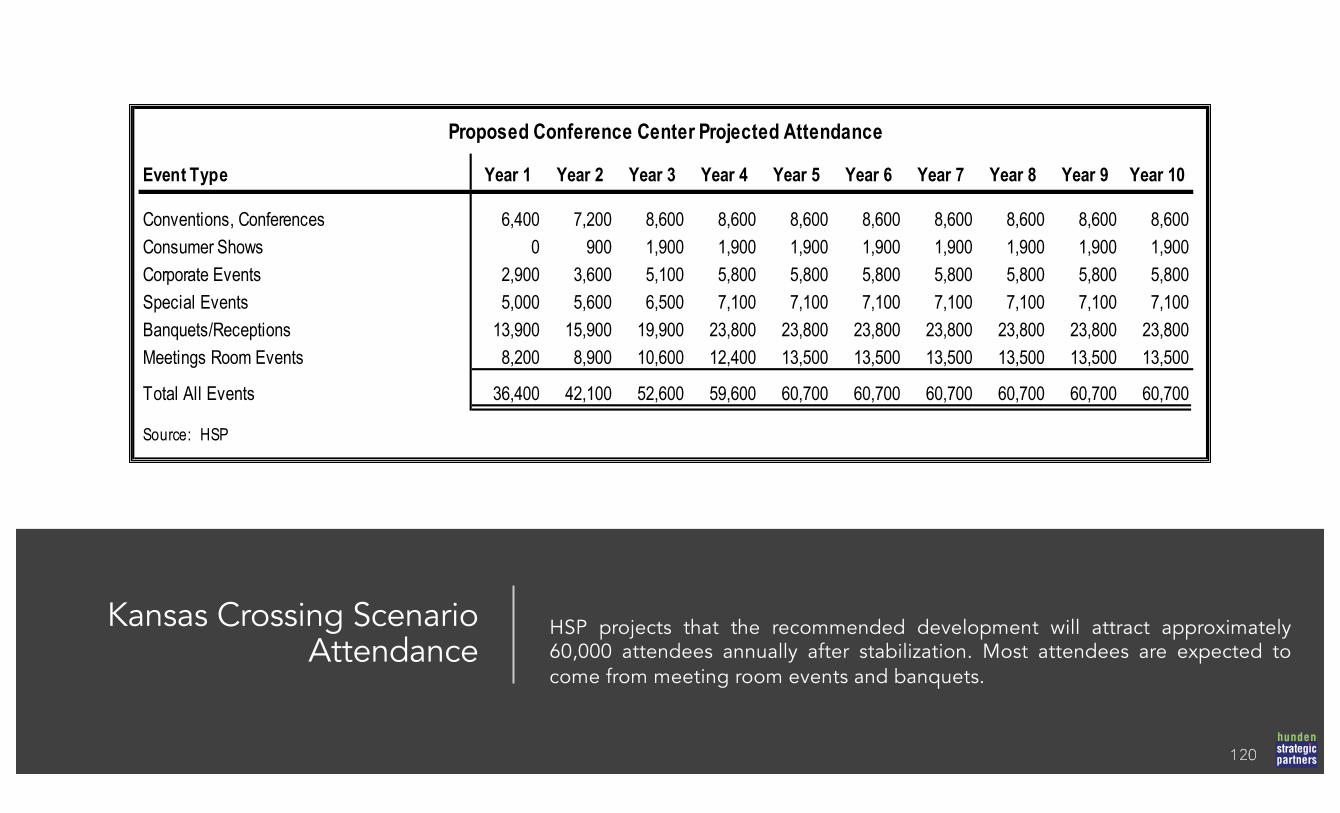
Kansas Crossing Scenario Attendance
HSP projects that the recommended development will attract approximately60,000 attendees annually after stabilization. Most attendees are expected tocome from meeting room events and banquets.
Proposed Conference Center Projected Attendance
Event Type Year 1 Year 2 Year 3 Year 4 Year 5 Year 6 Year 7 Year 8 Year 9 Year 10
Conventions, Conferences 6,400 7,200 8,600 8,600 8,600 8,600 8,600 8,600 8,600 8,600Consumer Shows 0 900 1,900 1,900 1,900 1,900 1,900 1,900 1,900 1,900Corporate Events 2,900 3,600 5,100 5,800 5,800 5,800 5,800 5,800 5,800 5,800Special Events 5,000 5,600 6,500 7,100 7,100 7,100 7,100 7,100 7,100 7,100Banquets/Receptions 13,900 15,900 19,900 23,800 23,800 23,800 23,800 23,800 23,800 23,800Meetings Room Events 8,200 8,900 10,600 12,400 13,500 13,500 13,500 13,500 13,500 13,500
Total All Events 36,400 42,100 52,600 59,600 60,700 60,700 60,700 60,700 60,700 60,700
Source: HSP
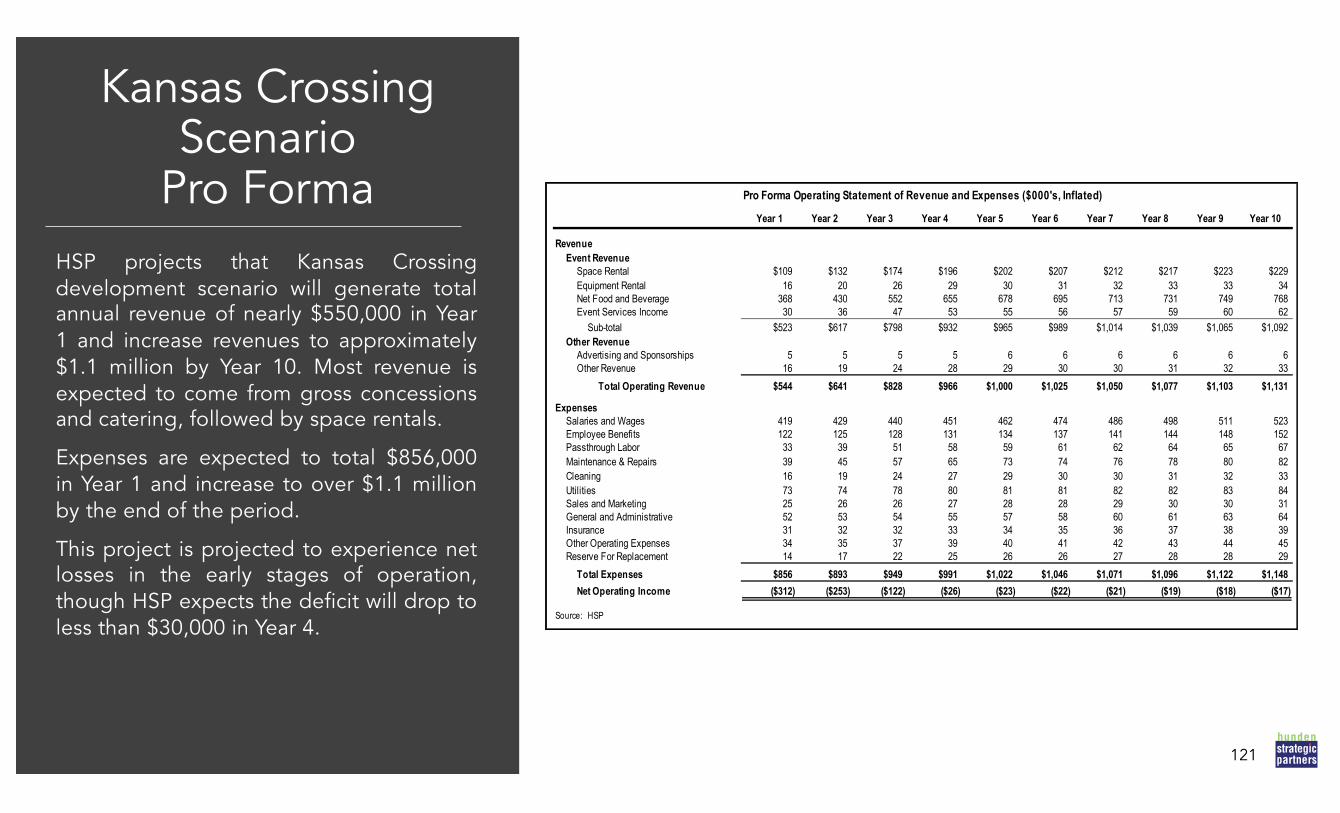
Kansas Crossing Scenario
Pro FormaHSP projects that Kansas Crossingdevelopment scenario will generate totalannual revenue of nearly $550,000 in Year1 and increase revenues to approximately$1.1 million by Year 10. Most revenue isexpected to come from gross concessionsand catering, followed by space rentals.
Expenses are expected to total $856,000in Year 1 and increase to over $1.1 millionby the end of the period.
This project is projected to experience netlosses in the early stages of operation,though HSP expects the deficit will drop toless than $30,000 in Year 4.
121
Pro Forma Operating Statement of Revenue and Expenses ($000's, Inflated)
Year 1 Year 2 Year 3 Year 4 Year 5 Year 6 Year 7 Year 8 Year 9 Year 10
RevenueEvent Revenue
Space Rental $109 $132 $174 $196 $202 $207 $212 $217 $223 $229Equipment Rental 16 20 26 29 30 31 32 33 33 34Net Food and Beverage 368 430 552 655 678 695 713 731 749 768Event Services Income 30 36 47 53 55 56 57 59 60 62
Sub-total $523 $617 $798 $932 $965 $989 $1,014 $1,039 $1,065 $1,092Other Revenue
Advertising and Sponsorships 5 5 5 5 6 6 6 6 6 6Other Revenue 16 19 24 28 29 30 30 31 32 33
Total Operating Revenue $544 $641 $828 $966 $1,000 $1,025 $1,050 $1,077 $1,103 $1,131
Expenses Salaries and Wages 419 429 440 451 462 474 486 498 511 523Employee Benefits 122 125 128 131 134 137 141 144 148 152Passthrough Labor 33 39 51 58 59 61 62 64 65 67Maintenance & Repairs 39 45 57 65 73 74 76 78 80 82Cleaning 16 19 24 27 29 30 30 31 32 33Utilities 73 74 78 80 81 81 82 82 83 84Sales and Marketing 25 26 26 27 28 28 29 30 30 31General and Administrative 52 53 54 55 57 58 60 61 63 64Insurance 31 32 32 33 34 35 36 37 38 39Other Operating Expenses 34 35 37 39 40 41 42 43 44 45Reserve For Replacement 14 17 22 25 26 26 27 28 28 29
Total Expenses $856 $893 $949 $991 $1,022 $1,046 $1,071 $1,096 $1,122 $1,148Net Operating Income ($312) ($253) ($122) ($26) ($23) ($22) ($21) ($19) ($18) ($17)
Source: HSP
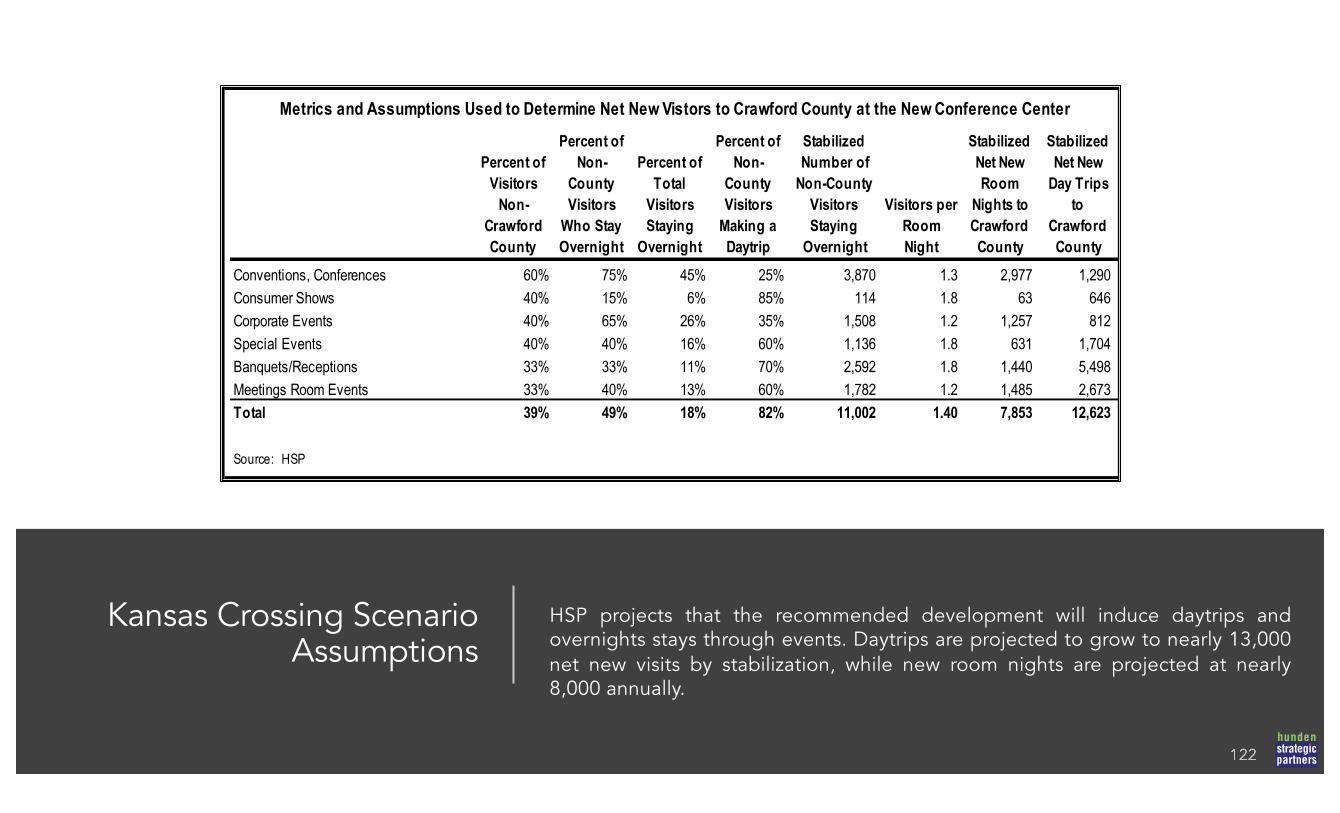
Kansas Crossing Scenario Assumptions
HSP projects that the recommended development will induce daytrips andovernights stays through events. Daytrips are projected to grow to nearly 13,000net new visits by stabilization, while new room nights are projected at nearly8,000 annually.
Metrics and Assumptions Used to Determine Net New Vistors to Crawford County at the New Conference Center
Percent of Visitors
Non-Crawford County
Percent of Non-
County Visitors
Who Stay Overnight
Percent of Total
Visitors Staying
Overnight
Percent of Non-
County Visitors
Making a Daytrip
Stabilized Number of
Non-County Visitors Staying
Overnight
Visitors per Room Night
Stabilized Net New Room
Nights to Crawford County
Stabilized Net New
Day Trips to
Crawford County
Conventions, Conferences 60% 75% 45% 25% 3,870 1.3 2,977 1,290Consumer Shows 40% 15% 6% 85% 114 1.8 63 646Corporate Events 40% 65% 26% 35% 1,508 1.2 1,257 812Special Events 40% 40% 16% 60% 1,136 1.8 631 1,704Banquets/Receptions 33% 33% 11% 70% 2,592 1.8 1,440 5,498Meetings Room Events 33% 40% 13% 60% 1,782 1.2 1,485 2,673Total 39% 49% 18% 82% 11,002 1.40 7,853 12,623 Source: HSP
Chapter 9: Economic, Employment & Fiscal
Impact Analysis
123
Direct Net New & Recaptured Spending
Direct net new, including recaptured, spending falls into five categories: food &beverage, lodging, retail, transportation and other.
The recommended project is expected to generate nearly $46 million over time.$12.5 million of this total is expected to come from food & beverage spending,while lodging is expected to generate approximately $18 million.
Direct Net New/Recaptured Spending to Crawford County (000s)
Year 1 Year 2 Year 3 Year 4 Year 5 Year 10 Year 20 Total
Food & Beverage $312 $370 $472 $538 $561 $635 $812 $12,563Lodging $461 $541 $689 $773 $809 $938 $1,201 $18,468Retail $103 $122 $155 $177 $184 $208 $267 $4,124Transportation $155 $184 $235 $269 $279 $316 $405 $6,260Other $123 $146 $187 $213 $222 $251 $322 $4,975Total $1,154 $1,363 $1,737 $1,971 $2,056 $2,348 $3,006 $46,389
Source: Hunden Strategic Partners
Direct, Indirect & InducedNet New Spending
All three levels of spending are expected to combine for over $80 million duringthe Project’s first 20 years. As mentioned on the previous slide, $46 million ofspending will come direct spending, while indirect and induced spending areprojected to produce $15.8 million and $18.4 million.
Direct, Indirect & Induced Net New Spending to Crawford County (000s)
Year 1 Year 2 Year 3 Year 4 Year 5 Year 10 Year 20 Total
Net New Spending
Direct $1,154 $1,363 $1,737 $1,971 $2,056 $2,348 $3,006 $46,389Indirect $393 $465 $592 $672 $701 $801 $1,025 $15,816Induced $460 $543 $692 $785 $819 $935 $1,197 $18,478Total $2,007 $2,370 $3,022 $3,428 $3,576 $4,084 $5,228 $80,684
Source: Hunden Strategic Partners
Net New Earnings & Full-Time Equivalent Jobs
Jobs will be created onsite as well as onsite and offsite from the direct, indirectand induced spending, which are expected to produce net new earnings. Theproject is expected to create enough earnings to support an average of 38 newjobs.
Net New Full-Time Equivalent Jobs from Direct, Indirect & Induced Earnings
Year 1 Year 2 Year 3 Year 4 Year 5 Year 10 Year 20 Average
Net New FTE Jobs From Direct 14 16 20 22 22 22 22 22From Indirect 5 5 7 8 8 8 8 7From Induced 6 6 8 9 9 9 9 9Total 24 28 35 38 39 39 39 38
Source: Hunden Strategic Partners
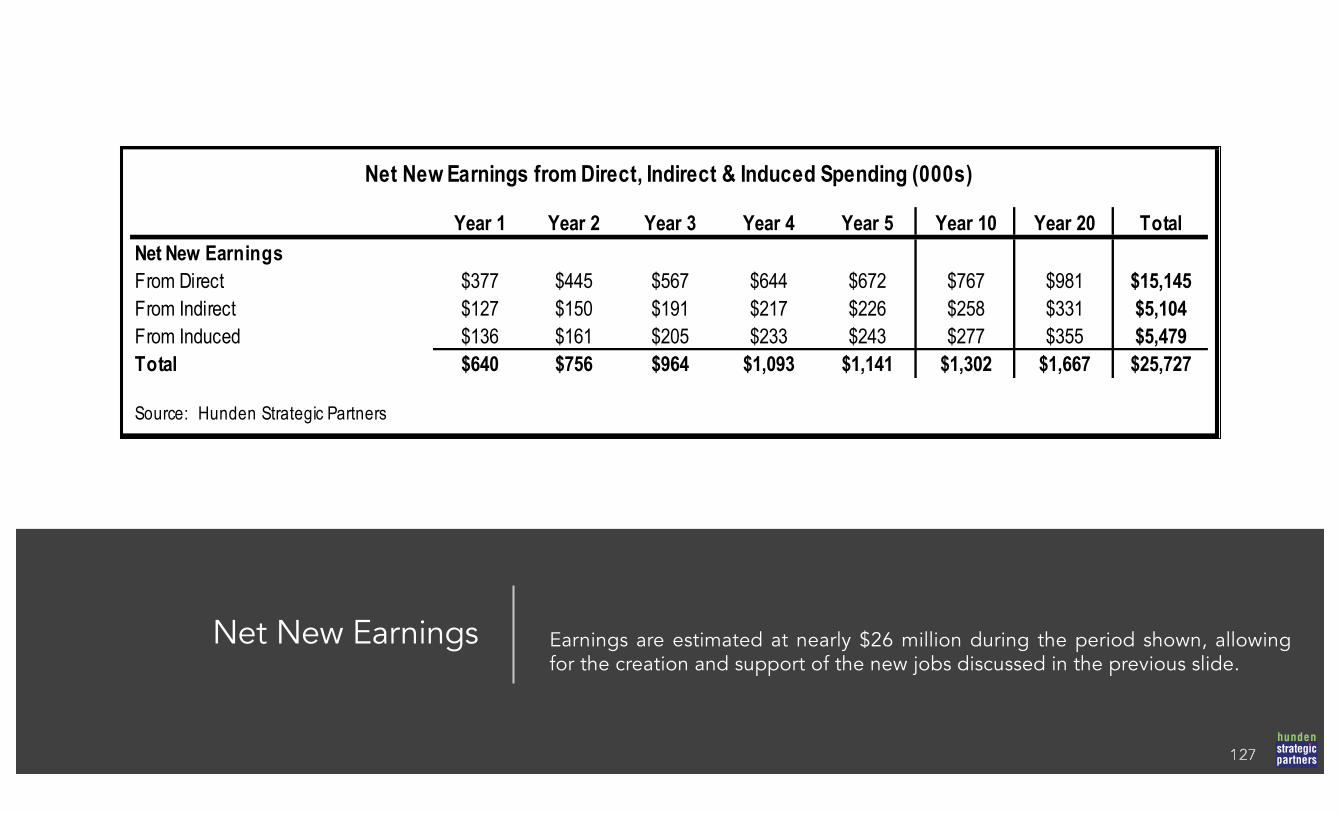
Net New Earnings Earnings are estimated at nearly $26 million during the period shown, allowingfor the creation and support of the new jobs discussed in the previous slide.
Net New Earnings from Direct, Indirect & Induced Spending (000s)
Year 1 Year 2 Year 3 Year 4 Year 5 Year 10 Year 20 TotalNet New Earnings From Direct $377 $445 $567 $644 $672 $767 $981 $15,145From Indirect $127 $150 $191 $217 $226 $258 $331 $5,104From Induced $136 $161 $205 $233 $243 $277 $355 $5,479Total $640 $756 $964 $1,093 $1,141 $1,302 $1,667 $25,727
Source: Hunden Strategic Partners
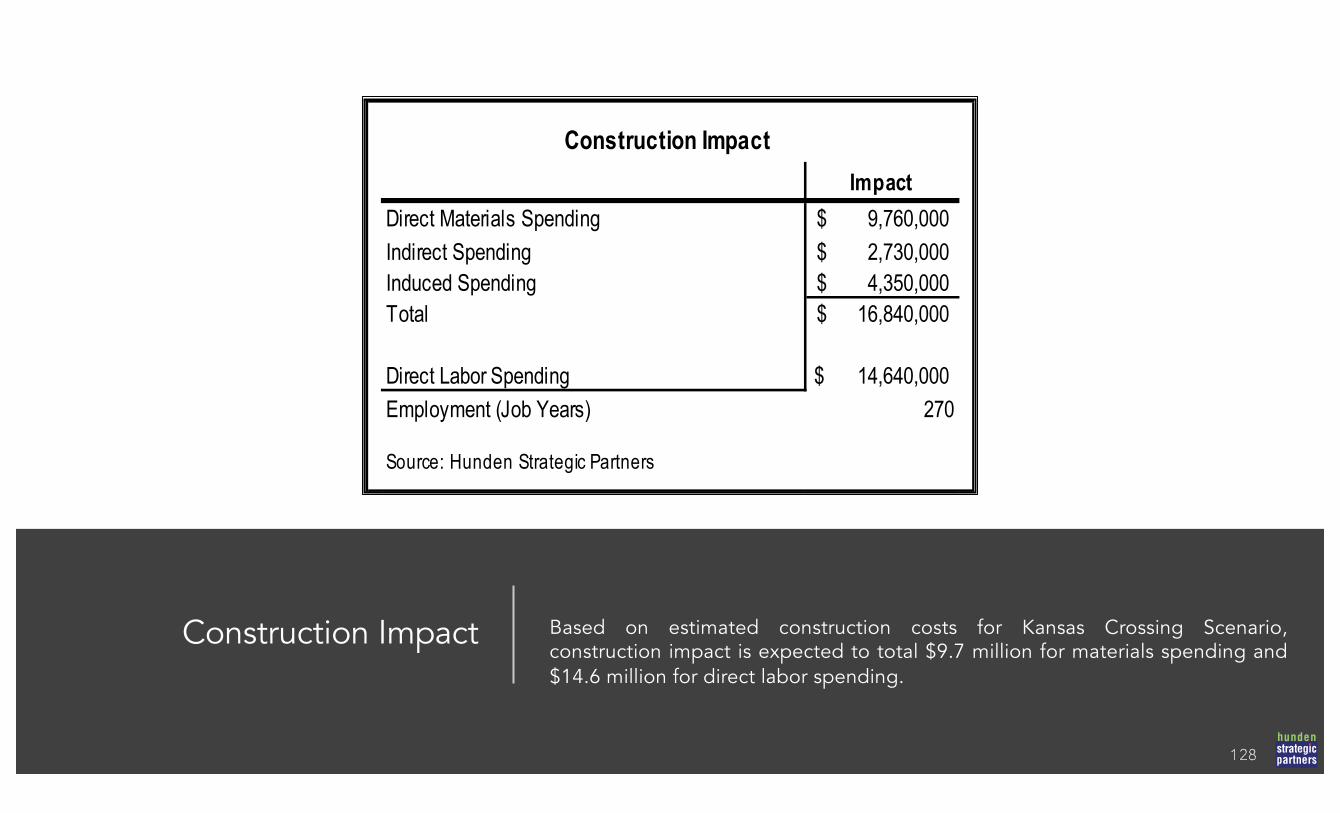
Construction Impact Based on estimated construction costs for Kansas Crossing Scenario,construction impact is expected to total $9.7 million for materials spending and$14.6 million for direct labor spending.
ImpactDirect Materials Spending 9,760,000$ Indirect Spending 2,730,000$ Induced Spending 4,350,000$ Total 16,840,000$
Direct Labor Spending 14,640,000$ Employment (Job Years) 270
Source: Hunden Strategic Partners
Construction Impact
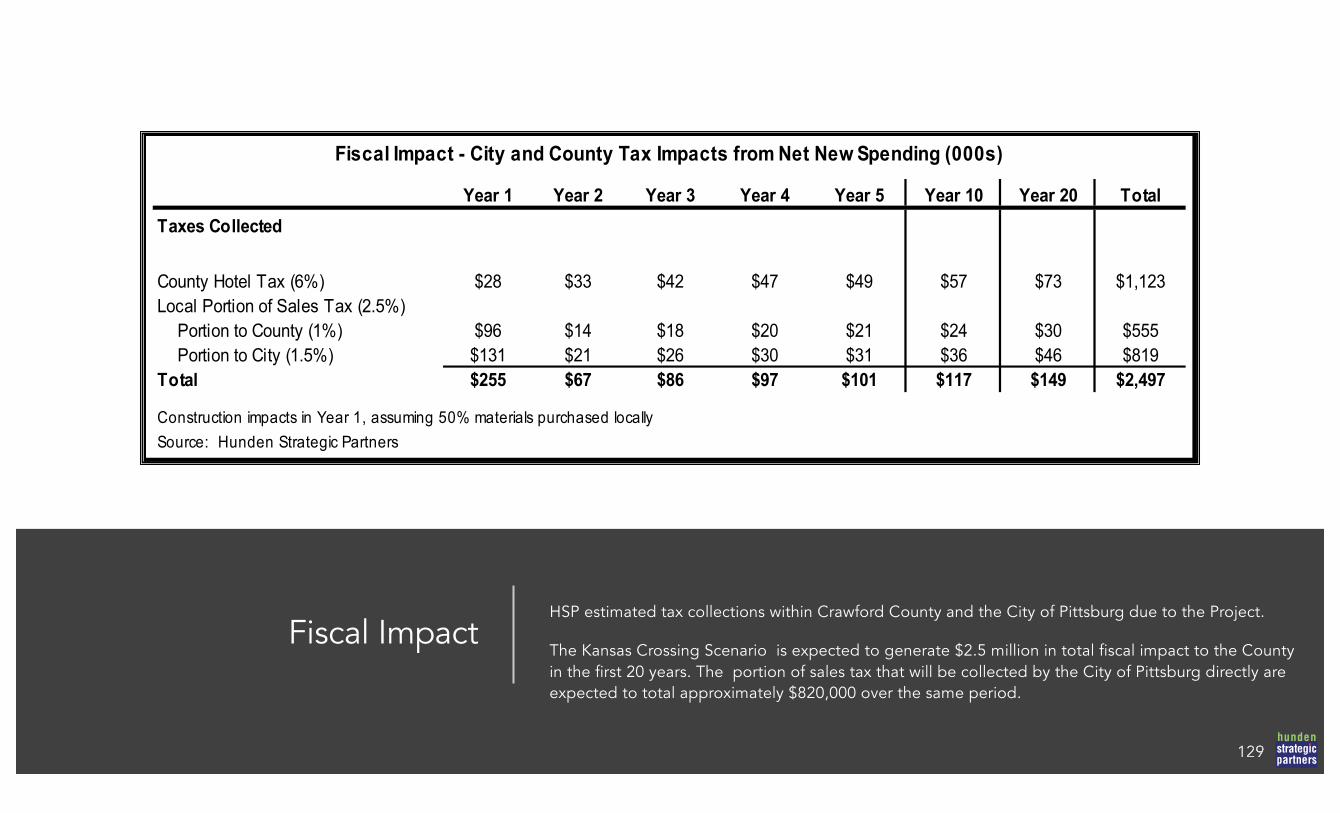
Fiscal ImpactHSP estimated tax collections within Crawford County and the City of Pittsburg due to the Project.
The Kansas Crossing Scenario is expected to generate $2.5 million in total fiscal impact to the County in the first 20 years. The portion of sales tax that will be collected by the City of Pittsburg directly are expected to total approximately $820,000 over the same period.
Fiscal Impact - City and County Tax Impacts from Net New Spending (000s)
Year 1 Year 2 Year 3 Year 4 Year 5 Year 10 Year 20 Total
Taxes Collected
County Hotel Tax (6%) $28 $33 $42 $47 $49 $57 $73 $1,123Local Portion of Sales Tax (2.5%)
Portion to County (1%) $96 $14 $18 $20 $21 $24 $30 $555Portion to City (1.5%) $131 $21 $26 $30 $31 $36 $46 $819
Total $255 $67 $86 $97 $101 $117 $149 $2,497
Construction impacts in Year 1, assuming 50% materials purchased locallySource: Hunden Strategic Partners
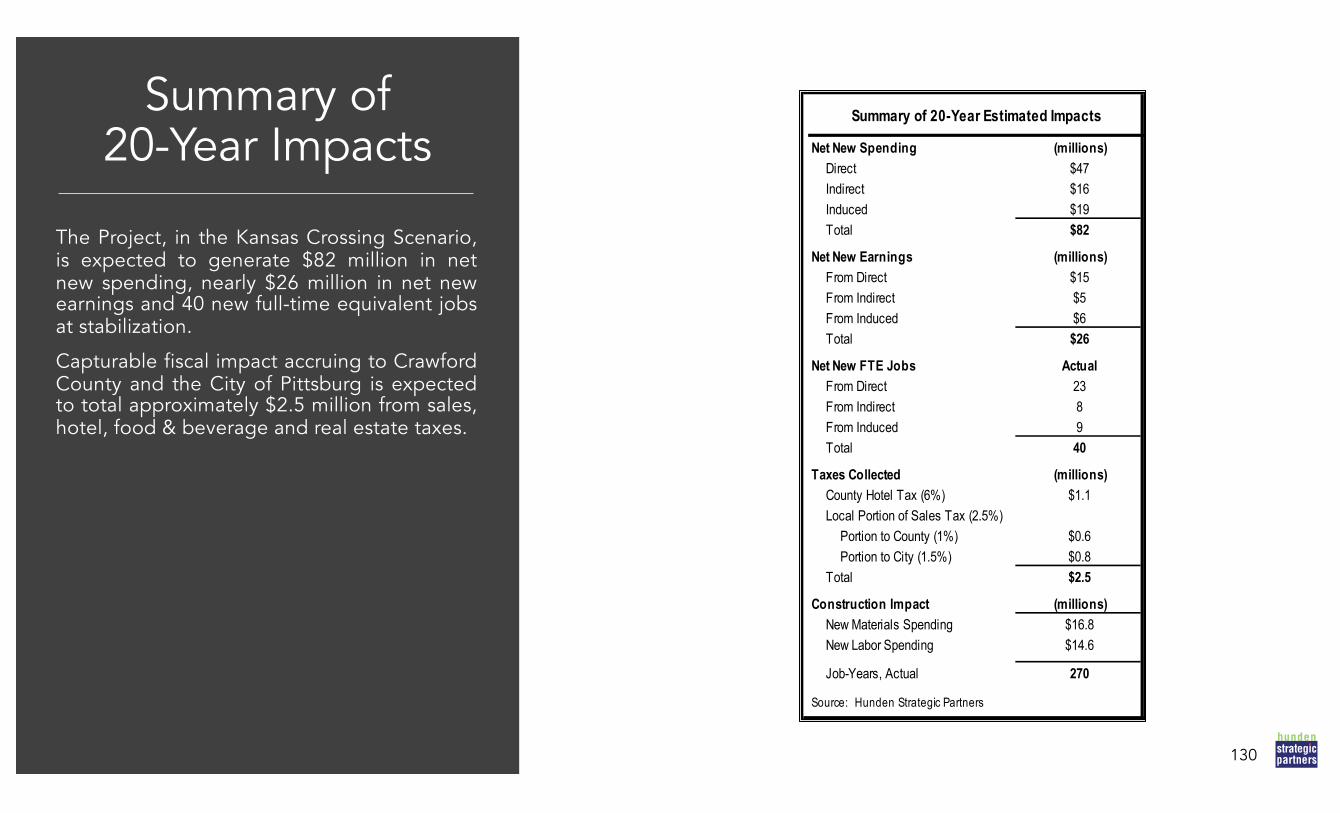
Summary of20-Year Impacts
The Project, in the Kansas Crossing Scenario,is expected to generate $82 million in netnew spending, nearly $26 million in net newearnings and 40 new full-time equivalent jobsat stabilization.
Capturable fiscal impact accruing to CrawfordCounty and the City of Pittsburg is expectedto total approximately $2.5 million from sales,hotel, food & beverage and real estate taxes.
130
Summary of 20-Year Estimated Impacts
Net New Spending (millions)Direct $47Indirect $16Induced $19Total $82
Net New Earnings (millions)From Direct $15From Indirect $5From Induced $6Total $26
Net New FTE Jobs ActualFrom Direct 23From Indirect 8From Induced 9Total 40
Taxes Collected (millions)County Hotel Tax (6%) $1.1Local Portion of Sales Tax (2.5%)
Portion to County (1%) $0.6Portion to City (1.5%) $0.8
Total $2.5 Construction Impact (millions)
New Materials Spending $16.8New Labor Spending $14.6
Job-Years, Actual 270
Source: Hunden Strategic Partners
131
Hunden Strategic Partners is a full-service real estate
development advisory practice specializing in destination assets.
With professionals in Chicago, San Diego, Indianapolis and
Minneapolis, HSP provides a variety of services for all stages of
destination development in:
- Real Estate Market & Financial Feasibility
- Economic, Fiscal & Employment Impact Analysis (Cost/Benefit)
- Organizational Development
- Public Incentive Analysis
- Economic and Tourism Policy/Legislation Consulting
- Research & Statistical Analysis
- Developer Solicitation & Selection
The firm and its principal have performed more than 700 studies
over the past 20 years, with more than $4.5 billion in built,
successful projects.
131
For further information about Hunden Strategic Partners, please contact:
Hunden Strategic Partners213 W. Institute Place, Suite 707Chicago, Illinois 60610312.643.2500www.hundenpartners.com


