Embed Size (px)
Citation preview

COUNTERING VIOLENT EXTREMISM
IN BANGLADESH
AN ECOSYSTEM APPROACH USING WEAK-
SIGNAL ANALYSIS
JANUARY 2022
Prepared under Contract No.: GS-10F-0033M / 7200AA18M00016, Tasking N031
DISCLAIMER: This publication was produced for review by the United States Agency for International Development. It was prepared by
NORC at the University of Chicago. The authors’ views expressed in this publication do not necessarily reflect the views of the United
States Agency for International Development or the United States Government.
DRG LEARNING, EVALUATION, AND
RESEARCH ACTIVITY II (DRG-LER II)
COUNTERING VIOLENT EXTREMISM
IN BANGLADESH
January 2022
Prepared under Contract No.: GS-10F-0033M/7200AA18M00016, Tasking N031
Submitted to:
USAID DRG Center
Submitted by:
NORC at the University of Chicago
Attention: Matthew Parry, Program Manager
Bethesda, MD 20814
Tel: 301- 634-9489; E-mail: [email protected]
DISCLAIMER
The authors’ views expressed in this publication do not necessarily reflect the views of the United
States Agency for International Development or the United States Government

DRG-LER II TASKING N031 COUNTERING VIOLENT EXTREMISM IN BANGLADESH
USAID.GOV FINAL REPORT | i
PREAMBLE
This report summarizes an empirical ecosystem analysis of violent extremism (VE) in Bangladesh
using weak-signal analysis. Parts of this analysis have been previously presented to USAID and the
USAID Mission in Bangladesh during briefings scheduled by USAID on October 13, 2020, May 25,
2021, and September 28, 2021.
While cross-cutting recommendations are included in Section 3 of this report, detailed
geographically-targeted interventions specific to the most vulnerable zilas are presented in Annex 1.
Annex 2 is a description of our methodology and the limitations associated with the analysis.
This research was supported by the United States Agency for International Development under
NORC subcontract, prime contract DRG-Learning, Evaluation and Research (LER II) GS-10F-0033M
/ 76200AA18M00016. Aspects of the analytical approach and methodology were developed by
Novametrics with support from the United States Office of the Secretary of Defense contract
#W911QX-13-C-0182.
We greatly appreciate the review and administrative management provided by our colleagues at
NORC and Social Impact. Novametrics would also like to acknowledge the contributions made by
Annie Liang, Stanley Shapiro, and Hannah Ulman to the research in this report. The opinions
presented in this report are those of the authors, and do not necessarily represent those of the
supporting organizations or any of the institutions with which the authors are affiliated.

DRG-LER II TASKING N031 COUNTERING VIOLENT EXTREMISM IN BANGLADESH
USAID.GOV FINAL REPORT | ii
TABLE OF CONTENTS
EXECUTIVE SUMMARY IV
I. INTRODUCTION 1
II. ANALYSIS 1 A. ANALYSIS OF CVE PROGRAMS IN BANGLADESH 1 B. ANALYSIS OF MADRASAS 2 C. ANALYSIS OF VE EVENTS IN BANGLADESH 4 D. WEAK-SIGNAL ANALYSIS OF VULNERABILITY TO VE 8
III. RECOMMENDATIONS AND CONCLUSIONS 16
IV. REFERENCES 17
ANNEX 1. GEOGRAPHICALLY-TARGETED INTERVENTIONS BY ZILA 21
ANNEX 2. TECHNICAL SUMMARY OF METHODOLOGY AND LIMITATIONS ON
THE ANALYSIS 32
TABLE OF TABLES
Table 1: Indicators and Weightings for VE Vulnerability Measure............................................................... 9 Table 2: VE Vulnerability by Zila ...................................................................................................................... 12
TABLE OF FIGURES
Figure 1: CVE Programming in Bangladesh as described in the Country Reports on Terrorism .......... 2 Figure 2: Ratio of Registered Qawmi to Aleya Madrasas and VE Vulnerability Measure ........................ 4 Figure 3: Frequency of VE and VE-Related Events Against Insurgency-Related Events ........................... 5 Figure 4: Spatial and Temporal Display of VE-Related Events ...................................................................... 6 Figure 5: VE Vulnerability Map for Bangladesh .............................................................................................. 11

DRG-LER II TASKING N031 COUNTERING VIOLENT EXTREMISM IN BANGLADESH
USAID.GOV FINAL REPORT | iii
ACRONYMS
ACLED Armed Conflict Location & Event Data
AQIS Al-Qaeda in the Indian Subcontinent
CVE Counter Violent Extremism
HuJI-B Harkat-ul-Jihad al Islami-Bangladesh (HuJI-B)
ICS Islami Chhatra Shibir
ISIS Islamic State of Iraq and Syria
JMB Jamaat-ul-Mujahideen Bangladesh
NGO Non-governmental Organization
PBCP Purbo Banglar Communist Party
SATP South Asia Terrorism Portal
SCP Situational Crime Prevention
TIP Trafficking in Persons
U15 Under 15 years of age
U18 Under 18 years of age
VE Violent Extremism
DRG-LER II TASKING N031 COUNTERING VIOLENT EXTREMISM IN BANGLADESH
USAID.GOV FINAL REPORT | iv
EXECUTIVE SUMMARY
A wide variety of data can be used to guide decision-making and program development to
prevent/counter violent extremism. Expanding beyond traditional data sources and analytical
approaches, we apply an ecosystem approach using open data and weak-signal analysis. We apply this
methodology to evaluate vulnerability to violent extremism (VE) in Bangladesh. The method
demonstrates a high predictive capability and reveals underlying causal relationships. It also allows for
the development of geographically-targeted interventions which can be used to reduce vulnerability
to VE. Our analysis demonstrates that existing, yet largely untapped, data resources, combined with
advanced data analytics, are a valuable resource for countering VE (CVE).
Although Bangladesh has made significant progress in CVE, our analysis reveals increased
vulnerability to the emergence of VE. We find high vulnerability in west-central and southwestern
Bangladesh among middle-wealth populations with traditional patriarchal structures that are
economically active and well-connected to the surrounding world. We identify Rajshahi, Jhenaidah,
Meherpur, Kushtia, and Jessore as among the most vulnerable zilas. All five of these zilas lie along the
central to southwestern edge of Bangladesh, bordering West Bengal, India. They share combinations
of characteristics, derived from multiple sources of demographic, economic, and survey data, that
our analysis has revealed to be associated with vulnerability to VE. These zilas are mostly agricultural
with main cities that serve as industrial or transport centers. The zilas are characterized by strong
technological and physical connectivity, leading to a mobile population with access to information.
The populations also have sociocultural characteristics, derived from multiple sources of
demographic, economic, and survey data, that reflect high levels of gender inequality and traditional
male-dominated, patriarchal norms.
Our analysis also identifies differing strategies between the most prominent VE actors in Bangladesh:
ISIS and al-Qaeda in the Indian Subcontinent (AQIS). ISIS appears to be focusing on gaining territory
and conquering populations within Bangladesh. AQIS appears to be focused on international
recognition.
The growing influence of Hefazat-e-Islam poses a particularly nuanced form of long-term risk due to
their influence over increasing numbers of unregistered Qawmi madrasas. Their ties with VE groups,
and their prominence in locations that we have identified as among the most vulnerable in the
country, create concern, both in promoting radical Islamist thinking, and as recruitment points. With
Rohingya Muslim refugees banned from enrolling in government schools, private (Qawmi) madrasas
may also be emerging as a source of radicalization among the refugee population.
While we provide geographically-targeted interventions for the most vulnerable zilas (Annex 1),
several cross-cutting recommendations based on our analysis are included in this summary report.
Most notable are the need to: a) expand CVE programming, b) tailor CVE programming to the type
of VE group operating in the area, c) include as CVE strategy efforts specifically designed to reduce
societal gender inequality, d) address ecosystem characteristics that are common to VE and human
trafficking, and e) increase transparency of unregistered Qawmi madrasas.

DRG-LER II TASKING N031 COUNTERING VIOLENT EXTREMISM IN BANGLADESH
USAID.GOV FINAL REPORT | 1
I. INTRODUCTION
In September 2014, al-Qaeda entered Bangladesh under the name al-Qaeda in the Indian
Subcontinent (AQIS). In November 2015, the Islamic State declared its presence in the country as
ISIS-Bangladesh (ISIS) (OSAC, 2020). During the ensuing years, both AQIS and ISIS have claimed
responsibility for numerous deadly attacks in the country through social media.
Despite these attacks, the government of Bangladesh attributes all violence to domestic terrorist
groups. For example, ISIS claimed responsibility for the July 2016 Holey Artisan Bakery attack that
resulted in the deaths of 28 civilians and policemen, and uploaded photos showing militants posing
with the ISIS flag at the scene. The Bangladesh Information Minister, however, stated, “As of this
moment, we can safely say that they are home-grown terrorists. They are members of a local
domestic terrorist network” (Comerford, 2017).
Although there is international agreement that transnational terrorist groups do exist in Bangladesh,
the government’s statement that militants belong to “a local domestic terrorist network” can also be
construed as accurate. AQIS and ISIS largely operate through local Bangladesh militants who belong
to domestic extremist organizations. These organizations are either satellites for transnational
terrorism, meaning local offshoots of AQIS or ISIS that operate under different names, or are
comprised of domestic, Bangladesh-based members that share ideology with, and pledge allegiance
to, either AQIS or ISIS. Specifically, the Ansarullah Bangla Team, which later changed its name to
Ansar al-Islam, is officially linked to, and therefore considered an affiliate of AQIS (OSAC, 2020).
Harkat-ul-Jihad al Islami-Bangladesh (HuJI-B), a longstanding domestic group in the country, has
operatives that align with AQIS, and is therefore considered AQIS-affiliated (SATP, n.d.).
Similarly, ISIS has a close relationship with the domestic group Jamaat-ul-Mujahideen Bangladesh
(JMB), with JMB members pledging allegiance to ISIS, and ISIS praising JMB. Neo-JMB is another
offshoot of the group that operates under a pro-ISIS ideology (OSAC, 2020). The Bangladesh
government usually blames either JMB or Neo-JMB for attacks claimed by ISIS, including the Holey
Artisan Bakery attack (Comerford, 2017). For the purposes of our analysis, both these organizations
are considered ISIS affiliates.
In our analysis, we treat ISIS and AQIS as fundamentally different groups. Although ISIS began as al-
Qaeda (AQ) in Iraq, it disagreed with AQ leadership because it wanted to wage sectarian war, attack
Sunni Muslims deemed apostates, and kill Shi’a Muslims, all actions considered too extreme by AQ
leadership. After disputes over control in Syria, AQ formally disassociated from ISIS in 2014, leaving
each group to form their own strategy (Byman, 2015).
In this report, we begin with a brief assessment of Bangladesh’s CVE programs and madrasas,
followed by a temporal (time) and spatial (location) analysis of VE events that have occurred since
2000. We then use a large variety and volume of data, and data analytics to assess vulnerability to VE
in Bangladesh. We take a big-data ecosystem approach based on Situational Crime Prevention (Eck
and Clarke, 2019) to identify, through weak-signal analysis, the combination of socioeconomic
factors that characterize vulnerability to VE.
As part of our analysis, we present a VE vulnerability map, a vulnerability measure for each of the
zilas based on our weak-signal analysis, cross-cutting recommendations, and recommendations for
geographically-targeted interventions. Our focus is on prevention, with the goal of undertaking
proactive measures to reduce vulnerability to VE. The analytical objective is to identify ecosystems
where VE is most likely to emerge in the future, and to identify the combination of characteristics

DRG-LER II TASKING N031 COUNTERING VIOLENT EXTREMISM IN BANGLADESH
USAID.GOV FINAL REPORT | 2
associated with those ecosystems. Geographically-targeted interventions can then be used to reduce
that vulnerability.
The annexes of this report include a description of the analytical methodology, limitations associated
with the analysis, and, for the most vulnerable zilas, a zila-by-zila analysis of VE vulnerabilities and
related-metrics with recommendations for potential geographically-targeted interventions.

DRG-LER II TASKING N031 COUNTERING VIOLENT EXTREMISM IN BANGLADESH
USAID.GOV FINAL REPORT | 1
II. ANALYSIS
Our analysis of VE in Bangladesh is presented in four sections:
1. We begin by assessing Bangladesh's CVE programs with a dataset we compiled from the US
Department of State’s annual Country Report on Terrorism (CRT).
2. We then present an analysis where we use the locations of known madrasas to make
inferences about unregistered madrasas and their potential relationship with VE.
3. Next, we analyze a dataset we assembled of over 19,000 events from 2010 through 2020.
Using the pattern of events, both through time (temporal) and location (spatial), we identify
changes that may serve as precursors of future events.
4. Finally, we use millions of data values and weak-signal analysis to identify vulnerability to VE,
and the underlying combination of characteristics associated with vulnerability to VE, in
Bangladesh.
A. ANALYSIS OF CVE PROGRAMS IN BANGLADESH
The analysis of Bangladesh’s CVE programs uses our time-series (2010-2019) dataset. The dataset
contains information on Bangladesh’s CVE programming, collected from the annual US State
Department’s CRTs. We built our dataset upon an existing dataset covering 2010-2017 (Ambrozik,
2019), and extended it through the most recently available CRT (2019).
The resulting time-series analysis is presented in Figure 1. Since 2010, Bangladesh has built up its
CVE program, incorporating additional programming such as engaging civic society; counter-
messaging; and deradicalization, disengagement and rehabilitation. Bangladesh has also engaged
additional stakeholders in CVE initiatives including religious leaders and academia. The analysis also
reveals that Bangladesh has not developed a national CVE strategy and have not invested in
intervention programing that provides assistance to individuals on the path towards radicalization.

DRG-LER II TASKING N031 COUNTERING VIOLENT EXTREMISM IN BANGLADESH
USAID.GOV FINAL REPORT | 2
Figure 1: CVE Programming in Bangladesh as described in the Country Reports on Terrorism
0
2
4
6
8
10
12
2010 2011 2012 2013 2014 2015 2016 2017 2018 2019
Bangladesh CVE Programs
National Strategy Programming DDR Prevention
Countermessaging Intervention RoleofReligion CommunityActive
GovernmentActive Relevant/Specific Concern
Figure 1 caption: Time-series analysis of CVE programs in Bangladesh. The following are definitions of the various program
categories (Ambrozik, 2019): National Strategy refers to a national CVE strategy or action plan, Programming refers
to whether a country has implemented any CVE programming. DDR, or deradicalization, disengagement, and rehabilitation programming, consists of programs that target individuals who are already engaged in VE by providing these individuals with
assistance in leaving VE. Prevention programming attempts to prevent VE from surfacing by addressing root causes.
Counter messaging refers to efforts that attempt to tackle VE by promoting an alternative viewpoint or perspective.
Intervention programming refers to programs that provide assistance to individuals on the path towards radicalization. Role of religion programming means that (1) the main actors involved in a program come from the religious community,
or (2) the programs focus on religion through the content of the program or target population of the program.
Community Active indicates civil-society participation: any instance where non-government actors are involved in CVE
initiatives within a country. Relevant/Specific consists of two components. A CVE-specific program refers to a program that meets the following requirements: (1) the program has a primary objective to prevent or counter violent extremism,
and (2) the program directly addresses a perceived root-cause of violent extremism or threat. A CVE-relevant program
refers to a program that meets the following requirements: (1) preventing or countering violent extremism is not the
primary objective of a program; and (2) the program indirectly helps prevent or counter violent extremism. Concern is an indicator for whether CVE programs reportedly threaten religious freedom.
B. ANALYSIS OF MADRASAS
Our analysis of madrasas attempts to determine if there is an identifiable relationship between the
presence of certain types of madrasas and vulnerability to VE. In Bangladesh, there are four types of
schools: state-run, private, non-governmental organization-run (NGO), and madrasas. Of these,
madrasas, which enroll over 4 million students, focus on Islamic education. There are two types of
madrasas: Qawmi, which are privately run and lie outside of the control of the government, and
Aleya, which are regulated by the Bangladeshi government (Ellis, 2007). Aleya madrasas, while still
maintaining a focus on Islamic education, educate their students on a variety of other topics,
including science, math, English, and social justice. At Qawmi madrasas, the curriculum is determined
by the teacher, and it often neglects the aforementioned topics (Chandan, 2017). Even parents
seeking a secular education may end up sending their children to madrasas, because they are less
expensive (or free) compared to state-run public or NGO schools (Shaon, 2018). With Rohingya

DRG-LER II TASKING N031 COUNTERING VIOLENT EXTREMISM IN BANGLADESH
USAID.GOV FINAL REPORT | 3
Muslim refugees banned from enrolling in government schools, many are enrolling in Qawmi
madrasas (Corraya, 2019) which some have argued may serve as recruitment pathways for VE (e.g.,
Alam, 2021).
There is debate over the role of Qawmi madrasas as potential recruitment points for VE groups.
Recent papers circulated within the extremist group Ansar Al Islam included plans to focus their
recruiting efforts on young students, especially those from madrasas (Alam, 2021). Jamaat-ul-
Mujahideen has used a similar recruitment strategy in the past (Roul, 2011). In addition, the Ahl-e-
Hadith Islamic movement, a traditionalist sect similar to Wahhabism, supports between 200 and
2,000 Qawmi madrasas in Bangladesh, all of which follow their own syllabi (Roy et al., 2020).
Appearing in Bangladesh at Rajshahi University in 1994, the Ahl-e-Hadith Islamic movement has
argued that followers should engage in Jihad against Islamic fallacies.1 The madrasas associated with
this movement, which are likely to be unregistered, are often funded by Saudi Arabia, and have been
reported to be recruitment targets for JMB (ICG, 2018).
The Qawmi madrasa system is associated with Hefazat-e-Islam, or “protector of Islam,” an Islamist
group formed in 2010 to fight secularism in Bangladesh. The group was formed by a group of
teachers from several madrasas in Chittagong (Khalidi, 2013). The group has ties with Saudi Arabia,
the Pakistani intelligence services (ISI), and Jamaat-e-Islami (Chaudhury, 2021). Hefazat is thought to
be financed by doctrinaire Islamists in Saudi Arabia (Banyan, 2017). Saudi Arabia is reported to be
donating 10.8 billion euros to build 560 mosques in Bangladesh (Corraya, 2017). Hefazat has had
increasing political influence, and the Bangladeshi government has given them concessions, including
an announcement that a degree from a Qawmi madrasa would be equivalent to a traditional master’s
degree, and the removal of a statue of a Greek goddess from the supreme court. Only in May 2021,
after Hefazat incited violence over the visit of Indian Prime Minister Narendra Modi, did the Awami
League alter their policy of accommodation to Hefazat (The Economist, 2021).
The growing influence of Hefazat-e-Islam poses a particularly nuanced form of long-term risk
through their influence over increasing numbers of unregistered Qawmi madrasas. Their 13-point
demand includes removal of secular sculptures, mandatory Islamic education, and maintaining capital
punishment for defaming Islam. Although the numbers are unknown, with estimates varying from
6,000 to 15,000, the private (Qawmi) madrasas are becoming increasingly numerous, wealthy, and
powerful with funding from Gulf State nations.
Because the number and locations of unregistered madrasas are unknown, we can only gain insight
on their relationship with VE vulnerability indirectly. We have assembled a dataset of registered
Qawmi madrasas and public Aleya madrasas and evaluated their relationship with our independently
derived VE vulnerability measure presented in section 2.4 of this report. Figure 2 shows the
relationship between our VE vulnerability measure and the ratio of registered Qawmi madrasas to
public Aleya madrasas.
1 The Bangladesh Ahl-e-Hadith Islamic originated in Rajshahi (Roy, 2018), the zila most vulnerable to VE according to our
vulnerability measure shown later.

DRG-LER II TASKING N031 COUNTERING VIOLENT EXTREMISM IN BANGLADESH
USAID.GOV FINAL REPORT | 4
Figure 2: Ratio of Registered Qawmi to Aleya Madrasas and VE Vulnerability Measure
Figure 2 caption: Linear regression of the ratio of registered Qawmi to Aleya Madrasas vs. our independently derived VE
vulnerability measure.
For the purposes of this analysis, we assume the ratio of Qawmi and Aleya madrasas is relatively
constant. If the assumption is correct, areas with a ratio lower than 1.0 would indicate locations
where there are fewer registered Qawmi madrasas than expected. In such areas there are likely to
be more unregistered Qawmi madrasas.
While the assumption of a relatively constant ratio between Qawmi and Aleya madrasas is
speculative, and the relationship is not strong, the analysis reveals an intriguing trend. The trend is
consistent with the hypotheses that unregistered Qawmi madrasas are disproportionately present in
areas that have higher vulnerability to VE.
C. ANALYSIS OF VE EVENTS IN BANGLADESH
A dataset of over 19,000 conflict events from 2010-2020 were assembled from three sources: a)
Armed Conflict Location & Event Data Project (ACLED) (Raleigh et al., 2010), b) Uppsala Conflict
Data Project (UCDP) Global Event Database v20.1 (Pettersson & Öberg, 2020), and c) Global
Terrorism Database (GTD) (START, 2019). The data were cleaned and compiled into a single,
integrated event database.
Each event was assigned to one of three categories of affiliation: “Yes,” “Maybe,” and “Other.” “Yes”
events are listed as perpetrated by, or affiliated with, a terrorist organization identified by the U.S.
Department of State (U.S. DoS, n.d.), the South Asia Terrorism Portal (SATP), or that are identified
as part of the Global Jihadist Movement, as defined by Carson and Suppenbach (2017). “Maybe”
events are those that are not “Yes” events but are events for which responsibility has been
attributed to perpetrators identified by the Global Terrorism Database (START, 2019). “Other”

DRG-LER II TASKING N031 COUNTERING VIOLENT EXTREMISM IN BANGLADESH
USAID.GOV FINAL REPORT | 5
events are those that are associated with actors identified in the Armed Conflict Location and Event
Data Project (Raleigh et al., 2010) and/or the Uppsala Conflict Data Project (UCDP) Global Event
Database v20.2 (Pettersson & Öberg, 2020).
We analyze these events first as a time-series (Figure 3), and then as a time-series presented with
geographic latitude (Figure 4). In the second analysis (Figure 4), the presentation of events by
location according to their geographic latitude allows us to see changes in the pattern of events both
in time and in location simultaneously.
Figure 3 presents our analysis of the frequency of events (2010-2020), differentiating with red the
combined “Yes” and “Maybe” events (“Yes/Maybe”) from the background in grey of the “Other”
events. There can be a continuum between what are considered VE events and what are considered
insurgency events. The red bars represent events that we identify with greatest confidence as VE or
VE-related, while the grey bars in the background represent events that are more likely insurgency-
related.
Figure 3: Frequency of VE and VE-Related Events Against Insurgency-Related Events
Figure 3 caption: Time-series of VE events by category 2010-2020. Events characterized as “Yes” or “Maybe” are plotted in red against the grey background of “Other” events. Significant political events, relevant violent extremist group
developments, and major attacks are annotated on the time-series.
As illustrated in Figure 3, there were a high number of “Other” events relative to VE events from
January 2010 through December 2012. During this period, there were an average of 173 “Other”
and 16.5 “Yes/Maybe” events per month, resulting in a 10.4 to 1 ratio. In January 2013, the number
of VE “Yes/Maybe” events rose sharply. During this period, there were an average of 164 “Other”
and 34.4 “Yes/Maybe” events per month, resulting in a 4.8 to 1 ratio. The number of “Yes/Maybe”
events more than doubled compared to the previous three years, while the number of “Other”
events remained roughly the same.

DRG-LER II TASKING N031 COUNTERING VIOLENT EXTREMISM IN BANGLADESH
USAID.GOV FINAL REPORT | 6
During the period July 2013 through January 2015, Bangladesh gained international attention as a
hotspot for terrorism (Roul, 2016). All events decreased during May 2015 to July 2018, and
“Yes/Maybe” events disappeared almost completely by the Summer of 2017 following Bangladesh’s
increased CVE efforts. The increased CVE efforts included police operations and raids of terrorist
hideouts across the country, social campaigns, tightening bail conditions for those accused of
extremism, increasing the monitoring of educational institutions to prevent radicalization, and of
imams to identify and prevent hate speech (Comerford, 2017).
An increase in “Other” events begins in August 2018 and continues through the time-series. This
increased level of background insurgency events resembles the precursor pattern in the three years
prior to the 2013 VE increase. In the last 2.5 years, there have been an average of 138 “Other” and
6 “Yes/Maybe” events, a 23 to 1 ratio. Because the previous period of increased “Other” activity
primed the stage for the emergence of VE, the current surge of “Other” events could be a similar
precursor, indicating increased vulnerability to VE.
Figure 4 presents a time-series over the last ten years of events by AQIS (yellow) and by ISIS (red).
For the purposes of this analysis, “AQIS” and “ISIS” include their respective domestic affiliates.
Jamaat-e-Islami (blue), a historic extremist organization in Bangladesh, is included in the timeseries
for comparison. The number of deaths associated with each event is represented by the size of the
data point. The horizontal axis is time, as with the previous plot (Figure 3). The vertical axis,
however, is now latitude. adding a spatial perspective to the temporal distribution. For reference,
Dhaka is at 23.8° N, the latitude where most AQIS (yellow) events occur.
Our analysis (Figure 4) reveals that ISIS has been associated with over ten times as many attacks as
AQIS (78 vs. 6). ISIS attacks result in less than half as many deaths per event, an average of 1.9
deaths, while AQIS events average 5.3 deaths.
Figure 4: Spatial and Temporal Display of VE-Related Events
Figure 4 Caption: Time-series of violent extremist events showing the difference between AQIS, ISIS, and Jamaat-e-Islami. Time-series is plotted by latitude to provide a spatial component to the time-series. The size of the dot corresponds to the
number of deaths at that event. “Al-Qaeda & affiliates” includes AQIS, Ansarullah Bangla Team, Ansar al-Islam, and HuJI-B.
“ISIS-Bangladesh & affiliates” includes ISIS, JMB, and Neo-JMB. “Jamaat-e-Islami” includes Jamaat-e-Islami and its student
wing Islamic Chhatra Shibir (ICS).

DRG-LER II TASKING N031 COUNTERING VIOLENT EXTREMISM IN BANGLADESH
USAID.GOV FINAL REPORT | 7
Our analysis of the distribution, frequency, and magnitude of VE events reveals the different
strategies and goals of AQIS and ISIS (Figure 3 and Figure 4). AQIS targets the country’s capital,
Dhaka (23.8°N), suggesting their goal is to gain international attention and cause civil unrest. ISIS, on
the other hand, has more frequent and smaller events that are broadly distributed. Their strategy is
consistent with their goal of becoming ingrained in the societal landscape and establishing themselves
as a permanent presence in the country. It supports the idea that ISIS wants to increase their
influence by gaining large swaths of territory and holding it through fear, mass executions, and other
violent actions; and that ISIS aims to purify the Islamic community and create a government run
under their version of Islamic Law (Byman, 2015).
Although Bangladesh has made significant progress in CVE, our time series analysis of violent events
from 2010-2020 suggests that there is high vulnerability for VE in Bangladesh. While there have been
fewer confirmed VE events in the last few years, the increasing level of “other” conflict events may
be a precursor for the re-emergence of VE. In the past, increased levels of such events appear to
have “primed the stage” for VE. Future elections and political instability are likely to serve as
triggering events.
ISIS’ wide distribution of events, mirroring the previous strategy of Jamaat-e-Islami three years
earlier, reflects the organization's strategy to gain control over large swaths of land, become
ingrained in the societal landscape, and impose their ideology. In the territory it controls, the Islamic
State uses violence to terrorize the population into submission and “purify” the community. Both
the event time-series analysis and spatial analysis are consistent with the concern that new ISIS cells
may be re-emerging (Middle East Institute, 2019).
In contrast, AQIS events, when they were active, occur around the capital city, Dhaka (23.8°N
latitude). Al-Qaeda favors large-scale, dramatic attacks against strategic or symbolic targets. The
attacks are consistent with the idea that the terrorist group focused on gaining international
attention and causing civil unrest in the most populated part of the country rather than provoking
widespread violence.
Some suspect al-Qaeda may now be presenting itself as a more stable option than the Islamic State,
and quietly expanding their base of operations (e.g., Middle East Institute, 2019). Although AQIS has
not been involved in a violent event since 2018, there were numerous arrests of Ansar al-Islam
leaders in 2020 and 2021, perhaps signaling efforts to spread AQIS’ ideology and recruit new
members (Singh, 2021). In the first half of 2021, 42 Ansar al-Islam leaders were arrested, and most
arrests involved the recovery of extremist materials including books and mobile devices. The
organization’s strategy includes recruiting citizens through spiritual messaging and preaching, at
madrasas and through social media, and training militants at remote camps (Singh, 2021). Such an
ideology-centered approach explains why our analysis shows that AQIS has not been implicated in
any recent violent events despite their activity. The lack of violence could mean that AQIS is building
up their membership, avoiding international attention, and preparing for a reemergence.
AQIS reportedly dominates the VE messaging in social media (~62 percent of VE messaging),
compared to ISIS (~eight percent) (SecDev, 2021). While connections between social media activity
and VE events have not been empirically established, the larger social media presence of AQIS is
consistent with their strategy of reaching large audiences. The lower profile presence of ISIS is
consistent with their strategy of working at the more local level, occupying territory, and using
violence to impose their ideology on populations, rather than to attract international attention
(Byman, 2015).

DRG-LER II TASKING N031 COUNTERING VIOLENT EXTREMISM IN BANGLADESH
USAID.GOV FINAL REPORT | 8
ISIS and its affiliates are the most likely perpetrators in the next wave of extremist violence, as they
continue to be the most active terrorist group in Bangladesh. JMB and Neo-JMB members are
regularly arrested or killed in police raids of hideouts throughout the country, and stockpiles of
weapons and extremist materials are usually found in the terrorist dens. The newest development in
ISIS strategy is the increasing prominence of a ‘sister wing’ of Neo-JMB, as the arrests of two female
Neo-JMB leaders in 2020 revealed robust efforts by female militants to indoctrinate women through
social media. Though overlooked as a part of terrorist strategy in the past, the ISIS affiliate is using
female terrorists in armed violence and in their campaign to radicalize entire families rather than just
individual recruits (Roul, 2021).
D. WEAK-SIGNAL ANALYSIS OF VULNERABILITY TO VE
From an analytical perspective vulnerability to VE can be classified as a “wicked problem” – the type
of problem that is characterized by a myriad of dynamically interconnected variables and defies a
single solution.2 Causal relationships are seldom direct, and the circumstances that foster the
problem vary from location to location. Even when causes appear similar, solutions that work in one
location seldom work in another location, owing to the vast array of varying sociocultural and
economic conditions.
While “wicked problems” may defy single, linear, and universal solutions, they can be addressed
through an ecosystem approach. In using such an analytical approach, we parameterize the
socioeconomic ecosystem in which VE exists to reveal, through weak-signal analysis, the
combinations of characteristics that allow VE to occur. Once identified, we can formulate
geographically-targeted interventions to disrupt that support system and proactively mitigate VE.
Our ecosystem approach is grounded in the criminology theory of Situational Crime Prevention
(SCP). SCP has helped law-enforcement organizations realize significant reductions in the occurrence
of crime and in the number of people who have experienced crime (Eck and Clarke, 2019; Clarke,
R., 1995). SCP focuses on the criminal setting and begins with an examination of the circumstances
(the “ecosystems”) that allow for particular types of crime. By gaining an understanding of these
ecosystems, mechanisms are then introduced to change the relevant ecosystems and reduce the
opportunities for particular crimes. The SCP paradigm is increasingly accepted among practitioners
who work on preventing and countering violent extremism. It is also consistent with the growing
emphasis on preventative measures which some have previously defined as “efforts to influence
individual and/or environmental factors that are suggested to create the conditions in which VE can
flourish, using social or educational, rather than explicitly security-driven measures” (Stephens et al.,
2021).
Coincident with the growing emphasis on prevention is an increased availability of open data. These
datasets include not only traditional sources such as survey and census data, but also data from both
formal and informal media sources, as well as geospatial data from Earth-observation technology.
While datasets may be of varying quality and completeness, each has the potential of carrying
information that reflects characteristics of a population, either by itself or through combination with
other datasets.
To characterize the ecosystem of VE in Bangladesh, we began by compiling millions of data values for
socioeconomic indicators, or attributes, from diverse datasets. These data are then cleaned,
standardized, normalized, and vectorized through a series of statistical algorithms, subdividing
2 The original use of the term ‘wicked problem” is attributed to design theorist Horst Rittel.

DRG-LER II TASKING N031 COUNTERING VIOLENT EXTREMISM IN BANGLADESH
USAID.GOV FINAL REPORT | 9
populations into smaller units for which distinct attributes can be measured. For Bangladesh, we
developed over half a million measures covering over 1,500 attributes for all 544 upazilas (units of
Bangladesh’s third administrative level). High-resolution geospatial and Earth-observation data, such
as land cover and climatic variables, were converted into tabular data for analysis. Depending on the
data type, values were summed (e.g., to determine population), or statistical measures of the value’s
distribution were used (e.g., average travel distance to a road, market, or urban area).
Using our collection of over 1,500 attributes, we identified through weak-signal analysis a VE
vulnerability measure composed of 26 weighted indicators (Table 1). Our vulnerability measure, has
a high predictive value for vulnerability to VE in Bangladesh, as confirmed by reported VE events
from ACLED, GTD, and UCDP.
Table 1: Indicators and Weightings for VE Vulnerability Measure
Indicator in Vulnerability Measure Weighting Percentage of women who gave birth in a medical facility A 0.169 Percentage of women who received antenatal care B 0.158 Percentage of women who have ever used contraception in their lifetimes A 0.155 Temperature annual range (maximum temperature of warmest month - minimum temperature of
coldest month) C 0.152
Percentage of children (aged 1-5) who can identify at least 10 letters of the alphabet B 0.149 Percentage of women (aged 15-49) married under the age of 15 A 0.142 Percentage of households that own a bicycle B 0.141 Percentage of households that own a motorcycle B 0.140 Percentage of guardians that know how to register their child’s birth A 0.138 Percentage of women (aged 15-49) married under the age of 18 A 0.134 Percentage of households that have a TV A 0.127 Number of trafficking victims per 100,000 population D 0.127 Mango area (as a percentage of total acreage) E 0.126 Percentage of men whose highest level of education is completed higher education A 0.125 Percentage of women who used any materials such as sanitary pads, tampons, or cloth A 0.124 Percentage of women who have no sons or daughters living with them A 0.123 Banana area (as a percentage of total acreage) E 0.111 Percentage of women who have ever used a computer or a tablet A 0.110 Percentage of women who wear glasses A 0.106 Percentage of women who never read a newspaper or magazine A -0.105 Percentage of women who agree that a husband is justified in beating his wife A -0.117 Percentage of men whose highest level of education completed is primary A -0.126 Percentage of women who have been living in their current location since birth A -0.129 Ratio of daughters to sons who are currently living with their mother A -0.132 Percentage of women whose highest level of education completed is primary A -0.138 Percentage of households with a metal or tin roof A -0.158
Sources: A BBS and UNICEF (2019), B BBS and UNICEF (2014), C Hijmans et al. (2005), D PSD BGD (2016 and 2018), E BBS
(2020)
A detailed technical summary of weak-signal analysis is included in Annex 2. In mathematical terms,
we use singular-value decomposition, combined with varimax rotation and squared-factor loadings as
an unsupervised self-learning algorithm to identify key attributes and their relative weightings
(OECD, 2008). In non-mathematical terms, we begin with a wide range of socioeconomic indicators
(in this case, over 1,500) to capture the full spectrum of factors that are associated with a
population. The algorithm then identifies the optimal combinations of these indicators (in this case,
26) that are predictive of VE, while eliminating the combinations that are neither conducive nor
preventative. The higher the value of the composite vulnerability measure, the higher the
vulnerability for VE activity.

DRG-LER II TASKING N031 COUNTERING VIOLENT EXTREMISM IN BANGLADESH
USAID.GOV FINAL REPORT | 10
An additional advantage of weak-signal analysis is that the analysis is agnostic. We do not pre-select
and combine indicators that we think are related to VE, nor do we limit our analysis to any single
survey or type of data. We allow the weak-signal analysis to reveal the combinations of indicators
and their relative weightings that are most characteristic of ecosystems where VE occurs. We then
apply the measures and their relative weightings using data values for each location. Previously
hypothesized relationships are often confirmed, but the discovery of unexpected relationships is just
as common. And it is the discovery of the unexpected relationships that lead to a more sophisticated
understanding of VE, and in turn, offers new opportunities for more nuanced and effective
interventions.
Although the final vulnerability measure is composed of a relatively small subset of indicators that
represent the optimal combination characteristic of the VE ecosystem, the analysis reflects the full
sociocultural-economic ecosystem. Indicators that were excluded from the final measure are
indicators that: a) do not have significant associations with VE, either in a positive or negative
capacity, or b) that correlate so strongly with those in the final measure that their inclusion would
be redundant. We do not assume the indicators are necessarily direct causes of vulnerability, rather
we assume they are proxy measures that reflect societal characteristics that are difficult to measure
directly. For example, we cannot measure gender inequality directly. Certain manifestations of
gender inequality – high female child marriage rates and violence towards women, however, can be
measured. For each location, we interpret the causes of vulnerability using the specific indicator
values for that location and our interpretation of those indicators.
We confirm our analysis through “hind-casting,” which consists of testing the model against known
events in the past. The purpose of hind-casting is to see if the model correctly predicts areas of
known VE when the parameters for those areas are used as input for the model. When the VE
vulnerability measure is hind-casted with reported VE events, we see that the vulnerability measure
is a strong, statistically significant predictor of VE. When our vulnerability measure is hind-casted, it
correctly identifies the six zilas with the highest VE prevalence of the 38 zilas that had VE events in
2010 through 2020. The probability of this occurring by random chance is approximately one in 1.3
million.3
In addition, we developed a geospatial visualization (a “map”) of VE vulnerability in Bangladesh
(Figure 5). The geospatial presentation applies the vulnerability measure (Table 2) to 2019 ambient
population values and can be used to predict the number of people within a population that are
likely to experience VE events over a given timeframe. The VE vulnerability map is analogous to the
vulnerability maps that are used for natural hazards and should be interpreted in a similar fashion.
First-generation hazard vulnerability maps simply used the locations of known past events to predict
future vulnerability. As the understanding of the ecosystem in which natural hazards occur improved,
scientists were able to identify vulnerability in locations where events were previously unknown.
Over time, these projections were validated with new events, and the number of hazard victims
were dramatically reduced because of proactive measures to reduce vulnerability. The vulnerability
analysis for VE in Bangladesh follows the same developmental logic. By analyzing the ecosystem in
which VE is occurring, we can assess the potential of other locations to support VE activity and
reduce VE activity through proactive measures.
The scale in Figure 5 is a relative ranking with areas that are most vulnerable to VE shown in red,
and areas that have the lowest vulnerability shown in blue. Two messages are conveyed by the plot
3 The VE vulnerability measure has an R-squared value = 0.43 with the number of VE events per 100,000 population.

DRG-LER II TASKING N031 COUNTERING VIOLENT EXTREMISM IN BANGLADESH
USAID.GOV FINAL REPORT | 11
simultaneously. The color shade indicates the vulnerability measure of the location. The density of
color indicates the sizes of vulnerable populations.
Figure 5: VE Vulnerability Map for Bangladesh
Figure 5 caption: Geospatial presentation of vulnerability to VE, applying a composite measure to values at the zila level and to population estimates at the scale of approximately 1km2 (Rose et al, 2020). The map is composed of 176,449 discrete
values. Black dots are VE “Yes” events and grey dots are VE “Maybe” events from 2016–2020 (Raleigh et al., 2010, START,
2019 and Pettersson et al., 2020). Rohingya refugee camps in Cox’s Bazaar (Site Management Sector, RRRC, Inter-Sector
Coordination Group (ISCG), 2021) are colored in red to reflect their high reported vulnerability to VE (e.g., Coraya, 2019). District and zila boundaries are shown in grey and labeled (Bangladesh Bureau of Statistics, 2018). Topographic base
map is from Natural Earth (2020).
DRG-LER II TASKING N031 COUNTERING VIOLENT EXTREMISM IN BANGLADESH
USAID.GOV FINAL REPORT | 12
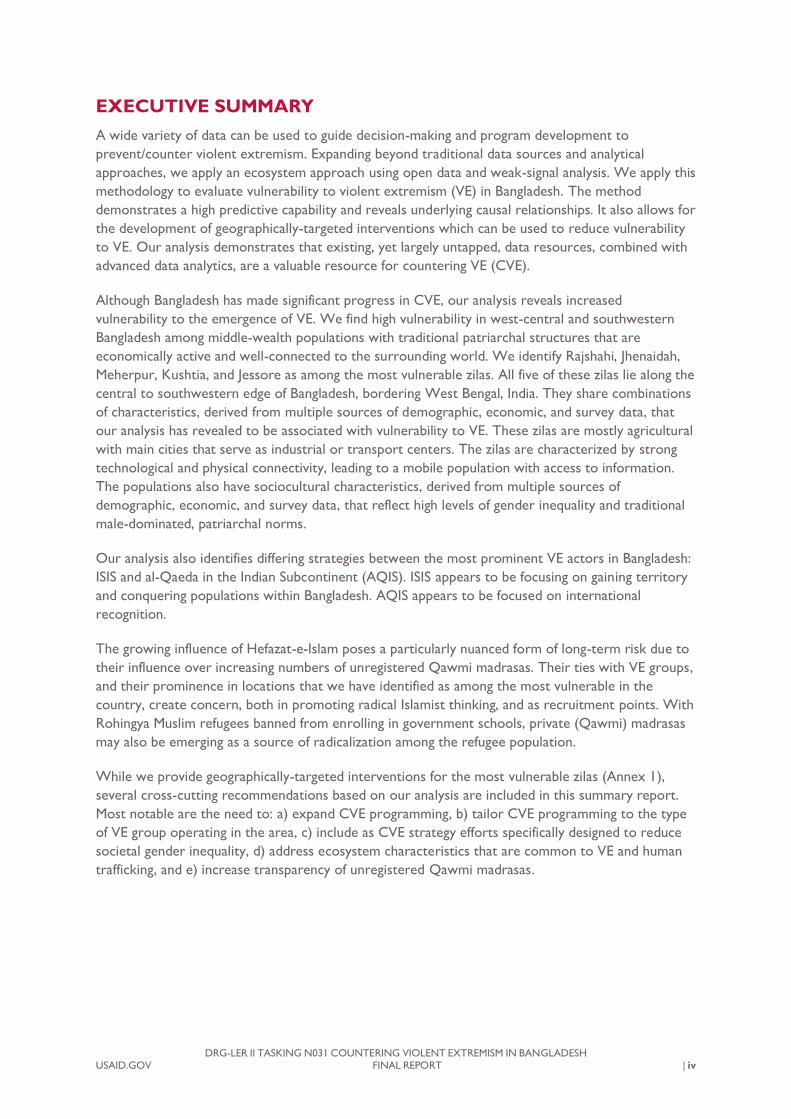
Table 2: VE Vulnerability by Zila
Zila Vulnerability Measure Population (2011 Census) Ranking
Rajshahi 5.94 2,595,197 1
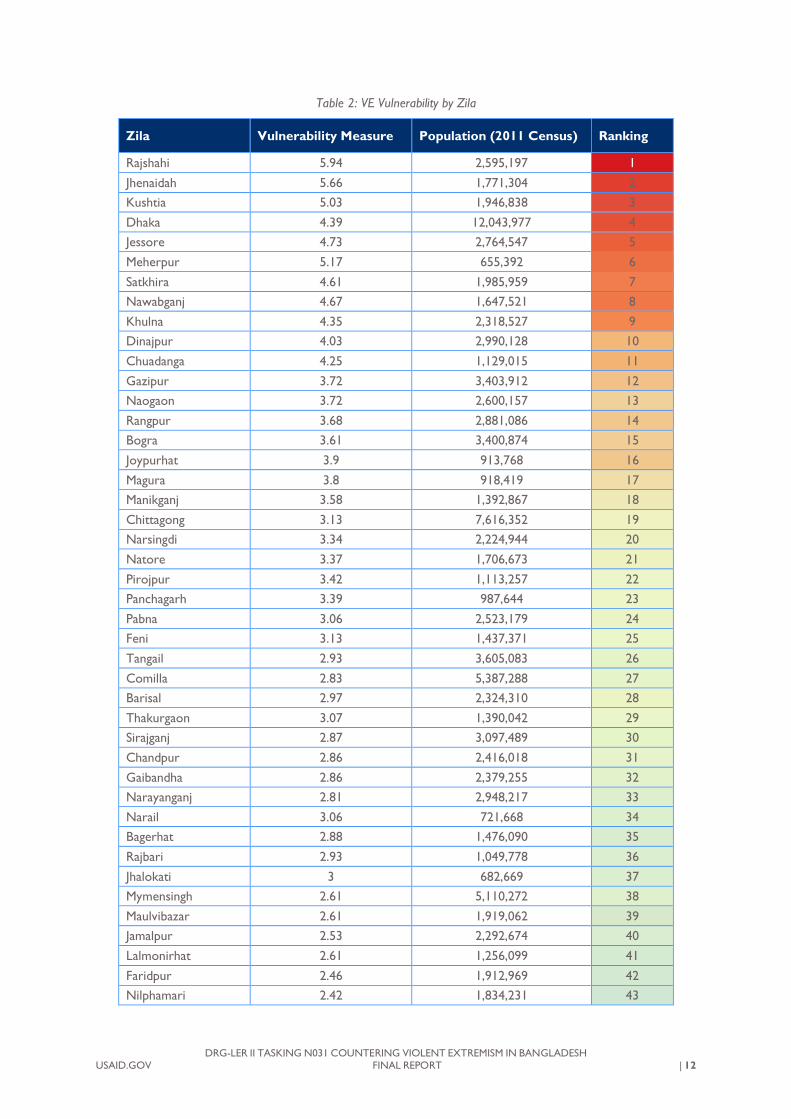
Jhenaidah 5.66 1,771,304 2
Kushtia 5.03 1,946,838 3
Dhaka 4.39 12,043,977 4
Jessore 4.73 2,764,547 5
Meherpur 5.17 655,392 6
Satkhira 4.61 1,985,959 7
Nawabganj 4.67 1,647,521 8
Khulna 4.35 2,318,527 9
Dinajpur 4.03 2,990,128 10
Chuadanga 4.25 1,129,015 11
Gazipur 3.72 3,403,912 12
Naogaon 3.72 2,600,157 13
Rangpur 3.68 2,881,086 14
Bogra 3.61 3,400,874 15
Joypurhat 3.9 913,768 16
Magura 3.8 918,419 17
Manikganj 3.58 1,392,867 18
Chittagong 3.13 7,616,352 19
Narsingdi 3.34 2,224,944 20
Natore 3.37 1,706,673 21
Pirojpur 3.42 1,113,257 22
Panchagarh 3.39 987,644 23
Pabna 3.06 2,523,179 24
Feni 3.13 1,437,371 25
Tangail 2.93 3,605,083 26
Comilla 2.83 5,387,288 27
Barisal 2.97 2,324,310 28
Thakurgaon 3.07 1,390,042 29
Sirajganj 2.87 3,097,489 30
Chandpur 2.86 2,416,018 31
Gaibandha 2.86 2,379,255 32
Narayanganj 2.81 2,948,217 33
Narail 3.06 721,668 34
Bagerhat 2.88 1,476,090 35
Rajbari 2.93 1,049,778 36
Jhalokati 3 682,669 37
Mymensingh 2.61 5,110,272 38
Maulvibazar 2.61 1,919,062 39
Jamalpur 2.53 2,292,674 40
Lalmonirhat 2.61 1,256,099 41
Faridpur 2.46 1,912,969 42
Nilphamari 2.42 1,834,231 43

DRG-LER II TASKING N031 COUNTERING VIOLENT EXTREMISM IN BANGLADESH
USAID.GOV FINAL REPORT | 13
Zila Vulnerability Measure Population (2011 Census) Ranking
Kurigram 2.35 2,069,273 44
Munshiganj 2.38 1,445,660 45
Gopalganj 2.41 1,172,415 46
Madaripur 2.32 1,165,952 47
Kishoreganj 2.13 2,911,907 48
Lakshmipur 2.17 1,729,188 49
Noakhali 2 3,108,083 50
Netrakona 2.02 2,229,642 51
Sylhet 1.93 3,434,188 52
Patuakhali 1.87 1,535,854 53
Brahamanbaria 1.78 2,840,498 54
Sherpur 1.81 1,358,325 55
Barguna 1.72 892,781 56
Khagrachhari 1.62 613,917 57
Habiganj 1.4 2,089,001 58
Bhola 1.36 1,776,795 59
Shariatpur 1.4 1,155,824 60
Sunamganj 0.67 2,467,968 61
Rangamati 0.65 595,979 62
Cox's Bazar 0.52 2,289,990 63
Bandarban 0.2 388,335 64
Table 2 caption: Corresponding VE vulnerability rankings for the zilas. The rankings were determined by multiplying the
vulnerability measure produced through weak signal analysis by the log of the population for each region to better account
for the areas with high populations, wherein there are more vulnerable individuals. The ranking color corresponds to the
predominant pixel color in the map. For Cox’s Bazar, we differentiate between the vulnerability of the host population and the vulnerability of the Rohingya.
Our analysis indicates that the top five most vulnerable zilas, Rajshahi, Jhenaidah, Meherpur, Kushtia,
and Jessore (Table 2), lie along the central to southwestern edge of Bangladesh, bordering West
Bengal, India (Figure 5). These zilas are mostly agricultural with cities that serve as industrial or
transport centers.4 These zila populations are moderately wealthy and are characterized by
technological and physical connectivity, leading to a mobile population with access to information.
These zilas also have high child marriage rates and high rates of trafficking in persons (TIP).
Our analysis indicates that within Bangladesh, populations with high vulnerability to VE are
communities with moderate levels of wealth and education, where the traditional gender norms of a
male-dominated patriarchal society are perhaps being challenged by increasing education and
economic opportunities for women. We interpret these findings based on the definitions,
interpretations, and values of the indicators from our vulnerability measure (Table 1).
From the indicators shown in Table 1, positive relationships between vulnerability and household
asset indicators (e.g., percentage of households owning a motorcycle, bicycle, or television set)
suggest linkages to moderate wealth. Vulnerable populations also tend to have access to medical
4 Two indicators related to agriculture (mango and banana acreage) and one indicator of the temperature range have a positive relationship with VE. The temperature range mirrors the west-east gradient of vulnerability seen in Figure 1and may have had a geophysical influence on the types of agriculture developed in Bangladesh across different regions. The two agriculture-related indicators suggest that rural populations or areas bordering urban centers may have higher vulnerability to VE.

DRG-LER II TASKING N031 COUNTERING VIOLENT EXTREMISM IN BANGLADESH
USAID.GOV FINAL REPORT | 14
facilities and knowledge, which is also related to wealth. This is evidenced by the positive
relationship between vulnerability and a) the percentage of women giving birth in a medical facility, b)
percentage of women who received antenatal care, c) percentage of women who have ever used
contraceptives, and d) percentage of women who have ever used sanitary products for
menstruation.
Communities with higher vulnerability appear to have entrenched gender inequality and a patriarchal
structure that are both likely being challenged by rising education and economic opportunities for
women. The existing patriarchal structure is reflected by the positive relationships between VE
vulnerability and high female child marriage rates, for those under 18 years of age (U18) and under
15 years of age (U15). Yet, indicators suggest that vulnerable populations tend to be educated: the
percentage of men who have completed higher education is positively correlated to VE vulnerability,
and the percentage of both men and women whose highest level of completed education is only
primary school are negatively correlated to vulnerability. It is likely that higher education attainment
has led to shifting societal values and gender roles, with increased economic opportunities for
women. This interpretation is consistent with the positive relationship between VE vulnerability and
indicators in our VE vulnerability index: a) the percentage of women who have used a computer or
tablet, b) the percentage of women who wear glasses, and c) the percentage of women who have
ever used sanitary products for menstruation. In patriarchal societies, where men have been viewed
as providers, lack of economic opportunity can make men more open to radicalization, as they may
see it as an opportunity to reclaim their masculinity (Brown et al., 2020). While higher education in
general is less associated with VE, education without economic opportunity for men can result in
increased vulnerability to VE (Bhatia and Ghanem, 2017).
Less vulnerable populations are communities where women have limited access to mobility,
education, information, and economic participation. These communities also have a patriarchal
structure, but it is likely not being challenged by shifting gender roles. This is evidenced by the
negative relationships between VE vulnerability and: a) percentage of women who have never read a
newspaper or magazine, b) percentage of women who agree that a husband is justified in beating his
wife, c) percentage of women who have been living in their current location since birth, and d) ratio
of daughters to sons who are currently living with their mother.
Several studies across nations suggest that perceived “threats to masculinity” or transgression of
entrenched norms may also incite violence against women (e.g., Duvvury et al, 2002). In addition, it
has been found in patriarchal societies that if women are given or perceived to have access to
opportunities that are not available to men, it can foster resentment and exacerbate violence against
women (Rahman, 2020). This highlights the need to support the expansion of economic
opportunities for men, together with women, in order to reduce VE vulnerability.
In looking at future interventions, it may be important to differentiate female empowerment from
gender equality. The United Nation’s Sustainable Development Goal 5, to “achieve gender equality
and empower women and girls,” links the concepts of female empowerment and gender equality
(United Nations, 2015). Female empowerment and gender equality share a sociocultural ecosystem,
with historically little differentiation between them in the goals set by development organizations.
Analyzing the two concepts as separate entities, however, may be helpful in understanding better
how various societal factors affect the achievements and conversely, the subjugation of females.
Intuitively, interventions would need to address societal norms that propagate traditional male and
female responsibilities and include young males in female-focused development initiatives before age
10, when gender roles and expectations begin to be imprinted (Blum et al., 2017).

DRG-LER II TASKING N031 COUNTERING VIOLENT EXTREMISM IN BANGLADESH
USAID.GOV FINAL REPORT | 15
Overall, VE is most likely to re-emerge in west-central and southwestern Bangladesh among middle
wealth populations with traditional patriarchal structures that are economically active and connected
to the surrounding world.

DRG-LER II TASKING N031 COUNTERING VIOLENT EXTREMISM IN BANGLADESH
USAID.GOV FINAL REPORT | 16
III. RECOMMENDATIONS AND CONCLUSIONS
Detailed geographically-targeted recommendations specific to the most vulnerable zilas are
presented in Annex 1. The following consist of cross-cutting and more general recommendations
based on the findings of our analysis:
1) Expand CVE programming
Notwithstanding the progress Bangladesh has made in CVE, our analysis indicates vulnerability to VE
persists. Bangladesh should develop a national CVE strategy and include intervention programming
that attempts to provide assistance to individuals on the path towards radicalization.
2) Tailor CVE programming to the type of VE group operating in the area
Our analysis demonstrates that within Bangladesh ISIS and AQIS have different goals and different
strategies. ISIS events are smaller, more frequent, and more distributed. We interpret this as
reflecting a strategy of conquering areas to promote governance consistent with their interpretation
of Islamic law. AQIS events are larger, fewer, and generally targeted at symbolic locations around the
capital that are likely to garner international attention and promote civil unrest.
3) Include as CVE strategy efforts specifically designed to reduce societal gender
inequality
Our analysis reveals several indicators strongly associated with vulnerability that reflect high gender
inequality and traditional male-dominated, patriarchal norms. Indicators that reflect more narrowly
female empowerment (e.g., female education) have weaker relationships. CVE efforts would strongly
benefit from complementing efforts to increase female empowerment with interventions targeted
specifically at reducing gender inequality. Such interventions would need to encourage men to revise
their patriarchal attitudes and views of masculinity, address societal norms that propagate traditional
male and female responsibilities, and include males in female-focused development initiatives. CVE
efforts designed to reduce gender inequality should include young males (age 5-10).
4) Address ecosystem characteristics that are common to VE and human trafficking
Our analysis indicates that TIP and VE share a common ecosystem. High human trafficking, as
measured by the number of victims per 100,000 population, is an indicator of vulnerability to VE.
5) Increase transparency of unregistered Qawmi madrasas
While by no means conclusive, our analysis of unregistered Qawmi madrasas indicates that they may
be disproportionately prevalent in areas that we have identified as having high vulnerability to VE.
Increasing transparency of the number of these schools and their curriculum is needed to assess the
extent to which they may be supportive of VE. One potential method for increasing transparency
would be for the government to expand degree recognition to include lower educational degrees in
exchange for a registration process that includes transparency of curriculum, enrollment, and foreign
funding.

DRG-LER II TASKING N031 COUNTERING VIOLENT EXTREMISM IN BANGLADESH
USAID.GOV FINAL REPORT | 17
IV. REFERENCES
Alam, S. (2021). Ansar Al Islam aims to recruit youth from religious and general education
background. Promothalo English. Retrieved from https://en.prothomalo.com/bangladesh/ansar-al-
islam-aims-to-recruit-youth-from-religious-and-general-education-background.
Ambrozik, C. (2019). Countering Violent Extremism Globally: A New Global CVE Dataset.
Perspectives on Terrorism, 13(5), 102–111. JSTOR. https://doi.org/10.2307/26798581.
Bangladesh Bureau of Statistics (BBS). (2018). Bangladesh - Subnational Administrative Boundaries as
of 2015. Retrieved from https://data.humdata.org/dataset/administrative-boundaries-of-bangladesh-as-
of-2015.
Bangladesh Bureau of Statistics (BBS) and UNICEF Bangladesh. (2014). Bangladesh Multiple Indicator
Cluster Survey 2012-2013. Retrieved from
https://mics.unicef.org/files?job=W1siZiIsIjIwMTUvMDcvMDcvMTcvMjAvMDkvNzk2L0JhbmdsYWRl
c2hfMjAxMl8xM19NSUNTX0ZpbmFsX1JlcG9ydC5wZGYiXV0&sha=f6f33951c5125263.
Bangladesh Bureau of Statistics (BBS) and UNICEF Bangladesh. (2019). Bangladesh Multiple Indicator
Cluster Survey 2019, Survey Findings Report. Retrieved from
https://www.unicef.org/bangladesh/en/reports/progotir-pathey-bangladesh.
Bangladesh Bureau of Statistics (BBS). (2020). Bangladesh 2019 Statistical Yearbook. Retrieved from
https://bbs.portal.gov.bd/sites/default/files/files/bbs.portal.gov.bd/page/b2db8758_8497_412c_a9ec_6
bb299f8b3ab/2020-09-17-15-30-d0e641b2e659019f2aa44cbaf628caa8.pdf.
Blum, M.D., Mmari K., and Moreau C. (2017), How Gender Expectations Shape Early Adolescence
Around the World, Journal of Adolescent Health, 61:4, Oct. 1, 2017 DOI:
https://doi.org/10.1016/j.jadohealth.2017.07.009
Brown, K. E., Duriesmith, D., Rahman, F., & True, J. (2020). Conflicting Identities: The Nexus
between Masculinities, Femininities and Violent Extremism in Asia. UNDP and UN
Women. Retrieved from
https://www.unwomen.org/sites/default/files/Headquarters/Attachments/Sections/Library/Publications
/2020/Conflicting-identities-Nexus-between-masculinities-femininities-violent-extremism-Asia-en.pdf
Byman, D. (April 2015). Comparing Al Qaeda and ISIS: Different goals, different targets. Brookings
Institute. Retrieved from https://www.brookings.edu/testimonies/comparing-al-qaeda-and-isis-
different-goals-different-targets/.
Bhatia, K., & Ghanem, H. (2017). How do education and unemployment affect support for violent
extremism—Evidence from eight Arab countries (No. 103; Global Economy & Development).
Brookings Institution.
Carson, J.V. & Suppenbach, M. (2017) The Global Jihadist Moment: The Most Lethal Ideology?
Homicide Studies 1–38, 2017 DOI: 10.1177/1088767917733783.
Chandan, M. (2017). Alia Madrasa: an education system on its death bed. The Daily Star. Retrieved
from https://www.thedailystar.net/star-weekend/alia-madrasa-1482232.

DRG-LER II TASKING N031 COUNTERING VIOLENT EXTREMISM IN BANGLADESH
USAID.GOV FINAL REPORT | 18
Chaudhury, D. R. (2021). Hefazat-e-Islam, the radical outfit behind the recent violence in Bangladesh.
The Economic Times. Retrieved from
https://economictimes.indiatimes.com/news/international/world-news/hefazat-e-islam-the-radical-
outfit-behind-recent-violence-in-bangladesh/articleshow/81875468.cms?from=mdr
Clarke, R. (1995). Situational Crime Prevention. Crime and Justice, 19, 91-150. Retrieved from
http://www.jstor.org/stable/1147596.
Comerford, M. (2017). Deciphering Bangladeshi Terror: Fallout and Response to the Holey Bakery
Attack. Comerford for Global Change. Retrieved from https://institute.global/policy/deciphering-
bangladeshi-terror-fallout-and-response-holey-bakery-attack.
Corraya, S. (2017), Riyadh donates 10.8 billion euros to 560 mosques in Bangladesh: Muslims split.,
AsiaNews.it, 4/24/2017. Retrieved from http://www.asianews.it/news-en/Riyadh-donates-10.8-billion-
euros-to-560-mosques-in-Bangladesh:-Muslims-split-40554.html
Corraya, S. (2019). Extremism growing among Rohingya children in Cox’s Bazar camps. AsiaNews.it.
Retrieved from http://www.asianews.it/news-en/Extremism-growing-among-Rohingya-children-in-
Cox%E2%80%98s-Bazar-camps-47366.html.
Eck J.E., Clarke R.V. (2019). Situational Crime Prevention: Theory, Practice and Evidence. In: Krohn
M., Hendrix N., Penly Hall G., Lizotte A. (eds) Handbook on Crime and Deviance. Handbooks of
Sociology and Social Research. Springer, Cham. https://doi.org/10.1007/978-3-030-20779-3_18.
Ellis, T. (2007). (Rep.). Institute of Peace and Conflict Studies. Retrieved June 11, 2021, from
http://www.jstor.org/stable/resrep09328
Hijmans, R.J., S.E. Cameron, J.L. Parra, P.G. Jones and A. Jarvis, (2005). Very High Resolution
Interpolated Climate Surfaces for Global Land Areas. International Journal of Climatology 25: 1965-
1978. doi:10.1002/joc.1276.
International Crisis Group (ICG). (2018). Countering Jihadist Militancy in Bangladesh (Report No.
295). https://www.crisisgroup.org/asia/south-asia/bangladesh/295-countering-jihadist-militancy-
bangladesh.
Khalidi, Toufique Imrose (2013). "Behind the rise of Bangladesh's Hefazaat". Al Jazeera. Retrieved
from https://www.aljazeera.com/features/2013/5/9/behind-the-rise-of-bangladeshs-hifazat.
Natural Earth (2020). Cross Blended Hypso with Shaded Relief, Water, and Drainages. Retrieved
from https://www.naturalearthdata.com/downloads/10m-raster-data/10m-cross-blend-hypso/.
Middle East Institute (2019) “Islamic State Ideology Continues to Resonate in Bangladesh.” Accessed
July 3, 2020. Retrieved from https://www.mei.edu/publications/islamic-state-ideology-continues-
resonate-bangladesh.
Ministry of Foreign Affairs (MFA), Bangladesh. (2021). Dhaka protests the US Secretary of State’s
remarks [Press release]. https://mofa.gov.bd/site/press_release/15dd7882-9ee5-4a82-a315-
83e2775d567c.
Organisation for Economic Co-Operation and Development (OECD). (2008) Handbook on
constructing composite indicators: methodology and user guide. ISBN 978-92-64-04345-9. 2008.

DRG-LER II TASKING N031 COUNTERING VIOLENT EXTREMISM IN BANGLADESH
USAID.GOV FINAL REPORT | 19
Overseas Security Advisory Council (OSAC). (2020, January 23). Terrorism in South Asia:
Bangladesh. OSAC. https://www.osac.gov/Content/Report/607a3a62-129a-4b76-91ce-17cad208a4c4.
Pettersson, Therese & Magnus Öberg (2020) Organized violence, 1989-2019. Journal of Peace
Research 57(4).
Public Security Division (PSD BGD) (2016). Bangladesh Country Report, 2016: Combating Human
Trafficking. Public Security Division, Government of the People's Republic of Bangladesh. Dhaka,
Bangladesh.
Public Security Division (PSD BGD) (2016). Bangladesh Country Report, 2018: Combating Human
Trafficking. Public Security Division, Government of the People's Republic of Bangladesh. Dhaka,
Bangladesh.
Raleigh, Clionadh, Andrew Linke, Håvard Hegre and Joakim Karlsen. (2010). “Introducing ACLED-
Armed Conflict Location and Event Data.” Journal of Peace Research 47(5) 651-660.
Rose, A. N., McKee, J. J., Sims, K. M., Bright, E. A., Reith, A. E., & Urban, M. L. (2020). LandScan 2019
(2019th ed.). Oak Ridge National Laboratory. https://landscan.ornl.gov/.
Roul, A. (2011). Jamaatul Mujahidin Bangladesh: Weakened, But Not Destroyed. Combating
Terrorism Center at West Point, 4(11), 16-18. Retrieved from https://ctc.usma.edu/jamaatul-
mujahidin-bangladesh-weakened-but-not-destroyed/.
Roul, A. (2016). How Bangladesh Became Fertile Ground for al-Qa`ida and the Islamic State.
Combating Terrorism Center at West Point. Retrieved from https://www.ctc.usma.edu/how-
bangladesh-became-fertile-ground-for-al-qaida-and-the-islamic-state/.
Roul, A. (2021, February). Neo-Jama’atul Mujahideen Bangladesh’s Female Members Further Islamic
State’s Recruitment and Propaganda. The Jamestown Foundation: Terrorism Monitor, 19(3), 3-5.
https://jamestown.org/wp-content/uploads/2021/02/TM-February-12-2021-Issue.pdf?x58058.
Roy, N. (2018). What is the Ahl-e Hadith Movement? The Dhaka Tribune. Retrieved from
https://www.dhakatribune.com/bangladesh/2018/03/11/ahl-e-hadith-movement.
Roy, S., Huq, S., & Rob, A. (2020). Faith and education in Bangladesh: A review of the contemporary
landscape and challenges. International Journal of Educational Development, 79.
https://doi.org/10.1016/j.ijedudev.2020.102290.
SecDev (2021), Bangladesh Violent Extremism Monitor: Quarterly Assessment of Drivers, Events
and Online Activity, April-June 2021, SecDev Analytics, September 2021.
Shaon, S. (2018). Why some parents prefer madrasa to school. The Dhaka Tribune. Retrieved from
dhakatribune.com/opinion/special/2018/01/18/parents-prefer-madrasa-school.
Singh, S.B. (2021). Bangladesh: Latent Threat of ABT/Ansar al-Islam— Analysis. South Asia Terrorism
Portal. https://www.eurasiareview.com/19072021-bangladesh-latent-threat-of-abt-ansar-al-islam-
analysis/.
Site Management Sector, RRRC, Inter-Sector Coordination Group (ISCG), (2021). Bangladesh -
Outline of camps of Rohingya refugees in Cox's Bazar. Retrieved from

DRG-LER II TASKING N031 COUNTERING VIOLENT EXTREMISM IN BANGLADESH
USAID.GOV FINAL REPORT | 20
https://data.humdata.org/dataset/outline-of-camps-sites-of-rohingya-refugees-in-cox-s-bazar-
bangladesh.
South Asia Terrorism Portal (SATP), https://www.satp.org/.
SATP (n.d.) Harkat-ul-Jihad-al-Islami (HuJI), Extremist Group, Bangladesh. Retrieved from
https://www.satp.org/satporgtp/countries/bangladesh/terroristoutfits/huj.htm.
START, National Consortium for the Study of Terrorism and Responses to Terrorism (START),
(2019). The Global Terrorism™ Database. University of Maryland.
Stephens, W., Sieckelinck, S. & Boutellier, H. (2021). Preventing Violent Extremism: A Review of the
Literature, Studies in Conflict & Terrorism, 44:4, 346-361, DOI: 10.1080/1057610X.2018.1543144
The Economist. (2021). Bangladesh’s government cracks down on a big Islamist group. The
Economist, 27 May 2021. Retrieved from https://www.economist.com/asia/2021/05/27/bangladeshs-
government-cracks-down-on-a-big-islamist-group
United States Department of State (U.S. DoS), (n.d.) : State Department Foreign Terrorist
Organizations. https://www.state.gov/foreign-terrorist-organizations/
United Nations (2015) Transforming our world: The 2030 Agenda for Sustainable Development,
Pub. L. No. A/RES/70/1. https://documents-dds-
ny.un.org/doc/UNDOC/GEN/N15/291/89/PDF/N1529189.pdf?OpenElement

DRG-LER II TASKING N031 COUNTERING VIOLENT EXTREMISM IN BANGLADESH
USAID.GOV FINAL REPORT | 21
ANNEX 1. GEOGRAPHICALLY-TARGETED INTERVENTIONS BY
ZILA

Rajshahi, Rajshahi
VE Vulnerability Score
0.20(lowest)
VE Events Timeline
5.94(highest)
Rank:
1 of 645.94
Year 2010 2011 2012 2013 2014 2015 2016 2017 2018 2019 2020 Total
# of VE Events 26 15 12 24 15 24 6 2 7 2 0 133
Socio-Economic Measures
Population: 2,595,197 (#18)
Percent Urban: 32.2% (#7)
Poverty Incidence: 31.4% (#32)
Female Secondary School Completion: 68.3%
(#9)
Households with Electricity: 95.3% (#21)
GNI per Capita (thousands of USD): 3.151 (#46)
Percent Muslim: 94.7% (#21)
Human Development Index: 0.578 (#52)
Percent of women who feel a husband is
justified in beating his wife: 17.4% (#49)
TIP: 0.77 cases per 100,000 population
(#17)
U15 Child Marriage: 34.1% (#3)
U18 Child Marriage: 68.5% (#7)
Literacy Rate 7+: 73.6% (#9)
Madrasahs
Rajshahi has 206 Aleya and 34 registered Qawmi madrasahs.
The ratio of Aleya to registered Qawmi madrasahs suggests a
significant number of unregistered madrasahs. Many are part of the Ahl-e Hadith Islamic movement, a traditionalist branch
of Sunni Islam, and are funded by Saudi Arabia.
VE Organizations
Rajshahi has experienced a high number of VE events in the past decade by both jihadist and political groups. The most active confirmed terrorist groups are JMB, ISIS, Jamaat-E-Islami, and ICS. The most recent attack by an Islamic
extremist group was in 2017, when five JMB members blew themselves up before their hideout was raided by police.
Extremist groups generally attack more populated areas, especially in Rajshahi City. Since 2018, all violent acts were
politically motivated and attributed to the Awami League, BCL, or the opposing BNP. In March 2021, Indian PM
Modi’s visit to Bangladesh sparked protests and violence in the zila.
VE Vulnerability Index for Zila & National Average Values
Derived from over 1,400 indicators,
the zila vulnerability measure is
composed of the subset of indicators
and weightings that represent the
optimal combination characteristic of
the VE ecosystem. This graph displays
the indicator values in this optimal
subset. The red bars are the values
for the particular zila. The grey bars
represent the national averages. The
statistical interpretation of these
indicator combinations, their
correlations with other factors, and
the phenomena for which they serve
as proxy measures, provide insight
and evidence for summaries below.
Summary Description • Rajshahi is on the southwestern border along the Ganges River, separating the zila from India. The large city of Rajshahi is a major industrial and commercial center
and home to the second-largest university in the country. There are direct train and main highway routes from Rajshahi to Dhaka.
• Rajshahi city is a modern city with an emphasis on education and commerce. This is reflected in above average levels of birth in a medical facility, antenatal care, and
contraceptive use.
• Similarly, TV ownership is higher than the national average. Though Rajshahi doesn’t have a high GNI, widespread access to TV indicates access to modern
technology and wealth in the region.
• High rates of TIP reflect a tradition of illegal crossings across the border with India by way of the Ganges River.
• While mango acreage is average, there is an ongoing trend in the region of farmers converting their rice paddies into mango orchards for increased income and
economic stability.
Geographically-Targeted Interventions
In Rajshahi, high priority interventions include countering the Ahl-e-Hadith Islamic movement, combating VE recruitment strategies using online propaganda and social
media, and reducing gender inequality. The Ahl-e-Hadith Islamic movement, a Sunni conservative reform movement, argues that followers should engage in jihad against
Islamic fallacies. They support many madrasahs in Rajshahi. Al-Markazul Islami As-Salafi is the largest Ahl-e Hadith madrasa in Bangladesh with over 1,000 students. These
schools are often funded by Saudi Arabia and have been reported to be recruitment targets for JMB (ICG, 2010). In 2016 a professor was attacked by a young follower of
Ahl-e-Hadith who had attended a madrasah and participated in an online forum where he was encouraged to carry out the attack. To reduce the threat of indoctrination,
radicalization, and extremist recruitment, the zila government should attempt to accurately identify and monitor unregistered Qawmi madrasahs. Curriculum modules
should be developed that promote inter-faith cooperation. The redirect method should be implemented to counter online grooming, which consists of identifying people
who are looking online for VE content and redirecting them to curated YouTube videos countering VE ideologies and themes. An additional strategy that could be used
using programs that can recognize a VE picture on one website and remove it from all locations on the internet. Bangladesh should require internet service providers to
install filtering software and require them to report suspicious IP addresses.
Rajshahi has the largest number of higher education institutions of any zila in Bangladesh. The female education rate is among the top ten zilas. However, it also has one
of the highest child marriage rates, reflecting high levels of societal gender inequality. To address societal gender inequality, efforts should focus on implementing early
childhood education programs that include young males (age 5-10) and educate both males and females on the benefits of gender equality, focusing in particular on its
economic and social benefits. When men are encouraged to value women as equals and are actively involved in the process of empowering women, societal attitude and
structures can change more rapidly. Efforts to combat gender inequality will not only help mitigate VE but will also help reduce TIP, as VE and TIP share a similar
ecosystem within Bangladesh.
0
0.5
1
1.5
2
2.5
Med
ical
Birth
Met
al Roo
fs
Ant
enatal C
are
Cont
race
ptives
Tem
pera
ture
Ran
ge
Chi
ldre
n Alpha
bet
U15
Child
Mar
r iag
e
Bicy
cles
Mot
orcy
cles
F: M
ax P
rimar
y Ed
ucat
ion
F: B
irth
Reg
istra
tion
U18
Child
Mar
r iag
e
F/M at Home
F: L
iving i n
Sam
e Plac
e
TV
Owne
rship
TIP V
ictims pe
r 10
0k
M: M
ax P
rimar
y Ed
ucatio
n
Man
go A
crea
ge
M: M
ax H
ighe
r Ed
ucat
ion
Men
stru
al M
ater
ials
Chi
ldre
n N
ot Li vin
g at
Hom
e
Wi fe
beatin
g Jus t
if ied
Bana
na A
crea
ge
F: U
sed
a Compu
ter
Female
Glass
es
F: N
ever
Rea
d New
spap
er
Raw
Valu
e (
Eit
her
Perc
en
tage o
r R
ati
o)
Rajshahi National Average
Jhenaidah, Khulna
VE Vulnerability Score
0.20(lowest)
VE Events Timeline
5.94(highest)
Rank:2 of 64
5.66
Year 2010 2011 2012 2013 2014 2015 2016 2017 2018 2019 2020 Total
# of VE Events 18 9 9 6 10 8 14 3 1 4 1 83
Socio-Economic Measures
Population: 1,771,304 (#37)
Percent Urban: 16.3% (#28)
Poverty Incidence: 24.7% (#50)
Female Secondary School Completion: 67.4%
(#15)
Households with Electricity: 96.2% (#16)
GNI per Capita (thousands of USD): 4.241 (#12)
Percent Muslim: 94.7% (#22)
Human Development Index: 0.610 (#29)
Percent of women who feel a husband is
justified in beating his wife: 14.4% (#55)
TIP: 3.05 cases per 100,000 population
(#6)
U15 Child Marriage: 27.4% (#8)
U18 Child Marriage: 73.4% (#4)
Literacy Rate 7+: 69.2% (#18)
Madrasahs
Jhenaidah has 111 Alia and 15 registered Qawmi madrasahs,
with madrasahs making up 11 percent of all schools (#54).
There are fewer than one percent known Qawmi madrasahs compared to all other non-madrasah schools, which is low in
comparison to other zilas with a similar Muslim demographic.
Given the strong presence of Islamic extremism in the zila, it
is likely that several madrasahs are unregistered.
VE Organizations
Jhenaidah has experienced ongoing VE over the last ten years with the fourth-most VE events out of any zila. Both international and domestic Islamic extremist groups have a presence in the region, with ISIS, Jamaat-E-Islami, and ICS
responsible for 80 percent of deaths since 2016. In 2016, ISIS carried out a string of seven deadly attacks,
immediately followed by six deadly JIB/ICS acts. Events have died down since their peak in 2016, and political groups
such as the Awami League and Purbo Banglar Communist Party (PBCP) are now the most common perpetrators in mostly non-fatal events. However, Neo JMB’s May 2017 debut, the most recent confirmed extremist attack, and the
discovery of a hideout around the same time indicates that terrorism has not disappeared.
VE Vulnerability Index for Zila & National Average Values
Derived from over 1,400 indicators,
the zila vulnerability measure is
composed of the subset of indicators
and weightings that represent the
optimal combination characteristic of
the VE ecosystem. This graph displays
the indicator values in this optimal
subset. The red bars are the values
for the particular zila. The grey bars
represent the national averages. The
statistical interpretation of these
indicator combinations, their
correlations with other factors, and
the phenomena for which they serve
as proxy measures, provide insight
and evidence for summaries below.
Summary Description • Jhenaidah is located in west-central Bangladesh, with a western border to India which has served as a transit point for cross-border trafficking into West Bengal. It
is also a transport hub within the Khulna division, with many highways from surrounding regions, including the Daulatdia-Mongla Highway, which connects the
Dhaka ferry system to the port of Mongla in Bagerhat and passes through several major cities.
• Jhenaidah has the lowest under five mortality rate in Bangladesh, the third-highest rates of births in medical facility, and relatively strong female secondary school
completion. Despite these health and education achievements, however, the U15 and U18 child marriage rates are high and only 38 percent of women receive paid
employment, which indicates high gender inequality.
• High rates of TV ownership and electricity access indicate general access to technology; while this offers an opportunity to spread awareness and educate citizens,
many VE groups have started recruiting online.
• Jhenaidah has a mix of rural rice farming villages and small cities, mostly used as transport hubs.
• VE organizations may be drawn to the zila’s remoteness and distance from major Bangladeshi cities as a place to hide out or train while still being able to carry out
prominent attacks in the more densely populated areas.
Geographically-Targeted Interventions
In Jhenaidah, high priority intervention locations include border crossings, madrasahs, and economic corridors into rural areas. Jhenaidah has a strong and diverse Islamic
extremist presence as it has experienced high rates of deadly violence perpetrated by ISIS-Bangladesh, Jamaat-E-Islami, ICS, and JMB in the last several years.
To address possible extremist indoctrination, the district government should devise a taskforce to seek out and monitor unregistered Qawmi madrasahs. Jhenaidah, a 90
percent Muslim zila with a mid-size population would be expected to have more madrasahs and connections with the JMB and Neo JMB. The low number of known
Qawmi madrasahs in the zila prompts a need for further efforts to investigate and uncover these private madrasahs. Additionally, there is a need for increased anti-
radicalization educational curricula for students, especially in the Alia madrasahs and other public educational institutions.
In January 2020, Bangladesh announced the Western Economic Corridor and Regional Enhancement Project to finance upgrades to national highways from Jessore to
Jhenaidah (48 km) and associated feeder roads and rural market infrastructure. Due to the similar ecosystems of VE and TIP, and the high rates of TIP in Jhenaidah,
efforts to reduce VE and TIP should be coordinated. Efforts should be placed into working with the border patrol and community leaders alongside the World Bank
transportation project to increase awareness of trafficking, especially along known trafficking routes. Additionally, the Bangladeshi government should implement a more
efficient process for its expatriates to return home so that border patrol can more easily identify dangerous activity, which could include movement of VE personnel and
equipment. Since rural areas provide places for extremist groups to hide out, the construction of connecting roads to major highways will remove an ecosystem benefit
for terrorist organizations.
0
0.2
0.4
0.6
0.8
1
1.2
1.4
1.6
1.8
2
Med
ical B
irth
Metal Roo
fs
Antena
tal C
are
Con
trac
eptiv
es
Tempe
rature
Ran
ge
Chil
dren
Alpha
bet
U15
Chil
d Marria
ge
Bicy
cles
Mot
orcy
cles
F: Max
Prim
ary Ed
ucation
F: Birth Re
gistration
U18
Chil
d Marria
ge
F/M at H
ome
F: Livin
g in Sa
me Plac
e
TV O
wne
rship
TIP Victim
s pe
r 10
0k
M: M
ax P
rimary Ed
ucation
Man
go A
crea
ge
M: M
ax H
igher
Edu
catio
n
Men
stru
al Mater
ials
Chil
dren
Not
Living
at H
ome
Wife
beating Jus
tified
Bana
na A
crea
ge
F: Used
a Com
puter
Female
Glas
ses
F: Nev
er R
ead New
spap
er
Raw
Val
ue (
Eit
her
Perc
enta
ge o
r R
atio
)
Jhenaidah National Average

Kushtia, Khulna
VE Vulnerability Score
0.20(lowest)
VE Events Timeline
5.94(highest)
Rank:3 of 64
5.03
Year 2010 2011 2012 2013 2014 2015 2016 2017 2018 2019 2020 Total
# of VE Events 17 5 8 8 3 6 6 3 2 5 4 67
Socio-Economic Measures
Population: 1,946,838 (#32)
Percent Urban: 12.8% (#49)
Poverty Incidence: 3.6% (#64)
Female Secondary School Completion: 67.4%
(#14)
Households with Electricity: 98.0% (#9)
GNI per Capita (thousands of USD): 4.241 (#12)
Percent Muslim: 97.9% (#5)
Human Development Index: 0.610 (#29)
Percent of women who feel a husband is
justified in beating his wife: 5.4% (#61)
TIP: 0.00 cases per 100,000 population
(#39)
U15 Child Marriage: 22.5% (#28)
U18 Child Marriage: 67.3% (#8)
Literacy Rate 7+: 64.8% (#28)
Madrasahs
Kushtia has 75 Aleya and 40 registered Qawmi madrasahs,
with madrasahs making up 10.2 percent of all schools (#56), a
low amount given its high Muslim population (97.9 percent). In December 2020, students and teachers from a Kushtia
madrasah were arrested for vandalizing a statue of former
Prime Minister Rahman and admitted to being influenced by
Hefazat-e-Islam leaders.
VE Organizations
Kushtia has experienced a high volume of VE acts (#6) in the past ten years, carried out by a diverse array of Islamic extremist and political groups. ISIS, JMB, Jamaat-E-Islami, ICS, and GMF have all been active in the zila, as well as the
ruling Awami League, BCL, and the opposing Bangladesh Nationalist Party. Attacks have not significantly decreased
since 2016, unlike many other zilas, and the most recent attack was perpetrated by Jamaat-E-Islami in November
2020. Most VE events occur in populated city or town centers. In May 2021, Islamic preacher Amir Hamza was arrested in Kushtia for “spreading extremism.”
VE Vulnerability Index for Zila & National Average Values
Derived from over 1,400 indicators,
the zila vulnerability measure is
composed of the subset of indicators
and weightings that represent the
optimal combination characteristic of
the VE ecosystem. This graph displays
the indicator values in this optimal
subset. The red bars are the values
for the particular zila. The grey bars
represent the national averages. The
statistical interpretation of these
indicator combinations, their
correlations with other factors, and
the phenomena for which they serve
as proxy measures, provide insight
and evidence for summaries below.
Summary Description • Kushtia is a highly developed district in western Bangladesh that shares a border with West Bengal, India along its northwestern edge. The zila lies on the upper
Ganges River and connects to Kolkata, India, and Rajshahi Zila by train.
• High rates of medical birth, antenatal care, contraceptives, and menstrual materials and extremely low support of justified wife-beating indicate a degree of female
autonomy and empowerment, while above average child marriage rates reveal gender inequality.
• High rates of bicycle, motorcycle, and TV ownership and electricity access, along with a high GNI and the nation’s lowest poverty incidence reflect the relative
wealth and infrastructure of the zila.
• Lack of TIP cases is a sharp contrast to surrounding zilas, which could indicate poor reporting or law enforcement. This district may be a weak spot in the Indian-
Bangladesh border, which would also make it an easy target for violent extremist groups.
• Female empowerment measures are high in education, female views on society, and maternal health, which indicates strong health and educational infrastructure.
Geographically-Targeted Interventions
In Kushtia, high priority interventions include improving monitoring of in-country and cross-border transportation and increasing awareness of VE recruiting practices
through the internet and extremist teaching of the Islamic faith. Kushtia has a particularly active VE presence, with several different groups of both political and jihadist
ideology perpetrating attacks in the zila. In December 2020, two students and two teachers from a madrasah in Jugia, Kushtia were arrested for a statue of the “Father
of the Nation,” Shiekh Mujibur Rahman. All four admitted they were influenced by leaders of the Hefazat-e-Islam group. To reduce the threat of indoctrination,
radicalization, and extremist recruitment, the zila government should attempt to accurately measure and monitor madrasah (unregistered Qawmi). Additionally, the zila
should work to foster inter-faith respect and harmony through community programs held with the local government.
As the use of the internet to radicalize citizens is increasing, specific methods should be taken by officials to counter it. The first recommended strategy is the redirect
method, which consists of targeting people who actively look for VE content on the internet and redirecting them to curated YouTube videos disapproving of VE
ideologies and themes. Another strategy to utilize is use of the eGLYPH technology, a program created that can flag a VE picture on one website and then remove it
anywhere else it may be on the internet. There is also value in programs to improve the ethics and responsibility of internet users that self-monitor and report
suspicious sites or online forums to the counter-trafficking authorities
With transportation systems across the Indian border and along the Ganges River, there is constant movement in and out of the zila, and an unusual lack of TIP cases,
which indicates that this movement is not well-tracked. Given the shared ecosystem between TIP and VE, border guards should be submitted to thorough background
checks, especially focusing on madrasah education, and guards’ locations should be rotated to avoid the development of relationships and bribery between migrants and
guards. The district should also increase patrolling and recording of imports, exports, and human activity along the Ganges River. Best practices, such as the rotation of
border guards, should be implemented.
0
0.2
0.4
0.6
0.8
1
1.2
1.4
1.6
Med
ical B
irth
Metal Roo
fs
Antena
tal C
are
Con
trac
eptiv
es
Tempe
rature
Ran
ge
Chil
dren
Alpha
bet
U15
Chil
d Marria
ge
Bicy
cles
Mot
orcy
cles
F: Max
Prim
ary Ed
ucation
F: Birth Re
gistration
U18
Chil
d Marria
ge
F/M at H
ome
F: Livin
g in Sa
me Plac
e
TV O
wne
rship
TIP Victim
s pe
r 10
0k
M: M
ax P
rimary Ed
ucation
Man
go A
crea
ge
M: M
ax H
igher
Edu
catio
n
Men
stru
al Mater
ials
Chil
dren
Not
Living
at H
ome
Wife
beating Jus
tified
Bana
na A
crea
ge
F: Used
a Com
puter
Female
Glas
ses
F: Nev
er R
ead New
spap
er
Raw
Val
ue (
Eit
her
Perc
enta
ge o
r R
atio
) Kusht ia Nat ional Average

Dhaka, Dhaka
VE Vulnerability Score
0.20(lowest)
VE Events Timeline
5.94(highest)
Rank:4 of 64
4.39
Year 2010 2011 2012 2013 2014 2015 2016 2017 2018 2019 2020 Total
# of VE Events 37 10 26 72 41 131 29 13 12 7 2 380
Socio-Economic Measures
Population: 12,043,977 (#1)
Percent Urban: 77.1% (#1)
Poverty Incidence: 15.7% (#60)
Female Secondary School Completion: 56.6%
(#60)
Households with Electricity: 99.7% (#2)
GNI per Capita (thousands of USD): 9.06 (#1)
Percent Muslim: 93.1% (#29)
Human Development Index: 0.695 (#1)
Percent of women who feel a husband is
justified in beating his wife: 20.2% (#45)
TIP: 0.41 cases per 100,000 population
(#22)
U15 Child Marriage: 16.8% (#43)
U18 Child Marriage: 44.4% (#49)
Literacy Rate 7+: 61.9% (#40)
Madrasahs
Dhaka has 258 Aleya and 306 registered Qawmi
madrasahs, with madrasahs making up 12.9 percent of all
schools (#49). During the coronavirus pandemic, the
government ordered a shutdown of all schools. Many
Qawmi madrasahs stayed open illegally, causing worry that
madrasahs would draw students away from public schools.
Jamiya Islamia Darul Ulum Madrasah, a Dhaka Qawmi
madrasah with over 8,000 students, held its master’s-
equivalent exam in April 2021.
VE Organizations
With 380 violent events in the last ten years, by far the most in the country, Dhaka has a powerful and
deadly VE presence. ISIS and the Ansarullah Bangla Team, an al-Qaeda-affiliated group, are active in the zila,
along with many other domestic Islamic extremist organizations such as JMB, HuJI-B, and Ansar al-Islam. On
July 1, 2016, 28 people, including 17 foreigners, were killed when ISIS militants open-fired on the Holey
Artisan Bakery in Dhaka and took patrons hostage in a 12-hour standoff. The most recent ISIS attack was
carried out in April 2019, when a bomb killed two people; it was the first ISIS-related incident in almost two
years. In 2020, two female JMB members were arrested in Dhaka for recruiting female jihadists through social
media, revealing an expanding “sister wing” of the organization.
VE Vulnerability Index for Zila & National Average Values
Derived from over 1,400 indicators,
the zila vulnerability measure is
composed of the subset of indicators
and weightings that represent the
optimal combination characteristic of
the VE ecosystem. This graph displays
the indicator values in this optimal
subset. The red bars are the values
for the particular zila. The grey bars
represent the national averages. The
statistical interpretation of these
indicator combinations, their
correlations with other factors, and
the phenomena for which they serve
as proxy measures, provide insight
and evidence for summaries below.
Summary Description • Dhaka zila contains the capital, Dhaka, and is located in the center of the country and is the home of the Bangladesh National Parliament. With over 12
million people, it is the most densely populated, wealthy, and urban zila in the country. Dhaka is the ninth-largest city in the world and contributes 40 percent of the GDP of Bangladesh.
• High rates of TV ownership and females using a computer indicate access to technology, including for women. VE groups often recruit online, and a growing number of women are being indoctrinated through social media.
• A high TIP rate reflects a major issue of human trafficking in the city. Rapid urbanization in Bangladesh has led to millions of people living in slums and
seeking employment in Dhaka, which results in high vulnerability to labor and sex trafficking. • With the fifth-lowest female secondary school completion rate and a bottom ten literacy rates for children over seven, Dhaka has a problem of access to
education. The 44 universities, over 5,000 total schools, and a high maximum male higher education rate reveal that educational institutions are not
lacking, however, and educational barriers are more likely due to socioeconomic status and wealth inequality.
Geographically-Targeted Interventions
In Dhaka, high priority interventions include increasing sanitary and education facilities in low-income areas, increasing awareness of VE online propaganda practices and recruitment, and continuing the strong police response. Dhaka is on track to be the sixth-largest megacity in the world by 2030, and as a result is experiencing the effects of rapid urbanization and wealth inequality, which leaves the zila vulnerable to extreme poverty in urban slums and societal changes
that fuel TIP and VE. The municipal government should invest heavily in its sanitation systems to ensure access to clean drinking water facilities to increase living standards. Education infrastructure should be improved, teachers should be given a fair wage, and should be entirely free for residents to encourage the
development of an educated work force and the enrollment of children in regulated public schools.
The Metro Rail project is currently under construction in Dhaka, but the city should also promote the use of bicycles with designated bike lanes to further
reduce air pollution and improve traffic congestion. Local law enforcement and train workers should undergo mandatory training to recognize signs of sex
trafficking and suspicious movement.
To address extremism directly, the zila should implement a public initiative on social media and through physical advertisements to educate residents on online
indoctrination, including signs of extremist accounts or changes in a family member’s behavior, and encourage people to report any suspicious activity.
21.50
0
0.2
0.4
0.6
0.8
1
1.2
1.4
1.6
1.8
2
Med
ical B
irth
Metal Roo
fs
Antena
tal C
are
Con
trac
eptiv
es
Tempe
rature
Ran
ge
Chil
dren
Alpha
bet
U15
Chil
d Marria
ge
Bicy
cles
Mot
orcy
cles
F: Max
Prim
ary Ed
ucation
F: Birth Re
gistration
U18
Chil
d Marria
ge
F/M at H
ome
F: Livin
g in Sa
me Plac
e
TV O
wne
rship
TIP Victim
s pe
r 10
0k
M: M
ax P
rimary Ed
ucation
Man
go A
crea
ge
M: M
ax H
igher
Edu
catio
n
Men
stru
al Mater
ials
Chil
dren
Not
Living
at H
ome
Wife
beating Jus
tified
Bana
na A
crea
ge
F: Used
a Com
puter
Female
Glas
ses
F: Nev
er R
ead New
spap
er
Raw
Val
ue (
Either
Perc
enta
ge o
r R
atio
) Dhaka National Average
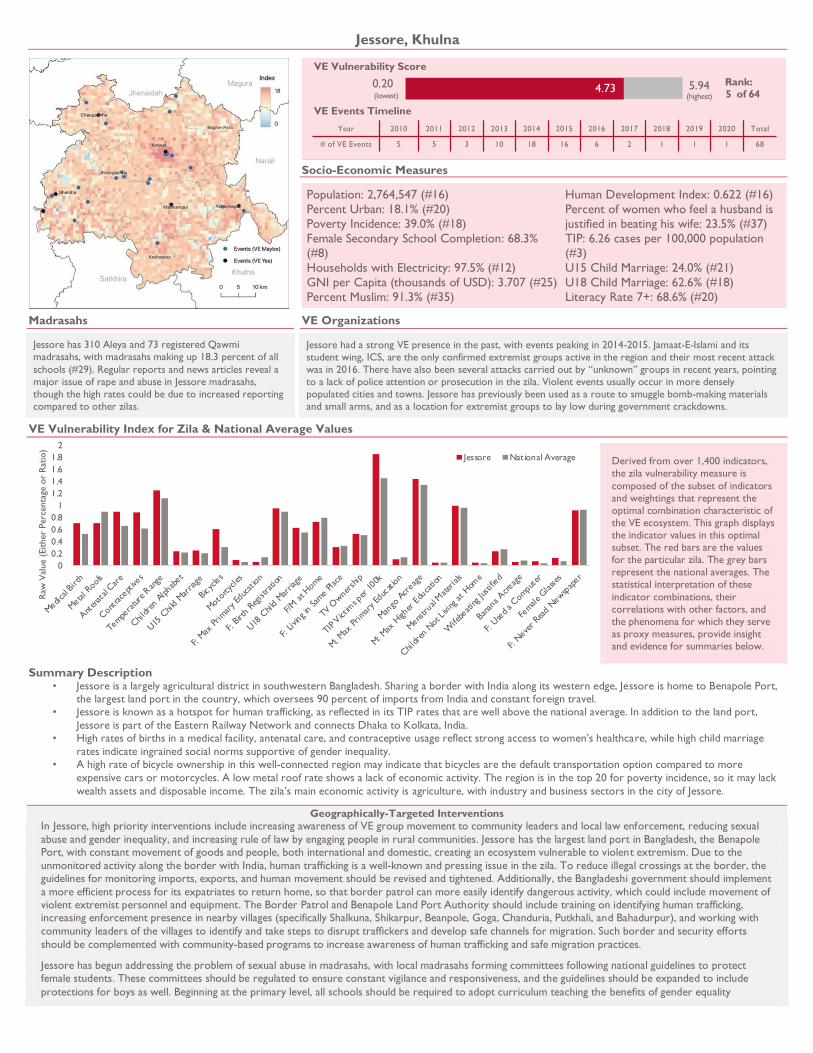
Jessore, Khulna
VE Vulnerability Score
0.20(lowest)
VE Events Timeline
5.94(highest)
Rank:5 of 64
4.73
Year 2010 2011 2012 2013 2014 2015 2016 2017 2018 2019 2020 Total
# of VE Events 5 5 3 10 18 16 6 2 1 1 1 68
Socio-Economic Measures
Population: 2,764,547 (#16)
Percent Urban: 18.1% (#20)
Poverty Incidence: 39.0% (#18)
Female Secondary School Completion: 68.3%
(#8)
Households with Electricity: 97.5% (#12)
GNI per Capita (thousands of USD): 3.707 (#25)
Percent Muslim: 91.3% (#35)
Human Development Index: 0.622 (#16)
Percent of women who feel a husband is
justified in beating his wife: 23.5% (#37)
TIP: 6.26 cases per 100,000 population
(#3)
U15 Child Marriage: 24.0% (#21)
U18 Child Marriage: 62.6% (#18)
Literacy Rate 7+: 68.6% (#20)
Madrasahs
Jessore has 310 Aleya and 73 registered Qawmi
madrasahs, with madrasahs making up 18.3 percent of all
schools (#29). Regular reports and news articles reveal a
major issue of rape and abuse in Jessore madrasahs,
though the high rates could be due to increased reporting
compared to other zilas.
VE Organizations
Jessore had a strong VE presence in the past, with events peaking in 2014-2015. Jamaat-E-Islami and its
student wing, ICS, are the only confirmed extremist groups active in the region and their most recent attack
was in 2016. There have also been several attacks carried out by “unknown” groups in recent years, pointing
to a lack of police attention or prosecution in the zila. Violent events usually occur in more densely
populated cities and towns. Jessore has previously been used as a route to smuggle bomb-making materials
and small arms, and as a location for extremist groups to lay low during government crackdowns.
VE Vulnerability Index for Zila & National Average Values
Derived from over 1,400 indicators,
the zila vulnerability measure is
composed of the subset of indicators
and weightings that represent the
optimal combination characteristic of
the VE ecosystem. This graph displays
the indicator values in this optimal
subset. The red bars are the values
for the particular zila. The grey bars
represent the national averages. The
statistical interpretation of these
indicator combinations, their
correlations with other factors, and
the phenomena for which they serve
as proxy measures, provide insight
and evidence for summaries below.
Summary Description • Jessore is a largely agricultural district in southwestern Bangladesh. Sharing a border with India along its western edge, Jessore is home to Benapole Port,
the largest land port in the country, which oversees 90 percent of imports from India and constant foreign travel. • Jessore is known as a hotspot for human trafficking, as reflected in its TIP rates that are well above the national average. In addition to the land port,
Jessore is part of the Eastern Railway Network and connects Dhaka to Kolkata, India. • High rates of births in a medical facility, antenatal care, and contraceptive usage reflect strong access to women’s healthcare, while high child marriage
rates indicate ingrained social norms supportive of gender inequality. • A high rate of bicycle ownership in this well-connected region may indicate that bicycles are the default transportation option compared to more
expensive cars or motorcycles. A low metal roof rate shows a lack of economic activity. The region is in the top 20 for poverty incidence, so it may lack
wealth assets and disposable income. The zila’s main economic activity is agriculture, with industry and business sectors in the city of Jessore.
Geographically-Targeted Interventions
In Jessore, high priority interventions include increasing awareness of VE group movement to community leaders and local law enforcement, reducing sexual
abuse and gender inequality, and increasing rule of law by engaging people in rural communities. Jessore has the largest land port in Bangladesh, the Benapole Port, with constant movement of goods and people, both international and domestic, creating an ecosystem vulnerable to violent extremism. Due to the
unmonitored activity along the border with India, human trafficking is a well-known and pressing issue in the zila. To reduce illegal crossings at the border, the guidelines for monitoring imports, exports, and human movement should be revised and tightened. Additionally, the Bangladeshi government should implement
a more efficient process for its expatriates to return home, so that border patrol can more easily identify dangerous activity, which could include movement of violent extremist personnel and equipment. The Border Patrol and Benapole Land Port Authority should include training on identifying human trafficking, increasing enforcement presence in nearby villages (specifically Shalkuna, Shikarpur, Beanpole, Goga, Chanduria, Putkhali, and Bahadurpur), and working with
community leaders of the villages to identify and take steps to disrupt traffickers and develop safe channels for migration. Such border and security efforts
should be complemented with community-based programs to increase awareness of human trafficking and safe migration practices.
Jessore has begun addressing the problem of sexual abuse in madrasahs, with local madrasahs forming committees following national guidelines to protect female students. These committees should be regulated to ensure constant vigilance and responsiveness, and the guidelines should be expanded to include
protections for boys as well. Beginning at the primary level, all schools should be required to adopt curriculum teaching the benefits of gender equality
0
0.2
0.4
0.6
0.8
1
1.2
1.4
1.6
1.8
2
Med
ical Birth
Met
al R
oofs
Ant
enat
al Car
e
Con
trac
eptiv
es
Tempe
rature
Ran
ge
Childre
n Al
phab
et
U15
Child M
arria
ge
Bic y
cles
Mot
orcy
cles
F: M
ax Primar
y Ed
ucat
ion
F: B
irth
Registra
tion
U18
Child M
arria
ge
F/M
at H
ome
F: Living in Sam
e Plac
e
TV O
wne
rship
TIP Vict
ims p
er 100
k
M: M
ax Primar
y Ed
ucation
Man
go A
crea
ge
M: M
ax H
igher
Edu
catio
n
Men
stru
al M
ater
ials
Childre
n Not
Livi
ng at Hom
e
Wife
beating Justified
Bana
na A
crea
ge
F: U
sed a Com
pute
r
Female Glasses
F: N
ever
Rea
d New
spap
er
Raw
Val
ue (
Either
Perc
enta
ge o
r R
atio
)
Jessore National Average

Meherpur, Khulna
VE Vulnerability Score
0.20(lowest)
VE Events Timeline
5.94(highest)
Rank:6 of 64
5.17
Year 2010 2011 2012 2013 2014 2015 2016 2017 2018 2019 2020 Total
# of VE Events 4 2 1 6 6 2 0 0 1 0 0 22
Socio-Economic Measures
Population: 655,392 (#61)
Percent Urban: 11.6% (#54)
Poverty Incidence: 15.2% (#61)
Female Secondary School Completion: 69.0%
(#7)
Households with Electricity: 97.5% (#12)
GNI per Capita (thousands of USD): 4.241 (#12)
Percent Muslim: 95.9% (#12)
Human Development Index: 0.610 (#29)
Percent of women who feel a husband is
justified in beating his wife: 10.7% (#57)
TIP: 1.83 cases per 100,000 population
(#10)
U15 Child Marriage: 25.9% (#12)
U18 Child Marriage: 75.4% (#1)
Literacy Rate 7+: 67.3% (#24)
Madrasahs
Meherpur has 24 Aleya and 19 registered Qawmi madrasahs.
Madrasahs make up 9.9 percent of all schools (#57), a low
amount given its high Muslim population. Given this disparity and the region’s rural composition, there are likely
unregistered Qawmi madrasahs as the ecosystem provides an
opportunity for private schools to operate outside the scope
of the government.
VE Organizations
As the original seat of the Bangladesh government in 1971, Meherpur has a history of political rife VE. It was a central focus of anti-terrorism efforts prior to 2010. From 2013-2014, Jamaat-E-Islami was responsible for a string of
four deadly attacks, while several past events, including rural explosions, have been carried out by “Unknown” or
“Pro Hartal” groups. Violent extremist events have greatly decreased recently, with only one event in the last five
years, but the April 2021 arrest of 13 Jamaat-e-Islami members and subsequent seizure of extremist books and explosive cocktails indicates that extremist groups are still present and could be reemerging. In 2017, the murders of
two local men were attributed to their desertion of a violent extremist group.
VE Vulnerability Index for Zila & National Average Values
Derived from over 1,400 indicators,
the zila vulnerability measure is
composed of the subset of indicators
and weightings that represent the
optimal combination characteristic of
the VE ecosystem. This graph displays
the indicator values in this optimal
subset. The red bars are the values
for the particular zila. The grey bars
represent the national averages. The
statistical interpretation of these
indicator combinations, their
correlations with other factors, and
the phenomena for which they serve
as proxy measures, provide insight
and evidence for summaries below.
Summary Description
• Meherpur is the smallest zila in Bangladesh by area and was home to the first provincial government of Bangladesh in 1971. It lies on the western
edge of the country and shares its entire western border with India.
• Meherpur is one of the wealthiest regions in Bangladesh, ranking 61st in its poverty rate, as well as 12th overall in national GNI per capita. • High rates of medical birth, antenatal care, and contraceptives and low support of justified wife-beating indicate a degree of female autonomy and
empowerment. However, high child marriage rates, especially for U18, suggest societal gender inequality.
• High female secondary school completion rates and low rates of maximum primary education indicate access to education.
• A high TIP case ranking and current reports of illegal border crossings reflect porosity along the Meherpur-Indian border. High rates of bicycle and motorcycle ownership and below-average female living in the same place indicate that there is transportation infrastructure and regular
movement throughout the zila. Coupled with rural isolation, these factors could be appealing for VE groups to organize, train, and travel.
Geographically-Targeted Interventions
In Meherpur, the high priority interventions include increasing rule of law in the rural areas, monitoring madrasahs in the area, and encouraging gender equality
programming in the public schools. Meherpur has not experienced high levels of violence in the past ten years, but its socio-cultural ecosystem, longer-term history of VE, and recent reports of extremist groups in the region make it a highly vulnerable zila. The recent arrests of 13 Jamaat-e-Islami members reflects
the continued use of the zila as an area for VE to operate within, perhaps due to the rural population and lack of rule of law in the area, as shown by the low reports of human trafficking. Although the region has high education rates, rural areas are vulnerable to unregistered madrasah development and are likely already fostering unregistered Qawmi schools. To address possible extremist indoctrination, the district government should devise a taskforce to seek out
unregistered Qawmi madrasahs. The federal government should implement a mandatory review of Qawmi madrasah curriculums.
Additionally, more government primary schools should be built to limit the appeal of madrasahs and school fees should be discouraged by the government to
provide free schooling in practice. To ensure that children have easy access to these schools and to limit isolated regions suitable for extremist hideouts, connecting roads should be built off R745, R749, and Z7452 to rural villages. Schools should adopt gender equality curriculum for all students starting in the
primary years to change both the female and male attitude toward child marriage.
0
0.2
0.4
0.6
0.8
1
1.2
1.4
1.6
1.8
2
Med
ical Birth
Met
al R
oofs
Ant
enat
al Car
e
Con
trac
eptiv
es
Tempe
rature
Ran
ge
Childre
n Al
phab
et
U15
Child M
arria
ge
Bic y
cles
Mot
orcy
cles
F: M
ax Primar
y Ed
ucat
ion
F: B
irth
Registra
tion
U18
Child M
arria
ge
F/M
at H
ome
F: Living in Sam
e Plac
e
TV O
wne
rship
TIP Vict
ims p
er 100
k
M: M
ax Primar
y Ed
ucation
Man
go A
crea
ge
M: M
ax H
igher
Edu
catio
n
Men
stru
al M
ater
ials
Childre
n Not
Livi
ng at Hom
e
Wife
beating Justified
Bana
na A
crea
ge
F: U
sed a Com
pute
r
Female Glasses
F: N
ever
Rea
d New
spap
erRaw
Val
ue (
Eit
her
Perc
enta
ge o
r R
atio
)
Meherpur Nat ional Average

Satkhira, Khulna
VE Vulnerability Score
0.20(lowest)
VE Events Timeline
5.94(highest)
Rank:7 of 64
4.61
Year 2010 2011 2012 2013 2014 2015 2016 2017 2018 2019 2020 Total
# of VE Events 1 3 3 22 19 3 4 4 0 1 0 60
Socio-Economic Measures
Population: 1,985,959 (#31)
Percent Urban: 9.6% (#62)
Poverty Incidence: 46.3% (#9)
Female Secondary School Completion: 69.2%
(#6)
Households with Electricity: 81.6% (#49)
GNI per Capita (thousands of USD): 3.134 (#49)
Percent Muslim: 78.3% (#55)
Human Development Index: 0.620 (#19)
Percent of women who feel a husband is
justified in beating his wife: 14.7% (#54)
TIP: 2.47 cases per 100,000 population
(#8)
U15 Child Marriage: 28.8% (#6)
U18 Child Marriage: 71.9% (#6)
Literacy Rate 7+: 75.1% (#8)
Madrasahs
Satkhira has 235 Aleya and 66 registered Qawmi madrasahs,
with madrasahs making up 21.5 percent of all schools (#16), a
high amount given its lower Muslim population in comparison to other areas. This suggests that there is a demand from
these or perhaps any schools in the area.
VE Organizations
Satkhira has had an active Jamaat-E-Islami and ICS presence in the last ten years, especially in 2013-14, and ISIS, JMB, and PBCP have all been involved in violent events since 2016. Attacks happened both in cities and rural areas in the
southern part of the zila. There is a history of violence against Hindu communities in the zila, perpetrated by Jamaat-
E-Islami and ISIS in the past ten years and by villagers as recently as April 2021. PBCP has a strong presence in the
region, as they often target rural areas and reportedly delay remote development through extortion of contractors.
VE Vulnerability Index for Zila & National Average Values
Derived from over 1,400 indicators,
the zila vulnerability measure is
composed of the subset of indicators
and weightings that represent the
optimal combination characteristic of
the VE ecosystem. This graph displays
the indicator values in this optimal
subset. The red bars are the values
for the particular zila. The grey bars
represent the national averages. The
statistical interpretation of these
indicator combinations, their
correlations with other factors, and
the phenomena for which they serve
as proxy measures, provide insight
and evidence for summaries below.
Summary Description • Satkhira is the southwestern-most zila in Bangladesh, sharing a long southeastern border with West Bengal and a coastline on the Bay of Bengal. The zila is
geographically closest to Kolkata’s metropolitan area, which is a known destination hub for trafficking. It is predominately an agricultural and aquacultural society,
with high levels of unemployment and high levels of poverty.
• High TIP rates reflect a major issue of human trafficking across the land border with India. In June 2021, members of a gang who trafficked thousands of girls to
India via TikTok were arrested while traveling through Satkhira.
• While Satkhira ranks high in some female empowerment measures, it has high societal gender inequality, as demonstrated in its high U15 and U18 marriage rates
and high levels of women experiencing threats and physical abuse from their spouse.
• The Bhomra land port near the Indian border, which was recently constructed, is one of the main land ports in Bangladesh after Benapole in Jessore. The land port
facilitates high volumes of traffic across the border, mostly to and from Kolkata.
Geographically-Targeted Interventions
In Satkhira, high priority interventions include increasing awareness of VE among community leaders, border security, and local law enforcement; increasing rule of law in
the zila; and reducing societal gender inequality. With a well-known Jamaat-e-Islami presence and more recent violent events linked to ISIS, JMB, and the PBCP, Satkhira
is highly vulnerable to VE. The Bhomra land port is the second-largest land port in Bangladesh and a significant economic hub of Satkhira. Known human trafficking routes
go through the port and other border points; the remote border with India, lined by the Ichamati River, is easily crossed without detection. Since VE groups and human
traffickers seek cover in rural regions, rural development and stronger security forces in rural areas should be a top priority for the zila. The strong response in the past
to VE in Satkhira has involved police extrajudicially killing those deemed violent extremists. Victims as young as 15 have been killed by police under allegedly falsified
stories. While aggressive action against VE groups is necessary, authorities in Satkhira should look to make their processes more transparent and follow proper legal
action. NGOs should encourage and assist citizens in proper legal processes and rights. It is difficult to ask citizens to report suspicious activity about insurgencies
without belief in the justice system, and if authorities continue to face accusations of unjustified killings of teenagers, whether or not they are true, they decrease societal
confidence in policing and its overall effectiveness.
To reduce child marriage and increase female safety, the zila should require all schools, beginning at the primary level, to incorporate material teaching the benefits of
gender equality into their curriculums. The district should implement community programs for both men and women promoting the benefits of gender equality and the
harmful effects of child marriage, focusing on economic and health advantages. To promote resiliency against climate change, the government should implement programs
educating the population on climate change and sustainable farming methods and subsidize farmers growing resilient crops. The zila should extend the southernmost
Z7617 highway, which currently ends in the northern half of the district, all the way south and build major connecting roads to smaller villages. This effort should be
paired with construction of main power lines to expand households’ access to electricity and larger economic markets.
0
0.2
0.4
0.6
0.8
1
1.2
1.4
1.6
1.8
2
Med
ical Birth
Met
al R
oofs
Ant
enat
al Car
e
Con
trac
eptiv
es
Tempe
rature
Ran
ge
Childre
n Al
phab
et
U15
Child M
arria
ge
Bicy
cles
Mot
orcy
cles
F: M
ax Primar
y Ed
ucat
ion
F: B
irth
Registra
tion
U18
Child M
arria
ge
F/M
at H
ome
F: Living in Sam
e Plac
e
TV O
wne
rship
TIP Vict
ims p
er 100
k
M: M
ax Primar
y Ed
ucation
Man
go A
crea
ge
M: M
ax H
igher
Edu
catio
n
Men
stru
al M
ater
ials
Childre
n Not
Livi
ng at Hom
e
Wife
beating Justified
Bana
na A
crea
ge
F: U
sed a Com
pute
r
Female Glasses
F: N
ever
Rea
d New
spap
er
Raw
Val
ue (
Either
Perc
enta
ge o
r R
atio
)
Satkhira Nat ional Average

Nawabganj, Rajshahi
VE Vulnerability Score
0.20(lowest)
VE Events Timeline
5.94(highest)
Rank:8 of 64
4.67
Year 2010 2011 2012 2013 2014 2015 2016 2017 2018 2019 2020 Total
# of VE Events 2 0 0 13 4 13 2 2 0 0 0 36
Socio-Economic Measures
Population: 1,647,521 (#40)
Percent Urban: 21.9% (#14)
Poverty Incidence: 25.3% (#49)
Female Secondary School Completion: 66.5%
(#19)
Households with Electricity: 87.9% (#36)
GNI per Capita (thousands of USD): 3.151 (#46)
Percent Muslim: 95.2% (#17)
Human Development Index: 0.578 (#52)
Percent of women who feel a husband is
justified in beating his wife: 19.0% (#46)
TIP: 0.06 cases per 100,000 population
(#37)
U15 Child Marriage: 38.6% (#1)
U18 Child Marriage: 73.6% (#3)
Literacy Rate 7+: 64.2% (#30)
Madrasahs
Nawabganj has 138 Aleya and 32 registered Qawmi
madrasahs, with madrasahs making up 16.0 percent of all
schools (#39). JMB, a prominent group in the zila with
regular movement across the border, is known to recruit
members from madrasahs in this zila. As a hotspot for
remote terrorist dens, it is likely there are also
unregistered, possibly extremist affiliated Qawmi
madrasahs in the region.
VE Organizations
Though Nawabganj has not experienced any confirmed extremist events since 2017, the zila has a recent
history with terrorist groups, with the five most recent attacks attributed to either ISIS or JMB. In April 2017,
four ISIS militants accused of planning and carrying out the Holey Artisan Bakery attack were killed by police
during a raid on their hideout, and, in November 2017, three members of JMB blew themselves up in their
rural hideout during a police operation. In August 2018, 17 suspected JMB members were arrested in a
Nawabganj hideout. The zila is used as a place for extremist organizations, especially JMB, to live and train in
relative isolation, and the border with India is a hotspot for smuggling militants, weapons, and equipment for
these groups.
VE Vulnerability Index for Zila & National Average Values
Derived from over 1,400 indicators,
the zila vulnerability measure is
composed of the subset of indicators
and weightings that represent the
optimal combination characteristic of
the VE ecosystem. This graph displays
the indicator values in this optimal
subset. The red bars are the values
for the particular zila. The grey bars
represent the national averages. The
statistical interpretation of these
indicator combinations, their
correlations with other factors, and
the phenomena for which they serve
as proxy measures, provide insight
and evidence for summaries below.
Summary Description • Nawabganj is the westernmost district in Bangladesh and shares an extensive border with India. Strong transportation systems connect much of
the zila to the rest of Bangladesh, including Dhaka.
• While the female education rates are above average, Nawabganj has the highest rate of U15 marriage (38.6 percent) in the country. It also ranks
second-highest for women who do not work because their husbands do not allow them. These indicators suggest the highest levels of gender inequality, which limits economic mobility and decision-making for women.
• A high TIP rate in the zila is due to the extensive border with India, much of which lies in remote areas and is also used for the smuggling of VE
weapons, equipment, and personnel.
• Wealth measures are low in the zila, with one-fourth of the population living in poverty, and low TV ownership and GNI per capita reveal a lack
of technology and economic mobility in the zila.
Geographically-Targeted Interventions
In Nawabganj, high priority interventions include increasing awareness of VE among border security, local law enforcement, and community leaders,
and reducing societal gender inequality. Nawabganj has not experienced VE events recently, but it is known to be an attractive region for Islamic
extremist organizations, particularly ISIS and JMB, to lay low and organize in scarcely populated areas. The Bangladesh Police Force should continue to
focus its efforts on detecting and raiding terrorist hideouts in the zila. The zila should implement community programs to educate residents on
identifying extremist indoctrination and recruitment and encourage anonymous reports to police of possible extremist activity.
To address possible extremist indoctrination, the district government should devise a taskforce to seek out unregistered Qawmi madrasahs. To
reduce child marriage, the government should require all schools to incorporate material teaching the benefits of gender equality into their
curriculums beginning at the primary level. The district should implement community programs for both men and women, aimed at promoting the
benefits of gender equality and the harmful effects of child marriage, and focusing on economic and health advantages.
0
0.2
0.4
0.6
0.8
1
1.2
1.4
1.6
1.8
2
Med
ical Birth
Met
al R
oofs
Ant
enat
al Car
e
Con
trac
eptiv
es
Tempe
rature
Ran
ge
Childre
n Al
phab
et
U15
Child M
arria
ge
Bic y
cles
Mot
orcy
cles
F: M
ax Primar
y Ed
ucat
ion
F: B
irth
Registra
tion
U18
Child M
arria
ge
F/M
at H
ome
F: Living in Sam
e Plac
e
TV O
wne
rship
TIP Vict
ims p
er 100
k
M: M
ax Primar
y Ed
ucation
Man
go A
crea
ge
M: M
ax H
igher
Edu
catio
n
Men
stru
al M
ater
ials
Childre
n Not
Livi
ng at Hom
e
Wife
beating Justified
Bana
na A
crea
ge
F: U
sed a Com
pute
r
Female Glasses
F: N
ever
Rea
d New
spap
er
Raw
Val
ue (
Either
Perc
enta
ge o
r R
atio
)
Nawabganj Nat ional Average

Khulna, Khulna
VE Vulnerability Score
0.20(lowest)
VE Events Timeline
5.94(highest)
Rank:9 of 64
4.35
Year 2010 2011 2012 2013 2014 2015 2016 2017 2018 2019 2020 Total
# of VE Events 4 7 8 5 2 4 3 2 3 1 0 39
Socio-Economic Measures
Population: 2,318,527 (#24)
Percent Urban: 33.7% (#5)
Poverty Incidence: 38.8% (#19)
Female Secondary School Completion: 65.8%
(#24)
Households with Electricity: 86.4% (#40)
GNI per Capita (thousands of USD): 3.134 (#49)
Percent Muslim: 78.0% (#56)
Human Development Index: 0.620 (#19)
Percent of women who feel a husband is
justified in beating his wife: 32% (#18)
TIP: 9.49 cases per 100,000 population
(#2)
U15 Child Marriage: 25.6% (#13)
U18 Child Marriage: 60.2% (#25)
Literacy Rate 7+: 62.4% (#37)
Madrasahs
Khulna has 124 Aleya and 74 registered Qawmi
madrasahs, with madrasahs making up 13.9 percent of all
schools (#42). With a 22 percent Hindu population (#5)
and most VE attributed to political groups, it is unlikely
that students in Khulna are highly vulnerable to Islamic
extremist education in these schools.
VE Organizations
Khulna has one of the highest numbers of VE acts in the past ten years (#12), by mostly political
organizations, particularly the Awami League, the Bangladesh Chhatra League, and the PBCP. The majority of
VE events have taken place in city centers, mostly in the main city of Khulna, though PBCP and the Awami
League have also targeted rural farmland. While VE has decreased in the second half of the decade, the most
recent attack in 2019 was carried out by ISIS on an Awami League office, showing a new presence of
transnational Islamic terrorism in the zila that continues to focus on political targets.
VE Vulnerability Index for Zila & National Average Values
Derived from over 1,400 indicators,
the zila vulnerability measure is
composed of the subset of indicators
and weightings that represent the
optimal combination characteristic of
the VE ecosystem. This graph displays
the indicator values in this optimal
subset. The red bars are the values
for the particular zila. The grey bars
represent the national averages. The
statistical interpretation of these
indicator combinations, their
correlations with other factors, and
the phenomena for which they serve
as proxy measures, provide insight
and evidence for summaries below.
Summary Description • Khulna is on the western side of Bangladesh, with a southern border with the Bay of Bengal. • The city of Khulna is the third-largest city in Bangladesh and a major urban center for business and commerce. The city also hosts a base for the
Bangladeshi Navy and the Port of Mongla, a major seaport. The rest of zila contains farmland and a UNESCO World Heritage Site, the Sundarbans (a
mangrove forest), which is a leading destination for small tourism. • High rates of education, two universities (#7), and eight government colleges (#3) mark Khulna as a leader in education. However, violence from the
Bangladesh Chhatra (Student) League indicates potential political radicalization in educational institutions. • Measures of female mobility and empowerment are high. These rates are likely due to the zila’s major urban center, although for the strong educational
facilities in the area, females completing secondary school are not considered consistent in the zila. • In Khulna, a high percentage of women responded that they do not work due to societal constraints and the zila has high child marriage rates, indicating
gender inequality.
Geographically-Targeted Interventions
In Khulna, high priority interventions include increasing pro-democracy programming among university students, raising awareness of politically motivated violent
extremist organizations among community leaders and local law enforcement, and continued monitoring of the Port of Mongla for suspicious movement of people and
goods. Most VE in Khulna takes place in the main city and is carried out by political organizations. The zila has many colleges and universities, but factions of the
Bangladesh Chhatra League recruit members and organized within these institutions. The main interventions should be primarily aimed at establishing political peace
rather than focusing on Islamist extremists. Implementing programs that encourage free and fair democratic elections and pro-democracy programs should be given in
the surrounding areas of Khulna city. Furthermore, increased monitoring of the PBCP, which is active in the region and has fallen under the radar of terrorist crackdown
efforts in comparison to Islamic extremist groups. Finally, programs at the universities and colleges should focus on anti-violence and anti-radicalization of students.
As it is a port city, Khulna should continue to be monitored as a potential point of entry and a target of extremist groups. Programs should be implemented to increase
monitoring and recording of imports, exports, and human activity in and out of the Port of Mongla to cut off a potential path for human trafficking and terrorist
personnel and equipment. This is important, as the Khulna-Mongla Port Rail Line Project, which will increase transnational trade through the port, is set to be finished by
the end of 2021. Though many are currently weakened, VE groups attempting to make a resurgence will want to target locations that are both populous and meaningful.
The Port of Mongla presents a unique opportunity for extremist groups and should continue to be monitored as a point of interest.
0
0.2
0.4
0.6
0.8
1
1.2
1.4
1.6
1.8
2
Med
ical Birth
Met
al R
oofs
Ant
enat
al Car
e
Con
trac
eptiv
es
Tempe
rature
Ran
ge
Childre
n Al
phab
et
U15
Child M
arria
ge
Bic y
cles
Mot
orcy
cles
F: M
ax Primar
y Ed
ucat
ion
F: B
irth
Registra
tion
U18
Child M
arria
ge
F/M
at H
ome
F: Living in Sam
e Plac
e
TV O
wne
rship
TIP Vict
ims p
er 100
k
M: M
ax Primar
y Ed
ucation
Man
go A
crea
ge
M: M
ax H
igher
Edu
catio
n
Men
stru
al M
ater
ials
Childre
n Not
Livi
ng at Hom
e
Wife
beating Justified
Bana
na A
crea
ge
F: U
sed a Com
pute
r
Female Glasses
F: N
ever
Rea
d New
spap
erRaw
Val
ue (
Eit
her
Perc
enta
ge o
r R
atio
)
Khulna Nat ional Average

Dinajpur, Rangpur
VE Vulnerability Score
0.20(lowest)
VE Events Timeline
5.94(highest)
Rank:10 of 64
4.03
Year 2010 2011 2012 2013 2014 2015 2016 2017 2018 2019 2020 Total
# of VE Events 1 0 1 2 10 7 0 0 0 0 0 21
Socio-Economic Measures
Population: 2,990,128 (#11)
Percent Urban: 14.5% (#37)
Poverty Incidence: 37.9% (#22)
Female Secondary School Completion: 66.1%
(#23)
Households with Electricity: 92.5% (#27)
GNI per Capita (thousands of USD): 3.203 (#40)
Percent Muslim: 77.2% (#57)
Human Development Index: 0.614 (#22)
Percent of women who feel a husband is
justified in beating his wife: 44.5% (#5)
TIP: 0.00 cases per 100,000 population
(#39)
U15 Child Marriage: 24.9% (#18)
U18 Child Marriage: 57.5% (#33)
Literacy Rate 7+: 69.9% (#17)
Madrasahs
Dinajpur has 326 Aleya and 109 registered Qawmi
madrasahs, with madrasahs making up 13.6 percent of all
schools (#46). With the third-highest Hindu population
and the fifth-most schools in the country, it is unlikely that
the zila is home to many unregistered Qawmi madrasahs.
VE Organizations
Although Dinajpur has not experienced a violent event by a confirmed extremist organization since 2015, the
zila has a history of a VE group presence, with JMB, ISIS, and Jamaat-E-Islami and ICS particularly active in
2014-2015. In 2015, the zila saw a slew of attacks against foreigners and two high-profile terrorist attacks
earned international attention, as ISIS militants shot an Italian priest in November and JMB members attacked
a Hindu temple in December. Since then, Dinajpur has been a central target of the Bangladeshi government
crackdown on terrorism.
VE Vulnerability Index for Zila & National Average Values
Derived from over 1,400 indicators,
the zila vulnerability measure is
composed of the subset of indicators
and weightings that represent the
optimal combination characteristic of
the VE ecosystem. This graph displays
the indicator values in this optimal
subset. The red bars are the values
for the particular zila. The grey bars
represent the national averages. The
statistical interpretation of these
indicator combinations, their
correlations with other factors, and
the phenomena for which they serve
as proxy measures, provide insight
and evidence for summaries below.
Summary Description • Situated in northwest Bangladesh, Dinajpur is a largely agricultural district that shares its southwestern border with India.
• Land Port is a checkpoint and customs office for the movement of goods and people located on the Dinajpur-India border. The border in general
is very porous.
• A low rate of female computer usage, high rates of females never reading the newspaper, and high rates of females who justified spousal violence reveal restrictions on women’s access to information and a lack of female empowerment. Additionally, low antenatal care and contraceptive rates
reflect a lack of women’s healthcare education and infrastructure.
• Dinajpur ranks fifth-in percentage of women who feel beating is justified, and the U15 and U18 child marriage rates rank within the top half of
Bangladesh. These indicators suggests that societal gender inequality is strong within the zila. VE groups often recruit online through social media.
Geographically-Targeted Interventions
In Dinajpur, high priority interventions include increasing awareness of violent extremist groups among community leaders, local law enforcement, and
border patrol; increasing education and health infrastructure; and reducing gender inequality. Dinajpur is a well-connected district with transportation and information infrastructure that lacks in gender equality measures and female empowerment. The border with India is often used for Bangladeshi
citizens to cross into West Bengal both legally and illegally. To reduce illegal immigration, the government should construct waiting areas and
restrooms at Hili Land Port and invest in security technology to facilitate luggage and passenger inspections.
To address low rates of women’s healthcare, the district should support and assist NGOs in constructing women’s health facilities in more rural parts of the zila, and the education board should require mandatory curricula on sexual health and childbearing. Programs for young mothers should be
implemented in communities for women to gather and learn about proper health education for those who are not in school. Additionally, the district
should encourage NGOs, such as CARE Bangladesh, to establish local programs promoting female empowerment and educating both men and women
on the dangers of child marriage and domestic abuse. The government should construct and fund small public libraries throughout the district that
offer safe access to media and classes for women on using information technology.
0
0.2
0.4
0.6
0.8
1
1.2
1.4
1.6
1.8
2
Med
ical Birth
Met
al R
oofs
Ant
enat
al Car
e
Con
trac
ept iv
es
Tempe
rature
Ran
ge
Childre
n Al
phab
et
U15
Child M
arria
ge
Bic y
cles
Mot
orcy
cles
F: M
ax Primar
y Ed
ucat
ion
F: B
irth
Registra
tion
U18
Child M
arria
ge
F/M
at H
ome
F: Living in Sam
e Plac
e
TV O
wne
rship
TIP Vict
ims p
er 100
k
M: M
ax Primar
y Ed
ucation
Man
go A
crea
ge
M: M
ax H
igher
Edu
catio
n
Men
stru
al M
ater
ials
Childre
n Not
Livi
ng at Hom
e
Wife
beating Justified
Bana
na A
crea
ge
F: U
sed a Com
pute
r
Female Glasses
F: N
ever
Rea
d New
spap
er
Raw
Val
ue (
Either
Perc
enta
ge o
r R
atio
)
Dinajpur Nat ional Average

DRG-LER II TASKING N031 COUNTERING VIOLENT EXTREMISM IN BANGLADESH
USAID.GOV FINAL REPORT | 32
ANNEX 2. TECHNICAL SUMMARY OF METHODOLOGY AND
LIMITATIONS ON THE ANALYSIS
TECHNICAL SUMMARY OF METHODOLOGY
Novametrics’ weak-signal analysis provides a means for predicting vulnerability and for identifying
underlying causal relationships among multiple inter-related variables in a dynamic environment. It
was originally developed through a series of research seminars at Princeton University and was
supported with a USD 1.2M Small Business Innovation Research Award from the U.S. Secretary of
Defense to predict conflict in Sub-Saharan Africa. The analysis received an award for “Innovative Use
of Data for Increasing Resilience” from USAID.
Weak-Signal Analysis begins with data fusion through a suite of statistical and regression algorithms
for normalization, standardization, and vectorization, which subdivides populations into small units
for which distinct attributes can be measured. A raw persistent data-storage layer contains all the
raw data in its original form. A virtualized data layer provides an abstraction layer between the
physical data sets and the analysis layer. This is where the data are cleaned, standardized, normalized,
and vectorized. New indicators are created from the original raw data and stored in logical
groupings. Singular-value decomposition is used as an unsupervised self-learning algorithm to identify
agnostically key attributes and their relative weightings. The attributes are tested via resampling
methods to confirm consistency and sensitivity. The outputs are sets of indicators (weak-signals) that
are proxy measures for the underlying causal relationships.
We began with large volumes of data from diverse, mostly open-source datasets from NGOs, media,
the U.S. government, and the statistical authorities of local governments. These datasets included
detailed national census data, health and educational survey data, remote-sensing data suitable for
geospatial analysis, web-scraped data, and data from both formal and informal media sources. The
Novametrics Bangladesh Database contains over half a million socioeconomic indicator values
covering over 1,400 measures for 544 upazilas over 20 years, using 405,257 1km2 pixels. Using
information from hundreds of millions of data values, we developed hundreds of thousands of
human-social-cultural-behavioral attributes differentiated down to the municipality level.
We consider all data to be valuable. While datasets may be of varying quality and completeness, each
has the potential to carry information that reflects a characteristic of a population, either by itself or,
more commonly, through combination with other datasets.
High-resolution geospatial data (typically 1km2 for population, but down to 10-meter resolution for
imagery) and remote-sensing data are converted into tabular data by determining the number of
pixels of each data type within each administrative boundary and multiplying the pixel count by the
area of each 30” x 30” pixel (approximately 1km2), totaling 405,257 distinct area-patches for
Bangladesh. Depending on the data type, either we summed the values, e.g., to determine
population, or we took a statistical measure of the values distribution, e.g., average travel distance to
a road, market, or urban area. For each pixel, the population was derived from Oak Ridge National
Laboratory’s LandScan global population data and represents ambient population averaged over 24
hours.
We calculated indicators from raw survey data at the lower administrative levels. We aggregated
and compared these indicators to reported values at higher administrative levels to confirm the
accuracy of the aggregation. We then translated the responses into indicators based on the nature of
the data. For example, we expressed a simple yes/no on whether a mother uses a mosquito net with

DRG-LER II TASKING N031 COUNTERING VIOLENT EXTREMISM IN BANGLADESH
USAID.GOV FINAL REPORT | 33
a single indicator (“Percentage of Mothers Using a Mosquito Net”), whereas we expressed the
religion of a household more completely with multiple indicators (“Percentage of Muslim
Households,” “Percentage of Christian Households,” etc.). Other survey questions, such as “How
many hours per week did your child attend school?” are aggregated with averages for each
administrative unit.
Additional indicators were calculated by Novametrics either by combining two raw indicators in the
database or calculating the raw data into more meaningful indicators. For example, we calculated the
percentage of female teachers, a useful indicator of gender equality, from the reported number of
female teachers and number of teachers.
Non-numerical data were reformatted into numerical values and processed statistically. For example,
a typical Likert scale was used to survey attitudes with responses like “Strongly Agree,” “Agree,”
“Neutral,” “Disagree,” and “Strongly Disagree,” with responses centered about zero. For some
indicators where the data was a ranked-choice variable, the choices were converted to discrete
numbers between -1 and 1, centered on zero.
Missing data were imputed using linear interpolation or a piecewise cubic polynomial that
interpolates the given data if derivatives are specified at the interpolation points. If a zila was missing
so much data that imputation was unreasonable based on examining the distribution, and if there
were significant events in the zila that would make the data no longer representative, it was rejected
from the analysis. Judgment was applied depending on the potential value of the indicator and the
availability of alternative “proxy” indicators that might capture comparable phenomena within the
socioeconomic ecosystem.
Administrative boundaries were sourced from the Bangladesh Bureau of Statistics. Names and
boundaries were updated to the most current at the time of data analysis. Duplicate names that
refer to different locations were differentiated by appending the name of the next administrative
level up. In the USA, this strategy would distinguish two familiar cities named “Springfield” as
“Illinois.Springfield” and “Virginia.Springfield.”
Novametrics conducted an extensive data mining mission to pull information about VE in Bangladesh
from a variety of sources. We developed two datasets which were then integrated into our VE
database.
The first is a Conflict Event dataset derived from three main sources of information:
1. Armed Conflict Location & Event Data Project (ACLED)
2. Uppsala Conflict Data Project (UCDP) Global Event Database v20.1
3. Global Terrorism Database (GTD)
We cleaned and integrated the data from these events into a single event database. We then
selected a time period of interest, 2010 to 2020, which enabled us to filter our event database and
conduct time-series analysis.
Next, we developed a database of groups with their associated VE status: yes, maybe, or other. The
VE status classification is based on official terrorist group lists from the State Department and
classifications as an actor in a terrorism database like the GTD. This list was sent to USAID
Bangladesh on October 7, 2020 to confirm organizational designations. Absent comment from
USAID Bangladesh, we assumed the listed designations are correct and consistent with USAID

DRG-LER II TASKING N031 COUNTERING VIOLENT EXTREMISM IN BANGLADESH
USAID.GOV FINAL REPORT | 34
designations. We then classified the conflict event data by the VE status of the organization who
perpetrated the event.
As part of our database development, we used a standard event type classification to classify all
events. The event type classification is derived from the ACLED database (Raleigh et al., 2010).
ACLED categorizes events by type, including a main event type and a sub-event type. Therefore, in
addition to general VE indicators such as number of events per zila and number of deaths per zila,
we have created several VE metrics based on event type and VE status of the perpetrating group:
• Violent Events (with VE Status of Yes and Maybe)
• Demonstrations (with VE Status of Yes and Maybe)
• Strategic Developments (with VE Status of Yes and Maybe)
• VE Both
• VE Yes
• VE Maybe
VE Both consists of all VE sub-types, riots, and all strategic developments for actors with a VE Status
of both “Yes” and “Maybe.” VE Yes consists of all VE sub-types, riots, and all strategic developments
for actors with a VE Status of only “Yes.” VE Maybe consists of all VE sub-types, riots, and all
strategic developments for actors with a VE Status of only “Maybe.”
The resulting VE database was then used to generate metrics such as VE-related events or VE-
related deaths per 100,000 population. These metrics were subsequently used in calibrating our
weak-signal analysis.
Bibliography for VE event databases:
• Raleigh, Clionadh, Andrew Linke, Håvard Hegre and Joakim Karlsen. (2010). “Introducing
ACLED-Armed Conflict Location and Event Data.” Journal of Peace Research 47(5) 651-660.
• Pettersson, Therese & Magnus Öberg (2020) Organized violence, 1989-2019. Journal of
Peace Research 57(4).
• National Consortium for the Study of Terrorism and Responses to Terrorism (START),
University of Maryland. (2019). The Global Terrorism™ Database.
Bibliography for VE status determination:
• Carson, J. V., & Suppenbach, M. (2017). The Global Jihadist Movement: The Most Lethal
Ideology?: Homicide Studies. https://doi.org/10.1177/1088767917733783
• Institute of Conflict Management. (n.d.). Terrorist Groups in Bangladesh—South Asia Terrorism
Portal. Retrieved April 28, 2021, from https://www.satp.org/terrorist-groups/bangladesh
• National Consortium for the Study of Terrorism and Responses to Terrorism (START),
University of Maryland. (2019). The Global Terrorism™ Database.
• United States Department of State. (n.d.). Foreign Terrorist Organizations—United States
Department of State. Retrieved April 28, 2021, from https://www.state.gov/foreign-terrorist-
organizations/
Data Preprocessing: weak-signal analysis requires preprocessing the data for each indicator used in the
analysis. If the indicator distribution resembled a Gaussian distribution, we typically subtracted the
mean and normalized by the standard deviation. If the indicator distribution was Log-normal or Chi-
squared, we used the logarithm or square-root, respectively. If the data distribution showed
clustering asymptotically near an upper limit (e.g., percentages that concentrate near 100 percent),
DRG-LER II TASKING N031 COUNTERING VIOLENT EXTREMISM IN BANGLADESH
USAID.GOV FINAL REPORT | 35
we subtracted the indicator values from this limit and computed the logarithm or square-root of the
differences. We term this transform a “reverse-log” or a “reverse-sqrt.” Given limit value XL and
indicator data Xj, we compute scaled values X’j as:
Reverse-Log: X’j = - log10(XL – Xj + e)
Reverse-Sqrt:X’j = - sqrt (XL – Xj + e)
Where e is a small adjustable parameter to avoid singularities at Xj – XL = 0, and the minus sign
preserves the ordering of indicator values from smallest to largest. In each case, the rescaling
preserved the size-ordering of data values, so that relative comparisons were maintained, and the
data distribution met the requirement for the statistical analysis.
If data sets had outliers, we winsorized the data to reduce the influence of outsized data values in
statistical correlations and regressions. We typically set the outlier values to three standard
deviations from the mean, so that they exert strong, but not extreme, influence on statistical
computations in the analysis. In some cases, where some data remained skewed in linear, log10 and
square-root scaling, with a substantial group (>3 percent) of indicators beyond 3-sigma, the Z-
threshold for winsorizing was set to four to preserve the extreme values. Exceptions were applied
to indicators whose values clustered in the neighborhood of an upper bound (e.g., literacy rates,
which tend to cluster near 100 percent, but have tails of values downward toward zero percent). In
such cases, a reverse-log and a reverse square-root transformation were applied.
Development of the Vulnerability Index: Once the data were cleaned, the indicators were run through a
Pearson Correlation Matrix by category for quality assurance and to identify redundant indicators
that were highly correlated and did not exhibit sufficient statistical independence to contribute
information to the full data set. Singular-value decomposition and varimax rotations were
subsequently used as unsupervised self-learning algorithms to identify key attributes and their
relative weightings. Thus, the algorithm pares down a large dataset into a smaller one comprised of
the most defining and statistically important components. Running the analysis within specific
subregions of the nation enables the identification of combinations of characteristics predictive of VE
while eliminating the combinations of characteristics that are neither conducive nor preventative.
Attributes and attribute-combinations that are prominent in both areas of known high- and low-level
VE are thus deemed as inconclusive to VE vulnerability. The attributes are then tested via resampling
methods, in which the algorithm is run on different subsections of regions, to confirm consistency
and sensitivity. As we want to explain as much of the variance in the data as possible, but also avoid
having an overly complicated measure, various threshold values for indicator weightings are used to
identify the optimal subset of indicators. The weighted values of the selected indicators are then
used as input to the composite measure to generate vulnerability measures for each zila.
Development of the Projected Prevalence: The goal of this step is to rescale the prevalence rates to
reflect their distributions more accurately. The vulnerability score is obtained from the indicator
matrix, within which many of the indicators have been scaled logarithmically to decrease small
values. When we transform from the indicator matrix into prevalence estimates, we reapply the
scaling. In particular, prevalence estimates are typically lognormal in the indicator matrix because
they range by many orders of magnitude. Therefore, exponentiating the vulnerability index enables a
proper scaling for our inferring zila by zila prevalence estimates.

DRG-LER II TASKING N031 COUNTERING VIOLENT EXTREMISM IN BANGLADESH
USAID.GOV FINAL REPORT | 36
LIMITATIONS ON THE ANALYSIS
Whenever possible, we have attempted to describe the uncertainties associated with Weak-Signal
Analysis in the presentation of our analytical results in the main report. When presenting the
vulnerability index, we have also presented an evaluation of the “null hypotheses” that geographical
fluctuations of indicator values, and their projections onto our vulnerability index, have occurred by
random. We use 95 percent confidence for non-randomness as our threshold for statistical
significance, though often the data relationships greatly exceed this threshold.
Although our statistical arguments can be presented in probabilistic terms with associated
confidence levels, there are many additional uncertainties due to the nature of our analysis and what
we are trying to evaluate. The major limitations are associated with the nature of VE itself.
Although our analysis can compute estimates of vulnerability down to a 1km2 area, such precision is
an untrustworthy artifact of the mathematics. Vulnerabilities are probabilistic in nature, expressing
likelihoods of VE activity within a location. If the ecosystem is conducive to VE, but no activity has
been reported, the activity may be unreported or else the VE may not have yet occurred.
An analogy with earthquake hazards is useful. Maps of predicted earthquake motion are used to
develop building codes, establish insurance rates, allocate resources, and guide development. Even in
an area of high probability, no earthquake may occur for several years. Alternatively, a single
earthquake can cause damage that exceeds the probabilistic values for multiple years. Despite the
lack of precision, earthquake hazard maps have been extremely effective in dramatically reducing the
impact of earthquakes by informing policymakers, insurers, architects, planners, and responders on
where to prioritize strategies to reduce vulnerability. The VE vulnerability index should be used in
the same manner, focusing policymaker attention on building resilience in the most vulnerable
locations, while maintaining baseline programs in areas with lower vulnerability.
Below are limitations associated with the analytical results. They are listed in a hierarchy based on
our assessment of their impact.
1) Ambiguity in what we are trying to measure
Analysis of VE is clouded by differing designations and definitions. There is overlap between VE and
other forms of crime and political violence, such as insurgency, hate crime, and organized crime
(START, 2017). Affiliations are often fluid and strengthen or weaken over time. Links between the
groups span a continuum.
In general, VE refers to advocating, engaging in, preparing, or otherwise supporting ideologically
motivated violence to further social, economic, political, or religious objectives (USAID, April 2020).
Insurgency, on the other hand, is the organized use of subversion and violence to seize, nullify, or
challenge political control of an area. VE and insurgency can overlap (USAID, 2011). Even when cases
are considered VE, there are “degrees.” In some cases, perpetrators have pledged their allegiance to
ISIS formally, so that the attacks can be considered ISIS-core. In other cases, the perpetrators are
ISIS-affiliated, have some level of coordination or approval by ISIS, or are ISIS-inspired and occur
with no direct communication (Carson and Suppenbach, 2017).
2) Use of data analysis in social science
Social science and international development research have been evolving from site visits and case
studies to more data-based analysis. Identifying relationships in complex, dynamic systems requires
statistical models. The results of the statistical models are expressed in probabilistic terms, for which

DRG-LER II TASKING N031 COUNTERING VIOLENT EXTREMISM IN BANGLADESH
USAID.GOV FINAL REPORT | 37
there is debate over required levels of certainty. In our analysis, we quantify probability as the
likelihood that a particular result might have occurred by random chance. We reject the “null
hypotheses,” the probability that the result occurred by chance, when the confidence level exceeds
95 percent. In other words, the probability of the result occurring by chance is less than one in
twenty.
Quantifying probability in this manner requires assumptions about the statistical distributions of data
sets. To the greatest extent possible, our analysis pre-processes raw data into data indicators whose
statistical distributions are approximately Gaussian. We reference our uncertainties to Gaussian
statistical models, using tools such as chi-squared and F variance-ratio distributions, singular-value
decompositions, and bootstrap resampling techniques, depending on the application.
A common criticism of data analysis is that “correlation does not imply causation.” For example,
deworming children may correlate with increased school attendance. Does this prove that
deworming children was the cause of increased school attendance? It is extremely difficult to prove
causal relationships in complex systems.
While a statistical relationship may not be proof of a causal relationship, it is evidence for a causal
relationship. Without a statistical correlation, there cannot be causation. In fact, one powerful
feature of correlation estimates is that they can be used to disprove causal assumptions that seem
reasonable but are not supported by the data. Lack of correlation argues that a causal relationship
between social indicators is unlikely. More importantly, however, statistical relationships that are
opposite to that expected, e.g., a positive correlation when looking for a negative one, can lead to a
re-assessment of prior assumptions.
We do not assume in our analysis that correlation implies causation – also known as the fallacy “cum
hoc ergo propter hoc” (“with this, therefore because of this”). As an example, we do not assume
that a correlation between conflict frequency and male/female literacy rates implies that conflict is
caused by a disparity in literacy rates between genders. We assume the indicators we can measure
are proxies for sociocultural phenomena that we are unable to measure directly or perhaps even
understand. In the example above, lower female literacy rate relative to male literacy rates may
indicate gender inequality, religious tenets, shortages of resources (requiring the girls to spend their
time collecting water, firewood, etc.), or economic change requiring girls to access markets for
alternative income producing activities. Even when we categorize these events as measures of a
population’s vulnerability, we both recognize and account for the fact that the indicators we are
using may not be unique or even directly related to the categories in which they have been assigned.
As an example, consider two population characteristics “A” and “B” that correlate with significant
statistical confidence. There are at least five options:
Option 1: The correlation is the result of random coincidence and does not reveal any
causal relationships between A and B.
Option 2: A is “causing” B, with the independent variable A causing the change in the
dependent variable B.
Option 3: B is “causing” A, with the independent variable B causing the change in the
dependent variable A.
Option 4: A and B are both dependent variables, following an independent population
characteristic C that has not been measured.

DRG-LER II TASKING N031 COUNTERING VIOLENT EXTREMISM IN BANGLADESH
USAID.GOV FINAL REPORT | 38
Option 5: A and B are part of a larger correlated system with no unique causal factor, that
is, no independent variable.
Option 5 is characteristic of “coupled systems,” in which “causality” resides in the linkages between
variables. In a fully coupled “holistic” system, no variable is truly independent. Such systems are
common in natural ecosystems, and we assume they are also common in socioeconomic
ecosystems. For example, in atmosphere-ocean interactions that lead to the El Niño and La Niña
climate events, there are no dependent versus independent variables. Atmospheric pressure highs
and lows induce winds that push surface seawater, and warm and cool patches of the sea surface
induce variations in atmospheric pressure. Neither the atmosphere nor the ocean operates
independently of the other. Neither can be taken as the independent variable in a causal relationship.
Yet the relationship is unambiguous and allows us to predict both the atmospheric and oceanic
effects with high degrees of certainty.
An ecosystem approach to complex, dynamic, and multi-variable problems such as human trafficking,
child marriage, and VE treats them as coupled systems that lack true independent variables, but
nevertheless offer situations where we can predict outcomes and intervene to effect change. The
big-data ecosystem approach finds inter-relationships among many variables, not only two. With
many variables and many distinct populations, there may be multiple independent correlation
patterns. The different patterns indicate the problem has multiple causes, and the causes vary for
different places. In an ecosystem approach, the correlations among population attributes are treated
as a coupled system that can be influenced at several points, rather than as a cause-effect process
that can be modified only through its dependent variable. The advantage of an ecosystems approach
is that it allows us to achieve our objectives by identifying the characteristics to be modified,
therefore allowing us to identify options for the interventions that will provide the greatest return
on investment.
3) Extrapolations
In any given dataset, the number of data values are generally small, and extrapolations from small
numbers have significant uncertainty.
4) Reporting accuracy
Reports are not necessarily accurate and VE events are not always independently verified.
5) Human-based data collection
Survey data are compiled by human analysts who may not faithfully follow the design of the database
or record responses accurately.
6) Definitions
International definitions are not consistent with national definitions and the local customs and laws
of a particular country. Opposition parties may be labeled as terrorists for political benefit.

U.S. AGENCY FOR INTERNATIONAL DEVELOPMENT
1300 Pennsylvania Avenue, NW
Washington, D.C. 20523