Embed Size (px)
Citation preview
COTTONSCOPE – A NEW INSTRUMENT FOR MATURITY AND FINENESS MEASUREMENTS: b) EXPERIMENTAL RESULTS AND EXPERIENCES
J. E. Rodgers1and D. P. Thibodeaux2
1Southern Regional Research Centre, Agricultural Research Service, USDA, New Orleans, LA, USA;
2Cotton Quality Research Station, Agricultural Research Service, USDA, Clemson, SC, USA
ABSTRACT Cotton fibre maturity and fineness are important properties for cotton quality and processing. Most methods for measuring fibre maturity and fineness involve the use of slow and laborious measurements, chemicals, and/or the use of expensive equipment and instruments. International interest has been expressed in new rapid, accurate, precise, and cost effective measurements of fibre maturity and fineness. A new small size instrument — the Cottonscope — has been introduced that simultaneously measures cotton fibre maturity and fineness. The Cottonscope yields average fibre maturity, fineness, and ribbon width, as well as distributions for maturity and width. A program was implanted to determine the capabilities of the Cottonscope instrument for maturity and fineness measurements. Examples of our experimental results and experiences with the Cottonscope are presented. Comparisons were made between the maturity and fineness results from the Cottonscope, cross-sectional image analysis (reference method), SRRC Fibre Maturity Tester (FMT), and Uster® Advanced Fibre Information System (AFIS) measurements. It was demonstrated that the Cottonscope yields a simultaneous, rapid, precise, and accurate measurement of fibre maturity and fineness. The Cottonscope measurement was relatively fast (less than a total of 10 minutes for 6 measurements per sample) and easy to perform. The primary impact on the Cottonscope measurement results was the change in environmental conditions (room temperature and relative humidity), and that impact was major only for fibre fineness. Measurements on experimental breeder samples indicated that the Cottonscope yielded a more representative and responsive measurement of fibre maturity and fineness compared to the corresponding AFIS results. INTRODUCTION The cotton fibre properties of maturity and fineness are important to fibre quality and downstream processing. Immature fibres can impact the ease of ginning, textile processing and final fabric quality due to increased mechanical entanglements, poor lustre, low fibre strength, and less dye absorbance/uptake; fineness differences can impact the fabric lustre, dye appearance, fabric stiffness, fibre and yarn strength, and spinning performance (Lord and Heap, 1988; Pierce and Lord, 1939; Wakelyn et.al., 2007). Fibre maturity is the degree of thickening, Θ, of the cotton fibre’s secondary cell wall, and it can be represented as
Θ = 4πA/P2, (1) where A is the area of the fibre cell wall and P is the fibre perimeter. Fibre maturity is often reported as the maturity ratio (MR), which can be represented as
MR = Θ/0.577 (2) There are several terms for fibre fineness, H (e.g., linear density, cross-sectional area, and fibre diameter). For cross-sectional area, the fineness is represented as H = ρA, (3) where ρ is the average cell wall density (1.52 g/cm3). Often, linear density (mass per unit length, often in mtex) is used for many cotton quality assessment methods and for downstream processing. There are many present methods for measuring fibre maturity and fineness (ASTM-D1442-06, 2009; ASTM-D1464-07, 2009; ASTM-D1577-07, 2009; Montalvo and VonHoven, 2004; Rodgers and Ghosh, 2008; Wakelyn et.al., 2007) The most common direct measurements of fibre maturity include cross-sectional image analysis, polarized light microscopy of longitudinal fibres, and caustic swelling. Other maturity tests include the causticaire maturity index, differential dye maturity, Uster® Advanced Fibre Information System (AFIS), Fibre Maturity Tester (FMT), and Near Infrared (NIR) spectroscopy. The most common direct measurements of fibre fineness include cross-sectional image analysis and gravimetric linear density. Other fineness tests include the AFIS, FMT, Vibroscope, and NIR spectroscopy. Often, the tests for fibre maturity and fineness entail the use of slow and laborious analyses (moderate sample and/or instrument preparation), chemicals, and/or expensive testing equipment. An indirect measurement that is often used to infer both the fibre’s maturity and fineness is micronaire, which is a measure of the cotton fibre’s resistance to air flow per unit mass. Micronaire is often measured on high volume instruments, such as the Uster® High Volume Instrument (HVI) (USDA, 2001). Much interest has been expressed internationally in new instrumentation that could measure fibre maturity and fineness rapidly, accurately, and precisely with a minimum of operator training. The Cottonscope (Cottonscope Pty Ltd, Perth, Australia) measures fibre maturity and fineness on longitudinal fibres by image analysis and polarized light microscopy (Naylor et.al., 2011). The instrument design and measurement specifics were presented in the previous paper (A section) from CSIRO (Gordon and Naylor, 2012). Recent research has assessed the capabilities, and some limitations, of the Cottonscope to measure cotton fibre maturity and fineness rapidly, precisely, and accurately (Naylor et.al., 2011, Rodgers et.al., 2011). In this work, we will present a few of the latest experimental results and experiences with the Cottonscope, to include Cottonscope method precision, measurement impacts, and comparisons to other maturity and fineness measurements/instruments (both routine ginned cotton fibre and producer/breeder fibre). The reference method for these evaluations is the cross-sectional image analysis method.
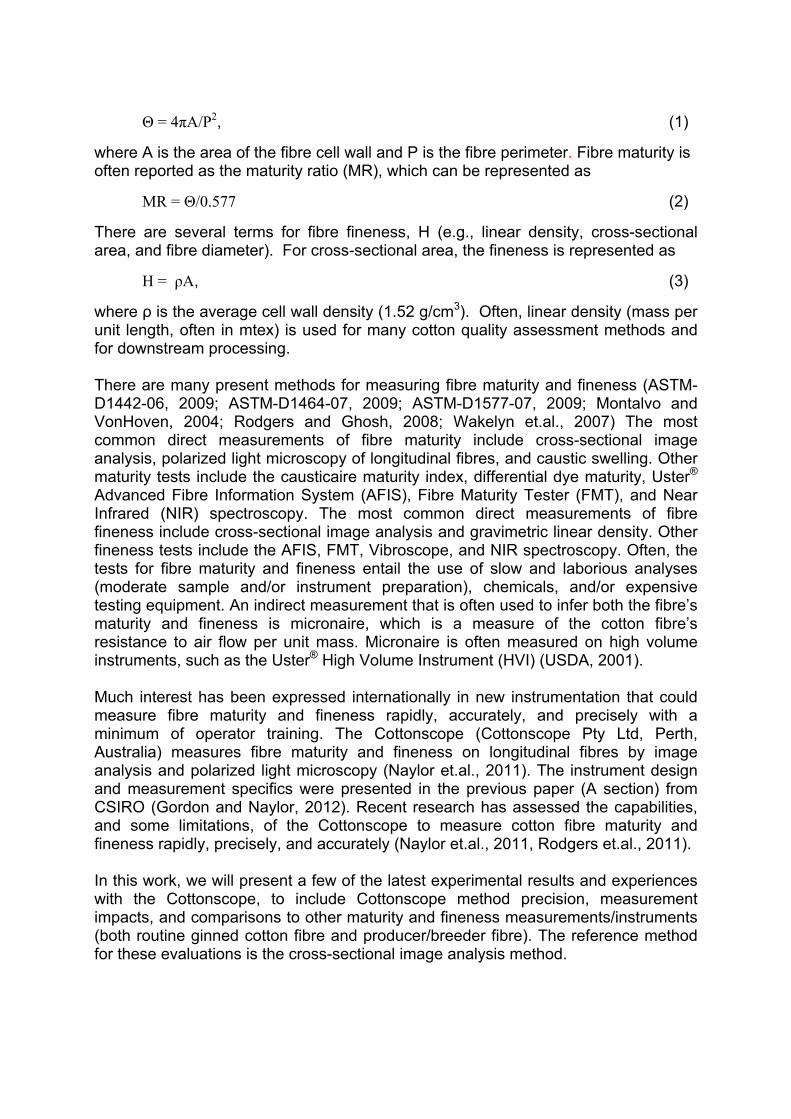
COTTONSCOPE MEASUREMENT The Cottonscope is a small and light-weight instrument that is composed of 3 primary components — the Cottonscope water-based image analysis system, a 0.7mm knife-blade cutter, and a computer. (Figure 1) The cotton lint is cut into fibre snippets (50±3 mg), placed into the water bowl, and the measurement started. The stirred fibre snippets pass under a submerged, water-tight lens tube, and the colour images of the snippets collected (polarized light microscopy and image analysis). A normal operation measures approximately 20,000 fibre snippets in 30-40 seconds. The Cottonscope results are average values for maturity, fineness, and ribbon width as well as maturity and ribbon width distributions.
Figure 1. Cottonscope (computer, water base unit, knife blade cutter). PRECISION ANALYSES Preliminary evaluations were performed on a set of 37 well-defined samples to determine the analytical variability (Swp) and sampling variability (Sbp) for the Cottonscope measurement. (Rodgers et.al., 2011) For each sample, 5 loadings or cuts were made, and each loading was measured 3 times (3 replicates) on the Cottonscope (total of 15 measurements per sample). The results are shown in Table I. The analytical and sample variabilities for maturity were very small (both less than 0.01 maturity unit), but the sample variability was slightly higher. Though small, the sample variability was higher than the analytical variability for fineness. For both maturity and fineness, the major source of measurement variability in this evaluation was sample variability. Since cotton is a natural fibre with many sample inhomogenities, this result was not unforeseen.
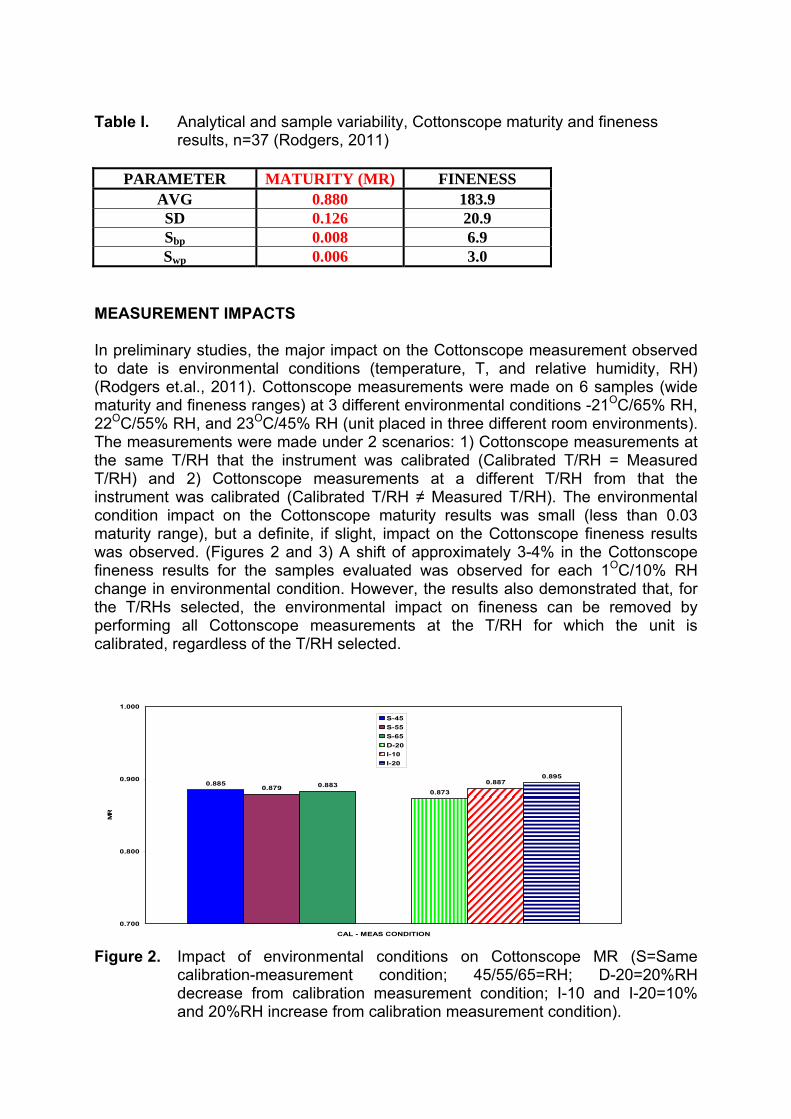
Table I. Analytical and sample variability, Cottonscope maturity and fineness results, n=37 (Rodgers, 2011)
PARAMETER MATURITY (MR) FINENESS
AVG 0.880 183.9 SD 0.126 20.9 Sbp 0.008 6.9 Swp 0.006 3.0
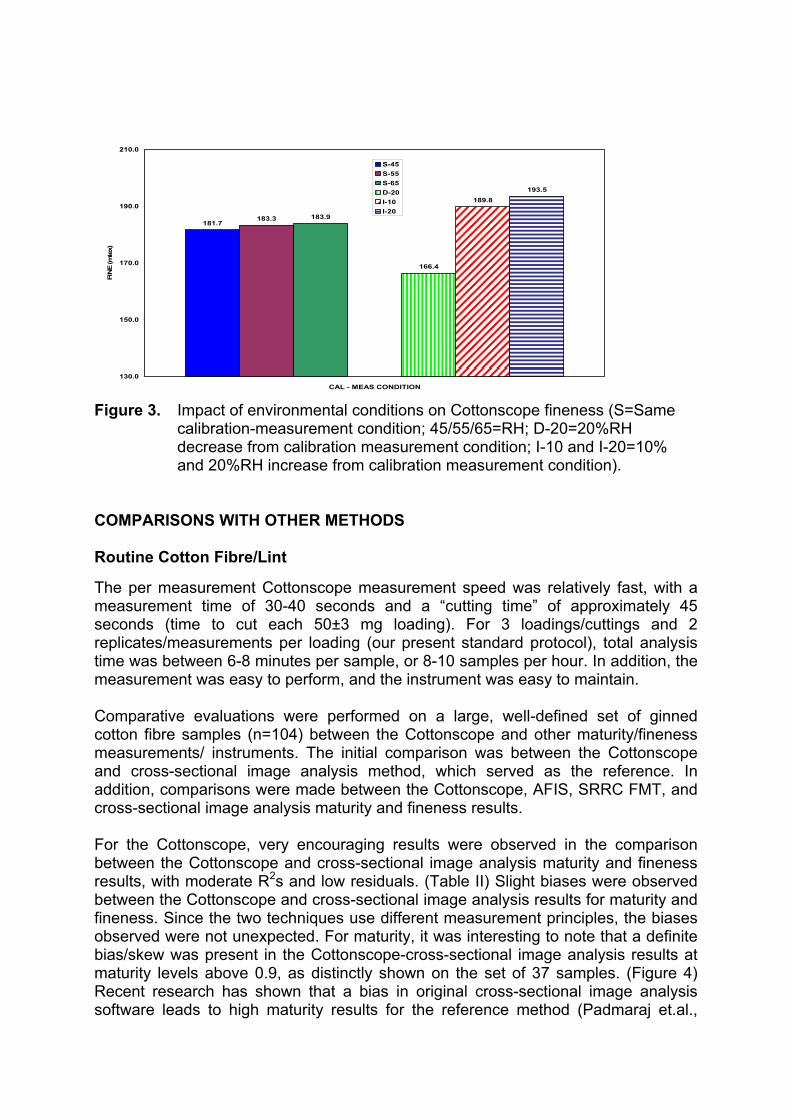
MEASUREMENT IMPACTS In preliminary studies, the major impact on the Cottonscope measurement observed to date is environmental conditions (temperature, T, and relative humidity, RH) (Rodgers et.al., 2011). Cottonscope measurements were made on 6 samples (wide maturity and fineness ranges) at 3 different environmental conditions -21OC/65% RH, 22OC/55% RH, and 23OC/45% RH (unit placed in three different room environments). The measurements were made under 2 scenarios: 1) Cottonscope measurements at the same T/RH that the instrument was calibrated (Calibrated T/RH = Measured T/RH) and 2) Cottonscope measurements at a different T/RH from that the instrument was calibrated (Calibrated T/RH ≠ Measured T/RH). The environmental condition impact on the Cottonscope maturity results was small (less than 0.03 maturity range), but a definite, if slight, impact on the Cottonscope fineness results was observed. (Figures 2 and 3) A shift of approximately 3-4% in the Cottonscope fineness results for the samples evaluated was observed for each 1OC/10% RH change in environmental condition. However, the results also demonstrated that, for the T/RHs selected, the environmental impact on fineness can be removed by performing all Cottonscope measurements at the T/RH for which the unit is calibrated, regardless of the T/RH selected.
0.8850.879 0.883
0.8730.887
0.895
0.700
0.800
0.900
1.000
CAL - MEAS CONDITION
MR
S-45S-55S-65D-20I-10I-20
Figure 2. Impact of environmental conditions on Cottonscope MR (S=Same
calibration-measurement condition; 45/55/65=RH; D-20=20%RH decrease from calibration measurement condition; I-10 and I-20=10% and 20%RH increase from calibration measurement condition).
181.7183.3 183.9
166.4
189.8193.5
130.0
150.0
170.0
190.0
210.0
CAL - MEAS CONDITION
FIN
E (m
tex)
S-45S-55S-65D-20I-10I-20
Figure 3. Impact of environmental conditions on Cottonscope fineness (S=Same
calibration-measurement condition; 45/55/65=RH; D-20=20%RH decrease from calibration measurement condition; I-10 and I-20=10% and 20%RH increase from calibration measurement condition).
COMPARISONS WITH OTHER METHODS Routine Cotton Fibre/Lint The per measurement Cottonscope measurement speed was relatively fast, with a measurement time of 30-40 seconds and a “cutting time” of approximately 45 seconds (time to cut each 50±3 mg loading). For 3 loadings/cuttings and 2 replicates/measurements per loading (our present standard protocol), total analysis time was between 6-8 minutes per sample, or 8-10 samples per hour. In addition, the measurement was easy to perform, and the instrument was easy to maintain. Comparative evaluations were performed on a large, well-defined set of ginned cotton fibre samples (n=104) between the Cottonscope and other maturity/fineness measurements/ instruments. The initial comparison was between the Cottonscope and cross-sectional image analysis method, which served as the reference. In addition, comparisons were made between the Cottonscope, AFIS, SRRC FMT, and cross-sectional image analysis maturity and fineness results. For the Cottonscope, very encouraging results were observed in the comparison between the Cottonscope and cross-sectional image analysis maturity and fineness results, with moderate R2s and low residuals. (Table II) Slight biases were observed between the Cottonscope and cross-sectional image analysis results for maturity and fineness. Since the two techniques use different measurement principles, the biases observed were not unexpected. For maturity, it was interesting to note that a definite bias/skew was present in the Cottonscope-cross-sectional image analysis results at maturity levels above 0.9, as distinctly shown on the set of 37 samples. (Figure 4) Recent research has shown that a bias in original cross-sectional image analysis software leads to high maturity results for the reference method (Padmaraj et.al.,
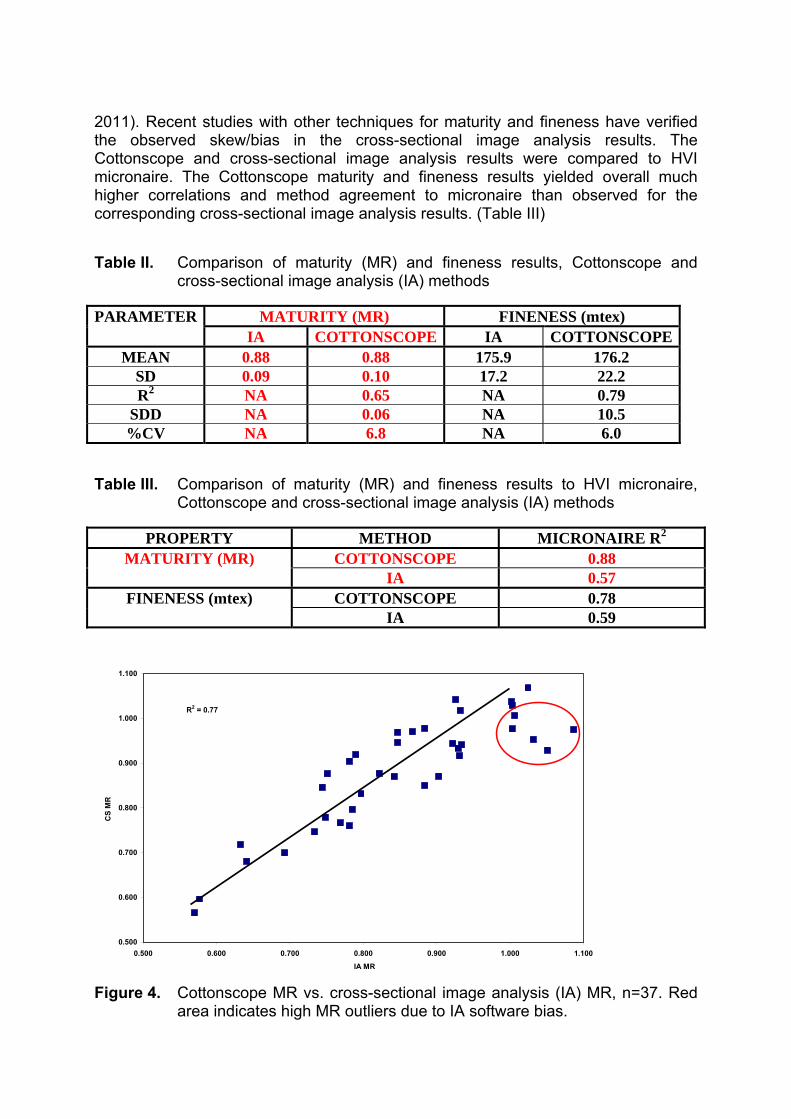
2011). Recent studies with other techniques for maturity and fineness have verified the observed skew/bias in the cross-sectional image analysis results. The Cottonscope and cross-sectional image analysis results were compared to HVI micronaire. The Cottonscope maturity and fineness results yielded overall much higher correlations and method agreement to micronaire than observed for the corresponding cross-sectional image analysis results. (Table III) Table II. Comparison of maturity (MR) and fineness results, Cottonscope and
cross-sectional image analysis (IA) methods PARAMETER MATURITY (MR) FINENESS (mtex)
IA COTTONSCOPE IA COTTONSCOPEMEAN 0.88 0.88 175.9 176.2
SD 0.09 0.10 17.2 22.2 R2 NA 0.65 NA 0.79
SDD NA 0.06 NA 10.5 %CV NA 6.8 NA 6.0
Table III. Comparison of maturity (MR) and fineness results to HVI micronaire,
Cottonscope and cross-sectional image analysis (IA) methods
PROPERTY METHOD MICRONAIRE R2 COTTONSCOPE 0.88 MATURITY (MR)
IA 0.57 COTTONSCOPE 0.78 FINENESS (mtex)
IA 0.59
0.500
0.600
0.700
0.800
0.900
1.000
1.100
0.500 0.600 0.700 0.800 0.900 1.000 1.100
IA MR
CS
MR
R2 = 0.77
Figure 4. Cottonscope MR vs. cross-sectional image analysis (IA) MR, n=37. Red
area indicates high MR outliers due to IA software bias.
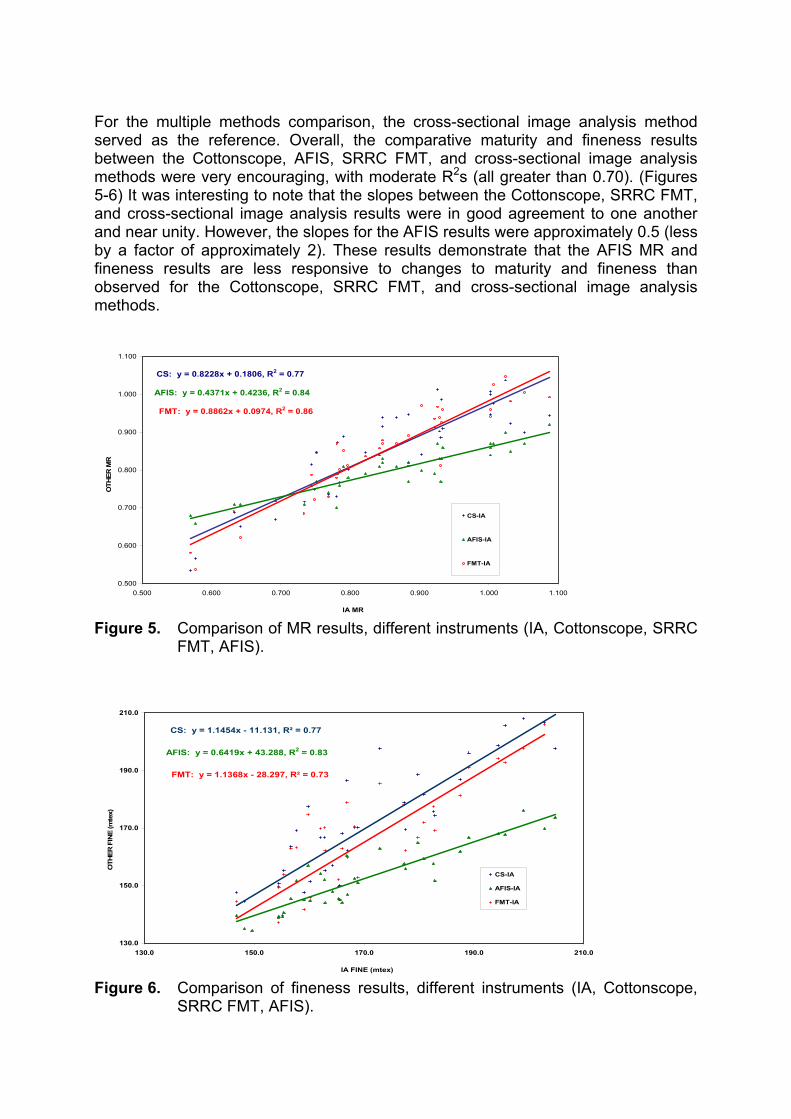
For the multiple methods comparison, the cross-sectional image analysis method served as the reference. Overall, the comparative maturity and fineness results between the Cottonscope, AFIS, SRRC FMT, and cross-sectional image analysis methods were very encouraging, with moderate R2s (all greater than 0.70). (Figures 5-6) It was interesting to note that the slopes between the Cottonscope, SRRC FMT, and cross-sectional image analysis results were in good agreement to one another and near unity. However, the slopes for the AFIS results were approximately 0.5 (less by a factor of approximately 2). These results demonstrate that the AFIS MR and fineness results are less responsive to changes to maturity and fineness than observed for the Cottonscope, SRRC FMT, and cross-sectional image analysis methods.
CS: y = 0.8228x + 0.1806, R2 = 0.77
AFIS: y = 0.4371x + 0.4236, R2 = 0.84
FMT: y = 0.8862x + 0.0974, R2 = 0.86
0.500
0.600
0.700
0.800
0.900
1.000
1.100
0.500 0.600 0.700 0.800 0.900 1.000 1.100
IA MR
OTH
ER M
R
CS-IA
AFIS-IA
FMT-IA
Figure 5. Comparison of MR results, different instruments (IA, Cottonscope, SRRC
FMT, AFIS).
CS: y = 1.1454x - 11.131, R² = 0.77
AFIS: y = 0.6419x + 43.288, R2 = 0.83
FMT: y = 1.1368x - 28.297, R² = 0.73
130.0
150.0
170.0
190.0
210.0
130.0 150.0 170.0 190.0 210.0
IA FINE (mtex)
OTH
ER F
INE
(mte
x)
CS-IA
AFIS-IA
FMT-IA
Figure 6. Comparison of fineness results, different instruments (IA, Cottonscope,
SRRC FMT, AFIS).
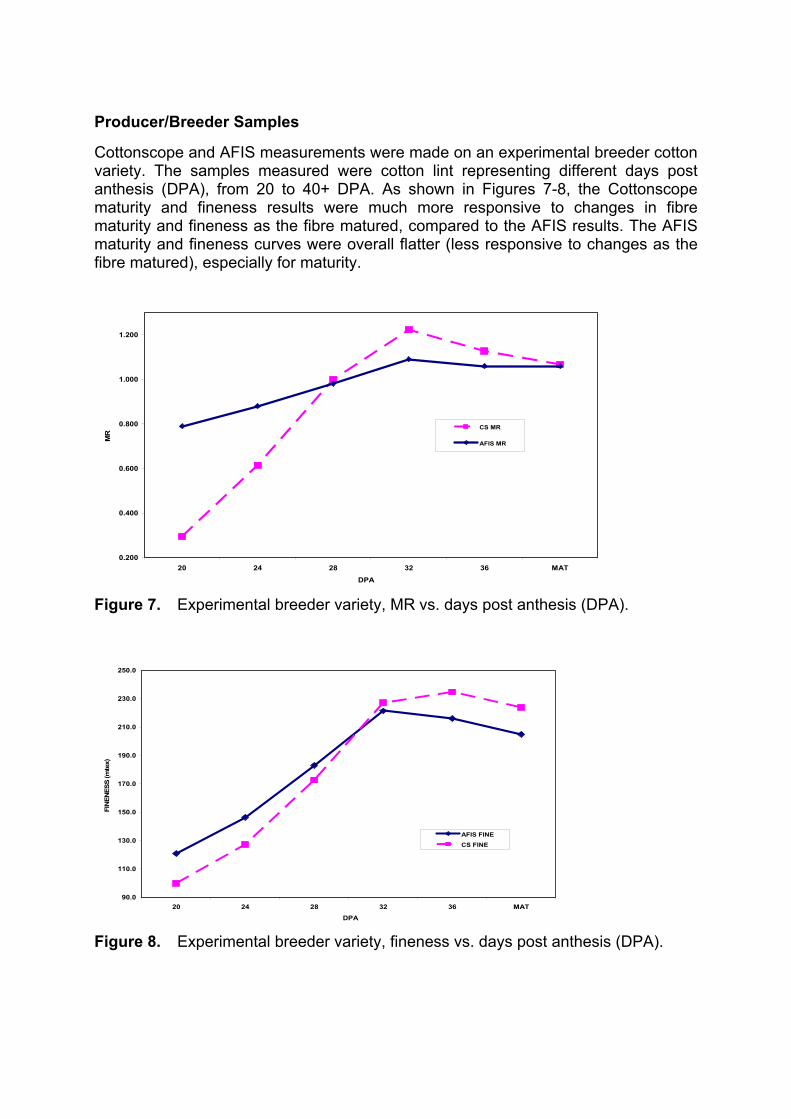
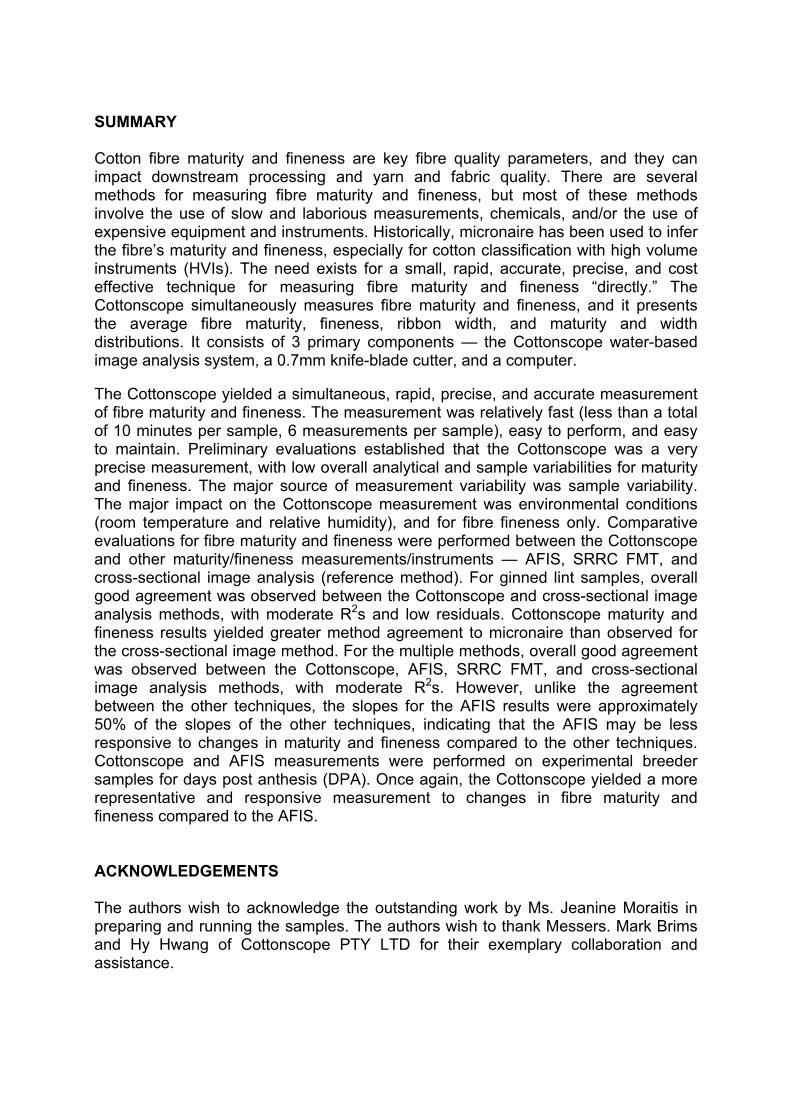
Producer/Breeder Samples Cottonscope and AFIS measurements were made on an experimental breeder cotton variety. The samples measured were cotton lint representing different days post anthesis (DPA), from 20 to 40+ DPA. As shown in Figures 7-8, the Cottonscope maturity and fineness results were much more responsive to changes in fibre maturity and fineness as the fibre matured, compared to the AFIS results. The AFIS maturity and fineness curves were overall flatter (less responsive to changes as the fibre matured), especially for maturity.
0.200
0.400
0.600
0.800
1.000
1.200
20 24 28 32 36 MAT
DPA
MR
CS MR
AFIS MR
Figure 7. Experimental breeder variety, MR vs. days post anthesis (DPA).
90.0
110.0
130.0
150.0
170.0
190.0
210.0
230.0
250.0
20 24 28 32 36 MAT
DPA
FIN
ENES
S (m
tex)
AFIS FINE
CS FINE
Figure 8. Experimental breeder variety, fineness vs. days post anthesis (DPA).
SUMMARY Cotton fibre maturity and fineness are key fibre quality parameters, and they can impact downstream processing and yarn and fabric quality. There are several methods for measuring fibre maturity and fineness, but most of these methods involve the use of slow and laborious measurements, chemicals, and/or the use of expensive equipment and instruments. Historically, micronaire has been used to infer the fibre’s maturity and fineness, especially for cotton classification with high volume instruments (HVIs). The need exists for a small, rapid, accurate, precise, and cost effective technique for measuring fibre maturity and fineness “directly.” The Cottonscope simultaneously measures fibre maturity and fineness, and it presents the average fibre maturity, fineness, ribbon width, and maturity and width distributions. It consists of 3 primary components — the Cottonscope water-based image analysis system, a 0.7mm knife-blade cutter, and a computer. The Cottonscope yielded a simultaneous, rapid, precise, and accurate measurement of fibre maturity and fineness. The measurement was relatively fast (less than a total of 10 minutes per sample, 6 measurements per sample), easy to perform, and easy to maintain. Preliminary evaluations established that the Cottonscope was a very precise measurement, with low overall analytical and sample variabilities for maturity and fineness. The major source of measurement variability was sample variability. The major impact on the Cottonscope measurement was environmental conditions (room temperature and relative humidity), and for fibre fineness only. Comparative evaluations for fibre maturity and fineness were performed between the Cottonscope and other maturity/fineness measurements/instruments — AFIS, SRRC FMT, and cross-sectional image analysis (reference method). For ginned lint samples, overall good agreement was observed between the Cottonscope and cross-sectional image analysis methods, with moderate R2s and low residuals. Cottonscope maturity and fineness results yielded greater method agreement to micronaire than observed for the cross-sectional image method. For the multiple methods, overall good agreement was observed between the Cottonscope, AFIS, SRRC FMT, and cross-sectional image analysis methods, with moderate R2s. However, unlike the agreement between the other techniques, the slopes for the AFIS results were approximately 50% of the slopes of the other techniques, indicating that the AFIS may be less responsive to changes in maturity and fineness compared to the other techniques. Cottonscope and AFIS measurements were performed on experimental breeder samples for days post anthesis (DPA). Once again, the Cottonscope yielded a more representative and responsive measurement to changes in fibre maturity and fineness compared to the AFIS. ACKNOWLEDGEMENTS The authors wish to acknowledge the outstanding work by Ms. Jeanine Moraitis in preparing and running the samples. The authors wish to thank Messers. Mark Brims and Hy Hwang of Cottonscope PTY LTD for their exemplary collaboration and assistance.
DISCLAIMER The use of a company or product name is solely for the purpose of providing specific information and does not imply approval or recommendation by the United States Department of Agriculture to the exclusion of others. REFERENCES ASTM- D1442-06. 2009. Standard test method for maturity of cotton fibres (sodium hydroxide swelling and polarized light microscopy procedures). ASTM- D1464-07. 2009. Standard test method for differential dyeing behaviour of cotton. ASTM- D1577-07. 2009. Standard test method for linear density of textile fibres. Gordon, S.G., and G.R.S. Naylor. 2012. Cottonscope: A new instrument for maturity and fineness measurements. (A) Instrument design. Proc. 31st International Cotton Conference, Bremen, Germany, in press. Lord, E., and S.A. Heap. 1988. The origin and assessment of cotton fibre maturity. International Institute for Cotton, Manchester, UK, 38 pp. Montalvo, J.G., and T.M. Von Hoven. 2004. Chapter 25: Analysis of cotton. Near-Infrared Spectroscopy in Agriculture. Roberts, C., Workman, J., and Reeves, J. (eds). American Society of Agronomy, Madison, WI, Agronomy Monograph No. 44, 671-728. G.R.S. Naylor, S.G. Gordon, H.D. Hwang, and M.A. Brims. 2011. Cottonscope-rapid, independent and simultaneous measurement of both cotton fibre linear density (fineness) and maturity. Proc. 2011 Beltwide Cotton Conference, Atlanta, GA, 1278-1281. Padmaraj, L., M. Krifa, and B. Xu. 2011. Evaluating immature fibre bias in fibre cross-section analysis. Proc. 2011 Beltwide Cotton Conference, Atlanta, GA, 1476. Pierce, F.T., and E. Lord. 1939. The fineness and maturity of cotton. J. Textile Inst. 30(12): T173-T210. Rodgers, J.E., and S. Ghosh. 2008. Chapter 25: NIR analysis of textiles. Handbook of Near-Infrared Analysis, 3rd Ed. Burns, D., and Ciurczak, E. (eds.), CRC Press, Boca Raton, FL, 485-520. Rodgers, J.E., C.D. Delhom, C.A. Fortier, and D.P. Thibodeaux. 2011. Rapid measurement of cotton fibre maturity and fineness by image analysis-microscopy using the Cottonscope®. Text. Res. J., on-line 20 December 2011, 1-13. doi: 10.1177/0040517511431317

USDA AMS Cotton Program Brochure. April 2001. The classification of cotton. Wakelyn, P.J., N.R. Bertoniere, J.V. Edwards, A.D. French, G.R. Gamble, B.A. Triplett, M.A. Rousselle, D.D. McAlister, D.P. Thibodeaux, W.R. Goynes. 2007. Chapter 7: Physical properties of cotton. Cotton Fibre Chemistry and Technology. CRC Press, Boca Raton, FL, 107-109.