Embed Size (px)
Citation preview

B I O L O G I C A L C O N S E R VAT I O N 1 2 7 ( 2 0 0 6 ) 4 4 3 –4 6 2
. sc iencedi rec t . com
ava i lab le a t wwwjournal homepage: www.elsevier .com/ locate /b iocon
Cost-effectiveness of silvicultural measures to increasesubstrate availability for red-listed wood-living organismsin Norway spruce forests
Mattias Jonsson a,*, Thomas Ranius a, Hans Ekvall b, Goran Bostedt b, Anders Dahlberg c,Bengt Ehnstrom d, Bjorn Norden e, Jogeir N. Stokland f
aDepartment of Entomology, P.O. Box 7044, Swedish University of Agricultural Sciences, SE-750 07 Uppsala, SwedenbDepartment of Forest Economics, Swedish University of Agricultural Sciences, SE-901 83 Umea, SwedencSwedish Species Information Centre, P.O. Box 7007, Swedish University of Agricultural Sciences, SE-750 07 Uppsala, SwedendStationsomradet 224, SE-780 53 Nas, SwedeneBotanical Institute, Systematic Botany, Goteborg University, P.O. Box 461, SE-405 30 Goteborg, SwedenfNorwegian Institute of Land Inventory, P.O. Box 115, 1431 As, Norway
A R T I C L E I N F O
Article history:
Received 3 May 2005
Received in revised form
2 September 2005
Accepted 6 September 2005
Available online 19 October 2005
Keywords:
CWD
Forestry
FSC
Picea abies
Saproxylic
0006-3207/$ - see front matter � 2005 Elsevidoi:10.1016/j.biocon.2005.09.004
* Corresponding author: Present address. NaCanterbury, New zealand. Tel.: +64 3 325 369
E-mail address: [email protected] (
A B S T R A C T
It is important that measures to maintain biodiversity are taken in a way that is cost-
effective for the landowner. We analyzed the cost-effectiveness of silvicultural mea-
sures that aim at increasing the substrate availability for red-listed (species that are
threatened, near threatened or where species probably are threatened but data is defi-
cient) saproxylic (wood-inhabiting) organisms. We modelled stands of Norway spruce
(Picea abies) in three regions of Sweden by using computer simulations and a database
with substrate requirements of saproxylic beetles and cryptogams on the Swedish Red-
List. Conclusions concerning cost-effectiveness of silvicultural measures depend on the
extinction thresholds of the species they are intended to conserve; measures that gen-
erate only small amounts of coarse woody debris (CWD) may provide too little substrate
to be useful for species with high extinction thresholds. In northern Sweden, forestland
is relatively inexpensive, so a cost-effective strategy to increase the amount of spruce
CWD was to set aside more forests as reserves. In central and southern Sweden, more
emphasis should instead be given to increasing the amount of CWD in the managed
forest. The regulations by the Forest Stewardship Council (FSC) could be made more
cost-effective by prescribing creation of more high stumps and retention of larger
amounts of naturally dying trees. Large-sized CWD, CWD from slow-growing trees,
and CWD in late decay stages are substrate types that were particularly rare in man-
aged forest in relation to unmanaged forests. Manual soil scarification and retention
of living trees are measures that can increase the proportion of these underrepresented
CWD types.
� 2005 Elsevier Ltd. All rights reserved.
er Ltd. All rights reserved.
tional Centre for Advanced Bio-Protection Technologies, Lincoln University, P.O. Box 84,6; fax: +64 3 325 3864.M. Jonsson).

444 B I O L O G I C A L C O N S E R VAT I O N 1 2 7 ( 2 0 0 6 ) 4 4 3 –4 6 2
1. Introduction
Preserving biodiversity may be economically beneficial in a
national or a global sense (Balmford et al., 2002), but for pri-
vate landowners, conservation measures aremost often asso-
ciated with economic costs. Therefore, it is important that
measures to maintain biodiversity are chosen so that they
are cost-effective for the land owner. Such conservation mea-
sures may include setting aside reserves but also altered
management of the productive land. In forest ecosystems,
biodiversity conservation has long been dominated by setting
aside reserves, but especially during the last decade this ap-
proach has been combined with changes in silvicultural
methods, which aim at increasing habitat quality for species
in managed forests (e.g., Larsson and Danell, 2001; Lindenma-
yer and Franklin, 2002). In Sweden and Finland, the current
strategy for preservation of forest biodiversity is, to a large ex-
tent, based on improvement of forest habitats in managed
forests through altered silvicultural methods (Raivio et al.,
2001). These changes have been brought about by adaptations
to the forest certification standards (e.g. from the Forest Stew-
ardship Council, FSC). As only a minor part of the forest area
is protected in these countries, consideration of managed for-
est land is probably essential for successful conservation of
forest biodiversity.
Dead wood is a key feature for the presence of biodiversity
in boreal forests (e.g., Berg et al., 1994; Jonsell et al., 1998; Sii-
tonen, 2001). A large proportion of the species in boreal for-
ests are saproxylic (Hanski and Hammond, 1995; Siitonen,
2001), i.e. they depend directly on dead wood or on other spe-
cies that require dead wood during some part of their life-cy-
cle (Speight, 1989). In Sweden, at least 6000–7000 species are
saproxylic (Dahlberg and Stokland, 2004). Coarse woody deb-
ris (CWD, defined as dead wood with a diameter larger than
10 cm) has higher species richness and is more important
for red-listed (species that are threatened, near threatened
or where species probably are threatened but data is deficient
according to the criteria of IUCN (2001)) saproxylic species,
than fine woody debris (Jonsell et al., 1998; Grove, 2002; Dahl-
berg and Stokland, 2004). About 90% of the Swedish red-listed
saproxylic species are confined to CWD (Dahlberg and Stok-
land, 2004), which explains why the efforts to enhance the
conditions for them have focused on CWD. Forest manage-
ment in Fennoscandia has decreased the volume of CWD to
2–30% (normally less than 10%) of the quantity found in old-
growth boreal forests (Fridman and Walheim, 2000; Siitonen,
2001). Therefore, many saproxylic species have declined and
are now red-listed (Gardenfors, 2000; Rassi et al., 2000). In
Sweden, 1126 saproxylic species are red-listed, which is about
25% of all red-listed species in the country (Dahlberg and
Stokland, 2004).
Saproxylic species have different requirements regarding
the quality of dead wood (Berg et al., 1994; Jonsell et al.,
1998; Stokland et al., 2004). Some factors that have been
found to correlate with the richness and composition of sapr-
oxylic species are tree species (Lohmus and Lohmus, 2001;
Lindhe and Lindelow, 2004; Lindhe et al., 2004), tree diameter
(Soderstrom, 1988; Bader et al., 1995; Ranius and Jansson,
2000; Norden et al., 2004), stage of decay (Soderstrom, 1988;
Bader et al., 1995; Lundblad, 1998; Lohmus and Lohmus,
2001), position, i.e. whether the tree is standing or lying (Jon-
sell and Weslien, 2003; Lindhe et al., 2004) and light regime
(Ranius and Jansson, 2000; Martikainen, 2001; Lindhe et al.,
2004; Jonsell et al., 2004). Thus, to maintain saproxylic biodi-
versity a great diversity of substrate qualities should be se-
cured (Simila et al., 2003).
According to Swedish governmental goals, the amount of
hard (less decayed) dead wood should increase by 40% to
2010 (Anon., 2001). A rough estimate suggests that this would
cost 4.2 x 10⁹ SEK (Anon., 1999). Because large costs are in-
volved, it is important that measures taken to increase the
amount of CWD are cost-effective. Several studies have re-
cently analyzed different aspects of cost-effectiveness of bio-
diversity-oriented forestry in Fennoscandia. Some have
analyzed how to select forest reserves in a cost-effective
manner (Juutinen and Monkkonen, 2004; Juutinen et al.,
2004), whereas others have focused on cost-effectiveness
within managed forests (Carlen et al., 1999; Wikstrom and Eri-
ksson, 2000; Kruys and Wikstrom, 2001; Kurttila and Pukkala,
2003; Ranius et al., 2005). Two studies have included analyses
on how to increase the amount of substrate for saproxylic
species in managed forests. Carlen et al. (1999) estimated ef-
fects on biodiversity at final logging by ranking conservation
measures according to how they believed that animals were
affected. Retention of dead fallen and standing trees was
among the measures that had a positive effect on biodiversity
but caused no change in net revenue. Kruys and Wikstrom
(2001) modelled dynamics of CWD and population dynamics
of the liverwort Anastrophyllum hellerianum (Lindenb.) and
showed that the occurrence of this particular species can in-
crease considerably at only a small cost. Thus, both studies
suggest that it is possible to improve cost-effectiveness of bio-
diversity-oriented forestry.
In a previous study where Norway spruce stands in Swe-
den were modelled, it was shown that measures to increase
the volumes of CWD differ considerably in terms of their
cost-effectiveness (Ranius et al., 2005). Creating high stumps
at thinning and clear-cutting, and retaining wind-thrown
trees were found to be inexpensive measures, whereas
increasing the rotation period was expensive. In that study
the response variables were the financial costs for the land-
owner and the total amount of CWD available if the same
management regime prevails over a long time. However, to in-
crease the total amount of CWD is not a goal in itself, but the
aim is to decrease the extinction risks of saproxylic species.
Because saproxylic species have different requirements
regarding the quality of dead wood, and some substrate types
are known to host a greater number of species than others
(Berg et al., 1994; Jonsell et al., 1998; Stokland et al., 2004),
increasing the amount of CWD to a certain extent will affect
saproxylic species differently depending on what qualities of
dead wood are increased. In analyses of cost-effectiveness of
different conservation measures that increase the amount of
dead wood it is therefore important to consider the substrate
requirements of saproxylic species. However, so far no study
has attempted to model financial costs, dead wood dynamics
and diversity of saproxylic species using different manage-
ment scenarios. In this study we build on the results from a
previous study of cost-effectiveness of different measures
that increase the amount of CWD in Norway spruce forests

Fig. 1 – Location of the three hypothetical Norway spruce
stands that were simulated, from north to south:
Vasterbotten in northern Sweden, Gavleborg in central
Sweden and Kronoberg in southern Sweden.
B I O L O G I C A L C O N S E R VAT I O N 1 2 7 ( 2 0 0 6 ) 4 4 3 –4 6 2 445
(Ranius et al., 2005), but when we estimate the conservation
value, we also take the substrate requirements of red-listed
saproxylic species into account. We simulated the amount
of suitable substrate for red-listed specieswhen different con-
servation measures are performed and how much these mea-
sures cost the land owner. In addition, we ascertained which
substrate types were underrepresented in managed forests in
relation to unmanaged forests and which, if any, of the con-
servation measures can make an extra contribution to these
substrate types. The analysis was performed for typical
spruce stands in three different regions of Sweden.
2. Methods
For each of the management scenarios analyzed, three differ-
ent kinds of data were obtained as output: economic costs,
volumes of different CWD qualities, and the amounts of sub-
strate suitable for different red-listed saproxylic species. We
used three models, one that deals with the development of
the forest stand, one that deals with the economic outcome
and one that deals with CWD (Ranius et al., 2005). To be able
to estimate the amount of substrate for red-listed species we
compiled a database based on available knowledge about the
substrate requirements of the red-listed species. We used
two types of estimates of conservation value to compare dif-
ferent conservation measures: a substrate index which is the
amount of substrate available multiplied with the number of
species that can use it and the number of species finding
more substrate than certain threshold amounts. We
compared the cost-effectiveness by calculating the economic
cost associated with a measure and dividing it with the in-
crease in the conservation value compared with a reference
scenario which maximized economic profit. The more cost-
effective a conservation measure is, the lower this value be-
comes. We also compared the proportions of different CWD
qualities present under different management scenarios
with the proportions present in unmanaged forests to evalu-
ate which substrate qualities that are underrepresented in
managed forests and if any measure can decrease this
deficit.
2.1. Forest characteristics and growth
We compared three model forest stands with 100% Norway
spruce in southern (Kronoberg county), central (Gavleborg
county) and northern (mountainous part of Vasterbotten
county) Sweden (Fig. 1). The stands were assigned character-
istics (site productivity and different transport distances)
close to the average values for each area (see Ranius et al.,
2005, for more details).
In scenarios with forest management, forest growth was
predicted by using a growth model applied in ‘The Stand
Method’ (‘Bestandsmetoden’), which is a flexible growth
model for forest valuation developed by the National Land
Survey of Sweden (Anon., 1988). The model was parameter-
ized using information from the National Land Survey of
Sweden.
In scenarios without management, the number of trees
per hectare was predicted by a function from Ranius et al.
(2004). The diameters of the trees were described by a nega-
tive exponential distribution, which is very near the distribu-
tion found empirically (Ranius et al., 2004).
2.2. Calculation of CWD amounts
We simulated the dynamics of CWD in managed stands using
a model similar to that presented by Ranius et al. (2003) and in
unmanaged stands using the model presented in Ranius et al.
(2004). The models predict amounts of CWD that are close to
the amounts observed in managed and old-growth forests in
Sweden (Ranius et al., 2003, 2004).
To simulate CWD dynamics, we used information on forest
growth, data on tree mortality, and a model that describes the
decay process of CWD. The output data included the volume
of CWD present in the forest, stratified according to decay
stage, size, light regime, position (whether standing or lying
on the ground), and growth rate of the stem when alive (Table
1). These variables were used when we calculated the amount
of substrate for red-listed species.
Tree mortality was assumed to be related to the stand age
(Table 2). Among retained trees, especially Norway spruce
trees that grow in small groups left on clear-cuts, mortality
will often be very high immediately after cutting (Esseen,
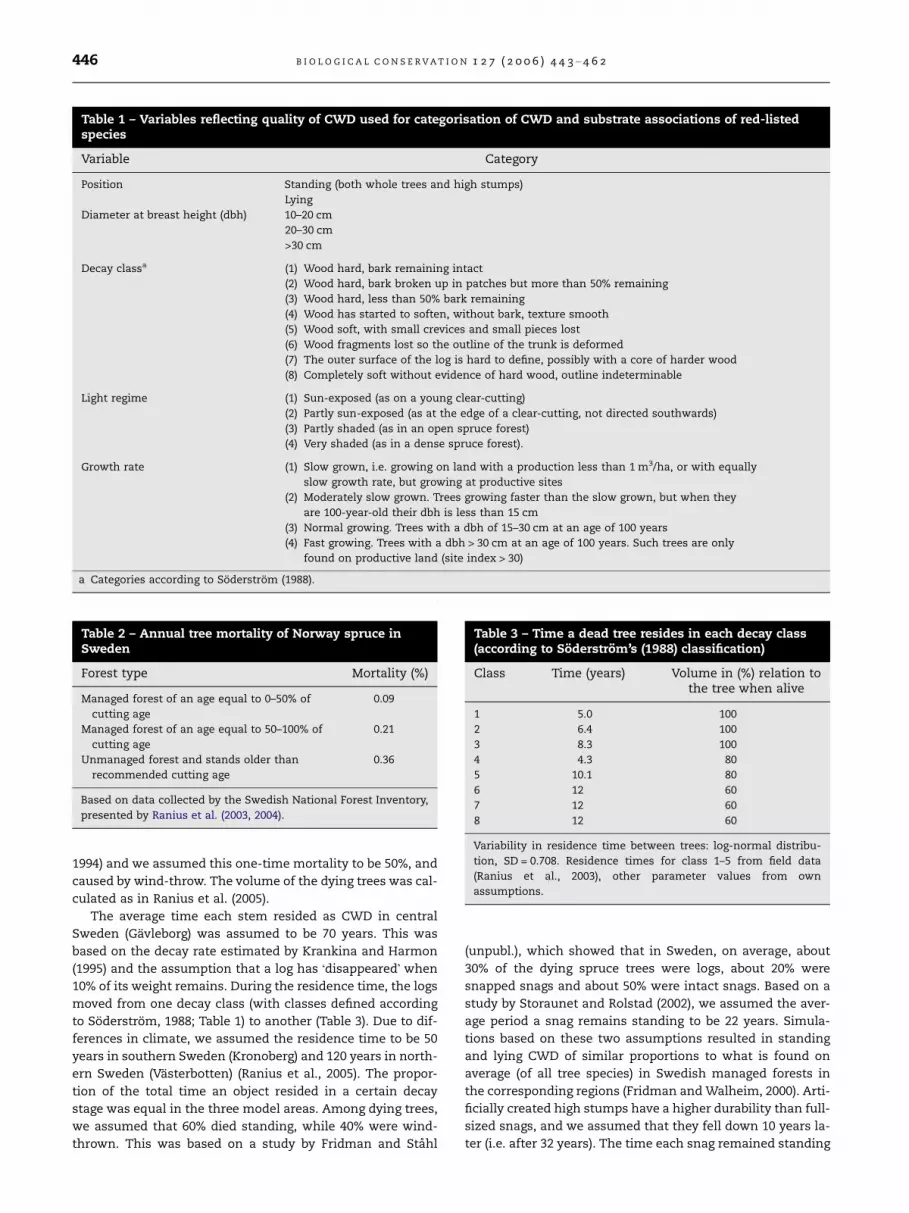
Table 3 – Time a dead tree resides in each decay class(according to Soderstrom’s (1988) classification)
Class Time (years) Volume in (%) relation tothe tree when alive
1 5.0 100
2 6.4 100
3 8.3 100
4 4.3 80
5 10.1 80
6 12 60
7 12 60
8 12 60
Variability in residence time between trees: log-normal distribu-
tion, SD = 0.708. Residence times for class 1–5 from field data
(Ranius et al., 2003), other parameter values from own
assumptions.
Table 1 – Variables reflecting quality of CWD used for categorisation of CWD and substrate associations of red-listedspecies
Variable Category
Position Standing (both whole trees and high stumps)
Lying
Diameter at breast height (dbh) 10–20 cm
20–30 cm
>30 cm
Decay classa (1) Wood hard, bark remaining intact
(2) Wood hard, bark broken up in patches but more than 50% remaining
(3) Wood hard, less than 50% bark remaining
(4) Wood has started to soften, without bark, texture smooth
(5) Wood soft, with small crevices and small pieces lost
(6) Wood fragments lost so the outline of the trunk is deformed
(7) The outer surface of the log is hard to define, possibly with a core of harder wood
(8) Completely soft without evidence of hard wood, outline indeterminable
Light regime (1) Sun-exposed (as on a young clear-cutting)
(2) Partly sun-exposed (as at the edge of a clear-cutting, not directed southwards)
(3) Partly shaded (as in an open spruce forest)
(4) Very shaded (as in a dense spruce forest).
Growth rate (1) Slow grown, i.e. growing on land with a production less than 1 m3/ha, or with equally
slow growth rate, but growing at productive sites
(2) Moderately slow grown. Trees growing faster than the slow grown, but when they
are 100-year-old their dbh is less than 15 cm
(3) Normal growing. Trees with a dbh of 15–30 cm at an age of 100 years
(4) Fast growing. Trees with a dbh > 30 cm at an age of 100 years. Such trees are only
found on productive land (site index > 30)
a Categories according to Soderstrom (1988).
Table 2 – Annual tree mortality of Norway spruce inSweden
Forest type Mortality (%)
Managed forest of an age equal to 0–50% of
cutting age
0.09
Managed forest of an age equal to 50–100% of
cutting age
0.21
Unmanaged forest and stands older than
recommended cutting age
0.36
Based on data collected by the Swedish National Forest Inventory,
presented by Ranius et al. (2003, 2004).
446 B I O L O G I C A L C O N S E R VAT I O N 1 2 7 ( 2 0 0 6 ) 4 4 3 –4 6 2
1994) and we assumed this one-time mortality to be 50%, and
caused by wind-throw. The volume of the dying trees was cal-
culated as in Ranius et al. (2005).
The average time each stem resided as CWD in central
Sweden (Gavleborg) was assumed to be 70 years. This was
based on the decay rate estimated by Krankina and Harmon
(1995) and the assumption that a log has �disappeared� when
10% of its weight remains. During the residence time, the logs
moved from one decay class (with classes defined according
to Soderstrom, 1988; Table 1) to another (Table 3). Due to dif-
ferences in climate, we assumed the residence time to be 50
years in southern Sweden (Kronoberg) and 120 years in north-
ern Sweden (Vasterbotten) (Ranius et al., 2005). The propor-
tion of the total time an object resided in a certain decay
stage was equal in the three model areas. Among dying trees,
we assumed that 60% died standing, while 40% were wind-
thrown. This was based on a study by Fridman and Stahl
(unpubl.), which showed that in Sweden, on average, about
30% of the dying spruce trees were logs, about 20% were
snapped snags and about 50% were intact snags. Based on a
study by Storaunet and Rolstad (2002), we assumed the aver-
age period a snag remains standing to be 22 years. Simula-
tions based on these two assumptions resulted in standing
and lying CWD of similar proportions to what is found on
average (of all tree species) in Swedish managed forests in
the corresponding regions (Fridman andWalheim, 2000). Arti-
ficially created high stumps have a higher durability than full-
sized snags, and we assumed that they fell down 10 years la-
ter (i.e. after 32 years). The time each snag remained standing

Table 4 – Assumed sun-exposure of CWD objects in even-aged stands of Norway spruce
Stand agea Southern Sweden Central Sweden Northern Sweden
Snagsb Logsc Snagsb Logsc Snagsb Logsc
<7 years (managed forest) 90–10–0–0 70–20–10–0 90–10–0–0 70–20–10–0 90–10–0–0 70–20–10–0
<7 years (at area retained at clear-cutting) 20–40–40–0 20–30–30–20 20–40–40–0 20–30–40–10 20–40–40–0 20–40–30–10
7–14 years (managed and retained part) 50–40–10–0 0–30–40–30 50–40–10–0 30–50–20–0 50–40–10–0 0–40–50–10
15–28 years (managed and retained part) 0–50–50–0 0–20–20–60 0–60–40–0 0–20–40–40 0–70–30–0 0–30–60–10
>28 years (managed and retained part) 0–20–20–60 0–10–10–80 0–20–50–30 0–10–40–50 0–30–60–10 0–20–60–20
Percentages of the CWD in sun-exposure classes (see Table 1) in relation to stand age and geographical location.
a The age (= time since cutting of the managed part) presented here is valid when SI = 24. The age limits is dependent on productivity, with a
lower limit in more productive forests.
b Percent of snags that are sun-exposed–partly shaded–very shaded.
c Percent of downed logs that are sun-exposed–partly sun-exposed–partly shaded–very shaded.
B I O L O G I C A L C O N S E R VAT I O N 1 2 7 ( 2 0 0 6 ) 4 4 3 –4 6 2 447
was always directly proportional to the total residence time
for each object. Consequently, the snags fell after different
time periods, however, the decay stage when they fell was al-
ways the same; in the model, all naturally generated snags
belonged to decay class 4 when they fell, while artificially cre-
ated high stumps belonged to class 5. Each CWD object was
also given a value of growth rate category based on age and
diameter at death.
Light regime varied between individual stems. We as-
sumed that the proportion of dead trees in different light re-
gime classes differed between standing trees and downed
logs, and that in managed forests it changed with the ageing
of the stand (Table 4). We modelled two unmanaged stands
differing in their light regime. In one, the light regime of the
CWD was, on average, equal to the light regime in 34–82-
year-old managed forest, while in the other the light regime
of the CWD was equal to the average in the managed forest
over the whole rotation period. In this way we emulated one
forest with a small gap dynamics (generally more shaded)
and another with a large scale disturbance regime (generally
more sun-exposed).
The forest stand was simulated over 400–500 years with
constant management regime over time, but output data
was only taken from the last rotation period (for the unman-
aged stand a time period equal to the rotation period of the
managed forest). This was done to emulate a situation when
the same management regime prevails over such a long time
that there is no effect of any former management regime.
With all measures except setting aside a stand as a reserve,
a large proportion of the increase in CWD takes place immedi-
ately after the time of decision. For three methods (manual
scarification, retention of snags and retention of naturally dy-
ing trees), the whole increase takes place at that time, while
for the other measures (creation of high stumps, retention of
living trees at harvest and prolongation of the rotation period),
the increase takes place over a longer period. The amount of
CWD varied over the rotation period, and an average value
was calculated. We simulated 500 stands and estimated a
mean value, which was a sufficiently large sample size to
achieve results that were stable between simulation runs.
2.3. Database for saproxylic species
To be able to compare the conservation value of different
management scenarios, we first compiled the available
knowledge about the substrate requirements of all non-ex-
tinct red-listed beetles, mosses, fungi and lichens in Swe-
den for which spruce CWD is considered an important
substrate, into a database. The substrate requirements of
all species occurring in the counties of Kronoberg (southern
Sweden), Gavleborg (central Sweden) and Vasterbotten
(northern Sweden) (Gardenfors, 2000) are summarised in
Fig. 2. Beetles, fungi, mosses and lichens together comprise
the great majority of red-listed species associated with dead
spruce trees in Sweden (Dahlberg and Stokland, 2004). The
database includes all species which according to Speight�s
(1989) definition are saproxylic, i.e. both species living di-
rectly from the dead wood, and those depending on other
organisms that are living on dead wood. The substrate asso-
ciations of the red-listed species were categorised according
to the variables used in the CWD simulations (Table 1). The
classification was carried out by experts associated with the
Swedish Species Information Centre and complemented
with information from two other databases, one available
at the Swedish Species Information Centre and one devel-
oped by Dahlberg and Stokland (2004). For some species,
knowledge about their associations with certain substrate
variables is poorly known. These organisms were classified
as generalists for that particular substrate variable, i.e.
occurring in all of its categories. An alternative would be
to exclude species with unknown associations from the
analysis, but as most species only had unknown associa-
tions for one or two variables, that would have discarded
a lot of information.
2.4. Modelling conservation value
For each CWD simulation, we calculated the average volume
of CWD that potentially could be used by each red-listed spe-
cies in the database, Vi, by summing the simulated volumes of
CWD with qualities corresponding to the preferences of that
species. Only species that have been recorded in the county
where the simulated forest was situated (Gardenfors, 2000)
were included in the analysis. We used two types of estimates
to compare the conservation value of the different conserva-
tion measures: a substrate index, S, and the number of spe-
cies which have substrate amounts exceeding certain
threshold levels. The substrate index for a given simulation
was calculated by summing the preferred substrate volumes
for all red-listed species included in the database and

Southern Sweden (county of Kronoberg)
0
5
10
15
20
25
30
35
40
Sta
ndin
g
Lyin
g
Pre
f. un
know
n
10-2
0 cm
20-3
0 cm
>30
cm
Pre
f. un
know
n
Ver
y sl
ow
Mod
erat
ely
slow
Nor
mal
Ver
y fa
st
Pre
f. un
know
n 1 2 3 4 5 6 7 8
Pre
f. un
know
n
Ver
y su
nny
Mod
erat
ely
sunn
y
Mod
erat
ely
shad
y
Ver
y sh
ady
Pre
f. un
know
n
Nu
mb
er o
f sp
ecie
s N
um
ber
of
spec
ies
Mosses, n=8
Lichens,n=2
Fungi, n=7
Beetles, n=23
Central Sweden (county of Gävleborg)
0
20
40
60
80
100
120Mosses, n=12
Lichens, n=4
Fungi, n=38
Beetles, n=62
Substrate category
Position Diameter Growth rate Decay stage Light regime
Sta
ndin
g
Lyin
g
Pre
f. un
know
n
10-2
0 cm
20-3
0 cm
>30
cm
Pre
f. un
know
n
Ver
y sl
ow
Mod
erat
ely
slow
Nor
mal
Ver
y fa
st
Pre
f. un
know
n 1 2 3 4 5 6 7 8
Pre
f. un
know
n
Ver
y su
nny
Mod
erat
ely
sunn
y
Mod
erat
ely
shad
y
Ver
y sh
ady
Pre
f. un
know
n
Substrate category
Position Diameter Growth rate Decay stage Light regime
Northern Sweden (county of Västerbotten)
0
10
20
30
40
50
60
70
80
90
Nu
mb
ero
fsp
ecie
s
Mosses, n=5
Lichens, n=5
Fungi, n=32
Beetles, n=58
Fig. 2 – Substrate associations of red-listed mosses, lichens, fungi and beetles that utilise dead spruces during some part of
their life-cycle and have been recorded from the Swedish counties of Kronoberg (southern Sweden), Gavleborg (central
Sweden) or Vasterbotten (northern Sweden). n Values represent number of species found of a taxonomic group in a region.
448 B I O L O G I C A L C O N S E R VAT I O N 1 2 7 ( 2 0 0 6 ) 4 4 3 –4 6 2
occurring in the county (see Eq. (1), where V is the substrate
volume and i counts the red-listed species).
S ¼X
8iVi. ð1Þ
Thus, the size of the substrate index is equal to the pre-
dicted volume of each substrate quality multiplied by the
number of species that prefer that particular kind of sub-
strate. The substrate index is a relevant measure of conserva-

Table 5 – Point in time when the decision is made toundertake measures to increase the volume of CWD
Measure Point in time
Artificial creation of high stumps First thinning
Retention of living trees Final felling
Retention of snags Final felling
Manual scarification Immediately after final felling
Prolongation of rotation period Final felling
Setting aside stands as reserves Final felling
Retention of wind-throw Halfway between last thinning
and final felling
B I O L O G I C A L C O N S E R VAT I O N 1 2 7 ( 2 0 0 6 ) 4 4 3 –4 6 2 449
tion value if there is a linear relationship between the sub-
strate amount and the persistence probability for the popula-
tions of the red-listed species.
Our second type of estimate of conservation value was
achieved by counting the number of species finding more
suitable substrate than certain threshold levels at each man-
agement scenario. Several theoretical studies agree that
extinction thresholds are common, i.e. that the relationship
between habitat amount and persistence probability could
be described by a sigmoid function (Lande, 1987; Bascompte
and Sole, 1996; With and King, 1999; Fahrig, 2001). As knowl-
edge about extinction thresholds of saproxylic species is poor
(but see Økland et al., 1996; Ranius, 2002), we arbitrarily se-
lected four different threshold values. The extinction thresh-
old for individual species is not related to the total amount of
CWD, but to the amount of CWD suitable for that particular
species. To make the extinction thresholds comparable be-
tween species associated with different types of CWD, we ex-
press this threshold as the percent of suitable substrate in
relation to the amount present in unmanaged forests rather
than in terms of cubic meters. Therefore, we defined our
threshold values as proportions of substrate found in unman-
aged forests. Two types of unmanaged forest were simulated,
differing in their light regime. We divided the red-listed spe-
cies into species mainly utilizing the two more sun-exposed
substrate classes and those mainly utilizing the two more
shaded classes. The threshold values for the more sun
demanding species were set to a certain proportion of suit-
able substrate found in more sun-exposed unmanaged forest
and for the more shade demanding species to a certain pro-
portion of the substrate amount found in the more shaded
unmanaged forest. Threshold values were set at 10%, 20%,
30% and 50% of the substrate amounts in the two unmanaged
forests.
To analyze how well different substrate qualities are repre-
sented in managed forests we compared the proportions of
CWD belonging to different qualities in the different managed
forest scenarios with the proportions of the same qualities in
unmanaged forests. For this analysis we pooled substrate
qualities so that each variable only had two categories, as
equal in size as possible.
2.5. Modelling economic costs
We planned the management of the stand and calculated
the opportunity costs using ‘Plan33’, (Ekvall, 2001), in the
same way and with the same assumptions as Ranius et al.
(2005). The opportunity cost of a measure to increase CWD
is defined as the difference between the maximum present
value that can be obtained from the stand when no CWD-
increasing measure is undertaken and the present value ob-
tained as a result of undertaking a CWD-increasing measure.
The costs and revenues were discounted to the point in time
when the decision to undertake a CWD-increasing measure
was made (Table 5). This way of calculating the present val-
ues replicates the decision problem faced by a forest owner
expected to increase the total amount of CWD at an estate
that consists of many forest stands differing in age. By con-
trast, using the soil expectation value measure implicitly as-
sumes that all decisions concerning CWD-increasing
measures are undertaken in connection to the final cut,
which is unrealistic.
The decision on timing for final clear-cutting and the num-
ber, type (e.g. size of felled trees in relation to those retained),
timing and intensity of the thinnings was obtained through
an iterative search for a global present value maximum. The
management regime (rotation period and time and strength
of thinnings) was adapted to maximize the present value
when no measure to increase the amount of CWD was taken,
and was not changed when the measures to increase CWD
were analyzed (except when increasing the rotation period
was the conservation measure).
All economic calculations were based on the price lists for
2002 from Mellanskog (Ranius et al., 2005). We assumed that
the most common methods in Swedish forestry were used.
This means that felling, cutting, pruning, and stacking is con-
ducted using a harvester. Transport from the felling site to the
logging road is conducted with a forwarder. Manual felling
was assumed to be conducted only when the number of trees
to be cut was low. At regeneration, soil scarification, planting,
re-growth control and pre-commercial thinning was
conducted.
What is cost-effective for a small increase in CWD is not
necessarily cost-effective for a larger increase. In this study
we captured this fact through the use of three levels of
intensity for the measures creation of high stumps, reten-
tion of living trees and prolongation of the rotation period
and two plus two levels for retention of newly formed
CWD. The measures retention of snags, manual scarification
and setting aside a stand as a reserve are of a dichotomous
choice character, i.e. they cannot be conducted in different
levels of intensity.
2.6. Management practices
Seven different conservation measures were considered: six
that involves altered management and one where the whole
stand is set aside as a reserve (Table 6). These measures
change the amount and quality of CWD, and therefore also
persistence probabilities of saproxylic organisms. For each
measure we analyzed one to three levels of intensity. If possi-
ble, one of the levels corresponds to the FSC regulations
(Anon., 2000). For each level, the opportunity cost, CWD vol-
ume, substrate index and the number of species above the
four different threshold levels were compared with a refer-
ence case where forest management was conducted with
the sole purpose of maximizing present value.

Table 6 – Management measures taken to increase the amount of CWD, levels of intensity analyzed, and their values whenno measure to increase CWD is taken
Management measure Intensity of managementmeasure
Value when no measure toincrease CWD is taken
Retention of area (%) with living trees at harvest 1 0
5
9
Artificial creation of high stumps during thinning
operations and at final cutting (no./ha)
3 0
10
20
Scarification of the clear-cutting Only manually around plants No restriction
Retention of snags at final cutting (%) 80 0
Prolongation of rotation period (%) 10 0
25
50
Setting aside a stand as a reserve. Two types of
unmanaged forests are compared: one with a large scale
disturbance regime and on with a small scaled gap
dynamics
100% 0%
Retention of newly formed CWD in a year with high
natural mortality (volume of newly formed CWD (x) and
how much of this that is retained (y) (m3/ha), always one
storm felling per rotation period)
x = 20, y = 20 x = 20, y = 0
x = 20, y = 1 x = 5, y = 0
x = 5, y = 5
x = 5, y = 1
Levels that often occur when FSC prescriptions are followed are underlined.
450 B I O L O G I C A L C O N S E R VAT I O N 1 2 7 ( 2 0 0 6 ) 4 4 3 –4 6 2
The seven management measures are described below:
(1) Retention of living trees at harvest. When the FSC standard
(Anon., 2000) is applied, living trees covering at least 5% of the
stand are normally retained at cutting, both as individual
trees and in small groups of trees. In retained areas, the vol-
ume of standing trees per hectare is lower than the average
(Ola Karen, pers. comm.), and therefore we assumed that
the retained area has a productivity and a timber volume
per hectare equal to 75% of the average value for the stand.
Tree retention at harvest reduces the present value because
the standing timber is lost and no timber production will take
place on the area in the future.
(2) Artificial creation of high stumps during thinning operations
and at final cutting. The FSC standard prescribes the creation of
high stumps (Anon., 2000). High stumps usually have a height
of 3–5 m. In this study, the height was assumed to be 4 m, and
the average diameter equal to the cut trees. The CWD volume
of a high stump was set to 30% of a whole stem. High stumps
are created from trees of all quality classes, but lower classes
are overrepresented (Ola Karen, pers. comm.). We assumed
that all high stumps are created from wood of the lowest tim-
ber quality class. For harvested trees, the wood at the base of
the tree may belong to three different timber quality classes
as well as the pulp wood class, and its average value is higher
than the value of the lowest timber quality class. Creating
high stumps reduces present value because the timber in
the stumps is lost, and the harvesting costs increase since
high stumps are avoided by the machines.
(3) Manual scarification of clear-cuts. Especially at scarifica-
tion (before plantation), but also at final cutting, machines
are used which destroy CWD. In a Finnish study, 58% of the
younger CWD, and 88% of the older CWD was destroyed at fi-
nal cutting if scarification was carried out, while with no scar-
ification the loss was 15% (Hautala et al., 2004). According to
the FSC standard, forestry operations should take care to pre-
serve CWD and, if possible, scarification should be avoided
(Anon., 2000). We compared two different methods (manual
and with machines) of scarification before plantation. We as-
sumed that only 15% of the CWD is lost when manual scari-
fication is used. Manual scarification reduces the present
value of forestry since it is more expensive than using
machines.
(4) Retention of snags at final cutting. If preservation of CWD
is not taken into consideration, we assumed that 100% of the
snags are actively or incidentally felled at final cutting. These
downed logs are then destroyed at scarification to the same
extent as CWD that was lying on the ground before final cut-
ting. When care is taken to preserve CWD we assumed that
80% of the snags will remain standing, while 20% fall down
accidentally at cutting operations (Ola Karen, pers. comm.).
This conservation measure decreases the present value since
machines have to avoid the snags.
(5) Prolongation of rotation period. We compared three levels
of prolonged rotation time. Prolonged rotation time increases
the amount of CWD because the period when the living trees
are large enough to possibly generate CWD becomes longer,
and destruction of CWD due to cutting occurs at longer inter-
vals. An extension of the rotation time reduces the present
value mainly through the discounting effect, i.e. the forest
owner must wait longer for the revenues of the harvest.
(6) Setting aside a stand as nature reserve. Setting aside the
whole stand as a reserve means that it will never be used
for forestry, and thus the cost is equal to the present value
of the stand.

Table 7 – Increase of CWD (average over the rotation period assuming that the management has been the same over a longtime, m3/ha), substrate index, the number of species with more substrate than certain threshold levels and financial cost(decrease of predicted present value at the time of decision, SEK/ha) when different measures are taken to increase thevolume of CWD at even-aged Norway spruce stands in Sweden
Number of species above threshold volumes of substrate
CWD Substrateindex
10% ofunmanaged
forest
20% ofunmanaged
forest
30% ofunmanaged
forest
50% ofunmanaged
forest
Cost
Southern Sweden
Reference case 6.92 29.37 15 5 4 2 0
Retention of area (%)
1 +1.09 +5.18 +3 +1 0 0 416
5 +5.10 +24.98 +8 +6 +4 +1 2143
9 +9.33 +45.51 +10 +12 +7 +5 3845
High stumps (no./ha)
3 +0.63 +2.16 +3 +2 +1 +1 44
10 +2.23 +7.48 +9 +4 +2 +1 146
20 +4.32 +14.18 +10 +6 +3 +2 293
Manual soil scarification +3.69 +19.24 +7 +6 +2 +2 1216
Retention of snags +1.79 +5.96 +6 +5 +1 +1 53
Rotation period (% prolongation)
10 +2.25 +9.73 +3 +2 +1 +1 1863
25 +5.87 +25.99 +9 +8 +4 +3 8889
50 +12.93 +58.02 +13 +17 +7 +5 25,979
Setting aside stand as reserve
Sun-exposed forest +91.80 +342.42 +25 +35 +36 +38 69,528
Shady forest +91.58 +351.80 +24 +34 +35 +34 69,528
20 m3 wind-throw
Reference case 6.52 27.41 14 6 5 3 0
1 m3 retained +0.35 +1.89 0 �1 �1 �1 55
20 m3 retained +6.09 +30.25 +7 +6 +3 +1 963
5 m3 wind-throw
Reference case 6.70 28.51 13 5 4 2 0
1 m3 retained +0.23 +1.10 +1 +1 0 0 53
5 m3 retained +1.45 +7.07 +4 +1 0 +1 147
Central Sweden
Reference case 4.57 81.91 25 7 5 3 0
Retention of area (%)
1 +0.68 +14.41 +7 +5 0 0 245
5 +3.35 +70.23 +34 +16 +7 +2 1209
9 +5.94 +125.35 +47 +31 +16 +3 2010
High stumps (no./ha)
3 +0.39 +5.53 +3 +1 0 0 45
10 +1.21 +17.86 +13 +8 0 0 150
20 +2.47 +36.19 +22 +10 +1 0 300
Manual soil scarification +2.64 +50.04 +22 +12 +7 +1 915
Retention of snags +1.19 +18.43 +11 +9 �2 0 36
Rotation period (% prolongation)
10 +1.18 +23.60 +13 +9 0 0 1333
25 +3.14 +62.94 +38 +14 +6 +1 6232
50 +7.84 +160.64 +62 +44 +23 +5 17,099
Setting aside stand as reserve
Sun-exposed forest +68.23 +1022.10 +91 +109 +111 +113 43,424
Shady forest +68.20 +1084.10 +90 +108 +110 +98 43,424
20 m3 wind-throw
Reference case 4.50 80.44 25 7 5 3 0
1 m3 retained +0.35 +7.46 +4 +3 0 0 �5
20 m3 retained +7.10 +143.73 +43 +35 +19 +10 �252
(continued on next page)
B I O L O G I C A L C O N S E R VAT I O N 1 2 7 ( 2 0 0 6 ) 4 4 3 –4 6 2 451

Table 7 – Continued
Number of species above threshold volumes of substrate
CWD Substrateindex
10% ofunmanaged
forest
20% ofunmanaged
forest
30% ofunmanaged
forest
50% ofunmanaged
forest
Cost
5 m3 wind-throw
Reference case 4.44 79.68 25 7 5 3 0
1 m3 retained +0.40 +7.94 +3 +3 0 0 �8
5 m3 retained +1.87 +37.66 +15 +12 +1 +1 �154
Northern Sweden
Reference case 3.60 64.99 18 6 4 4 0
Retention of area (%)
1 +0.28 +4.83 +1 0 0 0 194
5 +1.61 +28.53 +11 +4 +2 0 963
9 +3.00 +53.06 +24 +5 +3 0 1731
High stumps (no./ha)
3 +0.15 +2.48 +1 0 0 0 33
10 +0.49 +7.98 +2 0 0 0 109
20 +0.96 +15.61 +9 +2 +2 0 216
Manual soil scarification +1.89 +32.91 +7 +6 +2 +1 509
Retention of snags +0.58 +9.66 +1 0 +2 0 10
Rotation period (% prolongation)
10 +0.79 +14.33 +9 +2 0 0 618
25 +2.16 +39.43 +16 +6 +3 0 2631
50 +5.14 +95.27 +39 +20 +6 +2 6184
Setting aside stand as reserve
Sun-exposed forest +62.61 +991.79 +82 +94 +96 +96 9870
Shady forest +62.87 +1042.02 +81 +93 +95 +95 9870
20 m3 wind-throw
Reference case 3.49 63.17 17 6 4 4 0
1 m3 retained +0.37 +6.42 +2 +1 0 0 �75
20 m3 retained +7.66 +129.50 +26 +25 +15 +5 �1663
5 m3 wind-throw
Reference case 3.52 63.65 17 6 4 4 0
1 m3 retained +0.42 +7.30 +3 +2 0 0 �80
5 m3 retained +1.94 +32.90 +12 +6 +2 +1 �507
The stands were situated in three different counties, Kronoberg in southern, Gavleborg in central and Vasterbotten in northern Sweden. The
given values are the difference in CWD (in m3/ha) and present value (in SEK/ha) in relation to a reference case. When occasions with large
amounts of wind-throw occur, the reference cases differ, and imply that all newly formed CWD is taken care of (0 m3 retained).
452 B I O L O G I C A L C O N S E R VAT I O N 1 2 7 ( 2 0 0 6 ) 4 4 3 –4 6 2
(7) Retention of newly formed CWD in a year with high natural
mortality. If large quantities of spruce CWD are generated by
natural mortality, it is usually removed by the forester. This
is because the risk for bark beetle outbreaks may increase
(Schroeder and Lindelow, 2002) or because newly dead spruce
trees have a commercial value (Torlind, 1998). In our analysis,
we assumed that at a particular age (always midway between
the last thinning and the final cutting), the mortality is excep-
tionally high, while for all other scenarios the tree mortality
was held constant and no newly formed CWD was removed.
Therefore, the results from this conservation measure are
not directly comparable to the other measures. In years with
exceptional mortality, all trees were wind-thrown and no
trees died standing. We compared a scenario with all CWD
generated at the year with highmortality retained, with a sce-
nario with CWD from this year removed. Leaving naturally
dying trees reduces the present value both because the timber
in the trees is lost and because it increases future costs that
arise when machines have to avoid the CWD. According to
FSC, the forester is not allowed to remove all dead trees gen-
erated at a year with high natural mortality; a few representa-
tive dead trees per hectare must be retained (Anon., 2000).
3. Results
3.1. Substrate amounts for red-listed species
In the simulated unmanaged forests, there was more CWD in
the south than in the north; in southern Sweden on average
99 m3/ha CWD was present, in central Sweden 73 m3/ha,
and in northern Sweden 66 m3/ha. Also in the reference case
where present economic value was optimized more CWDwas
produced in the south (Table 7).

B I O L O G I C A L C O N S E R VAT I O N 1 2 7 ( 2 0 0 6 ) 4 4 3 –4 6 2 453
The substrate index and volume of CWD ranked the differ-
ent measures in almost the same way (Table 7, Fig. 3). When
the increase in number of species above different thresholds
was considered, larger differences in relation to the volume
of CWD appeared (Table 7, Fig. 3). At some combinations of
thresholds and conservation measures, no increase in the
number of species above the thresholds was observed (Table
7, Fig. 3). This occurred in all regions, but more often in north-
ern and central Sweden than in southern Sweden (Table 7,
Fig. 3). For example, three high stumps created in northern
Sweden only resulted in an increase in the number of species
above the 10% threshold whereas it gave an increase at all of
the threshold levels in southern Sweden (Table 7, Fig. 3).
In all regions, the reference scenario produced a much
lower proportion of large-sized (>30 cm) and slow grown
CWD than the unmanaged forests, and a somewhat lower
proportion of CWD in late decay stages (Fig. 4). In addition,
Southern Sweden
0
200
400
600
800
1000
1200
1400
Ret
entio
n of
are
a 1%
Ret
entio
n of
are
a 5%
Ret
entio
n of
are
a 9%
Hig
h st
umps
3
Hig
h st
umps
10
Hig
h st
umps
20
Man
ual s
carif
icat
ion
Ret
entio
n of
sna
gs
Rot
atio
n +
10%
Rot
atio
n +
25%
Rot
atio
n +
50%
Res
erve
, sun
expo
sed
Res
erve
, sha
dy
20m
3 fall,
1m
3 ret
ain
20m
3 fall,
20m
3 ret
ain
5m3 fa
ll, 1
m3 r
etai
n
5m3 fa
ll, 5
m3 r
etai
n
Conservation measure
Incr
ease
in c
on
serv
atio
n v
alu
e (%
) co
mp
ared
wit
h r
efer
ence
cas
e
CWD volume
Substrate index
Treshold 10%
Treshold 30%
----
--N
o in
crea
se
----
--N
o in
crea
se
----
--N
o in
crea
se
----
--N
o in
crea
se
ig. 3 – Increase in volume of CWD, substrate index and the number of species with more substrate than different threshold
vels, following different conservation measures compared with the reference case, i.e. when these measures were not
aken. The reference case differs between retention of wind-thrown trees and the other management measures. Measures
arked with ‘‘No increase’’ did not lead to any increase in that particular variable. The stands were situated in southern
ounty of Kronoberg), central (county of Gavleborg) and northern Sweden (county of Vasterbotten).
F
le
t
m
(c
in the reference scenario somewhat lower proportions of
CWD in shady positions was present compared with the
shady unmanaged forest and in sun-exposed positions com-
pared with the sun-exposed unmanaged forest (Fig. 4). The
proportion of CWD that was standing was rather similar to
unmanaged forests (Fig. 4). Setting aside whole stands as re-
serves would obviously in the long run eliminate the under-
representation of these substrate types as the stand would
become similar to forests that were never managed. Among
the conservation measures involving altered management,
prolongation of the rotation period was the measure that
generated the largest increase of the proportion of CWD of
large-size (Fig. 4). In northern Sweden some measures, in
particular retaining part of the forest area and increasing
the rotation period, significantly increased the proportion
of slow-growing trees, whereas no measure did this in
southern and central Sweden (Fig. 4). In all regions, manual

Central Sweden
-100
100
300
500
700
900
1100
1300
1500
1700
1900
2100
2300
Ret
entio
n of
are
a 1%
Ret
entio
n of
are
a 5%
Ret
entio
n of
are
a 9%
Hig
h st
umps
3
Hig
h st
umps
10
Hig
h st
umps
20
Man
ual s
carif
icat
ion
Ret
entio
n of
sna
gs
Rot
atio
n +
10%
Rot
atio
n +
25%
Rot
atio
n +
50%
Res
erve
, sun
expo
sed
Res
erve
, sha
dy
20m
3 fall,
1m3 r
etai
n
20m
3 fall,
20m
3 re
tain
5m3 fa
ll,1m
3 ret
ain
5m3 fa
ll,5m
3 ret
ain
Conservation measure
Incr
ease
in c
on
serv
atio
n v
alu
e (%
) co
mp
ared
wit
h r
efer
ence
cas
eCWD volume
Substrate index
Treshold 10%
Treshold 30%
----
--
----
--
----
--
----
--
----
--
----
-- No
incr
ease
No
incr
ease
No
incr
ease
No
incr
ease
No
incr
ease
No
incr
ease
Fig. 3 – continued
454 B I O L O G I C A L C O N S E R VAT I O N 1 2 7 ( 2 0 0 6 ) 4 4 3 –4 6 2
soil scarification increased the proportion of CWD in late de-
cay stages the most, prolongation of the rotation period in-
creased the proportion of shady CWD the most, and
retention of snags increased the proportion of sun-exposed
CWD the most (Fig. 4).
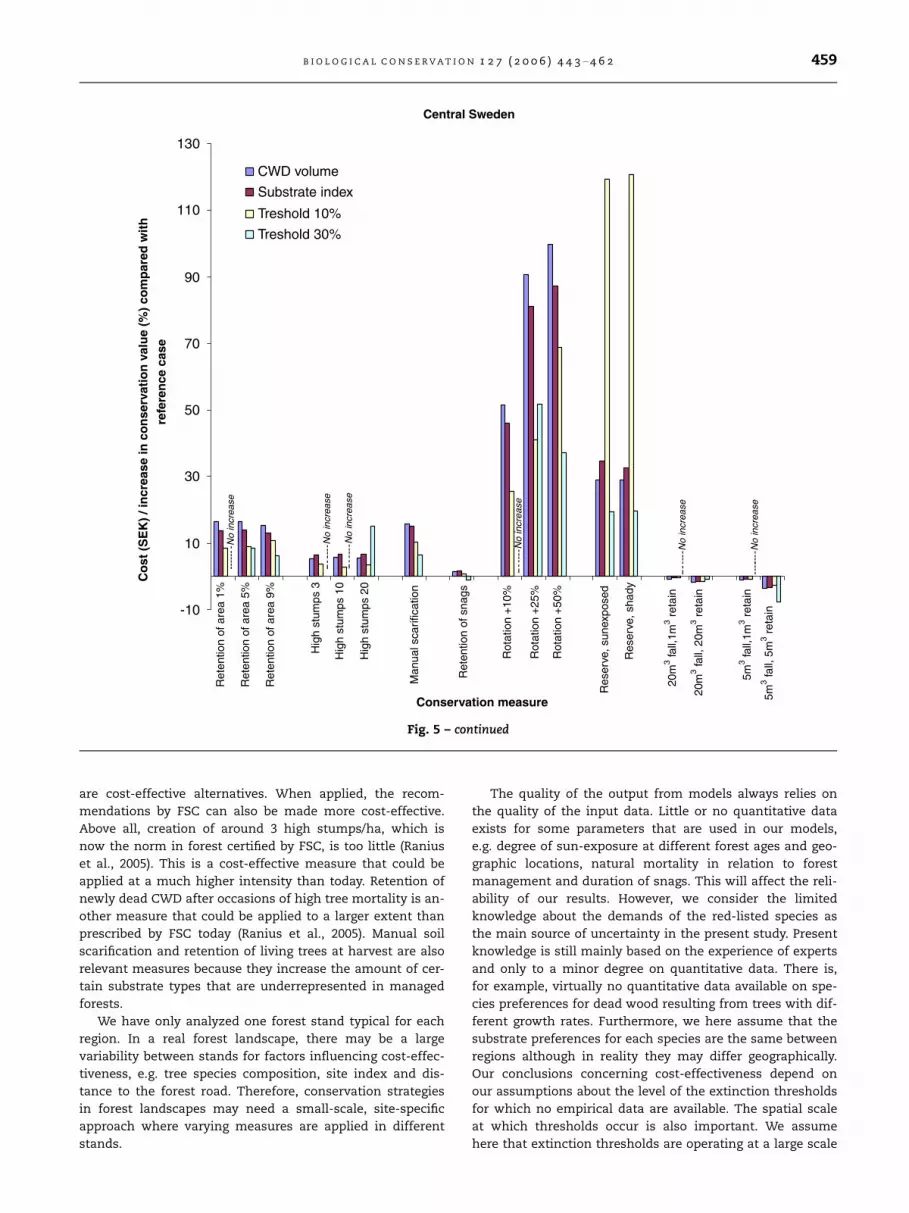
3.2. Cost-effectivity
The volume of CWD and the substrate index generally ranked
the different conservationmeasures in the sameway in terms
of cost efficiency. In all regions, the volume of CWD and the
substrate index agreed that, in the absence of wind-thrown
trees, retention of snags was the most cost-effective measure
for biodiversity conservation and that increasing the rotation
period was the least cost-effective measure (Fig. 5). Another
cost-effective measure in all regions was creation of high
stumps (Fig. 5). In northern Sweden, manual soil scarification
was almost as cost-effective as creating high stumps whereas
it was less cost-effective in the other regions (Fig. 5). Setting
aside a reserve was cost-effective in northern Sweden but
more expensive towards the south (Fig. 5). Retention of
wind-thrown trees when they were available was a cost-
effective conservation measure in all regions. In central and
northern Sweden this measure resulted in a negative cost,
implying that it was cheaper to retain wind-thrown trees than
to remove them. In southern Sweden, retention of wind-
thrown trees entailed a small cost, but it was still a compara-
tively cost-effective measure.
Results are partly different for the number of species
above certain threshold amounts of suitable substrate com-
pared with volume of CWD and the substrate index. The
largest differences were found in central and northern Swe-
den at the highest threshold levels. Measures only increas-
ing the amount of CWD to a small extent such as
retention of snags and creation of a few high stumps did
not lead to any, or only a very small, increase in the number
of species above the thresholds, making these measures less
cost-effective. Instead, measures increasing the amount of
CWD to a larger extent such as retaining a large percentage
of the forest area and setting aside whole stands as reserves
were relatively more cost-effective measures at higher
extinction thresholds (Fig. 5, Table 7). In southern Sweden,

Northern Sweden
0
200
400
600
800
1000
1200
1400
1600
1800
2000
2200
2400
Ret
entio
n of
are
a 1%
Ret
entio
n of
are
a 5%
Ret
entio
n of
are
a 9%
Hig
h st
umps
3
Hig
h st
umps
10
Hig
h st
umps
20
Man
ual s
carif
icat
ion
Ret
entio
n of
sna
gs
Rot
atio
n +
10%
Rot
atio
n +
25%
Rot
atio
n +
50%
Res
erve
, sun
expo
sed
Res
erve
, sha
dy
20m
3 fall,
1m
3 ret
ain
20m
3 fall,
20m
3 ret
ain
5m3 fa
ll, 1
m3 r
etai
n
5m3 fa
ll, 5
m3 r
etai
n
Conservation measure
Incr
ease
in c
on
serv
atio
n v
alu
e (%
) co
mp
ared
wit
h r
efer
ence
cas
e
CWD volume
Substrate index
Treshold 10%
Treshold 30%
----
--N
o in
crea
se
----
--N
o in
crea
se
----
--N
o in
crea
se
----
--N
o in
crea
se
----
--N
o in
crea
se
----
--N
o in
crea
se
Fig. 3 – continued
B I O L O G I C A L C O N S E R VAT I O N 1 2 7 ( 2 0 0 6 ) 4 4 3 –4 6 2 455
the difference between the number of species above thresh-
olds and volume CWD and the substrate index was smaller,
e.g. retention of snags and creation of high stumps were
cost-effective measures and prolongation of the rotation per-
iod was relatively expensive (Fig. 5, Table 7). In all regions,
different thresholds ranked setting aside the whole stand
as a reserve differently. For low threshold levels this mea-
sure was rather costly whereas it was more cost-effective
at higher threshold levels.
4. Discussion
4.1. Cost-effectivity
Our study shows that conclusions concerning cost-effective-
ness of different conservation measures depend on the
amount of substrate that is needed for the persistence of
the species that the measures are intended to conserve. The
main reason for this is that several conservation measures
do not increase CWD enough to increase the number of
species above certain thresholds. In central and northern
Sweden, for example, retention of snags and creation of a
few high stumps are cost-effective measures when no or
low thresholds are considered, but at high thresholds they
give no increase in the number of species above the thresh-
olds. Instead, measures resulting in a larger amount of
CWD, such as retention of living trees at harvest and setting
aside whole stands as reserves become relatively more cost-
effective alternatives. This pinpoints the risk that the current
conservation strategy in Fennoscandia to spread conservation
measures thinly, but evenly over themanaged forest area may
be inefficient because it produces too little substrate to pre-
serve more demanding red-listed species (Hanski, 2000).
As little is known about the relationship between amount
of substrate and extinction risks of saproxylic species it is
difficult to say which of our estimates of conservation value
is the most appropriate. However, certain patterns of cost-
effectiveness are common for many of the estimates. In all
regions, creation of high stumps and retention of snags were
among the most cost-effective measures, except at high
extinction thresholds in central and northern Sweden,
where they gave a too small an increase in substrate to

456 B I O L O G I C A L C O N S E R VAT I O N 1 2 7 ( 2 0 0 6 ) 4 4 3 –4 6 2
increase the number of species above the thresholds. We
have only analyzed these measures taken singly but if they
are combined with other measures they may contribute also
to persistence of species with higher thresholds. We there-
Southe
-0.8
-0.7
-0.6
-0.5
-0.4
-0.3
-0.2
-0.1
0
0.1
0.2
Centra
-0.8
-0.7
-0.6
-0.5
-0.4
-0.3
-0.2
-0.1
0
0.1
0.2
Subs
Pro
po
rtio
n o
f C
WD
in m
anag
ed f
ore
st
min
us
pro
po
rtio
n o
f C
WD
in u
nm
anag
ed
fore
st
Pro
po
rtio
n o
f C
WD
in m
anag
ed f
ore
st
min
us
pro
po
rtio
n o
f C
WD
in u
nm
anag
ed
fore
st
Standing Large-sized Slow grow
Subs
Standing Large-sized Slow grow
Fig. 4 – Deviation between the proportion of CWD of different su
proportion of substrate in the same qualities in unmanaged for
(small-sized = 10–30 cm, large-sized = >30 cm; slow grown = cate
stages 1–4, late decay = stages 5–8; sun-exposed = categories 1–
shown for one of them. For light regime, the proportions are co
sun-exposed (large scaled disturbance regime) and one shady (
comparisons are with average proportions of the two forest typ
Kronoberg), central (county of Gavleborg) and northern Sweden
fore suggest that a cost-effective management program
within a managed forest to preserve saproxylic diversity
should include retention of snags and creation of high
stumps. Creation of high stumps should be conducted at a
rn Sweden
Reference case
Retention of area 9%
High stumps 20
Manual scarification
Retention of snags
Rotation +50%
20m3 fall, 20m
3 retain
l Sweden
trate quality
Reference case
Retention of area 9%
High stumps 20
Manual scarification
Retention of snags
Rotation +50%
20m3 fall, 20m
3 retain
ing Late decay Shady (shady forest)
Sun-exposed(sunny forest)
trate quality
ing Late decay Shady (shady forest)
Sun-exposed(sunny forest)
bstrate qualities at various management scenarios and the
ests. All variables are divided into two categories
gories 1–2, fast growing = categories 3–4; early decay =
2, shady = categories 3–4) with the deviation in proportions
mpared with two types of unmanaged forests: one more
small scaled disturbance regime). For the other measures
es. The stands were situated in southern (county of
(county of Vasterbotten).

Northern Sweden
-0.6
-0.5
-0.4
-0.3
-0.2
-0.1
0
0.1
0.2
Substrate quality
Pro
po
rtio
n o
f C
WD
in m
anag
ed f
ore
st
min
us
pro
po
rtio
n o
f C
WD
in u
nm
anag
ed
fore
st Reference case
Retention of area 9%
High stumps 20
Manual scarification
Retention of snags
Rotation +50%
20m3
fall, 20m3
retain
Standing Large-sized Slow growing Late decay Shady(shady forest)
Sun-exposed(sunny forest)
Fig. 4 – continued
B I O L O G I C A L C O N S E R VAT I O N 1 2 7 ( 2 0 0 6 ) 4 4 3 –4 6 2 457
high intensity (Ranius et al., 2005), however creation of more
than 20 high stumps/ha may entail new costs as accessibil-
ity for forest machines may decrease.
At occasions with high tree mortality it is cost-effective to
retain trees that have fallen, particularly in central and north-
ern Sweden, where such a measure even entails a small ben-
efit (Ranius et al., 2005). According to our calculations it would
be most cost-effective to retain as many as possible of the
trees that have fallen. However, we have not taken into ac-
count any cost associated with increased risks of attacks by
bark beetles, mainly Ips typographus (L.), that develop in newly
dead spruce trees. For volumes of newly formed conifer CWD
up to 5 m3/ha the risk of bark beetle attack is not expected to
increase much (Hedgren et al., 2003), but no studies have been
conducted using higher volumes of CWD. Thus, we do not
know to what extent our conclusion that retention of newly
formed CWD after occasions of high natural mortality is
cost-effective is valid when more than 5 m3/ha of conifer
CWD is left in the forest.
In managed forests large diameter trees are rare (Siito-
nen, 2001), CWD from slow grown trees are virtually absent
(Ehnstrom, 2001), and a somewhat lower proportion of the
CWD belongs to late decay stages in managed forests com-
pared with in unmanaged ones. Thus, species specialised
on these types of substrate will be particularly vulnerable
in managed forests, and may need special efforts to avoid
extinction. Some of the conservation measures that were
analyzed increased the proportion of these substrate types.
Manual soil scarification increased CWD in late decay stages
and retention of living trees at harvest slightly increased
the proportion of large diameter CWD and gave more slow
grown trees in northern Sweden. Consequently, these mea-
sures should be included in a management program that
aims to preserve species associated with substrates that
are particularly rare in managed forests. Another measure
increasing the amount of otherwise scarce substrate types
is prolongation of the rotation period. This measure in-
creased the amount of large diameter CWD, particularly in
southern Sweden, and it also increased the amount of
slow-growing CWD in northern Sweden. In addition, prolon-
gation of the rotation period will benefit species requiring a
shady environment. Thus, our study supports the view that
increased rotation will benefit species associated with late
successional stages that may find little substrate in
managed forests (Martikainen et al., 2000). However, in
all regions creation of reserves was a more cost-
effective measure than increasing the rotation period. Thus
preservation of species associated with late successional
stages is probably more cost-effectively performed within
reserves.
Our study revealed significant differences in cost-effec-
tiveness among conservation measures between geographic
regions. The cost of setting aside reserves is rather low in
northern Sweden, mainly because low productivity makes
land inexpensive. Therefore, setting aside stands as reserves
is a cost-effective measure in this region. This is also reflected
in the current distribution of protected forestland in Sweden,
which is skewed towards Norway spruce forests in north-
western Sweden (Fridman, 2000). In central and southern
Sweden on the other hand, productivity and thus also land
prices are higher, which makes setting aside reserves a more
costly alternative. It is worth noting however, that here we
predict the amount of CWD present in forests that have been
managed in the same way for a long time, and we do not take
into account any transition states between management re-
gimes, for volume and quality of CWD. For most of the mea-
sures taken within managed forests this time period will be
rather short, whereas transition from a mature managed

Southern Sweden
-50
0
50
100
150
200
250
300
350
400
450
Ret
entio
n of
are
a 1%
Ret
entio
n of
are
a 5%
Ret
entio
n of
are
a 9%
Hig
h st
umps
3
Hig
h st
umps
10
Hig
h st
umps
20
Man
ual s
carif
icat
ion
Ret
entio
n of
sna
gs
Rot
atio
n +
10%
Rot
atio
n +
25%
Rot
atio
n +
50%
Res
erve
, sun
expo
sed
Res
erve
, sha
dy
20m
3 fall,
1m
3 ret
ain
20m
3 fall,
20m
3 ret
ain
5m3 fa
ll, 1
m3 r
etai
n
5m3 fa
ll, 5
m3 r
etai
n
Conservation measure
Co
st (
SE
K)
/ in
crea
se in
co
nse
rvat
ion
val
ue
(%)
com
par
ed w
ith
refe
ren
ce c
ase
CWD volume
Substrate index
Treshold 10%
Treshold 30%
----
--N
o in
crea
se
----
--N
o in
crea
se
----
--N
o in
crea
se
----
--N
o in
crea
se
Fig. 5 – Inverted cost-effectiveness of different measures to increase the amount of substrate for red-listed saproxylic species
in Sweden. Cost (i.e. decrease in present value at the time of decision, SEK/ha, assuming a discount rate of 3%) divided by the
increase in the volume of CWD, substrate index or the number of species with more substrate than different threshold levels.
Measures marked with ‘‘No increase’’ did not lead to any increase in that particular variable. The stands were situated in
southern (county of Kronoberg), central (county of Gavleborg) and northern Sweden (county of Vasterbotten).
458 B I O L O G I C A L C O N S E R VAT I O N 1 2 7 ( 2 0 0 6 ) 4 4 3 –4 6 2
forest to an unmanaged forest will take a considerably longer
time as long as CWD is not actively generated in them, which
would generate costs we have not taken into consideration.
This tends to generate an overestimate of the cost-effective-
ness of setting aside forest stands as reserves compared with
the other measures. The selection of stands to set aside as re-
serves is important for cost-effectiveness (Juutinen et al.,
2004; Juutinen and Monkkonen, 2004); to choose stands that
already host populations of red-listed species (Huxel and Has-
tings, 1999) or are located close enough to such populations to
allow colonisation will make it more effective. In contrast,
there are small possibilities to apply conservation measures
close to red-listed species when the conservation measures
comprise changes in silvicultural measures that are supposed
to be applied at a similar intensity throughout the forest land,
as they are in Sweden in Finland. Because we do not take the
spatial distribution of red-listed species into account in this
study, we will tend to underestimate the cost-effectiveness
of setting aside forest stands as reserves compared with the
other measures.
4.2. Conclusions and limitations of the study
Our study shows that a conservation strategy based on a few
standard rules applied in the same way over all Swedish
managed forests is ineffective from an economic point of
view. To be cost-effective, the focus should be on different
types of conservation measures in different parts of Sweden.
In northern Sweden it is more cost-effective to concentrate
on setting aside forest instead of biodiversity-oriented forest
management, whereas in central and southern Sweden
measures to preserve biodiversity within production stands
Central Sweden
-10
10
30
50
70
90
110
130
Conservation measure
Co
st (
SE
K)
/ in
crea
se in
co
nse
rvat
ion
val
ue
(%)
com
par
ed w
ith
re
fere
nce
cas
eCWD volume
Substrate index
Treshold 10%
Treshold 30%--
----
-N
o in
crea
se
----
No
incr
ease
----
No
incr
ease
----
No
incr
ease
----
---
----
----
---N
o in
crea
se
----
----
No
incr
ease
Ret
entio
n of
are
a 1%
Ret
entio
n of
are
a 5%
Ret
entio
n of
are
a 9%
Hig
h st
umps
3
Hig
h st
umps
10
Hig
h st
umps
20
Man
ual s
carif
icat
ion
Ret
entio
n of
sna
gs
Rot
atio
n +
10%
Rot
atio
n +
25%
Rot
atio
n +
50%
Res
erve
, sun
expo
sed
Res
erve
, sha
dy
20m
3 fall,
1m3 r
etai
n
20m
3 fall,
20m
3 ret
ain
5m3 fa
ll,1m
3 ret
ain
5m3 fa
ll, 5
m3 r
etai
n
Fig. 5 – continued
B I O L O G I C A L C O N S E R VAT I O N 1 2 7 ( 2 0 0 6 ) 4 4 3 –4 6 2 459
are cost-effective alternatives. When applied, the recom-
mendations by FSC can also be made more cost-effective.
Above all, creation of around 3 high stumps/ha, which is
now the norm in forest certified by FSC, is too little (Ranius
et al., 2005). This is a cost-effective measure that could be
applied at a much higher intensity than today. Retention of
newly dead CWD after occasions of high tree mortality is an-
other measure that could be applied to a larger extent than
prescribed by FSC today (Ranius et al., 2005). Manual soil
scarification and retention of living trees at harvest are also
relevant measures because they increase the amount of cer-
tain substrate types that are underrepresented in managed
forests.
We have only analyzed one forest stand typical for each
region. In a real forest landscape, there may be a large
variability between stands for factors influencing cost-effec-
tiveness, e.g. tree species composition, site index and dis-
tance to the forest road. Therefore, conservation strategies
in forest landscapes may need a small-scale, site-specific
approach where varying measures are applied in different
stands.
The quality of the output from models always relies on
the quality of the input data. Little or no quantitative data
exists for some parameters that are used in our models,
e.g. degree of sun-exposure at different forest ages and geo-
graphic locations, natural mortality in relation to forest
management and duration of snags. This will affect the reli-
ability of our results. However, we consider the limited
knowledge about the demands of the red-listed species as
the main source of uncertainty in the present study. Present
knowledge is still mainly based on the experience of experts
and only to a minor degree on quantitative data. There is,
for example, virtually no quantitative data available on spe-
cies preferences for dead wood resulting from trees with dif-
ferent growth rates. Furthermore, we here assume that the
substrate preferences for each species are the same between
regions although in reality they may differ geographically.
Our conclusions concerning cost-effectiveness depend on
our assumptions about the level of the extinction thresholds
for which no empirical data are available. The spatial scale
at which thresholds occur is also important. We assume
here that extinction thresholds are operating at a large scale

Northern Sweden
-15
-5
5
15
25
35
45
Ret
entio
n of
are
a 1%
Ret
entio
n of
are
a 5%
Ret
entio
n of
are
a 9%
Hig
h st
umps
3
Hig
h st
umps
10
Hig
h st
umps
20
Man
ual s
carif
icat
ion
Ret
entio
n of
sna
gs
Rot
atio
n +
10%
Rot
atio
n +
25%
Rot
atio
n +
50%
Res
erve
, sun
expo
sed
Res
erve
, sha
dy
20m
3 fall,
1m
3 ret
ain
20m
3 fall,
20m
3 ret
ain
5m3 fa
ll, 1
m3 r
etai
n
5m3 fa
ll, 5
m3 r
etai
n
Conservation measure
Co
st (
SE
K)
/ in
crea
se in
co
nse
rvat
ion
val
ue
(%)
com
par
ed w
ith
refe
ren
ce c
ase
CWD volume
Substrate index
Treshold 10%
Treshold 30%
----
--N
o in
crea
se
----
--N
o in
crea
se
----
--N
o in
crea
se
----
--N
o in
crea
se
----
--N
o in
crea
se
----
--N
o in
crea
se
Fig. 5 – continued
460 B I O L O G I C A L C O N S E R VAT I O N 1 2 7 ( 2 0 0 6 ) 4 4 3 –4 6 2
where several forest stands in different ages are present.
Only then do our average values of substrate amounts for
whole rotation periods make any sense. If thresholds are
operating at a smaller scale, the temporal variation in
CWD amounts must be considered.
Acknowledgements
Support for this project came from the project ‘‘Cost-effi-
ciency of a biodiversity-oriented forestry’’ financed by The
Swedish Research Council for Environment, Agricultural Sci-
ences and Spatial Planning (FORMAS), by the Oscar and Lili
LammMemorial Foundation, and from the project ‘‘Conserva-
tion of Biodiversity in Managed Forests’’ financed by the Fac-
ulty of Forestry at the Swedish University of Agricultural
Sciences (SLU). Tomas Hallingback, Goran Thor, Karl-Henrik
Larsson, Malte Edman, and Oskar Kindvall are thanked for
invaluable help with the database for red-listed species. Bar-
bara Ekbom and two anonymous reviewers provided valuable
comments on the manuscript.
R E F E R E N C E S
Anon., 1988. Bestandsmetoden for skogsvardering. Rapport 1988:1–3, National Land Survey of Sweden, Gavle, Sweden (inSwedish).
Anon., 1999. Miljokvalitetsmal 8: Levande skogar. National Boardof Forestry, Jonkoping, Sweden (in Swedish).
Anon., 2000. Svensk FSC-standard for certifiering av skogsbruk.Svenska FSC-radet, Uppsala, Sweden (in Swedish).
Anon., 2001. Regeringens proposition 2000/01:130. Svenskamiljomal – delmal och atgardsstrategier. MiljodepartementetStockholm, Sweden (in Swedish).
Bader, P., Jansson, S., Jonsson, B.G., 1995. Wood-inhabiting fungiand substratum decline in selectively logged boreal spruceforests. Biological Conservation 72, 355–362.
Balmford, A., Bruner, A., Cooper, P., Costanza, R., Farber, S., Green,R.E., Jenkins, M., Jefferiss, P., Jessamy, V., Madden, J., Munro, K.,Myers, N., Naeem, S., Paavola, J., Rayment, M., Rosendo, S.,

B I O L O G I C A L C O N S E R VAT I O N 1 2 7 ( 2 0 0 6 ) 4 4 3 –4 6 2 461
Roughgarden, Trumper, K., Turner, K., 2002. Economic reasonsfor conserving wild nature. Science 297, 950–953.
Bascompte, J., Sole, R.V., 1996. Habitat fragmentation and extinctionthresholds in spatially explicit models. Journal of AnimalEcology 65, 465–473.
Berg, A., Ehnstrom, B., Gustafsson, L., Hallingback, T., Jonsell, M.,Weslien, J., 1994. Threatened plant, animal and fungus speciesin Swedish forests: distribution and habitat associations.Conservation Biology 8, 718–731.
Carlen, O., Mattsson, L., Atlegrim, O., Sjoberg, K., 1999. Costefficiency in pursuing environmental objectives in forestry.Journal of Environmental Management 55, 111–125.
Dahlberg, A., Stokland, J.N., 2004. Vedlevande arters krav pasubstrat. RapportNo. 7. Skogsstyrelsen, Jonkoping (in Swedish).
Ehnstrom, B., 2001. Leaving dead wood for insects in borealforests – suggestions for the future. Scandinavian Journal ofForest Research (Suppl. 3), 91–98.
Ekvall, H., 2001. Plan 33 – Ett verktyg for ekonomisk analys avskogsbruksforetagets virkesproduktion. Licentiate thesisReport No. 123, Dept. of Forest Economics, Swedish Universityof Agricultural Sciences, Umea (in Swedish, English abstract).
Esseen, P.A., 1994. Tree mortality patterns after experimentalfragmentation of an old-growth conifer forest. BiologicalConservation 68, 19–28.
Fahrig, L., 2001. How much habitat is enough? BiologicalConservation 100, 65–74.
Fridman, J., 2000. Conservation of forest in Sweden: a strategicecological analysis. Biological Conservation 96, 95–103.
Fridman, J., Walheim, M., 2000. Amount, structure and dynamicsof dead wood on managed forestland in Sweden. ForestEcology and Management 131, 23–26.
Gardenfors, U. (Ed.), 2000. The 2000 Red-List of Swedish Species.Artdatabanken, Swedish University of Agricultural Sciences,Uppsala.
Grove, S.J., 2002. Saproxylic insect ecology and the sustainablemanagement of forests. Annual Review of Ecology andSystematics 33, 1–23.
Hanski, I., 2000. Extinction debt and species credit in boreal forests:modelling the consequences of different approaches tobiodiversity conservation.Annales Zoologici Fennici 37, 271–280.
Hanski, I., Hammond, P., 1995. Biodiversity in boreal forests.Trends in Ecology and Evolution 10, 5–6.
Hautala, H., Jalonen, J., Laaka-Lindberg, S., Vanha-Majamaa, I.,2004. Impacts of retention felling on coarse woody debris(CWD) in mature boreal spruce forests in Finland. Biodiversityand Conservation 13, 1541–1554.
Hedgren, P.O., Schroeder, L.M., Weslien, J., 2003. Tree killing by Ipstypographus (Coleoptera: Scolytidae) at stand edges with andwithout colonized felled spruce trees. Agricultural and ForestEntomology 5, 67–74.
Huxel, G.R., Hastings, A., 1999. Habitat loss, fragmentation, andrestoration. Restoration Ecology 7, 309–315.
IUCN, 2001. 2001 IUCN Red List Categories and Criteria version 3.1.IUCN Species Survival Commission. IUCN, Gland, Switzerland,Cambridge, UK.
Jonsell, M., Weslien, J., 2003. Felled or standing retained wood – itmakes a difference for saproxylic beetles. Forest Ecology andManagement 175, 425–435.
Jonsell, M., Weslien, J., Ehnstrom, B., 1998. Substrate requirementsof red-listed saproxylic invertebrates in Sweden. Biodiversityand Conservation 7, 749–764.
Jonsell, M., Nitterus, K., Stighall, K., 2004. Saproxylic beetles innatural and man-made deciduous high stumps retained forconservation. Biological Conservation 118, 163–173.
Juutinen, A., Monkkonen, M., 2004. Testing alternativeindicators for biodiversity conservation in old-growthboreal forests: ecology and economics. EcologicalEconomics 50, 35–48.
Juutinen, A., Mantymaa, E., Monkkonen, M., Salmi, J., 2004. Acost-efficient approach to selecting forest stands forconserving species: a case study from northern Fennoscandia.Forest Science 50, 527–539.
Krankina, O.N., Harmon, M.E., 1995. Dynamics of the dead woodcarbon pool in north western Russian boreal forests. Water,Air and Soil Pollution 82, 227–238.
Kruys, N., Wikstrom, P., 2001. Optimising uneven-aged manage-ment for economic efficiency and occurrence of wood-inhabiting species. In: Kruys, N., Bryophytes and Fungi onDead Spruce: Integrating Conservation with Forest Planning.Dissertation, Department of Ecology and EnvironmentalScience, Umea University, Umea.
Kurttila, M., Pukkala, T., 2003. Combining holding-level economicgoals with spatial landscape-level goals in the planning ofmultiple ownership forestry. Landscape Ecology 18, 529–541.
Lande, R., 1987. Extinction thresholds in demographic models ofterritorial populations. American Naturalist 130, 624–635.
Larsson, S., Danell, K., 2001. Science and the management ofboreal forest biodiversity. Scandinavian Journal of ForestResearch (Suppl. 3), 5–9.
Lindenmayer, D.B., Franklin, J.F., 2002. Conserving ForestBiodiversity. A Comprehensive Multiscaled Approach. Islandpress, Washington.
Lindhe, A., Lindelow, A., 2004. Cut high stumps of spruce, birch,aspen and oak as breeding substrates for saproxylic beetles.Forest Ecology and Management 203, 1–20.
Lindhe, A., Asenblad, N., Toresson, H.-G., 2004. Cut logs and highstumps of spruce, birch, aspen and oak – nineyears of saproxylicfungi succession. Biological Conservation 119, 443–454.
Lohmus, P., Lohmus, A., 2001. Snags, and their lichen flora in oldEstonian peatland forests. Annales Botanici Fennici 38,265–280.
Lundblad, I., 1998. Wood-inhabiting fungi on fallen logs of Norwayspruce: relations to forest management and substrate quality.Nordic Journal of Botany 18, 343–355.
Martikainen, P., 2001. Conservation of threatened saproxylicbeetles: significance of retained aspen Populus tremula onclearcut areas. Ecological Bulletins 49, 205–218.
Martikainen, P., Siitonen, J., Punttila, P., Kaila, L., Rauh, J., 2000.Species richness of Coleoptera in mature managed andold-growth boreal forests in southern Finland. BiologicalConservation 94, 199–209.
Norden, B., Ryberg, M., Gotmark, F., Olausson, B., 2004. Relativeimportance of coarse and fine woody debris for the diversity ofwood-inhabiting fungi in temperate broadleaf forests.Biological Conservation 117, 1–10.
Økland, B., Bakke, A., Hagvar, S., Kvamme, T., 1996. What factorsinfluence the diversity of saproxylic beetles? A multiscaledstudy from a spruce forest in southern Norway. Biodiversityand Conservation 5, 75–100.
Raivio, S., Normark, E., Pettersson, B., Salpakivi-Salomaa, P., 2001.Science and the management of boreal forest biodiversity – aforest industries� view. Scandinavian Journal of ForestResearch (Suppl. 3), 99–104.
Ranius, T., 2002. Influence of stand size and quality of treehollows on saproxylic beetles in Sweden. BiologicalConservation 103, 85–91.
Ranius, T., Jansson, N., 2000. The influence of forest regrowth,original canopy cover and tree size on saproxylic beetlesassociated with old oaks. Biological Conservation 95, 85–94.
Ranius, T., Kindvall, O., Kruys, N., Jonsson, B.G., 2003. Modellingdead wood in Norway spruce stands subject to differentmanagement regimes. Forest Ecology and Management 182,13–29.
Ranius, T., Jonsson, B.G., Kruys, N., 2004. Modelling dead wood inFennoscandian old-growth forests dominated by Norwayspruce. Canadian Journal of Forest Research 34, 1025–1034.
462 B I O L O G I C A L C O N S E R VAT I O N 1 2 7 ( 2 0 0 6 ) 4 4 3 –4 6 2
Ranius, T., Ekvall, H., Jonsson, M., Bostedt, G., 2005. Cost efficiencyof measures to increase the amount of coarse woody debrisin managed Norway spruce forests. Forest Ecology andManagement 206, 119–133.
Rassi, P., Mannerkoski, I., Peltonen, S.-L., Alanen, A., 2000. 2nd RedData Book of Finland. Ministry of Environment, Helsinki.
Schroeder, L.M., Lindelow, A., 2002. Attacks on living spruce treesby the bark beetle Ips typographus (Col.: Scolytidae) following astorm-felling: a comparison between stands with and withoutremoval of wind-felled trees. Agricultural and ForestEntomology 4, 47–56.
Siitonen, J., 2001. Forest management, coarse woody debris andsaproxylic organisms: Fennoscandian boreal forests as anexample. Ecological Bulletins 49, 11–41.
Simila, M., Kouki, J., Martikainen, P., 2003. Saproxylic beetles inmanaged and seminatural Scots pine forests: quality of deadwood matters. Forest Ecology and Management 174, 365–381.
Soderstrom, L., 1988. Sequence of bryophytes and lichens inrelation to substrate variables of decaying coniferous wood innorthern Sweden. Nordic Journal of Botany 8, 89–97.
Speight, M.C.D., 1989. Saproxylic Invertebrates and TheirConservation. Council of Europe, Strasbourg.
Stokland, J.N., Tomter, S., Soderberg, U., 2004. Development ofdead wood indicators for biodiversity monitoring: experiencesfrom Scandinavia. In: Marchetti, M. (Ed.), Proceedings of theIUFRO Conference on Monitoring and Indicators of ForestBiodiversity in Europe – From Ideas to Operationality. EFIProceedings 51, 207–226.
Storaunet, K.O., Rolstad, J., 2002. Time since death and fall ofNorway spruce logs in old-growth, selectively cut borealforest. Canadian Journal of Forest Research 32, 1801–1812.
Torlind, A., 1998. Markagares hantering av vindfallen I sambandmed slutavverkning. En studie i Norduppland. Department ofSilviculture, Swedish University of Agricultural Sciences,Umea (in Swedish, English summary).
Wikstrom, P., Eriksson, L.-O., 2000. Solving the stand managementproblem under biodiversity-related considerations. ForestEcology and Management 126, 361–376.
With, K.A., King, A.W., 1999. Extinction thresholds for species infractal landscapes. Conservation Biology 13, 314–326.


![Silvikültürel Uygulamalar. Silvicultural Practices. [In Turkish]](https://img.dokumen.tips/doc/110x75/631522465cba183dbf07dcca/silvikueltuerel-uygulamalar-silvicultural-practices-in-turkish.jpg)


