Embed Size (px)
Citation preview
325 South Lake Avenue, Suite 700 Duluth, MN 55802 218.529.8200 www.barr.com
Corrective Action Plan
MP 1102.5 Uncontrolled Flow
Prepared for Enbridge Energy
February 15, 2022 – Revision 3
P:\Duluth\49 WI\16\49161299 Line 3 Replacement Geotech Sur\WorkFiles\01_Uncontrolled Flow Assistance\04_CAP\MP1102.5\Rev 3\L3R_MP1102.5CAP_Rev3_2022-02-15 Final.docx i
Corrective Action Plan MP 1102.5 Uncontrolled Flow
February 15, 2022 – Revision 3
Contents 1 Introduction ........................................................................................................................................................................... 1
2 Assessment of Artesian Conditions .............................................................................................................................. 2
2.1 Monitoring Data and Hydrogeologic Conditions .............................................................................................. 2
2.2 Aquifer Test and Parameters ...................................................................................................................................... 4
2.3 Groundwater Modelling of Flow Resulting from Grouting ............................................................................ 4
3 Alternatives Analysis ........................................................................................................................................................... 8
4 Proposed Pressure/Permeation Grouting .................................................................................................................. 9
4.1 Installation of Caissons ................................................................................................................................................. 9
4.2 Temporary Dewatering Wells ..................................................................................................................................11
4.3 Dewatering/Grout Injection Wells..........................................................................................................................13
4.4 Grouting ...........................................................................................................................................................................15
4.5 Chemical Admixtures ..................................................................................................................................................17
5 Water Management ..........................................................................................................................................................20
5.1 Water Management Outside of the FDL Reservation ....................................................................................20
5.1.1 Water Management of Groundwater Expressions .....................................................................................20
5.1.2 Water Management from Dewatering Wells ...............................................................................................20
5.1.3 MPCA Water Quality Monitoring ......................................................................................................................21
5.2 Water Management within the FDL Reservation .............................................................................................24
5.2.1 Clean Water Discharge Location #1 (Within FDL Reservation) .............................................................24
5.2.2 FDL Water Quality Monitoring ...........................................................................................................................25
5.2.3 Hydraulic and Hydrologic Modeling ...............................................................................................................25
5.3 Water Management of Grout-Impacted Water ................................................................................................27
6 Wetland Monitoring .........................................................................................................................................................29
6.1 Monitoring Locations ..................................................................................................................................................29
6.2 Water Chemistry Sampling .......................................................................................................................................30
6.3 Vegetation Monitoring ...............................................................................................................................................31
7 Access to Site.......................................................................................................................................................................32
8 Schedule ................................................................................................................................................................................33
ii
9 Monitoring and Reporting .............................................................................................................................................34
List of Tables Table 1 Boring Construction ........................................................................................................................................... 3 Table 2 Vibrating Wire Piezometer Summary .......................................................................................................... 3 Table 3 Proposed Chemical Admixtures ................................................................................................................. 18 Table 4 Use of Master Builder Solutions Glenium 7500 in Minnesota ....................................................... 18 Table 5 Use of Master Builder Solutions MasterSure Z-60 in Minnesota .................................................. 19 Table 6 Minnesota State Water Quality Standards and Background Levels for Class 2D
Wetlands .............................................................................................................................................................. 22 Table 7 FDL Water Quality Sampling Plan Sampling Locations .................................................................... 25 Table 8 Resulting Water Surface Elevations (WSE) from Steady-State Model Runs ............................. 27 Table 9 Piezometer and Stilling Well Construction ............................................................................................ 30 Table 10 Water Quality Sampling Parameters for Wetland Piezometer and Stilling Well Station..... 31
List of Images Image 1 Pre-Construction Conditions .......................................................................................................................... 6 Image 2 Post Sealing Conditions .................................................................................................................................... 7
List of Photos Photo 1 Liebherr LB45 Caisson Drill Rig at MP 1102 .......................................................................................... 10
List of Plots Plot 1 Hydrograph USGS 04021520 Stoney Brook at Pine Drive Near Brookston, MN .................... 27
List of Figures Figure 1 Site Plan Figure 2 Proposed Well Locations Figure 3 Typical Well Construction Detail Figure 4 Typical Dewatering Structure Figure 5 Discharge Water Flow Paths and Sample Locations
iii
List of Appendices Appendix A MP1102.5 Groundwater Investigation Data Submittal Appendix B Alternatives Analysis Appendix C Caisson Installation Request Memorandum Appendix D Sampling and Analysis Plan to Assess Water Quality – Line 3 Replacement Project Seep at
Milepost 1102.5 Appendix E Water Quality Sampling Results Appendix F Barr SOP's Appendix G Safety Data Sheets for Proposed Chemical Additives Appendix H Grouting Distance Calculations
iv
Certification
I hereby certify that this plan, specification, or report was prepared by me or under my direct supervision and that I am duly Licensed Professional Engineer under the laws of the State of Minnesota.
February 15, 2022 Ray W. Wuolo Minnesota PE #: 19897
Date
February 15, 2022 Travis A. Davidsavor Minnesota PE #: 44919
Date
February 15, 2022 Steven E. Marshik Minnesota PE #: 22093
Date
1
1 Introduction This revised Corrective Action Plan (CAP) provides the proposed steps for sealing artesian flow that developed following installation of the pipeline at Milepost (MP) 1102.5 for the Line 3 Replacement Project (L3R or Project), and addresses comments received from the Fond du Lac Band of Lake Superior Chippewa (FDL), U.S. Army Corps of Engineers, Minnesota Department of Natural Resources (MDNR), Minnesota Pollution Control Agency (MPCA), Minnesota Department of Health (MDH) and St. Louis County with regard to the November 7, 2021 and January 29, 2022 versions of the CAP. This Work Plan was prepared at the request of Enbridge and is based on currently available data and current information on groundwater pressures, stratigraphy, prior construction sequences and procedures, available sealing technology, and uncontrolled flow locations and rates.
The area where the uncontrolled groundwater flow is occurring is located south of US Highway 2 and east of Minnesota Highway 73 in St. Louis County, Minnesota, approximately 400 feet west of the FDL Reservation Boundary. These tracts are managed by St. Louis County. The seeps are located within previously disturbed L3R construction workspace within a hardwood swamp/shrub-carr wetland complex (w-50n19w22-a) (Figure 1).
MP 1102.5 was a hydrostatic test break location; therefore, the final tie-in location remained open for several months until the hydrostatic test segments were completed, and the two segments could be tied-in (welded) and backfilled. Portions of the sheet piling through this area had been installed in the winter months of 2020 and 2021 and were left in place near access road (AR) 588 until September 14, 2021. The depth of the trench was approximately 7 to 8 feet deep to obtain the required depth of cover in wetland areas. The sheet piling near MP 1102.5 was installed to a depth of approximately 22 to 27 feet. The extents of the sheet piling that was installed for L3R construction and removed on September 14, 2021 are shown in Figure 1.
Flows from the seeps are presently managed by diverting water to a constructed temporary rock-lined swale within the construction workspace and are presently being calculated by measuring the height of discharge over a weir using an electronic weir monitor (Geokon Model 4675LV). A weir box was installed on September 26, 2021 and the measured flow was approximately 270 gallons per minute (gpm) and flow since installation has been steadily declining. Enbridge has been reporting discharge quantities regularly to the MDNR since September 2021. The fluctuation in the flow has been attributed to the currently installed test borings. Approximately 125 million gallons of water were estimated to have been discharged from the seeps and the dewatering wells between September 10, 2021, and February 6, 2022.
2
2 Assessment of Artesian Conditions In the immediate vicinity of the backfilled excavation, the subsurface conditions are estimated by recent geotechnical investigation data to include the following:
• Approximate depth to top of confined aquifer: 30 to 39 feet
• General soil type above the confined layer: variable glacial deposits – sand, sandy clay, and silty sand with cobbles and boulders.
• Approximate depth below ground surface to the bottom of the confined aquifer: 34 to 77 feet
• General soil type of the confining layer: sandy silt, silty sand, and silt
• General soil type of the confined aquifer: poorly graded gravel with sand and cobbles
• Ground surface elevation: 1321 to 1338.9 feet
• Elevation of shallow groundwater: not encountered prior to mud rotary drilling methods
• Typical hydraulic head elevation of pressurized groundwater (i.e., the confined aquifer): to 1338.5 1343.5 feet
• Maximum encountered head above ground surface of the confined aquifer: 18 feet (estimated)
• Estimated depth of the excavation during construction: 8 feet
• Estimated depth of temporary construction sheet piling (now removed): 22 to 27 feet
Barr Engineering (Barr), a contractor to Enbridge, understands that the excavation was backfilled with native material that was removed during the initial excavation of the trench.
The working hypothesis of how uncontrolled surface flow developed is that the sheet pile that was used to stabilize the excavation during construction was installed and removed using vibratory hammers that reduced the strength of the confining layer. Vibration of the sheet piling (particular during removal) may have resulted in localized liquification of the native silts and fine sands that make up the confining layer, thus reducing its strength and ability to confine the pressurized groundwater below. Upward hydraulic pressure from the confined aquifer likely resulted in upward flow through the confining layer along the line of penetration and onto the ground surface in some locations.
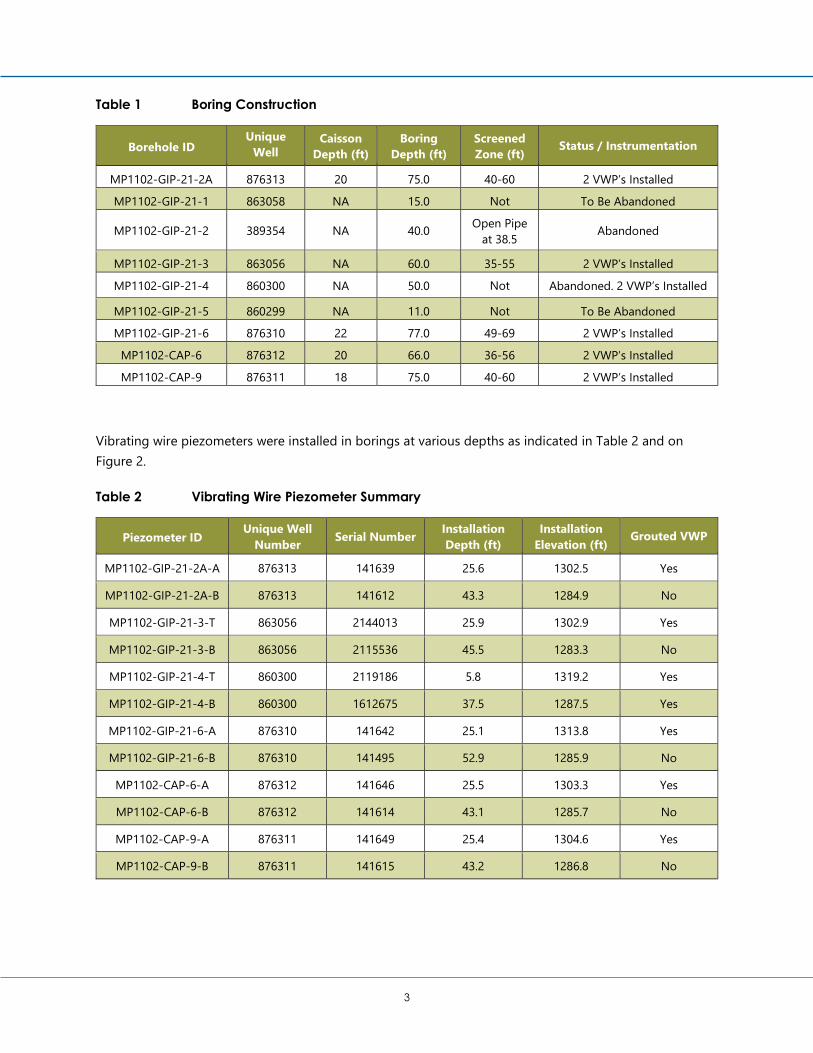
2.1 Monitoring Data and Hydrogeologic Conditions Table 1 summarizes the installation of all borings installed at the site as authorized under the GIP, their current status and whether instrumentation has been installed. Caissons were not used for the installation of MP1102-GIP-21-1, MP1102-GIP-21-2, MP1102-GIP-21-3, MP1102-GIP-21-4, and MP1102-GIP-21-5. The locations of these borings are shown in Figure 1. Boring logs for all completed wells are included in Appendix A.
3
Table 1 Boring Construction
Borehole ID Unique
Well
Caisson Depth (ft)
Boring Depth (ft)
Screened Zone (ft)
Status / Instrumentation
MP1102-GIP-21-2A 876313 20 75.0 40-60 2 VWP’s Installed
MP1102-GIP-21-1 863058 NA 15.0 Not
To Be Abandoned
MP1102-GIP-21-2 389354 NA 40.0 Open Pipe at 38.5
Abandoned
MP1102-GIP-21-3 863056 NA 60.0 35-55 2 VWP’s Installed
MP1102-GIP-21-4 860300 NA 50.0 Not
Abandoned. 2 VWP’s Installed
MP1102-GIP-21-5 860299 NA 11.0 Not
To Be Abandoned
MP1102-GIP-21-6 876310 22 77.0 49-69 2 VWP’s Installed
MP1102-CAP-6 876312 20 66.0 36-56 2 VWP’s Installed
MP1102-CAP-9 876311 18 75.0 40-60 2 VWP’s Installed
Vibrating wire piezometers were installed in borings at various depths as indicated in Table 2 and on Figure 2.
Table 2 Vibrating Wire Piezometer Summary
Piezometer ID Unique Well
Number Serial Number Installation Depth (ft)
Installation Elevation (ft)
Grouted VWP
MP1102-GIP-21-2A-A 876313 141639 25.6 1302.5 Yes
MP1102-GIP-21-2A-B 876313 141612 43.3 1284.9 No
MP1102-GIP-21-3-T 863056 2144013 25.9 1302.9 Yes
MP1102-GIP-21-3-B 863056 2115536 45.5 1283.3 No
MP1102-GIP-21-4-T 860300 2119186 5.8 1319.2 Yes
MP1102-GIP-21-4-B 860300 1612675 37.5 1287.5 Yes
MP1102-GIP-21-6-A 876310 141642 25.1 1313.8 Yes
MP1102-GIP-21-6-B 876310 141495 52.9 1285.9 No
MP1102-CAP-6-A 876312 141646 25.5 1303.3 Yes
MP1102-CAP-6-B 876312 141614 43.1 1285.7 No
MP1102-CAP-9-A 876311 141649 25.4 1304.6 Yes
MP1102-CAP-9-B 876311 141615 43.2 1286.8 No
4
2.2 Aquifer Test and Parameters The MDNR requested that an aquifer test (a.k.a. “pumping test”) be completed at the site to obtain an estimate of the aquifer’s transmissivity and storage as well as to determine the general flow direction in the aquifer. Enbridge conducted this pump test in accordance with Enbridge’s MP1102.5 Aquifer Test Plan memo (Rev 1, January 14, 2022) approved by the MDNR on January 14, 2022.
The aquifer test was completed on January 14-16, 2022 and is described in more detail in Enbridge’s January 24, 2022 Caisson Installation Request Memo (Rev 3), which was approved by the agencies on January 24, 2022 (Appendix C). Barr completed the analysis of the aquifer test to calculate a range of values for transmissivity, storage, and general groundwater flow. Overall, transmissivity was estimated to be approximately 1,500 square feet/day (ft2/d), with a range of 1,450 to 3,000 ft2/d. Storage was estimated to be approximately 1.2x10⁻⁴, with a range of 5.1x10⁻⁶ to 1.4x10⁻³. Assuming a representative saturated thickness of approximately 10 feet for the confined aquifer, the estimated horizontal hydraulic conductivity of the confined aquifer is 150 ft/day, which is consistent with a highly permeable sand and gravel unit.
Groundwater flow direction based on maximum water levels during the recovery period of the test is south-southeast.
2.3 Groundwater Modelling of Flow Resulting from Grouting A steady-state groundwater flow model was constructed for this CAP using the USGS code MODFLOW for the purpose of evaluating the relative change in groundwater heads and groundwater flow paths that may result from the proposed grouting activities. The primary purpose of the modeling was to predict how the groundwater flow field (groundwater flow direction and rates) in the confined aquifer will be affected by the installation of grout, as currently proposed, in comparison to pre-pipeline construction flow conditions.
As described in Section 2.2, an aquifer test was performed in January 2022 to obtain aquifer parameters for the artesian confined aquifer and the results of that test were analyzed using the software AQTESOLV. The aquifer parameters were used as inputs to the steady-state groundwater flow model. A hydraulic gradient was simulated across the site by approximating a groundwater divide corresponding to the ground-surface high (watershed divide) to the northwest of the site. The ground-surface high was delineated from the 1-meter digital elevation maps (DEM) for St. Louis and Carlton Counties. Downgradient (southeast) of the site, discharge zones were simulated by representing the streams and rivers and their approximate stage. Stream hydrography was obtained from the MDNR’s GIS coverages for St. Louis and Carlton Counties. Stream stage was estimated from the 1-meter DEM. The upgradient boundary conditions were simulated as a line of constant head cells with an elevation approximately equal to the ground surface along the northeast-southwest trending topographic high, which is approximately perpendicular to streams north and south of the area of interest. Some very modest changes to the upgradient boundary condition were made to approximately calibrate the simulated head to the heads observed in the piezometers at the site. A value of 50 m/day (approximately 150 ft/day) was assumed for the horizontal hydraulic conductivity of the aquifer, with a base and top elevation uniform
5
across the model domain to represent approximately 3.5 meters of aquifer thickness. The resulting model simulated artesian conditions over large areas of the model domain. The model domain is an area of approximately 82 km2. The MODFLO grid is oriented approximately 45-degrees clockwise. The maximum grid cell size (along the periphery of the model) is 100 x 100 meters. Grid cells in the vicinity of the proposed grouting are 1.56 x 1.56 meters in order to increase the computational resolution in the area of interest.
The particle tracking code MODPATH was used to simulate groundwater flow paths under steady-state flow conditions. Forward particle tracking was used with a line of particles perpendicular to the direction of groundwater flow, released upgradient of the area of interest.
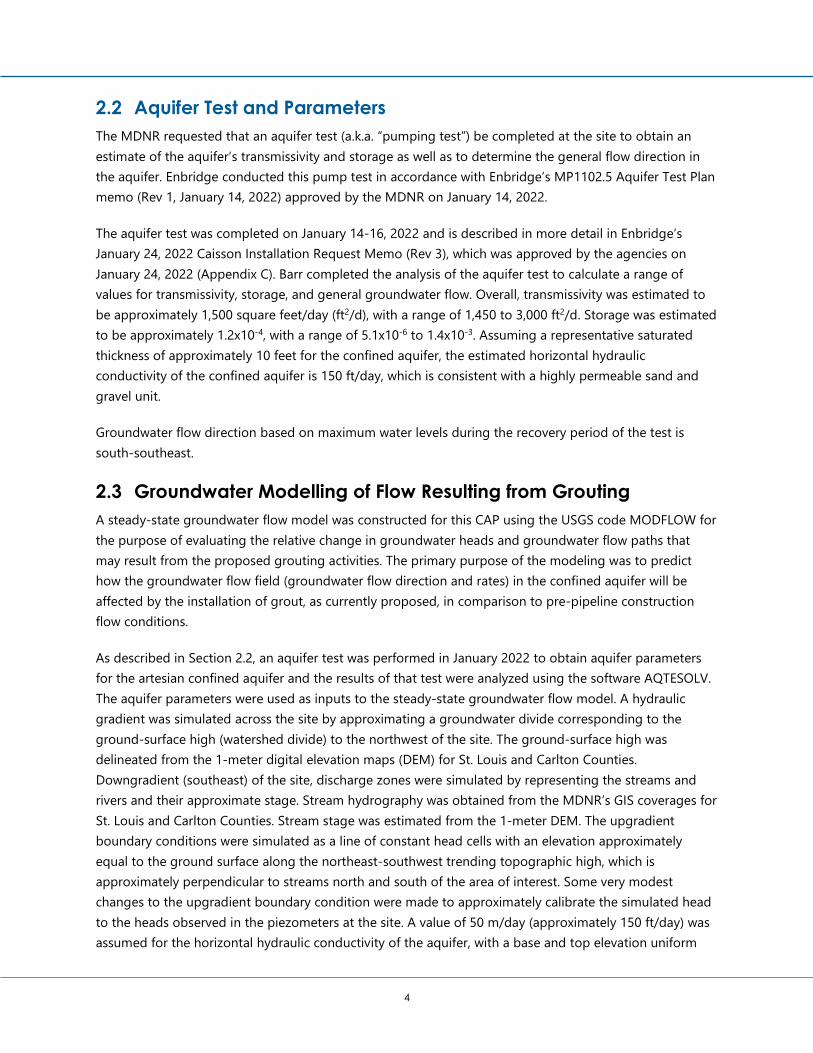
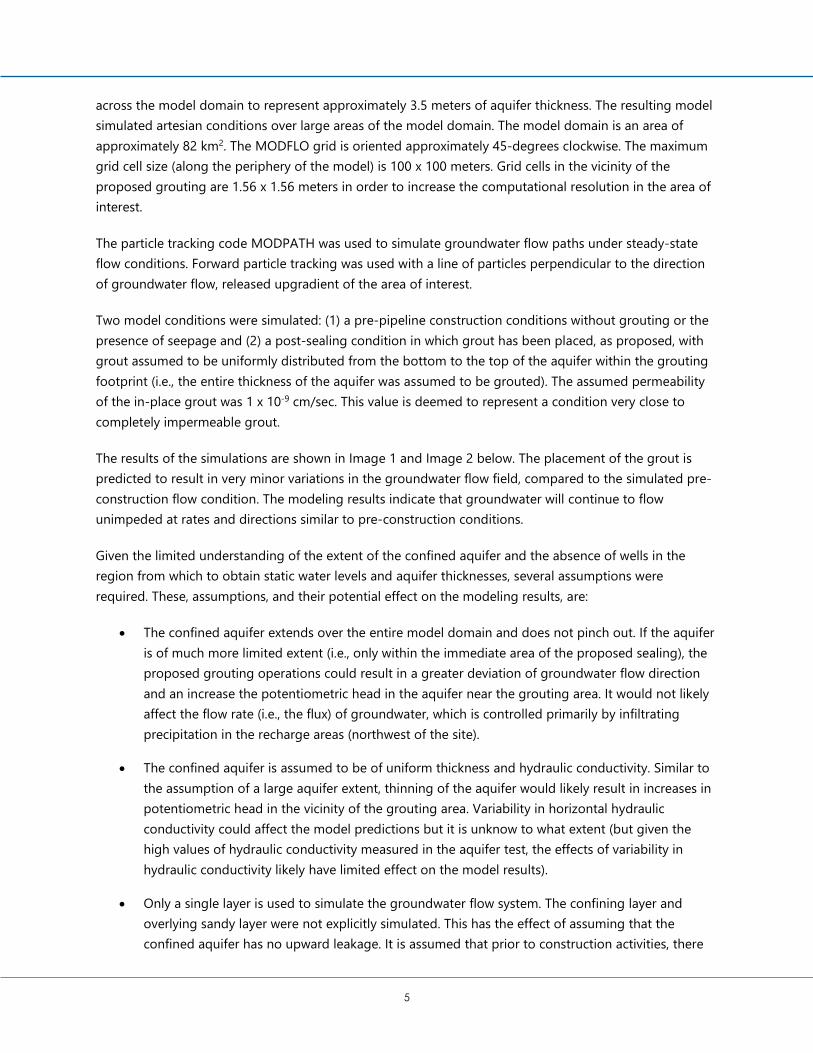
Two model conditions were simulated: (1) a pre-pipeline construction conditions without grouting or the presence of seepage and (2) a post-sealing condition in which grout has been placed, as proposed, with grout assumed to be uniformly distributed from the bottom to the top of the aquifer within the grouting footprint (i.e., the entire thickness of the aquifer was assumed to be grouted). The assumed permeability of the in-place grout was 1 x 10⁻⁹ cm/sec. This value is deemed to represent a condition very close to completely impermeable grout.
The results of the simulations are shown in Image 1 and Image 2 below. The placement of the grout is predicted to result in very minor variations in the groundwater flow field, compared to the simulated pre-construction flow condition. The modeling results indicate that groundwater will continue to flow unimpeded at rates and directions similar to pre-construction conditions.
Given the limited understanding of the extent of the confined aquifer and the absence of wells in the region from which to obtain static water levels and aquifer thicknesses, several assumptions were required. These, assumptions, and their potential effect on the modeling results, are:
• The confined aquifer extends over the entire model domain and does not pinch out. If the aquifer is of much more limited extent (i.e., only within the immediate area of the proposed sealing), the proposed grouting operations could result in a greater deviation of groundwater flow direction and an increase the potentiometric head in the aquifer near the grouting area. It would not likely affect the flow rate (i.e., the flux) of groundwater, which is controlled primarily by infiltrating precipitation in the recharge areas (northwest of the site).
• The confined aquifer is assumed to be of uniform thickness and hydraulic conductivity. Similar to the assumption of a large aquifer extent, thinning of the aquifer would likely result in increases in potentiometric head in the vicinity of the grouting area. Variability in horizontal hydraulic conductivity could affect the model predictions but it is unknow to what extent (but given the high values of hydraulic conductivity measured in the aquifer test, the effects of variability in hydraulic conductivity likely have limited effect on the model results).
• Only a single layer is used to simulate the groundwater flow system. The confining layer and overlying sandy layer were not explicitly simulated. This has the effect of assuming that the confined aquifer has no upward leakage. It is assumed that prior to construction activities, there
6
was not significant artesian flow to the ground surface. Grouting is intended to seal vertical artesian flow pathways that developed during and after construction. Therefore, assuming no vertical leakage should not affect the comparison between pre-construction conditions and post-grouting conditions.
• The areal extent of the grout was assumed, based on the projections described elsewhere in this CAP. A larger grout area may result in greater differences in flow direction in close proximity of the grouting activities. The assumption of fully grouting the aquifer from bottom to top within the grout footprint represents a condition in which the greatest difference between pre-construction and post-sealing flow would result.
Image 1 Pre-Construction Conditions
7
Image 2 Post Sealing Conditions
8
3 Alternatives Analysis The MDNR and MPCA requested that Enbridge conduct an alternatives analysis to ensure the proposed corrective action is the least environmentally damaging alternative in their November 17 and 18, 2021 comments, respectively. Enbridge submitted an Alternatives Analysis to the agencies for review on December 30, 2021 and held a conference call with representatives from the FDL, MDNR, MPCA, MDH and St. Louis County on January 7, 2022. Enbridge’s Alternatives Analysis, provided in Appendix B, considered the No Action Alternative, and several non-grouting and grouting corrective action alternatives.
The No Action Alternative was eliminated for further consideration because the unmitigated discharge of groundwater from the site would result in worsening conditions at the site; would not meet agencies’ requirements to stop groundwater flow; and would present concerns regarding long-term subsurface stability surrounding existing Enbridge infrastructure.
Three non-grouting options were considered: ground freezing, construction of a sheet pile wall system, and reconstruction of the confining cap layer. These alternatives were not carried forward due to infeasibility in terms of energy demands to maintain the corrective action permanently (ground freezing), risk of potential for liquefaction and further destabilization of the confining layer (sheet pile wall system) and extensive disturbance and risk of failure due to high head pressures encountered at this aquifer (reconstruction of a confining layer cap).
The grouting alternatives considered included Tube a Manchette (TAM), jet grouting, and pressure/permeation grouting. Based on the characteristics of this aquifer system described in more detail above, the TAM method is not recommended because it would require more than 200 small punctures in a weak confining layer. However, the TAM method could be used for limited supplemental grouting after the initial grouting effort is completed, if needed. The jet grouting method uses high-pressure injection of air and grout and is also not recommended due to the disruptive nature of the process and the potential effects on the fragile silt/sandy silt confining layer at this site. Enbridge recommends the use of pressure/permeation grouting, described in detail in Section 4.
9
4 Proposed Pressure/Permeation Grouting Barr and Enbridge’s contractors recommend the use of pressure/permeation grouting at this location. This method would consist of permeating the confined gravelly aquifer to significantly reduce the hydraulic conductivity of the aquifer. Grouting would be performed after head pressures are lowered via numerous dewatering/injection wells that are in addition to the dewatering wells used to reduce groundwater flows and pressures. Each dewatering/injection well would then be used as an injection well to permeate grout into the aquifer formation with adjacent injection/dewatering wells drawing grout towards the well through manipulation of the local gradient by controlling injection pressure and local well pump rates. The process would continue until all injection wells are grouted, and the confined aquifer is fully grouted to stop surface flow expression. This effort will require significant temporary dewatering to reduce local head pressure to facilitate grout installation in addition to cased well construction due to the weak confining layer. However, this method offers several advantages compared to the other grouting efforts and has the lowest risk of introducing more disruptions to the confining layer as it significantly reduces the number of new disruptions in the confining layer compared to a TAM grouting method and is less disruptive to the fragile silt/silty sand confining layer compared to a jet grouting method. It will also allow the grouting contractor, in coordination with Barr, to address conditions as the grouting process continues as the contractor will be able to guide grout throughout the aquifer using the different injection points and manipulate the water flow through the system through pressure adjustments via dewatering. This level of control is not possible with TAM or jet grouting. This will allow the grout to be conveyed throughout the system, up and into the sheet pile penetrations, and eventually up through the wells, where it can be capped. Enbridge believes that this method is best suited to the site characteristics and offers the highest likelihood of successfully sealing the groundwater surface expressions as compared to other cement grouting methods.
Grouting beneath the section of the pipeline that is the subject of the sealing plan will substantially reduce the transmissivity of the aquifer where the grout is injected. Transmissivity of the aquifer should not be affected beyond the zone of grouting. Groundwater will flow around the grout zone from upgradient upland areas to the north-northwest to discharge areas south and southeast of the sealing project as presented in Section 2.3. Grouting does not affect the water balance of the aquifer (i.e., the quantity of water flowing through the aquifer over time).
4.1 Installation of Caissons As described above, the confining layer above the poorly graded gravel layer (confined aquifer) is predominately made up of silt and sandy silt, which is susceptible to liquefaction and has a lower undrained shear strength than a more common clay confining layer. To mitigate the risk of disturbance to the confining layer, the silty sand with gravel layer above the silt confining layer in the area of each dewatering/injection well has been improved/replaced with sand cement grout mixture that complies with Minnesota Rules 4725.0100, subpart 22b, but with no additional chemicals or admixtures to reduce permeability or control setting time prior to the installation of the proposed borings. Caisson installation for each of the dewatering/injection wells and the dedicated dewatering wells was completed at the site on February 2, 2022. An Environmental Inspector (EI) and Independent Environmental Monitor (IEM) were
10
onsite throughout the duration of all caisson installation activities and Enbridge has indicated that they will continue to be onsite for the duration of the grouting activities. Enbridge, the EIs and IEMs confirmed that the products used complied with Minnesota Rules 4725.0100, subpart 22b. No additional chemicals or admixtures to reduce permeability or control setting time were used for caisson construction.
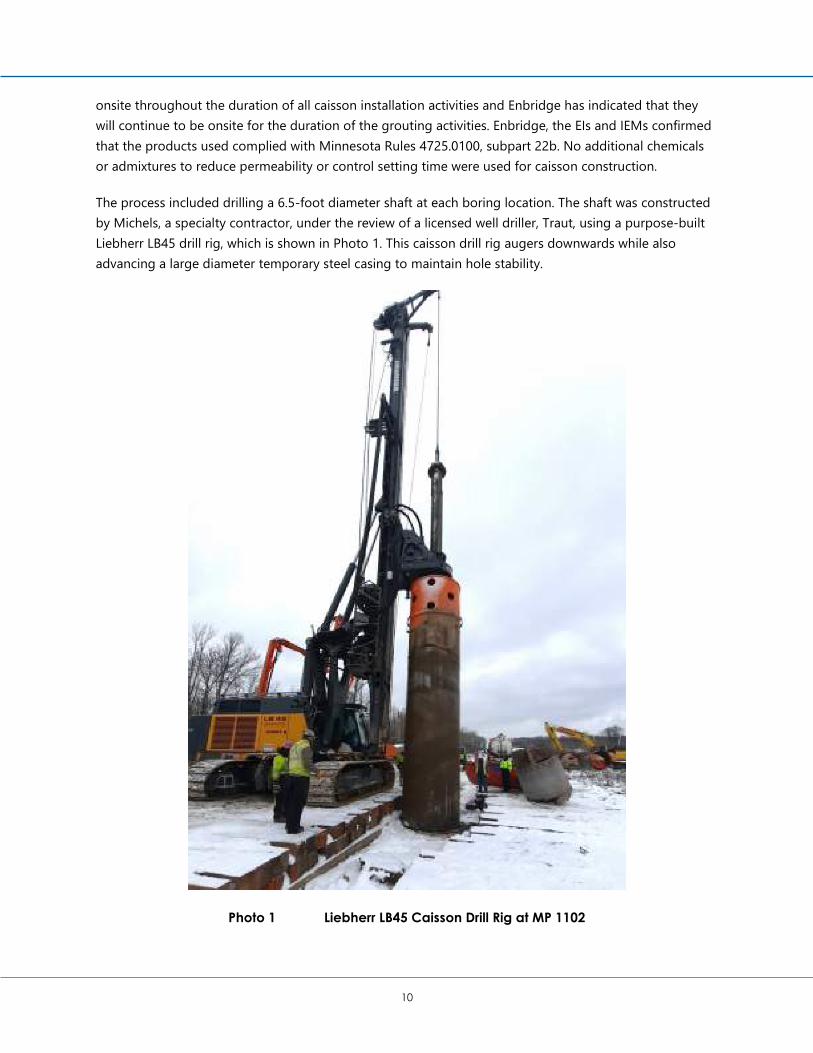
The process included drilling a 6.5-foot diameter shaft at each boring location. The shaft was constructed by Michels, a specialty contractor, under the review of a licensed well driller, Traut, using a purpose-built Liebherr LB45 drill rig, which is shown in Photo 1. This caisson drill rig augers downwards while also advancing a large diameter temporary steel casing to maintain hole stability.
Photo 1 Liebherr LB45 Caisson Drill Rig at MP 1102
11
Enbridge submitted a caisson installation request memo (Appendix C) to the agencies describing the process for installing the caissons for the four additional dewatering wells, in addition to the 19 dewatering/grout injection wells described in Section 4.3. Enbridge met with the agencies on January 21 and January 24, 2022 to discuss this request, and the caisson installation work was approved by the agencies on January 24, 2022. Michels completed this work for Enbridge on February 2, 2022.
4.2 Temporary Dewatering Wells To reduce the rate of groundwater inflow from entering the seepage area and to temporarily reduce the confined aquifer pressures, dewatering wells are proposed to be installed upgradient of the area of seepage. The dewatering wells will be constructed using multiple steel casings and in accordance with Minnesota Department of Health Well Code requirements. The well casings will be produced to ASTM A53 standards and will be in accordance with Minnesota Rules 4725.2350 – Steel Casing Requirements. The well screens will be constructed of grade 304 stainless steel and be in accordance with Minnesota Rules 4725.2750 – Screens; Screen Leaders, Risers, and Sumps. The grout used for dewatering well construction will be a neat cement grout and will be in accordance with Minnesota Rules 4725.3050 - Grouting. No admixtures will be added to the neat cement grout. Traut, a licensed well driller with experience managing artesian conditions will continue to be retained to complete the wells.
The wells would be constructed to pump from the underlying confined aquifer at a rate sufficient to (1) reduce flow in the proposed grout injection wells described later and (2) reduce upward pressures in the confined aquifer to a level that will allow for grout to be injected and set, allowing permanent sealing of existing flow paths. The six proposed dewatering well locations (two wells have already been installed as authorized under the GIP) were determined based on the limited workspace and on an assumed groundwater flow to the southeast, which was confirmed during the aquifer test. The spacing of the wells is anticipated to be approximately 25 - 30 ft in order to create intersecting radii of influence and temporarily maximize the potentiometric pressure reduction. The proposed spacing and the influence on adjacent wells was confirmed during the aquifer test by the measured potentiometric pressure changes in MP1102-CAP-9 (reduction and rebound of approximately 3 ft), which is located approximately 65 feet upgradient of aquifer test pumping wells MP1102-GIP-21-2A and MP1102-CAP-6.
The final locations of the dewatering wells will be field located based on the available workspace, existing infrastructure and engineering judgement. Approximate locations are shown in Figure 2. Additional temporary dewatering wells may be required if the groundwater pressures are not sufficiently reduced.
Rotosonic drilling will be utilized to install the well casing and screen, as this method allows the most options for control of the borehole during aquifer penetration by always utilizing temporary casing in the borehole during advancement. Should a need arise to immediately abandon a borehole if excessive backflow is encountered or caving gravels are encountered, the temporary casing of the rotosonic method allows the most effective and rapid response. Additionally, the presence of cobbles, potential boulders, and gravel in the aquifer necessitate the use of temporary casing to install the well screen and this is most effectively accomplished with the rotosonic system. Aquifer head reduction by active-
12
pumping of adjacent wells during drilling will aid in reducing the risk of liquefaction of the confining layer with the rotosonic method.
Completion of the dewatering wells will be performed in the following sequence for each location after the caissons have been installed and the grout allowed to cure for a minimum of 24 hours as described in Section 4.1.
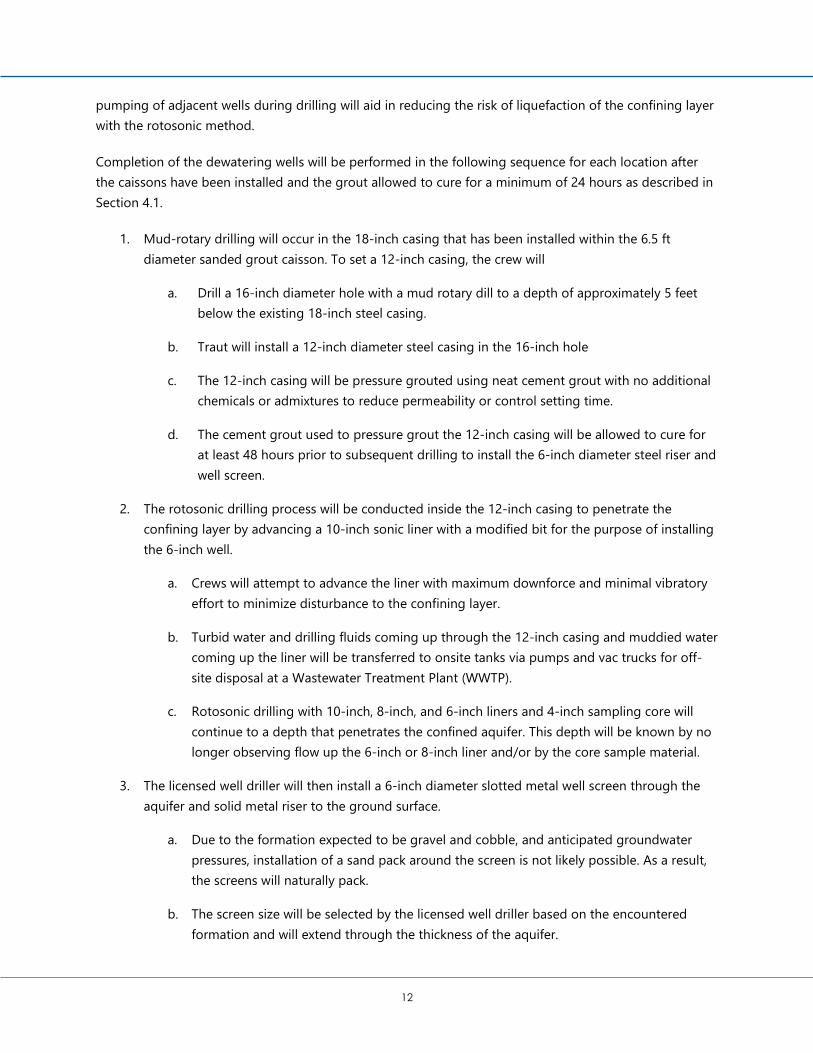
1. Mud-rotary drilling will occur in the 18-inch casing that has been installed within the 6.5 ft diameter sanded grout caisson. To set a 12-inch casing, the crew will
a. Drill a 16-inch diameter hole with a mud rotary dill to a depth of approximately 5 feet below the existing 18-inch steel casing.
b. Traut will install a 12-inch diameter steel casing in the 16-inch hole
c. The 12-inch casing will be pressure grouted using neat cement grout with no additional chemicals or admixtures to reduce permeability or control setting time.
d. The cement grout used to pressure grout the 12-inch casing will be allowed to cure for at least 48 hours prior to subsequent drilling to install the 6-inch diameter steel riser and well screen.
2. The rotosonic drilling process will be conducted inside the 12-inch casing to penetrate the confining layer by advancing a 10-inch sonic liner with a modified bit for the purpose of installing the 6-inch well.
a. Crews will attempt to advance the liner with maximum downforce and minimal vibratory effort to minimize disturbance to the confining layer.
b. Turbid water and drilling fluids coming up through the 12-inch casing and muddied water coming up the liner will be transferred to onsite tanks via pumps and vac trucks for off-site disposal at a Wastewater Treatment Plant (WWTP).
c. Rotosonic drilling with 10-inch, 8-inch, and 6-inch liners and 4-inch sampling core will continue to a depth that penetrates the confined aquifer. This depth will be known by no longer observing flow up the 6-inch or 8-inch liner and/or by the core sample material.
3. The licensed well driller will then install a 6-inch diameter slotted metal well screen through the aquifer and solid metal riser to the ground surface.
a. Due to the formation expected to be gravel and cobble, and anticipated groundwater pressures, installation of a sand pack around the screen is not likely possible. As a result, the screens will naturally pack.
b. The screen size will be selected by the licensed well driller based on the encountered formation and will extend through the thickness of the aquifer.
13
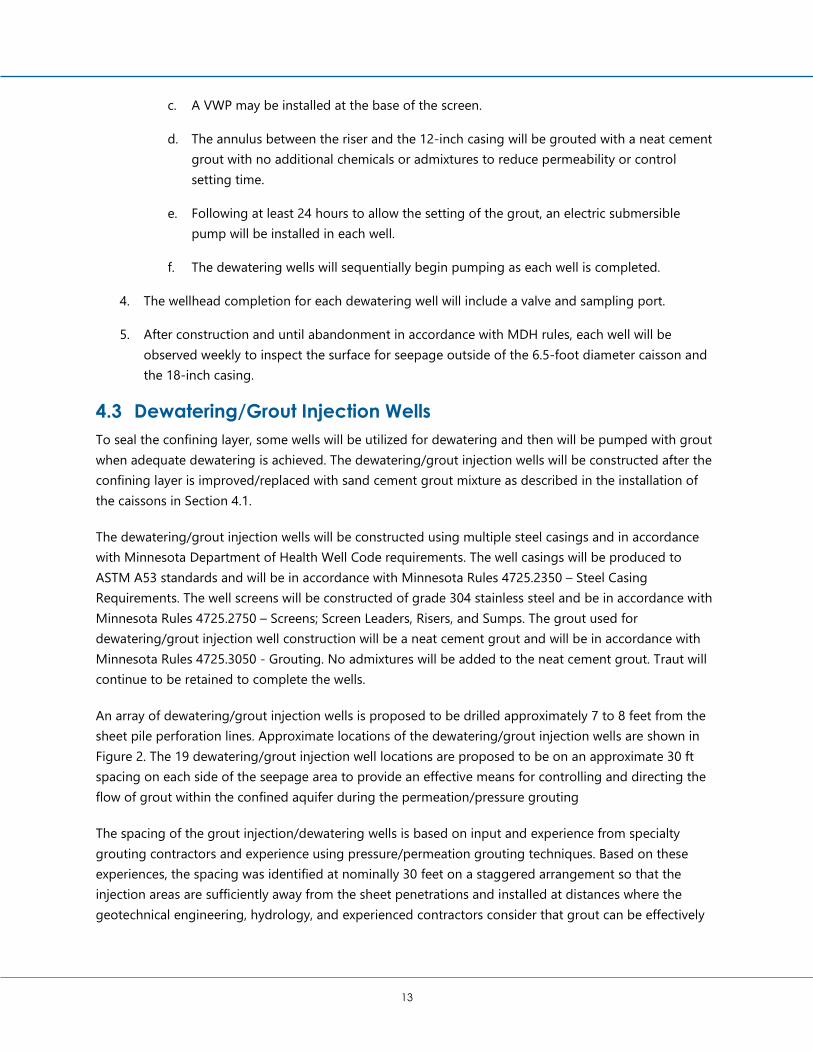
c. A VWP may be installed at the base of the screen.
d. The annulus between the riser and the 12-inch casing will be grouted with a neat cement grout with no additional chemicals or admixtures to reduce permeability or control setting time.
e. Following at least 24 hours to allow the setting of the grout, an electric submersible pump will be installed in each well.
f. The dewatering wells will sequentially begin pumping as each well is completed.
4. The wellhead completion for each dewatering well will include a valve and sampling port.
5. After construction and until abandonment in accordance with MDH rules, each well will be observed weekly to inspect the surface for seepage outside of the 6.5-foot diameter caisson and the 18-inch casing.
4.3 Dewatering/Grout Injection Wells To seal the confining layer, some wells will be utilized for dewatering and then will be pumped with grout when adequate dewatering is achieved. The dewatering/grout injection wells will be constructed after the confining layer is improved/replaced with sand cement grout mixture as described in the installation of the caissons in Section 4.1.
The dewatering/grout injection wells will be constructed using multiple steel casings and in accordance with Minnesota Department of Health Well Code requirements. The well casings will be produced to ASTM A53 standards and will be in accordance with Minnesota Rules 4725.2350 – Steel Casing Requirements. The well screens will be constructed of grade 304 stainless steel and be in accordance with Minnesota Rules 4725.2750 – Screens; Screen Leaders, Risers, and Sumps. The grout used for dewatering/grout injection well construction will be a neat cement grout and will be in accordance with Minnesota Rules 4725.3050 - Grouting. No admixtures will be added to the neat cement grout. Traut will continue to be retained to complete the wells.
An array of dewatering/grout injection wells is proposed to be drilled approximately 7 to 8 feet from the sheet pile perforation lines. Approximate locations of the dewatering/grout injection wells are shown in Figure 2. The 19 dewatering/grout injection well locations are proposed to be on an approximate 30 ft spacing on each side of the seepage area to provide an effective means for controlling and directing the flow of grout within the confined aquifer during the permeation/pressure grouting
The spacing of the grout injection/dewatering wells is based on input and experience from specialty grouting contractors and experience using pressure/permeation grouting techniques. Based on these experiences, the spacing was identified at nominally 30 feet on a staggered arrangement so that the injection areas are sufficiently away from the sheet penetrations and installed at distances where the geotechnical engineering, hydrology, and experienced contractors consider that grout can be effectively
14
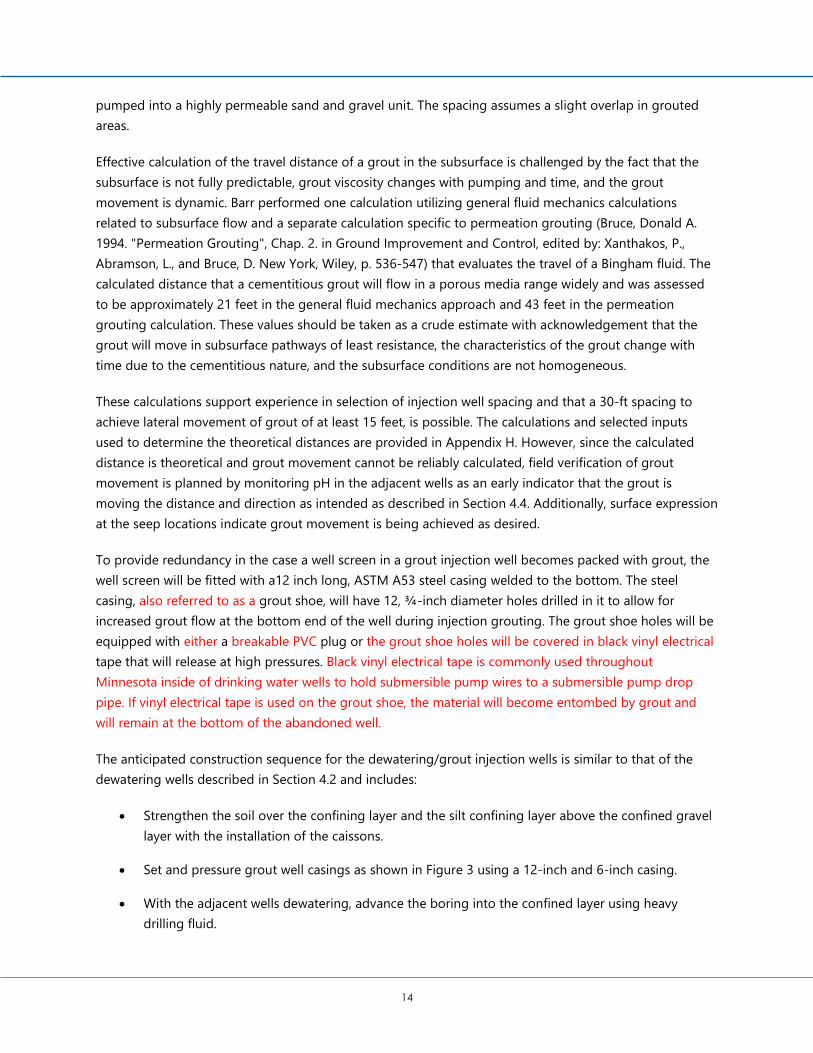
pumped into a highly permeable sand and gravel unit. The spacing assumes a slight overlap in grouted areas.
Effective calculation of the travel distance of a grout in the subsurface is challenged by the fact that the subsurface is not fully predictable, grout viscosity changes with pumping and time, and the grout movement is dynamic. Barr performed one calculation utilizing general fluid mechanics calculations related to subsurface flow and a separate calculation specific to permeation grouting (Bruce, Donald A. 1994. "Permeation Grouting", Chap. 2. in Ground Improvement and Control, edited by: Xanthakos, P., Abramson, L., and Bruce, D. New York, Wiley, p. 536-547) that evaluates the travel of a Bingham fluid. The calculated distance that a cementitious grout will flow in a porous media range widely and was assessed to be approximately 21 feet in the general fluid mechanics approach and 43 feet in the permeation grouting calculation. These values should be taken as a crude estimate with acknowledgement that the grout will move in subsurface pathways of least resistance, the characteristics of the grout change with time due to the cementitious nature, and the subsurface conditions are not homogeneous.
These calculations support experience in selection of injection well spacing and that a 30-ft spacing to achieve lateral movement of grout of at least 15 feet, is possible. The calculations and selected inputs used to determine the theoretical distances are provided in Appendix H. However, since the calculated distance is theoretical and grout movement cannot be reliably calculated, field verification of grout movement is planned by monitoring pH in the adjacent wells as an early indicator that the grout is moving the distance and direction as intended as described in Section 4.4. Additionally, surface expression at the seep locations indicate grout movement is being achieved as desired.
To provide redundancy in the case a well screen in a grout injection well becomes packed with grout, the well screen will be fitted with a12 inch long, ASTM A53 steel casing welded to the bottom. The steel casing, also referred to as a grout shoe, will have 12, ¾-inch diameter holes drilled in it to allow for increased grout flow at the bottom end of the well during injection grouting. The grout shoe holes will be equipped with either a breakable PVC plug or the grout shoe holes will be covered in black vinyl electrical tape that will release at high pressures. Black vinyl electrical tape is commonly used throughout Minnesota inside of drinking water wells to hold submersible pump wires to a submersible pump drop pipe. If vinyl electrical tape is used on the grout shoe, the material will become entombed by grout and will remain at the bottom of the abandoned well.
The anticipated construction sequence for the dewatering/grout injection wells is similar to that of the dewatering wells described in Section 4.2 and includes:
• Strengthen the soil over the confining layer and the silt confining layer above the confined gravellayer with the installation of the caissons.
• Set and pressure grout well casings as shown in Figure 3 using a 12-inch and 6-inch casing.
• With the adjacent wells dewatering, advance the boring into the confined layer using heavydrilling fluid.
15
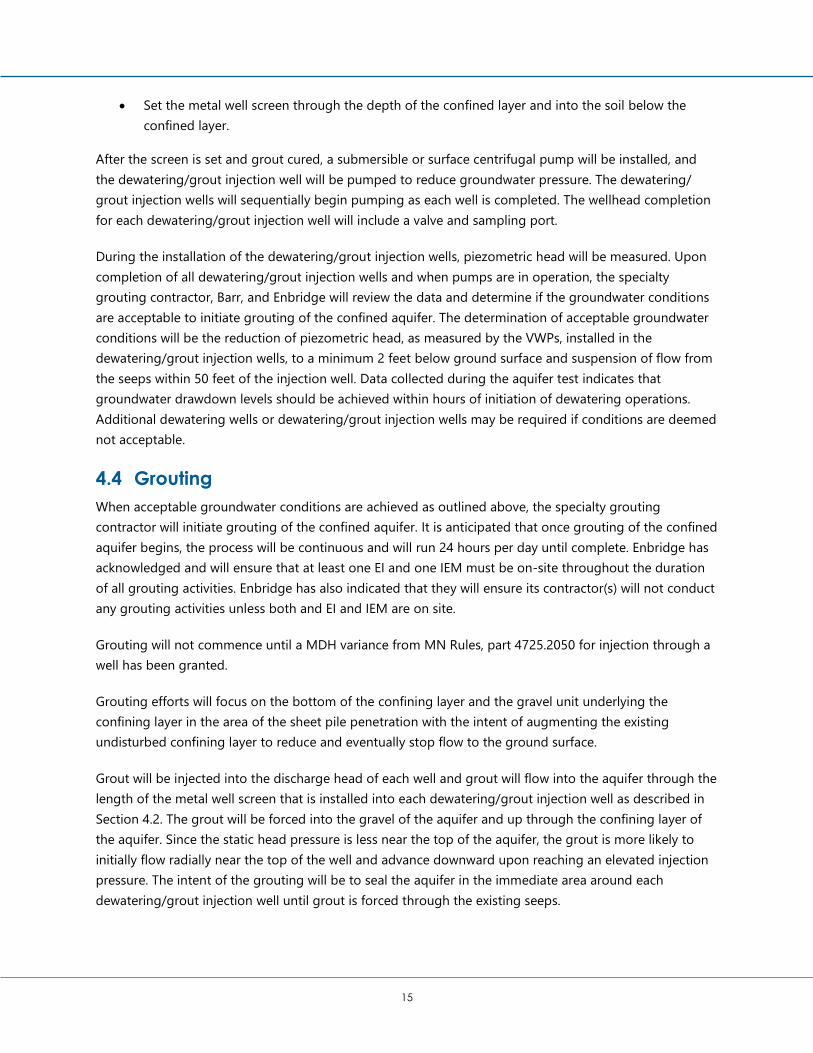
• Set the metal well screen through the depth of the confined layer and into the soil below the confined layer.
After the screen is set and grout cured, a submersible or surface centrifugal pump will be installed, and the dewatering/grout injection well will be pumped to reduce groundwater pressure. The dewatering/ grout injection wells will sequentially begin pumping as each well is completed. The wellhead completion for each dewatering/grout injection well will include a valve and sampling port.
During the installation of the dewatering/grout injection wells, piezometric head will be measured. Upon completion of all dewatering/grout injection wells and when pumps are in operation, the specialty grouting contractor, Barr, and Enbridge will review the data and determine if the groundwater conditions are acceptable to initiate grouting of the confined aquifer. The determination of acceptable groundwater conditions will be the reduction of piezometric head, as measured by the VWPs, installed in the dewatering/grout injection wells, to a minimum 2 feet below ground surface and suspension of flow from the seeps within 50 feet of the injection well. Data collected during the aquifer test indicates that groundwater drawdown levels should be achieved within hours of initiation of dewatering operations. Additional dewatering wells or dewatering/grout injection wells may be required if conditions are deemed not acceptable.
4.4 Grouting When acceptable groundwater conditions are achieved as outlined above, the specialty grouting contractor will initiate grouting of the confined aquifer. It is anticipated that once grouting of the confined aquifer begins, the process will be continuous and will run 24 hours per day until complete. Enbridge has acknowledged and will ensure that at least one EI and one IEM must be on-site throughout the duration of all grouting activities. Enbridge has also indicated that they will ensure its contractor(s) will not conduct any grouting activities unless both and EI and IEM are on site.
Grouting will not commence until a MDH variance from MN Rules, part 4725.2050 for injection through a well has been granted.
Grouting efforts will focus on the bottom of the confining layer and the gravel unit underlying the confining layer in the area of the sheet pile penetration with the intent of augmenting the existing undisturbed confining layer to reduce and eventually stop flow to the ground surface.
Grout will be injected into the discharge head of each well and grout will flow into the aquifer through the length of the metal well screen that is installed into each dewatering/grout injection well as described in Section 4.2. The grout will be forced into the gravel of the aquifer and up through the confining layer of the aquifer. Since the static head pressure is less near the top of the aquifer, the grout is more likely to initially flow radially near the top of the well and advance downward upon reaching an elevated injection pressure. The intent of the grouting will be to seal the aquifer in the immediate area around each dewatering/grout injection well until grout is forced through the existing seeps.
16
Grouting is anticipated to begin on the downgradient wells and proceed up gradient (to the northwest) to reduce the amount of grout-impacted water. The sequencing will be reviewed by the specialty contractor, Enbridge, and Barr prior to implementation. Once prepared to grout, the pumps in the southeasterly wells will be removed and pressurized neat cement grout will be injected into at least two adjacent dewatering/grout-injection wells simultaneously until one of the following conditions are achieved:
1) Grout inundates an adjacent dewatering/injection well and grout is produced in the discharge
2) A pressure predetermined by the specialty contractor is measured at the injection point at the wellhead
If grout is observed inundating an adjacent dewatering/injection well, the pump in that well will be removed and pressurized grout injection will be initiated in that well.
The pressure used to determine when grouting will temporarily or permanently cease in a dewatering/injection well will be dependent on the chemical admixtures used in the grout, which, as described in Sections 4.5 and 8 below, must first receive approval from FDL, MPCA and MDH, restrictions in the formation, and movement of the ground surface. A preliminary evaluation by Michels indicates a pressure of approximately 300 psi will be initially used. However, the pressures will be adjusted as needed based on site conditions during grouting activities.
If injection grouting damages the grout seal around a well, resulting in groundwater flow around the well casings, the well must be reconstructed or sealed in accordance with Minnesota Well Code requirements and ground water flow stopped
When the injection well has been used to deliver the cement grout and will no longer be utilized for additional grout injection, the uncured grout in the well screen will be flushed with clean water to allow abandonment of the well. Traut will permanently abandon each injection well in accordance with MN Well Code well sealing requirements. The grout used for the well abandonment will be a MN Well Code approved neat cement grout with no additional chemicals or admixtures to reduce permeability or control setting time.
When the final injection of grout has cured for 48 hours, the pumping rate of the upgradient dewatering wells will be reduced and areas of remaining flowing conditions will be identified and marked. The well pumping rates will be increased, and these identified areas will be grouted with additional phases of grout placement. This process will be repeated until all flow at the surface is stopped. Once the surface flows have been stopped, the pumping of the dewatering wells will cease. A 48-hour observation period will begin and conditions at the surface will be monitored. If surface seepage is identified, pumping of the dewatering wells will recommence and those areas with surface flows will be grouted with additional phases. The grouting process for any new surface expressions will be determined by the amount of flow and pressure observed. The appropriate methodology for any future grouting must be assessed based on the conditions presented at that time. Conceptually, the use of TAMs will be initially evaluated and this approach will most likely be utilized for sealing small surface expressions.
17
The approximate areal dimensions of the area within the aquifer that will be grouted is 300 ft by 60 ft.
After a 7-day time period has elapsed without any visible surface flows, the temporary pumps will be removed, and the wells will be shut-in by Traut by installing a well seal or closing a valve at the well head in accordance with MDH rules. The temporary dewatering wells will be abandoned as required by Minnesota Rules 4725.3850 and will be sealed with MN Well Code approved neat cement grout with no additional chemicals or admixtures to reduce permeability or control setting time one year after completion of the grouting unless seepage is observed.
4.5 Chemical Admixtures To further increase the likelihood of success, Enbridge has requested authorization to add agency-approved chemical admixtures to the grout their contractors will use. Enbridge has acknowledged, as described in Section 8 below, that any such chemical admixtures, or additives of any kind, must not be added to the grout unless the FDL, MPCA and MDH have expressly approved their use. Although not required, chemical admixtures allow the grout to be pushed further and become effective faster than cement grouts without admixtures. Grout mixtures with appropriate admixtures have a better chance of more effectively filling aquifer voids on the initial pass, as well as increasing the potential to produce less grout-impacted water.
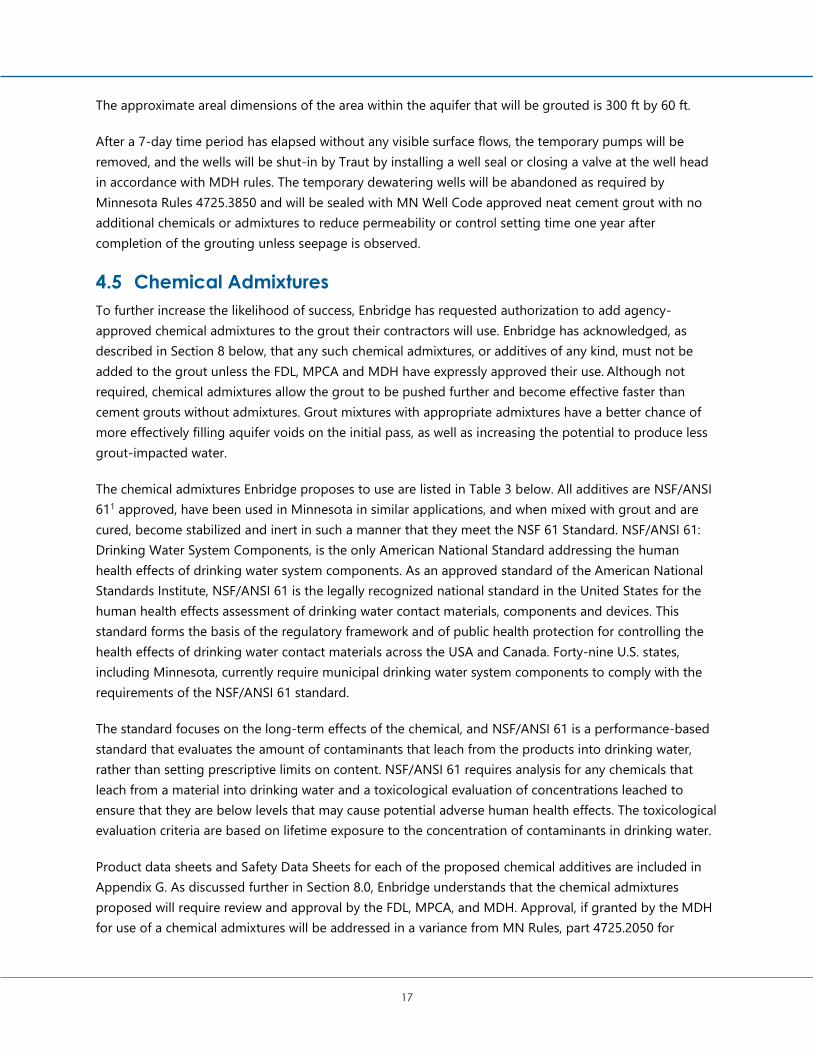
The chemical admixtures Enbridge proposes to use are listed in Table 3 below. All additives are NSF/ANSI 611 approved, have been used in Minnesota in similar applications, and when mixed with grout and are cured, become stabilized and inert in such a manner that they meet the NSF 61 Standard. NSF/ANSI 61: Drinking Water System Components, is the only American National Standard addressing the human health effects of drinking water system components. As an approved standard of the American National Standards Institute, NSF/ANSI 61 is the legally recognized national standard in the United States for the human health effects assessment of drinking water contact materials, components and devices. This standard forms the basis of the regulatory framework and of public health protection for controlling the health effects of drinking water contact materials across the USA and Canada. Forty-nine U.S. states, including Minnesota, currently require municipal drinking water system components to comply with the requirements of the NSF/ANSI 61 standard.
The standard focuses on the long-term effects of the chemical, and NSF/ANSI 61 is a performance-based standard that evaluates the amount of contaminants that leach from the products into drinking water, rather than setting prescriptive limits on content. NSF/ANSI 61 requires analysis for any chemicals that leach from a material into drinking water and a toxicological evaluation of concentrations leached to ensure that they are below levels that may cause potential adverse human health effects. The toxicological evaluation criteria are based on lifetime exposure to the concentration of contaminants in drinking water.
Product data sheets and Safety Data Sheets for each of the proposed chemical additives are included in Appendix G. As discussed further in Section 8.0, Enbridge understands that the chemical admixtures proposed will require review and approval by the FDL, MPCA, and MDH. Approval, if granted by the MDH for use of a chemical admixtures will be addressed in a variance from MN Rules, part 4725.2050 for
18
injection through a well. The variance and approval for the proposed admixtures will not be needed until grout injection starts, which is anticipated to begin as soon as February 28, 2022.
Table 3 Proposed Chemical Admixtures
Admixture Description Admixture Name Manufacturer NSF/ANSI 61 Compliance?
Hydration Controlling Admixture Masterset DELVO Master Builder Solutions Y
Full Range Water Reducing Admixture Glenium 7500 Master Builder Solutions Y
Workability Retaining Admixture MasterSure Z-60 Master Builder Solutions Y
1 NSF standard for drinking water system components, covering indirect additives products and materials, establishing minimum requirements for the control of potential adverse human health effects from products that contact drinking water.
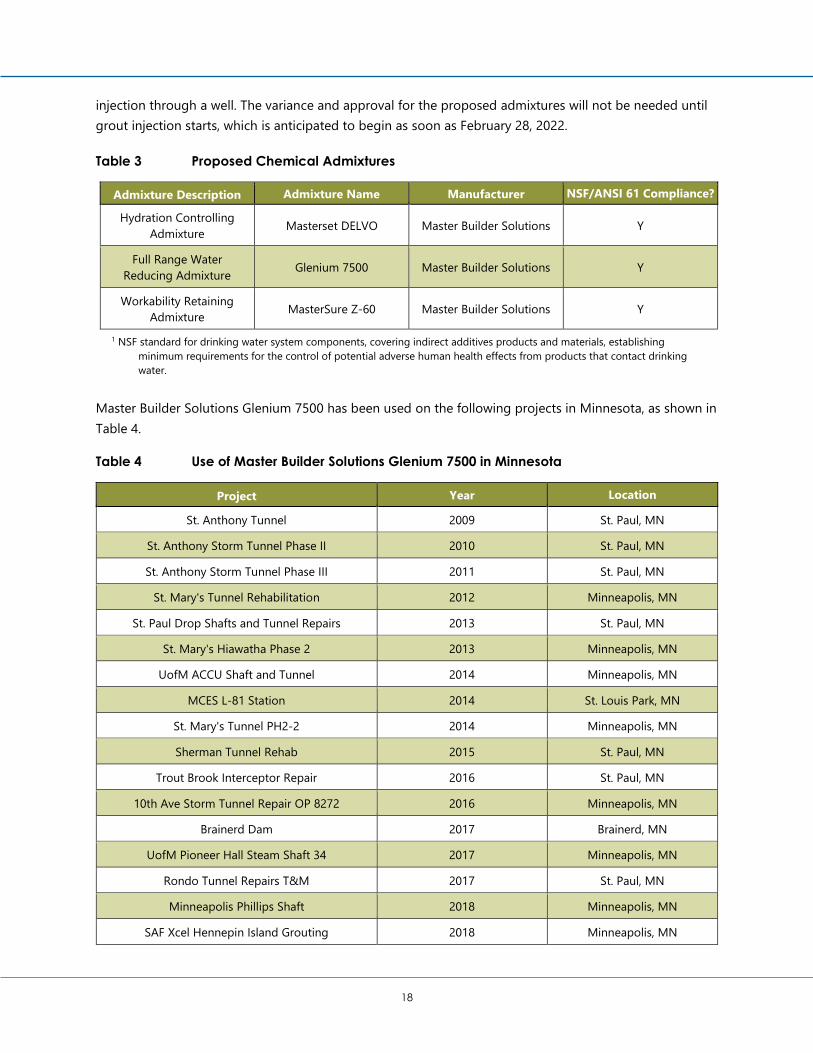
Master Builder Solutions Glenium 7500 has been used on the following projects in Minnesota, as shown in Table 4.
Table 4 Use of Master Builder Solutions Glenium 7500 in Minnesota
Project Year Location
St. Anthony Tunnel 2009 St. Paul, MN
St. Anthony Storm Tunnel Phase II 2010 St. Paul, MN
St. Anthony Storm Tunnel Phase III 2011 St. Paul, MN
St. Mary's Tunnel Rehabilitation 2012 Minneapolis, MN
St. Paul Drop Shafts and Tunnel Repairs 2013 St. Paul, MN
St. Mary's Hiawatha Phase 2 2013 Minneapolis, MN
UofM ACCU Shaft and Tunnel 2014 Minneapolis, MN
MCES L-81 Station 2014 St. Louis Park, MN
St. Mary's Tunnel PH2-2 2014 Minneapolis, MN
Sherman Tunnel Rehab 2015 St. Paul, MN
Trout Brook Interceptor Repair 2016 St. Paul, MN
10th Ave Storm Tunnel Repair OP 8272 2016 Minneapolis, MN
Brainerd Dam 2017 Brainerd, MN
UofM Pioneer Hall Steam Shaft 34 2017 Minneapolis, MN
Rondo Tunnel Repairs T&M 2017 St. Paul, MN
Minneapolis Phillips Shaft 2018 Minneapolis, MN
SAF Xcel Hennepin Island Grouting 2018 Minneapolis, MN
19
Project Year Location
RFB - PW - Phalen Storm Tunnerl Rehab Phase III 2018 St. Paul, MN
10th Ave Water Main River Crossing 2019 Minneapolis, MN
Arch Culvert Rehab - MOSC 2015 Marine on St. Croix, MN
RFB - PW - Phase 2 Kittsondale Tunnel 2019 St. Paul, MN
PSC-Q3 Layfayette Gas Pipeline Water Control Grouting 2020 St. Paul, MN
Master Builder Solutions MasterSure Z-60 has been used on the following projects in Minnesota, as shown in Table 5.
Table 5 Use of Master Builder Solutions MasterSure Z-60 in Minnesota
Project Year Location
St. Mary's - Hiawatha Tunnel Phase 2 2013 Minneapolis, MN
St. Mary's Tunnel PH2-2 2014 Minneapolis, MN
Sherman Tunnel Rehab 2015 St. Paul, MN
Trout Brook Interceptor Repair 2016 St. Paul, MN
Brainerd Dam 2017 Brainerd, MN
RFB - PW - Phase 2 Kittsondale Tunnel 2019 St. Paul, MN
20
5 Water Management The following water streams will be managed as part of this corrective action:
1) the ongoing groundwater expressions occurring at the seeps near MP 1102.5
2) water pumped from the aquifer by the dewatering wells and discharged outside of the FDL
3) water pumped from the aquifer by the dewatering wells and discharged within the FDL
4) grout-affected water that is a byproduct of the grouting activities
5.1 Water Management Outside of the FDL Reservation 5.1.1 Water Management of Groundwater Expressions As discussed in Section 1, flows from the seeps are presently managed by diverting water to a constructed temporary rock-lined swale that runs west to east along the construction workspace within a wetland complex (w-50n19w22-a) to nearly the western boundary of the FDL Reservation, which is delineated by a north-south running unnamed stream/ditch feature (s-50n19w27-a) that is regulated by the FDL (Figure 1). Flows are being calculated by accurately measuring the height of discharge over a weir using an electronic weir monitor.
Presently, site dewatering activities have suspended any surficial expression of seepage at the flow locations. Should flows develop during the grouting activities, grout impacted water will be collected and managed as described in Section 5.3. Clean water will be diverted to the previously described existing, temporary rock-lined swale. Any clean water flow that is allowed to be diverted to the temporary swale will be calculated by accurately measuring the height of discharge over a weir using the installed electronic weir monitor.
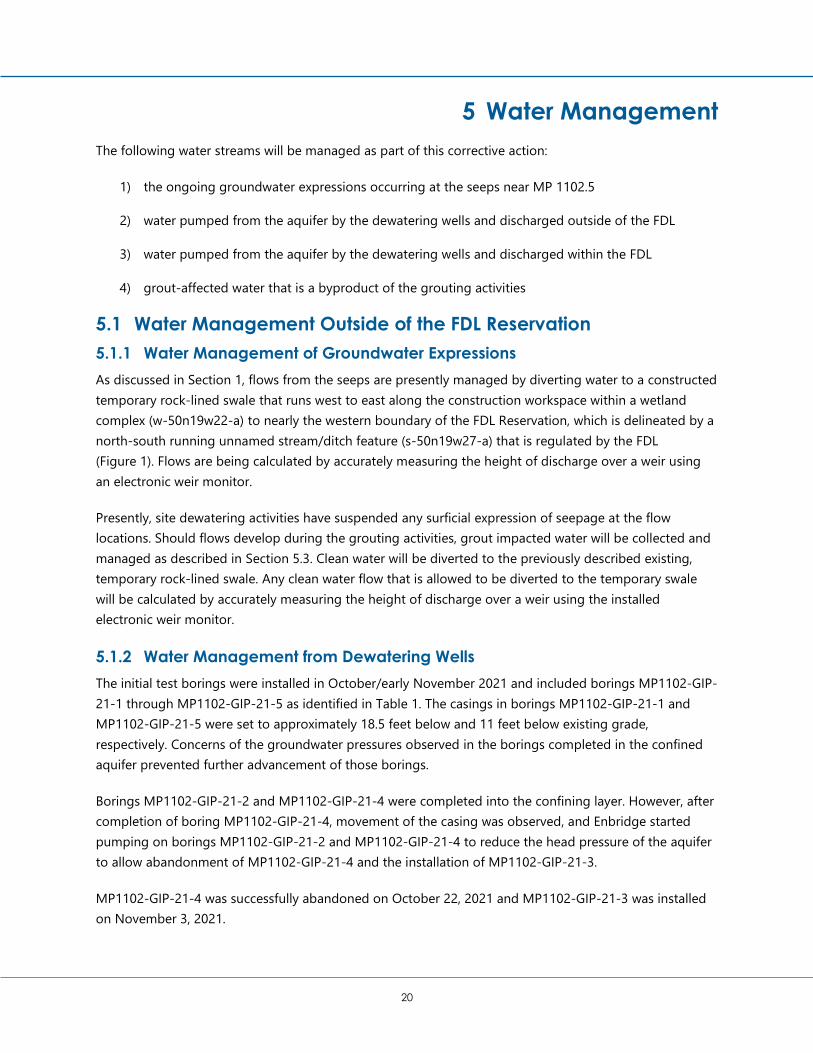
5.1.2 Water Management from Dewatering Wells The initial test borings were installed in October/early November 2021 and included borings MP1102-GIP-21-1 through MP1102-GIP-21-5 as identified in Table 1. The casings in borings MP1102-GIP-21-1 and MP1102-GIP-21-5 were set to approximately 18.5 feet below and 11 feet below existing grade, respectively. Concerns of the groundwater pressures observed in the borings completed in the confined aquifer prevented further advancement of those borings.
Borings MP1102-GIP-21-2 and MP1102-GIP-21-4 were completed into the confining layer. However, after completion of boring MP1102-GIP-21-4, movement of the casing was observed, and Enbridge started pumping on borings MP1102-GIP-21-2 and MP1102-GIP-21-4 to reduce the head pressure of the aquifer to allow abandonment of MP1102-GIP-21-4 and the installation of MP1102-GIP-21-3.
MP1102-GIP-21-4 was successfully abandoned on October 22, 2021 and MP1102-GIP-21-3 was installed on November 3, 2021.
21
Once all test borings were complete, Enbridge continued dewatering from MP1102-GIP-21-2 and MP1102-GIP-21-3 to maximize depressurization of the confined aquifer in anticipation of sealing activities. Pump rates during this timeframe averaged around 200-250 gpm in October 2021 and increased to about 450 gpm on average from November 2021 through the initiation of the aquifer test in January 2022. In December 2021, Enbridge installed four additional wells as authorized under the GIP: MP1102-CAP-9, MP1102-CAP-6, MP1102 -GIP-21-2A, MP1102- GIP-21-6, as identified in Table 1.
The procedures for the aquifer pump test are described in Enbridge’s MP1102.5 Aquifer Test Plan memo (Rev 1, January 14, 2022) approved by the MDNR on January 14, 2022. During the pump test, pump rates reached a maximum of 810 gpm. Upon completion of the pump tests, MDNR authorized the abandonment and sealing of MP1102-CAP-GIP-21-2 due to leaking that started to occur around the casing. Pump rates increased to approximately 1,600 gpm starting January 21, 2022 through present day to reduce piezometric head to accomplish the abandonment of that well and has continued during the installation of the additional caissons.
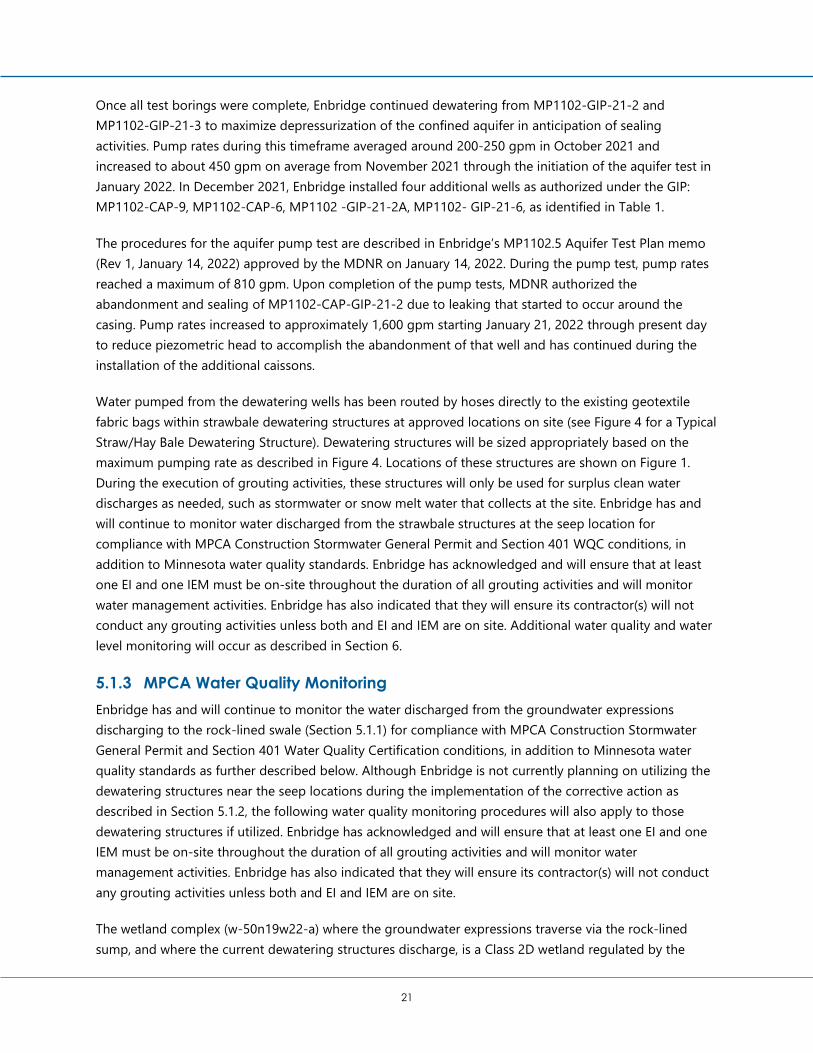
Water pumped from the dewatering wells has been routed by hoses directly to the existing geotextile fabric bags within strawbale dewatering structures at approved locations on site (see Figure 4 for a Typical Straw/Hay Bale Dewatering Structure). Dewatering structures will be sized appropriately based on the maximum pumping rate as described in Figure 4. Locations of these structures are shown on Figure 1. During the execution of grouting activities, these structures will only be used for surplus clean water discharges as needed, such as stormwater or snow melt water that collects at the site. Enbridge has and will continue to monitor water discharged from the strawbale structures at the seep location for compliance with MPCA Construction Stormwater General Permit and Section 401 WQC conditions, in addition to Minnesota water quality standards. Enbridge has acknowledged and will ensure that at least one EI and one IEM must be on-site throughout the duration of all grouting activities and will monitor water management activities. Enbridge has also indicated that they will ensure its contractor(s) will not conduct any grouting activities unless both and EI and IEM are on site. Additional water quality and water level monitoring will occur as described in Section 6.
5.1.3 MPCA Water Quality Monitoring Enbridge has and will continue to monitor the water discharged from the groundwater expressions discharging to the rock-lined swale (Section 5.1.1) for compliance with MPCA Construction Stormwater General Permit and Section 401 Water Quality Certification conditions, in addition to Minnesota water quality standards as further described below. Although Enbridge is not currently planning on utilizing the dewatering structures near the seep locations during the implementation of the corrective action as described in Section 5.1.2, the following water quality monitoring procedures will also apply to those dewatering structures if utilized. Enbridge has acknowledged and will ensure that at least one EI and one IEM must be on-site throughout the duration of all grouting activities and will monitor water management activities. Enbridge has also indicated that they will ensure its contractor(s) will not conduct any grouting activities unless both and EI and IEM are on site.
The wetland complex (w-50n19w22-a) where the groundwater expressions traverse via the rock-lined sump, and where the current dewatering structures discharge, is a Class 2D wetland regulated by the
22
MPCA and subject to water quality standards outlined in Minn. Rules 7050.0222, Subp. 6. As described in Sections 5.1.1 and 5.1.2, the majority, if not all of the water directed to the rock-lined structure exits into the north-south running unnamed stream/ditch feature (s-50n19w27-a) which is managed by the FDL. The amount of water being directed to the rock-lined structure during the implementation of the corrective actions is anticipated to be minimal – currently there is no flow from the groundwater expressions due to ongoing pumping activities that will continue during the corrective action implementation. Further, Enbridge will only direct stormwater or snow melt water to the dewatering structures on-site as needed during implementation of the corrective actions.
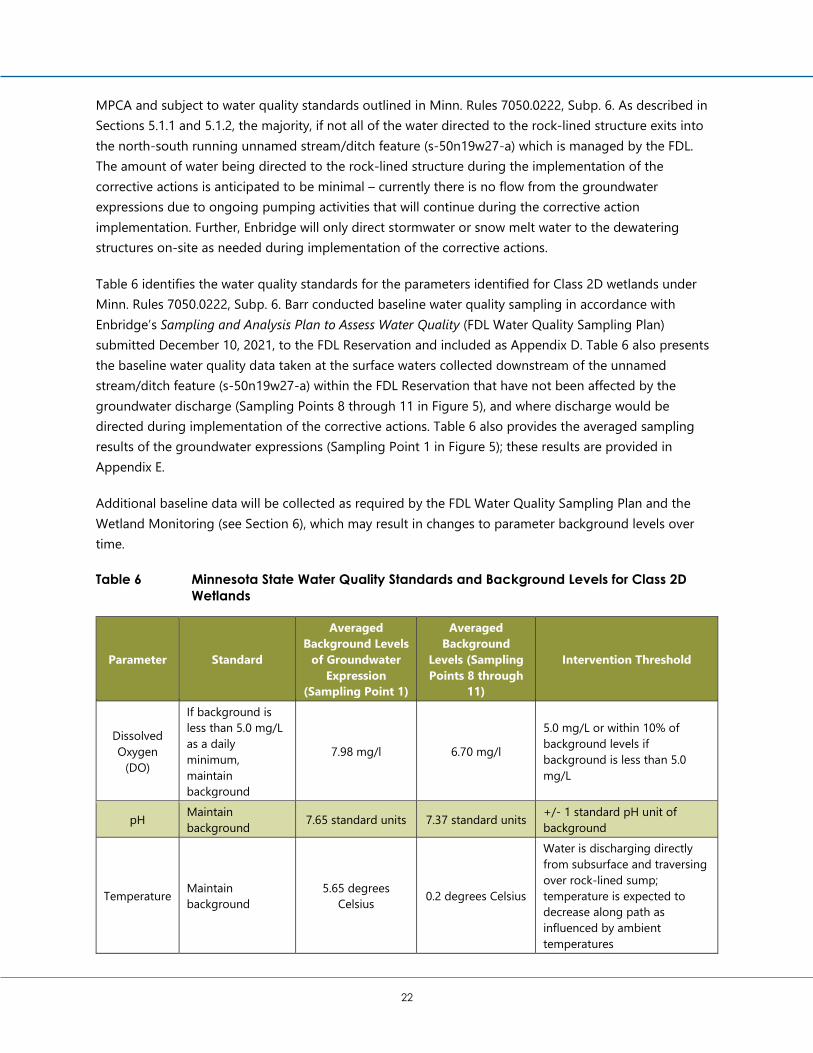
Table 6 identifies the water quality standards for the parameters identified for Class 2D wetlands under Minn. Rules 7050.0222, Subp. 6. Barr conducted baseline water quality sampling in accordance with Enbridge’s Sampling and Analysis Plan to Assess Water Quality (FDL Water Quality Sampling Plan) submitted December 10, 2021, to the FDL Reservation and included as Appendix D. Table 6 also presents the baseline water quality data taken at the surface waters collected downstream of the unnamed stream/ditch feature (s-50n19w27-a) within the FDL Reservation that have not been affected by the groundwater discharge (Sampling Points 8 through 11 in Figure 5), and where discharge would be directed during implementation of the corrective actions. Table 6 also provides the averaged sampling results of the groundwater expressions (Sampling Point 1 in Figure 5); these results are provided in Appendix E.
Additional baseline data will be collected as required by the FDL Water Quality Sampling Plan and the Wetland Monitoring (see Section 6), which may result in changes to parameter background levels over time.
Table 6 Minnesota State Water Quality Standards and Background Levels for Class 2D Wetlands
Parameter Standard
Averaged Background Levels
of Groundwater Expression
(Sampling Point 1)
Averaged Background
Levels (Sampling Points 8 through
11)
Intervention Threshold
Dissolved Oxygen
(DO)
If background is less than 5.0 mg/L as a daily minimum, maintain background
7.98 mg/l 6.70 mg/l
5.0 mg/L or within 10% of background levels if background is less than 5.0 mg/L
pH Maintain background 7.65 standard units 7.37 standard units +/- 1 standard pH unit of
background
Temperature Maintain background
5.65 degrees Celsius 0.2 degrees Celsius
Water is discharging directly from subsurface and traversing over rock-lined sump; temperature is expected to decrease along path as influenced by ambient temperatures
23
Parameter Standard
Averaged Background Levels
of Groundwater Expression
(Sampling Point 1)
Averaged Background
Levels (Sampling Points 8 through
11)
Intervention Threshold
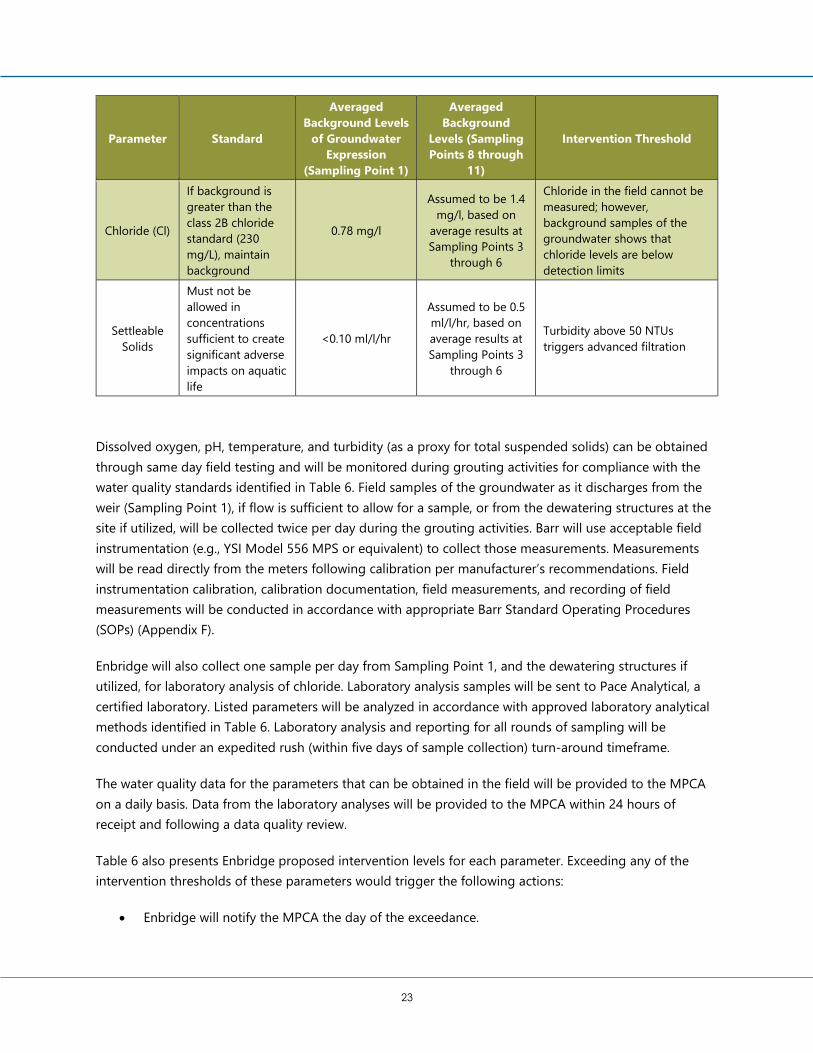
Chloride (Cl)
If background is greater than the class 2B chloride standard (230 mg/L), maintain background
0.78 mg/l
Assumed to be 1.4 mg/l, based on
average results at Sampling Points 3
through 6
Chloride in the field cannot be measured; however, background samples of the groundwater shows that chloride levels are below detection limits
Settleable Solids
Must not be allowed in concentrations sufficient to create significant adverse impacts on aquatic life
<0.10 ml/l/hr
Assumed to be 0.5 ml/l/hr, based on average results at Sampling Points 3
through 6
Turbidity above 50 NTUs triggers advanced filtration
Dissolved oxygen, pH, temperature, and turbidity (as a proxy for total suspended solids) can be obtained through same day field testing and will be monitored during grouting activities for compliance with the water quality standards identified in Table 6. Field samples of the groundwater as it discharges from the weir (Sampling Point 1), if flow is sufficient to allow for a sample, or from the dewatering structures at the site if utilized, will be collected twice per day during the grouting activities. Barr will use acceptable field instrumentation (e.g., YSI Model 556 MPS or equivalent) to collect those measurements. Measurements will be read directly from the meters following calibration per manufacturer’s recommendations. Field instrumentation calibration, calibration documentation, field measurements, and recording of field measurements will be conducted in accordance with appropriate Barr Standard Operating Procedures (SOPs) (Appendix F).
Enbridge will also collect one sample per day from Sampling Point 1, and the dewatering structures if utilized, for laboratory analysis of chloride. Laboratory analysis samples will be sent to Pace Analytical, a certified laboratory. Listed parameters will be analyzed in accordance with approved laboratory analytical methods identified in Table 6. Laboratory analysis and reporting for all rounds of sampling will be conducted under an expedited rush (within five days of sample collection) turn-around timeframe.
The water quality data for the parameters that can be obtained in the field will be provided to the MPCA on a daily basis. Data from the laboratory analyses will be provided to the MPCA within 24 hours of receipt and following a data quality review.
Table 6 also presents Enbridge proposed intervention levels for each parameter. Exceeding any of the intervention thresholds of these parameters would trigger the following actions:
• Enbridge will notify the MPCA the day of the exceedance.
24
• Additional filtration or corrective actions will be implemented, as appropriate, to bring discharge into compliance with the water quality standards identified in Table 6.
• If Enbridge cannot maintain compliance with the water quality standards, the water will be hauled off-site for disposal at a WWTP.
Corrective actions to bring the discharge into compliance may include aeration to increase DO or routing the discharge water through additional geotextile fabric bags within strawbale dewatering structures (see Figure 4 for a Typical Straw/Hay Bale Dewatering Structure) for settleable solids. If the pH of the water is outside of the intervention threshold (6.4-8.4), the water will be hauled off-site for disposal at a WWTP as discussed in Section 5.3.
Because this is an ongoing expression of groundwater, Enbridge is not able to stop the discharge from occurring without moving forward with the implementation of the corrective action.
Additional water quality sampling will occur as prescribed in the FDL Water Quality Sampling Plan (Appendix D) and wetland water quality monitoring will occur as described in Section 6.2.
5.2 Water Management within the FDL Reservation 5.2.1 Clean Water Discharge Location #1 (Within FDL Reservation) During the implementation of the corrective action, it is anticipated that dewatering efforts will require flow rates with anticipated rates in the range of 2,000-5,000 gpm for approximately four weeks. The flow rate is based on a combination of the anticipated flow rate from each of the six dewatering well flow rates of 350-400 (2,400 gpm total) and the anticipated flow rate of each of the dewatering/grout injection wells of 100 gpm (1,900 gpm total). Flow rate estimates are based on observation of pumping during the installation of the GIP wells and borings and the aquifer pump test. The total flow will likely be reduced as the grouting activities commence.
Due to the higher volumes of water that will be pumped during the execution of the corrective action, this water will be routed by a 16-inch pipe to northeast to the “Clean Water Discharge Location #1” within the FDL Reservation on County Administered Tax Forfeit property, shown on Figure 5. Discharge water from the pumping wells will continue to be directed to frac tanks via the 16-inch pipe to allow for settling of suspended solids. When turbidity from frac tanks exceeds 50 Nephelometric Units (NTUs), Enbridge engages a sock filtration system to further reduce settable solids, and subsequently discharges to geotextile bags within strawbale settling structures located in uplands located at the “Clean Water Discharge Location #1”. The strawbale structures will be designed in accordance with Section 5.0 of Enbridge’s Environmental Protection Plan (EPP) and the Typical Straw/Hay Bale Dewatering Structure provided in Figure 4. Based on a review of topographic features, the water will likely disperse over the adjacent upland and wetland areas and will eventually converge with unnamed stream (kittle number S-002-017-006-002, public water), which is a tributary to Stoney Brook (kittle number S-002-017, public water), as illustrated in Figure 5. Enbridge will monitor the water discharged from these strawbale structures for compliance with the FDL Water Quality Certification and Enbridge’s EPP.
25
Water removed during the dewatering well and dewatering/grout injection well installation will be monitored by the EIs for visible grout and pH using a pH meter several times per day. If the water is outside of the intervention threshold of 6.4-8.4 standard unit range for pH, the water will be hauled off-site for disposal at a WWTP as discussed in Section 5.3.
Corrective actions to bring the discharge into compliance may include aeration to increase DO or routing the discharge water through additional geotextile fabric bags within strawbale dewatering structures (see Figure 4 for a Typical Straw/Hay Bale Dewatering Structure) for settleable solids.
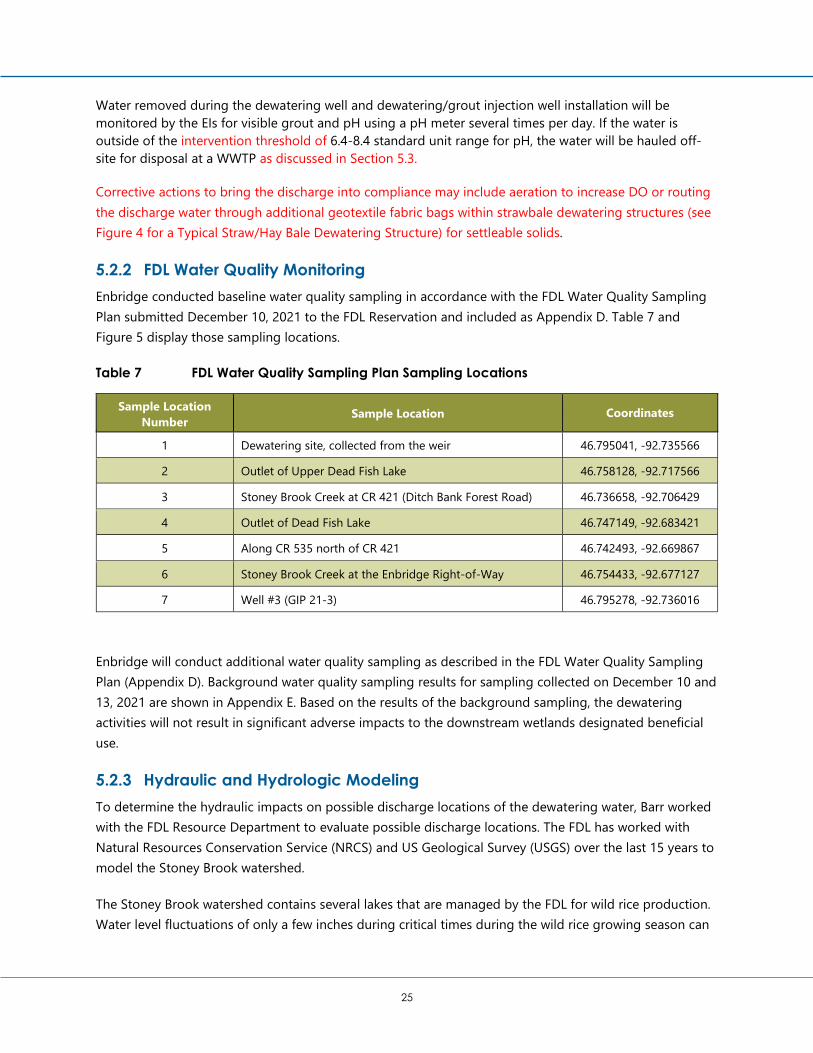
5.2.2 FDL Water Quality Monitoring Enbridge conducted baseline water quality sampling in accordance with the FDL Water Quality Sampling Plan submitted December 10, 2021 to the FDL Reservation and included as Appendix D. Table 7 and Figure 5 display those sampling locations.
Table 7 FDL Water Quality Sampling Plan Sampling Locations
Sample Location Number
Sample Location Coordinates
1 Dewatering site, collected from the weir 46.795041, -92.735566
2 Outlet of Upper Dead Fish Lake 46.758128, -92.717566
3 Stoney Brook Creek at CR 421 (Ditch Bank Forest Road) 46.736658, -92.706429
4 Outlet of Dead Fish Lake 46.747149, -92.683421
5 Along CR 535 north of CR 421 46.742493, -92.669867
6 Stoney Brook Creek at the Enbridge Right-of-Way 46.754433, -92.677127
7 Well #3 (GIP 21-3) 46.795278, -92.736016
Enbridge will conduct additional water quality sampling as described in the FDL Water Quality Sampling Plan (Appendix D). Background water quality sampling results for sampling collected on December 10 and 13, 2021 are shown in Appendix E. Based on the results of the background sampling, the dewatering activities will not result in significant adverse impacts to the downstream wetlands designated beneficial use.
5.2.3 Hydraulic and Hydrologic Modeling To determine the hydraulic impacts on possible discharge locations of the dewatering water, Barr worked with the FDL Resource Department to evaluate possible discharge locations. The FDL has worked with Natural Resources Conservation Service (NRCS) and US Geological Survey (USGS) over the last 15 years to model the Stoney Brook watershed.
The Stoney Brook watershed contains several lakes that are managed by the FDL for wild rice production. Water level fluctuations of only a few inches during critical times during the wild rice growing season can
26
negatively impact growth and harvesting. The most critical period is during the late spring/summer months.
Clean water that is generated during the sealing activities will be discharged to the Arrowhead Tributary. Deadfish Lake, which is upstream of where the Arrowhead Tributary enters Stoney Brook, is one such basin that is most vulnerable to water level fluctuations.
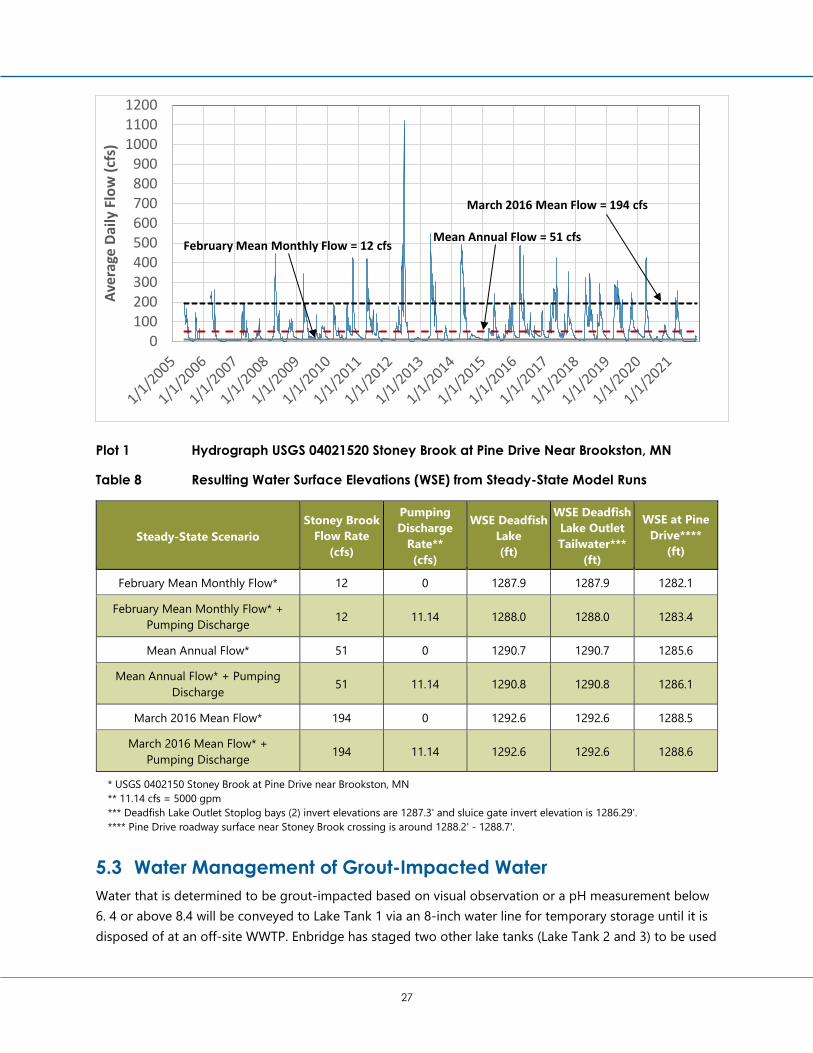
To evaluate the water level impacts of the pumped discharge on Stoney Brook and Deadfish Lake, a draft 2-dimensional HEC-RAS model that is being developed by the USGS was used. Steady-state flow conditions were modeled to represent various flow conditions in the main stem of Stoney Brook downstream of Deadfish Lake where the tributary flow would be introduced. Daily average stream flows from 2005 to 2021 were evaluated for Stoney Brook at the Pine Drive gage (Plot 1). The evaluated flows include the following:
• February mean flow of 12 cubic feet per second (cfs) – assumed start of pumping
• Mean annual flow of 51 cfs - typical summer flow
• March 2016 flow of 194 cfs – flood flow condition
These results were compared to the same model conditions, but with the addition of 5,000 gpm (11.14 cfs) steady-state flow entering the model at the Arrowhead Tributary (Table 8). This is anticipated to be the maximum dewatering flow rate. Of the conditions evaluated, the smaller stream flow (February mean monthly flow of 12 cfs) has the largest associated water level impact due to the pumping discharge. For this condition, the maximum water surface elevation increase at Deadfish Lake is 0.1 foot. For the same condition, the water surface elevation increase on Stoney Brook at Pine Drive is 1.3 feet, yet the roadway is not overtopped.
For the mean annual flow of 51 cfs, the maximum water surface elevation increase at Deadfish Lake is also 0.1 foot. For the March 2016 flood flow (194 cfs), the pumping would have zero impact on lake levels.
In conclusion, it does not appear that the introduction of 5,000 gpm to the Arrowhead Tributary would have a significant impact on the water level of Deadfish Lake for any of the evaluated conditions (low flow, typical summer flow, and flood flow).
27
Plot 1 Hydrograph USGS 04021520 Stoney Brook at Pine Drive Near Brookston, MN
Table 8 Resulting Water Surface Elevations (WSE) from Steady-State Model Runs
Steady-State Scenario Stoney Brook
Flow Rate (cfs)
Pumping Discharge
Rate** (cfs)
WSE Deadfish Lake (ft)
WSE Deadfish Lake Outlet Tailwater***
(ft)
WSE at Pine Drive****
(ft)
February Mean Monthly Flow* 12 0 1287.9 1287.9 1282.1
February Mean Monthly Flow* + Pumping Discharge 12 11.14 1288.0 1288.0 1283.4
Mean Annual Flow* 51 0 1290.7 1290.7 1285.6
Mean Annual Flow* + Pumping Discharge 51 11.14 1290.8 1290.8 1286.1
March 2016 Mean Flow* 194 0 1292.6 1292.6 1288.5
March 2016 Mean Flow* + Pumping Discharge 194 11.14 1292.6 1292.6 1288.6
* USGS 0402150 Stoney Brook at Pine Drive near Brookston, MN ** 11.14 cfs = 5000 gpm *** Deadfish Lake Outlet Stoplog bays (2) invert elevations are 1287.3' and sluice gate invert elevation is 1286.29'. **** Pine Drive roadway surface near Stoney Brook crossing is around 1288.2' - 1288.7'.
5.3 Water Management of Grout-Impacted Water Water that is determined to be grout-impacted based on visual observation or a pH measurement below 6. 4 or above 8.4 will be conveyed to Lake Tank 1 via an 8-inch water line for temporary storage until it is disposed of at an off-site WWTP. Enbridge has staged two other lake tanks (Lake Tank 2 and 3) to be used
0100200300400500600700800900
100011001200
Aver
age
Daily
Flo
w (c
fs)
Mean Annual Flow = 51 cfsFebruary Mean Monthly Flow = 12 cfs
March 2016 Mean Flow = 194 cfs
28
for storage of grout-impacted water as needed. The volume of Lake Tank 1 is 1.25 million gallons. The volume of Lake Tank 2 and Lake Tank 3 is 2.3 million gallons each. A truck-mounted heater will be located at the seep location and will heat the water as it is conveyed form the site to Lake Tank 1 to prevent the line from freezing. At Lake Tank 1, pumps will be used to continuously circulate the water within the tank to prevent freezing. An additional heater will be available at Lake Tank 1 to use as needed when pushing water to Lake Tank 2. Preliminary groundwater volume estimates for water that is grout-impacted is 1,000 gallons per dewatering/discharge well during well installation.
Enbridge has acknowledged and will ensure that at least one EI and one IEM must be on-site throughout the duration of all grouting activities. The EI and IEM will be observing the work area for any signs of surface return of visible grout or grout-impacted water, in addition to measuring the pH of discharged water as described above. Enbridge has also indicated that they will ensure its contractor(s) will not conduct any grouting activities unless both an EI and IEM are on site. Localized barriers of sandbags or other blocking materials will be placed to contain grout and grout-impacted water for collection and pumping to the Lake Tanks. Sumps will be constructed along drainageways to allow for concentration and collection of the grout-impacted water.
29
6 Wetland Monitoring In addition to the MPCA Water Quality Monitoring described in Section 5.1.3 and the FDL Water Quality Sampling Plan that will occur within the FDL Reservation (Appendix D), Enbridge will conduct additional water chemistry and vegetation monitoring as requested by the MPCA and MDNR on January 7, 2022. Enbridge met with the MPCA, MDNR and FDL on January 14, 2022 to discuss and further refine these wetland monitoring procedures, as described below.
6.1 Monitoring Locations Enbridge has installed shallow four 2-inch diameter PVC piezometers screened sufficiently deep to evaluate the water table and surface water within the wetland receiving the discharged groundwater as identified in Table 9 and Figure 1. Piezometers were installed by hand to reduce impacts to the wetland; the confining unit of the aquifer was not penetrated during installation. All shallow piezometers were installed with a sand pack around the screens, with bentonite present from the ground surface to 0.3 feet below ground surface in order to provide a surface seal. All shallow piezometers were developed using a dedicated bailer until the water bailed from the piezometers was visually clear.
The piezometer locations shown in Figure 1 were identified by the MPCA and MDNR to monitor the impacts of the groundwater discharge and grouting activities at the site, up-gradient of the site, side gradient of the site and away from the drainage ditch.
One of the proposed shallow piezometers (MP1102-GW-06) has not yet been installed because the location proposed by MPCA and MDNR has been inaccessible during current site conditions. An alternate location for that piezometer has been identified and approved by the agencies and will be installed the week of February 14, 2022, within the same plant community as the originally proposed location (Northern Rich Alder Swamp (FPn73). The alternate location is shown on Figure 1.
A stilling well (MP1102-SW-04) has been installed within the north-south running unnamed stream/ditch feature (s-50n19w27-a) that is regulated by the FDL to monitor the impact of the discharged groundwater on the water levels within the drainage ditch. The MPCA and MDNR requested the installation of the stilling well to allow for comparison of the wetland area water levels to the ditch water levels and possible impacts to downstream areas.
The stilling well consists of 24 inches of 2-inch diameter slotted PVC screen to monitor the entire depth of the drainage ditch and is attached to a fence post installed approximately 2.0-2.5 feet deep into the ditch bottom to ensure the stilling well does not move.
Vibrating wire piezometers (VWPs) will be installed in the shallow piezometers and in the stilling well prior to implementation of corrective actions at MP 1102.5. Water level measurements will be collected by the VWPs at least every 15 minutes while groundwater is discharging, and on-site grouting activities are conducted. Once groundwater ceases to discharge and on-site activities cease, water level monitoring will be reduced to hourly.
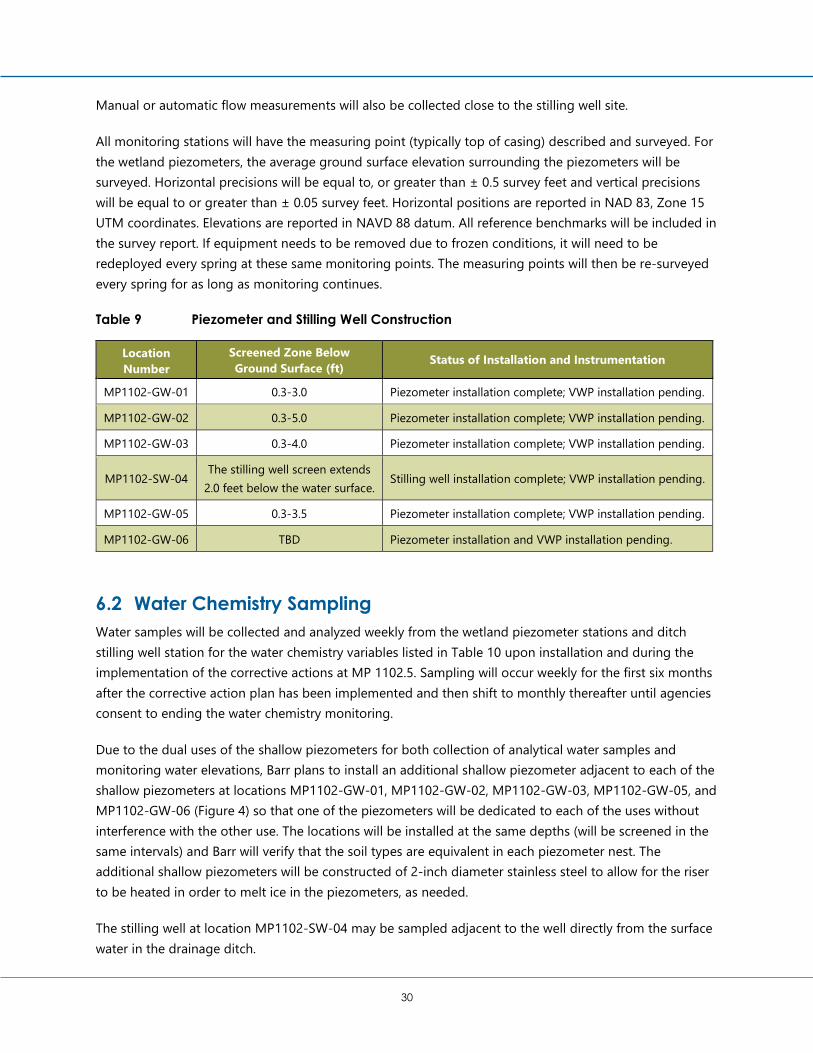
30
Manual or automatic flow measurements will also be collected close to the stilling well site.
All monitoring stations will have the measuring point (typically top of casing) described and surveyed. For the wetland piezometers, the average ground surface elevation surrounding the piezometers will be surveyed. Horizontal precisions will be equal to, or greater than ± 0.5 survey feet and vertical precisions will be equal to or greater than ± 0.05 survey feet. Horizontal positions are reported in NAD 83, Zone 15 UTM coordinates. Elevations are reported in NAVD 88 datum. All reference benchmarks will be included in the survey report. If equipment needs to be removed due to frozen conditions, it will need to be redeployed every spring at these same monitoring points. The measuring points will then be re-surveyed every spring for as long as monitoring continues.
Table 9 Piezometer and Stilling Well Construction
Location Number
Screened Zone Below Ground Surface (ft)
Status of Installation and Instrumentation
MP1102-GW-01 0.3-3.0 Piezometer installation complete; VWP installation pending.
MP1102-GW-02 0.3-5.0 Piezometer installation complete; VWP installation pending.
MP1102-GW-03 0.3-4.0 Piezometer installation complete; VWP installation pending.
MP1102-SW-04 The stilling well screen extends
2.0 feet below the water surface. Stilling well installation complete; VWP installation pending.
MP1102-GW-05 0.3-3.5 Piezometer installation complete; VWP installation pending.
MP1102-GW-06 TBD Piezometer installation and VWP installation pending.
6.2 Water Chemistry Sampling Water samples will be collected and analyzed weekly from the wetland piezometer stations and ditch stilling well station for the water chemistry variables listed in Table 10 upon installation and during the implementation of the corrective actions at MP 1102.5. Sampling will occur weekly for the first six months after the corrective action plan has been implemented and then shift to monthly thereafter until agencies consent to ending the water chemistry monitoring.
Due to the dual uses of the shallow piezometers for both collection of analytical water samples and monitoring water elevations, Barr plans to install an additional shallow piezometer adjacent to each of the shallow piezometers at locations MP1102-GW-01, MP1102-GW-02, MP1102-GW-03, MP1102-GW-05, and MP1102-GW-06 (Figure 4) so that one of the piezometers will be dedicated to each of the uses without interference with the other use. The locations will be installed at the same depths (will be screened in the same intervals) and Barr will verify that the soil types are equivalent in each piezometer nest. The additional shallow piezometers will be constructed of 2-inch diameter stainless steel to allow for the riser to be heated in order to melt ice in the piezometers, as needed.
The stilling well at location MP1102-SW-04 may be sampled adjacent to the well directly from the surface water in the drainage ditch.
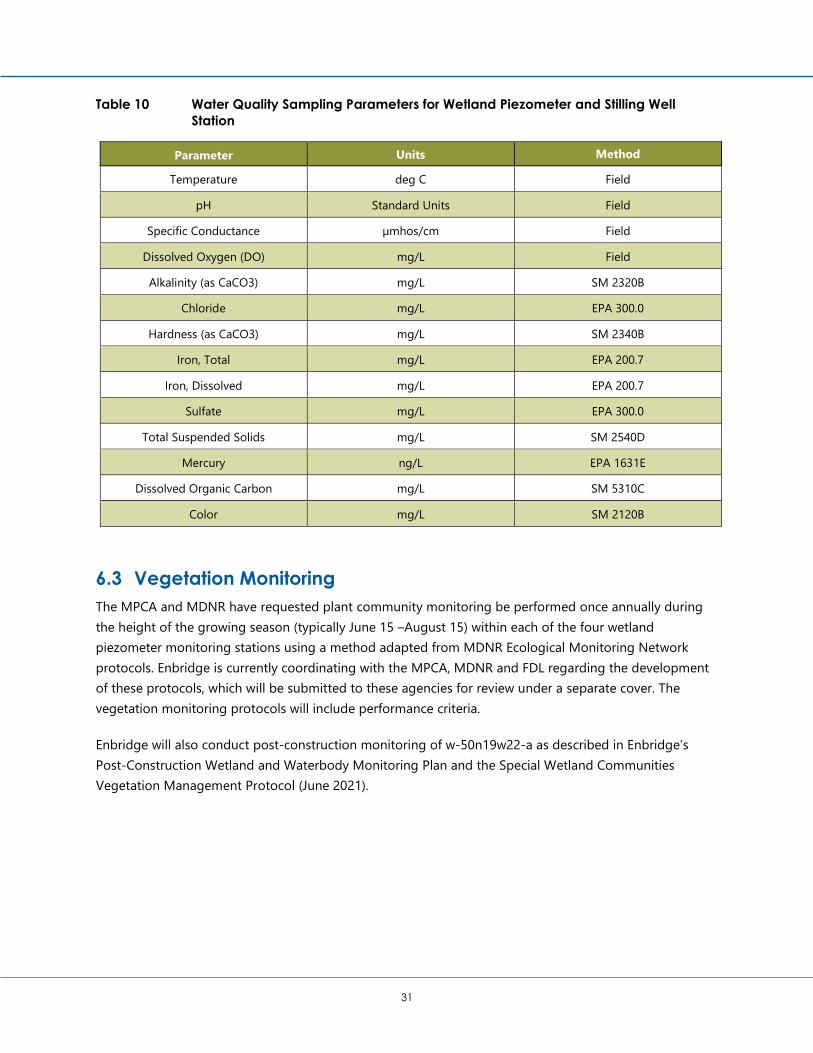
31
Table 10 Water Quality Sampling Parameters for Wetland Piezometer and Stilling Well Station
Parameter Units Method
Temperature deg C Field
pH Standard Units Field
Specific Conductance µmhos/cm Field
Dissolved Oxygen (DO) mg/L Field
Alkalinity (as CaCO3) mg/L SM 2320B
Chloride mg/L EPA 300.0
Hardness (as CaCO3) mg/L SM 2340B
Iron, Total mg/L EPA 200.7
Iron, Dissolved mg/L EPA 200.7
Sulfate mg/L EPA 300.0
Total Suspended Solids mg/L SM 2540D
Mercury ng/L EPA 1631E
Dissolved Organic Carbon mg/L SM 5310C
Color mg/L SM 2120B
6.3 Vegetation Monitoring The MPCA and MDNR have requested plant community monitoring be performed once annually during the height of the growing season (typically June 15 –August 15) within each of the four wetland piezometer monitoring stations using a method adapted from MDNR Ecological Monitoring Network protocols. Enbridge is currently coordinating with the MPCA, MDNR and FDL regarding the development of these protocols, which will be submitted to these agencies for review under a separate cover. The vegetation monitoring protocols will include performance criteria.
Enbridge will also conduct post-construction monitoring of w-50n19w22-a as described in Enbridge’s Post-Construction Wetland and Waterbody Monitoring Plan and the Special Wetland Communities Vegetation Management Protocol (June 2021).
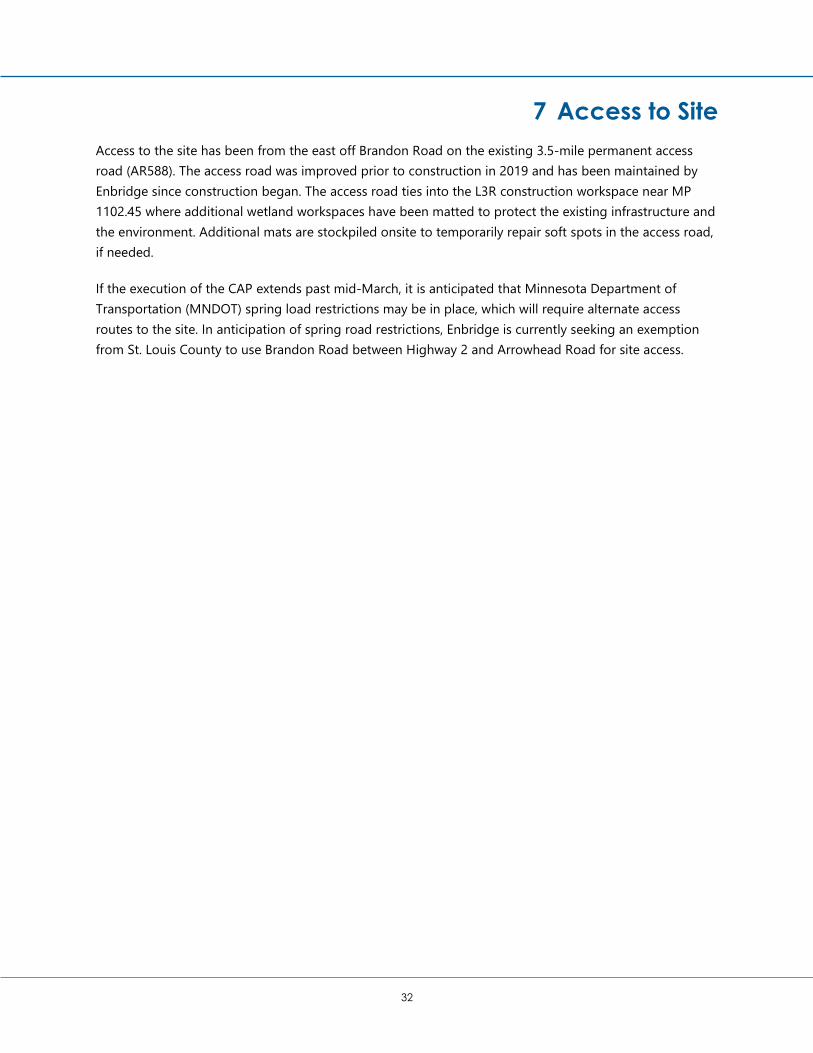
32
7 Access to Site Access to the site has been from the east off Brandon Road on the existing 3.5-mile permanent access road (AR588). The access road was improved prior to construction in 2019 and has been maintained by Enbridge since construction began. The access road ties into the L3R construction workspace near MP 1102.45 where additional wetland workspaces have been matted to protect the existing infrastructure and the environment. Additional mats are stockpiled onsite to temporarily repair soft spots in the access road, if needed.
If the execution of the CAP extends past mid-March, it is anticipated that Minnesota Department of Transportation (MNDOT) spring load restrictions may be in place, which will require alternate access routes to the site. In anticipation of spring road restrictions, Enbridge is currently seeking an exemption from St. Louis County to use Brandon Road between Highway 2 and Arrowhead Road for site access.
33
8 Schedule Enbridge’s contractors are prepared to continue work at this site with agency approval of this CAP. Contractors will work both day and night shifts during the grouting process and Enbridge has acknowledged and will ensure that at least one EI and one IEM must be on-site throughout the duration of all grouting activities. Enbridge has also indicated that they will ensure its contractor(s) will not conduct any grouting activities unless both and EI and IEM are on site.
To maintain the schedule requested by the FDL of mid-March 2022, and to avoid complications associated with spring melt and associated road restrictions and maintenance, Enbridge is requesting approval of this CAP by February 10, 2022.
Enbridge has acknowledged it is the company's responsibility to furnish to FDL, MPCA, and MDH all information necessary to facilitate each respective agency's determination (approval/disapproval) on the proposed use of the chemical admixtures. Failure to do so in a timely manner will likely delay each agency's decision-making process. Enbridge has further acknowledged it is the company's responsibility to provide to the FDL and MPCA, in part, specific data, some of which may be considered proprietary, related to the content of each proposed admixture, and that the FDL and MPCA cannot complete its required review without this information.
Enbridge is also applying for a variance from the MDH for the proposed grout methodology and understands that the chemical admixtures proposed in Section 4.5 will require review and approval by the FDL, MPCA, and MDH. The variance and approval for the proposed admixtures will not be needed until grout injection starts, which is anticipated to occur on February 28, 2022. Therefore, Enbridge requests any subsequent decisions on the variance and use of the chemical admixtures by February 28, 2022.
34
9 Monitoring and Reporting Flow rates from the dewatering wells will be recorded using one or more totalizing flow meters. Water levels and water pressures will be monitored in the grout injection wells. Non-grout-impacted water discharged from the groundwater expressions at the seep will be measured through the existing weir box.
Groundwater elevation data will be tabulated and provided in electronic data format on a weekly basis during the implementation of the corrective action. The data submittal will include all corrected data collected to date and will include a legend clearly identifying the monitoring point location (including unique well number). The data submittal will also include information on the timing of site activities that could affect water elevations such as the time of initial groundwater discharge, the beginning and end of grouting, and other relevant site activities.
Quantities of grout pumped will also be recorded.
Enbridge will prepare and submit a Corrective Action Implementation Report within two weeks of completion of corrective action activities to the agencies, which will include monitoring data.
A Long-Term Groundwater and Vegetative Monitoring and Site Inspection Plan will be developed and submitted following the corrective action(s) taken at the site. The monitoring plan will include specific performance criteria and information on how, where, and how often the area will be visually monitored for breakthrough groundwater discharges.

Figures
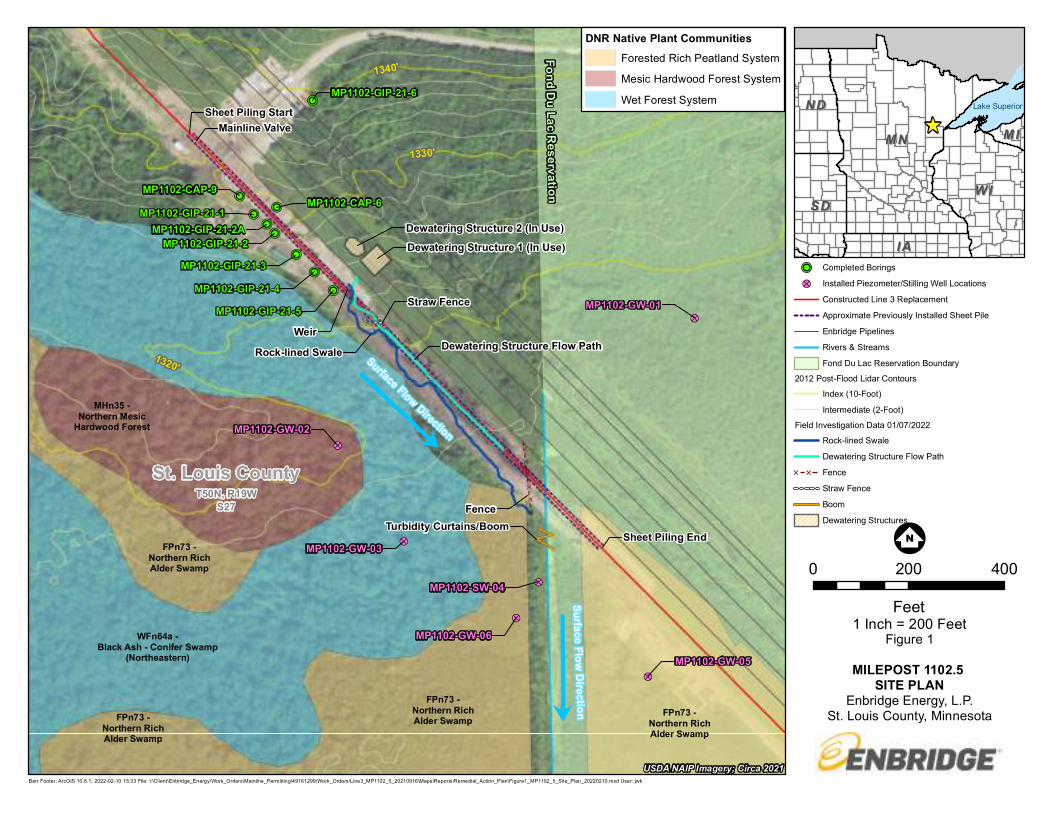
!P
!P
!P
!P
!P
!P
!P!P
!P
!?
!?
!?
!?
!?
!?
Fond Du Lac Reservation
Sheet Piling End
Sheet Piling StartMainline Valve
Weir
Dewatering Structure 1 (In Use)Dewatering Structure 2 (In Use)
Straw Fence
Rock-lined Swale Dewatering Structure Flow Path
FenceTurbidity Curtains/Boom
St. Louis CountyT50N, R19W
S27
MP1102-GIP-21-1
MP1102-GIP-21-2
MP1102-GIP-21-4MP1102-GIP-21-5
MP1102-GIP-21-3
MP1102-GIP-21-6
MP1102-GIP-21-2A
MP1102-CAP-6MP1102-CAP-9
FPn73 -Northern RichAlder Swamp
FPn73 -Northern RichAlder Swamp
FPn73 -Northern RichAlder Swamp
FPn73 -Northern RichAlder Swamp
WFn64a -Black Ash - Conifer Swamp
(Northeastern)
MHn35 -Northern Mesic
Hardwood Forest
MP1102-GW-01
MP1102-GW-02
MP1102-GW-03
MP1102-SW-04
MP1102-GW-05
MP1102-GW-06
1340'
1330'
1320'
Barr Footer: ArcGIS 10.8.1, 2022-02-10 15:33 File: I:\Client\Enbridge_Energy\Work_Orders\Mainline_Permitting\49161299\Work_Orders\Line3_MP1102_5_20210916\Maps\Reports\Remedial_Action_Plan\Figure1_MP1102_5_Site_Plan_20220210.mxd User: jwk
1 Inch = 200 Feet
!P Completed Borings
!? Installed Piezometer/Stilling Well Locations
Constructed Line 3 Replacement
Approximate Previously Installed Sheet Pile
Enbridge Pipelines
Rivers & Streams
Fond Du Lac Reservation Boundary
2012 Post-Flood Lidar Contours
Index (10-Foot)
Intermediate (2-Foot)
Field Investigation Data 01/07/2022
Rock-lined Swale
Dewatering Structure Flow Path
[ [ Fence
Straw Fence
Boom
Dewatering Structures
0 200 400
Feet
Figure 1
MILEPOST 1102.5 SITE PLAN
Enbridge Energy, L.P.St. Louis County, Minnesota
!;N
^Lake Superior
IAIA
MIMIMNMN
NDND
SDSDWIWI
USDA NAIP Imagery; Circa 2021
7
7
Surface Flow Direction
Surface Flow Direction
DNR Native Plant CommunitiesForested Rich Peatland System
Mesic Hardwood Forest System
Wet Forest System
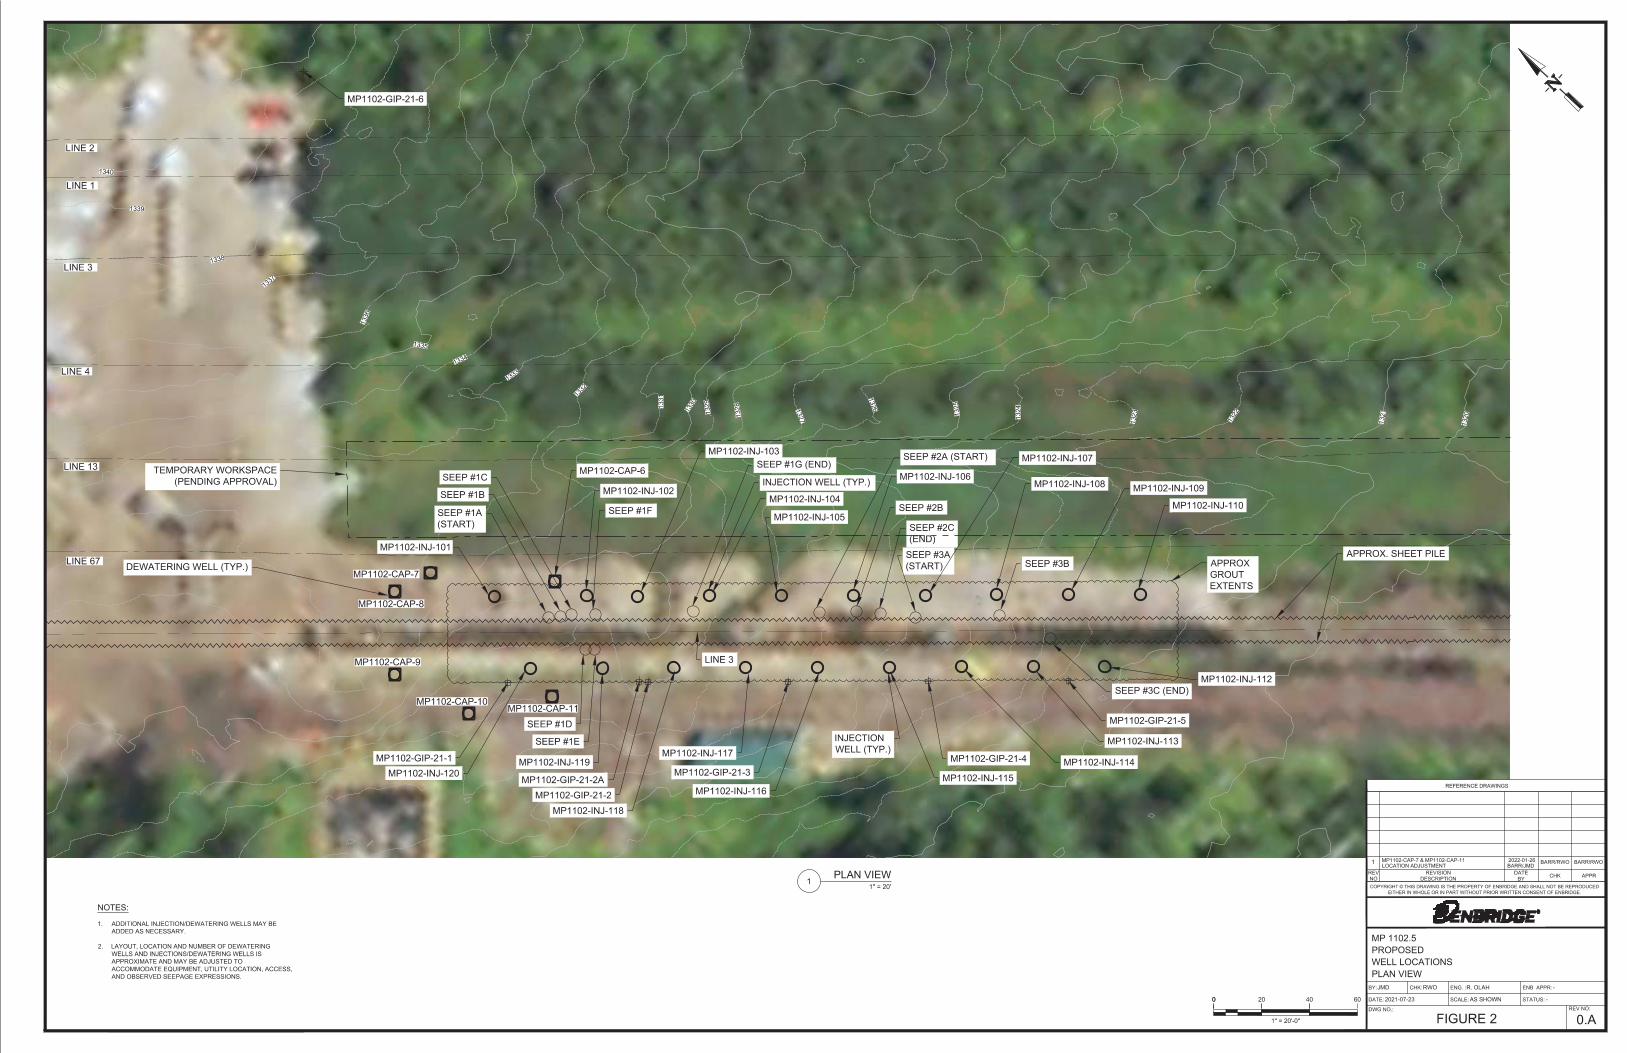
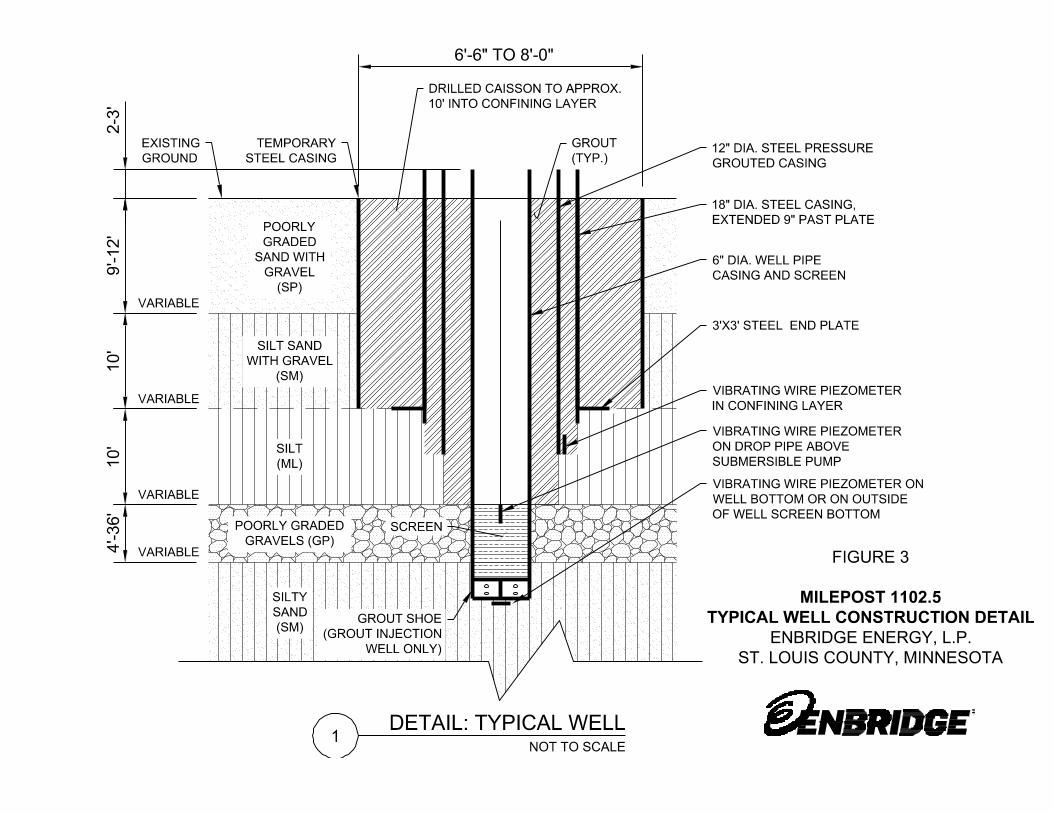
9'-12'
10'
10'
4'-36'
POORLY
GRADED
SAND WITH
GRAVEL
(SP)
SILT SAND
WITH GRAVEL
(SM)
SILT
(ML)
POORLY GRADED
GRAVELS (GP)
1
NOT TO SCALE
DETAIL: TYPICAL WELL
VARIABLE
VARIABLE
12" DIA. STEEL PRESSURE
GROUTED CASING
6" DIA. WELL PIPE
CASING AND SCREEN
SCREEN
EXISTING
GROUND
6'-6" TO 8'-0"
DRILLED CAISSON TO APPROX.
10' INTO CONFINING LAYER
GROUT
(TYP.)
VARIABLE
VARIABLE
18" DIA. STEEL CASING,
EXTENDED 9" PAST PLATE
TEMPORARY
STEEL CASING
2-3'
3'X3' STEEL END PLATE
VIBRATING WIRE PIEZOMETER
IN CONFINING LAYER
VIBRATING WIRE PIEZOMETER
ON DROP PIPE ABOVE
SUBMERSIBLE PUMP
VIBRATING WIRE PIEZOMETER ON
WELL BOTTOM OR ON OUTSIDE
OF WELL SCREEN BOTTOM
SILTY
SAND
(SM)
GROUT SHOE
(GROUT INJECTION
WELL ONLY)
FIGURE 3
MILEPOST 1102.5
TYPICAL WELL CONSTRUCTION DETAIL
ENBRIDGE ENERGY, L.P.
ST. LOUIS COUNTY, MINNESOTA
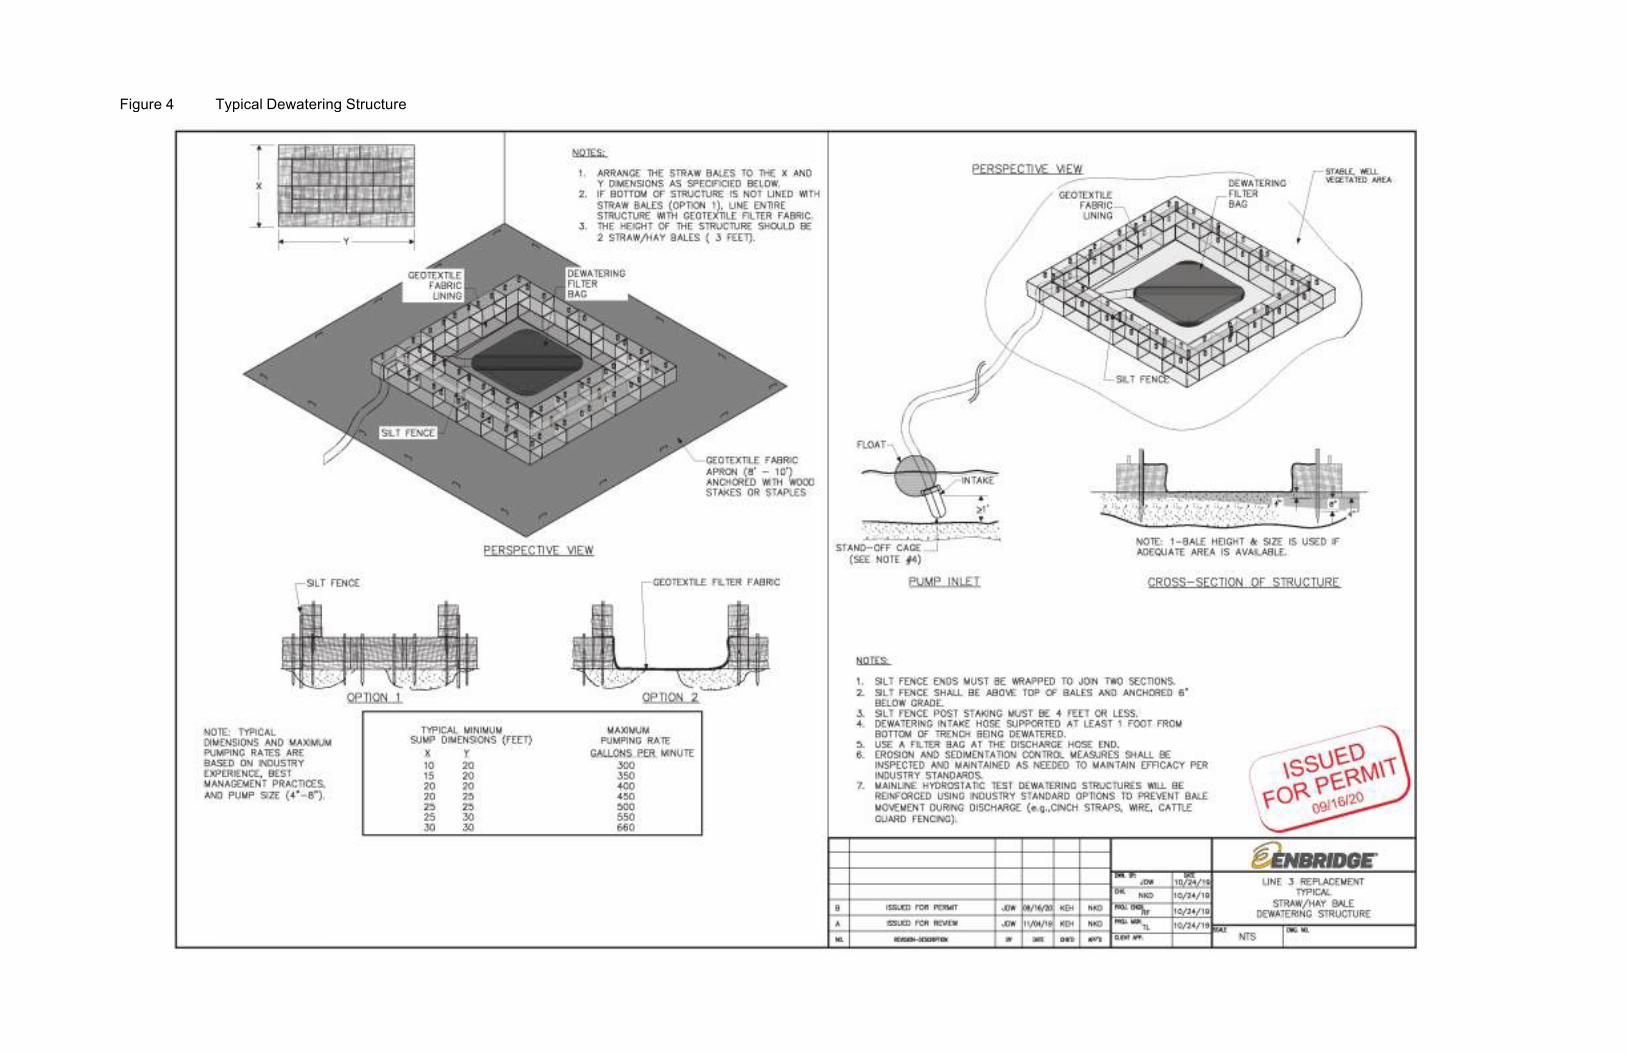
Figure 4 Typical Dewatering Structure
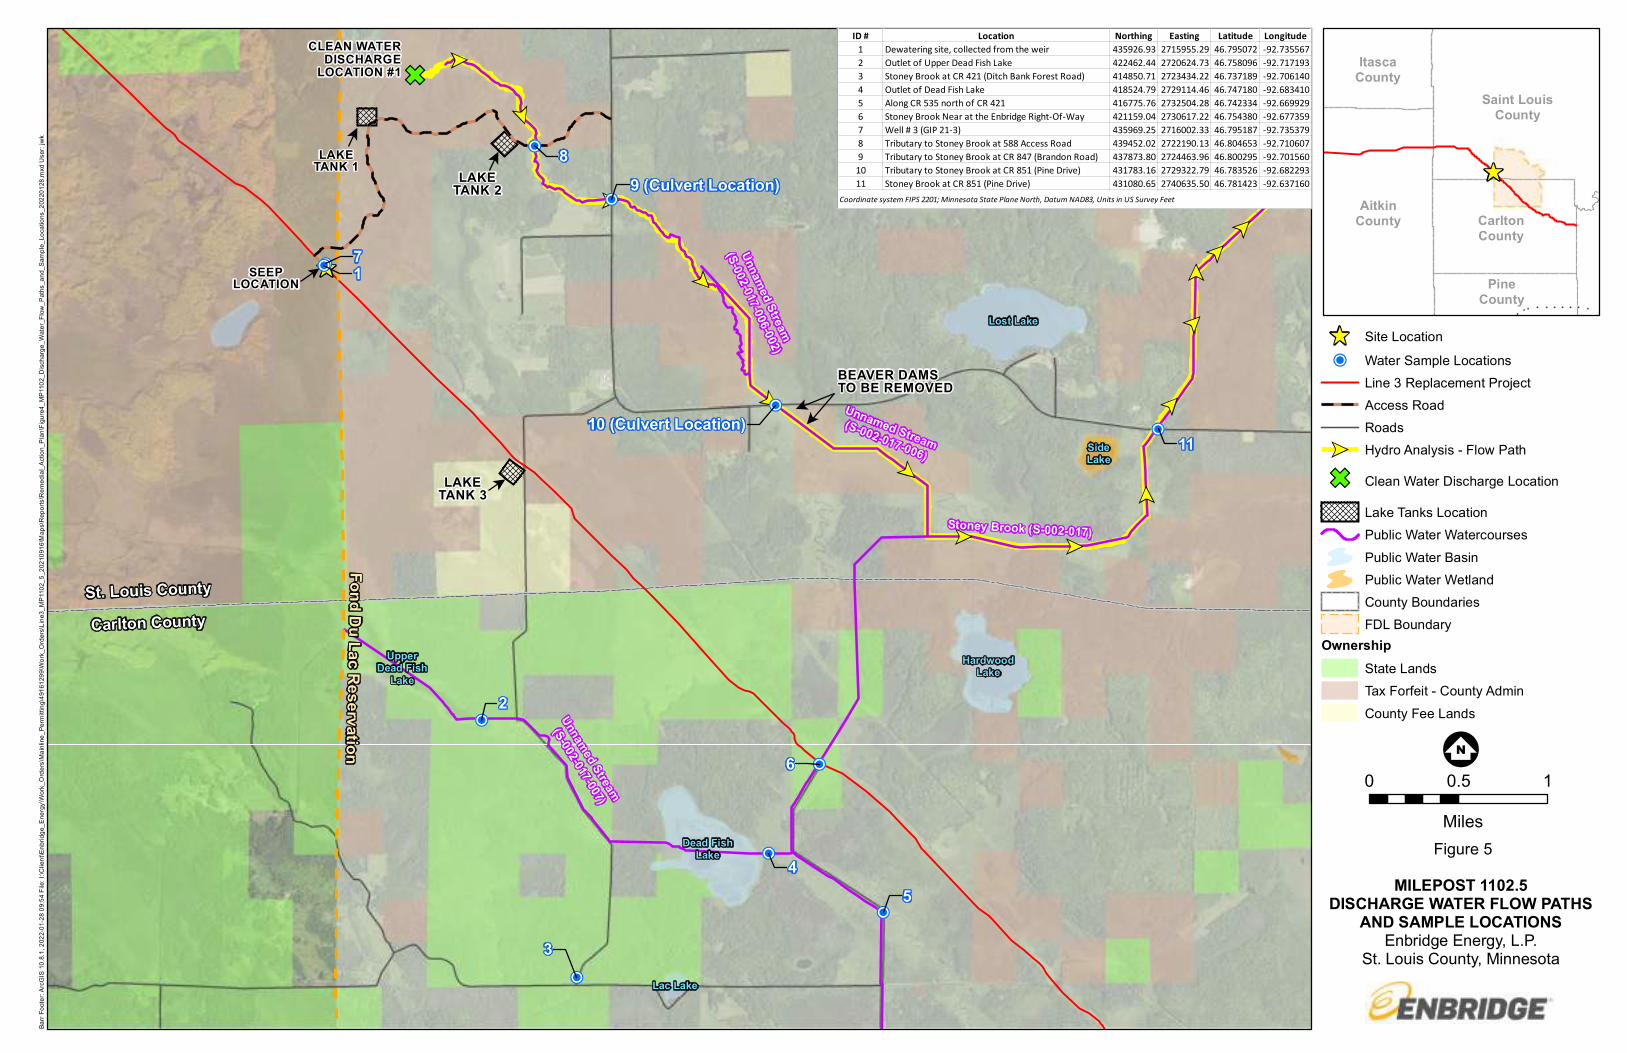
$$
$$
$$
$$
$$
$$
$$$$
$$
$$
$$
$$
$$$$
$$
$$$$
GF
^!P!P
!P
!P
!P
!P
!P
!P
!P
!P
!P
Fond Du Lac Reservation
St. Louis CountyCarlton County
$
BEAVER DAMSTO BE REMOVED
$
$
LAKETANK 2
$LAKE
TANK 3 $
LAKETANK 1
CLEAN WATERDISCHARGE
LOCATION #1
SEEPLOCATION $
71
2
3
45
6
89 (Culvert Location)
10 (Culvert Location)11
HardwoodLake
Lac Lake
Lost Lake
Dead FishLake
SideLake
UpperDead Fish
Lake
Unnamed Stream
(S-002-017-006-002)
Unnamed Stream(S-002-017-006)
Unnamed Stream
(S-002-017-007)
Stoney Brook (S-002-017)
!;N
Barr
Foo
ter:
Arc
GIS
10.
8.1,
202
2-01
-28
09:5
4 Fi
le: I
:\Clie
nt\E
nbrid
ge_E
nerg
y\W
ork_
Ord
ers\
Mai
nlin
e_Pe
rmitt
ing\
4916
1299
\Wor
k_O
rder
s\Li
ne3_
MP
1102
_5_2
0210
916\
Map
s\R
epor
ts\R
emed
ial_
Act
ion_
Pla
n\Fi
gure
4_M
P11
02_D
isch
arge
_Wat
er_F
low
_Pat
hs_a
nd_S
ampl
e_Lo
catio
ns_2
0220
128.
mxd
Use
r: jw
k
^ Site Location
!P Water Sample LocationsLine 3 Replacement ProjectAccess RoadRoads
$$ Hydro Analysis - Flow Path
GF Clean Water Discharge Location
Lake Tanks LocationPublic Water WatercoursesPublic Water BasinPublic Water WetlandCounty BoundariesFDL Boundary
OwnershipState LandsTax Forfeit - County AdminCounty Fee Lands
0 0.5 1
^
ItascaCounty
CarltonCounty
PineCounty
AitkinCounty
Saint LouisCounty
MilesFigure 5
MILEPOST 1102.5DISCHARGE WATER FLOW PATHS
AND SAMPLE LOCATIONS Enbridge Energy, L.P.
St. Louis County, Minnesota
ID # Location Northing Easting Latitude Longitude1 Dewatering site, collected from the weir 435926.93 2715955.29 46.795072 -92.7355672 Outlet of Upper Dead Fish Lake 422462.44 2720624.73 46.758096 -92.7171933 Stoney Brook at CR 421 (Ditch Bank Forest Road) 414850.71 2723434.22 46.737189 -92.7061404 Outlet of Dead Fish Lake 418524.79 2729114.46 46.747180 -92.6834105 Along CR 535 north of CR 421 416775.76 2732504.28 46.742334 -92.6699296 Stoney Brook Near at the Enbridge Right-Of-Way 421159.04 2730617.22 46.754380 -92.6773597 Well # 3 (GIP 21-3) 435969.25 2716002.33 46.795187 -92.7353798 Tributary to Stoney Brook at 588 Access Road 439452.02 2722190.13 46.804653 -92.7106079 Tributary to Stoney Brook at CR 847 (Brandon Road) 437873.80 2724463.96 46.800295 -92.70156010 Tributary to Stoney Brook at CR 851 (Pine Drive) 431783.16 2729322.79 46.783526 -92.68229311 Stoney Brook at CR 851 (Pine Drive) 431080.65 2740635.50 46.781423 -92.637160
Coordinate system FIPS 2201; Minnesota State Plane North, Datum NAD83, Units in US Survey Feet

Appendices
Appendix A
MP1102.5 Groundwater Investigation Data Submittal
P:\Duluth\49 WI\16\49161299 Line 3 Replacement Geotech Sur\WorkFiles\01_Uncontrolled Flow Assistance\03_Groundwater Investigation Submittal\MP1102.5\Rev 3\Line 3 MP1102 Groundwater Memo_Rev 3_01292022.docx
Memorandum
To: Minnesota Department of Natural Resources From: Robert Olah, PE, Travis Davidsavor, PE, and Ray Wuolo, PE, PG (Barr) Subject: MP1102.5 Groundwater Investigation Data Submittal Date: January 29, 2022 (Revision 3) Project: Line 3 Replacement Project
Barr Engineering Co. (Barr), under contract with Enbridge Energy, Limited Partnership (Enbridge), is in the process of completing a geotechnical investigation in support of the proposed Line 3 Replacement (L3R) pipeline near MP1102.5 in Arrowhead Township, Minnesota. The purpose of this memorandum is to provide the results of the investigation to date, our interpretation of the subsurface soil and groundwater conditions to date, and a summary of additional information to be collected.
Nine borings were previously performed to investigate the subsurface soil and groundwater conditions. In addition to the original five borings, an additional four borings were completed in January 2022. This included MP1102-GIP-21-2A, MP1102-GIP-21-6, MP1102-CAP-6, and MP1102-CAP-9. The additional boring locations were submitted to the Minnesota Department of Natural Resources (MDNR), Minnesota Pollution Control Agency (MPCA) and Minnesota Department of Health (MDH) in the Groundwater Investigation Plan (GIP), which was approved on December 15, 2021, and updated (Rev 4) on December 22, 2021. The coordinates and elevations for the boring locations, provided by the project surveyor Northwestern Surveying & Engineering, Inc. of Bemidji, Minnesota, are shown in Table 1 below:
Table 1 Boring Summary
Borehole ID Northing (ft) Easting (ft) Elevation (ft)
MP1102-GIP-21-1 436082.4 2715756.9 1329.7 (2) MP1102-GIP-21-2 436042.3 2715801.2 1328.3 (1)
MP1102-GIP-21-2A 436055.0 2715786.4 1328.2 (1) MP1102-GIP-21-3 435998.2 2715845.8 1328.8 (1) MP1102-GIP-21-4 435961.4 2715883.9 1325.0 (1) MP1102-GIP-21-5 435923.1 2715923.2 1324.1 (2) MP1102-GIP-22-6 436319.7 2715879.5 1338.9 (1)
MP1102-CAP-6 436097.4 2715805.8 1328.8 (1) MP1102-CAP-9 436111.3 2715720.6 1330.0 (1)
Coordinate system FIPS 2201 Minnesota State Plane North, Datum NAD83; NAVD88
(1) Elevation is ground surface elevation (2) Elevation is top of casing elevation
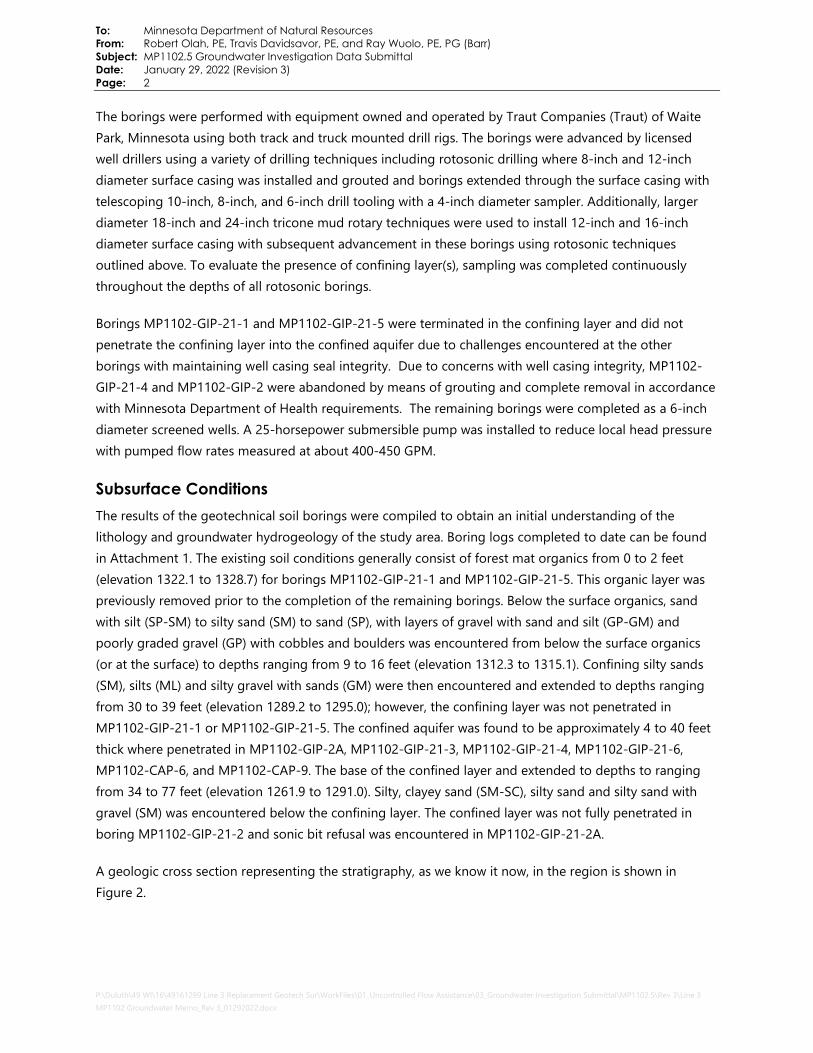
To: Minnesota Department of Natural Resources From: Robert Olah, PE, Travis Davidsavor, PE, and Ray Wuolo, PE, PG (Barr) Subject: MP1102.5 Groundwater Investigation Data Submittal Date: January 29, 2022 (Revision 3) Page: 2
P:\Duluth\49 WI\16\49161299 Line 3 Replacement Geotech Sur\WorkFiles\01_Uncontrolled Flow Assistance\03_Groundwater Investigation Submittal\MP1102.5\Rev 3\Line 3 MP1102 Groundwater Memo_Rev 3_01292022.docx
The borings were performed with equipment owned and operated by Traut Companies (Traut) of Waite Park, Minnesota using both track and truck mounted drill rigs. The borings were advanced by licensed well drillers using a variety of drilling techniques including rotosonic drilling where 8-inch and 12-inch diameter surface casing was installed and grouted and borings extended through the surface casing with telescoping 10-inch, 8-inch, and 6-inch drill tooling with a 4-inch diameter sampler. Additionally, larger diameter 18-inch and 24-inch tricone mud rotary techniques were used to install 12-inch and 16-inch diameter surface casing with subsequent advancement in these borings using rotosonic techniques outlined above. To evaluate the presence of confining layer(s), sampling was completed continuously throughout the depths of all rotosonic borings.
Borings MP1102-GIP-21-1 and MP1102-GIP-21-5 were terminated in the confining layer and did not penetrate the confining layer into the confined aquifer due to challenges encountered at the other borings with maintaining well casing seal integrity. Due to concerns with well casing integrity, MP1102-GIP-21-4 and MP1102-GIP-2 were abandoned by means of grouting and complete removal in accordance with Minnesota Department of Health requirements. The remaining borings were completed as a 6-inch diameter screened wells. A 25-horsepower submersible pump was installed to reduce local head pressure with pumped flow rates measured at about 400-450 GPM.
Subsurface Conditions The results of the geotechnical soil borings were compiled to obtain an initial understanding of the lithology and groundwater hydrogeology of the study area. Boring logs completed to date can be found in Attachment 1. The existing soil conditions generally consist of forest mat organics from 0 to 2 feet (elevation 1322.1 to 1328.7) for borings MP1102-GIP-21-1 and MP1102-GIP-21-5. This organic layer was previously removed prior to the completion of the remaining borings. Below the surface organics, sand with silt (SP-SM) to silty sand (SM) to sand (SP), with layers of gravel with sand and silt (GP-GM) and poorly graded gravel (GP) with cobbles and boulders was encountered from below the surface organics (or at the surface) to depths ranging from 9 to 16 feet (elevation 1312.3 to 1315.1). Confining silty sands (SM), silts (ML) and silty gravel with sands (GM) were then encountered and extended to depths ranging from 30 to 39 feet (elevation 1289.2 to 1295.0); however, the confining layer was not penetrated in MP1102-GIP-21-1 or MP1102-GIP-21-5. The confined aquifer was found to be approximately 4 to 40 feet thick where penetrated in MP1102-GIP-2A, MP1102-GIP-21-3, MP1102-GIP-21-4, MP1102-GIP-21-6, MP1102-CAP-6, and MP1102-CAP-9. The base of the confined layer and extended to depths to ranging from 34 to 77 feet (elevation 1261.9 to 1291.0). Silty, clayey sand (SM-SC), silty sand and silty sand with gravel (SM) was encountered below the confining layer. The confined layer was not fully penetrated in boring MP1102-GIP-21-2 and sonic bit refusal was encountered in MP1102-GIP-21-2A.
A geologic cross section representing the stratigraphy, as we know it now, in the region is shown in Figure 2.
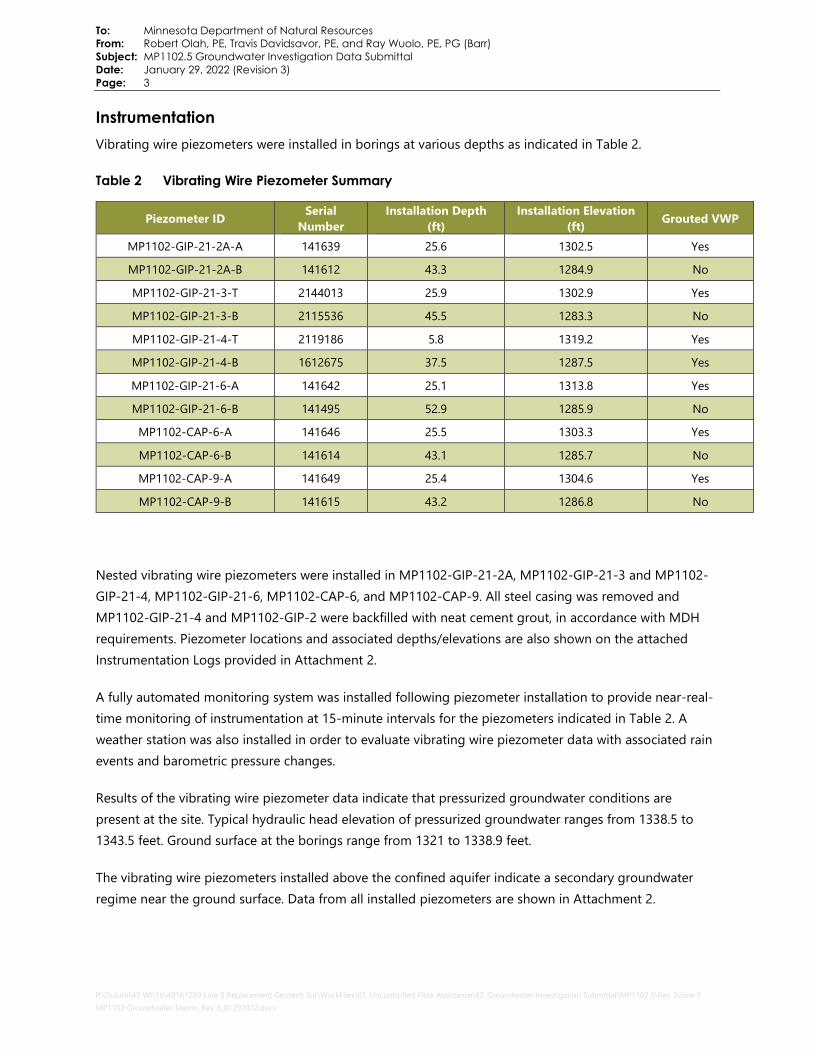
To: Minnesota Department of Natural Resources From: Robert Olah, PE, Travis Davidsavor, PE, and Ray Wuolo, PE, PG (Barr) Subject: MP1102.5 Groundwater Investigation Data Submittal Date: January 29, 2022 (Revision 3) Page: 3
P:\Duluth\49 WI\16\49161299 Line 3 Replacement Geotech Sur\WorkFiles\01_Uncontrolled Flow Assistance\03_Groundwater Investigation Submittal\MP1102.5\Rev 3\Line 3 MP1102 Groundwater Memo_Rev 3_01292022.docx
Instrumentation Vibrating wire piezometers were installed in borings at various depths as indicated in Table 2.
Table 2 Vibrating Wire Piezometer Summary
Nested vibrating wire piezometers were installed in MP1102-GIP-21-2A, MP1102-GIP-21-3 and MP1102-GIP-21-4, MP1102-GIP-21-6, MP1102-CAP-6, and MP1102-CAP-9. All steel casing was removed and MP1102-GIP-21-4 and MP1102-GIP-2 were backfilled with neat cement grout, in accordance with MDH requirements. Piezometer locations and associated depths/elevations are also shown on the attached Instrumentation Logs provided in Attachment 2.
A fully automated monitoring system was installed following piezometer installation to provide near-real-time monitoring of instrumentation at 15-minute intervals for the piezometers indicated in Table 2. A weather station was also installed in order to evaluate vibrating wire piezometer data with associated rain events and barometric pressure changes.
Results of the vibrating wire piezometer data indicate that pressurized groundwater conditions are present at the site. Typical hydraulic head elevation of pressurized groundwater ranges from 1338.5 to 1343.5 feet. Ground surface at the borings range from 1321 to 1338.9 feet.
The vibrating wire piezometers installed above the confined aquifer indicate a secondary groundwater regime near the ground surface. Data from all installed piezometers are shown in Attachment 2.
Piezometer ID Serial Number
Installation Depth (ft)
Installation Elevation (ft) Grouted VWP
MP1102-GIP-21-2A-A 141639 25.6 1302.5 Yes
MP1102-GIP-21-2A-B 141612 43.3 1284.9 No
MP1102-GIP-21-3-T 2144013 25.9 1302.9 Yes
MP1102-GIP-21-3-B 2115536 45.5 1283.3 No
MP1102-GIP-21-4-T 2119186 5.8 1319.2 Yes
MP1102-GIP-21-4-B 1612675 37.5 1287.5 Yes
MP1102-GIP-21-6-A 141642 25.1 1313.8 Yes
MP1102-GIP-21-6-B 141495 52.9 1285.9 No
MP1102-CAP-6-A 141646 25.5 1303.3 Yes
MP1102-CAP-6-B 141614 43.1 1285.7 No
MP1102-CAP-9-A 141649 25.4 1304.6 Yes
MP1102-CAP-9-B 141615 43.2 1286.8 No
To: Minnesota Department of Natural Resources From: Robert Olah, PE, Travis Davidsavor, PE, and Ray Wuolo, PE, PG (Barr) Subject: MP1102.5 Groundwater Investigation Data Submittal Date: January 29, 2022 (Revision 3) Page: 4
P:\Duluth\49 WI\16\49161299 Line 3 Replacement Geotech Sur\WorkFiles\01_Uncontrolled Flow Assistance\03_Groundwater Investigation Submittal\MP1102.5\Rev 3\Line 3 MP1102 Groundwater Memo_Rev 3_01292022.docx
Figures Figure 1 MP1102.5 Boring Locations Figure 2 MP1102.5 Geologic Cross Section Attachments Attachment 1 Completed Soil Boring Logs Attachment 2 Current Vibrating Wire Piezometer Data

Figures
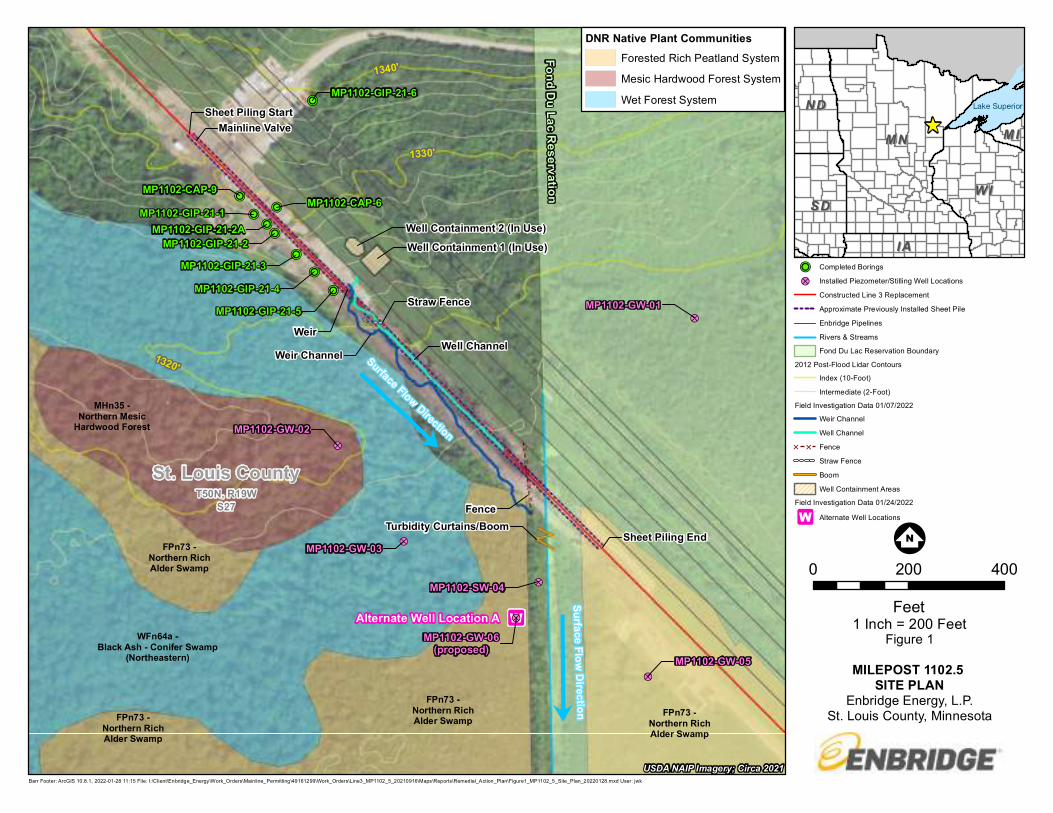
!P
!P
!P
!P
!P
!P
!P!P
!P
!W
!?
!?
!?
!?
!?
!?
Fond Du Lac Reservation
Sheet Piling End
Sheet Piling StartMainline Valve
Weir
Well Containment 1 (In Use)Well Containment 2 (In Use)
Straw Fence
Weir Channel Well Channel
FenceTurbidity Curtains/Boom
St. Louis CountyT50N, R19W
S27
MP1102-GIP-21-1
MP1102-GIP-21-2
MP1102-GIP-21-4MP1102-GIP-21-5
MP1102-GIP-21-3
MP1102-GIP-21-6
MP1102-GIP-21-2A
MP1102-CAP-6MP1102-CAP-9
Alternate Well Location A
FPn73 -Northern RichAlder Swamp
FPn73 -Northern RichAlder Swamp
FPn73 -Northern RichAlder Swamp
FPn73 -Northern RichAlder Swamp
WFn64a -Black Ash - Conifer Swamp
(Northeastern)
MHn35 -Northern Mesic
Hardwood Forest
MP1102-GW-01
MP1102-GW-02
MP1102-GW-03
MP1102-SW-04
MP1102-GW-05MP1102-GW-06
(proposed)
1340'
1330'
1320'
Barr Footer: ArcGIS 10.8.1, 2022-01-28 11:15 File: I:\Client\Enbridge_Energy\Work_Orders\Mainline_Permitting\49161299\Work_Orders\Line3_MP1102_5_20210916\Maps\Reports\Remedial_Action_Plan\Figure1_MP1102_5_Site_Plan_20220128.mxd User: jwk
1 Inch = 200 Feet
!P Completed Borings
!? Installed Piezometer/Stilling Well Locations
Constructed Line 3 Replacement
Approximate Previously Installed Sheet Pile
Enbridge Pipelines
Rivers & Streams
Fond Du Lac Reservation Boundary
2012 Post-Flood Lidar Contours
Index (10-Foot)
Intermediate (2-Foot)
Field Investigation Data 01/07/2022
Weir Channel
Well Channel
[ [ Fence
Straw Fence
Boom
Well Containment Areas
Field Investigation Data 01/24/2022
!W Alternate Well Locations
0 200 400
Feet
Figure 1
MILEPOST 1102.5 SITE PLAN
Enbridge Energy, L.P.St. Louis County, Minnesota
!;N
^Lake Superior
IAIA
MIMIMNMN
NDND
SDSDWIWI
USDA NAIP Imagery; Circa 2021
7
7
Surface Flow Direction
Surface Flow Direction
DNR Native Plant CommunitiesForested Rich Peatland System
Mesic Hardwood Forest System
Wet Forest System
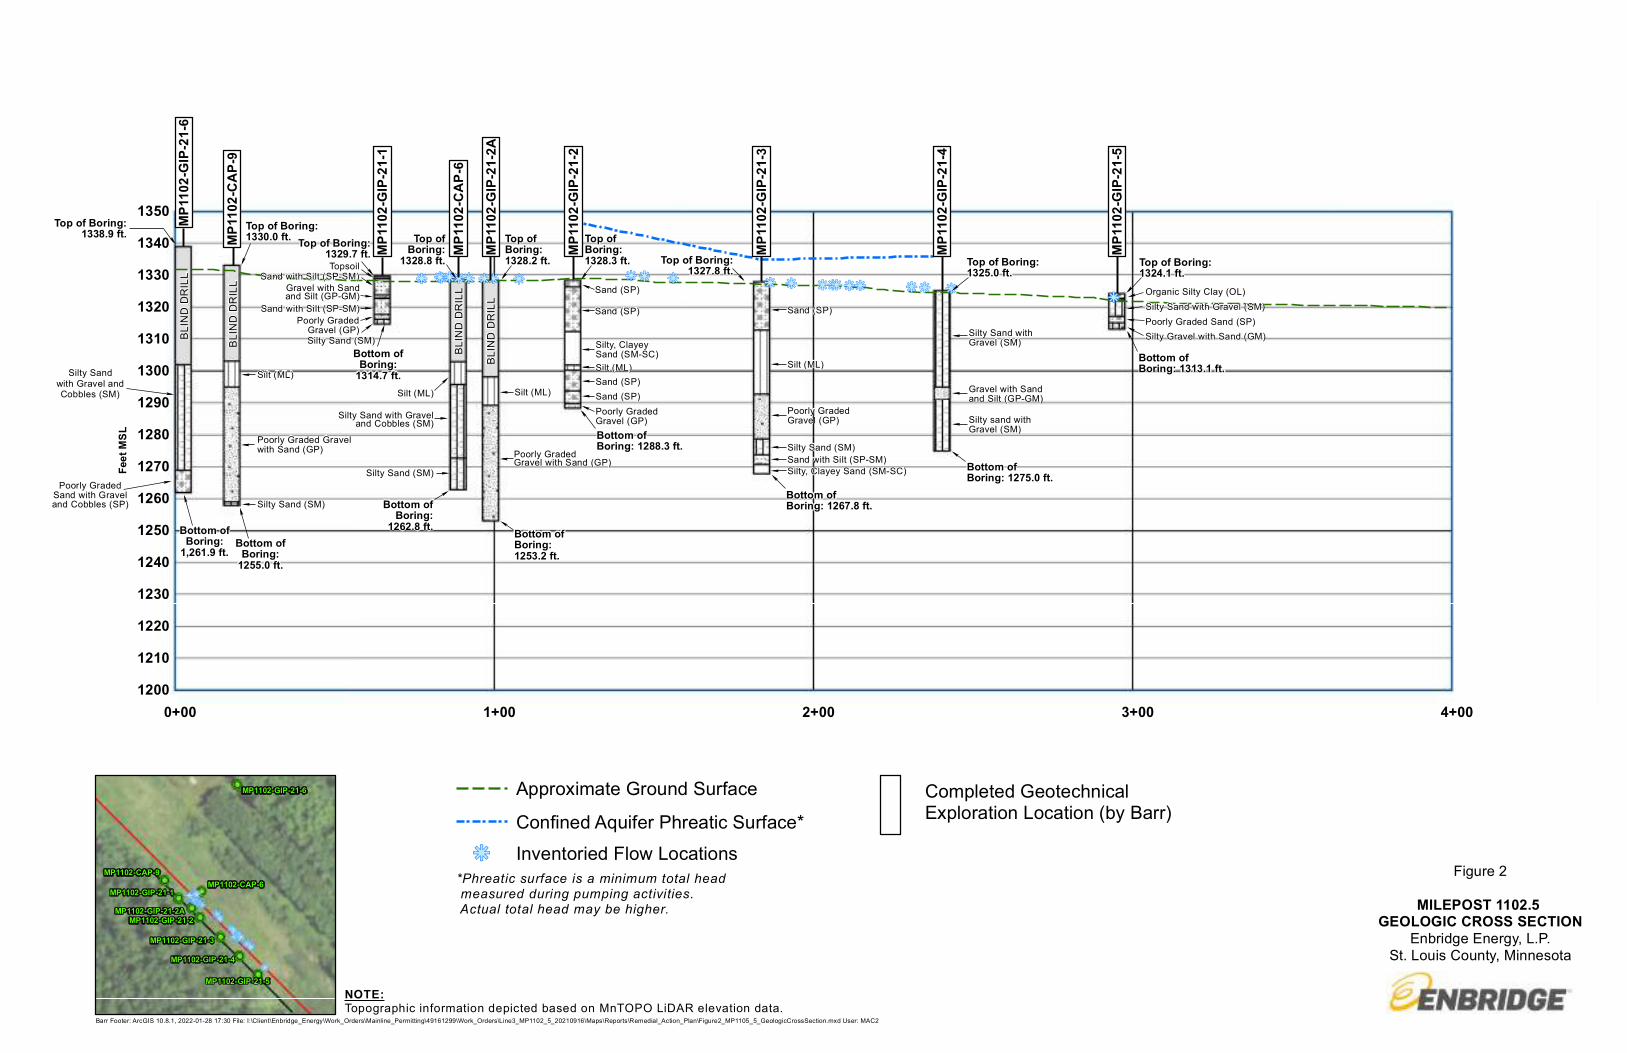
Barr Footer: ArcGIS 10.8.1, 2022-01-28 17:30 File: I:\Client\Enbridge_Energy\Work_Orders\Mainline_Permitting\49161299\Work_Orders\Line3_MP1102_5_20210916\Maps\Reports\Remedial_Action_Plan\Figure2_MP1105_5_GeologicCrossSection.mxd User: MAC2
kjkjkjkjkjkjkjkjkjkjkj kjkj kjkj kj kj kj kj kj kjkj kj
&Silty, Clayey Sand (SM-SC)Sand with Silt (SP-SM)&
Silty Sand (SM)&
2+00 4+003+000+00 1+00
1350134013301320131013001290
1260125012401230122012101200
Feet
MSL
12701280
MP11
02-G
IP-21
-1
Top of Boring:1327.8 ft. Top of Boring:
1325.0 ft.
Top ofBoring:1328.3 ft.
Top of Boring:1329.7 ft. Top of Boring:
1324.1 ft.
Bottom ofBoring: 1267.8 ft.
Bottom ofBoring: 1275.0 ft.
Bottom ofBoring: 1288.3 ft.
Bottom ofBoring:
1314.7 ft.Bottom ofBoring: 1313.1 ft.
&
MP11
02-G
IP-21
-2
MP11
02-G
IP-21
-3
MP11
02-G
IP-21
-4
MP11
02-G
IP-21
-5&
&&
&
&
&
&
&
&
MP11
02-C
AP-9
MP11
02-G
IP-21
-6
MP11
02-C
AP-6
MP11
02-G
IP-21
-2A
Top of Boring:1338.9 ft. &
Bottom ofBoring:
1,261.9 ft.
&
&
Bottom ofBoring:
1255.0 ft.
Bottom ofBoring:
1262.8 ft.
&
&
Bottom ofBoring:1253.2 ft.
Top of Boring:1330.0 ft.
&
Top ofBoring:1328.2 ft.
&
Top ofBoring:
1328.8 ft.
&
Sand (SP)Sand (SP)
Silty Sand withGravel (SM)
Silt (ML)
Sand (SP)
Silty sand with Gravel (SM)
Poorly GradedGravel (GP)
Silty, ClayeySand (SM-SC)
Sand (SP)
Sand with Silt (SP-SM)
Sand with Silt (SP-SM)
Sand (SP)
Silty Sand with Gravel (SM)
Silt (ML)
Topsoil
Gravel with Sandand Silt (GP-GM)
Silty Sand (SM)
Organic Silty Clay (OL)
Poorly Graded Sand (SP)
Poorly GradedGravel (GP)
Poorly GradedGravel (GP)
Gravel with Sandand Silt (GP-GM)
&
&
&
&
&
&
&
&
&
&
&
&
&
&
&
&
&
&
& Silty Gravel with Sand (GM)
&
&
&
&
BLI
ND
DR
ILL
BLI
ND
DR
ILL
BLI
ND
DR
ILL
BLI
ND
DR
ILL
Silt (ML)
Poorly Graded Gravelwith Sand (GP) Poorly Graded
Gravel with Sand (GP)
Silt (ML)
Silt (ML)
Silty Sandwith Gravel andCobbles (SM)
Silty Sand (SM)
Silty Sand with Graveland Cobbles (SM)
Poorly GradedSand with Graveland Cobbles (SP) Silty Sand (SM)
&
&
&
&
&
&
&
&
&
&
NOTE:Topographic information depicted based on MnTOPO LiDAR elevation data.
Figure 2
MILEPOST 1102.5 GEOLOGIC CROSS SECTION
Enbridge Energy, L.P.St. Louis County, Minnesota
MP1102-GIP-21-1
MP1102-GIP-21-2
MP1102-GIP-21-4
MP1102-GIP-21-5
MP1102-GIP-21-3
MP1102-GIP-21-6
MP1102-GIP-21-2A
MP1102-CAP-6MP1102-CAP-9
Completed GeotechnicalExploration Location (by Barr)
Approximate Ground Surface
Inventoried Flow Locationskj
Confined Aquifer Phreatic Surface*
*Phreatic surface is a minimum total head measured during pumping activities. Actual total head may be higher.

Attachments
Attachment 1
Soil Boring Logs
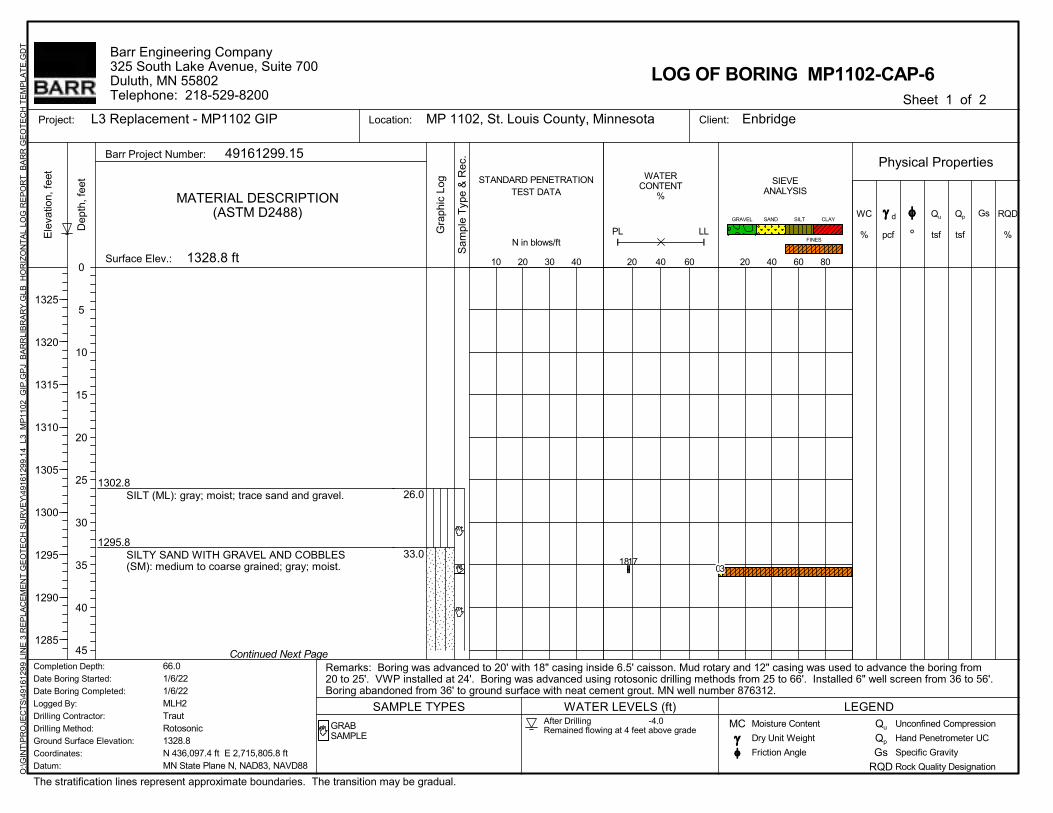
26.0
33.0
SILT (ML): gray; moist; trace sand and gravel.
SILTY SAND WITH GRAVEL AND COBBLES(SM): medium to coarse grained; gray; moist.
1302.8
1295.8
Physical Properties
Client:L3 Replacement - MP1102 GIP MP 1102, St. Louis County, Minnesota Enbridge
1328.8 ft
STANDARD PENETRATIONTEST DATA
WC
%
The stratification lines represent approximate boundaries. The transition may be gradual.
Continued Next Page
SAMPLE TYPES
GRABSAMPLE
°
MATERIAL DESCRIPTION(ASTM D2488)
Barr Project Number: 49161299.15
Surface Elev.:
Barr Engineering Company325 South Lake Avenue, Suite 700Duluth, MN 55802Telephone: 218-529-8200
Qp
tsf
Gs RQD
%
d
20 40 60
N in blows/ft
Qu
tsf
Dep
th, f
eet
0
5
10
15
20
25
30
35
40
45
PL LL
Sam
ple
Typ
e &
Rec
.
WATERCONTENT
%
SIEVEANALYSIS
Location:
WATER LEVELS (ft) LEGEND
Gra
phic
Log
pcf
GRAVEL SILT
Dry Unit Weight
Moisture Content
Friction Angle MC
Specific Gravity
Qu
Qp
Gs
Unconfined Compression
Hand Penetrometer UC
RQD Rock Quality Designation
CLAY
FINES
10 20 30 40
Ele
vatio
n, f
eet
1325
1320
1315
1310
1305
1300
1295
1290
1285
Sheet 1 of 2
Project:
SAND
Remarks: Boring was advanced to 20' with 18" casing inside 6.5' caisson. Mud rotary and 12" casing was used to advance the boring from20 to 25'. VWP installed at 24'. Boring was advanced using rotosonic drilling methods from 25 to 66'. Installed 6" well screen from 36 to 56'.Boring abandoned from 36' to ground surface with neat cement grout. MN well number 876312.
After Drilling -4.0Remained flowing at 4 feet above grade
LOG OF BORING MP1102-CAP-6
Completion Depth:
Date Boring Started:
Date Boring Completed:
Logged By:
Drilling Contractor:
Drilling Method:
Ground Surface Elevation:
Coordinates:
Datum:
66.01/6/221/6/22MLH2TrautRotosonic1328.8N 436,097.4 ft E 2,715,805.8 ftMN State Plane N, NAD83, NAVD88
O:\G
INT
\PR
OJE
CT
S\4
9161
299
LIN
E 3
RE
PLA
CE
ME
NT
GE
OT
EC
H S
UR
VE
Y\4
9161
299.
14_
L3_
MP
1102
_GIP
.GP
J B
AR
RLI
BR
AR
Y.G
LB H
OR
IZO
NT
AL
LOG
RE
PO
RT
BA
RR
GE
OT
EC
H T
EM
PLA
TE
.GD
T
1817
20 40 60 80
03

15
656.0
66.0
SILTY SAND WITH GRAVEL AND COBBLES(SM): medium to coarse grained; gray; moist.(Continued)
SILTY SAND (SM): fine to medium grained;reddish brown; moist; trace gravel; till.
Bottom of Boring at 66.0 feet
1272.8
1262.8
Physical Properties
Client:L3 Replacement - MP1102 GIP MP 1102, St. Louis County, Minnesota Enbridge
STANDARD PENETRATIONTEST DATA
WC
%
The stratification lines represent approximate boundaries. The transition may be gradual.
SAMPLE TYPES
GRABSAMPLE
°
MATERIAL DESCRIPTION(ASTM D2488)
Barr Project Number: 49161299.15
Barr Engineering Company325 South Lake Avenue, Suite 700Duluth, MN 55802Telephone: 218-529-8200
Qp
tsf
Gs RQD
%
d
20 40 60
N in blows/ft
Qu
tsf
Dep
th, f
eet
45
50
55
60
65
70
75
80
85
90
PL LL
Sam
ple
Typ
e &
Rec
.
WATERCONTENT
%
SIEVEANALYSIS
Location:
WATER LEVELS (ft) LEGEND
Gra
phic
Log
pcf
GRAVEL SILT
Dry Unit Weight
Moisture Content
Friction Angle MC
Specific Gravity
Qu
Qp
Gs
Unconfined Compression
Hand Penetrometer UC
RQD Rock Quality Designation
CLAY
FINES
10 20 30 40
Ele
vatio
n, f
eet
1280
1275
1270
1265
Sheet 2 of 2
Project:
SAND
Remarks: Boring was advanced to 20' with 18" casing inside 6.5' caisson. Mud rotary and 12" casing was used to advance the boring from20 to 25'. VWP installed at 24'. Boring was advanced using rotosonic drilling methods from 25 to 66'. Installed 6" well screen from 36 to 56'.Boring abandoned from 36' to ground surface with neat cement grout. MN well number 876312.
After Drilling -4.0Remained flowing at 4 feet above grade
LOG OF BORING MP1102-CAP-6
Completion Depth:
Date Boring Started:
Date Boring Completed:
Logged By:
Drilling Contractor:
Drilling Method:
Ground Surface Elevation:
Coordinates:
Datum:
66.01/6/221/6/22MLH2TrautRotosonic1328.8N 436,097.4 ft E 2,715,805.8 ftMN State Plane N, NAD83, NAVD88
O:\G
INT
\PR
OJE
CT
S\4
9161
299
LIN
E 3
RE
PLA
CE
ME
NT
GE
OT
EC
H S
UR
VE
Y\4
9161
299.
14_
L3_
MP
1102
_GIP
.GP
J B
AR
RLI
BR
AR
Y.G
LB H
OR
IZO
NT
AL
LOG
RE
PO
RT
BA
RR
GE
OT
EC
H T
EM
PLA
TE
.GD
T
20 40 60 800
55.8
7.3
99.1
94.7
63.2
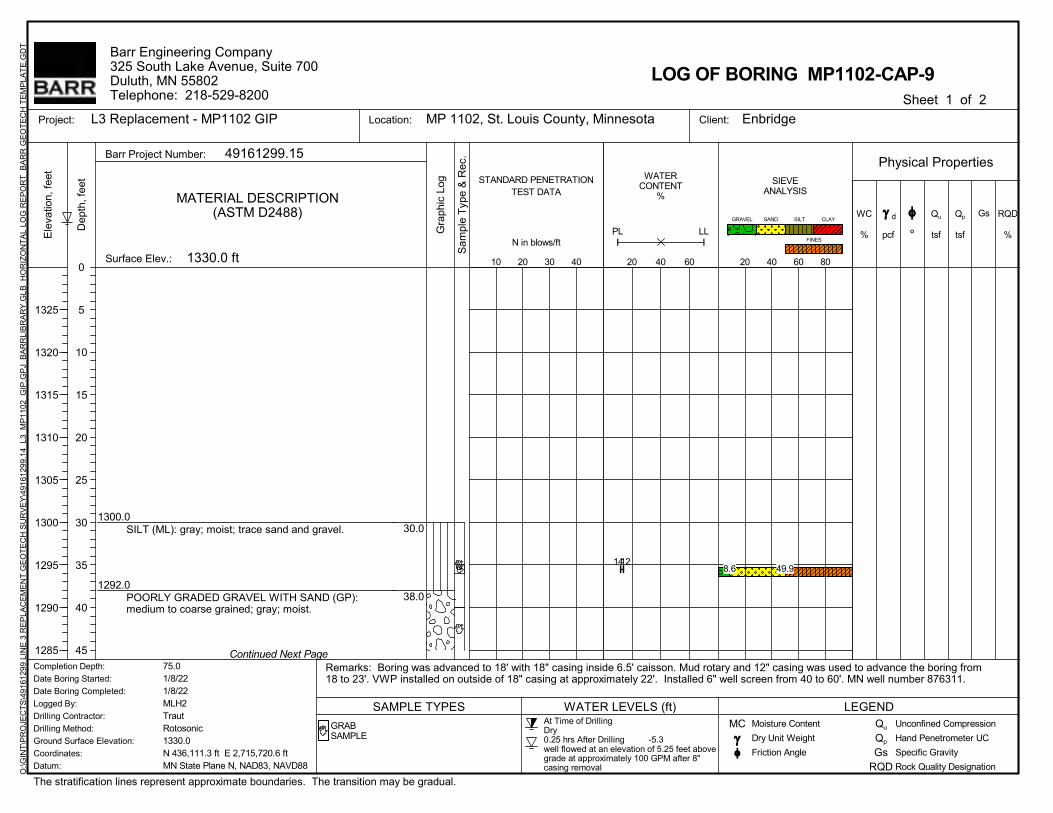
30.0
38.0
SILT (ML): gray; moist; trace sand and gravel.
POORLY GRADED GRAVEL WITH SAND (GP):medium to coarse grained; gray; moist.
1300.0
1292.0
Physical Properties
Client:L3 Replacement - MP1102 GIP MP 1102, St. Louis County, Minnesota Enbridge
1330.0 ft
STANDARD PENETRATIONTEST DATA
WC
%
The stratification lines represent approximate boundaries. The transition may be gradual.
Continued Next Page
SAMPLE TYPES
GRABSAMPLE
°
MATERIAL DESCRIPTION(ASTM D2488)
Barr Project Number: 49161299.15
Surface Elev.:
Barr Engineering Company325 South Lake Avenue, Suite 700Duluth, MN 55802Telephone: 218-529-8200
Qp
tsf
Gs RQD
%
d
20 40 60
N in blows/ft
Qu
tsf
Dep
th, f
eet
0
5
10
15
20
25
30
35
40
45
PL LL
Sam
ple
Typ
e &
Rec
.
WATERCONTENT
%
SIEVEANALYSIS
Location:
WATER LEVELS (ft) LEGEND
Gra
phic
Log
pcf
GRAVEL SILT
Dry Unit Weight
Moisture Content
Friction Angle MC
Specific Gravity
Qu
Qp
Gs
Unconfined Compression
Hand Penetrometer UC
RQD Rock Quality Designation
CLAY
FINES
10 20 30 40
Ele
vatio
n, f
eet
1325
1320
1315
1310
1305
1300
1295
1290
1285
Sheet 1 of 2
Project:
SAND
Remarks: Boring was advanced to 18' with 18" casing inside 6.5' caisson. Mud rotary and 12" casing was used to advance the boring from18 to 23'. VWP installed on outside of 18" casing at approximately 22'. Installed 6" well screen from 40 to 60'. MN well number 876311.
At Time of DrillingDry0.25 hrs After Drilling -5.3well flowed at an elevation of 5.25 feet abovegrade at approximately 100 GPM after 8"casing removal
LOG OF BORING MP1102-CAP-9
Completion Depth:
Date Boring Started:
Date Boring Completed:
Logged By:
Drilling Contractor:
Drilling Method:
Ground Surface Elevation:
Coordinates:
Datum:
75.01/8/221/8/22MLH2TrautRotosonic1330.0N 436,111.3 ft E 2,715,720.6 ftMN State Plane N, NAD83, NAVD88
O:\G
INT
\PR
OJE
CT
S\4
9161
299
LIN
E 3
RE
PLA
CE
ME
NT
GE
OT
EC
H S
UR
VE
Y\4
9161
299.
14_
L3_
MP
1102
_GIP
.GP
J B
AR
RLI
BR
AR
Y.G
LB H
OR
IZO
NT
AL
LOG
RE
PO
RT
BA
RR
GE
OT
EC
H T
EM
PLA
TE
.GD
T
1412
20 40 60 80
8.6 49.9
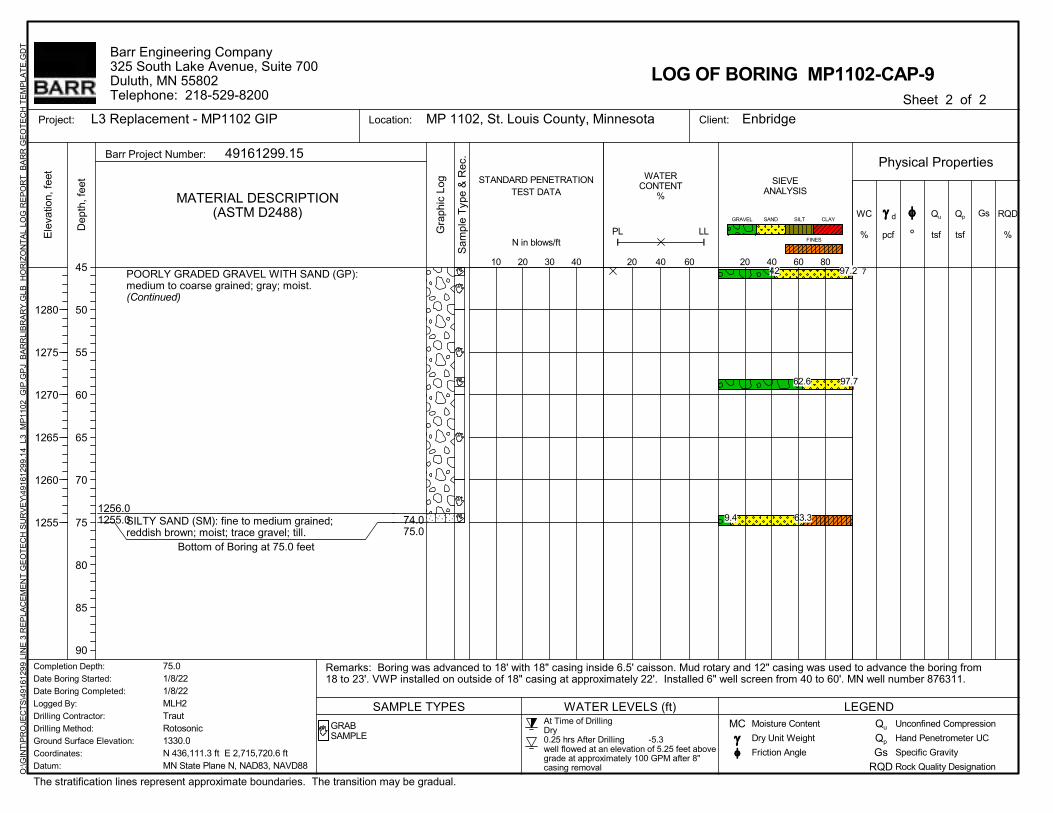
7
74.075.0
POORLY GRADED GRAVEL WITH SAND (GP):medium to coarse grained; gray; moist.(Continued)
SILTY SAND (SM): fine to medium grained;reddish brown; moist; trace gravel; till.
Bottom of Boring at 75.0 feet
1256.01255.0
Physical Properties
Client:L3 Replacement - MP1102 GIP MP 1102, St. Louis County, Minnesota Enbridge
STANDARD PENETRATIONTEST DATA
WC
%
The stratification lines represent approximate boundaries. The transition may be gradual.
SAMPLE TYPES
GRABSAMPLE
°
MATERIAL DESCRIPTION(ASTM D2488)
Barr Project Number: 49161299.15
Barr Engineering Company325 South Lake Avenue, Suite 700Duluth, MN 55802Telephone: 218-529-8200
Qp
tsf
Gs RQD
%
d
20 40 60
N in blows/ft
Qu
tsf
Dep
th, f
eet
45
50
55
60
65
70
75
80
85
90
PL LL
Sam
ple
Typ
e &
Rec
.
WATERCONTENT
%
SIEVEANALYSIS
Location:
WATER LEVELS (ft) LEGEND
Gra
phic
Log
pcf
GRAVEL SILT
Dry Unit Weight
Moisture Content
Friction Angle MC
Specific Gravity
Qu
Qp
Gs
Unconfined Compression
Hand Penetrometer UC
RQD Rock Quality Designation
CLAY
FINES
10 20 30 40
Ele
vatio
n, f
eet
1280
1275
1270
1265
1260
1255
Sheet 2 of 2
Project:
SAND
Remarks: Boring was advanced to 18' with 18" casing inside 6.5' caisson. Mud rotary and 12" casing was used to advance the boring from18 to 23'. VWP installed on outside of 18" casing at approximately 22'. Installed 6" well screen from 40 to 60'. MN well number 876311.
At Time of DrillingDry0.25 hrs After Drilling -5.3well flowed at an elevation of 5.25 feet abovegrade at approximately 100 GPM after 8"casing removal
LOG OF BORING MP1102-CAP-9
Completion Depth:
Date Boring Started:
Date Boring Completed:
Logged By:
Drilling Contractor:
Drilling Method:
Ground Surface Elevation:
Coordinates:
Datum:
75.01/8/221/8/22MLH2TrautRotosonic1330.0N 436,111.3 ft E 2,715,720.6 ftMN State Plane N, NAD83, NAVD88
O:\G
INT
\PR
OJE
CT
S\4
9161
299
LIN
E 3
RE
PLA
CE
ME
NT
GE
OT
EC
H S
UR
VE
Y\4
9161
299.
14_
L3_
MP
1102
_GIP
.GP
J B
AR
RLI
BR
AR
Y.G
LB H
OR
IZO
NT
AL
LOG
RE
PO
RT
BA
RR
GE
OT
EC
H T
EM
PLA
TE
.GD
T
20 40 60 8042
62.6
9.4
97.2
97.7
63.3
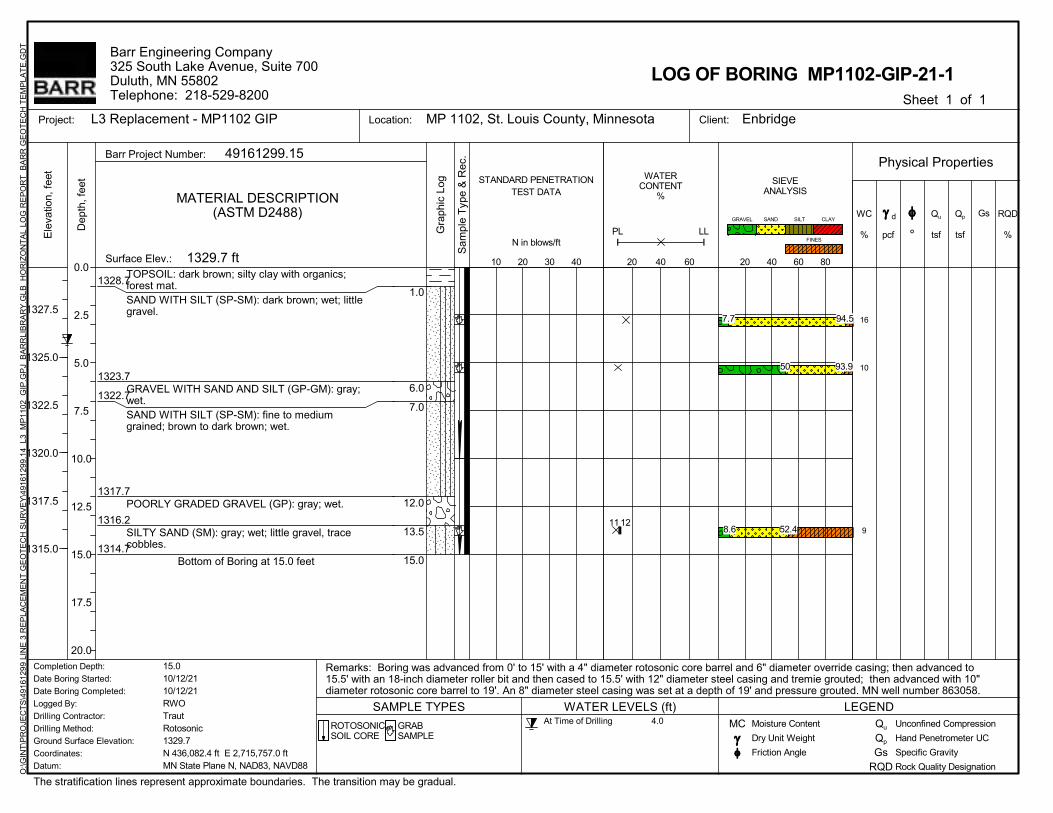
16
10
9
1.0
6.0
7.0
12.0
13.5
15.0
TOPSOIL: dark brown; silty clay with organics;forest mat.SAND WITH SILT (SP-SM): dark brown; wet; littlegravel.
GRAVEL WITH SAND AND SILT (GP-GM): gray;wet.SAND WITH SILT (SP-SM): fine to mediumgrained; brown to dark brown; wet.
POORLY GRADED GRAVEL (GP): gray; wet.
SILTY SAND (SM): gray; wet; little gravel, tracecobbles.
Bottom of Boring at 15.0 feet
1328.7
1323.7
1322.7
1317.7
1316.2
1314.7
Physical Properties
Client:L3 Replacement - MP1102 GIP MP 1102, St. Louis County, Minnesota Enbridge
1329.7 ft
STANDARD PENETRATIONTEST DATA
WC
%
The stratification lines represent approximate boundaries. The transition may be gradual.
SAMPLE TYPES
ROTOSONICSOIL CORE
GRABSAMPLE
°
MATERIAL DESCRIPTION(ASTM D2488)
Barr Project Number: 49161299.15
Surface Elev.:
Barr Engineering Company325 South Lake Avenue, Suite 700Duluth, MN 55802Telephone: 218-529-8200
Qp
tsf
Gs RQD
%
d
20 40 60
N in blows/ft
Qu
tsf
Dep
th, f
eet
0.0
2.5
5.0
7.5
10.0
12.5
15.0
17.5
20.0
PL LL
Sam
ple
Typ
e &
Rec
.
WATERCONTENT
%
SIEVEANALYSIS
Location:
WATER LEVELS (ft) LEGEND
Gra
phic
Log
pcf
GRAVEL SILT
Dry Unit Weight
Moisture Content
Friction Angle MC
Specific Gravity
Qu
Qp
Gs
Unconfined Compression
Hand Penetrometer UC
RQD Rock Quality Designation
CLAY
FINES
10 20 30 40
Ele
vatio
n, f
eet
1327.5
1325.0
1322.5
1320.0
1317.5
1315.0
Sheet 1 of 1
Project:
SAND
Remarks: Boring was advanced from 0' to 15' with a 4" diameter rotosonic core barrel and 6" diameter override casing; then advanced to15.5' with an 18-inch diameter roller bit and then cased to 15.5' with 12" diameter steel casing and tremie grouted; then advanced with 10"diameter rotosonic core barrel to 19'. An 8" diameter steel casing was set at a depth of 19' and pressure grouted. MN well number 863058.
At Time of Drilling 4.0
LOG OF BORING MP1102-GIP-21-1
Completion Depth:
Date Boring Started:
Date Boring Completed:
Logged By:
Drilling Contractor:
Drilling Method:
Ground Surface Elevation:
Coordinates:
Datum:
15.010/12/2110/12/21RWOTrautRotosonic1329.7N 436,082.4 ft E 2,715,757.0 ftMN State Plane N, NAD83, NAVD88
O:\G
INT
\PR
OJE
CT
S\4
9161
299
LIN
E 3
RE
PLA
CE
ME
NT
GE
OT
EC
H S
UR
VE
Y\4
9161
299.
14_
L3_
MP
1102
_GIP
.GP
J B
AR
RLI
BR
AR
Y.G
LB H
OR
IZO
NT
AL
LOG
RE
PO
RT
BA
RR
GE
OT
EC
H T
EM
PLA
TE
.GD
T
11 12
20 40 60 80
7.7
50
8.6
94.5
93.9
52.4
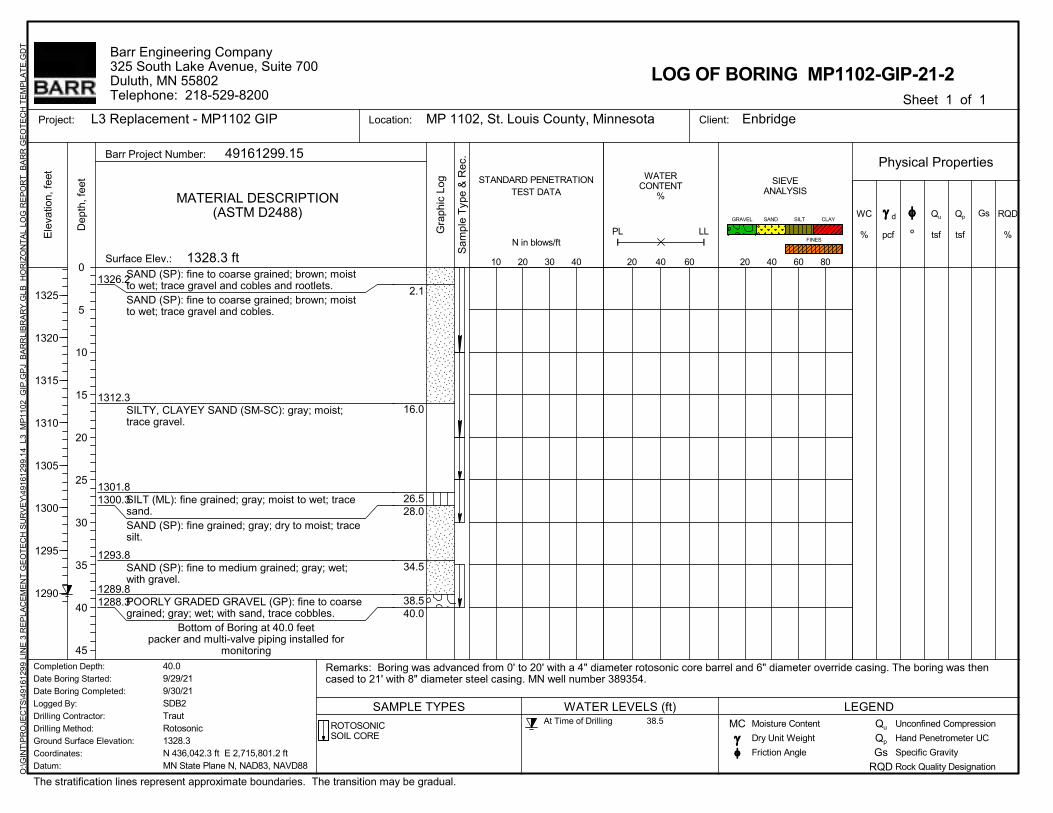
2.1
16.0
26.528.0
34.5
38.540.0
SAND (SP): fine to coarse grained; brown; moistto wet; trace gravel and cobles and rootlets.SAND (SP): fine to coarse grained; brown; moistto wet; trace gravel and cobles.
SILTY, CLAYEY SAND (SM-SC): gray; moist;trace gravel.
SILT (ML): fine grained; gray; moist to wet; tracesand.SAND (SP): fine grained; gray; dry to moist; tracesilt.
SAND (SP): fine to medium grained; gray; wet;with gravel.
POORLY GRADED GRAVEL (GP): fine to coarsegrained; gray; wet; with sand, trace cobbles.
Bottom of Boring at 40.0 feetpacker and multi-valve piping installed for
monitoring
1326.2
1312.3
1301.81300.3
1293.8
1289.81288.3
Physical Properties
Client:L3 Replacement - MP1102 GIP MP 1102, St. Louis County, Minnesota Enbridge
1328.3 ft
STANDARD PENETRATIONTEST DATA
WC
%
The stratification lines represent approximate boundaries. The transition may be gradual.
SAMPLE TYPES
ROTOSONICSOIL CORE
°
MATERIAL DESCRIPTION(ASTM D2488)
Barr Project Number: 49161299.15
Surface Elev.:
Barr Engineering Company325 South Lake Avenue, Suite 700Duluth, MN 55802Telephone: 218-529-8200
Qp
tsf
Gs RQD
%
d
20 40 60
N in blows/ft
Qu
tsf
Dep
th, f
eet
0
5
10
15
20
25
30
35
40
45
PL LL
Sam
ple
Typ
e &
Rec
.
WATERCONTENT
%
SIEVEANALYSIS
Location:
WATER LEVELS (ft) LEGEND
Gra
phic
Log
pcf
GRAVEL SILT
Dry Unit Weight
Moisture Content
Friction Angle MC
Specific Gravity
Qu
Qp
Gs
Unconfined Compression
Hand Penetrometer UC
RQD Rock Quality Designation
CLAY
FINES
10 20 30 40
Ele
vatio
n, f
eet
1325
1320
1315
1310
1305
1300
1295
1290
Sheet 1 of 1
Project:
SAND
Remarks: Boring was advanced from 0' to 20' with a 4" diameter rotosonic core barrel and 6" diameter override casing. The boring was thencased to 21' with 8" diameter steel casing. MN well number 389354.
At Time of Drilling 38.5
LOG OF BORING MP1102-GIP-21-2
Completion Depth:
Date Boring Started:
Date Boring Completed:
Logged By:
Drilling Contractor:
Drilling Method:
Ground Surface Elevation:
Coordinates:
Datum:
40.09/29/219/30/21SDB2TrautRotosonic1328.3N 436,042.3 ft E 2,715,801.2 ftMN State Plane N, NAD83, NAVD88
O:\G
INT
\PR
OJE
CT
S\4
9161
299
LIN
E 3
RE
PLA
CE
ME
NT
GE
OT
EC
H S
UR
VE
Y\4
9161
299.
14_
L3_
MP
1102
_GIP
.GP
J B
AR
RLI
BR
AR
Y.G
LB H
OR
IZO
NT
AL
LOG
RE
PO
RT
BA
RR
GE
OT
EC
H T
EM
PLA
TE
.GD
T
20 40 60 80
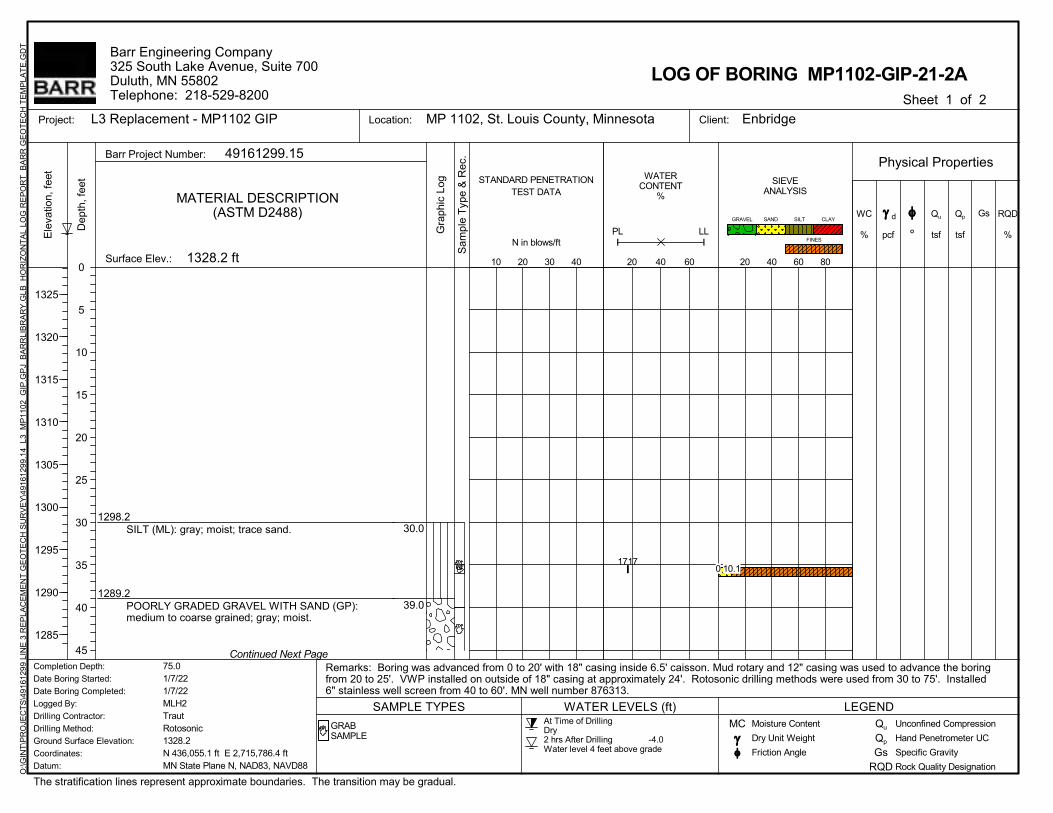
30.0
39.0
SILT (ML): gray; moist; trace sand.
POORLY GRADED GRAVEL WITH SAND (GP):medium to coarse grained; gray; moist.
1298.2
1289.2
Physical Properties
Client:L3 Replacement - MP1102 GIP MP 1102, St. Louis County, Minnesota Enbridge
1328.2 ft
STANDARD PENETRATIONTEST DATA
WC
%
The stratification lines represent approximate boundaries. The transition may be gradual.
Continued Next Page
SAMPLE TYPES
GRABSAMPLE
°
MATERIAL DESCRIPTION(ASTM D2488)
Barr Project Number: 49161299.15
Surface Elev.:
Barr Engineering Company325 South Lake Avenue, Suite 700Duluth, MN 55802Telephone: 218-529-8200
Qp
tsf
Gs RQD
%
d
20 40 60
N in blows/ft
Qu
tsf
Dep
th, f
eet
0
5
10
15
20
25
30
35
40
45
PL LL
Sam
ple
Typ
e &
Rec
.
WATERCONTENT
%
SIEVEANALYSIS
Location:
WATER LEVELS (ft) LEGEND
Gra
phic
Log
pcf
GRAVEL SILT
Dry Unit Weight
Moisture Content
Friction Angle MC
Specific Gravity
Qu
Qp
Gs
Unconfined Compression
Hand Penetrometer UC
RQD Rock Quality Designation
CLAY
FINES
10 20 30 40
Ele
vatio
n, f
eet
1325
1320
1315
1310
1305
1300
1295
1290
1285
Sheet 1 of 2
Project:
SAND
Remarks: Boring was advanced from 0 to 20' with 18" casing inside 6.5' caisson. Mud rotary and 12" casing was used to advance the boringfrom 20 to 25'. VWP installed on outside of 18" casing at approximately 24'. Rotosonic drilling methods were used from 30 to 75'. Installed6" stainless well screen from 40 to 60'. MN well number 876313.
At Time of DrillingDry2 hrs After Drilling -4.0Water level 4 feet above grade
LOG OF BORING MP1102-GIP-21-2A
Completion Depth:
Date Boring Started:
Date Boring Completed:
Logged By:
Drilling Contractor:
Drilling Method:
Ground Surface Elevation:
Coordinates:
Datum:
75.01/7/221/7/22MLH2TrautRotosonic1328.2N 436,055.1 ft E 2,715,786.4 ftMN State Plane N, NAD83, NAVD88
O:\G
INT
\PR
OJE
CT
S\4
9161
299
LIN
E 3
RE
PLA
CE
ME
NT
GE
OT
EC
H S
UR
VE
Y\4
9161
299.
14_
L3_
MP
1102
_GIP
.GP
J B
AR
RLI
BR
AR
Y.G
LB H
OR
IZO
NT
AL
LOG
RE
PO
RT
BA
RR
GE
OT
EC
H T
EM
PLA
TE
.GD
T
1717
20 40 60 80
0 10.1
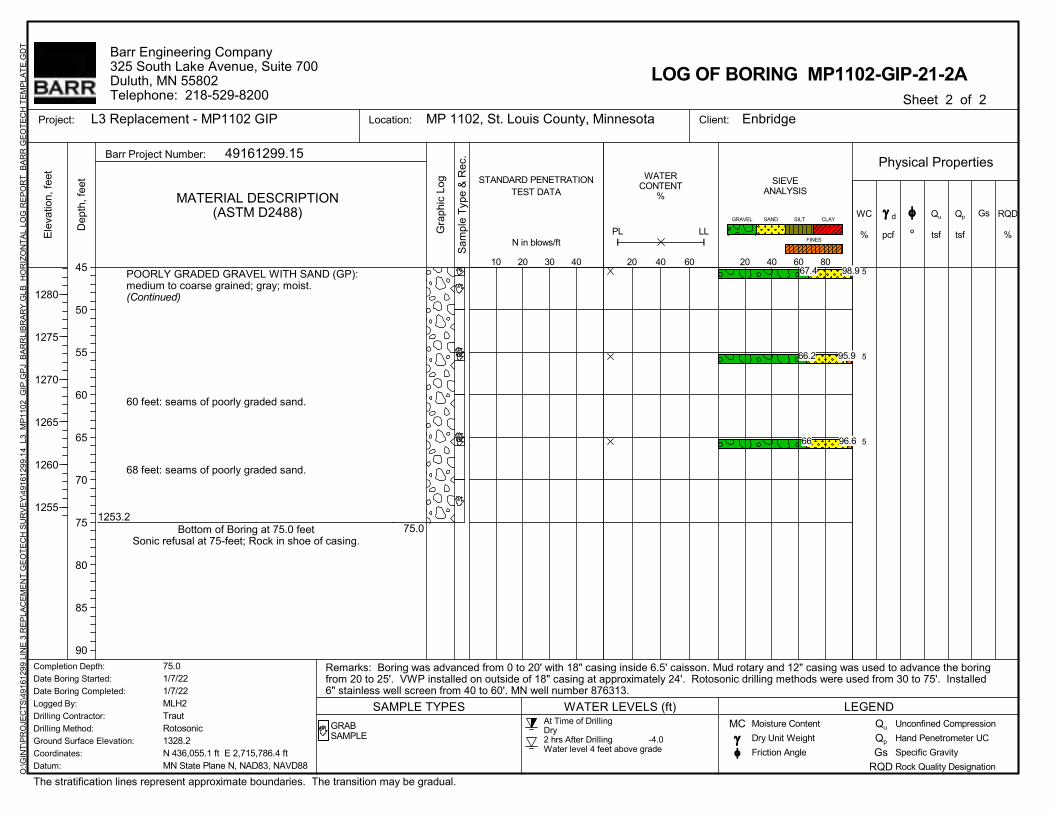
5
5
5
75.0
POORLY GRADED GRAVEL WITH SAND (GP):medium to coarse grained; gray; moist.(Continued)
60 feet: seams of poorly graded sand.
68 feet: seams of poorly graded sand.
Bottom of Boring at 75.0 feetSonic refusal at 75-feet; Rock in shoe of casing.
1253.2
Physical Properties
Client:L3 Replacement - MP1102 GIP MP 1102, St. Louis County, Minnesota Enbridge
STANDARD PENETRATIONTEST DATA
WC
%
The stratification lines represent approximate boundaries. The transition may be gradual.
SAMPLE TYPES
GRABSAMPLE
°
MATERIAL DESCRIPTION(ASTM D2488)
Barr Project Number: 49161299.15
Barr Engineering Company325 South Lake Avenue, Suite 700Duluth, MN 55802Telephone: 218-529-8200
Qp
tsf
Gs RQD
%
d
20 40 60
N in blows/ft
Qu
tsf
Dep
th, f
eet
45
50
55
60
65
70
75
80
85
90
PL LL
Sam
ple
Typ
e &
Rec
.
WATERCONTENT
%
SIEVEANALYSIS
Location:
WATER LEVELS (ft) LEGEND
Gra
phic
Log
pcf
GRAVEL SILT
Dry Unit Weight
Moisture Content
Friction Angle MC
Specific Gravity
Qu
Qp
Gs
Unconfined Compression
Hand Penetrometer UC
RQD Rock Quality Designation
CLAY
FINES
10 20 30 40
Ele
vatio
n, f
eet
1280
1275
1270
1265
1260
1255
Sheet 2 of 2
Project:
SAND
Remarks: Boring was advanced from 0 to 20' with 18" casing inside 6.5' caisson. Mud rotary and 12" casing was used to advance the boringfrom 20 to 25'. VWP installed on outside of 18" casing at approximately 24'. Rotosonic drilling methods were used from 30 to 75'. Installed6" stainless well screen from 40 to 60'. MN well number 876313.
At Time of DrillingDry2 hrs After Drilling -4.0Water level 4 feet above grade
LOG OF BORING MP1102-GIP-21-2A
Completion Depth:
Date Boring Started:
Date Boring Completed:
Logged By:
Drilling Contractor:
Drilling Method:
Ground Surface Elevation:
Coordinates:
Datum:
75.01/7/221/7/22MLH2TrautRotosonic1328.2N 436,055.1 ft E 2,715,786.4 ftMN State Plane N, NAD83, NAVD88
O:\G
INT
\PR
OJE
CT
S\4
9161
299
LIN
E 3
RE
PLA
CE
ME
NT
GE
OT
EC
H S
UR
VE
Y\4
9161
299.
14_
L3_
MP
1102
_GIP
.GP
J B
AR
RLI
BR
AR
Y.G
LB H
OR
IZO
NT
AL
LOG
RE
PO
RT
BA
RR
GE
OT
EC
H T
EM
PLA
TE
.GD
T
20 40 60 8067.4
66.2
66
98.9
95.9
96.6
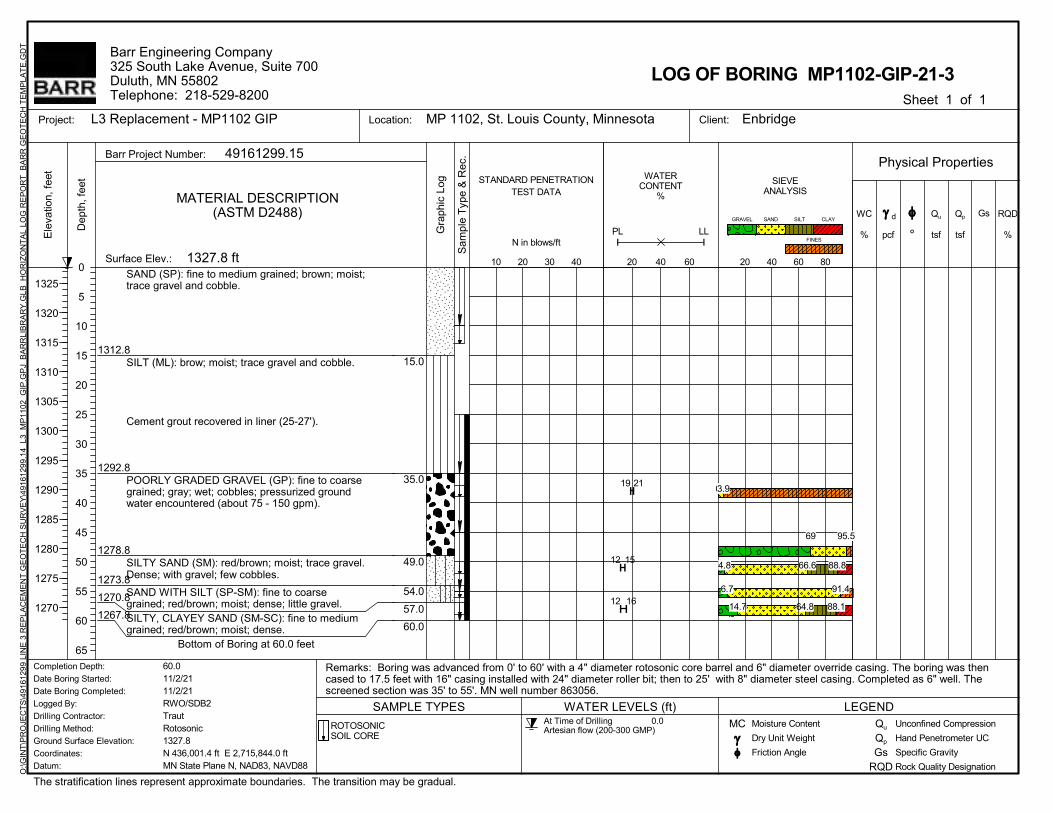
15.0
35.0
49.0
54.0
57.0
60.0
SAND (SP): fine to medium grained; brown; moist;trace gravel and cobble.
SILT (ML): brow; moist; trace gravel and cobble.
Cement grout recovered in liner (25-27').
POORLY GRADED GRAVEL (GP): fine to coarsegrained; gray; wet; cobbles; pressurized groundwater encountered (about 75 - 150 gpm).
SILTY SAND (SM): red/brown; moist; trace gravel.Dense; with gravel; few cobbles.
SAND WITH SILT (SP-SM): fine to coarsegrained; red/brown; moist; dense; little gravel.SILTY, CLAYEY SAND (SM-SC): fine to mediumgrained; red/brown; moist; dense.
Bottom of Boring at 60.0 feet
1312.8
1292.8
1278.8
1273.8
1270.8
1267.8
Physical Properties
Client:L3 Replacement - MP1102 GIP MP 1102, St. Louis County, Minnesota Enbridge
1327.8 ft
STANDARD PENETRATIONTEST DATA
WC
%
The stratification lines represent approximate boundaries. The transition may be gradual.
SAMPLE TYPES
ROTOSONICSOIL CORE
°
MATERIAL DESCRIPTION(ASTM D2488)
Barr Project Number: 49161299.15
Surface Elev.:
Barr Engineering Company325 South Lake Avenue, Suite 700Duluth, MN 55802Telephone: 218-529-8200
Qp
tsf
Gs RQD
%
d
20 40 60
N in blows/ft
Qu
tsf
Dep
th, f
eet
0
5
10
15
20
25
30
35
40
45
50
55
60
65
PL LL
Sam
ple
Typ
e &
Rec
.
WATERCONTENT
%
SIEVEANALYSIS
Location:
WATER LEVELS (ft) LEGEND
Gra
phic
Log
pcf
GRAVEL SILT
Dry Unit Weight
Moisture Content
Friction Angle MC
Specific Gravity
Qu
Qp
Gs
Unconfined Compression
Hand Penetrometer UC
RQD Rock Quality Designation
CLAY
FINES
10 20 30 40
Ele
vatio
n, f
eet
1325
1320
1315
1310
1305
1300
1295
1290
1285
1280
1275
1270
Sheet 1 of 1
Project:
SAND
Remarks: Boring was advanced from 0' to 60' with a 4" diameter rotosonic core barrel and 6" diameter override casing. The boring was thencased to 17.5 feet with 16" casing installed with 24" diameter roller bit; then to 25' with 8" diameter steel casing. Completed as 6" well. Thescreened section was 35' to 55'. MN well number 863056.
At Time of Drilling 0.0Artesian flow (200-300 GMP)
LOG OF BORING MP1102-GIP-21-3
Completion Depth:
Date Boring Started:
Date Boring Completed:
Logged By:
Drilling Contractor:
Drilling Method:
Ground Surface Elevation:
Coordinates:
Datum:
60.011/2/2111/2/21RWO/SDB2TrautRotosonic1327.8N 436,001.4 ft E 2,715,844.0 ftMN State Plane N, NAD83, NAVD88
O:\G
INT
\PR
OJE
CT
S\4
9161
299
LIN
E 3
RE
PLA
CE
ME
NT
GE
OT
EC
H S
UR
VE
Y\4
9161
299.
14_
L3_
MP
1102
_GIP
.GP
J B
AR
RLI
BR
AR
Y.G
LB H
OR
IZO
NT
AL
LOG
RE
PO
RT
BA
RR
GE
OT
EC
H T
EM
PLA
TE
.GD
T
19 21
12 15
12 16
20 40 60 80
0
69
4.8
6.7
14.7
3.9
95.5
66.6
91.4
64.8
88.8
88.1
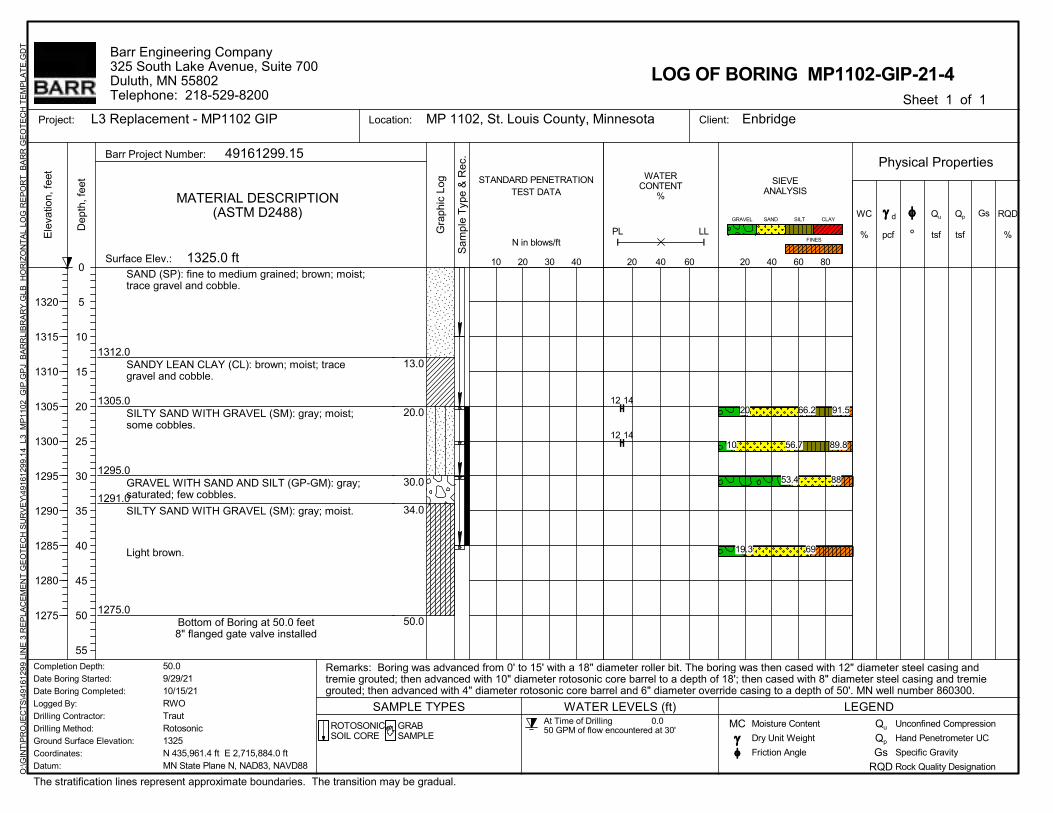
13.0
20.0
30.0
34.0
50.0
SAND (SP): fine to medium grained; brown; moist;trace gravel and cobble.
SANDY LEAN CLAY (CL): brown; moist; tracegravel and cobble.
SILTY SAND WITH GRAVEL (SM): gray; moist;some cobbles.
GRAVEL WITH SAND AND SILT (GP-GM): gray;saturated; few cobbles.
SILTY SAND WITH GRAVEL (SM): gray; moist.
Light brown.
Bottom of Boring at 50.0 feet8" flanged gate valve installed
1312.0
1305.0
1295.0
1291.0
1275.0
Physical Properties
Client:L3 Replacement - MP1102 GIP MP 1102, St. Louis County, Minnesota Enbridge
1325.0 ft
STANDARD PENETRATIONTEST DATA
WC
%
The stratification lines represent approximate boundaries. The transition may be gradual.
SAMPLE TYPES
ROTOSONICSOIL CORE
GRABSAMPLE
°
MATERIAL DESCRIPTION(ASTM D2488)
Barr Project Number: 49161299.15
Surface Elev.:
Barr Engineering Company325 South Lake Avenue, Suite 700Duluth, MN 55802Telephone: 218-529-8200
Qp
tsf
Gs RQD
%
d
20 40 60
N in blows/ft
Qu
tsf
Dep
th, f
eet
0
5
10
15
20
25
30
35
40
45
50
55
PL LL
Sam
ple
Typ
e &
Rec
.
WATERCONTENT
%
SIEVEANALYSIS
Location:
WATER LEVELS (ft) LEGEND
Gra
phic
Log
pcf
GRAVEL SILT
Dry Unit Weight
Moisture Content
Friction Angle MC
Specific Gravity
Qu
Qp
Gs
Unconfined Compression
Hand Penetrometer UC
RQD Rock Quality Designation
CLAY
FINES
10 20 30 40
Ele
vatio
n, f
eet
1320
1315
1310
1305
1300
1295
1290
1285
1280
1275
Sheet 1 of 1
Project:
SAND
Remarks: Boring was advanced from 0' to 15' with a 18" diameter roller bit. The boring was then cased with 12" diameter steel casing andtremie grouted; then advanced with 10" diameter rotosonic core barrel to a depth of 18'; then cased with 8" diameter steel casing and tremiegrouted; then advanced with 4" diameter rotosonic core barrel and 6" diameter override casing to a depth of 50'. MN well number 860300.
At Time of Drilling 0.050 GPM of flow encountered at 30'
LOG OF BORING MP1102-GIP-21-4
Completion Depth:
Date Boring Started:
Date Boring Completed:
Logged By:
Drilling Contractor:
Drilling Method:
Ground Surface Elevation:
Coordinates:
Datum:
50.09/29/2110/15/21RWOTrautRotosonic1325N 435,961.4 ft E 2,715,884.0 ftMN State Plane N, NAD83, NAVD88
O:\G
INT
\PR
OJE
CT
S\4
9161
299
LIN
E 3
RE
PLA
CE
ME
NT
GE
OT
EC
H S
UR
VE
Y\4
9161
299.
14_
L3_
MP
1102
_GIP
.GP
J B
AR
RLI
BR
AR
Y.G
LB H
OR
IZO
NT
AL
LOG
RE
PO
RT
BA
RR
GE
OT
EC
H T
EM
PLA
TE
.GD
T
12 14
12 14
20 40 60 80
20
10
53.4
19.3
66.2
56.7
88
69
91.5
89.8
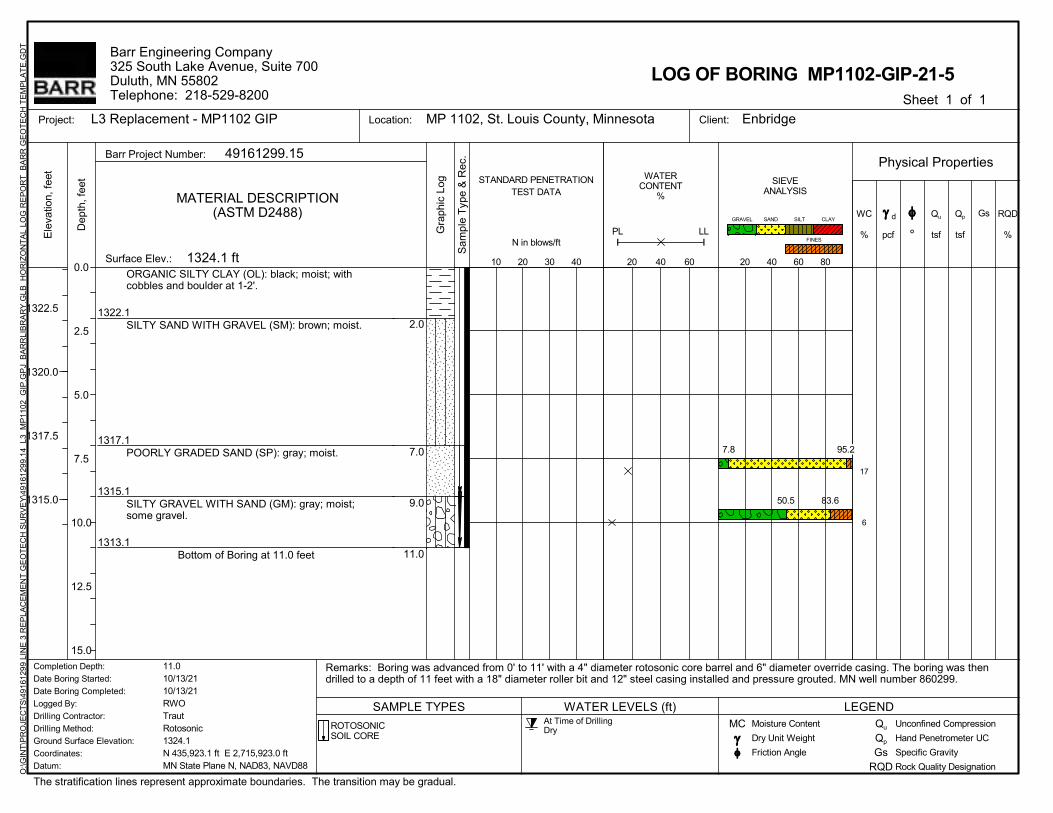
17
6
2.0
7.0
9.0
11.0
ORGANIC SILTY CLAY (OL): black; moist; withcobbles and boulder at 1-2'.
SILTY SAND WITH GRAVEL (SM): brown; moist.
POORLY GRADED SAND (SP): gray; moist.
SILTY GRAVEL WITH SAND (GM): gray; moist;some gravel.
Bottom of Boring at 11.0 feet
1322.1
1317.1
1315.1
1313.1
Physical Properties
Client:L3 Replacement - MP1102 GIP MP 1102, St. Louis County, Minnesota Enbridge
1324.1 ft
STANDARD PENETRATIONTEST DATA
WC
%
The stratification lines represent approximate boundaries. The transition may be gradual.
SAMPLE TYPES
ROTOSONICSOIL CORE
°
MATERIAL DESCRIPTION(ASTM D2488)
Barr Project Number: 49161299.15
Surface Elev.:
Barr Engineering Company325 South Lake Avenue, Suite 700Duluth, MN 55802Telephone: 218-529-8200
Qp
tsf
Gs RQD
%
d
20 40 60
N in blows/ft
Qu
tsf
Dep
th, f
eet
0.0
2.5
5.0
7.5
10.0
12.5
15.0
PL LL
Sam
ple
Typ
e &
Rec
.
WATERCONTENT
%
SIEVEANALYSIS
Location:
WATER LEVELS (ft) LEGEND
Gra
phic
Log
pcf
GRAVEL SILT
Dry Unit Weight
Moisture Content
Friction Angle MC
Specific Gravity
Qu
Qp
Gs
Unconfined Compression
Hand Penetrometer UC
RQD Rock Quality Designation
CLAY
FINES
10 20 30 40
Ele
vatio
n, f
eet
1322.5
1320.0
1317.5
1315.0
Sheet 1 of 1
Project:
SAND
Remarks: Boring was advanced from 0' to 11' with a 4" diameter rotosonic core barrel and 6" diameter override casing. The boring was thendrilled to a depth of 11 feet with a 18" diameter roller bit and 12" steel casing installed and pressure grouted. MN well number 860299.
At Time of DrillingDry
LOG OF BORING MP1102-GIP-21-5
Completion Depth:
Date Boring Started:
Date Boring Completed:
Logged By:
Drilling Contractor:
Drilling Method:
Ground Surface Elevation:
Coordinates:
Datum:
11.010/13/2110/13/21RWOTrautRotosonic1324.1N 435,923.1 ft E 2,715,923.0 ftMN State Plane N, NAD83, NAVD88
O:\G
INT
\PR
OJE
CT
S\4
9161
299
LIN
E 3
RE
PLA
CE
ME
NT
GE
OT
EC
H S
UR
VE
Y\4
9161
299.
14_
L3_
MP
1102
_GIP
.GP
J B
AR
RLI
BR
AR
Y.G
LB H
OR
IZO
NT
AL
LOG
RE
PO
RT
BA
RR
GE
OT
EC
H T
EM
PLA
TE
.GD
T
20 40 60 80
7.8
50.5
95.2
83.6
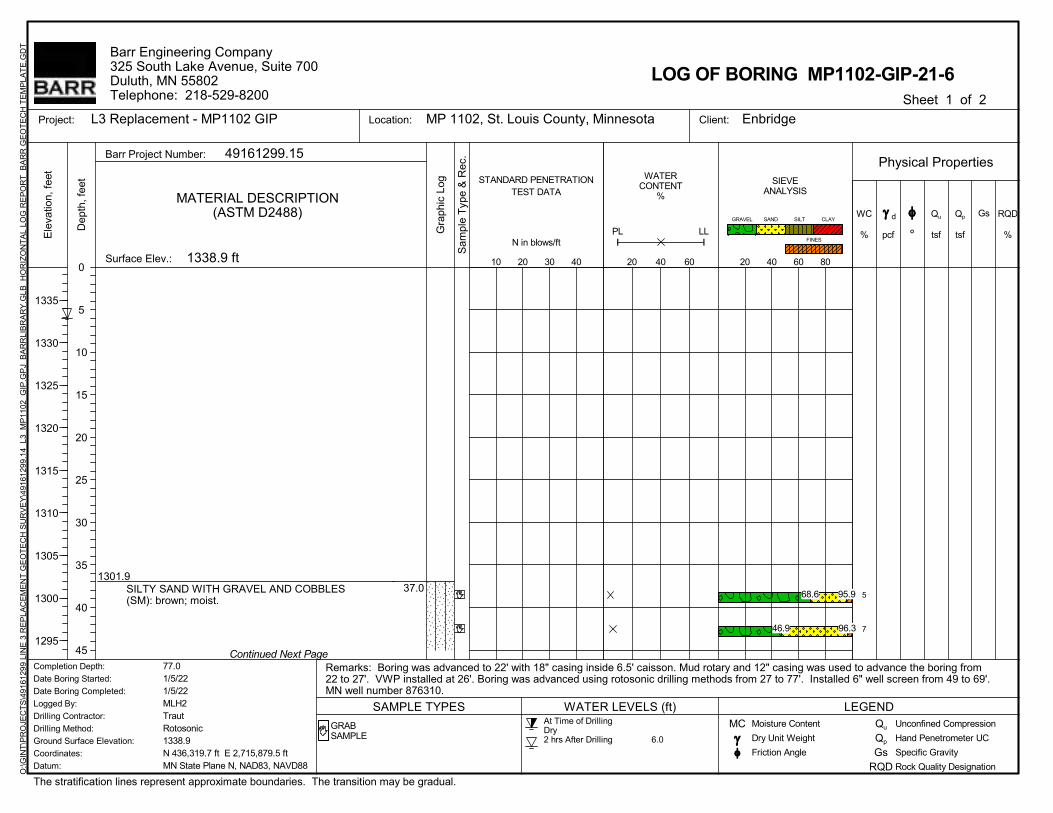
5
7
37.0SILTY SAND WITH GRAVEL AND COBBLES(SM): brown; moist.
1301.9
Physical Properties
Client:L3 Replacement - MP1102 GIP MP 1102, St. Louis County, Minnesota Enbridge
1338.9 ft
STANDARD PENETRATIONTEST DATA
WC
%
The stratification lines represent approximate boundaries. The transition may be gradual.
Continued Next Page
SAMPLE TYPES
GRABSAMPLE
°
MATERIAL DESCRIPTION(ASTM D2488)
Barr Project Number: 49161299.15
Surface Elev.:
Barr Engineering Company325 South Lake Avenue, Suite 700Duluth, MN 55802Telephone: 218-529-8200
Qp
tsf
Gs RQD
%
d
20 40 60
N in blows/ft
Qu
tsf
Dep
th, f
eet
0
5
10
15
20
25
30
35
40
45
PL LL
Sam
ple
Typ
e &
Rec
.
WATERCONTENT
%
SIEVEANALYSIS
Location:
WATER LEVELS (ft) LEGEND
Gra
phic
Log
pcf
GRAVEL SILT
Dry Unit Weight
Moisture Content
Friction Angle MC
Specific Gravity
Qu
Qp
Gs
Unconfined Compression
Hand Penetrometer UC
RQD Rock Quality Designation
CLAY
FINES
10 20 30 40
Ele
vatio
n, f
eet
1335
1330
1325
1320
1315
1310
1305
1300
1295
Sheet 1 of 2
Project:
SAND
Remarks: Boring was advanced to 22' with 18" casing inside 6.5' caisson. Mud rotary and 12" casing was used to advance the boring from22 to 27'. VWP installed at 26'. Boring was advanced using rotosonic drilling methods from 27 to 77'. Installed 6" well screen from 49 to 69'.MN well number 876310.
At Time of DrillingDry2 hrs After Drilling 6.0
LOG OF BORING MP1102-GIP-21-6
Completion Depth:
Date Boring Started:
Date Boring Completed:
Logged By:
Drilling Contractor:
Drilling Method:
Ground Surface Elevation:
Coordinates:
Datum:
77.01/5/221/5/22MLH2TrautRotosonic1338.9N 436,319.7 ft E 2,715,879.5 ftMN State Plane N, NAD83, NAVD88
O:\G
INT
\PR
OJE
CT
S\4
9161
299
LIN
E 3
RE
PLA
CE
ME
NT
GE
OT
EC
H S
UR
VE
Y\4
9161
299.
14_
L3_
MP
1102
_GIP
.GP
J B
AR
RLI
BR
AR
Y.G
LB H
OR
IZO
NT
AL
LOG
RE
PO
RT
BA
RR
GE
OT
EC
H T
EM
PLA
TE
.GD
T
20 40 60 80
68.6
46.9
95.9
96.3
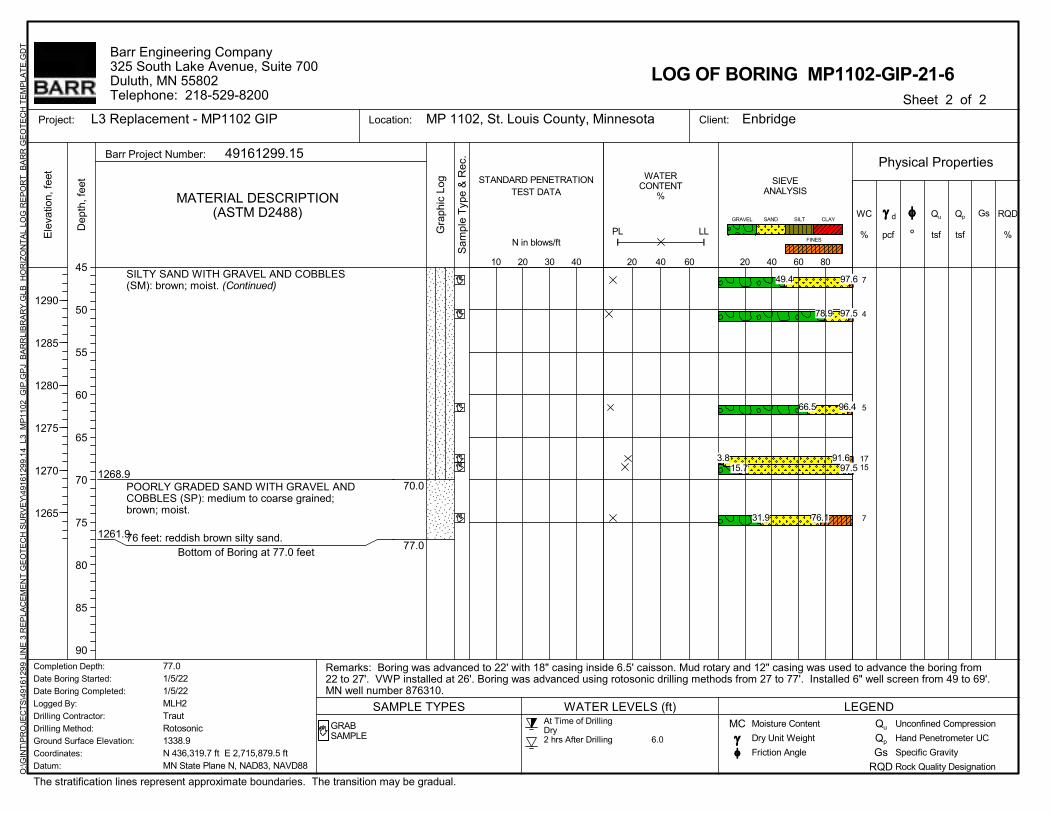
7
4
5
1715
7
70.0
77.0
SILTY SAND WITH GRAVEL AND COBBLES(SM): brown; moist. (Continued)
POORLY GRADED SAND WITH GRAVEL ANDCOBBLES (SP): medium to coarse grained;brown; moist.
76 feet: reddish brown silty sand.Bottom of Boring at 77.0 feet
1268.9
1261.9
Physical Properties
Client:L3 Replacement - MP1102 GIP MP 1102, St. Louis County, Minnesota Enbridge
STANDARD PENETRATIONTEST DATA
WC
%
The stratification lines represent approximate boundaries. The transition may be gradual.
SAMPLE TYPES
GRABSAMPLE
°
MATERIAL DESCRIPTION(ASTM D2488)
Barr Project Number: 49161299.15
Barr Engineering Company325 South Lake Avenue, Suite 700Duluth, MN 55802Telephone: 218-529-8200
Qp
tsf
Gs RQD
%
d
20 40 60
N in blows/ft
Qu
tsf
Dep
th, f
eet
45
50
55
60
65
70
75
80
85
90
PL LL
Sam
ple
Typ
e &
Rec
.
WATERCONTENT
%
SIEVEANALYSIS
Location:
WATER LEVELS (ft) LEGEND
Gra
phic
Log
pcf
GRAVEL SILT
Dry Unit Weight
Moisture Content
Friction Angle MC
Specific Gravity
Qu
Qp
Gs
Unconfined Compression
Hand Penetrometer UC
RQD Rock Quality Designation
CLAY
FINES
10 20 30 40
Ele
vatio
n, f
eet
1290
1285
1280
1275
1270
1265
Sheet 2 of 2
Project:
SAND
Remarks: Boring was advanced to 22' with 18" casing inside 6.5' caisson. Mud rotary and 12" casing was used to advance the boring from22 to 27'. VWP installed at 26'. Boring was advanced using rotosonic drilling methods from 27 to 77'. Installed 6" well screen from 49 to 69'.MN well number 876310.
At Time of DrillingDry2 hrs After Drilling 6.0
LOG OF BORING MP1102-GIP-21-6
Completion Depth:
Date Boring Started:
Date Boring Completed:
Logged By:
Drilling Contractor:
Drilling Method:
Ground Surface Elevation:
Coordinates:
Datum:
77.01/5/221/5/22MLH2TrautRotosonic1338.9N 436,319.7 ft E 2,715,879.5 ftMN State Plane N, NAD83, NAVD88
O:\G
INT
\PR
OJE
CT
S\4
9161
299
LIN
E 3
RE
PLA
CE
ME
NT
GE
OT
EC
H S
UR
VE
Y\4
9161
299.
14_
L3_
MP
1102
_GIP
.GP
J B
AR
RLI
BR
AR
Y.G
LB H
OR
IZO
NT
AL
LOG
RE
PO
RT
BA
RR
GE
OT
EC
H T
EM
PLA
TE
.GD
T
20 40 60 80
49.4
78.9
66.5
3.815.7
31.9
97.6
97.5
96.4
91.697.5
76.1
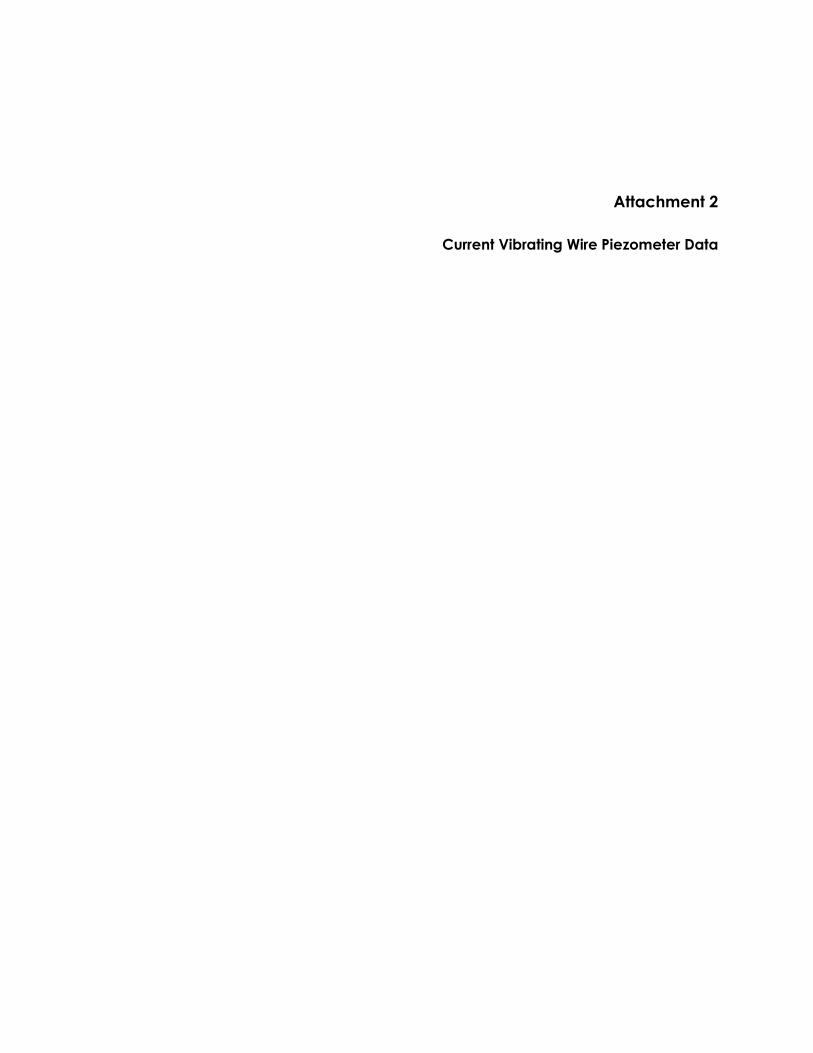
Attachment 2
Current Vibrating Wire Piezometer Data
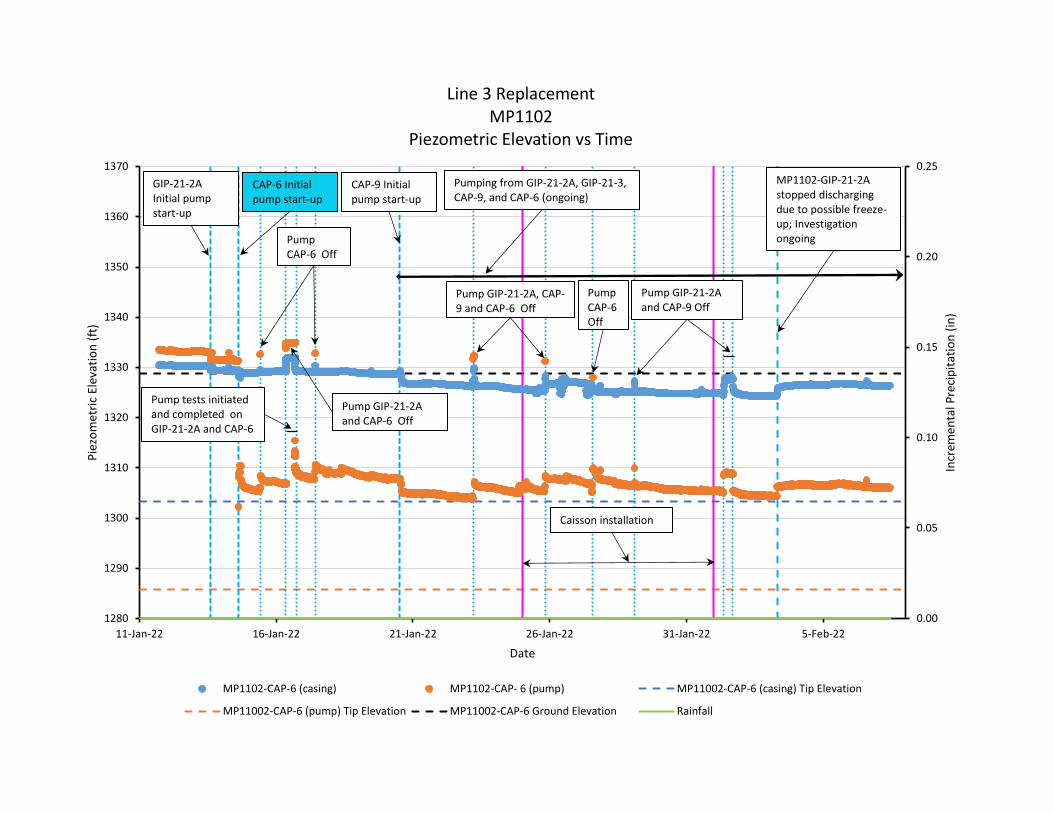
0.00
0.05
0.10
0.15
0.20
0.25
1280
1290
1300
1310
1320
1330
1340
1350
1360
1370
11-Jan-22 16-Jan-22 21-Jan-22 26-Jan-22 31-Jan-22 5-Feb-22
Incr
emen
tal P
reci
pit
atio
n (
in)
Pie
zom
etri
c El
evat
ion
(ft
)
Date
Line 3 Replacement MP1102
Piezometric Elevation vs Time
MP1102-CAP-6 (casing) MP1102-CAP- 6 (pump) MP11002-CAP-6 (casing) Tip Elevation
MP11002-CAP-6 (pump) Tip Elevation MP11002-CAP-6 Ground Elevation Rainfall
Caisson installation
Pumping from GIP-21-2A, GIP-21-3, CAP-9, and CAP-6 (ongoing)
Pump tests initiated and completed on GIP-21-2A and CAP-6
Pump GIP-21-2A, CAP-9 and CAP-6 Off
Pump GIP-21-2Aand CAP-6 Off
MP1102-GIP-21-2A stopped discharging due to possible freeze-up; Investigation ongoing
Pump GIP-21-2A and CAP-9 Off
CAP-6 Initialpump start-up
GIP-21-2AInitial pump start-up
CAP-9 Initialpump start-up
Pump CAP-6 Off
Pump CAP-6 Off
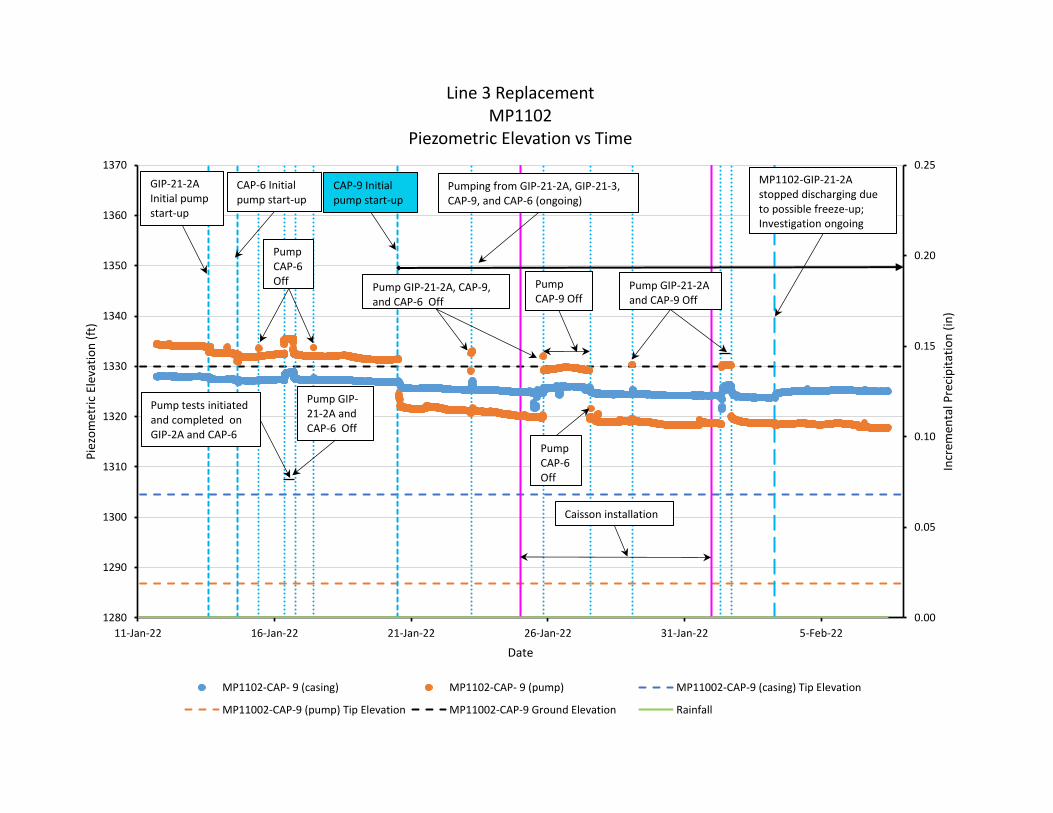
0.00
0.05
0.10
0.15
0.20
0.25
1280
1290
1300
1310
1320
1330
1340
1350
1360
1370
11-Jan-22 16-Jan-22 21-Jan-22 26-Jan-22 31-Jan-22 5-Feb-22
Incr
emen
tal P
reci
pit
atio
n (
in)
Pie
zom
etri
c El
evat
ion
(ft
)
Date
Line 3 Replacement MP1102
Piezometric Elevation vs Time
MP1102-CAP- 9 (casing) MP1102-CAP- 9 (pump) MP11002-CAP-9 (casing) Tip Elevation
MP11002-CAP-9 (pump) Tip Elevation MP11002-CAP-9 Ground Elevation Rainfall
Caisson installation
Pumping from GIP-21-2A, GIP-21-3, CAP-9, and CAP-6 (ongoing)
Pump GIP-21-2A, CAP-9, and CAP-6 Off
Pump GIP-21-2A and CAP-9 Off
MP1102-GIP-21-2A stopped discharging due to possible freeze-up;Investigation ongoing
Pump GIP-21-2A and CAP-6 Off
Pump tests initiated and completed on GIP-2A and CAP-6
Pump CAP-9 Off
CAP-6 Initialpump start-up
GIP-21-2AInitial pump start-up
CAP-9 Initialpump start-up
Pump CAP-6 Off
Pump CAP-6 Off
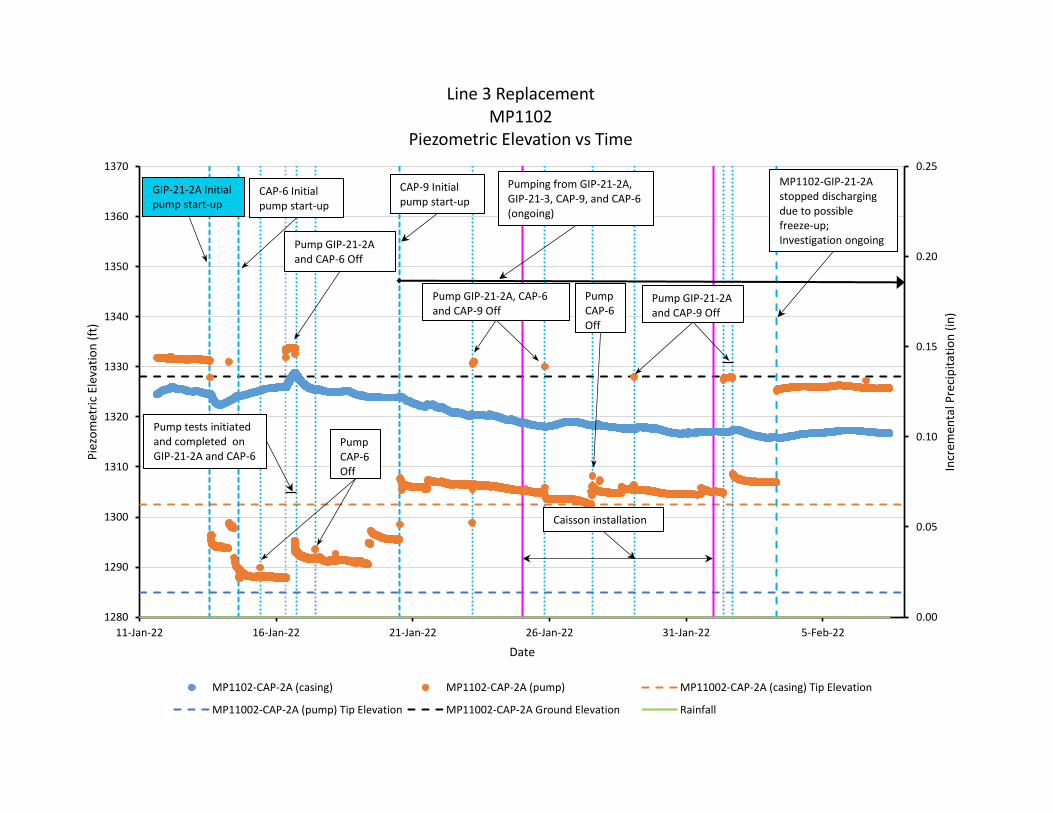
0.00
0.05
0.10
0.15
0.20
0.25
1280
1290
1300
1310
1320
1330
1340
1350
1360
1370
11-Jan-22 16-Jan-22 21-Jan-22 26-Jan-22 31-Jan-22 5-Feb-22
Incr
emen
tal P
reci
pit
atio
n (
in)
Pie
zom
etri
c El
evat
ion
(ft
)
Date
Line 3 Replacement MP1102
Piezometric Elevation vs Time
MP1102-CAP-2A (casing) MP1102-CAP-2A (pump) MP11002-CAP-2A (casing) Tip Elevation
MP11002-CAP-2A (pump) Tip Elevation MP11002-CAP-2A Ground Elevation Rainfall
Caisson installation
Pumping from GIP-21-2A, GIP-21-3, CAP-9, and CAP-6 (ongoing)
MP1102-GIP-21-2A stopped discharging due to possible freeze-up;Investigation ongoing
Pump tests initiated and completed on GIP-21-2A and CAP-6
Pump GIP-21-2Aand CAP-6 Off
GIP-21-2A Initial pump start-up
CAP-6 Initialpump start-up
Pump GIP-21-2A, CAP-6 and CAP-9 Off
CAP-9 Initialpump start-up
Pump GIP-21-2A and CAP-9 Off
Pump CAP-6 Off
Pump CAP-6 Off
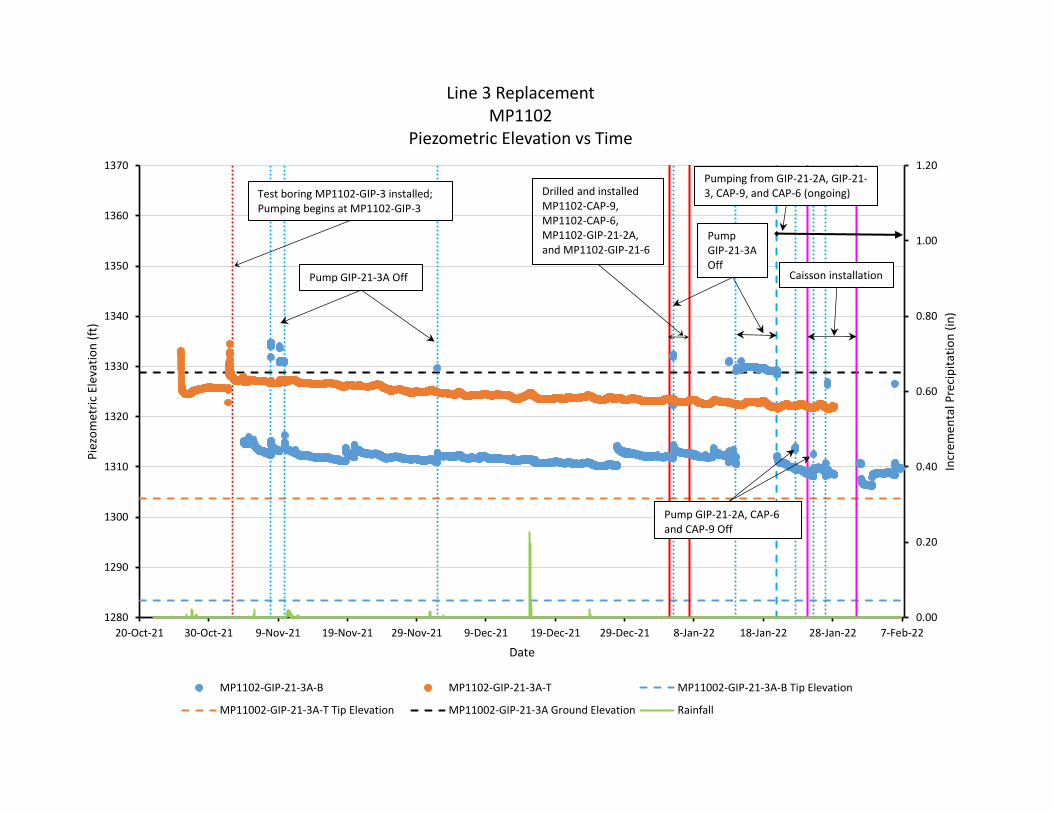
0.00
0.20
0.40
0.60
0.80
1.00
1.20
1280
1290
1300
1310
1320
1330
1340
1350
1360
1370
20-Oct-21 30-Oct-21 9-Nov-21 19-Nov-21 29-Nov-21 9-Dec-21 19-Dec-21 29-Dec-21 8-Jan-22 18-Jan-22 28-Jan-22 7-Feb-22
Incr
emen
tal P
reci
pit
atio
n (
in)
Pie
zom
etri
c El
evat
ion
(ft
)
Date
Line 3 Replacement MP1102
Piezometric Elevation vs Time
MP1102-GIP-21-3A-B MP1102-GIP-21-3A-T MP11002-GIP-21-3A-B Tip Elevation
MP11002-GIP-21-3A-T Tip Elevation MP11002-GIP-21-3A Ground Elevation Rainfall
Caisson installation
Pumping from GIP-21-2A, GIP-21-3, CAP-9, and CAP-6 (ongoing)Drilled and installed
MP1102-CAP-9, MP1102-CAP-6, MP1102-GIP-21-2A, and MP1102-GIP-21-6
Test boring MP1102-GIP-3 installed;Pumping begins at MP1102-GIP-3
Pump GIP-21-3A Off
Pump GIP-21-3A Off
Pump GIP-21-2A, CAP-6 and CAP-9 Off
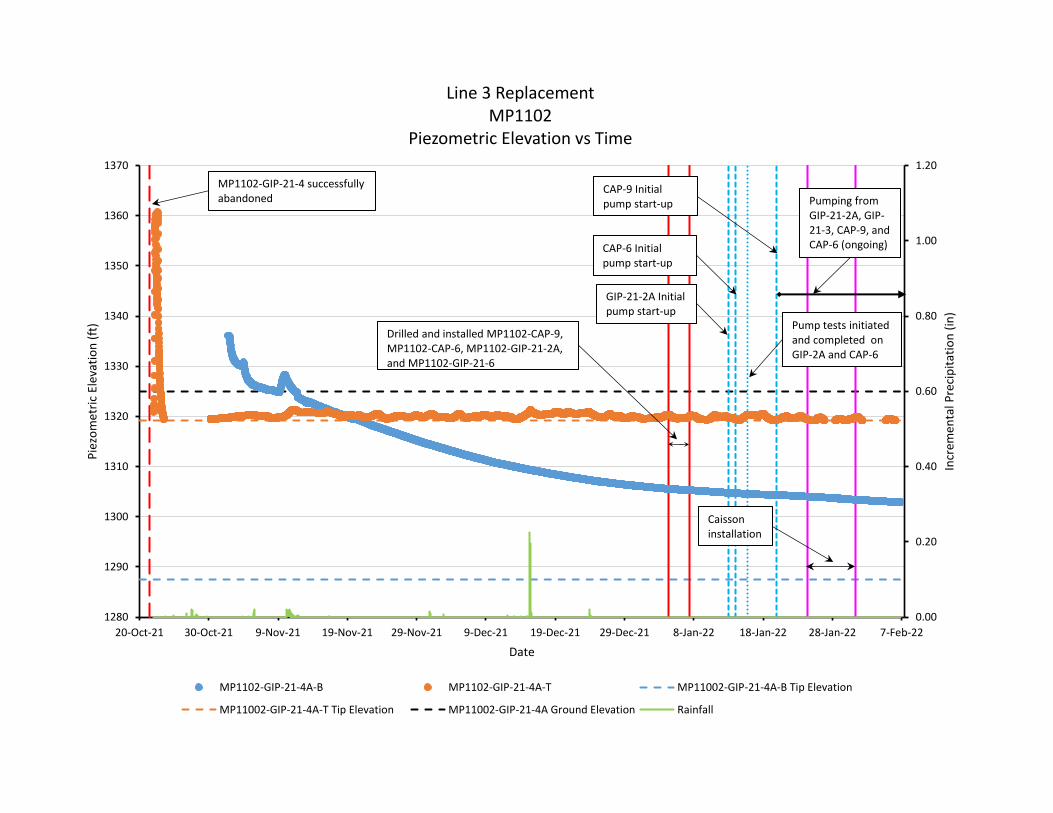
0.00
0.20
0.40
0.60
0.80
1.00
1.20
1280
1290
1300
1310
1320
1330
1340
1350
1360
1370
20-Oct-21 30-Oct-21 9-Nov-21 19-Nov-21 29-Nov-21 9-Dec-21 19-Dec-21 29-Dec-21 8-Jan-22 18-Jan-22 28-Jan-22 7-Feb-22
Incr
emen
tal P
reci
pit
atio
n (
in)
Pie
zom
etri
c El
evat
ion
(ft
)
Date
Line 3 Replacement MP1102
Piezometric Elevation vs Time
MP1102-GIP-21-4A-B MP1102-GIP-21-4A-T MP11002-GIP-21-4A-B Tip Elevation
MP11002-GIP-21-4A-T Tip Elevation MP11002-GIP-21-4A Ground Elevation Rainfall
Caisson installation
Pumping from GIP-21-2A, GIP-21-3, CAP-9, and CAP-6 (ongoing)
Drilled and installed MP1102-CAP-9, MP1102-CAP-6, MP1102-GIP-21-2A, and MP1102-GIP-21-6
MP1102-GIP-21-4 successfully abandoned
Pump tests initiated and completed on GIP-2A and CAP-6
CAP-6 Initialpump start-up
GIP-21-2A Initialpump start-up
CAP-9 Initialpump start-up

Appendix B
Alternatives Analysis
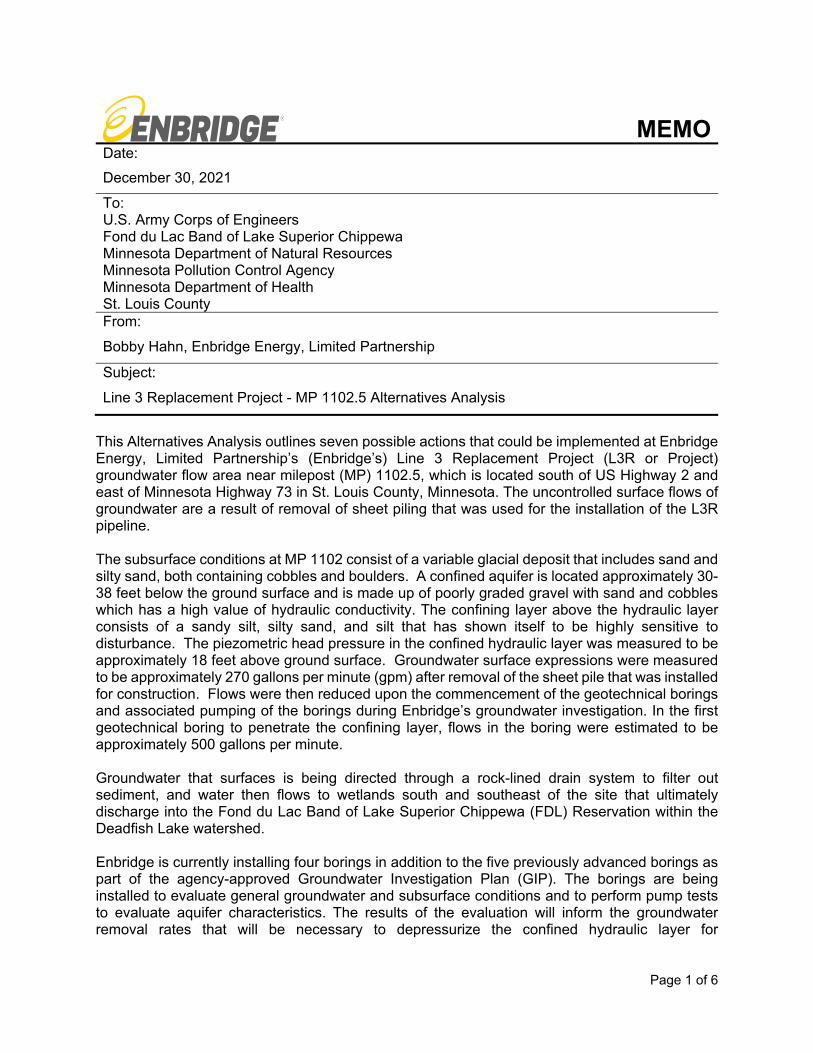
Page 1 of 6
MEMO Date:
December 30, 2021
To: U.S. Army Corps of Engineers Fond du Lac Band of Lake Superior Chippewa Minnesota Department of Natural Resources Minnesota Pollution Control Agency Minnesota Department of Health St. Louis County From:
Bobby Hahn, Enbridge Energy, Limited Partnership
Subject:
Line 3 Replacement Project - MP 1102.5 Alternatives Analysis
This Alternatives Analysis outlines seven possible actions that could be implemented at Enbridge Energy, Limited Partnership’s (Enbridge’s) Line 3 Replacement Project (L3R or Project) groundwater flow area near milepost (MP) 1102.5, which is located south of US Highway 2 and east of Minnesota Highway 73 in St. Louis County, Minnesota. The uncontrolled surface flows of groundwater are a result of removal of sheet piling that was used for the installation of the L3R pipeline. The subsurface conditions at MP 1102 consist of a variable glacial deposit that includes sand and silty sand, both containing cobbles and boulders. A confined aquifer is located approximately 30-38 feet below the ground surface and is made up of poorly graded gravel with sand and cobbles which has a high value of hydraulic conductivity. The confining layer above the hydraulic layer consists of a sandy silt, silty sand, and silt that has shown itself to be highly sensitive to disturbance. The piezometric head pressure in the confined hydraulic layer was measured to be approximately 18 feet above ground surface. Groundwater surface expressions were measured to be approximately 270 gallons per minute (gpm) after removal of the sheet pile that was installed for construction. Flows were then reduced upon the commencement of the geotechnical borings and associated pumping of the borings during Enbridge’s groundwater investigation. In the first geotechnical boring to penetrate the confining layer, flows in the boring were estimated to be approximately 500 gallons per minute. Groundwater that surfaces is being directed through a rock-lined drain system to filter out sediment, and water then flows to wetlands south and southeast of the site that ultimately discharge into the Fond du Lac Band of Lake Superior Chippewa (FDL) Reservation within the Deadfish Lake watershed. Enbridge is currently installing four borings in addition to the five previously advanced borings as part of the agency-approved Groundwater Investigation Plan (GIP). The borings are being installed to evaluate general groundwater and subsurface conditions and to perform pump tests to evaluate aquifer characteristics. The results of the evaluation will inform the groundwater removal rates that will be necessary to depressurize the confined hydraulic layer for
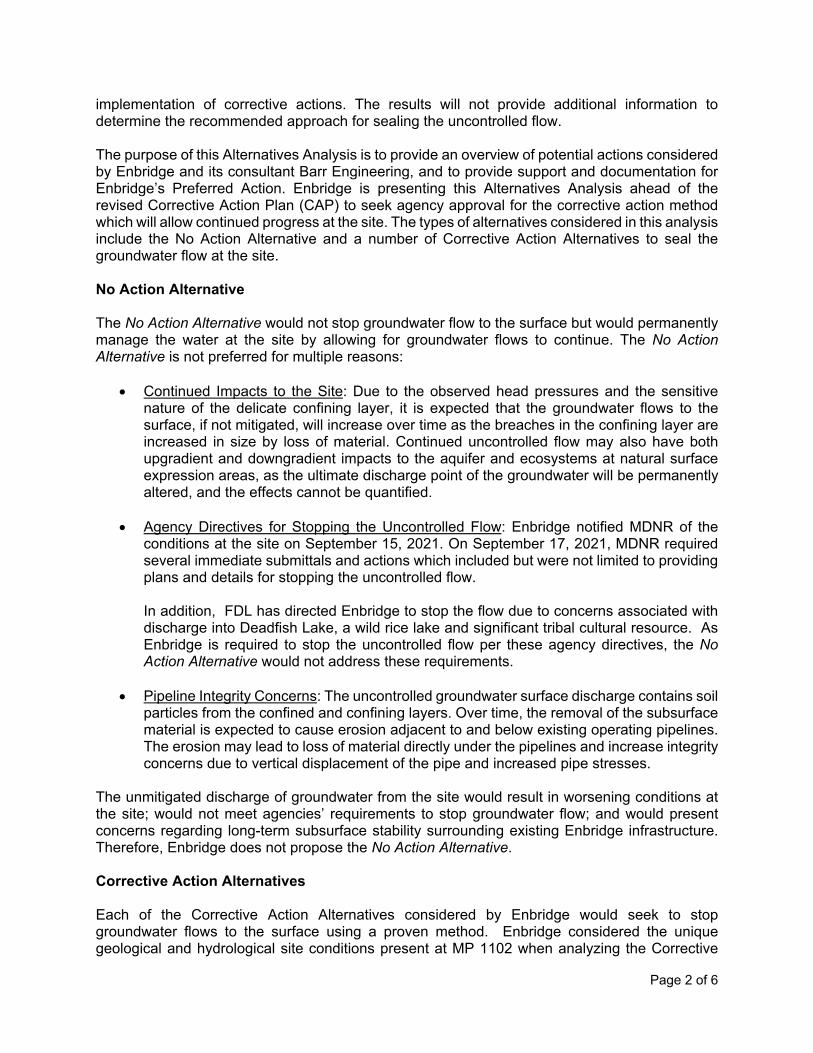
Page 2 of 6
implementation of corrective actions. The results will not provide additional information to determine the recommended approach for sealing the uncontrolled flow. The purpose of this Alternatives Analysis is to provide an overview of potential actions considered by Enbridge and its consultant Barr Engineering, and to provide support and documentation for Enbridge’s Preferred Action. Enbridge is presenting this Alternatives Analysis ahead of the revised Corrective Action Plan (CAP) to seek agency approval for the corrective action method which will allow continued progress at the site. The types of alternatives considered in this analysis include the No Action Alternative and a number of Corrective Action Alternatives to seal the groundwater flow at the site. No Action Alternative
The No Action Alternative would not stop groundwater flow to the surface but would permanently manage the water at the site by allowing for groundwater flows to continue. The No Action Alternative is not preferred for multiple reasons:
Continued Impacts to the Site: Due to the observed head pressures and the sensitive nature of the delicate confining layer, it is expected that the groundwater flows to the surface, if not mitigated, will increase over time as the breaches in the confining layer are increased in size by loss of material. Continued uncontrolled flow may also have both upgradient and downgradient impacts to the aquifer and ecosystems at natural surface expression areas, as the ultimate discharge point of the groundwater will be permanently altered, and the effects cannot be quantified.
Agency Directives for Stopping the Uncontrolled Flow: Enbridge notified MDNR of the conditions at the site on September 15, 2021. On September 17, 2021, MDNR required several immediate submittals and actions which included but were not limited to providing plans and details for stopping the uncontrolled flow.
In addition, FDL has directed Enbridge to stop the flow due to concerns associated with discharge into Deadfish Lake, a wild rice lake and significant tribal cultural resource. As Enbridge is required to stop the uncontrolled flow per these agency directives, the No Action Alternative would not address these requirements.
Pipeline Integrity Concerns: The uncontrolled groundwater surface discharge contains soil particles from the confined and confining layers. Over time, the removal of the subsurface material is expected to cause erosion adjacent to and below existing operating pipelines. The erosion may lead to loss of material directly under the pipelines and increase integrity concerns due to vertical displacement of the pipe and increased pipe stresses.
The unmitigated discharge of groundwater from the site would result in worsening conditions at the site; would not meet agencies’ requirements to stop groundwater flow; and would present concerns regarding long-term subsurface stability surrounding existing Enbridge infrastructure. Therefore, Enbridge does not propose the No Action Alternative. Corrective Action Alternatives Each of the Corrective Action Alternatives considered by Enbridge would seek to stop groundwater flows to the surface using a proven method. Enbridge considered the unique geological and hydrological site conditions present at MP 1102 when analyzing the Corrective
Page 3 of 6
Action Alternatives. Each corrective action considered carries a likelihood of success based on the site’s specific geologic and hydrologic conditions, most specifically, the hydraulic head pressure. Therefore, Enbridge’s main goal when considering corrective actions is to use a method that can maintain and not further disturb the confining layer, while being able to withstand the head pressure which results in high volumes of water expression. Corrective Action Alternatives considered by Enbridge include both non-grouting and grouting options and are described below. Non-Grouting Options Non-grouting options to seal the confining layer include:
Ground Freezing; Construction of a Sheet Pile Wall System; and Reconstruction of the Confining Layer Cap.
Ground Freezing. Ground freezing would involve drilling and installing a series of closed-cycle pipes to circulate coolant to freeze the aquifer formation. This would reduce the permeability of the aquifer to stop the flow of groundwater to the surface. Ground freezing is used in various applications throughout the world to temporarily control non-flowing groundwater. However, because of the depth of the groundwater system, the high groundwater flow rates, and the need for permanent operation, this option is not practical to implement on the scale necessary for success. The thermal dynamic and heat removal needed to freeze the site would be significant and would require extensive permanent infrastructure and power demands. The site would also need to be maintained in a frozen state permanently, because if the site were to thaw, the fracturing and volume expansion that would take place as a result of the freezing would likely increase primary and secondary permeability in the confining layer, which could result in the development or enlargement of vertical groundwater flow paths to the ground surface and additional uncontrolled artesian flow. Ground freezing would, in effect, “crack open” the confining layer upon thawing. Therefore, Enbridge has determined ground freezing is not reasonable and prudent and has removed this alternative from further consideration. Sheet Pile Wall System. The sheet pile wall system option would involve installing steel sheet piles through the confined aquifer to essentially “box-in” and cut off the flow to the aquifer. Sheet piling systems can be successful in small applications with tolerant and stable confining layers and the alternative is a straightforward approach. However, because of the sensitivity of the confining layer at this site, and because previous sheet pile use at the site was the destabilizing factor to the confining layer, this option would have a low likelihood of success. More concerning is the potential for liquefaction and further destabilization of the confining layer that would likely occur during the installation of the sheet pile, resulting in increased groundwater surface expressions. Additionally, the life expectancy of sheet pile is limited due to corrosion, and the sheet pile would likely require replacement every 50 to 100 years. Enbridge has determined that construction of a sheet pile wall system is not reasonable and prudent, and therefore has removed this alternative from further consideration. Reconstruction of a Confining Layer Cap. This final non-grouting option would involve excavation of the soil to the confining layer and then reconstruction of the damaged portion of the confining layer with new materials. A new confining layer cap would improve the strength of the weakened confining layer. While this technique can be successful in smaller applications, it would likely not be successful at this site due to the high head pressures. Additionally, this method would require excavation of a 30-foot deep area approximately 550 feet long by 50 feet wide amongst multiple existing operating pipelines. There is also a high risk that this large excavation would cause further
Page 4 of 6
uncontrolled groundwater flows due to the reduction in overburden stresses. Therefore, Enbridge has determined that reconstruction of a confining layer at this site is not reasonable and prudent and has removed this alternative from further consideration. Grouting Options Because the non-grout options would not be successful in stopping groundwater flow, Enbridge considered the following grout methods:
Tube a Manchette (TAM) Grouting; Jet Grouting; and Pressure/Permeation Grouting.
Due to the high artesian pressures encountered at relatively shallow depths, easily disturbed confining layer soils, and the high flow rates, it is unlikely that any of these grouting methods would be effective at controlling the artesian flows without first substantially reducing the piezometric head. Each method would require the installation of a series of dewatering wells installed upgradient from the seep area. The wells would pump from the underlying confined aquifer at a rate sufficient to both reduce groundwater flow to the surface and reduce upward pressures in the confined aquifer to a level that will allow for grout to be injected and set, allowing permanent sealing of existing flow paths. Tube a Manchette (TAM) Grouting. This method would involve grouting the confined layer using TAMs, which consist of a perforated pipe with dual rubber packers, to be able to precisely deliver and place grout into the formation. The grout injection would first be used at locations where the highest flows were observed and would then be used at other locations, as necessary. The TAM method was recently used to successfully stop groundwater flow expressions at a site in Hubbard County; however, site conditions differed from the MP 1102 site in several important aspects. At the site in Hubbard County, the uplift pressure and hydraulic head was much lower as compared to the pressures and flow at MP 1102. Additionally, the aquifer at the site in Hubbard County contained peaty soils which are less hydraulically transmissive than the cobble, sand, and gravel aquifer present at MP 1102. Success at the Hubbard County site was aided due to the fact that sheet piling was still in place, which plugged groundwater flow paths while areas of groundwater expression were addressed. This method is not preferred at MP 1102 because the TAM method relies on localized treatment with little to no ability to flow grout into the entire formation, which is required at MP 1102. Additionally, the estimated TAM spacing would be 2-4 feet apart and would likely take multiple passes of implementation. This method would result in more than 200 small punctures of the aquifer’s confining layer, which would likely result in additional surface seeps as demonstrated during the installation of the GIP borings. For these reasons, the TAM method is not appropriate for this setting and does not offer a high likelihood of success. Jet Grouting. This method involves using high-pressure injection of air and grout into the formation through directional nozzles to break up and loosen soil at a prescribed depth interval and reduce the aquifer void volume through placement of grout, ultimately reducing permeability and hydraulic conductivity. Grouting would be performed after head pressures are lowered via numerous dewatering wells. This targeted grout injection would be performed through numerous open holes used to treat the aquifer and confining layer at identified seepage locations. Jet grouting using cement is currently being used at a site in Clearwater County. This method is being used at the Clearwater County site because the aquifer consisted of sand overlain by a cohesive clay confining layer that could withstand high-velocity and disruptive fluid jets. This method is not preferred at MP 1102 because of the disruptive nature of the jet grouting process and the potential
Page 5 of 6
effects on the fragile silt/sandy silt confining layer, which is not as strong as at the Clearwater County site. For these reasons, the jet grouting method is not appropriate for this setting due to the risk of destabilizing the system further and creating additional surface groundwater expressions. Pressure/Permeation Grouting. This method would consist of permeating the confined gravelly aquifer to significantly reduce the hydraulic conductivity of the aquifer. Grouting would be performed after head pressures are lowered via numerous dewatering/injection wells that are in addition to the dewatering wells used to reduce groundwater flows and pressures. Each dewatering/injection well would then be used as an injection well to permeate grout into the aquifer formation with adjacent injection/dewatering wells drawing grout towards the well through manipulation of the local gradient by controlling injection pressure and local well pump rates. The process would continue until all injection wells are grouted, and the confined aquifer is fully grouted to stop surface flow expression. This effort will require high-capacity dewatering to temporarily reduce local head pressure to facilitate grout installation as well as cased well construction due to the weak confining layer. However, this method offers several advantages compared to the other grouting efforts by minimizing the number of new disruptions in the confining layer and allowing the grouting contractor, in coordination with Barr Engineering, to address conditions as the grouting process continues. The contractor will be able to guide grout throughout the aquifer using the different injection points and manipulate the water flow through the system through pressure adjustments via dewatering. This will allow the grout to be pulled throughout the system, up and into the sheet pile penetrations, and eventually up through the wells, where it can be capped. To further increase the likelihood of success, Minnesota Department of Health (MDH)-approved chemical additives could be added to the grout, or a non-cementitious, chemical grout could be used in lieu of the cementitious grout. Chemical grouts are typically comprised of polyurethanes, epoxies, and acrylamides and are used to address the specific characteristics of a site. Chemical grouts offer some benefits over cement grout. They would dramatically improve the water handling requirements that are implicit in all cement grouting methods. Chemical additives and chemical grouts allow the grout to be pushed further and become effective faster than cement grouts and have a better chance of filling aquifer voids on the initial pass. The chemicals used would become stabilized and inert upon application. Chemical grouting is used in similar settings in other states as well as on other projects in Minnesota. For these reasons, Enbridge proposes to move forward with Pressure/Permeation Grouting and would recommend the use of MDH-approved chemical additives or an MDH-approved chemical grout. Conclusions To summarize, Enbridge considered seven potential options to address the groundwater flow at MP 1102.
The No Action Alternative would involve no active mitigation and would allow the conditions to persist and worsen; therefore, it is not appropriate.
The three non-grout methods, Ground Freezing, Construction of a Sheet Pile Wall System, and Reconstruction of the Confining Layer Cap, would not be successful in stopping groundwater flows and may create additional negative effects to the extent that they should not be considered further.
Page 6 of 6
Of the three grouting methods, Pressure/Permeation Grouting has the highest likelihood of success when compared to TAM Grouting and Jet Grouting. The overall success with this method can be increased with the use of MDH-approved chemical additives or an MDH-approved chemical grout; additional agency review and approval of the proposed chemicals would be required.

Appendix C
Caisson Installation Request Memorandum
Date: January 24, 2022
To: Minnesota Pollution Control Agency, Minnesota Department of Natural Resources, Minnesota Department of Health, Fond du Lac Band of Lake Superior Chippewa
From: Enbridge Line 3 Replacement Team
Re: MP1102.5 Caisson Installation Request – Revision 3
This request outlines the work proposed to install the remaining 23 caissons at Milepost 1102.5 for the Line 3 Replacement Project (L3R or Project) to be used in the remediation of the uncontrolled flow at that site. As outlined, 19 of the caissons will be used for the installation of dewatering/grout injection wells and 4 caissons will be used for the installation of additional dewatering wells.
The 4 caissons for the test borings, completed as part of the Groundwater Investigation Plan (GIP) were installed between December 19-21, 2021. Those test borings and wells were completed between January 5-8, 2022. The location and construction of the 4 wells installed with the test borings is described in the revised GIP that was submitted to the agencies on December 22, 2021. Two of the additional wells will be used for dewatering wells during implementation of the Corrective Action Plan (CAP).
This request describes:
• an assessment of the artesian conditions
• the process used and observations during the installation of the initial 4 caissons for the test borings
• results from the completed aquifer test
• the initial steps for installation of the remaining 23 caissons for the dewatering and dewatering/grout injection wells
• the current process for groundwater management
• discussion on schedule and the need to move forward with installation of the remaining 23 caissons
Assessment of Artesian Conditions In the immediate vicinity of the backfilled pipeline excavation, the subsurface conditions are estimated to include the following:
• Approximate depth to top of confined aquifer: 30 to 39 feet
• General soil type above the confined layer: variable glacial deposits – sand, sandy clay, and silty sand with cobbles and boulders.
• Approximate depth below ground surface to the bottom of the confined aquifer: 34 to 77 feet
• General soil type of the confining layer: sandy silt, silty sand, and silt
• General soil type of the confined aquifer: poorly graded gravel with sand and cobbles
• Ground surface elevation: 1321 to 1338.9 feet
• Elevation of shallow groundwater: not encountered prior to mud rotary drilling methods
• Typical hydraulic head elevation of pressurized groundwater (i.e., the confined aquifer): to 1338.5 1343.5 feet
• Maximum encountered head above ground surface of the confined aquifer: 18 feet (estimated)
• Estimated depth of the excavation during construction: 8 feet
• Estimated depth of temporary construction sheet piling (now removed): 22 to 27 feet
Installation of Caissons for Test Borings The “Revised Drilling Approach” section of the December 22, 2021 (Revision 4) GIP describes the process that was utilized to drill the 4 test borings, which includes:
1. Estimation of the confining layer depth based on previous borings.
2. Installation of 6.5-foot diameter sand-cement grout column (referred to as a caisson) to a depth of approximately 20-25 feet to improve the top of the confining layer and to provide a seal for the subsequent casings. The caissons are installed above the confining layer. An 18-inch steel casing is set into the caisson prior to tremie grout placement. The cement grout is allowed to cure for 24 hours.
3. Drill 16-inch diameter hole within the previously placed 18-inch casing and extend 12-inch casing to a minimum of 5 feet beyond the bottom of the 18-inch casing. This 12-inch casing is pressure grouted in place and allowed to cure for 24 hours.
4. Conduct rotosonic drilling inside the 12-inch casing to penetrate into and through the confining layer by advancing telescoping 4, 6, and 8 inch sonic liners with a modified bit.
5. A 6-inch diameter slotted metal well screen is installed by a licensed well drill through the aquifer and solid metal riser to the ground surface. A sand pack is placed around the screened section of the well and cement is tremie grouted around the 6-inch riser above the well screen. The cement grout is allowed to cure for 24 hours.
6. A 4-inch submersible pump and 4-inch drop pipe is installed along with a pressure gauge and vibrating wire piezometers.
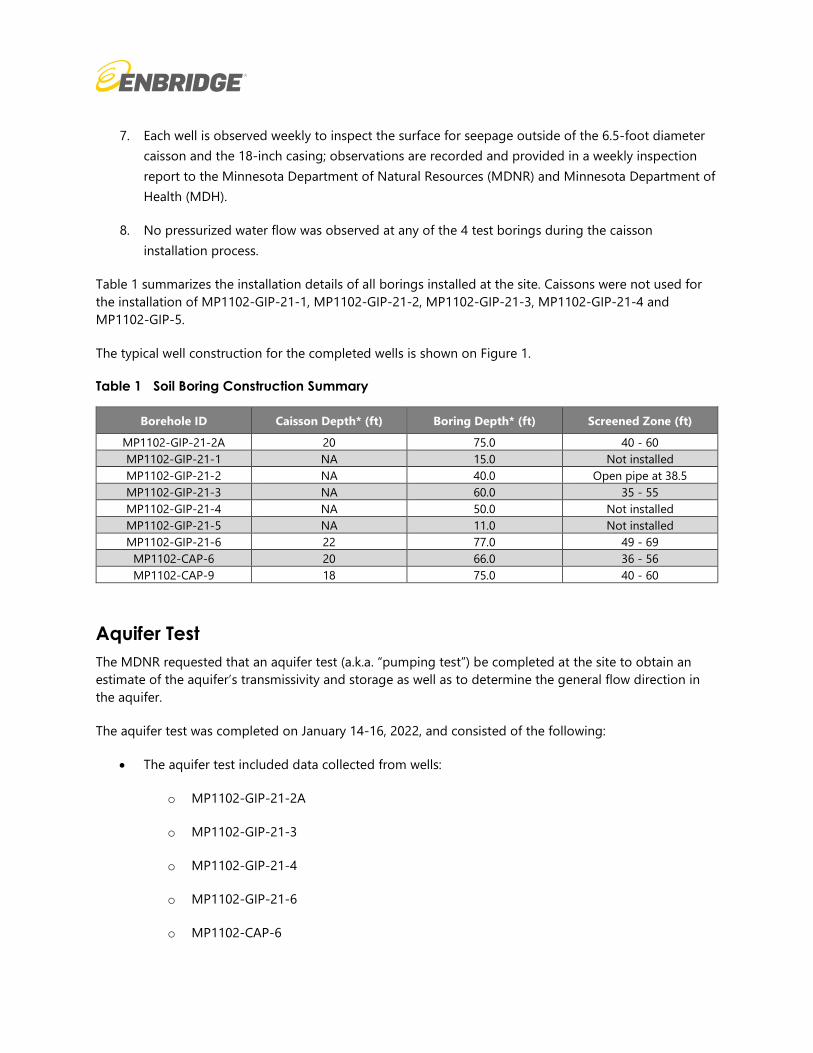
7. Each well is observed weekly to inspect the surface for seepage outside of the 6.5-foot diameter caisson and the 18-inch casing; observations are recorded and provided in a weekly inspection report to the Minnesota Department of Natural Resources (MDNR) and Minnesota Department of Health (MDH).
8. No pressurized water flow was observed at any of the 4 test borings during the caisson installation process.
Table 1 summarizes the installation details of all borings installed at the site. Caissons were not used for the installation of MP1102-GIP-21-1, MP1102-GIP-21-2, MP1102-GIP-21-3, MP1102-GIP-21-4 and MP1102-GIP-5.
The typical well construction for the completed wells is shown on Figure 1.
Table 1 Soil Boring Construction Summary
Borehole ID Caisson Depth* (ft) Boring Depth* (ft) Screened Zone (ft)
MP1102-GIP-21-2A 20 75.0 40 - 60 MP1102-GIP-21-1 NA 15.0 Not installed MP1102-GIP-21-2 NA 40.0 Open pipe at 38.5 MP1102-GIP-21-3 NA 60.0 35 - 55 MP1102-GIP-21-4 NA 50.0 Not installed MP1102-GIP-21-5 NA 11.0 Not installed MP1102-GIP-21-6 22 77.0 49 - 69
MP1102-CAP-6 20 66.0 36 - 56 MP1102-CAP-9 18 75.0 40 - 60
Aquifer Test The MDNR requested that an aquifer test (a.k.a. “pumping test”) be completed at the site to obtain an estimate of the aquifer’s transmissivity and storage as well as to determine the general flow direction in the aquifer.
The aquifer test was completed on January 14-16, 2022, and consisted of the following:
• The aquifer test included data collected from wells:
o MP1102-GIP-21-2A
o MP1102-GIP-21-3
o MP1102-GIP-21-4
o MP1102-GIP-21-6
o MP1102-CAP-6
o MP1102-CAP-9
• MP1102-GIP-21-2A and MP1102-CAP-6 were used as pumping wells during the test.
• Water expressed to the surface from MP1102-GIP-21-2 and the existing seeps was channeled to the weir box on site for flow measurement. Weir box and dewater structure locations are shown on Figure 2.
• To reduce the risk of complete seal failure on MP1102-GIP-21-2 during the aquifer test, bentonite chips were packed around the MP1102-GIP-21-2 casing at the ground surface prior to the test. The efforts were successful and no leakage was observed during the completion of the test.
• A period of approximately 36 hours of constant-rate pumping from MP1102-GIP-21-2A and MP1102-CAP-6 proceeded the aquifer test. Vibrating wire piezometers (VWP) were installed in the wells used as part of the test. VWPs and flows were monitored and recorded at an interval of 15 minutes or less. Pumping rates from MP1102-GIP-21-2A and MP1102-CAP-6 were recorded by the flowmeter installed on the pump discharge of each well. The pumping rates at MP1102-GIP-21-2A and MP1102-CAP-6 were 410 gpm and 400 gpm, respectively. Flow from MP1102-GIP-21-2A and MP1102-CAP-6 was directed to the on-site dewatering structures.
• The test consisted of simultaneously suspending pumping from MP1102-GIP-21-2A and MP1102-CAP-6, while allowing flow to continue through MP1102-GIP-21-2 as the potentiometric head recovered for 8 hours. During that period, VWPs measured pressures at intervals of once every 30 seconds and the data logger in MP1102-GIP-21-2 measurement pressures at once every 10 seconds for the first hour and once every 30 seconds for the remainder of the test.
• Following the 8 hours of recovery, the data collected were reviewed and it was determined that pre-pumping piezometric conditions had been met. Pumping from MP1102-GIP-21-2A and MP1102-CAP-6 then recommenced at a constant rate for a period of 16 hours. During that period, VWPs measured pressures at intervals of once every 30 seconds.
• A review of the pump test data collected during the test indicated that sufficient data were collected to develop the AQTESOLV and MODFLOW models. The pumps in MP-1102-GIP-21-2A and MP-1102-GIP-6 were not shut off again as any additional data collected would be redundant and due to concerns over the competency of the casing seal in MP1102-GIP-21-2 with rising potentiometric head pressures.
Barr Engineering completed the analysis of the aquifer test to calculate a range of values for transmissivity, storage and general groundwater flow. The Hantush (wedge-shaped aquifer) solution was used for most analyses as this solution was developed to account for the effect of variable aquifer thickness on groundwater flow. This is an appropriate solution for the site given the different aquifer thicknesses observed in the site borings. The Hantush-Jacob solution for leaky confining aquifers was also tested and resulted in a similar transmissivity estimate.
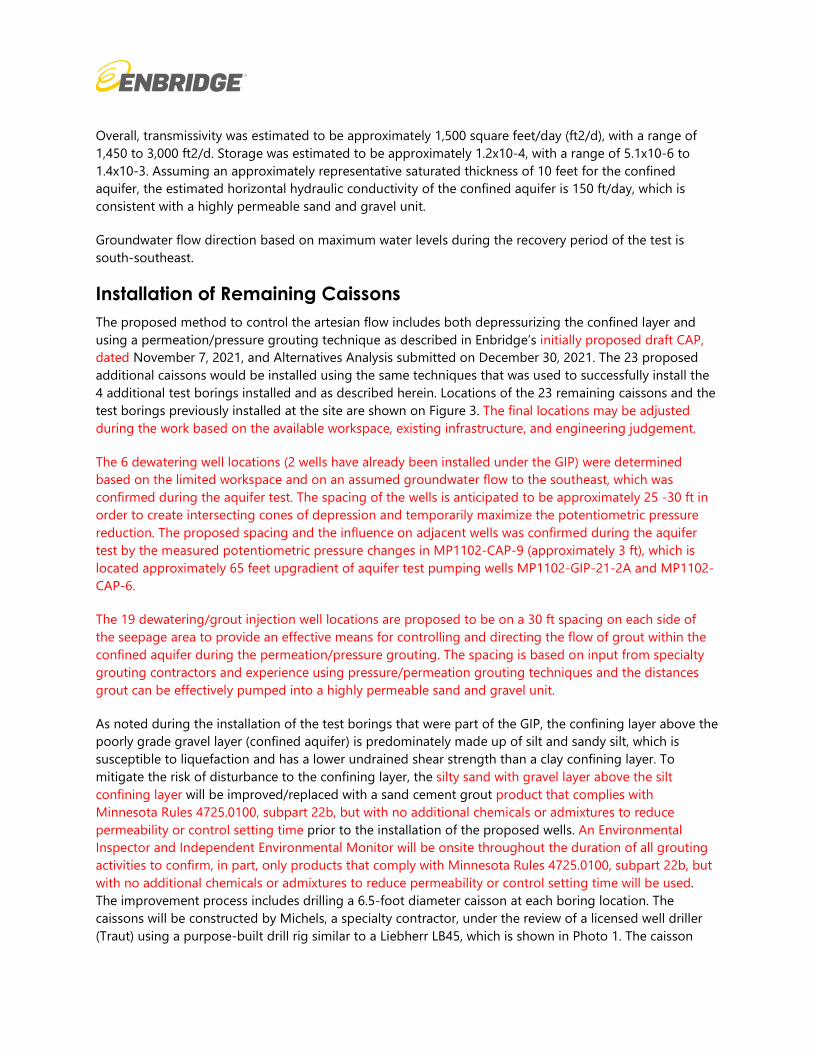
Overall, transmissivity was estimated to be approximately 1,500 square feet/day (ft2/d), with a range of 1,450 to 3,000 ft2/d. Storage was estimated to be approximately 1.2x10⁻⁴, with a range of 5.1x10⁻⁶ to 1.4x10⁻³. Assuming an approximately representative saturated thickness of 10 feet for the confined aquifer, the estimated horizontal hydraulic conductivity of the confined aquifer is 150 ft/day, which is consistent with a highly permeable sand and gravel unit.
Groundwater flow direction based on maximum water levels during the recovery period of the test is south-southeast.
Installation of Remaining Caissons The proposed method to control the artesian flow includes both depressurizing the confined layer and using a permeation/pressure grouting technique as described in Enbridge’s initially proposed draft CAP, dated November 7, 2021, and Alternatives Analysis submitted on December 30, 2021. The 23 proposed additional caissons would be installed using the same techniques that was used to successfully install the 4 additional test borings installed and as described herein. Locations of the 23 remaining caissons and the test borings previously installed at the site are shown on Figure 3. The final locations may be adjusted during the work based on the available workspace, existing infrastructure, and engineering judgement.
The 6 dewatering well locations (2 wells have already been installed under the GIP) were determined based on the limited workspace and on an assumed groundwater flow to the southeast, which was confirmed during the aquifer test. The spacing of the wells is anticipated to be approximately 25 -30 ft in order to create intersecting cones of depression and temporarily maximize the potentiometric pressure reduction. The proposed spacing and the influence on adjacent wells was confirmed during the aquifer test by the measured potentiometric pressure changes in MP1102-CAP-9 (approximately 3 ft), which is located approximately 65 feet upgradient of aquifer test pumping wells MP1102-GIP-21-2A and MP1102-CAP-6.
The 19 dewatering/grout injection well locations are proposed to be on a 30 ft spacing on each side of the seepage area to provide an effective means for controlling and directing the flow of grout within the confined aquifer during the permeation/pressure grouting. The spacing is based on input from specialty grouting contractors and experience using pressure/permeation grouting techniques and the distances grout can be effectively pumped into a highly permeable sand and gravel unit.
As noted during the installation of the test borings that were part of the GIP, the confining layer above the poorly grade gravel layer (confined aquifer) is predominately made up of silt and sandy silt, which is susceptible to liquefaction and has a lower undrained shear strength than a clay confining layer. To mitigate the risk of disturbance to the confining layer, the silty sand with gravel layer above the silt confining layer will be improved/replaced with a sand cement grout product that complies with Minnesota Rules 4725.0100, subpart 22b, but with no additional chemicals or admixtures to reduce permeability or control setting time prior to the installation of the proposed wells. An Environmental Inspector and Independent Environmental Monitor will be onsite throughout the duration of all grouting activities to confirm, in part, only products that comply with Minnesota Rules 4725.0100, subpart 22b, but with no additional chemicals or admixtures to reduce permeability or control setting time will be used. The improvement process includes drilling a 6.5-foot diameter caisson at each boring location. The caissons will be constructed by Michels, a specialty contractor, under the review of a licensed well driller (Traut) using a purpose-built drill rig similar to a Liebherr LB45, which is shown in Photo 1. The caisson
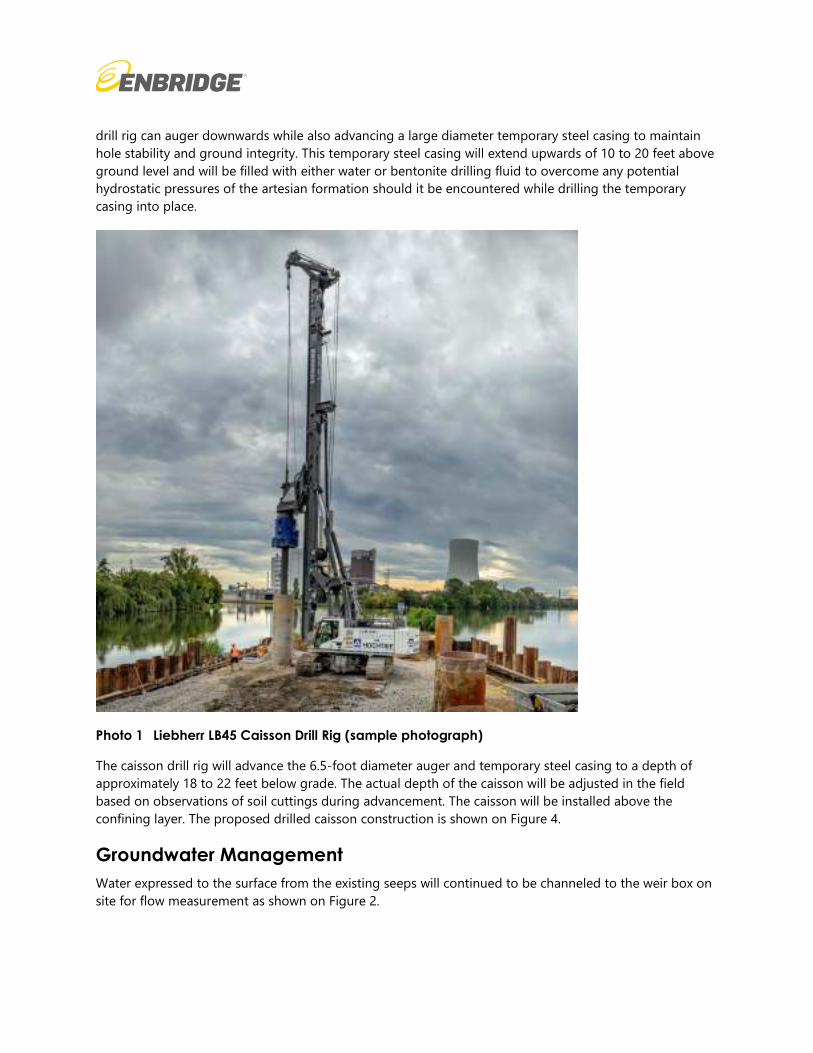
drill rig can auger downwards while also advancing a large diameter temporary steel casing to maintain hole stability and ground integrity. This temporary steel casing will extend upwards of 10 to 20 feet above ground level and will be filled with either water or bentonite drilling fluid to overcome any potential hydrostatic pressures of the artesian formation should it be encountered while drilling the temporary casing into place.
Photo 1 Liebherr LB45 Caisson Drill Rig (sample photograph)
The caisson drill rig will advance the 6.5-foot diameter auger and temporary steel casing to a depth of approximately 18 to 22 feet below grade. The actual depth of the caisson will be adjusted in the field based on observations of soil cuttings during advancement. The caisson will be installed above the confining layer. The proposed drilled caisson construction is shown on Figure 4.
Groundwater Management Water expressed to the surface from the existing seeps will continued to be channeled to the weir box on site for flow measurement as shown on Figure 2.

Schedule Enbridge requests the agencies’ authorization to proceed with the installation of the remaining 23 caissons to maintain forward progress at the site and maintain the execution schedule. This schedule was developed in consideration of concerns identified by the Fond du Lac Band of Lake Superior Chippewa (FDL), and to minimize logistical issues presented by Minnesota Department of Transportation (MDOT) spring load restrictions and road maintenance issues during spring melt, in particular along access road (AR) 588 which is the main road that will be utilized to access the site and discharge locations.
Installation of the remaining 23 caissons is estimated to require approximately 3 weeks, weather dependent. Upon the agencies’ approval, Enbridge is prepared to start this work immediately. During this time, Enbridge will continue to work with various agencies to finalize remaining items necessary to address agency comments received on the November 7, 2021 draft CAP and to incorporate changes made to the design prior to submitting an updated CAP to the required agencies for their review and approval.
Figures Figure 1 MP1102.5 Typical Well Construction Detail Figure 2 Weir Box and Discharge Locations During Pump Test Figure 3 MP1102.5 Proposed Caisson Locations Figure 4 MP1102.5 Typical Drilled Caisson Detail

Figures
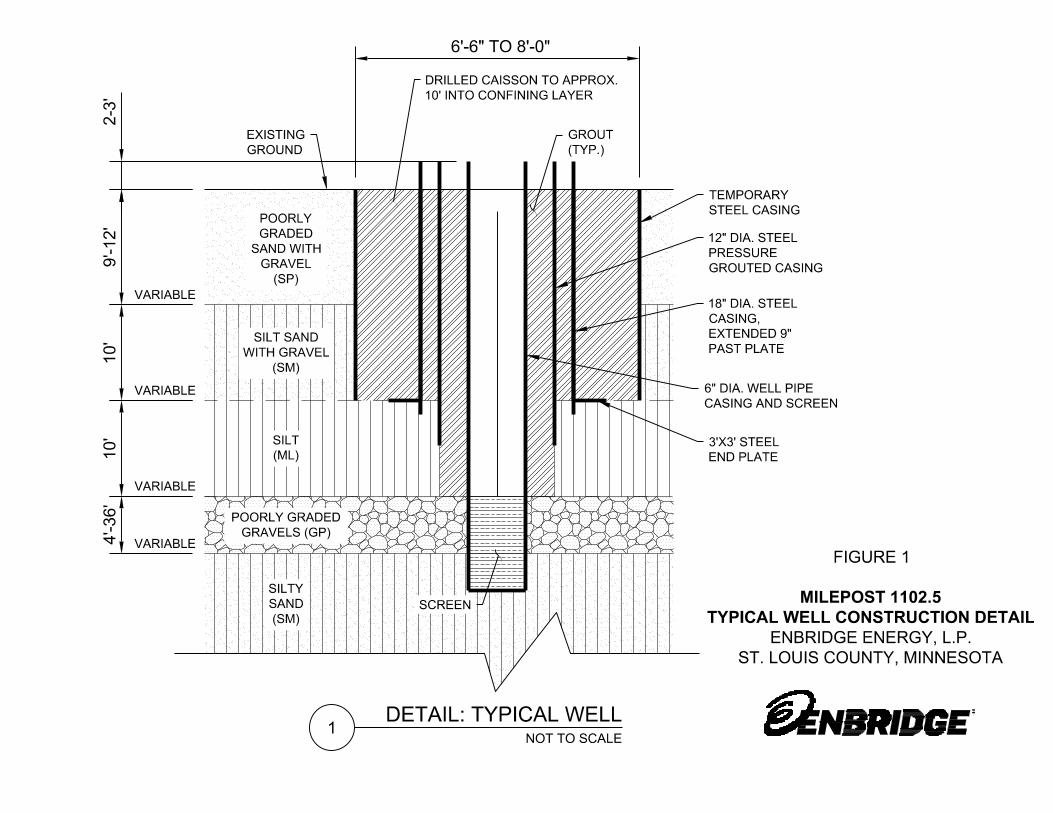
9'-12'
10'
10'
4'-36'
POORLY
GRADED
SAND WITH
GRAVEL
(SP)
SILT SAND
WITH GRAVEL
(SM)
SILT
(ML)
POORLY GRADED
GRAVELS (GP)
1
NOT TO SCALE
DETAIL: TYPICAL WELL
VARIABLE
VARIABLE
SILTY
SAND
(SM)
12" DIA. STEEL
PRESSURE
GROUTED CASING
6" DIA. WELL PIPE
CASING AND SCREEN
SCREEN
EXISTING
GROUND
6'-6" TO 8'-0"
DRILLED CAISSON TO APPROX.
10' INTO CONFINING LAYER
GROUT
(TYP.)
VARIABLE
VARIABLE
18" DIA. STEEL
CASING,
EXTENDED 9"
PAST PLATE
TEMPORARY
STEEL CASING
2-3'
3'X3' STEEL
END PLATE
FIGURE 1
MILEPOST 1102.5
TYPICAL WELL CONSTRUCTION DETAIL
ENBRIDGE ENERGY, L.P.
ST. LOUIS COUNTY, MINNESOTA
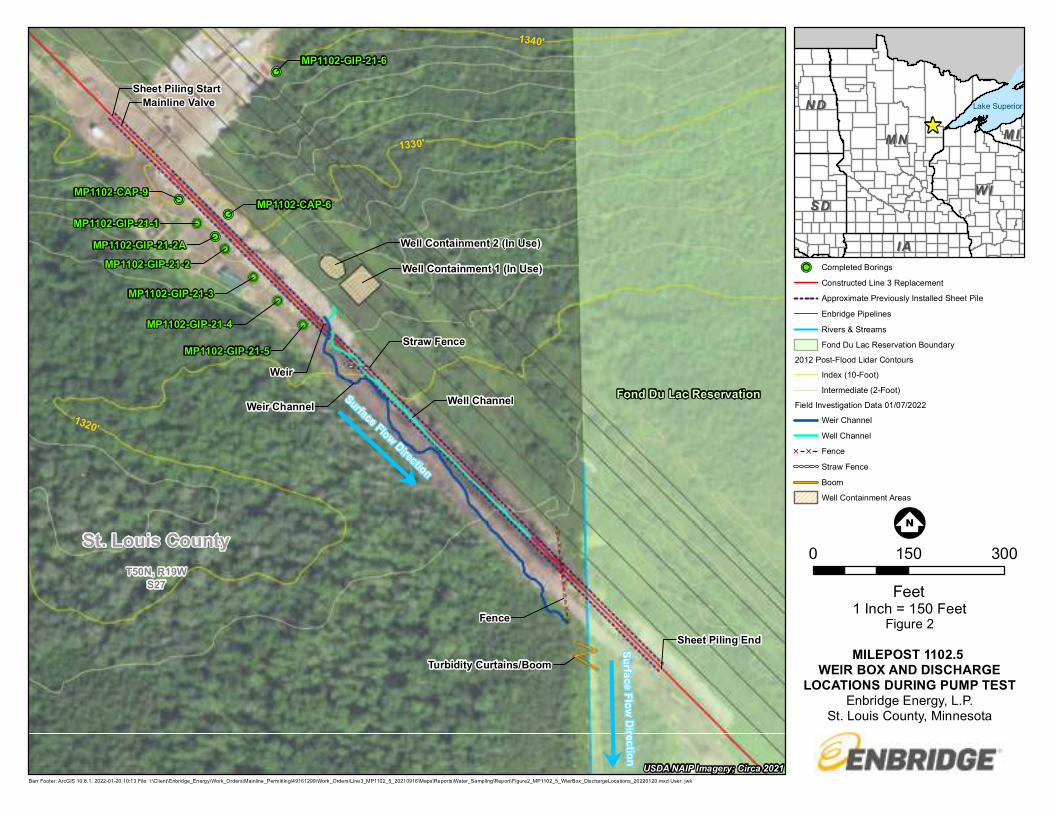
!P
!P
!P!P
Fond Du Lac Reservation
Sheet Piling End
Sheet Piling StartMainline Valve
Weir
Well Containment 1 (In Use)
Well Containment 2 (In Use)
Straw Fence
Weir Channel Well Channel
Fence
Turbidity Curtains/Boom
St. Louis CountyT50N, R19W
S27
MP1102-GIP-21-1
MP1102-GIP-21-2
MP1102-GIP-21-4
MP1102-GIP-21-5
MP1102-GIP-21-3
MP1102-GIP-21-6
MP1102-GIP-21-2A
MP1102-CAP-6MP1102-CAP-9
1340'
1330'
1320'
Barr Footer: ArcGIS 10.8.1, 2022-01-20 10:13 File: I:\Client\Enbridge_Energy\Work_Orders\Mainline_Permitting\49161299\Work_Orders\Line3_MP1102_5_20210916\Maps\Reports\Water_Sampling\Report\Figure2_MP1102_5_WierBox_DischargeLocations_20220120.mxd User: jwk
1 Inch = 150 Feet
!P Completed Borings
Constructed Line 3 Replacement
Approximate Previously Installed Sheet Pile
Enbridge Pipelines
Rivers & Streams
Fond Du Lac Reservation Boundary
2012 Post-Flood Lidar Contours
Index (10-Foot)
Intermediate (2-Foot)
Field Investigation Data 01/07/2022
Weir Channel
Well Channel
[ [ Fence
Straw Fence
Boom
Well Containment Areas
0 150 300
Feet
Figure 2
MILEPOST 1102.5 WEIR BOX AND DISCHARGE
LOCATIONS DURING PUMP TESTEnbridge Energy, L.P.
St. Louis County, Minnesota
!;N
^Lake Superior
IAIA
MIMIMNMN
NDND
SDSDWIWI
USDA NAIP Imagery; Circa 2021
7
7
Surface Flow Direction
Surface Flow Direction
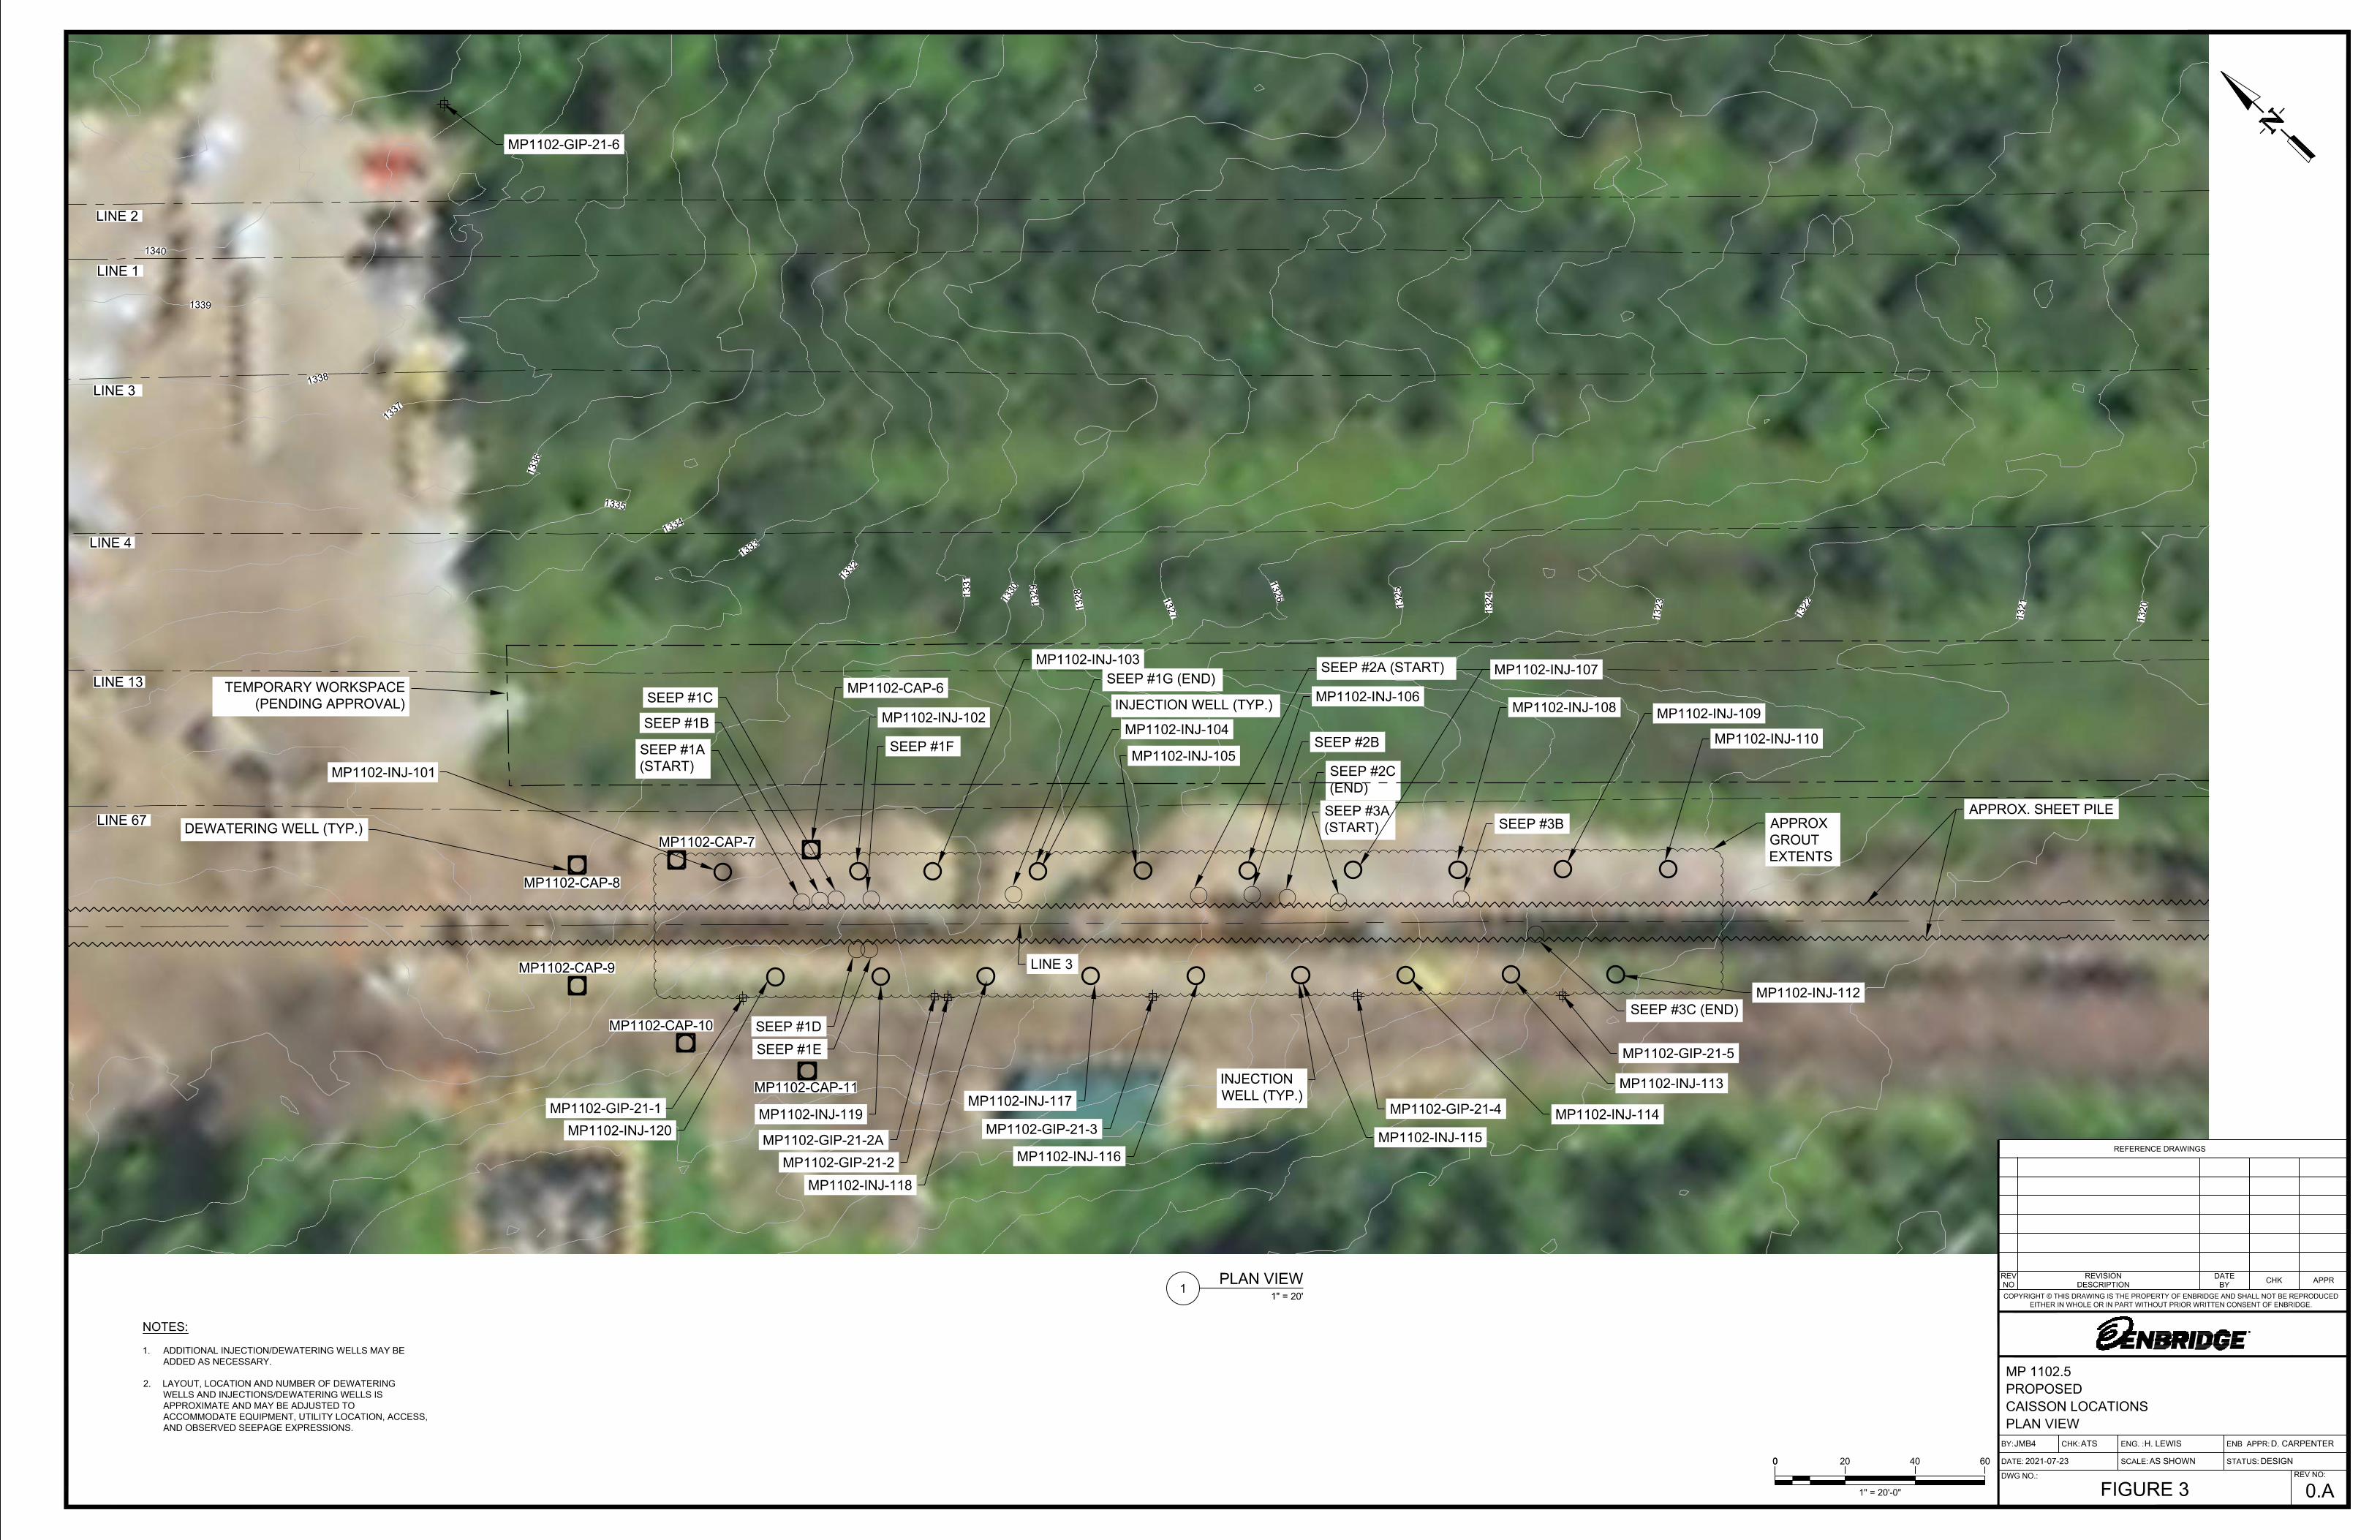
MP1102-GIP-21-1
MP1102-GIP-21-2
MP1102-GIP-21-3
MP1102-GIP-21-4
MP1102-GIP-21-5
SEEP #1A
(START)
SEEP #1B
SEEP #1C
SEEP #1D
SEEP #1E
SEEP #1F
SEEP #1G (END)
SEEP #2A (START)
SEEP #2B
SEEP #2C
(END)
SEEP #3A
(START)
SEEP #3B
SEEP #3C (END)
APPROX. SHEET PILE
LINE 3
DEWATERING WELL (TYP.)
INJECTION
WELL (TYP.)
INJECTION WELL (TYP.)
APPROX
GROUT
EXTENTS
TEMPORARY WORKSPACE
(PENDING APPROVAL)
MP1102-GIP-21-2A
MP1102-CAP-11
MP1102-CAP-10
MP1102-CAP-9
MP1102-CAP-8
MP1102-CAP-7
MP1102-INJ-102
MP1102-INJ-101
MP1102-INJ-104
MP1102-INJ-103
MP1102-INJ-105
MP1102-INJ-106
MP1102-INJ-107
MP1102-INJ-108
MP1102-INJ-109
MP1102-INJ-110
MP1102-INJ-112
MP1102-INJ-113
MP1102-INJ-114
MP1102-INJ-115
MP1102-INJ-116
MP1102-INJ-117
MP1102-INJ-118
MP1102-INJ-119
MP1102-INJ-120
LINE 67
LINE 13
LINE 4
LINE 3
LINE 1
1
3
2
0
1325
1
3
3
0
1
3
3
5
1340
1
3
2
1
1
3
2
2
1
3
2
3
1324
1
3
2
61
3
2
7
1328
1329
1331
1
3
3
2
1
3
3
3
1
3
3
4
1
3
3
6
1
3
3
7
1
3
3
8
1339
MP1102-CAP-6
MP1102-GIP-21-6
LINE 2
0 400 20 60
1" = 20'-0"
DESCRIPTIONNO BY
REVISIONREV
CHK APPR
DATE
REFERENCE DRAWINGS
DWG NO.:
REV NO:
ENG. :
SCALE:
CHK:
DATE:
BY: ENB APPR:
STATUS:
COPYRIGHT © THIS DRAWING IS THE PROPERTY OF ENBRIDGE AND SHALL NOT BE REPRODUCED
EITHER IN WHOLE OR IN PART WITHOUT PRIOR WRITTEN CONSENT OF ENBRIDGE.
123457.18"00
MP 1102.5
PROPOSED
CAISSON LOCATIONS
PLAN VIEW
FIGURE 30.A
JMB4 ATS H. LEWIS D. CARPENTER
2021-07-23 AS SHOWN DESIGN
1
1" = 20'
PLAN VIEW
NOTES:
1. ADDITIONAL INJECTION/DEWATERING WELLS MAY BE
ADDED AS NECESSARY.
2. LAYOUT, LOCATION AND NUMBER OF DEWATERING
WELLS AND INJECTIONS/DEWATERING WELLS IS
APPROXIMATE AND MAY BE ADJUSTED TO
ACCOMMODATE EQUIPMENT, UTILITY LOCATION, ACCESS,
AND OBSERVED SEEPAGE EXPRESSIONS.
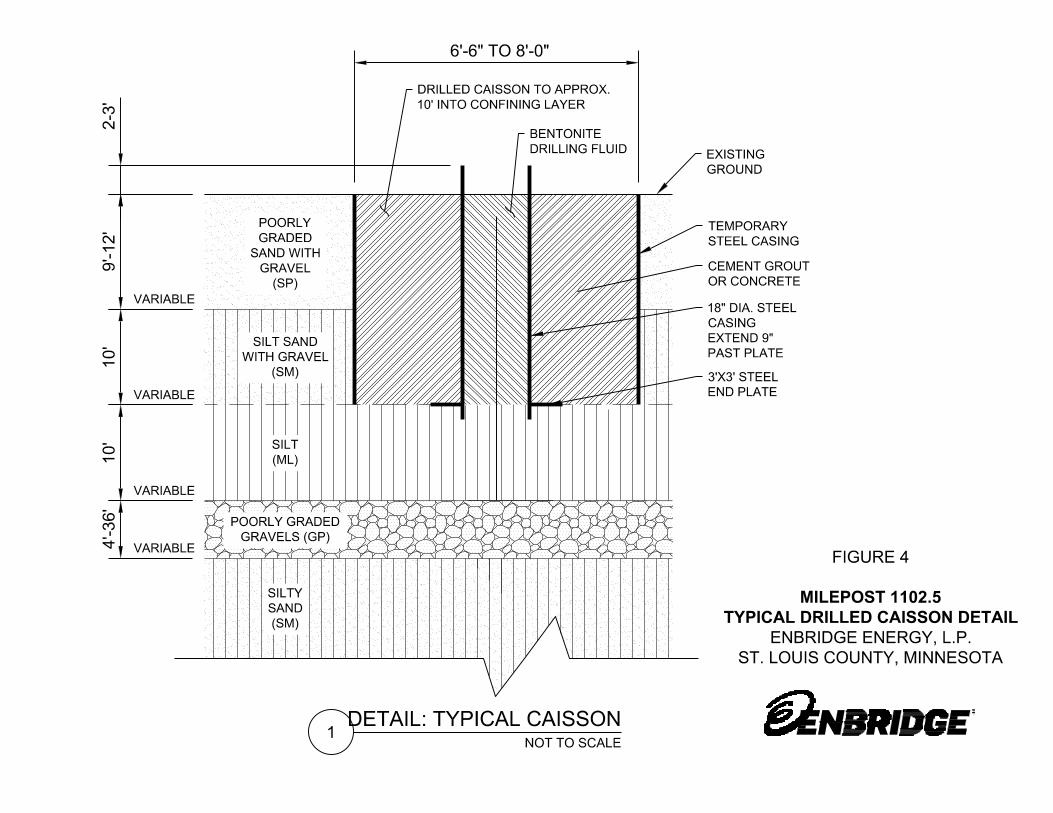
9'-1
2'
10
'1
0'
4'-3
6'
POORLY
GRADED
SAND WITH
GRAVEL
(SP)
SILT SAND
WITH GRAVEL
(SM)
SILT
(ML)
POORLY GRADED
GRAVELS (GP)
1
NOT TO SCALE
DETAIL: TYPICAL CAISSON
VARIABLE
VARIABLE
SILTY
SAND
(SM)
EXISTING
GROUND
6'-6" TO 8'-0"
DRILLED CAISSON TO APPROX.
10' INTO CONFINING LAYER
BENTONITE
DRILLING FLUID
VARIABLE
VARIABLE
18" DIA. STEEL
CASING
EXTEND 9"
PAST PLATE
TEMPORARY
STEEL CASING
2-3
'
3'X3' STEEL
END PLATE
CEMENT GROUT
OR CONCRETE
FIGURE 4
MILEPOST 1102.5
TYPICAL DRILLED CAISSON DETAIL
ENBRIDGE ENERGY, L.P.
ST. LOUIS COUNTY, MINNESOTA
Appendix D
Sampling and Analysis Plan to Assess Water Quality – Line 3 Replacement Project Seep at Milepost 1102.5
325 South Lake Avenue, Suite 700 Duluth, MN 55802 218.529.8200 www.barr.com
325 South Lake Avenue, Suite 700 Duluth, MN 55802 218.529.8200 www.barr.com
Sampling and Analysis Plan to Assess Water Quality – Line 3 Replacement Project Seep at Milepost 1102.5
Prepared for Enbridge Energy
December 10, 2021
\\barr.com\projects\Duluth\49 WI\16\49161299 Line 3 Replacement Geotech Sur\WorkFiles\01_Uncontrolled Flow Assistance\08_Monitoring and Submittals\MP1102\Sampling and Analysis Plan\MP 1102 WQ Monitoring Plan 121021.docx i
Sampling and Analysis Plan to Assess Water Quality – Line 3 Replacement Project Seep at Milepost 1102.5
December 10, 2021
Contents
1 Introduction ........................................................................................................................................................................... 1
2 Water Sample Collection for Water Quality Evaluation ........................................................................................ 2
2.1 Access Considerations .................................................................................................................................................. 2
2.2 Proposed Sampling Locations ................................................................................................................................... 2
2.3 Quality Assurance/Quality Control (QA/QC) Procedures ............................................................................... 4
3 Data Review and Reporting ............................................................................................................................................. 7
3.1 Assess Water Quality ..................................................................................................................................................... 7
3.2 Final Data Reporting ...................................................................................................................................................... 7
4 References .............................................................................................................................................................................. 8
ii
List of Tables
Table 3-1 Proposed Sampling Locations ....................................................................................................................... 2 Table 3-2 Parameter List for Water Samples ................................................................................................................ 3 Table 3-3 Data Quality Indicators (DQIs) ....................................................................................................................... 4
List of Figures
Figure 1 Milepost 1102.5 Proposed Water Sample Locations
List of Appendices
Appendix A Barr Field Data Collection Standard Operating Procedures Appendix B Barr QA/QC Water Quality Data Standard Operating Procedures
iii
Abbreviations
CAP Corrective Action Plan DO Dissolved Oxygen DQIs Data Quality Indicators DQOs Data Quality Objectives MP Milepost QA Quality Assurance QC Quality Control SOP Standard Operating Procedure USEPA U.S. Environmental Protection Agency
1
1 Introduction This document is a Sampling and Analysis Plan (Work Plan) for characterizing water quality of surface water and groundwater located in the vicinity of Milepost (MP) 1102.5 near Cloquet, Minnesota. The goal of this Work Plan is to collect and analyze water samples in order to establish baseline conditions and monitor water quality throughout implementation of the site-specific Corrective Action Plan (CAP). This document summarizes site-specific data collection methods.
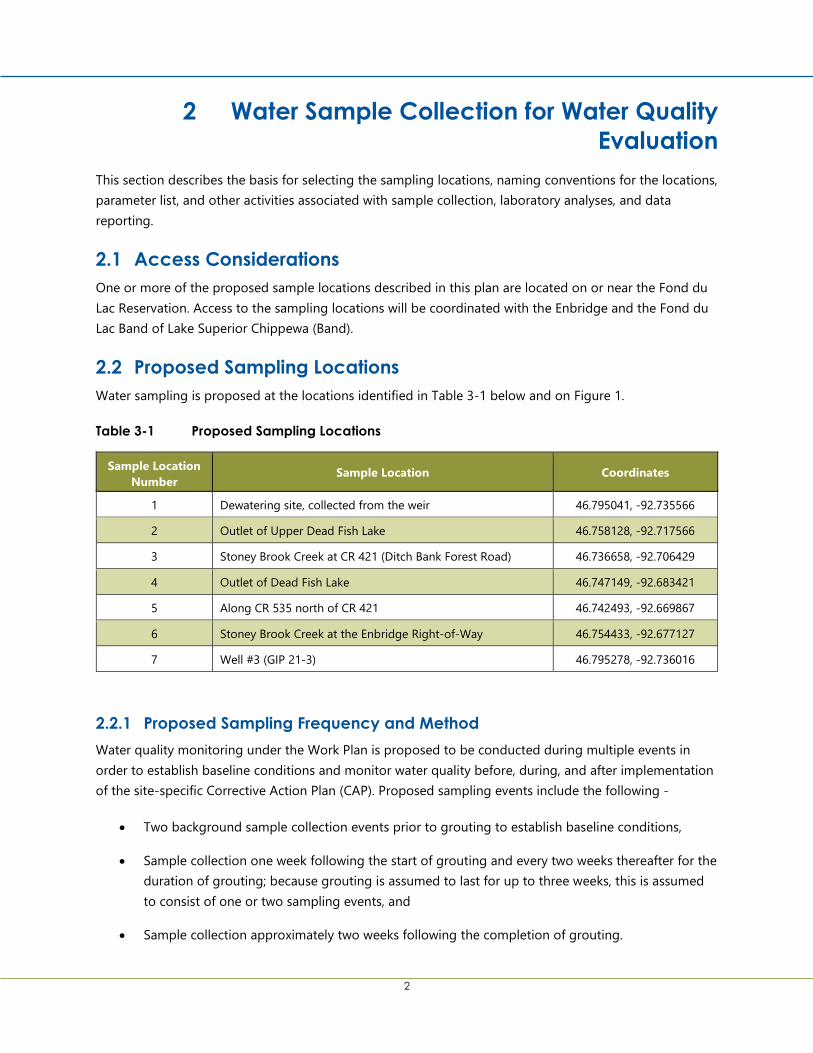
2
2 Water Sample Collection for Water Quality Evaluation
This section describes the basis for selecting the sampling locations, naming conventions for the locations, parameter list, and other activities associated with sample collection, laboratory analyses, and data reporting.
2.1 Access Considerations One or more of the proposed sample locations described in this plan are located on or near the Fond du Lac Reservation. Access to the sampling locations will be coordinated with the Enbridge and the Fond du Lac Band of Lake Superior Chippewa (Band).
2.2 Proposed Sampling Locations Water sampling is proposed at the locations identified in Table 3-1 below and on Figure 1.
Table 3-1 Proposed Sampling Locations
Sample Location Number
Sample Location Coordinates
1 Dewatering site, collected from the weir 46.795041, -92.735566
2 Outlet of Upper Dead Fish Lake 46.758128, -92.717566
3 Stoney Brook Creek at CR 421 (Ditch Bank Forest Road) 46.736658, -92.706429
4 Outlet of Dead Fish Lake 46.747149, -92.683421
5 Along CR 535 north of CR 421 46.742493, -92.669867
6 Stoney Brook Creek at the Enbridge Right-of-Way 46.754433, -92.677127
7 Well #3 (GIP 21-3) 46.795278, -92.736016
2.2.1 Proposed Sampling Frequency and Method Water quality monitoring under the Work Plan is proposed to be conducted during multiple events in order to establish baseline conditions and monitor water quality before, during, and after implementation of the site-specific Corrective Action Plan (CAP). Proposed sampling events include the following -
• Two background sample collection events prior to grouting to establish baseline conditions,
• Sample collection one week following the start of grouting and every two weeks thereafter for the duration of grouting; because grouting is assumed to last for up to three weeks, this is assumed to consist of one or two sampling events, and
• Sample collection approximately two weeks following the completion of grouting.
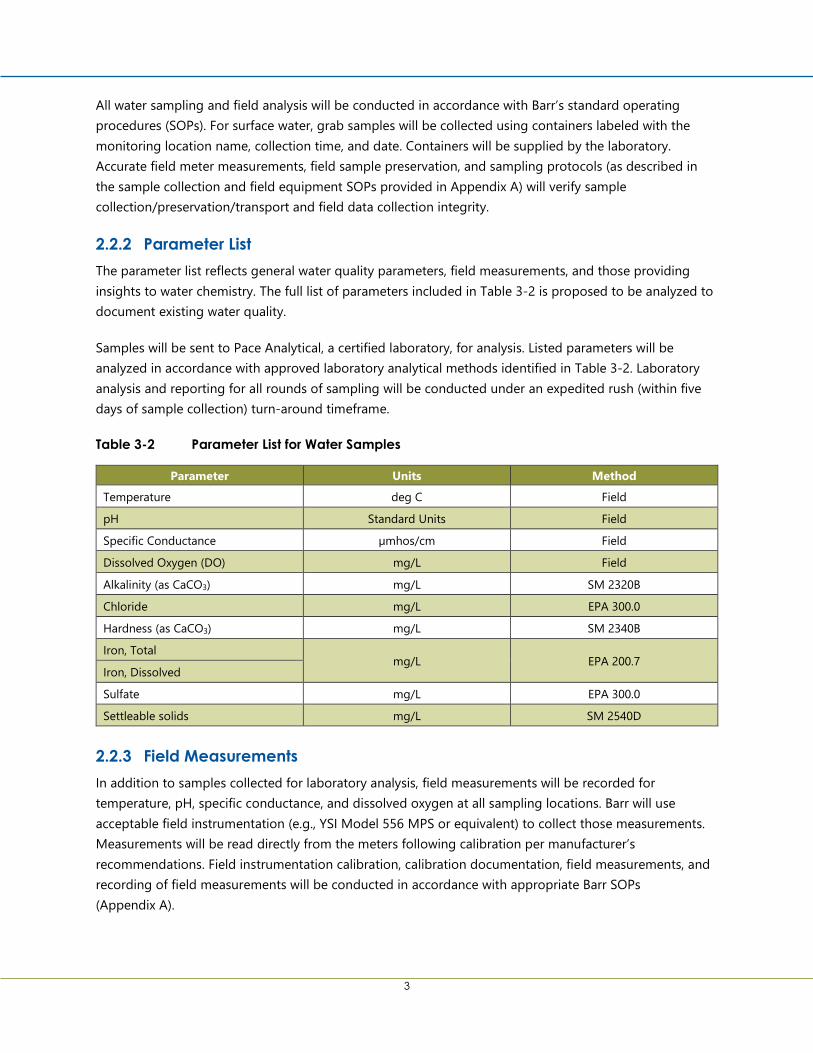
3
All water sampling and field analysis will be conducted in accordance with Barr’s standard operating procedures (SOPs). For surface water, grab samples will be collected using containers labeled with the monitoring location name, collection time, and date. Containers will be supplied by the laboratory. Accurate field meter measurements, field sample preservation, and sampling protocols (as described in the sample collection and field equipment SOPs provided in Appendix A) will verify sample collection/preservation/transport and field data collection integrity.
2.2.2 Parameter List The parameter list reflects general water quality parameters, field measurements, and those providing insights to water chemistry. The full list of parameters included in Table 3-2 is proposed to be analyzed to document existing water quality.
Samples will be sent to Pace Analytical, a certified laboratory, for analysis. Listed parameters will be analyzed in accordance with approved laboratory analytical methods identified in Table 3-2. Laboratory analysis and reporting for all rounds of sampling will be conducted under an expedited rush (within five days of sample collection) turn-around timeframe.
Table 3-2 Parameter List for Water Samples
Parameter Units Method
Temperature deg C Field
pH Standard Units Field
Specific Conductance µmhos/cm Field
Dissolved Oxygen (DO) mg/L Field
Alkalinity (as CaCO3) mg/L SM 2320B
Chloride mg/L EPA 300.0
Hardness (as CaCO3) mg/L SM 2340B
Iron, Total mg/L EPA 200.7
Iron, Dissolved
Sulfate mg/L EPA 300.0
Settleable solids mg/L SM 2540D
2.2.3 Field Measurements In addition to samples collected for laboratory analysis, field measurements will be recorded for temperature, pH, specific conductance, and dissolved oxygen at all sampling locations. Barr will use acceptable field instrumentation (e.g., YSI Model 556 MPS or equivalent) to collect those measurements. Measurements will be read directly from the meters following calibration per manufacturer’s recommendations. Field instrumentation calibration, calibration documentation, field measurements, and recording of field measurements will be conducted in accordance with appropriate Barr SOPs (Appendix A).
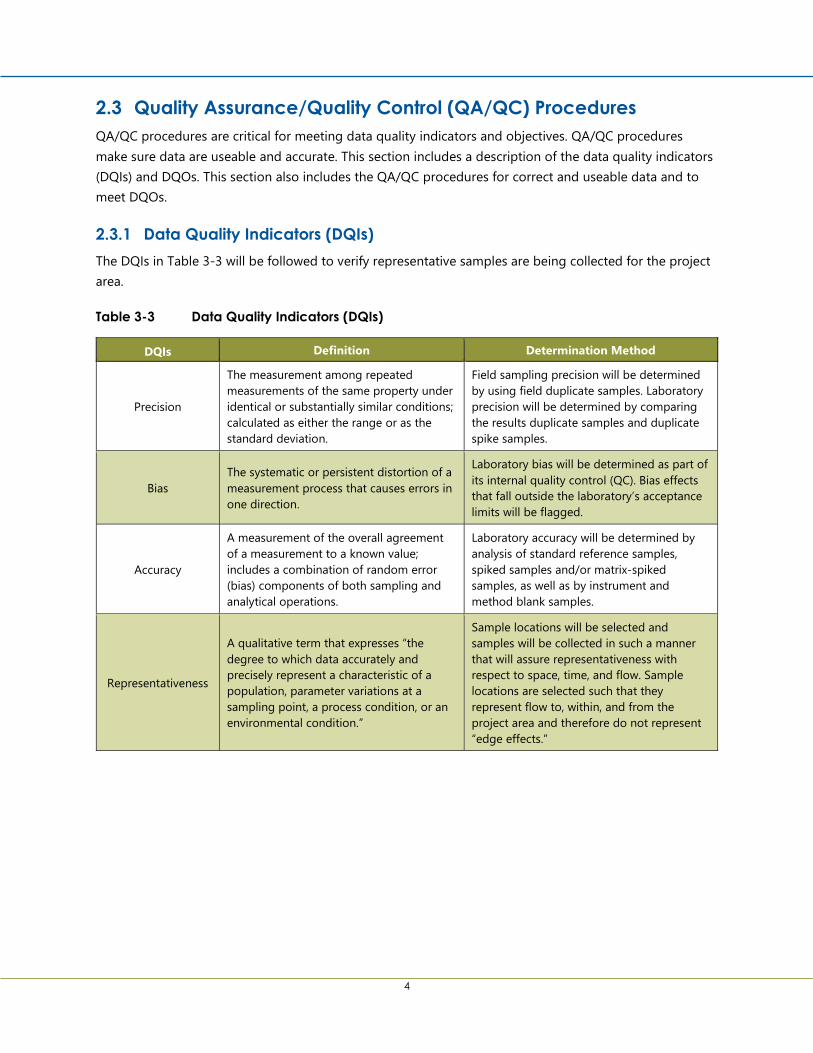
4
2.3 Quality Assurance/Quality Control (QA/QC) Procedures QA/QC procedures are critical for meeting data quality indicators and objectives. QA/QC procedures make sure data are useable and accurate. This section includes a description of the data quality indicators (DQIs) and DQOs. This section also includes the QA/QC procedures for correct and useable data and to meet DQOs.
2.3.1 Data Quality Indicators (DQIs) The DQIs in Table 3-3 will be followed to verify representative samples are being collected for the project area.
Table 3-3 Data Quality Indicators (DQIs)
DQIs Definition Determination Method
Precision
The measurement among repeated measurements of the same property under identical or substantially similar conditions; calculated as either the range or as the standard deviation.
Field sampling precision will be determined by using field duplicate samples. Laboratory precision will be determined by comparing the results duplicate samples and duplicate spike samples.
Bias The systematic or persistent distortion of a measurement process that causes errors in one direction.
Laboratory bias will be determined as part of its internal quality control (QC). Bias effects that fall outside the laboratory’s acceptance limits will be flagged.
Accuracy
A measurement of the overall agreement of a measurement to a known value; includes a combination of random error (bias) components of both sampling and analytical operations.
Laboratory accuracy will be determined by analysis of standard reference samples, spiked samples and/or matrix-spiked samples, as well as by instrument and method blank samples.
Representativeness
A qualitative term that expresses “the degree to which data accurately and precisely represent a characteristic of a population, parameter variations at a sampling point, a process condition, or an environmental condition.”
Sample locations will be selected and samples will be collected in such a manner that will assure representativeness with respect to space, time, and flow. Sample locations are selected such that they represent flow to, within, and from the project area and therefore do not represent “edge effects.”
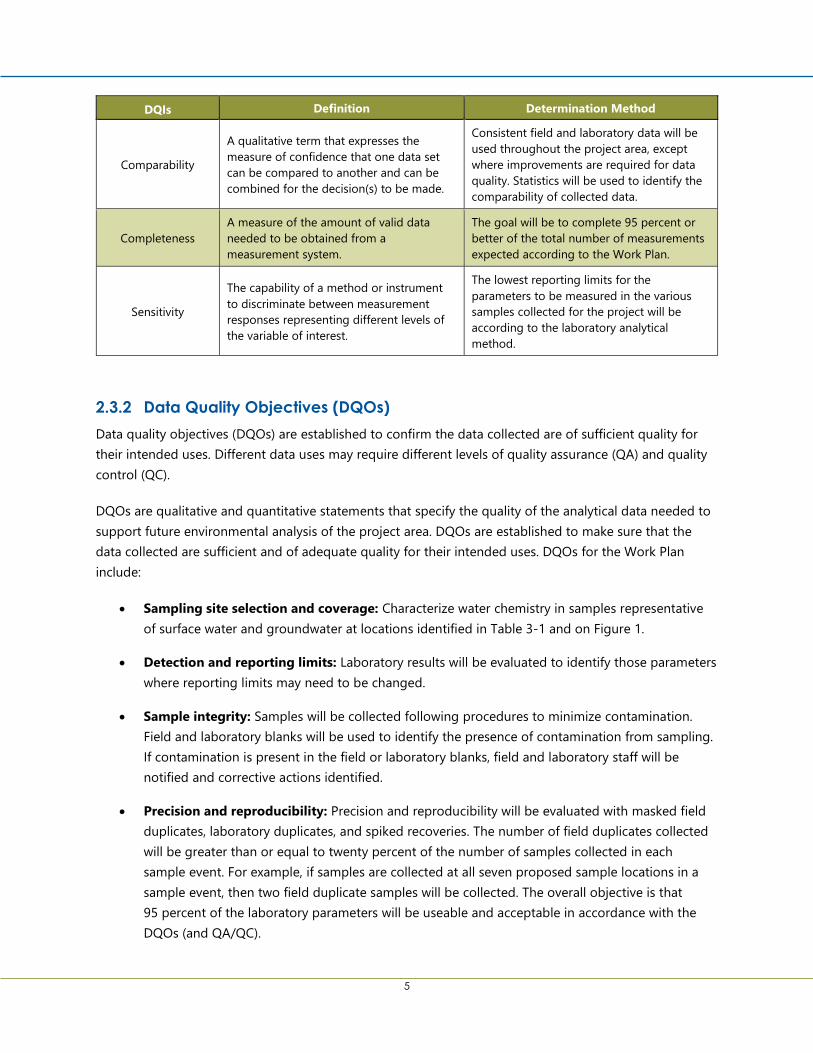
5
DQIs Definition Determination Method
Comparability
A qualitative term that expresses the measure of confidence that one data set can be compared to another and can be combined for the decision(s) to be made.
Consistent field and laboratory data will be used throughout the project area, except where improvements are required for data quality. Statistics will be used to identify the comparability of collected data.
Completeness A measure of the amount of valid data needed to be obtained from a measurement system.
The goal will be to complete 95 percent or better of the total number of measurements expected according to the Work Plan.
Sensitivity
The capability of a method or instrument to discriminate between measurement responses representing different levels of the variable of interest.
The lowest reporting limits for the parameters to be measured in the various samples collected for the project will be according to the laboratory analytical method.
2.3.2 Data Quality Objectives (DQOs) Data quality objectives (DQOs) are established to confirm the data collected are of sufficient quality for their intended uses. Different data uses may require different levels of quality assurance (QA) and quality control (QC).
DQOs are qualitative and quantitative statements that specify the quality of the analytical data needed to support future environmental analysis of the project area. DQOs are established to make sure that the data collected are sufficient and of adequate quality for their intended uses. DQOs for the Work Plan include:
• Sampling site selection and coverage: Characterize water chemistry in samples representative of surface water and groundwater at locations identified in Table 3-1 and on Figure 1.
• Detection and reporting limits: Laboratory results will be evaluated to identify those parameters where reporting limits may need to be changed.
• Sample integrity: Samples will be collected following procedures to minimize contamination. Field and laboratory blanks will be used to identify the presence of contamination from sampling. If contamination is present in the field or laboratory blanks, field and laboratory staff will be notified and corrective actions identified.
• Precision and reproducibility: Precision and reproducibility will be evaluated with masked field duplicates, laboratory duplicates, and spiked recoveries. The number of field duplicates collected will be greater than or equal to twenty percent of the number of samples collected in each sample event. For example, if samples are collected at all seven proposed sample locations in a sample event, then two field duplicate samples will be collected. The overall objective is that 95 percent of the laboratory parameters will be useable and acceptable in accordance with the DQOs (and QA/QC).
6
2.3.3 Quality Control (QC) Data QC samples will include field blanks and duplicates. Field duplicate samples will be submitted to the laboratory as blind or masked samples. For each sampling event, field duplicates will be collected for all parameters and one field blank will be collected for metals only. Field blanks will be collected by transferring distilled or lab water into the required sample container. Field blanks also will be field filtered for dissolved metals analysis if dissolved metals fractions are being collected at the respective location(s) during the sampling event. All masked duplicate samples will be assigned a sample name on the sample bottle label and the chain-of-custody record. The field duplicates will be recorded on the field log.
2.3.4 Data Review, Validation, and Verification Requirements Laboratory personnel (Pace Analytical) will flag analytical parameters in their reports that exceed hold time, do not meet preservation requirements, are outside the limits of analysis, or have other factors that may cause the data to be invalidated.
Barr will cross-check laboratory reports against field notes and data sheets. QC data (e.g., duplicates, blanks, etc.) will be reviewed. Barr will also include an assessment of overall data validity and usability consistent with the DQIs and DQOs in the Work Plan. If data quality does not meet project specifications, the deficient data will be qualified or discarded, and the cause evaluated.
Barr will follow the USEPA (2002) document Guidance on Environmental Verification and Validation, whereby the data are reviewed and accepted by qualified staff. Barr SOPs for the following are included in Appendix B:
• Routine-Level General Chemistry Data Evaluation
• Routine-Level Metals Data Evaluation
Data that do not meet validation and verification criteria will be discarded. If needed, results of the QC review will be discussed with laboratory personnel. If outliers are suspected, appropriate testing will be performed before censoring the data. USEPA guidance will be followed in the event that discrepancies between dissolved and total recoverable metals occur.
7
3 Data Review and Reporting Data review and reporting includes QA/QC measures, data management, and reporting to the client.
3.1 Assess Water Quality Data evaluation methods will depend on the data collected. Temporal trends in water quality may be apparent over the multiple sampling events.
Tables and graphics will be prepared to show the differences and similarities of sample chemistry.
3.2 Final Data Reporting Barr will prepare summaries of the water chemistry data and evaluations in various formats to support Project discussions and will identify potential follow-up sampling to support the evaluation. The data reporting will include one or more of the following elements:
• Data tables summarizing water chemistry data
• Data (scatter) plots, bar graphs, or other formats to highlight specific characteristics of the water monitoring data
• Description and interpretation of the monitoring data
• QA/QC results of the field and laboratory data
• Potential future sampling:
o Discussion of any recommended modifications to the monitoring locations or the analytical parameters
o Explanations of evaluations that resulted in refinements/adjustments to monitoring locations and/or parameters
A final report will be prepared at the conclusion of the sampling efforts.
8
4 References U.S. Environmental Protection Agency (USEPA). 2002 Guidance on Environmental Data Verification and
Data Validation (USEPA QA/G-8). November 2002.

Figures
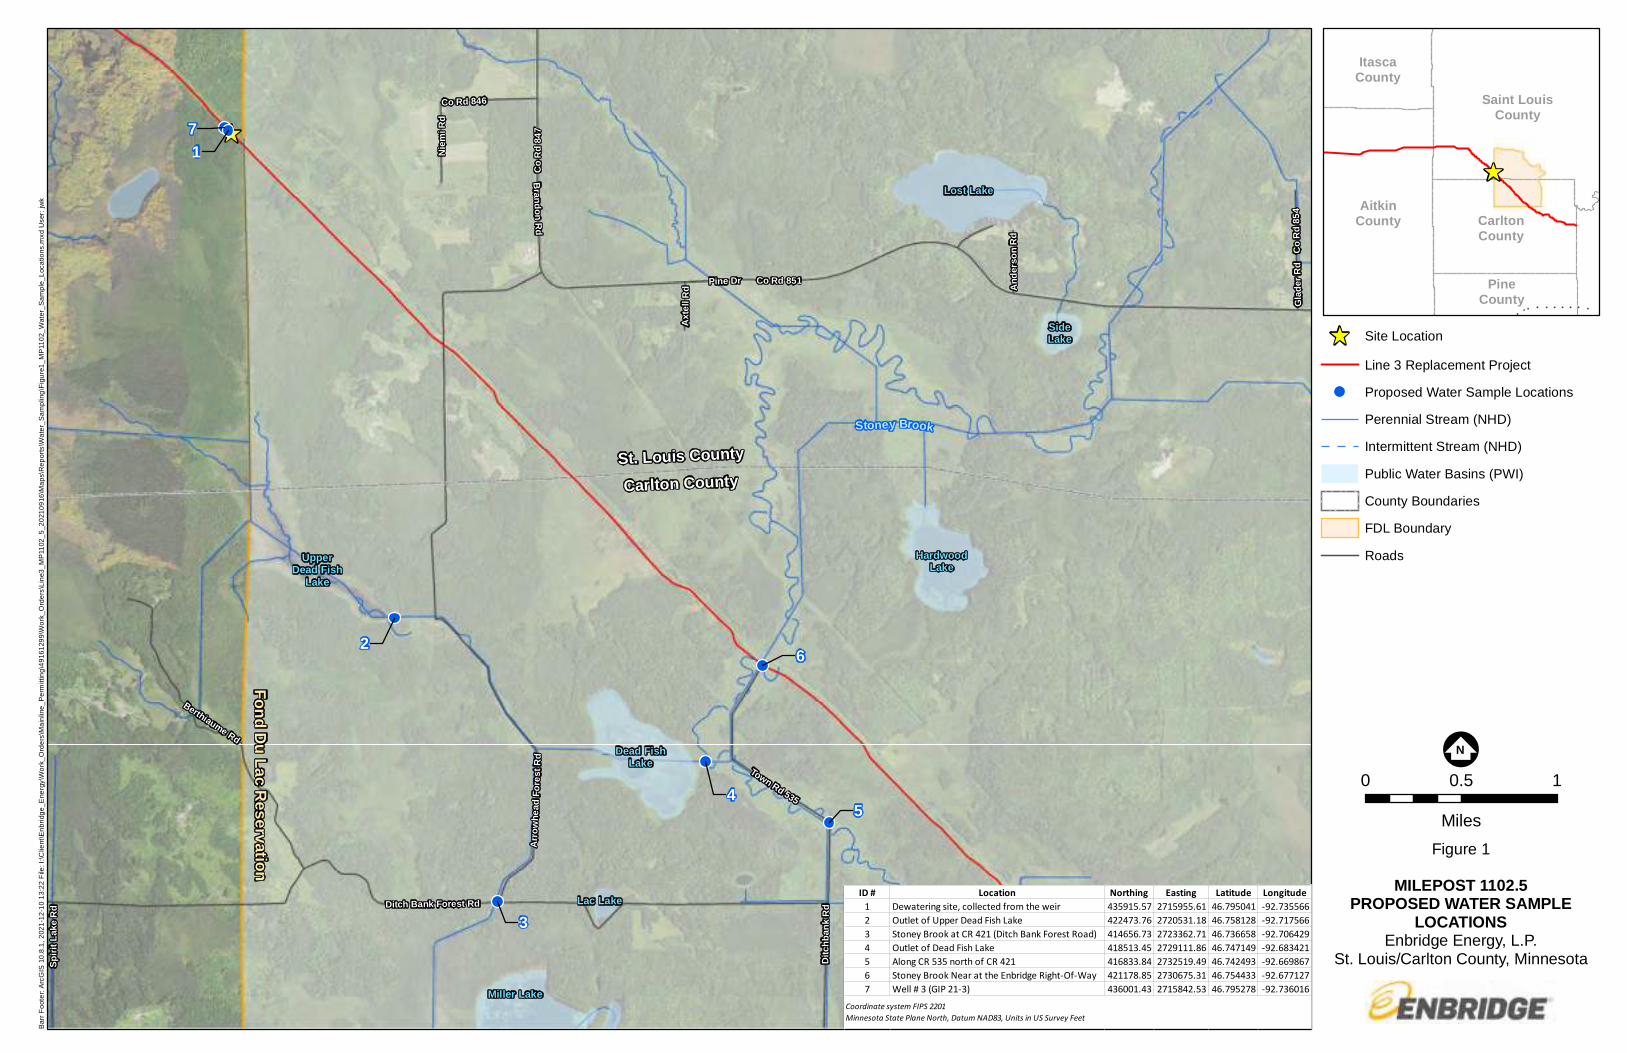
^
Fond Du Lac Reservation
St. Louis CountyCarlton County
UpperDead Fish
Lake
HardwoodLake
Miller Lake
Lac Lake
Lost Lake
Dead FishLake
SideLake
71
2
3
45
6
Stoney Brook
Ditch Bank Forest Rd
Ditch
bank
Rd
Spirit
Lake
Rd
Berthiaume Rd
Town Rd 535
Arro
whea
d For
est R
d
Axtel
l Rd An
ders
on R
d
Brandon Rd
Pine Dr
Glad
er R
d
Niem
i Rd
Co Rd 851
Co R
d 847
Co R
d 854
Co Rd 846
!;N
Barr
Foote
r: ArcG
IS 10
.8.1,
2021
-12-10
13:22
File:
I:\Cl
ient\E
nbrid
ge_E
nergy
\Work
_Orde
rs\Ma
inline
_Perm
itting
\4916
1299
\Work
_Orde
rs\Lin
e3_M
P110
2_5_
2021
0916
\Map
s\Rep
orts\W
ater_S
ampli
ng\Fi
gure1
_MP1
102_
Water
_Sam
ple_L
ocati
ons.m
xd U
ser: j
wk
^ Site LocationLine 3 Replacement ProjectProposed Water Sample LocationsPerennial Stream (NHD)Intermittent Stream (NHD)Public Water Basins (PWI)County BoundariesFDL BoundaryRoads
0 0.5 1Miles
^
ItascaCounty
CarltonCounty
PineCounty
AitkinCounty
Saint LouisCounty
Figure 1MILEPOST 1102.5
PROPOSED WATER SAMPLELOCATIONS
Enbridge Energy, L.P.St. Louis/Carlton County, Minnesota
ID # Location Northing Easting Latitude Longitude1 Dewatering site, collected from the weir 435915.57 2715955.61 46.795041 -92.7355662 Outlet of Upper Dead Fish Lake 422473.76 2720531.18 46.758128 -92.7175663 Stoney Brook at CR 421 (Ditch Bank Forest Road) 414656.73 2723362.71 46.736658 -92.7064294 Outlet of Dead Fish Lake 418513.45 2729111.86 46.747149 -92.6834215 Along CR 535 north of CR 421 416833.84 2732519.49 46.742493 -92.6698676 Stoney Brook Near at the Enbridge Right-Of-Way 421178.85 2730675.31 46.754433 -92.6771277 Well # 3 (GIP 21-3) 436001.43 2715842.53 46.795278 -92.736016
Coordinate system FIPS 2201Minnesota State Plane North, Datum NAD83, Units in US Survey Feet

Appendices
Appendix A
Barr Field Data Collection Standard Operating Procedures

Standard Operating Procedure Collection of Quality Control Samples
Revision 8
April 15, 2021
Approved By:
Andrea Nord 04/15/21 Print Technical Reviewer Signature Date
Michael Dupay 04/15/21 Print QA Manager Signature Date
Review of the SOP has been performed and the SOP still reflects current practice.
Initials: Date:
Initials: Date:
Initials: Date:
Initials: Date:
Collection of Quality Control Samples Page 2 of 6 Revision Date: 04/15/21
Printed Copy is Uncontrolled. Controlled copy is maintained on the internal Barr network. Print a new copy each tim
e a hard copy is required.
Collection of Quality Control Samples 1.0 Scope and Applicability The purpose of this Standard Operating Procedure (SOP) is to describe the procedures used in the collection and handling of field quality control (QC) samples: field blanks, equipment (rinsate) blanks, trip blanks, field (masked) duplicate samples, matrix spikes and matrix spike duplicate samples. The recommended procedures in this SOP should be followed unless conditions make it impractical or inappropriate to do so. Modifications should be noted in the applicable documentation and communicated to appropriate personnel. Significant changes may result in a revision or newly created SOP.
2.0 Limitations The type and frequency of quality control samples can vary by project. If not specified in the
project scope of work and/or documentation (e.g., Work Plan, Sampling Analysis Plan (SAP), or Quality Assurance Project Plan (QAPP)), consult with the appropriate regulatory agency for guidance.
Laboratory analysis specific QC samples (e.g., method blanks, laboratory control samples) are not discussed within this SOP.
3.0 Responsibilities Experienced Field Technicians are responsible for the accurate collection of QC samples and the laboratory is responsible for the accurate set-up and analysis of QC samples. Project staff are responsible for ordering sample containers prior to the sampling event. The role of the Field Safety Representative is to oversee on-site safety activities. The Project Manager, in conjunction with the client, develops the site-specific scope of work (e.g., Work Plan, Sampling Analysis Plan (SAP), etc.).
4.0 Safety Barr staff is responsible for conducting the aspects of the job safely. When applicable, refer to the appropriate Project Health and Safety Plan (PHASP) to understand the hazards associated with suspected contamination, symptoms of exposure, methods to minimize exposure, personal protective equipment (PPE), and personal air monitoring required when using this SOP. Minimum protection of one pair of chemical resistant gloves (e.g., nitrile) and safety glasses with side shields should be worn to prevent sample contact with the skin and eyes. When sampling soils contaminated with corrosive materials, emergency eye flushing facilities should be available. Some of the sample containers may require the use of preservatives. Consult the applicable Safety Data Sheet to review hazards and appropriate PPE to minimize exposure.

Collection of Quality Control Samples Page 3 of 6 Revision Date: 04/15/21
Printed Copy is Uncontrolled. Controlled copy is maintained on the internal Barr network. Print a new copy each tim
e a hard copy is required.
5.0 Equipment, Reagents, and Supplies* Laboratory-certified containers appropriate
for the required analysis Matrix specific sampling devices and
equipment Sample containers/media (method specific) Analyte-free water Chemical resistant gloves (e.g., nitrile) Items listed in Section 8.0 Records Sample labels Decontamination supplies (see Decon SOP)
* See Barr’s PFAS SOP for a list of prohibited and acceptable items.
6.0 Procedure This section provides the definitions and sampling procedure(s) for field derived QC samples.
Calibration Calibration is not applicable to this SOP.
Sampling General considerations to be taken into account when planning and conducting sampling operations are the required sample amount, sample holding times, sample handling, and special precautions for trace contaminant sampling. Matrix-specific sampling SOPs should be followed for the collection and preservation of samples. The QC samples will be handled in the same manner as the sample group for which they are intended (i.e., stored and transported with the sample group). 6.2.1 Blank Samples
Blank samples are used to monitor for potential contamination at a sampling site and may consist of field, equipment, rinsate, and trip blank samples. Each of these measure different potential sources of contamination. When collecting a blank for dissolved parameters, the blank water sample should be filtered before adding it to the sample container. 6.2.1.1 Field Blank
A field blank (FB) is prepared on-site and is a sample of analyte-free water exposed to environmental conditions at the sampling site by either 1) transferring the water from one container to another or 2) by removing the lid and exposing a container filled with analyte-free water to the atmosphere for the time necessary to fill the container(s). It measures the potential for sample cross-contamination due to site conditions. 6.2.1.2 Equipment Blank
An equipment blank (EB) is prepared on-site and is a sample of analyte-free water that has been collected after field decontamination of sampling equipment (e.g., bailer or pump, hand-trowel and bowl) and prior to sampling the next location. It measures the potential for sample cross-contamination due to insufficient decontamination. An equipment blank is not collected from disposable or dedicated equipment.
Collection of Quality Control Samples Page 4 of 6 Revision Date: 04/15/21
Printed Copy is Uncontrolled. Controlled copy is maintained on the internal Barr network. Print a new copy each tim
e a hard copy is required.
Note: Prior to May 2019, the terms ‘Equipment Blank’ and ‘Rinsate Blank’ were used interchangeably and carried the same definition. To help better define the blank being collected, the term ‘Rinsate Blank’ is defined as listed below.
6.2.1.3 Rinsate Blank
A rinsate (or rinse blank, RB) is a sample of analyte-free water that has been collected from the rinsing of sampling equipment. It is used to check that equipment being considered for use at a project site would not introduce the target analyte of concern to the samples being collected. Best practice is to evaluate prior to using the equipment at the project site. 6.2.1.4 Trip Blank
A trip blank (TB) is a sample of analyte-free water prepared or provided by the laboratory along with the sampling containers. Trip blank sample containers are not to be opened in the field and accompany the samples during collection, storage, and transport to the analytical laboratory. It measures the potential for sample cross-contamination due to sample transport and handling. A trip blank sample is used when sampling volatile parameters (e.g., volatile organic compounds (VOC)/gasoline range organic (GRO)/ total petroleum hydrocarbon (TPH)). Trip blanks may also be used for per- and polyfluorinated alkyl substances (PFAS). Analyte-free water is used for an aqueous trip blank and methanol (or other applicable sample preservative) is used for a soil trip blank. A trip blank should be included for each sample cooler containing VOC (or PFAS, as required) samples and documented on the chain-of-custody (COC) form along with the samples and the required analysis. 6.2.2 Material Check
A material check (MC) is a sample of material (e.g. bentonite, sand) that has been collected to verify that the material being considered for use at a project site will not introduce the target analyte of concern to the samples being collected. 6.2.3 Field (Masked) Duplicate
A field (masked) duplicate is a sample collected at the same time as an original/source sample using the same procedures, equipment, and types of containers. It measures the precision associated with sample homogeneity, collection, preservation, and storage, as well as laboratory procedures. The field duplicate is collected in a separate container and assigned a different sample identification (e.g., M-1 or FD) than the original/source sample. The date sampled must be included on the sample container label and COC for holding time determination but not the time sampled so that the original/source sample will be blind to the laboratory. Containers designated for a particular analysis (e.g., semi-volatile organic compounds) must be filled sequentially before jars designated for another analysis are filled (e.g., metals). The field duplicate sample is analyzed using the same method as the original/source sample. 6.2.4 Matrix Spike and Matrix Spike Duplicate
Matrix Spikes (MS) and Matrix Spike Duplicate (MSD) samples are two aliquots of a sample to which known quantities of analytes are added (spiked) in the laboratory. The MS and MSD are prepared and analyzed exactly like their original/source sample aliquot. For some analyses, it is required that three separate sample aliquots are collected in the field for each analysis. One aliquot is analyzed to determine

Collection of Quality Control Samples Page 5 of 6 Revision Date: 04/15/21
Printed Copy is Uncontrolled. Controlled copy is maintained on the internal Barr network. Print a new copy each tim
e a hard copy is required.
the concentrations in the original/source sample, a second sample aliquot serves as the MS, and the third sample aliquot serves as the MSD. The purpose of the MS and MSD is to quantify the bias and precision caused by the sample matrix. Additional sample volume for MS/MSD samples may be requested by the laboratory or may be required at a specified frequency as part of the project SAP or QAPP.
Data Reduction/Calculations No data reduction or calculations are associated with this procedure.
Disposal Waste generated by this process will be disposed of in accordance with Federal, State and Local regulations and Barr’s ‘Investigative Derived Waste’ SOP. Where reasonably feasible, technological changes have been implemented to minimize the potential for environmental pollution.
7.0 Quality Control and Quality Assurance (QA/QC) The QC activities described below allow the self-verification of the quality and consistency of the work.
QA/QC Samples The frequency of QC samples is generally one field blank or equipment blank/field duplicate/MS/MSD per twenty samples; however, specific project requirements may require alternative sampling frequencies.
Measurement Criteria Criteria are defined in project specific documentation or in Barr’s data evaluation SOPs.
8.0 Records The field technician will document the type and number of QC samples collected during each sampling event on a COC and in a project dedicated field logbook or on field log data sheets. Examples of common field documentation are available in Barr’s “Compendium of Field Documentation”. Field documentation specific to this SOP are listed below:
Field Log Data Sheet COC form Sample label Custody seal (if applicable)
Field documentation and COC are provided to a Barr Data Management Administrator for storage on the internal Barr network. Additional records information can be found in Barr’s “Records Management System Manual”. Other Barr SOP subjects referenced within this SOP: sample collection, investigative derived waste, decontamination of sampling equipment, and documentation on a COC.

Collection of Quality Control Samples Page 6 of 6 Revision Date: 04/15/21
Printed Copy is Uncontrolled. Controlled copy is maintained on the internal Barr network. Print a new copy each tim
e a hard copy is required.
9.0 References EPA QA/G-5. 2002. Guidance for Quality Assurance Project Plans. EPA SW-846. 2014. Chapter One: Project Quality Assurance and Quality Control.
Standard Operating Procedure Collection of Surface Water Samples
Revision 8
April 26, 2021
Approved By:
John W. Juntilla 04/26/21 Print Technical Reviewer Signature Date
Michael Dupay 04/26/21
Print QA Manager Signature Date
Review of the SOP has been performed and the SOP still reflects current practice.
Initials: Date:
Initials: Date:
Initials: Date:
Initials: Date:

Collection of Surface Water Samples Page 2 of 6 Revision Date: 04/26/21
Printed Copy is Uncontrolled. Controlled copy is maintained on the internal Barr network. Print a new copy each tim
e a hard copy is required.
Collection of Surface Water Samples
1.0 Scope and Applicability The purpose of this Standard Operating Procedure (SOP) is to describe the methods used for sampling of surface water samples (e.g., lakes, streams, rivers, seeps, and springs). The recommended procedures in this SOP should be followed unless conditions make it impractical or inappropriate to do so. Modifications should be noted in the applicable documentation and communicated to appropriate personnel. Significant changes may result in a revision or newly created SOP.
2.0 Limitations Sample collection methods can vary by project. If not specified in the project scope of work
and/or documentation (e.g., Work Plan, Sampling Analysis Plan (SAP), or Quality Assurance Project Plan (QAPP)), consult with the appropriate regulatory agency for guidance.
Dedicated sampling equipment and/or decontamination of sampling equipment is required to prevent cross-contamination.
If sampling for per- and polyfluorinated alkyl substances (PFAS), special consideration must be taken to avoid accidental contamination of environmental samples - see Barr’s SOP ‘Collection of Per- and Polyfluorinated Alkyl Substances (PFAS) Samples’.
3.0 Responsibilities The Project Manager, in conjunction with the client, develops the site-specific scope of work (e.g., Work Plan, SAP, etc.). Experienced Field Technician(s) are responsible for the measurement of field screening procedures, field equipment and calibration, proper sample identification, collection of samples, quality control procedures, and documentation. Equipment Technicians are responsible for maintaining equipment in working order and aiding in troubleshooting equipment issues. The role of the Field Safety Representative is to oversee on-site safety activities. Project staff are responsible for ordering sample containers prior to the sampling event.
4.0 Safety Barr staff is responsible for conducting the aspects of the job safely. When applicable, refer to the appropriate Project Health and Safety Plan (PHASP) to understand the hazards associated with suspected contamination, symptoms of exposure, methods to minimize exposure, personal protection equipment (PPE), and personal air monitoring required when using this SOP. Minimum protection of one pair of chemical resistant gloves (e.g., nitrile) and safety glasses with side shields should be worn to prevent sample contact with the skin and eyes. Some of the sample containers may require the use of preservatives. Consult the applicable Safety Data Sheet to review hazards and appropriate PPE to minimize exposure.
Collection of Surface Water Samples Page 3 of 6 Revision Date: 04/26/21
Printed Copy is Uncontrolled. Controlled copy is maintained on the internal Barr network. Print a new copy each tim
e a hard copy is required.
5.0 Equipment, Reagents, and Supplies* Sample containers (method specific) Chemical resistant gloves (e.g., nitrile) Peristaltic pump (optional) Telescoping pole (optional) Plastic bags Waterproof ink pen or pencil Ice Items listed in Section 8.0 Records Coolers Decontamination supplies (see Decon SOP)
* See Barr’s PFAS SOP for a list of prohibited and acceptable items.
6.0 Procedure This section describes the procedure(s) for the sampling, handling, and delivery involving surface water samples.
Calibration If field equipment is used along with this SOP, it will be calibrated as per the applicable Barr SOP.
Sampling Surface water samples will typically be collected either by directly filling a container or by decanting the water from a collection device. Consult with the Project Manager to determine the protocol for sampling based on the project objectives and the location of the surface water. If the analysis does not require preservation, the sample bottle itself may be used for sample collection. For analyses requiring chemical preservation, use an unpreserved transfer container to collect the sample and then fill each preserved container. Samples collected in shallow water (less than 3 feet deep) should begin at the furthest downstream point and move upstream so that any disturbances caused by sampling will not affect the quality of the water sampled. Collect surface water samples prior to any sediment sampling at the same location. The surface water sample should be collected at mid-depth without disturbing the bottom sediments. Hold the container under the surface with the mouth of the container facing the flow, until filled. When sampling deeper waters, such as rivers, collection should first begin at the upstream point, then to the downstream point, and finally to the sampling point closest to the apparent source of discharge (e.g., outfall). Samples can also be collected using a peristaltic pump, with tubing attached to a telescoping pole, for larger water bodies. The use of a pole allows access to the mid channel location without disturbing the bottom sediments.
Put on gloves for skin protection and to prevent sample contamination. Lower tubing into the water (1 to 2 feet below surface) and cut to the desired length. Connect the sampling tubing to the drive tubing entering the pump. Connect the drive tubing exiting the pump to the short section of tubing used to fill the sample
containers and turn on the pump. Sampling may begin once desired volume is purged.

Collection of Surface Water Samples Page 4 of 6 Revision Date: 04/26/21
Printed Copy is Uncontrolled. Controlled copy is maintained on the internal Barr network. Print a new copy each tim
e a hard copy is required.
Samples should be collected from the most volatile towards the least volatile parameter as listed in Barr’s ‘Water Sampling Guidelines’ form and from the least contaminated area to the most contaminated area (when known). To reduce potential contamination, samples for PFAS should be collected first. See Barr’s SOP ‘Collection of Per- and Polyfluorinated Alkyl Substances (PFAS) Samples’. To prevent the possible loss of some VOCs, samples for volatile parameters should be collected second with as little agitation and disturbance as possible. The 40 mL vials used to collect the VOC samples should be checked for air bubbles. Air bubbles may be caused by insufficient meniscus when sealing the vial, degassing after sample collection or during sample shipment, or reaction between the sample and preservative (hydrochloric acid, HCl). If air bubbles > 6 mm (pea-sized) are observed during sampling, discard the vial and recollect the sample using a new vial. If air bubbles are believed to be due to the sample reacting with the preservative, the sample should be collected in an unpreserved vial if possible. Put on new sampling gloves at each sampling site to reduce the risk of sample cross-contamination and exposure to skin. Never reuse old gloves. Prepare sampling containers by filling out the label, using an indelible permanent pen, with the following information at a minimum:
Sample ID Date and time of sample collection Preservative Sample analysis (if required by the lab)
When filling the containers, do not insert any tubing into the containers and do not overfill preserved containers. When samples are containerized, place the filled sample containers in a sampling cooler with ice, turn off any equipment, disassemble the sampling apparatus, dispose of one-time use (disposable) equipment, and decontaminate reusable equipment per Barr’s SOP ‘Decontamination of Sampling Equipment’. 6.2.1 Preservation
Container volume, type, and preservative are important considerations in sample collection. Container volume must be adequate to meet laboratory requirements for quality control, split samples, or repeat analyses. The container type varies with the analysis required. Typically, the analytical laboratory will preserve the container before shipment. Preservation and shelf life vary; contact the laboratory to determine if an on-hand container is still useful. Barr’s ‘Water Sampling Guidelines’ form lists the parameter, container type, container volume, and preservative for many of the most common parameters collected. 6.2.2 Handling
The samples will be bubble wrapped or bagged after collection, stored in a sample cooler, and packed on double bagged wet ice. Samples will be kept cold (≤ 6 °C, but not frozen), until receipt at the laboratory (where applicable). Note: Samples may need to be stored indoors in winter to prevent freezing.

Collection of Surface Water Samples Page 5 of 6 Revision Date: 04/26/21
Printed Copy is Uncontrolled. Controlled copy is maintained on the internal Barr network. Print a new copy each tim
e a hard copy is required.
6.2.3 Shipment/Delivery
Once the cooler is packed to prevent breaking of bottles, the proper chain-of-custody (COC) documentation is signed and placed inside a plastic bag then added to the cooler. Samples will be kept secured to prevent tampering. If sample coolers are left in a vehicle or field office for temporary storage, the area will be locked and secured. Custody seals may be present, but at a minimum, the coolers must be taped shut to prevent the lid from opening during shipment. The coolers must be delivered to the laboratory via hand or overnight delivery courier, if possible, in accordance with Federal, State and Local transportation regulations and Barr’s SOP ‘Domestic Transport of Samples to the Laboratory’.
Data Reduction/Calculations No data reduction or calculations are associated with this procedure.
Disposal Waste generated by this process will be disposed of in accordance with Federal, State and Local regulations and Barr’s SOP ‘Investigative Derived Waste’. Where reasonably feasible, technological changes have been implemented to minimize the potential for environmental pollution.
7.0 Quality Control and Quality Assurance (QA/QC) The QC activities described below allow the self-verification of the quality and consistency of the work.
QA/QC Samples QA/QC samples are defined in Barr’s SOP ‘Collection of Quality Control Samples’. The sampling frequency should be performed at the frequency noted in the project scope of work and/or documentation (e.g., Work Plan, SAP, or QAPP).
8.0 Records The field technician will document any field test measurements on the field log data sheet and/or field notebook. They will also document the type and number of bottles on the chain-of-custody record, as appropriate. The analysis for each container and the laboratory used will be documented on the chain-of-custody record. Refer to Barr’s SOP ‘Documentation on a Chain-of-Custody (COC)’ for further information. Examples of common field documentation are available in Barr’s “Compendium of Field Documentation”. Field documentation specific to this SOP are listed below:
COC Sample label Custody seal (if applicable) Field Log Data Sheet Field Log Cover Sheet Field Sampling Report Water Sampling Guidelines (includes sampling order, container, preservation, and holding time)

Collection of Surface Water Samples Page 6 of 6 Revision Date: 04/26/21
Printed Copy is Uncontrolled. Controlled copy is maintained on the internal Barr network. Print a new copy each tim
e a hard copy is required.
The field documents and COCs are provided to a Barr Data Management Administrator for storage on the internal Barr network. Additional records information can be found in Barr’s “Records Management System Manual”. Other Barr SOP subjects referenced within this SOP: water quality meter, turbidimeter, collection of QC samples, collection of PFAS samples, decontamination of sampling equipment, investigative derived waste, domestic transport of samples, and documentation on a COC.
9.0 References Environmental Protection Agency, Region 4. 2013. Surface Water Sampling Operating Procedure. Environmental Protection Agency. Title 40 of the Code of Federal Regulations, Part 136.3.
Updated 01/30/2020
Compendium
Of
Field Documentation
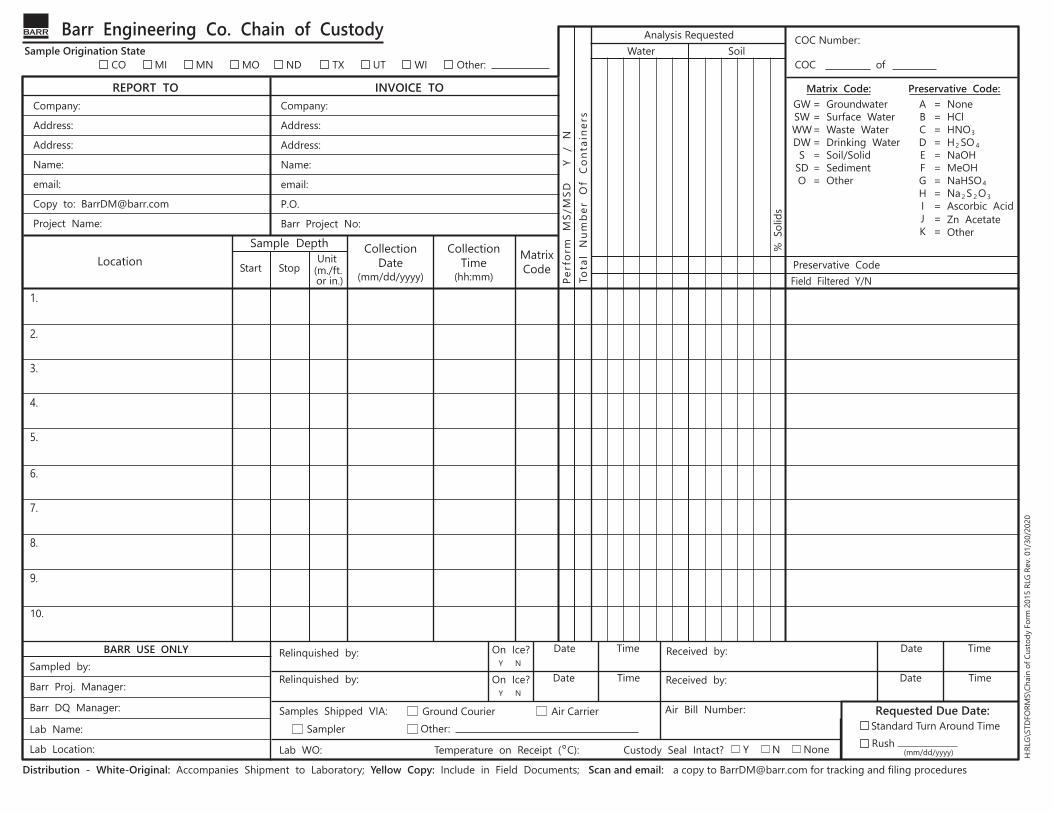
Location MatrixCode
Tota
l N
umbe
r O
f C
onta
iner
s
Barr Engineering Co. Chain of Custody
Distribution - White-Original: Accompanies Shipment to Laborat a copy to [email protected] for tracking and filing proceduresory; Yellow Copy: Include in Field Documents; Scan and email:
1.
2.
3.
4.
5.
6.
7.
8.
9.
10.
Relinquished by:
Relinquished by:
Received by:
Received by:
Air Bill Number:
COC of
On Ice?Y N
Start Stop
CollectionDate
Sample Origination State
(mm/dd/yyyy)
CollectionTime
(hh:mm)(m./ft.
CO MI MN
REPORT TO INVOICE TO
Copy to: [email protected]
Perf
orm
M
S/M
SD
Y
/ N
Name:
email:
Project Name:
Company:Company:
Address:
Address:
Address:
Address:
Name:
email:
P.O.
Barr Project No:
COC Number:
ABCDEFGHIJK
= None= HCl= HNO= H SO= NaOH= MeOH= NaHSO= Na S O= Ascorbic Acid= =
Zn AcetateOther
Field Filtered Y/NPreservative Code
Lab Name:
BARR USE ONLY Sampled by:
Barr Proj. Manager:
Barr DQ Manager:
Lab Location:
Standard Turn Around TimeRush
(mm/dd/yyyy) H:R
LG\S
TDFO
RMS\
Chai
n of
Cus
tody
For
m 2
015
RLG
Rev.
01/3
0/20
20
Requested Due Date:
or in.)
GWSWWWDW
SSDO
= Groundwater= Surface Water= Waste Water= Drinking Water= Soil/Solid= Sediment= Other
Matrix Code: Preservative Code:
Lab WO: Temperature on Receipt ( C): Custody Seal Intact? Y N None
On Ice?Y N
Date
Date
Time
Time
Date
Date
Time
Time
Analysis Requested
3
2 4
4
2 2 3
Water Soil
% S
olid
s
Sample DepthUnit
MO ND TX UT WI Other:
Samples Shipped VIA: Ground Courier Air CarrierSampler Other:

Location
Barr Engineering Co. Chain of Custody for Air Canisters
Distribution - White-Original: Accompanies Shipment to Laborat a copy to [email protected] for tracking and filing proceduresory; Yellow Copy: Include in Field Documents; Scan and email:
1.
2.
3.
4.
5.
6.
7.
8.
9.
10.
Relinquished by:
Relinquished by:
Samples Shipped VIA: Ground Courier Air CarrierSampler Other:
Received by:
Received by:
Air Bill Number:
COC of
Serial# L
Size
Sample Origination State CO MI MN
REPORT TO INVOICE TO
Copy to: [email protected]
Name:
email:
Project Name:
Company:Company:
Address:
Address:
Address:
Address:
Name:
email:
P.O.
Barr Project No:
COC Number:
Lab Name:
BARR USE ONLY Sampled by:
Barr Proj. Manager:
Barr DQ Manager:
Lab Location:
Standard Turn Around TimeRush
(mm/dd/yyyy) H:R
LG\S
TDFO
RMS\
Chai
n of
Cus
tody
for A
ir Ca
nist
ers F
orm
201
5 RL
G Re
v. 01
/30/
2020
Requested Due Date:
Matrix Code:
Lab WO: Custody Seal Intact? Y N None
Date
Date
Time
Time
Date
Date
Time
Time
Analysis Requested
Lab Deliverable Contents
EDD:
(check all that apply)
MO ND TX UT WI Other:
Flow Controller
Serial #
Vacuum Collection Time
TO-143C
Sample Data with QCTIC Library SearchSample Chromatograms
AA = Ambient Air (Indoor/Outdoor)SV = Soil Vapor/Landfill Gas/SVEOther:
EQuIS EQuIS-LITETIC results in EDD
Other:
Individual Canister Certification Data
TO-15Other
TO-15SIM
Canister
Initial(in Hg)
Final(in Hg)
Initial(hh:mm)
Final(hh:mm)
Collection Date
(mm/dd/yyyy)
PID Reading(ppm/ppb)
Total Time
(hh:mm)
Matrix Code Sample Comments
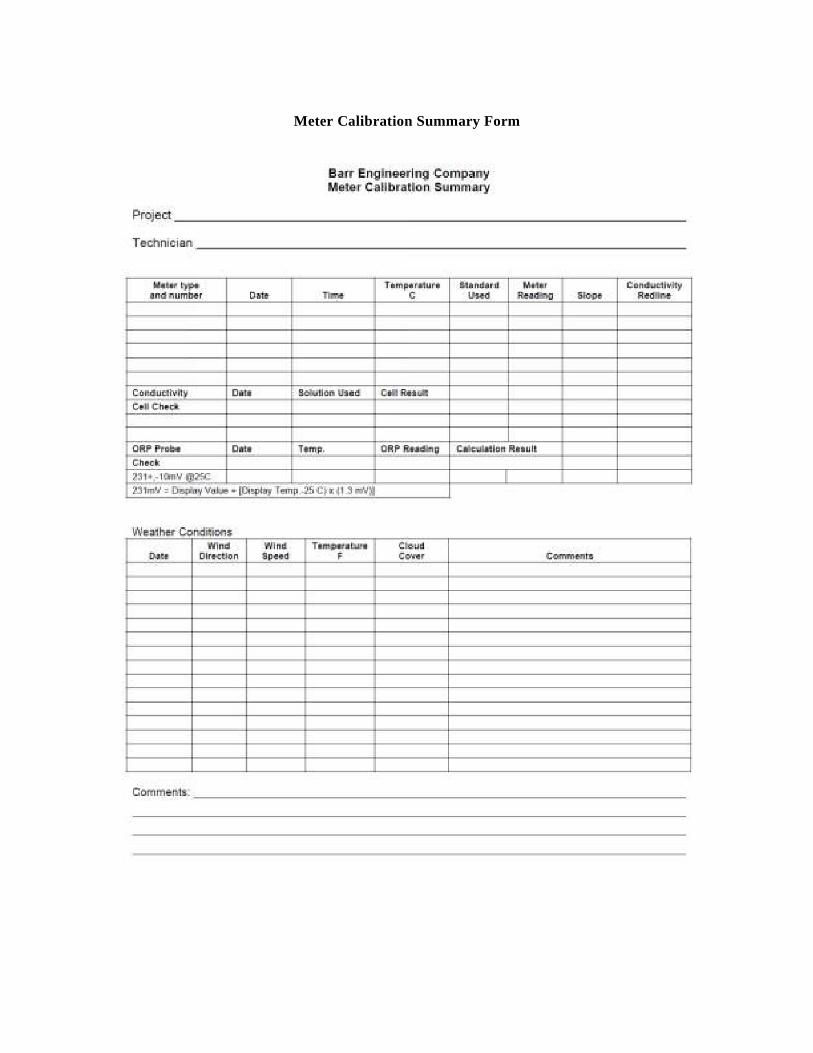
Meter Calibration Summary Form
Version: April 2013
Barr Engineering Company Troll Checklist / Data Sheet
Client: Monitoring Point: Location: Troll Serial Number: Project #: Date:
• Memory Status (approximate):
• Battery Status (approximate):
• Test Running?:
• Time Downloaded:
Water Level Measurements:
Time Water Level Measured by Hand
Troll Water Level Reading
Difference in Measurements*
*consider restarting test with a new reference if difference between measurements is >0.15 feet
• Troll Removed? circle one: Yes No
Complete the following if Troll was removed Time removed:
Time reinstalled:
Post Reinstallation Water Level Measurements:
Time Water Level Measured by Hand
Troll Water Level Reading
Difference in Measurements
• For Troll 9500 only
o Calibrated?

Water Level Data Sheet
WATER LEVEL DATA SHEET
Project: Project Number: Environmental Staff: Date:
Monitoring Location
Measuring Point Elevation
Water Level Depth
Total Well Depth
Static Water Elevation
Comments
Field Log Data Sheet
Client: Monitoring Point:
Location: Date:
Project #: Sample time:
GENERAL DATA STABILIZATION TEST
Barr lock: Time/
Volume Temp.
ºC Cond. @ 25 PH
ORP mV D.O.
Turbidity NTU (not
appearance) Casing diameter:
Total well depth:* NA
Static well level:*
Water depth:*
Well volume: (gal)
Purge method:
Sample method:
Start time: Odor:
Stop time: Purge Appearance:
Duration: (minutes) Sample Appearance:
Rate, gpm: Comments:
Volume purged:
Duplicate collected:
Sample collection by:
Others present: Well condition:
MW: groundwater monitoring well WS: water supply well SW: surface water SE: sediment Other: sump
VOC Semi-volatile General Nutrient Cyanide DRO Sulfide
Oil, grease Bacteria Total Metal Filtered Metal Methane Filter
Others:
* Measurements are referenced from the top of riser pipe, unless otherwise indicated.

Date Time
Field Log Data Sheet
Soil Samples
Barr Engineering Company
Location:
Number of Containers/ AnalysisClient:
Oth
er:
Mois
ture
Oth
er:
VO
C
17.
18
19.
20.
13.
14.
15.
16.
9.
10.
11.
12.
5.
6.
7.
8.
1.
2.
3.
4.
Sample IdentificationCollection
Matrix Type
Soil
Slu
dge
Gra
b
RC
RA
Meta
ls
WIG
RO
WID
RO
PC
B
8 o
z. U
npre
s.
Oth
er:
SV
OC
PA
H
Mois
ture
-pla
stic v
ial etc
.
2 o
z. P
res.
2 o
z. U
npre
s.
4 o
z. U
npre
s.
Com
p.
QC
Project #:
Project Name:
Sediment Core/Boring LogVC: vibracorePC: push core
Proj#: Project: Core/Boring#:Collection Date(s): GPS X: Length of Push (feet): Driller: Drilling Method: Ice Thickness (feet): GPS Y: Recovery (feet): Crew: Logged by:Water Depth (feet): GPS Z: % Recovery: Observer: Checked by:
Sample Interval
and number Mo
isture
Dens
ity o
r Co
nsist
ency
Plasti
city
Cohe
siven
ess
Part
icle
s
Odo
r
Stai
ning
Shee
n
ASTM
/ USC
S Cla
ssific
ation
Grap
hic Lo
g
Depth (ft.)
Properties
Description
page_____of_____

Recovery Rate Test Form
Recovery Rate Test
Project: Sampled by: Date: Well Number: Water Level Before Evacuation (0.01 Ft.):
Time Well Was Evacuated: Sample Time:
Time from Evacuation (min.) Water Level (0.01 ft.) Time from Evacuation Water Level (0.01 ft.)
:00 :30
1:00 1:30 2:00 2:30 3:00 3:30 4:00 4:30 5:00 6:00 7:00 8:00 9:00
10:00 11:00 12:00 13:00 14:00 15:00

FIELD LOG COVER SHEET
Client: Project No.: Technician: Sampling Period:
Date Temperature Wind Speed Wind
Direction Cloud Cover
Summary of Field Activities
FIELD SAMPLING REPORT
Date: Project: Contact: Field Sampling Field Report Attachments:
• • • • • • • • • •
Laboratory Analysis Status __________________________________ <Name here> Environmental Technician
Dangerous Goods in Excepted Quantities Label Examples
3 Methanol
8 Nitric Acid

Courier Form Example
Sample Label Examples
Custody Seal Example

Soil Sampling Guidelines Revision Date: 03/15/19
Soil Sampling Guidelines
Some of the analyses below require the use of preservatives. Consult the applicable Safety Data Sheet to review hazards and appropriate PPE to minimize exposure.
Sampling
Order Analysis Container Preservation Holding Time
1 PFAS^ 4 oz. HDPE jar w/unlined cap Cool, ≤ 6 °C 28 days
2 VOC
Glass jar or vial w/PTFE-lined lid, pre-weighed by laboratory
Cool, ≤ 6 °C, 1:1 w/chemical
preservation (e.g., methanol, sodium
bisulfate)
14 days
En Core® Freeze or extrude
into chemical preservative
48 hours
3 TCLP VOC 4 oz. glass jar w/PTFE-lined lid Cool, ≤ 6 °C, no headspace 14 days
4 WI GRO/PVOC Glass jar or vial w/PTFE-lined lid Cool, ≤ 6 °C, 1:1 w/methanol 21 days / 14 days
5 WI DRO* 2 or 4 oz. jar w/PTFE-lined lid, pre-weighed by laboratory Cool, ≤ 6 °C 10 days
6 TPH as Jet Fuel, Fuel Oil, Motor Oil (etc.) 2 or 4 oz. jar w/PTFE-lined lid Cool, ≤ 6 °C 14 days
7 SVOC/PAH, Pesticides, Herbicides 2 or 4 oz. jar w/PTFE-lined lid Cool, ≤ 6 °C 14 days
8 TCLP SVOC, TCLP Pesticides. TCLP
Herbicides 4 oz. jar w/PTFE-lined lid Cool, ≤ 6 °C 14 days
9 PCB 2 or 4 oz. jar w/PTFE-lined lid Cool, ≤ 6 °C None
10 Metals / Mercury 2 or 4 oz. jar w/PTFE-lined lid Cool, ≤ 6 °C 6 months
(mercury 28 days)
11 TCLP Metals / TCLP Mercury 4 oz. jar w/PTFE-lined lid Cool, ≤ 6 °C
6 months (mercury 28 days)
12 General Chemistry 2 or 4 oz. jar w/PTFE-lined lid NA Various depending on analysis
^ Use PFAS-free materials – see Barr’s PFAS SOP * 25-35 g, for best data quality results, do not use less than 25 grams/sample.
Note: Hold times are from initial sampling event to first analytical process. The times stated above do not reflect hold times extended due to extraction or other preparatory methods.
Note: Container types and sizes listed are for guidance only. Refer to your specific regulatory agency sampling protocols. Laboratories may use different containers or combine analyses into larger volume containers.

Water Sampling Guidelines Revision Date: 03/14/19
Water Sampling Guidelines Safety Considerations: Acids and bases are used for some of the preservatives - use appropriate PPE when sampling, Minimum protection of gloves and safety glasses should be worn to prevent sample contact with the skin and eyes.
Sampling Order
Parameter Group
Container Type, Size, and Number Preservation Sampling Instructions Holding Time
1 PFAS 250 mL HDPE w/unlined cap
Cool, ≤ 6 °C Trizma (if
chlorine present)
Fill slowly to minimize sample agitation. Fill bottle with enough water to minimize headspace. Use PFAS-free materials – see Barr’s PFAS SOP.
14 Days (drinking water), 28 days (non-
potable water)
2 VOCs, WI GRO, TPH as Gasoline
3-40 mL VOA glass vials, Teflon®
septum cap
HCl, pH < 2,
Zero Headspace; Cool, ≤ 6 °C
Allow slow stream of water to fill vial at an angle to minimize agitation. Near top, return vial to vertical and add water until meniscus forms, avoid overfilling. Cap tightly, invert and tap lightly; should be no headspace, if bubbles appear (> 6mm), recollect sample.
14 Days, 7 Days if pH > 2
3
SVOCs, Pesticides, Herbicides,
Dioxin/Furans
1 L amber glass, Teflon® septum
cap Cool, ≤ 6 °C Fill slowly to minimize sample agitation.
Fill bottle with enough water to minimize headspace. 7 Days
4 WI DRO 1 L amber glass, Teflon® septum
cap
HCl, pH < 2;
Cool, ≤ 6 °C
Fill slowly to minimize sample agitation. Fill bottle with enough water to minimize headspace. 7 Days
5 TPH as Jet Fuel, Fuel Oil, Motor
Oil (etc.)
1 L amber glass, Teflon® septum
cap Cool, ≤ 6 °C Fill slowly to minimize sample agitation.
Fill bottle with enough water to minimize headspace. 7 Days
6 PCBs 1 L amber glass, Teflon® septum
cap Cool, ≤ 6 °C Fill slowly to minimize sample agitation.
Fill bottle with enough water to minimize headspace. None
7 Metals, Mercury
500 mL polyethylene;
LL Hg – fluoropolymer or
glass
HNO3, pH < 2; Cool, ≤ 6 °C (not
required, best practice)
Fill slowly to minimize sample agitation.
180 days; Hg 28 days; LL Hg preserve
w/in 48 hrs. or if oxidized, 28 days
8 Dissolved Metals, Mercury
500 mL polyethylene ;
LL Hg – fluoropolymer or
glass
HNO3, pH < 2; Cool, ≤ 6 °C (not
required, best practice)
Filter sample through a 0.45 µm filter. Fill slowly to minimize sample agitation.
180 days; Hg 28 days; LL Hg lab filter w/in 24 hrs., if field filtered see above
9 Cyanide 1 L polyethylene NaOH,
pH > 12; Cool, ≤ 6 °C
Fill slowly to minimize sample agitation. 14 days
10 Sulfide 500 mL polyethylene
NaOH, pH >9 and zinc acetate;
Cool, ≤ 6 °C Fill slowly to minimize sample agitation. 7 days
11 General Chemistry 1 L Cool, ≤ 6 °C Fill slowly to minimize sample agitation. 14-28 days (except
below) 11 TDS, TSS 1 L polyethylene Cool, ≤ 6 °C Fill slowly to minimize sample agitation. 7 days
11 BOD, CBOD 1 L polyethylene Cool, ≤ 6 °C Fill slowly to minimize sample agitation. 48 hrs.
11 Nitrate or Nitrite Only
250 mL polyethylene Cool, ≤ 6 °C Fill slowly to minimize sample agitation. 48 hrs.
11 Chromium VI 250 mL polyethylene Cool, ≤ 6 °C Fill slowly to minimize sample agitation. 24 hrs.
12
Phenolics, Ammonia,
Nitrate+nitrite, TKN, COD
Varies by parameter
H2SO4, pH < 2;
Cool, ≤ 6 °C Fill slowly to minimize sample agitation. 28 days
12 HEM (Oil and Grease) 1 L amber glass
HCl or H2SO4, pH < 2;
Cool, ≤ 6 °C Fill slowly to minimize sample agitation. 28 days
13 Total / Fecal Coliforms 125 mL sterile Na2S2O3;
Cool, ≤ 6 °C Fill slowly to minimize sample agitation. ≤ 30 / ≤24 hrs
Note: Hold times are from initial sampling event to first analytical process. The times stated above do not reflect hold times extended due to extraction or other preparatory methods.
Note: Container types and sizes listed are for guidance only. Refer to your specific regulatory agency sampling protocols. Laboratories may use different containers or combine analyses into larger volume containers.
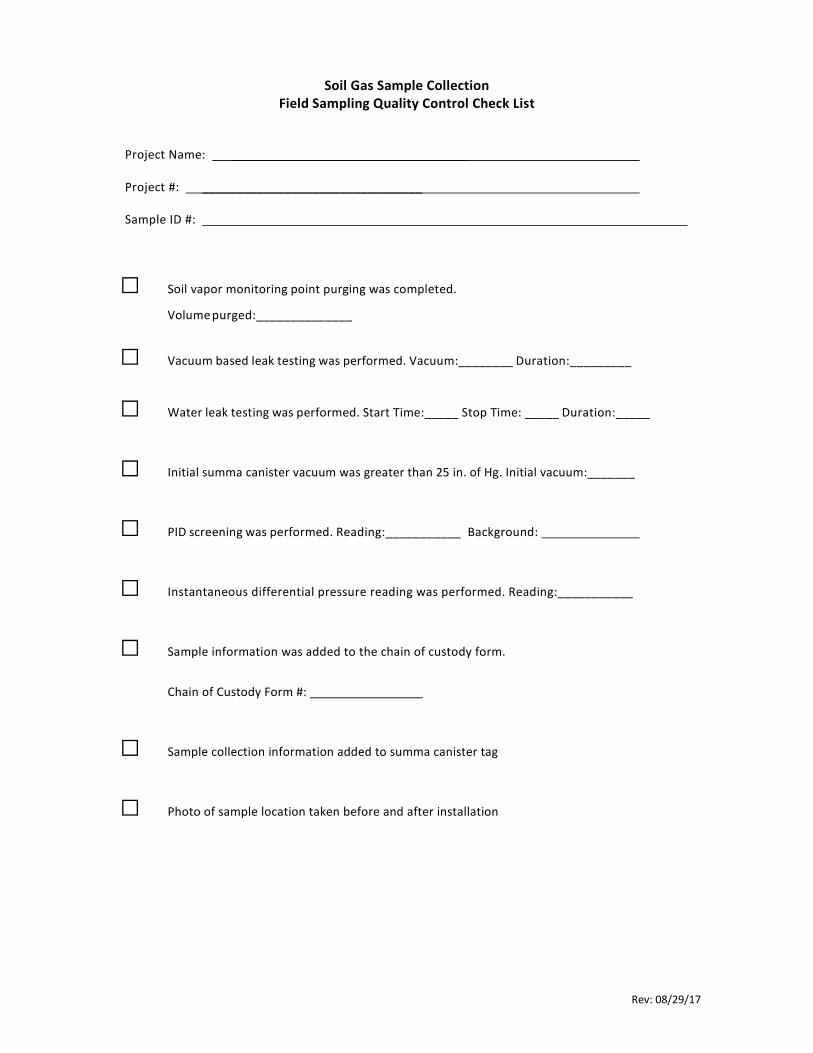
Rev: 08/29/17
Soil Gas Sample Collection Field Sampling Quality Control Check List
Project Name: __________________________________
Project #: ________________________________
Sample ID #:
□ Soil vapor monitoring point purging was completed.
Volume purged:______________
□ Vacuum based leak testing was performed. Vacuum:________ Duration:_________
□ Water leak testing was performed. Start Time:_____ Stop Time: _____ Duration:_____
□ Initial summa canister vacuum was greater than 25 in. of Hg. Initial vacuum:_______
□ PID screening was performed. Reading:___________ Background:
□ Instantaneous differential pressure reading was performed. Reading:___________
□ Sample information was added to the chain of custody form.
Chain of Custody Form #:
□ Sample collection information added to summa canister tag
□ Photo of sample location taken before and after installation
Soil Gas Sample Record
Sample Location Map:
Sample Type___ Soil Vapor ___ Pre-mitigation ___ Sub-Slab Soil Vapor ___ Post-mitigation
Sample Equipment Pin Installation Data
Summa Canister ID #: Time installed:
Flow Control ID #: Permanent OR Temporary
Certification Batch #:
Certification Date: Temporary: Hole patched with concrete? Y or N
Barr Manifold #: Photo after patching? Y or N
Leak Testing Data
Vacuum Test Start Time: Water Leak Test Start Time:
Vacuum Test Stop Time: Water Leak Test Stop Time:
Vacuum Test Pressure:
Sample Collection Data
Purge Volume:
Sample Start Time: Sample Start Pressure:
Sample Stop Time: Sample Stop Pressure:
PID Measurement: Background PID Measurement:
Sub-slab Pressure Reading: Sample information added to summa canister tag?
Photos of sample location taken
Notes:
Project Number:
Sample Date:
Sampling Technician(s):
Sample ID:

Appendix D
www.pca.state.mn.us • 651-296-6300 • 800-657-3864 • Use your preferred realy service • Available in alternative formatsc-rem3-01a • 10/28/16 Page 1 of 8
Vapor Intrusion Building SurveyForm
Remediation Program Doc Type: Site Inspection Information
Preparer’s name: Date/Time prepared: Affiliation: Phone number: Email:
Part 1: Property owner & building occupant information
1. Owner/Landlord information (Check if same as occupant: ) Occupant name(s): Interviewed: Yes No Mailing address:City: State: Zip code: Home phone: Office phone:
2. Occupant informationOccupant name(s): Interviewed: Yes No Mailing address:City: State: Zip code: Phone: Fax: Email: Number of occupants at this location: Age range of occupants:
Part 2: Building evaluation
3. Building use (Check appropriate response) Residential Child/Day Care School Church Hospital Long-term care facility Correctional facility Commercial Industrial Other (specify):
If the property is residential, what type? (Check appropriate response) Ranch rambler Raised rambler Townhouses/Condos Duplex Modular 2-Family Split level Contemporary Apartment house Cape cod Log home 3-Family Colonial Mobile home Other (specify):
4. Building descriptionIf the property is commercial or industrial, describe the business use(s):
Indicate the number of floors and general use of each floor of the building beginning with lowest level:
If there are multiple residential units, indicate how many units: When was building constructed: Type of insulation used in building: Elevators or lifts: Yes No Basement/Lowest level depth below grade: (feet)

Appendix D
www.pca.state.mn.us • 651-296-6300 • 800-657-3864 • Use your preferred realy service • Available in alternative formatsc-rem3-01a • 10/28/16 Page 2 of 8
Observed basement characteristics (Check all that apply) Is basement/lowest level occupied: Full time Occasionally Almost never Bedrooms in the basement/lowest level: Yes No If yes, are the bedrooms occupied regularly: Yes No Basement type: Full Partial Slab Other: Floor materials: Concrete Dirt Stone Other: Floor covering: Uncovered Covered Covered with: Concrete floor: Unsealed Sealed Sealed with: Foundation walls: Poured Block Stone Other: Basement finished: Unfinished Finished Partially finished Basement wetness: Wet Damp Seldom Moldy Sump pump present: Yes No If yes, was water present: Yes No Are there any crawl spaces present:
Yes No If yes, describe the crawl space floor conditions (earth, concrete, etc.) and construction (walls, use, connectivity to building, etc.) and illustrate location on the attached grid plans:
Have there been any building additions
Yes No Describe addition construction including how it ties to the existing floor plan (footings, slab connectivity, etc.) illustrate locations of additions on the attached grid plans:
Thickness of the concrete floor slab in the lowest level(s): Inches. Soil type present beneath the building: Is there evidence of saturated or high moisture conditions beneath the floor slab? Yes No
If yes, explain:
Indicate sources of water supply sources (i.e., drinking, irrigation, etc.) and type of sewage disposal (Check all that apply) Water supply: Public water Drilled well Driven well Dug well Sewage disposal: Public sewer Septic tank Leach field Dry well
5. Heating, venting, air conditioning, or other building controls (Check all that apply)Type of heating system(s) used in this building (Check all that apply)
Hot air circulation Space heaters Electric baseboard In-floor heating Heat pump Steam radiation Wood stove Hot water baseboard Radiant floor Outdoor wood boiler Other (specify): Primary type:

Appendix D
www.pca.state.mn.us • 651-296-6300 • 800-657-3864 • Use your preferred realy service • Available in alternative formatsc-rem3-01a • 10/28/16 Page 3 of 8
Primary type of fuel used (Check appropriate response) Natural gas Fuel oil Kerosene Electric Propane Solar Wood Coal
If hot water tank present, indicate fuel source: Boiler/furnace is located in: Basement Outdoors Main floor Other: Type of air conditioning: Central air Window units Open windows No mechanical system Is outside replacement (make-up) air provided for combustion appliances? Yes No
If no, explain:
Are there air distribution ducts present? Yes No Describe the supply and cold air return ductwork and its condition where visible, including whether there is a cold air return and the tightness of duct joints. Indicate the locations on the floor plan diagram:
Describe the type of mechanical ventilation systems used within or for the building (e.g., air-to-air exchangers, HVAC, etc.). Indicate whether the interior spaces of the building use separate ventilation systems and/or controls. Provide information on any existing building mitigation system (e.g., radon mitigation, passive venting systems, etc.). If available, provide information on air exchange rates for any existing mechanical ventilation systems currently in use.
6. Summary of potential building vapor intrusion entry pointsEarthen floors or incompetent floor slabs in the lowest level of building Yes No Sumps (unsealed) Yes No Large utility penetrations through floor and/or walls with exposure to sub-surface soils Yes No Crawl spaces with earthen floors or incompetent floor conditions Yes No Other (describe) Yes No
7. Is the use of the vapor intrusion attenuation factor (33X ISV screening level) valid for this building basedon the above building conditions? Yes No

Appendix D
www.pca.state.mn.us • 651-296-6300 • 800-657-3864 • Use your preferred realy service • Available in alternative formatsc-rem3-01a • 10/28/16 Page 4 of 8
8. Grid plansUse grid plans to describe floor plans, locate potential soil vapor entry points (e.g., cracks, utility ports, drains); and ifapplicable, identify sample locations (sub-slab, indoor air, outdoor air sampling).
Floor plan for basement or lowest level at property address:
Scale: North (indicate direction):
Appendix D
www.pca.state.mn.us • 651-296-6300 • 800-657-3864 • Use your preferred realy service • Available in alternative formatsc-rem3-01a • 10/28/16 Page 5 of 8
Floor above lowest level at property address:
Scale: North (indicate direction):
Appendix D
www.pca.state.mn.us • 651-296-6300 • 800-657-3864 • Use your preferred realy service • Available in alternative formatsc-rem3-01a • 10/28/16 Page 6 of 8
Outdoor grid plot (Include if outdoor ambient air samples collected): Insert sketch (or attach separate document) of the area outside the building and locate outdoor air sample locations. If applicable, provide information on spill locations, potential air contamination sources, locations of wells, septic system, etc., and PID meter readings. Indicate wind direction and speed during sampling.
Appendix D
www.pca.state.mn.us • 651-296-6300 • 800-657-3864 • Use your preferred realy service • Available in alternative formatsc-rem3-01a • 10/28/16 Page 7 of 8
Part 3: Indoor Air Quality Survey
Complete if indoor air sampling is conducted (use grids in Part 1 for labeling sampling locations). Factors that may influence indoor air quality: Is there an attached garage: Yes No Are petroleum-powered machines or vehicles stored in the garage (e.g., lawn mower, ATV, car): Yes No Please specify: Has the building ever had a fire: Yes No When: Is a kerosene or unvented gas space heater present: Yes No Where & type: Is there smoking in the building: Yes No How frequently: Have cleaning products been used recently: Yes No When & type: Have cosmetic products been used recently: Yes No When & type: Has painting/staining been done in the last 6 months: Yes No Where & when: Has any remodeling or construction occurred in the last 6 months: Yes No Where & when: Is there new carpet, drapes, or other textiles: Yes No Where & when: Have air fresheners been used recently: Yes No When & type:
Is there a clothes dryer: Yes No If yes, is it vented outside: Are there odors in the building: Yes No If yes, please describe:
Do any of the building occupants use solvents at work: Yes No If yes, what types of solvents are used:
Do any of the building occupants regularly use or work at a dry-cleaning service: Yes No
If yes, indicate approximately how frequent:
Product inventory form (Add additional rows if needed) Make and model of field instrument used: List specific products identified in the building that have the potential to affect indoor air quality (add or delete rows as needed):
Location Product description* Comments
Instrument readings if taken and units
* Describe the condition of the product containers as Unopened (UO), Used (U), or Deteriorated (D).Include photographs of product containers as appropriate to document products and ingredients.
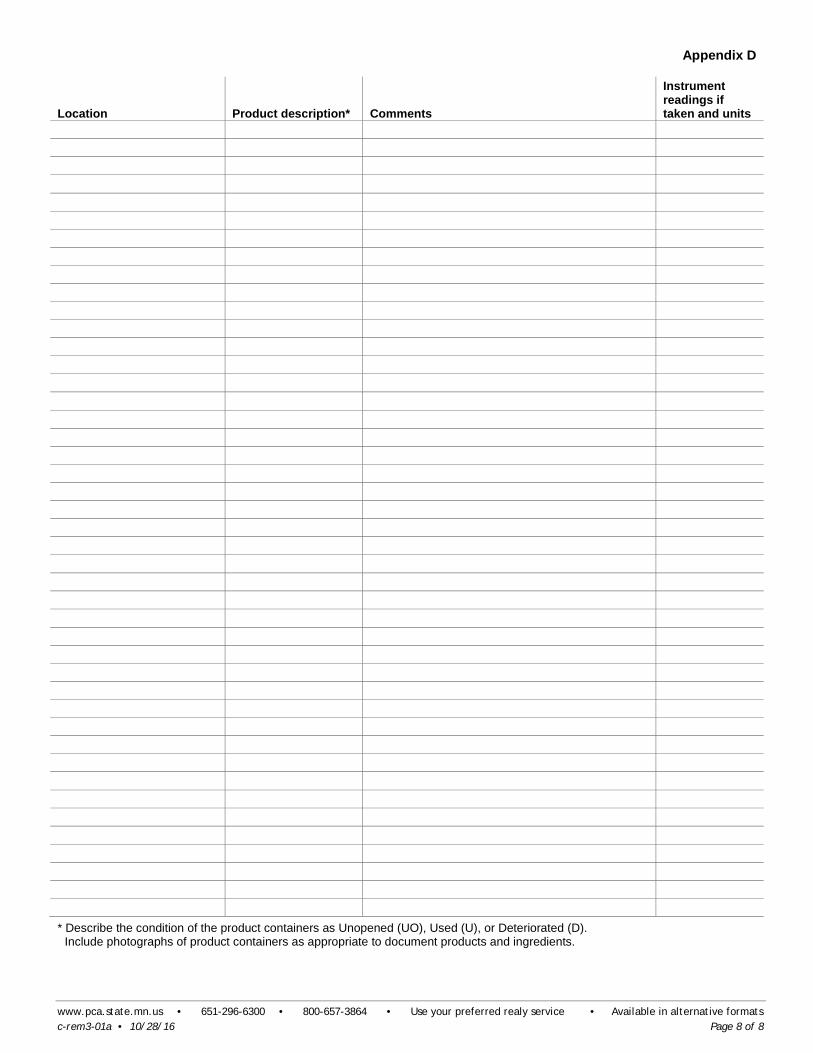
Appendix D
www.pca.state.mn.us • 651-296-6300 • 800-657-3864 • Use your preferred realy service • Available in alternative formatsc-rem3-01a • 10/28/16 Page 8 of 8
Location Product description* Comments
Instrument readings if taken and units
* Describe the condition of the product containers as Unopened (UO), Used (U), or Deteriorated (D).Include photographs of product containers as appropriate to document products and ingredients.

Interior Building Survey Inventory Form Property Address: Date/Time:
Technicians: Instrument Name: Serial Number: Instrument Name: Serial Number:
Location (Map ID & Description)
Temperature (oF) Instrument Reading
Air Velocity (ft/s) Instrument Reading
Photoionization Detector (ppb) Instrument Reading
A
B
C
D
E
F
G
H
I
J
K
L
M
N
O
P
Q
R
S
T
U
V
W
X
Y
Z

Product Inventory Form Property Address: Date/Time: Technicians:
Instrument Name: Serial Number:
Location (Map ID & Description)
Product Label/Marking Product Container Integrity*
Manufacture’s intended use of chemical Comments
Instrument Reading (ppb)
1
2
3
4
5
6
7
8
9
10
11
12
13
14
15
16
17
18
19
20
21
22
23
24
25
26
27
28
29
30
*Describe the condition of the product containers as Unopened (UO), Used (U), or Deteriorated (D). Include photographs of product containers as appropriate to document products and ingredients. Reference: MPCA Vapor Intrusion Interior Building Survey Form, Part 2

Indoor Air Sampling Procedure Via USEPA Method TO-15
Page 1 of 10

Indoor Air Sampling Procedure Via USEPA Method TO-15
Page 2 of 10

Indoor Air Sampling Procedure Via USEPA Method TO-15
Page 3 of 10
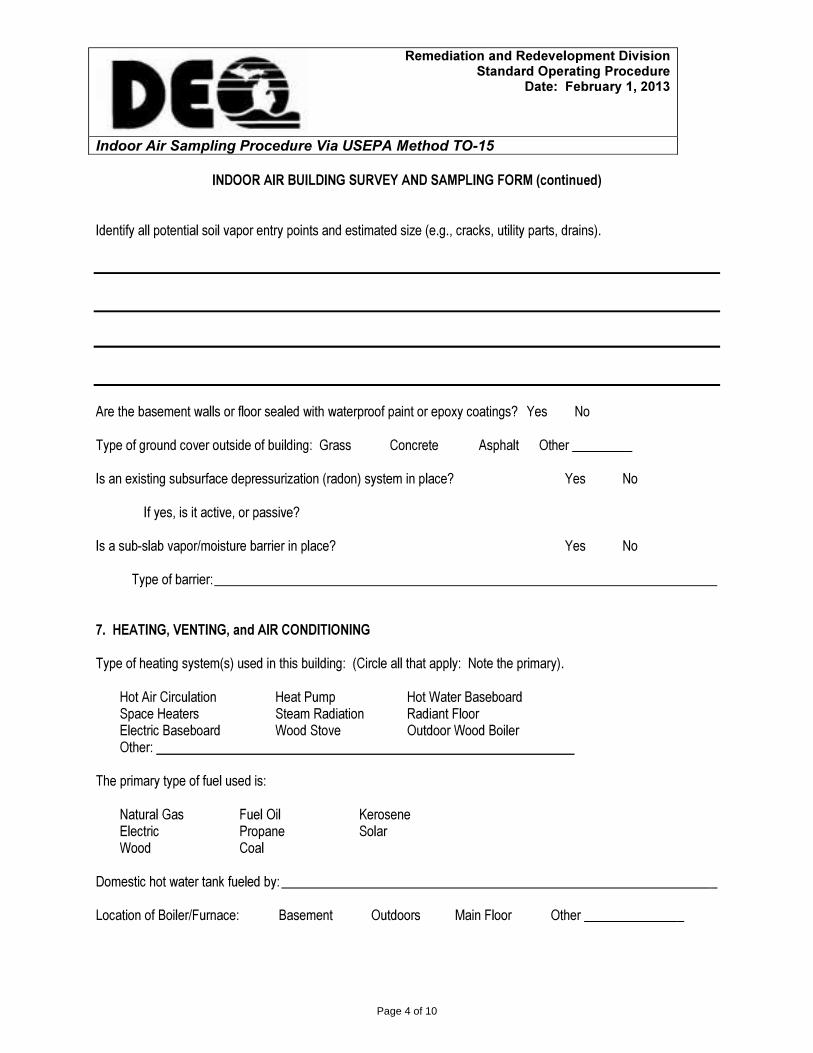
Indoor Air Sampling Procedure Via USEPA Method TO-15
Page 4 of 10

Indoor Air Sampling Procedure Via USEPA Method TO-15
Page 5 of 10

Indoor Air Sampling Procedure Via USEPA Method TO-15
Page 6 of 10

Indoor Air Sampling Procedure Via USEPA Method TO-15
Page 7 of 10

Indoor Air Sampling Procedure Via USEPA Method TO-15
Page 8 of 10
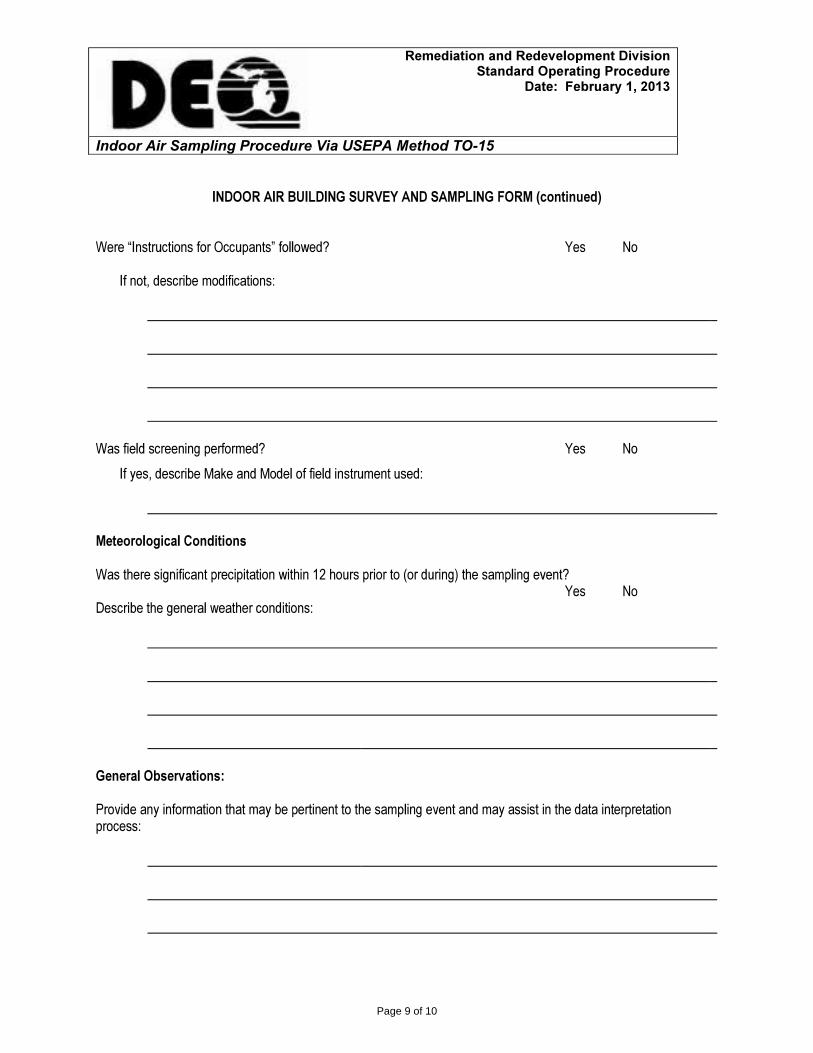
Indoor Air Sampling Procedure Via USEPA Method TO-15
Page 9 of 10

Indoor Air Sampling Procedure Via USEPA Method TO-15
Page 10 of 10

Indoor/Outdoor Air Sample Record
Sample Location Map:
Sample Type___ Indoor Air ___ Pre-mitigation ___ Outdoor Air ___ Post-mitigation___ Emissions Sample
Sample Collection Time___ Grab Sample ___ Time-weighted Sample - Target time: _______ hours
Sample Equipment Sample Information
Summa Canister ID #: Sample Height:
Flow Control ID #: Wind Direction:
Certification Batch #: Weather Conditions:
Certification Date: Temperature:
Canister Volume (L): Ambient Pressure:
Sample Collection Data
Sample Start Time: Sample Start Pressure:
Sample Stop Time: Sample Stop Pressure:
Start PID Measurement: Stop PID Measurement:
Sample information added to summa canister tag?
Photos of sample location taken
Interior Building Survey Completed, Date: ___________
Notes:
Building HVAC: ON OFF
Project Number:
Sample Date:
Sampling Technician(s):
Sample ID:

Standard Operating Procedure Decontamination of Sampling Equipment
Revision 2
October 6, 2020
Approved By:
John W. Juntilla 10/06/20 Print Technical Reviewer Signature Date
Michael Dupay 10/06/20 Print QA Manager Signature Date
Review of the SOP has been performed and the SOP still reflects current practice.
Initials: Date:
Initials: Date:
Initials: Date:
Initials: Date:

Decontamination of Sampling Equipment Page 2 of 5 Revision Date: 10/06/20
Printed Copy is Uncontrolled. Controlled copy is m
aintained on the internal Barr network. Print a new
copy each time a hard copy is required.
Decontamination of Sampling Equipment
1.0 Scope and Applicability The purpose of this Standard Operating Procedure (SOP) is to define the process used for decontaminating environmental sampling-related equipment including pumps, meters, and materials coming into contact with actual sampling equipment or with sampling personnel. This procedure is applicable to all personnel who are collecting samples and/or decontaminating sampling and field equipment.
The recommended procedures in this SOP should be followed unless conditions make it impractical or inappropriate to do so. Modifications should be noted in the applicable documentation and communicated to appropriate personnel. Significant changes may result in a revision or newly created SOP.
2.0 Limitations • Equipment used once and discarded such as bailers, protective gear, and filtration devices are not
part of this SOP.
3.0 Responsibilities The equipment technician is responsible for ensuring field equipment has been thoroughly decontaminated and prepared for use out in the field. The field technician(s) are responsible for decontamination in the field at each individual sampling point and for ensuring adherence to any investigative derived waste (IDW) project-specific requirements set forth in a QAPP or SAP (if applicable).
The role of the Field Safety Representative is to oversee on-site safety activities.
4.0 Safety Barr staff is responsible for implementing aspects of the job safely. Where available, refer to the appropriate Project Health and Safety Plan (PHASP) to determine the proper personal protection equipment (PPE) required when using this SOP. Barr staff is responsible for conducting all aspects of the job safely. When applicable, refer to the appropriate Project Health and Safety Plan (PHASP) to understand the hazards associated with suspected contamination, symptoms of exposure, methods to minimize exposure, personal protection equipment (PPE), and personal air monitoring required when using this SOP. Minimum protection of one pair of chemical resistant gloves (e.g., nitrile) and safety glasses with side shields should be worn to prevent sample contact with the skin and eyes. When sampling soils contaminated with corrosive materials, emergency eye flushing facilities should be available.
Some of the sample containers may require the use of preservatives. Consult the applicable Safety Data Sheet to review hazards and appropriate PPE to minimize exposure.
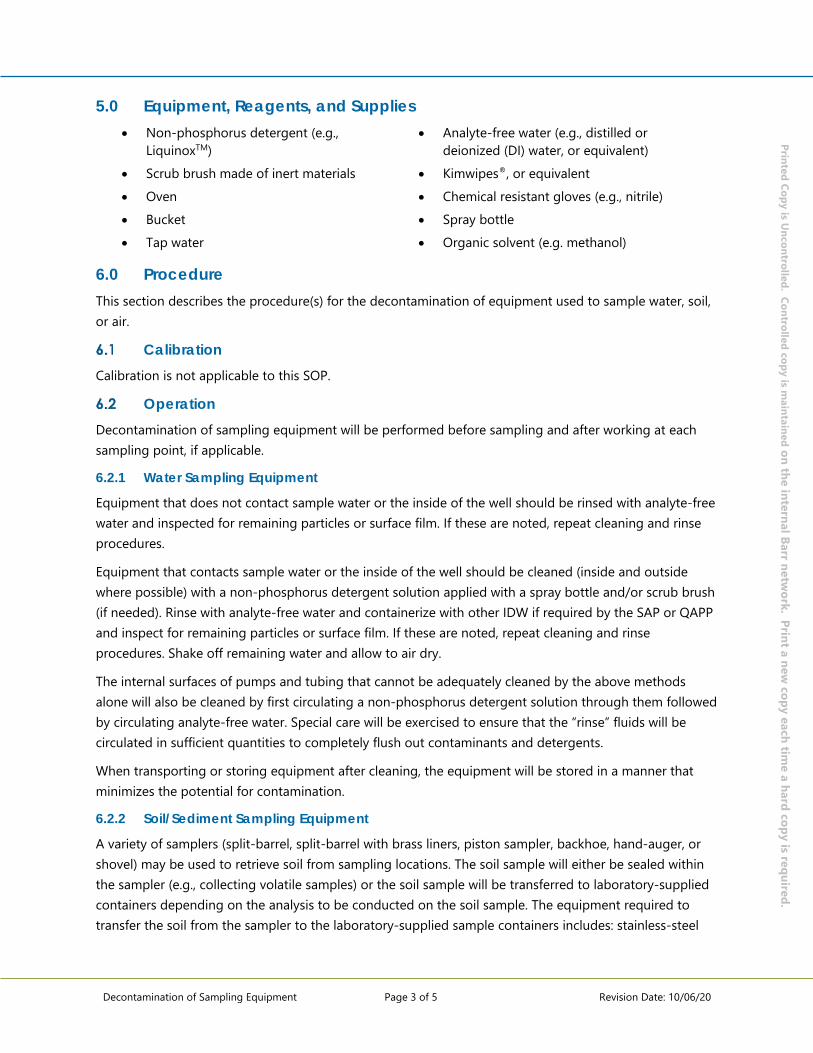
Decontamination of Sampling Equipment Page 3 of 5 Revision Date: 10/06/20
Printed Copy is Uncontrolled. Controlled copy is m
aintained on the internal Barr network. Print a new
copy each time a hard copy is required.
5.0 Equipment, Reagents, and Supplies • Non-phosphorus detergent (e.g.,
LiquinoxTM) • Analyte-free water (e.g., distilled or
deionized (DI) water, or equivalent) • Scrub brush made of inert materials • Kimwipes®, or equivalent • Oven • Chemical resistant gloves (e.g., nitrile) • Bucket • Spray bottle • Tap water • Organic solvent (e.g. methanol)
6.0 Procedure This section describes the procedure(s) for the decontamination of equipment used to sample water, soil, or air.
Calibration Calibration is not applicable to this SOP.
Operation Decontamination of sampling equipment will be performed before sampling and after working at each sampling point, if applicable.
6.2.1 Water Sampling Equipment
Equipment that does not contact sample water or the inside of the well should be rinsed with analyte-free water and inspected for remaining particles or surface film. If these are noted, repeat cleaning and rinse procedures.
Equipment that contacts sample water or the inside of the well should be cleaned (inside and outside where possible) with a non-phosphorus detergent solution applied with a spray bottle and/or scrub brush (if needed). Rinse with analyte-free water and containerize with other IDW if required by the SAP or QAPP and inspect for remaining particles or surface film. If these are noted, repeat cleaning and rinse procedures. Shake off remaining water and allow to air dry.
The internal surfaces of pumps and tubing that cannot be adequately cleaned by the above methods alone will also be cleaned by first circulating a non-phosphorus detergent solution through them followed by circulating analyte-free water. Special care will be exercised to ensure that the “rinse” fluids will be circulated in sufficient quantities to completely flush out contaminants and detergents.
When transporting or storing equipment after cleaning, the equipment will be stored in a manner that minimizes the potential for contamination.
6.2.2 Soil/Sediment Sampling Equipment
A variety of samplers (split-barrel, split-barrel with brass liners, piston sampler, backhoe, hand-auger, or shovel) may be used to retrieve soil from sampling locations. The soil sample will either be sealed within the sampler (e.g., collecting volatile samples) or the soil sample will be transferred to laboratory-supplied containers depending on the analysis to be conducted on the soil sample. The equipment required to transfer the soil from the sampler to the laboratory-supplied sample containers includes: stainless-steel

Decontamination of Sampling Equipment Page 4 of 5 Revision Date: 10/06/20
Printed Copy is Uncontrolled. Controlled copy is m
aintained on the internal Barr network. Print a new
copy each time a hard copy is required.
spoons or scoops and the appropriate personal protective equipment necessary for collection and handling of soil samples as described in the PHASP.
All soil sampling equipment, including split-barrels, stainless-steel spoons and scoops, will be carefully cleaned before and during sampling with a tap water and non-phosphorus detergent solution, using a brush if necessary to remove particulate matter and films. The equipment is then rinsed three times with tap water and/or three times with analyte-free water. Inspect equipment and repeat procedure if any residual soil or visible contaminants are present. Dry sampler with a Kimwipes®. Organic solvents (e.g., methanol) may be used to aid with desorbing organic material but should be kept to a minimum and must be collected and containerized if used.
At the completion of the work day, the samplers should be decontaminated following the procedure above and stored in a manner that minimizes the potential for contamination.
6.2.3 Air Sampling Equipment
For non-laboratory manifold equipment, methanol soak manifold components for a minimum of two hours. Remove from the methanol bath and place in an oven pre-heated to 90 °C and continue to heat manifold components for at least 3 hours or until interior and exterior surface inspections of the manifold components indicate that they are free of liquid methanol.
6.2.4 Handling
All equipment will be handled in a manner that minimizes cross-contamination between points. After cleaning, the equipment will be visibly inspected to detect any residues or other substances that may exist after normal cleaning. If inspection reveals that decontamination was insufficient, the decontamination procedures will be repeated.
Data Reduction/Calculations No data reduction or calculations are associated with this procedure.
Disposal IDW generated by this process will be disposed of in accordance with Federal, State and Local regulations and/or as required by project-specific SAP or Work Plan. Where reasonably feasible, technological changes have been implemented to minimize the potential for environmental pollution.
7.0 Quality Control and Quality Assurance (QA/QC) The QC activities described below allow the self-verification of the quality and consistency of the work.
QA/QC Samples Decontamination procedures may be monitored through the use of an equipment blank which consists of analyte-free water processed through non-disposable or non-dedicated aqueous or solid sampling equipment after equipment decontamination and before field sample collection. The equipment blank is analyzed for the same parameters as the samples at a project specific frequency (e.g., one per twenty samples).
Decontamination of Sampling Equipment Page 5 of 5 Revision Date: 10/06/20
Printed Copy is Uncontrolled. Controlled copy is m
aintained on the internal Barr network. Print a new
copy each time a hard copy is required.
Measurement Criteria Equipment blank results should be below the laboratory’s method detection limit or reporting limit (depending on the data quality objectives).
8.0 Records When required, the field technician(s) will document the field equipment decontamination procedures in a project dedicated field logbook or on field log data sheets.
Examples of common field documentation are available in Barr’s “Compendium of Field Documentation”. Field documentation is listed in the applicable sample collection SOP.
Field documentation and COC are provided to a Barr Data Management Administrator for storage on the internal Barr network.
Additional records information can be found in Barr’s “Records Management System Manual.”
Other Barr SOP subjects referenced within this SOP: collection of samples and investigative derived waste.
9.0 References ASTM. 2015. Standard Practice for Decontamination of Field Equipment Used at Waste Sites.
Standard Operating Procedure Documentation on a Chain-of-Custody (COC)
Revision 6
February 26, 2020
Approved By:
Andrea Nord 02/26/20 Print Technical Reviewer Signature Date
Terri Olson 02/26/20 Print QA Manager Signature Date
Review of the SOP has been performed and the SOP still reflects current practice.
Initials: Date:
Initials: Date:
Initials: Date:
Initials: Date:
Documentation on a COC Form Page 2 of 4 Revision Date: 02/26/20
Printed Copy is Uncontrolled. Controlled copy is m
aintained on the internal Barr network. Print a new
copy each time a hard copy is required.
Documentation on a Chain-of-Custody (COC)
1.0 Scope and Applicability The purpose of this procedure is to describe how to properly document information on a Chain-of-Custody (COC). A COC is a legally binding document that identifies sample identification, analyses required, and shows traceable possession of samples from the time they are obtained until they are introduced as evidence in legal proceedings. A Field Technician completes the information on the COC at the time he/she collects samples and the COC accompanies the samples during transport to a storage facility or to the laboratory for analysis.
The recommended procedures in this SOP should be followed unless conditions make it impractical or inappropriate to do so. Modifications should be noted in the applicable documentation and communicated to appropriate personnel. Significant changes may result in a revision or newly created SOP.
2.0 Limitations • The SOP does not apply to sample aliquots that are only collected for field screening purposes. • The SOP does not apply to samples remaining on-site.
3.0 Responsibilities Experienced Field Technicians are responsible for the proper sample identification and for accurate and complete documentation on the COC.
4.0 Procedure The COC is the most important sampling document; it must be filled out accurately and completely every time a sample is collected. The instructions below are specific to Barr’s COC for air canisters and Barr’s COC typically used for solid and liquid samples. The COC for air canisters is typically used when collecting soil gas, soil vapor, emissions, or indoor and outdoor air samples in an evacuated canister. The COC for solid and liquid samples is typically used when collecting matrices such as groundwater, surface water, drinking water, waste water, storm water, soil, sediment, oil, paint chips, bulk materials, etc. Information common to both COCs and specific to each COC are detailed below.
Some of the information on a COC may be filled out ahead of time (e.g., report and invoice recipient details, project number, project name, project manager, purchase order number, etc.) while other information should be completed during sampling. Complete one COC or more, as needed, for each set of project samples. The COC should be completed prior to leaving the sampling location.
Laboratory supplied COCs may be used but may differ in the information captured. The use of a Barr COC is recommended as it allows for more efficient data processing within Barr’s systems. If there are any questions, please contact a member of Barr’s Data Quality team.

Documentation on a COC Form Page 3 of 4 Revision Date: 02/26/20
Printed Copy is Uncontrolled. Controlled copy is m
aintained on the internal Barr network. Print a new
copy each time a hard copy is required.
The laboratory receiving the samples will sign the COC, record the date and time of sample receipt, assign a laboratory work order number, document sample condition, and document whether custody seals were used and if they were intact.
Common Chain-of-Custody Information • Barr office location managing the work. • Two digit identification for the state or province the samples originated from/sampled in. • COC numbered pages (e.g., 1 of 1). • Report and invoice recipient information. • Purchase order number (if applicable). • Barr project name and number. • Sample location. • Sample collection date and time. • Sample matrix abbreviation (see “Matrix Code” on COC). • Analysis requested. • Field Technician (i.e. sampler) name. • Barr Project Manager and project Data Quality (DQ) Manager names. • Laboratory name and location in which samples are to be relinquished. • Requested due date. • Signature of Field Technician (i.e. sampler) under the first ‘relinquished by’. • Signature of sample transferee. • Date and time of sample transfers. • Method of transport (ground courier, air carrier, sampler, etc.). • Air Bill number (if applicable).
Completing a Chain-of-Custody for Air Canisters Lab deliverable contents (based on project needs). • Canister serial # and size. • Flow controller serial #. • Initial and final vacuum measurement (in inches of mercury). • Start and stop times that the canister was drawing sample. • Total time calculated from the start and stop times. • Matrix code. • PID reading (indicate if ppm or ppb). • Sample comments (if any). • Identify the report deliverable contents and electronic data deliverable contents requested.

Documentation on a COC Form Page 4 of 4 Revision Date: 02/26/20
Printed Copy is Uncontrolled. Controlled copy is m
aintained on the internal Barr network. Print a new
copy each time a hard copy is required.
Completing a Chain-of Custody for Solid and Liquid Samples • Sample start and stop depth (if applicable) and unit of measurement (meter, feet, inches, etc.). • Information regarding whether to perform sample Matrix Spike (MS) and MS duplicate (MSD). • Container preservative type (see “Preservative Code” on COC). • Information regarding whether the sample was field filtered. • Number of each container type and the total number of containers for the sample. • Presence or absence of ice.
Distribution of the COC Pages Page one (white copy) accompanies the sample shipment to the laboratory and page two (yellow copy) is the Field Document copy. The Field Technician must scan and email a copy to the Barr Data Management Administrator for filing on Barr’s internal network project files. Alternatively, the yellow hardcopy may be routed to the Barr Data Management Administrator for electronic filing. This read-only electronic copy will be distributed to and available for use by the project team via Barr’s internal network project file access.
5.0 Quality Control and Quality Assurance (QA/QC) The Field Technician should review the COC for accurate and complete documentation.
6.0 Records Examples of common field documentation are available in Barr’s “Compendium of Field Documentation”. Field documentation specific to this SOP are listed below:
• Chain-of-Custody for Air Canisters • Chain-of-Custody
A copy of the COC is provided to a Barr Data Management Administrator for storage on the internal Barr network files.
Additional records information can be found in Barr’s “Records Management System Manual”.
7.0 References United States Environmental Protection Agency. 2002. Guidance for Quality Assurance Project Plans. EPA QA/G-5.
Standard Operating Procedure Domestic Transport of Samples to
Laboratories within the United States of America –
States and Territories
Revision 3
February 27, 2020
Approved By:
Andrea Nord 02/27/20 Print QA Manager Signature Date
Review of the SOP has been performed and the SOP still reflects current practice.
Initials: Date:
Initials: Date:
Initials: Date:
Initials: Date:
Domestic Transport of Samples to Labs Page 2 of 8 Revision Date: 02/27/20
Printed Copy is Uncontrolled. Controlled copy is m
aintained on the internal Barr network. Print a new
copy each time a hard copy is required.
Standard Operating Procedures for the Domestic Transport of Samples to the Laboratories within the United States of
America – States and Territories
1.0 Scope and Applicability The purpose of this Standard Operating Procedure (SOP) is to describe the procedures necessary for personal delivery or shipment of samples from locations within the United States of America (USA) and its territories to analytical laboratories located within the USA and its territories. This procedure applies to the transportation of ground and surface water, soil, wipe, sediment, paint chip, debris, air samples and their corresponding quality control samples to the appropriate laboratory. This SOP applies to samples that are classified as non-regulated, non-hazardous, or “Dangerous Goods in Excepted Quantities” samples prior to shipment.
Soil samples that are preserved with flammable chemicals (methanol) and unused sample vials containing flammable or corrosive chemical preservatives are examples of materials that are classified as “Dangerous Goods in Excepted Quantities”. Materials classified as Dangerous Goods in Excepted Quantities have limitations on the volume/weight of the material allowed in each shipment, and have additional packaging, labeling, and shipping requirements than non-regulated and non-hazardous samples and sampling media.
The recommended procedures in this SOP should be followed unless conditions make it impractical or inappropriate to do so. Modifications should be noted in the applicable documentation and communicated to appropriate personnel. Significant changes may result in a revision or newly created SOP.
2.0 Limitations • Maintaining proper sample temperatures (<6°C or ambient air temperature in accordance with
the analytical method requirements) and delivering samples to the laboratory within 24 to 48 hours from collection are primary concerns.
• This procedure does not apply to the transportation of samples to laboratories outside of the USA and its territories.
• This procedure does not apply to samples that are classified as “hazardous” according to USDOT, PHMSA, and/or RCRA and must be packaged, labeled, and/or transported in accordance with USDOT’s hazardous materials regulations (49 CFR Parts 100-180).
• This procedure does not apply to samples that are classified as “dangerous goods” and must follow the International Air Transportation Association’s (IATA) dangerous goods regulations (DGR) for packaging, labeling, and/or air transport.

Domestic Transport of Samples to Labs Page 3 of 8 Revision Date: 02/27/20
Printed Copy is Uncontrolled. Controlled copy is m
aintained on the internal Barr network. Print a new
copy each time a hard copy is required.
3.0 Responsibilities The field technician(s) shall ensure the security, temperature, and packaging of environmental samples during transport and shipment.
4.0 Safety Barr staff is responsible for conducting the aspects of the job safely. When applicable, refer to the appropriate Project Health and Safety Plan (PHASP) to understand the hazards associated with suspected contamination, symptoms of exposure, methods to minimize exposure, personal protective equipment (PPE), and personal air monitoring required when using this SOP. Minimum protection of one pair of chemical resistant gloves (e.g., nitrile) and safety glasses with side shields should be worn to prevent sample contact with the skin and eyes. When samples may be contaminated with corrosive materials, emergency eye flushing facilities should be available.
Some of the sample containers may require the use of chemical preservatives. Consult the applicable Safety Data Sheet to review hazards and appropriate PPE to minimize exposure.
5.0 Equipment, Reagents, and Supplies • Rigid cooler • Absorbent padding • Heavy bag for containing ice and
preventing leakage of melted water • Bubble-wrap/bubble bags (inner packing
material) • Ice • Ziploc® baggies • Packing tape • Shipping Airbill – if shipping via overnight
commercial courier service • Dangerous Goods in Excepted Quantities
Label with the number “8” added indicating the hazard class. This label must be used for coolers containing unused sample containers with corrosive preservative.
• Dangerous Goods in Excepted Quantities Label with the number “3” added indicating the hazard class. This label must be used for coolers containing methanol preservative
• Items listed in Section 8.0 Records
6.0 Procedure Packaging of non-regulated or non-hazardous samples requiring ambient air
temperature per the analytical method of analysis Sample matrices that do not require thermal preservation (ice) typically include wipe, paint chip, debris, and air samples. These samples may or may not require chemical preservatives depending upon the analytical method of analysis. The classification of “non-regulated” or “non-hazardous” in this context is based upon the nature of the sample prior to chemical preservation/fixation.
For samples that are stored at ambient air temperature, the samples will be placed in a jar, baggie or shipping carton (i.e. cooler, cardboard box, envelope) and accompanied with the proper COC.
Domestic Transport of Samples to Labs Page 4 of 8 Revision Date: 02/27/20
Printed Copy is Uncontrolled. Controlled copy is m
aintained on the internal Barr network. Print a new
copy each time a hard copy is required.
Place the samples in a shipping carton in a manner that will avoid breakage. Fill out the chain-of-custody (COC) completely and include required copies with the samples. Refer to Barr’s SOP ‘Documentation on a Chain-of-Custody (COC)’ for further information.
Once the shipping carton is packed to prevent samples breaking, the COC is signed off and placed in the cooler or box. Adhere two to three strips of packaging tape from top to bottom on the cooler or box.
Custody seals must be adhered over the shipping carton lid or enclosure if project quality assurance plan or sampling and analysis plan require them. The custody seal must be adhered to the crack of the lid on two opposing sides of the cooler or over the flap(s) of the box or envelope to ensure the carton remained shut and the contents have not been tampered with during transit.
Packaging of non-regulated or non-hazardous samples requiring thermal preservation per the analytical method of analysis
Samples matrices that require thermal preservation (ice) typically include water, soil and sediment samples. Glass containers should be packed in bubble wrap or other cushioning material to avoid breakage.
Note: Bubble-wrap is the preferred packing material.
Line a rigid plastic cooler (i.e. shipping container) with a strong plastic bag. This bag will serve as an outer liner and contain the wet ice, absorbent materials and sample containers.
Place samples and cushioning absorbent material inside the plastic bag and add enough absorbent padding to absorb the sample liquid within the package. Package ice in double-lined Ziploc® bags to ensure sample labels will not be compromised, and the cooler(s) will not leak melt water. Add enough ice to the cooler to maintain a constant temperature at ≤ 6 °C, (but not frozen) until the samples arrive at the laboratory. Zip tie the plastic bag shut.
Before sealing cooler, fill out the COC completely and include required copies with the samples. Refer to Barr’s SOP ‘Documentation on a Chain-of-Custody (COC)’ for further information.
Adhere two to three strips of packaging tape on the cooler from top to bottom, and adhere an additional strip of tape covering the gap between the lid and sides of cooler to seal the cooler to avoid leakage. Custody seals must be adhered on the cooler if project quality assurance plan or sampling and analysis plan require them. The custody seal must be adhered to the crack of the lid on two opposing sides of the cooler to ensure the contents have not been tampered with during transit.
Follow the labelling instructions in Section 6.4 of this SOP.
Domestic Transport of Samples to Labs Page 5 of 8 Revision Date: 02/27/20
Printed Copy is Uncontrolled. Controlled copy is m
aintained on the internal Barr network. Print a new
copy each time a hard copy is required.
Packaging of samples classified as “Dangerous Goods in Excepted Quantities” 6.3.1 Soil Samples Preserved with Methanol (Flammable) – Hazard Class 3
Soil samples that are preserved with flammable chemicals (methanol) are an example of materials that are classified as hazard class “3” “Dangerous Goods in Excepted Quantities”.
Follow the packaging instructions listed in Section 6.2 of this SOP with the following addition: Methanol sample containers must be placed in a Ziploc® Baggie to meet shipping requirements for preventing leakage.
Each cooler shall not exceed 500 mL of methanol (50 vials, 10 mL of methanol per vial) and each vial shall not have more than 10 mL of methanol to meet the requirements of a Dangerous Goods in Excepted Quantities. A label with the hazard class number “3” indicates the cooler contains flammable (or reactive/oxidizer) materials (in this case a flammable methanol sample preservative). Additional labeling instructions are found in Section 6.4.2 of this SOP.
6.3.2 Unused Sample Jars – Hazard Class 3 (Flammable) and Hazard Class 8 (Corrosive) Chemicals
Unused sample vials containing flammable or corrosive chemical preservatives are examples of materials that are classified as “Dangerous Goods in Excepted Quantities”.
Follow the packaging instructions listed in Section 6.2 of this SOP with the following additions:
Each chemical, may have a limitation as to the volume or weight of the chemical and the number of inner containers (sample containers) allowed within each outer shipping container (cooler) to meet the requirements of a Dangerous Goods in Excepted Quantities. A label with the hazard class number “3” indicates the cooler contains flammable (or reactive/oxidizer) materials (in this case a flammable methanol sample preservative). A label with the hazard class number “8” indicates the cooler contains a corrosive material (in this case an acid or base sample preservative). Additional labeling instructions are found in Section 6.4.2 of this SOP.
Labeling of Outer Shipping Container or Carton 6.4.1 Shipping Label
Attach the shipping address label to the top of the cooler or to the cooler handle tag. Attach a second label with the same information should also be attached with packaging tape to the cooler in event that the original label is damaged or destroyed during sample shipment.
Directional arrow labels (Figure 1) must also be attached to the outside of the cooler according to the hazardous materials shipping regulations. Directional arrow labels indicate the upright position during sample shipment.
Domestic Transport of Samples to Labs Page 6 of 8 Revision Date: 02/27/20
Printed Copy is Uncontrolled. Controlled copy is m
aintained on the internal Barr network. Print a new
copy each time a hard copy is required.
Figure 1 - Directional Arrows Label
6.4.2 Dangerous Goods in Excepted Quantities Label
When shipping materials classified as Dangerous Goods in Excepted Quantities, the cooler must have a Dangerous Goods in Excepted Quantities Label (Figure 2). This label is placed on two opposing sides of the cooler. The label indicates the hazard class number and the name and address of the shipper or consignee. In cases where the package contents have more than one hazard class assigned, the primary (most hazardous) hazard class is listed on the label. Table 1 includes a Summary of United Nations Hazard Classes.
Figure 2 - Dangerous Goods in Excepted Quantities Label
Footnotes:
(1) The “*” must be replaced by the primary hazard class, or when assigned, the division of each of the hazardous materials contained in the package.
(2) The “**” must be replaced by the name of the shipper or consignee if not shown elsewhere on the package.
*
**
Domestic Transport of Samples to Labs Page 7 of 8 Revision Date: 02/27/20
Printed Copy is Uncontrolled. Controlled copy is m
aintained on the internal Barr network. Print a new
copy each time a hard copy is required.
Table 1 – Summary of United Nations Hazard Classes
Class 1 Explosives Class 2 Gases Class 3 Flammable Liquids Class 4 Flammable Solids; Substances Liable to Spontaneous Combustion; Substances Which, in Contact with
Water, Emit Flammable Gases (e.g., soil sample contaminated with high concentrations of gasoline released from an underground storage tank)
Class 5 Oxidizing Substances and Organic Peroxide Class 6 Toxic and Infectious Substances (e.g., samples of refuse collected from a solid waste landfill) Class 7 Radioactive Material Class 8 Corrosives (e.g., nitric acid used for preservation of some groundwater samples) (see Note) Class 9 Miscellaneous Dangerous Goods
6.4.2.1 Dangerous Goods Air Waybill Statement and Shippers Declaration
A shipping paper (i.e. bill of lading) is not required when offering the cooler for air transport via a commercial courier service (e.g. Federal Express or United Parcel Service).
A document such as an air waybill accompanies a shipment that is transported by aircraft. The air waybill must include the statement “Dangerous Goods in Excepted Quantities” and indicate the number of packages associated with each air waybill. This phrase is typically written behind the Barr project number in the PO or comments section on the air waybill.
A shipper’s declaration for dangerous goods is also required. Some air waybills also have a box you must also check off that says “Dangerous Goods no Shipper’s Declaration Required”.
Transport/Delivery Options Account for the samples before shipping and compare to the COC. Refer to Barr’s SOP ‘Documentation on a Chain-of-Custody (COC) for further information. Ship samples during times when the laboratory will be able to accept and quickly analyze them. Whenever possible, select mode of transport/delivery to ensure delivery to the laboratory will occur with ample holding time remaining for the specified analytical methods required for the samples. Avoid sending samples during holidays and weekends. All Federal, State and Local shipping regulations must be met.
Personal Delivery. The samples are delivered to the laboratory by the field technician(s). The COC is signed and dated by the laboratory representative.
Ground Transport. The same procedures are followed as above; i.e., the COC is signed and dated and the top copy is sent with the samples. The cooler or box is then secured with packaging tape and a courier form is filled out for the designated laboratory. The cooler or box is then left in the services area for pickup via ground transport and delivery.
Air Transport. Follow the procedures above, replacing the courier form with the overnight courier air bill via Federal Express or United Parcel Service, for example. Include the date, project number, type of

Domestic Transport of Samples to Labs Page 8 of 8 Revision Date: 02/27/20
Printed Copy is Uncontrolled. Controlled copy is m
aintained on the internal Barr network. Print a new
copy each time a hard copy is required.
delivery service desired, parcel weight, number of coolers or boxes on the air bill. Also include the phrase “Dangerous Goods in Excepted Quantities”, when applicable.
7.0 Quality Control and Quality Assurance (QA/QC) Not Applicable.
8.0 Records Examples of common field documentation are available in Barr’s “Compendium of Field Documentation”.
Field documentation specific to this SOP are listed below:
• Chain-of-custody (COC) • Custody seal (if applicable) • Dangerous Goods in Excepted Quantities Label • Directional Arrow Label
COCs are provided to a Barr Data Management Administrator for storage on the internal Barr network.
Additional records information can be found in Barr’s “Records Management System Manual”.
Other Barr SOP subjects referenced within this SOP: documentation on a COC.
9.0 References 49 CFR Part 173.4a – Excepted Quantities October 1, 2011 Online https://www.govinfo.gov/app/details/CFR-2011-title49-vol2/CFR-2011-title49-vol2-sec173-4
ASTM International. 2015. ASTM Method D6911 – 15 Standard Guide for Packaging and Shipping Environmental Samples for Laboratory Analysis1. ASTM January 15, 2015.
Standard Operating Procedure YSI Model 556 Multi-Probe System (MPS)
Water Quality Monitoring System
Revision 7
March 20, 2020
Approved By:
Charity Gachne 03/20/20 Print Technical Reviewer Signature Date
Andrea Nord 03/20/20 Print QA Manager Signature Date
Review of the SOP has been performed and the SOP still reflects current practice.
Initials: Date:
Initials: Date:
Initials: Date:
Initials: Date:
YSI Model 556 MPS Page 2 of 10 Revision Date: 03/20/20
Printed Copy is Uncontrolled. Controlled copy is m
aintained on the internal Barr network. Print a new
copy each time a hard copy is required.
YSI Model 556 Multi-Probe System Water Quality Monitoring System
1.0 Scope and Applicability The purpose of this Standard Operating Procedure (SOP) is to clearly define the procedures required to accurately measure dissolved oxygen, conductivity, temperature, pH and oxidation reduction potential (ORP) in groundwater and surface water using the YSI Model 556 MPS water quality system.
The YSI 556 MPS (Multi-Probe System) is an easy-to-use hand-held unit. It includes a waterproof, impact-resistant case and it simultaneously measures dissolved oxygen, conductivity, temperature, pH and ORP.
Analysis Conductivity Oxidation Reduction Potential
pH Dissolved Oxygen
Temperature
Analytical Method
Standard Method 2510B
Standard Method 2580A
Standard Method 4500-H+ B
Standard Method 4500-O G
Standard Method 2550B
The recommended procedures in this SOP should be followed unless conditions make it impractical or inappropriate to do so. Modifications should be noted in the applicable documentation and communicated to appropriate personnel. Significant changes may result in a revision or newly created SOP.
2.0 Limitations • Procedures can vary by project as noted within the project scope of work and/or documentation
(e.g., Work Plan, Sampling Analysis Plan (SAP), or Quality Assurance Project Plan (QAPP)). • Decontamination of reusable equipment is required to prevent cross-contamination.
3.0 Responsibilities The Project Manager, in conjunction with the client, develops the site specific scope of work (e.g., Work Plan, SAP, etc.).
Experienced Field Technicians are responsible for the proper field equipment calibration, measurement, quality control procedures, and documentation of dissolved oxygen, conductivity, temperature, pH and ORP.
Equipment Technicians are responsible for maintaining equipment in working order and aiding in troubleshooting equipment issues.
The role of the Field Safety Representative is to oversee on-site safety activities.
4.0 Safety Barr staff is responsible for conducting aspects of the job safely. When applicable, refer to the appropriate Project Health and Safety Plan (PHASP) to understand the hazards associated with suspected contamination, symptoms of exposure, methods to minimize exposure, personal protective equipment (PPE), and personal air monitoring required when using this SOP. Minimum protection of one pair of chemical resistant gloves
YSI Model 556 MPS Page 3 of 10 Revision Date: 03/20/20
Printed Copy is Uncontrolled. Controlled copy is m
aintained on the internal Barr network. Print a new
copy each time a hard copy is required.
(e.g., nitrile) and safety glasses with side shields should be worn to prevent sample contact with the skin and eyes. When samples may be contaminated with corrosive materials, emergency eye flushing facilities should be available.
Consult the applicable Safety Data Sheet to review hazards involved with the calibration solutions and reagents listed in this SOP and to determine safe handling protocols and the appropriate PPE to minimize exposure.
5.0 Equipment, Reagents, and Supplies
• YSI Model 556 meter • pH buffer 4.0, Field Environmental Instruments, Inc. catalog #FEI12280-1
• O-ring lubricant • pH buffer 7.0, Field Environmental Instruments, Inc. catalog #FEI12380-1
• Four alkaline “C” batteries • pH buffer 10.0, Field Environmental Instruments, Inc. catalog #FEI12510-1
• Mild detergent
• Lint-free lab wipes
• Conductivity (1409 µmhos/cm @ 25 °C), Field Environmental Instruments, Inc. catalog #FEI18780-1
• Screwdrivers • Zobell standard, YSI 3682, Fondriest catalog #61320
• Calibration/Storage Cups • Items listed in Section 8.0 Records
• Moist Sponges • Decontamination supplies (see Decon SOP)
6.0 Procedure This section below describes the procedures and equipment used for measuring dissolved oxygen, conductivity, temperature, pH and ORP in groundwater and surface water.
Maintenance/Installation 6.1.1 Instrument
The 556 requires occasional battery replacement and cleaning. Four alkaline “C” cells in the 556 provide approximately 180 hours of operation. Battery life is displayed on the keypad and the batteries should be changed when it is low.
a. Loosen the four screws in the battery lid on the back of the instrument. b. Insert four “C” batteries in the clips following the polarity labels on the bottom of the battery
compartment. c. Check the gasket for proper placement and place the lid. d. Do not over tighten the screws. e. Clean the display pad with a mild detergent and water solution. f. Wipe the solution on and off. g. Follow with a clean water wipe.
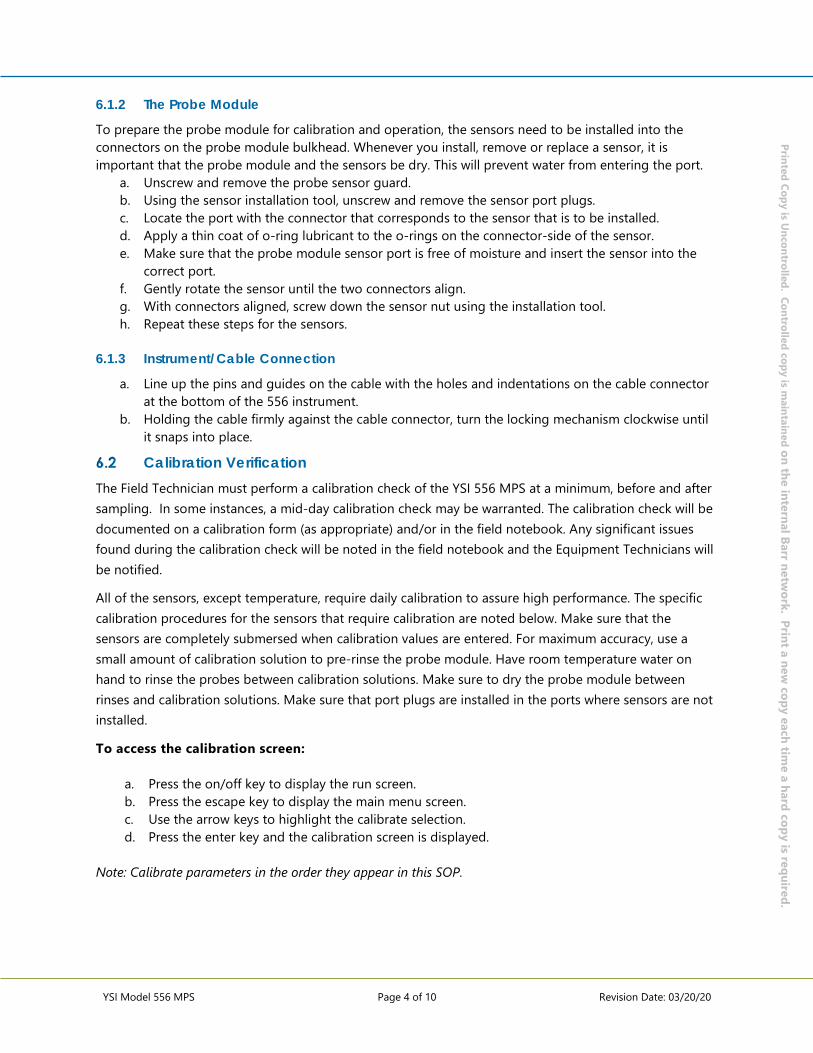
YSI Model 556 MPS Page 4 of 10 Revision Date: 03/20/20
Printed Copy is Uncontrolled. Controlled copy is m
aintained on the internal Barr network. Print a new
copy each time a hard copy is required.
6.1.2 The Probe Module
To prepare the probe module for calibration and operation, the sensors need to be installed into the connectors on the probe module bulkhead. Whenever you install, remove or replace a sensor, it is important that the probe module and the sensors be dry. This will prevent water from entering the port.
a. Unscrew and remove the probe sensor guard. b. Using the sensor installation tool, unscrew and remove the sensor port plugs. c. Locate the port with the connector that corresponds to the sensor that is to be installed. d. Apply a thin coat of o-ring lubricant to the o-rings on the connector-side of the sensor. e. Make sure that the probe module sensor port is free of moisture and insert the sensor into the
correct port. f. Gently rotate the sensor until the two connectors align. g. With connectors aligned, screw down the sensor nut using the installation tool. h. Repeat these steps for the sensors.
6.1.3 Instrument/Cable Connection
a. Line up the pins and guides on the cable with the holes and indentations on the cable connector at the bottom of the 556 instrument.
b. Holding the cable firmly against the cable connector, turn the locking mechanism clockwise until it snaps into place.
Calibration Verification The Field Technician must perform a calibration check of the YSI 556 MPS at a minimum, before and after sampling. In some instances, a mid-day calibration check may be warranted. The calibration check will be documented on a calibration form (as appropriate) and/or in the field notebook. Any significant issues found during the calibration check will be noted in the field notebook and the Equipment Technicians will be notified.
All of the sensors, except temperature, require daily calibration to assure high performance. The specific calibration procedures for the sensors that require calibration are noted below. Make sure that the sensors are completely submersed when calibration values are entered. For maximum accuracy, use a small amount of calibration solution to pre-rinse the probe module. Have room temperature water on hand to rinse the probes between calibration solutions. Make sure to dry the probe module between rinses and calibration solutions. Make sure that port plugs are installed in the ports where sensors are not installed.
To access the calibration screen:
a. Press the on/off key to display the run screen. b. Press the escape key to display the main menu screen. c. Use the arrow keys to highlight the calibrate selection. d. Press the enter key and the calibration screen is displayed.
Note: Calibrate parameters in the order they appear in this SOP.
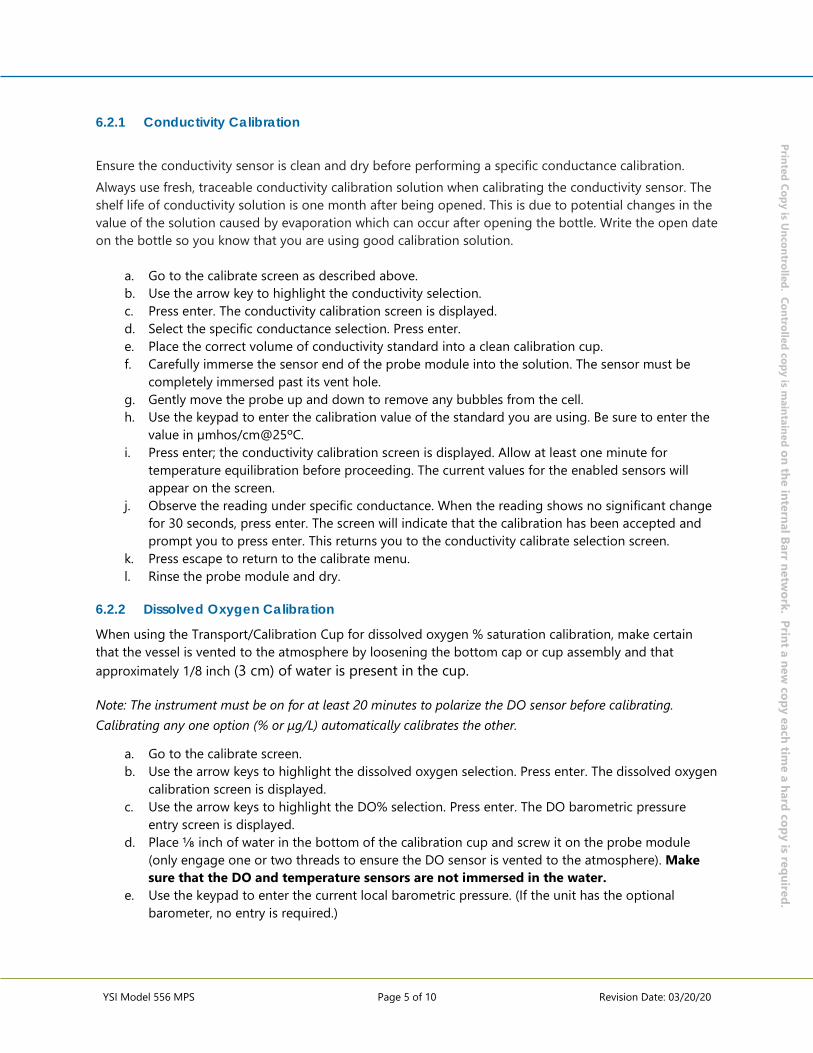
YSI Model 556 MPS Page 5 of 10 Revision Date: 03/20/20
Printed Copy is Uncontrolled. Controlled copy is m
aintained on the internal Barr network. Print a new
copy each time a hard copy is required.
6.2.1 Conductivity Calibration
Ensure the conductivity sensor is clean and dry before performing a specific conductance calibration. Always use fresh, traceable conductivity calibration solution when calibrating the conductivity sensor. The shelf life of conductivity solution is one month after being opened. This is due to potential changes in the value of the solution caused by evaporation which can occur after opening the bottle. Write the open date on the bottle so you know that you are using good calibration solution.
a. Go to the calibrate screen as described above. b. Use the arrow key to highlight the conductivity selection. c. Press enter. The conductivity calibration screen is displayed. d. Select the specific conductance selection. Press enter. e. Place the correct volume of conductivity standard into a clean calibration cup. f. Carefully immerse the sensor end of the probe module into the solution. The sensor must be
completely immersed past its vent hole. g. Gently move the probe up and down to remove any bubbles from the cell. h. Use the keypad to enter the calibration value of the standard you are using. Be sure to enter the
value in µmhos/cm@25ºC. i. Press enter; the conductivity calibration screen is displayed. Allow at least one minute for
temperature equilibration before proceeding. The current values for the enabled sensors will appear on the screen.
j. Observe the reading under specific conductance. When the reading shows no significant change for 30 seconds, press enter. The screen will indicate that the calibration has been accepted and prompt you to press enter. This returns you to the conductivity calibrate selection screen.
k. Press escape to return to the calibrate menu. l. Rinse the probe module and dry.
6.2.2 Dissolved Oxygen Calibration
When using the Transport/Calibration Cup for dissolved oxygen % saturation calibration, make certain that the vessel is vented to the atmosphere by loosening the bottom cap or cup assembly and that approximately 1/8 inch (3 cm) of water is present in the cup.
Note: The instrument must be on for at least 20 minutes to polarize the DO sensor before calibrating. Calibrating any one option (% or µg/L) automatically calibrates the other.
a. Go to the calibrate screen. b. Use the arrow keys to highlight the dissolved oxygen selection. Press enter. The dissolved oxygen
calibration screen is displayed. c. Use the arrow keys to highlight the DO% selection. Press enter. The DO barometric pressure
entry screen is displayed. d. Place ⅛ inch of water in the bottom of the calibration cup and screw it on the probe module
(only engage one or two threads to ensure the DO sensor is vented to the atmosphere). Make sure that the DO and temperature sensors are not immersed in the water.
e. Use the keypad to enter the current local barometric pressure. (If the unit has the optional barometer, no entry is required.)
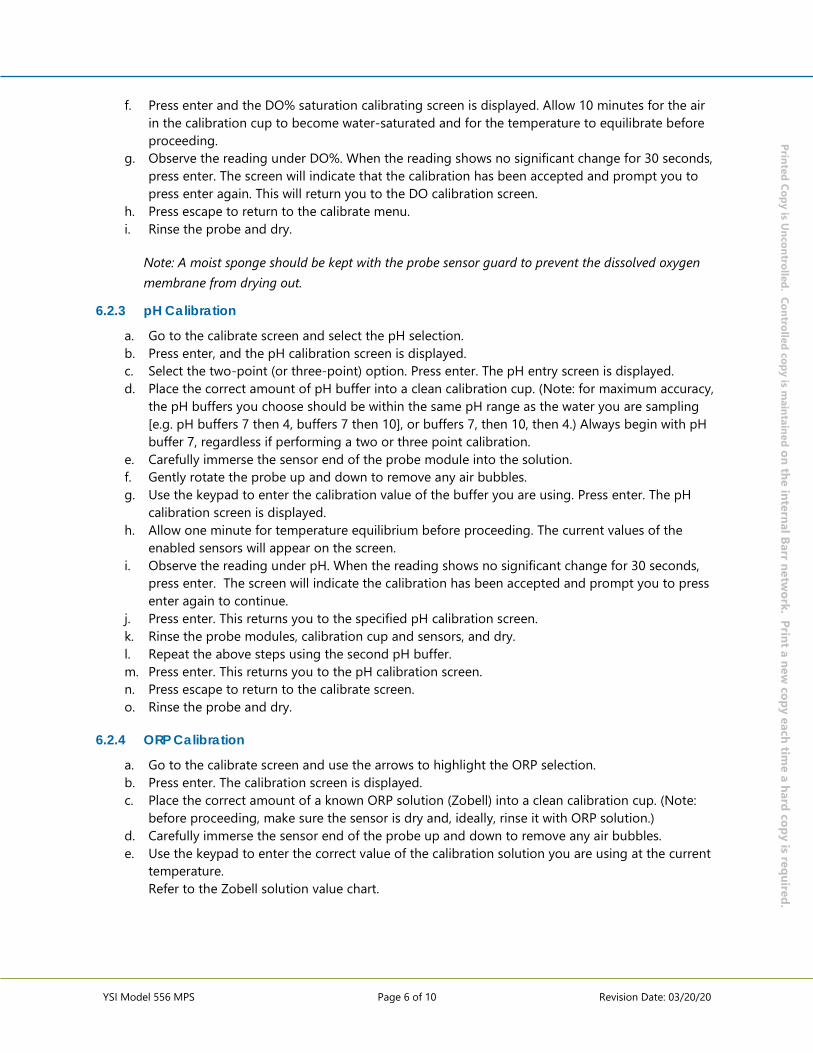
YSI Model 556 MPS Page 6 of 10 Revision Date: 03/20/20
Printed Copy is Uncontrolled. Controlled copy is m
aintained on the internal Barr network. Print a new
copy each time a hard copy is required.
f. Press enter and the DO% saturation calibrating screen is displayed. Allow 10 minutes for the air in the calibration cup to become water-saturated and for the temperature to equilibrate before proceeding.
g. Observe the reading under DO%. When the reading shows no significant change for 30 seconds, press enter. The screen will indicate that the calibration has been accepted and prompt you to press enter again. This will return you to the DO calibration screen.
h. Press escape to return to the calibrate menu. i. Rinse the probe and dry.
Note: A moist sponge should be kept with the probe sensor guard to prevent the dissolved oxygen membrane from drying out.
6.2.3 pH Calibration
a. Go to the calibrate screen and select the pH selection. b. Press enter, and the pH calibration screen is displayed. c. Select the two-point (or three-point) option. Press enter. The pH entry screen is displayed. d. Place the correct amount of pH buffer into a clean calibration cup. (Note: for maximum accuracy,
the pH buffers you choose should be within the same pH range as the water you are sampling [e.g. pH buffers 7 then 4, buffers 7 then 10], or buffers 7, then 10, then 4.) Always begin with pH buffer 7, regardless if performing a two or three point calibration.
e. Carefully immerse the sensor end of the probe module into the solution. f. Gently rotate the probe up and down to remove any air bubbles. g. Use the keypad to enter the calibration value of the buffer you are using. Press enter. The pH
calibration screen is displayed. h. Allow one minute for temperature equilibrium before proceeding. The current values of the
enabled sensors will appear on the screen. i. Observe the reading under pH. When the reading shows no significant change for 30 seconds,
press enter. The screen will indicate the calibration has been accepted and prompt you to press enter again to continue.
j. Press enter. This returns you to the specified pH calibration screen. k. Rinse the probe modules, calibration cup and sensors, and dry. l. Repeat the above steps using the second pH buffer. m. Press enter. This returns you to the pH calibration screen. n. Press escape to return to the calibrate screen. o. Rinse the probe and dry.
6.2.4 ORP Calibration
a. Go to the calibrate screen and use the arrows to highlight the ORP selection. b. Press enter. The calibration screen is displayed. c. Place the correct amount of a known ORP solution (Zobell) into a clean calibration cup. (Note:
before proceeding, make sure the sensor is dry and, ideally, rinse it with ORP solution.) d. Carefully immerse the sensor end of the probe up and down to remove any air bubbles. e. Use the keypad to enter the correct value of the calibration solution you are using at the current
temperature. Refer to the Zobell solution value chart.
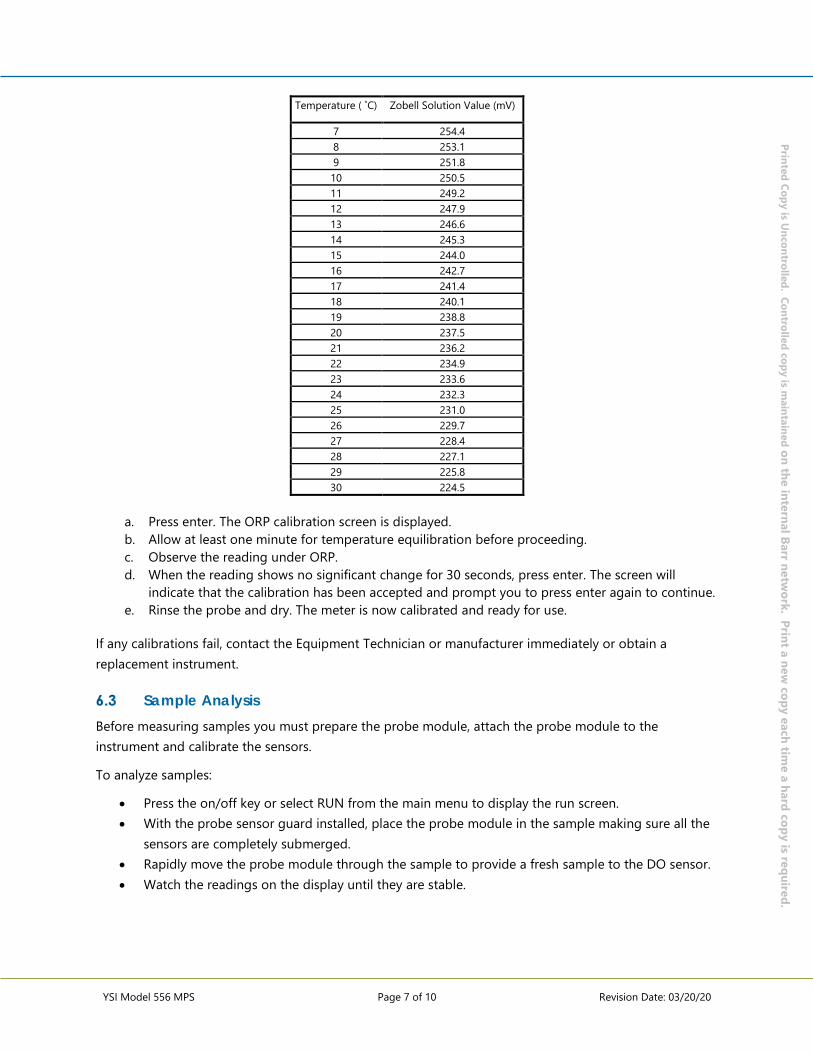
YSI Model 556 MPS Page 7 of 10 Revision Date: 03/20/20
Printed Copy is Uncontrolled. Controlled copy is m
aintained on the internal Barr network. Print a new
copy each time a hard copy is required.
Temperature ( ˚C) Zobell Solution Value (mV)
7 254.4 8 253.1 9 251.8 10 250.5 11 249.2 12 247.9 13 246.6 14 245.3 15 244.0 16 242.7 17 241.4 18 240.1 19 238.8 20 237.5 21 236.2 22 234.9 23 233.6 24 232.3 25 231.0 26 229.7 27 228.4 28 227.1 29 225.8 30 224.5
a. Press enter. The ORP calibration screen is displayed. b. Allow at least one minute for temperature equilibration before proceeding. c. Observe the reading under ORP. d. When the reading shows no significant change for 30 seconds, press enter. The screen will
indicate that the calibration has been accepted and prompt you to press enter again to continue. e. Rinse the probe and dry. The meter is now calibrated and ready for use.
If any calibrations fail, contact the Equipment Technician or manufacturer immediately or obtain a replacement instrument.
Sample Analysis Before measuring samples you must prepare the probe module, attach the probe module to the instrument and calibrate the sensors.
To analyze samples:
• Press the on/off key or select RUN from the main menu to display the run screen. • With the probe sensor guard installed, place the probe module in the sample making sure all the
sensors are completely submerged. • Rapidly move the probe module through the sample to provide a fresh sample to the DO sensor. • Watch the readings on the display until they are stable.
YSI Model 556 MPS Page 8 of 10 Revision Date: 03/20/20
Printed Copy is Uncontrolled. Controlled copy is m
aintained on the internal Barr network. Print a new
copy each time a hard copy is required.
6.3.1 Interferences
Rinse the probe sensors between instrument readings with water and dab dry to ensure accurate results.
Data Processing To upload data to your PC, you must install EcoWatch for Windows to your PC.
• Connect the YSI 556 to a serial (COMM) port of your computer using the 655173 PC interface cable.
• Open EcoWatch on your PC. • Click on the sonde/probe icon in the upper toolbar. • Set the Comm port number to match the port the YSI 556 MPS is connected to. • Go to the YSI 556 MPS file screen and use the arrow keys to highlight the Upload to PC selection. • Press Enter. The file list is displayed. • Use the arrow keys to highlight the .DAT file you want to transfer. • Press Enter. You will see the displays’ transfer progress. • After the file transfer is complete, close the terminal window (the smaller window on your PC) by
clicking the “X” at its upper right corner. • Press the Escape key on the YSI 556 MPS until you reach the main menu.
Data Calculations 6.5.1 Field Replicate
Field replicate results are evaluated by calculating the Relative Percent Difference (RPD) value. The RPD formula is as follows:
𝑅𝑅𝑅𝑅𝑅𝑅 = |𝑆𝑆 − 𝑅𝑅|
(𝑆𝑆 + 𝑅𝑅)/2 𝑥𝑥 100
Where: RPD = relative percent difference S = first replicate result D = second replicate result
6.5.2 Calibration Check
The percent difference is calculated using the following equation:
%𝑅𝑅 = |𝑇𝑇𝑇𝑇 −𝑀𝑀𝑅𝑅|
𝑇𝑇𝑇𝑇 𝑥𝑥 100
Where: %D = % difference TV = calibration check true value MR = measured result
Disposal Waste generated by this process will be disposed of in accordance with Federal, State and Local regulations and Barr’s SOP ‘Investigative Derived Waste’. Where reasonably feasible, technological changes have been implemented to minimize the potential for environmental pollution.
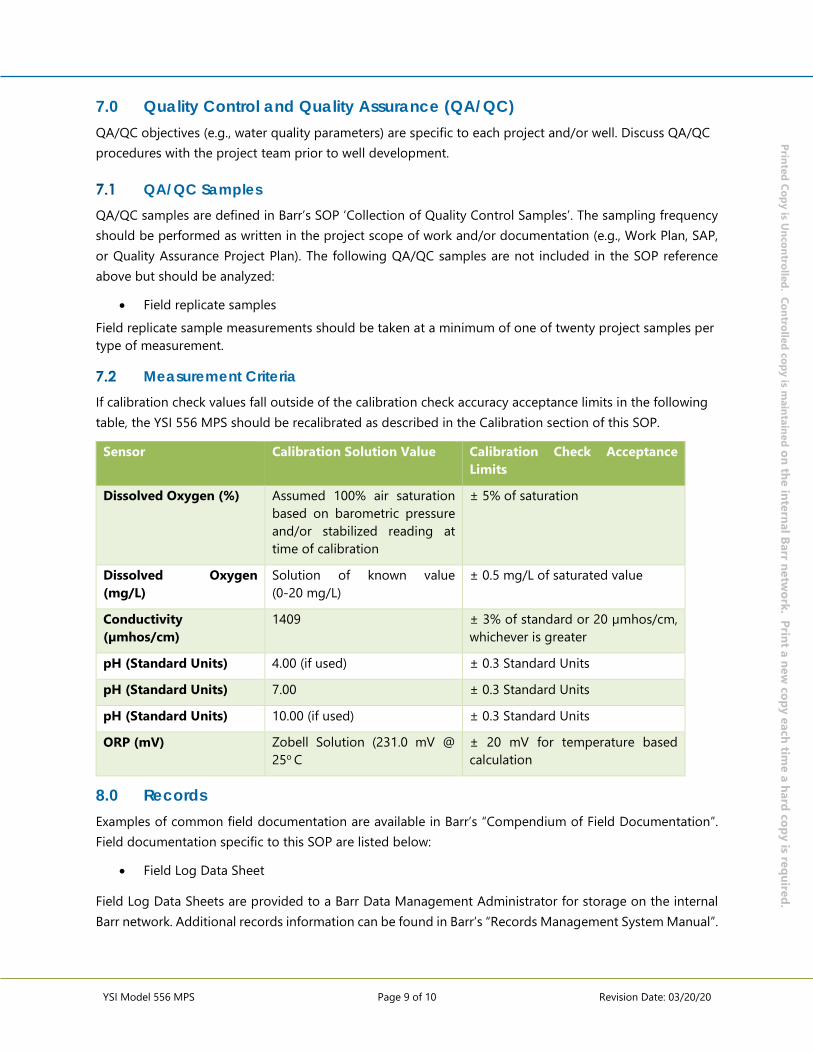
YSI Model 556 MPS Page 9 of 10 Revision Date: 03/20/20
Printed Copy is Uncontrolled. Controlled copy is m
aintained on the internal Barr network. Print a new
copy each time a hard copy is required.
7.0 Quality Control and Quality Assurance (QA/QC) QA/QC objectives (e.g., water quality parameters) are specific to each project and/or well. Discuss QA/QC procedures with the project team prior to well development.
QA/QC Samples QA/QC samples are defined in Barr’s SOP ‘Collection of Quality Control Samples’. The sampling frequency should be performed as written in the project scope of work and/or documentation (e.g., Work Plan, SAP, or Quality Assurance Project Plan). The following QA/QC samples are not included in the SOP reference above but should be analyzed:
• Field replicate samples Field replicate sample measurements should be taken at a minimum of one of twenty project samples per type of measurement.
Measurement Criteria If calibration check values fall outside of the calibration check accuracy acceptance limits in the following table, the YSI 556 MPS should be recalibrated as described in the Calibration section of this SOP.
Sensor Calibration Solution Value Calibration Check Acceptance Limits
Dissolved Oxygen (%) Assumed 100% air saturation based on barometric pressure and/or stabilized reading at time of calibration
± 5% of saturation
Dissolved Oxygen (mg/L)
Solution of known value (0-20 mg/L)
± 0.5 mg/L of saturated value
Conductivity (µmhos/cm)
1409 ± 3% of standard or 20 µmhos/cm, whichever is greater
pH (Standard Units) 4.00 (if used) ± 0.3 Standard Units
pH (Standard Units) 7.00 ± 0.3 Standard Units
pH (Standard Units) 10.00 (if used) ± 0.3 Standard Units
ORP (mV) Zobell Solution (231.0 mV @ 25o C
± 20 mV for temperature based calculation
8.0 Records Examples of common field documentation are available in Barr’s “Compendium of Field Documentation”. Field documentation specific to this SOP are listed below:
• Field Log Data Sheet
Field Log Data Sheets are provided to a Barr Data Management Administrator for storage on the internal Barr network. Additional records information can be found in Barr’s “Records Management System Manual”.
YSI Model 556 MPS Page 10 of 10 Revision Date: 03/20/20
Printed Copy is Uncontrolled. Controlled copy is m
aintained on the internal Barr network. Print a new
copy each time a hard copy is required.
Other Barr SOP subjects referenced within this SOP: collection of QC samples, decontamination of sampling equipment, and investigative derived waste.
9.0 References YSI Model 556 MPS Water Quality System Operations Manual
Website: www.ysi.com/productsdetail.php?556MPS-21
Appendix B
Barr QA/QC Water Quality Data Standard Operating Procedures
Updated 01/30/2020
Compendium
Of
Data Quality Assessment Documentation
Barr DQ Assessment Definitions January 29, 2020
Barr DQ Assessment Definitions
Accuracy: Accuracy is the degree of agreement between an observed value and an accepted reference value. Accuracy measures the bias in a measurement system. Accuracy of laboratory results may be assessed using the analytical results of method blanks, field blanks, reagent/preparation blank, matrix spike/matrix spike duplicate samples and laboratory control samples. The percent recovery for (%R) matrix spikes and laboratory control samples will be calculated using the following equation:
Where: %R = % recovery SSR = spiked sample result SR = sample result SA = spike added to native sample
NOTE: In the case of LCS and other laboratory-prepared samples, SR is zero.
Batch: Group of samples of the same matrix prepared for single or multiple analyses that will be analyzed during one operation at a given specific time frame. Typical size is 1-20 samples.
Blank: Blank samples are used to monitor for potential contamination and may consist of laboratory method, field, equipment, rinsate, and trip blank samples. Each of these measure different potential sources of contamination. When collecting a blank for dissolved parameters, the blank water sample should be filtered before adding it to the sample container.
Calibration: Calibration is the process of checking, adjusting or determining by comparison under specified conditions an instrument’s response to standards for each target compound to be analyzed. The source and accuracy of standards used for this purpose are integral to obtaining the best quality data.
Contamination: A component of a sample or an extract that is not representative of the environmental source of the sample. Contamination may stem from other samples, sampling equipment, while in transit, from laboratory reagents, laboratory environment, or analytical instruments.
Data Quality Specialist: An individual that is part of the Data Quality group at Barr Engineering and may be referred to as a Quality Assurance Manager, Quality Assurance Officer, or Quality Manager within Quality Assurance Project Plans or other project documentation.
Duplicate: A second aliquot of a sample that is treated the same as the original sample in order to determine the precision of the method.
Equipment Blank (EB): A sample of analyte-free water that has been collected after field decontamination of sampling equipment (e.g., bailer or pump, hand-trowel and bowl) and prior to sampling the next location. It measures the potential for sample cross contamination due to insufficient decontamination. An equipment blank is not collected from disposable or dedicated equipment.
Note: Prior to May 2019, the terms ‘Equipment Blank’ and ‘Rinsate Blank’ were used interchangeably and carried the same definition. To help better define the blank being collected, the term ‘Rinsate Blank’ is defined as listed below.
100% ×−
=SA
SRSSRR
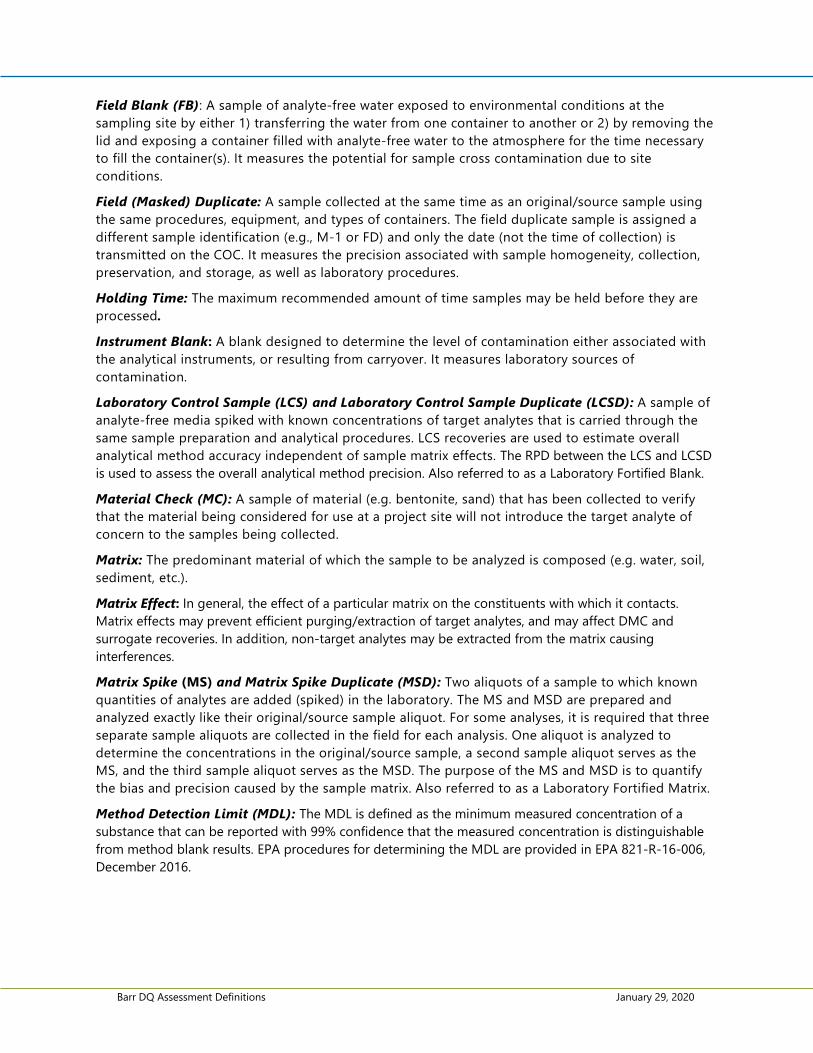
Barr DQ Assessment Definitions January 29, 2020
Field Blank (FB): A sample of analyte-free water exposed to environmental conditions at the sampling site by either 1) transferring the water from one container to another or 2) by removing the lid and exposing a container filled with analyte-free water to the atmosphere for the time necessary to fill the container(s). It measures the potential for sample cross contamination due to site conditions.
Field (Masked) Duplicate: A sample collected at the same time as an original/source sample using the same procedures, equipment, and types of containers. The field duplicate sample is assigned a different sample identification (e.g., M-1 or FD) and only the date (not the time of collection) is transmitted on the COC. It measures the precision associated with sample homogeneity, collection, preservation, and storage, as well as laboratory procedures.
Holding Time: The maximum recommended amount of time samples may be held before they are processed.
Instrument Blank: A blank designed to determine the level of contamination either associated with the analytical instruments, or resulting from carryover. It measures laboratory sources of contamination.
Laboratory Control Sample (LCS) and Laboratory Control Sample Duplicate (LCSD): A sample of analyte-free media spiked with known concentrations of target analytes that is carried through the same sample preparation and analytical procedures. LCS recoveries are used to estimate overall analytical method accuracy independent of sample matrix effects. The RPD between the LCS and LCSD is used to assess the overall analytical method precision. Also referred to as a Laboratory Fortified Blank.
Material Check (MC): A sample of material (e.g. bentonite, sand) that has been collected to verify that the material being considered for use at a project site will not introduce the target analyte of concern to the samples being collected.
Matrix: The predominant material of which the sample to be analyzed is composed (e.g. water, soil, sediment, etc.).
Matrix Effect: In general, the effect of a particular matrix on the constituents with which it contacts. Matrix effects may prevent efficient purging/extraction of target analytes, and may affect DMC and surrogate recoveries. In addition, non-target analytes may be extracted from the matrix causing interferences.
Matrix Spike (MS) and Matrix Spike Duplicate (MSD): Two aliquots of a sample to which known quantities of analytes are added (spiked) in the laboratory. The MS and MSD are prepared and analyzed exactly like their original/source sample aliquot. For some analyses, it is required that three separate sample aliquots are collected in the field for each analysis. One aliquot is analyzed to determine the concentrations in the original/source sample, a second sample aliquot serves as the MS, and the third sample aliquot serves as the MSD. The purpose of the MS and MSD is to quantify the bias and precision caused by the sample matrix. Also referred to as a Laboratory Fortified Matrix.
Method Detection Limit (MDL): The MDL is defined as the minimum measured concentration of a substance that can be reported with 99% confidence that the measured concentration is distinguishable from method blank results. EPA procedures for determining the MDL are provided in EPA 821-R-16-006, December 2016.
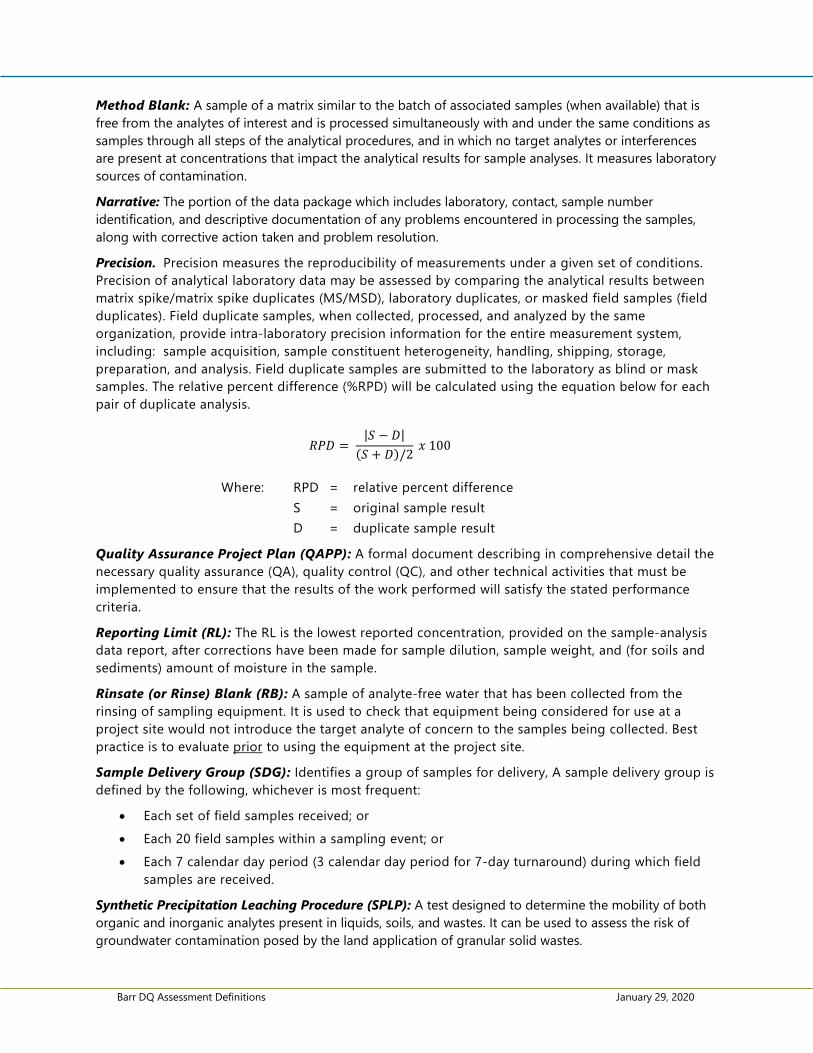
Barr DQ Assessment Definitions January 29, 2020
Method Blank: A sample of a matrix similar to the batch of associated samples (when available) that is free from the analytes of interest and is processed simultaneously with and under the same conditions as samples through all steps of the analytical procedures, and in which no target analytes or interferences are present at concentrations that impact the analytical results for sample analyses. It measures laboratory sources of contamination.
Narrative: The portion of the data package which includes laboratory, contact, sample number identification, and descriptive documentation of any problems encountered in processing the samples, along with corrective action taken and problem resolution.
Precision. Precision measures the reproducibility of measurements under a given set of conditions. Precision of analytical laboratory data may be assessed by comparing the analytical results between matrix spike/matrix spike duplicates (MS/MSD), laboratory duplicates, or masked field samples (field duplicates). Field duplicate samples, when collected, processed, and analyzed by the same organization, provide intra-laboratory precision information for the entire measurement system, including: sample acquisition, sample constituent heterogeneity, handling, shipping, storage, preparation, and analysis. Field duplicate samples are submitted to the laboratory as blind or mask samples. The relative percent difference (%RPD) will be calculated using the equation below for each pair of duplicate analysis.
𝑅𝑅𝑅𝑅𝐷𝐷 = |𝑆𝑆 − 𝐷𝐷|
(𝑆𝑆 + 𝐷𝐷)/2 𝑥𝑥 100
Where: RPD = relative percent difference S = original sample result D = duplicate sample result
Quality Assurance Project Plan (QAPP): A formal document describing in comprehensive detail the necessary quality assurance (QA), quality control (QC), and other technical activities that must be implemented to ensure that the results of the work performed will satisfy the stated performance criteria.
Reporting Limit (RL): The RL is the lowest reported concentration, provided on the sample-analysis data report, after corrections have been made for sample dilution, sample weight, and (for soils and sediments) amount of moisture in the sample.
Rinsate (or Rinse) Blank (RB): A sample of analyte-free water that has been collected from the rinsing of sampling equipment. It is used to check that equipment being considered for use at a project site would not introduce the target analyte of concern to the samples being collected. Best practice is to evaluate prior to using the equipment at the project site.
Sample Delivery Group (SDG): Identifies a group of samples for delivery, A sample delivery group is defined by the following, whichever is most frequent:
• Each set of field samples received; or • Each 20 field samples within a sampling event; or • Each 7 calendar day period (3 calendar day period for 7-day turnaround) during which field
samples are received.
Synthetic Precipitation Leaching Procedure (SPLP): A test designed to determine the mobility of both organic and inorganic analytes present in liquids, soils, and wastes. It can be used to assess the risk of groundwater contamination posed by the land application of granular solid wastes.
Barr DQ Assessment Definitions January 29, 2020
Toxicity Characteristic Leaching Procedure (TCLP): A test designed to determine whether a waste is hazardous or requires treatment to become less hazardous; also can be used to monitor treatment techniques for effectiveness.
Trip Blank (TB): A sample of analyte-free water prepared or provided by the laboratory along with the sampling containers. Trip blank sample containers are not to be opened in the field and accompany the samples during collection, storage, and transport to the analytical laboratory. It measures the potential for sample cross contamination due to sample transport and handling.
A trip blank sample is used when sampling volatile parameters (e.g., volatile organic compounds (VOC)/gasoline range organic (GRO)/ total petroleum hydrocarbon (TPH)). Analyte-free water is used for an aqueous trip blank and methanol (or other applicable sample preservative) is used for a soil trip blank. A trip blank should be included for each sample cooler containing VOC samples and documented on the chain-of-custody (COC) form along with the samples and the required analysis. Trip blanks may also be used for per- and polyfluorinated alkyl substances (PFAS).
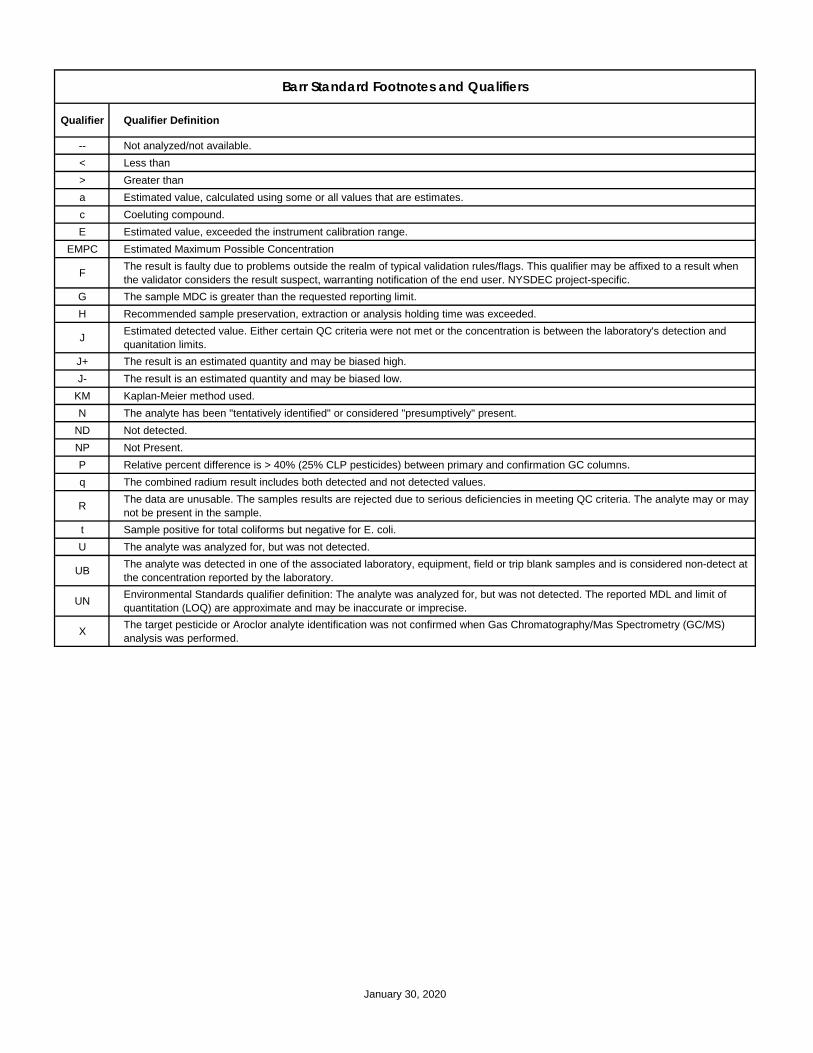
January 30, 2020
Qualifier Qualifier Definition
-- Not analyzed/not available.< Less than> Greater thana Estimated value, calculated using some or all values that are estimates.c Coeluting compound.E Estimated value, exceeded the instrument calibration range.
EMPC Estimated Maximum Possible ConcentrationF The result is faulty due to problems outside the realm of typical validation rules/flags. This qualifier may be affixed to a result when
the validator considers the result suspect, warranting notification of the end user. NYSDEC project-specific.G The sample MDC is greater than the requested reporting limit.H Recommended sample preservation, extraction or analysis holding time was exceeded. J Estimated detected value. Either certain QC criteria were not met or the concentration is between the laboratory's detection and
quanitation limits.J+ The result is an estimated quantity and may be biased high.J- The result is an estimated quantity and may be biased low.
KM Kaplan-Meier method used.N The analyte has been "tentatively identified" or considered "presumptively" present.
ND Not detected.NP Not Present.P Relative percent difference is > 40% (25% CLP pesticides) between primary and confirmation GC columns.q The combined radium result includes both detected and not detected values.R The data are unusable. The samples results are rejected due to serious deficiencies in meeting QC criteria. The analyte may or may
not be present in the sample. t Sample positive for total coliforms but negative for E. coli.U The analyte was analyzed for, but was not detected.
UB The analyte was detected in one of the associated laboratory, equipment, field or trip blank samples and is considered non-detect at the concentration reported by the laboratory.
UN Environmental Standards qualifier definition: The analyte was analyzed for, but was not detected. The reported MDL and limit of quantitation (LOQ) are approximate and may be inaccurate or imprecise.
X The target pesticide or Aroclor analyte identification was not confirmed when Gas Chromatography/Mas Spectrometry (GC/MS) analysis was performed.
Barr Standard Footnotes and Qualifiers
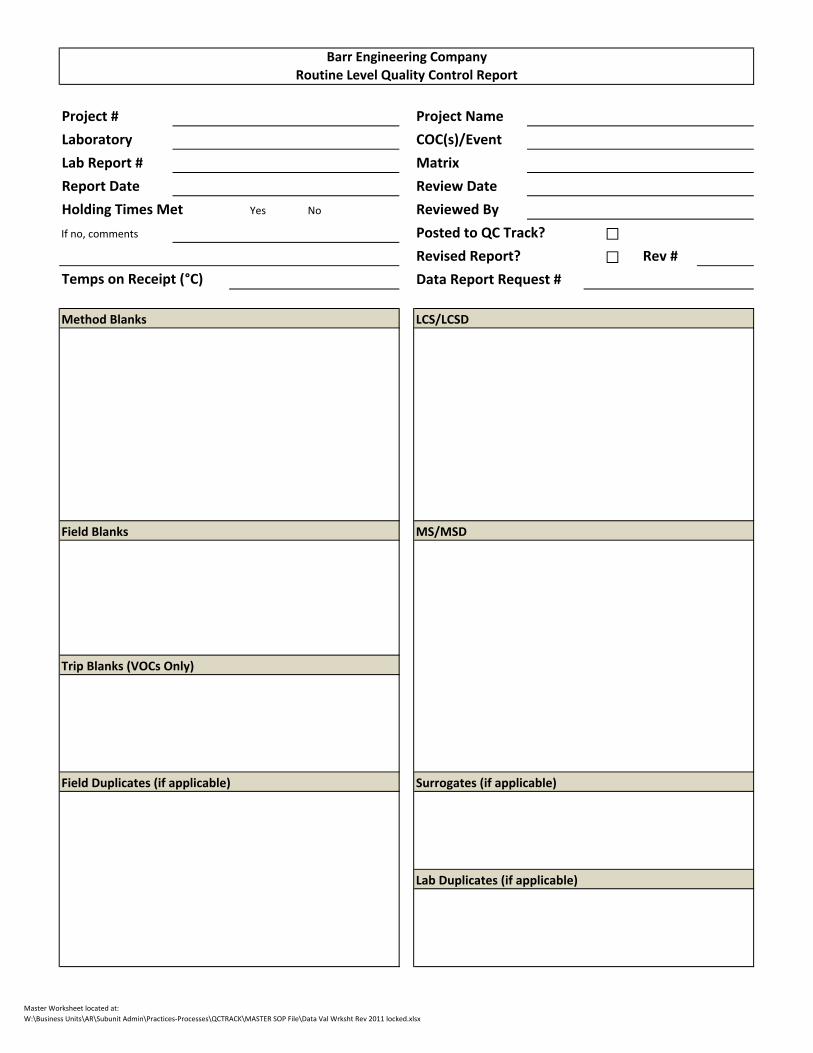
Project # Project Name
Laboratory COC(s)/Event
Lab Report # Matrix
Report Date Review Date
Holding Times Met Yes No Reviewed By
If no, comments Posted to QC Track? □
Revised Report? □ Rev #
Temps on Receipt (°C) Data Report Request #
Method Blanks LCS/LCSD
Field Blanks MS/MSD
Trip Blanks (VOCs Only)
Field Duplicates (if applicable) Surrogates (if applicable)
Lab Duplicates (if applicable)
Barr Engineering Company
Routine Level Quality Control Report
Master Worksheet located at:
W:\Business Units\AR\Subunit Admin\Practices-Processes\QCTRACK\MASTER SOP File\Data Val Wrksht Rev 2011 locked.xlsx
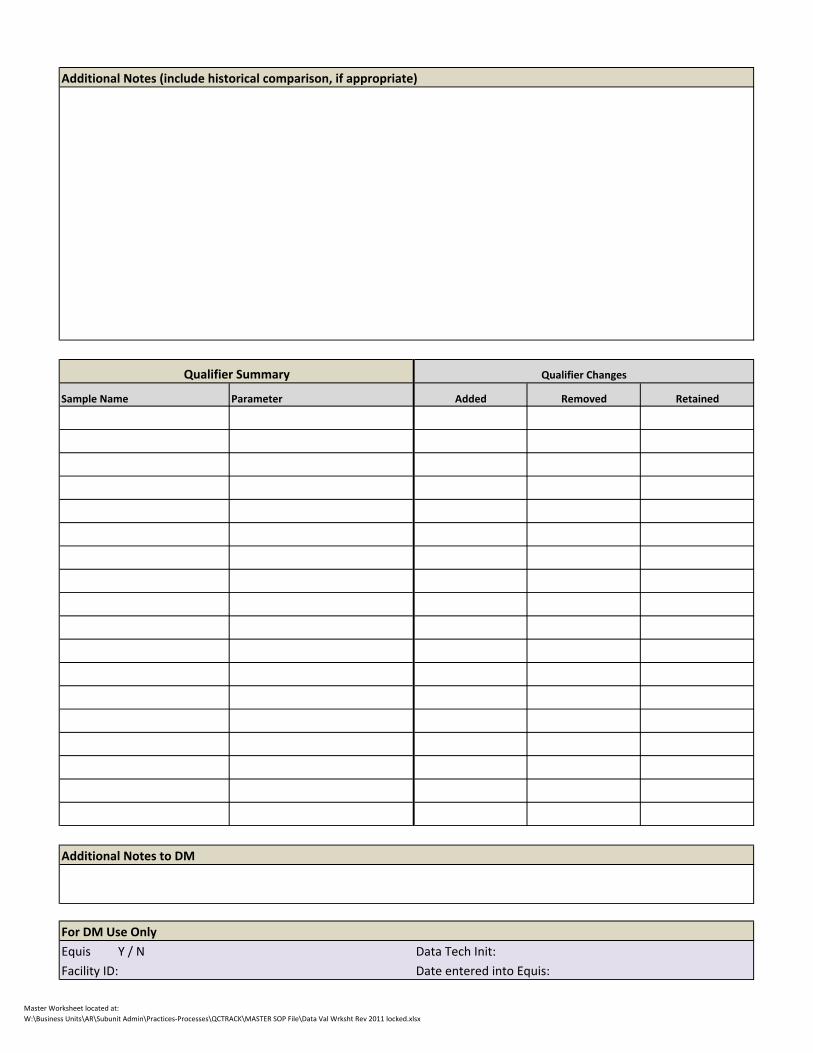
Additional Notes (include historical comparison, if appropriate)
Sample Name Parameter
Additional Notes to DM
For DM Use Only
Equis Y / N Data Tech Init:
Facility ID: Date entered into Equis:
Qualifier Changes
Added Removed Retained
Qualifier Summary
Master Worksheet located at:
W:\Business Units\AR\Subunit Admin\Practices-Processes\QCTRACK\MASTER SOP File\Data Val Wrksht Rev 2011 locked.xlsx

Standard Operating Procedure Routine Level General Chemistry Data Evaluation
Revision 8
January 2, 2020
Approved By:
Michael Dupay 01/02/20 Print Technical Reviewer Signature Date
Terri Olson 01/02/20 Print QA Manager Signature Date
Review of the SOP has been performed and the SOP still reflects current practice.
Initials: Date:
Initials: Date:
Initials: Date:
Initials: Date:

Routine Level General Chemistry Data Evaluation
Page 2 of 10 Revision Date: 01/02/20
Printed Copy is Uncontrolled. Controlled copy is m
aintained on the internal Barr network. Print a new
copy each time a hard copy is required.
Routine Level General Chemistry Data Evaluation
1.0 Scope and Applicability This SOP is intended as a guidance document for the routine level evaluation of general chemistry data provided by laboratories to be used in Barr Engineering Company (Barr) projects.
This SOP is based on the recommendations of the associated approved analytical methods from USEPA, ASTM, and Standard Methods for the Examination of Water and Wastewater and applies to routine general chemistry data evaluation including a variety of approved methods not limited to the following parameters:
Alkalinity (Total, Bicarbonate, Carbonate) Orthophosphate
Ammonia, Total (NH3 + NH4-) pH – in lab
Biological Oxygen Demand (BOD) Phosphorus, Total
Chemical Oxygen Demand (COD) Sulfate
Chloride Sulfide
Chromium VI (Hexavalent Chromium) Surfactants
Conductance, Specific – in lab Total Dissolved Solids (TDS)
Cyanide (as CN-) Total Kjeldahl Nitrogen (TKN)
Fluoride Total Organic Carbon (TOC)
Hardness Total Phenolics
Nitrate (or Nitrite) only Total Suspended Solids (TSS)
Nitrate + Nitrite Turbidity
Oil and Grease (as HEM)
In the case of specific parameters not listed above, the guidelines within this document will provide the basis upon which to make adequate professional judgment in the evaluation of data submitted for review. Laboratories may not provide all the review elements in this SOP, review only those that are provided.
The recommended procedures in this SOP should be followed unless conditions make it impractical or inappropriate to do so. Modifications should be noted in the applicable documentation and communicated to appropriate personnel. Significant changes may result in a revision or newly created SOP.
2.0 Limitations • Level IV data evaluation is not covered in this SOP and should be performed in accordance with
project specific requirements.
3.0 Responsibilities The laboratory is responsible for generating data from the samples submitted for analysis. In instances where QC criteria are not met for the analysis of samples, the laboratory is responsible for reanalysis of the samples, provided reanalysis is possible (considering matrix interference, holding times and sample volume, etc.), or documenting the impact to the data.
Routine Level General Chemistry Data Evaluation
Page 3 of 10 Revision Date: 01/02/20
Printed Copy is Uncontrolled. Controlled copy is m
aintained on the internal Barr network. Print a new
copy each time a hard copy is required.
The Data Quality Specialist is responsible for evaluating the data in accordance with this document, in addition to using professional judgment where necessary or appropriate. Project specific requirements, such as those specified in a Quality Assurance Project Plan (QAPP) or Sampling and Analysis Plan (SAP), may differ from these recommendations and professional judgment should be applied before qualifying any data.
4.0 Procedure The Quality Assurance/Quality Control (QA/QC) data detailed below are the most typical found in a routine level laboratory report evaluation. Other QA/QC data may be provided by the laboratory within the laboratory report case narrative, data qualifiers, or cover sheet and should be evaluated using professional judgment (e.g., initial calibration, calibration verification, internal standards, post digestion, serial dilution).
Definitions to common QA/QC terms and terms used within this SOP along with a list of Barr ‘Data Qualifiers/Footnotes’ that may be applied during review can be found in Barr’s “Compendium of Data Quality Assessment Documentation”.
4.1 Holding Time and Preservation The purpose of holding time and preservation evaluation is to ascertain the validity of the analytical results based on the sample condition, preservation, and time elapsed between the date of sample collection and date of analysis.
40 CFR Part 136 and the Test Methods for Evaluating Solid Waste (SW-846) are used as guidance for the recommended holding time and preservation acceptance criteria listed in Table 1. Further information may be found in the water and soil sampling guidelines in Barr’s “Compendium of Field Documentation”.
Table 1 - Recommended Holding Times and Preservation
Parameter
Recommended Hold Time Preservation
24 H
our
48 H
our
7 D
ay
14 D
ay
28 D
ay
180
Day
Ice
(≤ 6
°C )
HCl
HN
O3
H2S
O4
NaO
H
ZnAc
+
NaO
H
Alkalinity, as CaCO3 X X
Ammonia as N X X X
Biochemical Oxygen Demand (BOD) X X
Chemical Oxygen Demand (COD) X X X
Chloride X None required
Chromium, Hexavalent X xa X
Conductance, Specific X X
Cyanide X X X
Fluoride X None required
Hardness X Xb Xb
(Table 1 continued on next page)
Routine Level General Chemistry Data Evaluation
Page 4 of 10 Revision Date: 01/02/20
Printed Copy is Uncontrolled. Controlled copy is m
aintained on the internal Barr network. Print a new
copy each time a hard copy is required.
Table 1 - Recommended Holding Times and Preservation
Parameter
Recommended Hold Time Preservation
24 H
our
48 H
our
7 D
ay
14 D
ay
28 D
ay
180
Day
Ice
(≤ 6
°C )
HCl
HN
O3
H2S
O4
NaO
H
ZnAc
+
NaO
H
Nitrate or Nitrite Xc X
Nitrate + Nitrite as N X X X
Oil & Grease, HEM X X Xd Xd
Orthophosphate (field filter w/in 15 min) X X
pH Xe None required
Phenolics, total X X X
Phosphorus, total X X X
Sulfate X X
Sulfide X X X
Surfactants X X
Total Dissolved Solids (TDS) X X
Total Kjeldahl Nitrogen (TKN) X X X
Total Organic Carbon (TOC) X X Xd Xd
Total Suspended Solids (TSS) X X
Turbidity X X
a = Per 40 CFR Part 136.3, a 28-day holding time may be achieved if the ammonium sulfate buffer solution specified in EPA Method 218.6 is used. This footnote supersedes preservation and holding time requirements in approved hexavalent chromium methods, unless this would compromise the measurement and then the method must be followed. b = Either preservative may be used for the titration method; if calculated from Ca and Mg, HNO3. c = Holding time for nitrate is NA when calculated from Nitrate + Nitrite minus Nitrite. d = Either preservative may be used (pH < 2). e = Method recommends pH should be measured in the field, holding time is 15 minutes.; however, for confirmation measurements in the laboratory, a maximum holding time of 7 days from sample collection may be used as a guideline for qualification.
If samples do not meet holding time, preservation and analysis recommendations in Table 1, consider qualification with an ‘H’ (“Recommended sample preservation, extraction or analysis holding time was exceeded.”). Other matrices, such as product samples (e.g. oil, waste rock, drill cores) may not be subject to the same holding time recommendations.
If the sample was stored on ice upon collection and delivered to the laboratory the same day, the sample may exceed recommended temperature at the time of laboratory receipt. Professional judgment should be applied (considering temperature, matrix, magnitude of the exceedance, etc.) when evaluating the application of qualifiers when criteria are not met.
Routine Level General Chemistry Data Evaluation
Page 5 of 10 Revision Date: 01/02/20
Printed Copy is Uncontrolled. Controlled copy is m
aintained on the internal Barr network. Print a new
copy each time a hard copy is required.
4.2 Blank Samples Blank sample evaluation is conducted to determine the existence and magnitude of target analyte contamination as a result of activities in the field during collection and transport or from inter-laboratory sources.
• While not required for all methods, method blanks are recommended for all but the pH analysis. Evaluation pertains to the batch of samples analyzed with the method blank.
• Field or equipment blank collection and analysis frequency is project specific. Evaluation pertains to the field samples associated with the field or equipment blank.
• Blank analyses may not have involved the same weights, volumes, or dilution factors as the associated samples. Data reviewers may have to obtain raw data and/or convert the data to the same units for comparison purposes.
Table 2 – Guidelines for Blank Contamination
Sample Result Recommended Action for Associated Data
Non-detect No action required
< 5x blank concentration Qualify with ‘UB’
≥ 5x blank concentration Use professional judgment UB = The analyte is detected in one of the associated laboratory, equipment, field or trip blank samples and is
considered non-detect at the concentration reported by the laboratory.
Note: Other multipliers of the blank contamination may be used based on professional judgment (reporting to the MDL, common lab contaminant, etc.)
Professional judgment regarding the usability of the data should be used in cases where gross detections of target analytes are found in the blank sample. A number of factors may be considered including historical data, prior knowledge of the site conditions, target analytes involved, type of blank sample, etc. In such cases, it may be appropriate to qualify the affected data with ‘J’ (“Estimated detected value. Either certain QC criteria were not met or the concentration is between the laboratory’s detection and quantitation limits.”) or ‘R’ (“The data are unusable. The sample results are rejected due to serious deficiencies in meeting QC criteria. The analyte may or may not be present in the sample.”).
4.3 Laboratory Control Samples (LCS) and Laboratory Control Sample Duplicate Samples (LCSD)
The laboratory control sample is used to monitor the overall performance of each step during analysis, including sample preparation. The LCS should be analyzed:
• Once every preparation batch (typically 20 or less samples of the same matrix). • Once for each matrix.
Laboratory control samples contain a known amount of each target compound and the percent recoveries are evaluated based on the criteria within the laboratory report or project specific requirements. Percent recoveries are calculated for accuracy and the relative percent difference (RPD) is calculated for precision (when an LCSD was analyzed). Accuracy and precision equations can be found in ‘Definitions’ from Barr’s “Compendium of Data Quality Assessment Documentation”.

Routine Level General Chemistry Data Evaluation
Page 6 of 10 Revision Date: 01/02/20
Printed Copy is Uncontrolled. Controlled copy is m
aintained on the internal Barr network. Print a new
copy each time a hard copy is required.
Table 3 – Guidelines for Laboratory Control Samples
Criteria Recommended Action for Associated Data
Detect Non-Detect
%R > Upper Limit Qualify with ‘J+’ or use professional judgment No qualification
%R < Lower Limit Qualify with ‘J-’ or ‘R’, use professional judgment
RPD > Upper Limit Qualify with ‘J’ or use professional judgment
%R and RPD within Limits No qualification J+ = The result is an estimated quantity and may be biased high. J- = The result is an estimated quantity and may be biased low. J = Estimated detected value. Either certain QC criteria were not met or the concentration is between the laboratory’s detection and quantitation limits. R = The data are unusable. The sample results are rejected due to serious deficiencies in meeting QC criteria.
The analyte may or may not be present in the sample.
4.4 Laboratory Duplicate Samples Laboratory duplicate samples are separate aliquots of field samples analyzed to demonstrate acceptable method precision by the laboratory at the time of analysis. Ideally, blanks and proficiency testing (PT) samples should not be used for duplicate analysis. The MS/MSD duplicate pairs may be substituted for laboratory duplicates. The RPDs are calculated using the equation as provided in ‘Definitions’ from Barr’s “Compendium of Data Quality Assessment Documentation” and are not calculated where data are already qualified with U, UB, <, or R. RPD results are dependent on the homogeneity of the samples.
Duplicates should be analyzed (whichever is more frequent):
• One from each matrix (soil or water)
• One from each SDG
Laboratory acceptance criteria or project specific requirement are used to evaluate RPDs. If criteria are not available, use professional judgment when considering qualification of associated results.
Higher RPDs are expected when results are at or near the reporting limits and are not always indicative of poor precision. RPDs are typically only evaluated for samples where both the native and duplicate sample concentrations are greater than five times (>5x) the RL. In cases where either of the samples (native or duplicate) is non-detect for a parameter and the other corresponding sample has detectable concentrations much greater than five times (>5x) the RL, professional judgment should be used to determine if qualification is appropriate.
Routine Level General Chemistry Data Evaluation
Page 7 of 10 Revision Date: 01/02/20
Printed Copy is Uncontrolled. Controlled copy is m
aintained on the internal Barr network. Print a new
copy each time a hard copy is required.
Table 4 – Guidelines for Laboratory Duplicates
% RPD Recommended Action for Associated Data
RPD < Upper Limit No action is required
RPD > Upper Limit Both results are ≤ 5x RL, no action is required
RPD > Upper Limit
Both results are > 5x RL, consider qualifying with ‘J’ J = Estimated detected value. Either certain QC criteria were not met or the concentration is between the laboratory’s detection and quantitation limits.
4.5 Field Duplicate Samples Field duplicate samples (also known as “masked” or “blind” duplicate samples) are used to demonstrate acceptable precision and reproducibility of the field and laboratory procedures. Frequency of collection is project specific. The RPDs are calculated using the equation as provided under precision in ‘Definitions’ from Barr’s “Compendium of Data Quality Assessment Documentation” and are not calculated where data is already qualified with U, UB, <, or R. RPD results are dependent on the homogeneity of the samples.
Acceptance criteria for field duplicate samples are subject to the professional judgment of the Data Quality Specialist but typically RPDs ≤ 30% for aqueous samples and ≤ 40% for soil and sediment samples are considered acceptable unless other project specific requirements are defined.
Higher RPDs are expected when results are at or near the reporting limits and are not always indicative of poor precision. RPDs are typically only evaluated for samples where both the native and duplicate sample concentrations are greater than five times (>5x) the RL. In cases where either of the samples (native or field duplicate) is non-detect for a parameter and the other corresponding sample has detectable concentrations much greater than five times (>5x) the RL, professional judgment should be used to determine if qualification is appropriate.
Table 5 – Guidelines for Field Duplicates
% RPD Recommended Action for Associated Data
RPD < Upper Limit No action is required
RPD > Upper Limit Both results are ≤ 5x RL, no action is required
RPD > Upper Limit
Both results are > 5x RL, consider qualifying with ‘J’ J = Estimated detected value. Either certain QC criteria were not met or the concentration is between the laboratory’s detection and quantitation limits.
4.6 Matrix Spikes (MS) and Matrix Spike Duplicate (MSD) Samples Matrix spike samples contain a known amount of a target compound and provide information about the effect of each samples’ matrix on the sample preparation procedures and analytical results. Matrix spikes are typically analyzed at the following frequencies:
• 1 (MS/MSD pair) in every 20 samples • 1 per preparation batch per matrix • 1 per SDG
Routine Level General Chemistry Data Evaluation
Page 8 of 10 Revision Date: 01/02/20
Printed Copy is Uncontrolled. Controlled copy is m
aintained on the internal Barr network. Print a new
copy each time a hard copy is required.
However, the frequency may be project specific and the documents outlining the needs of the project (SAP, QAPP, etc.) should be reviewed. In some cases, MS/MSD analysis is not required.
The percent recoveries are evaluated based on the criteria within the laboratory report or project specific requirements. If a matrix spike recovery does not meet acceptance criteria and is not associated with a project sample, no further action is required unless other systematic evidence warrants qualification.
If the native concentration of a spiked sample is significantly greater than the spike added (>4x), spike recovery cannot be accurately evaluated, therefore the criteria do not apply. Professional judgment should be used for percent recoveries nominally outside laboratory acceptance criteria prior to qualifying data.
If criteria are not available, use guidance found in the NFG. Percent recoveries of matrix spike (and matrix spike duplicate) samples should be calculated using the equation provided under accuracy in ‘Definitions’ from Barr’s “Compendium of Data Quality Assessment Documentation”.
Solid samples may have highly variable concentrations of target analytes and percent recoveries (%R) may be influenced by the sampling precision and inherent sample homogeneity. Professional judgment should be used for difficult matrices and the acceptance criteria adjusted accordingly.
Table 6 – Guidelines for Matrix Spikes
Criteria Recommended Action for Associated Data
Detect Non-Detect
%R > Upper Limit Qualify with ‘J+’ or use professional judgment No qualification
%R < Lower Limit Qualify with ‘J-’ or ‘R’, use professional judgment
RPD > Upper Limit Qualify with ‘J’ or use professional judgment
%R and RPD within Limits No qualification J+ = The result is an estimated quantity and may be biased high. J- = The result is an estimated quantity and may be biased low. J = Estimated detected value. Either certain QC criteria were not met or the concentration is between the laboratory’s detection and quantitation limits. R = The data are unusable. The sample results are rejected due to serious deficiencies in meeting QC criteria.
The analyte may or may not be present in the sample.
While matrix spike duplicates are not required by all methods, if results for MSD analyses are reported, evaluate the RPD for MS and MSD pairs using the equation as provided under precision in ‘Definitions’ from Barr’s “Compendium of Data Quality Assessment Documentation”.
4.7 Overall Assessment The chain-of-custody should be reviewed to determine if the laboratory report matches the requested analyses and that project specific parameters were analyzed as requested. The narrative and other supporting documentation should be evaluated to ensure that sample condition was appropriately documented by the laboratory upon receipt. If available, historical data should be used to assist with data evaluation. Any additional anomalies should be documented and evaluated, if necessary.

Routine Level General Chemistry Data Evaluation
Page 9 of 10 Revision Date: 01/02/20
Printed Copy is Uncontrolled. Controlled copy is m
aintained on the internal Barr network. Print a new
copy each time a hard copy is required.
5.0 Quality Control and Quality Assurance (QA/QC) Depending on the project objectives, the data evaluation may include the completion of a Routine Level Quality Control Report. This may be a report produced via EQuIS DQM (Environmental Quality Information System Data Quality Module) or a hardcopy as found in Barr’s “Compendium of Data Quality Assessment Documentation”. Within each QC data section, the reviewer should include references to whether the QC data met or exceeded the acceptance criteria. The qualifiers, added, removed, or retained, should be documented. If using EQuIS DQM, reason codes will also be applied. The reason codes are defined in the software. Where multiple qualifiers may be applicable to a sample/analyte result, professional judgment should be used to determine if all qualifiers are necessary or if one qualifier would be sufficient to represent the deviations. A statement as to whether the data are acceptable as reported or acceptable with qualification(s) should also be included. If revised reports are required and the revision affects the sample results, notification should be given to the appropriate data management personnel and/or project team members.
6.0 Records The Routine Level Quality Control Report should be saved to the appropriate internal Barr file and the link uploaded to the tracking system. Periodically, Data Quality staff should check for missing Routine Level Quality Control Reports in the tracking system to help maintain the most current information. Documentation of the data evaluation may include but is not limited to an email to the project team, data evaluation summary report, technical memo, or section within a project report.
Documentation specific to this SOP are listed below and are available in Barr’s “Compendium of Data Quality Assessment Documentation”.
• Definitions • Barr Qualifiers/Footnotes • Routine Level Quality Control Report
Additional records information can be found in Barr’s “Records Management System Manual”.
7.0 References Environmental Protection Agency. Title 40 of the Code of Federal Regulations, Part 136.3.
Environmental Protection Agency, National Functional Guidelines for Inorganic Superfund Data Review.
Analytical methods listed under the ‘Scope and Applicability’ section of this SOP.
Routine Level General Chemistry Data Evaluation
Page 10 of 10 Revision Date: 01/02/20
Printed Copy is Uncontrolled. Controlled copy is m
aintained on the internal Barr network. Print a new
copy each time a hard copy is required.
Attachment 1 Revision History
Revision Number
Date of Revision Section Revision Made
5.0 06/17/13
Cover page Added Calgary office
Applicability Added US to EPA reference
I Added waste rock and drill cores to examples of product sample
III Added LCSD information
III, IV, V, VI Added ‘project specific requirements’ as possible criteria source
V Added ‘field and laboratory procedures’ to clarify that it’s not only a laboratory item
V Clarified field duplicate criteria as < one value and not a range
VIII Added statement regarding multiple qualifiers
6 01/07/16 Document Wide SOP restructuring, new format
7 04/24/18 1.0
Added laboratories may not provide all the review elements in this SOP, review only those that are provided.
4.2, third bullet Clarified that data reviewers would have to obtain raw data since not provided with Level II report.
8 01/02/20 Document wide Updated for new qualifiers
Standard Operating Procedure Routine Level Metals Data Evaluation
Revision 8
January 2, 2020
Approved By:
Michael Dupay 01/02/20 Print Technical Reviewer Signature Date
Terri Olson 01/02/20 Print QA Manager Signature Date
Review of the SOP has been performed and the SOP still reflects current practice.
Initials: Date:
Initials: Date:
Initials: Date:
Initials: Date:
Routine Level Metals Data Evaluation Page 2 of 10 Revision Date: 01/02/20
Printed Copy is Uncontrolled. Controlled copy is m
aintained on the internal Barr network. Print a new
copy each time a hard copy is required.
Routine Level Metals Data Evaluation
1.0 Scope and Applicability This SOP is intended as a guidance document for the routine level evaluation of metals data provided by laboratories to be used in Barr Engineering Company (Barr) projects.
This SOP is based on quality assurance elements, not the specific criteria, of USEPA Contract Laboratory Program National Functional Guidelines (NFG) for Inorganic Data and applies to routine metals data evaluation for analyses by the following technologies:
• Inductively Coupled Plasma/Atomic Emission Spectroscopy (ICP/AES)
o Method examples: EPA 200.7, EPA 6010
• Inductively Coupled Plasma/Mass Spectrometry (ICP/MS)
o Method examples: EPA 200.8, EPA 6020
• Cold Vapor Atomic Absorption (CVAA)
o Method examples: EPA 245.1, EPA 7470, EPA 7471, SM 3112 B
• Cold Vapor Atomic Fluorescence Spectrometry (CVAF)
o Method examples: EPA 245.7, EPA 1631 (low-level mercury), EPA 7474
• Thermal Decomposition / Atomic Absorption Spectrophotometer
o EPA 7473
• Graphite Furnace Atomic Absorption (GFAA)
o Method examples: EPA 7010, SM 3113 B
• Methods above in conjunction with Toxicity Characteristic Leachate Procedure (TCLP), EPA 1311
• Methods above in conjunction with Synthetic Precipitation Leachate Procedure (SPLP), EPA 1312
The letter indicator for the various EPA method revisions have been intentional omitted. Multiple versions of the approved methods would be applicable for review under this SOP. In the case of specific technologies and/or methods not listed above, the guidelines within this document will provide the basis upon which to make adequate professional judgment in the evaluation of data submitted for review. Laboratories may not provide all the review elements in this SOP, review only those that are provided.
The recommended procedures in this SOP should be followed unless conditions make it impractical or inappropriate to do so. Modifications should be noted in the applicable documentation and communicated to appropriate personnel. Significant changes may result in a revision or newly created SOP.
2.0 Limitations • Level IV data evaluation is not covered in this SOP and should be performed in accordance with
NFG or project specific requirements.
Routine Level Metals Data Evaluation Page 3 of 10 Revision Date: 01/02/20
Printed Copy is Uncontrolled. Controlled copy is m
aintained on the internal Barr network. Print a new
copy each time a hard copy is required.
3.0 Responsibilities The laboratory is responsible for generating data from the samples submitted for analysis. In instances where QC criteria are not met for the analysis of samples, the laboratory is responsible for reanalysis of the samples, provided reanalysis is possible (considering matrix interference, holding times and sample volume, etc.), or documenting the impact to the data.
The Data Quality Specialist is responsible for evaluating the data in accordance with this document, in addition to using professional judgment where necessary or appropriate. Project specific requirements, such as those specified in a Quality Assurance Project Plan (QAPP) or Sampling and Analysis Plan (SAP), may differ from these recommendations and professional judgment should be applied before qualifying any data.
4.0 Procedure The Quality Assurance/Quality Control (QA/QC) data detailed below are the most typical found in a routine level laboratory report. Other QA/QC data may be provided by the laboratory within the laboratory report case narrative, data qualifiers, or cover sheet and should be evaluated using professional judgment (e.g., initial calibration, calibration verification, internal standards, post digestion, serial dilution).
Definitions to common QA/QC terms and terms used within this SOP along with a list of Barr ‘Data Qualifiers/Footnotes’ that may be applied during review can be found in Barr’s “Compendium of Data Quality Assessment Documentation”.
4.1 Holding Time and Preservation The purpose of holding time and preservation evaluation is to ascertain the validity of the analytical results based on the sample condition, preservation, and time elapsed between the date of sample collection and date of analysis.
40 CFR Part 136 and the Test Methods for Evaluating Solid Waste (SW-846) are used as guidance for the recommended holding time and preservation acceptance criteria listed in Table 1.
Table 1 – Recommended Holding Times and Preservation
Compound Matrix Temp. Preservative Maximum Holding Time
Mercury
Aqueous -- HNO3 < 2 pH 28 days
Aqueous (low level) --
Pre-tested hydrochloric acid or bromine chloride
48 hours preserve or analyze if not oxidized in sample bottle/28 days preserve if oxidized in sample bottle
90 days analysis (from collection) if preserved
Sediment/Soil Cool, ≤ 6 °C Ice 28 days
Wipe/Air -- NA 28 days (Table 1 continued on next page)
Routine Level Metals Data Evaluation Page 4 of 10 Revision Date: 01/02/20
Printed Copy is Uncontrolled. Controlled copy is m
aintained on the internal Barr network. Print a new
copy each time a hard copy is required.
Table 1 – Recommended Holding Times and Preservation
Compound Matrix Temp. Preservative Maximum Holding Time
Mercury TCLP -- NA 28 days TCLP Extraction/ 28 days analysis
All other metals
Aqueous -- HNO3 < 2 pH 180 days
Sediment/Soil Cool, ≤ 6 °C Ice 180 days
Wipe/Air -- NA 180 days
TCLP -- NA 180 days TCLP Extraction/ 180 days analysis
Note: When analyzing boron or silica, do not collect samples in borosilicate glass bottles.
If samples do not meet holding time, preservation and analysis recommendations in Table 1, consider qualification with an ‘H’ (“Recommended sample preservation, extraction or analysis holding time was exceeded.”). Other matrices, such as product samples (e.g. oil, waste rock, drill cores) may not be subject to the same holding time recommendations.
If the sample was stored on ice upon collection and delivered to the laboratory the same day, the sample may exceed recommended temperature at the time of laboratory receipt. Professional judgment should be applied (considering temperature, matrix, magnitude of the exceedance, etc.) when evaluating the application of qualifiers when criteria are not met.
Special considerations for low-level mercury
Low-level mercury must be collected directly into a specially cleaned, pretested, fluoropolymer or glass bottle using sample handling techniques specially designed for collection of mercury at trace levels and preserved with pre-tested hydrochloric acid (required for methyl mercury) or bromine chloride. Samples not collected in the correct type of container may be qualified with an ‘H’ (“Recommended sample preservation, extraction or analysis holding time was exceeded.”). These samples may be shipped unpreserved provided:
• Sample is collected in a fluoropolymer or glass bottle.
• Bottle contains no headspace and is capped tightly.
• Sample temperature was maintained at ≤ 6 °C.
• Samples are preserved or analyzed within 48 hours or oxidized in the bottle within 28 days.
4.2 Blank Samples Blank sample evaluation is conducted to determine the existence and magnitude of target analyte contamination as a result of activities in the field during collection and transport or from inter-laboratory sources.
• For each matrix, at least one method blank should be prepared and analyzed with each sample delivery group (SDG), or each batch digested (whichever is more frequent). Evaluation pertains to the batch of samples analyzed with the method blank.
Routine Level Metals Data Evaluation Page 5 of 10 Revision Date: 01/02/20
Printed Copy is Uncontrolled. Controlled copy is m
aintained on the internal Barr network. Print a new
copy each time a hard copy is required.
• Field or equipment blank collection and analysis frequency is project specific. Evaluation pertains to the field samples associated with the field or equipment blank.
• Blank analyses may not have involved the same weights, volumes, or dilution factors as the associated samples. It may be easier to work with the raw data and/or convert the data to the same units for comparison purposes.
• Low-level mercury method requires at least three method blanks per run per analytical batch.
Table 2 – Guidelines for Blank Contamination
Sample Result Recommended Action for Associated Data
Non-detect No action required
< 5x blank concentration Qualify with ‘UB’
≥ 5x blank concentration Use professional judgment UB = The analyte is detected in one of the associated laboratory, equipment, field or trip blank samples and is
considered non-detect at the concentration reported by the laboratory.
Note: Other multipliers of the blank contamination may be used based on professional judgment (reporting to the MDL, common lab contaminant, etc.)
Professional judgment regarding the usability of the data should be evaluated in cases where gross detections of target analytes are found in the blank sample. A number of factors may be considered including historical data, prior knowledge of the site conditions, target analytes involved, type of blank sample, etc. In such cases, it may be appropriate to qualify the affected data with ‘J’ (“Estimated detected value. Either certain QC criteria were not met or the concentration is between the laboratory’s detection and quantitation limits.”) or ‘R’ (“The data are unusable. The sample results are rejected due to serious deficiencies in meeting QC criteria. The analyte may or may not be present in the sample.”).
4.3 Laboratory Control Samples (LCS) and Laboratory Control Sample Duplicate Samples (LCSD)
The laboratory control sample is used to monitor the overall performance of each step during analysis, including sample preparation. The LCS should be analyzed:
• Once every preparation batch (typically 20 or less samples of the same matrix).
• Once for each matrix.
• For low-level mercury, ongoing precision and recovery (OPR) samples are run before and after each analytical batch - quality control samples (QCS) should be from a different source and analyzed once per analytical batch.
Laboratory control samples contain a known amount of each target compound and the percent recoveries are evaluated based on the criteria within the laboratory report or project specific requirements. If criteria are not available, use guidance found in the NFG. Percent recoveries are calculated for accuracy and the relative percent difference (RPD) is calculated for precision (when an LCSD was analyzed). Accuracy and precision equations can be found in ‘Definitions’ from Barr’s “Compendium of Data Quality Assessment Documentation”.
Routine Level Metals Data Evaluation Page 6 of 10 Revision Date: 01/02/20
Printed Copy is Uncontrolled. Controlled copy is m
aintained on the internal Barr network. Print a new
copy each time a hard copy is required.
Table 3 – Guidelines for Laboratory Control Samples
Criteria Recommended Action for Associated Data
Detect Non-Detect
%R > Upper Limit Qualify with ‘J+’ or use professional judgment No qualification
%R < Lower Limit Qualify with ‘J-’ or ‘R’, use professional judgment
RPD > Upper Limit Qualify with ‘J’ or use professional judgment
%R and RPD within Limits No qualification J+ = The result is an estimated quantity and may be biased high. J- = The result is an estimated quantity and may be biased low. J = Estimated detected value. Either certain QC criteria were not met or the concentration is between the laboratory’s detection and quantitation limits. R = The data are unusable. The sample results are rejected due to serious deficiencies in meeting QC criteria.
The analyte may or may not be present in the sample.
4.4 Laboratory Duplicate Samples Laboratory duplicate samples are separate aliquots of field samples analyzed to demonstrate acceptable method precision by the laboratory at the time of analysis. Ideally, blanks and proficiency testing (PT) samples should not be used for duplicate analysis. The MS/MSD duplicate pairs may be substituted for laboratory duplicates. The RPDs are calculated using the equation as provided in ‘Definitions’ from Barr’s “Compendium of Data Quality Assessment Documentation” and are not calculated where data are already qualified with U, UB, <, or R. RPD results are dependent on the homogeneity of the samples.
Duplicates should be analyzed (whichever is more frequent):
• One from each matrix (soil or water)
• One from each SDG
Laboratory acceptance criteria or project specific requirement are used to evaluate RPDs. If criteria are not available, use guidance found in NFG or use professional judgment when considering qualification of associated results.
Higher RPDs are expected when results are at or near the reporting limits and are not always indicative of poor precision. RPDs are typically only evaluated for samples where both the native and duplicate sample concentrations are greater than five times (>5x) the RL. In cases where either of the samples (native or duplicate) is non-detect for a parameter and the other corresponding sample has detectable concentrations much greater than five times (>5x) the RL, professional judgment should be used to determine if qualification is appropriate.
Routine Level Metals Data Evaluation Page 7 of 10 Revision Date: 01/02/20
Printed Copy is Uncontrolled. Controlled copy is m
aintained on the internal Barr network. Print a new
copy each time a hard copy is required.
Table 4 – Guidelines for Laboratory Duplicates
% RPD Recommended Action for Associated Data
RPD < Upper Limit No action is required
RPD > Upper Limit
Both results are ≤ 5x RL, no action is required
RPD > Upper Limit Both results are > 5x RL, consider qualifying with ‘J’ J = Estimated detected value. Either certain QC criteria were not met or the concentration is between the
laboratory’s detection and quantitation limits
4.5 Field Duplicate Samples Field duplicate samples (also known as “masked” or “blind” duplicate samples) are used to demonstrate acceptable precision and reproducibility of the field and laboratory procedures. Frequency of collection is project specific. The RPDs are calculated using the equation as provided under precision in ‘Definitions’ from Barr’s “Compendium of Data Quality Assessment Documentation” and are not calculated where data are already qualified with U, UB, <, or R. RPD results are dependent on the homogeneity of the samples.
Acceptance criteria for field duplicate samples are subject to the professional judgment of the Data Quality Specialist but typically RPDs ≤ 30% for aqueous samples and ≤ 40% for soil and sediment samples are considered acceptable unless other project specific requirements are defined.
Higher RPDs are expected when results are at or near the reporting limits and are not always indicative of poor precision. RPDs are typically only evaluated for samples where both the native and duplicate sample concentrations are greater than five times (>5x) the RL. In cases where either of the samples (native or field duplicate) is non-detect for a parameter and the other corresponding sample has detectable concentrations much greater than five times (>5x) the RL, professional judgment should be used to determine if qualification is appropriate.
Table 5 – Guidelines for Field Duplicates
% RPD Recommended Action for Associated Data
RPD < Upper Limit No action is required
RPD > Upper Limit Both results are ≤ 5x RL, no action is required
RPD > Upper Limit
Both results are > 5x RL, consider qualifying with ‘J’ J = Estimated detected value. Either certain QC criteria were not met or the concentration is between the laboratory’s detection and quantitation limits.
4.6 Matrix Spikes (MS) and Matrix Spike Duplicate (MSD) Samples Matrix spike samples contain a known amount of a target compound and provide information about the effect of each samples’ matrix on the sample preparation procedures and analytical results. Matrix spikes are typically analyzed at the following frequencies:
• 1 (MS/MSD pair) in every 20 samples
• 1 per preparation batch per matrix
• 1 per SDG
Routine Level Metals Data Evaluation Page 8 of 10 Revision Date: 01/02/20
Printed Copy is Uncontrolled. Controlled copy is m
aintained on the internal Barr network. Print a new
copy each time a hard copy is required.
However, the frequency may be project specific and the documents outlining the needs of the project (SAP, QAPP, etc.) should be reviewed. In some cases, MS/MSD analysis is not required.
The percent recoveries are evaluated based on the criteria within the laboratory report or project specific requirements. If a matrix spike recovery does not meet acceptance criteria and is not associated with a project sample, no further action is required unless other systematic evidence warrants qualification.
If the native concentration of a spiked sample is significantly greater than the spike added (>4x), spike recovery cannot be accurately evaluated, therefore the criteria do not apply. Professional judgment should be used for percent recoveries nominally outside laboratory acceptance criteria prior to qualifying data.
If criteria are not available, use guidance found in the NFG. Percent recoveries of matrix spike (and matrix spike duplicate) samples should be calculated using the equation provided under accuracy in ‘Definitions’ from Barr’s “Compendium of Data Quality Assessment Documentation”.
Solid samples may have highly variable concentrations of target analytes and percent recoveries (%R) may be influenced by the sampling precision and inherent sample homogeneity. Professional judgment should be used for difficult matrices and the acceptance criteria adjusted accordingly.
Table 6 – Guidelines for Matrix Spikes
Criteria Recommended Action for Associated Data
Detect Non-Detect
%R > Upper Limit Qualify with ‘J+’ or use professional judgment No qualification
%R < Lower Limit Qualify with ‘J-’ or ‘R’, use professional judgment
RPD > Upper Limit Qualify with ‘J’ or use professional judgment
%R and RPD within Limits No qualification J+ = The result is an estimated quantity and may be biased high. J- = The result is an estimated quantity and may be biased low. J = Estimated detected value. Either certain QC criteria were not met or the concentration is between the laboratory’s detection and quantitation limits. R = The data are unusable. The sample results are rejected due to serious deficiencies in meeting QC criteria.
The analyte may or may not be present in the sample.
While matrix spike duplicates are not required by all methods, if results for MSD analyses are reported, evaluate the RPD for MS and MSD pairs using the equation as provided under precision in ‘Definitions’ from Barr’s “Compendium of Data Quality Assessment Documentation”.
4.7 Overall Assessment The chain-of-custody should be reviewed to determine if the laboratory report matches the requested analyses and that project specific parameters were analyzed as requested. The narrative and other supporting documentation should be evaluated to ensure that sample condition was appropriately documented by the laboratory upon receipt. If available, historical data should be used to assist with data evaluation. Any additional anomalies should be documented and evaluated, if necessary.
Routine Level Metals Data Evaluation Page 9 of 10 Revision Date: 01/02/20
Printed Copy is Uncontrolled. Controlled copy is m
aintained on the internal Barr network. Print a new
copy each time a hard copy is required.
4.8 Total vs. Dissolved Occasionally, the measurements for dissolved metals are equivalent to or greater than the associated results reported for the total metals analysis. When this occurs, the variation between the total and dissolved results may indicate that the majority of the target metals present in the sample were in the dissolved phase and normal analytical variability may account for the difference. Professional judgment should be used to determine if the variation is significant enough to be qualified.
5.0 Quality Control and Quality Assurance (QA/QC) Depending on the project objectives, the data evaluation may include the completion of a Routine Level Quality Control Report. This may be a report produced via EQuIS DQM (Environmental Quality Information System Data Quality Module) or a hardcopy as found in Barr’s “Compendium of Data Quality Assessment Documentation”. Within each QC data section, the reviewer should include references to whether the QC data met or exceeded the acceptance criteria. The qualifiers, added, removed, or retained, should be documented. If using EQuIS DQM, reason codes will also be applied. The reason codes are defined in the software. Where multiple qualifiers may be applicable to a sample/analyte result, professional judgment should be used to determine if all qualifiers are necessary or if one qualifier would be sufficient to represent the deviations. A statement as to whether the data are acceptable as reported or acceptable with qualification(s) should also be included. If revised reports are required and the revision affects the sample results, notification should be given to the appropriate data management personnel and/or project team members.
6.0 Records The Routine Level Quality Control Report should be saved to the appropriate internal Barr file and the link uploaded to the tracking system. Periodically, Data Quality staff should check for missing Routine Level Quality Control Reports in the tracking system to help maintain the most current information. Documentation of the data evaluation may include but is not limited to an email to the project team, data evaluation summary report, technical memo, or section within a project report.
Documentation specific to this SOP are listed below and are available in Barr’s “Compendium of Data Quality Assessment Documentation”.
• Definitions • Barr Qualifiers/Footnotes • Routine Level Quality Control Report
Additional records information can be found in Barr’s “Records Management System Manual
7.0 References Environmental Protection Agency. Title 40 of the Code of Federal Regulations, Part 136.3.
Environmental Protection Agency, National Functional Guidelines for Inorganic Superfund Data Review.
Analytical methods listed under the ‘Scope and Applicability’ section of this SOP.
Routine Level Metals Data Evaluation Page 10 of 10 Revision Date: 01/02/20
Printed Copy is Uncontrolled. Controlled copy is m
aintained on the internal Barr network. Print a new
copy each time a hard copy is required.
Attachment 1 Revision History
Revision Number
Date of Revision Section Revision Made
5.0 06/17/13
Cover page Added Calgary office
Applicability Added US to EPA reference
I Added waste rock and drill cores to examples of product sample
III, IV, V, VI Added ‘project specific requirements’ as possible criteria source
V Added ‘field and laboratory procedures’ to clarify that it’s not only a laboratory item
V Clarified field duplicate criteria as < one value and not a range
VIII Added statement regarding multiple qualifiers
6.0 01/07/16 Document Wide SOP restructuring, new format
7 04/24/18 1.0
Added letter indicator for the various EPA method revisions was intentional omitted; multiple versions of the approved methods would be applicable for review under this SOP. Added laboratories may not provide all the review elements in this SOP, review only those that are provided.
4.2, third bullet Clarified that data reviewers would have to obtain raw data since not provided with Level II report.
8 01/02/20 Document wide Updated for new qualifiers
Appendix E
Water Quality Sampling Results
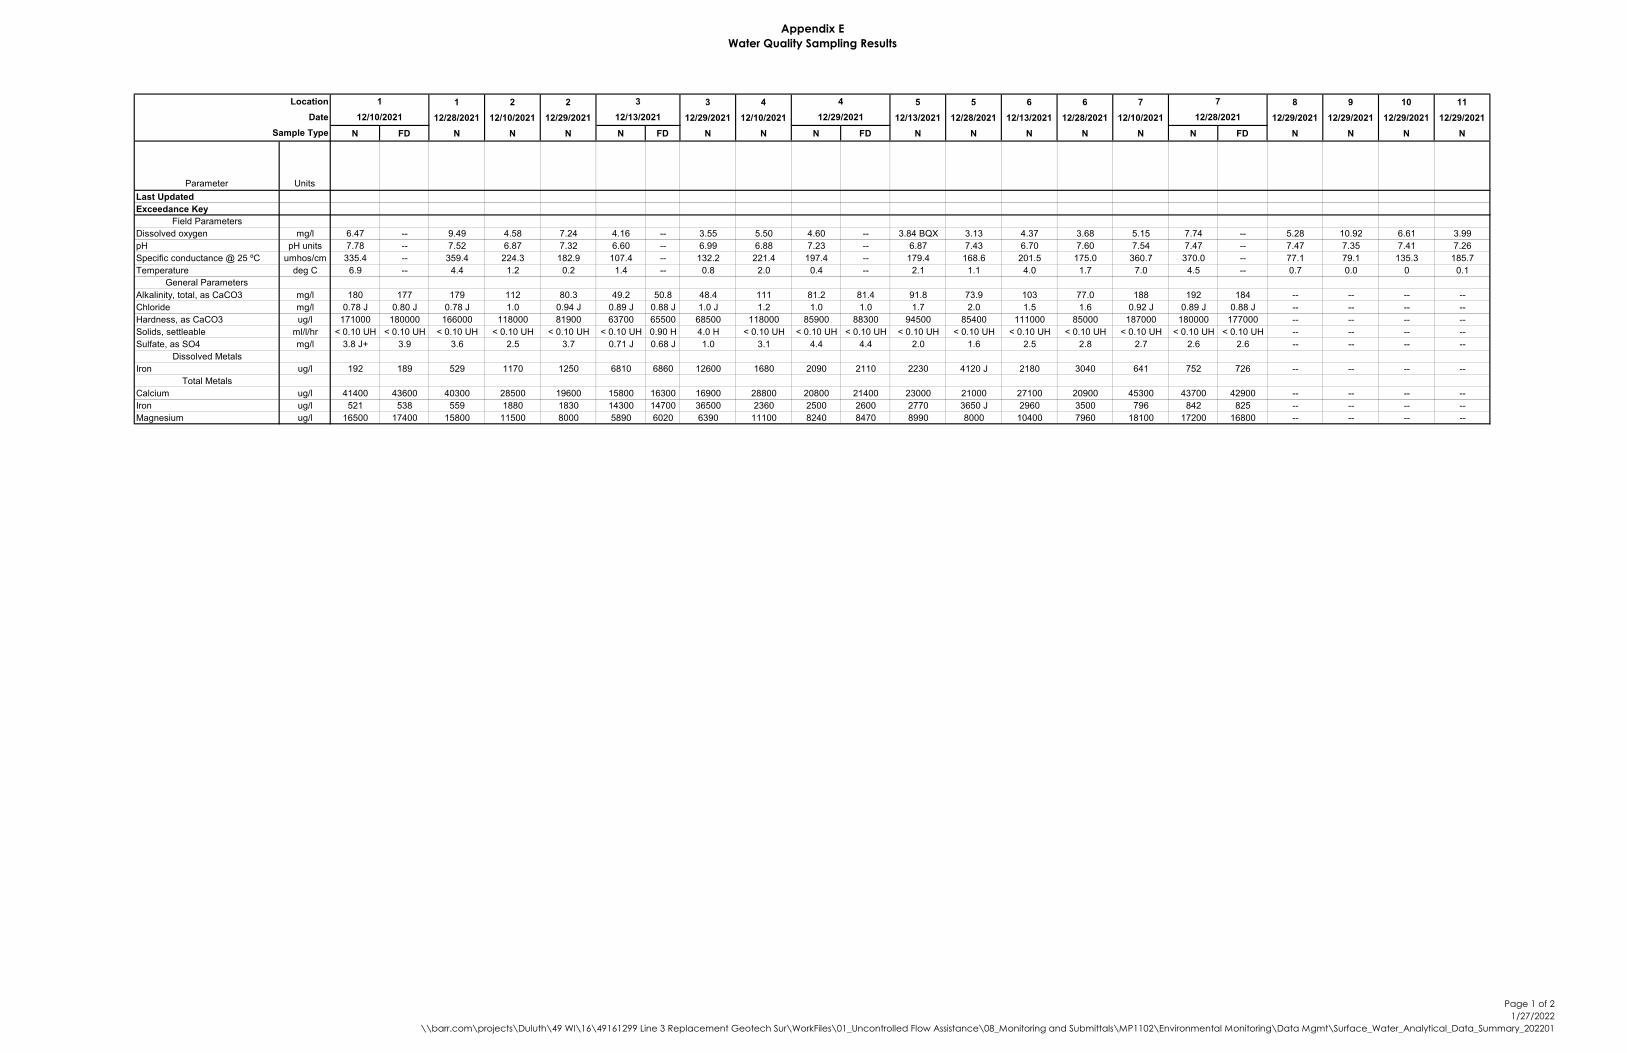
Appendix EWater Quality Sampling Results
1 2 2 3 4 5 5 6 6 7 8 9 10 1112/28/2021 12/10/2021 12/29/2021 12/29/2021 12/10/2021 12/13/2021 12/28/2021 12/13/2021 12/28/2021 12/10/2021 12/29/2021 12/29/2021 12/29/2021 12/29/2021
N FD N N N N FD N N N FD N N N N N N FD N N N N
Parameter UnitsLast UpdatedExceedance Key
Field ParametersDissolved oxygen mg/l 6.47 -- 9.49 4.58 7.24 4.16 -- 3.55 5.50 4.60 -- 3.84 BQX 3.13 4.37 3.68 5.15 7.74 -- 5.28 10.92 6.61 3.99pH pH units 7.78 -- 7.52 6.87 7.32 6.60 -- 6.99 6.88 7.23 -- 6.87 7.43 6.70 7.60 7.54 7.47 -- 7.47 7.35 7.41 7.26Specific conductance @ 25 ºC umhos/cm 335.4 -- 359.4 224.3 182.9 107.4 -- 132.2 221.4 197.4 -- 179.4 168.6 201.5 175.0 360.7 370.0 -- 77.1 79.1 135.3 185.7Temperature deg C 6.9 -- 4.4 1.2 0.2 1.4 -- 0.8 2.0 0.4 -- 2.1 1.1 4.0 1.7 7.0 4.5 -- 0.7 0.0 0 0.1
General ParametersAlkalinity, total, as CaCO3 mg/l 180 177 179 112 80.3 49.2 50.8 48.4 111 81.2 81.4 91.8 73.9 103 77.0 188 192 184 -- -- -- --Chloride mg/l 0.78 J 0.80 J 0.78 J 1.0 0.94 J 0.89 J 0.88 J 1.0 J 1.2 1.0 1.0 1.7 2.0 1.5 1.6 0.92 J 0.89 J 0.88 J -- -- -- --Hardness, as CaCO3 ug/l 171000 180000 166000 118000 81900 63700 65500 68500 118000 85900 88300 94500 85400 111000 85000 187000 180000 177000 -- -- -- --Solids, settleable ml/l/hr < 0.10 UH < 0.10 UH < 0.10 UH < 0.10 UH < 0.10 UH < 0.10 UH 0.90 H 4.0 H < 0.10 UH < 0.10 UH < 0.10 UH < 0.10 UH < 0.10 UH < 0.10 UH < 0.10 UH < 0.10 UH < 0.10 UH < 0.10 UH -- -- -- --Sulfate, as SO4 mg/l 3.8 J+ 3.9 3.6 2.5 3.7 0.71 J 0.68 J 1.0 3.1 4.4 4.4 2.0 1.6 2.5 2.8 2.7 2.6 2.6 -- -- -- --
Dissolved MetalsIron ug/l 192 189 529 1170 1250 6810 6860 12600 1680 2090 2110 2230 4120 J 2180 3040 641 752 726 -- -- -- --
Total MetalsCalcium ug/l 41400 43600 40300 28500 19600 15800 16300 16900 28800 20800 21400 23000 21000 27100 20900 45300 43700 42900 -- -- -- --Iron ug/l 521 538 559 1880 1830 14300 14700 36500 2360 2500 2600 2770 3650 J 2960 3500 796 842 825 -- -- -- --Magnesium ug/l 16500 17400 15800 11500 8000 5890 6020 6390 11100 8240 8470 8990 8000 10400 7960 18100 17200 16800 -- -- -- --
Sample Type
Location 1 3 4 7Date 12/10/2021 12/13/2021 12/29/2021 12/28/2021
Page 1 of 21/27/2022
\\barr.com\projects\Duluth\49 WI\16\49161299 Line 3 Replacement Geotech Sur\WorkFiles\01_Uncontrolled Flow Assistance\08_Monitoring and Submittals\MP1102\Environmental Monitoring\Data Mgmt\Surface_Water_Analytical_Data_Summary_202201
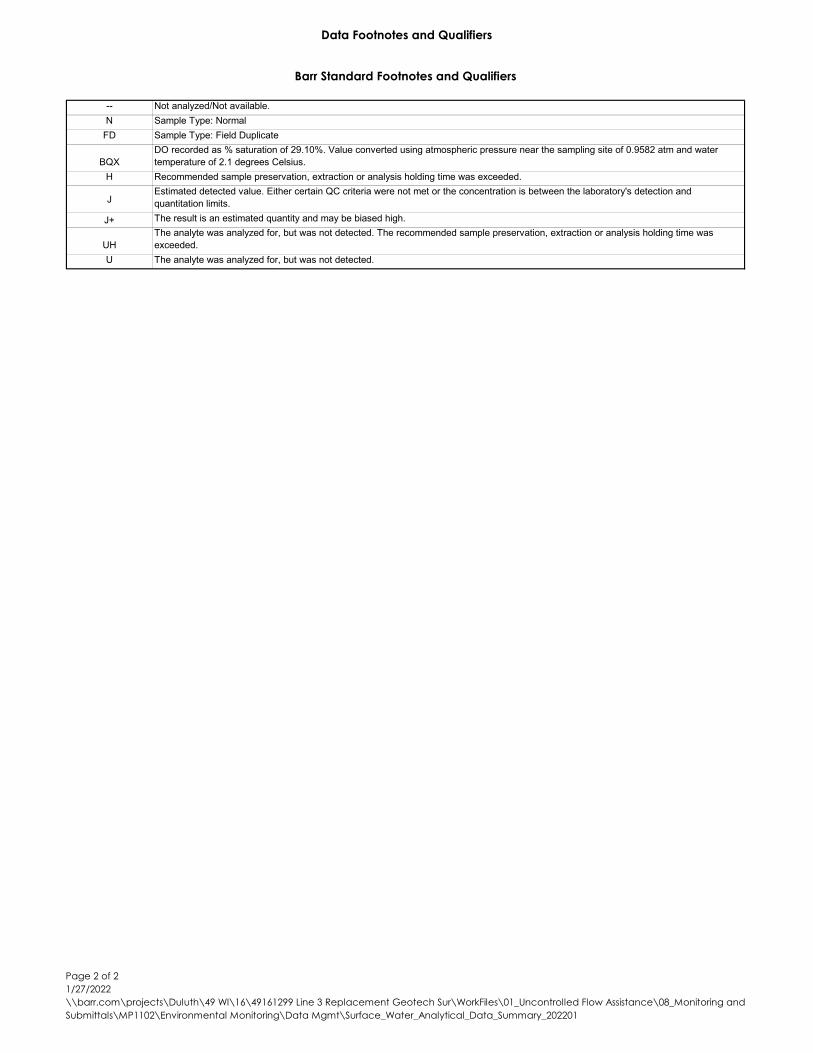
Data Footnotes and Qualifiers
-- Not analyzed/Not available.N Sample Type: Normal
FD Sample Type: Field Duplicate
BQXDO recorded as % saturation of 29.10%. Value converted using atmospheric pressure near the sampling site of 0.9582 atm and water temperature of 2.1 degrees Celsius.
H Recommended sample preservation, extraction or analysis holding time was exceeded.
JEstimated detected value. Either certain QC criteria were not met or the concentration is between the laboratory's detection and quantitation limits.
J+ The result is an estimated quantity and may be biased high.
UHThe analyte was analyzed for, but was not detected. The recommended sample preservation, extraction or analysis holding time was exceeded.
U The analyte was analyzed for, but was not detected.
Barr Standard Footnotes and Qualifiers
Page 2 of 21/27/2022\\barr.com\projects\Duluth\49 WI\16\49161299 Line 3 Replacement Geotech Sur\WorkFiles\01_Uncontrolled Flow Assistance\08_Monitoring and Submittals\MP1102\Environmental Monitoring\Data Mgmt\Surface_Water_Analytical_Data_Summary_202201
Appendix F
Barr SOP’s

Standard Operating Procedure Collection of Groundwater Samples using
Low-Flow Purging and Sampling
Revision 2
April 26, 2021
Approved By:
John W. Juntilla 04/26/21 Print Technical Reviewer Signature Date
Michael Dupay 04/26/21 Print QA Manager Signature Date
Review of the SOP has been performed and the SOP still reflects current practice.
Initials: Date:
Initials: Date:
Initials: Date:
Initials: Date:
Collection of GW Samples using Low-Flow Purging and Sampling
Page 2 of 10 Revision Date: 04/26/21
Printed Copy is Uncontrolled. Controlled copy is maintained on the internal Barr network. Print a new copy each tim
e a hard copy is required.
Collection of Groundwater Samples using Low-Flow Purging and Sampling
1.0 Scope and Applicability The purpose of this Standard Operating Procedure (SOP) is to describe the methods used for low-flow purging and sampling of monitoring wells. Low-flow sampling maximizes the potential for representative groundwater samples. A representative groundwater sample should accurately reflect the physical and chemical properties of the groundwater in the portion of the formation open to the well. This SOP also provides details regarding the measurement of groundwater stabilization criteria, and identification of common container, preservative, and holding times for typical groundwater sample analyses. The recommended procedures in this SOP should be followed unless conditions make it impractical or inappropriate to do so. Modifications should be noted in the applicable documentation and communicated to appropriate personnel. Significant changes may result in a revision or newly created SOP.
2.0 Limitations Sample collection methods can vary by project. If not specified in the project scope of work
and/or documentation (e.g., Work Plan, Sampling Analysis Plan (SAP), or Quality Assurance Project Plan (QAPP)), consult with the appropriate regulatory agency for guidance.
Best practice is to have a minimum of one week pass between monitoring well development and monitoring well sampling unless there are other project requirements.
It is recommended that low-flow sampling be conducted when the air temperature is above 32 °F (0 °C). If the procedure is used below 32 °F, special precautions will need to be taken to prevent the groundwater from freezing in the equipment. Ice formation in the flow-through-cell will cause the monitoring probes to act erratically. A transparent flow-through-cell should be used to observe if ice is forming in the cell.
Direct sun light and hot ambient air temperatures may cause the groundwater in the tubing and flow-through-cell to heat up. This may cause the groundwater to degas which will result in loss of volatile organic compounds (VOCs) and dissolved gases. When sampling under these conditions, the sampler will need to shade the equipment from the sunlight (e.g., umbrella, tent, etc.). The tubing exiting the monitoring well should be kept as short as possible to avoid the sun light or ambient air from heating up the groundwater.
Collection of groundwater samples from residential/water supply systems are not discussed within this SOP.
Dedicated sampling equipment and/or decontamination of sampling equipment is required to prevent cross-contamination.
Sample collection using ‘clean hands/dirty hands’ methods is not discussed within this SOP. If sampling for per- and polyfluorinated alkyl substances (PFAS), special consideration must be
taken to avoid accidental contamination of environmental samples - see Barr’s SOP ‘Collection of Per- and Polyfluorinated Alkyl Substances (PFAS) Samples’.
Collection of GW Samples using Low-Flow Purging and Sampling
Page 3 of 10 Revision Date: 04/26/21
Printed Copy is Uncontrolled. Controlled copy is maintained on the internal Barr network. Print a new copy each tim
e a hard copy is required.
3.0 Responsibilities The Project Manager, in conjunction with the client, develops the site-specific scope of work (e.g., Work Plan, SAP, etc.). Experienced Field Technician(s) are responsible for the measurement of well pumping rates, field screening procedures, field equipment and calibration, proper sample identification, collection of samples, quality control procedures, and documentation. They should be familiar with the procedures described in this document and use professional judgment when sampling, especially when conditions are not routine, in order to collect a representative sample. Equipment Technicians are responsible for maintaining equipment in working order and aiding in troubleshooting equipment issues. The role of the Field Safety Representative is to oversee on-site safety activities. Project staff are responsible for ordering sample containers prior to the sampling event.
4.0 Safety Barr staff is responsible for conducting the aspects of the job safely. When applicable, refer to the appropriate Project Health and Safety Plan (PHASP) to understand the hazards associated with suspected contamination, symptoms of exposure, methods to minimize exposure, personal protective equipment (PPE), and personal air monitoring required when using this SOP. Minimum protection of one pair of chemical resistant gloves (e.g., nitrile) and safety glasses with side shields should be worn to prevent sample contact with the skin and eyes. When sampling waters contaminated with corrosive materials, emergency eye flushing facilities should be available.
5.0 Equipment, Reagents, and Supplies* Water quality meter (e.g., YSI, or
equivalent) Pump (peristaltic^, submersible, bladder)
power source, and appropriate drive tubing Turbidimeter Compressed air source (bladder pump only) Water level indicator Ring stand, or equivalent, to secure tubing Graduated measuring container Sample tubing# Clock or stopwatch Chemical resistant gloves (e.g., nitrile) Inline filters (if applicable) Calculator Sample containers (method specific) Plastic bags Waterproof ink pen or pencil Items listed in Section 8.0 Records Coolers and ice Decontamination supplies (see Decon SOP)
* See Barr’s PFAS SOP for a list of prohibited and acceptable items. ^Due to the negative pressure used to lift the sample when using a peristaltic pump, loss of some VOCs could occur,
especially at depths to groundwater approaching suction lift limitations (>20 feet). The project team should decide if VOCs should be collected from a peristaltic pump based on their project requirements.
#Teflon® tubing is preferred when sampling VOCs, SVOCs, pesticides, PCBs, and inorganics but not when collecting PFAS. Other materials may be used if information is available showing that there is no leaching of contaminants or interferences for the analyses being performed. PVC, polypropylene or polyethylene tubing may be used when collecting samples for metals and other inorganics.
Collection of GW Samples using Low-Flow Purging and Sampling
Page 4 of 10 Revision Date: 04/26/21
Printed Copy is Uncontrolled. Controlled copy is maintained on the internal Barr network. Print a new copy each tim
e a hard copy is required.
6.0 Procedure This section addresses the procedure(s) for calibrating field equipment, measuring pumping rates, well purging, measuring well stabilization, and the sampling, handling, and delivery involving groundwater sampling. Best practices include setting up the purging, stabilization, and sampling equipment in an upwind direction from any potential source of contamination.
Calibration The water quality meter and turbidimeter will be calibrated as per the applicable Barr SOP. The meters will undergo calibration checks, at a minimum, before and after sampling. The calibration check will be documented on a calibration form (as appropriate) and/or in the field notebook. Significant issues found during the calibration check will be handled as per the applicable Barr SOP, noted in the field notebook, and the Equipment Technicians will be notified.
Purging/Well Stabilization/Sampling Prior to sampling, water levels are measured (see applicable Barr SOP) and purging of the monitoring well is performed to remove stagnant water from within the well and to stabilize the well to allow for representative groundwater sample collection. The term ‘purge volume’ refers to the amount of water removed from a well before groundwater sample collection occurs. Low-flow purging may be completed using one of the following, depending on the well and the sampling requirements: an electric submersible pump, bladder pump, or peristaltic pump. Pumps constructed of stainless steel or Teflon® are preferred but other materials may be used if information is available showing that there is no leaching of contaminants or interferences for the analyses being performed (e.g., PFAS). Dedicated equipment should be installed when possible to minimize disturbance in the well. Non-dedicated (portable) sampling devices will be slowly and carefully lowered into the well to minimize disturbance. The intake port for the pump being used will be placed at a depth typically near the middle of the water column within the well screen interval. Pumping rates during low-flow purging are typically kept below 500 mL/min; however, this is dependent on the site-specific hydrogeology and will be adjusted to minimize drawdown during purging. Drawdown is the lowering of the water level in a monitoring well due to water being evacuated (purged) faster than the groundwater recharge rate. An electronic water level indicator will be used to determine that a minimal amount of drawdown is occurring within the well, ideally, no more than 4 inches (0.33 ft). Flow rate will be measured using a graduated measuring container and a watch/clock. During the first purge/sampling event, a purge rate will be established for each monitoring well. Samplers should attempt to match the same purge rate during subsequent events, if possible. Pump powering equipment that generates air emissions will be kept downwind of the well that is being sampled. If the well was purged dry at the intake tubing, the samples should be collected within 24 hours of when the well was purged dry or when sufficient recharge allows (e.g., enough volume for analyses). If there is insufficient sample volume for the analyses being sampled, the project team will need to decide if sampling should be carried out or if a reduced prioritized list of analyses should be collected.

Collection of GW Samples using Low-Flow Purging and Sampling
Page 5 of 10 Revision Date: 04/26/21
Printed Copy is Uncontrolled. Controlled copy is maintained on the internal Barr network. Print a new copy each tim
e a hard copy is required.
6.2.1 Peristaltic Pump Purging
A peristaltic pump is used when the water level is within suction lift (e.g., within about 25 feet of the ground surface but may be less at higher altitudes). It usually is a low-volume suction pump with low pumping rates suitable for sampling shallow, small-diameter wells.
Put on gloves for skin protection and to prevent sample contamination. Lower tubing intake into the well and secure at desired depth typically near the middle of the
water column within the well screen interval. Connect the well tubing to the drive tubing entering the pump. Connect the drive tubing exiting the pump to the short section of tubing entering the flow-
through cell or graduated measuring container. Set the pump speed to zero. Turn on pump and slowly increase the speed to the desired rate of
flow. Attach the flow-through-cell for the water quality meter after initial turbidity in the purge water
has cleared visually. Sampling may begin once the well has stabilized (see Section 6.2.4, Well Stabilization of this SOP).
6.2.2 1.5-inch Submersible Pump Purging (Temporary or Dedicated)
A submersible pump is used when the water level is greater than the suction lift associated with a peristaltic pump. It can purge water from depths down to 200 feet depending on pump model and manufacturer. A variable speed controller is required for operation of the pump. There are a variety of speed controllers available, typically designed for a specific pump.
Put on gloves for skin protection and to prevent sample contamination. Attach appropriate diameter tubing to pump intake, lower pump, and secure at desired depth
typically near the middle of the water column within the well screen interval. Cut off tubing, allowing additional tubing length for discharge. Set the controller speed or voltage to zero. Plug the pump into the controller. Attach the controller to the power supply. Turn on the controller and dial the speed control to the desired flow rate and measure the flow
rate with the graduated measuring container. The controller can slow the purge rate down to the optimum rate. Note: If the submersible pump is not running, turn off the pump and then disconnect from the power supply. Check connections and try again.
Attach the flow-through-cell for the water quality meter after initial turbidity in the purge water has cleared visually.
Sampling may begin once the well has stabilized (see Section 6.2.4, Well Stabilization of this SOP). 6.2.3 Bladder Pump Purging
A bladder pump may be used when the static water level is > 25 feet or at shallower depths when concerns with VOC loss via peristaltic pumping is identified by the project team.
Put on gloves for skin protection and to prevent sample contamination.
Collection of GW Samples using Low-Flow Purging and Sampling
Page 6 of 10 Revision Date: 04/26/21
Printed Copy is Uncontrolled. Controlled copy is maintained on the internal Barr network. Print a new copy each tim
e a hard copy is required.
Hook air and sampling tubing to the pump. Lower pump into the well at the desired depth typically near the middle of the water column
within the well screen interval. Attach the air side of the tubing to the controller. Attach controller to the air source (e.g., air compressor or compressed CO2). Set the air pressure to the manufacturer’s recommendation based on the well depth. Set the number of pumping cycles, recovery times, and discharge times. When water flows from discharge of the pump, adjust the flow according to desired flow rate and
measure the flow rate with the graduated measuring container. Attach the flow-through-cell for the water quality meter after initial turbidity in the purge water
has cleared visually. Sampling may begin once the well has stabilized (see Section 6.2.4, Well Stabilization of this SOP).
6.2.4 Well Stabilization
Well stabilization is typically conducted to help verify that the groundwater sample is representative of aquifer conditions. A well is considered ‘stabilized’ after the groundwater (or well) stabilization parameter measurements are within acceptable limits for three consecutive readings. The stabilization parameters should be monitored at a frequency of five-minute intervals or greater unless there are other project requirements. The pump’s flow rate must be able to ‘turn over’ at least one flow-through cell volume between measurements (e.g., flow rate = 50 mL/min, flow-through cell = 250 mL, monitor every five minutes; every 10 minutes with a 500 mL flow-through cell). Well stabilization parameters may vary by project or regulatory agency but at a minimum typically include pH, specific conductance (temperature corrected electrical conductivity), oxidation-reduction potential (ORP), turbidity, and dissolved oxygen (DO). Temperature should also be measured and recorded but will not be used to determine stability. Turbidity and DO usually require the longest time for stabilization. Most wells should stabilize within two hours. Prior to going on-site, review previous low-flow groundwater sampling logs from the site (if available) and discuss with the project or task manager what should be done if wells take longer than two hours to stabilize (e.g., collect a pair of filtered/unfiltered samples for metals analysis when turbidity > 5 NTU). Initially, the field technician should verify that the field equipment is functioning properly, and that operator error is not an issue. If the checks produce no new insight, one of three optional courses of action may be taken: 1) continue purging until stabilization is achieved, 2) discontinue purging, do not collect any samples, and record in the field log data sheets or field notebook and in the Field Sampling Report that stabilization could not be achieved (documentation must describe attempts to achieve stabilization), or 3) discontinue purging, collect samples and clearly document in the field log data sheets or field notebook and in the Field Sampling Report that stabilization was not achieved. The procedure to stabilize a well includes recording well stabilization parameter measurements collected with the water quality meter during the well purging process and recording the purged well volumes. Groundwater aliquots used for stabilization parameter measurements (aside from turbidity) are measured by utilizing in-line, flow-through cell equipment. Turbidity is typically measured with a standalone
Collection of GW Samples using Low-Flow Purging and Sampling
Page 7 of 10 Revision Date: 04/26/21
Printed Copy is Uncontrolled. Controlled copy is maintained on the internal Barr network. Print a new copy each tim
e a hard copy is required.
turbidimeter by collecting samples from a sample port on a sampling valve installed upstream of the flow-through-cell. Documentation of the well stabilization process typically includes recording pertinent information such as the pump type, pumping rate, volume pumped, and well stabilization measurements on the field log data sheets or field notebook. The well may be sampled after three consecutive measurements are within specific project criteria or the criteria presented in Section 7.2, Measurement Criteria of this SOP. 6.2.5 Sampling
After the well has been purged and stabilized, disconnect the tubing exiting the pump from the flow-through cell or sampling valve if used. Do not collect samples from the discharge of the flow-through cell. The same pump that is used for purging will be used for low-flow sampling. The project team will determine the order for sampling the wells, but general guidelines are below:
Where water quality data are available, the least contaminated wells would be sampled first, proceeding to increasingly contaminated wells.
Where the distribution of contaminants is not known, wells considered to be upgradient from likely sources of contamination would be sampled first and downgradient wells closest to the suspected contamination would be last.
Make certain to keep records of the order in which wells were sampled. To reduce potential contamination, samples for PFAS should be collected first. See Barr’s SOP ‘Collection of Per- and Polyfluorinated Alkyl Substances (PFAS) Samples’. To prevent the possible loss of some volatile organic compounds (VOCs), samples for volatile parameters should be collected first with as little agitation and disturbance as possible, then proceed in order towards the least volatile parameter as listed in Barr’s ‘Water Sampling Guidelines’ form. The 40 mL vials used to collect the VOC samples should be checked for air bubbles. Air bubbles may be caused by insufficient meniscus when sealing the vial, degassing after sample collection or during sample shipment, or reaction between the sample and preservative (HCl). If air bubbles > 6 mm (pea-sized) are observed during sampling, discard the vial and recollect the sample using a new vial. If air bubbles are believed to be due to the sample reacting with the preservative, the sample should be collected in an unpreserved vial if possible. Depending on project requirements, groundwater samples being analyzed for metals may or may not be filtered and in some cases, both filtered and unfiltered samples may be collected. If samples are to be filtered, see Barr’s SOP ‘Filtering of Water Samples’. Inline filters should typically be used to collect field filtered samples. Put on new sampling gloves at each sampling site to reduce the risk of sample cross-contamination and exposure to skin. Never reuse gloves. Prepare sampling containers by filling out the label, using an indelible permanent pen, with the following information at a minimum:
Sample ID Date and time of sample collection
Collection of GW Samples using Low-Flow Purging and Sampling
Page 8 of 10 Revision Date: 04/26/21
Printed Copy is Uncontrolled. Controlled copy is maintained on the internal Barr network. Print a new copy each tim
e a hard copy is required.
Preservative Sample analysis (if required by the lab)
When filling the containers, do not insert the tubing into the containers and do not overfill preserved containers. When samples are containerized, place the filled sample containers in a sampling cooler with ice, turn off any equipment, disassemble the sampling apparatus, carefully remove non-dedicated equipment to minimize disturbance to the well, dispose of one-time use (disposable) equipment, and decontaminate reusable equipment per Barr’s SOP ‘Decontamination of Sampling Equipment’. 6.2.6 Preservation
Container volume, type, and preservative are important considerations in sample collection. Container volume must be adequate to meet laboratory requirements for quality control, split samples, or repeat analyses. The container type varies with the analysis required. Typically, the analytical laboratory will preserve the container before shipment. Preservation and shelf life vary; contact the laboratory to determine if an on-hand container is still useful. Barr’s ‘Water Sampling Guidelines’ form lists the parameter, container type, container volume, and preservative for many of the most common parameters collected. 6.2.7 Handling
The samples will be bubble wrapped or bagged after collection, stored in a sample cooler, and packed on double bagged wet ice. Samples will be kept cold (≤ 6 °C, but not frozen), until receipt at the laboratory (where applicable). Note: Samples may need to be stored indoors in winter to prevent freezing.
6.2.8 Shipment/Delivery
Once the cooler is packed to prevent breaking of bottles, the proper chain-of-custody (COC) documentation is signed and placed inside a plastic bag then added to the cooler. Samples will be kept secured to prevent tampering. If sample coolers are left in a vehicle or field office for temporary storage, the area will be locked and secured. Custody seals may be present, but at a minimum, the coolers must be taped shut to prevent the lid from opening during shipment. The coolers must be delivered to the laboratory via hand or overnight delivery courier, if possible, in accordance with Federal, State and Local transportation regulations and Barr’s SOP ‘Domestic Transport of Samples to the Laboratory’.
Data Reduction/Calculations No data reduction or calculations are associated with this procedure.
Disposal Waste generated by this process will be disposed of in accordance with Federal, State and Local regulations and Barr’s SOP ‘Investigative Derived Waste’. Where reasonably feasible, technological changes have been implemented to minimize the potential for environmental pollution.
Collection of GW Samples using Low-Flow Purging and Sampling
Page 9 of 10 Revision Date: 04/26/21
Printed Copy is Uncontrolled. Controlled copy is maintained on the internal Barr network. Print a new copy each tim
e a hard copy is required.
7.0 Quality Control and Quality Assurance (QA/QC) The QC activities described below allow the self-verification of the quality and consistency of the work.
QA/QC Samples QA/QC samples are defined in Barr’s SOP ‘Collection of Quality Control Samples’. The sampling frequency should be performed at the frequency noted in the project scope of work and/or documentation (e.g., Work Plan, SAP, or QAPP).
Well Stabilization Criteria Well stabilization criteria to be used if there are no project specific criteria:
pH ± 0.1 standard units Temperature ± 3% Specific conductance ± 3% ORP ± 10 mV Dissolved oxygen ± 10% (> 0.5 mg/L)
Note: Three consecutive readings ≤ 0.5 mg/L can be considered stabilized. Turbidity ± 10% (> 5 Nephelometric Turbidity Units (NTU))
Note: Three consecutive readings ≤ 5 NTU can be considered stabilized.
8.0 Records The field technician will document the flow rate, drawdown, time purged, volume purged, water level, total well depth, stabilization test measurements, and any unusual conditions that occurred (e.g., excessive drawdown, noticeable discoloration, presence of sediment, odor in the water, etc.) on the field log data sheet and/or field notebook. They will also document the type and number of bottles on the chain-of-custody record, as appropriate. The analysis for each container and the laboratory used will be documented on the chain-of-custody record. Refer to Barr’s SOP ‘Documentation on a Chain-of-Custody (COC)’ for further information. Examples of common field documentation are available in Barr’s “Compendium of Field Documentation”. Field documentation specific to this SOP are listed below:
COC Sample label Custody Seal (if applicable) Water Level Data Sheet Field Log Data Sheet Field Log Cover Sheet Field Sampling Report Water Sampling Guidelines (includes sampling order, container, preservation, and holding time)
The field documents and COCs are provided to a Barr Data Management Administrator for storage on the internal Barr network.
Collection of GW Samples using Low-Flow Purging and Sampling
Page 10 of 10 Revision Date: 04/26/21
Printed Copy is Uncontrolled. Controlled copy is maintained on the internal Barr network. Print a new copy each tim
e a hard copy is required.
Additional records information can be found in Barr’s “Records Management System Manual”. Other Barr SOP subjects referenced within this SOP: water level measurement, water quality meter, turbidimeter, well development, filtering of water samples, collection of QC samples, collection of PFAS samples, decontamination of sampling equipment, investigative derived waster, domestic transport of samples, and documentation on a COC.
9.0 References Environmental Protection Agency, Region 1. 1996, revised 2010 and 2017. Low Stress (low-flow) Purging and Sampling Procedure for the Collection of Groundwater Samples from Monitoring Wells.
Environmental Protection Agency, EPA/540/S-95/504. 1996. Groundwater Issue. Low-Flow (Minimal Drawdown) Ground-water Sampling Procedures. Environmental Protection Agency. Title 40 of the Code of Federal Regulations, Part 136.3.
Michigan Department of Environmental Quality. 2004. RRD Operational Memorandum No.2, Attachment 5.
Standard Operating Procedure Collection of Low Level Mercury Water Samples
Revision 8
April 13, 2021
Approved By:
Seth R. Noland 04/13/21 Print Technical Reviewer Signature Date
Michael Dupay 04/13/21 Print QA Manager Signature Date
Review of the SOP has been performed and the SOP still reflects current practice.
Initials: Date:
Initials: Date:
Initials: Date:
Initials: Date:
Collection of Low Level Mercury Water Samples
Page 2 of 7 Revision Date: 04/13/21
Printed Copy is Uncontrolled. Controlled copy is maintained on the internal Barr network. Print a new copy each tim
e a hard copy is required.
Collection of Low Level Mercury Water Samples
1.0 Scope and Applicability The purpose of this Standard Operating Procedure (SOP) is to describe the method used when collecting low level mercury groundwater or surface water samples by a two-person sampling team using the ‘clean hands/dirty hands’ approach. The recommended procedures in this SOP should be followed unless conditions make it impractical or inappropriate to do so. Modifications should be noted in the applicable documentation and communicated to appropriate personnel. Significant changes may result in a revision or newly created SOP.
2.0 Limitations Sample collection methods can vary by project. If not specified in the project scope of work
and/or documentation (e.g., Work Plan, Sampling Analysis Plan (SAP), or Quality Assurance Project Plan (QAPP)), consult with the appropriate regulatory agency for guidance.
This method is not intended for collection of samples from treated and untreated industrial discharges.
Low level mercury samples are susceptible to contamination from many sources, including improperly cleaned equipment; improper sample-collection techniques that allow dust, dirt, or metallic surfaces to contact samples; contaminated preservatives; atmospheric inputs from dust, dirt and rain; and the breath of field personnel having dental amalgam fillings, if the breath contacts the sample.
Dedicated sampling equipment and/or decontamination of sampling equipment should be used to prevent cross-contamination, where applicable.
3.0 Responsibilities The Project Manager, in conjunction with the client, develops the site-specific scope of work (e.g., Work Plan, SAP, etc.). Experienced Field Technician(s) are responsible for the proper sample identification, collection of samples, quality control procedures, and documentation. Equipment Technicians are responsible for maintaining equipment in working order and aiding in troubleshooting equipment issues. The role of the Field Safety Representative is to oversee on-site safety activities. Project staff are responsible for ordering sample bottles prior to the sampling event.
4.0 Safety Barr staff is responsible for conducting the aspects of the job safely. When applicable, refer to the appropriate Project Health and Safety Plan (PHASP) to understand the hazards associated with suspected contamination, symptoms of exposure, methods to minimize exposure, personal protective equipment (PPE), and personal air monitoring required when using this SOP. Minimum protection of one pair of
Collection of Low Level Mercury Water Samples
Page 3 of 7 Revision Date: 04/13/21
Printed Copy is Uncontrolled. Controlled copy is maintained on the internal Barr network. Print a new copy each tim
e a hard copy is required.
chemical resistant gloves (e.g., nitrile) and safety glasses with side shields should be worn to prevent sample contact with the skin and eyes. When sampling waters contaminated with corrosive materials, emergency eye flushing facilities should be available. Some of the sample containers may require the use of preservatives. Consult the applicable Safety Data Sheet to review hazards and appropriate PPE to minimize exposure. 5.0 Equipment, Reagents, and Supplies
Water quality meter (e.g., YSI or equivalent) (optional)
Chemical resistant, powder-less gloves (e.g., nitrile) (various lengths)
Turbidimeter (optional) Peristaltic pump (optional) Fluoropolymer or glass sample bottles
with appropriate preservative Clean, nylon wind suits or disposable Tyvek®
Fluoropolymer tubing (optional, or equivalent)
Plastic bags
Coolers Waterproof ink pen or pencil Ice (optional) Items listed in Section 8.0 Records Inline 0.45 um filter (or equivalent, e.g.,
stand-up) Decontamination supplies (see Decon SOP)
6.0 Procedure This section describes the procedure(s) for the sampling, handling, and delivery of low level mercury water samples. Care must be taken during sampling operations to minimize exposure of the sample to human, atmospheric, and other sources of contamination. Samples should be collected facing upstream or upwind, at least 100 feet away from metal supports, bridges, wires, poles, busy roadways and from areas of lowest concentration to highest concentration whenever possible to minimize the introduction of contamination. Low level mercury samples should be collected first at each sampling location.
Where water quality data are available, the least contaminated wells would be sampled first, proceeding to increasingly contaminated wells.
Where the distribution of contaminants is not known, wells considered to be up gradient from likely sources of contamination would be sampled first and downgradient wells closest to the suspected contamination would be last.
Keep records of the order in which wells were sampled.
Calibration If field equipment such as a water quality meter or turbidimeter are used, they will be calibrated as per the applicable Barr SOP. The meters will undergo calibration checks, at a minimum, before and after sampling. The calibration check will be documented on a calibration form (as appropriate) and/or in the field notebook. Any significant issues found during the calibration check will be noted in the field notebook and the Equipment Technicians will be notified.
Purging/Sampling Purging may be necessary to remove stagnant water from within a monitoring well and to stabilize the well to allow for representative groundwater sample collection. Standard purging procedures and
Collection of Low Level Mercury Water Samples
Page 4 of 7 Revision Date: 04/13/21
Printed Copy is Uncontrolled. Controlled copy is maintained on the internal Barr network. Print a new copy each tim
e a hard copy is required.
sampling equipment for groundwater monitoring wells are defined in Barr’s SOP ‘Collection of Groundwater Samples from a Temporary or Permanent Monitoring Well (Includes Well Purging and Stabilization)’ or low-flow purging procedures and sampling equipment are defined in Barr’s SOP ‘Collection of Groundwater Samples using Low-Flow Purging and Sampling’. Surface sampling procedures and sampling equipment are defined in Barr’s SOP ‘Collection of Surface Water Samples’. During purging the field crew should limit movement/activity to minimize disturbance to the area. The information below addresses purging and sample collection by a two-person team using a ‘clean hands/dirty hands’ approach. Prior to purging and/or sampling, one member of the two-person sampling team is designated as "dirty hands"; the second member is designated as "clean hands." If a pump is being used, “dirty hands” opens any outer bags and “clean hands” opens the inner bag and removes the contents. “Clean hands” installs any item in contact with the water (e.g., tubing, pump, water level). “Dirty hands” turns on the pump and sets the flow rate. Based on the applicable Barr SOP and project requirements, samples are collected after the well is stabilized. 6.2.1 Collection
Operations involving contact with the sample bottle and transfer of the sample from the sample collection device to the sample bottle are handled by the individual designated as "clean hands." The individual responsible for preparation of the sampler (except the sample bottle itself), operation of any machinery, and for other activities that do not involve direct contact with the sample, is designated as “dirty hands". If a field blank is being generated, it should be collected first. Prepare sample bottles by filling out the label, using a waterproof pen, with the following information at a minimum. Samples can be labeled directly on outside bag, minimizing potential for contaminating sample.
Sample ID Date and time of sample collection Preservative Sample analysis (if required by the lab)
Wear a disposable Tyvek® suit or a clean, nylon wind suit over clothing. Put on new sampling gloves at each sampling site to reduce the risk of sample cross-contamination and exposure to skin. Never reuse gloves. When sampling surface water, “clean hands” should wear a glove length under the wrist-length glove that will account for the depth of the sample being taken (e.g., elbow or shoulder length). The use and type of suit or gloves may vary depending on project requirements. It is recommended that samples be filtered and/or preserved at the laboratory due to the potential for contamination and the hazards of BrCl (bromine monochloride); however, if holding time is an issue, filtration may be done in the field by the “Dirty hands” using an inline (or stand-up) filter per Barr’s SOP ‘Filtering of Water Samples’.
“Dirty hands” opens the outside plastic bag. "Clean hands" opens the inside bag containing the sample bottle, removes the bottle, and reseals
the inside bag.
Collection of Low Level Mercury Water Samples
Page 5 of 7 Revision Date: 04/13/21
Printed Copy is Uncontrolled. Controlled copy is maintained on the internal Barr network. Print a new copy each tim
e a hard copy is required.
"Dirty hands" reseals the outer bag. “Clean hands” unscrews the cap and places the sample bottle at the groundwater tubing flow
outlet or submerges the bottle into the water body for a surface water sample. When collecting the field blank, pour the field blank bottle supplied by the lab into the sample bottle and label this bottle as the field blank. The field blank should be collected first. Do not insert tubing into the bottles, avoid breathing directly over the samples, and do not overfill preserved bottles. “Clean hands” fills bottle to the top and replaces the cap.
"Dirty hands" reopens the outer plastic bag. “Clean hands" opens the inside bag, places the bottle inside it, and zips the inner bag. "Dirty hands" zips the outer bag, attaches the sample label to the outside bag, and places the
sample bottle into cooler with bagged ice. Note: The samples should be double wrapped individually (as received from the laboratory) and stored in a separate cooler from other sample parameters.
“Dirty hands” measures and records the depth to the bottom of the well. “Clean hands” removes the equipment from the well. Dispose of one-time use (disposable) equipment and decontaminate reusable equipment per Barr’s SOP ‘Decontamination of Sampling Equipment’. After decontamination, large Ziploc bags should be used to place sampling equipment during transportation to the next sample location. (per MDEQ policy). Due to the low analytical reporting limits required for low level mercury and the possibility of contamination in the field environment, laboratory filtration is preferred over field filtration methods for dissolved low level mercury. 6.2.2 Preservation
Sample bottles are either fluoropolymer or glass with fluoropolymer or fluoropolymer-lined caps. Bottle volume should be adequate to meet laboratory requirements for quality control, split samples, or repeat analyses. Sample bottles may be sent from the laboratory with or without preservative. As noted previously, it is recommended that samples be preserved at the laboratory due to the potential for contamination and the hazards of BrCl. Samples are filtered and/or preserved upon receipt at the laboratory using either 5 mL/L of pretested 12N HCl (hydrochloric acid) or 5 mL/L of BrCl solution. Samples must be filtered within 24 hours and preserved or analyzed within 48 hours of sample collection. The time to preservation may be extended to 28 days if a sample is oxidized in the sample bottle. Preserved samples must be analyzed within 90 days of sample collection. 6.2.3 Handling
The double-bagged samples will be stored in a sample cooler and packed on double bagged wet ice (optional; thermal preservation is not required by the method). Note: Samples may need to be stored indoors in winter to prevent freezing.
6.2.4 Shipment/Delivery
Once the cooler is packed to prevent breaking of bottles, the proper chain-of-custody (COC) documentation is signed and placed inside a plastic bag then added to the cooler. Samples will be kept secured to prevent tampering. If sample coolers are left in a vehicle or field office for temporary storage, the area will be locked and secured.
Collection of Low Level Mercury Water Samples
Page 6 of 7 Revision Date: 04/13/21
Printed Copy is Uncontrolled. Controlled copy is maintained on the internal Barr network. Print a new copy each tim
e a hard copy is required.
Custody seals may be present, but at a minimum, the coolers must be taped shut to prevent the lid from opening during shipment. The coolers must be delivered to the laboratory via hand or overnight delivery courier, if possible, in accordance with Federal, State and Local transportation regulations and Barr’s SOP ‘Domestic Transport of Samples to the Laboratory’.
Data Reduction/Calculations No data reduction or calculations are associated with this procedure.
Disposal Waste generated by this process will be disposed of in accordance with Federal, State and Local regulations and Barr’s SOP ‘Investigative Derived Waste’. Where reasonably feasible, technological changes have been implemented to minimize the potential for environmental pollution.
7.0 Quality Control and Quality Assurance (QA/QC) The QC activities allow the self-verification of the quality and consistency of the work.
QA/QC Samples QA/QC samples are defined in Barr’s SOP ‘Collection of Quality Control Samples’. The sampling frequency should be performed at the frequency noted in the project scope of work and/or documentation (e.g., Work Plan, SAP, or QAPP). To demonstrate that sample contamination has not occurred during field sampling, one field blank should be processed per day or per project requirements.
8.0 Records The field technician will document the order in which the wells were sampled, any potential sources of contamination (e.g., changes in weather, wind direction, activity in the area), and any field test measurements on the field log data sheet and/or field notebook. They will also document the type and number of bottles on the chain-of-custody record, as appropriate. The analysis for each bottle and the laboratory used will be documented on the chain-of-custody record. Refer to Barr’s SOP ‘Documentation on a Chain-of-Custody (COC)’ for further information. Examples of common field documentation are available in Barr’s “Compendium of Field Documentation”. Field documentation specific to this SOP are listed below:
COC Sample label Custody seal (if applicable) Field Log Data Sheet Field Log Cover Sheet Field Sampling Report
The field documents and COCs are provided to a Barr Data Management Administrator for storage on the internal Barr network. Additional records information can be found in Barr’s “Records Management System Manual”.
Collection of Low Level Mercury Water Samples
Page 7 of 7 Revision Date: 04/13/21
Printed Copy is Uncontrolled. Controlled copy is maintained on the internal Barr network. Print a new copy each tim
e a hard copy is required.
Other Barr SOP subjects referenced within this SOP: water quality meter, turbidimeter, collection of groundwater samples, low flow sampling, collection of QC samples, filtering of water samples, decontamination of sampling equipment, and documentation on a COC.
9.0 References Environmental Protection Agency. 2002. Method 1631, Revision E: Mercury in Water by Oxidation, Purge and Trap, and Cold Vapor Atomic Fluorescence Spectrometry.
Environmental Protection Agency. 1996. Method 1669: Sampling Ambient Water for Trace Metals at EPA Water Quality Criteria Levels.
Michigan Department of Environmental Quality, Remediation and Redevelopment Division, RRD-36. 2016. Standard Operating Procedure for Low Level Mercury Sample Collection.
USGS TWRI Book 9, Chapter A5. 2004. Processing of Water Samples, Low-Level Mercury, 5.6.4.B.
Standard Operating Procedure Collection of Quality Control Samples
Revision 8
April 15, 2021
Approved By:
Andrea Nord 04/15/21 Print Technical Reviewer Signature Date
Michael Dupay 04/15/21 Print QA Manager Signature Date
Review of the SOP has been performed and the SOP still reflects current practice.
Initials: Date:
Initials: Date:
Initials: Date:
Initials: Date:

Collection of Quality Control Samples Page 2 of 6 Revision Date: 04/15/21
Printed Copy is Uncontrolled. Controlled copy is maintained on the internal Barr network. Print a new copy each tim
e a hard copy is required.
Collection of Quality Control Samples 1.0 Scope and Applicability The purpose of this Standard Operating Procedure (SOP) is to describe the procedures used in the collection and handling of field quality control (QC) samples: field blanks, equipment (rinsate) blanks, trip blanks, field (masked) duplicate samples, matrix spikes and matrix spike duplicate samples. The recommended procedures in this SOP should be followed unless conditions make it impractical or inappropriate to do so. Modifications should be noted in the applicable documentation and communicated to appropriate personnel. Significant changes may result in a revision or newly created SOP.
2.0 Limitations The type and frequency of quality control samples can vary by project. If not specified in the
project scope of work and/or documentation (e.g., Work Plan, Sampling Analysis Plan (SAP), or Quality Assurance Project Plan (QAPP)), consult with the appropriate regulatory agency for guidance.
Laboratory analysis specific QC samples (e.g., method blanks, laboratory control samples) are not discussed within this SOP.
3.0 Responsibilities Experienced Field Technicians are responsible for the accurate collection of QC samples and the laboratory is responsible for the accurate set-up and analysis of QC samples. Project staff are responsible for ordering sample containers prior to the sampling event. The role of the Field Safety Representative is to oversee on-site safety activities. The Project Manager, in conjunction with the client, develops the site-specific scope of work (e.g., Work Plan, Sampling Analysis Plan (SAP), etc.).
4.0 Safety Barr staff is responsible for conducting the aspects of the job safely. When applicable, refer to the appropriate Project Health and Safety Plan (PHASP) to understand the hazards associated with suspected contamination, symptoms of exposure, methods to minimize exposure, personal protective equipment (PPE), and personal air monitoring required when using this SOP. Minimum protection of one pair of chemical resistant gloves (e.g., nitrile) and safety glasses with side shields should be worn to prevent sample contact with the skin and eyes. When sampling soils contaminated with corrosive materials, emergency eye flushing facilities should be available. Some of the sample containers may require the use of preservatives. Consult the applicable Safety Data Sheet to review hazards and appropriate PPE to minimize exposure.
Collection of Quality Control Samples Page 3 of 6 Revision Date: 04/15/21
Printed Copy is Uncontrolled. Controlled copy is maintained on the internal Barr network. Print a new copy each tim
e a hard copy is required.
5.0 Equipment, Reagents, and Supplies* Laboratory-certified containers appropriate
for the required analysis Matrix specific sampling devices and
equipment Sample containers/media (method specific) Analyte-free water Chemical resistant gloves (e.g., nitrile) Items listed in Section 8.0 Records Sample labels Decontamination supplies (see Decon SOP)
* See Barr’s PFAS SOP for a list of prohibited and acceptable items.
6.0 Procedure This section provides the definitions and sampling procedure(s) for field derived QC samples.
Calibration Calibration is not applicable to this SOP.
Sampling General considerations to be taken into account when planning and conducting sampling operations are the required sample amount, sample holding times, sample handling, and special precautions for trace contaminant sampling. Matrix-specific sampling SOPs should be followed for the collection and preservation of samples. The QC samples will be handled in the same manner as the sample group for which they are intended (i.e., stored and transported with the sample group). 6.2.1 Blank Samples
Blank samples are used to monitor for potential contamination at a sampling site and may consist of field, equipment, rinsate, and trip blank samples. Each of these measure different potential sources of contamination. When collecting a blank for dissolved parameters, the blank water sample should be filtered before adding it to the sample container. 6.2.1.1 Field Blank
A field blank (FB) is prepared on-site and is a sample of analyte-free water exposed to environmental conditions at the sampling site by either 1) transferring the water from one container to another or 2) by removing the lid and exposing a container filled with analyte-free water to the atmosphere for the time necessary to fill the container(s). It measures the potential for sample cross-contamination due to site conditions. 6.2.1.2 Equipment Blank
An equipment blank (EB) is prepared on-site and is a sample of analyte-free water that has been collected after field decontamination of sampling equipment (e.g., bailer or pump, hand-trowel and bowl) and prior to sampling the next location. It measures the potential for sample cross-contamination due to insufficient decontamination. An equipment blank is not collected from disposable or dedicated equipment.

Collection of Quality Control Samples Page 4 of 6 Revision Date: 04/15/21
Printed Copy is Uncontrolled. Controlled copy is maintained on the internal Barr network. Print a new copy each tim
e a hard copy is required.
Note: Prior to May 2019, the terms ‘Equipment Blank’ and ‘Rinsate Blank’ were used interchangeably and carried the same definition. To help better define the blank being collected, the term ‘Rinsate Blank’ is defined as listed below.
6.2.1.3 Rinsate Blank
A rinsate (or rinse blank, RB) is a sample of analyte-free water that has been collected from the rinsing of sampling equipment. It is used to check that equipment being considered for use at a project site would not introduce the target analyte of concern to the samples being collected. Best practice is to evaluate prior to using the equipment at the project site. 6.2.1.4 Trip Blank
A trip blank (TB) is a sample of analyte-free water prepared or provided by the laboratory along with the sampling containers. Trip blank sample containers are not to be opened in the field and accompany the samples during collection, storage, and transport to the analytical laboratory. It measures the potential for sample cross-contamination due to sample transport and handling. A trip blank sample is used when sampling volatile parameters (e.g., volatile organic compounds (VOC)/gasoline range organic (GRO)/ total petroleum hydrocarbon (TPH)). Trip blanks may also be used for per- and polyfluorinated alkyl substances (PFAS). Analyte-free water is used for an aqueous trip blank and methanol (or other applicable sample preservative) is used for a soil trip blank. A trip blank should be included for each sample cooler containing VOC (or PFAS, as required) samples and documented on the chain-of-custody (COC) form along with the samples and the required analysis. 6.2.2 Material Check
A material check (MC) is a sample of material (e.g. bentonite, sand) that has been collected to verify that the material being considered for use at a project site will not introduce the target analyte of concern to the samples being collected. 6.2.3 Field (Masked) Duplicate
A field (masked) duplicate is a sample collected at the same time as an original/source sample using the same procedures, equipment, and types of containers. It measures the precision associated with sample homogeneity, collection, preservation, and storage, as well as laboratory procedures. The field duplicate is collected in a separate container and assigned a different sample identification (e.g., M-1 or FD) than the original/source sample. The date sampled must be included on the sample container label and COC for holding time determination but not the time sampled so that the original/source sample will be blind to the laboratory. Containers designated for a particular analysis (e.g., semi-volatile organic compounds) must be filled sequentially before jars designated for another analysis are filled (e.g., metals). The field duplicate sample is analyzed using the same method as the original/source sample. 6.2.4 Matrix Spike and Matrix Spike Duplicate
Matrix Spikes (MS) and Matrix Spike Duplicate (MSD) samples are two aliquots of a sample to which known quantities of analytes are added (spiked) in the laboratory. The MS and MSD are prepared and analyzed exactly like their original/source sample aliquot. For some analyses, it is required that three separate sample aliquots are collected in the field for each analysis. One aliquot is analyzed to determine
Collection of Quality Control Samples Page 5 of 6 Revision Date: 04/15/21
Printed Copy is Uncontrolled. Controlled copy is maintained on the internal Barr network. Print a new copy each tim
e a hard copy is required.
the concentrations in the original/source sample, a second sample aliquot serves as the MS, and the third sample aliquot serves as the MSD. The purpose of the MS and MSD is to quantify the bias and precision caused by the sample matrix. Additional sample volume for MS/MSD samples may be requested by the laboratory or may be required at a specified frequency as part of the project SAP or QAPP.
Data Reduction/Calculations No data reduction or calculations are associated with this procedure.
Disposal Waste generated by this process will be disposed of in accordance with Federal, State and Local regulations and Barr’s ‘Investigative Derived Waste’ SOP. Where reasonably feasible, technological changes have been implemented to minimize the potential for environmental pollution.
7.0 Quality Control and Quality Assurance (QA/QC) The QC activities described below allow the self-verification of the quality and consistency of the work.
QA/QC Samples The frequency of QC samples is generally one field blank or equipment blank/field duplicate/MS/MSD per twenty samples; however, specific project requirements may require alternative sampling frequencies.
Measurement Criteria Criteria are defined in project specific documentation or in Barr’s data evaluation SOPs.
8.0 Records The field technician will document the type and number of QC samples collected during each sampling event on a COC and in a project dedicated field logbook or on field log data sheets. Examples of common field documentation are available in Barr’s “Compendium of Field Documentation”. Field documentation specific to this SOP are listed below:
Field Log Data Sheet COC form Sample label Custody seal (if applicable)
Field documentation and COC are provided to a Barr Data Management Administrator for storage on the internal Barr network. Additional records information can be found in Barr’s “Records Management System Manual”. Other Barr SOP subjects referenced within this SOP: sample collection, investigative derived waste, decontamination of sampling equipment, and documentation on a COC.
Collection of Quality Control Samples Page 6 of 6 Revision Date: 04/15/21
Printed Copy is Uncontrolled. Controlled copy is maintained on the internal Barr network. Print a new copy each tim
e a hard copy is required.
9.0 References EPA QA/G-5. 2002. Guidance for Quality Assurance Project Plans. EPA SW-846. 2014. Chapter One: Project Quality Assurance and Quality Control.

Standard Operating Procedure Collection of Surface Water Samples
Revision 8
April 26, 2021
Approved By:
John W. Juntilla 04/26/21 Print Technical Reviewer Signature Date
Michael Dupay 04/26/21
Print QA Manager Signature Date
Review of the SOP has been performed and the SOP still reflects current practice.
Initials: Date:
Initials: Date:
Initials: Date:
Initials: Date:
Collection of Surface Water Samples Page 2 of 6 Revision Date: 04/26/21
Printed Copy is Uncontrolled. Controlled copy is maintained on the internal Barr network. Print a new copy each tim
e a hard copy is required.
Collection of Surface Water Samples
1.0 Scope and Applicability The purpose of this Standard Operating Procedure (SOP) is to describe the methods used for sampling of surface water samples (e.g., lakes, streams, rivers, seeps, and springs). The recommended procedures in this SOP should be followed unless conditions make it impractical or inappropriate to do so. Modifications should be noted in the applicable documentation and communicated to appropriate personnel. Significant changes may result in a revision or newly created SOP.
2.0 Limitations Sample collection methods can vary by project. If not specified in the project scope of work
and/or documentation (e.g., Work Plan, Sampling Analysis Plan (SAP), or Quality Assurance Project Plan (QAPP)), consult with the appropriate regulatory agency for guidance.
Dedicated sampling equipment and/or decontamination of sampling equipment is required to prevent cross-contamination.
If sampling for per- and polyfluorinated alkyl substances (PFAS), special consideration must be taken to avoid accidental contamination of environmental samples - see Barr’s SOP ‘Collection of Per- and Polyfluorinated Alkyl Substances (PFAS) Samples’.
3.0 Responsibilities The Project Manager, in conjunction with the client, develops the site-specific scope of work (e.g., Work Plan, SAP, etc.). Experienced Field Technician(s) are responsible for the measurement of field screening procedures, field equipment and calibration, proper sample identification, collection of samples, quality control procedures, and documentation. Equipment Technicians are responsible for maintaining equipment in working order and aiding in troubleshooting equipment issues. The role of the Field Safety Representative is to oversee on-site safety activities. Project staff are responsible for ordering sample containers prior to the sampling event.
4.0 Safety Barr staff is responsible for conducting the aspects of the job safely. When applicable, refer to the appropriate Project Health and Safety Plan (PHASP) to understand the hazards associated with suspected contamination, symptoms of exposure, methods to minimize exposure, personal protection equipment (PPE), and personal air monitoring required when using this SOP. Minimum protection of one pair of chemical resistant gloves (e.g., nitrile) and safety glasses with side shields should be worn to prevent sample contact with the skin and eyes. Some of the sample containers may require the use of preservatives. Consult the applicable Safety Data Sheet to review hazards and appropriate PPE to minimize exposure.

Collection of Surface Water Samples Page 3 of 6 Revision Date: 04/26/21
Printed Copy is Uncontrolled. Controlled copy is maintained on the internal Barr network. Print a new copy each tim
e a hard copy is required.
5.0 Equipment, Reagents, and Supplies* Sample containers (method specific) Chemical resistant gloves (e.g., nitrile) Peristaltic pump (optional) Telescoping pole (optional) Plastic bags Waterproof ink pen or pencil Ice Items listed in Section 8.0 Records Coolers Decontamination supplies (see Decon SOP)
* See Barr’s PFAS SOP for a list of prohibited and acceptable items.
6.0 Procedure This section describes the procedure(s) for the sampling, handling, and delivery involving surface water samples.
Calibration If field equipment is used along with this SOP, it will be calibrated as per the applicable Barr SOP.
Sampling Surface water samples will typically be collected either by directly filling a container or by decanting the water from a collection device. Consult with the Project Manager to determine the protocol for sampling based on the project objectives and the location of the surface water. If the analysis does not require preservation, the sample bottle itself may be used for sample collection. For analyses requiring chemical preservation, use an unpreserved transfer container to collect the sample and then fill each preserved container. Samples collected in shallow water (less than 3 feet deep) should begin at the furthest downstream point and move upstream so that any disturbances caused by sampling will not affect the quality of the water sampled. Collect surface water samples prior to any sediment sampling at the same location. The surface water sample should be collected at mid-depth without disturbing the bottom sediments. Hold the container under the surface with the mouth of the container facing the flow, until filled. When sampling deeper waters, such as rivers, collection should first begin at the upstream point, then to the downstream point, and finally to the sampling point closest to the apparent source of discharge (e.g., outfall). Samples can also be collected using a peristaltic pump, with tubing attached to a telescoping pole, for larger water bodies. The use of a pole allows access to the mid channel location without disturbing the bottom sediments.
Put on gloves for skin protection and to prevent sample contamination. Lower tubing into the water (1 to 2 feet below surface) and cut to the desired length. Connect the sampling tubing to the drive tubing entering the pump. Connect the drive tubing exiting the pump to the short section of tubing used to fill the sample
containers and turn on the pump. Sampling may begin once desired volume is purged.
Collection of Surface Water Samples Page 4 of 6 Revision Date: 04/26/21
Printed Copy is Uncontrolled. Controlled copy is maintained on the internal Barr network. Print a new copy each tim
e a hard copy is required.
Samples should be collected from the most volatile towards the least volatile parameter as listed in Barr’s ‘Water Sampling Guidelines’ form and from the least contaminated area to the most contaminated area (when known). To reduce potential contamination, samples for PFAS should be collected first. See Barr’s SOP ‘Collection of Per- and Polyfluorinated Alkyl Substances (PFAS) Samples’. To prevent the possible loss of some VOCs, samples for volatile parameters should be collected second with as little agitation and disturbance as possible. The 40 mL vials used to collect the VOC samples should be checked for air bubbles. Air bubbles may be caused by insufficient meniscus when sealing the vial, degassing after sample collection or during sample shipment, or reaction between the sample and preservative (hydrochloric acid, HCl). If air bubbles > 6 mm (pea-sized) are observed during sampling, discard the vial and recollect the sample using a new vial. If air bubbles are believed to be due to the sample reacting with the preservative, the sample should be collected in an unpreserved vial if possible. Put on new sampling gloves at each sampling site to reduce the risk of sample cross-contamination and exposure to skin. Never reuse old gloves. Prepare sampling containers by filling out the label, using an indelible permanent pen, with the following information at a minimum:
Sample ID Date and time of sample collection Preservative Sample analysis (if required by the lab)
When filling the containers, do not insert any tubing into the containers and do not overfill preserved containers. When samples are containerized, place the filled sample containers in a sampling cooler with ice, turn off any equipment, disassemble the sampling apparatus, dispose of one-time use (disposable) equipment, and decontaminate reusable equipment per Barr’s SOP ‘Decontamination of Sampling Equipment’. 6.2.1 Preservation
Container volume, type, and preservative are important considerations in sample collection. Container volume must be adequate to meet laboratory requirements for quality control, split samples, or repeat analyses. The container type varies with the analysis required. Typically, the analytical laboratory will preserve the container before shipment. Preservation and shelf life vary; contact the laboratory to determine if an on-hand container is still useful. Barr’s ‘Water Sampling Guidelines’ form lists the parameter, container type, container volume, and preservative for many of the most common parameters collected. 6.2.2 Handling
The samples will be bubble wrapped or bagged after collection, stored in a sample cooler, and packed on double bagged wet ice. Samples will be kept cold (≤ 6 °C, but not frozen), until receipt at the laboratory (where applicable). Note: Samples may need to be stored indoors in winter to prevent freezing.
Collection of Surface Water Samples Page 5 of 6 Revision Date: 04/26/21
Printed Copy is Uncontrolled. Controlled copy is maintained on the internal Barr network. Print a new copy each tim
e a hard copy is required.
6.2.3 Shipment/Delivery
Once the cooler is packed to prevent breaking of bottles, the proper chain-of-custody (COC) documentation is signed and placed inside a plastic bag then added to the cooler. Samples will be kept secured to prevent tampering. If sample coolers are left in a vehicle or field office for temporary storage, the area will be locked and secured. Custody seals may be present, but at a minimum, the coolers must be taped shut to prevent the lid from opening during shipment. The coolers must be delivered to the laboratory via hand or overnight delivery courier, if possible, in accordance with Federal, State and Local transportation regulations and Barr’s SOP ‘Domestic Transport of Samples to the Laboratory’.
Data Reduction/Calculations No data reduction or calculations are associated with this procedure.
Disposal Waste generated by this process will be disposed of in accordance with Federal, State and Local regulations and Barr’s SOP ‘Investigative Derived Waste’. Where reasonably feasible, technological changes have been implemented to minimize the potential for environmental pollution.
7.0 Quality Control and Quality Assurance (QA/QC) The QC activities described below allow the self-verification of the quality and consistency of the work.
QA/QC Samples QA/QC samples are defined in Barr’s SOP ‘Collection of Quality Control Samples’. The sampling frequency should be performed at the frequency noted in the project scope of work and/or documentation (e.g., Work Plan, SAP, or QAPP).
8.0 Records The field technician will document any field test measurements on the field log data sheet and/or field notebook. They will also document the type and number of bottles on the chain-of-custody record, as appropriate. The analysis for each container and the laboratory used will be documented on the chain-of-custody record. Refer to Barr’s SOP ‘Documentation on a Chain-of-Custody (COC)’ for further information. Examples of common field documentation are available in Barr’s “Compendium of Field Documentation”. Field documentation specific to this SOP are listed below:
COC Sample label Custody seal (if applicable) Field Log Data Sheet Field Log Cover Sheet Field Sampling Report Water Sampling Guidelines (includes sampling order, container, preservation, and holding time)
Collection of Surface Water Samples Page 6 of 6 Revision Date: 04/26/21
Printed Copy is Uncontrolled. Controlled copy is maintained on the internal Barr network. Print a new copy each tim
e a hard copy is required.
The field documents and COCs are provided to a Barr Data Management Administrator for storage on the internal Barr network. Additional records information can be found in Barr’s “Records Management System Manual”. Other Barr SOP subjects referenced within this SOP: water quality meter, turbidimeter, collection of QC samples, collection of PFAS samples, decontamination of sampling equipment, investigative derived waste, domestic transport of samples, and documentation on a COC.
9.0 References Environmental Protection Agency, Region 4. 2013. Surface Water Sampling Operating Procedure. Environmental Protection Agency. Title 40 of the Code of Federal Regulations, Part 136.3.

Updated 01/30/2020
Compendium
Of
Field Documentation

Location MatrixCode
Tota
l N
umbe
r O
f C
onta
iner
s
Barr Engineering Co. Chain of Custody
Distribution - White-Original: Accompanies Shipment to Laborat a copy to [email protected] for tracking and filing proceduresory; Yellow Copy: Include in Field Documents; Scan and email:
1.
2.
3.
4.
5.
6.
7.
8.
9.
10.
Relinquished by:
Relinquished by:
Received by:
Received by:
Air Bill Number:
COC of
On Ice?Y N
Start Stop
CollectionDate
Sample Origination State
(mm/dd/yyyy)
CollectionTime
(hh:mm)(m./ft.
CO MI MN
REPORT TO INVOICE TO
Copy to: [email protected]
Perf
orm
M
S/M
SD
Y
/ N
Name:
email:
Project Name:
Company:Company:
Address:
Address:
Address:
Address:
Name:
email:
P.O.
Barr Project No:
COC Number:
ABCDEFGHIJK
= None= HCl= HNO= H SO= NaOH= MeOH= NaHSO= Na S O= Ascorbic Acid= =
Zn AcetateOther
Field Filtered Y/NPreservative Code
Lab Name:
BARR USE ONLY Sampled by:
Barr Proj. Manager:
Barr DQ Manager:
Lab Location:
Standard Turn Around TimeRush
(mm/dd/yyyy) H:R
LG\S
TDFO
RMS\
Chai
n of
Cus
tody
For
m 2
015
RLG
Rev.
01/3
0/20
20
Requested Due Date:
or in.)
GWSWWWDW
SSDO
= Groundwater= Surface Water= Waste Water= Drinking Water= Soil/Solid= Sediment= Other
Matrix Code: Preservative Code:
Lab WO: Temperature on Receipt ( C): Custody Seal Intact? Y N None
On Ice?Y N
Date
Date
Time
Time
Date
Date
Time
Time
Analysis Requested
3
2 4
4
2 2 3
Water Soil
% S
olid
s
Sample DepthUnit
MO ND TX UT WI Other:
Samples Shipped VIA: Ground Courier Air CarrierSampler Other:
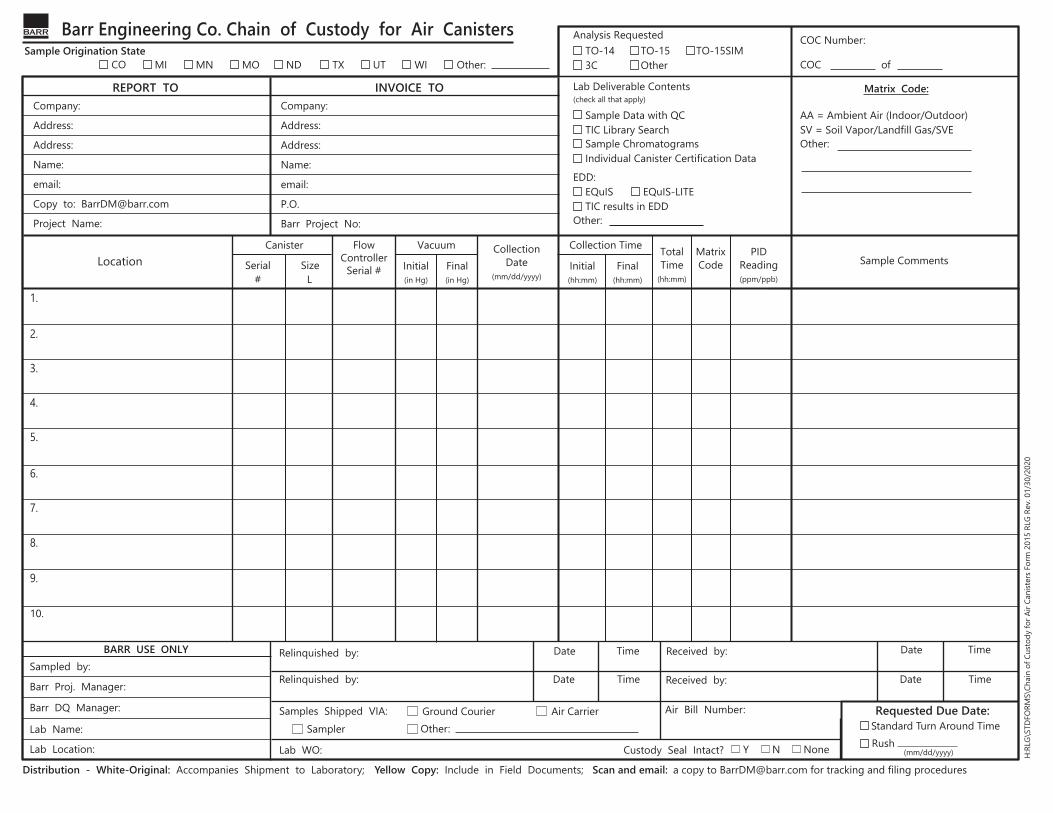
Location
Barr Engineering Co. Chain of Custody for Air Canisters
Distribution - White-Original: Accompanies Shipment to Laborat a copy to [email protected] for tracking and filing proceduresory; Yellow Copy: Include in Field Documents; Scan and email:
1.
2.
3.
4.
5.
6.
7.
8.
9.
10.
Relinquished by:
Relinquished by:
Samples Shipped VIA: Ground Courier Air CarrierSampler Other:
Received by:
Received by:
Air Bill Number:
COC of
Serial# L
Size
Sample Origination State CO MI MN
REPORT TO INVOICE TO
Copy to: [email protected]
Name:
email:
Project Name:
Company:Company:
Address:
Address:
Address:
Address:
Name:
email:
P.O.
Barr Project No:
COC Number:
Lab Name:
BARR USE ONLY Sampled by:
Barr Proj. Manager:
Barr DQ Manager:
Lab Location:
Standard Turn Around TimeRush
(mm/dd/yyyy) H:R
LG\S
TDFO
RMS\
Chai
n of
Cus
tody
for A
ir Ca
nist
ers F
orm
201
5 RL
G Re
v. 01
/30/
2020
Requested Due Date:
Matrix Code:
Lab WO: Custody Seal Intact? Y N None
Date
Date
Time
Time
Date
Date
Time
Time
Analysis Requested
Lab Deliverable Contents
EDD:
(check all that apply)
MO ND TX UT WI Other:
Flow Controller
Serial #
Vacuum Collection Time
TO-143C
Sample Data with QCTIC Library SearchSample Chromatograms
AA = Ambient Air (Indoor/Outdoor)SV = Soil Vapor/Landfill Gas/SVEOther:
EQuIS EQuIS-LITETIC results in EDD
Other:
Individual Canister Certification Data
TO-15Other
TO-15SIM
Canister
Initial(in Hg)
Final(in Hg)
Initial(hh:mm)
Final(hh:mm)
Collection Date
(mm/dd/yyyy)
PID Reading(ppm/ppb)
Total Time
(hh:mm)
Matrix Code Sample Comments

Meter Calibration Summary Form

Version: April 2013
Barr Engineering Company Troll Checklist / Data Sheet
Client: Monitoring Point: Location: Troll Serial Number: Project #: Date:
• Memory Status (approximate):
• Battery Status (approximate):
• Test Running?:
• Time Downloaded:
Water Level Measurements:
Time Water Level Measured by Hand
Troll Water Level Reading
Difference in Measurements*
*consider restarting test with a new reference if difference between measurements is >0.15 feet
• Troll Removed? circle one: Yes No
Complete the following if Troll was removed Time removed:
Time reinstalled:
Post Reinstallation Water Level Measurements:
Time Water Level Measured by Hand
Troll Water Level Reading
Difference in Measurements
• For Troll 9500 only
o Calibrated?
Water Level Data Sheet
WATER LEVEL DATA SHEET
Project: Project Number: Environmental Staff: Date:
Monitoring Location
Measuring Point Elevation
Water Level Depth
Total Well Depth
Static Water Elevation
Comments

Field Log Data Sheet
Client: Monitoring Point:
Location: Date:
Project #: Sample time:
GENERAL DATA STABILIZATION TEST
Barr lock: Time/
Volume Temp.
ºC Cond. @ 25 PH
ORP mV D.O.
Turbidity NTU (not
appearance) Casing diameter:
Total well depth:* NA
Static well level:*
Water depth:*
Well volume: (gal)
Purge method:
Sample method:
Start time: Odor:
Stop time: Purge Appearance:
Duration: (minutes) Sample Appearance:
Rate, gpm: Comments:
Volume purged:
Duplicate collected:
Sample collection by:
Others present: Well condition:
MW: groundwater monitoring well WS: water supply well SW: surface water SE: sediment Other: sump
VOC Semi-volatile General Nutrient Cyanide DRO Sulfide
Oil, grease Bacteria Total Metal Filtered Metal Methane Filter
Others:
* Measurements are referenced from the top of riser pipe, unless otherwise indicated.
Date Time
Field Log Data Sheet
Soil Samples
Barr Engineering Company
Location:
Number of Containers/ AnalysisClient:
Oth
er:
Mois
ture
Oth
er:
VO
C
17.
18
19.
20.
13.
14.
15.
16.
9.
10.
11.
12.
5.
6.
7.
8.
1.
2.
3.
4.
Sample IdentificationCollection
Matrix Type
Soil
Slu
dge
Gra
b
RC
RA
Meta
ls
WIG
RO
WID
RO
PC
B
8 o
z. U
npre
s.
Oth
er:
SV
OC
PA
H
Mois
ture
-pla
stic v
ial etc
.
2 o
z. P
res.
2 o
z. U
npre
s.
4 o
z. U
npre
s.
Com
p.
QC
Project #:
Project Name:

Sediment Core/Boring LogVC: vibracorePC: push core
Proj#: Project: Core/Boring#:Collection Date(s): GPS X: Length of Push (feet): Driller: Drilling Method: Ice Thickness (feet): GPS Y: Recovery (feet): Crew: Logged by:Water Depth (feet): GPS Z: % Recovery: Observer: Checked by:
Sample Interval
and number Mo
isture
Dens
ity o
r Co
nsist
ency
Plasti
city
Cohe
siven
ess
Part
icle
s
Odo
r
Stai
ning
Shee
n
ASTM
/ USC
S Cla
ssific
ation
Grap
hic Lo
g
Depth (ft.)
Properties
Description
page_____of_____
Recovery Rate Test Form
Recovery Rate Test
Project: Sampled by: Date: Well Number: Water Level Before Evacuation (0.01 Ft.):
Time Well Was Evacuated: Sample Time:
Time from Evacuation (min.) Water Level (0.01 ft.) Time from Evacuation Water Level (0.01 ft.)
:00 :30
1:00 1:30 2:00 2:30 3:00 3:30 4:00 4:30 5:00 6:00 7:00 8:00 9:00
10:00 11:00 12:00 13:00 14:00 15:00
FIELD LOG COVER SHEET
Client: Project No.: Technician: Sampling Period:
Date Temperature Wind Speed Wind
Direction Cloud Cover
Summary of Field Activities

FIELD SAMPLING REPORT
Date: Project: Contact: Field Sampling Field Report Attachments:
• • • • • • • • • •
Laboratory Analysis Status __________________________________ <Name here> Environmental Technician

Dangerous Goods in Excepted Quantities Label Examples
3 Methanol
8 Nitric Acid
Courier Form Example

Sample Label Examples

Custody Seal Example
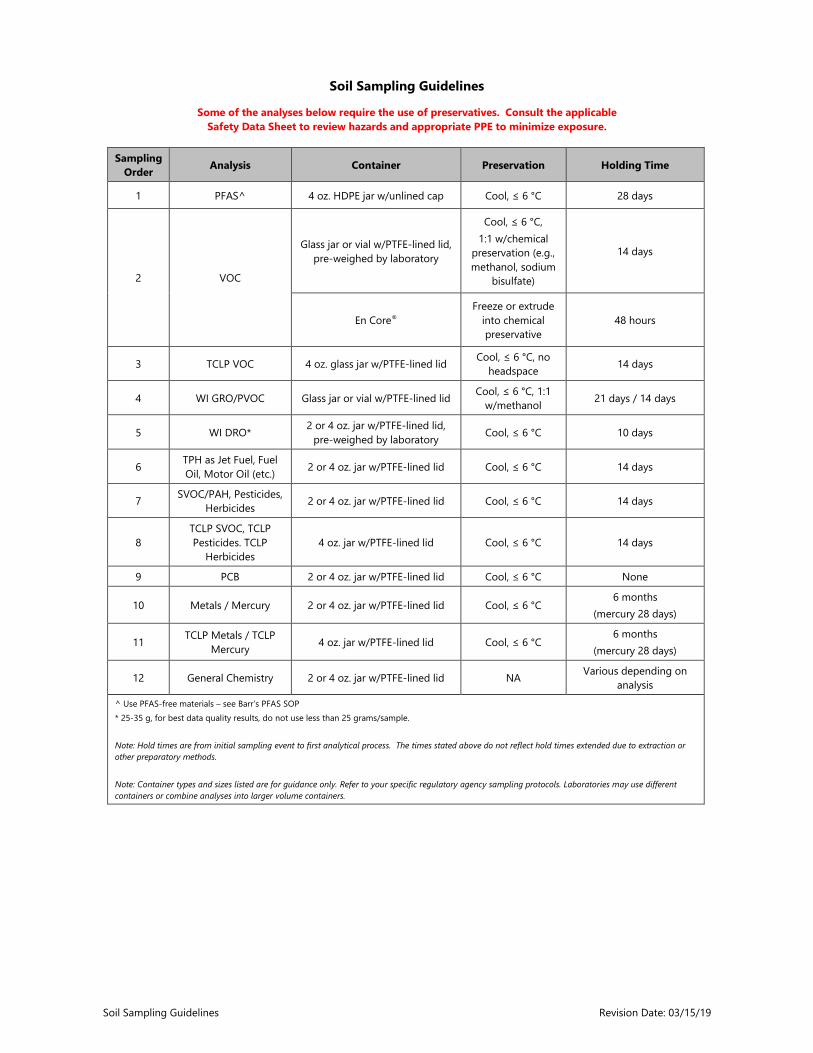
Soil Sampling Guidelines Revision Date: 03/15/19
Soil Sampling Guidelines
Some of the analyses below require the use of preservatives. Consult the applicable Safety Data Sheet to review hazards and appropriate PPE to minimize exposure.
Sampling
Order Analysis Container Preservation Holding Time
1 PFAS^ 4 oz. HDPE jar w/unlined cap Cool, ≤ 6 °C 28 days
2 VOC
Glass jar or vial w/PTFE-lined lid, pre-weighed by laboratory
Cool, ≤ 6 °C, 1:1 w/chemical
preservation (e.g., methanol, sodium
bisulfate)
14 days
En Core® Freeze or extrude
into chemical preservative
48 hours
3 TCLP VOC 4 oz. glass jar w/PTFE-lined lid Cool, ≤ 6 °C, no headspace 14 days
4 WI GRO/PVOC Glass jar or vial w/PTFE-lined lid Cool, ≤ 6 °C, 1:1 w/methanol 21 days / 14 days
5 WI DRO* 2 or 4 oz. jar w/PTFE-lined lid, pre-weighed by laboratory Cool, ≤ 6 °C 10 days
6 TPH as Jet Fuel, Fuel Oil, Motor Oil (etc.) 2 or 4 oz. jar w/PTFE-lined lid Cool, ≤ 6 °C 14 days
7 SVOC/PAH, Pesticides, Herbicides 2 or 4 oz. jar w/PTFE-lined lid Cool, ≤ 6 °C 14 days
8 TCLP SVOC, TCLP Pesticides. TCLP
Herbicides 4 oz. jar w/PTFE-lined lid Cool, ≤ 6 °C 14 days
9 PCB 2 or 4 oz. jar w/PTFE-lined lid Cool, ≤ 6 °C None
10 Metals / Mercury 2 or 4 oz. jar w/PTFE-lined lid Cool, ≤ 6 °C 6 months
(mercury 28 days)
11 TCLP Metals / TCLP Mercury 4 oz. jar w/PTFE-lined lid Cool, ≤ 6 °C
6 months (mercury 28 days)
12 General Chemistry 2 or 4 oz. jar w/PTFE-lined lid NA Various depending on analysis
^ Use PFAS-free materials – see Barr’s PFAS SOP * 25-35 g, for best data quality results, do not use less than 25 grams/sample.
Note: Hold times are from initial sampling event to first analytical process. The times stated above do not reflect hold times extended due to extraction or other preparatory methods.
Note: Container types and sizes listed are for guidance only. Refer to your specific regulatory agency sampling protocols. Laboratories may use different containers or combine analyses into larger volume containers.
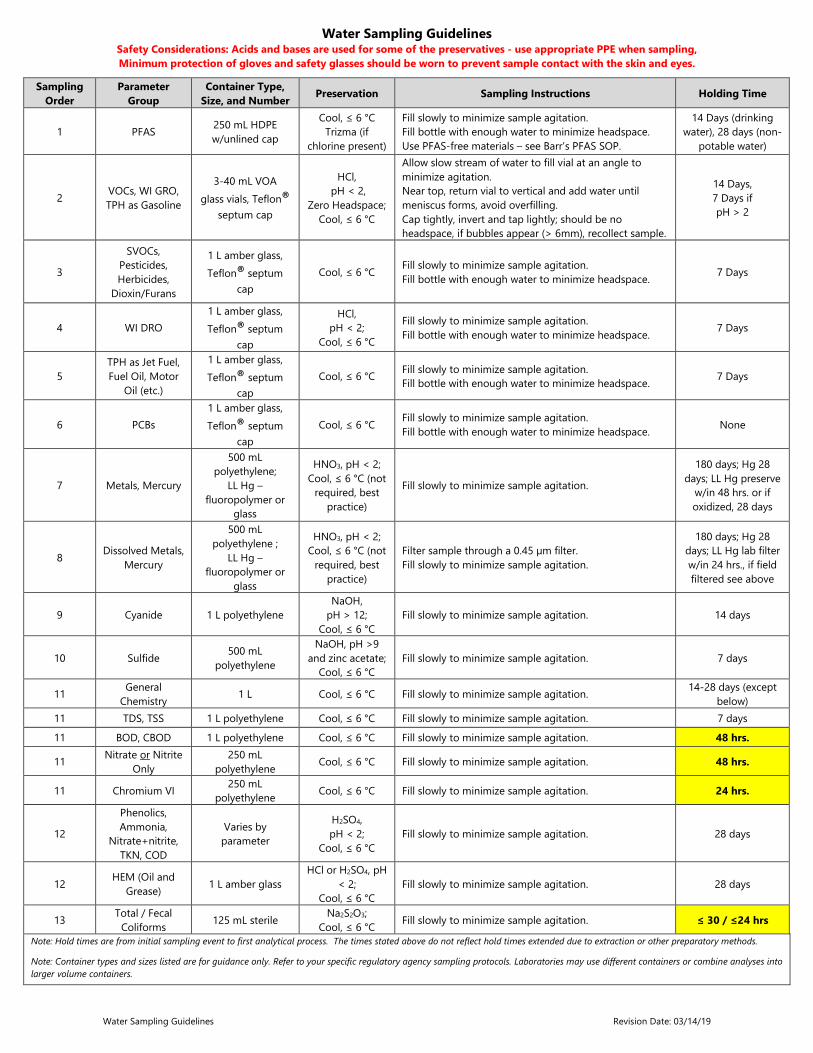
Water Sampling Guidelines Revision Date: 03/14/19
Water Sampling Guidelines Safety Considerations: Acids and bases are used for some of the preservatives - use appropriate PPE when sampling, Minimum protection of gloves and safety glasses should be worn to prevent sample contact with the skin and eyes.
Sampling Order
Parameter Group
Container Type, Size, and Number Preservation Sampling Instructions Holding Time
1 PFAS 250 mL HDPE w/unlined cap
Cool, ≤ 6 °C Trizma (if
chlorine present)
Fill slowly to minimize sample agitation. Fill bottle with enough water to minimize headspace. Use PFAS-free materials – see Barr’s PFAS SOP.
14 Days (drinking water), 28 days (non-
potable water)
2 VOCs, WI GRO, TPH as Gasoline
3-40 mL VOA glass vials, Teflon®
septum cap
HCl, pH < 2,
Zero Headspace; Cool, ≤ 6 °C
Allow slow stream of water to fill vial at an angle to minimize agitation. Near top, return vial to vertical and add water until meniscus forms, avoid overfilling. Cap tightly, invert and tap lightly; should be no headspace, if bubbles appear (> 6mm), recollect sample.
14 Days, 7 Days if pH > 2
3
SVOCs, Pesticides, Herbicides,
Dioxin/Furans
1 L amber glass, Teflon® septum
cap Cool, ≤ 6 °C Fill slowly to minimize sample agitation.
Fill bottle with enough water to minimize headspace. 7 Days
4 WI DRO 1 L amber glass, Teflon® septum
cap
HCl, pH < 2;
Cool, ≤ 6 °C
Fill slowly to minimize sample agitation. Fill bottle with enough water to minimize headspace. 7 Days
5 TPH as Jet Fuel, Fuel Oil, Motor
Oil (etc.)
1 L amber glass, Teflon® septum
cap Cool, ≤ 6 °C Fill slowly to minimize sample agitation.
Fill bottle with enough water to minimize headspace. 7 Days
6 PCBs 1 L amber glass, Teflon® septum
cap Cool, ≤ 6 °C Fill slowly to minimize sample agitation.
Fill bottle with enough water to minimize headspace. None
7 Metals, Mercury
500 mL polyethylene;
LL Hg – fluoropolymer or
glass
HNO3, pH < 2; Cool, ≤ 6 °C (not
required, best practice)
Fill slowly to minimize sample agitation.
180 days; Hg 28 days; LL Hg preserve
w/in 48 hrs. or if oxidized, 28 days
8 Dissolved Metals, Mercury
500 mL polyethylene ;
LL Hg – fluoropolymer or
glass
HNO3, pH < 2; Cool, ≤ 6 °C (not
required, best practice)
Filter sample through a 0.45 µm filter. Fill slowly to minimize sample agitation.
180 days; Hg 28 days; LL Hg lab filter w/in 24 hrs., if field filtered see above
9 Cyanide 1 L polyethylene NaOH,
pH > 12; Cool, ≤ 6 °C
Fill slowly to minimize sample agitation. 14 days
10 Sulfide 500 mL polyethylene
NaOH, pH >9 and zinc acetate;
Cool, ≤ 6 °C Fill slowly to minimize sample agitation. 7 days
11 General Chemistry 1 L Cool, ≤ 6 °C Fill slowly to minimize sample agitation. 14-28 days (except
below) 11 TDS, TSS 1 L polyethylene Cool, ≤ 6 °C Fill slowly to minimize sample agitation. 7 days
11 BOD, CBOD 1 L polyethylene Cool, ≤ 6 °C Fill slowly to minimize sample agitation. 48 hrs.
11 Nitrate or Nitrite Only
250 mL polyethylene Cool, ≤ 6 °C Fill slowly to minimize sample agitation. 48 hrs.
11 Chromium VI 250 mL polyethylene Cool, ≤ 6 °C Fill slowly to minimize sample agitation. 24 hrs.
12
Phenolics, Ammonia,
Nitrate+nitrite, TKN, COD
Varies by parameter
H2SO4, pH < 2;
Cool, ≤ 6 °C Fill slowly to minimize sample agitation. 28 days
12 HEM (Oil and Grease) 1 L amber glass
HCl or H2SO4, pH < 2;
Cool, ≤ 6 °C Fill slowly to minimize sample agitation. 28 days
13 Total / Fecal Coliforms 125 mL sterile Na2S2O3;
Cool, ≤ 6 °C Fill slowly to minimize sample agitation. ≤ 30 / ≤24 hrs
Note: Hold times are from initial sampling event to first analytical process. The times stated above do not reflect hold times extended due to extraction or other preparatory methods.
Note: Container types and sizes listed are for guidance only. Refer to your specific regulatory agency sampling protocols. Laboratories may use different containers or combine analyses into larger volume containers.

Rev: 08/29/17
Soil Gas Sample Collection Field Sampling Quality Control Check List
Project Name: __________________________________
Project #: ________________________________
Sample ID #:
□ Soil vapor monitoring point purging was completed.
Volume purged:______________
□ Vacuum based leak testing was performed. Vacuum:________ Duration:_________
□ Water leak testing was performed. Start Time:_____ Stop Time: _____ Duration:_____
□ Initial summa canister vacuum was greater than 25 in. of Hg. Initial vacuum:_______
□ PID screening was performed. Reading:___________ Background:
□ Instantaneous differential pressure reading was performed. Reading:___________
□ Sample information was added to the chain of custody form.
Chain of Custody Form #:
□ Sample collection information added to summa canister tag
□ Photo of sample location taken before and after installation

Soil Gas Sample Record
Sample Location Map:
Sample Type___ Soil Vapor ___ Pre-mitigation ___ Sub-Slab Soil Vapor ___ Post-mitigation
Sample Equipment Pin Installation Data
Summa Canister ID #: Time installed:
Flow Control ID #: Permanent OR Temporary
Certification Batch #:
Certification Date: Temporary: Hole patched with concrete? Y or N
Barr Manifold #: Photo after patching? Y or N
Leak Testing Data
Vacuum Test Start Time: Water Leak Test Start Time:
Vacuum Test Stop Time: Water Leak Test Stop Time:
Vacuum Test Pressure:
Sample Collection Data
Purge Volume:
Sample Start Time: Sample Start Pressure:
Sample Stop Time: Sample Stop Pressure:
PID Measurement: Background PID Measurement:
Sub-slab Pressure Reading: Sample information added to summa canister tag?
Photos of sample location taken
Notes:
Project Number:
Sample Date:
Sampling Technician(s):
Sample ID:

Appendix D
www.pca.state.mn.us • 651-296-6300 • 800-657-3864 • Use your preferred realy service • Available in alternative formatsc-rem3-01a • 10/28/16 Page 1 of 8
Vapor Intrusion Building SurveyForm
Remediation Program Doc Type: Site Inspection Information
Preparer’s name: Date/Time prepared: Affiliation: Phone number: Email:
Part 1: Property owner & building occupant information
1. Owner/Landlord information (Check if same as occupant: ) Occupant name(s): Interviewed: Yes No Mailing address:City: State: Zip code: Home phone: Office phone:
2. Occupant informationOccupant name(s): Interviewed: Yes No Mailing address:City: State: Zip code: Phone: Fax: Email: Number of occupants at this location: Age range of occupants:
Part 2: Building evaluation
3. Building use (Check appropriate response) Residential Child/Day Care School Church Hospital Long-term care facility Correctional facility Commercial Industrial Other (specify):
If the property is residential, what type? (Check appropriate response) Ranch rambler Raised rambler Townhouses/Condos Duplex Modular 2-Family Split level Contemporary Apartment house Cape cod Log home 3-Family Colonial Mobile home Other (specify):
4. Building descriptionIf the property is commercial or industrial, describe the business use(s):
Indicate the number of floors and general use of each floor of the building beginning with lowest level:
If there are multiple residential units, indicate how many units: When was building constructed: Type of insulation used in building: Elevators or lifts: Yes No Basement/Lowest level depth below grade: (feet)
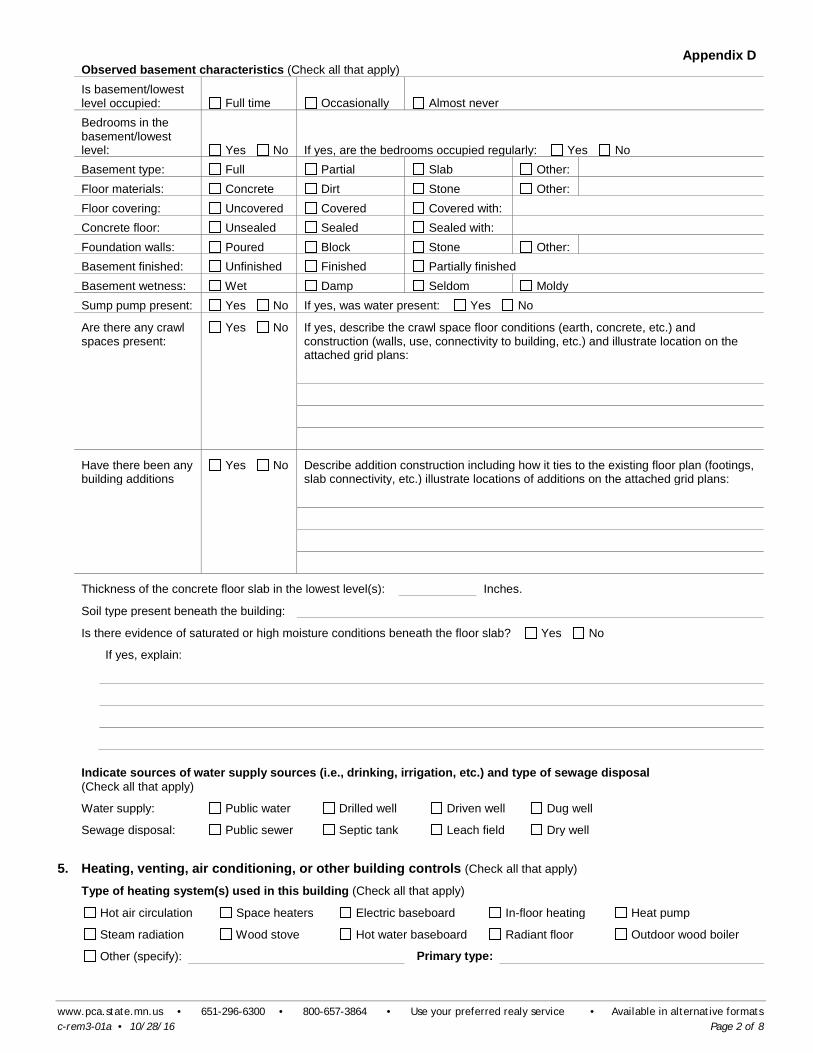
Appendix D
www.pca.state.mn.us • 651-296-6300 • 800-657-3864 • Use your preferred realy service • Available in alternative formatsc-rem3-01a • 10/28/16 Page 2 of 8
Observed basement characteristics (Check all that apply) Is basement/lowest level occupied: Full time Occasionally Almost never Bedrooms in the basement/lowest level: Yes No If yes, are the bedrooms occupied regularly: Yes No Basement type: Full Partial Slab Other: Floor materials: Concrete Dirt Stone Other: Floor covering: Uncovered Covered Covered with: Concrete floor: Unsealed Sealed Sealed with: Foundation walls: Poured Block Stone Other: Basement finished: Unfinished Finished Partially finished Basement wetness: Wet Damp Seldom Moldy Sump pump present: Yes No If yes, was water present: Yes No Are there any crawl spaces present:
Yes No If yes, describe the crawl space floor conditions (earth, concrete, etc.) and construction (walls, use, connectivity to building, etc.) and illustrate location on the attached grid plans:
Have there been any building additions
Yes No Describe addition construction including how it ties to the existing floor plan (footings, slab connectivity, etc.) illustrate locations of additions on the attached grid plans:
Thickness of the concrete floor slab in the lowest level(s): Inches. Soil type present beneath the building: Is there evidence of saturated or high moisture conditions beneath the floor slab? Yes No
If yes, explain:
Indicate sources of water supply sources (i.e., drinking, irrigation, etc.) and type of sewage disposal (Check all that apply) Water supply: Public water Drilled well Driven well Dug well Sewage disposal: Public sewer Septic tank Leach field Dry well
5. Heating, venting, air conditioning, or other building controls (Check all that apply)Type of heating system(s) used in this building (Check all that apply)
Hot air circulation Space heaters Electric baseboard In-floor heating Heat pump Steam radiation Wood stove Hot water baseboard Radiant floor Outdoor wood boiler Other (specify): Primary type:
Appendix D
www.pca.state.mn.us • 651-296-6300 • 800-657-3864 • Use your preferred realy service • Available in alternative formatsc-rem3-01a • 10/28/16 Page 3 of 8
Primary type of fuel used (Check appropriate response) Natural gas Fuel oil Kerosene Electric Propane Solar Wood Coal
If hot water tank present, indicate fuel source: Boiler/furnace is located in: Basement Outdoors Main floor Other: Type of air conditioning: Central air Window units Open windows No mechanical system Is outside replacement (make-up) air provided for combustion appliances? Yes No
If no, explain:
Are there air distribution ducts present? Yes No Describe the supply and cold air return ductwork and its condition where visible, including whether there is a cold air return and the tightness of duct joints. Indicate the locations on the floor plan diagram:
Describe the type of mechanical ventilation systems used within or for the building (e.g., air-to-air exchangers, HVAC, etc.). Indicate whether the interior spaces of the building use separate ventilation systems and/or controls. Provide information on any existing building mitigation system (e.g., radon mitigation, passive venting systems, etc.). If available, provide information on air exchange rates for any existing mechanical ventilation systems currently in use.
6. Summary of potential building vapor intrusion entry pointsEarthen floors or incompetent floor slabs in the lowest level of building Yes No Sumps (unsealed) Yes No Large utility penetrations through floor and/or walls with exposure to sub-surface soils Yes No Crawl spaces with earthen floors or incompetent floor conditions Yes No Other (describe) Yes No
7. Is the use of the vapor intrusion attenuation factor (33X ISV screening level) valid for this building basedon the above building conditions? Yes No
Appendix D
www.pca.state.mn.us • 651-296-6300 • 800-657-3864 • Use your preferred realy service • Available in alternative formatsc-rem3-01a • 10/28/16 Page 4 of 8
8. Grid plansUse grid plans to describe floor plans, locate potential soil vapor entry points (e.g., cracks, utility ports, drains); and ifapplicable, identify sample locations (sub-slab, indoor air, outdoor air sampling).
Floor plan for basement or lowest level at property address:
Scale: North (indicate direction):

Appendix D
www.pca.state.mn.us • 651-296-6300 • 800-657-3864 • Use your preferred realy service • Available in alternative formatsc-rem3-01a • 10/28/16 Page 5 of 8
Floor above lowest level at property address:
Scale: North (indicate direction):

Appendix D
www.pca.state.mn.us • 651-296-6300 • 800-657-3864 • Use your preferred realy service • Available in alternative formatsc-rem3-01a • 10/28/16 Page 6 of 8
Outdoor grid plot (Include if outdoor ambient air samples collected): Insert sketch (or attach separate document) of the area outside the building and locate outdoor air sample locations. If applicable, provide information on spill locations, potential air contamination sources, locations of wells, septic system, etc., and PID meter readings. Indicate wind direction and speed during sampling.

Appendix D
www.pca.state.mn.us • 651-296-6300 • 800-657-3864 • Use your preferred realy service • Available in alternative formatsc-rem3-01a • 10/28/16 Page 7 of 8
Part 3: Indoor Air Quality Survey
Complete if indoor air sampling is conducted (use grids in Part 1 for labeling sampling locations). Factors that may influence indoor air quality: Is there an attached garage: Yes No Are petroleum-powered machines or vehicles stored in the garage (e.g., lawn mower, ATV, car): Yes No Please specify: Has the building ever had a fire: Yes No When: Is a kerosene or unvented gas space heater present: Yes No Where & type: Is there smoking in the building: Yes No How frequently: Have cleaning products been used recently: Yes No When & type: Have cosmetic products been used recently: Yes No When & type: Has painting/staining been done in the last 6 months: Yes No Where & when: Has any remodeling or construction occurred in the last 6 months: Yes No Where & when: Is there new carpet, drapes, or other textiles: Yes No Where & when: Have air fresheners been used recently: Yes No When & type:
Is there a clothes dryer: Yes No If yes, is it vented outside: Are there odors in the building: Yes No If yes, please describe:
Do any of the building occupants use solvents at work: Yes No If yes, what types of solvents are used:
Do any of the building occupants regularly use or work at a dry-cleaning service: Yes No
If yes, indicate approximately how frequent:
Product inventory form (Add additional rows if needed) Make and model of field instrument used: List specific products identified in the building that have the potential to affect indoor air quality (add or delete rows as needed):
Location Product description* Comments
Instrument readings if taken and units
* Describe the condition of the product containers as Unopened (UO), Used (U), or Deteriorated (D).Include photographs of product containers as appropriate to document products and ingredients.

Appendix D
www.pca.state.mn.us • 651-296-6300 • 800-657-3864 • Use your preferred realy service • Available in alternative formatsc-rem3-01a • 10/28/16 Page 8 of 8
Location Product description* Comments
Instrument readings if taken and units
* Describe the condition of the product containers as Unopened (UO), Used (U), or Deteriorated (D).Include photographs of product containers as appropriate to document products and ingredients.
Interior Building Survey Inventory Form Property Address: Date/Time:
Technicians: Instrument Name: Serial Number: Instrument Name: Serial Number:
Location (Map ID & Description)
Temperature (oF) Instrument Reading
Air Velocity (ft/s) Instrument Reading
Photoionization Detector (ppb) Instrument Reading
A
B
C
D
E
F
G
H
I
J
K
L
M
N
O
P
Q
R
S
T
U
V
W
X
Y
Z
Product Inventory Form Property Address: Date/Time: Technicians:
Instrument Name: Serial Number:
Location (Map ID & Description)
Product Label/Marking Product Container Integrity*
Manufacture’s intended use of chemical Comments
Instrument Reading (ppb)
1
2
3
4
5
6
7
8
9
10
11
12
13
14
15
16
17
18
19
20
21
22
23
24
25
26
27
28
29
30
*Describe the condition of the product containers as Unopened (UO), Used (U), or Deteriorated (D). Include photographs of product containers as appropriate to document products and ingredients. Reference: MPCA Vapor Intrusion Interior Building Survey Form, Part 2

Indoor Air Sampling Procedure Via USEPA Method TO-15
Page 1 of 10
Indoor Air Sampling Procedure Via USEPA Method TO-15
Page 2 of 10
Indoor Air Sampling Procedure Via USEPA Method TO-15
Page 3 of 10

Indoor Air Sampling Procedure Via USEPA Method TO-15
Page 4 of 10
Indoor Air Sampling Procedure Via USEPA Method TO-15
Page 5 of 10
Indoor Air Sampling Procedure Via USEPA Method TO-15
Page 6 of 10
Indoor Air Sampling Procedure Via USEPA Method TO-15
Page 7 of 10
Indoor Air Sampling Procedure Via USEPA Method TO-15
Page 8 of 10

Indoor Air Sampling Procedure Via USEPA Method TO-15
Page 9 of 10
Indoor Air Sampling Procedure Via USEPA Method TO-15
Page 10 of 10
Indoor/Outdoor Air Sample Record
Sample Location Map:
Sample Type___ Indoor Air ___ Pre-mitigation ___ Outdoor Air ___ Post-mitigation___ Emissions Sample
Sample Collection Time___ Grab Sample ___ Time-weighted Sample - Target time: _______ hours
Sample Equipment Sample Information
Summa Canister ID #: Sample Height:
Flow Control ID #: Wind Direction:
Certification Batch #: Weather Conditions:
Certification Date: Temperature:
Canister Volume (L): Ambient Pressure:
Sample Collection Data
Sample Start Time: Sample Start Pressure:
Sample Stop Time: Sample Stop Pressure:
Start PID Measurement: Stop PID Measurement:
Sample information added to summa canister tag?
Photos of sample location taken
Interior Building Survey Completed, Date: ___________
Notes:
Building HVAC: ON OFF
Project Number:
Sample Date:
Sampling Technician(s):
Sample ID:
Standard Operating Procedure Decontamination of Sampling Equipment
Revision 2
October 6, 2020
Approved By:
John W. Juntilla 10/06/20 Print Technical Reviewer Signature Date
Michael Dupay 10/06/20 Print QA Manager Signature Date
Review of the SOP has been performed and the SOP still reflects current practice.
Initials: Date:
Initials: Date:
Initials: Date:
Initials: Date:
Decontamination of Sampling Equipment Page 2 of 5 Revision Date: 10/06/20
Printed Copy is Uncontrolled. Controlled copy is m
aintained on the internal Barr network. Print a new
copy each time a hard copy is required.
Decontamination of Sampling Equipment
1.0 Scope and Applicability The purpose of this Standard Operating Procedure (SOP) is to define the process used for decontaminating environmental sampling-related equipment including pumps, meters, and materials coming into contact with actual sampling equipment or with sampling personnel. This procedure is applicable to all personnel who are collecting samples and/or decontaminating sampling and field equipment.
The recommended procedures in this SOP should be followed unless conditions make it impractical or inappropriate to do so. Modifications should be noted in the applicable documentation and communicated to appropriate personnel. Significant changes may result in a revision or newly created SOP.
2.0 Limitations • Equipment used once and discarded such as bailers, protective gear, and filtration devices are not
part of this SOP.
3.0 Responsibilities The equipment technician is responsible for ensuring field equipment has been thoroughly decontaminated and prepared for use out in the field. The field technician(s) are responsible for decontamination in the field at each individual sampling point and for ensuring adherence to any investigative derived waste (IDW) project-specific requirements set forth in a QAPP or SAP (if applicable).
The role of the Field Safety Representative is to oversee on-site safety activities.
4.0 Safety Barr staff is responsible for implementing aspects of the job safely. Where available, refer to the appropriate Project Health and Safety Plan (PHASP) to determine the proper personal protection equipment (PPE) required when using this SOP. Barr staff is responsible for conducting all aspects of the job safely. When applicable, refer to the appropriate Project Health and Safety Plan (PHASP) to understand the hazards associated with suspected contamination, symptoms of exposure, methods to minimize exposure, personal protection equipment (PPE), and personal air monitoring required when using this SOP. Minimum protection of one pair of chemical resistant gloves (e.g., nitrile) and safety glasses with side shields should be worn to prevent sample contact with the skin and eyes. When sampling soils contaminated with corrosive materials, emergency eye flushing facilities should be available.
Some of the sample containers may require the use of preservatives. Consult the applicable Safety Data Sheet to review hazards and appropriate PPE to minimize exposure.

Decontamination of Sampling Equipment Page 3 of 5 Revision Date: 10/06/20
Printed Copy is Uncontrolled. Controlled copy is m
aintained on the internal Barr network. Print a new
copy each time a hard copy is required.
5.0 Equipment, Reagents, and Supplies • Non-phosphorus detergent (e.g.,
LiquinoxTM) • Analyte-free water (e.g., distilled or
deionized (DI) water, or equivalent) • Scrub brush made of inert materials • Kimwipes®, or equivalent • Oven • Chemical resistant gloves (e.g., nitrile) • Bucket • Spray bottle • Tap water • Organic solvent (e.g. methanol)
6.0 Procedure This section describes the procedure(s) for the decontamination of equipment used to sample water, soil, or air.
Calibration Calibration is not applicable to this SOP.
Operation Decontamination of sampling equipment will be performed before sampling and after working at each sampling point, if applicable.
6.2.1 Water Sampling Equipment
Equipment that does not contact sample water or the inside of the well should be rinsed with analyte-free water and inspected for remaining particles or surface film. If these are noted, repeat cleaning and rinse procedures.
Equipment that contacts sample water or the inside of the well should be cleaned (inside and outside where possible) with a non-phosphorus detergent solution applied with a spray bottle and/or scrub brush (if needed). Rinse with analyte-free water and containerize with other IDW if required by the SAP or QAPP and inspect for remaining particles or surface film. If these are noted, repeat cleaning and rinse procedures. Shake off remaining water and allow to air dry.
The internal surfaces of pumps and tubing that cannot be adequately cleaned by the above methods alone will also be cleaned by first circulating a non-phosphorus detergent solution through them followed by circulating analyte-free water. Special care will be exercised to ensure that the “rinse” fluids will be circulated in sufficient quantities to completely flush out contaminants and detergents.
When transporting or storing equipment after cleaning, the equipment will be stored in a manner that minimizes the potential for contamination.
6.2.2 Soil/Sediment Sampling Equipment
A variety of samplers (split-barrel, split-barrel with brass liners, piston sampler, backhoe, hand-auger, or shovel) may be used to retrieve soil from sampling locations. The soil sample will either be sealed within the sampler (e.g., collecting volatile samples) or the soil sample will be transferred to laboratory-supplied containers depending on the analysis to be conducted on the soil sample. The equipment required to transfer the soil from the sampler to the laboratory-supplied sample containers includes: stainless-steel
Decontamination of Sampling Equipment Page 4 of 5 Revision Date: 10/06/20
Printed Copy is Uncontrolled. Controlled copy is m
aintained on the internal Barr network. Print a new
copy each time a hard copy is required.
spoons or scoops and the appropriate personal protective equipment necessary for collection and handling of soil samples as described in the PHASP.
All soil sampling equipment, including split-barrels, stainless-steel spoons and scoops, will be carefully cleaned before and during sampling with a tap water and non-phosphorus detergent solution, using a brush if necessary to remove particulate matter and films. The equipment is then rinsed three times with tap water and/or three times with analyte-free water. Inspect equipment and repeat procedure if any residual soil or visible contaminants are present. Dry sampler with a Kimwipes®. Organic solvents (e.g., methanol) may be used to aid with desorbing organic material but should be kept to a minimum and must be collected and containerized if used.
At the completion of the work day, the samplers should be decontaminated following the procedure above and stored in a manner that minimizes the potential for contamination.
6.2.3 Air Sampling Equipment
For non-laboratory manifold equipment, methanol soak manifold components for a minimum of two hours. Remove from the methanol bath and place in an oven pre-heated to 90 °C and continue to heat manifold components for at least 3 hours or until interior and exterior surface inspections of the manifold components indicate that they are free of liquid methanol.
6.2.4 Handling
All equipment will be handled in a manner that minimizes cross-contamination between points. After cleaning, the equipment will be visibly inspected to detect any residues or other substances that may exist after normal cleaning. If inspection reveals that decontamination was insufficient, the decontamination procedures will be repeated.
Data Reduction/Calculations No data reduction or calculations are associated with this procedure.
Disposal IDW generated by this process will be disposed of in accordance with Federal, State and Local regulations and/or as required by project-specific SAP or Work Plan. Where reasonably feasible, technological changes have been implemented to minimize the potential for environmental pollution.
7.0 Quality Control and Quality Assurance (QA/QC) The QC activities described below allow the self-verification of the quality and consistency of the work.
QA/QC Samples Decontamination procedures may be monitored through the use of an equipment blank which consists of analyte-free water processed through non-disposable or non-dedicated aqueous or solid sampling equipment after equipment decontamination and before field sample collection. The equipment blank is analyzed for the same parameters as the samples at a project specific frequency (e.g., one per twenty samples).

Decontamination of Sampling Equipment Page 5 of 5 Revision Date: 10/06/20
Printed Copy is Uncontrolled. Controlled copy is m
aintained on the internal Barr network. Print a new
copy each time a hard copy is required.
Measurement Criteria Equipment blank results should be below the laboratory’s method detection limit or reporting limit (depending on the data quality objectives).
8.0 Records When required, the field technician(s) will document the field equipment decontamination procedures in a project dedicated field logbook or on field log data sheets.
Examples of common field documentation are available in Barr’s “Compendium of Field Documentation”. Field documentation is listed in the applicable sample collection SOP.
Field documentation and COC are provided to a Barr Data Management Administrator for storage on the internal Barr network.
Additional records information can be found in Barr’s “Records Management System Manual.”
Other Barr SOP subjects referenced within this SOP: collection of samples and investigative derived waste.
9.0 References ASTM. 2015. Standard Practice for Decontamination of Field Equipment Used at Waste Sites.

Standard Operating Procedure Documentation on a Chain-of-Custody (COC)
Revision 6
February 26, 2020
Approved By:
Andrea Nord 02/26/20 Print Technical Reviewer Signature Date
Terri Olson 02/26/20 Print QA Manager Signature Date
Review of the SOP has been performed and the SOP still reflects current practice.
Initials: Date:
Initials: Date:
Initials: Date:
Initials: Date:

Documentation on a COC Form Page 2 of 4 Revision Date: 02/26/20
Printed Copy is Uncontrolled. Controlled copy is m
aintained on the internal Barr network. Print a new
copy each time a hard copy is required.
Documentation on a Chain-of-Custody (COC)
1.0 Scope and Applicability The purpose of this procedure is to describe how to properly document information on a Chain-of-Custody (COC). A COC is a legally binding document that identifies sample identification, analyses required, and shows traceable possession of samples from the time they are obtained until they are introduced as evidence in legal proceedings. A Field Technician completes the information on the COC at the time he/she collects samples and the COC accompanies the samples during transport to a storage facility or to the laboratory for analysis.
The recommended procedures in this SOP should be followed unless conditions make it impractical or inappropriate to do so. Modifications should be noted in the applicable documentation and communicated to appropriate personnel. Significant changes may result in a revision or newly created SOP.
2.0 Limitations • The SOP does not apply to sample aliquots that are only collected for field screening purposes. • The SOP does not apply to samples remaining on-site.
3.0 Responsibilities Experienced Field Technicians are responsible for the proper sample identification and for accurate and complete documentation on the COC.
4.0 Procedure The COC is the most important sampling document; it must be filled out accurately and completely every time a sample is collected. The instructions below are specific to Barr’s COC for air canisters and Barr’s COC typically used for solid and liquid samples. The COC for air canisters is typically used when collecting soil gas, soil vapor, emissions, or indoor and outdoor air samples in an evacuated canister. The COC for solid and liquid samples is typically used when collecting matrices such as groundwater, surface water, drinking water, waste water, storm water, soil, sediment, oil, paint chips, bulk materials, etc. Information common to both COCs and specific to each COC are detailed below.
Some of the information on a COC may be filled out ahead of time (e.g., report and invoice recipient details, project number, project name, project manager, purchase order number, etc.) while other information should be completed during sampling. Complete one COC or more, as needed, for each set of project samples. The COC should be completed prior to leaving the sampling location.
Laboratory supplied COCs may be used but may differ in the information captured. The use of a Barr COC is recommended as it allows for more efficient data processing within Barr’s systems. If there are any questions, please contact a member of Barr’s Data Quality team.
Documentation on a COC Form Page 3 of 4 Revision Date: 02/26/20
Printed Copy is Uncontrolled. Controlled copy is m
aintained on the internal Barr network. Print a new
copy each time a hard copy is required.
The laboratory receiving the samples will sign the COC, record the date and time of sample receipt, assign a laboratory work order number, document sample condition, and document whether custody seals were used and if they were intact.
Common Chain-of-Custody Information • Barr office location managing the work. • Two digit identification for the state or province the samples originated from/sampled in. • COC numbered pages (e.g., 1 of 1). • Report and invoice recipient information. • Purchase order number (if applicable). • Barr project name and number. • Sample location. • Sample collection date and time. • Sample matrix abbreviation (see “Matrix Code” on COC). • Analysis requested. • Field Technician (i.e. sampler) name. • Barr Project Manager and project Data Quality (DQ) Manager names. • Laboratory name and location in which samples are to be relinquished. • Requested due date. • Signature of Field Technician (i.e. sampler) under the first ‘relinquished by’. • Signature of sample transferee. • Date and time of sample transfers. • Method of transport (ground courier, air carrier, sampler, etc.). • Air Bill number (if applicable).
Completing a Chain-of-Custody for Air Canisters Lab deliverable contents (based on project needs). • Canister serial # and size. • Flow controller serial #. • Initial and final vacuum measurement (in inches of mercury). • Start and stop times that the canister was drawing sample. • Total time calculated from the start and stop times. • Matrix code. • PID reading (indicate if ppm or ppb). • Sample comments (if any). • Identify the report deliverable contents and electronic data deliverable contents requested.
Documentation on a COC Form Page 4 of 4 Revision Date: 02/26/20
Printed Copy is Uncontrolled. Controlled copy is m
aintained on the internal Barr network. Print a new
copy each time a hard copy is required.
Completing a Chain-of Custody for Solid and Liquid Samples • Sample start and stop depth (if applicable) and unit of measurement (meter, feet, inches, etc.). • Information regarding whether to perform sample Matrix Spike (MS) and MS duplicate (MSD). • Container preservative type (see “Preservative Code” on COC). • Information regarding whether the sample was field filtered. • Number of each container type and the total number of containers for the sample. • Presence or absence of ice.
Distribution of the COC Pages Page one (white copy) accompanies the sample shipment to the laboratory and page two (yellow copy) is the Field Document copy. The Field Technician must scan and email a copy to the Barr Data Management Administrator for filing on Barr’s internal network project files. Alternatively, the yellow hardcopy may be routed to the Barr Data Management Administrator for electronic filing. This read-only electronic copy will be distributed to and available for use by the project team via Barr’s internal network project file access.
5.0 Quality Control and Quality Assurance (QA/QC) The Field Technician should review the COC for accurate and complete documentation.
6.0 Records Examples of common field documentation are available in Barr’s “Compendium of Field Documentation”. Field documentation specific to this SOP are listed below:
• Chain-of-Custody for Air Canisters • Chain-of-Custody
A copy of the COC is provided to a Barr Data Management Administrator for storage on the internal Barr network files.
Additional records information can be found in Barr’s “Records Management System Manual”.
7.0 References United States Environmental Protection Agency. 2002. Guidance for Quality Assurance Project Plans. EPA QA/G-5.

Standard Operating Procedure Domestic Transport of Samples to
Laboratories within the United States of America –
States and Territories
Revision 3
February 27, 2020
Approved By:
Andrea Nord 02/27/20 Print QA Manager Signature Date
Review of the SOP has been performed and the SOP still reflects current practice.
Initials: Date:
Initials: Date:
Initials: Date:
Initials: Date:

Domestic Transport of Samples to Labs Page 2 of 8 Revision Date: 02/27/20
Printed Copy is Uncontrolled. Controlled copy is m
aintained on the internal Barr network. Print a new
copy each time a hard copy is required.
Standard Operating Procedures for the Domestic Transport of Samples to the Laboratories within the United States of
America – States and Territories
1.0 Scope and Applicability The purpose of this Standard Operating Procedure (SOP) is to describe the procedures necessary for personal delivery or shipment of samples from locations within the United States of America (USA) and its territories to analytical laboratories located within the USA and its territories. This procedure applies to the transportation of ground and surface water, soil, wipe, sediment, paint chip, debris, air samples and their corresponding quality control samples to the appropriate laboratory. This SOP applies to samples that are classified as non-regulated, non-hazardous, or “Dangerous Goods in Excepted Quantities” samples prior to shipment.
Soil samples that are preserved with flammable chemicals (methanol) and unused sample vials containing flammable or corrosive chemical preservatives are examples of materials that are classified as “Dangerous Goods in Excepted Quantities”. Materials classified as Dangerous Goods in Excepted Quantities have limitations on the volume/weight of the material allowed in each shipment, and have additional packaging, labeling, and shipping requirements than non-regulated and non-hazardous samples and sampling media.
The recommended procedures in this SOP should be followed unless conditions make it impractical or inappropriate to do so. Modifications should be noted in the applicable documentation and communicated to appropriate personnel. Significant changes may result in a revision or newly created SOP.
2.0 Limitations • Maintaining proper sample temperatures (<6°C or ambient air temperature in accordance with
the analytical method requirements) and delivering samples to the laboratory within 24 to 48 hours from collection are primary concerns.
• This procedure does not apply to the transportation of samples to laboratories outside of the USA and its territories.
• This procedure does not apply to samples that are classified as “hazardous” according to USDOT, PHMSA, and/or RCRA and must be packaged, labeled, and/or transported in accordance with USDOT’s hazardous materials regulations (49 CFR Parts 100-180).
• This procedure does not apply to samples that are classified as “dangerous goods” and must follow the International Air Transportation Association’s (IATA) dangerous goods regulations (DGR) for packaging, labeling, and/or air transport.
Domestic Transport of Samples to Labs Page 3 of 8 Revision Date: 02/27/20
Printed Copy is Uncontrolled. Controlled copy is m
aintained on the internal Barr network. Print a new
copy each time a hard copy is required.
3.0 Responsibilities The field technician(s) shall ensure the security, temperature, and packaging of environmental samples during transport and shipment.
4.0 Safety Barr staff is responsible for conducting the aspects of the job safely. When applicable, refer to the appropriate Project Health and Safety Plan (PHASP) to understand the hazards associated with suspected contamination, symptoms of exposure, methods to minimize exposure, personal protective equipment (PPE), and personal air monitoring required when using this SOP. Minimum protection of one pair of chemical resistant gloves (e.g., nitrile) and safety glasses with side shields should be worn to prevent sample contact with the skin and eyes. When samples may be contaminated with corrosive materials, emergency eye flushing facilities should be available.
Some of the sample containers may require the use of chemical preservatives. Consult the applicable Safety Data Sheet to review hazards and appropriate PPE to minimize exposure.
5.0 Equipment, Reagents, and Supplies • Rigid cooler • Absorbent padding • Heavy bag for containing ice and
preventing leakage of melted water • Bubble-wrap/bubble bags (inner packing
material) • Ice • Ziploc® baggies • Packing tape • Shipping Airbill – if shipping via overnight
commercial courier service • Dangerous Goods in Excepted Quantities
Label with the number “8” added indicating the hazard class. This label must be used for coolers containing unused sample containers with corrosive preservative.
• Dangerous Goods in Excepted Quantities Label with the number “3” added indicating the hazard class. This label must be used for coolers containing methanol preservative
• Items listed in Section 8.0 Records
6.0 Procedure Packaging of non-regulated or non-hazardous samples requiring ambient air
temperature per the analytical method of analysis Sample matrices that do not require thermal preservation (ice) typically include wipe, paint chip, debris, and air samples. These samples may or may not require chemical preservatives depending upon the analytical method of analysis. The classification of “non-regulated” or “non-hazardous” in this context is based upon the nature of the sample prior to chemical preservation/fixation.
For samples that are stored at ambient air temperature, the samples will be placed in a jar, baggie or shipping carton (i.e. cooler, cardboard box, envelope) and accompanied with the proper COC.

Domestic Transport of Samples to Labs Page 4 of 8 Revision Date: 02/27/20
Printed Copy is Uncontrolled. Controlled copy is m
aintained on the internal Barr network. Print a new
copy each time a hard copy is required.
Place the samples in a shipping carton in a manner that will avoid breakage. Fill out the chain-of-custody (COC) completely and include required copies with the samples. Refer to Barr’s SOP ‘Documentation on a Chain-of-Custody (COC)’ for further information.
Once the shipping carton is packed to prevent samples breaking, the COC is signed off and placed in the cooler or box. Adhere two to three strips of packaging tape from top to bottom on the cooler or box.
Custody seals must be adhered over the shipping carton lid or enclosure if project quality assurance plan or sampling and analysis plan require them. The custody seal must be adhered to the crack of the lid on two opposing sides of the cooler or over the flap(s) of the box or envelope to ensure the carton remained shut and the contents have not been tampered with during transit.
Packaging of non-regulated or non-hazardous samples requiring thermal preservation per the analytical method of analysis
Samples matrices that require thermal preservation (ice) typically include water, soil and sediment samples. Glass containers should be packed in bubble wrap or other cushioning material to avoid breakage.
Note: Bubble-wrap is the preferred packing material.
Line a rigid plastic cooler (i.e. shipping container) with a strong plastic bag. This bag will serve as an outer liner and contain the wet ice, absorbent materials and sample containers.
Place samples and cushioning absorbent material inside the plastic bag and add enough absorbent padding to absorb the sample liquid within the package. Package ice in double-lined Ziploc® bags to ensure sample labels will not be compromised, and the cooler(s) will not leak melt water. Add enough ice to the cooler to maintain a constant temperature at ≤ 6 °C, (but not frozen) until the samples arrive at the laboratory. Zip tie the plastic bag shut.
Before sealing cooler, fill out the COC completely and include required copies with the samples. Refer to Barr’s SOP ‘Documentation on a Chain-of-Custody (COC)’ for further information.
Adhere two to three strips of packaging tape on the cooler from top to bottom, and adhere an additional strip of tape covering the gap between the lid and sides of cooler to seal the cooler to avoid leakage. Custody seals must be adhered on the cooler if project quality assurance plan or sampling and analysis plan require them. The custody seal must be adhered to the crack of the lid on two opposing sides of the cooler to ensure the contents have not been tampered with during transit.
Follow the labelling instructions in Section 6.4 of this SOP.

Domestic Transport of Samples to Labs Page 5 of 8 Revision Date: 02/27/20
Printed Copy is Uncontrolled. Controlled copy is m
aintained on the internal Barr network. Print a new
copy each time a hard copy is required.
Packaging of samples classified as “Dangerous Goods in Excepted Quantities” 6.3.1 Soil Samples Preserved with Methanol (Flammable) – Hazard Class 3
Soil samples that are preserved with flammable chemicals (methanol) are an example of materials that are classified as hazard class “3” “Dangerous Goods in Excepted Quantities”.
Follow the packaging instructions listed in Section 6.2 of this SOP with the following addition: Methanol sample containers must be placed in a Ziploc® Baggie to meet shipping requirements for preventing leakage.
Each cooler shall not exceed 500 mL of methanol (50 vials, 10 mL of methanol per vial) and each vial shall not have more than 10 mL of methanol to meet the requirements of a Dangerous Goods in Excepted Quantities. A label with the hazard class number “3” indicates the cooler contains flammable (or reactive/oxidizer) materials (in this case a flammable methanol sample preservative). Additional labeling instructions are found in Section 6.4.2 of this SOP.
6.3.2 Unused Sample Jars – Hazard Class 3 (Flammable) and Hazard Class 8 (Corrosive) Chemicals
Unused sample vials containing flammable or corrosive chemical preservatives are examples of materials that are classified as “Dangerous Goods in Excepted Quantities”.
Follow the packaging instructions listed in Section 6.2 of this SOP with the following additions:
Each chemical, may have a limitation as to the volume or weight of the chemical and the number of inner containers (sample containers) allowed within each outer shipping container (cooler) to meet the requirements of a Dangerous Goods in Excepted Quantities. A label with the hazard class number “3” indicates the cooler contains flammable (or reactive/oxidizer) materials (in this case a flammable methanol sample preservative). A label with the hazard class number “8” indicates the cooler contains a corrosive material (in this case an acid or base sample preservative). Additional labeling instructions are found in Section 6.4.2 of this SOP.
Labeling of Outer Shipping Container or Carton 6.4.1 Shipping Label
Attach the shipping address label to the top of the cooler or to the cooler handle tag. Attach a second label with the same information should also be attached with packaging tape to the cooler in event that the original label is damaged or destroyed during sample shipment.
Directional arrow labels (Figure 1) must also be attached to the outside of the cooler according to the hazardous materials shipping regulations. Directional arrow labels indicate the upright position during sample shipment.

Domestic Transport of Samples to Labs Page 6 of 8 Revision Date: 02/27/20
Printed Copy is Uncontrolled. Controlled copy is m
aintained on the internal Barr network. Print a new
copy each time a hard copy is required.
Figure 1 - Directional Arrows Label
6.4.2 Dangerous Goods in Excepted Quantities Label
When shipping materials classified as Dangerous Goods in Excepted Quantities, the cooler must have a Dangerous Goods in Excepted Quantities Label (Figure 2). This label is placed on two opposing sides of the cooler. The label indicates the hazard class number and the name and address of the shipper or consignee. In cases where the package contents have more than one hazard class assigned, the primary (most hazardous) hazard class is listed on the label. Table 1 includes a Summary of United Nations Hazard Classes.
Figure 2 - Dangerous Goods in Excepted Quantities Label
Footnotes:
(1) The “*” must be replaced by the primary hazard class, or when assigned, the division of each of the hazardous materials contained in the package.
(2) The “**” must be replaced by the name of the shipper or consignee if not shown elsewhere on the package.
*
**

Domestic Transport of Samples to Labs Page 7 of 8 Revision Date: 02/27/20
Printed Copy is Uncontrolled. Controlled copy is m
aintained on the internal Barr network. Print a new
copy each time a hard copy is required.
Table 1 – Summary of United Nations Hazard Classes
Class 1 Explosives Class 2 Gases Class 3 Flammable Liquids Class 4 Flammable Solids; Substances Liable to Spontaneous Combustion; Substances Which, in Contact with
Water, Emit Flammable Gases (e.g., soil sample contaminated with high concentrations of gasoline released from an underground storage tank)
Class 5 Oxidizing Substances and Organic Peroxide Class 6 Toxic and Infectious Substances (e.g., samples of refuse collected from a solid waste landfill) Class 7 Radioactive Material Class 8 Corrosives (e.g., nitric acid used for preservation of some groundwater samples) (see Note) Class 9 Miscellaneous Dangerous Goods
6.4.2.1 Dangerous Goods Air Waybill Statement and Shippers Declaration
A shipping paper (i.e. bill of lading) is not required when offering the cooler for air transport via a commercial courier service (e.g. Federal Express or United Parcel Service).
A document such as an air waybill accompanies a shipment that is transported by aircraft. The air waybill must include the statement “Dangerous Goods in Excepted Quantities” and indicate the number of packages associated with each air waybill. This phrase is typically written behind the Barr project number in the PO or comments section on the air waybill.
A shipper’s declaration for dangerous goods is also required. Some air waybills also have a box you must also check off that says “Dangerous Goods no Shipper’s Declaration Required”.
Transport/Delivery Options Account for the samples before shipping and compare to the COC. Refer to Barr’s SOP ‘Documentation on a Chain-of-Custody (COC) for further information. Ship samples during times when the laboratory will be able to accept and quickly analyze them. Whenever possible, select mode of transport/delivery to ensure delivery to the laboratory will occur with ample holding time remaining for the specified analytical methods required for the samples. Avoid sending samples during holidays and weekends. All Federal, State and Local shipping regulations must be met.
Personal Delivery. The samples are delivered to the laboratory by the field technician(s). The COC is signed and dated by the laboratory representative.
Ground Transport. The same procedures are followed as above; i.e., the COC is signed and dated and the top copy is sent with the samples. The cooler or box is then secured with packaging tape and a courier form is filled out for the designated laboratory. The cooler or box is then left in the services area for pickup via ground transport and delivery.
Air Transport. Follow the procedures above, replacing the courier form with the overnight courier air bill via Federal Express or United Parcel Service, for example. Include the date, project number, type of
Domestic Transport of Samples to Labs Page 8 of 8 Revision Date: 02/27/20
Printed Copy is Uncontrolled. Controlled copy is m
aintained on the internal Barr network. Print a new
copy each time a hard copy is required.
delivery service desired, parcel weight, number of coolers or boxes on the air bill. Also include the phrase “Dangerous Goods in Excepted Quantities”, when applicable.
7.0 Quality Control and Quality Assurance (QA/QC) Not Applicable.
8.0 Records Examples of common field documentation are available in Barr’s “Compendium of Field Documentation”.
Field documentation specific to this SOP are listed below:
• Chain-of-custody (COC) • Custody seal (if applicable) • Dangerous Goods in Excepted Quantities Label • Directional Arrow Label
COCs are provided to a Barr Data Management Administrator for storage on the internal Barr network.
Additional records information can be found in Barr’s “Records Management System Manual”.
Other Barr SOP subjects referenced within this SOP: documentation on a COC.
9.0 References 49 CFR Part 173.4a – Excepted Quantities October 1, 2011 Online https://www.govinfo.gov/app/details/CFR-2011-title49-vol2/CFR-2011-title49-vol2-sec173-4
ASTM International. 2015. ASTM Method D6911 – 15 Standard Guide for Packaging and Shipping Environmental Samples for Laboratory Analysis1. ASTM January 15, 2015.
Standard Operating Procedure Filtering of Water Samples
Revision 7
April 26, 2021
Approved By:
John W. Juntilla 04/26/21 Print Technical Reviewer Signature Date
Michael Dupay 04/26/21 Print QA Manager Signature Date
Review of the SOP has been performed and the SOP still reflects current practice.
Initials: Date:
Initials: Date:
Initials: Date:
Initials: Date:
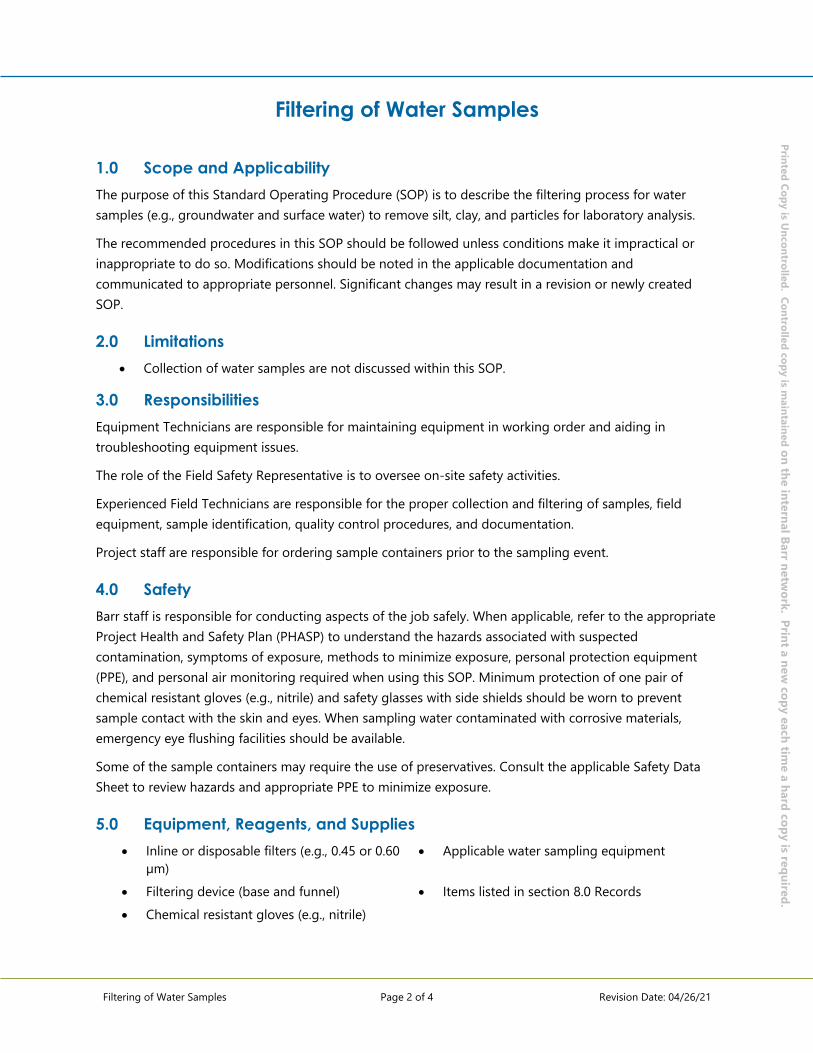
Filtering of Water Samples Page 2 of 4 Revision Date: 04/26/21
Printed Copy is Uncontrolled. Controlled copy is maintained on the internal Barr network. Print a new copy each tim
e a hard copy is required.
Filtering of Water Samples
1.0 Scope and Applicability The purpose of this Standard Operating Procedure (SOP) is to describe the filtering process for water samples (e.g., groundwater and surface water) to remove silt, clay, and particles for laboratory analysis. The recommended procedures in this SOP should be followed unless conditions make it impractical or inappropriate to do so. Modifications should be noted in the applicable documentation and communicated to appropriate personnel. Significant changes may result in a revision or newly created SOP.
2.0 Limitations Collection of water samples are not discussed within this SOP.
3.0 Responsibilities Equipment Technicians are responsible for maintaining equipment in working order and aiding in troubleshooting equipment issues. The role of the Field Safety Representative is to oversee on-site safety activities. Experienced Field Technicians are responsible for the proper collection and filtering of samples, field equipment, sample identification, quality control procedures, and documentation. Project staff are responsible for ordering sample containers prior to the sampling event.
4.0 Safety Barr staff is responsible for conducting aspects of the job safely. When applicable, refer to the appropriate Project Health and Safety Plan (PHASP) to understand the hazards associated with suspected contamination, symptoms of exposure, methods to minimize exposure, personal protection equipment (PPE), and personal air monitoring required when using this SOP. Minimum protection of one pair of chemical resistant gloves (e.g., nitrile) and safety glasses with side shields should be worn to prevent sample contact with the skin and eyes. When sampling water contaminated with corrosive materials, emergency eye flushing facilities should be available. Some of the sample containers may require the use of preservatives. Consult the applicable Safety Data Sheet to review hazards and appropriate PPE to minimize exposure.
5.0 Equipment, Reagents, and Supplies Inline or disposable filters (e.g., 0.45 or 0.60
µm) Applicable water sampling equipment
Filtering device (base and funnel) Items listed in section 8.0 Records Chemical resistant gloves (e.g., nitrile)
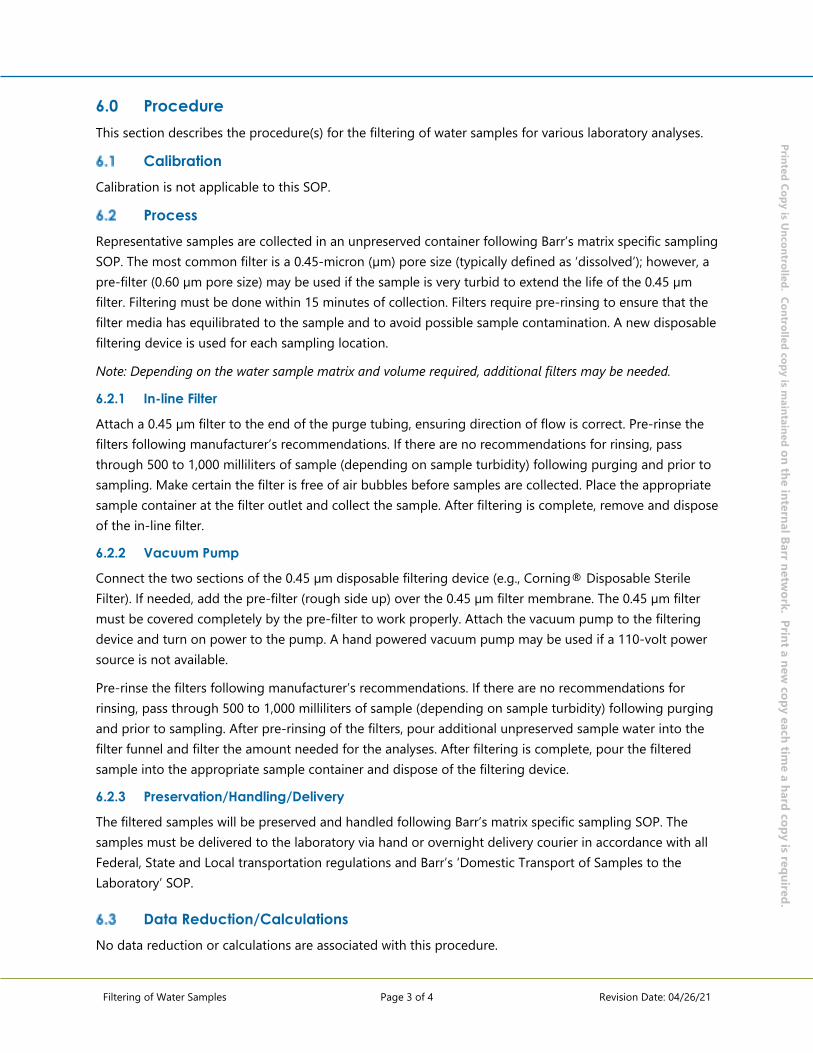
Filtering of Water Samples Page 3 of 4 Revision Date: 04/26/21
Printed Copy is Uncontrolled. Controlled copy is maintained on the internal Barr network. Print a new copy each tim
e a hard copy is required.
6.0 Procedure This section describes the procedure(s) for the filtering of water samples for various laboratory analyses.
Calibration Calibration is not applicable to this SOP.
Process Representative samples are collected in an unpreserved container following Barr’s matrix specific sampling SOP. The most common filter is a 0.45-micron (µm) pore size (typically defined as ‘dissolved’); however, a pre-filter (0.60 µm pore size) may be used if the sample is very turbid to extend the life of the 0.45 µm filter. Filtering must be done within 15 minutes of collection. Filters require pre-rinsing to ensure that the filter media has equilibrated to the sample and to avoid possible sample contamination. A new disposable filtering device is used for each sampling location. Note: Depending on the water sample matrix and volume required, additional filters may be needed. 6.2.1 In-line Filter
Attach a 0.45 µm filter to the end of the purge tubing, ensuring direction of flow is correct. Pre-rinse the filters following manufacturer’s recommendations. If there are no recommendations for rinsing, pass through 500 to 1,000 milliliters of sample (depending on sample turbidity) following purging and prior to sampling. Make certain the filter is free of air bubbles before samples are collected. Place the appropriate sample container at the filter outlet and collect the sample. After filtering is complete, remove and dispose of the in-line filter. 6.2.2 Vacuum Pump
Connect the two sections of the 0.45 µm disposable filtering device (e.g., Corning® Disposable Sterile Filter). If needed, add the pre-filter (rough side up) over the 0.45 µm filter membrane. The 0.45 µm filter must be covered completely by the pre-filter to work properly. Attach the vacuum pump to the filtering device and turn on power to the pump. A hand powered vacuum pump may be used if a 110-volt power source is not available. Pre-rinse the filters following manufacturer’s recommendations. If there are no recommendations for rinsing, pass through 500 to 1,000 milliliters of sample (depending on sample turbidity) following purging and prior to sampling. After pre-rinsing of the filters, pour additional unpreserved sample water into the filter funnel and filter the amount needed for the analyses. After filtering is complete, pour the filtered sample into the appropriate sample container and dispose of the filtering device. 6.2.3 Preservation/Handling/Delivery
The filtered samples will be preserved and handled following Barr’s matrix specific sampling SOP. The samples must be delivered to the laboratory via hand or overnight delivery courier in accordance with all Federal, State and Local transportation regulations and Barr’s ‘Domestic Transport of Samples to the Laboratory’ SOP.
Data Reduction/Calculations No data reduction or calculations are associated with this procedure.
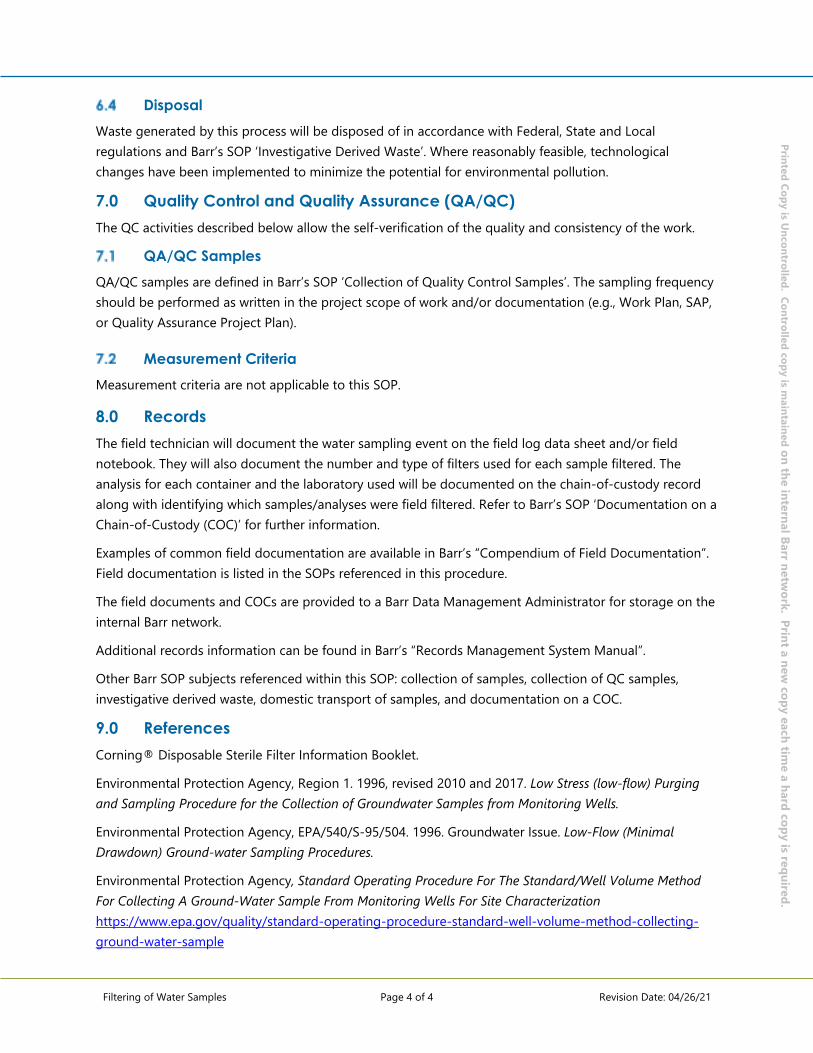
Filtering of Water Samples Page 4 of 4 Revision Date: 04/26/21
Printed Copy is Uncontrolled. Controlled copy is maintained on the internal Barr network. Print a new copy each tim
e a hard copy is required.
Disposal Waste generated by this process will be disposed of in accordance with Federal, State and Local regulations and Barr’s SOP ‘Investigative Derived Waste’. Where reasonably feasible, technological changes have been implemented to minimize the potential for environmental pollution.
7.0 Quality Control and Quality Assurance (QA/QC) The QC activities described below allow the self-verification of the quality and consistency of the work.
QA/QC Samples QA/QC samples are defined in Barr’s SOP ‘Collection of Quality Control Samples’. The sampling frequency should be performed as written in the project scope of work and/or documentation (e.g., Work Plan, SAP, or Quality Assurance Project Plan).
Measurement Criteria Measurement criteria are not applicable to this SOP.
8.0 Records The field technician will document the water sampling event on the field log data sheet and/or field notebook. They will also document the number and type of filters used for each sample filtered. The analysis for each container and the laboratory used will be documented on the chain-of-custody record along with identifying which samples/analyses were field filtered. Refer to Barr’s SOP ‘Documentation on a Chain-of-Custody (COC)’ for further information. Examples of common field documentation are available in Barr’s “Compendium of Field Documentation”. Field documentation is listed in the SOPs referenced in this procedure. The field documents and COCs are provided to a Barr Data Management Administrator for storage on the internal Barr network. Additional records information can be found in Barr’s “Records Management System Manual”. Other Barr SOP subjects referenced within this SOP: collection of samples, collection of QC samples, investigative derived waste, domestic transport of samples, and documentation on a COC.
9.0 References Corning® Disposable Sterile Filter Information Booklet. Environmental Protection Agency, Region 1. 1996, revised 2010 and 2017. Low Stress (low-flow) Purging and Sampling Procedure for the Collection of Groundwater Samples from Monitoring Wells.
Environmental Protection Agency, EPA/540/S-95/504. 1996. Groundwater Issue. Low-Flow (Minimal Drawdown) Ground-water Sampling Procedures. Environmental Protection Agency, Standard Operating Procedure For The Standard/Well Volume Method For Collecting A Ground-Water Sample From Monitoring Wells For Site Characterization https://www.epa.gov/quality/standard-operating-procedure-standard-well-volume-method-collecting-ground-water-sample
Standard Operating Procedure Routine Level General Chemistry Data Evaluation
Revision 8
January 2, 2020
Approved By:
Michael Dupay 01/02/20 Print Technical Reviewer Signature Date
Terri Olson 01/02/20 Print QA Manager Signature Date
Review of the SOP has been performed and the SOP still reflects current practice.
Initials: Date:
Initials: Date:
Initials: Date:
Initials: Date:
Routine Level General Chemistry Data Evaluation
Page 2 of 10 Revision Date: 01/02/20
Printed Copy is Uncontrolled. Controlled copy is m
aintained on the internal Barr network. Print a new
copy each time a hard copy is required.
Routine Level General Chemistry Data Evaluation
1.0 Scope and Applicability This SOP is intended as a guidance document for the routine level evaluation of general chemistry data provided by laboratories to be used in Barr Engineering Company (Barr) projects.
This SOP is based on the recommendations of the associated approved analytical methods from USEPA, ASTM, and Standard Methods for the Examination of Water and Wastewater and applies to routine general chemistry data evaluation including a variety of approved methods not limited to the following parameters:
Alkalinity (Total, Bicarbonate, Carbonate) Orthophosphate
Ammonia, Total (NH3 + NH4-) pH – in lab
Biological Oxygen Demand (BOD) Phosphorus, Total
Chemical Oxygen Demand (COD) Sulfate
Chloride Sulfide
Chromium VI (Hexavalent Chromium) Surfactants
Conductance, Specific – in lab Total Dissolved Solids (TDS)
Cyanide (as CN-) Total Kjeldahl Nitrogen (TKN)
Fluoride Total Organic Carbon (TOC)
Hardness Total Phenolics
Nitrate (or Nitrite) only Total Suspended Solids (TSS)
Nitrate + Nitrite Turbidity
Oil and Grease (as HEM)
In the case of specific parameters not listed above, the guidelines within this document will provide the basis upon which to make adequate professional judgment in the evaluation of data submitted for review. Laboratories may not provide all the review elements in this SOP, review only those that are provided.
The recommended procedures in this SOP should be followed unless conditions make it impractical or inappropriate to do so. Modifications should be noted in the applicable documentation and communicated to appropriate personnel. Significant changes may result in a revision or newly created SOP.
2.0 Limitations • Level IV data evaluation is not covered in this SOP and should be performed in accordance with
project specific requirements.
3.0 Responsibilities The laboratory is responsible for generating data from the samples submitted for analysis. In instances where QC criteria are not met for the analysis of samples, the laboratory is responsible for reanalysis of the samples, provided reanalysis is possible (considering matrix interference, holding times and sample volume, etc.), or documenting the impact to the data.

Routine Level General Chemistry Data Evaluation
Page 3 of 10 Revision Date: 01/02/20
Printed Copy is Uncontrolled. Controlled copy is m
aintained on the internal Barr network. Print a new
copy each time a hard copy is required.
The Data Quality Specialist is responsible for evaluating the data in accordance with this document, in addition to using professional judgment where necessary or appropriate. Project specific requirements, such as those specified in a Quality Assurance Project Plan (QAPP) or Sampling and Analysis Plan (SAP), may differ from these recommendations and professional judgment should be applied before qualifying any data.
4.0 Procedure The Quality Assurance/Quality Control (QA/QC) data detailed below are the most typical found in a routine level laboratory report evaluation. Other QA/QC data may be provided by the laboratory within the laboratory report case narrative, data qualifiers, or cover sheet and should be evaluated using professional judgment (e.g., initial calibration, calibration verification, internal standards, post digestion, serial dilution).
Definitions to common QA/QC terms and terms used within this SOP along with a list of Barr ‘Data Qualifiers/Footnotes’ that may be applied during review can be found in Barr’s “Compendium of Data Quality Assessment Documentation”.
4.1 Holding Time and Preservation The purpose of holding time and preservation evaluation is to ascertain the validity of the analytical results based on the sample condition, preservation, and time elapsed between the date of sample collection and date of analysis.
40 CFR Part 136 and the Test Methods for Evaluating Solid Waste (SW-846) are used as guidance for the recommended holding time and preservation acceptance criteria listed in Table 1. Further information may be found in the water and soil sampling guidelines in Barr’s “Compendium of Field Documentation”.
Table 1 - Recommended Holding Times and Preservation
Parameter
Recommended Hold Time Preservation
24 H
our
48 H
our
7 D
ay
14 D
ay
28 D
ay
180
Day
Ice
(≤ 6
°C )
HCl
HN
O3
H2S
O4
NaO
H
ZnAc
+
NaO
H
Alkalinity, as CaCO3 X X
Ammonia as N X X X
Biochemical Oxygen Demand (BOD) X X
Chemical Oxygen Demand (COD) X X X
Chloride X None required
Chromium, Hexavalent X xa X
Conductance, Specific X X
Cyanide X X X
Fluoride X None required
Hardness X Xb Xb
(Table 1 continued on next page)

Routine Level General Chemistry Data Evaluation
Page 4 of 10 Revision Date: 01/02/20
Printed Copy is Uncontrolled. Controlled copy is m
aintained on the internal Barr network. Print a new
copy each time a hard copy is required.
Table 1 - Recommended Holding Times and Preservation
Parameter
Recommended Hold Time Preservation
24 H
our
48 H
our
7 D
ay
14 D
ay
28 D
ay
180
Day
Ice
(≤ 6
°C )
HCl
HN
O3
H2S
O4
NaO
H
ZnAc
+
NaO
H
Nitrate or Nitrite Xc X
Nitrate + Nitrite as N X X X
Oil & Grease, HEM X X Xd Xd
Orthophosphate (field filter w/in 15 min) X X
pH Xe None required
Phenolics, total X X X
Phosphorus, total X X X
Sulfate X X
Sulfide X X X
Surfactants X X
Total Dissolved Solids (TDS) X X
Total Kjeldahl Nitrogen (TKN) X X X
Total Organic Carbon (TOC) X X Xd Xd
Total Suspended Solids (TSS) X X
Turbidity X X
a = Per 40 CFR Part 136.3, a 28-day holding time may be achieved if the ammonium sulfate buffer solution specified in EPA Method 218.6 is used. This footnote supersedes preservation and holding time requirements in approved hexavalent chromium methods, unless this would compromise the measurement and then the method must be followed. b = Either preservative may be used for the titration method; if calculated from Ca and Mg, HNO3. c = Holding time for nitrate is NA when calculated from Nitrate + Nitrite minus Nitrite. d = Either preservative may be used (pH < 2). e = Method recommends pH should be measured in the field, holding time is 15 minutes.; however, for confirmation measurements in the laboratory, a maximum holding time of 7 days from sample collection may be used as a guideline for qualification.
If samples do not meet holding time, preservation and analysis recommendations in Table 1, consider qualification with an ‘H’ (“Recommended sample preservation, extraction or analysis holding time was exceeded.”). Other matrices, such as product samples (e.g. oil, waste rock, drill cores) may not be subject to the same holding time recommendations.
If the sample was stored on ice upon collection and delivered to the laboratory the same day, the sample may exceed recommended temperature at the time of laboratory receipt. Professional judgment should be applied (considering temperature, matrix, magnitude of the exceedance, etc.) when evaluating the application of qualifiers when criteria are not met.

Routine Level General Chemistry Data Evaluation
Page 5 of 10 Revision Date: 01/02/20
Printed Copy is Uncontrolled. Controlled copy is m
aintained on the internal Barr network. Print a new
copy each time a hard copy is required.
4.2 Blank Samples Blank sample evaluation is conducted to determine the existence and magnitude of target analyte contamination as a result of activities in the field during collection and transport or from inter-laboratory sources.
• While not required for all methods, method blanks are recommended for all but the pH analysis. Evaluation pertains to the batch of samples analyzed with the method blank.
• Field or equipment blank collection and analysis frequency is project specific. Evaluation pertains to the field samples associated with the field or equipment blank.
• Blank analyses may not have involved the same weights, volumes, or dilution factors as the associated samples. Data reviewers may have to obtain raw data and/or convert the data to the same units for comparison purposes.
Table 2 – Guidelines for Blank Contamination
Sample Result Recommended Action for Associated Data
Non-detect No action required
< 5x blank concentration Qualify with ‘UB’
≥ 5x blank concentration Use professional judgment UB = The analyte is detected in one of the associated laboratory, equipment, field or trip blank samples and is
considered non-detect at the concentration reported by the laboratory.
Note: Other multipliers of the blank contamination may be used based on professional judgment (reporting to the MDL, common lab contaminant, etc.)
Professional judgment regarding the usability of the data should be used in cases where gross detections of target analytes are found in the blank sample. A number of factors may be considered including historical data, prior knowledge of the site conditions, target analytes involved, type of blank sample, etc. In such cases, it may be appropriate to qualify the affected data with ‘J’ (“Estimated detected value. Either certain QC criteria were not met or the concentration is between the laboratory’s detection and quantitation limits.”) or ‘R’ (“The data are unusable. The sample results are rejected due to serious deficiencies in meeting QC criteria. The analyte may or may not be present in the sample.”).
4.3 Laboratory Control Samples (LCS) and Laboratory Control Sample Duplicate Samples (LCSD)
The laboratory control sample is used to monitor the overall performance of each step during analysis, including sample preparation. The LCS should be analyzed:
• Once every preparation batch (typically 20 or less samples of the same matrix). • Once for each matrix.
Laboratory control samples contain a known amount of each target compound and the percent recoveries are evaluated based on the criteria within the laboratory report or project specific requirements. Percent recoveries are calculated for accuracy and the relative percent difference (RPD) is calculated for precision (when an LCSD was analyzed). Accuracy and precision equations can be found in ‘Definitions’ from Barr’s “Compendium of Data Quality Assessment Documentation”.

Routine Level General Chemistry Data Evaluation
Page 6 of 10 Revision Date: 01/02/20
Printed Copy is Uncontrolled. Controlled copy is m
aintained on the internal Barr network. Print a new
copy each time a hard copy is required.
Table 3 – Guidelines for Laboratory Control Samples
Criteria Recommended Action for Associated Data
Detect Non-Detect
%R > Upper Limit Qualify with ‘J+’ or use professional judgment No qualification
%R < Lower Limit Qualify with ‘J-’ or ‘R’, use professional judgment
RPD > Upper Limit Qualify with ‘J’ or use professional judgment
%R and RPD within Limits No qualification J+ = The result is an estimated quantity and may be biased high. J- = The result is an estimated quantity and may be biased low. J = Estimated detected value. Either certain QC criteria were not met or the concentration is between the laboratory’s detection and quantitation limits. R = The data are unusable. The sample results are rejected due to serious deficiencies in meeting QC criteria.
The analyte may or may not be present in the sample.
4.4 Laboratory Duplicate Samples Laboratory duplicate samples are separate aliquots of field samples analyzed to demonstrate acceptable method precision by the laboratory at the time of analysis. Ideally, blanks and proficiency testing (PT) samples should not be used for duplicate analysis. The MS/MSD duplicate pairs may be substituted for laboratory duplicates. The RPDs are calculated using the equation as provided in ‘Definitions’ from Barr’s “Compendium of Data Quality Assessment Documentation” and are not calculated where data are already qualified with U, UB, <, or R. RPD results are dependent on the homogeneity of the samples.
Duplicates should be analyzed (whichever is more frequent):
• One from each matrix (soil or water)
• One from each SDG
Laboratory acceptance criteria or project specific requirement are used to evaluate RPDs. If criteria are not available, use professional judgment when considering qualification of associated results.
Higher RPDs are expected when results are at or near the reporting limits and are not always indicative of poor precision. RPDs are typically only evaluated for samples where both the native and duplicate sample concentrations are greater than five times (>5x) the RL. In cases where either of the samples (native or duplicate) is non-detect for a parameter and the other corresponding sample has detectable concentrations much greater than five times (>5x) the RL, professional judgment should be used to determine if qualification is appropriate.

Routine Level General Chemistry Data Evaluation
Page 7 of 10 Revision Date: 01/02/20
Printed Copy is Uncontrolled. Controlled copy is m
aintained on the internal Barr network. Print a new
copy each time a hard copy is required.
Table 4 – Guidelines for Laboratory Duplicates
% RPD Recommended Action for Associated Data
RPD < Upper Limit No action is required
RPD > Upper Limit Both results are ≤ 5x RL, no action is required
RPD > Upper Limit
Both results are > 5x RL, consider qualifying with ‘J’ J = Estimated detected value. Either certain QC criteria were not met or the concentration is between the laboratory’s detection and quantitation limits.
4.5 Field Duplicate Samples Field duplicate samples (also known as “masked” or “blind” duplicate samples) are used to demonstrate acceptable precision and reproducibility of the field and laboratory procedures. Frequency of collection is project specific. The RPDs are calculated using the equation as provided under precision in ‘Definitions’ from Barr’s “Compendium of Data Quality Assessment Documentation” and are not calculated where data is already qualified with U, UB, <, or R. RPD results are dependent on the homogeneity of the samples.
Acceptance criteria for field duplicate samples are subject to the professional judgment of the Data Quality Specialist but typically RPDs ≤ 30% for aqueous samples and ≤ 40% for soil and sediment samples are considered acceptable unless other project specific requirements are defined.
Higher RPDs are expected when results are at or near the reporting limits and are not always indicative of poor precision. RPDs are typically only evaluated for samples where both the native and duplicate sample concentrations are greater than five times (>5x) the RL. In cases where either of the samples (native or field duplicate) is non-detect for a parameter and the other corresponding sample has detectable concentrations much greater than five times (>5x) the RL, professional judgment should be used to determine if qualification is appropriate.
Table 5 – Guidelines for Field Duplicates
% RPD Recommended Action for Associated Data
RPD < Upper Limit No action is required
RPD > Upper Limit Both results are ≤ 5x RL, no action is required
RPD > Upper Limit
Both results are > 5x RL, consider qualifying with ‘J’ J = Estimated detected value. Either certain QC criteria were not met or the concentration is between the laboratory’s detection and quantitation limits.
4.6 Matrix Spikes (MS) and Matrix Spike Duplicate (MSD) Samples Matrix spike samples contain a known amount of a target compound and provide information about the effect of each samples’ matrix on the sample preparation procedures and analytical results. Matrix spikes are typically analyzed at the following frequencies:
• 1 (MS/MSD pair) in every 20 samples • 1 per preparation batch per matrix • 1 per SDG

Routine Level General Chemistry Data Evaluation
Page 8 of 10 Revision Date: 01/02/20
Printed Copy is Uncontrolled. Controlled copy is m
aintained on the internal Barr network. Print a new
copy each time a hard copy is required.
However, the frequency may be project specific and the documents outlining the needs of the project (SAP, QAPP, etc.) should be reviewed. In some cases, MS/MSD analysis is not required.
The percent recoveries are evaluated based on the criteria within the laboratory report or project specific requirements. If a matrix spike recovery does not meet acceptance criteria and is not associated with a project sample, no further action is required unless other systematic evidence warrants qualification.
If the native concentration of a spiked sample is significantly greater than the spike added (>4x), spike recovery cannot be accurately evaluated, therefore the criteria do not apply. Professional judgment should be used for percent recoveries nominally outside laboratory acceptance criteria prior to qualifying data.
If criteria are not available, use guidance found in the NFG. Percent recoveries of matrix spike (and matrix spike duplicate) samples should be calculated using the equation provided under accuracy in ‘Definitions’ from Barr’s “Compendium of Data Quality Assessment Documentation”.
Solid samples may have highly variable concentrations of target analytes and percent recoveries (%R) may be influenced by the sampling precision and inherent sample homogeneity. Professional judgment should be used for difficult matrices and the acceptance criteria adjusted accordingly.
Table 6 – Guidelines for Matrix Spikes
Criteria Recommended Action for Associated Data
Detect Non-Detect
%R > Upper Limit Qualify with ‘J+’ or use professional judgment No qualification
%R < Lower Limit Qualify with ‘J-’ or ‘R’, use professional judgment
RPD > Upper Limit Qualify with ‘J’ or use professional judgment
%R and RPD within Limits No qualification J+ = The result is an estimated quantity and may be biased high. J- = The result is an estimated quantity and may be biased low. J = Estimated detected value. Either certain QC criteria were not met or the concentration is between the laboratory’s detection and quantitation limits. R = The data are unusable. The sample results are rejected due to serious deficiencies in meeting QC criteria.
The analyte may or may not be present in the sample.
While matrix spike duplicates are not required by all methods, if results for MSD analyses are reported, evaluate the RPD for MS and MSD pairs using the equation as provided under precision in ‘Definitions’ from Barr’s “Compendium of Data Quality Assessment Documentation”.
4.7 Overall Assessment The chain-of-custody should be reviewed to determine if the laboratory report matches the requested analyses and that project specific parameters were analyzed as requested. The narrative and other supporting documentation should be evaluated to ensure that sample condition was appropriately documented by the laboratory upon receipt. If available, historical data should be used to assist with data evaluation. Any additional anomalies should be documented and evaluated, if necessary.

Routine Level General Chemistry Data Evaluation
Page 9 of 10 Revision Date: 01/02/20
Printed Copy is Uncontrolled. Controlled copy is m
aintained on the internal Barr network. Print a new
copy each time a hard copy is required.
5.0 Quality Control and Quality Assurance (QA/QC) Depending on the project objectives, the data evaluation may include the completion of a Routine Level Quality Control Report. This may be a report produced via EQuIS DQM (Environmental Quality Information System Data Quality Module) or a hardcopy as found in Barr’s “Compendium of Data Quality Assessment Documentation”. Within each QC data section, the reviewer should include references to whether the QC data met or exceeded the acceptance criteria. The qualifiers, added, removed, or retained, should be documented. If using EQuIS DQM, reason codes will also be applied. The reason codes are defined in the software. Where multiple qualifiers may be applicable to a sample/analyte result, professional judgment should be used to determine if all qualifiers are necessary or if one qualifier would be sufficient to represent the deviations. A statement as to whether the data are acceptable as reported or acceptable with qualification(s) should also be included. If revised reports are required and the revision affects the sample results, notification should be given to the appropriate data management personnel and/or project team members.
6.0 Records The Routine Level Quality Control Report should be saved to the appropriate internal Barr file and the link uploaded to the tracking system. Periodically, Data Quality staff should check for missing Routine Level Quality Control Reports in the tracking system to help maintain the most current information. Documentation of the data evaluation may include but is not limited to an email to the project team, data evaluation summary report, technical memo, or section within a project report.
Documentation specific to this SOP are listed below and are available in Barr’s “Compendium of Data Quality Assessment Documentation”.
• Definitions • Barr Qualifiers/Footnotes • Routine Level Quality Control Report
Additional records information can be found in Barr’s “Records Management System Manual”.
7.0 References Environmental Protection Agency. Title 40 of the Code of Federal Regulations, Part 136.3.
Environmental Protection Agency, National Functional Guidelines for Inorganic Superfund Data Review.
Analytical methods listed under the ‘Scope and Applicability’ section of this SOP.

Routine Level General Chemistry Data Evaluation
Page 10 of 10 Revision Date: 01/02/20
Printed Copy is Uncontrolled. Controlled copy is m
aintained on the internal Barr network. Print a new
copy each time a hard copy is required.
Attachment 1 Revision History
Revision Number
Date of Revision Section Revision Made
5.0 06/17/13
Cover page Added Calgary office
Applicability Added US to EPA reference
I Added waste rock and drill cores to examples of product sample
III Added LCSD information
III, IV, V, VI Added ‘project specific requirements’ as possible criteria source
V Added ‘field and laboratory procedures’ to clarify that it’s not only a laboratory item
V Clarified field duplicate criteria as < one value and not a range
VIII Added statement regarding multiple qualifiers
6 01/07/16 Document Wide SOP restructuring, new format
7 04/24/18 1.0
Added laboratories may not provide all the review elements in this SOP, review only those that are provided.
4.2, third bullet Clarified that data reviewers would have to obtain raw data since not provided with Level II report.
8 01/02/20 Document wide Updated for new qualifiers

Standard Operating Procedure Routine Level General Chemistry Data Evaluation
Revision 8
January 2, 2020
Approved By:
Michael Dupay 01/02/20 Print Technical Reviewer Signature Date
Terri Olson 01/02/20 Print QA Manager Signature Date
Review of the SOP has been performed and the SOP still reflects current practice.
Initials: Date:
Initials: Date:
Initials: Date:
Initials: Date:

Routine Level General Chemistry Data Evaluation
Page 2 of 10 Revision Date: 01/02/20
Printed Copy is Uncontrolled. Controlled copy is m
aintained on the internal Barr network. Print a new
copy each time a hard copy is required.
Routine Level General Chemistry Data Evaluation
1.0 Scope and Applicability This SOP is intended as a guidance document for the routine level evaluation of general chemistry data provided by laboratories to be used in Barr Engineering Company (Barr) projects.
This SOP is based on the recommendations of the associated approved analytical methods from USEPA, ASTM, and Standard Methods for the Examination of Water and Wastewater and applies to routine general chemistry data evaluation including a variety of approved methods not limited to the following parameters:
Alkalinity (Total, Bicarbonate, Carbonate) Orthophosphate
Ammonia, Total (NH3 + NH4-) pH – in lab
Biological Oxygen Demand (BOD) Phosphorus, Total
Chemical Oxygen Demand (COD) Sulfate
Chloride Sulfide
Chromium VI (Hexavalent Chromium) Surfactants
Conductance, Specific – in lab Total Dissolved Solids (TDS)
Cyanide (as CN-) Total Kjeldahl Nitrogen (TKN)
Fluoride Total Organic Carbon (TOC)
Hardness Total Phenolics
Nitrate (or Nitrite) only Total Suspended Solids (TSS)
Nitrate + Nitrite Turbidity
Oil and Grease (as HEM)
In the case of specific parameters not listed above, the guidelines within this document will provide the basis upon which to make adequate professional judgment in the evaluation of data submitted for review. Laboratories may not provide all the review elements in this SOP, review only those that are provided.
The recommended procedures in this SOP should be followed unless conditions make it impractical or inappropriate to do so. Modifications should be noted in the applicable documentation and communicated to appropriate personnel. Significant changes may result in a revision or newly created SOP.
2.0 Limitations • Level IV data evaluation is not covered in this SOP and should be performed in accordance with
project specific requirements.
3.0 Responsibilities The laboratory is responsible for generating data from the samples submitted for analysis. In instances where QC criteria are not met for the analysis of samples, the laboratory is responsible for reanalysis of the samples, provided reanalysis is possible (considering matrix interference, holding times and sample volume, etc.), or documenting the impact to the data.

Routine Level General Chemistry Data Evaluation
Page 3 of 10 Revision Date: 01/02/20
Printed Copy is Uncontrolled. Controlled copy is m
aintained on the internal Barr network. Print a new
copy each time a hard copy is required.
The Data Quality Specialist is responsible for evaluating the data in accordance with this document, in addition to using professional judgment where necessary or appropriate. Project specific requirements, such as those specified in a Quality Assurance Project Plan (QAPP) or Sampling and Analysis Plan (SAP), may differ from these recommendations and professional judgment should be applied before qualifying any data.
4.0 Procedure The Quality Assurance/Quality Control (QA/QC) data detailed below are the most typical found in a routine level laboratory report evaluation. Other QA/QC data may be provided by the laboratory within the laboratory report case narrative, data qualifiers, or cover sheet and should be evaluated using professional judgment (e.g., initial calibration, calibration verification, internal standards, post digestion, serial dilution).
Definitions to common QA/QC terms and terms used within this SOP along with a list of Barr ‘Data Qualifiers/Footnotes’ that may be applied during review can be found in Barr’s “Compendium of Data Quality Assessment Documentation”.
4.1 Holding Time and Preservation The purpose of holding time and preservation evaluation is to ascertain the validity of the analytical results based on the sample condition, preservation, and time elapsed between the date of sample collection and date of analysis.
40 CFR Part 136 and the Test Methods for Evaluating Solid Waste (SW-846) are used as guidance for the recommended holding time and preservation acceptance criteria listed in Table 1. Further information may be found in the water and soil sampling guidelines in Barr’s “Compendium of Field Documentation”.
Table 1 - Recommended Holding Times and Preservation
Parameter
Recommended Hold Time Preservation
24 H
our
48 H
our
7 D
ay
14 D
ay
28 D
ay
180
Day
Ice
(≤ 6
°C )
HCl
HN
O3
H2S
O4
NaO
H
ZnAc
+
NaO
H
Alkalinity, as CaCO3 X X
Ammonia as N X X X
Biochemical Oxygen Demand (BOD) X X
Chemical Oxygen Demand (COD) X X X
Chloride X None required
Chromium, Hexavalent X xa X
Conductance, Specific X X
Cyanide X X X
Fluoride X None required
Hardness X Xb Xb
(Table 1 continued on next page)

Routine Level General Chemistry Data Evaluation
Page 4 of 10 Revision Date: 01/02/20
Printed Copy is Uncontrolled. Controlled copy is m
aintained on the internal Barr network. Print a new
copy each time a hard copy is required.
Table 1 - Recommended Holding Times and Preservation
Parameter
Recommended Hold Time Preservation
24 H
our
48 H
our
7 D
ay
14 D
ay
28 D
ay
180
Day
Ice
(≤ 6
°C )
HCl
HN
O3
H2S
O4
NaO
H
ZnAc
+
NaO
H
Nitrate or Nitrite Xc X
Nitrate + Nitrite as N X X X
Oil & Grease, HEM X X Xd Xd
Orthophosphate (field filter w/in 15 min) X X
pH Xe None required
Phenolics, total X X X
Phosphorus, total X X X
Sulfate X X
Sulfide X X X
Surfactants X X
Total Dissolved Solids (TDS) X X
Total Kjeldahl Nitrogen (TKN) X X X
Total Organic Carbon (TOC) X X Xd Xd
Total Suspended Solids (TSS) X X
Turbidity X X
a = Per 40 CFR Part 136.3, a 28-day holding time may be achieved if the ammonium sulfate buffer solution specified in EPA Method 218.6 is used. This footnote supersedes preservation and holding time requirements in approved hexavalent chromium methods, unless this would compromise the measurement and then the method must be followed. b = Either preservative may be used for the titration method; if calculated from Ca and Mg, HNO3. c = Holding time for nitrate is NA when calculated from Nitrate + Nitrite minus Nitrite. d = Either preservative may be used (pH < 2). e = Method recommends pH should be measured in the field, holding time is 15 minutes.; however, for confirmation measurements in the laboratory, a maximum holding time of 7 days from sample collection may be used as a guideline for qualification.
If samples do not meet holding time, preservation and analysis recommendations in Table 1, consider qualification with an ‘H’ (“Recommended sample preservation, extraction or analysis holding time was exceeded.”). Other matrices, such as product samples (e.g. oil, waste rock, drill cores) may not be subject to the same holding time recommendations.
If the sample was stored on ice upon collection and delivered to the laboratory the same day, the sample may exceed recommended temperature at the time of laboratory receipt. Professional judgment should be applied (considering temperature, matrix, magnitude of the exceedance, etc.) when evaluating the application of qualifiers when criteria are not met.

Routine Level General Chemistry Data Evaluation
Page 5 of 10 Revision Date: 01/02/20
Printed Copy is Uncontrolled. Controlled copy is m
aintained on the internal Barr network. Print a new
copy each time a hard copy is required.
4.2 Blank Samples Blank sample evaluation is conducted to determine the existence and magnitude of target analyte contamination as a result of activities in the field during collection and transport or from inter-laboratory sources.
• While not required for all methods, method blanks are recommended for all but the pH analysis. Evaluation pertains to the batch of samples analyzed with the method blank.
• Field or equipment blank collection and analysis frequency is project specific. Evaluation pertains to the field samples associated with the field or equipment blank.
• Blank analyses may not have involved the same weights, volumes, or dilution factors as the associated samples. Data reviewers may have to obtain raw data and/or convert the data to the same units for comparison purposes.
Table 2 – Guidelines for Blank Contamination
Sample Result Recommended Action for Associated Data
Non-detect No action required
< 5x blank concentration Qualify with ‘UB’
≥ 5x blank concentration Use professional judgment UB = The analyte is detected in one of the associated laboratory, equipment, field or trip blank samples and is
considered non-detect at the concentration reported by the laboratory.
Note: Other multipliers of the blank contamination may be used based on professional judgment (reporting to the MDL, common lab contaminant, etc.)
Professional judgment regarding the usability of the data should be used in cases where gross detections of target analytes are found in the blank sample. A number of factors may be considered including historical data, prior knowledge of the site conditions, target analytes involved, type of blank sample, etc. In such cases, it may be appropriate to qualify the affected data with ‘J’ (“Estimated detected value. Either certain QC criteria were not met or the concentration is between the laboratory’s detection and quantitation limits.”) or ‘R’ (“The data are unusable. The sample results are rejected due to serious deficiencies in meeting QC criteria. The analyte may or may not be present in the sample.”).
4.3 Laboratory Control Samples (LCS) and Laboratory Control Sample Duplicate Samples (LCSD)
The laboratory control sample is used to monitor the overall performance of each step during analysis, including sample preparation. The LCS should be analyzed:
• Once every preparation batch (typically 20 or less samples of the same matrix). • Once for each matrix.
Laboratory control samples contain a known amount of each target compound and the percent recoveries are evaluated based on the criteria within the laboratory report or project specific requirements. Percent recoveries are calculated for accuracy and the relative percent difference (RPD) is calculated for precision (when an LCSD was analyzed). Accuracy and precision equations can be found in ‘Definitions’ from Barr’s “Compendium of Data Quality Assessment Documentation”.
Routine Level General Chemistry Data Evaluation
Page 6 of 10 Revision Date: 01/02/20
Printed Copy is Uncontrolled. Controlled copy is m
aintained on the internal Barr network. Print a new
copy each time a hard copy is required.
Table 3 – Guidelines for Laboratory Control Samples
Criteria Recommended Action for Associated Data
Detect Non-Detect
%R > Upper Limit Qualify with ‘J+’ or use professional judgment No qualification
%R < Lower Limit Qualify with ‘J-’ or ‘R’, use professional judgment
RPD > Upper Limit Qualify with ‘J’ or use professional judgment
%R and RPD within Limits No qualification J+ = The result is an estimated quantity and may be biased high. J- = The result is an estimated quantity and may be biased low. J = Estimated detected value. Either certain QC criteria were not met or the concentration is between the laboratory’s detection and quantitation limits. R = The data are unusable. The sample results are rejected due to serious deficiencies in meeting QC criteria.
The analyte may or may not be present in the sample.
4.4 Laboratory Duplicate Samples Laboratory duplicate samples are separate aliquots of field samples analyzed to demonstrate acceptable method precision by the laboratory at the time of analysis. Ideally, blanks and proficiency testing (PT) samples should not be used for duplicate analysis. The MS/MSD duplicate pairs may be substituted for laboratory duplicates. The RPDs are calculated using the equation as provided in ‘Definitions’ from Barr’s “Compendium of Data Quality Assessment Documentation” and are not calculated where data are already qualified with U, UB, <, or R. RPD results are dependent on the homogeneity of the samples.
Duplicates should be analyzed (whichever is more frequent):
• One from each matrix (soil or water)
• One from each SDG
Laboratory acceptance criteria or project specific requirement are used to evaluate RPDs. If criteria are not available, use professional judgment when considering qualification of associated results.
Higher RPDs are expected when results are at or near the reporting limits and are not always indicative of poor precision. RPDs are typically only evaluated for samples where both the native and duplicate sample concentrations are greater than five times (>5x) the RL. In cases where either of the samples (native or duplicate) is non-detect for a parameter and the other corresponding sample has detectable concentrations much greater than five times (>5x) the RL, professional judgment should be used to determine if qualification is appropriate.

Routine Level General Chemistry Data Evaluation
Page 7 of 10 Revision Date: 01/02/20
Printed Copy is Uncontrolled. Controlled copy is m
aintained on the internal Barr network. Print a new
copy each time a hard copy is required.
Table 4 – Guidelines for Laboratory Duplicates
% RPD Recommended Action for Associated Data
RPD < Upper Limit No action is required
RPD > Upper Limit Both results are ≤ 5x RL, no action is required
RPD > Upper Limit
Both results are > 5x RL, consider qualifying with ‘J’ J = Estimated detected value. Either certain QC criteria were not met or the concentration is between the laboratory’s detection and quantitation limits.
4.5 Field Duplicate Samples Field duplicate samples (also known as “masked” or “blind” duplicate samples) are used to demonstrate acceptable precision and reproducibility of the field and laboratory procedures. Frequency of collection is project specific. The RPDs are calculated using the equation as provided under precision in ‘Definitions’ from Barr’s “Compendium of Data Quality Assessment Documentation” and are not calculated where data is already qualified with U, UB, <, or R. RPD results are dependent on the homogeneity of the samples.
Acceptance criteria for field duplicate samples are subject to the professional judgment of the Data Quality Specialist but typically RPDs ≤ 30% for aqueous samples and ≤ 40% for soil and sediment samples are considered acceptable unless other project specific requirements are defined.
Higher RPDs are expected when results are at or near the reporting limits and are not always indicative of poor precision. RPDs are typically only evaluated for samples where both the native and duplicate sample concentrations are greater than five times (>5x) the RL. In cases where either of the samples (native or field duplicate) is non-detect for a parameter and the other corresponding sample has detectable concentrations much greater than five times (>5x) the RL, professional judgment should be used to determine if qualification is appropriate.
Table 5 – Guidelines for Field Duplicates
% RPD Recommended Action for Associated Data
RPD < Upper Limit No action is required
RPD > Upper Limit Both results are ≤ 5x RL, no action is required
RPD > Upper Limit
Both results are > 5x RL, consider qualifying with ‘J’ J = Estimated detected value. Either certain QC criteria were not met or the concentration is between the laboratory’s detection and quantitation limits.
4.6 Matrix Spikes (MS) and Matrix Spike Duplicate (MSD) Samples Matrix spike samples contain a known amount of a target compound and provide information about the effect of each samples’ matrix on the sample preparation procedures and analytical results. Matrix spikes are typically analyzed at the following frequencies:
• 1 (MS/MSD pair) in every 20 samples • 1 per preparation batch per matrix • 1 per SDG

Routine Level General Chemistry Data Evaluation
Page 8 of 10 Revision Date: 01/02/20
Printed Copy is Uncontrolled. Controlled copy is m
aintained on the internal Barr network. Print a new
copy each time a hard copy is required.
However, the frequency may be project specific and the documents outlining the needs of the project (SAP, QAPP, etc.) should be reviewed. In some cases, MS/MSD analysis is not required.
The percent recoveries are evaluated based on the criteria within the laboratory report or project specific requirements. If a matrix spike recovery does not meet acceptance criteria and is not associated with a project sample, no further action is required unless other systematic evidence warrants qualification.
If the native concentration of a spiked sample is significantly greater than the spike added (>4x), spike recovery cannot be accurately evaluated, therefore the criteria do not apply. Professional judgment should be used for percent recoveries nominally outside laboratory acceptance criteria prior to qualifying data.
If criteria are not available, use guidance found in the NFG. Percent recoveries of matrix spike (and matrix spike duplicate) samples should be calculated using the equation provided under accuracy in ‘Definitions’ from Barr’s “Compendium of Data Quality Assessment Documentation”.
Solid samples may have highly variable concentrations of target analytes and percent recoveries (%R) may be influenced by the sampling precision and inherent sample homogeneity. Professional judgment should be used for difficult matrices and the acceptance criteria adjusted accordingly.
Table 6 – Guidelines for Matrix Spikes
Criteria Recommended Action for Associated Data
Detect Non-Detect
%R > Upper Limit Qualify with ‘J+’ or use professional judgment No qualification
%R < Lower Limit Qualify with ‘J-’ or ‘R’, use professional judgment
RPD > Upper Limit Qualify with ‘J’ or use professional judgment
%R and RPD within Limits No qualification J+ = The result is an estimated quantity and may be biased high. J- = The result is an estimated quantity and may be biased low. J = Estimated detected value. Either certain QC criteria were not met or the concentration is between the laboratory’s detection and quantitation limits. R = The data are unusable. The sample results are rejected due to serious deficiencies in meeting QC criteria.
The analyte may or may not be present in the sample.
While matrix spike duplicates are not required by all methods, if results for MSD analyses are reported, evaluate the RPD for MS and MSD pairs using the equation as provided under precision in ‘Definitions’ from Barr’s “Compendium of Data Quality Assessment Documentation”.
4.7 Overall Assessment The chain-of-custody should be reviewed to determine if the laboratory report matches the requested analyses and that project specific parameters were analyzed as requested. The narrative and other supporting documentation should be evaluated to ensure that sample condition was appropriately documented by the laboratory upon receipt. If available, historical data should be used to assist with data evaluation. Any additional anomalies should be documented and evaluated, if necessary.
Routine Level General Chemistry Data Evaluation
Page 9 of 10 Revision Date: 01/02/20
Printed Copy is Uncontrolled. Controlled copy is m
aintained on the internal Barr network. Print a new
copy each time a hard copy is required.
5.0 Quality Control and Quality Assurance (QA/QC) Depending on the project objectives, the data evaluation may include the completion of a Routine Level Quality Control Report. This may be a report produced via EQuIS DQM (Environmental Quality Information System Data Quality Module) or a hardcopy as found in Barr’s “Compendium of Data Quality Assessment Documentation”. Within each QC data section, the reviewer should include references to whether the QC data met or exceeded the acceptance criteria. The qualifiers, added, removed, or retained, should be documented. If using EQuIS DQM, reason codes will also be applied. The reason codes are defined in the software. Where multiple qualifiers may be applicable to a sample/analyte result, professional judgment should be used to determine if all qualifiers are necessary or if one qualifier would be sufficient to represent the deviations. A statement as to whether the data are acceptable as reported or acceptable with qualification(s) should also be included. If revised reports are required and the revision affects the sample results, notification should be given to the appropriate data management personnel and/or project team members.
6.0 Records The Routine Level Quality Control Report should be saved to the appropriate internal Barr file and the link uploaded to the tracking system. Periodically, Data Quality staff should check for missing Routine Level Quality Control Reports in the tracking system to help maintain the most current information. Documentation of the data evaluation may include but is not limited to an email to the project team, data evaluation summary report, technical memo, or section within a project report.
Documentation specific to this SOP are listed below and are available in Barr’s “Compendium of Data Quality Assessment Documentation”.
• Definitions • Barr Qualifiers/Footnotes • Routine Level Quality Control Report
Additional records information can be found in Barr’s “Records Management System Manual”.
7.0 References Environmental Protection Agency. Title 40 of the Code of Federal Regulations, Part 136.3.
Environmental Protection Agency, National Functional Guidelines for Inorganic Superfund Data Review.
Analytical methods listed under the ‘Scope and Applicability’ section of this SOP.

Routine Level General Chemistry Data Evaluation
Page 10 of 10 Revision Date: 01/02/20
Printed Copy is Uncontrolled. Controlled copy is m
aintained on the internal Barr network. Print a new
copy each time a hard copy is required.
Attachment 1 Revision History
Revision Number
Date of Revision Section Revision Made
5.0 06/17/13
Cover page Added Calgary office
Applicability Added US to EPA reference
I Added waste rock and drill cores to examples of product sample
III Added LCSD information
III, IV, V, VI Added ‘project specific requirements’ as possible criteria source
V Added ‘field and laboratory procedures’ to clarify that it’s not only a laboratory item
V Clarified field duplicate criteria as < one value and not a range
VIII Added statement regarding multiple qualifiers
6 01/07/16 Document Wide SOP restructuring, new format
7 04/24/18 1.0
Added laboratories may not provide all the review elements in this SOP, review only those that are provided.
4.2, third bullet Clarified that data reviewers would have to obtain raw data since not provided with Level II report.
8 01/02/20 Document wide Updated for new qualifiers

Standard Operating Procedure YSI ProDSS (Digital Sampling System) Multi-parameter Water Quality Meter
Revision 0
March 17, 2020
Approved By:
Charity Gachne 03/17/20 Print Technical Reviewer Signature Date
Andrea Nord 03/17/20 Print QA Manager Signature Date
Review of the SOP has been performed and the SOP still reflects current practice.
Initials: Date:
Initials: Date:
Initials: Date:
Initials: Date:
YSI ProDSS Water Quality System Page 2 of 11 Revision Date: 03/17/20
Printed Copy is Uncontrolled. Controlled copy is m
aintained on the internal Barr network. Print a new
copy each time a hard copy is required.
YSI ProDSS (Digital Sampling System) Multi-parameter Water Quality Meter
1.0 Scope and Applicability The purpose of this Standard Operating Procedure (SOP) is to clearly define the procedures required to accurately measure dissolved oxygen (DO), conductivity, temperature, pH, oxidation reduction potential (ORP), and turbidity in groundwater and surface water using the YSI ProDSS (digital sampling system) multi-parameter water quality meter.
The YSI ProDSS water quality meter is an easy-to-use hand-held unit. It includes a waterproof, impact-resistant case and it simultaneously measures dissolved oxygen, conductivity, temperature, pH, ORP, and turbidity.
Analysis Conductivity Oxidation Reduction Potential
pH Dissolved Oxygen
Temperature Turbidity
Analytical Method
Standard Method 2510B
Standard Method 2580A
Standard Method 4500-H+ B
ASTM Method D888-09 (C)
Standard Method 2550B
Standard Method 2130B
The recommended procedures in this SOP should be followed unless conditions make it impractical or inappropriate to do so. Modifications should be noted in the applicable documentation and communicated to appropriate personnel. Significant changes may result in a revision or newly created SOP.
2.0 Limitations • The ProDSS calibration cup and sensor guard must be used (and correctly installed!) when
calibrating dissolved oxygen and/or turbidity. The sensor guard must be installed when taking any measurements.
• The sensor guard has a metal bottom that is painted black. Ensure the inside surface (i.e. the surface that faces the sensor tip) is not significantly scratched. This surface needs to be black to eliminate any stray light reflection. Also ensure the sensor guard and calibration cup are free of any reflective material.
• Procedures can vary by project as noted within the project scope of work and/or documentation (e.g., Work Plan, Sampling Analysis Plan (SAP), or Quality Assurance Project Plan (QAPP)).
• Decontamination of reusable equipment is required to prevent cross-contamination.
3.0 Responsibilities The Project Manager, in conjunction with the client, develops the site specific scope of work (e.g., Work Plan, SAP, etc.).
Experienced Field Technicians are responsible for the proper field equipment calibration, measurement, quality control procedures, and documentation of dissolved oxygen, conductivity, temperature, pH, ORP, and turbidity.
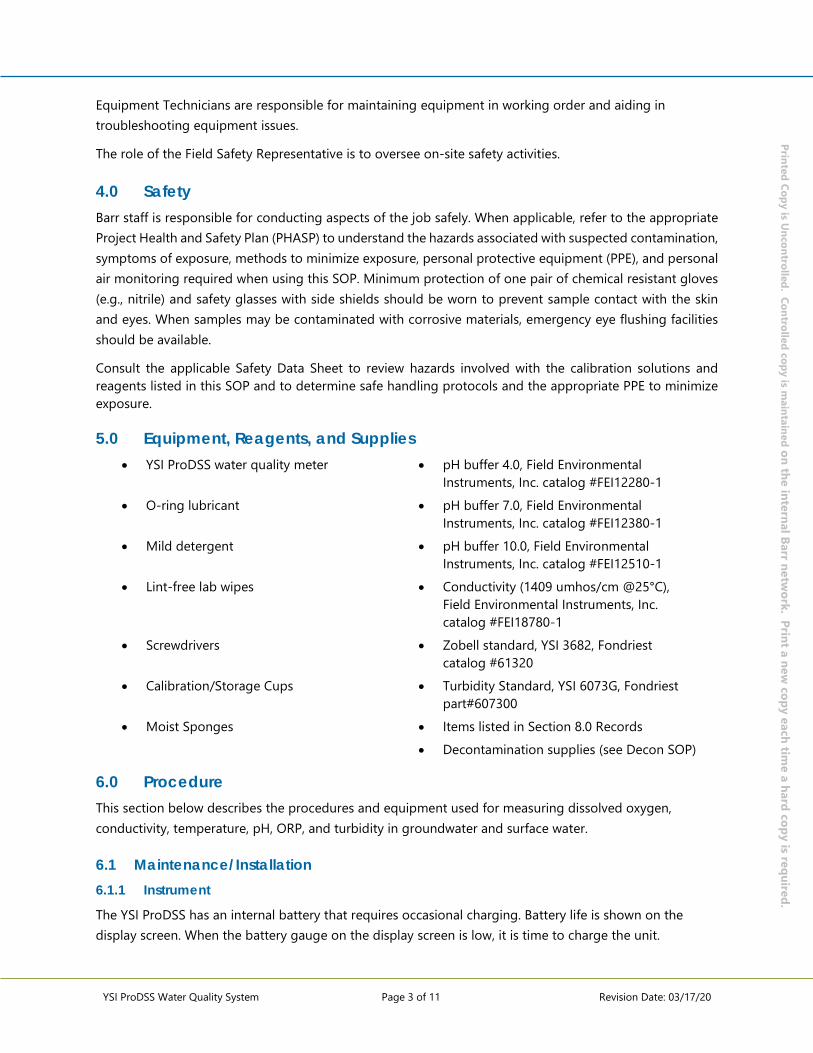
YSI ProDSS Water Quality System Page 3 of 11 Revision Date: 03/17/20
Printed Copy is Uncontrolled. Controlled copy is m
aintained on the internal Barr network. Print a new
copy each time a hard copy is required.
Equipment Technicians are responsible for maintaining equipment in working order and aiding in troubleshooting equipment issues.
The role of the Field Safety Representative is to oversee on-site safety activities.
4.0 Safety Barr staff is responsible for conducting aspects of the job safely. When applicable, refer to the appropriate Project Health and Safety Plan (PHASP) to understand the hazards associated with suspected contamination, symptoms of exposure, methods to minimize exposure, personal protective equipment (PPE), and personal air monitoring required when using this SOP. Minimum protection of one pair of chemical resistant gloves (e.g., nitrile) and safety glasses with side shields should be worn to prevent sample contact with the skin and eyes. When samples may be contaminated with corrosive materials, emergency eye flushing facilities should be available.
Consult the applicable Safety Data Sheet to review hazards involved with the calibration solutions and reagents listed in this SOP and to determine safe handling protocols and the appropriate PPE to minimize exposure.
5.0 Equipment, Reagents, and Supplies • YSI ProDSS water quality meter • pH buffer 4.0, Field Environmental
Instruments, Inc. catalog #FEI12280-1 • O-ring lubricant • pH buffer 7.0, Field Environmental
Instruments, Inc. catalog #FEI12380-1 • Mild detergent • pH buffer 10.0, Field Environmental
Instruments, Inc. catalog #FEI12510-1 • Lint-free lab wipes • Conductivity (1409 umhos/cm @25°C),
Field Environmental Instruments, Inc. catalog #FEI18780-1
• Screwdrivers • Zobell standard, YSI 3682, Fondriest catalog #61320
• Calibration/Storage Cups • Turbidity Standard, YSI 6073G, Fondriest part#607300
• Moist Sponges • Items listed in Section 8.0 Records • Decontamination supplies (see Decon SOP)
6.0 Procedure This section below describes the procedures and equipment used for measuring dissolved oxygen, conductivity, temperature, pH, ORP, and turbidity in groundwater and surface water.
6.1 Maintenance/Installation 6.1.1 Instrument
The YSI ProDSS has an internal battery that requires occasional charging. Battery life is shown on the display screen. When the battery gauge on the display screen is low, it is time to charge the unit.
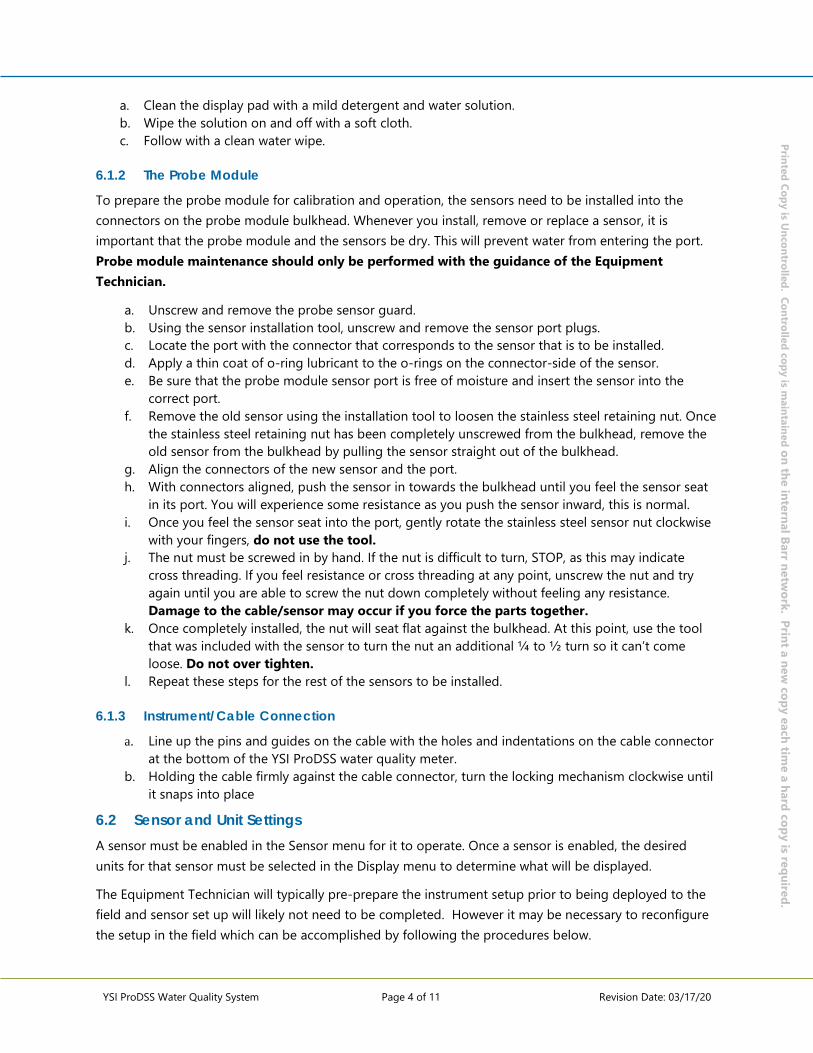
YSI ProDSS Water Quality System Page 4 of 11 Revision Date: 03/17/20
Printed Copy is Uncontrolled. Controlled copy is m
aintained on the internal Barr network. Print a new
copy each time a hard copy is required.
a. Clean the display pad with a mild detergent and water solution. b. Wipe the solution on and off with a soft cloth. c. Follow with a clean water wipe.
6.1.2 The Probe Module
To prepare the probe module for calibration and operation, the sensors need to be installed into the connectors on the probe module bulkhead. Whenever you install, remove or replace a sensor, it is important that the probe module and the sensors be dry. This will prevent water from entering the port. Probe module maintenance should only be performed with the guidance of the Equipment Technician.
a. Unscrew and remove the probe sensor guard. b. Using the sensor installation tool, unscrew and remove the sensor port plugs. c. Locate the port with the connector that corresponds to the sensor that is to be installed. d. Apply a thin coat of o-ring lubricant to the o-rings on the connector-side of the sensor. e. Be sure that the probe module sensor port is free of moisture and insert the sensor into the
correct port. f. Remove the old sensor using the installation tool to loosen the stainless steel retaining nut. Once
the stainless steel retaining nut has been completely unscrewed from the bulkhead, remove the old sensor from the bulkhead by pulling the sensor straight out of the bulkhead.
g. Align the connectors of the new sensor and the port. h. With connectors aligned, push the sensor in towards the bulkhead until you feel the sensor seat
in its port. You will experience some resistance as you push the sensor inward, this is normal. i. Once you feel the sensor seat into the port, gently rotate the stainless steel sensor nut clockwise
with your fingers, do not use the tool. j. The nut must be screwed in by hand. If the nut is difficult to turn, STOP, as this may indicate
cross threading. If you feel resistance or cross threading at any point, unscrew the nut and try again until you are able to screw the nut down completely without feeling any resistance. Damage to the cable/sensor may occur if you force the parts together.
k. Once completely installed, the nut will seat flat against the bulkhead. At this point, use the tool that was included with the sensor to turn the nut an additional ¼ to ½ turn so it can’t come loose. Do not over tighten.
l. Repeat these steps for the rest of the sensors to be installed.
6.1.3 Instrument/Cable Connection
a. Line up the pins and guides on the cable with the holes and indentations on the cable connector at the bottom of the YSI ProDSS water quality meter.
b. Holding the cable firmly against the cable connector, turn the locking mechanism clockwise until it snaps into place
6.2 Sensor and Unit Settings A sensor must be enabled in the Sensor menu for it to operate. Once a sensor is enabled, the desired units for that sensor must be selected in the Display menu to determine what will be displayed.
The Equipment Technician will typically pre-prepare the instrument setup prior to being deployed to the field and sensor set up will likely not need to be completed. However it may be necessary to reconfigure the setup in the field which can be accomplished by following the procedures below.
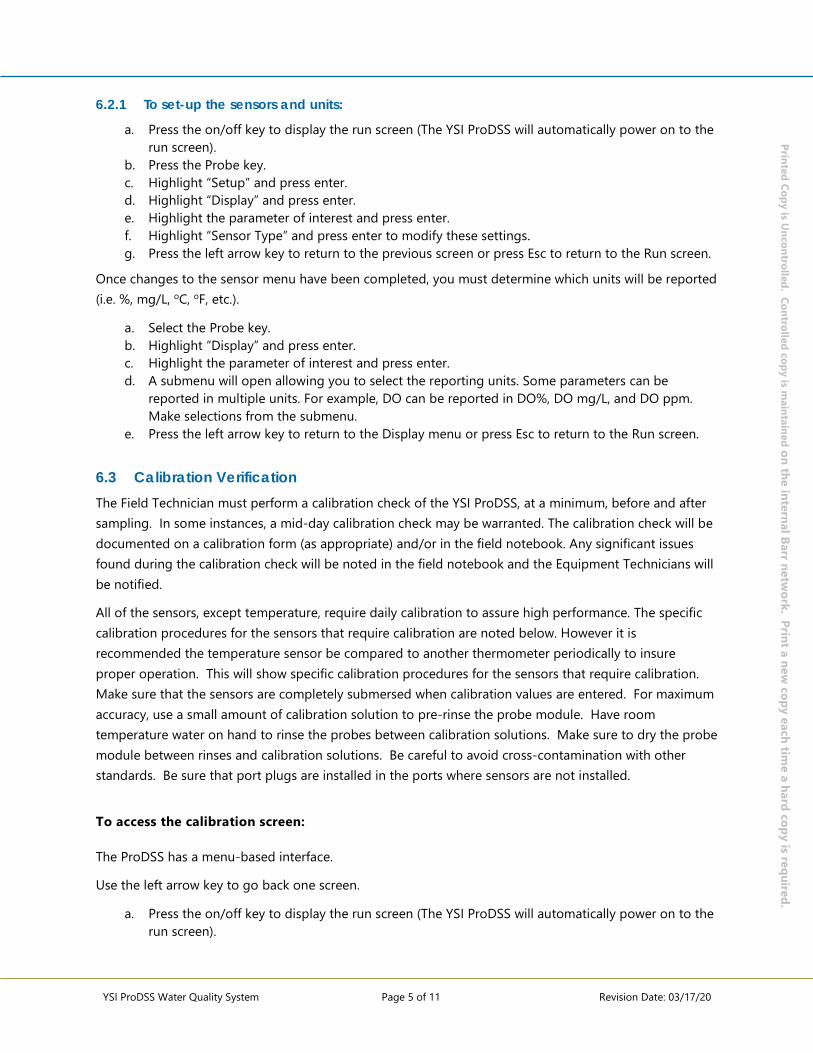
YSI ProDSS Water Quality System Page 5 of 11 Revision Date: 03/17/20
Printed Copy is Uncontrolled. Controlled copy is m
aintained on the internal Barr network. Print a new
copy each time a hard copy is required.
6.2.1 To set-up the sensors and units:
a. Press the on/off key to display the run screen (The YSI ProDSS will automatically power on to the run screen).
b. Press the Probe key. c. Highlight “Setup” and press enter. d. Highlight “Display” and press enter. e. Highlight the parameter of interest and press enter. f. Highlight “Sensor Type” and press enter to modify these settings. g. Press the left arrow key to return to the previous screen or press Esc to return to the Run screen.
Once changes to the sensor menu have been completed, you must determine which units will be reported (i.e. %, mg/L, oC, oF, etc.).
a. Select the Probe key. b. Highlight “Display” and press enter. c. Highlight the parameter of interest and press enter. d. A submenu will open allowing you to select the reporting units. Some parameters can be
reported in multiple units. For example, DO can be reported in DO%, DO mg/L, and DO ppm. Make selections from the submenu.
e. Press the left arrow key to return to the Display menu or press Esc to return to the Run screen.
6.3 Calibration Verification The Field Technician must perform a calibration check of the YSI ProDSS, at a minimum, before and after sampling. In some instances, a mid-day calibration check may be warranted. The calibration check will be documented on a calibration form (as appropriate) and/or in the field notebook. Any significant issues found during the calibration check will be noted in the field notebook and the Equipment Technicians will be notified.
All of the sensors, except temperature, require daily calibration to assure high performance. The specific calibration procedures for the sensors that require calibration are noted below. However it is recommended the temperature sensor be compared to another thermometer periodically to insure proper operation. This will show specific calibration procedures for the sensors that require calibration. Make sure that the sensors are completely submersed when calibration values are entered. For maximum accuracy, use a small amount of calibration solution to pre-rinse the probe module. Have room temperature water on hand to rinse the probes between calibration solutions. Make sure to dry the probe module between rinses and calibration solutions. Be careful to avoid cross-contamination with other standards. Be sure that port plugs are installed in the ports where sensors are not installed.
To access the calibration screen: The ProDSS has a menu-based interface.
Use the left arrow key to go back one screen.
a. Press the on/off key to display the run screen (The YSI ProDSS will automatically power on to the run screen).
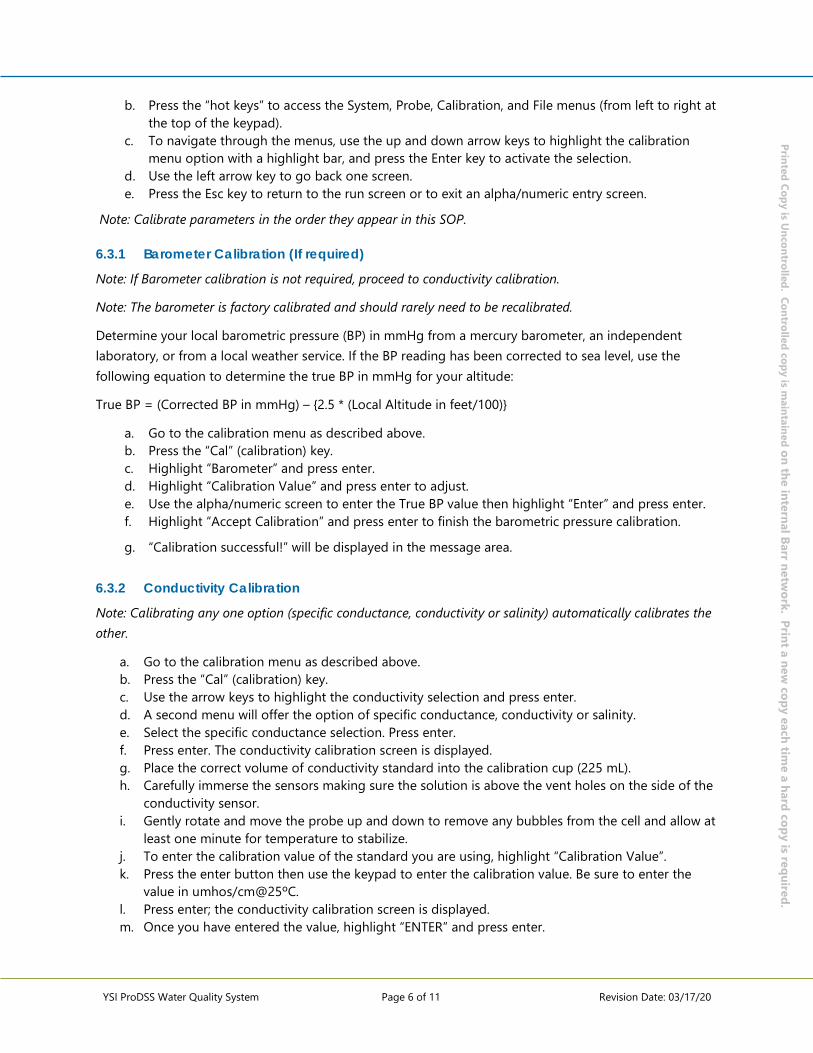
YSI ProDSS Water Quality System Page 6 of 11 Revision Date: 03/17/20
Printed Copy is Uncontrolled. Controlled copy is m
aintained on the internal Barr network. Print a new
copy each time a hard copy is required.
b. Press the “hot keys” to access the System, Probe, Calibration, and File menus (from left to right at the top of the keypad).
c. To navigate through the menus, use the up and down arrow keys to highlight the calibration menu option with a highlight bar, and press the Enter key to activate the selection.
d. Use the left arrow key to go back one screen. e. Press the Esc key to return to the run screen or to exit an alpha/numeric entry screen.
Note: Calibrate parameters in the order they appear in this SOP.
6.3.1 Barometer Calibration (If required)
Note: If Barometer calibration is not required, proceed to conductivity calibration.
Note: The barometer is factory calibrated and should rarely need to be recalibrated.
Determine your local barometric pressure (BP) in mmHg from a mercury barometer, an independent laboratory, or from a local weather service. If the BP reading has been corrected to sea level, use the following equation to determine the true BP in mmHg for your altitude:
True BP = (Corrected BP in mmHg) – {2.5 * (Local Altitude in feet/100)}
a. Go to the calibration menu as described above. b. Press the “Cal” (calibration) key. c. Highlight “Barometer” and press enter. d. Highlight “Calibration Value” and press enter to adjust. e. Use the alpha/numeric screen to enter the True BP value then highlight “Enter” and press enter. f. Highlight “Accept Calibration” and press enter to finish the barometric pressure calibration.
g. “Calibration successful!” will be displayed in the message area.
6.3.2 Conductivity Calibration
Note: Calibrating any one option (specific conductance, conductivity or salinity) automatically calibrates the other.
a. Go to the calibration menu as described above. b. Press the “Cal” (calibration) key. c. Use the arrow keys to highlight the conductivity selection and press enter. d. A second menu will offer the option of specific conductance, conductivity or salinity. e. Select the specific conductance selection. Press enter. f. Press enter. The conductivity calibration screen is displayed. g. Place the correct volume of conductivity standard into the calibration cup (225 mL). h. Carefully immerse the sensors making sure the solution is above the vent holes on the side of the
conductivity sensor. i. Gently rotate and move the probe up and down to remove any bubbles from the cell and allow at
least one minute for temperature to stabilize. j. To enter the calibration value of the standard you are using, highlight “Calibration Value”. k. Press the enter button then use the keypad to enter the calibration value. Be sure to enter the
value in umhos/cm@25ºC. l. Press enter; the conductivity calibration screen is displayed. m. Once you have entered the value, highlight “ENTER” and press enter.
YSI ProDSS Water Quality System Page 7 of 11 Revision Date: 03/17/20
Printed Copy is Uncontrolled. Controlled copy is m
aintained on the internal Barr network. Print a new
copy each time a hard copy is required.
n. Observe the reading under specific conductance. When the reading shows no significant change for 40 seconds, highlight “Accept Calibration” and press enter to calibrate.
o. “Calibration successful!” will be displayed in the message area. p. Rinse the probe module in clean water and dry.
6.3.3 pH Calibration
Note: Typical working life for pH sensors is approximately 12-24 months depending on usage, storage and maintenance. Proper storage and maintenance generally extends the sensor’s working life.
Note: If performing a 2 or 3 point calibration, one point should be in buffer 7. Calibration points can be in any order.
a. Fill the calibration cup with pH 7 buffer solution (170mL). b. Carefully immerse the probe end of the sensors into the buffer solution. c. Press the “Cal” (calibration) key. d. Use the arrow keys to highlight the pH/ORP selection press enter. e. Select pH and press enter. f. Allow at least one minute for temperature stabilization, then select Calibration value. g. Enter the pH buffer value and press enter. h. Observe the reading under pH. Once the pH is stable with no significant change for 40 seconds,
highlight “Accept Calibration” and press enter. i. “Ready for cal point 2” will be displayed in the message area. j. Rinse the sensor 2-3 times with a small amount of the pH buffer solution. k. Rinse, then fill the calibration cup with the same buffer solution (170mL) used to rinse the sensor. l. Carefully immerse the sensors in the buffer solution. m. Allow at least one minute for temperature stabilization. n. Select Calibration value and enter the pH buffer value and press enter. o. Observe the reading under pH. Once the pH is stable with no significant change for 40 seconds,
highlight “Accept Calibration” and press enter. p. Highlight “Finish Calibration” for a 2-point calibration or repeat the procedure for the third buffer
solution.
6.3.4 ORP Calibration
Note: Typical working life for ORP sensors is approximately 12-24 months depending on usage, storage and maintenance. Proper storage and maintenance generally extends the sensor’s working life.
a. Press the “Cal” (calibration) key. b. Use the arrow keys to highlight the pH/ORP selection. c. Select ORP and press enter. d. Place the correct volume of a known ORP solution (Zobell) standard into the calibration cup. e. Carefully immerse the sensor and allow the temperature of the standard to stabilize.. f. Highlight “Calibration Value” and enter the ORP calibration value that corresponds to the
measured temperature. g. Refer to the Zobell solution value chart.
YSI ProDSS Water Quality System Page 8 of 11 Revision Date: 03/17/20
Printed Copy is Uncontrolled. Controlled copy is m
aintained on the internal Barr network. Print a new
copy each time a hard copy is required.
Temperature ( ˚C) Zobell Solution Value (mV)
7 254.4 8 253.1 9 251.8 10 250.5 11 249.2 12 247.9 13 246.6 14 245.3 15 244.0 16 242.7 17 241.4 18 240.1 19 238.8 20 237.5 21 236.2 22 234.9 23 233.6 24 232.3 25 231.0 26 229.7 27 228.4 28 227.1 29 225.8 30 224.5
a. Once you have entered the value, highlight “ENTER” and press enter; the ORP calibration screen
will be displayed. b. Observe the reading under ORP. When the reading shows no significant change for 40 seconds,
highlight “Accept Calibration” and press enter to calibrate. c. “Calibration successful!” will be displayed in the message area. d. Rinse the probe module and dry.
6.3.5 Dissolved Oxygen Calibration
Note: The instrument must be on for at least 10 minutes to allow the DO sensor to stabilize before calibrating. Calibrating any one option (%, mg/L, or ppm) automatically calibrates the other. It is recommended to calibrate DO% or DO% Local and not mg/L
a. Using the sensor guard, place a small amount of water (1/8 inch) in the calibration/storage cup and screw it on the probe. Only engage one or two threads to ensure the DO sensor is vented to the atmosphere. Make sure that the DO and temperature sensors are not immersed in the water and there are no water droplets on the ODO sensor cap or temperature sensor.
b. Go to the calibration menu as described above. c. Press the “Cal” (calibration) key. d. Use the arrow keys to highlight the ODO selection. e. Select DO% press enter. f. Verify the barometric pressure displayed is accurate. g. Once DO% and temperature are stable with no significant change for 40 seconds, highlight
“Accept Calibration” and press enter.
YSI ProDSS Water Quality System Page 9 of 11 Revision Date: 03/17/20
Printed Copy is Uncontrolled. Controlled copy is m
aintained on the internal Barr network. Print a new
copy each time a hard copy is required.
h. “Calibration successful!” will be displayed in the message area.
Note: A moist sponge should be kept with the probe sensor guard to prevent the dissolved oxygen membrane from drying out.
6.3.6 Turbidity Calibration
NOTE: The sensor guard must be installed for the turbidity sensor calibration.
NOTE: When performing a turbidity calibration, the first point must be zero.
a. Rinse the sensor 2-3 times with a small amount of DI water. Ultra-filtered DI water is included with the turbidity standards.
b. Fill the calibration cup with DI water and immerse the sensors into the water. c. Press the “Cal” (calibration) key. d. Select Calibration Value and enter 0.00. Press enter e. Observe the readings for stability and after no significant change after 40 seconds, highlight
Accept Calibration and press enter. f. “Ready for cal point 2” will be displayed in the message area. g. Rinse the sensors, calibration cup, and sensor guard 2-3 times with a small amount of the second
standard (124 FNU). Discard the standard after each rinse. h. Fill the calibration cup with the second standard (124 FNU). i. Select Calibration Value and enter the value of the second standard. j. Observe the readings for stability for no significant change after 40 seconds. k. Select “Finish Calibration” to complete the 2-point calibration. l. Rinse the sensors in clean water and dry.
The meter is now calibrated and ready for use.
If any calibrations fail, contact the Equipment Technician or manufacturer immediately or obtain a replacement instrument.
6.4 Sampling a. Install the sensor guard. b. Carefully immerse the sensors in the sample making sure the sensors are complete submerged. c. Gently move the module up and down and rotate to release any air bubbles. d. Wait for the sensors to stabilize.
6.4.1 Interferences
Rinse the probe sensors between instrument readings with water and dab dry to ensure accurate results.
6.5 Data Processing a. Open the KorDSS software. b. Use the micro USB cable to connect the handheld to the PC. c. Power on the handheld; there may be a short delay before it shows up in the software. d. Select the handheld under the Instrument Connection Panel and press “Connect”. e. Press “Start Download” from Device.
YSI ProDSS Water Quality System Page 10 of 11 Revision Date: 03/17/20
Printed Copy is Uncontrolled. Controlled copy is m
aintained on the internal Barr network. Print a new
copy each time a hard copy is required.
f. After data download, press “View Logged Data” to view, print, and export data files from the KorDSS software program.
6.6 Data Calculations 6.6.1 Field Replicate
Field replicate results are evaluated by calculating the Relative Percent Difference (RPD) value. The RPD formula is as follows:
𝑅𝑅𝑅𝑅𝑅𝑅 = |𝑆𝑆 − 𝑅𝑅|
(𝑆𝑆 + 𝑅𝑅)/2 𝑥𝑥 100
Where: RPD = relative percent difference S = first replicate result D = second replicate result
6.6.2 Calibration Check
The percent difference is calculated using the following equation:
%𝑅𝑅 = |𝑇𝑇𝑇𝑇 −𝑀𝑀𝑅𝑅|
𝑇𝑇𝑇𝑇 𝑥𝑥 100
Where: %D = % difference TV = calibration check true value MR = measured result
6.7 Disposal Waste generated by this process will be disposed of in accordance with Federal, State and Local regulations and Barr’s SOP ‘Investigative Derived Waste’. Where reasonably feasible, technological changes have been implemented to minimize the potential for environmental pollution.
7.0 Quality Control and Quality Assurance (QA/QC) QA/QC objectives (e.g., water quality parameters) are specific to each project and/or well. Discuss QA/QC procedures with the project team prior to well development.
7.1 QA/QC Samples QA/QC samples are defined in Barr’s SOP ‘Collection of Quality Control Samples’. The sampling frequency should be performed as written in the project scope of work and/or documentation (e.g., Work Plan, SAP, or Quality Assurance Project Plan). The following QA/QC samples are not include in the SOP reference above but should be analyzed:
• Field replicate samples Field replicate sample measurements should be taken at a minimum of one of twenty project samples per type of measurement.
YSI ProDSS Water Quality System Page 11 of 11 Revision Date: 03/17/20
Printed Copy is Uncontrolled. Controlled copy is m
aintained on the internal Barr network. Print a new
copy each time a hard copy is required.
7.2 Measurement Criteria If calibration check values fall outside of the calibration check accuracy acceptance limits in the following table, the YSI ProDSS should be recalibrated as described in the Calibration section of this SOP.
Sensor Calibration Solution Value Calibration Check Acceptance Limits
Dissolved Oxygen (%) Assumed 100% air saturation based on barometric pressure and/or stabilized reading at time of calibration
± 5% of saturation
Dissolved Oxygen (mg/L) Solution of known value (0-50 mg/L)
± 0.5 mg/L of saturated value
Conductivity (µmhos/cm) 1409 ± 3% of standard or 20 µmhos/cm, whichever is greater
pH (Standard Units) 4.00 (if used) ± 0.3 Standard Units
pH (Standard Units) 7.00 ± 0.3 Standard Units
pH (Standard Units) 10.00 (if used) ± 0.3 Standard Units
ORP (mV) Zobell Solution (231.0 mV @ 25o C
± 20 mV for temperature based calculation
Turbidity 0 FNU and 124 FNU ± 5% of standard value
8.0 Records Examples of common field documentation are available in Barr’s “Compendium of Field Documentation”. Field documentation specific to this SOP are listed below:
• Field Log Data Sheet
Field Log Data Sheets are provided to a Barr Data Management Administrator for storage on the internal Barr network. Additional records information can be found in Barr’s “Records Management System Manual”.
Other Barr SOP subjects referenced within this SOP: collection of QC samples, decontamination of sampling equipment, and investigative derived waste.
9.0 References Website: https://www.ysi.com/ProDSS YSI ProDSS Multiparameter Water Quality Field Instrument Catalog
YSI ProDSS User Manual Document #626973-01REF
Appendix G
Safety Data Sheets for Proposed Chemical Additives
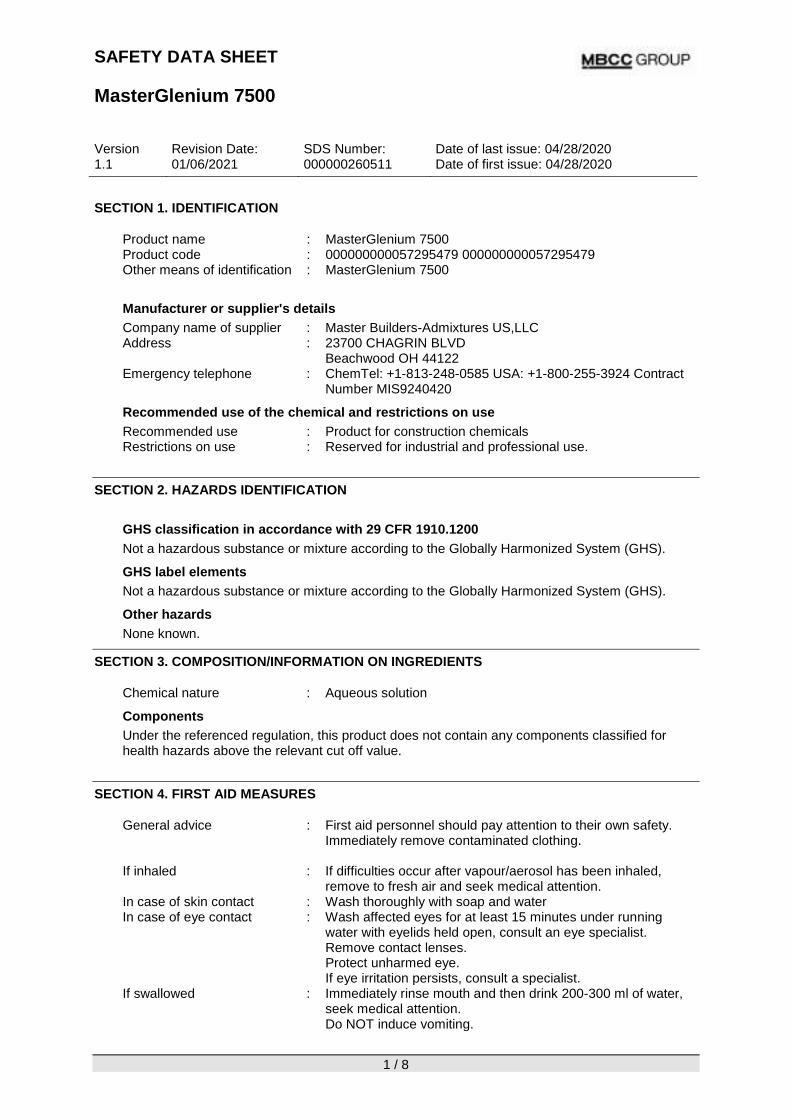
SAFETY DATA SHEET MasterGlenium 7500
Version 1.1
Revision Date: 01/06/2021
SDS Number: 000000260511
Date of last issue: 04/28/2020 Date of first issue: 04/28/2020
1 / 8
SECTION 1. IDENTIFICATION
Product name : MasterGlenium 7500 Product code : 000000000057295479 000000000057295479 Other means of identification
: MasterGlenium 7500
Manufacturer or supplier's details Company name of supplier : Master Builders-Admixtures US,LLC Address : 23700 CHAGRIN BLVD
Beachwood OH 44122 Emergency telephone : ChemTel: +1-813-248-0585 USA: +1-800-255-3924 Contract Number MIS9240420
Recommended use of the chemical and restrictions on use Recommended use : Product for construction chemicals Restrictions on use : Reserved for industrial and professional use.
SECTION 2. HAZARDS IDENTIFICATION
GHS classification in accordance with 29 CFR 1910.1200 Not a hazardous substance or mixture according to the Globally Harmonized System (GHS). GHS label elements Not a hazardous substance or mixture according to the Globally Harmonized System (GHS). Other hazards None known.
SECTION 3. COMPOSITION/INFORMATION ON INGREDIENTS
Chemical nature : Aqueous solution Components Under the referenced regulation, this product does not contain any components classified for health hazards above the relevant cut off value.
SECTION 4. FIRST AID MEASURES
General advice : First aid personnel should pay attention to their own safety. Immediately remove contaminated clothing.
If inhaled : If difficulties occur after vapour/aerosol has been inhaled,
remove to fresh air and seek medical attention. In case of skin contact : Wash thoroughly with soap and water In case of eye contact : Wash affected eyes for at least 15 minutes under running water with eyelids held open, consult an eye specialist.
Remove contact lenses. Protect unharmed eye. If eye irritation persists, consult a specialist. If swallowed : Immediately rinse mouth and then drink 200-300 ml of water, seek medical attention. Do NOT induce vomiting.
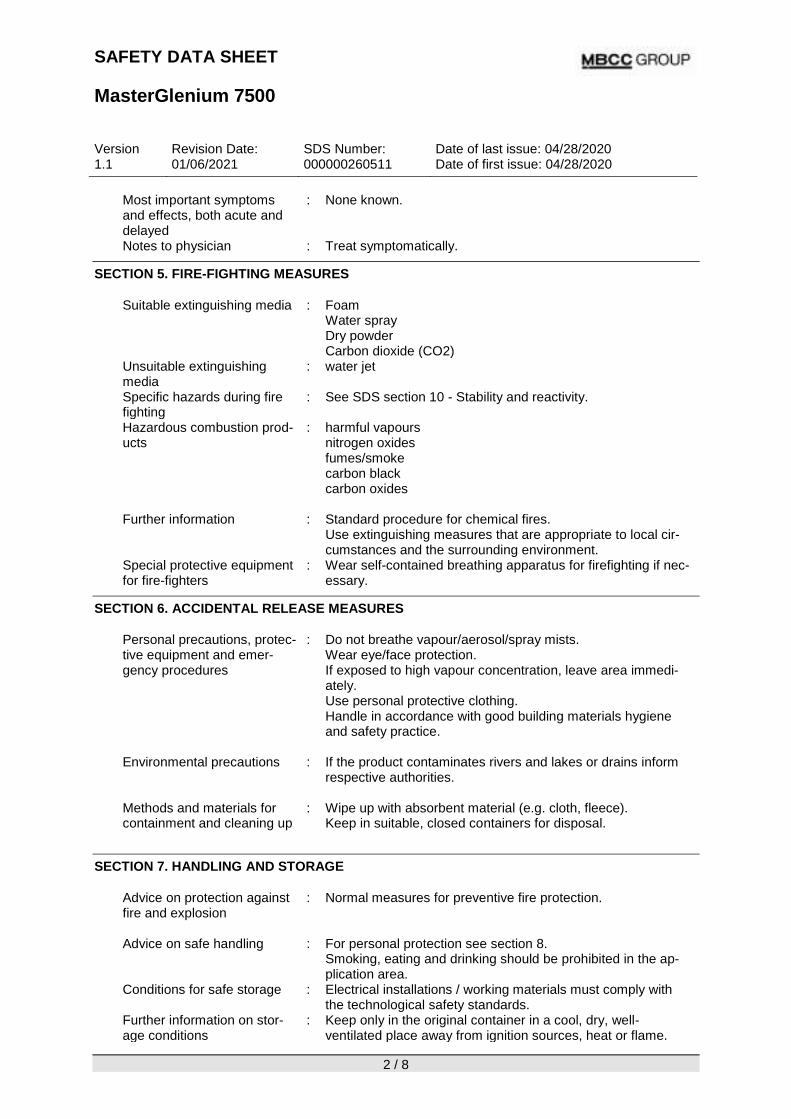
SAFETY DATA SHEET MasterGlenium 7500
Version 1.1
Revision Date: 01/06/2021
SDS Number: 000000260511
Date of last issue: 04/28/2020 Date of first issue: 04/28/2020
2 / 8
Most important symptoms and effects, both acute and delayed
: None known.
Notes to physician : Treat symptomatically. SECTION 5. FIRE-FIGHTING MEASURES
Suitable extinguishing media : Foam Water spray Dry powder Carbon dioxide (CO2) Unsuitable extinguishing
media : water jet
Specific hazards during fire fighting
: See SDS section 10 - Stability and reactivity.
Hazardous combustion prod-ucts
: harmful vapours nitrogen oxides fumes/smoke carbon black carbon oxides
Further information : Standard procedure for chemical fires. Use extinguishing measures that are appropriate to local cir-cumstances and the surrounding environment. Special protective equipment
for fire-fighters : Wear self-contained breathing apparatus for firefighting if nec-
essary. SECTION 6. ACCIDENTAL RELEASE MEASURES
Personal precautions, protec-tive equipment and emer-gency procedures
: Do not breathe vapour/aerosol/spray mists. Wear eye/face protection. If exposed to high vapour concentration, leave area immedi-ately. Use personal protective clothing. Handle in accordance with good building materials hygiene and safety practice.
Environmental precautions
: If the product contaminates rivers and lakes or drains inform respective authorities.
Methods and materials for containment and cleaning up
: Wipe up with absorbent material (e.g. cloth, fleece). Keep in suitable, closed containers for disposal.
SECTION 7. HANDLING AND STORAGE
Advice on protection against fire and explosion
: Normal measures for preventive fire protection.
Advice on safe handling : For personal protection see section 8. Smoking, eating and drinking should be prohibited in the ap-plication area. Conditions for safe storage : Electrical installations / working materials must comply with the technological safety standards. Further information on stor-
age conditions : Keep only in the original container in a cool, dry, well-
ventilated place away from ignition sources, heat or flame.
SAFETY DATA SHEET MasterGlenium 7500
Version 1.1
Revision Date: 01/06/2021
SDS Number: 000000260511
Date of last issue: 04/28/2020 Date of first issue: 04/28/2020
3 / 8
Protect from direct sunlight.
Materials to avoid : No materials to be especially mentioned.
Further information on stor-age stability
: No decomposition if stored and applied as directed.
SECTION 8. EXPOSURE CONTROLS/PERSONAL PROTECTION
Ingredients with workplace control parameters Contains no substances with occupational exposure limit values. Engineering measures : Ensure adequate ventilation. Personal protective equipment Respiratory protection : Wear respiratory protection if ventilation is inadequate. Hand protection
Remarks : Wear chemical resistant protective gloves. Manufacturer's
directions for use should be observed because of great di-versity of types. Eye protection : Safety glasses Skin and body protection : Protective suit Protective measures : Do not inhale gases/vapours/aerosols. Avoid contact with the skin, eyes and clothing. Avoid exposure - obtain special instructions before use. Handle in accordance with good building materials hygiene and safety practice. Wearing of closed work clothing is recommended. Hygiene measures : General industrial hygiene practice.
SECTION 9. PHYSICAL AND CHEMICAL PROPERTIES
Appearance : liquid Color : brown Odor : slight odour pH : approx. 4.6 (72 °F / 22 °C)
Melting point : No applicable information available.
Boiling point : No applicable information available.
Flash point : 200.01 °F / 93.34 °C
Evaporation rate : No applicable information available.
Flammability (liquids) : The product is not flammable.
Upper explosion limit / Upper flammability limit
: No applicable information available.
SAFETY DATA SHEET MasterGlenium 7500
Version 1.1
Revision Date: 01/06/2021
SDS Number: 000000260511
Date of last issue: 04/28/2020 Date of first issue: 04/28/2020
4 / 8
Lower explosion limit / Lower flammability limit
: No applicable information available.
Vapor pressure : No applicable information available.
Relative vapor density : Not applicable
Relative density : No applicable information available.
Density : 1.05 g/cm3 (68 °F / 20 °C)
Solubility(ies) Water solubility : No data available
Solubility in other solvents : No data available
Partition coefficient: n-octanol/water
: Not applicable
Autoignition temperature : Based on the water content the product does not ignite.
Decomposition temperature : No decomposition if stored and handled as pre-scribed/indicated.
Viscosity Viscosity, dynamic : No applicable information available.
Viscosity, kinematic : No applicable information available.
Explosive properties : Not explosive
Not explosive
Oxidizing properties : Based on its structural properties the product is not classified as oxidizing.
Sublimation point : No applicable information available.
Molecular weight : No data available.
SECTION 10. STABILITY AND REACTIVITY
Reactivity : No hazardous reactions if stored and handled as pre-scribed/indicated. Chemical stability : The product is stable if stored and handled as pre-scribed/indicated. Possibility of hazardous reac-
tions : Stable under recommended storage conditions.
No hazards to be specially mentioned.
Conditions to avoid : See SDS section 7 - Handling and storage. Incompatible materials : Strong acids Strong bases Strong oxidizing agents Strong reducing agents Hazardous decomposition : No hazardous decomposition products if stored and handled
SAFETY DATA SHEET MasterGlenium 7500
Version 1.1
Revision Date: 01/06/2021
SDS Number: 000000260511
Date of last issue: 04/28/2020 Date of first issue: 04/28/2020
5 / 8
products as prescribed/indicated. SECTION 11. TOXICOLOGICAL INFORMATION
Acute toxicity Not classified based on available information. Skin corrosion/irritation Not classified based on available information. Serious eye damage/eye irritation Not classified based on available information. Respiratory or skin sensitization
Skin sensitization Not classified based on available information. Respiratory sensitization Not classified based on available information. Germ cell mutagenicity Not classified based on available information. Carcinogenicity Not classified based on available information. Reproductive toxicity Not classified based on available information. STOT-single exposure Not classified based on available information. STOT-repeated exposure Not classified based on available information. Aspiration toxicity Not classified based on available information. Further information
Product: Remarks : The product has not been tested. The statement has been
derived from the properties of the individual components. SECTION 12. ECOLOGICAL INFORMATION
Ecotoxicity No data available Persistence and degradability No data available Bioaccumulative potential No data available
SAFETY DATA SHEET MasterGlenium 7500
Version 1.1
Revision Date: 01/06/2021
SDS Number: 000000260511
Date of last issue: 04/28/2020 Date of first issue: 04/28/2020
6 / 8
Mobility in soil No data available Other adverse effects
Product: Additional ecological infor-mation
: There is a high probability that the product is not acutely harmful to aquatic organisms. The product has not been tested. The statements on ecotoxi-cology have been derived from the properties of the individual components.
SECTION 13. DISPOSAL CONSIDERATIONS
Disposal methods Waste from residues : Dispose of in accordance with national, state and local regula-
tions. Do not discharge into drains/surface waters/groundwater. Do not contaminate ponds, waterways or ditches with chemi-cal or used container. Contaminated packaging : Contaminated packaging should be emptied as far as possible and disposed of in the same manner as the sub-stance/product.
SECTION 14. TRANSPORT INFORMATION
International Regulations
UNRTDG Not regulated as a dangerous good IATA-DGR Not regulated as a dangerous good IMDG-Code Not regulated as a dangerous good Transport in bulk according to Annex II of MARPOL 73/78 and the IBC Code Not applicable for product as supplied. Domestic regulation
49 CFR Not regulated as a dangerous good
SECTION 15. REGULATORY INFORMATION
The ingredients of this product are reported in the following inventories: DSL
: All components of this product are on the Canadian DSL TSCA
: All chemical substances in this product are either listed as active on the TSCA Inventory or are in compliance with a TSCA Inventory exemption.
SAFETY DATA SHEET MasterGlenium 7500
Version 1.1
Revision Date: 01/06/2021
SDS Number: 000000260511
Date of last issue: 04/28/2020 Date of first issue: 04/28/2020
7 / 8
SECTION 16. OTHER INFORMATION
Further information
NFPA 704: HMIS® IV:
HMIS® ratings are based on a 0-4 rating scale, with 0 representing minimal haz-ards or risks, and 4 representing signifi-cant hazards or risks. The "*" represents a chronic hazard, while the "/" represents the absence of a chronic hazard.
Full text of other abbreviations
AICS - Australian Inventory of Chemical Substances; ASTM - American Society for the Testing of Materials; bw - Body weight; CERCLA - Comprehensive Environmental Response, Compensa-tion, and Liability Act; CMR - Carcinogen, Mutagen or Reproductive Toxicant; DIN - Standard of the German Institute for Standardisation; DOT - Department of Transportation; DSL - Domestic Substances List (Canada); ECx - Concentration associated with x% response; EHS - Extremely Hazardous Substance; ELx - Loading rate associated with x% response; EmS - Emergency Schedule; ENCS - Existing and New Chemical Substances (Japan); ErCx - Concentration asso-ciated with x% growth rate response; ERG - Emergency Response Guide; GHS - Globally Har-monized System; GLP - Good Laboratory Practice; HMIS - Hazardous Materials Identification System; IARC - International Agency for Research on Cancer; IATA - International Air Transport Association; IBC - International Code for the Construction and Equipment of Ships carrying Dan-gerous Chemicals in Bulk; IC50 - Half maximal inhibitory concentration; ICAO - International Civil Aviation Organization; IECSC - Inventory of Existing Chemical Substances in China; IMDG - In-ternational Maritime Dangerous Goods; IMO - International Maritime Organization; ISHL - Indus-trial Safety and Health Law (Japan); ISO - International Organisation for Standardization; KECI - Korea Existing Chemicals Inventory; LC50 - Lethal Concentration to 50 % of a test population; LD50 - Lethal Dose to 50% of a test population (Median Lethal Dose); MARPOL - International Convention for the Prevention of Pollution from Ships; MSHA - Mine Safety and Health Admin-istration; n.o.s. - Not Otherwise Specified; NFPA - National Fire Protection Association; NO(A)EC - No Observed (Adverse) Effect Concentration; NO(A)EL - No Observed (Adverse) Effect Level; NOELR - No Observable Effect Loading Rate; NTP - National Toxicology Program; NZIoC - New Zealand Inventory of Chemicals; OECD - Organization for Economic Co-operation and Develop-ment; OPPTS - Office of Chemical Safety and Pollution Prevention; PBT - Persistent, Bioaccumu-lative and Toxic substance; PICCS - Philippines Inventory of Chemicals and Chemical Substanc-es; (Q)SAR - (Quantitative) Structure Activity Relationship; RCRA - Resource Conservation and Recovery Act; REACH - Regulation (EC) No 1907/2006 of the European Parliament and of the Council concerning the Registration, Evaluation, Authorisation and Restriction of Chemicals; RQ - Reportable Quantity; SADT - Self-Accelerating Decomposition Temperature; SARA - Superfund
HEALTH
1 0
0
Flammability
Instability
Special hazard
FLAMMABILITY PHYSICAL HAZARD
Health
SAFETY DATA SHEET MasterGlenium 7500
Version 1.1
Revision Date: 01/06/2021
SDS Number: 000000260511
Date of last issue: 04/28/2020 Date of first issue: 04/28/2020
8 / 8
Amendments and Reauthorization Act; SDS - Safety Data Sheet; TCSI - Taiwan Chemical Sub-stance Inventory; TSCA - Toxic Substances Control Act (United States); UN - United Nations; UNRTDG - United Nations Recommendations on the Transport of Dangerous Goods; vPvB - Very Persistent and Very Bioaccumulative
Revision Date : 01/06/2021
We support worldwide Responsible Care® initiatives. We value the health and safety of our em-ployees, customers, suppliers and neighbors, and the protection of the environment. Our com-mitment to Responsible Care is integral to conducting our business and operating our facilities in a safe and environmentally responsible fashion, supporting our customers and suppliers in ensur-ing the safe and environmentally sound handling of our products, and minimizing the impact of our operations on society and the environment during production, storage, transport, use and dis-posal of our products. IMPORTANT: WHILE THE DESCRIPTIONS, DESIGNS, DATA AND INFORMATION CONTAINED HEREIN ARE PRESENTED IN GOOD FAITH AND BELIEVED TO BE ACCURATE , IT IS PROVIDED FOR YOUR GUIDANCE ONLY. BECAUSE MANY FACTORS MAY AFFECT PROCESSING OR APPLICATION/USE, WE RECOMMEND THAT YOU MAKE TESTS TO DETERMINE THE SUITABILITY OF A PRODUCT FOR YOUR PARTICULAR PURPOSE PRIOR TO USE. NO WARRANTIES OF ANY KIND, EITHER EXPRESSED OR IMPLIED, INCLUDING WARRANTIES OF MERCHANTABILITY OR FITNESS FOR A PARTICULAR PURPOSE, ARE MADE REGARDING PRODUCTS DESCRIBED OR DESIGNS, DATA OR INFORMATION SET FORTH, OR THAT THE PRODUCTS, DESIGNS, DATA OR INFORMATION MAY BE USED WITHOUT INFRINGING THE INTELLECTUAL PROPERTY RIGHTS OF OTHERS. IN NO CASE SHALL THE DESCRIPTIONS, INFORMATION, DATA OR DESIGNS PROVIDED BE CONSIDERED A PART OF OUR TERMS AND CONDITIONS OF SALE. FURTHER, YOU EXPRESSLY UNDERSTAND AND AGREE THAT THE DESCRIPTIONS, DESIGNS, DATA, AND INFORMATION FURNISHED BY OUR COMPANY HEREUNDER ARE GIVEN GRATIS AND WE ASSUME NO OBLIGATION OR LIABILITY FOR THE DESCRIPTION, DESIGNS, DATA AND INFORMATION GIVEN OR RESULTS OBTAINED, ALL SUCH BEING GIVEN AND ACCEPTED AT YOUR RISK.
US / EN
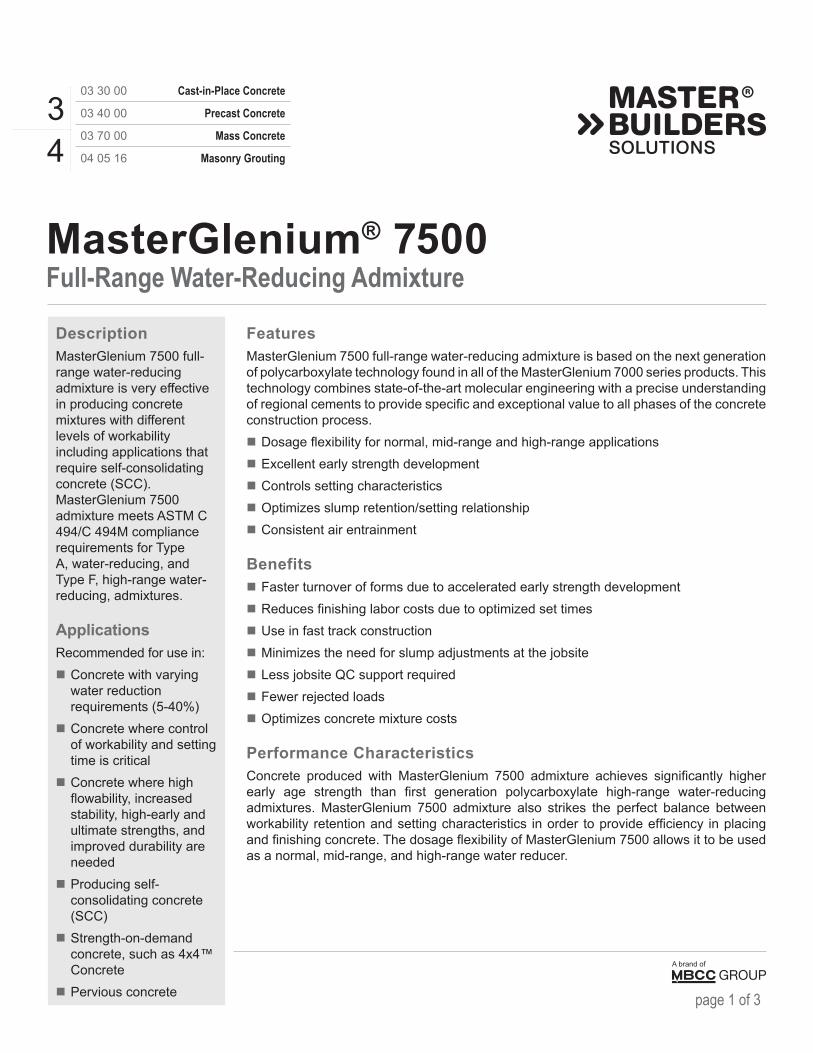
page 1 of 3
FeaturesMasterGlenium 7500 full-range water-reducing admixture is based on the next generation of polycarboxylate technology found in all of the MasterGlenium 7000 series products. This technology combines state-of-the-art molecular engineering with a precise understanding of regional cements to provide specific and exceptional value to all phases of the concrete construction process.�� Dosage flexibility for normal, mid-range and high-range applications�� Excellent early strength development�� Controls setting characteristics�� Optimizes slump retention/setting relationship�� Consistent air entrainment
Benefits�� Faster turnover of forms due to accelerated early strength development�� Reduces finishing labor costs due to optimized set times�� Use in fast track construction�� Minimizes the need for slump adjustments at the jobsite�� Less jobsite QC support required�� Fewer rejected loads�� Optimizes concrete mixture costs
Performance CharacteristicsConcrete produced with MasterGlenium 7500 admixture achieves significantly higher early age strength than first generation polycarboxylate high-range water-reducing admixtures. MasterGlenium 7500 admixture also strikes the perfect balance between workability retention and setting characteristics in order to provide efficiency in placing and finishing concrete. The dosage flexibility of MasterGlenium 7500 allows it to be used as a normal, mid-range, and high-range water reducer.
DescriptionMasterGlenium 7500 full-range water-reducing admixture is very effective in producing concrete mixtures with different levels of workability including applications that require self-consolidating concrete (SCC). MasterGlenium 7500 admixture meets ASTM C 494/C 494M compliance requirements for Type A, water-reducing, and Type F, high-range water-reducing, admixtures.
ApplicationsRecommended for use in:�� Concrete with varying water reduction requirements (5-40%)�� Concrete where control of workability and setting time is critical�� Concrete where high flowability, increased stability, high-early and ultimate strengths, and improved durability are needed�� Producing self-consolidating concrete (SCC)�� Strength-on-demand concrete, such as 4x4™ Concrete�� Pervious concrete
MasterGlenium® 7500Full-Range Water-Reducing Admixture
34
03 30 00 Cast-in-Place Concrete
03 40 00 Precast Concrete
03 70 00 Mass Concrete
04 05 16 Masonry Grouting
A brand of
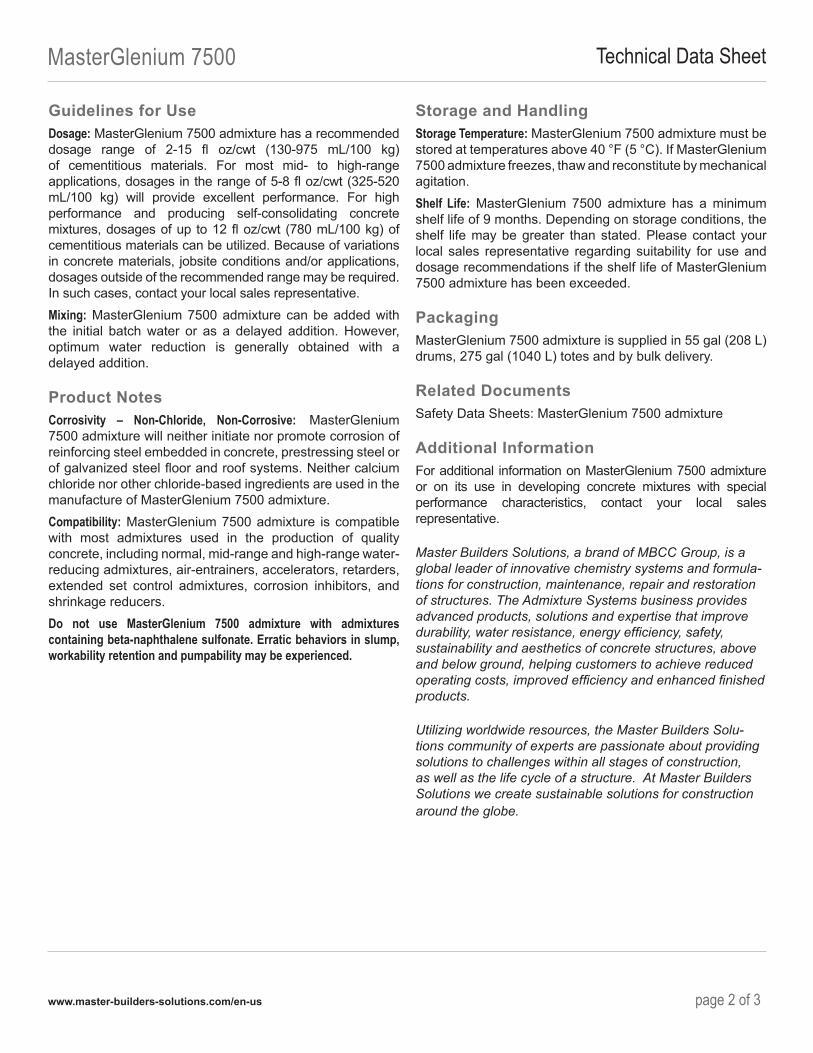
MasterGlenium 7500 Technical Data Sheet
www.master-builders-solutions.com/en-us page 2 of 3
Guidelines for UseDosage: MasterGlenium 7500 admixture has a recommended dosage range of 2-15 fl oz/cwt (130-975 mL/100 kg) of cementitious materials. For most mid- to high-range applications, dosages in the range of 5-8 fl oz/cwt (325-520 mL/100 kg) will provide excellent performance. For high performance and producing self-consolidating concrete mixtures, dosages of up to 12 fl oz/cwt (780 mL/100 kg) of cementitious materials can be utilized. Because of variations in concrete materials, jobsite conditions and/or applications, dosages outside of the recommended range may be required. In such cases, contact your local sales representative. Mixing: MasterGlenium 7500 admixture can be added with the initial batch water or as a delayed addition. However, optimum water reduction is generally obtained with a delayed addition.
Product NotesCorrosivity – Non-Chloride, Non-Corrosive: MasterGlenium 7500 admixture will neither initiate nor promote corrosion of reinforcing steel embedded in concrete, prestressing steel or of galvanized steel floor and roof systems. Neither calcium chloride nor other chloride-based ingredients are used in the manufacture of MasterGlenium 7500 admixture.Compatibility: MasterGlenium 7500 admixture is compatible with most admixtures used in the production of quality concrete, including normal, mid-range and high-range water-reducing admixtures, air-entrainers, accelerators, retarders, extended set control admixtures, corrosion inhibitors, and shrinkage reducers. Do not use MasterGlenium 7500 admixture with admixtures containing beta-naphthalene sulfonate. Erratic behaviors in slump, workability retention and pumpability may be experienced.
Storage and HandlingStorage Temperature: MasterGlenium 7500 admixture must be stored at temperatures above 40 °F (5 °C). If MasterGlenium 7500 admixture freezes, thaw and reconstitute by mechanical agitation. Shelf Life: MasterGlenium 7500 admixture has a minimum shelf life of 9 months. Depending on storage conditions, the shelf life may be greater than stated. Please contact your local sales representative regarding suitability for use and dosage recommendations if the shelf life of MasterGlenium 7500 admixture has been exceeded.
PackagingMasterGlenium 7500 admixture is supplied in 55 gal (208 L) drums, 275 gal (1040 L) totes and by bulk delivery.
Related DocumentsSafety Data Sheets: MasterGlenium 7500 admixture
Additional InformationFor additional information on MasterGlenium 7500 admixture or on its use in developing concrete mixtures with special performance characteristics, contact your local sales representative.
Master Builders Solutions, a brand of MBCC Group, is a global leader of innovative chemistry systems and formula-tions for construction, maintenance, repair and restoration of structures. The Admixture Systems business provides advanced products, solutions and expertise that improve durability, water resistance, energy efficiency, safety, sustainability and aesthetics of concrete structures, above and below ground, helping customers to achieve reduced operating costs, improved efficiency and enhanced finished products.
Utilizing worldwide resources, the Master Builders Solu-tions community of experts are passionate about providing solutions to challenges within all stages of construction, as well as the life cycle of a structure. At Master Builders Solutions we create sustainable solutions for construction around the globe.
© MBCC Group � 04/21 � DAT-0231® registered trademark of a MBCC Group member in many countries of the world www.master-builders-solutions.com/en-us
Master Builders Solutions Admixtures US, LLC23700 Chagrin Boulevard Cleveland, Ohio 44122-5544 USA � 800-628-9990
Master Builders Solutions Canada, Inc. 1800 Clark BoulevardBrampton, Ontario L6T 4M7 CANADA � 289-360-1300 page 3 of 3
MasterGlenium 7500 Technical Data Sheet
Limited Warranty NoticeMaster Builders Solutions Admixtures US, LLC (“Master Builders Solutions”) warrants this product to be free from manufacturing defects and to meet the technical properties on the current Technical Data Guide, if used as directed within shelf life. Satisfactory results depend not only on quality products but also upon many factors beyond our control. MASTER BUILDERS SOLUTIONS MAKES NO OTHER WARRANTY OR GUARANTEE, EXPRESS OR IMPLIED, INCLUDING WARRANTIES OF MERCHANTABILITY OR FITNESS FOR A PARTICULAR PURPOSE WITH RESPECT TO ITS PRODUCTS. The sole and exclusive remedy of Purchaser for any claim concerning this product, including but not limited to, claims alleging breach of warranty, negligence, strict liability or otherwise, is shipment to purchaser of product equal to the amount of product that fails to meet this warranty or refund of the original purchase price of product that fails to meet this warranty, at the sole option of Master Builders Solutions. Any claims concerning this product must be received in writing within one (1) year from the date of shipment and any claims not presented within that period are waived by Purchaser. MASTER BUILDERS SOLUTIONS WILL NOT BE RESPONSIBLE FOR ANY SPECIAL, INCIDENTAL, CONSEQUENTIAL (INCLUDING LOST PROFITS) OR PUNITIVE DAMAGES OF ANY KIND.Purchaser must determine the suitability of the products for the intended use and assumes all risks and liabilities in connection therewith. This information and all further technical advice are based on Master Builders Solutions' present knowledge and experience. However, Master Builders Solutions assumes no liability for providing such information and advice including the extent to which such information and advice may relate to existing third party intellectual property rights, especially patent rights, nor shall any legal relationship be created by or arise from the provision of such information and advice. Master Builders Solutions reserves the right to make any changes according to technological progress or further developments. The Purchaser of the Product(s) must test the product(s) for suitability for the intended application and purpose before proceeding with a full application of the product(s). Performance of the product described herein should be verified by testing and carried out by qualified experts.
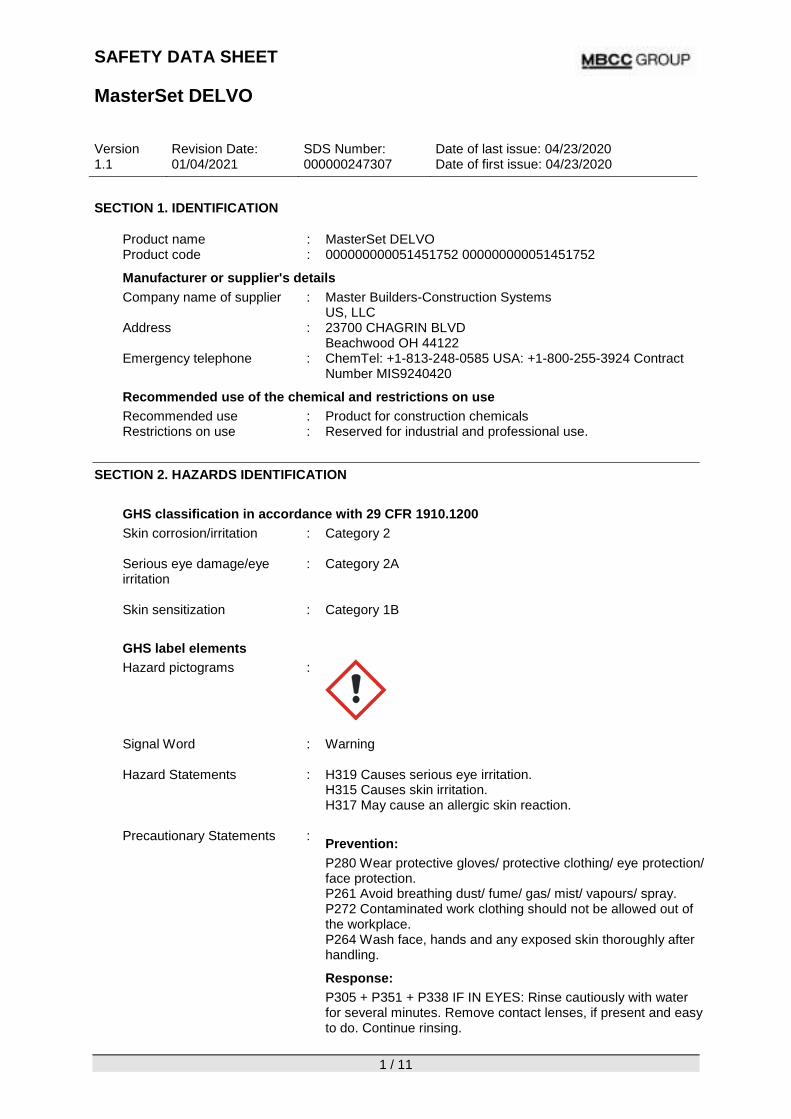
SAFETY DATA SHEET MasterSet DELVO
Version 1.1
Revision Date: 01/04/2021
SDS Number: 000000247307
Date of last issue: 04/23/2020 Date of first issue: 04/23/2020
1 / 11
SECTION 1. IDENTIFICATION
Product name : MasterSet DELVO Product code : 000000000051451752 000000000051451752 Manufacturer or supplier's details Company name of supplier : Master Builders-Construction Systems
US, LLC Address : 23700 CHAGRIN BLVD Beachwood OH 44122 Emergency telephone : ChemTel: +1-813-248-0585 USA: +1-800-255-3924 Contract Number MIS9240420
Recommended use of the chemical and restrictions on use Recommended use : Product for construction chemicals Restrictions on use : Reserved for industrial and professional use.
SECTION 2. HAZARDS IDENTIFICATION
GHS classification in accordance with 29 CFR 1910.1200 Skin corrosion/irritation
: Category 2 Serious eye damage/eye irritation
: Category 2A
Skin sensitization
: Category 1B
GHS label elements Hazard pictograms
:
Signal Word
: Warning
Hazard Statements
: H319 Causes serious eye irritation. H315 Causes skin irritation. H317 May cause an allergic skin reaction.
Precautionary Statements
: Prevention: P280 Wear protective gloves/ protective clothing/ eye protection/ face protection. P261 Avoid breathing dust/ fume/ gas/ mist/ vapours/ spray. P272 Contaminated work clothing should not be allowed out of the workplace. P264 Wash face, hands and any exposed skin thoroughly after handling. Response: P305 + P351 + P338 IF IN EYES: Rinse cautiously with water for several minutes. Remove contact lenses, if present and easy to do. Continue rinsing.
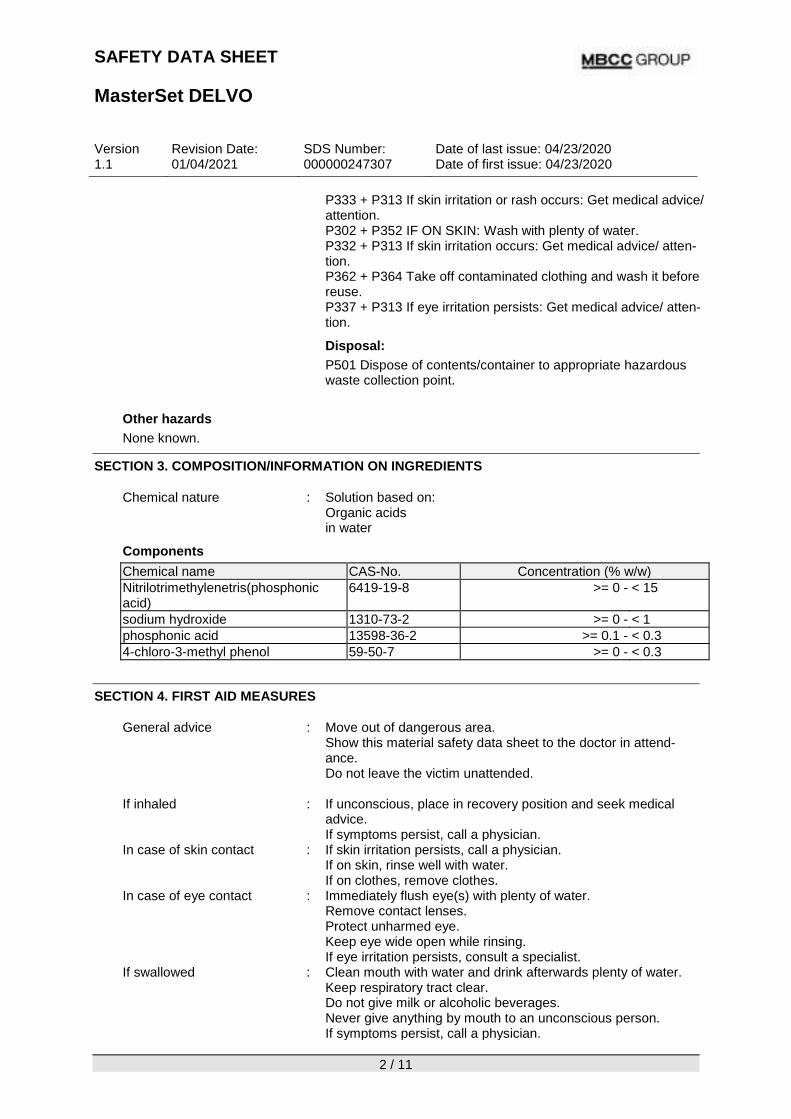
SAFETY DATA SHEET MasterSet DELVO
Version 1.1
Revision Date: 01/04/2021
SDS Number: 000000247307
Date of last issue: 04/23/2020 Date of first issue: 04/23/2020
2 / 11
P333 + P313 If skin irritation or rash occurs: Get medical advice/ attention. P302 + P352 IF ON SKIN: Wash with plenty of water. P332 + P313 If skin irritation occurs: Get medical advice/ atten-tion. P362 + P364 Take off contaminated clothing and wash it before reuse. P337 + P313 If eye irritation persists: Get medical advice/ atten-tion. Disposal: P501 Dispose of contents/container to appropriate hazardous waste collection point.
Other hazards None known.
SECTION 3. COMPOSITION/INFORMATION ON INGREDIENTS
Chemical nature : Solution based on: Organic acids in water
Components Chemical name CAS-No. Concentration (% w/w) Nitrilotrimethylenetris(phosphonic acid)
6419-19-8 >= 0 - < 15 sodium hydroxide 1310-73-2 >= 0 - < 1 phosphonic acid 13598-36-2 >= 0.1 - < 0.3 4-chloro-3-methyl phenol 59-50-7 >= 0 - < 0.3
SECTION 4. FIRST AID MEASURES
General advice : Move out of dangerous area. Show this material safety data sheet to the doctor in attend-ance. Do not leave the victim unattended.
If inhaled : If unconscious, place in recovery position and seek medical
advice. If symptoms persist, call a physician. In case of skin contact : If skin irritation persists, call a physician. If on skin, rinse well with water. If on clothes, remove clothes. In case of eye contact : Immediately flush eye(s) with plenty of water. Remove contact lenses. Protect unharmed eye. Keep eye wide open while rinsing. If eye irritation persists, consult a specialist. If swallowed : Clean mouth with water and drink afterwards plenty of water. Keep respiratory tract clear. Do not give milk or alcoholic beverages. Never give anything by mouth to an unconscious person. If symptoms persist, call a physician.
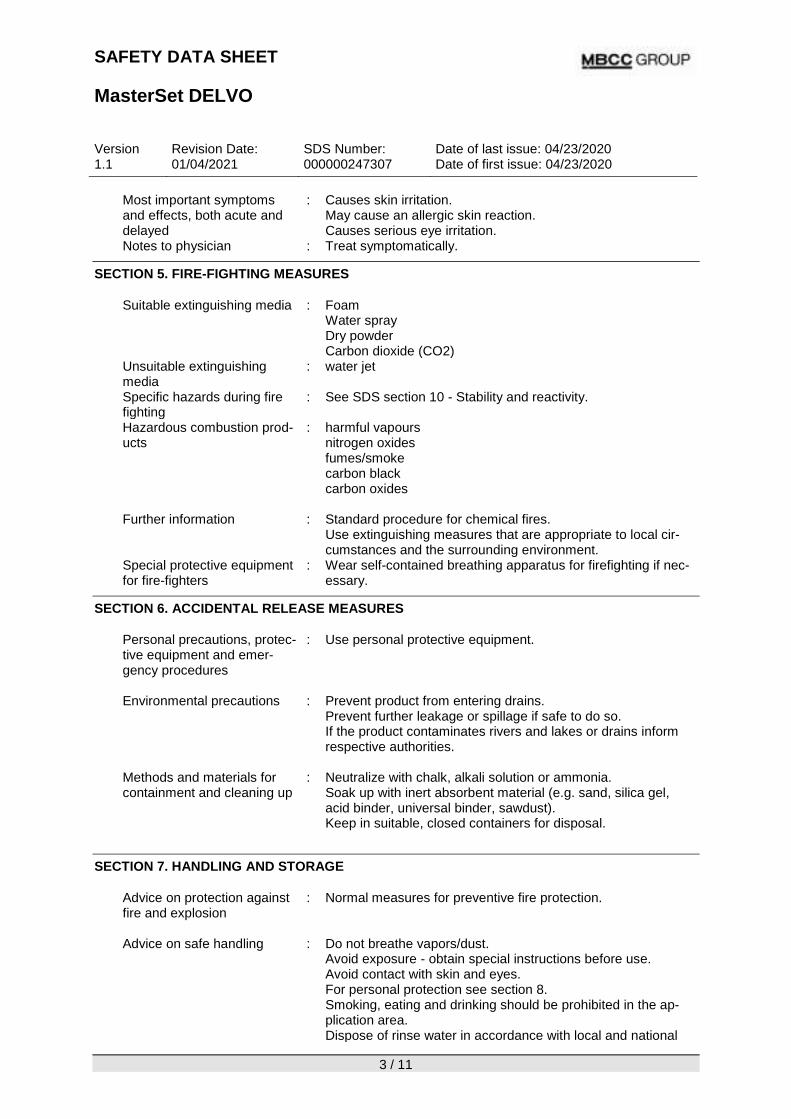
SAFETY DATA SHEET MasterSet DELVO
Version 1.1
Revision Date: 01/04/2021
SDS Number: 000000247307
Date of last issue: 04/23/2020 Date of first issue: 04/23/2020
3 / 11
Most important symptoms and effects, both acute and delayed
: Causes skin irritation. May cause an allergic skin reaction. Causes serious eye irritation. Notes to physician : Treat symptomatically.
SECTION 5. FIRE-FIGHTING MEASURES
Suitable extinguishing media : Foam Water spray Dry powder Carbon dioxide (CO2) Unsuitable extinguishing
media : water jet
Specific hazards during fire fighting
: See SDS section 10 - Stability and reactivity.
Hazardous combustion prod-ucts
: harmful vapours nitrogen oxides fumes/smoke carbon black carbon oxides
Further information : Standard procedure for chemical fires. Use extinguishing measures that are appropriate to local cir-cumstances and the surrounding environment. Special protective equipment
for fire-fighters : Wear self-contained breathing apparatus for firefighting if nec-
essary. SECTION 6. ACCIDENTAL RELEASE MEASURES
Personal precautions, protec-tive equipment and emer-gency procedures
: Use personal protective equipment.
Environmental precautions
: Prevent product from entering drains. Prevent further leakage or spillage if safe to do so. If the product contaminates rivers and lakes or drains inform respective authorities.
Methods and materials for containment and cleaning up
: Neutralize with chalk, alkali solution or ammonia. Soak up with inert absorbent material (e.g. sand, silica gel, acid binder, universal binder, sawdust). Keep in suitable, closed containers for disposal.
SECTION 7. HANDLING AND STORAGE
Advice on protection against fire and explosion
: Normal measures for preventive fire protection.
Advice on safe handling : Do not breathe vapors/dust. Avoid exposure - obtain special instructions before use. Avoid contact with skin and eyes. For personal protection see section 8. Smoking, eating and drinking should be prohibited in the ap-plication area. Dispose of rinse water in accordance with local and national
SAFETY DATA SHEET MasterSet DELVO
Version 1.1
Revision Date: 01/04/2021
SDS Number: 000000247307
Date of last issue: 04/23/2020 Date of first issue: 04/23/2020
4 / 11
regulations. Persons susceptible to skin sensitization problems or asthma, allergies, chronic or recurrent respiratory disease should not be employed in any process in which this mixture is being used. Conditions for safe storage : Keep container tightly closed in a dry and well-ventilated place. Electrical installations / working materials must comply with the technological safety standards. Further information on stor-
age conditions
: Keep only in the original container in a cool, dry, well-ventilated place away from ignition sources, heat or flame. Protect from direct sunlight.
Materials to avoid : No applicable information available.
Do not store near acids.
Further information on stor-age stability
: No decomposition if stored and applied as directed.
SECTION 8. EXPOSURE CONTROLS/PERSONAL PROTECTION
Ingredients with workplace control parameters Components CAS-No. Value type
(Form of exposure)
Control parame-ters / Permissible concentration
Basis
sodium hydroxide 1310-73-2 CLV 2 mg/m3 ACGIHTLV Ceil_Time 2 mg/m3 NIOSH PEL 2 mg/m3 29 CFR 1910.1000 (Table Z-1) CLV 2 mg/m3 29 CFR 1910.1000 (Table Z-1-A) C 2 mg/m3 ACGIH C 2 mg/m3 NIOSH REL TWA 2 mg/m3 OSHA Z-1 C 2 mg/m3 OSHA P0
Engineering measures : No applicable information available. Personal protective equipment Respiratory protection : When workers are facing concentrations above the occupa-
tional exposure limits they must use appropriate certified respirators. Hand protection
Remarks : Wear chemical resistant protective gloves. Manufacturer's
directions for use should be observed because of great di-versity of types. Eye protection : Eye wash bottle with pure water Tightly fitting safety goggles Wear face-shield and protective suit for abnormal processing problems. Skin and body protection : Impervious clothing
SAFETY DATA SHEET MasterSet DELVO
Version 1.1
Revision Date: 01/04/2021
SDS Number: 000000247307
Date of last issue: 04/23/2020 Date of first issue: 04/23/2020
5 / 11
Choose body protection according to the amount and con-centration of the dangerous substance at the work place. Protective measures : Do not inhale gases/vapours/aerosols. Avoid contact with the skin, eyes and clothing. Avoid exposure - obtain special instructions before use. Handle in accordance with good building materials hygiene and safety practice. Wearing of closed work clothing is recommended. Hygiene measures : When using do not eat or drink. When using do not smoke. Wash hands before breaks and at the end of workday.
SECTION 9. PHYSICAL AND CHEMICAL PROPERTIES
Appearance : liquid Color : light brown Odor : odorless pH : 2.1 - 4 (77 °F / 25 °C)
Freezing point : 27 °F / -3 °C
Melting point 27 °F / -3 °C
Boiling point : 221 °F / 105 °C
Flash point : does not flash
Evaporation rate : not determined
Upper explosion limit / Upper flammability limit
: No applicable information available.
Relative vapor density : Heavier than air.
Density : approx. 1.075 g/cm3 (68 °F / 20 °C)
Solubility(ies) Water solubility : soluble (68 °F / 20 °C)
Solubility in other solvents : No applicable information available.
Partition coefficient: n-octanol/water
: Not applicable
Autoignition temperature : Based on the water content the product does not ignite.
Decomposition temperature : No decomposition if stored and handled as pre-scribed/indicated.
Viscosity Viscosity, dynamic : not determined
Viscosity, kinematic : No applicable information available.
SAFETY DATA SHEET MasterSet DELVO
Version 1.1
Revision Date: 01/04/2021
SDS Number: 000000247307
Date of last issue: 04/23/2020 Date of first issue: 04/23/2020
6 / 11
Explosive properties : Not explosive
Oxidizing properties : not fire-propagating
Sublimation temperature : No applicable information available.
Molecular weight : No data available.
Metal corrosion rate : Corrosive effect on: Mild steel Aluminium The product is not to
be labelled as corrosive for transport purposes.
SECTION 10. STABILITY AND REACTIVITY
Reactivity : No decomposition if stored and applied as directed. Chemical stability : No decomposition if stored and applied as directed. Possibility of hazardous reac-tions
: No decomposition if stored and applied as directed.
Conditions to avoid : See SDS section 7 - Handling and storage. Incompatible materials : Strong acids Strong bases Strong oxidizing agents Strong reducing agents Hazardous decomposition
products : phosphines
carbon oxides SECTION 11. TOXICOLOGICAL INFORMATION
Acute toxicity Not classified based on available information. Product: Acute inhalation toxicity : Remarks: No applicable information available.
Skin corrosion/irritation Causes skin irritation. Serious eye damage/eye irritation Causes serious eye irritation. Respiratory or skin sensitization
Skin sensitization May cause an allergic skin reaction. Respiratory sensitization Not classified based on available information. Germ cell mutagenicity Not classified based on available information. Carcinogenicity Not classified based on available information.
SAFETY DATA SHEET MasterSet DELVO
Version 1.1
Revision Date: 01/04/2021
SDS Number: 000000247307
Date of last issue: 04/23/2020 Date of first issue: 04/23/2020
7 / 11
Reproductive toxicity Not classified based on available information. STOT-single exposure Not classified based on available information. STOT-repeated exposure Not classified based on available information. Aspiration toxicity Not classified based on available information. Further information
Product: Remarks : The product has not been tested. The statement has been
derived from the properties of the individual components. SECTION 12. ECOLOGICAL INFORMATION
Ecotoxicity
Product: Toxicity to fish : LC0 (trout, rainbow): 5,000 mg/l
Exposure time: 96 h
Toxicity to daphnia and other aquatic invertebrates
: LC0 (Daphnia magna): 400 mg/l Exposure time: 48 h
Persistence and degradability No data available Bioaccumulative potential
Components:
Nitrilotrimethylenetris(phosphonic acid): Partition coefficient: n-octanol/water
: log Pow: -4.55 Method: other (calculated)
sodium hydroxide: Partition coefficient: n-octanol/water
: Remarks: Study scientifically not justified.
phosphonic acid: Partition coefficient: n-octanol/water
: log Pow: 1.15 Method: other (calculated)
4-chloro-3-methyl phenol: Partition coefficient: n-octanol/water
: log Pow: 2.7 (77 °F / 25 °C) Method: other (calculated)
SAFETY DATA SHEET MasterSet DELVO
Version 1.1
Revision Date: 01/04/2021
SDS Number: 000000247307
Date of last issue: 04/23/2020 Date of first issue: 04/23/2020
8 / 11
Mobility in soil No data available Other adverse effects
Product: Additional ecological infor-mation
: There is a high probability that the product is not acutely harmful to aquatic organisms. The product has not been tested. The statements on ecotoxi-cology have been derived from the properties of the individual components.
SECTION 13. DISPOSAL CONSIDERATIONS
Disposal methods Waste from residues : Dispose of in accordance with national, state and local regula-
tions. Residues should be disposed of in the same manner as the substance/product. Do not discharge into drains/surface waters/groundwater. Contaminated packaging : Contaminated packaging should be emptied as far as possi-ble; then it can be passed on for recycling after being thor-oughly cleaned.
Packs that cannot be cleaned should be disposed of in the same manner as the contents.
SECTION 14. TRANSPORT INFORMATION
International Regulations
UNRTDG Not regulated as a dangerous good IATA-DGR Not regulated as a dangerous good IMDG-Code Not regulated as a dangerous good Transport in bulk according to Annex II of MARPOL 73/78 and the IBC Code Not applicable for product as supplied. Domestic regulation
49 CFR Not regulated as a dangerous good
SECTION 15. REGULATORY INFORMATION
US State Regulations
Pennsylvania Right To Know sodium hydroxide 1310-73-2 New Jersey Right To Know
SAFETY DATA SHEET MasterSet DELVO
Version 1.1
Revision Date: 01/04/2021
SDS Number: 000000247307
Date of last issue: 04/23/2020 Date of first issue: 04/23/2020
9 / 11
sodium hydroxide 1310-73-2 California Prop. 65 WARNING: This product can expose you to chemicals including formaldehyde, which is/are known to the State of California to cause cancer. For more information go to www.P65Warnings.ca.gov. The ingredients of this product are reported in the following inventories: TSCA
: All chemical substances in this product are either listed as active on the TSCA Inventory or are in compliance with a TSCA Inventory exemption. DSL
: This product contains the following components listed on the
Canadian NDSL. All other components are on the Canadian DSL. 2,2-Dibromo-2-cyanoacetamide
SECTION 16. OTHER INFORMATION
Further information
NFPA 704: HMIS® IV:
HMIS® ratings are based on a 0-4 rating scale, with 0 representing minimal haz-ards or risks, and 4 representing signifi-cant hazards or risks. The "*" represents a chronic hazard, while the "/" represents the absence of a chronic hazard.
Full text of other abbreviations 29 CFR 1910.1000 (Table Z-1-A)
: OSHA - Table Z-1-A (29 CFR 1910.1000) 29 CFR 1910.1000 (Table Z-1)
: OSHA - Table Z-1 (Limits for Air Contaminants) 29 CFR 1910.1000
ACGIH : USA. ACGIH Threshold Limit Values (TLV) ACGIHTLV : American Conference of Governmental Industrial Hygienists -
threshold limit values (US) NIOSH : NIOSH Pocket Guide to Chemical Hazards (US) NIOSH REL : USA. NIOSH Recommended Exposure Limits OSHA P0 : USA. OSHA - TABLE Z-1 Limits for Air Contaminants -
1910.1000 OSHA Z-1 : USA. Occupational Exposure Limits (OSHA) - Table Z-1 Lim-
HEALTH
2 0
0
Flammability
Instability
Special hazard
FLAMMABILITY PHYSICAL HAZARD
/
2 0 0
Health
SAFETY DATA SHEET MasterSet DELVO
Version 1.1
Revision Date: 01/04/2021
SDS Number: 000000247307
Date of last issue: 04/23/2020 Date of first issue: 04/23/2020
10 / 11
its for Air Contaminants 29 CFR 1910.1000 (Table Z-1-A) / CLV
: Ceiling Limit Value: 29 CFR 1910.1000 (Table Z-1) / PEL
: Permissible exposure limit ACGIH / C : Ceiling limit ACGIHTLV / CLV : Ceiling Limit Value: NIOSH / Ceil_Time : Ceiling Limit Value and Time Period (if specified): NIOSH REL / C : Ceiling value not be exceeded at any time. OSHA P0 / C : Ceiling limit OSHA Z-1 / TWA : 8-hour time weighted average
AICS - Australian Inventory of Chemical Substances; ASTM - American Society for the Testing of Materials; bw - Body weight; CERCLA - Comprehensive Environmental Response, Compensa-tion, and Liability Act; CMR - Carcinogen, Mutagen or Reproductive Toxicant; DIN - Standard of the German Institute for Standardisation; DOT - Department of Transportation; DSL - Domestic Substances List (Canada); ECx - Concentration associated with x% response; EHS - Extremely Hazardous Substance; ELx - Loading rate associated with x% response; EmS - Emergency Schedule; ENCS - Existing and New Chemical Substances (Japan); ErCx - Concentration asso-ciated with x% growth rate response; ERG - Emergency Response Guide; GHS - Globally Har-monized System; GLP - Good Laboratory Practice; HMIS - Hazardous Materials Identification System; IARC - International Agency for Research on Cancer; IATA - International Air Transport Association; IBC - International Code for the Construction and Equipment of Ships carrying Dan-gerous Chemicals in Bulk; IC50 - Half maximal inhibitory concentration; ICAO - International Civil Aviation Organization; IECSC - Inventory of Existing Chemical Substances in China; IMDG - In-ternational Maritime Dangerous Goods; IMO - International Maritime Organization; ISHL - Indus-trial Safety and Health Law (Japan); ISO - International Organisation for Standardization; KECI - Korea Existing Chemicals Inventory; LC50 - Lethal Concentration to 50 % of a test population; LD50 - Lethal Dose to 50% of a test population (Median Lethal Dose); MARPOL - International Convention for the Prevention of Pollution from Ships; MSHA - Mine Safety and Health Admin-istration; n.o.s. - Not Otherwise Specified; NFPA - National Fire Protection Association; NO(A)EC - No Observed (Adverse) Effect Concentration; NO(A)EL - No Observed (Adverse) Effect Level; NOELR - No Observable Effect Loading Rate; NTP - National Toxicology Program; NZIoC - New Zealand Inventory of Chemicals; OECD - Organization for Economic Co-operation and Develop-ment; OPPTS - Office of Chemical Safety and Pollution Prevention; PBT - Persistent, Bioaccumu-lative and Toxic substance; PICCS - Philippines Inventory of Chemicals and Chemical Substanc-es; (Q)SAR - (Quantitative) Structure Activity Relationship; RCRA - Resource Conservation and Recovery Act; REACH - Regulation (EC) No 1907/2006 of the European Parliament and of the Council concerning the Registration, Evaluation, Authorisation and Restriction of Chemicals; RQ - Reportable Quantity; SADT - Self-Accelerating Decomposition Temperature; SARA - Superfund Amendments and Reauthorization Act; SDS - Safety Data Sheet; TCSI - Taiwan Chemical Sub-stance Inventory; TSCA - Toxic Substances Control Act (United States); UN - United Nations; UNRTDG - United Nations Recommendations on the Transport of Dangerous Goods; vPvB - Very Persistent and Very Bioaccumulative
Revision Date : 01/04/2021
We support worldwide Responsible Care® initiatives. We value the health and safety of our em-ployees, customers, suppliers and neighbors, and the protection of the environment. Our com-mitment to Responsible Care is integral to conducting our business and operating our facilities in a safe and environmentally responsible fashion, supporting our customers and suppliers in ensur-ing the safe and environmentally sound handling of our products, and minimizing the impact of
SAFETY DATA SHEET MasterSet DELVO
Version 1.1
Revision Date: 01/04/2021
SDS Number: 000000247307
Date of last issue: 04/23/2020 Date of first issue: 04/23/2020
11 / 11
our operations on society and the environment during production, storage, transport, use and dis-posal of our products. IMPORTANT: WHILE THE DESCRIPTIONS, DESIGNS, DATA AND INFORMATION CONTAINED HEREIN ARE PRESENTED IN GOOD FAITH AND BELIEVED TO BE ACCURATE , IT IS PROVIDED FOR YOUR GUIDANCE ONLY. BECAUSE MANY FACTORS MAY AFFECT PROCESSING OR APPLICATION/USE, WE RECOMMEND THAT YOU MAKE TESTS TO DETERMINE THE SUITABILITY OF A PRODUCT FOR YOUR PARTICULAR PURPOSE PRIOR TO USE. NO WARRANTIES OF ANY KIND, EITHER EXPRESSED OR IMPLIED, INCLUDING WARRANTIES OF MERCHANTABILITY OR FITNESS FOR A PARTICULAR PURPOSE, ARE MADE REGARDING PRODUCTS DESCRIBED OR DESIGNS, DATA OR INFORMATION SET FORTH, OR THAT THE PRODUCTS, DESIGNS, DATA OR INFORMATION MAY BE USED WITHOUT INFRINGING THE INTELLECTUAL PROPERTY RIGHTS OF OTHERS. IN NO CASE SHALL THE DESCRIPTIONS, INFORMATION, DATA OR DESIGNS PROVIDED BE CONSIDERED A PART OF OUR TERMS AND CONDITIONS OF SALE. FURTHER, YOU EXPRESSLY UNDERSTAND AND AGREE THAT THE DESCRIPTIONS, DESIGNS, DATA, AND INFORMATION FURNISHED BY OUR COMPANY HEREUNDER ARE GIVEN GRATIS AND WE ASSUME NO OBLIGATION OR LIABILITY FOR THE DESCRIPTION, DESIGNS, DATA AND INFORMATION GIVEN OR RESULTS OBTAINED, ALL SUCH BEING GIVEN AND ACCEPTED AT YOUR RISK.
US / EN
page 1 of 3
Features�� Reduced water content required for a given workability�� Retarded setting time characteristics�� Improved workability
Benefits�� Provides flexibility in the scheduling of placing and finishing operations�� Offsets the effects of slump loss during extended delays between mixing and placing�� Reduces waste associated with concrete washwater and returned concrete�� Increased strength – compressive and flexural
Performance CharacteristicsRate of Hardening: The temperature of a concrete mixture and the ambient temperature (forms, earth, air, etc.) affect the hardening rate of concrete. At higher temperatures, concrete hardens more rapidly which may cause problems with placing and finishing.One of the functions of MasterSet DELVO admixture is to retard the set of concrete. Within the normal dosage range, it will generally extend the working and setting times of concrete containing normal portland cement, fly ash, slag cement and silica fume approximately 1 hour to 5 hours compared to a plain concrete mixture. This depends on job materials and temperatures. Trial mixtures should be made under approximate job conditions to determine the dosage required.Compressive Strength: Concrete produced with MasterSet DELVO admixture will develop higher early (within 24 hours) and higher ultimate strengths than plain concrete when used within the recommended dosage range and under normal, comparable curing conditions. When MasterSet DELVO admixture is used in heat-cured concrete, the length of the preheating period should be increased until the initial set of the concrete is achieved. The actual heat-curing period is then reduced accordingly to maintain existing production cycles without sacrificing early or ultimate strengths.
DescriptionMasterSet DELVO ready-to-use, liquid admixture is used for making more uniform and predictable high-performance concrete. MasterSet DELVO admixture retards setting time by controlling the hydration of portland cement and other cementitious materials while facilitating placing and finishing operations. MasterSet DELVO admixture meets ASTM C 494/C 494M requirements for Type B, retarding, and Type D, water-reducing and retarding, admixtures.
ApplicationsRecommended for use in:�� Stabilization of concrete washwater�� Stabilization of returned plastic concrete�� Stabilization of freshly batched concrete for long hauls�� 4x4™ Concrete�� Pumped concrete, shotcrete (wet mix) and conventionally-placed concrete�� Plain, reinforced, precast, prestressed, lightweight and normal weight concrete�� Pervious concrete
MasterSet® DELVOHydration Controlling Admixture
303 30 00 Cast-in-Place Concrete
03 40 00 Precast Concrete
03 70 00 Mass Concrete
A brand of
MasterSet DELVO Technical Data Sheet
www.master-builders-solutions.com/en-us page 2 of 3
Guidelines for UseDosage: MasterSet DELVO admixture is recommended for use at a dosage of 4 ± 1 fl oz/cwt (260 ± 65 mL/100 kg) of cementitious materials for most concrete mixtures using average concrete ingredients. For long time-to-discharge applications, such as long hauls, dosages higher than the recommended range may be required. Specifically, for shotcrete applications, MasterSet DELVO admixture is recommended for use at a dosage of 1.5 fl oz/cwt to 25 fl oz/cwt (100 mL/100 kg to 1,500 mL/100 kg) of cementitious materials. Because of variations in job conditions and concrete materials, dosages other than the recommended amounts may be required. In such cases, contact your local sales representative. For concrete washwater and returned concrete stabilization, utilize MasterSet DELVO charts to determine the appropriate dosage rates.
Product NotesCorrosivity – Non-Chloride, Non-Corrosive: MasterSet DELVO admixture will neither initiate nor promote corrosion of reinforcing steel in concrete. This admixture does not contain intentionally-added calcium chloride or other chloride-based ingredients. Compatibility: MasterSet DELVO admixture may be used in combination with any Master Builders Solutions admixture. When used in conjunction with another admixture, each admixture must be dispensed separately into the mixture.CAUTION: While MasterSet DELVO and MasterLife CI 30 admixtures are compatible in the same concrete mixture when added separately, these two admixtures are NOT compatible in the same STORAGE TANK OR CONTAINER, in any ratio, as potentially harmful gas may result from blending the two. Contact a Master Builders Solutions representative if there are any questions regarding admixture storage or admixture compatibility.
Storage and HandlingStorage Temperature: MasterSet DELVO admixture should be stored above freezing temperatures. If MasterSet DELVO admixture freezes, thaw at 35 °F (2 °C) or above and completely reconstitute by mild mechanical agitation. Do not use pressurized air for agitation. Shelf Life: MasterSet DELVO admixture has a minimum shelf life of 12 months. Depending on storage conditions, the shelf life may be greater than stated. Please contact your local sales representative regarding suitability for use and dosage recommendations if the shelf life of MasterSet DELVO admixture has been exceeded.
PackagingMasterSet DELVO admixture is supplied in specially designed 55 gal (208 L) drums, 275 gal (1040 L) totes and by bulk delivery.
Related DocumentsSafety Data Sheets: MasterSet DELVO admixture
© MBCC Group � 04/21 � DAT-0021® registered trademark of a MBCC Group member in many countries of the world www.master-builders-solutions.com/en-us
Master Builders Solutions Admixtures US, LLC23700 Chagrin Boulevard Cleveland, Ohio 44122-5544 USA � 800-628-9990
Master Builders Solutions Canada, Inc. 1800 Clark BoulevardBrampton, Ontario L6T 4M7 CANADA � 289-360-1300 page 3 of 3
MasterSet DELVO Technical Data Sheet
Additional InformationFor more information on MasterSet DELVO admixture, contact your local sales representative.Master Builders Solutions, a brand of MBCC Group, is a global leader of innovative chemistry systems and formulations for construction, maintenance, repair and restoration of structures. The Admixture Systems business provides advanced products, solutions and expertise that improve durability, water resistance, energy efficiency, safety, sustainability and aesthetics of concrete structures, above and below ground, helping customers to achieve reduced operating costs, improved efficiency and enhanced finished products. Utilizing worldwide resources, the Master Builders Solutions community of experts are passionate about providing solutions to challenges within all stages of construction, as well as the life cycle of a structure. At Master Builders Solutions we create sustainable solutions for construction around the globe.
Limited Warranty NoticeMaster Builders Solutions Admixtures US, LLC (“Master Builders Solutions”) warrants this product to be free from manufacturing defects and to meet the technical properties on the current Technical Data Guide, if used as directed within shelf life. Satisfactory results depend not only on quality products but also upon many factors beyond our control. MASTER BUILDERS SOLUTIONS MAKES NO OTHER WARRANTY OR GUARANTEE, EXPRESS OR IMPLIED, INCLUDING WARRANTIES OF MERCHANTABILITY OR FITNESS FOR A PARTICULAR PURPOSE WITH RESPECT TO ITS PRODUCTS. The sole and exclusive remedy of Purchaser for any claim concerning this product, including but not limited to, claims alleging breach of warranty, negligence, strict liability or otherwise, is shipment to purchaser of product equal to the amount of product that fails to meet this warranty or refund of the original purchase price of product that fails to meet this warranty, at the sole option of Master Builders Solutions. Any claims concerning this product must be received in writing within one (1) year from the date of shipment and any claims not presented within that period are waived by Purchaser. MASTER BUILDERS SOLUTIONS WILL NOT BE RESPONSIBLE FOR ANY SPECIAL, INCIDENTAL, CONSEQUENTIAL (INCLUDING LOST PROFITS) OR PUNITIVE DAMAGES OF ANY KIND.Purchaser must determine the suitability of the products for the intended use and assumes all risks and liabilities in connection therewith. This information and all further technical advice are based on Master Builders Solutions' present knowledge and experience. However, Master Builders Solutions assumes no liability for providing such information and advice including the extent to which such information and advice may relate to existing third party intellectual property rights, especially patent rights, nor shall any legal relationship be created by or arise from the provision of such information and advice. Master Builders Solutions reserves the right to make any changes according to technological progress or further developments. The Purchaser of the Product(s) must test the product(s) for suitability for the intended application and purpose before proceeding with a full application of the product(s). Performance of the product described herein should be verified by testing and carried out by qualified experts.
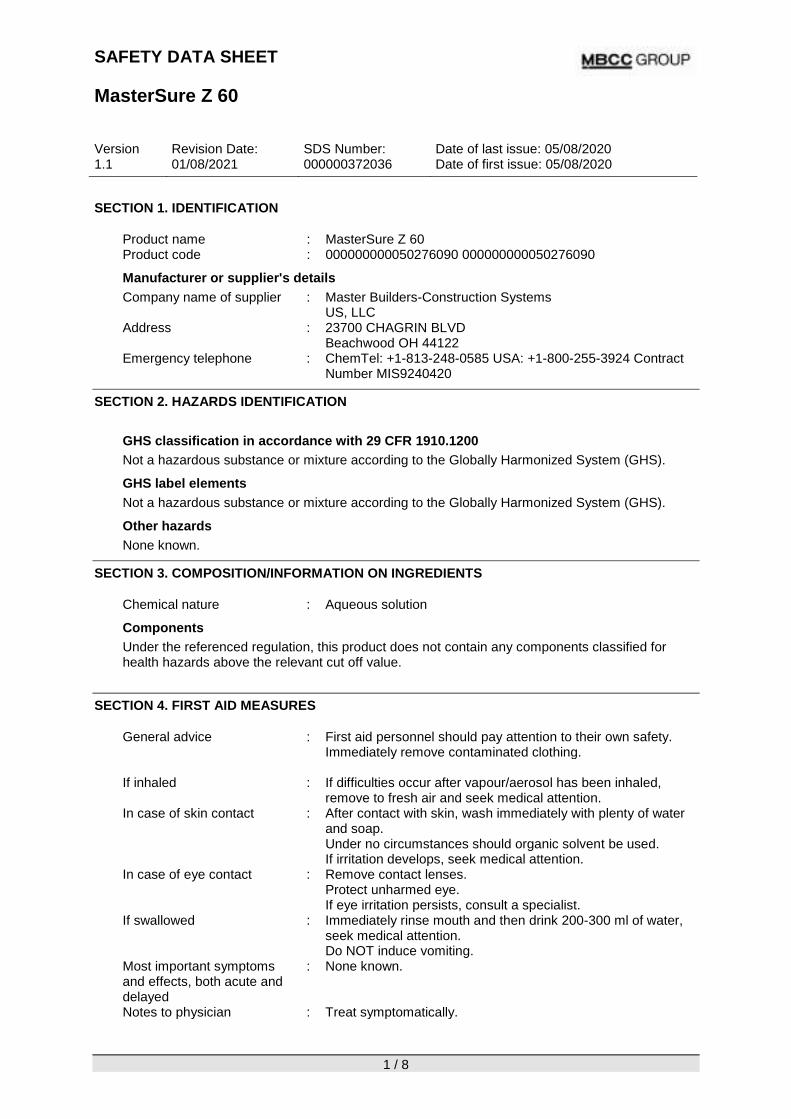
SAFETY DATA SHEET MasterSure Z 60
Version 1.1
Revision Date: 01/08/2021
SDS Number: 000000372036
Date of last issue: 05/08/2020 Date of first issue: 05/08/2020
1 / 8
SECTION 1. IDENTIFICATION
Product name : MasterSure Z 60 Product code : 000000000050276090 000000000050276090 Manufacturer or supplier's details Company name of supplier : Master Builders-Construction Systems
US, LLC Address : 23700 CHAGRIN BLVD Beachwood OH 44122 Emergency telephone : ChemTel: +1-813-248-0585 USA: +1-800-255-3924 Contract Number MIS9240420
SECTION 2. HAZARDS IDENTIFICATION
GHS classification in accordance with 29 CFR 1910.1200 Not a hazardous substance or mixture according to the Globally Harmonized System (GHS). GHS label elements Not a hazardous substance or mixture according to the Globally Harmonized System (GHS). Other hazards None known.
SECTION 3. COMPOSITION/INFORMATION ON INGREDIENTS
Chemical nature : Aqueous solution Components Under the referenced regulation, this product does not contain any components classified for health hazards above the relevant cut off value.
SECTION 4. FIRST AID MEASURES
General advice : First aid personnel should pay attention to their own safety. Immediately remove contaminated clothing.
If inhaled : If difficulties occur after vapour/aerosol has been inhaled,
remove to fresh air and seek medical attention. In case of skin contact : After contact with skin, wash immediately with plenty of water and soap. Under no circumstances should organic solvent be used. If irritation develops, seek medical attention. In case of eye contact : Remove contact lenses. Protect unharmed eye. If eye irritation persists, consult a specialist. If swallowed : Immediately rinse mouth and then drink 200-300 ml of water, seek medical attention. Do NOT induce vomiting. Most important symptoms
and effects, both acute and delayed
: None known.
Notes to physician : Treat symptomatically.
SAFETY DATA SHEET MasterSure Z 60
Version 1.1
Revision Date: 01/08/2021
SDS Number: 000000372036
Date of last issue: 05/08/2020 Date of first issue: 05/08/2020
2 / 8
SECTION 5. FIRE-FIGHTING MEASURES
Suitable extinguishing media : Foam Water spray Dry powder Carbon dioxide (CO2) Unsuitable extinguishing
media : water jet
Specific hazards during fire fighting
: See SDS section 10 - Stability and reactivity.
Hazardous combustion prod-ucts
: harmful vapours nitrogen oxides fumes/smoke carbon black carbon oxides
Further information : Standard procedure for chemical fires. Use extinguishing measures that are appropriate to local cir-cumstances and the surrounding environment. Special protective equipment
for fire-fighters : Wear self-contained breathing apparatus for firefighting if nec-
essary. SECTION 6. ACCIDENTAL RELEASE MEASURES
Personal precautions, protec-tive equipment and emer-gency procedures
: Do not breathe vapour/aerosol/spray mists. Wear eye/face protection. If exposed to high vapour concentration, leave area immedi-ately. Use personal protective clothing. Handle in accordance with good building materials hygiene and safety practice.
Environmental precautions
: If the product contaminates rivers and lakes or drains inform respective authorities.
Methods and materials for containment and cleaning up
: Wipe up with absorbent material (e.g. cloth, fleece). Keep in suitable, closed containers for disposal.
SECTION 7. HANDLING AND STORAGE
Advice on protection against fire and explosion
: Normal measures for preventive fire protection.
Advice on safe handling : For personal protection see section 8. Smoking, eating and drinking should be prohibited in the ap-plication area. Conditions for safe storage : Electrical installations / working materials must comply with the technological safety standards. Further information on stor-
age conditions
: Keep only in the original container in a cool, dry, well-ventilated place away from ignition sources, heat or flame. Protect from direct sunlight.
Materials to avoid : No materials to be especially mentioned.
SAFETY DATA SHEET MasterSure Z 60
Version 1.1
Revision Date: 01/08/2021
SDS Number: 000000372036
Date of last issue: 05/08/2020 Date of first issue: 05/08/2020
3 / 8
Further information on stor-age stability
: No decomposition if stored and applied as directed.
SECTION 8. EXPOSURE CONTROLS/PERSONAL PROTECTION
Ingredients with workplace control parameters Contains no substances with occupational exposure limit values. Engineering measures : Ensure adequate ventilation. Personal protective equipment Respiratory protection : Wear respiratory protection if ventilation is inadequate. Hand protection
Remarks : Wear chemical resistant protective gloves. Manufacturer's
directions for use should be observed because of great di-versity of types. Eye protection : Safety glasses Skin and body protection : Protective suit Protective measures : Do not inhale gases/vapours/aerosols. Avoid contact with the skin, eyes and clothing. Avoid exposure - obtain special instructions before use. Handle in accordance with good building materials hygiene and safety practice. Wearing of closed work clothing is recommended. Hygiene measures : General industrial hygiene practice.
SECTION 9. PHYSICAL AND CHEMICAL PROPERTIES
Appearance : liquid Color : brown Odor : characteristic Odor Threshold : not determined
pH : approx. 6 (68 °F / 20 °C)
Melting point : No applicable information available.
Boiling point : No applicable information available.
Flash point : A flash point determination is unnecessary due to the high water content.
Evaporation rate : not determined
Flammability (liquids) : The product is not flammable.
Vapor pressure : No applicable information available.
Relative vapor density : not determined
Relative density : approx. 1.043 (68 °F / 20 °C)
SAFETY DATA SHEET MasterSure Z 60
Version 1.1
Revision Date: 01/08/2021
SDS Number: 000000372036
Date of last issue: 05/08/2020 Date of first issue: 05/08/2020
4 / 8
Density : approx. 1.04 g/cm3 (approx. 68 °F / 20 °C)
Solubility(ies)
Water solubility : completely soluble (59 °F / 15 °C)
Solubility in other solvents : No applicable information available.
Partition coefficient: n-octanol/water
: No applicable information available.
Autoignition temperature : No data available
Decomposition temperature : No decomposition if stored and handled as pre-scribed/indicated.
Viscosity Viscosity, dynamic : not determined
Viscosity, kinematic : not determined
Explosive properties : Not explosive
Not explosive
Oxidizing properties : Based on its structural properties the product is not classified as oxidizing.
Sublimation point : No applicable information available.
Molecular weight : No data available
Metal corrosion rate : Corrosive effects to metal are not anticipated.
SECTION 10. STABILITY AND REACTIVITY
Reactivity : No hazardous reactions if stored and handled as pre-scribed/indicated. Chemical stability : The product is stable if stored and handled as pre-scribed/indicated. Possibility of hazardous reac-
tions : Stable under recommended storage conditions.
No hazards to be specially mentioned.
Conditions to avoid : See SDS section 7 - Handling and storage. Incompatible materials : Strong acids Strong bases Strong oxidizing agents Strong reducing agents Hazardous decomposition
products : No hazardous decomposition products if stored and handled
as prescribed/indicated. SECTION 11. TOXICOLOGICAL INFORMATION
Acute toxicity Not classified based on available information.
SAFETY DATA SHEET MasterSure Z 60
Version 1.1
Revision Date: 01/08/2021
SDS Number: 000000372036
Date of last issue: 05/08/2020 Date of first issue: 05/08/2020
5 / 8
Product: Acute oral toxicity : Remarks: No applicable information available.
Acute inhalation toxicity : Remarks: No applicable information available.
Acute dermal toxicity : Remarks: No applicable information available.
Skin corrosion/irritation Not classified based on available information. Serious eye damage/eye irritation Not classified based on available information. Respiratory or skin sensitization
Skin sensitization Not classified based on available information. Respiratory sensitization Not classified based on available information. Germ cell mutagenicity Not classified based on available information. Carcinogenicity Not classified based on available information. Reproductive toxicity Not classified based on available information. STOT-single exposure Not classified based on available information. STOT-repeated exposure Not classified based on available information. Aspiration toxicity Not classified based on available information. Further information
Product: Remarks : Health injuries are not known or expected under normal use.
The product has not been tested. The statements on toxicolo-gy have been derived from the properties of the individual components.
SECTION 12. ECOLOGICAL INFORMATION
Ecotoxicity No data available Persistence and degradability No data available
SAFETY DATA SHEET MasterSure Z 60
Version 1.1
Revision Date: 01/08/2021
SDS Number: 000000372036
Date of last issue: 05/08/2020 Date of first issue: 05/08/2020
6 / 8
Bioaccumulative potential No data available Mobility in soil No data available Other adverse effects
Product: Additional ecological infor-mation
: There is a high probability that the product is not acutely harmful to aquatic organisms. The product has not been tested. The statements on ecotoxi-cology have been derived from the properties of the individual components.
SECTION 13. DISPOSAL CONSIDERATIONS
Disposal methods Waste from residues : Dispose of in accordance with national, state and local regula-
tions. Do not discharge into drains/surface waters/groundwater. Do not contaminate ponds, waterways or ditches with chemi-cal or used container. Contaminated packaging : Contaminated packaging should be emptied as far as possible and disposed of in the same manner as the sub-stance/product.
SECTION 14. TRANSPORT INFORMATION
International Regulations
UNRTDG Not regulated as a dangerous good IATA-DGR Not regulated as a dangerous good IMDG-Code Not regulated as a dangerous good Transport in bulk according to Annex II of MARPOL 73/78 and the IBC Code Not applicable for product as supplied. Domestic regulation
49 CFR Not regulated as a dangerous good
SECTION 15. REGULATORY INFORMATION
California Prop. 65 WARNING: This product can expose you to chemicals including ethylene oxide, which is/are known to the State of California to cause cancer and birth defects or other reproductive harm. For more information go to www.P65Warnings.ca.gov.
SAFETY DATA SHEET MasterSure Z 60
Version 1.1
Revision Date: 01/08/2021
SDS Number: 000000372036
Date of last issue: 05/08/2020 Date of first issue: 05/08/2020
7 / 8
The ingredients of this product are reported in the following inventories: DSL
: This product contains the following components listed on the Canadian NDSL. All other components are on the Canadian DSL. 2,2-Dibromo-2-cyanoacetamide
TSCA
: All chemical substances in this product are either listed as active on the TSCA Inventory or are in compliance with a TSCA Inventory exemption.
SECTION 16. OTHER INFORMATION
Further information
NFPA 704: HMIS® IV:
HMIS® ratings are based on a 0-4 rating scale, with 0 representing minimal haz-ards or risks, and 4 representing signifi-cant hazards or risks. The "*" represents a chronic hazard, while the "/" represents the absence of a chronic hazard.
Full text of other abbreviations
AICS - Australian Inventory of Chemical Substances; ASTM - American Society for the Testing of Materials; bw - Body weight; CERCLA - Comprehensive Environmental Response, Compensa-tion, and Liability Act; CMR - Carcinogen, Mutagen or Reproductive Toxicant; DIN - Standard of the German Institute for Standardisation; DOT - Department of Transportation; DSL - Domestic Substances List (Canada); ECx - Concentration associated with x% response; EHS - Extremely Hazardous Substance; ELx - Loading rate associated with x% response; EmS - Emergency Schedule; ENCS - Existing and New Chemical Substances (Japan); ErCx - Concentration asso-ciated with x% growth rate response; ERG - Emergency Response Guide; GHS - Globally Har-monized System; GLP - Good Laboratory Practice; HMIS - Hazardous Materials Identification System; IARC - International Agency for Research on Cancer; IATA - International Air Transport Association; IBC - International Code for the Construction and Equipment of Ships carrying Dan-gerous Chemicals in Bulk; IC50 - Half maximal inhibitory concentration; ICAO - International Civil Aviation Organization; IECSC - Inventory of Existing Chemical Substances in China; IMDG - In-ternational Maritime Dangerous Goods; IMO - International Maritime Organization; ISHL - Indus-trial Safety and Health Law (Japan); ISO - International Organisation for Standardization; KECI - Korea Existing Chemicals Inventory; LC50 - Lethal Concentration to 50 % of a test population; LD50 - Lethal Dose to 50% of a test population (Median Lethal Dose); MARPOL - International
HEALTH
1 0
0
Flammability
Instability
Special hazard
FLAMMABILITY PHYSICAL HAZARD
Health
SAFETY DATA SHEET MasterSure Z 60
Version 1.1
Revision Date: 01/08/2021
SDS Number: 000000372036
Date of last issue: 05/08/2020 Date of first issue: 05/08/2020
8 / 8
Convention for the Prevention of Pollution from Ships; MSHA - Mine Safety and Health Admin-istration; n.o.s. - Not Otherwise Specified; NFPA - National Fire Protection Association; NO(A)EC - No Observed (Adverse) Effect Concentration; NO(A)EL - No Observed (Adverse) Effect Level; NOELR - No Observable Effect Loading Rate; NTP - National Toxicology Program; NZIoC - New Zealand Inventory of Chemicals; OECD - Organization for Economic Co-operation and Develop-ment; OPPTS - Office of Chemical Safety and Pollution Prevention; PBT - Persistent, Bioaccumu-lative and Toxic substance; PICCS - Philippines Inventory of Chemicals and Chemical Substanc-es; (Q)SAR - (Quantitative) Structure Activity Relationship; RCRA - Resource Conservation and Recovery Act; REACH - Regulation (EC) No 1907/2006 of the European Parliament and of the Council concerning the Registration, Evaluation, Authorisation and Restriction of Chemicals; RQ - Reportable Quantity; SADT - Self-Accelerating Decomposition Temperature; SARA - Superfund Amendments and Reauthorization Act; SDS - Safety Data Sheet; TCSI - Taiwan Chemical Sub-stance Inventory; TSCA - Toxic Substances Control Act (United States); UN - United Nations; UNRTDG - United Nations Recommendations on the Transport of Dangerous Goods; vPvB - Very Persistent and Very Bioaccumulative
Revision Date : 01/08/2021
We support worldwide Responsible Care® initiatives. We value the health and safety of our em-ployees, customers, suppliers and neighbors, and the protection of the environment. Our com-mitment to Responsible Care is integral to conducting our business and operating our facilities in a safe and environmentally responsible fashion, supporting our customers and suppliers in ensur-ing the safe and environmentally sound handling of our products, and minimizing the impact of our operations on society and the environment during production, storage, transport, use and dis-posal of our products. IMPORTANT: WHILE THE DESCRIPTIONS, DESIGNS, DATA AND INFORMATION CONTAINED HEREIN ARE PRESENTED IN GOOD FAITH AND BELIEVED TO BE ACCURATE , IT IS PROVIDED FOR YOUR GUIDANCE ONLY. BECAUSE MANY FACTORS MAY AFFECT PROCESSING OR APPLICATION/USE, WE RECOMMEND THAT YOU MAKE TESTS TO DETERMINE THE SUITABILITY OF A PRODUCT FOR YOUR PARTICULAR PURPOSE PRIOR TO USE. NO WARRANTIES OF ANY KIND, EITHER EXPRESSED OR IMPLIED, INCLUDING WARRANTIES OF MERCHANTABILITY OR FITNESS FOR A PARTICULAR PURPOSE, ARE MADE REGARDING PRODUCTS DESCRIBED OR DESIGNS, DATA OR INFORMATION SET FORTH, OR THAT THE PRODUCTS, DESIGNS, DATA OR INFORMATION MAY BE USED WITHOUT INFRINGING THE INTELLECTUAL PROPERTY RIGHTS OF OTHERS. IN NO CASE SHALL THE DESCRIPTIONS, INFORMATION, DATA OR DESIGNS PROVIDED BE CONSIDERED A PART OF OUR TERMS AND CONDITIONS OF SALE. FURTHER, YOU EXPRESSLY UNDERSTAND AND AGREE THAT THE DESCRIPTIONS, DESIGNS, DATA, AND INFORMATION FURNISHED BY OUR COMPANY HEREUNDER ARE GIVEN GRATIS AND WE ASSUME NO OBLIGATION OR LIABILITY FOR THE DESCRIPTION, DESIGNS, DATA AND INFORMATION GIVEN OR RESULTS OBTAINED, ALL SUCH BEING GIVEN AND ACCEPTED AT YOUR RISK.
US / EN

page 1 of 3
Features�� Provides flexible degrees of slump and workability retention without retardation�� Can be used in low- to high-slump concrete mixtures, including self-consolidating concrete�� Can be used alone or in combination with MasterPozzolith®, MasterPolyheed® or MasterGlenium® normal, mid-range and high-range water-reducing admixtures�� Improved early- and late-age compressive strengths
Benefits�� Minimizes the need for jobsite slump adjustment using water or high-range water-reducing admixture�� Provides consistency in air-entrainment, slump, workability and strength�� Fewer rejected loads and better customer satisfaction due to consistent quality of concrete�� Faster truck turn-around time�� Expanded concrete delivery range�� Provides concrete producers with ability to consistently produce and deliver quality concrete mixtures
DescriptionMasterSure Z 60 admixture is a workability-retaining admixture that provides flexible degrees of slump retention without retardation. MasterSure Z 60 admixture provides concrete producers a cost-effective means of maintaining consistency between loads of concrete with respect to slump, workability and air content. MasterSure Z 60 admixture meets ASTM C 494/C 494M requirements for Type S, Specific Performance, admixtures.
ApplicationsRecommended for use in:�� Concrete with varied slump retention requirements �� Concrete mixtures utilizing supplementary cementitious materials�� Concrete where high flowability, increased stability and durability are needed�� Production of self-consolidating concrete (SCC) mixtures
MasterSure® Z 60Workability-Retaining Admixture
34
03 30 00 Cast-in-Place Concrete
03 40 00 Precast Concrete
03 70 00 Mass Concrete
04 05 16 Masonry Grouting
A brand of
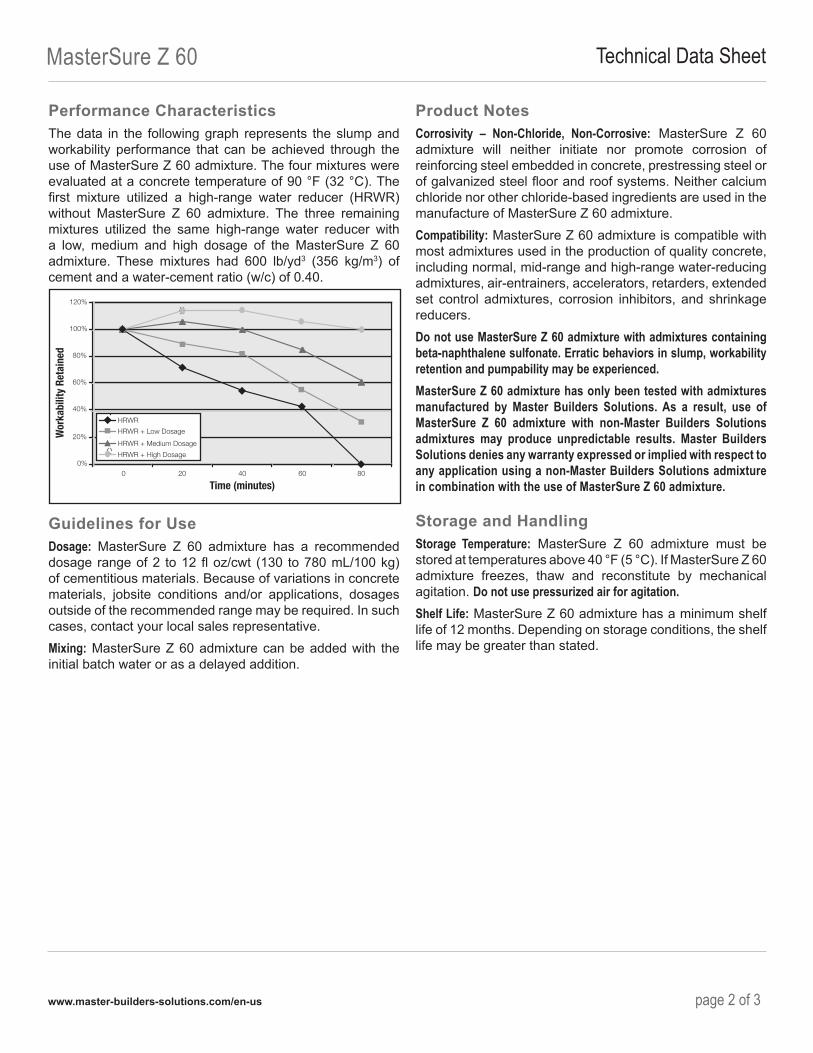
MasterSure Z 60 Technical Data Sheet
www.master-builders-solutions.com/en-us page 2 of 3
Performance CharacteristicsThe data in the following graph represents the slump and workability performance that can be achieved through the use of MasterSure Z 60 admixture. The four mixtures were evaluated at a concrete temperature of 90 °F (32 °C). The first mixture utilized a high-range water reducer (HRWR) without MasterSure Z 60 admixture. The three remaining mixtures utilized the same high-range water reducer with a low, medium and high dosage of the MasterSure Z 60 admixture. These mixtures had 600 lb/yd3 (356 kg/m3) of cement and a water-cement ratio (w/c) of 0.40.
0%
20%
40%
60%
80%
100%
120%
0 20 40 60 80
Time (minutes)
Wor
kabi
lity
Reta
ined
HRWR
HRWR + Low Dosage
HRWR + Medium Dosage
HRWR + High Dosage
Guidelines for UseDosage: MasterSure Z 60 admixture has a recommended dosage range of 2 to 12 fl oz/cwt (130 to 780 mL/100 kg) of cementitious materials. Because of variations in concrete materials, jobsite conditions and/or applications, dosages outside of the recommended range may be required. In such cases, contact your local sales representative.Mixing: MasterSure Z 60 admixture can be added with the initial batch water or as a delayed addition.
Product NotesCorrosivity – Non-Chloride, Non-Corrosive: MasterSure Z 60 admixture will neither initiate nor promote corrosion of reinforcing steel embedded in concrete, prestressing steel or of galvanized steel floor and roof systems. Neither calcium chloride nor other chloride-based ingredients are used in the manufacture of MasterSure Z 60 admixture.Compatibility: MasterSure Z 60 admixture is compatible with most admixtures used in the production of quality concrete, including normal, mid-range and high-range water-reducing admixtures, air-entrainers, accelerators, retarders, extended set control admixtures, corrosion inhibitors, and shrinkage reducers.Do not use MasterSure Z 60 admixture with admixtures containing beta-naphthalene sulfonate. Erratic behaviors in slump, workability retention and pumpability may be experienced.MasterSure Z 60 admixture has only been tested with admixtures manufactured by Master Builders Solutions. As a result, use of MasterSure Z 60 admixture with non-Master Builders Solutions admixtures may produce unpredictable results. Master Builders Solutions denies any warranty expressed or implied with respect to any application using a non-Master Builders Solutions admixture in combination with the use of MasterSure Z 60 admixture.
Storage and HandlingStorage Temperature: MasterSure Z 60 admixture must be stored at temperatures above 40 °F (5 °C). If MasterSure Z 60 admixture freezes, thaw and reconstitute by mechanical agitation. Do not use pressurized air for agitation. Shelf Life: MasterSure Z 60 admixture has a minimum shelf life of 12 months. Depending on storage conditions, the shelf life may be greater than stated.
MasterSure Z 60 Technical Data Sheet
© MBCC Group � 04/21 � DAT-0492® registered trademark of a MBCC Group member in many countries of the world www.master-builders-solutions.com/en-us
Master Builders Solutions Admixtures US, LLC23700 Chagrin Boulevard Cleveland, Ohio 44122-5544 USA � 800-628-9990
Master Builders Solutions Canada, Inc. 1800 Clark BoulevardBrampton, Ontario L6T 4M7 CANADA � 289-360-1300 page 3 of 3
PackagingMasterSure Z 60 admixture is supplied in 55 gal (208 L) drums, 275 gal (1040 L) totes and by bulk delivery.
Related DocumentsSafety Data Sheets: MasterSure Z 60 admixture
Additional InformationFor additional information on MasterSure Z 60 admixture or on its use in developing concrete mixtures with special performance characteristics, contact your local sales representative.Master Builders Solutions, a brand of MBCC Group, is a global leader of innovative chemistry systems and formulations for construction, maintenance, repair and restoration of structures. The Admixture Systems business provides advanced products, solutions and expertise that improve durability, water resistance, energy efficiency, safety, sustainability and aesthetics of concrete structures, above and below ground, helping customers to achieve reduced operating costs, improved efficiency and enhanced finished products. Utilizing worldwide resources, the Master Builders Solutions community of experts are passionate about providing solutions to challenges within all stages of construction, as well as the life cycle of a structure. At Master Builders Solutions we create sustainable solutions for construction around the globe.
Limited Warranty NoticeMaster Builders Solutions Admixtures US, LLC (“Master Builders Solutions”) warrants this product to be free from manufacturing defects and to meet the technical properties on the current Technical Data Guide, if used as directed within shelf life. Satisfactory results depend not only on quality products but also upon many factors beyond our control. MASTER BUILDERS SOLUTIONS MAKES NO OTHER WARRANTY OR GUARANTEE, EXPRESS OR IMPLIED, INCLUDING WARRANTIES OF MERCHANTABILITY OR FITNESS FOR A PARTICULAR PURPOSE WITH RESPECT TO ITS PRODUCTS. The sole and exclusive remedy of Purchaser for any claim concerning this product, including but not limited to, claims alleging breach of warranty, negligence, strict liability or otherwise, is shipment to purchaser of product equal to the amount of product that fails to meet this warranty or refund of the original purchase price of product that fails to meet this warranty, at the sole option of Master Builders Solutions. Any claims concerning this product must be received in writing within one (1) year from the date of shipment and any claims not presented within that period are waived by Purchaser. MASTER BUILDERS SOLUTIONS WILL NOT BE RESPONSIBLE FOR ANY SPECIAL, INCIDENTAL, CONSEQUENTIAL (INCLUDING LOST PROFITS) OR PUNITIVE DAMAGES OF ANY KIND.Purchaser must determine the suitability of the products for the intended use and assumes all risks and liabilities in connection therewith. This information and all further technical advice are based on Master Builders Solutions' present knowledge and experience. However, Master Builders Solutions assumes no liability for providing such information and advice including the extent to which such information and advice may relate to existing third party intellectual property rights, especially patent rights, nor shall any legal relationship be created by or arise from the provision of such information and advice. Master Builders Solutions reserves the right to make any changes according to technological progress or further developments. The Purchaser of the Product(s) must test the product(s) for suitability for the intended application and purpose before proceeding with a full application of the product(s). Performance of the product described herein should be verified by testing and carried out by qualified experts.

Appendix H
Grouting Distance Calculations
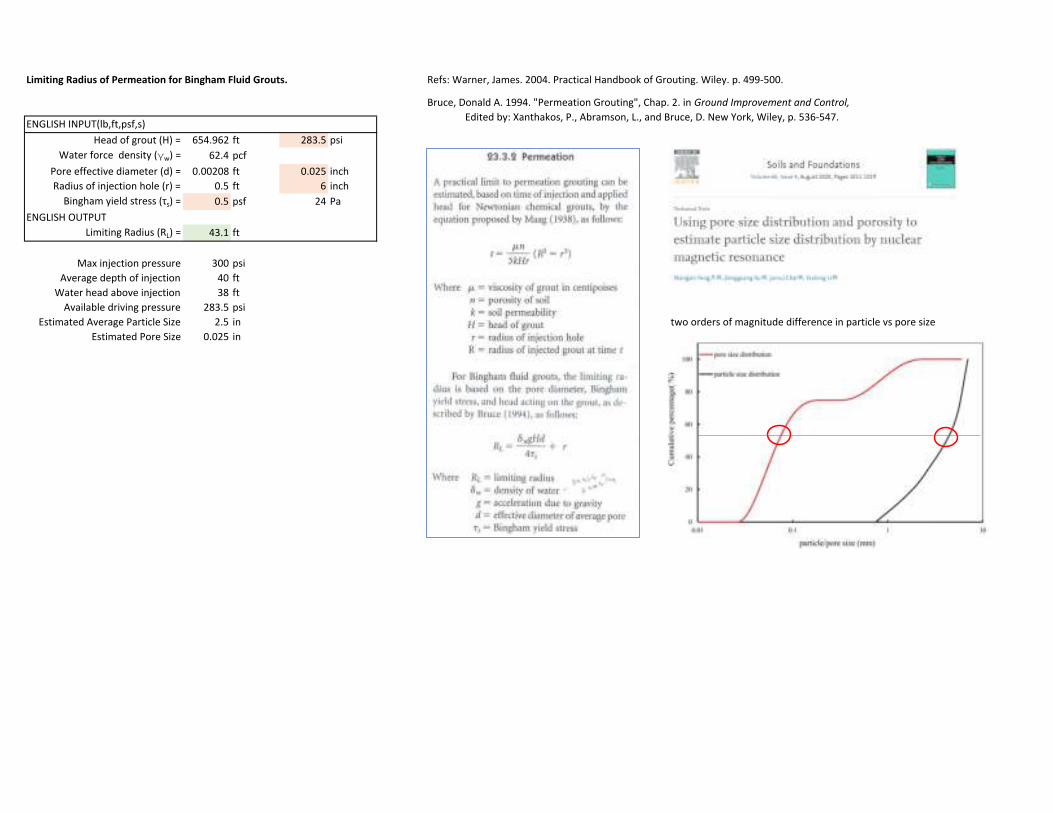
Limiting Radius of Permeation for Bingham Fluid Grouts. Refs: Warner, James. 2004. Practical Handbook of Grouting. Wiley. p. 499‐500.
ENGLISH INPUT(lb,ft,psf,s)
Head of grout (H) = 654.962 ft 283.5 psi
Water force density (γw) = 62.4 pcf
Pore effective diameter (d) = 0.00208 ft 0.025 inch
Radius of injection hole (r) = 0.5 ft 6 inch
Bingham yield stress (τs) = 0.5 psf 24 Pa
ENGLISH OUTPUT
Limiting Radius (RL) = 43.1 ft
Max injection pressure 300 psi
Average depth of injection 40 ft
Water head above injection 38 ft
Available driving pressure 283.5 psi
Estimated Average Particle Size 2.5 in two orders of magnitude difference in particle vs pore size
Estimated Pore Size 0.025 in
Bruce, Donald A. 1994. "Permeation Grouting", Chap. 2. in Ground Improvement and Control, Edited by: Xanthakos, P., Abramson, L., and Bruce, D. New York, Wiley, p. 536‐547.
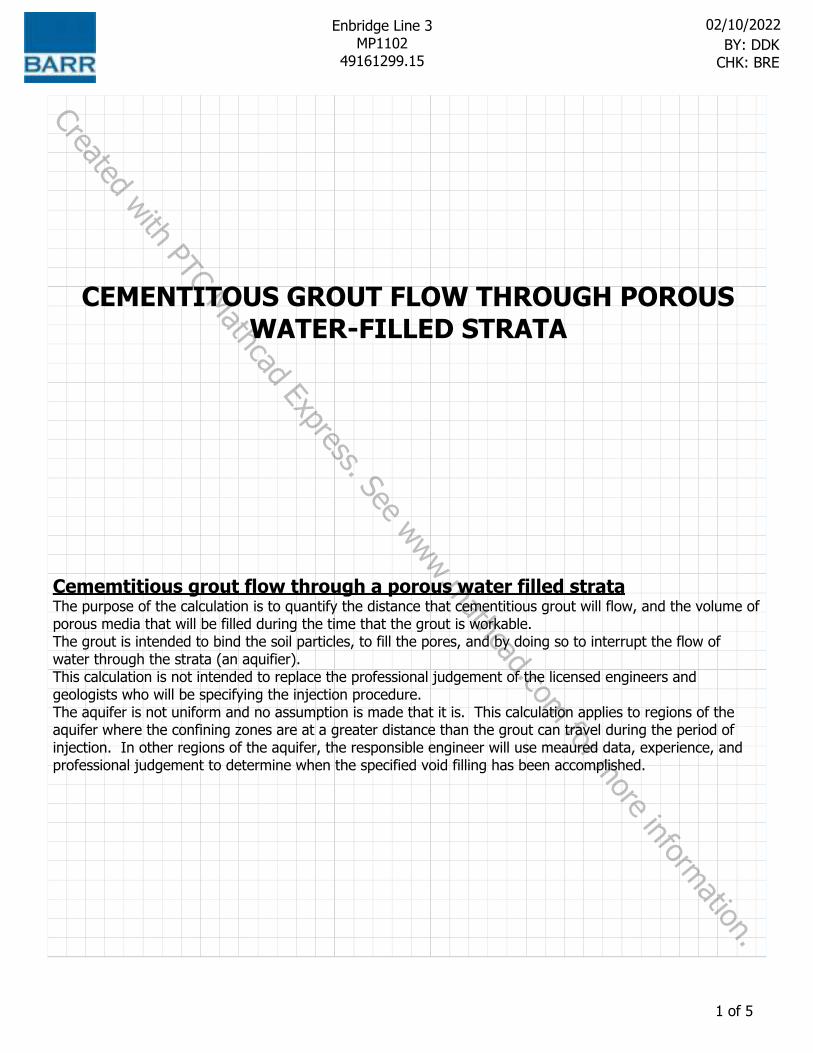
Enbridge Line 3MP1102
49161299.15
02/10/2022BY: DDK
CHK: BRE
Created with PTC Mathcad Express. See www.mathcad.com
for more inform
ation.
CEMENTITOUS GROUT FLOW THROUGH POROUS WATER-FILLED STRATA
Cememtitious grout flow through a porous water filled strataThe purpose of the calculation is to quantify the distance that cementitious grout will flow, and the volume of porous media that will be filled during the time that the grout is workable.The grout is intended to bind the soil particles, to fill the pores, and by doing so to interrupt the flow of water through the strata (an aquifier).This calculation is not intended to replace the professional judgement of the licensed engineers and geologists who will be specifying the injection procedure.The aquifer is not uniform and no assumption is made that it is. This calculation applies to regions of the aquifer where the confining zones are at a greater distance than the grout can travel during the period of injection. In other regions of the aquifer, the responsible engineer will use meaured data, experience, and professional judgement to determine when the specified void filling has been accomplished.
Input Parameters
1 of 5
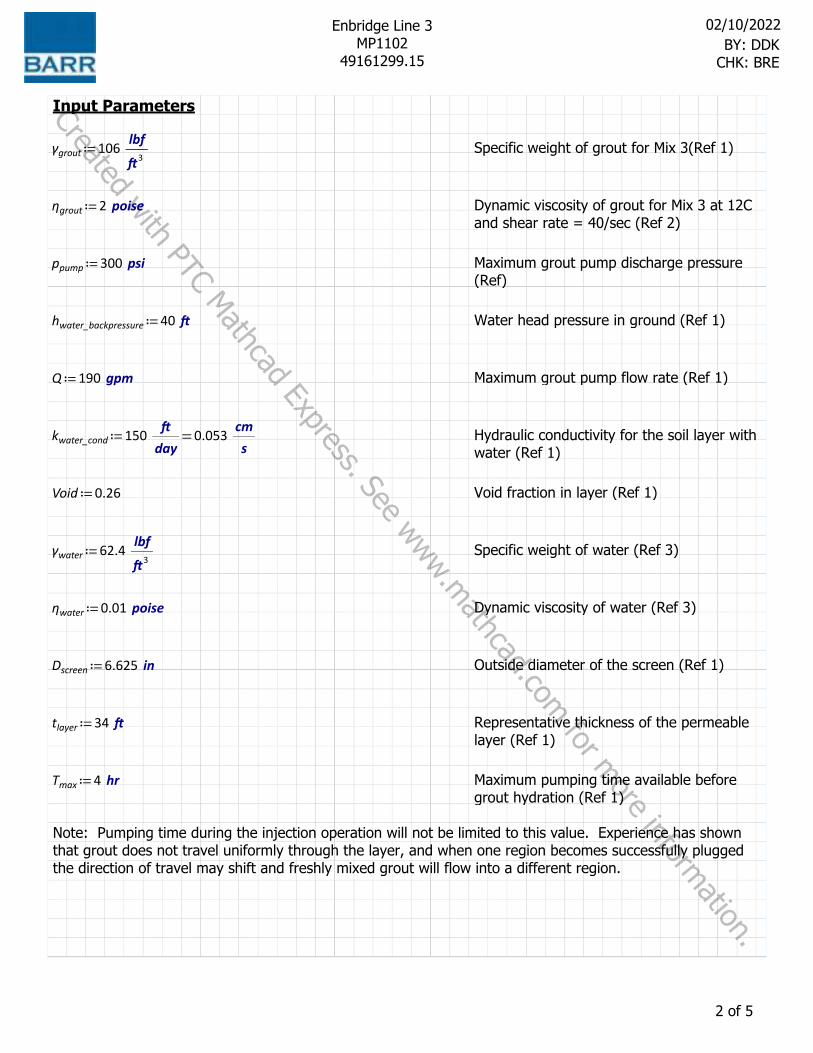
Enbridge Line 3MP1102
49161299.15
02/10/2022BY: DDK
CHK: BRE
Created with PTC Mathcad Express. See www.mathcad.com
for more inform
ation.Input Parameters
≔γgrout 106 ――lbf
ft3Specific weight of grout for Mix 3(Ref 1)
≔ηgrout 2 poise Dynamic viscosity of grout for Mix 3 at 12C and shear rate = 40/sec (Ref 2)
≔ppump 300 psi Maximum grout pump discharge pressure (Ref)
≔hwater_backpressure 40 ft Water head pressure in ground (Ref 1)
≔Q 190 gpm Maximum grout pump flow rate (Ref 1)
≔kwater_cond =150 ――ftday
0.053 ――cms
Hydraulic conductivity for the soil layer with water (Ref 1)
≔Void 0.26 Void fraction in layer (Ref 1)
≔γwater 62.4 ――lbf
ft3Specific weight of water (Ref 3)
≔ηwater 0.01 poise Dynamic viscosity of water (Ref 3)
≔Dscreen 6.625 in Outside diameter of the screen (Ref 1)
≔tlayer 34 ft Representative thickness of the permeable layer (Ref 1)
≔Tmax 4 hr Maximum pumping time available before grout hydration (Ref 1)
Note: Pumping time during the injection operation will not be limited to this value. Experience has shown that grout does not travel uniformly through the layer, and when one region becomes successfully plugged the direction of travel may shift and freshly mixed grout will flow into a different region.
2 of 5
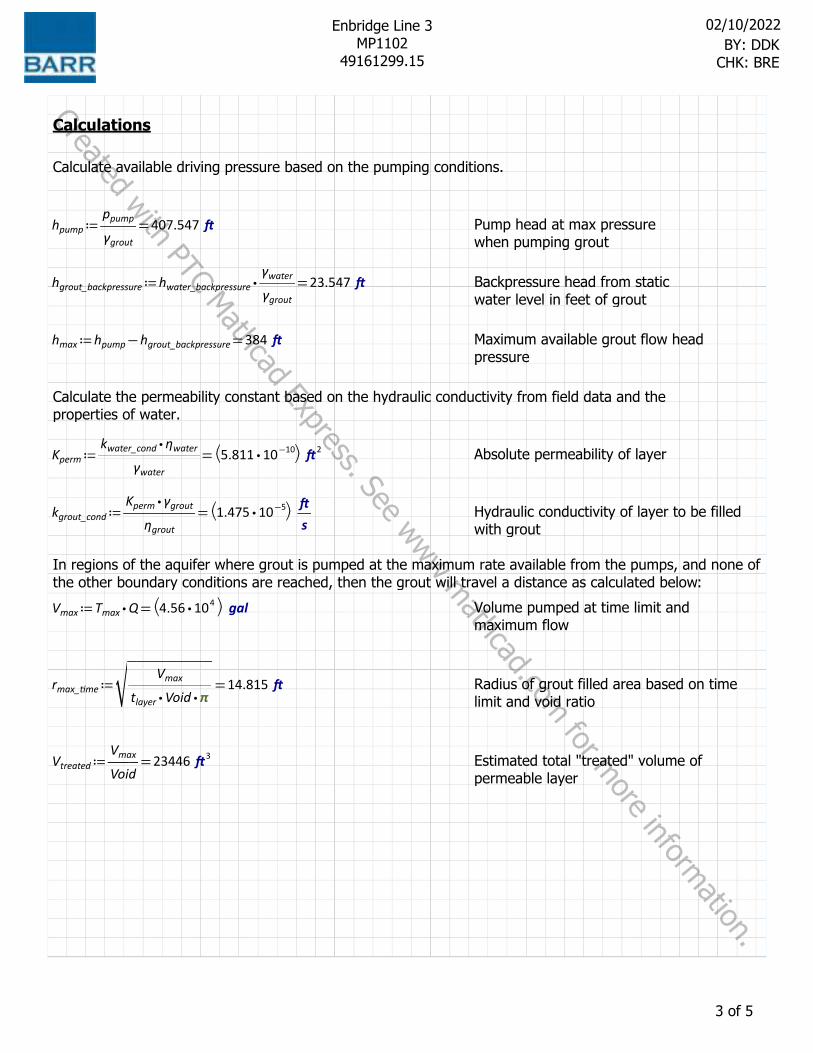
Enbridge Line 3MP1102
49161299.15
02/10/2022BY: DDK
CHK: BRE
Created with PTC Mathcad Express. See www.mathcad.com
for more inform
ation.
Calculations
Calculate available driving pressure based on the pumping conditions.
≔hpump =――ppump
γgrout407.547 ft Pump head at max pressure
when pumping grout
≔hgrout_backpressure =⋅hwater_backpressure ――γwaterγgrout
23.547 ft Backpressure head from static water level in feet of grout
≔hmax =-hpump hgrout_backpressure 384 ft Maximum available grout flow head pressure
Calculate the permeability constant based on the hydraulic conductivity from field data and the properties of water.
≔Kperm =―――――⋅kwater_cond ηwater
γwater⎛⎝ ⋅5.811 10-10⎞⎠ ft2 Absolute permeability of layer
≔kgrout_cond =――――⋅Kperm γgrout
ηgrout⎛⎝ ⋅1.475 10-5⎞⎠ ―
fts
Hydraulic conductivity of layer to be filled with grout
In regions of the aquifer where grout is pumped at the maximum rate available from the pumps, and none of the other boundary conditions are reached, then the grout will travel a distance as calculated below:
≔Vmax =⋅Tmax Q ⎛⎝ ⋅4.56 104 ⎞⎠ gal Volume pumped at time limit and maximum flow
≔rmax_time =‾‾‾‾‾‾‾‾‾‾――――
Vmax
⋅⋅tlayer Void π14.815 ft Radius of grout filled area based on time
limit and void ratio
≔Vtreated =――Vmax
Void23446 ft3 Estimated total "treated" volume of
permeable layer
3 of 5
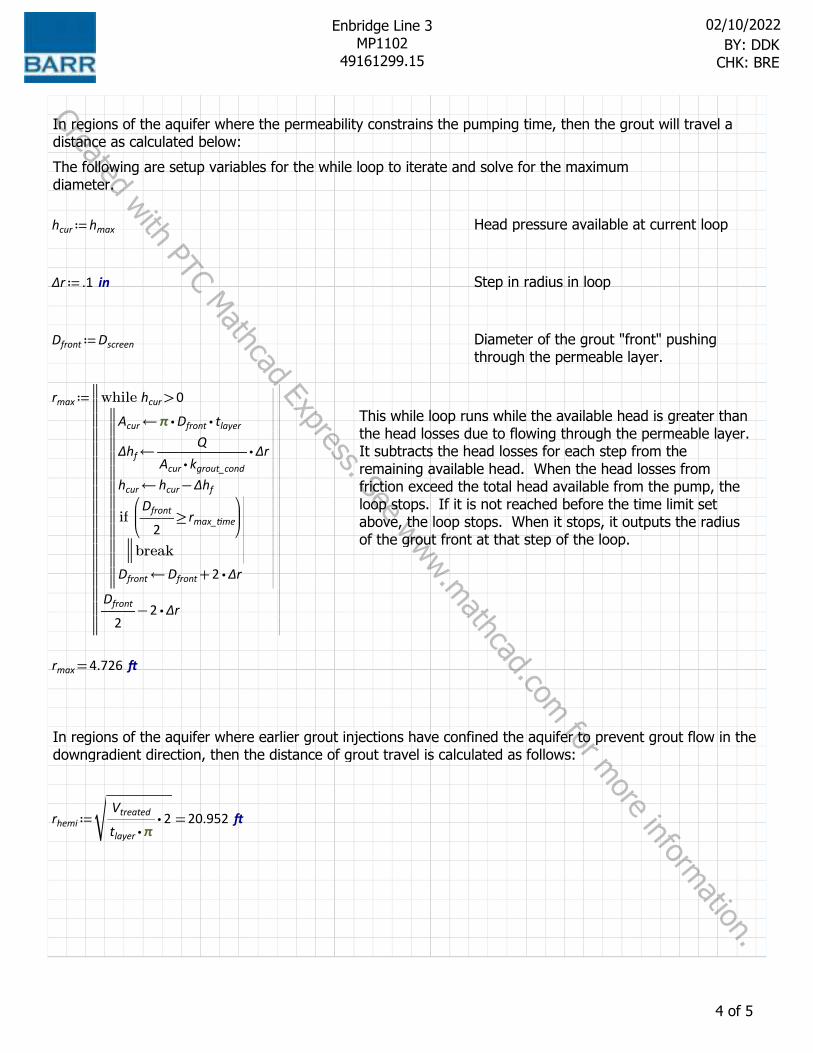
Enbridge Line 3MP1102
49161299.15
02/10/2022BY: DDK
CHK: BRE
Created with PTC Mathcad Express. See www.mathcad.com
for more inform
ation.
In regions of the aquifer where the permeability constrains the pumping time, then the grout will travel a distance as calculated below:
The following are setup variables for the while loop to iterate and solve for the maximum diameter.
≔hcur hmax Head pressure available at current loop
≔Δr .1 in Step in radius in loop
≔Dfront Dscreen Diameter of the grout "front" pushing through the permeable layer.
≔rmax‖‖‖‖‖‖‖‖‖‖‖‖‖‖‖‖‖‖
||||||||||||||||||
while ||||||||||||||
>hcur 0‖‖‖‖‖‖‖‖‖‖‖‖‖
←Acur ⋅⋅π Dfront tlayer
←Δhf ⋅―――――Q
⋅Acur kgrout_condΔr
←hcur -hcur Δhf|||||
if⎛⎜⎝
≥――Dfront
2rmax_time
⎞⎟⎠
‖‖break
←Dfront +Dfront ⋅2 Δr
-――Dfront
2⋅2 Δr
This while loop runs while the available head is greater than the head losses due to flowing through the permeable layer. It subtracts the head losses for each step from the remaining available head. When the head losses from friction exceed the total head available from the pump, the loop stops. If it is not reached before the time limit set above, the loop stops. When it stops, it outputs the radius of the grout front at that step of the loop.
=rmax 4.726 ft
In regions of the aquifer where earlier grout injections have confined the aquifer to prevent grout flow in the downgradient direction, then the distance of grout travel is calculated as follows:
≔rhemi =‾‾‾‾‾‾‾‾
⋅―――Vtreated
⋅tlayer π2 20.952 ft
4 of 5
Enbridge Line 3MP1102
49161299.15
02/10/2022BY: DDK
CHK: BRE
Created with PTC Mathcad Express. See www.mathcad.com
for more inform
ation.
References
1.2.
3.
Corrective Action Plan: MP 1102.5 Uncontrolled Flow, Revision 2Estimation of Viscosity and Yield Stress of Cement Grouts at True Ground Temperatures Based on the Flow Spread Test; Zhipeng Xu,1,2,* Yichen Miao,3 Haikuan Wu,1,2 Xun Yuan,3 and Changwu Liu1,2,*IAPWS-IF97
5 of 5


