Embed Size (px)
Citation preview
KS Energy
INDONESIAN tycoon Kris Wiluan, who is facing 112
charges for alleged market rigging and false trading, has
resigned as chairman, chief executive and director of off-
shore and marine firm KS Energy.
His son, Richard James Wiluan, 42, has replaced him
as chairman and CEO of KS Energy. The younger
Mr Wiluan has also assumed the position of chairman of
KS Drilling, the group’s principal subsidiary. This comes
after KS Energy on Aug 7 defended the suitability of Kris
Wiluan to remain as chairman and CEO despite the
charges he faced.
In addition to his latest appointments, Mr Richard
Wiluan has been executive director of KS Energy and
chief executive and director of KS Drilling.
Vibrant Group
THE Singapore Exchange Regulation (SGX RegCo) has re-
ported accounting irregularities in Vibrant Group’s sub-
sidiary Blackgold International Holdings to the relevant
authorities. It also now requires SGX-listed companies
to consult it before appointing any Blackgold manage-
ment as a director or key management.
A special audit report released by EY Advisory in
January 2019 uncovered potential significant misstate-
ments in Chinese coal-miner Blackgold’s financial state-
ments.
The report also noted that Blackgold’s management
may also have recorded fictitious mining fees from sub-
contractors prior to the acquisition, meaning that the
false accounts could date back to when the company
was still listed on the Australian Securities Exchange.
Blackgold was acquired by Vibrant in July 2017.
Mapletree Industrial Trust
MAPLETREE Industrial Trust (MIT) has agreed to sell a
data centre located at 26A Ayer Rajah Crescent, Singa-
pore to Equinix Singapore at a proposed price of
S$125 million. Equinix had exercised its option to pur-
chase the property that was within the 2015 lease agree-
ment it had with MIT. The sale price represents a
23.3 per cent premium over the development cost of
S$101.4 million. The property contributed about 2.2 per
cent to MIT’s portfolio gross revenue in the financial
year ended March 31, 2020.
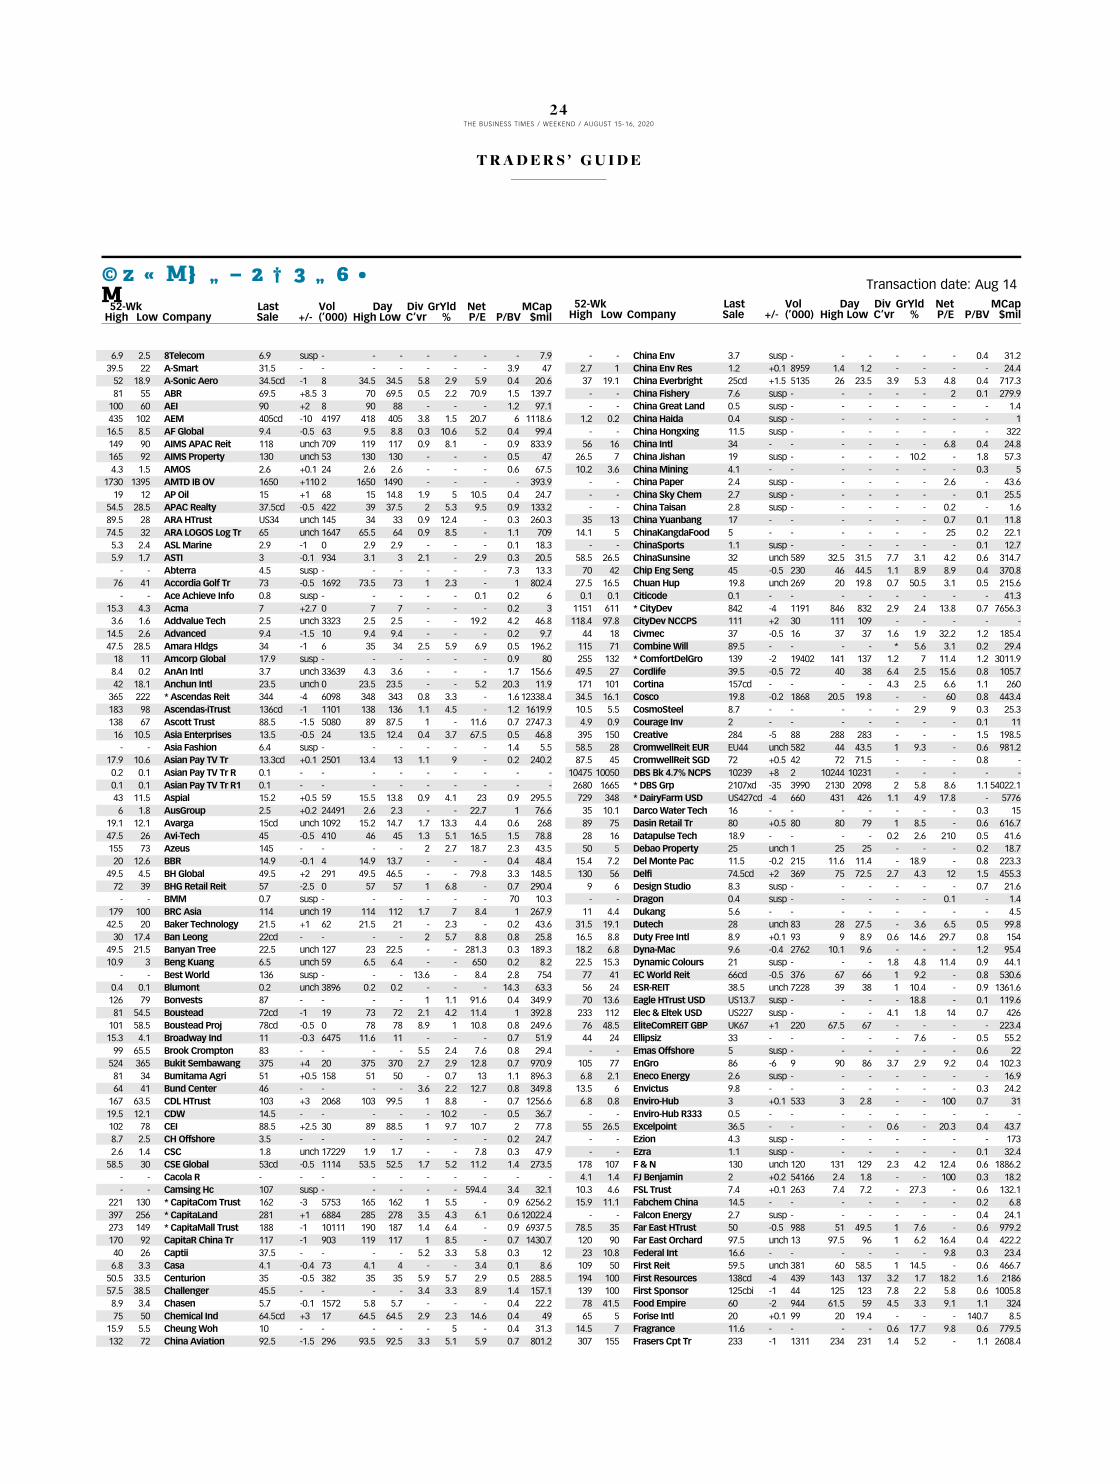
THE Straits Times Index
ended the week down 14.65
points or 0.56 per cent at
2,581.32 points, as investors re-
mained cautious amid the virus-
hit economy.
Oanda senior market analyst
Jeffrey Halley said: “A direction-
less session from Wall Street set
up much the same picture in Asia
today. Most major indices are drift-
ing.”
The best performer on the in-
dex was Singapore Technologies
Engineering (ST Engineering),
which gained 3.67 per cent or 12
Singapore cents for the day to
close at S$3.39. This was despite
the company’s profit falling by 4.4
per cent to S$257.4 million for H1.
Its board approved an interim
dividend of S$0.05 per share for
the financial year ending Dec 31,
as was the case the previous year.
OCBC Investment Research
noted that the company was “seek-
ing to capture opportunities” from
the pandemic, and was set to re-
ceive more than S$300 million in
support throughout the year.
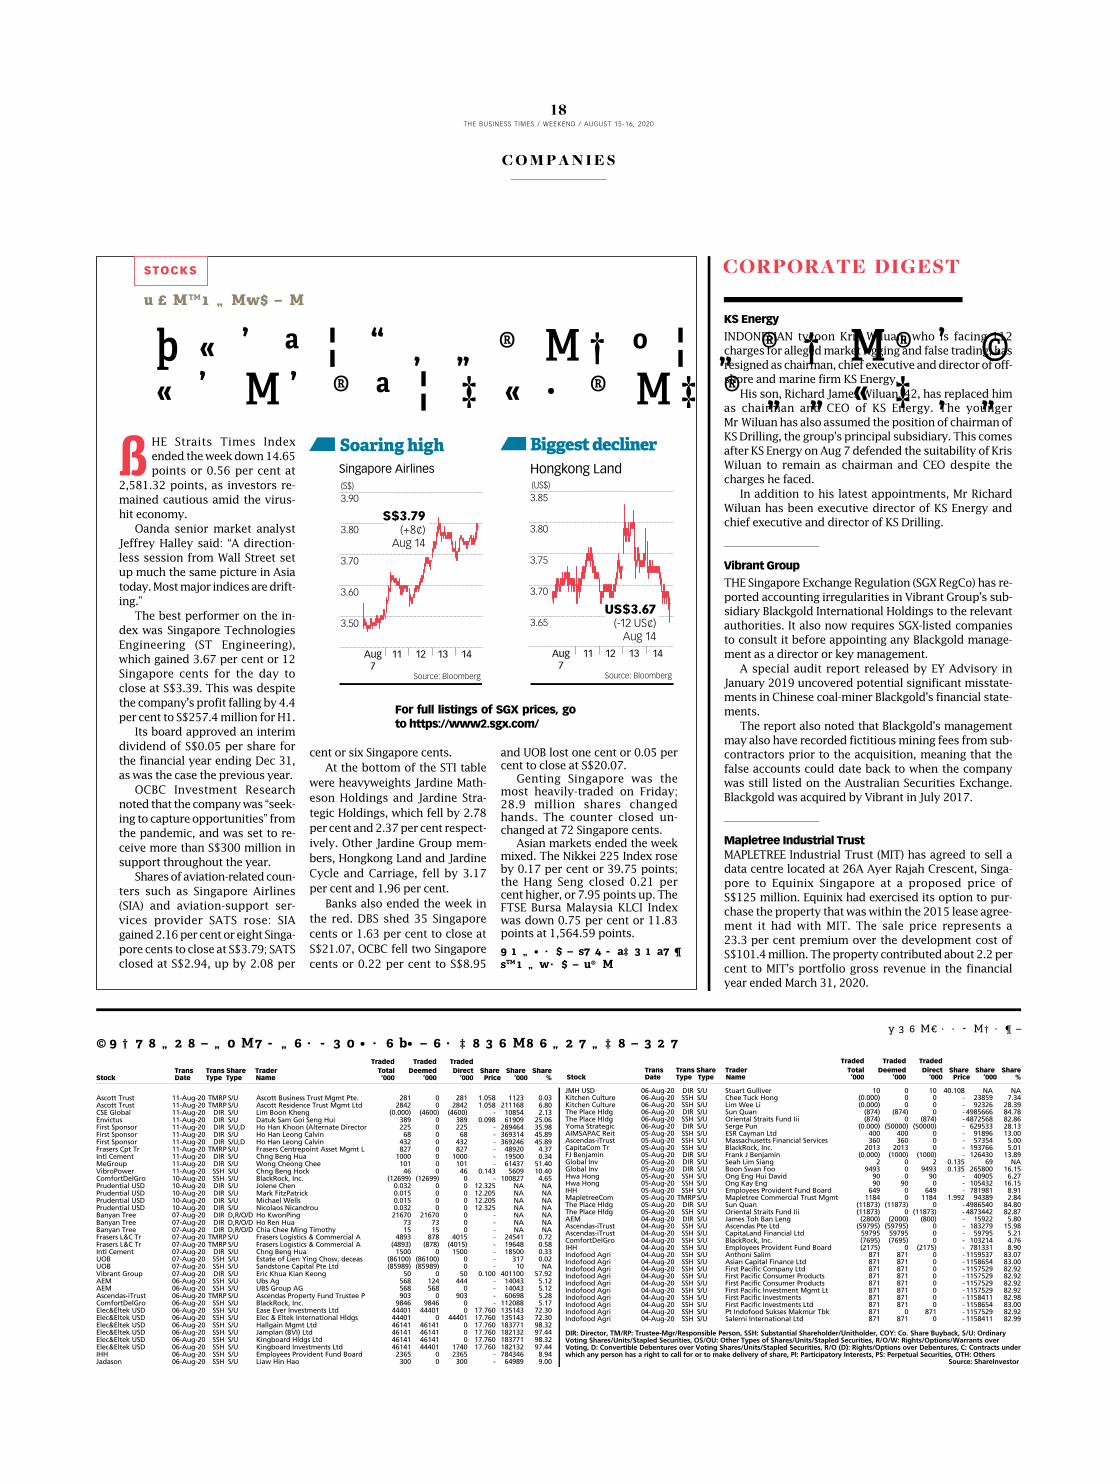
Shares of aviation-related coun-
ters such as Singapore Airlines
(SIA) and aviation-support ser-
vices provider SATS rose: SIA
gained 2.16 per cent or eight Singa-
pore cents to close at S$3.79; SATS
closed at S$2.94, up by 2.08 per
cent or six Singapore cents.
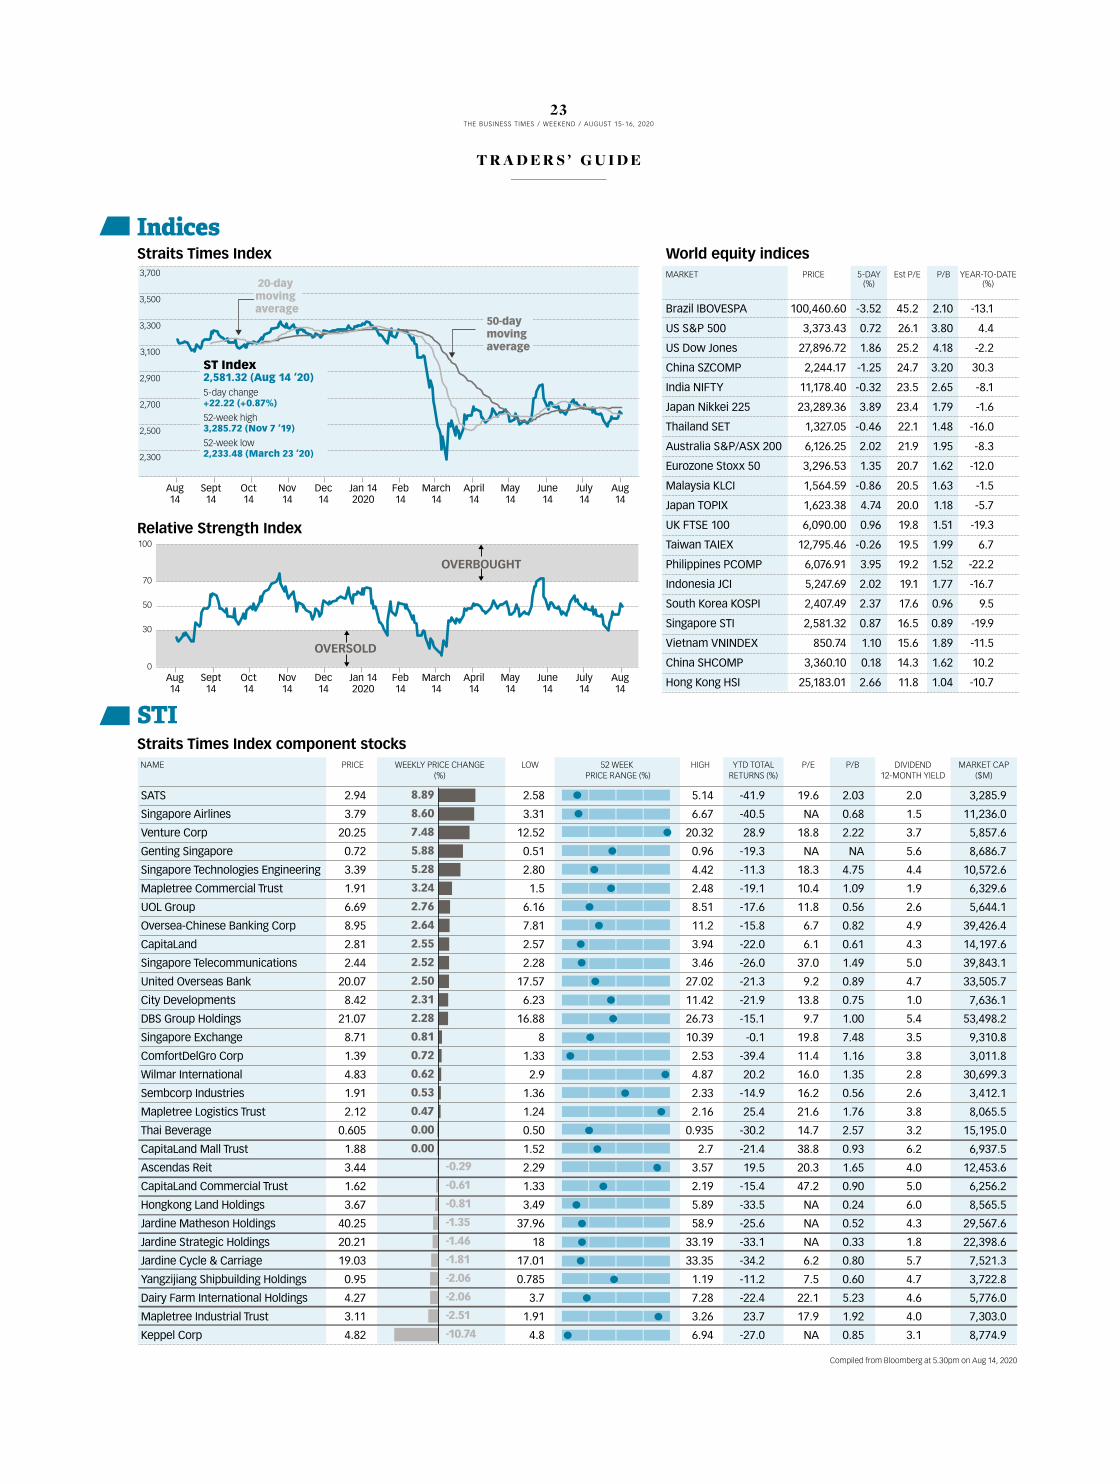
At the bottom of the STI table
were heavyweights Jardine Math-
eson Holdings and Jardine Stra-
tegic Holdings, which fell by 2.78
per cent and 2.37 per cent respect-
ively. Other Jardine Group mem-
bers, Hongkong Land and Jardine
Cycle and Carriage, fell by 3.17
per cent and 1.96 per cent.
Banks also ended the week in
the red. DBS shed 35 Singapore
cents or 1.63 per cent to close at
S$21.07, OCBC fell two Singapore
cents or 0.22 per cent to S$8.95
and UOB lost one cent or 0.05 per cent to close at S$20.07.
Genting Singapore was the most heavily-traded on Friday; 28.9 million shares changed hands. The counter closed un-changed at 72 Singapore cents.
Asian markets ended the week mixed. The Nikkei 225 Index rose by 0.17 per cent or 39.75 points; the Hang Seng closed 0.21 per cent higher, or 7.95 points up. The FTSE Bursa Malaysia KLCI Index was down 0.75 per cent or 11.83 points at 1,564.59 points.
[email protected]@UmaDeviBT
Singapore shares end week in negative territory
For week beginning Aug 10Substantial shareholder/director transactions
Traded Traded Traded
Trans Trans Share Trader Total Deemed Direct Share Share ShareStock Date Type Type Name ’000 ’000 ’000 Price ’000 %
Traded Traded Traded
Trans Trans Share Trader Total Deemed Direct Share Share ShareStock Date Type Type Name ’000 ’000 ’000 Price ’000 %
CORPORATE DIGEST
Ascott Trust 11-Aug-20 TMRP S/U Ascott Business Trust Mgmt Pte. 281 0 281 1.058 1123 0.03Ascott Trust 11-Aug-20 TMRP S/U Ascott Residence Trust Mgmt Ltd 2842 0 2842 1.058 211168 6.80CSE Global 11-Aug-20 DIR S/U Lim Boon Kheng (0.000) (4600) (4600) - 10854 2.13Envictus 11-Aug-20 DIR S/U Datuk Sam Goi Seng Hui 389 0 389 0.098 61909 25.06First Sponsor 11-Aug-20 DIR S/U,D Ho Han Khoon (Alternate Director 225 0 225 - 289464 35.98First Sponsor 11-Aug-20 DIR S/U Ho Han Leong Calvin 68 0 68 - 369314 45.89First Sponsor 11-Aug-20 DIR S/U,D Ho Han Leong Calvin 432 0 432 - 369246 45.89Frasers Cpt Tr 11-Aug-20 TMRP S/U Frasers Centrepoint Asset Mgmt L 827 0 827 - 48920 4.37Intl Cement 11-Aug-20 DIR S/U Chng Beng Hua 1000 0 1000 - 19500 0.34MeGroup 11-Aug-20 DIR S/U Wong Cheong Chee 101 0 101 - 61437 51.40VibroPower 11-Aug-20 SSH S/U Chng Beng Hock 46 0 46 0.143 5609 10.40ComfortDelGro 10-Aug-20 SSH S/U BlackRock, Inc. (12699) (12699) 0 - 100827 4.65Prudential USD 10-Aug-20 DIR S/U Jolene Chen 0.032 0 0 12.325 NA NAPrudential USD 10-Aug-20 DIR S/U Mark FitzPatrick 0.015 0 0 12.205 NA NAPrudential USD 10-Aug-20 DIR S/U Michael Wells 0.015 0 0 12.205 NA NAPrudential USD 10-Aug-20 DIR S/U Nicolaos Nicandrou 0.032 0 0 12.325 NA NABanyan Tree 07-Aug-20 DIR D,R/O/D Ho KwonPing 21670 21670 0 - NA NABanyan Tree 07-Aug-20 DIR D,R/O/D Ho Ren Hua 73 73 0 - NA NABanyan Tree 07-Aug-20 DIR D,R/O/D Chia Chee Ming Timothy 15 15 0 - NA NAFrasers L&C Tr 07-Aug-20 TMRP S/U Frasers Logistics & Commercial A 4893 878 4015 - 24541 0.72Frasers L&C Tr 07-Aug-20 TMRP S/U Frasers Logistics & Commercial A (4893) (878) (4015) - 19648 0.58Intl Cement 07-Aug-20 DIR S/U Chng Beng Hua 1500 0 1500 - 18500 0.33UOB 07-Aug-20 SSH S/U Estate of Lien Ying Chow, deceas (86100) (86100) 0 - 317 0.02UOB 07-Aug-20 SSH S/U Sandstone Capital Pte Ltd (85989) (85989) 0 - 10 NAVibrant Group 07-Aug-20 DIR S/U Eric Khua Kian Keong 50 0 50 0.100 401100 57.92AEM 06-Aug-20 SSH S/U Ubs Ag 568 124 444 - 14043 5.12AEM 06-Aug-20 SSH S/U UBS Group AG 568 568 0 - 14043 5.12Ascendas-iTrust 06-Aug-20 TMRP S/U Ascendas Property Fund Trustee P 903 0 903 - 60698 5.28ComfortDelGro 06-Aug-20 SSH S/U BlackRock, Inc. 9846 9846 0 - 112088 5.17Elec&Eltek USD 06-Aug-20 SSH S/U Ease Ever Investments Ltd 44401 44401 0 17.760 135143 72.30Elec&Eltek USD 06-Aug-20 SSH S/U Elec & Eltek International Hldgs 44401 0 44401 17.760 135143 72.30Elec&Eltek USD 06-Aug-20 SSH S/U Hallgain Mgmt Ltd 46141 46141 0 17.760 183771 98.32Elec&Eltek USD 06-Aug-20 SSH S/U Jamplan (BVI) Ltd 46141 46141 0 17.760 182132 97.44Elec&Eltek USD 06-Aug-20 SSH S/U Kingboard Hldgs Ltd 46141 46141 0 17.760 183771 98.32Elec&Eltek USD 06-Aug-20 SSH S/U Kingboard Investments Ltd 46141 44401 1740 17.760 182132 97.44IHH 06-Aug-20 SSH S/U Employees Provident Fund Board 2365 0 2365 - 784346 8.94Jadason 06-Aug-20 SSH S/U Liaw Hin Hao 300 0 300 - 64989 9.00
JMH USD 06-Aug-20 DIR S/U Stuart Gulliver 10 0 10 40.108 NA NAKitchen Culture 06-Aug-20 SSH S/U Chee Tuck Hong (0.000) 0 0 - 23859 7.34Kitchen Culture 06-Aug-20 SSH S/U Lim Wee Li (0.000) 0 0 - 92326 28.39The Place Hldg 06-Aug-20 DIR S/U Sun Quan (874) (874) 0 - 4985666 84.78The Place Hldg 06-Aug-20 SSH S/U Oriental Straits Fund Iii (874) 0 (874) - 4872568 82.86Yoma Strategic 06-Aug-20 DIR S/U Serge Pun (0.000) (50000) (50000) - 629533 28.13AIMSAPAC Reit 05-Aug-20 SSH S/U ESR Cayman Ltd 400 400 0 - 91896 13.00Ascendas-iTrust 05-Aug-20 SSH S/U Massachusetts Financial Services 360 360 0 - 57354 5.00CapitaCom Tr 05-Aug-20 SSH S/U BlackRock, Inc. 2013 2013 0 - 193766 5.01FJ Benjamin 05-Aug-20 DIR S/U Frank J Benjamin (0.000) (1000) (1000) - 126430 13.89Global Inv 05-Aug-20 DIR S/U Seah Lim Siang 2 0 2 0.135 69 NAGlobal Inv 05-Aug-20 DIR S/U Boon Swan Foo 9493 0 9493 0.135 265800 16.15Hwa Hong 05-Aug-20 SSH S/U Ong Eng Hui David 90 0 90 - 40905 6.27Hwa Hong 05-Aug-20 SSH S/U Ong Kay Eng 90 90 0 - 105432 16.15IHH 05-Aug-20 SSH S/U Employees Provident Fund Board 649 0 649 - 781981 8.91MapletreeCom 05-Aug-20 TMRP S/U Mapletree Commercial Trust Mgmt 1184 0 1184 1.992 94389 2.84The Place Hldg 05-Aug-20 DIR S/U Sun Quan (11873) (11873) 0 - 4986540 84.80The Place Hldg 05-Aug-20 SSH S/U Oriental Straits Fund Iii (11873) 0 (11873) - 4873442 82.87AEM 04-Aug-20 DIR S/U James Toh Ban Leng (2800) (2000) (800) - 15922 5.80Ascendas-iTrust 04-Aug-20 SSH S/U Ascendas Pte Ltd (59795) (59795) 0 - 183279 15.98Ascendas-iTrust 04-Aug-20 SSH S/U CapitaLand Financial Ltd 59795 59795 0 - 59795 5.21ComfortDelGro 04-Aug-20 SSH S/U BlackRock, Inc. (7695) (7695) 0 - 103214 4.76IHH 04-Aug-20 SSH S/U Employees Provident Fund Board (2175) 0 (2175) - 781331 8.90Indofood Agri 04-Aug-20 SSH S/U Anthoni Salim 871 871 0 - 1159537 83.07Indofood Agri 04-Aug-20 SSH S/U Asian Capital Finance Ltd 871 871 0 - 1158654 83.00Indofood Agri 04-Aug-20 SSH S/U First Pacific Company Ltd 871 871 0 - 1157529 82.92Indofood Agri 04-Aug-20 SSH S/U First Pacific Consumer Products 871 871 0 - 1157529 82.92Indofood Agri 04-Aug-20 SSH S/U First Pacific Consumer Products 871 871 0 - 1157529 82.92Indofood Agri 04-Aug-20 SSH S/U First Pacific Investment Mgmt Lt 871 871 0 - 1157529 82.92Indofood Agri 04-Aug-20 SSH S/U First Pacific Investments 871 871 0 - 1158411 82.98Indofood Agri 04-Aug-20 SSH S/U First Pacific Investments Ltd 871 871 0 - 1158654 83.00Indofood Agri 04-Aug-20 SSH S/U Pt Indofood Sukses Makmur Tbk 871 0 871 - 1157529 82.92Indofood Agri 04-Aug-20 SSH S/U Salerni International Ltd 871 871 0 - 1158411 82.99
DIR: Director, TM/RP: Trustee-Mgr/Responsible Person, SSH: Substantial Shareholder/Unitholder, COY: Co. Share Buyback, S/U: Ordinary Voting Shares/Units/Stapled Securities, OS/OU: Other Types of Shares/Units/Stapled Securities, R/O/W: Rights/Options/Warrants over Voting, D: Convertible Debentures over Voting Shares/Units/Stapled Securities, R/O (D): Rights/Options over Debentures, C: Contracts under which any person has a right to call for or to make delivery of share, PI: Participatory Interests, PS: Perpetual Securities, OTH: Others Source: ShareInvestor
STOCKS
By Uma Devi
Hongkong Land(US$)
Biggest decliner
Source: Bloomberg
Aug7
11 12 13 14
3.85
3.80
3.75
3.70
3.65US$3.67
(-12 US¢)Aug 14
Singapore Airlines(S$)
Soaring high
Source: Bloomberg
Aug7
1311 1412
3.90
3.80
3.70
3.60
3.50
S$3.79 (+8¢)
Aug 14
For full listings of SGX prices, go
to https://www2.sgx.com/
1 8THE BUSINESS TIMES / WEEKEND / AUGUST 15-16, 2020
C O M P A N I E S
IndicesStraits Times Index
Straits Times Index component stocksNAME PRICE WEEKLY PRICE CHANGE
(%)LOW HIGH YTD TOTAL
RETURNS (%)P/E P/B DIVIDEND
12-MONTH YIELDMARKET CAP
($M)52 WEEK
PRICE RANGE (%)
STI
SATS 2.94 2.58 5.14 -41.9 19.6 2.03 2.0 3,285.9
Singapore Airlines 3.79 3.31 6.67 -40.5 NA 0.68 1.5 11,236.0
Venture Corp 20.25 12.52 20.32 28.9 18.8 2.22 3.7 5,857.6
Genting Singapore 0.72 0.51 0.96 -19.3 NA NA 5.6 8,686.7
Singapore Technologies Engineering 3.39 2.80 4.42 -11.3 18.3 4.75 4.4 10,572.6
Mapletree Commercial Trust 1.91 1.5 2.48 -19.1 10.4 1.09 1.9 6,329.6
UOL Group 6.69 6.16 8.51 -17.6 11.8 0.56 2.6 5,644.1
Oversea-Chinese Banking Corp 8.95 7.81 11.2 -15.8 6.7 0.82 4.9 39,426.4
CapitaLand 2.81 2.57 3.94 -22.0 6.1 0.61 4.3 14,197.6
Singapore Telecommunications 2.44 2.28 3.46 -26.0 37.0 1.49 5.0 39,843.1
United Overseas Bank 20.07 17.57 27.02 -21.3 9.2 0.89 4.7 33,505.7
City Developments 8.42 6.23 11.42 -21.9 13.8 0.75 1.0 7,636.1
DBS Group Holdings 21.07 16.88 26.73 -15.1 9.7 1.00 5.4 53,498.2
Singapore Exchange 8.71 8 10.39 -0.1 19.8 7.48 3.5 9,310.8
ComfortDelGro Corp 1.39 1.33 2.53 -39.4 11.4 1.16 3.8 3,011.8
Wilmar International 4.83 2.9 4.87 20.2 16.0 1.35 2.8 30,699.3
Sembcorp Industries 1.91 1.36 2.33 -14.9 16.2 0.56 2.6 3,412.1
Mapletree Logistics Trust 2.12 1.24 2.16 25.4 21.6 1.76 3.8 8,065.5
Thai Beverage 0.605 0.50 0.935 -30.2 14.7 2.57 3.2 15,195.0
CapitaLand Mall Trust 1.88 1.52 2.7 -21.4 38.8 0.93 6.2 6,937.5
Ascendas Reit 3.44 2.29 3.57 19.5 20.3 1.65 4.0 12,453.6
CapitaLand Commercial Trust 1.62 1.33 2.19 -15.4 47.2 0.90 5.0 6,256.2
Hongkong Land Holdings 3.67 3.49 5.89 -33.5 NA 0.24 6.0 8,565.5
Jardine Matheson Holdings 40.25 37.96 58.9 -25.6 NA 0.52 4.3 29,567.6
Jardine Strategic Holdings 20.21 18 33.19 -33.1 NA 0.33 1.8 22,398.6
Jardine Cycle & Carriage 19.03 17.01 33.35 -34.2 6.2 0.80 5.7 7,521.3
Yangzijiang Shipbuilding Holdings 0.95 0.785 1.19 -11.2 7.5 0.60 4.7 3,722.8
Dairy Farm International Holdings 4.27 3.7 7.28 -22.4 22.1 5.23 4.6 5,776.0
Mapletree Industrial Trust 3.11 1.91 3.26 23.7 17.9 1.92 4.0 7,303.0
Keppel Corp 4.82 4.8 6.94 -27.0 NA 0.85 3.1 8,774.9
Compiled from Bloomberg at 5.30pm on Aug 14, 2020
-0.29
-0.61
-0.81
-1.35
-1.46
-1.81
-2.06
-2.06
-2.51
-10.74
0
30
50
70
100
Relative Strength Index
OVERBOUGHT
OVERSOLD
May14
June14
July14
Aug14
Aug14
Sept14
Oct14
Nov14
Dec14
Feb14
Jan 142020
March14
April14
May14
June14
July14
Aug14
Aug14
Sept14
Oct14
Nov14
Dec14
Feb14
Jan 142020
March14
April14
3,700
3,500
3,300
3,100
2,900
2,700
2,500
2,300
World equity indices
Brazil IBOVESPA 100,460.60 -3.52 45.2 2.10 -13.1
US S&P 500 3,373.43 0.72 26.1 3.80 4.4
US Dow Jones 27,896.72 1.86 25.2 4.18 -2.2
China SZCOMP 2,244.17 -1.25 24.7 3.20 30.3
India NIFTY 11,178.40 -0.32 23.5 2.65 -8.1
Japan Nikkei 225 23,289.36 3.89 23.4 1.79 -1.6
Thailand SET 1,327.05 -0.46 22.1 1.48 -16.0
Australia S&P/ASX 200 6,126.25 2.02 21.9 1.95 -8.3
Eurozone Stoxx 50 3,296.53 1.35 20.7 1.62 -12.0
Malaysia KLCI 1,564.59 -0.86 20.5 1.63 -1.5
Japan TOPIX 1,623.38 4.74 20.0 1.18 -5.7
UK FTSE 100 6,090.00 0.96 19.8 1.51 -19.3
Taiwan TAIEX 12,795.46 -0.26 19.5 1.99 6.7
Philippines PCOMP 6,076.91 3.95 19.2 1.52 -22.2
Indonesia JCI 5,247.69 2.02 19.1 1.77 -16.7
South Korea KOSPI 2,407.49 2.37 17.6 0.96 9.5
Singapore STI 2,581.32 0.87 16.5 0.89 -19.9
Vietnam VNINDEX 850.74 1.10 15.6 1.89 -11.5
China SHCOMP 3,360.10 0.18 14.3 1.62 10.2
Hong Kong HSI 25,183.01 2.66 11.8 1.04 -10.7
PRICEMARKET 5-DAY(%)
Est P/E P/B YEAR-TO-DATE(%)
8.89
8.60
7.48
5.88
5.28
3.24
2.76
2.64
2.55
2.52
2.50
2.31
2.28
0.81
0.72
0.62
0.53
0.47
0.00
0.00
ST Index 2,581.32 (Aug 14 ‘20)5-day change+22.22 (+0.87%)
52-week high3,285.72 (Nov 7 ’19)
52-week low2,233.48 (March 23 ’20)
20-day moving average
50-day moving average
2 3THE BUSINESS TIMES / WEEKEND / AUGUST 15-16, 2020
T R A D E R S ’ G U I D E
6.9 2.5 8Telecom 6.9 susp - - - - - - - 7.9
39.5 22 A-Smart 31.5 - - - - - - - 3.9 47
52 18.9 A-Sonic Aero 34.5cd -1 8 34.5 34.5 5.8 2.9 5.9 0.4 20.6
81 55 ABR 69.5 +8.5 3 70 69.5 0.5 2.2 70.9 1.5 139.7
100 60 AEI 90 +2 8 90 88 - - - 1.2 97.1
435 102 AEM 405cd -10 4197 418 405 3.8 1.5 20.7 6 1118.6
16.5 8.5 AF Global 9.4 -0.5 63 9.5 8.8 0.3 10.6 5.2 0.4 99.4
149 90 AIMS APAC Reit 118 unch 709 119 117 0.9 8.1 - 0.9 833.9
165 92 AIMS Property 130 unch 53 130 130 - - - 0.5 47
4.3 1.5 AMOS 2.6 +0.1 24 2.6 2.6 - - - 0.6 67.5
1730 1395 AMTD IB OV 1650 +110 2 1650 1490 - - - - 393.9
19 12 AP Oil 15 +1 68 15 14.8 1.9 5 10.5 0.4 24.7
54.5 28.5 APAC Realty 37.5cd -0.5 422 39 37.5 2 5.3 9.5 0.9 133.2
89.5 28 ARA HTrust US34 unch 145 34 33 0.9 12.4 - 0.3 260.3
74.5 32 ARA LOGOS Log Tr 65 unch 1647 65.5 64 0.9 8.5 - 1.1 709
5.3 2.4 ASL Marine 2.9 -1 0 2.9 2.9 - - - 0.1 18.3
5.9 1.7 ASTI 3 -0.1 934 3.1 3 2.1 - 2.9 0.3 20.5
- - Abterra 4.5 susp - - - - - - 7.3 13.3
76 41 Accordia Golf Tr 73 -0.5 1692 73.5 73 1 2.3 - 1 802.4
- - Ace Achieve Info 0.8 susp - - - - - 0.1 0.2 6
15.3 4.3 Acma 7 +2.7 0 7 7 - - - 0.2 3
3.6 1.6 Addvalue Tech 2.5 unch 3323 2.5 2.5 - - 19.2 4.2 46.8
14.5 2.6 Advanced 9.4 -1.5 10 9.4 9.4 - - - 0.2 9.7
47.5 28.5 Amara Hldgs 34 -1 6 35 34 2.5 5.9 6.9 0.5 196.2
18 11 Amcorp Global 17.9 susp - - - - - - 0.9 80
8.4 0.2 AnAn Intl 3.7 unch 33639 4.3 3.6 - - - 1.7 156.6
42 18.1 Anchun Intl 23.5 unch 0 23.5 23.5 - - 5.2 20.3 11.9
365 222 * Ascendas Reit 344 -4 6098 348 343 0.8 3.3 - 1.6 12338.4
183 98 Ascendas-iTrust 136cd -1 1101 138 136 1.1 4.5 - 1.2 1619.9
138 67 Ascott Trust 88.5 -1.5 5080 89 87.5 1 - 11.6 0.7 2747.3
16 10.5 Asia Enterprises 13.5 -0.5 24 13.5 12.4 0.4 3.7 67.5 0.5 46.8
- - Asia Fashion 6.4 susp - - - - - - 1.4 5.5
17.9 10.6 Asian Pay TV Tr 13.3cd +0.1 2501 13.4 13 1.1 9 - 0.2 240.2
0.2 0.1 Asian Pay TV Tr R 0.1 - - - - - - - - -
0.1 0.1 Asian Pay TV Tr R1 0.1 - - - - - - - - -
43 11.5 Aspial 15.2 +0.5 59 15.5 13.8 0.9 4.1 23 0.9 295.5
6 1.8 AusGroup 2.5 +0.2 24491 2.6 2.3 - - 22.7 1 76.6
19.1 12.1 Avarga 15cd unch 1092 15.2 14.7 1.7 13.3 4.4 0.6 268
47.5 26 Avi-Tech 45 -0.5 410 46 45 1.3 5.1 16.5 1.5 78.8
155 73 Azeus 145 - - - - 2 2.7 18.7 2.3 43.5
20 12.6 BBR 14.9 -0.1 4 14.9 13.7 - - - 0.4 48.4
49.5 4.5 BH Global 49.5 +2 291 49.5 46.5 - - 79.8 3.3 148.5
72 39 BHG Retail Reit 57 -2.5 0 57 57 1 6.8 - 0.7 290.4
- - BMM 0.7 susp - - - - - - 70 10.3
179 100 BRC Asia 114 unch 19 114 112 1.7 7 8.4 1 267.9
42.5 20 Baker Technology 21.5 +1 62 21.5 21 - 2.3 - 0.2 43.6
30 17.4 Ban Leong 22cd - - - - 2 5.7 8.8 0.8 25.8
49.5 21.5 Banyan Tree 22.5 unch 127 23 22.5 - - 281.3 0.3 189.3
10.9 3 Beng Kuang 6.5 unch 59 6.5 6.4 - - 650 0.2 8.2
- - Best World 136 susp - - - 13.6 - 8.4 2.8 754
0.4 0.1 Blumont 0.2 unch 3896 0.2 0.2 - - - 14.3 63.3
126 79 Bonvests 87 - - - - 1 1.1 91.6 0.4 349.9
81 54.5 Boustead 72cd -1 19 73 72 2.1 4.2 11.4 1 392.8
101 58.5 Boustead Proj 78cd -0.5 0 78 78 8.9 1 10.8 0.8 249.6
15.3 4.1 Broadway Ind 11 -0.3 6475 11.6 11 - - - 0.7 51.9
99 65.5 Brook Crompton 83 - - - - 5.5 2.4 7.6 0.8 29.4
524 365 Bukit Sembawang 375 +4 20 375 370 2.7 2.9 12.8 0.7 970.9
81 34 Bumitama Agri 51 +0.5 158 51 50 - 0.7 13 1.1 896.3
64 41 Bund Center 46 - - - - 3.6 2.2 12.7 0.8 349.8
167 63.5 CDL HTrust 103 +3 2068 103 99.5 1 8.8 - 0.7 1256.6
19.5 12.1 CDW 14.5 - - - - - 10.2 - 0.5 36.7
102 78 CEI 88.5 +2.5 30 89 88.5 1 9.7 10.7 2 77.8
8.7 2.5 CH Offshore 3.5 - - - - - - - 0.2 24.7
2.6 1.4 CSC 1.8 unch 17229 1.9 1.7 - - 7.8 0.3 47.9
58.5 30 CSE Global 53cd -0.5 1114 53.5 52.5 1.7 5.2 11.2 1.4 273.5
- - Cacola R - - - - - - - - - -
- - Camsing Hc 107 susp - - - - - 594.4 3.4 32.1
221 130 * CapitaCom Trust 162 -3 5753 165 162 1 5.5 - 0.9 6256.2
397 256 * CapitaLand 281 +1 6884 285 278 3.5 4.3 6.1 0.6 12022.4
273 149 * CapitaMall Trust 188 -1 10111 190 187 1.4 6.4 - 0.9 6937.5
170 92 CapitaR China Tr 117 -1 903 119 117 1 8.5 - 0.7 1430.7
40 26 Captii 37.5 - - - - 5.2 3.3 5.8 0.3 12
6.8 3.3 Casa 4.1 -0.4 73 4.1 4 - - 3.4 0.1 8.6
50.5 33.5 Centurion 35 -0.5 382 35 35 5.9 5.7 2.9 0.5 288.5
57.5 38.5 Challenger 45.5 - - - - 3.4 3.3 8.9 1.4 157.1
8.9 3.4 Chasen 5.7 -0.1 1572 5.8 5.7 - - - 0.4 22.2
75 50 Chemical Ind 64.5cd +3 17 64.5 64.5 2.9 2.3 14.6 0.4 49
15.9 5.5 Cheung Woh 10 - - - - - 5 - 0.4 31.3
132 72 China Aviation 92.5 -1.5 296 93.5 92.5 3.3 5.1 5.9 0.7 801.2
- - China Env 3.7 susp - - - - - - 0.4 31.2
2.7 1 China Env Res 1.2 +0.1 8959 1.4 1.2 - - - - 24.4
37 19.1 China Everbright 25cd +1.5 5135 26 23.5 3.9 5.3 4.8 0.4 717.3
- - China Fishery 7.6 susp - - - - - 2 0.1 279.9
- - China Great Land 0.5 susp - - - - - - - 1.4
1.2 0.2 China Haida 0.4 susp - - - - - - - 1
- - China Hongxing 11.5 susp - - - - - - - 322
56 16 China Intl 34 - - - - - - 6.8 0.4 24.8
26.5 7 China Jishan 19 susp - - - - 10.2 - 1.8 57.3
10.2 3.6 China Mining 4.1 - - - - - - - 0.3 5
- - China Paper 2.4 susp - - - - - 2.6 - 43.6
- - China Sky Chem 2.7 susp - - - - - - 0.1 25.5
- - China Taisan 2.8 susp - - - - - 0.2 - 1.6
35 13 China Yuanbang 17 - - - - - - 0.7 0.1 11.8
14.1 5 ChinaKangdaFood 5 - - - - - - 25 0.2 22.1
- - ChinaSports 1.1 susp - - - - - - 0.1 12.7
58.5 26.5 ChinaSunsine 32 unch 589 32.5 31.5 7.7 3.1 4.2 0.6 314.7
70 42 Chip Eng Seng 45 -0.5 230 46 44.5 1.1 8.9 8.9 0.4 370.8
27.5 16.5 Chuan Hup 19.8 unch 269 20 19.8 0.7 50.5 3.1 0.5 215.6
0.1 0.1 Citicode 0.1 - - - - - - - - 41.3
1151 611 * CityDev 842 -4 1191 846 832 2.9 2.4 13.8 0.7 7656.3
118.4 97.8 CityDev NCCPS 111 +2 30 111 109 - - - - -
44 18 Civmec 37 -0.5 16 37 37 1.6 1.9 32.2 1.2 185.4
115 71 Combine Will 89.5 - - - - * 5.6 3.1 0.2 29.4
255 132 * ComfortDelGro 139 -2 19402 141 137 1.2 7 11.4 1.2 3011.9
49.5 27 Cordlife 39.5 -0.5 72 40 38 6.4 2.5 15.6 0.8 105.7
171 101 Cortina 157cd - - - - 4.3 2.5 6.6 1.1 260
34.5 16.1 Cosco 19.8 -0.2 1868 20.5 19.8 - - 60 0.8 443.4
10.5 5.5 CosmoSteel 8.7 - - - - - 2.9 9 0.3 25.3
4.9 0.9 Courage Inv 2 - - - - - - - 0.1 11
395 150 Creative 284 -5 88 288 283 - - - 1.5 198.5
58.5 28 CromwellReit EUR EU44 unch 582 44 43.5 1 9.3 - 0.6 981.2
87.5 45 CromwellReit SGD 72 +0.5 42 72 71.5 - - - 0.8 -
10475 10050 DBS Bk 4.7% NCPS 10239 +8 2 10244 10231 - - - - -
2680 1665 * DBS Grp 2107xd -35 3990 2130 2098 2 5.8 8.6 1.1 54022.1
729 348 * DairyFarm USD US427cd -4 660 431 426 1.1 4.9 17.8 - 5776
35 10.1 Darco Water Tech 16 - - - - - - - 0.3 15
89 75 Dasin Retail Tr 80 +0.5 80 80 79 1 8.5 - 0.6 616.7
28 16 Datapulse Tech 18.9 - - - - 0.2 2.6 210 0.5 41.6
50 5 Debao Property 25 unch 1 25 25 - - - 0.2 18.7
15.4 7.2 Del Monte Pac 11.5 -0.2 215 11.6 11.4 - 18.9 - 0.8 223.3
130 56 Delfi 74.5cd +2 369 75 72.5 2.7 4.3 12 1.5 455.3
9 6 Design Studio 8.3 susp - - - - - - 0.7 21.6
- - Dragon 0.4 susp - - - - - 0.1 - 1.4
11 4.4 Dukang 5.6 - - - - - - - - 4.5
31.5 19.1 Dutech 28 unch 83 28 27.5 - 3.6 6.5 0.5 99.8
16.5 8.8 Duty Free Intl 8.9 +0.1 93 9 8.9 0.6 14.6 29.7 0.8 154
18.2 6.8 Dyna-Mac 9.6 -0.4 2762 10.1 9.6 - - - 1.2 95.4
22.5 15.3 Dynamic Colours 21 susp - - - 1.8 4.8 11.4 0.9 44.1
77 41 EC World Reit 66cd -0.5 376 67 66 1 9.2 - 0.8 530.6
56 24 ESR-REIT 38.5 unch 7228 39 38 1 10.4 - 0.9 1361.6
70 13.6 Eagle HTrust USD US13.7 susp - - - - 18.8 - 0.1 119.6
233 112 Elec & Eltek USD US227 susp - - - 4.1 1.8 14 0.7 426
76 48.5 EliteComREIT GBP UK67 +1 220 67.5 67 - - - - 223.4
44 24 Ellipsiz 33 - - - - - 7.6 - 0.5 55.2
- - Emas Offshore 5 susp - - - - - - 0.6 22
105 77 EnGro 86 -6 9 90 86 3.7 2.9 9.2 0.4 102.3
6.8 2.1 Eneco Energy 2.6 susp - - - - - - - 16.9
13.5 6 Envictus 9.8 - - - - - - - 0.3 24.2
6.8 0.8 Enviro-Hub 3 +0.1 533 3 2.8 - - 100 0.7 31
- - Enviro-Hub R333 0.5 - - - - - - - - -
55 26.5 Excelpoint 36.5 - - - - 0.6 - 20.3 0.4 43.7
- - Ezion 4.3 susp - - - - - - - 173
- - Ezra 1.1 susp - - - - - - 0.1 32.4
178 107 F & N 130 unch 120 131 129 2.3 4.2 12.4 0.6 1886.2
4.1 1.4 FJ Benjamin 2 +0.2 54166 2.4 1.8 - - 100 0.3 18.2
10.3 4.6 FSL Trust 7.4 +0.1 263 7.4 7.2 - 27.3 - 0.6 132.1
15.9 11.1 Fabchem China 14.5 - - - - - - - 0.2 6.8
- - Falcon Energy 2.7 susp - - - - - - 0.4 24.1
78.5 35 Far East HTrust 50 -0.5 988 51 49.5 1 7.6 - 0.6 979.2
120 90 Far East Orchard 97.5 unch 13 97.5 96 1 6.2 16.4 0.4 422.2
23 10.8 Federal Int 16.6 - - - - - - 9.8 0.3 23.4
109 50 First Reit 59.5 unch 381 60 58.5 1 14.5 - 0.6 466.7
194 100 First Resources 138cd -4 439 143 137 3.2 1.7 18.2 1.6 2186
139 100 First Sponsor 125cbi -1 44 125 123 7.8 2.2 5.8 0.6 1005.8
78 41.5 Food Empire 60 -2 944 61.5 59 4.5 3.3 9.1 1.1 324
65 5 Forise Intl 20 +0.1 99 20 19.4 - - - 140.7 8.5
14.5 7 Fragrance 11.6 - - - - 0.6 17.7 9.8 0.6 779.5
307 155 Frasers Cpt Tr 233 -1 1311 234 231 1.4 5.2 - 1.1 2608.4
SGX Mainboard Transaction date: Aug 14
52-Wk Last Vol Day Div GrYld Net MCapHigh Low Company Sale +/- (’000) High Low C’vr % P/E P/BV $mil
52-Wk Last Vol Day Div GrYld Net MCapHigh Low Company Sale +/- (’000) High Low C’vr % P/E P/BV $mil
2 4THE BUSINESS TIMES / WEEKEND / AUGUST 15-16, 2020
T R A D E R S ’ G U I D E
74 31.5 Frasers HTrust 43.5 -0.5 78 43.5 43 1 10.1 - 0.6 835.7
140 62.5 Frasers L&C Tr 133 -2 11029 138 131 1.2 5.1 - 1.4 4539.6
184 99.5 Frasers Property 118 unch 15 119 118 3.2 5.1 7.4 0.5 3454
126 47.5 Frencken 104 -20 19577 114 102 3.3 2.9 10.4 1.4 442.5
29 18.5 Fu Yu 24 +0.5 435 24.5 23.5 1.1 6.7 14.2 1.1 180.7
- - Full Apex 40.5 susp - - - - - - 0.1 17.9
85 45 Fuxing China 65 - - - - - - - 0.1 11.4
18.5 4.4 G Invacom 9.7 -0.6 2405 10.7 9.6 - - - 0.4 27.4
87 65 GK Goh 73 - - - - 1.2 2.7 29.8 0.6 252.5
81.5 42.5 GL 57.5 +0.5 29 57.5 57.5 2.3 3.8 16.3 0.6 786.6
62 43 GP Industries 52.5 +1.5 48 52.5 51 2.2 3.4 13.1 0.7 302.9
21.5 13.8 GRP 16.8 - - - - - 3 37.3 0.5 32.5
42 15 GSH 19 -0.5 54 19 19 - 1.3 48.7 1 374.5
14.5 9 GYP Properties 10.5 - - - - - - 28.4 0.4 34.4
12.5 10 Gallant Venture 11.6 unch 41 11.6 11.6 - - - 0.7 629.3
96 51 * Genting Sing 72 unch 28945 73.5 70.5 1.4 5.6 12.6 1.1 8846.2
15.3 7 Geo Energy Res 11.3 +0.1 22 11.3 11.1 - - - 0.7 158.1
14.4 10.5 Global Inv 13.8cd +0.1 1474 13.8 13.6 1.2 7.2 11.9 0.8 237.9
18 5.8 Global Palm Res 9 - - - - - - - 0.3 18.6
60 25 Global Testing 35 unch 0 35 35 - - - 0.3 18.4
30 12.7 Golden Agri-Res 15.4 -0.3 27425 15.8 15.3 3.5 3.8 7.5 0.3 1977
23 9.6 Golden Energy 16.4 - - - - 2 1.8 28.8 0.8 385.9
22 12.6 Goodland 16 - - - - 0.1 1.9 533.3 0.3 63.1
30 15.1 Grand Banks 19.5 - - - - - - 3.8 0.6 36
2486 1640 Great Eastern 1913 +25 6 1968 1895 - 3.1 9 1.1 9054.6
4.2 1.6 Green Build 1.6 - - - - - - - 0.4 3.9
2.9 0.5 Guoan Intl 1.8 -1.1 79 2.1 1.8 - - - - 138.9
210 120 GuocoLand Ltd 142 unch 123 142 139 3.3 4.9 6.7 0.4 1680.2
26 15.5 HG Metal 17 unch 0 17 17 - - 28.8 0.2 22.2
45 18 HL Global Ent 22.5 - - - - - - 23.9 0.3 21.7
25.5 12.1 HPH Trust SGD 13.7 -0.3 2031 13.9 13.7 0.4 13.9 - 0.3 -
18.5 8.2 HPH Trust USD US9.9 -0.2 18594 10.2 9.8 0.5 26.6 - 0.2 862.4
385 265 HPL 307 - - - - 1.1 3.3 32.8 0.8 1601
65 40.5 HRnetGroup 49.5 +0.5 271 49.5 48.5 1.8 5.7 9.6 1.6 500.6
16.9 12.6 Hafary 14.5 -0.2 1 14.5 14.5 2.3 6.9 6.2 0.9 62.4
55 31 Hai Leck 50 - - - - 0.3 4 166.7 0.9 103
51 21 Halcyon Agri 21.5 -1 307 22 21.5 - - - 0.4 342.9
- - HanKoreEnv 100 89.5 - - - - - - - - -
25 15 Hanwell 23 +0.5 4682 25 22.5 4.4 1.1 21.1 0.5 131.3
1422 910 Haw Par Corp 952cd -18 300 975 945 0.7 3.2 11.6 0.8 2206.6
32 17.8 Heeton 19.4 - - - - 6 2.3 4.8 0.2 94.6
168 70 Hi-P Intl 126 -6 3398 131 126 5 2.2 12.6 1.6 1117.8
80 62 Hiap Hoe 65.5 - - - - 3.1 2.3 13.9 0.4 314
7.2 1.8 HiapSeng 2 susp - - - - - - - 6.1
242 182 Ho Bee Land 212 +10 510 219 208 5 4.7 4.2 0.4 1566.6
38.5 23 Hock Lian Seng 26 -1 16 27 26 2 4.6 10.4 0.6 133.1
0.3 0.2 Hoe Leong 0.2 susp - - - - - - 2 11.2
87 53 Hong Fok 66 - - - - 10 1.5 4 0.2 574.6
21 11.8 Hong Lai Huat 12.5 - - - - - - 25 0.2 27.7
70.5 36 Hong Leong Asia 49 -2 153 50.5 49 4.6 2 10.6 0.5 370.7
272 195 Hong Leong Fin 237cd +7 66 238 230 1.5 6.3 10.3 0.6 1061.6
602 346 * HongkongLand USD US367cd -12 6155 377 364 0.4 6 43.3 0.2 8634.8
26 12.5 Hor Kew 18 - - - - - - 16.2 0.2 9.8
133 88 Hotel Grand 92 unch 4 93 92 0.9 4.3 25.3 0.5 668.4
312 229 Hotel Royal 300 +15 0 300 282 0.8 0.8 62.2 0.4 302.4
187 130 Hotung Inv 147 unch 23 147 146 1.2 7.8 10.3 0.5 186.8
- - Hu An Cable 0.9 susp - - - - - - 0.8 9.1
36.5 25 Hwa Hong 30 - - - - 1 3.3 30.3 1.1 196.1
- - Hyflux 21 susp - - - - - - 1.6 181.7
- - Hyflux 6% CPS 6537 susp - - - - - - - -
245 71.5 IFAST 228 -9 1454 237 227 1.1 1.4 64.2 6.5 620
24.5 17.2 IFS Capital 20 +0.5 39 20 19.5 3.2 3.9 8 0.4 75.2
200 151 IHH Healthcare 175 +3 40 177 173 2.1 0.8 100.6 2.2 15360.1
33 13.1 IPC Corp 13.5 -1.6 30 15.1 13.5 - - - 0.2 11.5
88.5 40.5 IREIT Global 73cd +0.5 705 74 72 - 7.4 - 0.8 467.5
45 13.4 ISDN Hldgs 36 -2.5 9097 39 36 2.4 1.1 21.4 0.9 156.9
- - Inch Kenneth - susp - - - - - - - -
33.5 24 Indofood Agri 29 -1 8 29 29 - - - 0.4 419.9
6 2.1 Informatics 3 - - - - - - - 9.4 5.3
- - InnoPac 0.2 susp - - - - - - - 23.7
50.5 30 InnoTek 40 unch 593 40.5 39 7.4 3.8 5.4 0.6 98.7
10.8 2.4 Interra Resource 5.2 +0.1 2562 5.2 5 - - - 0.9 34.1
5 0.5 Intl Cement 3.7 -0.5 11515 4.7 3.5 - - 12.8 1 209.6
32 19 Intraco 26.5 +1 29 26.5 25 - - 27.3 0.4 27.5
570 279 Isetan 296 unch 0 296 296 - 1.7 - 1 122.1
68 38 JB Foods 56cd -2 88 57 55.5 - 5 4.8 0.8 169.8
- - JES Intl 2.6 susp - - - - - 6.5 - 31.4
5968 3737 * JMH USD US4025cd -115 240 4141 40252238.2 4.3 5.3 0.4 30166.6
3350 1781 * JSH USD US2021cd -49 230 2080 2015 5.7 1.8 5.2 0.3 22673.6
15 12.3 Jackspeed 13.1 susp - - - 1 27.6 3.7 187.1 39.5
4.3 1.3 Jadason 3.2 -0.1 1651 3.4 3.2 - - - 0.8 23.2
73.5 37 Japfa 64 -1.5 3505 66.5 64 7.9 1.6 7.4 0.9 1323.2
3335 1658 * Jardine C&C 1903cd -38 1853 1985 1903 2.5 6.2 6.3 0.8 7520.7
0.6 0.1 Jasper Inv 0.3 +0.1 1 0.3 0.2 - - - - 13.1
3 0.5 KS Energy 1.3 susp - - - - - - - 17.2
- - KS Energy R 25.5 - - - - - - - - -
- - KS Energy R250 25 - - - - - - - - -
49 25 KSH 35 +1.5 93 35 33.5 1.2 6.3 12.6 0.6 200.8
6.4 1.4 KTL Global 2.2 -0.2 111 2.6 2 - - - 1.2 6.9
35 25 Karin Tech 30 - - - - 1.1 7.9 11.5 0.8 64.4
15.9 5.1 Kencana Agri 7.6 - - - - - - - 1.5 21.8
47.5 27.5 Keong Hong 33.5 - - - - 4 5.2 4.8 0.3 81.3
55.5 35 Kep Infra Tr 54 unch 5452 54.5 53.5 0.2 6.9 - 2.2 2694.9
80 39 KepPacOakReitUSD US72 +0.5 1205 72.5 71.5 1 8.3 - 0.6 677.6
697 471 * Keppel Corp 482 unch 4569 485 480 1.9 4.1 12.4 0.8 8784.3
309 165 Keppel DC Reit 292 -3 4464 298 292 1 2.6 - 2.5 4768.8
129 79 Keppel Reit 109 +1 5009 109 107 1 5.1 - 0.8 3810.7
200 133 Khong Guan 150 -5 6 165 150 - 1.3 - 0.6 38.7
10.9 3.9 King Wan 6.8 -0.1 66 6.8 6.8 - - 32.4 0.4 23.7
52.5 16.3 KingsmenCreative 22 +0.5 119 22 21 0.1 4.5 84.6 0.4 44.4
70 33.5 Koda 43.5 - - - - 3.5 5.7 5 0.6 36.1
27.5 13.5 Koh Bros 15.3 +0.1 0 15.3 15.3 3.5 2.6 10.9 0.2 73.4
4.2 3.3 Koon 4.2 susp - - - - - - - 11.1
81.5 54.5 Koufu 68.5cd +0.5 235 68.5 67.5 2 3.6 13.7 3.9 380.3
- - KrisEnergy 3 susp - - - - - - - 45.1
57 20 LCT 44 - - - - - - 12 0.5 17.5
70 45 LHT 61 - - - - 1.4 4.9 14.7 0.6 32.5
- - Lafe 65 susp - - - - - - 0.3 16.5
5.8 0.3 Leader Env 4.3 -0.1 318 4.3 4.3 - - - 3.6 57.1
3 2.4 Leader Env R 2.5 unch 747 2.5 2.5 - - - - -
1.9 1.9 Leader Env R1 1.9 - - - - - - - - -
96 44 Lendlease Reit 63cd unch 1207 63 62.5 2.4 4.8 - 0.7 738.2
54.5 31 Lian Beng 38.5 unch 42 39 38 2.5 2.6 6.7 0.3 204
- - Linc Energy 8.9 susp - - - - - - - 20.2
56.5 30 Lion Asiapac 37.5 - - - - - 9.3 - 0.4 30.4
24.5 10.2 Lippo Malls Tr 12.1 unch 2162 12.2 11.8 1.3 18.4 - 0.4 332
- - Lonza 7997 - - - - - - - - 5957.8
- - Lorenzo Intl 1.6 susp - - - - - - - 7
48 30 Low Keng Huat 37 -1 71 37 36.5 1.2 4.1 21.4 0.4 273.4
38 27.5 Lum Chang 34.5 unch 5 34.5 34.5 3.4 5.2 5.6 0.5 132.8
45 36.5 Lung Kee Bermuda 36.5 - - - - 1 10.9 8.9 - 230.6
39 17.9 Luxking 37 - - - - - - - 0.2 4.7
4 0.4 Luzhou Bio-Chem 2.8 unch 30 2.8 2.8 - - - - 16.6
- - M Development 0.2 susp - - - - - - - 3.9
20 8.9 MDR 9.2 unch 364 9.3 9.1 - - - 54.1 83.3
10.5 6 MFG Integration 9.1 +0.2 429 9.3 9 0.9 206.6 0.5 0.9 21.8
31 10.3 MM2 Asia 18 - - - - - - 60 0.9 208.4
0.7 0.1 MMP Resources 0.3 unch 355 0.3 0.2 - - - - 5.1
29.5 19.9 MSC 24.5cd - - - - - - - - 98
33.5 18 MTQ 20 - - - - 4.1 2.5 9.8 0.6 43.3
13 5.6 MYP 8.9 - - - - - - - 0.4 141.7
185 106 Man Oriental USD US154 -1 83 157 152 - 1.9 - 0.4 1945.4
6.7 1 Manhattan Res 2 - - - - - - - 0.6 59.7
108 54.5 ManulifeReit USD US75 +2.5 3523 75.5 72 1 7.9 - 0.7 1180.1
248 146 * Mapletree Com Tr 191 -1 6498 195 189 0.9 4.2 - 1.1 6329.6
332 186 * Mapletree Ind Tr 311 -5 4240 317 311 1 3.9 - 1.9 7303
221 120 * Mapletree Log Tr 212 -1 8993 215 210 1 3.8 - 1.8 8065.5
138 63 Mapletree NAC Tr 87.5 -0.5 6515 89.5 87 0.9 8.1 - 0.6 2946
2.8 1 MarcoPolo Marine 1.5 +0.1 4373 1.5 1.4 - - - 0.5 52.9
67 40 Meghmani SDS 48 - - - - 15.6 - 252.6 42.2 73.5
- - Memstar Tech 0.1 susp - - - - - - - 3.2
9.7 1.4 Mencast 3 - - - - - - - 0.5 12.9
15.1 4.5 Mermaid Maritime 6.6 -0.2 2539 6.8 6.5 - - - 0.2 93.3
98 59 Metro 75 unch 20 75 75 1.9 2.7 19.2 0.4 623.7
26 18 Mewah Intl 20.5 - - - - 1.2 2.2 19.5 0.4 308.9
205 132 Micro-Mechanics 200 +2 69 200 198 0.9 4.5 21.5 5.1 278.1
- - Midas 19.2 susp - - - - - - 0.4 364.7
60 20 MindChamps 31 unch 45 32 30.5 - - 10.8 1.2 74.9
37 4 Mirach Energy 6.5 - - - - - - - 3.8 15
138 71 Multi-Chem 130 -3 15 130 123 - 5.1 14.9 1 117.1
4.8 2.5 Mun Siong Engg 3.5 - - - - 2.1 1.1 38.9 0.4 20.4
0.1 0.1 NGSC 0.1 susp - - - - - 3.3 0.2 6.4
107 66 NSL 66 - - - - - 7.6 - 0.5 246.5
1.1 0.2 Nam Cheong 0.4 susp - - - - - 1.3 - 18.1
40 28 Nam Lee Metal 31 - - - - 2 4.8 7.7 0.5 75.6
28.5 15.6 NeraTel 17 +0.2 4 17.3 17 1.2 5.9 14 0.9 61.5
103 78.5 NetLink NBN Tr 97.5 +0.5 14553 98 96.5 2 5.2 - 1.3 3799.5
27.5 15 New Silkroutes 17.3 - - - - - - - 0.6 36.7
SGX Mainboard Transaction date: Aug 14
52-Wk Last Vol Day Div GrYld Net MCapHigh Low Company Sale +/- (’000) High Low C’vr % P/E P/BV $mil
52-Wk Last Vol Day Div GrYld Net MCapHigh Low Company Sale +/- (’000) High Low C’vr % P/E P/BV $mil
2 5THE BUSINESS TIMES / WEEKEND / AUGUST 15-16, 2020
T R A D E R S ’ G U I D E
18.5 9.1 New Toyo 17.5 +3.5 304 17.5 14.5 - 5.1 - 0.5 76.9
0.5 0.1 Nico Steel 0.2 unch 3428 0.2 0.2 - - - 0.5 9.9
- - Noble 8.1 susp - - - - - - - 107.7
26.5 13 Noel Gifts Intl 16 - - - - - 12.5 - 0.5 16.4
33.5 20 Nordic 22.5cd +1 45 23 21.5 2.6 3.8 10.2 1 90
16.4 3.1 NutryFarm 4.1 - - - - - - - 0.6 4
1123 780 * OCBC Bank 895cd -2 4764 902 887 2.1 5.9 8 0.8 39457.4
2.4 1.3 OKH Global 1.6 -0.1 454 1.6 1.6 - - - 0.2 18.1
21 12.7 OKP 16.2 -1.2 1 16.2 16.2 - 4.3 - 0.4 50
154 93 OUE 118 -1 172 120 118 4.7 5.1 4.2 0.3 1158.3
57.5 28 OUE Com Reit 37 unch 1315 37.5 36.5 1.2 8.9 - 0.6 2002.4
0.8 0.2 Oceanus 0.8 unch 23975 0.8 0.7 - - - 9 194.4
198 126 Olam Intl 141cd +1 2553 142 140 2.4 5.7 8.8 0.7 4612.1
15.9 3.4 Ossia Intl 8.5 +0.4 3 8.5 8.5 2.3 16.5 4 0.5 21.5
4.3 0.3 Ouhua Energy 2.2 - - - - - - 3 0.3 8.4
38.5 26 Overseas Edu 29 +0.5 6 29 29 0.7 9.5 15.3 0.9 120.5
38.5 19.5 Oxley 21.5 +0.5 428 21.5 21 3.5 4.7 6 0.6 912.9
62 36 PEC 49.5 +2.5 161 49.5 48 1.6 4 15.5 0.5 126.6
96 66 PNE Industries 82 - - - - 1.1 7.3 8.5 0.9 68.8
14.8 3.4 PSL 14.8 susp - - - - - - 0.3 8.2
- - Pacific Andes 2.2 susp - - - - - 0.7 0.1 189.7
39.5 26 Pacific Century 31.5 +1 466 31.5 30.5 0.2 2.4 26.5 0.8 975.3
- - Pacific Radiance 10.4 susp - - - - - - - 75.5
14 6.6 Pan Hong 10.9xd unch 771 11.1 10.5 2.9 18.3 2.4 0.4 56.6
549 386 Pan Ocean 407 - - - - - - 12.6 0.6 757.3
42 25.5 PanUnited 29.5 +0.5 9 30 28.5 3.7 5.4 10.1 1 207
2.7 0.2 Parkson Retail 1.7 +0.1 1796 1.9 1.7 - - - - 11.5
380 256 ParkwayLife Reit 354 -1 304 360 350 1 3.7 - 1.8 2139.5
4.4 0.7 Pavillon 1.9 - - - - - - 21.1 0.3 7.4
79 35.5 Penguin Intl 42 +1 35 42.5 40.5 5 4.2 4.8 0.5 92.5
96 27.5 Perennial Hldgs 94.5 - - - - 1.2 0.2 410.9 0.6 1573.6
62.5 11.5 Pharmesis Intl 26.5 -11 0 26.5 26.5 - - - 0.5 6.1
- - Plastoform 1.3 susp - - - - - - - 0.5
285 173 Powermatic Data 269 +4 28 271 255 - - 10.8 1.5 96.3
107 50 Prime US REIT USD US77xd -2.5 1974 78.5 76 - 4.1 - 0.6 811.7
50 18.5 Procurri 32 -0.5 282 33 32 - - 24.1 1.8 94
59.5 43.5 PropNex 59cd +0.5 533 59 57.5 1.5 5.9 10.9 2.9 218.3
1930 1120 Prudential USD US1898cd -12 0 1900 1898 - - - - 49196.2
73.5 30 Q&M Dental 46cd -0.5 353 47.5 46 2.8 6.1 20.1 3.2 377.2
91 60 QAF Ltd 87 -0.5 198 87.5 86.5 1 5.7 18.1 1 497
17.5 9.2 Qian Hu 14 -2 12 14 14 2.7 2.1 17.3 0.3 15.9
6.5 1.2 RH PetroGas 2.5 - - - - - - 6.4 - 18.4
2 1.7 RHT HealthTrust 1.9 susp - - - - - - 0.9 15.4
50 20 Raffles Infrastructu 43.5 - - - - - - 3.6 0.7 29.8
110 73 Raffles Medical 82 +0.5 532 82.5 81 1.3 3 24.7 1.7 1500.2
13.6 6.2 RafflesEdu 10.5 -0.1 88 10.6 10.5 - - 3.6 0.2 153.5
0.4 0.1 Reenova Investment 0.2 unch 3350 0.2 0.2 - - - 0.4 7.9
16.8 1 Regal Intl 14 unch 18 14 14 - - 12.3 3.8 32.3
0.2 0.1 Renaissance United 0.1 - - - - - - 10 0.2 6.2
490 68.5 Riverstone 406 -9 6544 422 395 2.5 0.6 70.1 10.4 3014.4
40 25 Roxy-Pacific 32.5 unch 30 32.5 32.5 1.8 4 14 0.8 426.7
- - Ryobi Kiso 13 susp - - - - - - 1.3 39.8
517 252 * SATS 294 +6 6522 294 287 2.5 2 19.5 2 3302.9
422 253 SBS Transit 280 -2 214 281 277 2 4.7 10.7 1.6 873.2
330 129 SEVAK 155 - - - - - - 17.9 0.5 20.9
1072 796 * SGX 871cd +3 2258 879 865 1.4 3.5 19.8 7.5 9334
17.8 15 SHS Hldgs 16.2 unch 235 - - - 1.9 - 0.7 115.1
668.6 320 * SIA 379 +8 8465 380 368 - 2.1 - 0.6 11284.9
289 148 SIA Engineering 184 -2 463 187 183 2.2 4.3 10.6 1.3 2068.3
30 18.1 SIIC Environment 20.5 unch 812 20.5 19.3 4.6 4.9 4.6 0.3 534.4
55 35 SP Corp 46 +1 20 46 46 - - 6.5 0.3 16.1
234 103 SPH 111 -1 2876 113 110 1.1 10.8 8.5 0.5 1776.7
116 67 SPHREIT 86 +0.5 2663 86 85.5 1 6.5 - 0.9 2376.3
442 278 * ST Engineering 339cd +12 15306 343 330 1.2 4.4 18.3 4.8 10584.9
56.5 25 SUTL Enterprise 36 +0.5 0 36 36 1.4 - 12.5 0.5 31.1
48.5 22.5 Sabana Reit 36.5 unch 505 37 36.5 1 8 - 0.7 384.4
11.5 3.3 Sakae 5 - - - - - - - 0.2 7.1
- - Samko 100 5.5 - - - - - - - 916.7 -
3.7 0.2 Samko Timber 2 -0.6 51 2.1 2 - - 100 2.2 47.6
16 10.1 SamuderaShipping 15 - - - - 1.3 5 15.3 0.3 80.9
11.7 2.3 Sapphire 7.8 - - - - - - 5.7 0.3 31.8
42.5 16.2 Sarine Tech 21.5 +1 75 21.5 20.5 - 6.3 - 0.9 76
92 52.5 Sasseur Reit 77.5cd +0.5 2157 78 76.5 0.8 8.4 - 0.8 931.1
27 16 Second Chance 18 - - - - 1.6 2.2 28.6 0.5 136
236 136 * Sembcorp Ind 191 -3 3387 193 191 2.7 2.6 16.2 0.6 3417.5
92.6 20.9 Sembcorp Marine 22.5xri -2 15468 24.5 22.5 - - - 0.2 2824.8
- - Sembcorp Marine R - - - - - - - - -
- - Sembcorp Marine R - - - - - - - - -
12 4.5 Serial System 7.4 -0.3 20 7.4 7.4 3.5 4.7 6.1 0.4 66.6
10.3 3.7 Seroja Inv 7.9 - - - - - - 12.2 0.7 30.8
901 520 Shangri-La HKD HK569 - - - - - 3.9 17.3 2.4 20401
186 100 Sheng Siong 178xd -2 4593 178 173 1.4 2 35.3 6.9 2676.3
428 166 Shinvest 329 +29 1 329 300 40.6 2.7 1.4 0.5 98.5
52.5 21 Silverlake Axis 29.5 -1.5 14133 31.5 29.5 1.7 6.1 9.7 3.7 795.5
23.5 15 Sin Ghee Huat 18.5 +0.5 21 18.5 18 1.8 3.2 17.1 0.5 41.1
34.5 24 Sin Heng Mach 31 unch 88 31 30 - - - 0.3 35.6
27.5 13.5 Sinarmas Land 15.8 - - - - 24 2.4 1.7 0.1 718.8
145 99.5 Sing Inv & Fin 120 - - - - 2.1 5 9.4 0.5 189.2
10 6.1 SingHaiyi 6.9 - - - - - - - 0.5 297.1
41.5 28.5 SingHoldings 37 +0.5 57 37 36.5 - 5 3.3 0.5 148.4
242 181 SingIndexFund 182 - - - - - - - - 242.6
12 1 SingMyanmar 3.2 +0.5 103 3.9 2.7 - - - 0.3 10.1
99.5 57.5 SingPost 71 -0.5 1950 72 71 1.2 4.9 20.9 1 1615.3
30 25 SingReinsurance 28.5cd +0.5 50 28.5 28.5 1.2 4.6 17.6 0.6 175.6
30 22 SingShipping 24.5 unch 0 24.5 24.5 3.3 4.1 7.8 0.8 107.1
348 219 * Singtel 244 +2 17252 245 240 0.4 5 37.1 1.5 39843.2
345 221 Singtel 10 242 unch 25 244 242 1.4 7.2 10 - -
5.4 1.1 Sino Grandness 2.2 unch 14033 2.3 2.2 - - 0.5 - 25.3
- - Sinopipe 13 susp - - - - - - - 33.2
22 13.5 Sinostar Pec 15 +0.5 34 15 14.8 - - 4.4 0.6 96
6.5 2.6 Soilbuild Const 2.7 - - - - - - - 0.4 18.2
58.4 19.9 SoilbuildBizReit 41 -0.5 1587 41.5 41 0.9 10.3 - 0.7 519.9
16.9 8.1 Soup Restaurant 8.1 -0.9 140 8.6 8.1 1.4 2.5 30 2.4 24.2
40 22.5 Southern Pkg 22.5 - - - - 10.1 1.1 9 0.1 15.8
112 68 Spindex Ind 85 +5 2 85 85 4.4 3.9 6.4 0.8 98.1
90.5 69 Spura Finance 79.5 - - - - 1.3 4.4 16.9 0.5 126.2
175 40 Sri Trang Agro 121 +3 8558 128 119 - - - - 1858.6
51 29.5 Stamford Land 32.5 +1 10 32.5 31.5 6.4 1.5 10.5 0.5 280.9
25 12.8 Stamford Tyres 17.5 - - - - - 2.9 - 0.4 41.4
155 109 StarHub 123cd unch 856 124 122 1.2 7.3 11.9 3.9 2129.5
77 37.5 StarhillGbl Reit 44.5 -1.5 5360 45.5 44.5 1.1 6.7 - 0.5 976.2
76 39.5 Straco 49.5 unch 302 50 47.5 1.8 5.1 11.2 1.5 430.1
221 149 Straits Trading 154 -2 112 156 154 3.5 3.9 7.4 0.4 675.4
- - StratechGroup 6.6 susp - - - - - - - 10.3
7.3 2.2 SunMoon Food 4.8 -0.1 2910 5.1 4.8 - - - 4.8 37.7
- - SunVic Chemical 2.2 susp - - - - - - - 13.3
136 73.5 Sunningdale Tech 114cd -1 164 117 113 0.5 7 27.2 0.6 218.8
64 30 Sunpower 57.5 -0.5 6766 60.5 57 17.7 0.4 16.9 1.2 455.3
57 28 Sunright 35 -2.5 95 37.5 34.5 - - - 0.5 43
52.5 25.5 Suntar Eco-City 52.5 +2.5 9 52.5 52.5 - - 5250 1.9 32.9
196 104 Suntec Reit 137 unch 7222 140 135 0.9 6.9 - 0.7 3864.5
- - SuntecReit A - - - - - - - - - -
- - Swee Hong 0.3 susp - - - - - - - 9.1
- - Swiber 10.9 susp - - - - - - 0.1 50.2
- - Swing Media Tech 46 susp - - - 30.6 - 1.5 0.1 26
- - SwingMedia R - - - - - - - - - -
- - Swissco 5.2 susp - - - 92.6 1.9 0.8 - 35.6
20 8.8 TA 9.7 -1.5 194 9.7 8.8 - - - 0.4 61.9
7.9 2 TEE Intl 3.3 unch 300 3.3 3.3 - - - 0.9 20.4
27 16.2 TIH 21 +2 15 21 17.5 5.9 4.8 3.5 0.4 50.7
- - TT Intl 1.4 susp - - - - - - - 14.7
25 11.1 TTJ 15 - - - - 2.7 2.7 13.9 0.4 52.5
34.5 26 Tai Sin Electric 30 -1 50 30 30 1.2 7.5 11.2 0.8 138.9
58.5 25 Tat Seng Pkg 53.5cd +5.5 149 56 49.5 4.6 3.7 5.9 0.6 84.1
- - Tech Oil & Gas 7.1 susp - - - - - 1.7 0.3 17.6
64.5 34.5 Teckwah 64 unch 1606 64.5 64 2.6 2.3 16.7 0.9 149.5
22 18.4 TeleChoice Intl 19 - - - - 1.2 5.3 16.1 1.3 90.7
95.5 49 * ThaiBev 60.5 unch 38207 61 59.5 1.9 2.5 14.4 2.6 15195
50 35 Thakral 43cd - - - - 1.7 9.3 6.2 0.4 56.3
2.5 1 The Place Hldg 1.1 -0.1 130 1.1 1.1 - - - 0.7 64.7
83 50 TheHourGlass 67.5 -1 31 68.5 67.5 5.4 3 6.2 0.8 475.9
6.9 3.8 Thomson Medical 5.4 -0.1 2980 5.6 5.4 - - - 2.2 1939.6
99 50.5 Tianjin ZX USD US85.5 unch 391 86 85.5 2.7 - 7.5 0.6 171
24 11.5 Tiong Seng 16 - - - - 4.8 3.1 6.7 0.3 73.5
57 28 Tiong Woon 38.5 -1.5 97 39.5 38.5 6.3 0.5 30.3 0.3 89.4
24.5 14.1 Top Global 16 - - - - - - 94.1 0.2 327.4
955 140 Top Glove 820 -34 1274 862 808 1.9 0.3 172.3 19.6 22201.4
11 5.9 Transit Concrete 6 -2 70 6 6 - - - 0.4 4.2
15 6.2 Travelite 8 -0.3 630 8.7 7.6 - - - 0.2 5
9.7 4.8 Trek 2000 Intl 9 - - - - - - 300 0.5 29.8
- - Triyards 8.4 susp - - - - - - 0.3 27.3
34.5 19.5 Tuan Sing 30 unch 541 30 29 - 2 10.7 0.3 360.1
13 5.2 Tye Soon 10.6 +0.5 88 10.6 9.1 - - 40.8 0.2 9.2
- - UE Pref 190 - - - -1035.3 3.9 - - 1.7
305 194 UIC 209 -3 48 210 209 10.6 1.9 5 0.4 2994.3
119 55 UMS 108cd -10 24489 115 106 1.6 3.2 17.3 2.2 651
79.5 51 UOA 65 - - - - - 4.2 7.9 0.7 828
2702 1728 * UOB 2007cd -1 2160 2018 1985 2 6.5 7.9 0.9 33728.5
SGX Mainboard Transaction date: Aug 14
52-Wk Last Vol Day Div GrYld Net MCapHigh Low Company Sale +/- (’000) High Low C’vr % P/E P/BV $mil
52-Wk Last Vol Day Div GrYld Net MCapHigh Low Company Sale +/- (’000) High Low C’vr % P/E P/BV $mil
2 6THE BUSINESS TIMES / WEEKEND / AUGUST 15-16, 2020
T R A D E R S ’ G U I D E
127 108 UOB Kay Hian 125 unch 212 126 125 2 3.4 14.7 0.7 1029.5
724 621 UOI 671 - - - - 2.7 3.6 10.2 1 410.4
858 601 * UOL 669 +5 1511 678 664 3.2 2.6 11.8 0.6 5649.2
- - UOL A - - - - - - - - - -
12 3.5 USP Group 10.1 - - - - - - - 0.3 9.9
76 37 Uni-Asia Grp 47 -1.5 79 48 46.5 2.4 8.9 4.6 0.2 36.9
40 28.5 Union Steel 31 -5 24 36.5 31 - - - 0.2 12.2
12 3.6 United Food 4 -0.2 15 5.4 4 - - - 0.2 7.6
- - Universal Res 17 susp - - - - - - 0.1 3.6
72 44 UtdHampshReitUSD US58cd unch 307 58.5 57.5 - - - 0.5 286.1
33.5 23.5 ValueMax 31 - - - - 2.8 5.2 6.6 0.8 172.2
86 43.5 Valuetronics 56.5 -1.5 1175 57.5 56.5 2.1 6.5 7.5 1.1 243.8
2048 1252 * Venture Corp 2025cd -7 1119 2048 2003 1.8 3.5 16.1 2.3 5876.5
16.2 6.3 Vibrant Group 10.8 -0.6 197 11 8.8 - - 16.6 0.3 75.4
15.2 9.4 VibroPower 13.8 - - - - - - - 0.4 7.6
250 167 Vicom 213 +4 232 213 209 0.8 18 26.6 6.3 755.2
44 7 Vicplas Intl 32 -4 8140 36.5 31 1.7 2.3 38.1 2.7 162.5
23 16 Wee Hur 19.2cd +0.7 45 19.2 18.5 4.7 4.2 5.1 0.4 179.7
56.5 18.6 Willas-Array 35 - - - - - - - 0.3 28.8
495 283 * Wilmar Intl 483cd -4 5433 489 481 2.2 2.6 17.6 1.3 30928.4
209 141 Wing Tai 166 unch 135 167 165 1.2 3 31.9 0.4 1318
23.5 14.5 World Precision 23 - - - - 0.7 3 32.9 0.4 92
18 5 XMH 9 -3 26 9 9 - - - 0.2 10.3
36 24.5 YHI Intl 33 +2 42 33 32 2 6.7 7.4 0.4 96.5
120 73 * YZJ Shipbldg SGD 95 -0.5 10560 96 94.5 3.4 4.7 6.2 0.6 3770.6
- - Yamada Green Res 33 susp - - - - - - 1 58.3
137 90 Yanlord Land 127 -1 5101 128 125 4.9 5.4 3.8 0.4 2459.5
98 65 Yeo Hiap Seng 80 -0.5 13 80.5 80 0.8 5 26.2 0.8 463.9
12.4 6 Ying Li Intl 8.7 unch 265 8.9 8.6 - - - 0.4 222.1
41.5 15.5 Yoma Strategic 29.5 unch 5521 30 29 - - 12.1 0.8 660.1
104 60 Yongmao 93 - - - - 13.5 1.1 6.9 0.5 82.5
17.2 7.6 Yongnam 8.8 +0.1 551 8.8 8.7 - - - 0.2 46
- - Yorkshine 48 susp - - - - - 2.8 4.4 91.9
16 9.2 Yunnan Energy 15.9 - - - - - - 24.8 0.4 43.8
- - YuuZoo Networks 3.8 susp - - - - - - - 31.3
64 38 Zheneng Jinjiang 55 - - - - - - 27 0.7 799.7
80 38 Zhongmin Baihui 50 -8 0 50 50 1.8 6 9.5 2.7 98.2
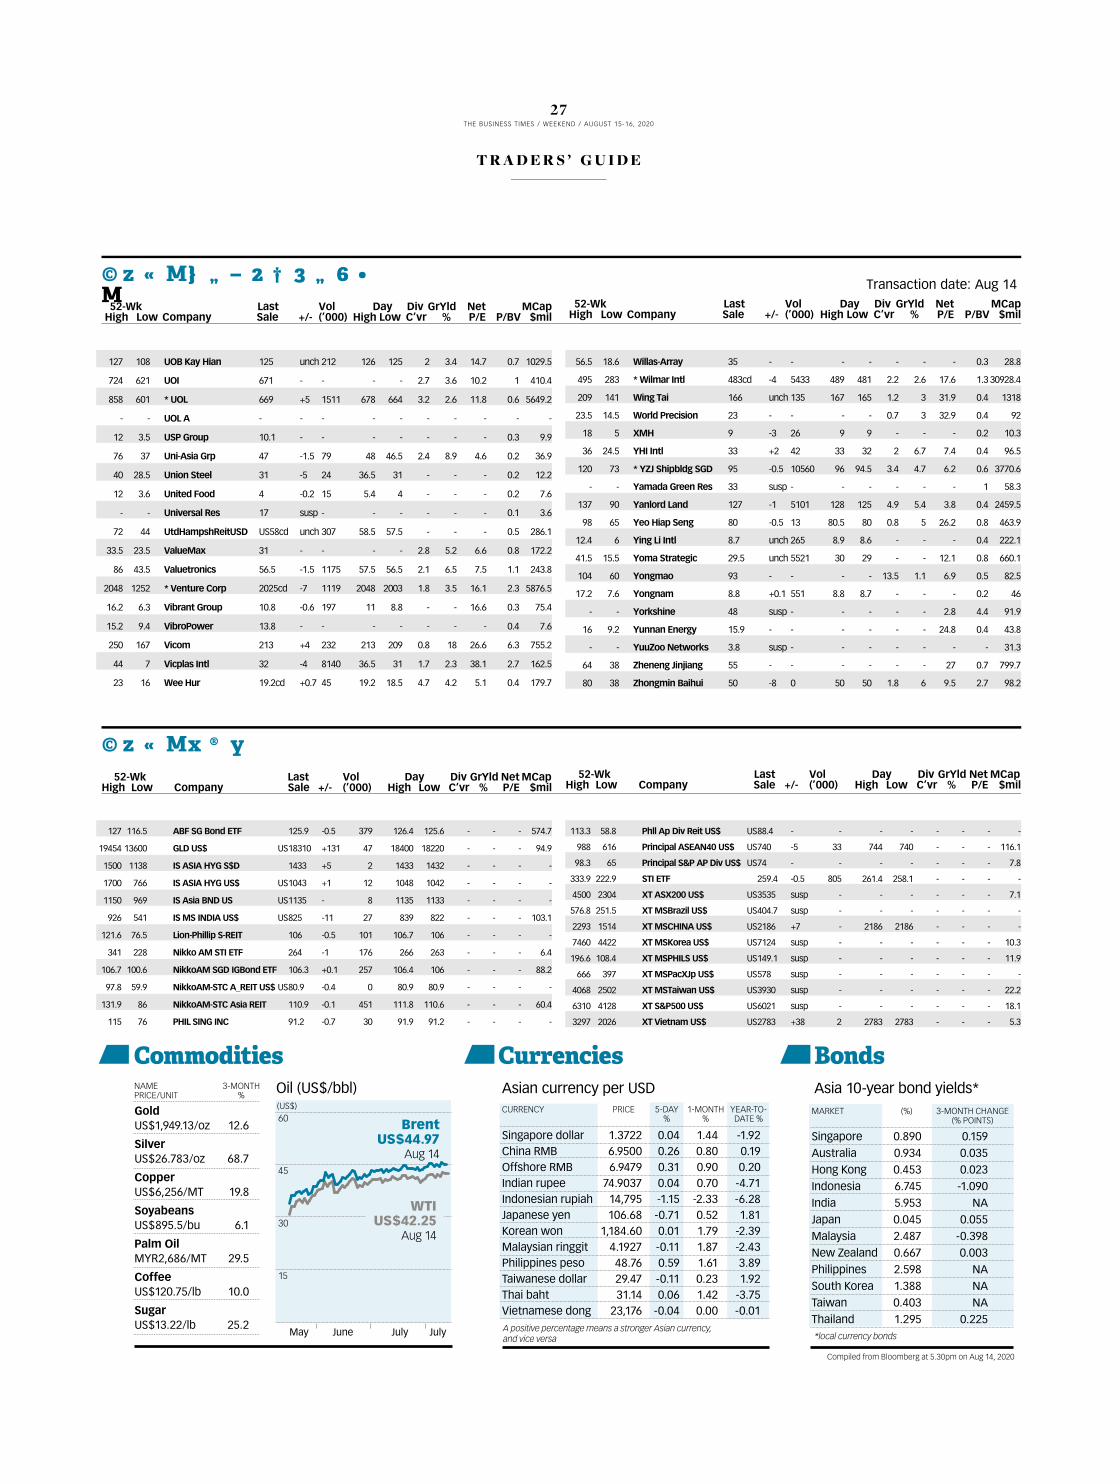
CommoditiesAsian currency per USD
(US$)
Oil (US$/bbl)
Currencies Bonds
May June July July
CURRENCY PRICE
Compiled from Bloomberg at 5.30pm on Aug 14, 2020
5-DAY%
1-MONTH%
YEAR-TO-DATE %
NAMEPRICE/UNIT
3-MONTH%
A positive percentage means a stronger Asian currency, and vice versa *local currency bonds
60
45
30
15
MARKET (%) 3-MONTH CHANGE (% POINTS)
Asia 10-year bond yields*Gold US$1,949.13/oz 12.6
Silver US$26.783/oz 68.7
Copper US$6,256/MT 19.8
Soyabeans US$895.5/bu 6.1
Palm Oil MYR2,686/MT 29.5
Coffee US$120.75/lb 10.0
Sugar US$13.22/lb 25.2
Singapore dollar 1.3722 0.04 1.44 -1.92China RMB 6.9500 0.26 0.80 0.19Offshore RMB 6.9479 0.31 0.90 0.20Indian rupee 74.9037 0.04 0.70 -4.71Indonesian rupiah 14,795 -1.15 -2.33 -6.28Japanese yen 106.68 -0.71 0.52 1.81Korean won 1,184.60 0.01 1.79 -2.39Malaysian ringgit 4.1927 -0.11 1.87 -2.43Philippines peso 48.76 0.59 1.61 3.89Taiwanese dollar 29.47 -0.11 0.23 1.92Thai baht 31.14 0.06 1.42 -3.75Vietnamese dong 23,176 -0.04 0.00 -0.01
Singapore 0.890 0.159Australia 0.934 0.035Hong Kong 0.453 0.023Indonesia 6.745 -1.090India 5.953 NAJapan 0.045 0.055Malaysia 2.487 -0.398New Zealand 0.667 0.003Philippines 2.598 NASouth Korea 1.388 NATaiwan 0.403 NAThailand 1.295 0.225
BrentUS$44.97
Aug 14
WTIUS$42.25
Aug 14
127 116.5 ABF SG Bond ETF 125.9 -0.5 379 126.4 125.6 - - - 574.7
19454 13600 GLD US$ US18310 +131 47 18400 18220 - - - 94.9
1500 1138 IS ASIA HYG S$D 1433 +5 2 1433 1432 - - - -
1700 766 IS ASIA HYG US$ US1043 +1 12 1048 1042 - - - -
1150 969 IS Asia BND US US1135 - 8 1135 1133 - - - -
926 541 IS MS INDIA US$ US825 -11 27 839 822 - - - 103.1
121.6 76.5 Lion-Phillip S-REIT 106 -0.5 101 106.7 106 - - - -
341 228 Nikko AM STI ETF 264 -1 176 266 263 - - - 6.4
106.7 100.6 NikkoAM SGD IGBond ETF 106.3 +0.1 257 106.4 106 - - - 88.2
97.8 59.9 NikkoAM-STC A_REIT US$ US80.9 -0.4 0 80.9 80.9 - - - -
131.9 86 NikkoAM-STC Asia REIT 110.9 -0.1 451 111.8 110.6 - - - 60.4
115 76 PHIL SING INC 91.2 -0.7 30 91.9 91.2 - - - -
113.3 58.8 Phll Ap Div Reit US$ US88.4 - - - - - - - -
988 616 Principal ASEAN40 US$ US740 -5 33 744 740 - - - 116.1
98.3 65 Principal S&P AP Div US$ US74 - - - - - - - 7.8
333.9 222.9 STI ETF 259.4 -0.5 805 261.4 258.1 - - - -
4500 2304 XT ASX200 US$ US3535 susp - - - - - - 7.1
576.8 251.5 XT MSBrazil US$ US404.7 susp - - - - - - -
2293 1514 XT MSCHINA US$ US2186 +7 - 2186 2186 - - - -
7460 4422 XT MSKorea US$ US7124 susp - - - - - - 10.3
196.6 108.4 XT MSPHILS US$ US149.1 susp - - - - - - 11.9
666 397 XT MSPacXJp US$ US578 susp - - - - - - -
4068 2502 XT MSTaiwan US$ US3930 susp - - - - - - 22.2
6310 4128 XT S&P500 US$ US6021 susp - - - - - - 18.1
3297 2026 XT Vietnam US$ US2783 +38 2 2783 2783 - - - 5.3
SGX Mainboard Transaction date: Aug 14
52-Wk Last Vol Day Div GrYld Net MCapHigh Low Company Sale +/- (’000) High Low C’vr % P/E P/BV $mil
52-Wk Last Vol Day Div GrYld Net MCapHigh Low Company Sale +/- (’000) High Low C’vr % P/E P/BV $mil
SGX ETF52-Wk Last Vol Day Div GrYld Net MCap
High Low Company Sale +/- (’000) High Low C’vr % P/E $mil
52-Wk Last Vol Day Div GrYld Net MCapHigh Low Company Sale +/- (’000) High Low C’vr % P/E $mil
2 7THE BUSINESS TIMES / WEEKEND / AUGUST 15-16, 2020
T R A D E R S ’ G U I D E
SGX Catalist Transaction date: Aug 14
52-Wk Last Vol Day Div GrYld Net MCapHigh Low Company Sale +/- (’000) High Low C’vr % P/E P/BV $mil
52-Wk Last Vol Day Div GrYld Net MCapHigh Low Company Sale +/- (’000) High Low C’vr % P/E P/BV $mil
3.4 0.4 3Cnergy Ltd 1.5 -0.1 2865 1.6 1.5 - - - 1.1 466.3 1.9 AGV 2.3 unch 18741 2.7 2.3 - - - - 15.30.2 0.1 AGV R 0.1 - - - - - - - - -4.5 0.7 Abundance Intl 3.3 +0.4 6898 4.2 3 - - - 0.9 42.410 1.6 Accrelist 3.1 - - - - - - - 0.2 8.72.8 0.5 Acesian Partners 1.4 - - - - - - - 1.1 721 4.5 Acromec 13.6 -0.7 900 15.4 13.2 - - 680 2.8 18.80.1 0.1 Advanced Systems 0.1 - - - - - - - 5 22.3
18.8 6.1 Advancer Global 8.3cd -0.2 80 10 8.3 - - 43.7 0.5 20.92.9 0.2 Adventus 2.1 -0.2 7382 2.2 2.1 - - - 2.2 41
- - Alita Resources 7.8 susp - - - - - - 0.5 59.420.5 13 Alliance HC 16.5 -1.5 55 16.5 16.5 - - 110 1.9 34.3
- - Allied Tech 1.1 susp - - - - - - 0.3 19.54.4 1.5 Alpha Energy 3.2 susp - - - - - - 3.7 72.25.5 1.6 Amplefield Ltd 3.4 +0.2 18112 3.8 3.2 - - 20 0.5 30.61.3 0.4 Anchor Resources 0.7 unch 1000 0.7 0.7 - - - 107.5 9.27.9 5 AnnAik 5.7 - - - - - 5.3 7.4 0.3 16.70.1 0.1 Annica 0.1 unch 0 0.1 0.1 - - - 3.7 18
25.5 10 Aoxin Q & M 13 - - - - - - - 1.1 49.61.8 0.2 Arion Ent 0.7 +0.1 50 0.7 0.6 - - - 2.3 4.60.8 0.2 Artivision Tech 0.5 +0.1 500 0.5 0.5 - - - - 918 6.3 Asia Vets 7.5 unch 189 7.5 7.5 - - 13.6 0.5 10.43.5 0.5 AsiaMedic 2.2 unch 8334 2.3 2.2 - - - 2.2 24.65.3 0.5 AsiaPhos 2.1 unch 6465 2.3 1.9 - - - 0.3 21.832 13.1 Asian Healthcare 23.5 -2 4791 25.5 23 1 5.5 26.1 2.4 101.31 0.2 Asian Micro 0.3 +0.1 910 0.4 0.3 - - - 1.7 3.2
1.3 0.4 Asiatic 0.6 +0.1 790 0.6 0.6 - - - 0.3 9.4- - Asiatravel.com 2.7 susp - - - - - - 1.1 12.6
24 4 Aspen 16.9 +1.9 15603 19.4 16.2 1.4 2 40.2 1.3 166.2- - Astaka 8.8 susp - - - - - - 5 164.4
7.8 2.6 Atlantic Nav 3.6 - - - - - - 5.8 0.2 18.822 4.4 Axington 22cri susp - - - 0.2 11.4 39.3 1.3 35.3
- - Ayondo 4.8 susp - - - - - 0.3 - 37.60.3 0.1 Beverly JCG 0.2 unch 90 0.2 0.1 - - - 4 32.3
88.5 17.5 Biolidics 39.5 -1 2444 40.5 38 - - - 12.3 102.82.6 0.8 BlackGoldNatural 1.3 -0.1 2877 1.4 1.3 - - - 9.1 1312 7.4 Boldtek 9 - - - - - - 16.7 0.6 16.73.2 1 CFM Hldgs 2.7 +0.7 2981 3.2 2.1 - - 19.3 0.5 5.439 11.6 CNMC Goldmine 30.5 unch 8615 32.5 30.5 1.8 2 20.7 2.1 124.30.9 0.3 CPH 0.4 unch 100 0.6 0.4 - - - 0.7 4.90.5 0.1 CWX Global 0.3 unch 966 0.3 0.2 - - - 0.2 12.52.1 0.4 Capital World 0.5 susp - - - - - - 0.1 9.2
- - Charisma Energy 0.2 susp - - - - - - - 29.9- - ChasWood Res 0.9 susp - - - - - - - 2.3
0.2 0.1 China Real Estate 0.1 - - - - - - - 0.3 353.3 1.5 China Star Food 2.3 -0.2 4710 2.8 2.2 - - - 0.2 14.73.4 0.5 ChinaKundaTech 2.8 +0.2 64130 3.4 2.6 - - - 1.3 11.530 12.1 Choo Chiang 19 - - - - 2 6.3 7.8 0.8 39.539 9.4 Clearbridge 17.9 -0.3 3937 18.5 17.9 - - - 2.1 106.634 13 Colex Hldgs 21xd -11.5 289 21.5 19 4.2 2.1 11.2 0.6 27.80.4 0.1 Disa 0.2 - - - - - - - 2 29.338 20 Don Agro 26 - - - - 5 - 6.2 0.9 39.17.5 2 ES Grp 5 -1.3 122 5 4.8 * 9 1.5 0.2 7.1
4 1.1 ETC Singapore 2.6 unch 951 2.6 2.5 - - 3.8 0.2 25.43.7 1.9 EcoWise 2.6 unch 283 3 2.6 - - - 0.7 24.90.8 0.4 Edition 0.6 - - - - - - - 0.9 15.17.6 1.1 Eindec 3.6 unch 78 4.3 3.6 - - - 0.5 5.2
- - Epicentre 1.8 susp - - - - - - - 2.925.5 11 EuroSports Gbl 16.2 - - - - - - 18.4 4.5 42.914.5 9.1 Far East 11 - - - - - 1.6 - 0.3 12.812.5 5 Figtree 10xd - - - - - 3 - 0.7 35.126.5 18 FortressMinerals 21 - - - - 3.4 1.7 11.5 2.4 105
45 21 Fuji Offset 43 - - - - 9.5 0.7 15.1 0.8 21.52 0.3 GCCP 1.2 -0.1 4970 1.3 1.2 - - - 0.7 14.3
20 9.8 GDS Global 9.8 - - - - - 3.1 - 0.7 119 4.4 GKE 7.7 -0.2 9016 8.1 7.7 - - 12.6 0.8 61.2
78.5 35 GS Hldg 52.5 - - - - - - 6.5 3.6 90.912.2 3.6 GSS Energy 6.2 +0.1 624 6.3 6 - - 15.1 0.6 35.5
8 3.3 Global Dragon 4.1 - - - - - - - 0.3 2832 19 Grand Venture 28.5 -2 305 30 28 - - 21.3 2 66.8
56.5 30 HC Surgical 31.5 - - - - 1.1 6.3 13.5 2.9 47.71.2 0.6 HGH 0.9 +0.1 0 0.9 0.9 - - - 0.3 16
11.5 4.2 Hatten Land 6.3 +0.3 101 6.3 6.1 22.5 0.2 21.7 0.7 91.214 3.1 HealthBank 13.8 - - - - - - - 1.1 10.85 2.1 Healthway Med 3.1 unch 4063 3.2 3 - - - 0.8 140.4
3.9 0.9 Heatec Jietong 1.7 +0.2 72 2.5 1.7 - - - 0.1 2.125 15.1 Hengyang Petro 25 - - - - - - - 0.6 50.99.3 3 Hiap Tong 6.1 - - - - - - - 0.2 18.84.3 2 Hosen 3.4 -0.4 100 3.4 3.4 - - - 0.4 12.1
14.5 5.7 Huationg Global 7.6 - - - - - - 2.8 0.2 11.562.5 18 Hyphens Pharma 50 -4.5 9050 56 49 2.2 2 23 3.3 150.21.2 0.6 ICP 0.8 unch 39 0.9 0.7 - - - 0.9 25.26.8 2 IEV 3.1 -0.7 2749 4.5 3.1 - - 17.2 4.1 15.14.9 0.4 IP Softcom 2.3 -0.7 99 2.3 2.3 - - - 0.5 16.8
13.3 3 IPS Securex 11 -0.6 6805 11.7 11 - - - 7.3 53.538.5 28.5 ISEC 29 - - - - 1.8 1.7 20.6 2.4 159.7
25 11.4 ISOTeam 14.8 -0.2 25 15 13.9 13.2 - 6.2 0.7 51.635 13 IX Biopharma 26.5 -1.5 3203 28 26.5 - - - 11.5 171.81.9 0.6 Imperium Crown 1.2 unch 180 1.2 1.2 - - - 0.2 9.52.2 0.2 Incredible 1.2 +0.1 11692 1.6 1.2 - - - 1.2 3.625 13.5 JEP 20 -0.5 1242 21 19.9 - - 12.4 1.3 82.850 28 Japan Foods 30cd +0.5 17 30 29 0.5 4.2 50.8 1.7 52.315 9.1 Jason Marine 15cd - - - - 4.2 3.3 7.2 0.6 15.924 14 Jawala 14 - - - - - 2.9 7 1.4 16.64.7 0.8 Jiutian Chemical 3.6 unch 376109 4.7 3.5 - - - 1 65.50.5 0.1 Joyas Intl 0.2 - - - - - - - 2.3 3.8
11.9 2.4 Jubilee Ind 2.8 -0.3 639 3.1 2.4 - - 2.1 0.2 7.839.5 19.3 Jumbo 35 unch 24 35.5 35 1.5 3.4 19.4 3.4 224.60.6 0.2 KLW Hldgs 0.5 unch 24983 0.6 0.4 - - - 0.4 27.99.1 3.3 KOP 4.6 -0.4 2350 5 4.6 - - - 0.4 5120 7 KTMG 20 - - - - - - - 2.2 33.917 8.9 Katrina 8.9 -0.2 22 9.1 8.9 - - - 2.7 20.66.9 1.8 KimHeng Offshore 2.9 unch 200 3 2.9 - - - 0.3 20.625 17.5 Kimly 22.5 unch 885 23 22.5 1.2 6.2 12.9 2.9 265.533 6.5 Kitchen Culture 21.5 -10.5 37089 31 20 - - - - 716.1 2.8 Koh Eco 3.7 +0.1 5627 4 3.6 6.4 1.4 11.2 0.7 73.932 16.6 Kori 22 - - - - 2.2 0.2 200 0.4 21.89.4 6 Koyo Intl 9 - - - - 2.1 1.1 42.9 0.9 17.715 9 LHN 12 +0.2 949 12 11.6 4.1 4.2 5.9 0.5 48.523 13.6 LY Corp 17.5 - - - - 2.5 0.5 83.3 1.2 85.63.8 1.1 Lasseters Intl 2.2 - - - - - - - 0.2 10.72.3 0.9 Ley Choon 1.3 -0.1 100 1.3 1.3 - - - 1.1 15.44.3 3.5 Libra 3.5 susp - - - - - - 0.6 7.5
1 0.1 LifeBrandz 0.3 +0.1 300 0.3 0.2 - - - - 2.30.2 0.1 LionGold 0.2 unch 3300 0.2 0.1 - - 10 1.8 64.47.5 3.1 MS Hldgs 6.9 - - - - - - - 0.4 11.46.3 2 MSM Intl 2.8 - - - - - - - 0.2 30.1 0.1 Magnus Energy 0.1 susp - - - - - - 2.5 12.7
18.8 7.4 Mary Chia 15 - - - - - 2 - - 28.64.2 0.7 Matex Intl 3 -0.1 1586 3.3 2.8 - - - 0.5 8
14.8 10.8 Maxi-Cash Fin 13.6 +0.2 183 13.6 13.3 1.1 6.3 9.5 1 140.823 10.6 MeGroup 17 - - - - 1.1 5.5 50 1.4 20.3
29.5 17.1 Medinex 23.5 - - - - 1.6 7.1 8.5 2.2 30.8168 2.6 Medtecs Intl 161cd +5 41817 167 156 - - 575 6.2 884.634.5 20.5 MegaChem 34.5cd +5.5 34 34.5 33 2.2 4.3 12 0.9 46
27 19.5 Memiontec 22.5 - - - - - - - - 49.69.5 3.3 Memories 5.6 - - - - - - - 0.4 28.17.5 1.7 Mercurius 2.6 unch 107 3 2.6 - - - 6.3 33.7
- - Metal Comp R 2.4 - - - - - - - - -3.6 1.3 Metal Component 2.2 - - - - - - 44 0.5 8.2
18.5 8.8 Metech Intl 12.4 unch 72 12.6 10.9 - - - 3.8 12.44.5 2.1 Miyoshi 3.1 -0.2 670 3.3 3.1 - - - 0.3 19
17.9 11.4 MoneyMax Fin 17.8 - - - - 4.8 2.8 7.4 0.8 639.4 4.6 Moya Asia 6.4 -0.4 8244 7 6.4 - - 16 0.9 269
- - Moya Asia R200 0.4 - - - - - - - - -7 2.4 Natural Cool 4.7 - - - - - - - 0.6 11.8
3.5 0.6 NauticAWT 2.1 - - - - - - - 5.8 16.749.5 28 Neo 45.5 -2 2857 45.5 45.5 8.6 1.1 10.6 1.6 673.1 1 Net Pacific Fin 1.9 -0.2 477 2 1.9 - - - 0.5 101.5 0.4 New Wave 0.8 -0.1 300 0.9 0.7 - - - 0.8 13.83.7 1.6 Nippecraft 3 - - - - - - - 0.3 10.56.1 1.8 No Signboard 4 - - - - - - - 1.4 18.51.8 0.5 Ntegrator Intl 0.9 unch 290 0.9 0.8 - - - 0.7 9.83.9 0.3 OEL 1.4 halt - - - - - - 1.5 10.4
18.5 17 OIO 18.5 - - - - - - - - 22.46.8 2.7 OUE Lippo HC 3.5 -0.1 330 3.5 3.5 - - 43.8 0.6 155.56.3 2.2 Ocean Sky Intl 4.5 - - - - - - - 0.4 19.478 55.5 Old Chang Kee 73.5 - - - - 0.5 2 105 3.3 89.211 3.6 Olive Tree 7.5 - - - - - - - 0.6 5.219 8.3 OneApex 14 - - - - - - - 1 11.83.8 1.5 P5 Capital 2 unch 900 2.1 2 - - - 0.8 11.2
16.4 3.8 Pacific Star Dev 4.3 susp - - - - - - - 21.64.6 1.4 Pan Asian 2.4 - - - - 1.1 7.5 12.6 0.3 5.1
- - Pine Cap 0.1 susp - - - - - - - 6.6220 38 Plato Capital 114 - - - - - - - 5.8 11.10.5 0.1 Polaris 0.3 +0.1 1000 0.3 0.2 - - - 3.8 51.2
7 1.2 Pollux Prop 1.2 - - - - - - 15 0.2 33.17.1 0.6 Progen 4.9 -0.2 959 5 4.8 - - - 0.6 25.81.3 0.2 QT Vascular 0.7 -0.1 7265 0.9 0.7 - - - 1.3 15.621 5.1 RE&S Holdings Ltd 7 - - - - 2.5 6.4 6.1 0.9 24.834 20 Reclaims Global 30 unch 13 30 30 3.1 1.3 24.8 1.8 39.3
- - RenewableEne R 0.1 - - - - - - - - -- - RenewableEne R250 0.1 - - - - - - - - -
22.5 20 Resources Gbl 21 unch 5 21 21 - - 21 0.9 18.9- - Resources Prima 2.6 susp - - - - - - - 47.7
40.5 17 Revez Corp 24 +2 0 24 23 - - - 5.2 3521 6.4 Rex Intl 16.8 -1.3 67652 17.7 16.6 - - 8.3 1.1 221
- - Rich Capital 0.3 susp - - - - - - 1.4 226 1 SBI Offshore 3.7 - - - - - - - 0.5 9.2
11 6.1 SK Jewellery 7.8 - - - - 1.1 12.8 7.2 0.7 43.913.8 6.3 SLB Dev 11 +1 72 11 9.1 - - 9.3 0.6 100.4
28 5.3 ST Group Food 10.5 - - - - - - 13.8 1.2 25.887 46 Samurai 54 - - - - 3 1.9 35.8 2.4 64.7
18.9 5 Sanli Env 7.7 - - - - 2 0.8 64.2 0.8 20.79.9 5.1 Santak 6.5 - - - - - - - 0.4 7
10.8 3.8 Secura 8.4 -0.2 5360 8.9 8.4 - - 93.3 0.8 33.64.1 1.7 Sen Yue 2.2 susp - - - - - - 0.7 21.715 8.6 Shopper360 8.6 -1.3 41 9.9 8.6 - - 10.1 0.6 9.833 13 Silkroad Nickel 25 -0.5 4 25 25 - - 357.1 3.9 65.327 15.3 Sim Leisure 24 +1.5 10 24 24 * 4.1 800 1.9 35.41.5 0.5 Sincap 0.7 unch 2125 0.7 0.7 - - 23.3 0.3 11.9
23.5 18 Sing Paincare 19.2 -0.3 10 19.2 19.2 - - - - 3139.5 17.9 SingMedical 24.5 -1 1997 25.5 24.5 3.5 3.3 8.7 0.8 118.3
- - SingMedical R 0.1 - - - - - - - - -37.5 14.1 Singapore O&G 24cd unch 196 24 24 - 2.6 - 2.9 114.613.8 2.6 Singapore eDev 6.2 -1.2 42846 7.3 5.7 - - - 2.6 96
12 7 SingaporeKitchen 11 - - - - - - - 1.1 17.14.2 0.5 Sinjia Land 1.8 +0.1 902 1.9 1.6 - - - 0.5 3.50.2 0.1 SinoCloud 0.1 - - - - - - - 0.5 13.6
2 0.7 Sitra 1.4 +0.2 780 1.5 1.3 - - - 1.1 17.2- - Sitra R200 0.1 - - - - - - - - -
7.5 1.6 Soon Lian 7.5 - - - - - - 10 0.3 8.127.5 26 SouthernAlliance 26.5 - - - - - - - - 129.61.9 0.6 Spackman 0.8 unch 1300 0.8 0.7 - - - 0.1 15.6
44.5 31 Starburst 42 -0.5 9030 44.5 40.5 - 0.6 - 4.2 106.718.8 5.7 Starland 8.5 - - - - 0.1 35.3 44.7 0.4 12.33.5 0.8 Sunrise Shares 2.2 -0.1 334 2.2 2.2 - - - 0.9 4.621 7.6 Synagie 19.3 unch 6287 19.6 19.3 - - - 11.2 59
18.2 11 Sysma 13.3 - - - - 0.4 7.5 30.2 0.6 34.77.4 4.5 TLV 5.1 +0.1 16 5.1 5.1 1.6 - 14.2 0.3 28.826 6.3 TSH 11.2 - - - - - - 8.2 0.6 5
53.5 33 TalkMed 42.5 - - - - 1.3 5.4 15.6 7.2 560.23.2 1 Teho Intl 2.6 - - - - - - - 0.4 6.10.5 0.4 Transcorp 0.5 susp - - - - - - - 1.3
13.8 5.4 Trendlines 10 -0.2 4699 10.2 9.8 - - - 0.6 79.146 29.5 TrickleStar 34 unch 9 34 34 - - 109.7 2.6 284.5 1 Tritech 1.5 +0.1 2560 1.5 1.4 - - - 0.9 14.5
17.5 9 Tung Lok Rest 11.5 - - - - - - - 2.5 31.6344 13.1 UG Healthcare 280 -19 4566 303 273 9.6 0.3 41 10.1 549.131.5 10.1 UnUsUaL 13.7 -0.6 11 14 13.7 - - 22.1 2.4 14137.5 20.5 Union Gas 35 -1 937 37 33.5 2 5.3 9.5 2.3 80.1
55 35 United Global 41 - - - - 8.9 5.4 1.4 1 129.612.2 4.4 Vallianz 5 +0.2 10 5 5 - - - 0.3 28.114.9 8.6 Versalink 14.9 - - - - - - - 1.1 20.1
- - Viking Offshore 0.4 susp - - - - - - 1.3 4.4- - Viking R 0.1 - - - - - - - - -- - Viking R1 - - - - - - - - - -
16.9 4.4 Vividthree 7.6 - - - - - - - 1 25.44.9 1.6 Wilton Resources 3.4 unch 2648 3.6 3.4 - - - 5.1 87.1
- - Winmark 3.1 susp - - - - - - 103.3 49.719.9 12.2 Wong Fong Ind 16.6 +0.5 753 16.7 16.1 1.9 3.1 17.3 0.8 3916.5 7.1 World Class Gbl 12 - - - - - - 8.1 0.9 109.914.5 4.2 Y Ventures 9.8 -0.3 7823 10.4 9.7 - - - 4.6 22.53.5 1 Yinda Infocomm 3.5 unch 76000 - - - - - 7 5.33.4 0.4 Zhongxin Fruit 1.7 - - - - - - 21.3 1.1 17.916 8.6 Zico Hldgs 11.7 - - - - - - - 1 38.1
2 8THE BUSINESS TIMES / WEEKEND / AUGUST 15-16, 2020
T R A D E R S ’ G U I D E