Embed Size (px)
Citation preview
Policy Research Working Paper 9474
The Coronavirus Pandemic and Food Security
Evidence from West Africa
Guigonan Serge AdjognonJeffrey R. Bloem
Aly Sanoh
Development Economics Development Impact Evaluation Group &Poverty and Equity Global PracticeNovember 2020
Pub
lic D
iscl
osur
e A
utho
rized
Pub
lic D
iscl
osur
e A
utho
rized
Pub
lic D
iscl
osur
e A
utho
rized
Pub
lic D
iscl
osur
e A
utho
rized
Produced by the Research Support Team
Abstract
The Policy Research Working Paper Series disseminates the findings of work in progress to encourage the exchange of ideas about development issues. An objective of the series is to get the findings out quickly, even if the presentations are less than fully polished. The papers carry the names of the authors and should be cited accordingly. The findings, interpretations, and conclusions expressed in this paper are entirely those of the authors. They do not necessarily represent the views of the International Bank for Reconstruction and Development/World Bank and its affiliated organizations, or those of the Executive Directors of the World Bank or the governments they represent.
Policy Research Working Paper 9474
This paper documents some of the first estimates of the effect of the coronavirus pandemic on food security in a low- and middle-income country context. It combines nationally representative pre- pandemic household survey data with follow-up phone survey data from Mali and exploits sub- national variation in the intensity of pandem-ic-related disruptions between urban and rural areas. These disruptions stem from both government policies aiming to slow the spread of the virus and also individual behavior motivated by fear of contracting the virus. The paper finds
evidence of increasing food insecurity in Mali associated with the pandemic. Difference-in-difference estimates show that moderate food insecurity increased by about 8 percentage points—a 33 percent increase—in urban areas compared with rural areas in Mali. The estimates are sub-stantially larger than existing predictions of the average effect of the pandemic on food security globally and there-fore highlights the critical importance of understanding effect heterogeneity.
This paper is a product of the Development Impact Evaluation Group, Development Economics in collaboration with the Poverty and Equity Global Practice. It is part of a larger effort by the World Bank to provide open access to its research and make a contribution to development policy discussions around the world. Policy Research Working Papers are also posted on the Web at http://www.worldbank.org/prwp. The authors may be contacted at [email protected].
The Coronavirus Pandemic and Food Security:
Evidence from West Africa∗
Guigonan Serge Adjognon†
Jeffrey R. Bloem‡
Aly Sanoh§
∗Authors are listed in alphabetical order and contributed equally to this paper. We thank Marc Bellemare, StevenZahniser, and Cheryl Christensen, as well as colleagues from DIME, for helpful feedback on initial drafts of this paper. Thefindings, interpretations, and conclusions expressed in this paper are entirely those of the authors. They do not necessarilyrepresent the views of the World Bank and its affiliated organizations, or those of the Executive Directors of the WorldBank or the governments they represent. Also, they should not be construed to represent any official US Department ofAgriculture or US Government determination of policy. All remaining errors are our own. Please tell us about them.†Agricultural Economist, Development Impact Evaluation Department, the World Bank Group, Email:
[email protected]‡Research Economist, United States Department of Agriculture, Economic Research Service, MS9999, Beacon Facility,
P.O. Box 419205, Kansas City, MO 64141, Email: [email protected]§Poverty Economist, World Bank Group, Email: [email protected]
1 Introduction
The second United Nations Sustainable Development Goal calls for ending hunger and achieving food
security for all people by 2030. Achieving this goal within the next ten years is now challenged by dramatic
shocks to earned income, household expenditures, and agricultural value chains due to the coronavirus
pandemic. Recent estimates suggest that the economic impact of the pandemic in Sub-Saharan Africa
specifically could be between a five and 7 percent reduction in GDP (Djiofack et al., 2020). Of course
GDP is only instrumentally valuable and how the pandemic influences other micro-level outcomes—such
as food security—remains largely unknown. Although predictions based on expected changes to income,
prices, and food supply estimate that the coronavirus pandemic will dramatically increase the number of
people suffering from food insecurity and undernutrition in low- and middle-income countries (Baqueano
et al., 2020; FAO et al., 2020), these predictions have yet to be evaluated with real-time data.
In this paper we estimate the effect of the coronavirus pandemic on food security in Mali. We
combine nationally representative data collected between October 2018 and July 2019 with follow-up
phone survey data collected between May and June 2020. The panel nature of these data allows us to
control for important time-invariant household-level heterogeneity by including household fixed effects in
our regression specifications. This is important because the effects of the pandemic may depend critically
on geographic and household characteristics, such as existing vulnerabilities to income shocks (Amjath-
Babu et al., 2020; Bene, 2020; Devereux et al., 2020). These features allow us to estimate nationally
representative effects while also accounting for time-invariant differences between households.1
The coronavirus pandemic threatens food security in a number of ways. On the demand side, the
pandemic has reduced earned income, increased poverty, and reduced household expenditures (Chetty
et al., 2020; Valensisi, 2020). On the supply side, the pandemic is particularly disruptive to post-farm
agricultural value chains—such as wholesale and processing logistics enterprises (Reardon et al., 2020).
In the context of Mali, the coronavirus pandemic surged in March, in the midst of the off-season period
of the agricultural cycle, thereby provoking minimal disruptions to crop production activities in rural
areas.2 Meanwhile, economic activities in urban areas were affected by government policies aiming to
slow the spread of the virus and individual behavior motivated by fear of contracting the virus. These
details, coupled with the biological dynamics of COVID-19 that spreads via close human contact, suggest
that pandemic-related disruptions are likely more dramatic in Mali’s urban and rural peri-urban areas
than in remote rural areas.3 We exploit this heterogeneity between urban and rural areas to calculate
difference-in-differences estimates of the effect of the coronavirus pandemic on food security in Mali.
We estimate the effect of the coronavirus pandemic on food security, not the more specific effect of
contracting the SARS CoV-2 (e.g., “COVID-19”) virus on food security. This is an important point for
1Similar data have been collected in a number of countries by national statistical agencies, in partnership with the WorldBank.
2As in other Sahel countries, Mali experiences one rainy season every year. For most farmers this facilitates only onecrop production period, which typically spans from mid-June through mid-September.
3We will investigate and validate this claim in more detail in Section 2.
2
both the identification and interpretation of our estimates. Our empirical strategy exploits sub-national
heterogeneity in pandemic-related disruptions between urban and rural areas in Mali. This strategy
is similar to that employed by Ravindran and Shah (2020) who exploit sub-national heterogeneity in
pandemic-related disruptions to estimate the effect of the pandemic on domestic violence in India. Our
results do not rely on COVID-19 tests accurately identifying the true rate of infection in Mali.
Our paper is related to emerging work on the consequences of the coronavirus pandemic. Much of the
existing research focuses on labor market outcomes in high-income countries (Adams-Prassl et al., 2020;
Alon et al., 2020; Barrero et al., 2020; Bartik et al., 2020; Bui et al., 2020; Chetty et al., 2020; Coibion
et al., 2020; Cowan, 2020). A smaller set of studies focuses on low- and middle-income countries and we
aim to add to this literature (Aggarwal et al., 2020; Amare et al., 2020; Arndt et al., 2020; Djiofack et al.,
2020; Ceballos et al., 2020; Gerard et al., 2020; Jain et al., 2020; Josephson et al., 2020; Kerr and Thornton,
2020; Mahmud and Riley, 2020; Valensisi, 2020). To the best of our knowledge, Amare et al. (2020) is the
only other paper that estimates the effect of the coronavirus pandemic on food security using real-time
data in a nationally representative sample. However, Amare et al. (2020) are not able to make use of
a complete food security measurement tool.4 Complementary analyses of sub-national populations by
Mahmud and Riley (2020) and Ceballos et al. (2020) document a dramatic decrease in food expenditures
in rural Uganda and food security in two Indian states, respectively. Adding important nuance, Aggarwal
et al. (2020) find that although the coronavirus pandemic led to severe disruptions in market activity
and large declines in income among market vendors in rural areas of both Liberia and Malawi, they find
no short-run effect on food security. Other researchers and analysts have raised serious concerns about
the disruption of food systems (Reardon et al., 2020) and food security (Arndt et al., 2020; Mishra and
Rampal, 2020; Narayanan and Saha, 2020; FAO et al., 2020) but do not quantify the extent nor the effects
of the disruption. Finally, existing predictions using expected changes to income, prices, and food supply
support this serious concern for food security in low- and middle-income countries (Baqueano et al., 2020;
FAO et al., 2020). Although these predictions provide valuable insight, they ultimately rely on expected
changes rather than micro-level data measuring real-time-changes.
We make three core contributions. First, we provide self-reported descriptive evidence of how re-
spondents themselves perceive that the coronavirus pandemic has influenced their food security. These
results suggest the pandemic has had dramatic effects. For example, 50 percent of households report
being worried that they will not have enough food to eat. Of those households, 65 percent identify the
coronavirus pandemic as the most important cause of their food security worries. Moreover, despite
higher incidence of food insecurity experience in rural areas, we find that respondents in urban areas
more frequently identify the pandemic as the most important cause of their food security challenges.
These self-reported descriptive results motivate a more sophisticated estimation approach to quantify the
effect of the pandemic on food security.
4For unknown reasons, the first round of the COVID-19 phone survey in Nigeria only included three of the eight FoodInsecurity Experience Scale (FIES) questions.
3
Second, and most importantly, we document some of the first estimates of the effect of the coronavirus
pandemic on food security outcomes in a low- and middle-income country in a nationally representative
sample. We find evidence that the pandemic has led to a dramatic increase in food insecurity. Households
in urban areas are at least 33 percent more likely to experience moderate food insecurity. Given the
limitations of our empirical strategy, primarily due to the widespread disruption of the pandemic, we
are careful to point out that these results likely represent an estimate of the lower bound of the effect
of the coronavirus pandemic on food security. Despite this, we estimate economically meaningful effects
that are substantially larger than existing predictions (Baqueano et al., 2020; FAO et al., 2020). This
finding highlights the critical importance of understanding effect heterogeneity. Our results are important
for understanding both the welfare loss due to the pandemic and, more specifically, the challenges of
achieving the Sustainable Development Goals after the global spread of COVID-19 (Hoy and Sumner,
2020; Ravallion, 2020).
Third, we discuss and provide some descriptive insights on the potential mechanisms driving these
results. Although we do not have access to data with sub-national variation in food prices for this
analysis, we do have some information on recent behaviors and experiences of household members in the
context of the coronavirus pandemic. We find that households in urban areas are more likely to take
health-related safety precautions (e.g., wash hands more often, avoid greetings with physical contact, and
avoid gatherings of more than 10 people), and report struggles to pay rent, access water or electricity,
save money, and make investments in durable goods than households in rural areas. Despite this, we
find no difference between urban and rural households in food-related behavior (e.g., stockpiling food,
frequency of visits to food markets or grocery stores, or self-reported struggle to buy food). This suggests
that reductions in food-related shopping behavior at the extensive margin do not fully explain our main
effect estimates. However, relative price effects may still influence behavior at the intensive margin. More
research is needed to fully understand these dynamics.
The remainder of this paper is organized as follows. The next section summarizes Mali’s experience
with the coronavirus pandemic. Section 3 discusses the data we use for our empirical analysis. Section
4 describes the empirical framework of this study and details our core identification strategy. Section 5
discusses the main results along with validity and robustness checks. Finally, section 6 concludes with a
discussion of priorities for future work.
2 The Coronavirus Pandemic in Mali
On March 11, 2020, the World Health Organization (WHO) officially categorized the COVID-19 outbreak
as a pandemic with consequences potentially reaching every country in the world. On March 18, as
preventative measures, Mali suspended all flights traveling from affected countries to Mali, closed all
public schools, and banned large public gatherings. On March 25 Mali confirmed its first two positive
COVID-19 infections. The next day, upon two additional positive COVID-19 infections, Mali’s then
4
President Ibrahim Boubacar Keita declared a state of emergency and implemented a curfew from 9 pm
to 5 am in hopes of limiting the spread of the virus. Just two days later, on March 28 and after an
additional 14 positive cases, Mali witnessed its first COVID-19 related death (WHO, 2020). The Oxford
COVID-19 government’s response tracker (Hale et al., 2020) suggests that the Mali government, in order
to control the spread of the virus, imposed restrictions as stringent as in North American and Western
European countries (see Figure A1 in the Supplemental Appendix).
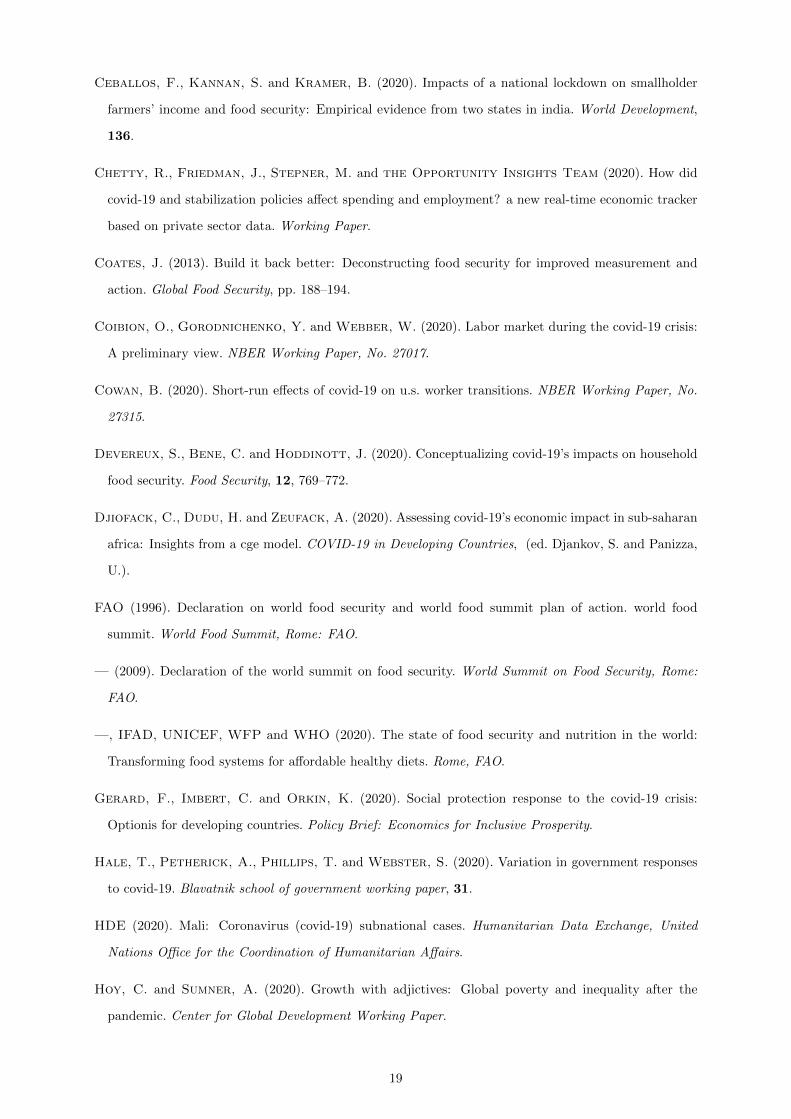
Figure 1 shows a seven-day moving average of new daily COVID-19 infection and death counts in Mali,
as well as in three of the largest urban centers—Bamako, Sikasso, and Segou—from April through July
2020. These data are collected by the United Nations’ Office for the Coordination of Humanitarian Affairs
(OCHA) and made available via the Humanitarian Data Exchange (HDE, 2020). Figure 1 highlights three
important details about the coronavirus pandemic in Mali. First, and most important for our empirical
approach, through about the middle of April 2020, almost all recorded COVID-19 infections and all
COVID-19 deaths occurred in Bamako. It was not until the middle of May when the trends in both
infections and deaths diverged between Mali and Bamako. Second, other relatively large urban centers—
Sikasso and Segou—did not experience anything close to the number of COVID-19 infections or deaths
recorded in Bamako. Aside from a small and short-lived increase in infections in Sikasso at the beginning
of June, infections and deaths in Sikasso and Segou remained relatively flat from April through July 2020.
Finally, the worst of the pandemic for Mali may be in the past, assuming of course no future wave of
COVID-19 infections. By the end of July 2020, daily infection counts were more than half of their peak
in previous months and some days have zero recorded COVID-19 deaths.5 Taken together, these data
suggest that the coronavirus pandemic to date has been most disruptive in Bamako.
We observe that pandemic-related disruptions were more intense in Bamako and surrounding urban
areas than in remote rural areas of Mali in three distinct sources of data. First, as shown in Figure 1 and
discussed above, using data on recorded COVID-19 infection and death counts we observe that both of
these indicators are dramatically skewed toward Bamako. Although these recorded infections and deaths
likely underestimate the true incidence of infections and deaths, particularly outside Bamako (UNICEF,
2020), they are indicators that influence containment policy efforts and motivate fear among individuals
of contracting the virus in Bamako specifically. Therefore, for the purposes of our study, they support
the observation that the intensity of pandemic-related disruptions was greater in urban areas than in
rural areas in Mali.
We now turn to Google’s Community Mobility Reports, our second source of information on the
intensity of pandemic-related disruptions in Mali. For the purpose of contributing to an understanding
of the consequences of the coronavirus pandemic, Google released anonymized and aggregated data from
users who have turned on the location history setting of their Google account. These same data are
5To be clear, these data do not suggest that the coronavirus pandemic is no longer a critical concern for Mali. Indeed,these data only report recorded COVID-19 infections and deaths. Considering the likely limited COVID-19 testing and deathmonitoring capacity in Mali, especially outside Bamako and other urban areas, these reported figures may dramaticallyunderestimate the true incidence of infections and deaths (UNICEF, 2020). Moreover the long-term consequences of thecoronavirus pandemic, not just in Mali but throughout the world, are sill unknown.
5
used by Google Maps to predict real-time congestion. The Google Community Mobility Reports show
daily changes in the amount of time spent at different places within a given geographic area. These data
capture daily percent changes from February 15 through July 15 relative to a baseline representing the
median value for the corresponding day of the week during the five-week period from January 3 through
February 6, 2020.6
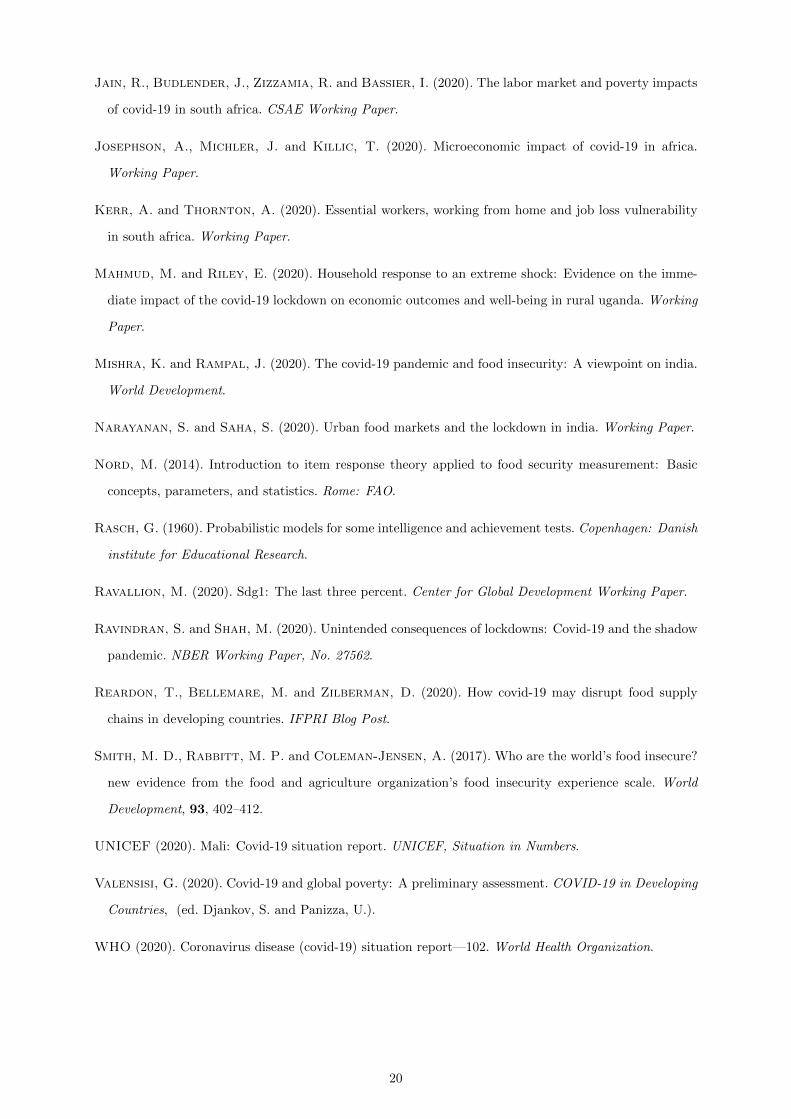
Figure 2 displays the Google Community Mobility data for both the entire country of Mali and
for Bamako specifically. Google aggregates locations into six types of places: Grocery and Pharmacy,
Retail and Recreation, Parks, Transportation Stations, Workplaces, and Residential. Overall, for the
entire country of Mali, we observe a decrease in time spent at all of these locations, except for places of
residence, where we see a relatively small increase. This suggests that either the government containment
policies or the risk of contracting the virus disrupted movement and economic activities in Mali.
Relative to the entire country, Bamako itself had a larger percent change in absolute value in the time
spent at each of these places. Specifically, as reported in the Google Community Mobility Reports, for
the period between June 13 and July 25, people in Mali spent 2 percent less time at grocery stores and
pharmacies relative to the baseline period whereas people in Bamako specifically spent 9 percent less time
at grocery stores and pharmacies. A similar finding holds for other types of places. People in Mali spent
5 percent less time in parks, 25 percent less time at transportation stations, and 4 percent more time in
residential spaces, relative to the baseline period. In comparison, people in Bamako specifically spent 12
percent less time in parks, 32 percent less time at transportation stations, and 6 percent more time in
residential spaces relative to the baseline period. This highlights that the reduced mobility induced by
the risk of contracting COVID-19 and government response to the pandemic was concentrated mostly
in Bamako, and perhaps, in other urban areas. In rural areas, by contrast, such pandemic-related
disruptions were not as noticeable. This supports the validity of our approach for investigating the effect
of the coronavirus pandemic and Mali’s containment policies on food security in Mali.
Finally, we use information from the COVID-19 phone panel survey, our third source of information
used to investigate the intensity of pandemic-related disruptions within Mali. Figure 3 summarizes
information about coronavirus-related awareness, beliefs, and behavior.7 We see that approximately
everyone in the sample, with no discernible difference between urban and rural areas, had previously heard
of the coronavirus and received some information about social distancing. Although most respondents
are, reportedly, satisfied with the Malian government’s response to the coronavirus, those who live in rural
areas are more satisfied on average than those who live in urban areas. Again, this supports our claim that
the pandemic-related disruptions were more intense in urban areas compared to rural areas. Moreover,
people living in urban areas are more likely to take extra health precautions due to the pandemic (e.g.,
6Additional details about these data are available at https://www.google.com/covid19/mobility/. A few notes aboutthese data are important. First, these data are not representative of the whole country. Google only reports on regionsif they have a sufficient number of observations over time to make credible estimates of mobility. Thus, these data existfor Mali and for Bamako specifically. No other regions within Mali are reported in Google’s Community Mobility Reports.Second, Google data only rely on individuals who use Google applications and have turned on the location history settingin their Google account.
7Table A1 in the Supplemental Appendix provides additional details on the statistics reported in Figure 3.
6
wash their hands more than usual, avoid greetings with physical contact, and avoid gatherings with more
than 10 people). However, and perhaps surprisingly, although most of the sample did reduce the number
of times they went to the market or grocery store and were not able to stockpile more food than usual,
we do not see a discernible difference in these reported behaviors between urban and rural households.
Although these descriptive insights highlight reasons why maintaining food security may be generally
challenging in Mali, extensive margin changes in these behaviors do not explain differences in pandemic-
related food security challenges between urban and rural areas. As documented in other contexts, and
as suggested by the Google Mobility Data, price effects could influence behavior on the intensive margin.
More research is needed to fully understand these dynamics.
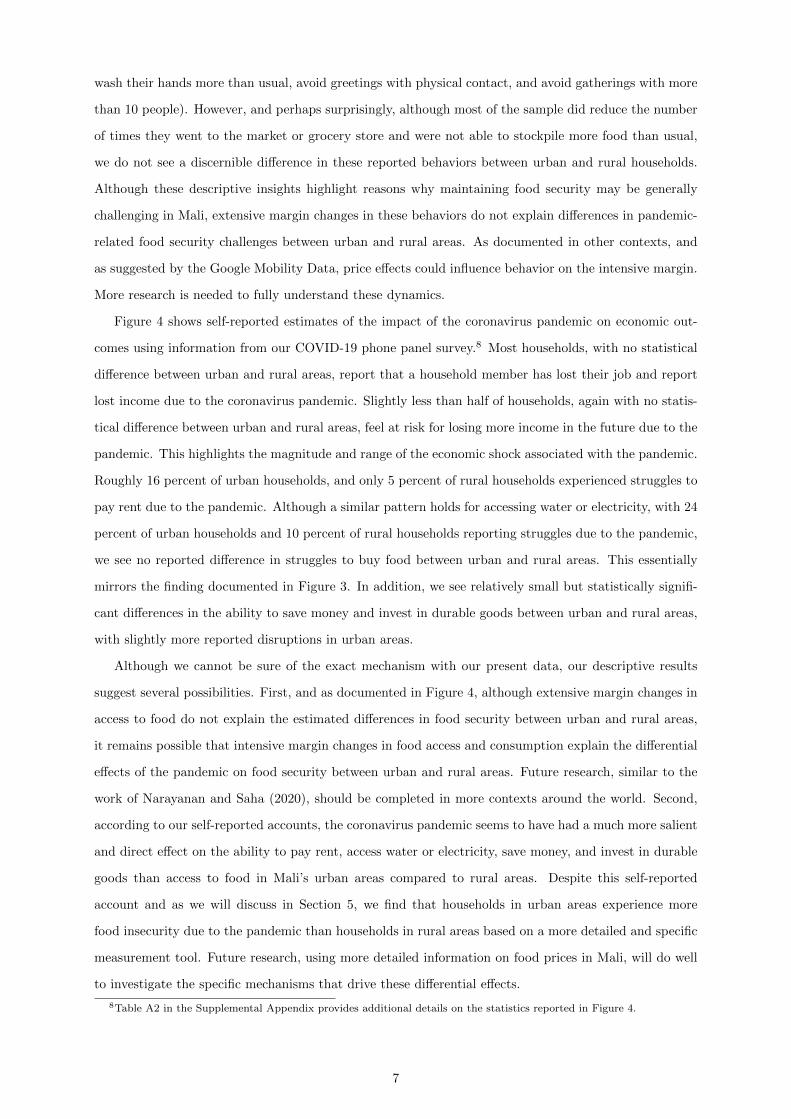
Figure 4 shows self-reported estimates of the impact of the coronavirus pandemic on economic out-
comes using information from our COVID-19 phone panel survey.8 Most households, with no statistical
difference between urban and rural areas, report that a household member has lost their job and report
lost income due to the coronavirus pandemic. Slightly less than half of households, again with no statis-
tical difference between urban and rural areas, feel at risk for losing more income in the future due to the
pandemic. This highlights the magnitude and range of the economic shock associated with the pandemic.
Roughly 16 percent of urban households, and only 5 percent of rural households experienced struggles to
pay rent due to the pandemic. Although a similar pattern holds for accessing water or electricity, with 24
percent of urban households and 10 percent of rural households reporting struggles due to the pandemic,
we see no reported difference in struggles to buy food between urban and rural areas. This essentially
mirrors the finding documented in Figure 3. In addition, we see relatively small but statistically signifi-
cant differences in the ability to save money and invest in durable goods between urban and rural areas,
with slightly more reported disruptions in urban areas.
Although we cannot be sure of the exact mechanism with our present data, our descriptive results
suggest several possibilities. First, and as documented in Figure 4, although extensive margin changes in
access to food do not explain the estimated differences in food security between urban and rural areas,
it remains possible that intensive margin changes in food access and consumption explain the differential
effects of the pandemic on food security between urban and rural areas. Future research, similar to the
work of Narayanan and Saha (2020), should be completed in more contexts around the world. Second,
according to our self-reported accounts, the coronavirus pandemic seems to have had a much more salient
and direct effect on the ability to pay rent, access water or electricity, save money, and invest in durable
goods than access to food in Mali’s urban areas compared to rural areas. Despite this self-reported
account and as we will discuss in Section 5, we find that households in urban areas experience more
food insecurity due to the pandemic than households in rural areas based on a more detailed and specific
measurement tool. Future research, using more detailed information on food prices in Mali, will do well
to investigate the specific mechanisms that drive these differential effects.
8Table A2 in the Supplemental Appendix provides additional details on the statistics reported in Figure 4.
7
3 Data
The primary data source for our analysis is the first round of the COVID-19 Panel Phone Survey of House-
holds, collected by the Mali National Statistical Office, Institut National de la Statistique (INSTAT), in
partnership with the World Bank.9 The survey is part of a regional effort to generate high-quality data on
the coronavirus pandemic and its impacts in the West African Economic and Monetary Union (WAEMU)
member countries. In Mali, the first round of the survey of Households was implemented between the
end of May and early June 2020, and included 2,270 households. These households were drawn randomly
from the Enquete Harmonisee des Conditions de Vie des Menages (EHCVM) sample, which was con-
ducted between October 2018 and July 2019 in a collaboration between INSTAT and the World Bank.
The COVID-19 Panel Phone Survey of Households sample is nationally representative, representative of
Bamako, and representative of both urban and rural areas.10 The survey uses a relatively short instru-
ment focusing on a subset of modules from the EHCVM and new modules on knowledge, perception, and
behavior relating to the coronavirus pandemic. Data collection of additional rounds of the COVID-19
Panel Phone Survey of Households is ongoing and subsequent analysis can and should investigate the
persistence of effects over a longer period of time.11
The EHCVM sample itself covered 8,390 households across Mali and is nationally representative,
representative of Bamako, and representative of both urban and rural areas. The survey relies on a
multi-module instrument covering topics including a household’s socio-economic characteristics, time-
use, production activities, and welfare indicators such as consumption expenditure and food security. We
use sampling weights derived from the 2018 EHCVM sampling frame and adjusted for response rates
in the COVID-19 Panel Phone Survey of Households. These sampling weights are applied both in our
descriptive statistics and regression estimates.
3.1 Measuring Food Security
The United Nations Food and Agriculture Organization (FAO) defines food security as existing, “when
all people, at all times, have physical, social, and economic access to sufficient, safe, and nutritious food
that meet their dietary needs and food preferences for an active and healthy life” (FAO, 1996, 2009).
Although this definition is widely accepted, consistently measuring food security based on this definition
is a considerable challenge (Carletto et al., 2013).
In this study, we use the FAO’s Food Insecurity Experience Scale (FIES) as primary outcome of
interest. The FIES aims to measure food insecurity based on the direct experiences of people relating to
food security (Ballard et al., 2013; Smith et al., 2017). This experience-based measure of food security
9Publicly available at https://microdata.worldbank.org/index.php/catalog/3725/study-description.10Since the COVID-19 Panel Phone Survey of Households relies on phone interviews, the sampled households include
only those who reported a valid phone number during the 2018 EHCVM survey. In some contexts this could generateselection bias. In Mali however, mobile phone technology use is high. Roughly 90 percent of the households surveyed in2018 provided at least one phone number.
11Although recent political events in Mali (See here) might confound any effects captured with later rounds of COVID-19phone surveys.
8
offers more precision than model-based measures relying on national-level food supply (Coates, 2013;
Smith et al., 2017). The FIES is constructed based on respondents’ responses to eight questions about
experience in various domains of food insecurity:
• FS1: “Household members have been worried that they will not have enough to eat?”
• FS2: “Household members have been worried that they cannot eat nutritious foods?”
• FS3: “Household members had to eat always the same thing?”
• FS4: “Household members had to skip a meal?”
• FS5: “Household members had to eat less than they should?”
• FS6: “Household members found nothing to eat at home?”
• FS7: “Household members have been hungry but did not eat?”
• FS8: “Household members have not eaten all day?”
Both the EHCVM sample and the COVID-19 phone survey include each of the eight FIES questions,
allowing us to get a measure of food insecurity for both periods. As long as the data generated via these
questions align with the Rasch measurement model’s assumptions (Rasch, 1960), food security status
can be measured by summing the number of affirmative responses to the FIES questions to produce
the raw FIES score. We use the raw FIES score as a primary outcome as well as the food insecurity
severity classifications developed by Smith et al. (2017) as follows: (a) We define “mild food insecurity”
with a raw FIES score greater than zero. This definition aligns closely with the FAO’s definition of food
security as having “physical, social, and economic access to sufficient, safe, and nutritious food [...] at all
times” (FAO, 2009). (b) We define “moderate food insecurity” with a raw FIES score greater than three.
Finally, (c) we define “severe food insecurity” with a raw FIES score greater than seven—or answering
affirmatively to each of the eight FIES questions.
4 Estimation Strategy
Our estimation relies on a difference-in-differences empirical framework based on the presence of sub-
national variation in the intensity of pandemic-related disruptions. Consistent with existing predictions
highlighting the primarily post-farm disruption of the coronavirus pandemic on food systems (Reardon
et al., 2020), the fact that the pandemic peaked prior to the beginning of the agricultural season in Mali,
and the biological dynamics in which COVID-19 spreads via close human contact, we claim that urban
areas experienced more intense pandemic-related disruptions than rural areas in Mali. This assumption is
consistent with recent findings by Aggarwal et al. (2020) on the effects of COVID 19 disruptions on food
security in rural Malawi and Liberia. Using panel data monthly phone surveys that started before and
9
continued through the COVID-19 outbreak, they find evidence of severe disruptions in market activity
which led to large declines in income among market vendors. However they find no effect on food security
for the rural households in their sample.
We also validate this claim, in the context of Mali, with data on recorded COVID-19 infections,
Google mobility data, and the COVID-19 phone survey. Therefore, in our core regression specification,
we compare the difference in food security measures between urban and rural areas before the peak of the
coronavirus pandemic to the same difference after the peak. We estimate the following linear regression:
ycht = αt + γch + β · 1{ch = Urban} · 1{t = Post}+ εcht (1)
In equation (1), ycht is an indicator of food security measured with the FIES within sampling cluster
c, in household h, in time t. This outcome variable takes several forms throughout our analysis. First,
we report the raw FIES score which is simply the sum of responses to the eight FIES questions each
capturing a different component of experienced food insecurity at the household level. We standardize
this variable so that this scale has a mean of zero and standard deviation of one in each survey wave.
We take this approach because the baseline EHCVM food security indicator questions use a 12-month
reference period and the COVID-19 phone survey use a 30-day reference period. By standardizing the
outcome within each survey wave the data represent deviations from the within-wave mean and therefore
mitigate complications with inconsistent reference periods. Additionally, this standardization process
allows for easier interpretation of our estimated coefficients in terms of standard deviations instead of a
unitless score.12 Second, we report dichotomous indicators of different levels of food insecurity severity
following the methods of Smith et al. (2017) and discussed above. These dichotomous variables represent
“mild food insecurity,” “moderate food insecurity,” and “severe food insecurity” based on the raw FIES
score.
On the right-hand-side of equation (1), αt is survey wave or time fixed effect, and γch is a household
fixed effect. The coefficient β represents the difference-in-differences estimate on the interaction between
a dichotomous variable {ch = Urban} indicating the household resides in an urban area (or in Bamako,
in alternative specifications) and a dichotomous variable {t = Post} indicating a post-pandemic outbreak
survey wave. Finally, εcht is the error term.
This empirical strategy relies on the claim that disruptions due to the coronavirus pandemic have been
much more severe in urban areas than in rural areas in Mali. We validate this claim with observations from
three different sources of information. First, according to the United Nations’ Office for the Coordination
of Humanitarian Affairs (OCHA) and shown in Figure 1, despite the fact that Bamako is home to roughly
12 percent of Mali’s population, over 60 percent of Mali’s COVID-19 infections were located in Bamako, as
of the end of July 2020 (HDE, 2020). Although this statistic likely represents easier access to COVID-19
testing in Bamako relative to other parts of Mali and positive cases of COVID-19 likely do exist in rural
12We show results without this standardization procedure in the Supplemental Appendix. The estimates are qualitativelyconsistent.
10
areas, it does show that the recorded distribution of the prevalence of COVID-19 in Mali is dramatically
skewed toward Bamako. Second, insights from Google’s Community Mobility Reports, shown in Figure
2, suggest that individuals living in Bamako have experienced relatively large changes in the time spent
at various types of places relative to a baseline period in early 2020. Consistent with our claim, these
changes in Bamako are larger than reported changes for individuals in all of Mali. Third, as documented
in Figure 3 and Figure 4, according to our COVID-19 phone panel survey data individuals in urban
areas are more likely to report taking health-related precautions and negative economic impacts due to
the coronavirus pandemic than individuals in rural areas. As predicted by Reardon et al. (2020), this
evidence highlights the reality that although the coronavirus pandemic increased challenges related to
food security everywhere, the pandemic is much more disruptive in urban areas than in rural areas in
Mali.
The difference-in-differences identification strategy rests on the assumption of parallel counterfactual
trends in latent food security between households in urban and rural areas (or, in some specifications,
between households in Bamako and all else) in the absence of the coronavirus pandemic. While this
identifying assumption cannot be tested directly, we argue that if bias exists in our empirical strategy,
then equation (1) generates estimates of the lower bound effect of the pandemic on food security. We
perform a number of robustness and sensitivity checks on our results. First, in each table reporting
regression results we show two variations of our core specification: one that does not include household
fixed effects and one that does include household fixed effects. The household fixed effects allow us to
account for time-invariant omitted heterogeneity between households which may bias our results. Second,
in the Supplemental Appendix, we show results that exclude all households in Bamako from the regression
specification and therefore estimate differences between urban and rural areas outside Bamako. Although
these estimates suffer from limited statistical power, we find results that are qualitatively similar to our
core results.
5 Results
In this section we report three sets of results. First, we report descriptive results which come directly
from the COVID-19 phone survey, targeted at understanding the responses to and socio-economic effects
of the coronavirus pandemic. While these results do not specifically quantify the effect of the coronavirus
pandemic on food security, they do provide insight of how individuals in Mali perceive the effect of the
pandemic in their own lives. Second, we report estimation results based on variations of the regression
specification in equation (1). These results provide some of the first estimates of the effect of the coro-
navirus pandemic in low- and middle-income countries. As we have previously discussed, we see these
results as estimates of the lower bound of the effect of the pandemic on food security. Third, we discuss
and implement several robustness tests.
11
5.1 Descriptive Results
These descriptive results provide insight by directly asking respondents if indicators for food insecurity
are due “specifically to the COVID-19 crisis.” This allows for a self-reported causal statement, which
is not necessarily equivalent to causal identification in the statistical use of the phrase. Nevertheless,
these descriptive results highlight how respondents understand changes in their lives in the time of the
coronavirus pandemic.
Figure 5 shows descriptive results using the May-June 2020 phone survey from Mali. The results
suggest that the coronavirus pandemic has dramatically reduced the food security of households in Mali.13
Overall, 50 percent of the full sample is worried that they will not have enough to eat. Of those households,
65 percent report that this worry is specifically due to COVID-19. This finding, that a substantial share
of households identify COVID-19 as an important cause of food security challenges, is largely driven by
households in urban areas. Specifically, we see an 11 percentage points difference, between urban and
rural areas, in those who identify COVID-19 as the source of their worry that they will not have enough to
eat. Similar findings persist for most of the remaining FIES questions. Across seven of eight food security
indicators, the exception being FS8 which is only experienced by less than 4 percent of households, a
larger share of households living in urban areas than in rural areas report food security challenges due
to COVID-19. In five out of the eight food security indicators the difference between urban and rural
areas in reporting of food security challenges due to COVID-19 is statistically significant at conventional
levels.
These findings are striking for at least two reasons. First, specifically in the context of Mali, food
security is on average more challenging in rural areas. Despite this, urban households tend to be more
likely than rural households to identify COVID-19 as the most important cause of their food security
challenges. In particular, 48 percent of rural households, compared to 42 percent of urban households,
indicate being worried that they cannot eat nutritious foods. However, 53 percent of rural households,
compared to 65 percent of urban households, indicate that this is primarily due to COVID-19— this
difference is statistically significant at conventional levels. Second, this highlights the validity of previous
predictions that the coronavirus pandemic would be more disruptive to food systems in dense urban
and rural peri-urban areas (Reardon et al., 2020). Additionally, as previously discussed, this finding
helps support our identification strategy where we exploit sub-national variation in the intensity of the
disruption of the coronavirus pandemic.
5.2 Estimation Results
We now turn to discussing results from estimating variations of equation (1). In this sub-section we
discuss four sets of results: first considering the full raw FIES score and the remaining three considering
increasingly severe levels of food insecurity.
13Table A3 in the Supplemental Appendix provides additional details on the statistics reported in Figure 5.
12
Panel A of Table 1 shows estimates when using the raw FIES score standardized to have a mean
of zero and standard deviation of one in each survey wave. The first two columns show simple first-
difference estimation results. These results highlight that, relative to a pre-pandemic baseline, households
in Mali report an increase in the raw FIES score of roughly 0.14 of a standard deviation. Comparing the
estimates in columns (1) and (2) shows that this trend in time is robust to the inclusion of household fixed
effects. The last four columns of Panel A in Table 1 report variations on our main difference-in-difference
estimation specification. Columns (3) and (4) exploit differences in the coronavirus pandemic’s shock
to the food system between urban and rural areas. Column (3) reports the results from a simplified
difference-in-difference estimation specification which includes a single dichotomous variable indicating a
household resides in an urban area, rather than household fixed effects. Column (4) reports the results
from our main difference-in-difference estimation with household fixed effects. Both columns show that,
relative to the pre-pandemic baseline, the raw FIES score increased more in urban areas than rural areas
by about 18 percent of a standard deviation; though estimating this effect with household fixed effects
increases the standard error around this estimate. Finally, in columns (5) and (6), when only considering
differences between Bamako and elsewhere in Mali, the observed differential change in the raw FIES
score falls slightly to about 15 percent of a standard deviation. This slightly smaller effect estimate is
consistent with the idea that other urban or peri-urban areas are now included in the comparison and
therefore bias the estimate toward zero.
Panel B of Table 1 shows estimates using a dichotomous dependent variable indicating at least “mild
food insecurity” defined as equal to one if the raw FIES score is greater than zero (Smith et al., 2017).
These estimates are helpful for at least two key reasons. First, they provide a more intuitive assessment
of effect magnitude than estimates reported in Panel A Table 1. The outcome variable identifies if
a household responds affirmatively to any of the eight FEIS questions. Second, the definition of the
dichotomous outcome variable used in Panel B of Table 1 aligns more closely with the FAO’s definition
of food security (FAO, 1996, 2009). This is because the FAO’s definition views food security as existing
“when all people, at all times, have physical, social, and economic access to sufficient, safe, and nutritious
food that meet their dietary needs and food preferences for an active and healthy life,” which we measure
if an individual does not answer affirmatively to any of the FIES questions.
The first two columns of Panel B of Table 1 show a simple first-difference estimation. These results
highlight roughly a 4 percentage-point increase in the probability of being food insecure, relative to the
pre-pandemic period. The last four columns report variations on our main difference-in-difference esti-
mation specification. Columns (3) and (4) show that the coronavirus pandemic increased food insecurity
by about 8 percentage points in urban areas relative to rural areas. Again, although the inclusion of
household fixed effects increases the standard error around this estimate the estimated average effect
remains stable. Finally, columns (5) and (6) focus on differences between Bamako and the rest of Mali,
and show qualitatively similar results to those reported in columns (3) and (4). The results indicate that
the coronavirus pandemic increased urban food insecurity by roughly 10 percentage points, results that
13
are robust across specifications. These effect estimates show meaningful increases in mild food insecurity.
Considering a baseline mean of 0.61, in columns (5) and (6), our estimates show that the coronavirus
pandemic increased mild food insecurity in Bamako by 16 percent relative to the rest of Mali.
Panel C of Table 1 reports results using a dichotomous dependent variable indicating “moderate
food insecurity” defined as equal to one of the raw FIES score is greater than three (Smith et al., 2017).
Although columns (1) and (2) show no evidence of an increasing time trend of moderate food insecurity in
Mali associated with the pandemic, our difference-in-difference estimates in columns (3) and (4) highlight
that in urban areas moderate food insecurity increased by 8 percentage points more than in rural areas.
This represents a 33 percent increase in moderate food insecurity in urban areas relative to rural areas.
These results represent the strongest estimates in this paper. This is important because existing research
using the FIES across a variety of contexts consider this measure of “moderate food insecurity” as the
primary measure of food insecurity (Smith et al., 2017). This measure, which identifies “moderate food
insecurity” if a household responds affirmatively to at least three out of the eight FIES questions, more
accurately represents the multidimensional reality of experienced food insecurity for households. Finally,
we find qualitatively similar results on average in columns (5) and (6), when considering differences
between Bamako and the rest of Mali, though these effects are less precisely estimated.
Finally, Panel D of Table 1 reports the results using a dichotomous dependent variable indicating
“severe food insecurity” defined as equal to one if the raw FIES score is greater than seven (Smith
et al., 2017). This definition therefore requires that households have indicated affirmative responses on
all eight of the FIES questions and is commonly associated with individuals experiencing physiological
hunger (Nord, 2014). Perhaps unsurprisingly, due to the relative infrequency of this extreme level of
food insecurity, these estimates suffer from low statistical power. We estimate effects with substantial
magnitudes but that remain statistically indistinguishable from a null result. Specifically, severe food
insecurity increased by roughly 60 percent in urban areas relative to rural areas. Therefore, the results
reported in Panel D of Table 1 should be interpreted with extreme caution. Severe food insecurity remains
relatively uncommon in Mali, experienced by roughly 3 percent of the population prior to the coronavirus
pandemic.
Existing predictions, based on modeling the expected changes to income, prices, and food supply,
suggest that the coronavirus pandemic may increase the number of undernourished people in the world
by between 10 and 16 percent in 2020 (Baqueano et al., 2020; FAO et al., 2020). Our estimates suggest
that these aggregate global estimates may hide important heterogeneity. In the context of urban Mali the
short-term effect of the coronavirus pandemic on mild food insecurity is at least as large as the average
global effect and likely larger. Heterogeneity also exists in the level of severity of food insecurity. In urban
Mali we find that the pandemic increased “moderate food insecurity” by at least 33 percent. This is an
important finding for at least two reasons. First, existing research uses this “moderate food insecurity”
measure as the primary measure of experienced food insecurity globally (Smith et al., 2017). Second, this
estimate is substantially larger than existing predictions of the effect of the pandemic globally (Baqueano
14
et al., 2020; FAO et al., 2020). Taken together, this implies that future work should focus on measuring
the extent of heterogeneity in the effect of the coronavirus pandemic on food security in a variety of
contexts around the world. Understanding this heterogeneity is important for understanding how to
best design, implement, and target policies and programs aimed at assisting those harmed most by the
pandemic.
5.3 Robustness
We conduct several robustness checks to test the sensitivity of our results. First, in Table A4 in the
Supplemental Appendix, we show results where the raw FIES score is not standardized to have a mean
of zero and standard deviation of one in each survey wave. Although we prefer the results using the
standardized dependent variable, this robustness check shows that our core findings are not driven by
our standardization procedure. Specifically, the difference-in-differences estimates shown in the last four
columns of Table A4 are qualitatively similar to the core results reported in Panel A of Table 1.
Second, in Table A5 in the Supplemental Appendix, we show results that do not control for missing
observations. This tests if our results are driven by the systematic non-response to specific survey
questions. We find results that are qualitatively consistent with those reported in 1.
Third, in Table A6 in the Supplemental Appendix, we show results that exclude households in Bamako
from the sample. This tests if our results are strictly driven by the effect of the pandemic within Bamako.
To the contrary, we find qualitatively similar results outside Bamako, although the difference-in-difference
estimates are not robust to the inclusion of household fixed effects, largely due to limited statistical power.
We continue to find evidence of worsening food security outcomes, on average and at every level of severity,
in urban areas relative to rural areas outside Bamako.
The analysis in this paper is not without limitations. First, and most generally, although the coron-
avirus pandemic has disrupted life in every country around the world, we study only one country. The
effects of the pandemic on welfare may vary substantially across countries, largely due to the specific
non-pharmaceutical policy response of each country. We argue, however, that the situation in Mali may
resemble that in many other parts of Sub-Saharan Africa where public health measures intended to slow
the spread of the virus are difficult to implement effectively, but were generally more disruptive in urban
areas. The work of Amare et al. (2020) in Nigeria and Mahmud and Riley (2020) in Uganda provide com-
plementary analysis highlighting the substantial effect of the pandemic on food security in Sub-Saharan
Africa.
Second, and specifically relating to our empirical strategy, our difference-in-difference estimates likely
underestimate the effect of the coronavirus pandemic on food security in urban Mali. The lack of a truly
unaffected comparable population challenges our ability to estimate an unbiased effect. Although we show
that pandemic-related disruptions in Mali’s urban areas likely outweigh disruptions in rural areas, the
pandemic likely had non-negligible disruptions in rural areas. Nevertheless, these challenges likely bias
15
our estimates toward zero and despite this reality, we estimate effects with substantial and meaningful
magnitudes.
Third, our estimates only represent the short-term effects of the coronavirus pandemic on food security.
As the spread of the virus began in Bamako, and therefore initial containment policies were most intense
in the capitol city, the short-term effect of the pandemic is more directly felt by urban households.
As time progresses, and the agricultural season gets underway, it is plausible, and in fact likely, that
rural households will be increasingly affected by the consequences of the pandemic (Amjath-Babu et al.,
2020). Future research which specifically examines the medium- and long-term effects of the coronavirus
pandemic, in both rural and urban areas, is absolutely essential.
Finally, we are unable to credibly identify mechanisms that explain our main findings. Research in
India suggests that food prices in urban areas have increased which could lead to challenges relating to
food security, especially for households that have lost a primary source of income due to pandemic-related
disruptions (Narayanan and Saha, 2020). It is plausible that this mechanism persists in Mali, however, we
do not have the data to examine this empirically. We do show some descriptive evidence suggesting that
the pandemic has reduced the frequency of visits to the market or grocery store, but there is very little
difference between households in urban and rural areas. Therefore, this type of extensive margin behavior
change does not seem to explain our main results in a meaningful fashion. Future research should focus
on identifying the mechanisms that explain these results to help inform effective policy responses.
6 Conclusion
We add to the emerging research that estimates the effect of the coronavirus pandemic on food secu-
rity in low- and middle-income countries (Amare et al., 2020; Ceballos et al., 2020; Mahmud and Riley,
2020). Using nationally representative pre-pandemic household survey data and a follow-up phone survey
from Mali, our difference-in-difference estimates highlight a dramatic increase in food insecurity. These
difference-in-difference estimates rely on sub-national variation in the intensity of pandemic-related dis-
ruptions between urban and rural areas. Although we aim to validate our understanding of the variation
in intensity of these disruptions with data on recorded COVID-19 infections, Google mobility data, and
our phone survey data, it remains likely that the pandemic also disrupted food systems in rural areas.
Therefore, our results in this paper are likely an estimate of the lower bound of the effect of the pandemic
on food security in Mali. Despite this limitation, we estimate effects with meaningful magnitudes that are
substantially larger than existing predictions of the effect of the coronavirus pandemic on food security
globally.
Existing predictions of the effect of the coronavirus pandemic on food security globally—based on ex-
pected changes to income, prices, and food supply—point to an increase in the number of undernourished
people in the world of 10–16 percent in 2020 (Baqueano et al., 2020; FAO et al., 2020). Our estimates
document important heterogeneity in this global aggregate prediction. In Mali our difference-in-difference
16
estimates show that moderate food insecurity increased in urban areas by at least 8 percentage points,
which is equivalent to about a 33 percent increase—more than double the predicted global aggregate
percent change. These results are important for informing short-term policy responses aiming to limit
the welfare loss from the coronavirus pandemic.
Our work in this paper only represents the beginning of the necessary research needed to better
understand the micro-level welfare implicates of the coronavirus pandemic. Throughout this paper, we
highlight many avenues for future research and encourage interdisciplinary approaches to address existing
questions. These future research topics include a more detailed investigation of the mechanisms driving
these relatively short-term effects and subsequent analysis of the medium-term effects which consider
household-level resiliency to the dramatic health and economic shock of the coronavirus pandemic.
17
References
Adams-Prassl, A., Boneva, T., Golin, M. and Rauh, C. (2020). Inequality in the impact of the
coronavirus shock: Evidence from real time surveys. Working paper.
Aggarwal, S., Jeong, D., Kumar, N., Park, D. S., Robinson, J. and Spearot, A. (2020). Did
COVID-19 Market Disruptions Disrupt Food Security? Evidence from Households in Rural Liberia and
Malawi. Tech. rep., National Bureau of Economic Research.
Alon, T., Doepke, M., Olmstead-Rumsey, J. and Tertilt, M. (2020). The impact of covid-19 on
gender equality. NBER Working Paper, No. 26947.
Amare, M., Abay, K. A., Tiberti, L. and Chamberlin, J. (2020). Impacts of covid-19 on food
security: Panel data evidence from nigera. PEP Working Paper No. 21.
Amjath-Babu, T., Krupnik, T., Thilsted, S. and McDonald, A. (2020). Key indicators for mon-
itoring food system disruptions caused by the covid-19 pandemic: Insights from bangladesh toward
effective response. Food Security, 12, 761–768.
Arndt, C., Davies, R., Gabriel, S., Harris, L., Makrelov, K., Robinson, S., Levy, S., Sim-
banegavi, W., van Sventer, D. and Anderson, L. (2020). Covid-19 lockdowns, income distribu-
tion, and food security, an analysis for south africa. Global Food Security, 26.
Ballard, T. J., Kepple, A. W. and Cafiero, C. (2013). The food insecurity experience scale:
development of a global standard for monitoring hunger worldwide. Rome: FAO.
Baqueano, F., Christensen, C., Ajewole, K. and Backman, J. (2020). International food security
assessment, 2020–30. GFA–31, U.S. Department of Agriculture, Economic Research Service.
Barrero, J., Bloom, N. and Davis, S. (2020). Covid-19 is also a reallocation shock. NBER Working
Paper, No. 27137.
Bartik, A., Bertrand, M., Cullen, Z., Glaeser, E., Luca, M. and Stanton, C. (2020). How
are small businesses adjusting to covid-19? early evidence from a survey. NBER Working Paper, No.
26989.
Bene, C. (2020). Resilience of local food systems and links to food security: A review of some important
concepts in the context of covid-19 and other shocks. Food Security.
Bui, T., Button, P. and Picciotti, E. (2020). Early evidence on the impact of covid-19 and the
recession on older workers. NBER Working Paper, No. 27448.
Carletto, C., Zezza, A. and Banerjee, R. (2013). Towards better measurement of household food
security: Harmonizing indicators and the role of household surveys. Global Food Security, 2 (1), 30–40.
18
Ceballos, F., Kannan, S. and Kramer, B. (2020). Impacts of a national lockdown on smallholder
farmers’ income and food security: Empirical evidence from two states in india. World Development,
136.
Chetty, R., Friedman, J., Stepner, M. and the Opportunity Insights Team (2020). How did
covid-19 and stabilization policies affect spending and employment? a new real-time economic tracker
based on private sector data. Working Paper.
Coates, J. (2013). Build it back better: Deconstructing food security for improved measurement and
action. Global Food Security, pp. 188–194.
Coibion, O., Gorodnichenko, Y. and Webber, W. (2020). Labor market during the covid-19 crisis:
A preliminary view. NBER Working Paper, No. 27017.
Cowan, B. (2020). Short-run effects of covid-19 on u.s. worker transitions. NBER Working Paper, No.
27315.
Devereux, S., Bene, C. and Hoddinott, J. (2020). Conceptualizing covid-19’s impacts on household
food security. Food Security, 12, 769–772.
Djiofack, C., Dudu, H. and Zeufack, A. (2020). Assessing covid-19’s economic impact in sub-saharan
africa: Insights from a cge model. COVID-19 in Developing Countries, (ed. Djankov, S. and Panizza,
U.).
FAO (1996). Declaration on world food security and world food summit plan of action. world food
summit. World Food Summit, Rome: FAO.
— (2009). Declaration of the world summit on food security. World Summit on Food Security, Rome:
FAO.
—, IFAD, UNICEF, WFP and WHO (2020). The state of food security and nutrition in the world:
Transforming food systems for affordable healthy diets. Rome, FAO.
Gerard, F., Imbert, C. and Orkin, K. (2020). Social protection response to the covid-19 crisis:
Optionis for developing countries. Policy Brief: Economics for Inclusive Prosperity.
Hale, T., Petherick, A., Phillips, T. and Webster, S. (2020). Variation in government responses
to covid-19. Blavatnik school of government working paper, 31.
HDE (2020). Mali: Coronavirus (covid-19) subnational cases. Humanitarian Data Exchange, United
Nations Office for the Coordination of Humanitarian Affairs.
Hoy, C. and Sumner, A. (2020). Growth with adjictives: Global poverty and inequality after the
pandemic. Center for Global Development Working Paper.
19
Jain, R., Budlender, J., Zizzamia, R. and Bassier, I. (2020). The labor market and poverty impacts
of covid-19 in south africa. CSAE Working Paper.
Josephson, A., Michler, J. and Killic, T. (2020). Microeconomic impact of covid-19 in africa.
Working Paper.
Kerr, A. and Thornton, A. (2020). Essential workers, working from home and job loss vulnerability
in south africa. Working Paper.
Mahmud, M. and Riley, E. (2020). Household response to an extreme shock: Evidence on the imme-
diate impact of the covid-19 lockdown on economic outcomes and well-being in rural uganda. Working
Paper.
Mishra, K. and Rampal, J. (2020). The covid-19 pandemic and food insecurity: A viewpoint on india.
World Development.
Narayanan, S. and Saha, S. (2020). Urban food markets and the lockdown in india. Working Paper.
Nord, M. (2014). Introduction to item response theory applied to food security measurement: Basic
concepts, parameters, and statistics. Rome: FAO.
Rasch, G. (1960). Probabilistic models for some intelligence and achievement tests. Copenhagen: Danish
institute for Educational Research.
Ravallion, M. (2020). Sdg1: The last three percent. Center for Global Development Working Paper.
Ravindran, S. and Shah, M. (2020). Unintended consequences of lockdowns: Covid-19 and the shadow
pandemic. NBER Working Paper, No. 27562.
Reardon, T., Bellemare, M. and Zilberman, D. (2020). How covid-19 may disrupt food supply
chains in developing countries. IFPRI Blog Post.
Smith, M. D., Rabbitt, M. P. and Coleman-Jensen, A. (2017). Who are the world’s food insecure?
new evidence from the food and agriculture organization’s food insecurity experience scale. World
Development, 93, 402–412.
UNICEF (2020). Mali: Covid-19 situation report. UNICEF, Situation in Numbers.
Valensisi, G. (2020). Covid-19 and global poverty: A preliminary assessment. COVID-19 in Developing
Countries, (ed. Djankov, S. and Panizza, U.).
WHO (2020). Coronavirus disease (covid-19) situation report—102. World Health Organization.
20
Figure 1: COVID-19 Infections and Deaths
Notes: These figures come from the Humanitarian Data Exchange (HDX) COVID-19 sub-national casedata, supported by the United Nations Office for the Coordination of Humanitarian Affairs. They showthe 7-day moving average of new daily COVID-19 infections and deaths for Mali and the three mostpopulous urban areas: Bamako, Sikasso, and Segou.
21
Figure 2: Google Mobility Data
Notes: These figures come from Google’s COVID-19 Community Mobility Data. With the same kindof aggregated and anonymized data used in Google Maps, these data show changes for each day in timespent at specific types of places relative to the baseline period. The Google Mobility Data use a baselineof the median value for the corresponding day of the week during the 5-week period of January 3 throughFebruary 6, 2020.
22
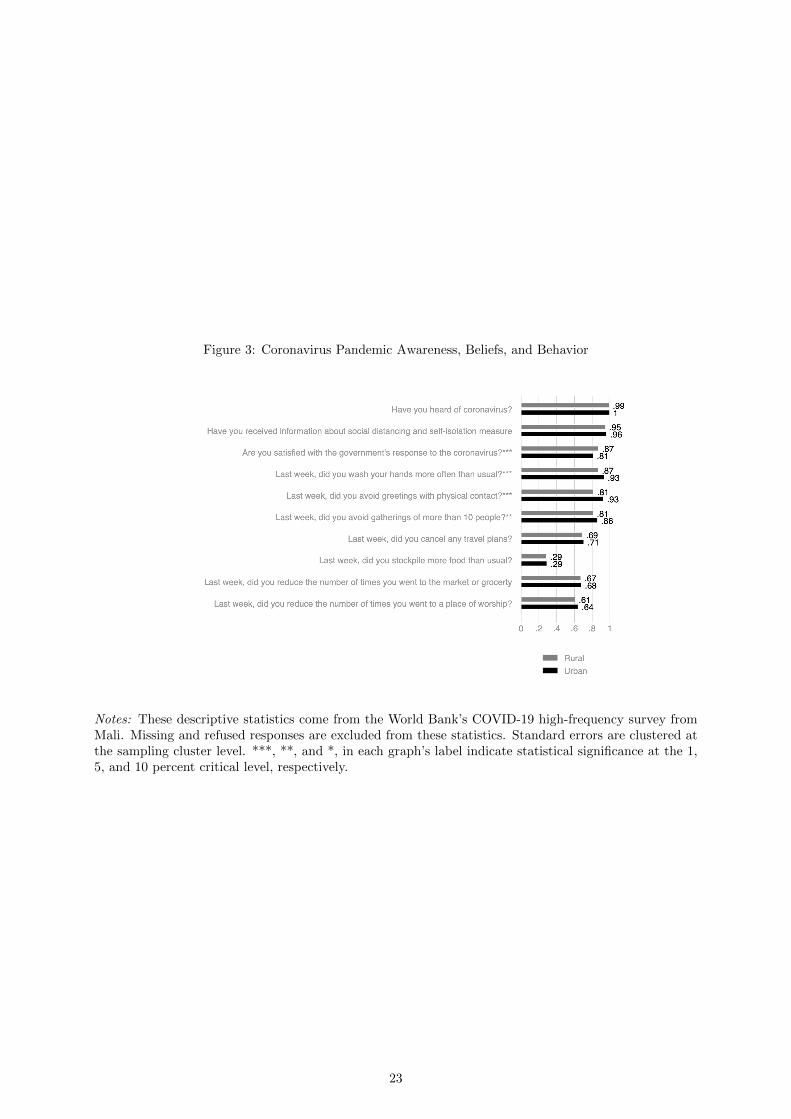
Figure 3: Coronavirus Pandemic Awareness, Beliefs, and Behavior
Notes: These descriptive statistics come from the World Bank’s COVID-19 high-frequency survey fromMali. Missing and refused responses are excluded from these statistics. Standard errors are clustered atthe sampling cluster level. ***, **, and *, in each graph’s label indicate statistical significance at the 1,5, and 10 percent critical level, respectively.
23
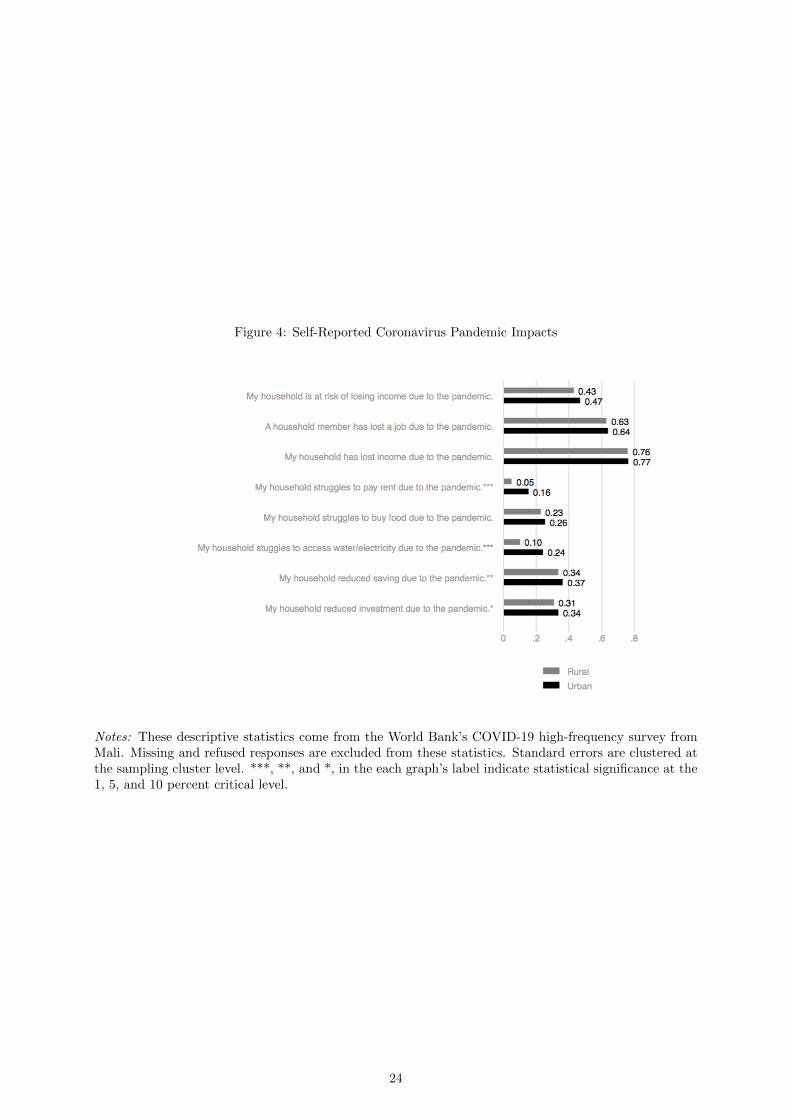
Figure 4: Self-Reported Coronavirus Pandemic Impacts
Notes: These descriptive statistics come from the World Bank’s COVID-19 high-frequency survey fromMali. Missing and refused responses are excluded from these statistics. Standard errors are clustered atthe sampling cluster level. ***, **, and *, in the each graph’s label indicate statistical significance at the1, 5, and 10 percent critical level.
24
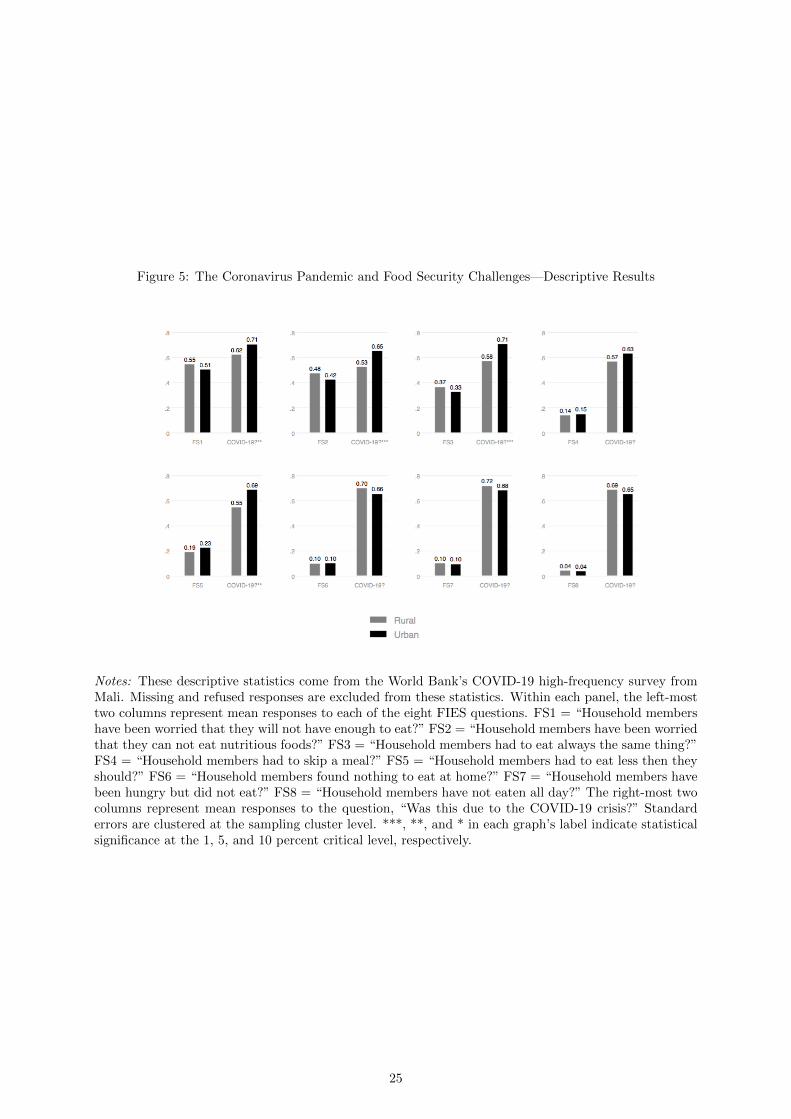
Figure 5: The Coronavirus Pandemic and Food Security Challenges—Descriptive Results
Notes: These descriptive statistics come from the World Bank’s COVID-19 high-frequency survey fromMali. Missing and refused responses are excluded from these statistics. Within each panel, the left-mosttwo columns represent mean responses to each of the eight FIES questions. FS1 = “Household membershave been worried that they will not have enough to eat?” FS2 = “Household members have been worriedthat they can not eat nutritious foods?” FS3 = “Household members had to eat always the same thing?”FS4 = “Household members had to skip a meal?” FS5 = “Household members had to eat less then theyshould?” FS6 = “Household members found nothing to eat at home?” FS7 = “Household members havebeen hungry but did not eat?” FS8 = “Household members have not eaten all day?” The right-most twocolumns represent mean responses to the question, “Was this due to the COVID-19 crisis?” Standarderrors are clustered at the sampling cluster level. ***, **, and * in each graph’s label indicate statisticalsignificance at the 1, 5, and 10 percent critical level, respectively.
25
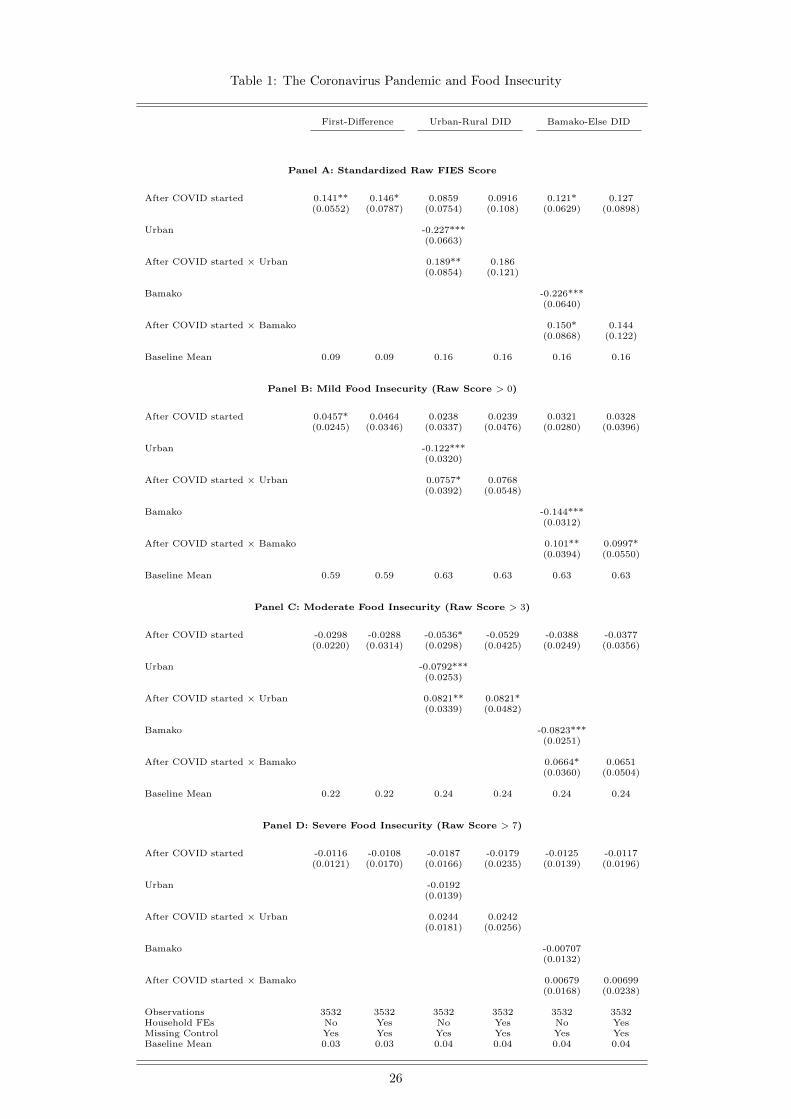
Table 1: The Coronavirus Pandemic and Food Insecurity
First-Difference Urban-Rural DID Bamako-Else DID
Panel A: Standardized Raw FIES Score
After COVID started 0.141** 0.146* 0.0859 0.0916 0.121* 0.127(0.0552) (0.0787) (0.0754) (0.108) (0.0629) (0.0898)
Urban -0.227***(0.0663)
After COVID started × Urban 0.189** 0.186(0.0854) (0.121)
Bamako -0.226***(0.0640)
After COVID started × Bamako 0.150* 0.144(0.0868) (0.122)
Baseline Mean 0.09 0.09 0.16 0.16 0.16 0.16
Panel B: Mild Food Insecurity (Raw Score > 0)
After COVID started 0.0457* 0.0464 0.0238 0.0239 0.0321 0.0328(0.0245) (0.0346) (0.0337) (0.0476) (0.0280) (0.0396)
Urban -0.122***(0.0320)
After COVID started × Urban 0.0757* 0.0768(0.0392) (0.0548)
Bamako -0.144***(0.0312)
After COVID started × Bamako 0.101** 0.0997*(0.0394) (0.0550)
Baseline Mean 0.59 0.59 0.63 0.63 0.63 0.63
Panel C: Moderate Food Insecurity (Raw Score > 3)
After COVID started -0.0298 -0.0288 -0.0536* -0.0529 -0.0388 -0.0377(0.0220) (0.0314) (0.0298) (0.0425) (0.0249) (0.0356)
Urban -0.0792***(0.0253)
After COVID started × Urban 0.0821** 0.0821*(0.0339) (0.0482)
Bamako -0.0823***(0.0251)
After COVID started × Bamako 0.0664* 0.0651(0.0360) (0.0504)
Baseline Mean 0.22 0.22 0.24 0.24 0.24 0.24
Panel D: Severe Food Insecurity (Raw Score > 7)
After COVID started -0.0116 -0.0108 -0.0187 -0.0179 -0.0125 -0.0117(0.0121) (0.0170) (0.0166) (0.0235) (0.0139) (0.0196)
Urban -0.0192(0.0139)
After COVID started × Urban 0.0244 0.0242(0.0181) (0.0256)
Bamako -0.00707(0.0132)
After COVID started × Bamako 0.00679 0.00699(0.0168) (0.0238)
Observations 3532 3532 3532 3532 3532 3532Household FEs No Yes No Yes No YesMissing Control Yes Yes Yes Yes Yes YesBaseline Mean 0.03 0.03 0.04 0.04 0.04 0.04
26
Supplemental Appendix
This Supplemental Appendix provides additional information supporting the results in the main manuscript.
• Table A1 reports descriptive results on coronavirus awareness, beliefs, and behavior in tabular
form. These results report the underlying information used when generating Figure 3 in the main
manuscript.
• Table A2 reports descriptive results on self-reported coronavirus pandemic impacts. These results
report the underlying information used when generating Figure 4 in the main manuscript.
• Table A3 reports descriptive results on the coronavirus pandemic and food security challenges in
tabular form. These results report the underlying information used when generating Figure 5 in
the main manuscript.
• Table A4 shows a robustness test on the results reported in Panel A of Table 1 in the main
manuscript. Instead of standardizing the raw FIES score to have a mean of zero and standard
deviation of one in each survey wave, the dependent variable in Table A4 is left as the raw non-
standardized FIES score. These results show that the estimates in Panel A of Table 1 of the main
manuscript are not driven by this standardization procedure.
• Table A5 shows a robustness test on the results reported in Table 1 by not controlling for missing
observations. This tests if our results are driven by systematic non-response to specific survey
questions. The results shown in Table A5 are qualitatively consistent with the results reported in
Table 1 and therefore highlight that our results are not driven by systematic non-response.
• Table A6 shows a robustness test on the results reported in Panels B through D in Table 1 in the
main manuscript. Specifically, households in Bamako are intentionally omitted from the results
reported in Table A6. These results show that the results reported in Panels B though D in Table
1 in the main manuscript are not primarily driven by the effect of the coronavirus pandemic in
Bamako, but qualitatively persist when excluding Bamako from the estimation specification.
27
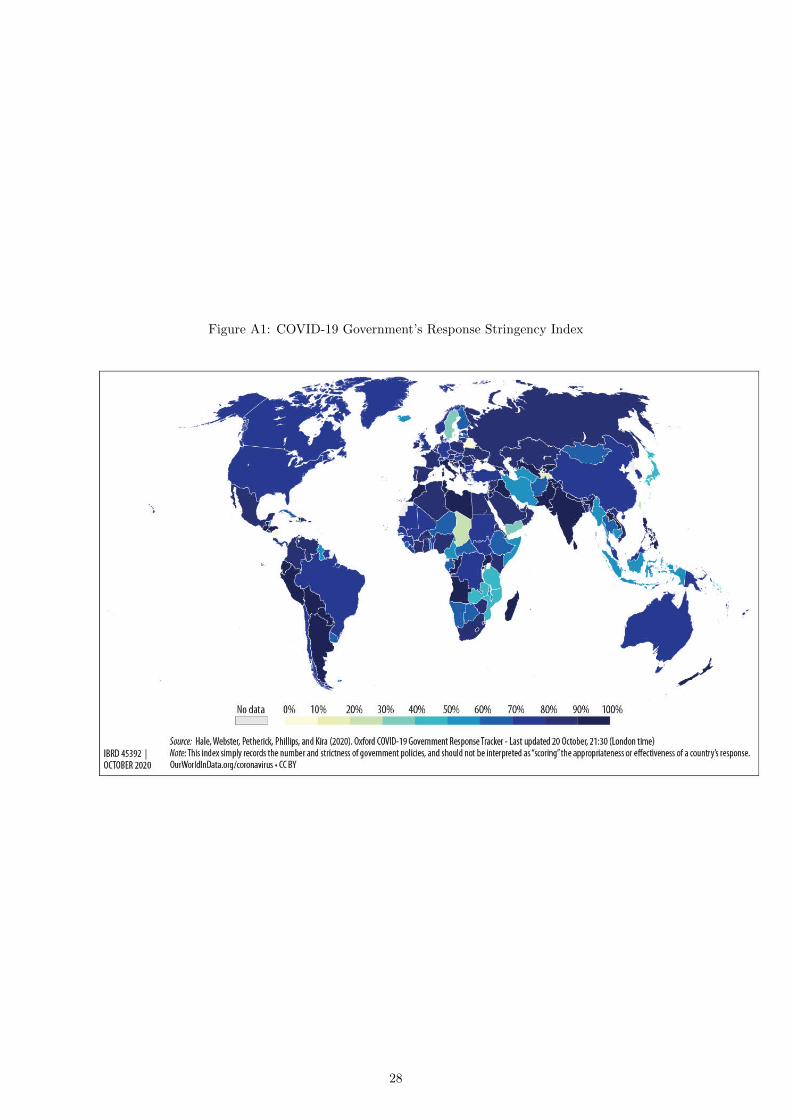
Figure A1: COVID-19 Government’s Response Stringency Index
28
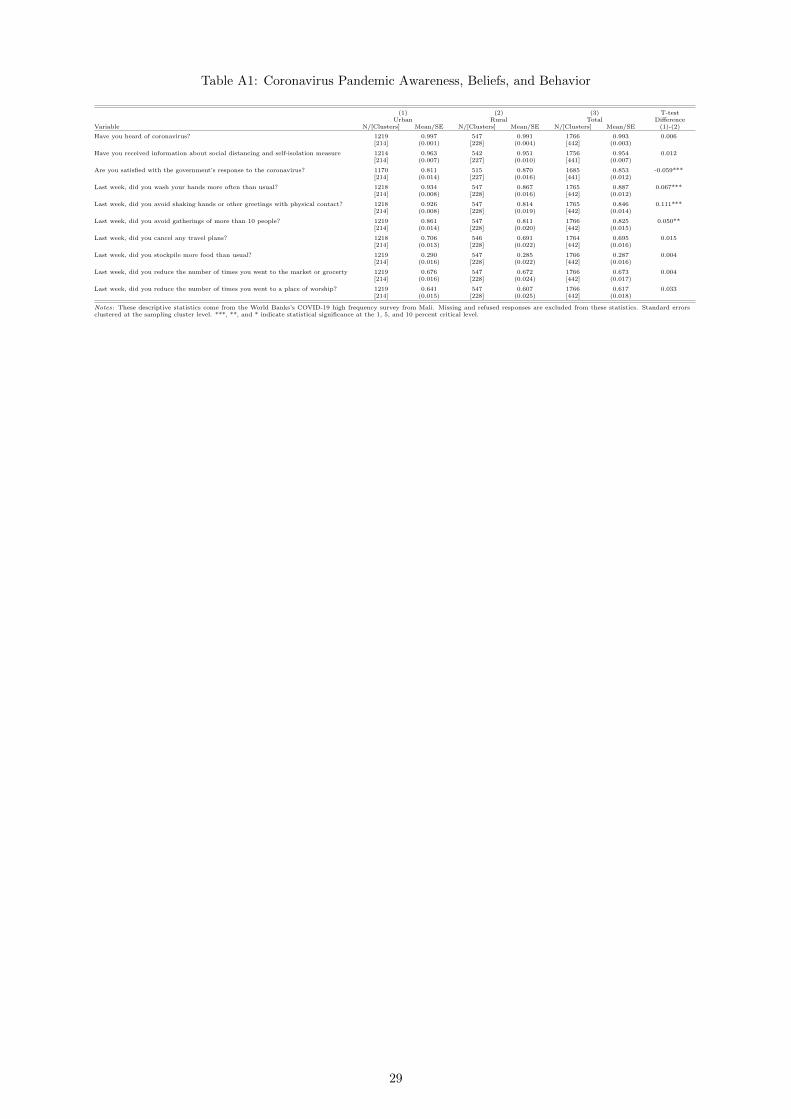
Table A1: Coronavirus Pandemic Awareness, Beliefs, and Behavior
(1) (2) (3) T-testUrban Rural Total Difference
Variable N/[Clusters] Mean/SE N/[Clusters] Mean/SE N/[Clusters] Mean/SE (1)-(2)
Have you heard of coronavirus? 1219[214]
0.997(0.001)
547[228]
0.991(0.004)
1766[442]
0.993(0.003)
0.006
Have you received information about social distancing and self-isolation measure 1214[214]
0.963(0.007)
542[227]
0.951(0.010)
1756[441]
0.954(0.007)
0.012
Are you satisfied with the government’s response to the coronavirus? 1170[214]
0.811(0.014)
515[227]
0.870(0.016)
1685[441]
0.853(0.012)
-0.059***
Last week, did you wash your hands more often than usual? 1218[214]
0.934(0.008)
547[228]
0.867(0.016)
1765[442]
0.887(0.012)
0.067***
Last week, did you avoid shaking hands or other greetings with physical contact? 1218[214]
0.926(0.008)
547[228]
0.814(0.019)
1765[442]
0.846(0.014)
0.111***
Last week, did you avoid gatherings of more than 10 people? 1219[214]
0.861(0.014)
547[228]
0.811(0.020)
1766[442]
0.825(0.015)
0.050**
Last week, did you cancel any travel plans? 1218[214]
0.706(0.013)
546[228]
0.691(0.022)
1764[442]
0.695(0.016)
0.015
Last week, did you stockpile more food than usual? 1219[214]
0.290(0.016)
547[228]
0.285(0.022)
1766[442]
0.287(0.016)
0.004
Last week, did you reduce the number of times you went to the market or grocerty 1219[214]
0.676(0.016)
547[228]
0.672(0.024)
1766[442]
0.673(0.017)
0.004
Last week, did you reduce the number of times you went to a place of worship? 1219[214]
0.641(0.015)
547[228]
0.607(0.025)
1766[442]
0.617(0.018)
0.033
Notes: These descriptive statistics come from the World Banks’s COVID-19 high frequency survey from Mali. Missing and refused responses are excluded from these statistics. Standard errorsclustered at the sampling cluster level. ***, **, and * indicate statistical significance at the 1, 5, and 10 percent critical level.
29
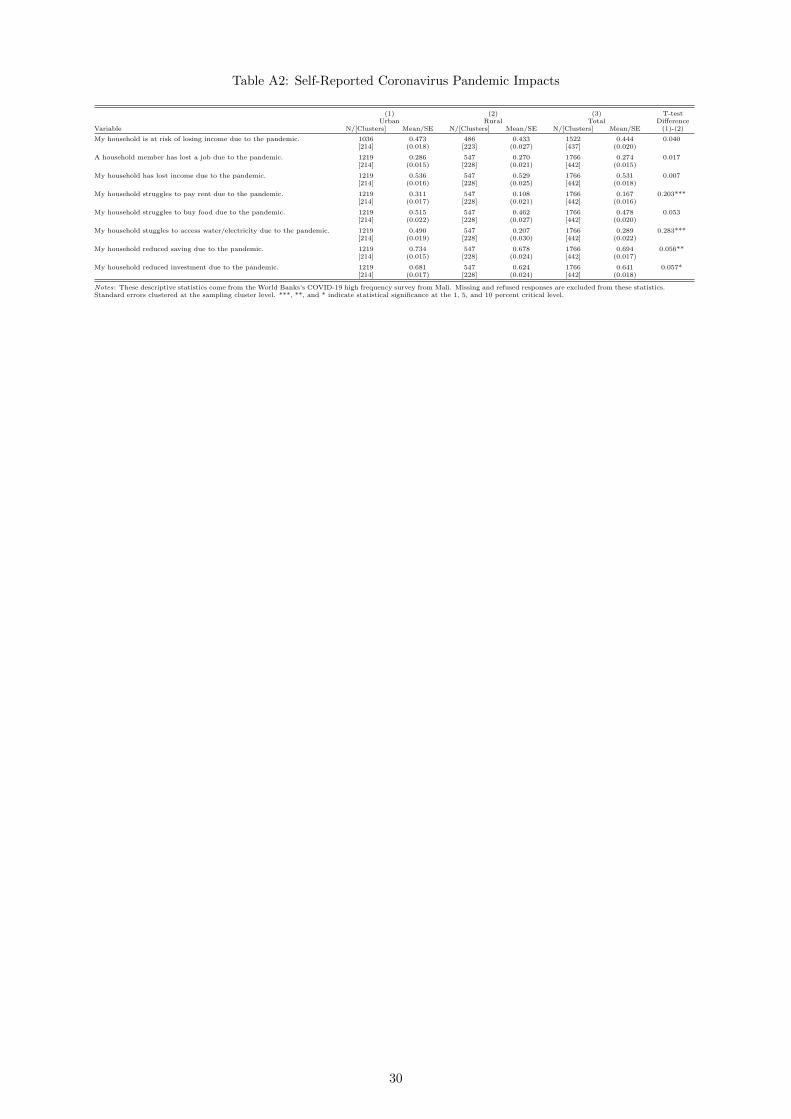
Table A2: Self-Reported Coronavirus Pandemic Impacts
(1) (2) (3) T-testUrban Rural Total Difference
Variable N/[Clusters] Mean/SE N/[Clusters] Mean/SE N/[Clusters] Mean/SE (1)-(2)
My household is at risk of losing income due to the pandemic. 1036[214]
0.473(0.018)
486[223]
0.433(0.027)
1522[437]
0.444(0.020)
0.040
A household member has lost a job due to the pandemic. 1219[214]
0.286(0.015)
547[228]
0.270(0.021)
1766[442]
0.274(0.015)
0.017
My household has lost income due to the pandemic. 1219[214]
0.536(0.016)
547[228]
0.529(0.025)
1766[442]
0.531(0.018)
0.007
My household struggles to pay rent due to the pandemic. 1219[214]
0.311(0.017)
547[228]
0.108(0.021)
1766[442]
0.167(0.016)
0.203***
My household struggles to buy food due to the pandemic. 1219[214]
0.515(0.022)
547[228]
0.462(0.027)
1766[442]
0.478(0.020)
0.053
My household stuggles to access water/electricity due to the pandemic. 1219[214]
0.490(0.019)
547[228]
0.207(0.030)
1766[442]
0.289(0.022)
0.283***
My household reduced saving due to the pandemic. 1219[214]
0.734(0.015)
547[228]
0.678(0.024)
1766[442]
0.694(0.017)
0.056**
My household reduced investment due to the pandemic. 1219[214]
0.681(0.017)
547[228]
0.624(0.024)
1766[442]
0.641(0.018)
0.057*
Notes: These descriptive statistics come from the World Banks’s COVID-19 high frequency survey from Mali. Missing and refused responses are excluded from these statistics.Standard errors clustered at the sampling cluster level. ***, **, and * indicate statistical significance at the 1, 5, and 10 percent critical level.
30
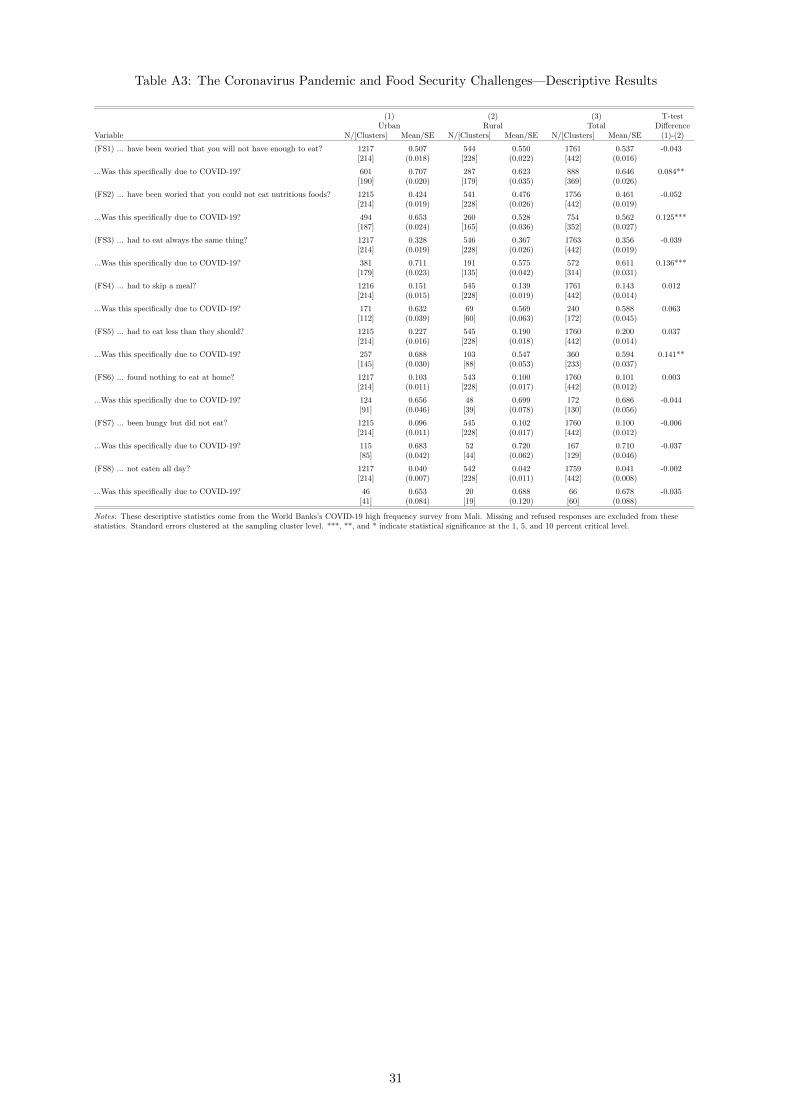
Table A3: The Coronavirus Pandemic and Food Security Challenges—Descriptive Results
(1) (2) (3) T-testUrban Rural Total Difference
Variable N/[Clusters] Mean/SE N/[Clusters] Mean/SE N/[Clusters] Mean/SE (1)-(2)
(FS1) ... have been woried that you will not have enough to eat? 1217[214]
0.507(0.018)
544[228]
0.550(0.022)
1761[442]
0.537(0.016)
-0.043
...Was this specifically due to COVID-19? 601[190]
0.707(0.020)
287[179]
0.623(0.035)
888[369]
0.646(0.026)
0.084**
(FS2) ... have been woried that you could not eat nutritious foods? 1215[214]
0.424(0.019)
541[228]
0.476(0.026)
1756[442]
0.461(0.019)
-0.052
...Was this specifically due to COVID-19? 494[187]
0.653(0.024)
260[165]
0.528(0.036)
754[352]
0.562(0.027)
0.125***
(FS3) ... had to eat always the same thing? 1217[214]
0.328(0.019)
546[228]
0.367(0.026)
1763[442]
0.356(0.019)
-0.039
...Was this specifically due to COVID-19? 381[179]
0.711(0.023)
191[135]
0.575(0.042)
572[314]
0.611(0.031)
0.136***
(FS4) ... had to skip a meal? 1216[214]
0.151(0.015)
545[228]
0.139(0.019)
1761[442]
0.143(0.014)
0.012
...Was this specifically due to COVID-19? 171[112]
0.632(0.039)
69[60]
0.569(0.063)
240[172]
0.588(0.045)
0.063
(FS5) ... had to eat less than they should? 1215[214]
0.227(0.016)
545[228]
0.190(0.018)
1760[442]
0.200(0.014)
0.037
...Was this specifically due to COVID-19? 257[145]
0.688(0.030)
103[88]
0.547(0.053)
360[233]
0.594(0.037)
0.141**
(FS6) ... found nothing to eat at home? 1217[214]
0.103(0.011)
543[228]
0.100(0.017)
1760[442]
0.101(0.012)
0.003
...Was this specifically due to COVID-19? 124[91]
0.656(0.046)
48[39]
0.699(0.078)
172[130]
0.686(0.056)
-0.044
(FS7) ... been hungy but did not eat? 1215[214]
0.096(0.011)
545[228]
0.102(0.017)
1760[442]
0.100(0.012)
-0.006
...Was this specifically due to COVID-19? 115[85]
0.683(0.042)
52[44]
0.720(0.062)
167[129]
0.710(0.046)
-0.037
(FS8) ... not eaten all day? 1217[214]
0.040(0.007)
542[228]
0.042(0.011)
1759[442]
0.041(0.008)
-0.002
...Was this specifically due to COVID-19? 46[41]
0.653(0.084)
20[19]
0.688(0.120)
66[60]
0.678(0.088)
-0.035
Notes: These descriptive statistics come from the World Banks’s COVID-19 high frequency survey from Mali. Missing and refused responses are excluded from thesestatistics. Standard errors clustered at the sampling cluster level. ***, **, and * indicate statistical significance at the 1, 5, and 10 percent critical level.
31
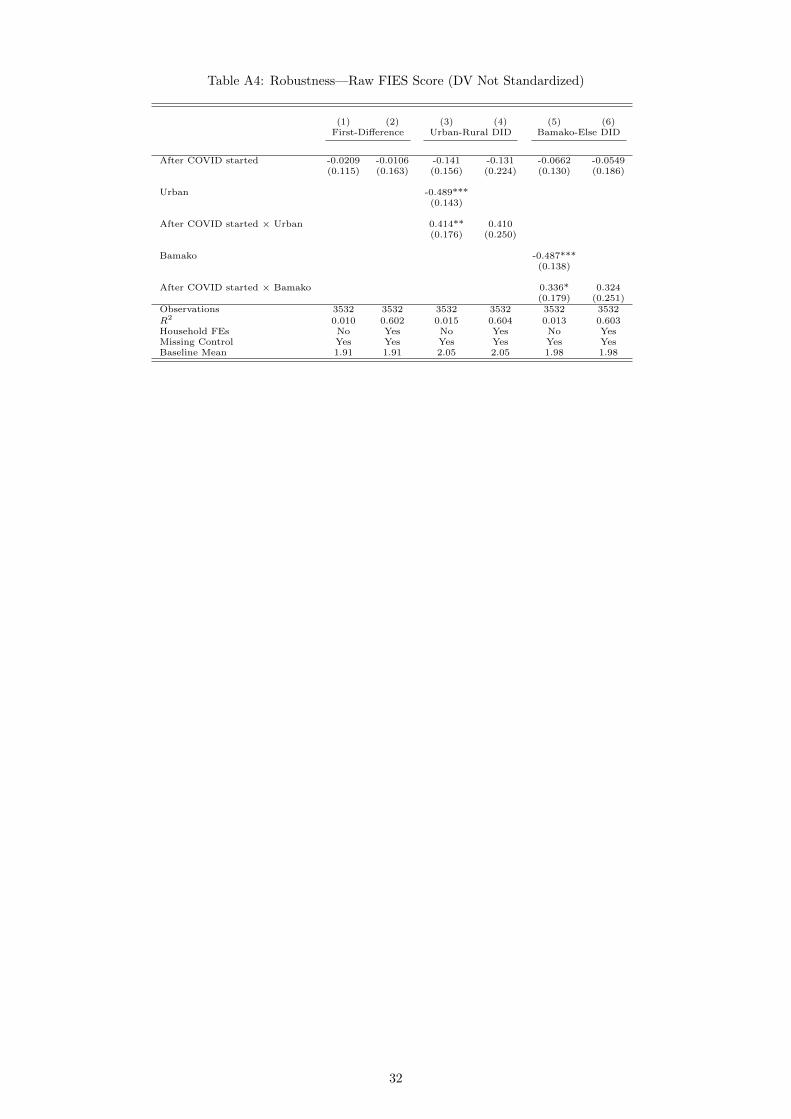
Table A4: Robustness—Raw FIES Score (DV Not Standardized)
(1) (2) (3) (4) (5) (6)First-Difference Urban-Rural DID Bamako-Else DID
After COVID started -0.0209 -0.0106 -0.141 -0.131 -0.0662 -0.0549(0.115) (0.163) (0.156) (0.224) (0.130) (0.186)
Urban -0.489***(0.143)
After COVID started × Urban 0.414** 0.410(0.176) (0.250)
Bamako -0.487***(0.138)
After COVID started × Bamako 0.336* 0.324(0.179) (0.251)
Observations 3532 3532 3532 3532 3532 3532R2 0.010 0.602 0.015 0.604 0.013 0.603Household FEs No Yes No Yes No YesMissing Control Yes Yes Yes Yes Yes YesBaseline Mean 1.91 1.91 2.05 2.05 1.98 1.98
32
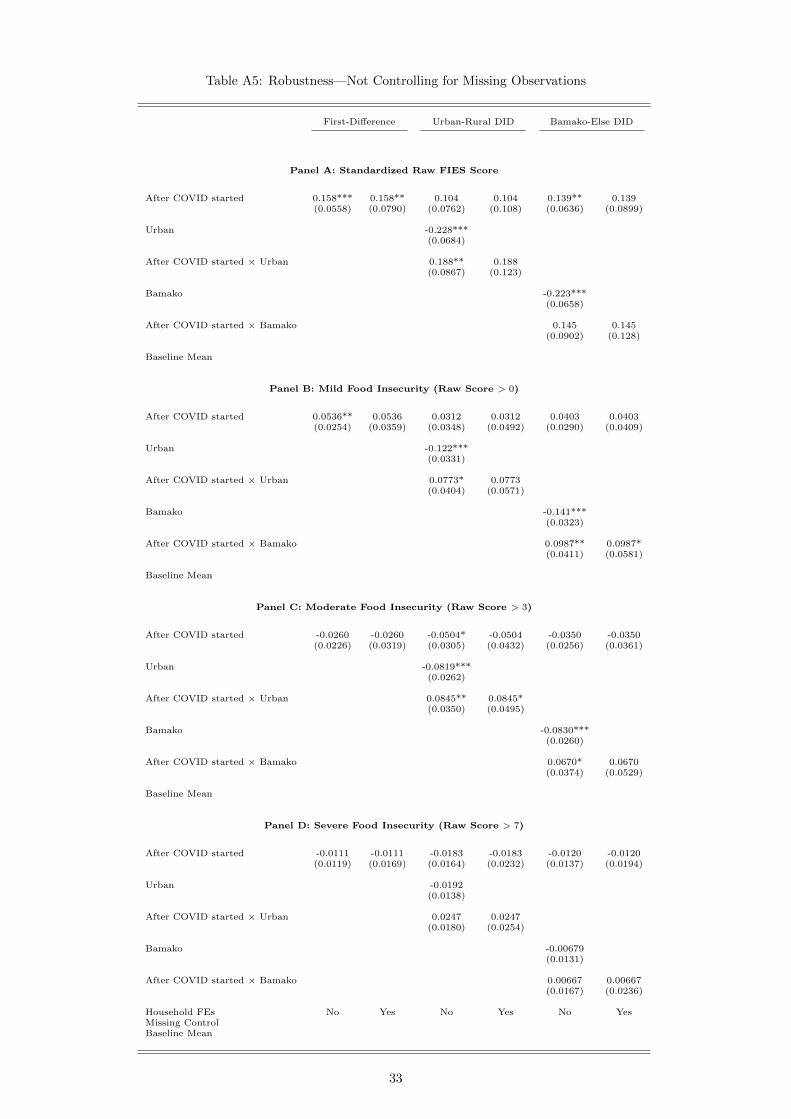
Table A5: Robustness—Not Controlling for Missing Observations
First-Difference Urban-Rural DID Bamako-Else DID
Panel A: Standardized Raw FIES Score
After COVID started 0.158*** 0.158** 0.104 0.104 0.139** 0.139(0.0558) (0.0790) (0.0762) (0.108) (0.0636) (0.0899)
Urban -0.228***(0.0684)
After COVID started × Urban 0.188** 0.188(0.0867) (0.123)
Bamako -0.223***(0.0658)
After COVID started × Bamako 0.145 0.145(0.0902) (0.128)
Baseline Mean
Panel B: Mild Food Insecurity (Raw Score > 0)
After COVID started 0.0536** 0.0536 0.0312 0.0312 0.0403 0.0403(0.0254) (0.0359) (0.0348) (0.0492) (0.0290) (0.0409)
Urban -0.122***(0.0331)
After COVID started × Urban 0.0773* 0.0773(0.0404) (0.0571)
Bamako -0.141***(0.0323)
After COVID started × Bamako 0.0987** 0.0987*(0.0411) (0.0581)
Baseline Mean
Panel C: Moderate Food Insecurity (Raw Score > 3)
After COVID started -0.0260 -0.0260 -0.0504* -0.0504 -0.0350 -0.0350(0.0226) (0.0319) (0.0305) (0.0432) (0.0256) (0.0361)
Urban -0.0819***(0.0262)
After COVID started × Urban 0.0845** 0.0845*(0.0350) (0.0495)
Bamako -0.0830***(0.0260)
After COVID started × Bamako 0.0670* 0.0670(0.0374) (0.0529)
Baseline Mean
Panel D: Severe Food Insecurity (Raw Score > 7)
After COVID started -0.0111 -0.0111 -0.0183 -0.0183 -0.0120 -0.0120(0.0119) (0.0169) (0.0164) (0.0232) (0.0137) (0.0194)
Urban -0.0192(0.0138)
After COVID started × Urban 0.0247 0.0247(0.0180) (0.0254)
Bamako -0.00679(0.0131)
After COVID started × Bamako 0.00667 0.00667(0.0167) (0.0236)
Household FEs No Yes No Yes No YesMissing ControlBaseline Mean
33
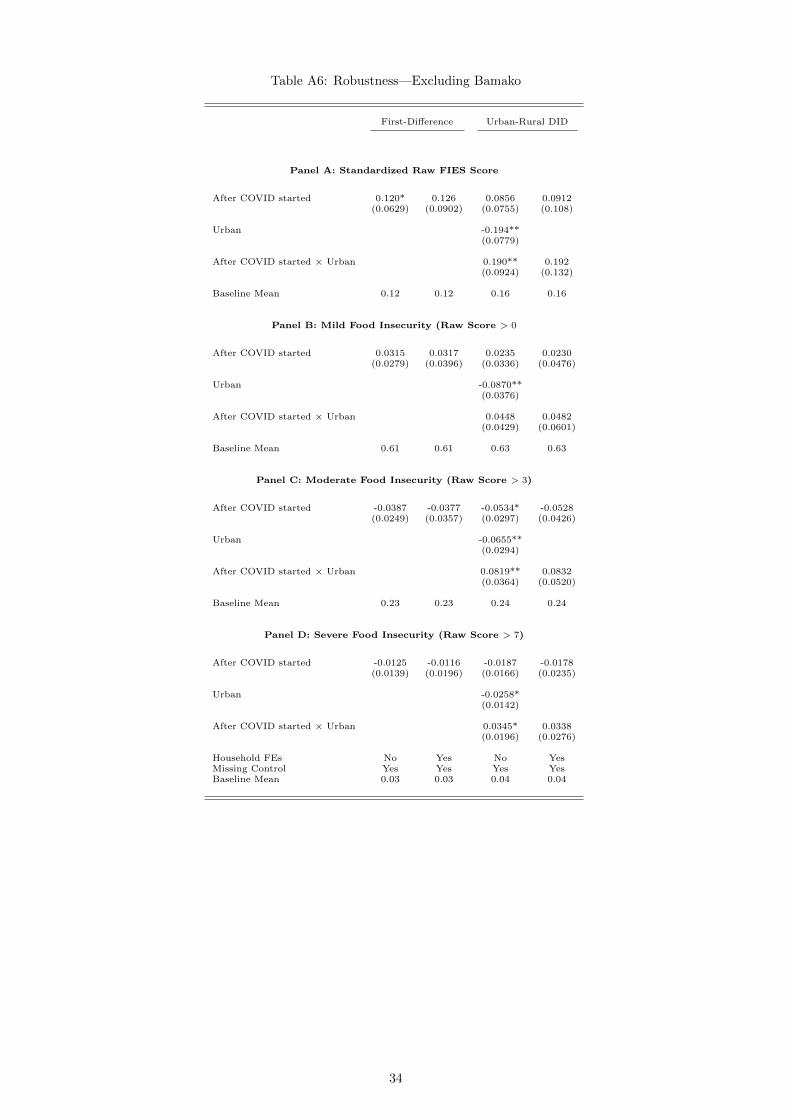
Table A6: Robustness—Excluding Bamako
First-Difference Urban-Rural DID
Panel A: Standardized Raw FIES Score
After COVID started 0.120* 0.126 0.0856 0.0912(0.0629) (0.0902) (0.0755) (0.108)
Urban -0.194**(0.0779)
After COVID started × Urban 0.190** 0.192(0.0924) (0.132)
Baseline Mean 0.12 0.12 0.16 0.16
Panel B: Mild Food Insecurity (Raw Score > 0
After COVID started 0.0315 0.0317 0.0235 0.0230(0.0279) (0.0396) (0.0336) (0.0476)
Urban -0.0870**(0.0376)
After COVID started × Urban 0.0448 0.0482(0.0429) (0.0601)
Baseline Mean 0.61 0.61 0.63 0.63
Panel C: Moderate Food Insecurity (Raw Score > 3)
After COVID started -0.0387 -0.0377 -0.0534* -0.0528(0.0249) (0.0357) (0.0297) (0.0426)
Urban -0.0655**(0.0294)
After COVID started × Urban 0.0819** 0.0832(0.0364) (0.0520)
Baseline Mean 0.23 0.23 0.24 0.24
Panel D: Severe Food Insecurity (Raw Score > 7)
After COVID started -0.0125 -0.0116 -0.0187 -0.0178(0.0139) (0.0196) (0.0166) (0.0235)
Urban -0.0258*(0.0142)
After COVID started × Urban 0.0345* 0.0338(0.0196) (0.0276)
Household FEs No Yes No YesMissing Control Yes Yes Yes YesBaseline Mean 0.03 0.03 0.04 0.04
34


