Embed Size (px)
Citation preview

Journal of the American College of Cardiology Vol. 59, No. 17, 2012© 2012 by the American College of Cardiology Foundation ISSN 0735-1097/$36.00
Cardiac Imaging
Coronary Arterial 18F-Sodium Fluoride UptakeA Novel Marker of Plaque Biology
Marc R. Dweck, MD,*† Marcus W. L. Chow,*† Nikhil V. Joshi, MD,*† Michelle C. Williams, MD,*†Charlotte Jones, BSC,*† Alison M. Fletcher, PHD,† Hamish Richardson, BSC,† Audrey White,*Graham McKillop, MD,† Edwin J. R. van Beek, PHD,† Nicholas A. Boon, MD,*James H. F. Rudd, PHD,‡ David E. Newby, DSC*†
Edinburgh and Cambridge, United Kingdom
Objectives With combined positron emission tomography and computed tomography (CT), we investigated coronary arterialuptake of 18F-sodium fluoride (18F-NaF) and 18F-fluorodeoxyglucose (18F-FDG) as markers of active plaquecalcification and inflammation, respectively.
Background The noninvasive assessment of coronary artery plaque biology would be a major advance particularly in the iden-tification of vulnerable plaques, which are associated with specific pathological characteristics, including micro-calcification and inflammation.
Methods We prospectively recruited 119 volunteers (72 � 8 years of age, 68% men) with and without aortic valve dis-ease and measured their coronary calcium score and 18F-NaF and 18F-FDG uptake. Patients with a calciumscore of 0 were used as control subjects and compared with those with calcific atherosclerosis (calcium score �0).
Results Inter-observer repeatability of coronary 18F-NaF uptake measurements (maximum tissue/background ratio) wasexcellent (intra-class coefficient 0.99). Activity was higher in patients with coronary atherosclerosis (n � 106)versus control subjects (1.64 � 0.49 vs. 1.23 � 0.24; p � 0.003) and correlated with the calcium score (r �
0.652, p � 0.001), although 40% of those with scores �1,000 displayed normal uptake. Patients with increasedcoronary 18F-NaF activity (n � 40) had higher rates of prior cardiovascular events (p � 0.016) and angina (p �
0.023) and higher Framingham risk scores (p � 0.011). Quantification of coronary 18F-FDG uptake was hampered bymyocardial activity and was not increased in patients with atherosclerosis versus control subjects (p � 0.498).
Conclusions 18F-NaF is a promising new approach for the assessment of coronary artery plaque biology. Prospective studies withclinical outcomes are now needed to assess whether coronary 18F-NaF uptake represents a novel marker of plaquevulnerability, recent plaque rupture, and future cardiovascular risk. (An Observational PET/CT Study Examining theRole of Active Valvular Calcification and Inflammation in Patients With Aortic Stenosis; NCT01358513) (J Am CollCardiol 2012;59:1539–48) © 2012 by the American College of Cardiology Foundation
Published by Elsevier Inc. doi:10.1016/j.jacc.2011.12.037
Myocardial infarction (MI) is the foremost cause of death indeveloped countries (1) and confers a major economic, social,and healthcare burden worldwide (2). The majority of MIsresult from rupture of atherosclerotic plaque, although identi-fying those at risk of rupture is problematic. The vast majority(86%) of culprit atherosclerotic lesions cause non-flow limitingluminal stenosis (3,4) that will not be detected by noninvasivestress testing. New methods focusing on plaque pathology are
From the *Centre for Cardiovascular Sciences, University of Edinburgh, United King-dom; †Clinical Research Imaging Centre, University of Edinburgh, Edinburgh,United Kingdom; and the ‡Division of Cardiovascular Medicine, University ofCambridge, Cambridge, United Kingdom. The Clinical Research Imaging Centre issupported by National Health Service Research Scotland through National Health ServiceLothian. Dr. Dweck was supported by a fellowship grant from the British Heart Foundation
(FS/10/026) and the British Heart Foundation Centre of Research Excellence Award. Dr.Joshi is supported by Chief Scientist Office (ETM/160). Dr. van Beek is supported by therequired to identify high-risk lesions so that risk of clinicalevents can be reduced by appropriate therapy.
See page 1549
Calcification is a key feature of human atherosclerosis,and its macroscopic presence in the coronary arteries can bedetected by cardiac computed tomography (CT). Coronary
Scottish Imaging Network—a Platform of Scientific Excellence. Dr. Williams has lectured atmeetings sponsored by Toshiba. The work of Dr. Rudd is supported by HEFCE, the BritishHeart Foundation, and the Cambridge NIHR Biomedical Research Centre. Dr. Newby issupported by the British Heart Foundation (CH/09/002). All other authors have reported thatthey have no relationships relevant to the contents of this paper to disclose. Drs. Rudd andNewby contributed equally to this work and are joint senior authors.
Manuscript received October 12, 2011; revised manuscript received December 14,2011, accepted December 20, 2011.

1540 Dweck et al. JACC Vol. 59, No. 17, 2012Coronary Arterial 18F-NaF Uptake April 24, 2012:1539–48
artery calcium (CAC) scoringprovides a surrogate measure ofthe atherosclerotic burden and apowerful predictor of cardiovas-cular risk (5). Risk predictioncan be improved by examiningthe progression of coronary calcifica-tion (6,7) and by detecting spottycalcification (8). However, CT isunable to measure active calcifica-tion directly and cannot reliably de-tect micro-calcifications that canlead to microfractures and acutethrombosis (9–11). 18F-sodiumfluoride (18F-NaF) is an establishedpositron emission tomography(PET) tracer that detects novel areasof bone formation and remodeling(12). Uptake has also been describedin aortic and carotid atheroma whereactivity is believed to signal areas ofactive vascular calcification, althoughthis is hypothetical (13–15). Todate, 18F-NaF uptake has notbeen measured in the coronaryvasculature.
Inflammation is thought toplay a key role in plaque rupture.Histologically, the vulnerableplaque is characterized by a lipid-
rich pool, infiltration of inflammatory cells, and a thinfibrous cap (4). Macrophages in particular are found inabundance within ruptured plaques and are thought tocontribute to a pro-thrombotic state and degradation of thefibrous cap via the action of matrix metalloproteinases(16). Vascular inflammation can be assessed noninva-sively in the carotid arteries, aorta, iliac, and femoralarteries with uptake of 18F-fluorodeoxyglucose (18F-FDG) as measured by combined PET and computedtomography (CT) (17). 18F-FDG uptake correlates withplaque macrophage burden (18), symptoms (19), andFramingham Risk Score (20) and can be lowered withstatin and other therapies (21,22). Recent in vitro and exvivo data have also suggested that 18F-FDG uptakemight reflect plaque hypoxia (23). However, measure-ment of 18F-FDG uptake within coronary atheroma ischallenging, because of cardiac and respiratory motionand the intense myocardial 18F-FDG uptake that canpotentially swamp any plaque signal (24,25).
The aim of this study was to investigate coronary arterial uptakeof 18F-NaF and 18F-FDG as markers of active calcification andinflammation, respectively. We hypothesized that the degreeof uptake of both tracers would correlate with atheroscleroticdisease severity, symptoms, prior cardiovascular events, and
Abbreviationsand Acronyms
18F-FDG � 18F-fluorodexyglucose
18F-NaF � 18F-sodiumfluoride
CAC � coronary arterycalcium
CAD � coronary arterydisease
CHD � coronary heartdisease
CI � confidence interval
CT � computed tomography
CVA � cerebrovascularaccident
CVD � cardiovasculardisease
LAD � left anteriordescending coronary artery
MACE � major adversecardiovascular events
MI � myocardial infarction
PET � positron emissiontomography
SUV � standard uptake value
TBR � tissue/backgroundratio
predictors of future clinical risk.
Methods
Study population. This was a substudy of a previouslypublished prospective cohort of 121 apparently healthy volun-teers and patients with aortic sclerosis and stenosis (26). Allsubjects were over 50 years of age and consecutively recruitedfrom cardiology outpatient clinics (Royal Infirmary Edin-burgh) to achieve groups of similar age and sex. Exclusioncriteria included insulin-dependent diabetes mellitus, poorlycontrolled type 2 diabetes mellitus, women of childbearingpotential not taking contraception, inability to undergoPET/CT scanning, and life expectancy �2 years. The studywas approved by the local research ethics committee, andwritten informed consent was obtained from all subjects.Baseline clinical assessment. Baseline clinical assessmentwas performed on the day of the initial PET/CT scan andincluded current cardiac symptoms, prior coronary intervention(percutaneous coronary intervention and coronary artery bypassgrafting), and past medical history of previous major adversecardiovascular events (MACE) (MI, cerebrovascular accident,and coronary revascularization). Atherogenic risk factors suchas age, sex, smoking habit, history of hypertension, diabetesmellitus, hypercholesterolemia, socioeconomic status, and fam-ily history of cardiovascular disease were identified. Full exter-nal examination was performed, and height and weight weremeasured to determine body mass index. A 12-lead electro-cardiogram was performed, and venous blood was collected formeasurement of serum creatinine, full lipid profile, and mark-ers of calcium metabolism. On the basis of this information,Framingham risk scores for coronary heart disease (CHD),CHD death, cardiovascular disease (CVD), and CVD deathwere calculated.Dietary restrictions. Myocardial uptake of 18F-FDG cancause overspill of signal into the coronary arteries, leading todifficulties in discriminating coronary artery uptake frommyocardium. All patients in our cohort were asked toobserve a carbohydrate-free, high-fat diet for 24 h beforetheir 18F-FDG scan. This suppresses myocardial uptake byswitching the heart from glucose to free-fatty acid metab-olism (27–29). Patients were provided with written instruc-tions and contacted by phone the day before the scan in anattempt to ensure dietary compliance.PET/CT image acquisition and reconstruction. Subjectsunderwent combined PET/CT imaging of the aorta andcoronary arteries with a hybrid scanner (Biograph mCT,Siemens Medical Systems, Erlangen, Germany). For thefirst scan, an electrocardiogram-gated breath-hold CT scan(non-contrast-enhanced, 40 mAs/rot [CareDose, SiemensMedical Systems], 100 kV) of the coronary arteries wasperformed for calculation of the CAC score. Study subjectswere then administered a target dose of 125 MBq 18F-NaFintravenously and subsequently rested in a quiet environmentfor 60 min. An attenuation correction CT scan (non-enhanced120 kV and 50 mA) was then performed, followed by PET
imaging of the thorax in 3-dimensional mode for 10 min.
ebTmrc(
1tatw
1sqpw
drpa
1541JACC Vol. 59, No. 17, 2012 Dweck et al.April 24, 2012:1539–48 Coronary Arterial 18F-NaF Uptake
For the second scan, subjects were administered a targetdose of 200 MBq 18F-FDG intravenously and subsequentlyrested in a quiet environment for 90 min. CombinedPET/CT imaging was then performed as described for the18F-NaF scan but with a 15-min bed time. Tracer circula-tion times were based on previous studies with 18F-FDGand 18F-NaF in atherosclerosis and aimed for optimalcontrast between the aortic wall, coronary arteries, and theblood pool (14,15,19). The PET data were reconstructedwith the Siemens Ultra-HD (time of flight �True X)reconstruction algorithm. Corrections were applied for at-tenuation, dead time, scatter, and random coincidences. Allimage analysis was performed on fused PET/CT datasets.Image analysis: coronary arteries. Evaluation of the cal-cium score was performed with calcium score analysissoftware (VScore, Vital Images, Minnetonka, Minnesota).Vessel-specific and total Agatston calcium scores werecalculated as described previously (30). The PET and CTimages were fused and analyzed by an experienced readerwith an Osirix workstation (OsiriX version 3.5.1 64-bit;OsiriX Imaging Software, Geneva, Switzerland). For 18F-NaF uptake, the coronary arteries were visually identified,and regions of interest were drawn around areas of maximaluptake in the left main stem, left anterior descending artery,circumflex artery, and the right coronary artery. The maxi-mum standard uptake value (SUV) was recorded from theseregions. It was not possible to determine the mean SUVvalues, given the difficulty in identifying the exact borders ofthe coronary arteries on the non-contrast-enhanced scans.The SUV is the decay-corrected tissue concentration of18F-NaF divided by the injected dose/body weight. How-ver, SUV measurements in vascular structures are influencedy variability in 18F-FDG and 18F-NaF activity in the blood.herefore, SUV measurements were divided by an averagedean SUV value in the blood pool, derived from 5 circular
egions of interest drawn in the center of the superior venaava. This provided maximum tissue/background ratiosTBRs) as a measure of arterial tracer uptake (18,31).
Quantification of 18F-FDG uptake was performed as for8F-NaF but restricted to the proximal and mid-portions ofhe coronary vessels (24). Difficulties were still encountereds a result of the pervasive myocardial uptake observed withhis tracer, and coronary activity was only quantified in areashere myocardial uptake could be confidently avoided.
INTER-OBSERVER REPEATABILITY OF IMAGE ANALYSIS.
After the image analysis methodology was established, PETscans from 20 patients were selected at random from thecohort. All scans from these patients were analyzed inde-pendently by 2 trained observers (M.D., N.J.). This pro-vided measures of inter-observer repeatability for maximumTBR values.Image analysis: aorta. The uptake of 18F-FDG (32) and18F-NaF (13) in the ascending and descending aorta wasquantified as per published methods. Circular regions of
interest were drawn around the aorta on adjacent 3-mm caxial slices with care taken to avoid uptake from extravas-cular structures. Maximum SUV values were once morecorrected for blood-pool activity to provide TBR values.Statistical analysis. Comparisons of tracer uptake wereinitially made between those with and without calcificatherosclerosis. Patients with CAC scores �0 or a priorhistory of ischemic heart disease were considered to haveunderlying calcific coronary atherosclerosis. Patients with aCAC score of 0 and no past history of CHD wereconsidered not to have calcific atherosclerosis and desig-nated as control subjects. Patients with atherosclerosis werethen divided according to well-established cutoffs in thecoronary calcium score (0, 1 to 100, 101 to 400, 401 to1,000, �1,000) (33) to assess the impact of disease severityon tracer activity. Finally, comparisons were made betweensubjects who had normal and increased 18F-NaF uptake.The highest maximum TBR value in the control group wasused as the cutoff value above which 18F-NaF was deemedto be elevated. In patients with underlying calcific coronaryatherosclerosis, those who had increased 18F-NaF uptakewere defined as having active coronary calcification, whereasthose with normal 18F-NaF uptake were defined as havinginactive calcification.
Continuous variables were expressed as mean � SD andcompared with unpaired Student t test or 1-way analysis ofvariance where appropriate. Categorical variables were ex-pressed as percentages and analyzed with the chi-square test.Correlations between normally distributed data were per-formed with Pearson’s correlation, whereas Spearman’s corre-lation was used for nonparametric data. The 95% normal rangefor differences between sets of SUV and TBR measurements(the limits of agreement) were estimated by multiplying theSD of the mean difference by 1.96 (34). Intra-class correla-tion coefficients with 95% confidence intervals (CIs) werecalculated for intraobserver and interobserver variation.Statistical analysis was performed with SPSS software(version 18, SPSS, Inc., Chicago, Illinois). A 2-sided pvalue �0.05 was regarded as statistically significant.
Results
Baseline characteristics. A total of 119 patients wererecruited (age 72 � 8 years, 68% men, 66% with aorticstenosis) and had both 18F-NaF (66 � 6 min after 124 �0 MBq) and 18F-FDG (94 � 7 min after 198 � 13 MBq)cans of their thorax �1 month apart (median 7 days, inter-uartile range 1 to 14 days). The effective radiation dose/atient, including all PET and CT scans, was 9.73 � 1.19 mSvith a CT conversion factor of 0.014 mSv/mGy/cm.Thirteen patients had no past history of coronary artery
isease (CAD) or evidence of calcific coronary atheroscle-osis and formed the control group (Table 1). A total of 106atients had evidence of coronary atherosclerosis: 41 havingclinical diagnosis of prior CAD, and a further 65 having
alcium scores above 0. One patient had experienced an

yocard
1542 Dweck et al. JACC Vol. 59, No. 17, 2012Coronary Arterial 18F-NaF Uptake April 24, 2012:1539–48
acute coronary syndrome in the week before his 18F-NaFscan; otherwise, patients had stable CHD.Dietary restrictions. Average myocardial SUV across theentire cohort was 4.6 � 3.6, and dietary restrictions effec-tively suppressed 18F-FDG myocardial uptake (pre-specified as a maximum SUV �5 measured in the maximalarea of uptake in the left ventricular septum) in 67% ofpatients, similar to that seen in previous studies (24).Sixty-one percent of patients complied with the dietary
Patient Demographic DataTable 1 Patient Demographic Data
Total
ControlCa Score
0
n 119 13
Age (yrs) 72 � 8 66 � 7
Male, % 68 46
BMI, kg/m2 28 � 4 28 � 4
CHD, % 34 0
Angina, % 24 0
MACE, % 40 0
Previous MI 12 0
Previous CVA/TIA 6 0
Previous PCI 15 0
Previous CABG 7 0
Smokers (ex or current), % 50 38
Diabetes, % 15 23
Hypertension, % 60 38
Hypercholesterolemia, % 49 38
Aortic stenosis, % 66 54
Aortic sclerosis, % 17 23
ACEi/ARB, % 49 15
Beta-blockers, % 39 15
Statins, % 53 15
Total cholesterol, mg/dl 193 � 50 227 � 48
LDL cholesterol, mg/dl 104 � 44 123 � 45
HDL cholesterol, mg/dl 54 � 20 69 � 42
Creatinine, mg/dl 0.98 � 0.33 0.97 � 0.1
Calcium, mg/dl 9.30 � 0.57 9.41 � 0.2
Phosphate, mg/dl 3.55 � 0.49 3.68 � 0.5
Alk Phosphatase, U/l 84 � 44 93 � 23
Ca score 414 (79–1,251) 0 (0–0)
18F-NaF Max SUV 1.56 � 0.50 1.21 � 0.2
18F-NaF Max TBR 1.59 � 0.48 1.23 � 0.2
Patients with increased coronary 18F-NaF, % 34% 0%
18F-FDG Max SUV 1.54 � 0.24 1.43 � 0.3
18F-FDG Max TBR 1.22 � 0.21 1.18 � 0.3
10-yr Framingham risk scores
CVD 30 � 13 25 � 17
CVD death 14 � 10 8 � 9
CHD 19 � 12 16 � 15
CHD death 6.3 � 4.7 4.5 � 5.4
Values are mean � SD, %, or median (interquartile range). 18F-NaF and 18-FDG values are based up18F-FDG � 18F-fluorodexyglucose; 18F-NaF � 18F-sodium fluoride; ACEi � angiotensin-conver
score � Agatston coronary calcium score; CABG � coronary artery bypass graft; CHD � coronalipoprotein; LDL � low-density lipoprotein; MACE � major adverse cardiovascular events; MI � mtissue/background ratio; TIA � transient ischemic attack.
restrictions, on the basis of dietary diaries, and had lower
myocardial 18F-FDG uptake than non-compliers (SUV3.2 � 2.3 vs. 6.7 � 4.2; p � 0.001).18F-NaF coronary uptake. Coronary 18F-NaF uptakewas quantifiable in 96% of the coronary territories exam-ined. It was not possible to assess the left main stem in 20patients, due to overspill of activity from the aortic valvesecondary to calcific aortic stenosis (Table 2). Repeatabilitystudies were excellent for coronary 18F-NaF quantificationwith no fixed or proportional biases, limits of agreement of
Atherosclerosis
Ca Score1–100
Ca Score101–400
Ca Score401–1,000
Ca Score>1,000
19 23 27 37
69 � 8 72 � 8 70 � 9 76 � 7
58 61 74 81
28 � 3 28 � 4 28 � 4 27 � 5
0 17 48 65
0 13 37 43
0 32 44 75
0 9 11 24
0 14 4 8
0 9 22 27
0 0 7 16
53 26 59 59
5 13 12 22
42 65 52 57
39 39 59 57
58 61 78 73
11 22 11 19
21 39 56 76
26 48 44 46
21 52 67 73
199 � 41 204 � 57 175 � 44 181 � 49
119 � 37 112 � 52 93 � 36 94 � 42
54 � 12 52 � 15 54 � 18 51 � 12
0.90 � 0.13 0.93 � 0.12 0.88 � 0.14 0.86 � 0.12
9.41 � 0.97 9.29 � 0.61 9.24 � 0.32 9.24 � 0.49
3.57 � 0.55 3.51 � 0.40 3.53 � 0.40 3.54 � 0.48
83 � 25 79 � 20 80 � 23 77 � 27
19 (2–46) 277 (125–351) 734 (448–888) 1783 (1,357–3,410)
1.28 � 0.27 1.40 � 0.27 1.49 � 0.31 1.97 � 0.60
1.33 � 0.32 1.42 � 0.27 1.59 � 0.29 1.97 � 0.58
5% 26% 41% 59%
1.56 � 0.19 1.55 � 0.27 1.46 � 0.24 1.60 � 0.22
1.25 � 0.18 1.19 � 0.16 1.22 � 0.29 1.24 � 0.15
27 � 13 31 � 10 27 � 12 35 � 13
11 � 8 14 � 8 12 � 10 18 � 11
18 � 11 20 � 10 18 � 12 22 � 12
5.2 � 3.9 6.3 � 3.6 5.3 � 4.4 8.3 � 5.1
aximum values recorded in the coronary vasculature of each patient.yme inhibitors; Alk � alkaline; ARB � angiotensin receptor blocker; BMI � body mass index; Cat disease; CVA � cerebrovascular accident; CVD � cardiovascular disease; HDL � high-densityial infarction; PCI � percutaneous coronary intervention; SUV � standard uptake value; TBR �
2
3
5
6
2
0
1
on the mting enzry hear
�0.14 for maximum TBR values (Fig. 1), and an intra-class

mlibd
wumu4h
uwi
0o
haivfstCTCw(pewp
iobbaldfi1dcilai
y territoright
1543JACC Vol. 59, No. 17, 2012 Dweck et al.April 24, 2012:1539–48 Coronary Arterial 18F-NaF Uptake
correlation coefficient value of 0.99 (95% CI: 0.98 to 1.00).Limits of agreement for 18F-NaF were in the order �0.20when examined in each of the coronary territories (Table 2).
18F-NaF activity was observed in areas overlying, adjacentto, and remote from existing coronary calcification. Uptake wasfocal in nature and could be localized to individual coronaryplaques. Areas of coronary calcification with no 18F-NaFuptake were also commonly observed (Fig. 2).
Coronary 18F-NaF uptake was higher in those withcoronary atherosclerosis, compared with the control group(1.64 � 0.49 vs. 1.23 � 0.24; p � 0.003) (Table 1). Thehighest maximum TBR value in the control group was 1.61,which was used to divide patients with coronary atheroscle-rosis into those with increased 18F-NaF uptake (activecalcification; TBR maximum �1.61; n � 40) and thosewithout (inactive calcification; TBR maximum �1.61; n �66) (Fig. 2, Table 3).
Patients with increased 18F-NaF uptake were older,ore likely to be male, and had lower serum high-density
ipoprotein cholesterol concentrations than those withoutncreased uptake (Table 3). Overall statin use was similaretween the groups, although atorvastatin use seemed to beouble in those with active calcification (28% vs. 14%; p �
0.077). They also had higher calcium scores, and there wasa strong correlation between the CAC score and 18F-NaFuptake (r � 0.652, p � 0.001). However extensive overlap
as observed, with some patients with increased 18F-NaFptake having relatively little coronary calcification (mini-um Agatston score 98) and patients without 18F-NaF
ptake having extensive calcium (maximum Agatston score,636). Indeed 41% of patients with CAC scores �1,000ad no significant 18F-NaF uptake (Table 1).Sites of increased 18F-NaF uptake were evenly distrib-
ted across the coronary vasculature (Table 2), and activityas 50% higher on average in these plaques compared with
18F-NaF and 18F-FDG SUV Max and TBR Max ValuesTable 2 18F-NaF and 18F-FDG SUV Max and TBR Max Values
Coronar
LMS LAD C
18F-NaF
% interpretable 83% 100% 9
SUV max 1.36 � 0.40 1.32 � 0.46 1.38
TBR max 1.36 � 0.44 1.35 � 0.46 1.42
% with increased activity(TBR �1.61)
13% 21% 1
Interobserver limits of agreement(mean difference � 2 SD)
0.06 � 0.17 0.01 � 0.20 0.00
18F-FDG
% interpretable 25% 74% 3
SUV max 1.55 � 0.25 1.45 � 0.27 1.48
TBR max 1.20 � 0.23 1.14 � 0.23 1.14
Interobserver limits of agreement �0.09 � 0.28 �0.21 � 0.48 �0.12
The 18F-NaF and 18F-FDG maximum standard uptake values (SUV max) and tissue/backgroundrepeatability statistics are also provided for TBR maximum measurements in each of the coronar
CX � circumflex; LAD � left anterior descending coronary artery; LMS � left main stem; RCA �
nactive plaques in the same patient (2.14 � 0.42 vs. 1.43 � F
.32; p � 0.001). In 25 patients, significant uptake wasbserved in 2 or more coronary territories.Patients with high 18F-NaF uptake were more likely to
ave a clinical diagnosis of CAD (60% vs. 26%; p � 0.001),nginal symptoms (40% vs. 20%; p � 0.023), prior revascular-zation (38% vs. 11%: p � 0.001), and previous MACE (45%s. 23%; p � 0.016) (Table 3). Furthermore, cardiovascular riskactor burden was increased. Framingham risk predictioncores were higher in those with increased 18F-NaF uptake inerms of Framingham CVD (p � 0.033), CHD (p � 0.049),VD death (p � 0.011), and CHD death (p � 0.024) (Fig. 3,able 3). Interestingly 10-year Framingham risk scores forVD, CVD death, and CHD death all displayed a correlationith 18F-NaF coronary uptake but not with the CAC score
Table 4). Framingham risk scores are not designed foratients with prior cardiovascular events. If these patients werexcluded from the analysis, risk scores remained higher in thoseith active calcification for both CHD (18 � 12 vs. 26 � 12;� 0.020) and CVD (29 � 13 vs. 37 � 12; p � 0.017).One patient was assessed 1 week after sustaining an
nferior non–ST-segment elevation MI. Intense uptake wasbserved in the proximal right coronary artery, which hadeen felt clinically to be the culprit coronary artery (on theasis of dynamic changes on the electrocardiogram andppearances at invasive coronary angiography). Relativelyittle uptake was observed in his other coronary territories,espite having 3-vessel CAD and extensive coronary calci-cation (Fig. 2, Online Video).8F-FDG coronary uptake. The 18F-FDG uptake wasifficult to quantify, particularly in the left main stem andircumflex artery. It was not possible to quantify accuratelyn 49% of the vessel territories examined (Table 2). This wasargely the result of myocardial spill over into the coronaryrteries, which was observed despite the dietary restrictionsmposed in the study. Even when possible, coronary 18F-
ies
Ascending Aorta Descending AortaRCA All Vessels
100% 96% 100% 100%
2 1.27 � 0.41 1.56 � 0.50 1.97 � 0.43 2.01 � 0.40
2 1.30 � 0.41 1.59 � 0.48 2.01 � 0.31 2.06 � 0.35
16% 34% — —
1 0.01 � 0.21 0.03 � 0.14 — —
74% 51% 100% 100%
8 1.34 � 0.22 1.54 � 0.24 2.23 � 0.35 2.24 � 0.31
9 1.05 � 0.24 1.22 � 0.21 1.78 � 0.25 1.79 � 0.25
2 �0.23 � 0.30 �0.22 � 0.32 — —
BR max) values in the coronary arteries, ascending aorta, and descending aorta. Inter-observerries (mean difference � limits of agreement).
coronary artery; other abbreviations as in Table 1.
y Arter
X
9%
� 0.4
� 0.4
9%
� 0.2
3%
� 0.2
� 0.1
� 0.4
ratio (T
DG repeatability was inferior to that for 18F-NaF, with a

i0
c1
0uaMtAa
a14tva00vila
1544 Dweck et al. JACC Vol. 59, No. 17, 2012Coronary Arterial 18F-NaF Uptake April 24, 2012:1539–48
fixed bias of 0.22, limits of agreement of � 0.32 and anntra-class correlation coefficient value of 0.67 (95% CI:.31 to 0.86) (Fig. 1).There were no differences in 18F-FDG uptake between the
ontrol group and those with atherosclerosis (1.18 � 0.31 vs..23 � 0.20; p � 0.498) (Table 1). There also was no
correlation between 18F-FDG activity and the CAC score,whether in the coronary vasculature as a whole (r � 0.063, p �0.538) or on a vessel-by-vessel basis (LAD: r � �0.041, p �.705; RCA: r � 0.039, p � 0.726). The 18F-FDG coronaryptake was not associated with increased rates of CAD,nginal symptoms, prior coronary revascularization, or previous
ACE. Neither was there a significant correlation with any ofhe risk prediction scores (Table 4).
ortic uptake. 18F-NaF uptake in the aorta was observed in
Figure 1 Bland Altman Plot of Inter-Observer Repeatabilityfor Max TBR Values for 18F-NaF and 18F-FDG
Bland Altman plot of inter-observer repeatability for maximum (Max) tissue/background ratio (TBR) values for (A) 18F-sodium fluoride (18F-NaF) and(B) 18F-fluorodeoxyglucose (18F-FDG). Blue line shows the mean inter-observerdifference. Grey lines show the limits of agreement for measurements.
focal distribution most commonly in areas overlying or
djacent to existing aortic calcification (Fig. 4). Less frequently8F-NaF uptake occurred in the absence of local calcium (Fig., Table 2). Across the cohort as a whole, 18F-NaF uptake inhe aorta was higher than in the coronary arteries (2.01 � 0.31s. 1.59 � 0.48; p � 0.001) (Table 2). Uptake in the ascendingorta correlated with activity in the descending aorta (r �.815, p � 0.001) and the coronary arteries (r � 0.525, p �.001) and with Framingham risk scores (e.g., ascending aortas. CVD: r � 0.208, p � 0.024). However, among those withncreased coronary 18F-NaF activity, a correlation was noonger observed between activity in the coronary vasculaturend the aorta (r � 0.157, p � 0.333).
Figure 2Fused Positron EmissionTomography/Computed TomographyImages of 18F-NaF Activity in the Coronary Arteries
(A) Patient in the control group with no coronary calcium and no coronary 18F-sodium fluoride (18F-NaF) uptake. Note the intense uptake in the vertebrae.(B) Patient with extensive calcification in the left anterior descending artery(LAD) but no 18F-NaF uptake. (C) Intense focal 18F-NaF uptake is observedin the proximal LAD overlying existing coronary calcium in this region. (D) In-creased and focal 18F-NaF uptake is observed in the mid-LAD adjacent to anarea of existing coronary calcification. (E) Patient who suffered a recent inferiornon-ST-segment elevation myocardial infarction showing intense focal uptake ofthe proximal right coronary artery with sparing of the LAD. The proximal rightcoronary artery was felt to be the culprit artery on the basis of the electrocar-diogram and appearances on coronary angiography (F), which demonstrated acomplex ulcerated plaque with in situ thrombus (Online Video).

pt0N0o
D
Tcti
bcwNpThpcpmprsta
(vtesiafop(aoa1
1545JACC Vol. 59, No. 17, 2012 Dweck et al.April 24, 2012:1539–48 Coronary Arterial 18F-NaF Uptake
18F-FDG uptake was observed in a circumferentialpattern around the aortic wall as previously described(Fig. 4) (17). Maximum 18F-FDG TBR in the ascendingaorta correlated strongly with that in the descending aorta(r � 0.824, p � 0.001) and the coronary arteries (r � 0.543,
� 0.001). 18F-FDG activity was higher in the aorta thanhe coronary arteries (1.78 � 0.25 vs. 1.22 � 0.21; p �.001) (Table 2). There was no correlation between 18F-aF and 18F-FDG uptake in the ascending aorta (r �
.043, p � 0.647), descending aorta (r � 0.124, p � 0.183),r the coronary arteries (r � 0.127, p � 0.21).
iscussion
his is the first study to describe 18F-NaF uptake in theoronary arteries with PET/CT. We have demonstratedhat this technique is both feasible and repeatable and that
Baseline Characteristics and10-Year Framingham Risk ScoresTable 3 Baseline Characteristics and10-Year Framingham Risk Scores
Low 18F-NaFUptake (n � 66)
High 18F-NaFUptake (n � 40) p Value
Age, yrs 71 � 8 75 � 8 0.015*
Male, % 65 80 0.103
BMI, kg/m2 27 � 4 28 � 5 0.343
CHD, % 26 60 �0.001†
Angina, % 20 40 0.023*
MACE, % 23 45 0.016*
Previous MI 11 18 0.324
Previous CVA/TIA 8 5 0.591
Previous PCI 9 30 0.005†
Previous CABG 2 18 0.003†
Smokers (ex/current), % 50 52 0.803
Diabetes, % 12 18 0.410
Hypertension, % 59 68 0.387
Hypercholesterolemia, % 49 53 0.745
ACEi/ARB, % 50 58 0.453
Beta-blockers, % 38 50 0.221
Statin, % 52 68 0.107
Atorvastatin, % 14 28 0.077
Total cholesterol, mg/dl 196 � 48 174 � 48 0.023*
LDL cholesterol, mg/dl 105 � 43 96 � 43 0.288
HDL cholesterol, mg/dl 55 � 15 48 � 11 0.021*
Creatinine, mg/dl 0.90 � 0.14 0.87 � 0.11 0.278
Calcium, mg/dl 9.21 � 0.43 9.39 � 0.79 0.125
Phosphate, mg/dl 3.55 � 0.52 3.51 � 0.43 0.647
Alkaline phosphatase, U/l 81 � 23 87 � 69 0.473
Coronary calcium score 372 (75–994) 1249 (589–2790) �0.001†
Coronary 18F-NaF TBR max 1.34 � 0.17 2.14 � 0.42 �0.001†
Coronary 18F-FDG TBR max 1.23 � 0.20 1.23 � 0.20 0.875
10-yr Framingham risk scores
CVD 29 � 13 34 � 12 0.033*
CVD death 12 � 9 17 � 11 0.011*
CHD 18 � 11 23 � 12 0.049
CHD death 5.8 � 4.4 7.9 � 4.6 0.024*
Values are mean � SD, %, or median (interquartile range). Baseline characteristics and 10-yearFramingham risk scores of patients with coronary atherosclerosis and either normal (SUV �1.61) orhigh (SUV �1.61) coronary 18F-NaF uptake. *p � 0.05 †p � 0.01
Abbreviations as in Table 1.
t can provide key insights into coronary artery plaque
iology. Activity was higher in patients with atherosclerosisompared with control subjects, displaying a progressive riseith increasing atherosclerotic burden. Furthermore, 18F-aF uptake can be used to discriminate between those
atients with active and inactive coronary calcification.hose with active calcification (38%) were more likely toave clinically significant CAD, a higher incidence ofrevious MACE, lower serum high-density lipoproteinholesterol concentrations, and higher Framingham riskrediction scores. Therefore, 18F-NaF holds promise as aeans of identifying high-risk populations and refining the
redictive power of CAC scoring. Finally, the spatialesolution of PET/CT allows localization of the 18-NaFignal to specific coronary territories and plaques offeringhe possibility of identifying vulnerable or culprit plaque onn individual basis.
18F-NaF uptake has been described recently in the aorta14) and carotid arteries (15) and is believed to reflect activeascular calcification. Although histological validation ofhis hypothesis is lacking, mechanistic information can bextrapolated from 18F-NaF uptake in bone that has beentudied for over 30 years. In that tissue, 18F-NaF isncorporated directly into exposed hydroxyapatite crystal vian exchange mechanism with hydroxyl groups (35). There-ore it detects novel areas of calcification as well as regionsf remodeling and is used clinically in Paget’s disease (36),rimary osteoblastic tumors, and metastatic bone disease37). Similarly, we believe that coronary uptake reflectsctive calcification in atherosclerotic plaque. Certainly cor-nary 18F-NaF uptake seems to offer information that isdditional and complementary to CAC scoring. Although8F-NaF activity was most commonly observed overlying
Figure 310-Year Framingham Risk Scores for ControlSubjects and Patients With Atherosclerosis WhoDid and Did Not Have Increased 18F-NaF Uptake
Error bars denote the SD of the mean. 18F-NaF � 18F-sodiumfluoride; CHD � coronary heart disease; CVD � cardiovascular disease.

ccbrNcafitto
aecc(lspsMiwapwb
1546 Dweck et al. JACC Vol. 59, No. 17, 2012Coronary Arterial 18F-NaF Uptake April 24, 2012:1539–48
existing calcium and a strong correlation was observed withthe CAC score, 41% of patients with scores �1,000 had nosignificant 18F-NaF uptake and, areas of increased traceruptake were also found in regions remote from establishedalcium. This activity potentially relates to developing micro-alcification that is frequently beyond the resolution of CT andelieved to be associated with increased mechanical stress andisk of future cardiovascular events (9–11). Therefore, 18F-aF seems to distinguish between patients with dormant
alcific disease, established many months or years previously,nd subjects with metabolically active disease where the calci-cation process is ongoing. Importantly this distinction seemso be of clinical relevance, with higher rates of anginal symp-oms, prior MACE events, and cardiovascular risk factor scoresbserved in those with active disease.
Calcification plays a key role in the pathophysiology oftherosclerosis, although its triggers remain debated. Ath-rosclerotic plaques with healed rupture almost invariablyontain calcium (38,39), leading to the hypothesis thatalcification forms part of a healing response to such events7,40,41). The spatial resolution of PET/CT is sufficient toocalize 18F-NaF activity to specific coronary territories,uggesting that 18F-NaF might be able to identify theresence and location of recent plaque rupture. This isupported by the PET/CT findings in the patient with recent
I. Extensive calcification was present in all 3 vessels, yetncreased 18F-NaF was only observed in the culprit lesion,hich was found to be complex and associated with thrombus
t the time of coronary angiography. According to this hy-othesis, the increased 18F-NaF activity observed in patientsith stable CAD reflects sub-clinical plaque rupture that has
Correlation of 10-Year Framingham Risk ScoresWith the Coronary Calcium Score and PET UptaTable 4 Correlation of 10-Year FraminghamWith the Coronary Calcium Score a
CVD Events
Coronary calcium score r � 0.112
p � 0.230
18F-NaF max TBR
Coronary arteries r � 0.196
p � 0.035*
Ascending aorta r � 0.208
p � 0.024*
Descending aorta r � 0.199
p � 0.032*
18F-FDG max TBR
Coronary arteries r � �0.024
p � 0.815
Ascending aorta r � �0.018
p � 0.845
Descending aorta r � �0.043
p � 0.645
Correlation of 10-year Framingham risk scores with the coronary calci*p � 0.05; †p � 0.01.
Abbreviations as in Table 1.
een demonstrated in over 10% of such patients undergoing
angioscopy (42,43) and is thought to underlie the step-wisegrowth of coronary atheroma.
Coronary calcification might occur as a response tointense plaque inflammation. Similar calcific responses canbe observed in other inflammatory conditions such astuberculosis, and intra-vascular ultrasound studies haverecently associated micro-calcification with a large necroticcore (44). However, this theory is not supported by our18F-FDG data, which failed to show a correlation with18F-NaF activity in either the coronary arteries or the aorta,indicating that inflammation and calcification occur inde-pendently in these regions.
By contrast to 18F-NaF, 18F-FDG activity was notincreased in patients with coronary atherosclerosis, com-pared with control subjects. However, our data werehampered by myocardial uptake that rendered one-half ofthe coronary territories un-interpretable. This largelyreflected the imperfect dietary compliance that occurredin one-third of patients, despite the detailed writteninstructions and verbal reminders provided. Further stud-ies are required in younger cohorts in whom compliancemight be improved, although our data do suggest that18F-FDG might be of limited use in the assessment ofstable coronary disease. Inflammation has a more prom-inent role in acute coronary syndromes, and therefore18-FDG might provide more information in these pa-tients. Indeed a recent study demonstrated increased18F-FDG uptake in unstable versus stable plaque in theproximal coronary vasculature (24).Study limitations. Positron emission tomography/CT isexpensive, especially when compared with circulating biomark-
ScoresT Uptake
0-Yr Framingham Risk Scores
Death CHD Events CHD Death
0.152 r � 0.047 r � 0.110
0.101 p � 0.617 p � 0.237
0.282 r � 0.138, r � 0.220
0.002† p � 0.137 p � 0.017*
0.239 r � 0.141 r � 0.195
0.009† p � 0.129 p � 0.035*
0.231 r � 0.144 r � 0.191
0.012* p � 0.122 p � 0.039*
0.118 r � 0.059 r � 0.060
0.245 p � 0.565 p � 0.560
�0.047 r � 0.031 r � 0.012
0.618 p � 0.741 p � 0.899
�0.052 r � 0.030 r � �0.019
0.584 p � 0.752 p � 0.842
re and 18F-NaF or 18F-FDG uptake in the coronary arteries and aorta.
keRisknd PE
1
CVD
r �
p �
r �
p �
r �
p �
r �
p �
r �
p �
r �
p �
r �
p �
um sco
ers of calcification activity, and this might limit its clinical use.
1547JACC Vol. 59, No. 17, 2012 Dweck et al.April 24, 2012:1539–48 Coronary Arterial 18F-NaF Uptake
However, we have demonstrated that—among those withincreased 18F-NaF uptake—activity in the coronaries did notcorrelate with that in the aorta, suggesting that it is driven bylocal rather than systemic factors. Therefore blood-basedbiomarkers are unlikely to provide an accurate indication ofcoronary calcification activity and instead will tend to reflectthat within larger vessels or skeletal bone. Therefore, in ouropinion the added costs of PET/CT are justified by its uniqueability to measure calcification activity specific to the coronaryvasculature. Moreover, 18F-NaF is a very simple and relativelycheap ligand to produce.
The majority of our patients had either concomitantaortic stenosis or aortic sclerosis. Although atherosclero-sis and aortic stenosis often co-exist and share manycommon etiological factors and histopathological simi-larities, it is nevertheless important to confirm thesefindings in a cohort of patients more representative of theclinical population with atherosclerosis in the absence of
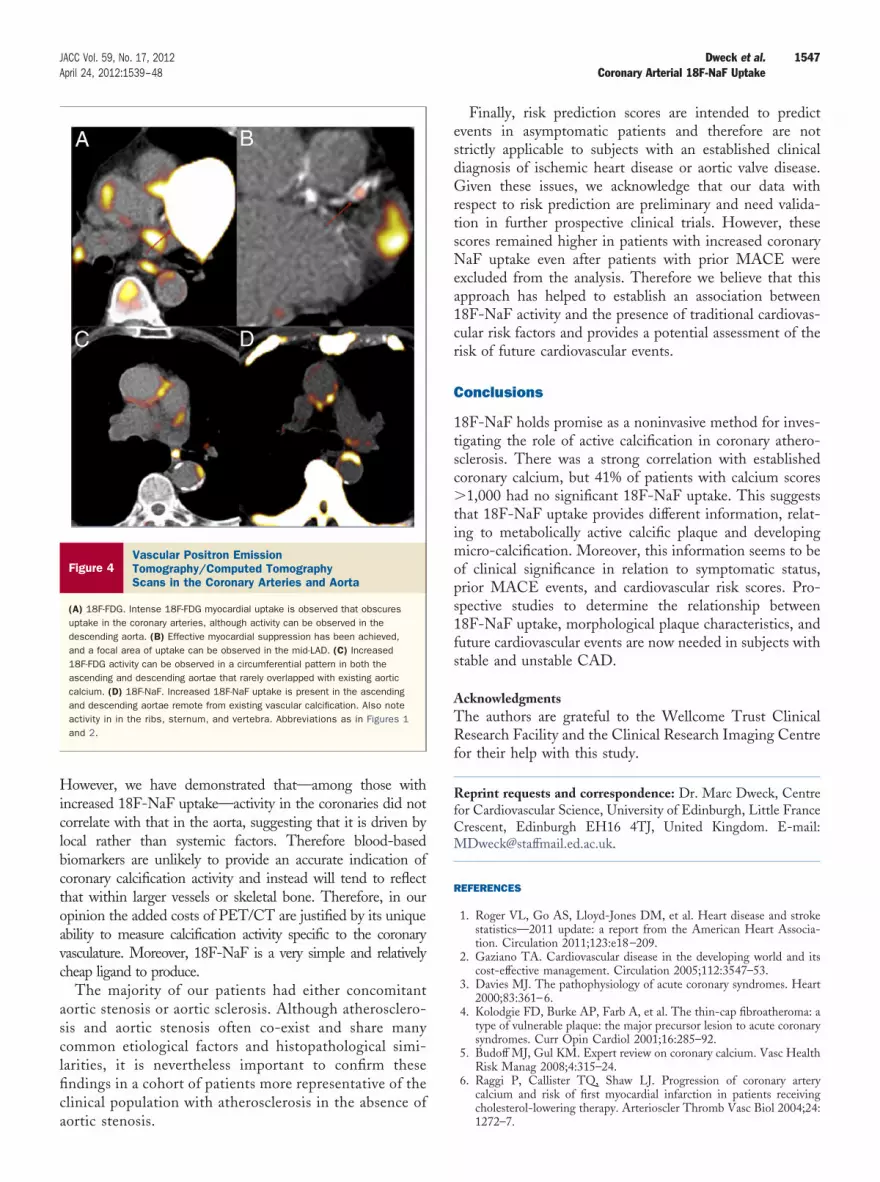
Figure 4Vascular Positron EmissionTomography/Computed TomographyScans in the Coronary Arteries and Aorta
(A) 18F-FDG. Intense 18F-FDG myocardial uptake is observed that obscuresuptake in the coronary arteries, although activity can be observed in thedescending aorta. (B) Effective myocardial suppression has been achieved,and a focal area of uptake can be observed in the mid-LAD. (C) Increased18F-FDG activity can be observed in a circumferential pattern in both theascending and descending aortae that rarely overlapped with existing aorticcalcium. (D) 18F-NaF. Increased 18F-NaF uptake is present in the ascendingand descending aortae remote from existing vascular calcification. Also noteactivity in in the ribs, sternum, and vertebra. Abbreviations as in Figures 1and 2.
aortic stenosis.
Finally, risk prediction scores are intended to predictevents in asymptomatic patients and therefore are notstrictly applicable to subjects with an established clinicaldiagnosis of ischemic heart disease or aortic valve disease.Given these issues, we acknowledge that our data withrespect to risk prediction are preliminary and need valida-tion in further prospective clinical trials. However, thesescores remained higher in patients with increased coronaryNaF uptake even after patients with prior MACE wereexcluded from the analysis. Therefore we believe that thisapproach has helped to establish an association between18F-NaF activity and the presence of traditional cardiovas-cular risk factors and provides a potential assessment of therisk of future cardiovascular events.
Conclusions
18F-NaF holds promise as a noninvasive method for inves-tigating the role of active calcification in coronary athero-sclerosis. There was a strong correlation with establishedcoronary calcium, but 41% of patients with calcium scores�1,000 had no significant 18F-NaF uptake. This suggeststhat 18F-NaF uptake provides different information, relat-ing to metabolically active calcific plaque and developingmicro-calcification. Moreover, this information seems to beof clinical significance in relation to symptomatic status,prior MACE events, and cardiovascular risk scores. Pro-spective studies to determine the relationship between18F-NaF uptake, morphological plaque characteristics, andfuture cardiovascular events are now needed in subjects withstable and unstable CAD.
AcknowledgmentsThe authors are grateful to the Wellcome Trust ClinicalResearch Facility and the Clinical Research Imaging Centrefor their help with this study.
Reprint requests and correspondence: Dr. Marc Dweck, Centrefor Cardiovascular Science, University of Edinburgh, Little FranceCrescent, Edinburgh EH16 4TJ, United Kingdom. E-mail:[email protected].
REFERENCES
1. Roger VL, Go AS, Lloyd-Jones DM, et al. Heart disease and strokestatistics—2011 update: a report from the American Heart Associa-tion. Circulation 2011;123:e18–209.
2. Gaziano TA. Cardiovascular disease in the developing world and itscost-effective management. Circulation 2005;112:3547–53.
3. Davies MJ. The pathophysiology of acute coronary syndromes. Heart2000;83:361–6.
4. Kolodgie FD, Burke AP, Farb A, et al. The thin-cap fibroatheroma: atype of vulnerable plaque: the major precursor lesion to acute coronarysyndromes. Curr Opin Cardiol 2001;16:285–92.
5. Budoff MJ, Gul KM. Expert review on coronary calcium. Vasc HealthRisk Manag 2008;4:315–24.
6. Raggi P, Callister TQ, Shaw LJ. Progression of coronary arterycalcium and risk of first myocardial infarction in patients receivingcholesterol-lowering therapy. Arterioscler Thromb Vasc Biol 2004;24:
1272–7.
2
2
3
3
3
3
3
3
3
3
3
3
4
4
4
4
4
1548 Dweck et al. JACC Vol. 59, No. 17, 2012Coronary Arterial 18F-NaF Uptake April 24, 2012:1539–48
7. McEvoy JW, Blaha MJ, Defilippis AP, et al. Coronary artery calciumprogression: an important clinical measurement? A review of publishedreports. J Am Coll Cardiol; 56:1613–22.
8. Motoyama S, Kondo T, Sarai M, et al. Multislice computed tomo-graphic characteristics of coronary lesions in acute coronary syndromes.J Am Coll Cardiol 2007;50:319–26.
9. Huang H, Virmani R, Younis H, Burke AP, Kamm RD, Lee RT. Theimpact of calcification on the biomechanical stability of atheroscleroticplaques. Circulation 2001;103:1051–6.
10. Ehara S, Kobayashi Y, Yoshiyama M, et al. Spotty calcification typifiesthe culprit plaque in patients with acute myocardial infarction: anintravascular ultrasound study. Circulation 2004;110:3424–9.
11. Vengrenyuk Y, Carlier S, Xanthos S, et al. A hypothesis for vulnerableplaque rupture due to stress-induced debonding around cellular mi-crocalcifications in thin fibrous caps. Proc Natl Acad Sci U S A2006;103:14678–83.
12. Even-Sapir E, Metser U, Mishani E, Lievshitz G, Lerman H,Leibovitch I. The detection of bone metastases in patients withhigh-risk prostate cancer: 99mTc-MDP Planar bone scintigraphy,single- and multi-field-of-view SPECT, 18F-fluoride PET, and18F-fluoride PET/CT. J Nucl Med 2006;47:287–97.
13. Derlin T, Toth Z, Papp L, et al. Correlation of inflammation assessedby 18F-FDG PET, active mineral deposition assessed by 18F-fluoridePET, and vascular calcification in atherosclerotic plaque: a dual-tracerPET/CT study. J Nucl Med 2011;52:1020–7.
14. Derlin T, Richter U, Bannas P, et al. Feasibility of 18F-sodiumfluoride PET/CT for imaging of atherosclerotic plaque. J Nucl Med2010;51:862–5.
15. Derlin T, Wisotzki C, Richter U, et al. In vivo imaging of mineraldeposition in carotid plaque using 18F-sodium fluoride PET/CT:correlation with atherogenic risk factors. J Nucl Med 2011;52:362–8.
16. Libby P. The molecular mechanisms of the thrombotic complicationsof atherosclerosis. J Intern Med 2008;263:517–27.
17. Rudd JH, Narula J, Strauss HW, et al. Imaging atherosclerotic plaqueinflammation by fluorodeoxyglucose with positron emission tomogra-phy: ready for prime time? J Am Coll Cardiol 2010;55:2527–35.
18. Tawakol A, Migrino RQ, Bashian GG, et al. In vivo 18F-fluorodeoxyglucose positron emission tomography imaging provides anoninvasive measure of carotid plaque inflammation in patients. J AmColl Cardiol 2006;48:1818–24.
19. Rudd JH, Warburton EA, Fryer TD, et al. Imaging atheroscleroticplaque inflammation with [18F]-fluorodeoxyglucose positron emissiontomography. Circulation 2002;105:2708–11.
20. Kim TN, Kim S, Yang SJ, et al. Vascular inflammation in patientswith impaired glucose tolerance and type 2 diabetes: analysis with18F-fluorodeoxyglucose positron emission tomography. Circ Cardio-vasc Imaging 2010;3:142–8.
21. Tahara N, Kai H, Ishibashi M, et al. Simvastatin attenuates plaqueinflammation: evaluation by fluorodeoxyglucose positron emissiontomography. J Am Coll Cardiol 2006;48:1825–31.
22. Fayad ZA, Mani V, Woodward M, et al. Safety and efficacy ofdalcetrapib on atherosclerotic disease using novel non-invasive multi-modality imaging (dal-PLAQUE): a randomised clinical trial. Lancet2011;378:1547–59.
23. Folco EJ, Sheikine Y, Rocha VZ, et al. Hypoxia but not inflammationaugments glucose uptake in human macrophages implications forimaging atherosclerosis with (18)fluorine-labeled 2-deoxy-d-glucosepositron emission tomography. J Am Coll Cardiol 2011;58:603–14.
24. Rogers IS, Nasir K, Figueroa AL, et al. Feasibility of FDG imaging ofthe coronary arteries: comparison between acute coronary syndromeand stable angina. J Am Coll Cardiol Img 2010;3:388–97.
25. Izquierdo-Garcia D, Davies JR, Graves MJ, et al. Comparison ofmethods for magnetic resonance-guided [18-F]fluorodeoxyglucosepositron emission tomography in human carotid arteries: reproducibil-ity, partial volume correction, and correlation between methods.Stroke 2009;40:86–93.
26. Dweck MR, Jones C, Joshi N, et al. Assessment of valvular calcifica-tion and inflammation by positron emission tomography in patientswith aortic stenosis. Circulation 2012;125:76–86.
27. Wykrzykowska J, Lehman S, Williams G, et al. Imaging of inflamedand vulnerable plaque in coronary arteries with 18F-FDG PET/CT in
patients with suppression of myocardial uptake using alow-carbohydrate, high-fat preparation. J Nucl Med 2009;50:563–8.
8. Williams G, Kolodny GM. Suppression of myocardial 18F-FDGuptake by preparing patients with a high-fat, low-carbohydrate diet.AJR Am J Roentgenol 2008;190:W151–6.
9. Cheng VY, Slomka PJ, Ahlen M, Thomson LE, Waxman AD,Berman DS. Impact of carbohydrate restriction with and without fattyacid loading on myocardial (18)F-FDG uptake during PET: a ran-domized controlled trial. J Nucl Cardiol 2010;17:286–91.
0. Agatston AS, Janowitz WR, Hildner FJ, Zusmer NR, Viamonte MJr., Detrano R. Quantification of coronary artery calcium usingultrafast computed tomography. J Am Coll Cardiol 1990;15:827–32.
1. Rudd JH, Myers KS, Bansilal S, et al. Atherosclerosis inflammationimaging with 18F-FDG PET: carotid, iliac, and femoral uptakereproducibility, quantification methods, and recommendations. J NuclMed 2008;49:871–8.
2. Rudd JH, Myers KS, Bansilal S, et al. Relationships among regionalarterial inflammation, calcification, risk factors, and biomarkers: a pro-spective fluorodeoxyglucose positron-emission tomography/computed to-mography imaging study. Circ Cardiovasc Imaging 2009;2:107–15.
3. Taylor AJ, Cerqueira M, Hodgson JM, et al. ACCF/SCCT/ACR/AHA/ASE/ASNC/NASCI/SCAI/SCMR 2010 appropriate use cri-teria for cardiac computed tomography. A report of the AmericanCollege of Cardiology Foundation Appropriate Use Criteria TaskForce, the Society of Cardiovascular Computed Tomography, theAmerican College of Radiology, the American Heart Association, theAmerican Society of Echocardiography, the American Society ofNuclear Cardiology, the North American Society for CardiovascularImaging, the Society for Cardiovascular Angiography and Interven-tions, and the Society for Cardiovascular Magnetic Resonance. J AmColl Cardiol 2010;56:1864–94.
4. Weber WA, Ziegler SI, Thodtmann R, Hanauske AR, Schwaiger M.Reproducibility of metabolic measurements in malignant tumors usingFDG PET. J Nucl Med 1999;40:1771–7.
5. Blau M, Ganatra R, Bender MA. 18 F-fluoride for bone imaging.Semin Nucl Med 1972;2:31–7.
6. Installe J, Nzeusseu A, Bol A, Depresseux G, Devogelaer JP, LonneuxM. (18)F-fluoride PET for monitoring therapeutic response in Paget’sdisease of bone. J Nucl Med 2005;46:1650–8.
7. Grant FD, Fahey FH, Packard AB, Davis RT, Alavi A, Treves ST.Skeletal PET with 18F-fluoride: applying new technology to an oldtracer. J Nucl Med 2008;49:68–78.
8. Virmani R, Burke AP, Farb A, Kolodgie FD. Pathology of thevulnerable plaque. J Am Coll Cardiol 2006;47:C13–8.
9. Burke AP, Weber DK, Kolodgie FD, Farb A, Taylor AJ, Virmani R.Pathophysiology of calcium deposition in coronary arteries. Herz2001;26:239–44.
0. Stary HC, Chandler AB, Dinsmore RE, et al. A definition ofadvanced types of atherosclerotic lesions and a histological classifica-tion of atherosclerosis. A report from the Committee on VascularLesions of the Council on Arteriosclerosis, American Heart Associa-tion. Arterioscler Thromb Vasc Biol 1995;15:1512–31.
1. Ueda M. [Clinical relevance of coronary artery calcification, as a riskfactor for plaque rupture: viewpoint from pathology]. Clin Calcium;20:1656–62.
2. de Feyter PJ, Ozaki Y, Baptista J, et al. Ischemia-related lesion charac-teristics in patients with stable or unstable angina. A study with intra-coronary angioscopy and ultrasound. Circulation 1995;92:1408–13.
3. Thieme T, Wernecke KD, Meyer R, et al. Angioscopic evaluation ofatherosclerotic plaques: validation by histomorphologic analysis andassociation with stable and unstable coronary syndromes. J Am CollCardiol 1996;28:1–6.
4. Wu X, Maehara A, Mintz GS, et al. Virtual histology intravascularultrasound analysis of non-culprit attenuated plaques detected bygrayscale intravascular ultrasound in patients with acute coronarysyndromes. Am J Cardiol 2010;105:48–53.
Key Words: acute coronary syndrome y calcification y inflammation ypositron emission tomography y risk prediction.
APPENDIX
For a supplemental video, please see the online version of this article.
![Synthesis of 1-[18F]fluorodeoxyglucose: an unexpected rearrangement in the reaction of 2-O-methanesulfonyl-β-D-mannopyranose with [18f] fluoride](https://img.dokumen.tips/doc/110x75/63455e7d38eecfb33a06872d/synthesis-of-1-18ffluorodeoxyglucose-an-unexpected-rearrangement-in-the-reaction.jpg)
![Striatal and extrastriatal microPET imaging of D2/D3 dopamine receptors in rat brain with [18F]fallypride and [18F]desmethoxyfallypride](https://img.dokumen.tips/doc/110x75/63364efcad6427665b0c27dc/striatal-and-extrastriatal-micropet-imaging-of-d2d3-dopamine-receptors-in-rat-brain.jpg)


![In vivo quantification of hypoxic and metabolic status of NSCLC tumors using [18F]HX4 and [18F]FDG-PET/CT imaging](https://img.dokumen.tips/doc/110x75/635cbd98a3fa66b45c0e0f69/in-vivo-quantification-of-hypoxic-and-metabolic-status-of-nsclc-tumors-using-18fhx4.jpg)


