Embed Size (px)
Citation preview
Plant and Soil 257: 205–217, 2003.© 2003 Kluwer Academic Publishers. Printed in the Netherlands.
205
Corn (Zea mays L.) growth, leaf pigment concentration, photosynthesisand leaf hyperspectral reflectance properties as affected by nitrogensupply
Duli Zhao1, K. Raja Reddy1,4, V.G. Kakani1, J.J. Read2 & G.A. Carter3
1Department of Plant and Soil Sciences, Mississippi State University, Box 9555, Mississippi State, MS 39762,USA. 2USDA-Agricultural Research Service, Crop Science Research Laboratory, Mississippi State, MS 39762,USA. 3Gulf Coast Geospatial Center, The University of Southern Mississippi, P. O. Box 7000, Ocean Spring, MS39564, USA. 4Corresponding author∗
Received 17 February 2003. Accepted in revised form 3 July 2003
Key words: chlorophyll, corn (Zea mays L.), leaf area, leaf spectral reflectance, maize, nitrogen deficiency,photosynthesis
Abstract
Plant nitrogen (N) deficiency often limits crop productivity. Early detection of plant N deficiency is important forimproving fertilizer N-use efficiency and crop yield. An experiment was conducted in sunlit, controlled environ-ment chambers in the 2001 growing season to determine responses of corn (Zea mays L. cv. 33A14) growth andleaf hyperspectral reflectance properties to varying N supply. Four N treatments were: (1) half-strength Hoagland’snutrient solution applied throughout the experiment (control); (2) 20% of control N starting 15 days after emergence(DAE); (3) 0% N starting 15 DAE; and (4) 0% N starting 23 DAE (0% NL). Plant height, the number of leaves,and leaf lengths were examined for nine plants per treatment every 3–4 days. Leaf hyperspectral reflectance,concentrations of chlorophyll a, chlorophyll b, and carotenoids, leaf and canopy photosynthesis, leaf area, and leafN concentration were also determined during the experiment. The various N treatments led to a wide range of Nconcentrations (11 – 48 g kg−1 DW) in uppermost fully expanded leaves. Nitrogen deficiency suppressed plantgrowth rate and leaf photosynthesis. At final harvest (42 DAE), plant height, leaf area and shoot biomass were64–66% of control values for the 20% N treatment, and 46-56% of control values for the 0% N treatment. Nitrogendeficit treatments of 20% N and 0% N (Treatment 3) could be distinguished by changes in leaf spectral reflectancein wavelengths of 552 and 710 nm 7 days after treatment. Leaf reflectance at these two wavebands was negativelycorrelated with either leaf N (r = –0.72 and –0.75∗∗) or chlorophyll (r = –0.60 and –0.72∗∗) concentrations. Inaddition, higher correlations were found between leaf N concentration and reflectance ratios. The identified N-specific spectral algorithms may be used for image interpretation and diagnosis of corn N status for site-specific Nmanagement.
Abbreviations: DAE – days after emergence; DW – dry weight; PAR – photosynthetically active radiation; Pn – netphotosynthetic rate; SPAR – Soil-Plant-Atmosphere-Research
Introduction
Nitrogen is an essential element for crop growth, de-velopment, and yield and is often a limiting nutrientin agricultural soils. Insufficient N supply reduces
∗ FAX No: 662-325-9461. E-mail: [email protected]
crop leaf area (Fernandez et al., 1996; van Delden2001), photosynthesis (Ciompi et al., 1996; Lu etal., 2001), development, and biomass production (Devand Bhardwaj, 1995), resulting in a low yield. On theother hand, excessive application of N fertilizer usu-ally increases input cost and reduces environmentalquality especially water quality. Therefore, the applic-
206
ation of N based on requirements for crop growth andplant and soil N levels is critical in precision agri-cultural production. The goal of farm managers is todetect crop N status at an early growth stage, and ap-ply the appropriate amount of N fertilizer for optimalyield, high N-use efficiency, and minimal N losses tothe environment.
Traditional methods to determine plant tissue nu-trient concentrations in a laboratory are time consum-ing and costly. Furthermore, by the time symptoms ofplant nutrient deficiency become clearly visible, manyphysiological processes have been severely disruptedby nutrient stress. Remote sensing at leaf to landscapescales of crop physiology as affected by environmentalstresses has a great potential for timely crop stress as-sessment and management (Afanasyev et al., 2001;Daughtry et al., 2000; Filella et al., 1995; Zarco-Tejada et al., 2000a, b). Recent studies have foundclose relationships between plant physiological para-meters and spectral reflectance (Chappelle et al., 1992;Penuelas and Filella, 1998; Penuelas and Inoue, 2000).Several studies have documented that N status of fieldcrops can be assessed using leaf or canopy spectral re-flectance data (Blackmer et al., 1994; Chappelle et al.,1992; Gausman, 1982; Thomas and Gausman, 1977).Nitrogen deficiency always causes a decrease in leafchlorophyll concentration, resulting in an increase inspectral reflectance in the visible spectrum (400–700nm). However, a variety of causes of plant stress mayresult in increased reflectance due to reduced amountsof chlorophyll (Carter and Knapp, 2001). Further-more, diagnosing a specific nutrient deficiency withremotely sensed data can be difficult when plants aresubjected to deficiencies of multiple elements (Masoniet al., 1996).
When the effects of N supply on crop physiologicalparameters and reflectance properties are determinedunder field conditions, the results may be interfered bysome other unexpected factors (Masoni et al., 1996).Therefore, in order to investigate responses of corn(Zea mays L.) growth, development, and leaf spectralproperties to N supply while keeping other conditionsoptimum, we carried out an experiment in sunlit, con-trolled environment chambers known as Soil-Plant-Atmosphere-Research (SPAR) units during the 2001growing season. The specific objectives of this studywere to: (i) determine the effects of N deficiencyon plant growth parameters, leaf chlorophyll and Nconcentrations, and photosynthesis and (ii) establishthe quantitative relationships between hyperspectral
reflectance and leaf pigments and plant N status incorn.
Materials and methods
Soil-Plant-Atmosphere-Research (SPAR) units
The experiment was conducted at the MississippiAgricultural and Forestry Experiment Station, Mis-sissippi State, Mississippi, USA using four SPARunits. The SPAR facility has the capability to preciselycontrol temperature and CO2 concentration at prede-termined set points for plant growth studies in nearnatural solar radiation regimes. Details of the SPARoperation and controls have been described by Reddyet al. (2001). Each SPAR unit consists of a steel soilbin (1 m deep by 2 m long by 0.5 m wide), and aPlexiglas chamber (2.5 m tall by 2 m long by 1.5 mwide) to accommodate above ground plant parts, aheating and cooling system, and an environment mon-itoring and control system. The Plexiglas chambertransmits 97% of incoming photosynthetically activeradiation (PAR, 400 – 700 nm). Air temperature andCO2 concentration in each SPAR unit were monitoredand adjusted every 10 s throughout the experimentalperiod.
Plant culture
A Pioneer brand hybrid corn, cv. 33A14, was seededon 1 August 2001 in fine sand medium within theSPAR soil bins. Emergence was observed five dayslater. Five rows in each SPAR unit were spaced0.4 m apart with 25 plants m−2. All SPAR unitswere maintained at 30/22 ◦C (day/night) temperaturesand 360 µL CO2 L−1 during the experiment. Plantswere irrigated three times a day with defined nutri-ent solutions, based on N treatments, delivered at0800, 1200 and 1700 h to ensure favorable water con-ditions for plant growth and development. Irrigationwas provided through an automated and computer-controlled drip system. Variable-density black shadecloths (Hummert Seed Co., St. Louis, Missouri, USA)were placed around the plant canopy and adjustedregularly to simulate natural shading by other plants.
Treatments
The four treatments included: (1) irrigation with half-strength Hoagland’s nutrient solution throughout the
207
experiment (Control); (2) N reduction to 20% of con-trol levels starting 15 DAE (20% N); (3) 0% N starting15 DAE (0% N); and (4) 0% N starting 23 DAE (0%NL) until final harvest (42 DAE). The uniformity testsof the SPAR units in previous studies indicated no stat-istical differences among all SPAR units (Reddy et al.,pers. comm., 2000). Therefore, four treatments wererandomly arranged in four identical SPAR units. Thenutrient solution was modified by substituting CaCl2for Ca(NO3)2 to allow for different N concentrations.All plants in the reduced N (20% N) and withheld N(0% N and 0% NL) treatments received normal half-strength Hoagland’s nutrient solution before N-stresstreatments were imposed. Three individual tanks wereused to provide the respective nutrient solutions whendifferent treatments commenced.
Measurements
Plant height, number of leaves and leaf lengths weremeasured at 3- or 4-day intervals from 10 to 42 DAEon nine plants in three center rows per treatment (3center plants per row). Plant height was measuredfrom ground surface to the base of an uppermost, fullyexpanded leaf. Leaf area was calculated based on leaflength using the following equation:
Y = 0.191 X 1.739,
where Y is leaf area in cm2 and X is leaf length in cm.The equation was obtained by regressing the lengthsand areas of more than 500 leaves (r2 = 0.86∗∗∗)measured from 36 plants in the four treatments at thefinal harvest (42 DAE).
Net photosynthetic rates (Pn) of the uppermost,fully expanded leaf from five plants in each treatmentwere measured between 1000 and 1200 h using a LI-6400 portable photosynthesis system (LI-COR Inc.,Lincoln, Nebraska, USA) at 20, 25, 35, 37, 40, and42 DAE. When measuring Pn, the PAR, provided by a6400-02 LED light source, was set to 1500 µmol m−2
s−1, temperature inside the leaf cuvette was set to30 ◦C, and leaf chamber CO2 concentration was set to360 µL L−1.
Canopy photosynthesis on a ground area basis wasdetermined using a mass balance approach in eachchamber throughout the experiment (Acock et al.,1985; Reddy et al., 1995). Each SPAR growth cham-ber and a fan-coil box formed a semi-closed systemfor the measurement of CO2 fluxes. The Plexiglaschamber containing the plants, ducts, and cooling sys-tem was sealed. Carbon dioxide concentration within
a SPAR unit was monitored at 10 s intervals and ad-justed to respective treatment set levels. A dedicatedinfrared gas analyzer (Model LI-6252, LI-COR Inc.,Lincoln, Nebraska, USA), calibrated weekly, was usedto monitor and control CO2 concentration to within± 10 µL CO2 L−1 air of the set point. Commercialgrade CO2 was injected through a system including apressure regulator, solenoid and needle valves, and acalibrated flowmeter. The flowmeters were calibratedwith a Brooks gas displacement meter at the beginningand end of the experiment. The time intervals duringwhich the solenoid valves were open were monitoredby the computer indicating the amount of gas injected.Carbon dioxide flow rates were recorded three times aday and converted into mass quantity using gas correc-tions for temperature and pressure. A leakage test wasperformed each night to derive a correction factor forlosses of CO2 from the chamber (Acock and Acock,1989). All CO2 exchange rate data were obtainedevery 10 s and integrated over 900-s intervals through-out the day-lit period. The corresponding incidentPAR was also measured by monitoring with a 200 SBpyranometer (LI-COR, Inc., Lincoln, Nebraska, USA)and summarized with a data acquisition system at 900-s intervals. Data for canopy net CO2 exchange rateswere summarized over the same time intervals. Thecurves of canopy net CO2 exchange rates vs. PAR (i.e.light response curves) for each SPAR were fitted witha quadratic equation, and canopy Pn, expressed on aground area basis, at 1200 µmol m−2 s−1 PAR wasestimated from the light response curves during theexperimental period. Canopy CO2 exchange rate ona leaf area basis was estimated by dividing canopy Pnon a ground area basis by total leaf area.
Three uppermost fully expanded leaves weresampled from each treatment every 3 or 4 daysbetween 1000 and 1200 h. Leaf hyperspectral reflect-ance was measured immediately after excising leavesusing a portable spectroradiometer (Analytical Spec-tral Devices Inc., Boulder, Colorado, USA) to includewavelengths from 350 to 2500 nm. The optical sensorwas mounted in the frame of a supplemental lightsource (ML 902, Makita Corporation, Aichi, Japan)with a 5-cm distance from target leaf surface. Theangle between the sensor and the leaf surface was 70◦.A white panel was used to optimize the instrument to100% reflectance at all wave bands before measure-ments were taken. When measuring leaf reflectance,the individual leaves were placed adaxial side up ontop of a black polyurethane background.
208
After measuring leaf reflectance, five leaf discs(38.5 mm2 each) were immediately punched fromeach leaf and placed in a vial with 4 mL of dimethylsulphoxide. Three replicate leaves were sampled ineach treatment, and the leaf discs were incubatedat room temperature in dark, for 24 h, to allowfor complete extraction of chlorophyll into the solu-tion. Absorbance of the extract was measured using aPharmacia UltraSpec Pro UV/VIS spectrophotometer(Pharmacia, Cambridge, England) at 470, 648 and664 nm to calculate concentrations of chlorophylla, chlorophyll b, and carotenoids (Chappelle et al.,1992). The area of each individual leaf was determinedusing a LI-3100 leaf area meter (LI-COR Inc., Lin-coln, Nebraska, USA) after collecting the leaf discs.Leaves were then immediately dried at 70 ◦C for 72 h,weighed, and ground to determine total N concentra-tions according to standard micro-Kjeldahl procedures(Nelson and Sommers, 1972). Concentrations of leafchlorophyll were expressed on a leaf area basis inorder to determine the relationships between leaf spec-tral reflectance and concentrations of leaf pigments.Leaf N concentrations were expressed on both leafarea basis and dry weight (DW) basis.
All plants were harvested at 42 DAE and separatedinto leaves, stems and roots. Length and area of indi-vidual leaves were recorded. Plant components weredried at 70 ◦C until they were consistent in weightsand weighed to determine the effects of N treatmentson plant dry mass accumulation and partitioning.
Data analysis
Plant height, the number of leaves, leaf area, and con-centrations of leaf chlorophyll and N were plotted vs.days after emergence. Best-fit regressions were em-ployed to determine plant growth patterns as affectedby N treatments. Simple correlation analysis and linearregression were carried out using the SAS program(SAS Institute, 1997) to determine the relationshipbetween each physiological variable (chlorophyll a,chlorophyll b, total chlorophyll, carotenoid, and leafN contents) and either leaf reflectance at a single 1-nmwide waveband or the simple reflectance ratios of 2-band combinations. Reflectance ratios were computedby dividing reflectance at each of the two single wave-bands with highest r2 values, when linearly regressedwith each physiological variable measured, by reflect-ance at each of all other wavebands throughout the 400– 2500 nm.
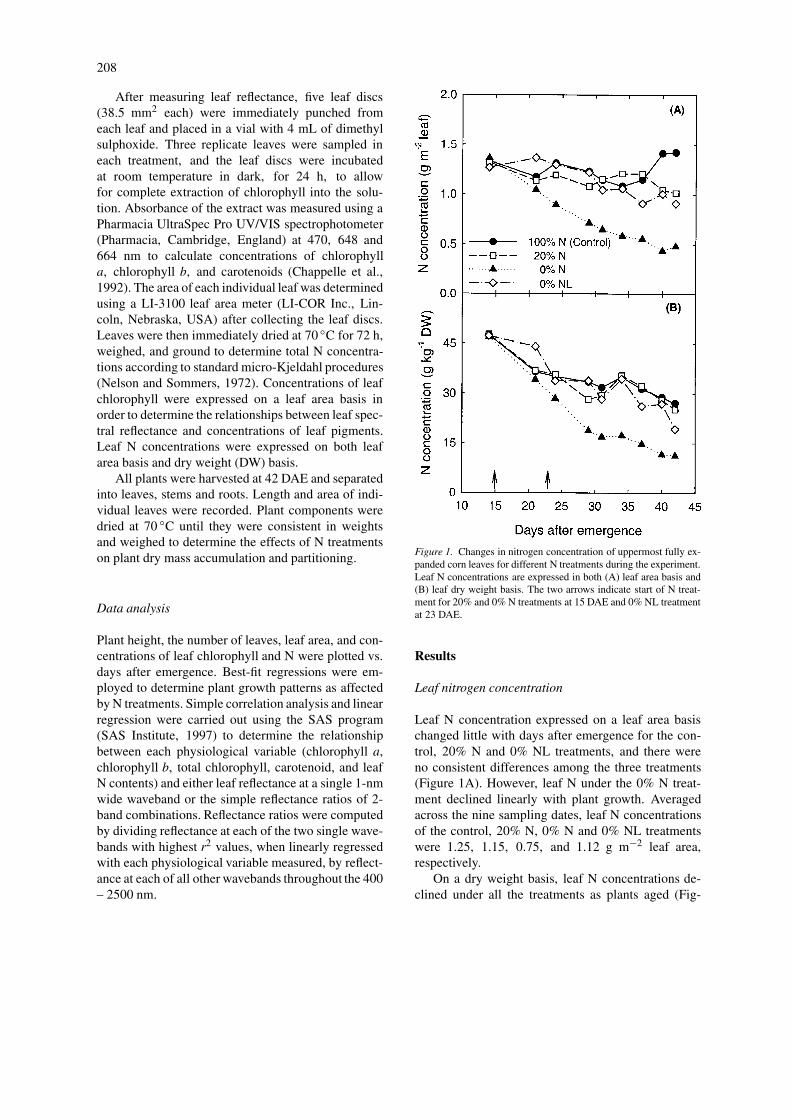
Figure 1. Changes in nitrogen concentration of uppermost fully ex-panded corn leaves for different N treatments during the experiment.Leaf N concentrations are expressed in both (A) leaf area basis and(B) leaf dry weight basis. The two arrows indicate start of N treat-ment for 20% and 0% N treatments at 15 DAE and 0% NL treatmentat 23 DAE.
Results
Leaf nitrogen concentration
Leaf N concentration expressed on a leaf area basischanged little with days after emergence for the con-trol, 20% N and 0% NL treatments, and there wereno consistent differences among the three treatments(Figure 1A). However, leaf N under the 0% N treat-ment declined linearly with plant growth. Averagedacross the nine sampling dates, leaf N concentrationsof the control, 20% N, 0% N and 0% NL treatmentswere 1.25, 1.15, 0.75, and 1.12 g m−2 leaf area,respectively.
On a dry weight basis, leaf N concentrations de-clined under all the treatments as plants aged (Fig-
209
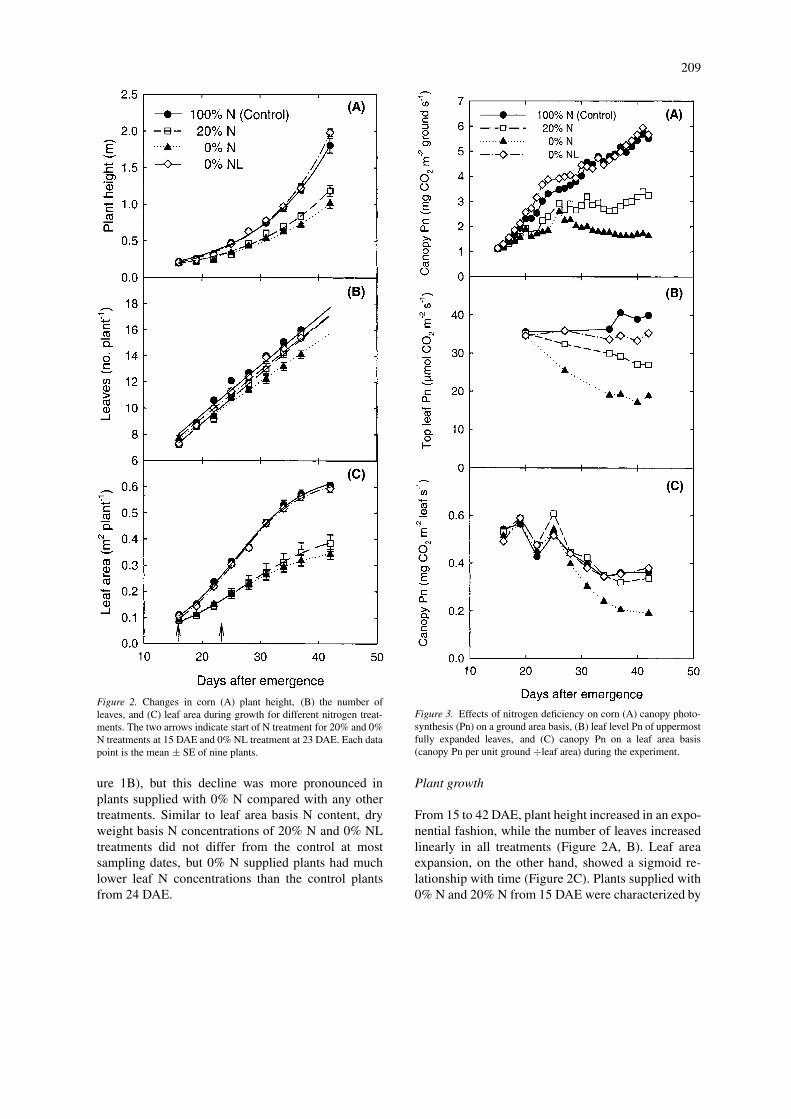
Figure 2. Changes in corn (A) plant height, (B) the number ofleaves, and (C) leaf area during growth for different nitrogen treat-ments. The two arrows indicate start of N treatment for 20% and 0%N treatments at 15 DAE and 0% NL treatment at 23 DAE. Each datapoint is the mean ± SE of nine plants.
ure 1B), but this decline was more pronounced inplants supplied with 0% N compared with any othertreatments. Similar to leaf area basis N content, dryweight basis N concentrations of 20% N and 0% NLtreatments did not differ from the control at mostsampling dates, but 0% N supplied plants had muchlower leaf N concentrations than the control plantsfrom 24 DAE.
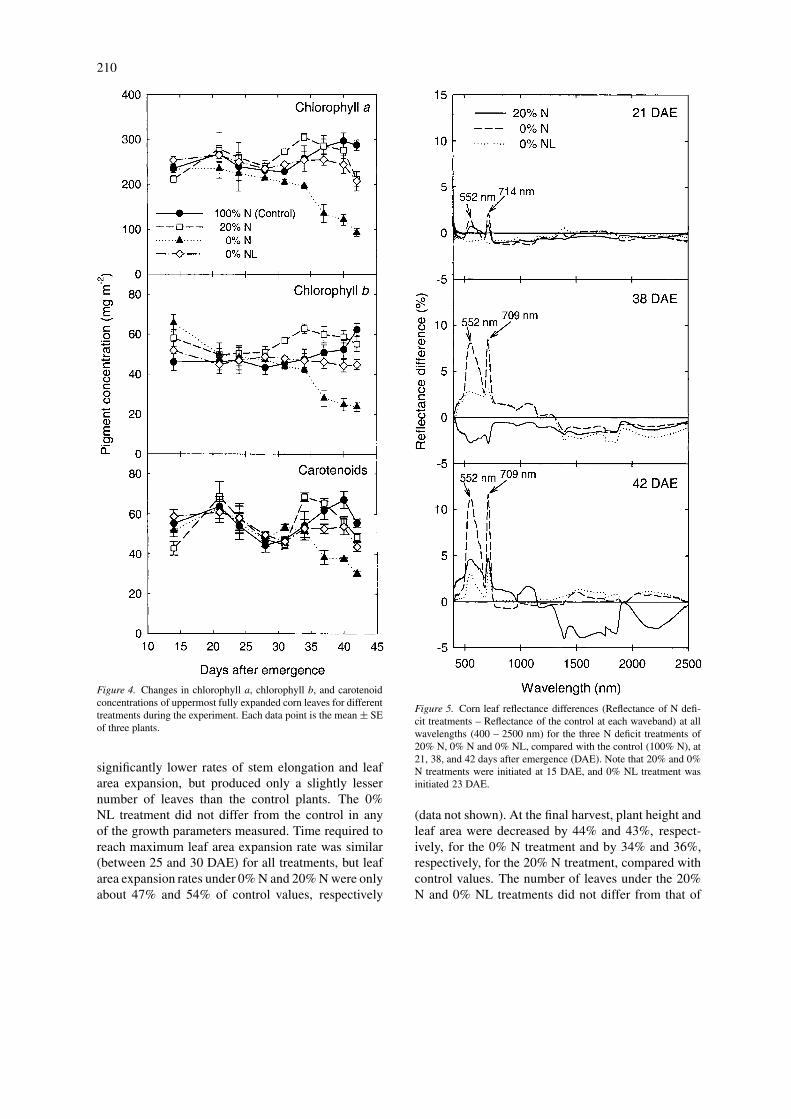
Figure 3. Effects of nitrogen deficiency on corn (A) canopy photo-synthesis (Pn) on a ground area basis, (B) leaf level Pn of uppermostfully expanded leaves, and (C) canopy Pn on a leaf area basis(canopy Pn per unit ground ÷leaf area) during the experiment.
Plant growth
From 15 to 42 DAE, plant height increased in an expo-nential fashion, while the number of leaves increasedlinearly in all treatments (Figure 2A, B). Leaf areaexpansion, on the other hand, showed a sigmoid re-lationship with time (Figure 2C). Plants supplied with0% N and 20% N from 15 DAE were characterized by
210
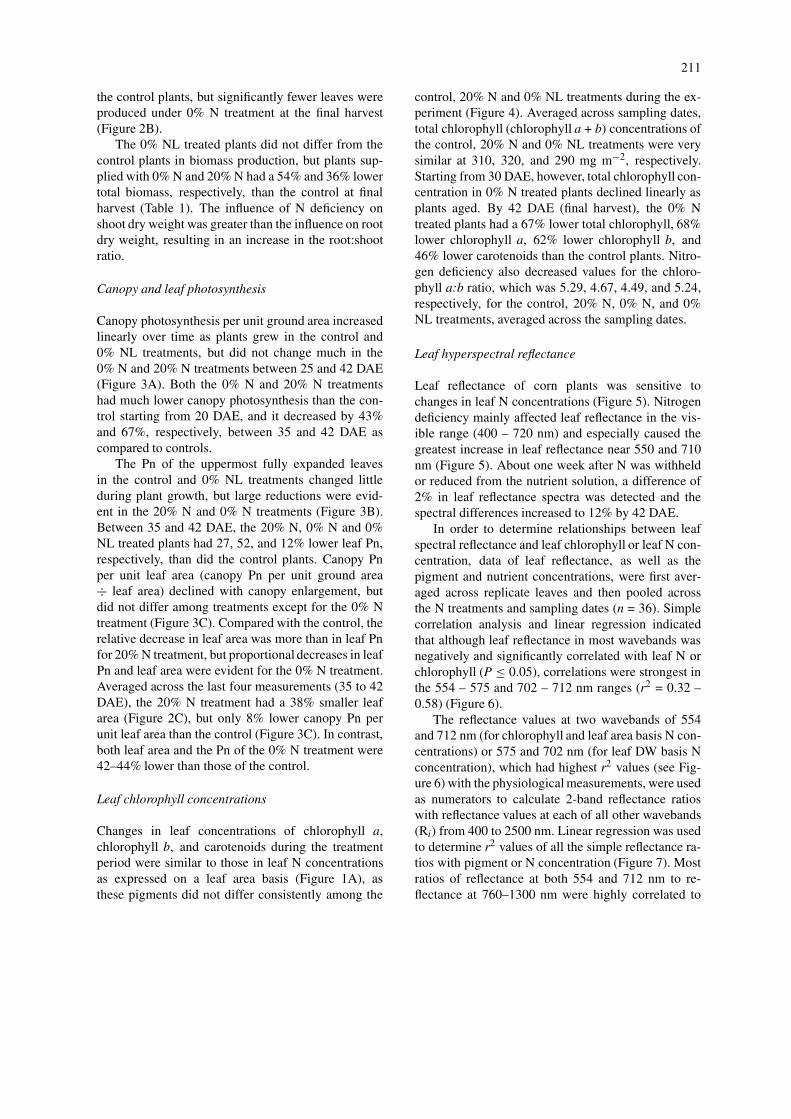
Figure 4. Changes in chlorophyll a, chlorophyll b, and carotenoidconcentrations of uppermost fully expanded corn leaves for differenttreatments during the experiment. Each data point is the mean ± SEof three plants.
significantly lower rates of stem elongation and leafarea expansion, but produced only a slightly lessernumber of leaves than the control plants. The 0%NL treatment did not differ from the control in anyof the growth parameters measured. Time required toreach maximum leaf area expansion rate was similar(between 25 and 30 DAE) for all treatments, but leafarea expansion rates under 0% N and 20% N were onlyabout 47% and 54% of control values, respectively
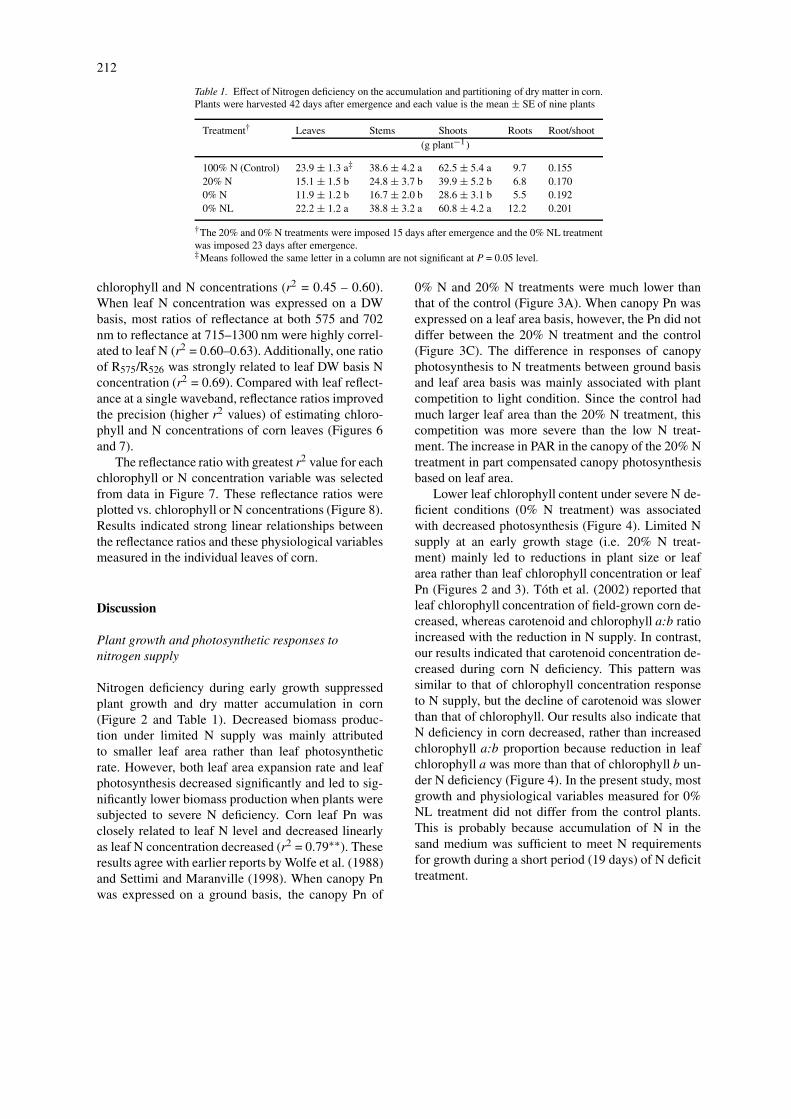
Figure 5. Corn leaf reflectance differences (Reflectance of N defi-cit treatments – Reflectance of the control at each waveband) at allwavelengths (400 – 2500 nm) for the three N deficit treatments of20% N, 0% N and 0% NL, compared with the control (100% N), at21, 38, and 42 days after emergence (DAE). Note that 20% and 0%N treatments were initiated at 15 DAE, and 0% NL treatment wasinitiated 23 DAE.
(data not shown). At the final harvest, plant height andleaf area were decreased by 44% and 43%, respect-ively, for the 0% N treatment and by 34% and 36%,respectively, for the 20% N treatment, compared withcontrol values. The number of leaves under the 20%N and 0% NL treatments did not differ from that of
211
the control plants, but significantly fewer leaves wereproduced under 0% N treatment at the final harvest(Figure 2B).
The 0% NL treated plants did not differ from thecontrol plants in biomass production, but plants sup-plied with 0% N and 20% N had a 54% and 36% lowertotal biomass, respectively, than the control at finalharvest (Table 1). The influence of N deficiency onshoot dry weight was greater than the influence on rootdry weight, resulting in an increase in the root:shootratio.
Canopy and leaf photosynthesis
Canopy photosynthesis per unit ground area increasedlinearly over time as plants grew in the control and0% NL treatments, but did not change much in the0% N and 20% N treatments between 25 and 42 DAE(Figure 3A). Both the 0% N and 20% N treatmentshad much lower canopy photosynthesis than the con-trol starting from 20 DAE, and it decreased by 43%and 67%, respectively, between 35 and 42 DAE ascompared to controls.
The Pn of the uppermost fully expanded leavesin the control and 0% NL treatments changed littleduring plant growth, but large reductions were evid-ent in the 20% N and 0% N treatments (Figure 3B).Between 35 and 42 DAE, the 20% N, 0% N and 0%NL treated plants had 27, 52, and 12% lower leaf Pn,respectively, than did the control plants. Canopy Pnper unit leaf area (canopy Pn per unit ground area÷ leaf area) declined with canopy enlargement, butdid not differ among treatments except for the 0% Ntreatment (Figure 3C). Compared with the control, therelative decrease in leaf area was more than in leaf Pnfor 20% N treatment, but proportional decreases in leafPn and leaf area were evident for the 0% N treatment.Averaged across the last four measurements (35 to 42DAE), the 20% N treatment had a 38% smaller leafarea (Figure 2C), but only 8% lower canopy Pn perunit leaf area than the control (Figure 3C). In contrast,both leaf area and the Pn of the 0% N treatment were42–44% lower than those of the control.
Leaf chlorophyll concentrations
Changes in leaf concentrations of chlorophyll a,chlorophyll b, and carotenoids during the treatmentperiod were similar to those in leaf N concentrationsas expressed on a leaf area basis (Figure 1A), asthese pigments did not differ consistently among the
control, 20% N and 0% NL treatments during the ex-periment (Figure 4). Averaged across sampling dates,total chlorophyll (chlorophyll a + b) concentrations ofthe control, 20% N and 0% NL treatments were verysimilar at 310, 320, and 290 mg m−2, respectively.Starting from 30 DAE, however, total chlorophyll con-centration in 0% N treated plants declined linearly asplants aged. By 42 DAE (final harvest), the 0% Ntreated plants had a 67% lower total chlorophyll, 68%lower chlorophyll a, 62% lower chlorophyll b, and46% lower carotenoids than the control plants. Nitro-gen deficiency also decreased values for the chloro-phyll a:b ratio, which was 5.29, 4.67, 4.49, and 5.24,respectively, for the control, 20% N, 0% N, and 0%NL treatments, averaged across the sampling dates.
Leaf hyperspectral reflectance
Leaf reflectance of corn plants was sensitive tochanges in leaf N concentrations (Figure 5). Nitrogendeficiency mainly affected leaf reflectance in the vis-ible range (400 – 720 nm) and especially caused thegreatest increase in leaf reflectance near 550 and 710nm (Figure 5). About one week after N was withheldor reduced from the nutrient solution, a difference of2% in leaf reflectance spectra was detected and thespectral differences increased to 12% by 42 DAE.
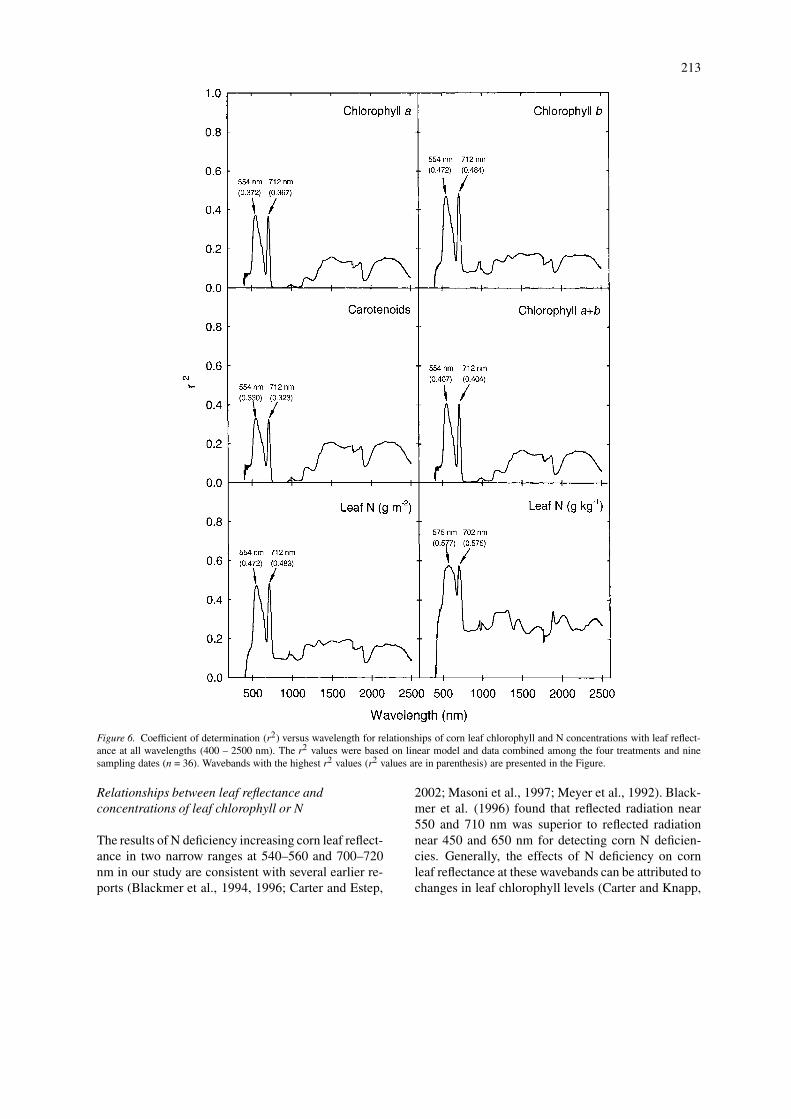
In order to determine relationships between leafspectral reflectance and leaf chlorophyll or leaf N con-centration, data of leaf reflectance, as well as thepigment and nutrient concentrations, were first aver-aged across replicate leaves and then pooled acrossthe N treatments and sampling dates (n = 36). Simplecorrelation analysis and linear regression indicatedthat although leaf reflectance in most wavebands wasnegatively and significantly correlated with leaf N orchlorophyll (P ≤ 0.05), correlations were strongest inthe 554 – 575 and 702 – 712 nm ranges (r2 = 0.32 –0.58) (Figure 6).
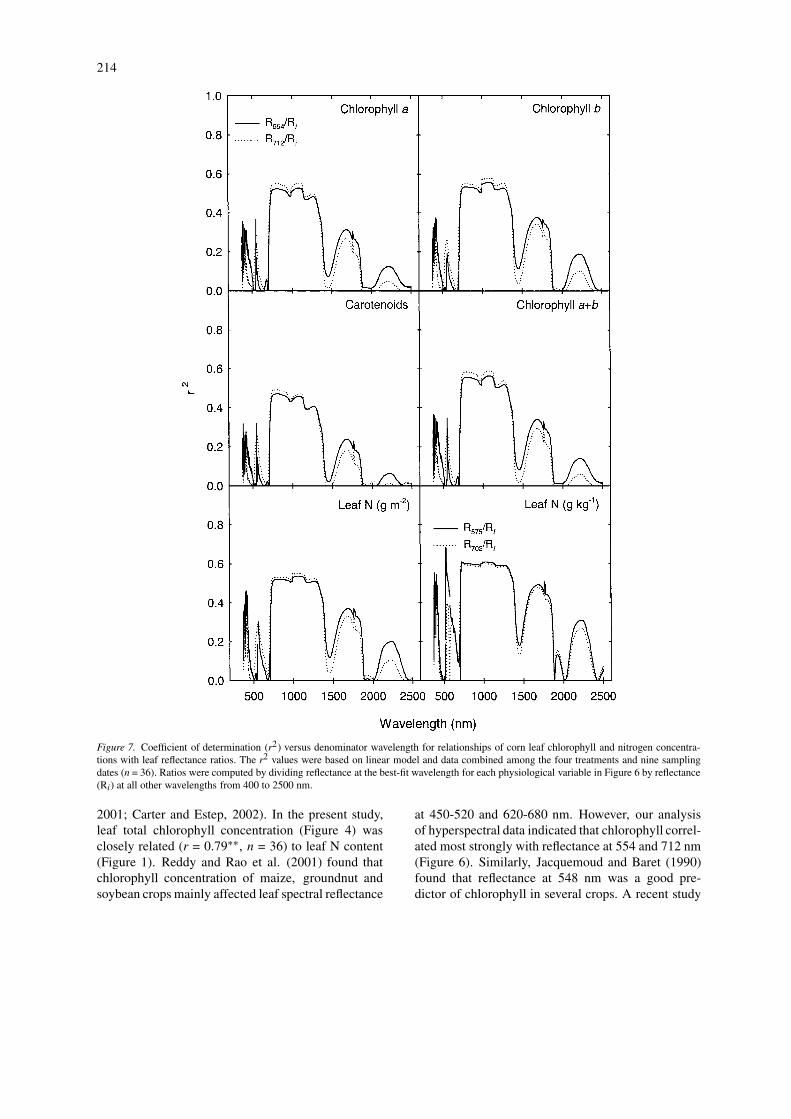
The reflectance values at two wavebands of 554and 712 nm (for chlorophyll and leaf area basis N con-centrations) or 575 and 702 nm (for leaf DW basis Nconcentration), which had highest r2 values (see Fig-ure 6) with the physiological measurements, were usedas numerators to calculate 2-band reflectance ratioswith reflectance values at each of all other wavebands(Ri) from 400 to 2500 nm. Linear regression was usedto determine r2 values of all the simple reflectance ra-tios with pigment or N concentration (Figure 7). Mostratios of reflectance at both 554 and 712 nm to re-flectance at 760–1300 nm were highly correlated to
212
Table 1. Effect of Nitrogen deficiency on the accumulation and partitioning of dry matter in corn.Plants were harvested 42 days after emergence and each value is the mean ± SE of nine plants
Treatment† Leaves Stems Shoots Roots Root/shoot(g plant−1)
100% N (Control) 23.9 ± 1.3 a‡ 38.6 ± 4.2 a 62.5 ± 5.4 a 9.7 0.15520% N 15.1 ± 1.5 b 24.8 ± 3.7 b 39.9 ± 5.2 b 6.8 0.1700% N 11.9 ± 1.2 b 16.7 ± 2.0 b 28.6 ± 3.1 b 5.5 0.1920% NL 22.2 ± 1.2 a 38.8 ± 3.2 a 60.8 ± 4.2 a 12.2 0.201
†The 20% and 0% N treatments were imposed 15 days after emergence and the 0% NL treatmentwas imposed 23 days after emergence.‡Means followed the same letter in a column are not significant at P = 0.05 level.
chlorophyll and N concentrations (r2 = 0.45 – 0.60).When leaf N concentration was expressed on a DWbasis, most ratios of reflectance at both 575 and 702nm to reflectance at 715–1300 nm were highly correl-ated to leaf N (r2 = 0.60–0.63). Additionally, one ratioof R575/R526 was strongly related to leaf DW basis Nconcentration (r2 = 0.69). Compared with leaf reflect-ance at a single waveband, reflectance ratios improvedthe precision (higher r2 values) of estimating chloro-phyll and N concentrations of corn leaves (Figures 6and 7).
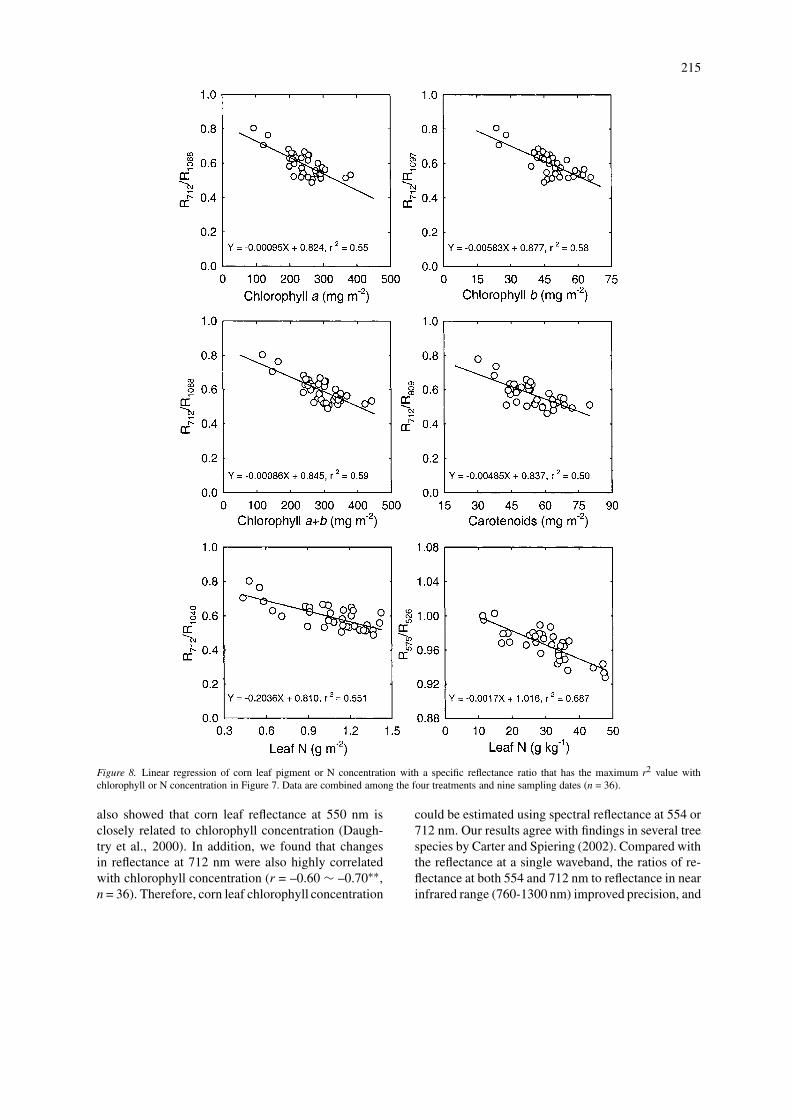
The reflectance ratio with greatest r2 value for eachchlorophyll or N concentration variable was selectedfrom data in Figure 7. These reflectance ratios wereplotted vs. chlorophyll or N concentrations (Figure 8).Results indicated strong linear relationships betweenthe reflectance ratios and these physiological variablesmeasured in the individual leaves of corn.
Discussion
Plant growth and photosynthetic responses tonitrogen supply
Nitrogen deficiency during early growth suppressedplant growth and dry matter accumulation in corn(Figure 2 and Table 1). Decreased biomass produc-tion under limited N supply was mainly attributedto smaller leaf area rather than leaf photosyntheticrate. However, both leaf area expansion rate and leafphotosynthesis decreased significantly and led to sig-nificantly lower biomass production when plants weresubjected to severe N deficiency. Corn leaf Pn wasclosely related to leaf N level and decreased linearlyas leaf N concentration decreased (r2 = 0.79∗∗). Theseresults agree with earlier reports by Wolfe et al. (1988)and Settimi and Maranville (1998). When canopy Pnwas expressed on a ground basis, the canopy Pn of
0% N and 20% N treatments were much lower thanthat of the control (Figure 3A). When canopy Pn wasexpressed on a leaf area basis, however, the Pn did notdiffer between the 20% N treatment and the control(Figure 3C). The difference in responses of canopyphotosynthesis to N treatments between ground basisand leaf area basis was mainly associated with plantcompetition to light condition. Since the control hadmuch larger leaf area than the 20% N treatment, thiscompetition was more severe than the low N treat-ment. The increase in PAR in the canopy of the 20% Ntreatment in part compensated canopy photosynthesisbased on leaf area.
Lower leaf chlorophyll content under severe N de-ficient conditions (0% N treatment) was associatedwith decreased photosynthesis (Figure 4). Limited Nsupply at an early growth stage (i.e. 20% N treat-ment) mainly led to reductions in plant size or leafarea rather than leaf chlorophyll concentration or leafPn (Figures 2 and 3). Tóth et al. (2002) reported thatleaf chlorophyll concentration of field-grown corn de-creased, whereas carotenoid and chlorophyll a:b ratioincreased with the reduction in N supply. In contrast,our results indicated that carotenoid concentration de-creased during corn N deficiency. This pattern wassimilar to that of chlorophyll concentration responseto N supply, but the decline of carotenoid was slowerthan that of chlorophyll. Our results also indicate thatN deficiency in corn decreased, rather than increasedchlorophyll a:b proportion because reduction in leafchlorophyll a was more than that of chlorophyll b un-der N deficiency (Figure 4). In the present study, mostgrowth and physiological variables measured for 0%NL treatment did not differ from the control plants.This is probably because accumulation of N in thesand medium was sufficient to meet N requirementsfor growth during a short period (19 days) of N deficittreatment.
213
Figure 6. Coefficient of determination (r2) versus wavelength for relationships of corn leaf chlorophyll and N concentrations with leaf reflect-ance at all wavelengths (400 – 2500 nm). The r2 values were based on linear model and data combined among the four treatments and ninesampling dates (n = 36). Wavebands with the highest r2 values (r2 values are in parenthesis) are presented in the Figure.
Relationships between leaf reflectance andconcentrations of leaf chlorophyll or N
The results of N deficiency increasing corn leaf reflect-ance in two narrow ranges at 540–560 and 700–720nm in our study are consistent with several earlier re-ports (Blackmer et al., 1994, 1996; Carter and Estep,
2002; Masoni et al., 1997; Meyer et al., 1992). Black-mer et al. (1996) found that reflected radiation near550 and 710 nm was superior to reflected radiationnear 450 and 650 nm for detecting corn N deficien-cies. Generally, the effects of N deficiency on cornleaf reflectance at these wavebands can be attributed tochanges in leaf chlorophyll levels (Carter and Knapp,
214
Figure 7. Coefficient of determination (r2) versus denominator wavelength for relationships of corn leaf chlorophyll and nitrogen concentra-tions with leaf reflectance ratios. The r2 values were based on linear model and data combined among the four treatments and nine samplingdates (n = 36). Ratios were computed by dividing reflectance at the best-fit wavelength for each physiological variable in Figure 6 by reflectance(Ri) at all other wavelengths from 400 to 2500 nm.
2001; Carter and Estep, 2002). In the present study,leaf total chlorophyll concentration (Figure 4) wasclosely related (r = 0.79∗∗, n = 36) to leaf N content(Figure 1). Reddy and Rao et al. (2001) found thatchlorophyll concentration of maize, groundnut andsoybean crops mainly affected leaf spectral reflectance
at 450-520 and 620-680 nm. However, our analysisof hyperspectral data indicated that chlorophyll correl-ated most strongly with reflectance at 554 and 712 nm(Figure 6). Similarly, Jacquemoud and Baret (1990)found that reflectance at 548 nm was a good pre-dictor of chlorophyll in several crops. A recent study
215
Figure 8. Linear regression of corn leaf pigment or N concentration with a specific reflectance ratio that has the maximum r2 value withchlorophyll or N concentration in Figure 7. Data are combined among the four treatments and nine sampling dates (n = 36).
also showed that corn leaf reflectance at 550 nm isclosely related to chlorophyll concentration (Daugh-try et al., 2000). In addition, we found that changesin reflectance at 712 nm were also highly correlatedwith chlorophyll concentration (r = –0.60 ∼ –0.70∗∗,n = 36). Therefore, corn leaf chlorophyll concentration
could be estimated using spectral reflectance at 554 or712 nm. Our results agree with findings in several treespecies by Carter and Spiering (2002). Compared withthe reflectance at a single waveband, the ratios of re-flectance at both 554 and 712 nm to reflectance in nearinfrared range (760-1300 nm) improved precision, and
216
could be used to estimate changes in leaf chlorophyllconcentration in corn (Figures 7 and 8).
Although several studies have found that non-destructive measurements of leaf or canopy reflectancecan be used as an indicator of plant N status (Ma etal., 1996; Voullot et al., 1998; Wang et al., 1998),the functional relationships between leaf reflectanceor reflectance ratios and plant growth or physiologicalvariables have been established in only a few studies.Yoder and Pettigrew-Crosby (1995) reported that leafreflectance at visible bands could be used to predictchlorophyll content, and short-wave infrared bandswere sensitive to leaf N concentration in big leaf maple(Acer macrophyllum). Fouche (1999) suggested thatreflectance at the 779 nm wavelength may providethe best detection of N deficiency in cotton, tobaccoand wheat. Carter and Estep (2002) reported that asimple linear relationship existed between leaf N (%)and reflectance at 721 nm in corn. In our study, leaf re-flectance in two narrow waveband ranges of 550 – 580and 700 – 720 nm had the largest negative correlations(r = –0.70 ∼ –0.75∗∗) with leaf N concentration. How-ever, the linear regression model of leaf N level and thesingle band reflectance at 575 or 712 nm with greatestr2 values only explained 44% (on a leaf area basis, r2
= 0.44) or 57% (on a leaf dry weight basis, r2 = 0.57)of corn leaf N concentration variations (Figure 6).
Blackmer et al. (1996) reported that ratio of re-flectance between 550 and 600 nm to reflectance inthe 800 – 900 nm range provided sensitive detectionof N stress in corn. In cotton, Tarpley et al. (2000)similarly found that ratios of leaf reflectance at a rededge (700 or 716 nm) with a waveband of very near in-frared region (755 – 920 and 1000 nm) provided goodprecision and accuracy for predicting leaf N concen-tration. Our results indicated that a simple reflectanceratio (R712/R1040 or R575/R526) improved precisionof estimating corn leaf N concentration (Figure 8),although the wavebands did not exactly match thefindings of either Blackmer et al. (1996) or Tarpleyet al. (2000). We found that when leaf N level wasexpressed on a dry weight basis, the best reflectanceratio for estimating corn leaf N was R575/R526 (r2 =0.69), and when leaf N concentration was expressedon a leaf area basis, the best ratio was R712/R1040 (r2
= 0.55). Therefore, leaf reflectance ratio of R575/R526or R712/R1040 may be used for predicting corn leaf Nconcentration.
Conclusions
Nitrogen deficiency decreased stem elongation rate,leaf area, and leaf or canopy Pn of corn, resulting inshorter plants with less dry matter accumulation. Leafhyperspectral reflectance was very sensitive to plantN status. Nitrogen deficiency mainly increased leafreflectance in two spectrally narrow waveband rangesof green (550–580 nm) and far red (700–720 nm),which were closely related to either leaf N or chloro-phyll concentration. On a leaf area basis, chlorophylla, chlorophyll b, carotenoid, and chlorophyll a+b con-centrations could be estimated using reflectance ratiosin the near infrared region of 712 nm to 1088, 1097,809, and 1088 nm, respectively. The N concentra-tion based on leaf area (g m−2) and leaf DW (g kg−1
DW) could be estimated using the ratio of reflectanceat 712 – 1040 nm and at 575 – 526 nm, respect-ively. Therefore, nondestructive measurements of leafspectral reflectance at these narrow wavebands couldprovide a rapid, easy and inexpensive tool for detect-ing corn plant N status. The identified corn-N-specificspectral signatures may be used for image interpreta-tion and diagnosis of corn N deficiency in a productionenvironment for site-specific management.
Acknowledgements
This research was funded by the National Aeronauticaland Space Administration through the Remote Sens-ing Technology Center at Mississippi State University.We thank D. Brand, K. Gourley and W. Ladner fortechnical support; Drs M. Clements, B. Ma, and J.Shanahan for reviewing the manuscript and construct-ive comments; Dr Lee Tarpley for initial thoughts onthe project; and Pioneer Hi-bred International, Inc.,for the supply of seed. Contribution from Departmentof Plant and Soil Sciences, Mississippi State Univer-sity, Mississippi Agricultural and Forestry ExperimentStation, paper no. J10331.
References
Acock B and Acock M C 1989 Calculating air leakage rates incontrolled-environment chambers containing plants. Agron. J.81, 619–623.
Acock B, Reddy V R, Hodges H F, Baker D N and McKinion J M1985 Photosynthetic response of soybean canopies to full-seasoncarbon dioxide enrichment. Agron. J. 77, 942–947.
Afanasyev Y D, Nezlin N P and Kostianoy A G 2001 Patterns ofseasonal dynamics of remotely sensed chlorophyll and physical
217
environment in the Newfoundland region. Remote Sens. Environ.76, 268–282.
Blackmer T M, Schepers J S and Varvel G E 1994 Light reflect-ance compared with other nitrogen stress measurements in cornleaves. Agron. J. 86, 934–938.
Blackmer T M, Schepers J S, Varvel G E and Walter-Shea E A 1996Nitrogen deficiency detection using reflected shortwave radiationfrom irrigated corn canopies. Agron. J. 88, 1–5.
Carter G A and Estep L 2002 General spectral characteristics of leafreflectance responses to stress and their manifestation at the land-scape. In From Laboratory Spectroscopy to Remotely SensedSpectra of Terrestrial Ecosystems. Ed. R S Muttaih. pp. 271–293.Kluwer Academic Publishers, Dordrecht, The Netherlands.
Carter G A and Knapp A K 2001 Leaf optical properties in higherplants: Linking spectral characteristics to stress and chlorophyllconcentration. Am. J. Bot. 88, 677–684.
Carter G A and Spiering B A 2002 Optical properties of intact leavesfor estimating chlorophyll concentration. J. Environ. Qual. 31,1424–1432.
Chappelle E W, Kim M S and McMurtrey III J E 1992 Ratio ana-lysis of reflectance spectra (RARS): An algorithm for the remoteestimation of the concentrations of chlorophyll a, chlorophyll b,and carotenoids in soybean leaves. Remote Sens. Environ. 39,239–247.
Ciompi S, Gentilli E, Guidi L and Soldatini G F 1996 The ef-fect of nitrogen deficiency on leaf gas exchange and chlorophyllfluorescence parameters in sunflower. Plant Sci. Limerick 118,177–184.
Daughtry C H T, Walthall C L, Kim M S, de Colstoun E B andMcMurtrey III J E 2000 Estimating corn leaf chlorophyll concen-tration from leaf and canopy reflectance. Remote Sens. Environ.74, 229–239.
Dev S P and Bhardwaj K K R 1995 Effect of crop wastes andnitrogen levels of biomass production and nitrogen uptake inwheat-maize sequence. Ann. Agric. Res. 16, 264–267.
Fernandez C J, McInnes K J and Cothren J T 1996 Water status andleaf area production in water- and nitrogen-stressed cotton. CropSci. 36, 1224–1233.
Filella I, Serrano L, Serra J and Penuelas J 1995 Evaluating wheatnitrogen status with canopy reflectance indices and discriminantanalysis. Crop Sci. 35, 1400–1405.
Fouche P S 1999 Detecting nitrogen deficiency on irrigated cashcrops using remote sensing methods. South African J. Plant Soil16, 59–63.
Gausman H W 1982 Visible light reflectance, transmittance, andabsorption of differently pigmented cotton leaves. Remote Sens.Environ. 13, 233–238.
Jacquemoud S and Baret F 1990 PROSPECT: A model of leafoptical properties spectra. Remote Sens. Environ. 34, 75–91.
Lu C M, Zhang J H, Zhang Q D, Li L B and Kuang T Y 2001 Modi-fication of Photosystem II photochemistry in nitrogen deficientmaize and wheat plants. J. Plant Physiol. 158, 1423–1430.
Ma B L, Morrison M J and Dwyer L M 1996 Canopy light reflect-ance and field greenness to assess nitrogen fertilization and yieldof maize. Agron. J. 88, 915–920.
Masoni A, Mariotti M and Ercoli L 1997 Effect of water stressand nitrogen nutrition on maize (Zea mays L.) leaf spectralproperties. Rivista-di-Agronomia 31, 441–448.
Masoni A, Ercoli L and Mariotti M 1996 Spectral properties ofleaves deficient in iron, sulfur, magnesium, and manganese.Agron. J. 88, 937–943.
Meyer G E, Troyer W W, Fitzgerald J B and Paparrozzi E T 1992Leaf nitrogen analysis of poinsettia (Euphorbia pulcherrima Will
D.) using spectral properties in natural and controlled lighting.App. Eng. Agric. 8, 715–722.
Nelson D W and Sommers L E 1972 A simple digestion procedurefor estimation of total nitrogen in soil and sediments. J. Environ.Qual. 1, 423–425.
Penuelas J and Filella I 1998 Visible and near-infrared reflect-ance techniques for diagnosing plant physiological status. TrendsPlant Sci. 3, 151–156.
Penuelas J and Inoue Y 2000 Reflectance assessment of canopy CO2uptake. Int. J. Remote Sens. 21, 3353–3356.
Reddy G S, Rao C L N, Venkataratnam L and Rao P V K 2001Influence of plant pigments on spectral reflectance of maize,groundnut and soybean grown in semi-arid environments. Int. J.Remote Sens. 22, 3373–3380.
Reddy K R, Read J J, Baker J T, McKinion J M, Tarpley L, HodgesH F and Reddy V R 2001 Soil-Plant-Atmosphere-Research(SPAR) facility – a tool for plant research and modeling. Bio-tronics 30, 27–50.
Reddy V R, Reddy K R and Hodges H F 1995 Carbon dioxideenrichment and temperature effects on cotton canopy photosyn-thesis, transpiration, and water use efficiency. Field Crops Res.41, 13–23.
SAS Institute Inc. 1997 SAS User’s Guide: Statistics. SAS InstituteInc., Cary, NC.
Settimi J R and Maranville J W 1998 Carbon dioxide assimilationefficiency of maize leaves under nitrogen stress at different stagesof plant development. Comm. Soil Sci. Plant Anal. 29, 777–792.
Tarpley L, Reddy K R and Sassenrath-Cole G F 2000 Reflectanceindices with precision and accuracy in predicting cotton leafnitrogen concentration. Crop Sci. 40, 1814–1819.
Thomas J R and Gausman H W 1977 Leaf reflectance vs. leafchlorophyll and carotenoid concentrations for eight crops. Ag-ron. J. 69, 799–802.
Tóth V R, Mészáros I, Veres S and Nagy J 2002 Effects of the avail-able nitrogen on the photosynthetic activity and xanthophyllscycle pool of maize in field. J. Plant Physiol. 159, 627–634.
van Delden A 2001 Yield and growth components of potato andwheat under organic nitrogen management. Agron. J. 93, 1370–1385.
Voullot M O, Huet P and Boissard P 1998 Early detection of Ndeficiency in a wheat crop using physiological and radiometricmethods. Agronomie 18, 117–130.
Wang R C, Wang K and Shen Z Q 1998 Feasibility of field evalu-ation of rice nitrogen status from reflectance spectra of canopy.Pedosphere 8, 121–126.
Wolfe D W, Henderson D W, Hsiao T C and Alvino A 1988 In-teractive water and nitrogen effects on senescence of maize: II.Photosynthetic decline and longevity of individual leaves. Agron.J. 80, 865–870.
Yoder B J and Pettigrew-Crosby R E 1995 Predicting nitrogen andchlorophyll content and concentrations from reflectance spectra(400–2500 nm) at leaf and canopy scales. Remote Sens. Environ.53, 199–211.
Zarco-Tejada P J, Miller J R, Mohammed G H and Noland T L2000a Chlorophyll fluorescence effects on vegetation apparentreflectance: I. Leaf-level measurements and model simulation.Remote Sens. Environ. 74, 582–595.
Zarco-Tejada P J, Miller J R, Mohammed G H, Noland T Land Sampson P H 2000b Chlorophyll fluorescence effects onvegetation apparent reflectance: II. Laboratory and airbornecanopy-level measurements with hyperspectral data. RemoteSens. Environ. 74, 596–608.
Section editor: H. Lambers


