Embed Size (px)
Citation preview
This article was published in an Elsevier journal. The attached copyis furnished to the author for non-commercial research and
education use, including for instruction at the author’s institution,sharing with colleagues and providing to institution administration.
Other uses, including reproduction and distribution, or selling orlicensing copies, or posting to personal, institutional or third party
websites are prohibited.
In most cases authors are permitted to post their version of thearticle (e.g. in Word or Tex form) to their personal website orinstitutional repository. Authors requiring further information
regarding Elsevier’s archiving and manuscript policies areencouraged to visit:
http://www.elsevier.com/copyright
Author's personal copy
Cooling rates in the lower crust of the Oman ophiolite:Ca in olivine, revisited
Jill A. VanTongeren ⁎, Peter B. Kelemen, Karen Hanghøj
Department of Earth and Environmental Sciences, Columbia University - Lamont-Doherty Earth Observatory, 61 Rt 9W, Palisades, NY 10964, United States
Received 4 July 2007; received in revised form 5 October 2007; accepted 17 November 2007
Editor: C.P. JaupartAvailable online 4 December 2007
Abstract
Debate over the mechanism of accretion of the lower oceanic crust has centered around the gabbro glacier and the sheeted sills models. Thethermal profile of the crust, specifically the roles of hydrothermal circulation and cooling rate, is a key component in distinguishing between thesetwo models. Results of this study show no systematic variation of cooling rate with depth in the lower crust of the Khafifah section in the WadiTayin massif of the Oman ophiolite. Additionally, very high rates recorded near the base of the crust suggest that hydrothermal circulation plays animportant role in the removal of heat throughout the crust. While the conclusions presented here do not rule out the possibility of accretion bygabbro glacier, they do contradict the initial tenet of the gabbro glacier model – convective heat loss by hydrothermal circulation can penetrate toMoho depths and crystallization is not, by necessity, constrained to the upper crust. On the basis of these results it can be concluded that thesheeted sills model is a thermally viable mechanism for accretion of oceanic lower crust.© 2007 Elsevier B.V. All rights reserved.
Keywords: calcium; olivine; oman; hydrothermal; cooling; crust
1. Introduction
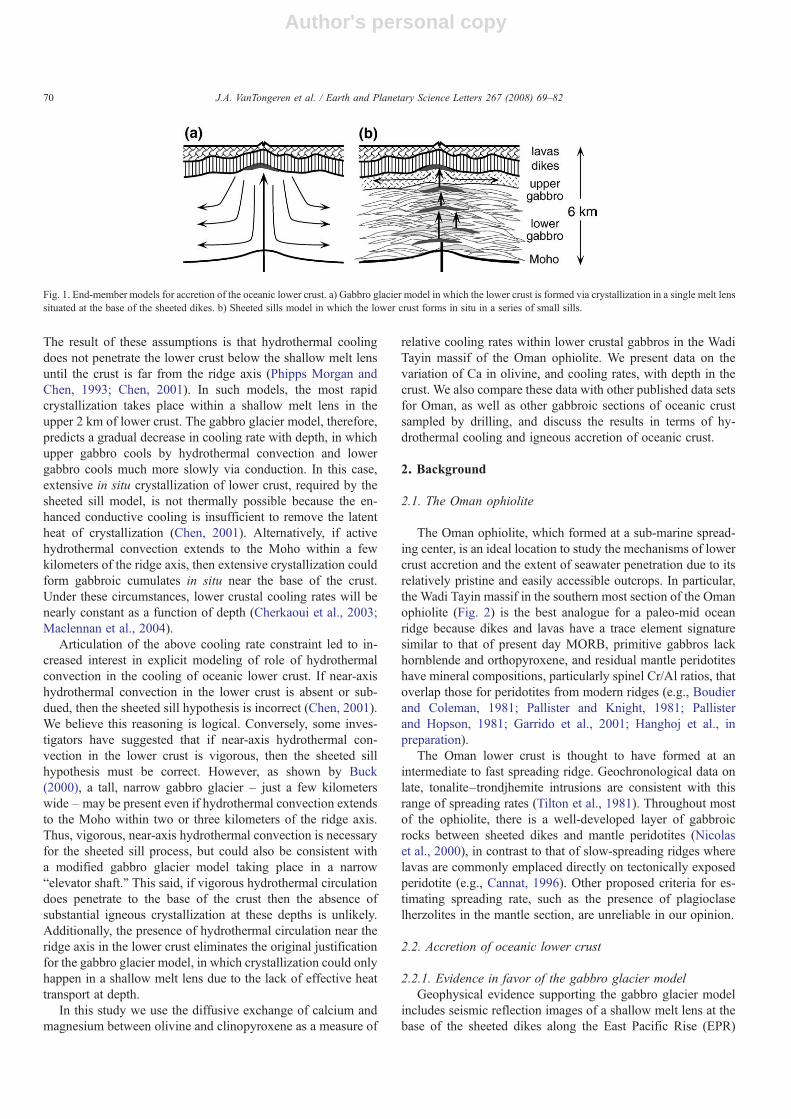
Mid-ocean ridges serve as the primary locus for heat andmass transfer between the Earth's interior and the hydrosphere.Yet due to the complexity of direct sampling, the first-orderprocesses that control the igneous accretion and hydrothermalcooling of the lower oceanic crust remain poorly understood.Currently, the debate over the processes of accretion of thelower crust at mid oceanic spreading centers is centered on twoend-member models: the gabbro glacier model and the sheetedsills model (Fig. 1). The gabbro glacier model proposes that theoceanic crust below the sheeted dikes is formed via crystal-lization in a single melt lens located at the base of the sheeteddike section (e.g., Nicolas et al., 1988; Henstock et al., 1993;Phipps Morgan and Chen, 1993; Quick and Denlinger, 1993).Conversely, in the sheeted sills model, the lower crust forms in
several melt lenses at different depths and crystallizes in situ(Korenaga and Kelemen, 1997; Kelemen et al., 1997; Kelemenand Aharonov, 1998). In fact, all papers advocating the sheetedsill mechanism, except that of MacLeod and Yaouancq (2000),have included a small “gabbro glacier,” forming the uppermostpart of the plutonic crust. Additional intermediate models havebeen proposed in which sills intrude a gabbro glacier, or inwhich crust is formed by several gabbro glaciers (Schouten andDenham, 1995; Boudier et al., 1996). Despite these clearlyposed alternatives and the range of reasonable, intermediatepossibilities, there has been a surprising lack of consensus onwhich end-member process is most important in forming oce-anic lower crust.
One potential means of distinguishing between the gabbroglacier and sheeted sill models is analysis of the cooling rateprofile in the lower crust. Quantitative gabbro glacier modelsincorporate the assumption that hydrothermal circulation doesnot occur in rocks at more than 600 °C, and that cooling canbe modeled as diffusive heat loss with an enhanced diffusivity.
Available online at www.sciencedirect.com
Earth and Planetary Science Letters 267 (2008) 69–82www.elsevier.com/locate/epsl
⁎ Corresponding author. Tel.: +1 212 769 5083; fax: +1 212 769 5339.E-mail address: [email protected] (J.A. VanTongeren).
0012-821X/$ - see front matter © 2007 Elsevier B.V. All rights reserved.doi:10.1016/j.epsl.2007.11.034
Author's personal copy
The result of these assumptions is that hydrothermal coolingdoes not penetrate the lower crust below the shallow melt lensuntil the crust is far from the ridge axis (Phipps Morgan andChen, 1993; Chen, 2001). In such models, the most rapidcrystallization takes place within a shallow melt lens in theupper 2 km of lower crust. The gabbro glacier model, therefore,predicts a gradual decrease in cooling rate with depth, in whichupper gabbro cools by hydrothermal convection and lowergabbro cools much more slowly via conduction. In this case,extensive in situ crystallization of lower crust, required by thesheeted sill model, is not thermally possible because the en-hanced conductive cooling is insufficient to remove the latentheat of crystallization (Chen, 2001). Alternatively, if activehydrothermal convection extends to the Moho within a fewkilometers of the ridge axis, then extensive crystallization couldform gabbroic cumulates in situ near the base of the crust.Under these circumstances, lower crustal cooling rates will benearly constant as a function of depth (Cherkaoui et al., 2003;Maclennan et al., 2004).
Articulation of the above cooling rate constraint led to in-creased interest in explicit modeling of role of hydrothermalconvection in the cooling of oceanic lower crust. If near-axishydrothermal convection in the lower crust is absent or sub-dued, then the sheeted sill hypothesis is incorrect (Chen, 2001).We believe this reasoning is logical. Conversely, some inves-tigators have suggested that if near-axis hydrothermal con-vection in the lower crust is vigorous, then the sheeted sillhypothesis must be correct. However, as shown by Buck(2000), a tall, narrow gabbro glacier – just a few kilometerswide –may be present even if hydrothermal convection extendsto the Moho within two or three kilometers of the ridge axis.Thus, vigorous, near-axis hydrothermal convection is necessaryfor the sheeted sill process, but could also be consistent witha modified gabbro glacier model taking place in a narrow“elevator shaft.” This said, if vigorous hydrothermal circulationdoes penetrate to the base of the crust then the absence ofsubstantial igneous crystallization at these depths is unlikely.Additionally, the presence of hydrothermal circulation near theridge axis in the lower crust eliminates the original justificationfor the gabbro glacier model, in which crystallization could onlyhappen in a shallow melt lens due to the lack of effective heattransport at depth.
In this study we use the diffusive exchange of calcium andmagnesium between olivine and clinopyroxene as a measure of
relative cooling rates within lower crustal gabbros in the WadiTayin massif of the Oman ophiolite. We present data on thevariation of Ca in olivine, and cooling rates, with depth in thecrust. We also compare these data with other published data setsfor Oman, as well as other gabbroic sections of oceanic crustsampled by drilling, and discuss the results in terms of hy-drothermal cooling and igneous accretion of oceanic crust.
2. Background
2.1. The Oman ophiolite
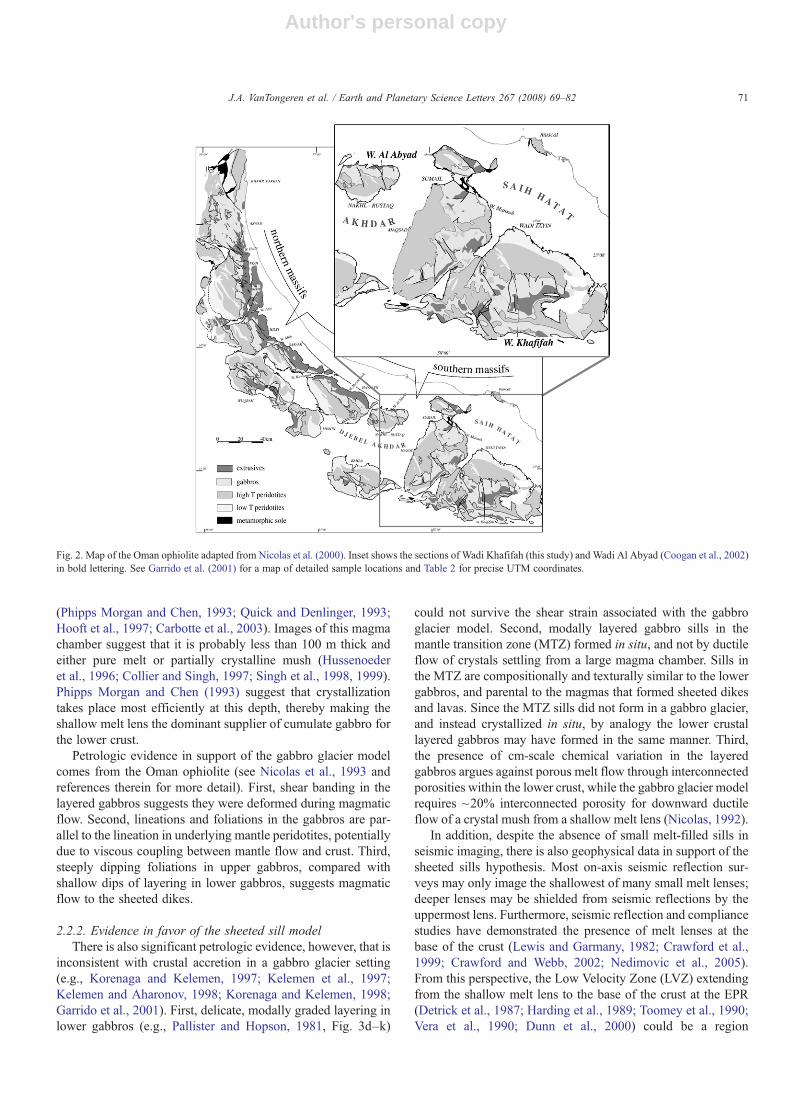
The Oman ophiolite, which formed at a sub-marine spread-ing center, is an ideal location to study the mechanisms of lowercrust accretion and the extent of seawater penetration due to itsrelatively pristine and easily accessible outcrops. In particular,the Wadi Tayin massif in the southern most section of the Omanophiolite (Fig. 2) is the best analogue for a paleo-mid oceanridge because dikes and lavas have a trace element signaturesimilar to that of present day MORB, primitive gabbros lackhornblende and orthopyroxene, and residual mantle peridotiteshave mineral compositions, particularly spinel Cr/Al ratios, thatoverlap those for peridotites from modern ridges (e.g., Boudierand Coleman, 1981; Pallister and Knight, 1981; Pallisterand Hopson, 1981; Garrido et al., 2001; Hanghoj et al., inpreparation).
The Oman lower crust is thought to have formed at anintermediate to fast spreading ridge. Geochronological data onlate, tonalite–trondjhemite intrusions are consistent with thisrange of spreading rates (Tilton et al., 1981). Throughout mostof the ophiolite, there is a well-developed layer of gabbroicrocks between sheeted dikes and mantle peridotites (Nicolaset al., 2000), in contrast to that of slow-spreading ridges wherelavas are commonly emplaced directly on tectonically exposedperidotite (e.g., Cannat, 1996). Other proposed criteria for es-timating spreading rate, such as the presence of plagioclaselherzolites in the mantle section, are unreliable in our opinion.
2.2. Accretion of oceanic lower crust
2.2.1. Evidence in favor of the gabbro glacier modelGeophysical evidence supporting the gabbro glacier model
includes seismic reflection images of a shallow melt lens at thebase of the sheeted dikes along the East Pacific Rise (EPR)
Fig. 1. End-member models for accretion of the oceanic lower crust. a) Gabbro glacier model in which the lower crust is formed via crystallization in a single melt lenssituated at the base of the sheeted dikes. b) Sheeted sills model in which the lower crust forms in situ in a series of small sills.
70 J.A. VanTongeren et al. / Earth and Planetary Science Letters 267 (2008) 69–82
Author's personal copy
(Phipps Morgan and Chen, 1993; Quick and Denlinger, 1993;Hooft et al., 1997; Carbotte et al., 2003). Images of this magmachamber suggest that it is probably less than 100 m thick andeither pure melt or partially crystalline mush (Hussenoederet al., 1996; Collier and Singh, 1997; Singh et al., 1998, 1999).Phipps Morgan and Chen (1993) suggest that crystallizationtakes place most efficiently at this depth, thereby making theshallow melt lens the dominant supplier of cumulate gabbro forthe lower crust.
Petrologic evidence in support of the gabbro glacier modelcomes from the Oman ophiolite (see Nicolas et al., 1993 andreferences therein for more detail). First, shear banding in thelayered gabbros suggests they were deformed during magmaticflow. Second, lineations and foliations in the gabbros are par-allel to the lineation in underlying mantle peridotites, potentiallydue to viscous coupling between mantle flow and crust. Third,steeply dipping foliations in upper gabbros, compared withshallow dips of layering in lower gabbros, suggests magmaticflow to the sheeted dikes.
2.2.2. Evidence in favor of the sheeted sill modelThere is also significant petrologic evidence, however, that is
inconsistent with crustal accretion in a gabbro glacier setting(e.g., Korenaga and Kelemen, 1997; Kelemen et al., 1997;Kelemen and Aharonov, 1998; Korenaga and Kelemen, 1998;Garrido et al., 2001). First, delicate, modally graded layering inlower gabbros (e.g., Pallister and Hopson, 1981, Fig. 3d–k)
could not survive the shear strain associated with the gabbroglacier model. Second, modally layered gabbro sills in themantle transition zone (MTZ) formed in situ, and not by ductileflow of crystals settling from a large magma chamber. Sills inthe MTZ are compositionally and texturally similar to the lowergabbros, and parental to the magmas that formed sheeted dikesand lavas. Since the MTZ sills did not form in a gabbro glacier,and instead crystallized in situ, by analogy the lower crustallayered gabbros may have formed in the same manner. Third,the presence of cm-scale chemical variation in the layeredgabbros argues against porous melt flow through interconnectedporosities within the lower crust, while the gabbro glacier modelrequires ~20% interconnected porosity for downward ductileflow of a crystal mush from a shallow melt lens (Nicolas, 1992).
In addition, despite the absence of small melt-filled sills inseismic imaging, there is also geophysical data in support of thesheeted sills hypothesis. Most on-axis seismic reflection sur-veys may only image the shallowest of many small melt lenses;deeper lenses may be shielded from seismic reflections by theuppermost lens. Furthermore, seismic reflection and compliancestudies have demonstrated the presence of melt lenses at thebase of the crust (Lewis and Garmany, 1982; Crawford et al.,1999; Crawford and Webb, 2002; Nedimovic et al., 2005).From this perspective, the Low Velocity Zone (LVZ) extendingfrom the shallow melt lens to the base of the crust at the EPR(Detrick et al., 1987; Harding et al., 1989; Toomey et al., 1990;Vera et al., 1990; Dunn et al., 2000) could be a region
Fig. 2. Map of the Oman ophiolite adapted from Nicolas et al. (2000). Inset shows the sections of Wadi Khafifah (this study) and Wadi Al Abyad (Coogan et al., 2002)in bold lettering. See Garrido et al. (2001) for a map of detailed sample locations and Table 2 for precise UTM coordinates.
71J.A. VanTongeren et al. / Earth and Planetary Science Letters 267 (2008) 69–82
Author's personal copy
containing many smaller melt lenses (1–100 m) rather than ahomogeneous “crystal mush.”
2.3. Hydrothermal alteration as a function of depth
In the Oman ophiolite, the crustal section of the Wadi Tayinmassif provides a benchmark for studies of hydrothermal al-teration of oceanic crust as a function of depth. Gregory andTaylor (1981) showed that lavas, sheeted dikes, and the up-permost gabbros were affected by low-temperature alterationthat shifted oxygen isotope ratios to heavier values and87Sr/86Sr closer to seawater values at high water-rock ratios.In the same study, they showed that lower crustal gabbrosunderwent high-temperature alteration that shifted oxygen tolighter isotope ratios, with less modification of 87Sr/86Sr atlower water–rock ratios. These observations are consistentwith other ophiolite sections and data from partial oceanicgabbro sections sampled by drilling (e.g., Lanphere et al., 1981;McCulloch et al., 1981; Stakes and Vanko, 1986; Lecuyer andReynard, 1996; Mevel et al., 1996; Kawahata et al., 2001; Altand Bach, 2006).
Recently, there has been an emphasis on anisotropic dis-tribution of fluid flow and alteration in the lower crust. High-temperature hydrothermal veins record much larger shifts tolighter oxygen isotopes and higher 87Sr/86Sr in the lower crust(Bosch et al., 2004; Coogan et al., 2006), indicating the presenceof high flux channels for focused flow during high-temperaturehydrothermal circulation. Systems of sub-millimeter micro-cracks that penetrate to the Moho in Oman lower gabbros havebeen described by numerous workers (Nicolas et al., 1988;Nehlig, 1994; Nicolas et al., 2003). These microcracks arethought to be interconnected and the cracking events episodic,presumably due to thermal contraction caused by the coolingof the gabbro. Because heat diffuses much more rapidly thanchemical components, a few zones with focused fluid flowcould drive rapid cooling in large domains within oceanic lowercrust. Amphibolite facies mineral assemblages, as well as ox-ygen and strontium isotopes, suggest that these cracks formed atvery high temperatures (900-1000 °C; Bosch et al., 2004).
The modeling study of Cherkaoui et al. (2003) showed thatoceanic lower crust may cool efficiently via vigorous hydro-thermal convection at permeabilities ≥2×10⁻¹⁴ m2. In thiscase, near-axis isotherms in the lower crust are essentiallyvertical from the base of the sheeted dikes to the Moho, im-plying uniform cooling throughout the lower crust. Dunn et al.(2000) presented an interpretation of lower crustal seismic datafor the EPR in which seismic velocity is slowest beneath theridge axis, and contours of seismic velocity are nearly vertical.Cherkaoui et al. and Dunn et al. interpreted these results toindicate that vigorous hydrothermal cooling extends to the baseof the crust along the EPR.
2.4. Cooling rates as a function of depth
Ultimately, the correct model for oceanic crustal accretionand the influence of hydrothermal cooling in the lower crustmust agree not only with petrologic and geophysical observa-
tions from spreading centers, but also with data on the thermalprofile of the lower crust. The latter can be quantified based oncooling rates of the cumulate gabbros.
Two previous studies have been conducted on the variationof cooling rate as a function of depth in the lower crust of theOman ophiolite. Garrido et al. (2001) measured plagioclasecrystal size distribution (CSD) through the Khafifah section ofthe Wadi Tayin massif, and found evidence for a transition fromconduction dominated cooling in the lower gabbros (below1500 m) to a hydrothermally dominated cooling profile in theupper gabbros (above 2500 m). Garrido et al. (2001) concludedthat their data were consistent with the sheeted sill model ofemplacement. Coogan et al. (2002) calculated cooling ratesusing Ca in olivine in the Wadi Abyad massif, and reported agradual decrease in cooling rate with increasing depth in thesection. On the basis of these results they argued in favor ofthe gabbro glacier model. The work presented here extends thetechnique of Coogan et al. (2002) to the sample suite from theKhafifah section in the Wadi Tayin massif of the Omanophiolite, previously studied by Garrido et al. (2001).
3. Methods
3.1. Samples
Samples were taken from the lower gabbro section in theWadi Tayin massif of the Oman ophiolite (See Garrido et al.(2001) for sample locations and descriptions). All thin sectionswere previously analyzed by Garrido et al. (2001) in a study ofplagioclase CSDs. Olivine crystals for this study were selectedaccording to two criteria: crystal freshness and crystal shape.Sub-spherical olivines, with aspect ratios less than 3.0, wereselected to maximize the likelihood of analyzing the true centerof the crystal.
3.2. Electron microprobe analyses
High precision electron microprobe analyses were conductedat The American Museum of Natural History on a CamecaSx100 microprobe. A 100 nA beam current, and 15 kV wereused for 600 s on the peak, and 300 s on each background for Cain olivine. In a previous Ca in olivine study, Coogan et al.(2002) used a 200 nA beam, 15 kV, and counting times of 600 speak and 300 s background and reported counting statistics of±2% relative at 1 σ. Mantle Ca in olivine measured by M.Braun (2004) used a 100 nA beam, 15 kV, and 240 s on peakand 180 s on background for precision of ±1.5% relative at 1 σ.Analytical conditions for this study were chosen based on theseresults. Standards were reproduced to better than ±5% relative(1 σ) over a range of concentrations between 100 and 700 ppm(Table 1a). Crucially, we checked for inter-laboratory bias byanalyzing Ca in olivine in samples loaned to us by L. A.Coogan, and discovered no significant difference between ouranalyses and his earlier results. Repeat analyses on two olivinegrains with different Ca concentrations yielded an accuracy(with respect to L.A. Coogan's analyses) of ±~1.5% relative,and ±0.9% relative at 1 σ, respectively. Precision of these
72 J.A. VanTongeren et al. / Earth and Planetary Science Letters 267 (2008) 69–82
Author's personal copy
analyses was well within the standard deviation of the accuracy(Table 1b).
All olivine grains were analyzed in both core and rim.Closely spaced traverses through each olivine were made wherepossible in order to determine a diffusion profile. An average offour olivine grains were analyzed per thin section resulting in anaverage of thirteen analyses per thin section.
3.3. Calculation of closure temperature and cooling rate
Temperatures are calculated using the experimentally de-rived Ca-in-olivine thermometer of Kohler and Brey (1990).
Tc ¼ 42:5P þ 5792
�ln Dol=cpxCa
� �� 1:25
ð1Þ
Pressure is assumed to be 200 MPa. DCaol/cpx is the distribution
coefficient of Ca between olivine and clinopyroxene. Coolingrates (dT/dt) are calculated following the equations of Dodson(1973).
dT=dt ¼ �RT2cADo
Ea2exp E=RTcð Þ : ð2Þ
A is a dimensionless number assigned for crystal shape (e.g.55 for a sphere, assumed throughout the calculations); a is thediffusion length, here defined as the crystal radius (or theminimum core to rim diffusion length in crystals with aspectratios N1); Do is the pre-exponential diffusion constant; and E isthe activation energy associated with the specified Do and theaxis of maximum diffusivity.
3.4. Potential complications in the measurement of cooling ratefrom Ca in olivine
3.4.1. Diffusivity of Ca in olivineThe choice of pre-exponential diffusion constant (Do) for Ca
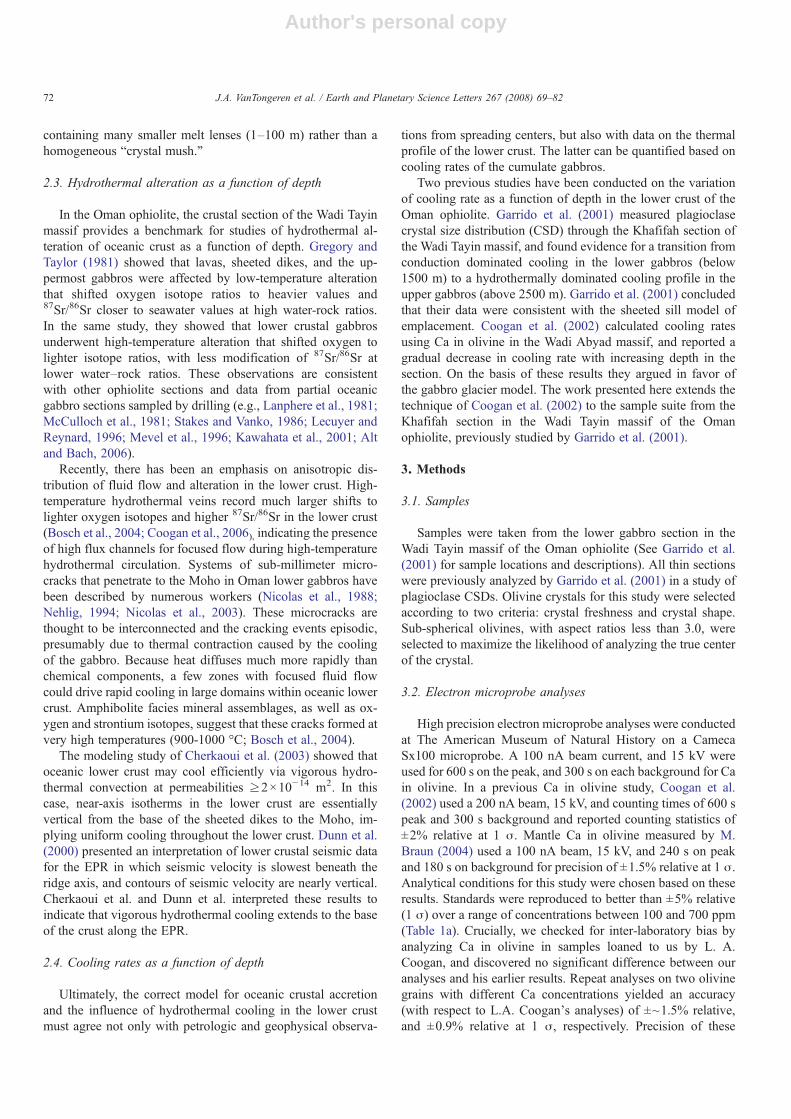
in olivine has been the subject of debate since the first studypublished by Morioka (1981). In fact, cooling rates calculatedbased on the Do and E of Jurewicz and Watson (1988) areshown to be markedly different than those calculated usingresults reported by Stahl et al. (1998) (e.g., Coogan et al., 2002).Fig. 3 demonstrates the current range in published values for Do
as a function of temperature. For this reason, until Do and E areknown precisely, calculated cooling rates based on Ca diffusionin olivine are best considered as relative estimates (Cooganet al., 2005). We place most confidence in the experimentally
calibrated diffusivities of Coogan et al. (2005), due to theircalibration over a wide range of temperature (1500–900 °C) andforsterite content (Fo100–Fo83).
3.4.2. Dependence of calcium diffusivity on olivine forsteritecontent
It has been proposed that increased Fe concentration leadsto increased diffusivity of Ca in olivine (Roeder, 1974; Longhiet al., 1978; Jurewicz and Watson, 1988; Libourel, 1999).Coogan et al. (2005) suggest that there is no correlation betweendecreased forsterite content and faster Ca diffusivity. Data fromour study show a small correlation (R2 =0.14) between Fo andCa content. Thus, Ca concentration and cooling rate valuesreported throughout this study are not corrected for any possibledependence of diffusivity on Fe content of olivine.
3.4.3. Stereological effects and crystallographic orientation inthin section
One complication in interpreting Ca content in olivine coresarises from uncertainty associated with crystal shape in three
Fig. 3. Experimentally determined pre-exponential diffusion constants (Do) forCa in olivine. J&W=Jurewicz and Watson (1988); Stahl=Stahl et al. (1998);Coogan=Coogan et al. (2005). a, b, and c=a, b, and c crystallographic axes.Most confidence is placed in the results of Coogan et al. (2005) because of theircalibration over a wide range of temperature and olivine forsterite content.Calculations of cooling rate reported throughout this study use the Do and E ofthe Coogan et al. (2005) c-axis. Gray shaded area denotes the temperatureinterval of interest in this study.
Table 1bStatistics on inter-lab comparison
Interlab comparison
Average Ca(ppm)
Standarddeviation(ppm)
Cooganreported value(ppm)
% relerror
% error(ppm)
Grain 1; n=8 319.40 5.60 314.44 1.58 5.04Grain 2; n=7 1558.36 18.63 1572.21 0.88 13.73
Table 1aError statistics on olivine standards
Standards
Standard n Mean Ca(ppm)
Standarddeviation
Countingerror (ppm)
% relative
SC_Oliv 43 716.04 12.05 4.68 1.68OL_Que 25 260.66 9.47 1.84 3.63OL174.1 15 99.07 5.56 0.68 5.61
73J.A. VanTongeren et al. / Earth and Planetary Science Letters 267 (2008) 69–82
Author's personal copy
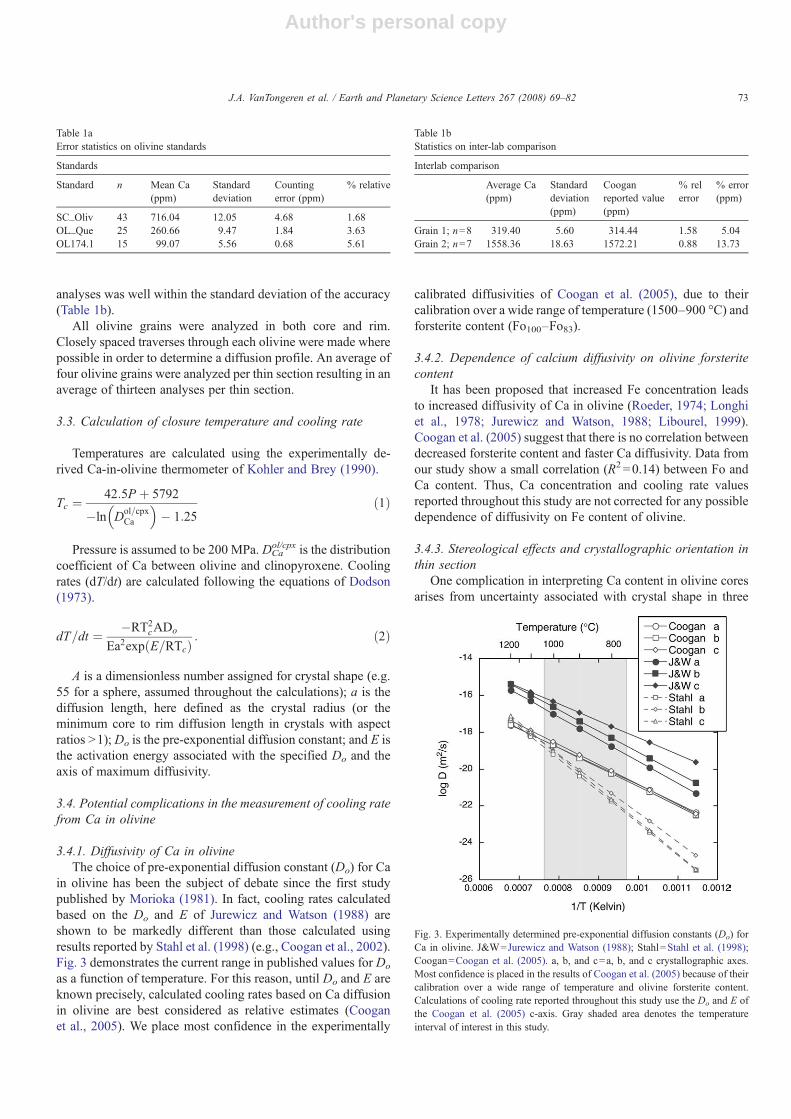
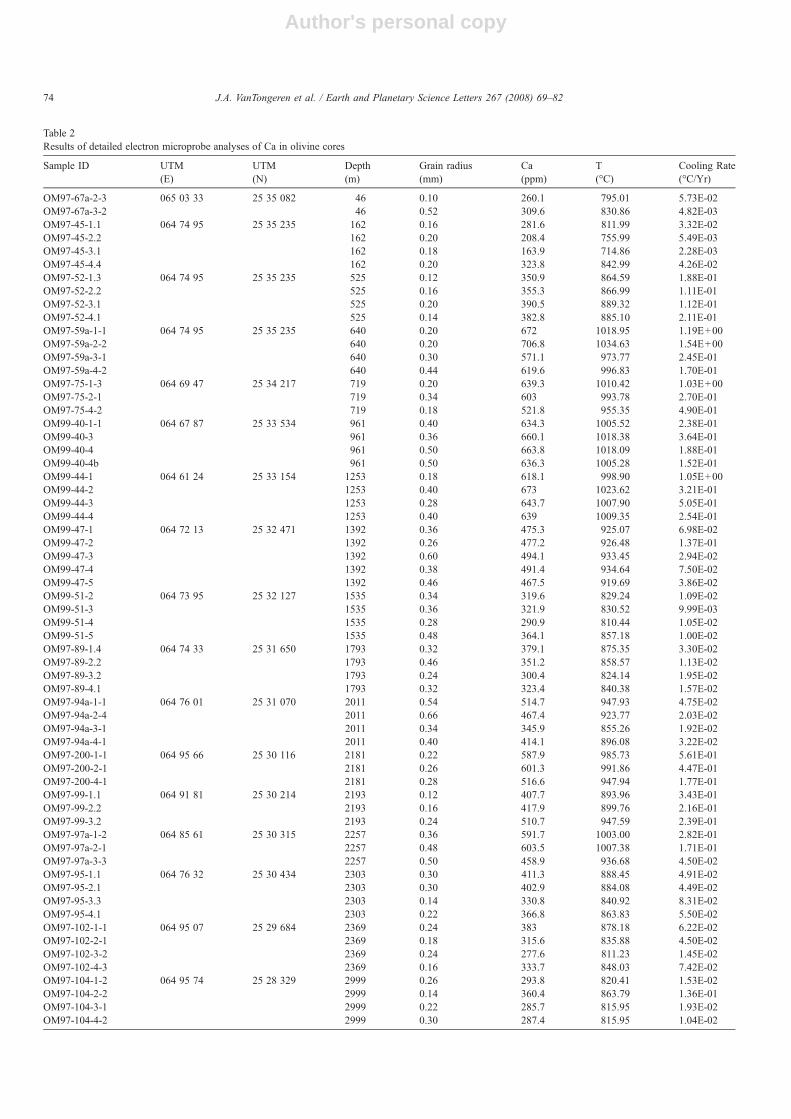
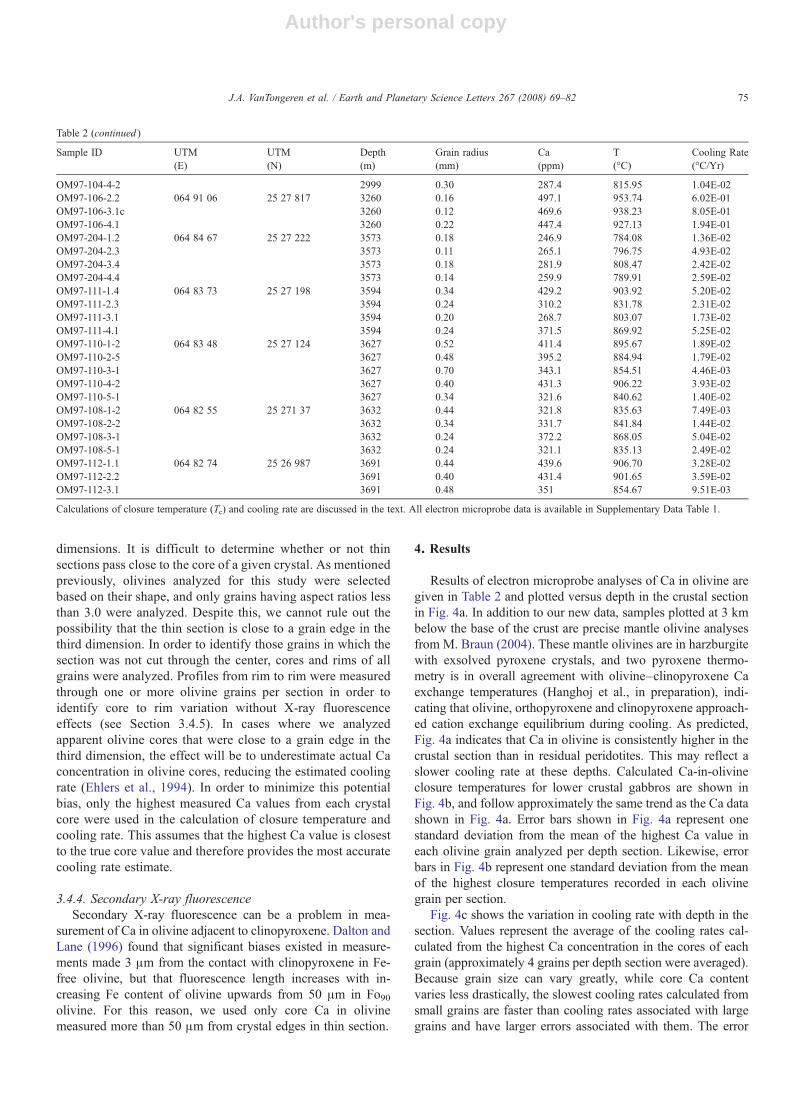
Table 2Results of detailed electron microprobe analyses of Ca in olivine cores
Sample ID UTM(E)
UTM(N)
Depth(m)
Grain radius(mm)
Ca(ppm)
T(°C)
Cooling Rate(°C/Yr)
OM97-67a-2-3 065 03 33 25 35 082 46 0.10 260.1 795.01 5.73E-02OM97-67a-3-2 46 0.52 309.6 830.86 4.82E-03OM97-45-1.1 064 74 95 25 35 235 162 0.16 281.6 811.99 3.32E-02OM97-45-2.2 162 0.20 208.4 755.99 5.49E-03OM97-45-3.1 162 0.18 163.9 714.86 2.28E-03OM97-45-4.4 162 0.20 323.8 842.99 4.26E-02OM97-52-1.3 064 74 95 25 35 235 525 0.12 350.9 864.59 1.88E-01OM97-52-2.2 525 0.16 355.3 866.99 1.11E-01OM97-52-3.1 525 0.20 390.5 889.32 1.12E-01OM97-52-4.1 525 0.14 382.8 885.10 2.11E-01OM97-59a-1-1 064 74 95 25 35 235 640 0.20 672 1018.95 1.19E+00OM97-59a-2-2 640 0.20 706.8 1034.63 1.54E+00OM97-59a-3-1 640 0.30 571.1 973.77 2.45E-01OM97-59a-4-2 640 0.44 619.6 996.83 1.70E-01OM97-75-1-3 064 69 47 25 34 217 719 0.20 639.3 1010.42 1.03E+00OM97-75-2-1 719 0.34 603 993.78 2.70E-01OM97-75-4-2 719 0.18 521.8 955.35 4.90E-01OM99-40-1-1 064 67 87 25 33 534 961 0.40 634.3 1005.52 2.38E-01OM99-40-3 961 0.36 660.1 1018.38 3.64E-01OM99-40-4 961 0.50 663.8 1018.09 1.88E-01OM99-40-4b 961 0.50 636.3 1005.28 1.52E-01OM99-44-1 064 61 24 25 33 154 1253 0.18 618.1 998.90 1.05E+00OM99-44-2 1253 0.40 673 1023.62 3.21E-01OM99-44-3 1253 0.28 643.7 1007.90 5.05E-01OM99-44-4 1253 0.40 639 1009.35 2.54E-01OM99-47-1 064 72 13 25 32 471 1392 0.36 475.3 925.07 6.98E-02OM99-47-2 1392 0.26 477.2 926.48 1.37E-01OM99-47-3 1392 0.60 494.1 933.45 2.94E-02OM99-47-4 1392 0.38 491.4 934.64 7.50E-02OM99-47-5 1392 0.46 467.5 919.69 3.86E-02OM99-51-2 064 73 95 25 32 127 1535 0.34 319.6 829.24 1.09E-02OM99-51-3 1535 0.36 321.9 830.52 9.99E-03OM99-51-4 1535 0.28 290.9 810.44 1.05E-02OM99-51-5 1535 0.48 364.1 857.18 1.00E-02OM97-89-1.4 064 74 33 25 31 650 1793 0.32 379.1 875.35 3.30E-02OM97-89-2.2 1793 0.46 351.2 858.57 1.13E-02OM97-89-3.2 1793 0.24 300.4 824.14 1.95E-02OM97-89-4.1 1793 0.32 323.4 840.38 1.57E-02OM97-94a-1-1 064 76 01 25 31 070 2011 0.54 514.7 947.93 4.75E-02OM97-94a-2-4 2011 0.66 467.4 923.77 2.03E-02OM97-94a-3-1 2011 0.34 345.9 855.26 1.92E-02OM97-94a-4-1 2011 0.40 414.1 896.08 3.22E-02OM97-200-1-1 064 95 66 25 30 116 2181 0.22 587.9 985.73 5.61E-01OM97-200-2-1 2181 0.26 601.3 991.86 4.47E-01OM97-200-4-1 2181 0.28 516.6 947.94 1.77E-01OM97-99-1.1 064 91 81 25 30 214 2193 0.12 407.7 893.96 3.43E-01OM97-99-2.2 2193 0.16 417.9 899.76 2.16E-01OM97-99-3.2 2193 0.24 510.7 947.59 2.39E-01OM97-97a-1-2 064 85 61 25 30 315 2257 0.36 591.7 1003.00 2.82E-01OM97-97a-2-1 2257 0.48 603.5 1007.38 1.71E-01OM97-97a-3-3 2257 0.50 458.9 936.68 4.50E-02OM97-95-1.1 064 76 32 25 30 434 2303 0.30 411.3 888.45 4.91E-02OM97-95-2.1 2303 0.30 402.9 884.08 4.49E-02OM97-95-3.3 2303 0.14 330.8 840.92 8.31E-02OM97-95-4.1 2303 0.22 366.8 863.83 5.50E-02OM97-102-1-1 064 95 07 25 29 684 2369 0.24 383 878.18 6.22E-02OM97-102-2-1 2369 0.18 315.6 835.88 4.50E-02OM97-102-3-2 2369 0.24 277.6 811.23 1.45E-02OM97-102-4-3 2369 0.16 333.7 848.03 7.42E-02OM97-104-1-2 064 95 74 25 28 329 2999 0.26 293.8 820.41 1.53E-02OM97-104-2-2 2999 0.14 360.4 863.79 1.36E-01OM97-104-3-1 2999 0.22 285.7 815.95 1.93E-02OM97-104-4-2 2999 0.30 287.4 815.95 1.04E-02
74 J.A. VanTongeren et al. / Earth and Planetary Science Letters 267 (2008) 69–82
Author's personal copy
dimensions. It is difficult to determine whether or not thinsections pass close to the core of a given crystal. As mentionedpreviously, olivines analyzed for this study were selectedbased on their shape, and only grains having aspect ratios lessthan 3.0 were analyzed. Despite this, we cannot rule out thepossibility that the thin section is close to a grain edge in thethird dimension. In order to identify those grains in which thesection was not cut through the center, cores and rims of allgrains were analyzed. Profiles from rim to rim were measuredthrough one or more olivine grains per section in order toidentify core to rim variation without X-ray fluorescenceeffects (see Section 3.4.5). In cases where we analyzedapparent olivine cores that were close to a grain edge in thethird dimension, the effect will be to underestimate actual Caconcentration in olivine cores, reducing the estimated coolingrate (Ehlers et al., 1994). In order to minimize this potentialbias, only the highest measured Ca values from each crystalcore were used in the calculation of closure temperature andcooling rate. This assumes that the highest Ca value is closestto the true core value and therefore provides the most accuratecooling rate estimate.
3.4.4. Secondary X-ray fluorescenceSecondary X-ray fluorescence can be a problem in mea-
surement of Ca in olivine adjacent to clinopyroxene. Dalton andLane (1996) found that significant biases existed in measure-ments made 3 μm from the contact with clinopyroxene in Fe-free olivine, but that fluorescence length increases with in-creasing Fe content of olivine upwards from 50 μm in Fo90olivine. For this reason, we used only core Ca in olivinemeasured more than 50 μm from crystal edges in thin section.
4. Results
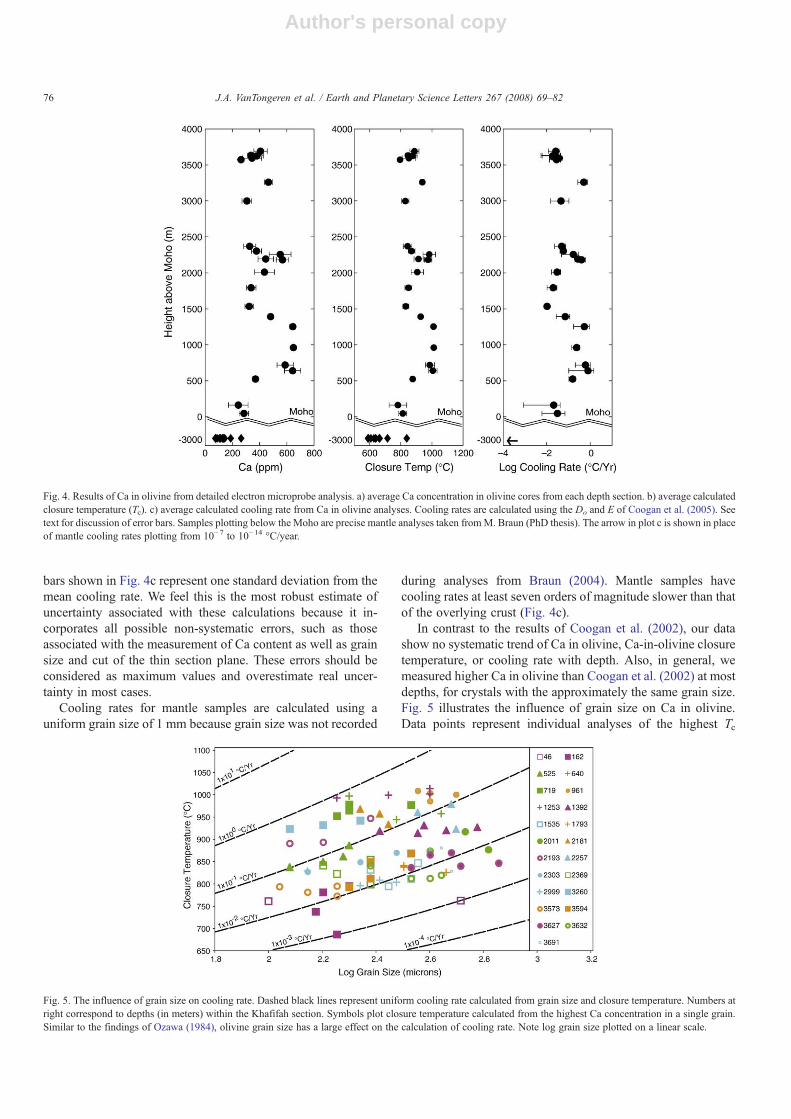
Results of electron microprobe analyses of Ca in olivine aregiven in Table 2 and plotted versus depth in the crustal sectionin Fig. 4a. In addition to our new data, samples plotted at 3 kmbelow the base of the crust are precise mantle olivine analysesfrom M. Braun (2004). These mantle olivines are in harzburgitewith exsolved pyroxene crystals, and two pyroxene thermo-metry is in overall agreement with olivine–clinopyroxene Caexchange temperatures (Hanghoj et al., in preparation), indi-cating that olivine, orthopyroxene and clinopyroxene approach-ed cation exchange equilibrium during cooling. As predicted,Fig. 4a indicates that Ca in olivine is consistently higher in thecrustal section than in residual peridotites. This may reflect aslower cooling rate at these depths. Calculated Ca-in-olivineclosure temperatures for lower crustal gabbros are shown inFig. 4b, and follow approximately the same trend as the Ca datashown in Fig. 4a. Error bars shown in Fig. 4a represent onestandard deviation from the mean of the highest Ca value ineach olivine grain analyzed per depth section. Likewise, errorbars in Fig. 4b represent one standard deviation from the meanof the highest closure temperatures recorded in each olivinegrain per section.
Fig. 4c shows the variation in cooling rate with depth in thesection. Values represent the average of the cooling rates cal-culated from the highest Ca concentration in the cores of eachgrain (approximately 4 grains per depth section were averaged).Because grain size can vary greatly, while core Ca contentvaries less drastically, the slowest cooling rates calculated fromsmall grains are faster than cooling rates associated with largegrains and have larger errors associated with them. The error
Table 2 (continued )
Sample ID UTM(E)
UTM(N)
Depth(m)
Grain radius(mm)
Ca(ppm)
T(°C)
Cooling Rate(°C/Yr)
OM97-104-4-2 2999 0.30 287.4 815.95 1.04E-02OM97-106-2.2 064 91 06 25 27 817 3260 0.16 497.1 953.74 6.02E-01OM97-106-3.1c 3260 0.12 469.6 938.23 8.05E-01OM97-106-4.1 3260 0.22 447.4 927.13 1.94E-01OM97-204-1.2 064 84 67 25 27 222 3573 0.18 246.9 784.08 1.36E-02OM97-204-2.3 3573 0.11 265.1 796.75 4.93E-02OM97-204-3.4 3573 0.18 281.9 808.47 2.42E-02OM97-204-4.4 3573 0.14 259.9 789.91 2.59E-02OM97-111-1.4 064 83 73 25 27 198 3594 0.34 429.2 903.92 5.20E-02OM97-111-2.3 3594 0.24 310.2 831.78 2.31E-02OM97-111-3.1 3594 0.20 268.7 803.07 1.73E-02OM97-111-4.1 3594 0.24 371.5 869.92 5.25E-02OM97-110-1-2 064 83 48 25 27 124 3627 0.52 411.4 895.67 1.89E-02OM97-110-2-5 3627 0.48 395.2 884.94 1.79E-02OM97-110-3-1 3627 0.70 343.1 854.51 4.46E-03OM97-110-4-2 3627 0.40 431.3 906.22 3.93E-02OM97-110-5-1 3627 0.34 321.6 840.62 1.40E-02OM97-108-1-2 064 82 55 25 271 37 3632 0.44 321.8 835.63 7.49E-03OM97-108-2-2 3632 0.34 331.7 841.84 1.44E-02OM97-108-3-1 3632 0.24 372.2 868.05 5.04E-02OM97-108-5-1 3632 0.24 321.1 835.13 2.49E-02OM97-112-1.1 064 82 74 25 26 987 3691 0.44 439.6 906.70 3.28E-02OM97-112-2.2 3691 0.40 431.4 901.65 3.59E-02OM97-112-3.1 3691 0.48 351 854.67 9.51E-03
Calculations of closure temperature (Tc) and cooling rate are discussed in the text. All electron microprobe data is available in Supplementary Data Table 1.
75J.A. VanTongeren et al. / Earth and Planetary Science Letters 267 (2008) 69–82
Author's personal copy
bars shown in Fig. 4c represent one standard deviation from themean cooling rate. We feel this is the most robust estimate ofuncertainty associated with these calculations because it in-corporates all possible non-systematic errors, such as thoseassociated with the measurement of Ca content as well as grainsize and cut of the thin section plane. These errors should beconsidered as maximum values and overestimate real uncer-tainty in most cases.
Cooling rates for mantle samples are calculated using auniform grain size of 1 mm because grain size was not recorded
during analyses from Braun (2004). Mantle samples havecooling rates at least seven orders of magnitude slower than thatof the overlying crust (Fig. 4c).
In contrast to the results of Coogan et al. (2002), our datashow no systematic trend of Ca in olivine, Ca-in-olivine closuretemperature, or cooling rate with depth. Also, in general, wemeasured higher Ca in olivine than Coogan et al. (2002) at mostdepths, for crystals with the approximately the same grain size.Fig. 5 illustrates the influence of grain size on Ca in olivine.Data points represent individual analyses of the highest Tc
Fig. 5. The influence of grain size on cooling rate. Dashed black lines represent uniform cooling rate calculated from grain size and closure temperature. Numbers atright correspond to depths (in meters) within the Khafifah section. Symbols plot closure temperature calculated from the highest Ca concentration in a single grain.Similar to the findings of Ozawa (1984), olivine grain size has a large effect on the calculation of cooling rate. Note log grain size plotted on a linear scale.
Fig. 4. Results of Ca in olivine from detailed electron microprobe analysis. a) average Ca concentration in olivine cores from each depth section. b) average calculatedclosure temperature (Tc). c) average calculated cooling rate from Ca in olivine analyses. Cooling rates are calculated using the Do and E of Coogan et al. (2005). Seetext for discussion of error bars. Samples plotting below the Moho are precise mantle analyses taken fromM. Braun (PhD thesis). The arrow in plot c is shown in placeof mantle cooling rates plotting from 10−7 to 10−14 °C/year.
76 J.A. VanTongeren et al. / Earth and Planetary Science Letters 267 (2008) 69–82
Author's personal copy
(calculated from highest Ca content) measured in the cores ofeach grain analyzed. Solid black contours delineate cooling rate.Similar to Ozawa (Ozawa, 1984, Figs. 9–14), for several of oursamples olivine analyses lie along contours of constant coolingrate. It can be concluded that core Ca is approximated well byour analytical procedure despite the potential biases mentionedpreviously (Section 3.4).
5. Discussion
The absence of systematic variation in cooling rate withdepth recorded in the Wadi Tayin crustal section of the Omanophiolite suggests that the gabbros cooled at approximately thesame rate throughout the lower crust (Fig. 4). Lower crustalgabbros with faster cooling rates than those of gabbros near thebase of the sheeted dikes, may have been intruded off-axiswhere host rock had already cooled significantly (MacLeod andYaouancq, 2000). Since oceanic crust shows no appreciableincrease in thickness more than one km off axis (Vera et al.,1990; Singh et al., 2006), these off-axis intrusions must havebeen within one km of the ridge axis, and thus rapid cooling ofhost rocks is required by these data. As mentioned previously(Section 1), in order to cool the lower crust at a uniform ratefrom the Moho to the sheeted dikes, hydrothermal circulationmust be active throughout the crust within one or two km of theridge axis. Results from this study are therefore consistent withvigorous hydrothermal cooling to Moho depths within one ortwo km of the ridge axis.
5.1. Comparison with previous cooling rate studies in theOman ophiolite
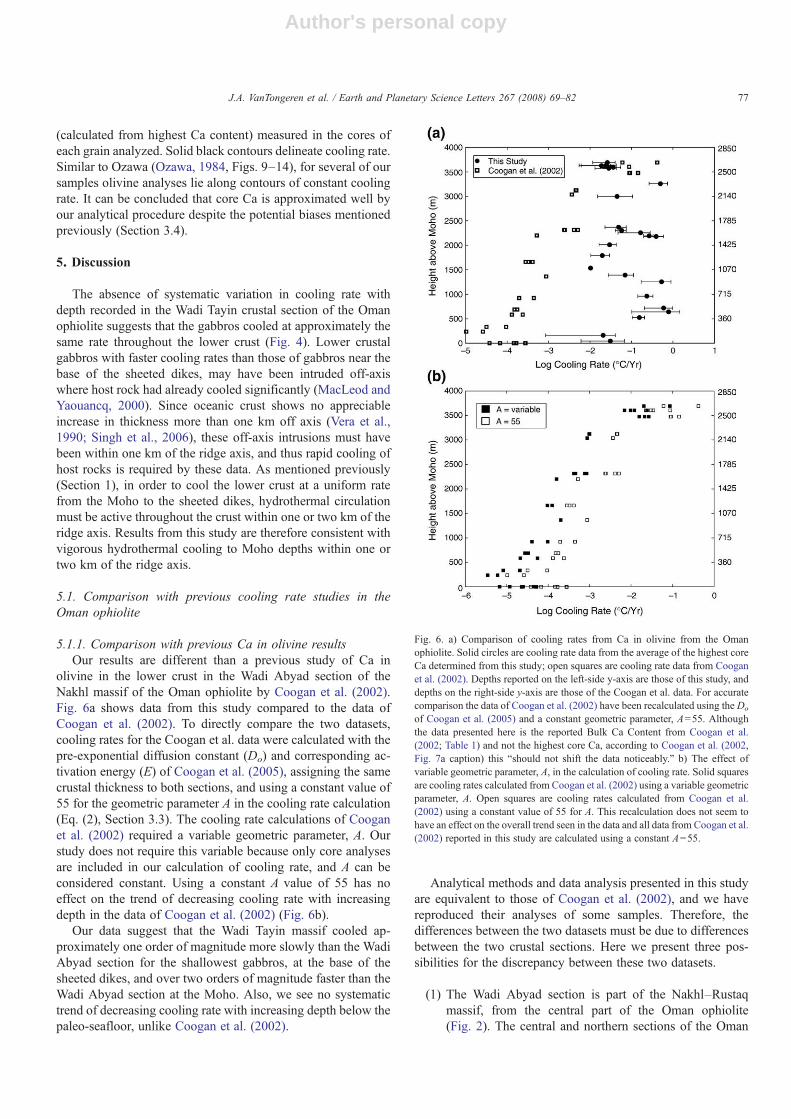
5.1.1. Comparison with previous Ca in olivine resultsOur results are different than a previous study of Ca in
olivine in the lower crust in the Wadi Abyad section of theNakhl massif of the Oman ophiolite by Coogan et al. (2002).Fig. 6a shows data from this study compared to the data ofCoogan et al. (2002). To directly compare the two datasets,cooling rates for the Coogan et al. data were calculated with thepre-exponential diffusion constant (Do) and corresponding ac-tivation energy (E) of Coogan et al. (2005), assigning the samecrustal thickness to both sections, and using a constant value of55 for the geometric parameter A in the cooling rate calculation(Eq. (2), Section 3.3). The cooling rate calculations of Cooganet al. (2002) required a variable geometric parameter, A. Ourstudy does not require this variable because only core analysesare included in our calculation of cooling rate, and A can beconsidered constant. Using a constant A value of 55 has noeffect on the trend of decreasing cooling rate with increasingdepth in the data of Coogan et al. (2002) (Fig. 6b).
Our data suggest that the Wadi Tayin massif cooled ap-proximately one order of magnitude more slowly than the WadiAbyad section for the shallowest gabbros, at the base of thesheeted dikes, and over two orders of magnitude faster than theWadi Abyad section at the Moho. Also, we see no systematictrend of decreasing cooling rate with increasing depth below thepaleo-seafloor, unlike Coogan et al. (2002).
Analytical methods and data analysis presented in this studyare equivalent to those of Coogan et al. (2002), and we havereproduced their analyses of some samples. Therefore, thedifferences between the two datasets must be due to differencesbetween the two crustal sections. Here we present three pos-sibilities for the discrepancy between these two datasets.
(1) The Wadi Abyad section is part of the Nakhl–Rustaqmassif, from the central part of the Oman ophiolite(Fig. 2). The central and northern sections of the Oman
Fig. 6. a) Comparison of cooling rates from Ca in olivine from the Omanophiolite. Solid circles are cooling rate data from the average of the highest coreCa determined from this study; open squares are cooling rate data from Cooganet al. (2002). Depths reported on the left-side y-axis are those of this study, anddepths on the right-side y-axis are those of the Coogan et al. data. For accuratecomparison the data of Coogan et al. (2002) have been recalculated using the Do
of Coogan et al. (2005) and a constant geometric parameter, A=55. Althoughthe data presented here is the reported Bulk Ca Content from Coogan et al.(2002; Table 1) and not the highest core Ca, according to Coogan et al. (2002,Fig. 7a caption) this “should not shift the data noticeably.” b) The effect ofvariable geometric parameter, A, in the calculation of cooling rate. Solid squaresare cooling rates calculated from Coogan et al. (2002) using a variable geometricparameter, A. Open squares are cooling rates calculated from Coogan et al.(2002) using a constant value of 55 for A. This recalculation does not seem tohave an effect on the overall trend seen in the data and all data from Coogan et al.(2002) reported in this study are calculated using a constant A=55.
77J.A. VanTongeren et al. / Earth and Planetary Science Letters 267 (2008) 69–82
Author's personal copy
ophiolite have trace element signatures indicative of asubduction-component (Pearce et al., 1981; Alabasteret al., 1982; Lachize et al., 1996; Arai et al., 2006; Tamuraand Arai, 2006). It is unclear, however, what influence asubduction component may have on cooling rates in thelower crust at intermediate-fast spreading ridges.
(2) The lower crust of the Wadi Abyad section is 2.6 kmthick, as compared to a thickness of 3.7 km inWadi Tayin.Phipps Morgan and Chen (1993) proposed that thinnercrust implies a smaller melt flux and therefore a deepermagma chamber. According to Phipps Morgan and Chen(1993; Figs. 4 & 5) a thinner crust would cool morequickly than a thicker crust with a shallower magmachamber. The difference in thermal regime associatedwith crustal thickness and magma chamber depth, there-fore, would be opposite to that which is seen from Ca inolivine results presented in Fig. 4.
(3) Magmatism in the central and northern massifs is poly-genetic, with a later suite of plutonic rocks intruding olderlower crustal gabbros (e.g., Smewing, 1981; Juteau et al.,1988a,b). In this context, it is relevant that there is a majorswarm of gabbronorite dikes intruding the shallow mantlesection of the Nahkl massif, just a few kilometers from thebase of the Wadi Abyad crustal section (e.g., Nicolaset al., 2000; Fig. 5). In particular, we think it is possiblethat reheating and retrograde metamorphism due poly-genetic crustal formation in this region may have con-tributed to anomalously slow cooling rates at the base ofthe Wadi Abyad crustal section.
Some combination of these factors may account for the dif-ference between our results and those of Coogan et al. (2002). Inany case, because the composition and crustal thickness of theWadi Tayin massif of the Oman ophiolite is most similar tocomposition and crustal thickness at active mid-ocean ridges, wesuggest that more confidence should be placed in the resultspresented from theWadi Tayinmassif (this study) as an analoguefor mid-ocean ridge processes.
5.1.2. Comparison with plagioclase crystal size distributionsThe results of Garrido et al. (2001) on the same sample suite
used in this study do not show any significant correlation withthe findings of this study. Using data on crystal size dis-tributions (CSDs), Garrido et al. inferred a transition from rapidto gradual cooling rates of the lower gabbros at approximately1500 m above the Moho. More confidence must be placed in thecooling rates based on Ca in olivine presented here for tworeasons. First, cooling rates determined by plagioclase CSDswere not quantified by Garrido et al. because prior calibrationsof CSD versus cooling rate were made for widely separatedcrystals in a large volume of magma, whereas Oman gabbrossolidified 100%, with impinging crystals. Thus, the CSD dataare simply a qualitative reflection of the cooling rate and ther-mal profile. Second, significant factors other than cooling rate,such as variable amounts of second phase pinning, may causevariation of CSDs in holocrystalline rocks that is independent ofcooling rate.
5.2. Comparison with model results
5.2.1. Numerical ModelsNumerical calculations by Maclennan et al. (2004, 2005)
show the thermal regime and surface heat flow for gabbroglacier and sheeted sill models. Intrusion of melt was assumedto take place over a lateral range of 1 km (half width), and thedistribution of melt and location of crystallization was allowedto vary. Hydrothermal circulation was treated as a series of heatsinks following the method of Morton and Sleep (1985).
Similarly, numerical models by Cherkaoui et al. (2003) showthermal gradients and fluid flux fields in the lower crust. Inthese models, however, all lower crust gabbros were assumed tocrystallize in situ at the final depth of emplacement, and per-meability was varied in order to assess the ability of hy-drothermal circulation to efficiently cool the crust. Cherkaouiet al. (2003) concluded on the basis of these models thathydrothermal circulation is very efficient at cooling the lowercrust at crustal permeabilities of 2×10–14 m2 and greater. Underthese conditions the sheeted sill model of emplacement isthermally viable. While permeability in the lower crust mea-sured from boreholes is typically approximately 10–17 exceptnear faults and shear zones (Fisher, 1998), it is likely that higherpermeabilities exist during rapid thermal contraction (Cher-kaoui et al., 2003; Nicolas et al., 2003; Bosch et al., 2004).Rapid circulation in focused, high permeability zones may besufficient to cool substantial portions of the lower crust.
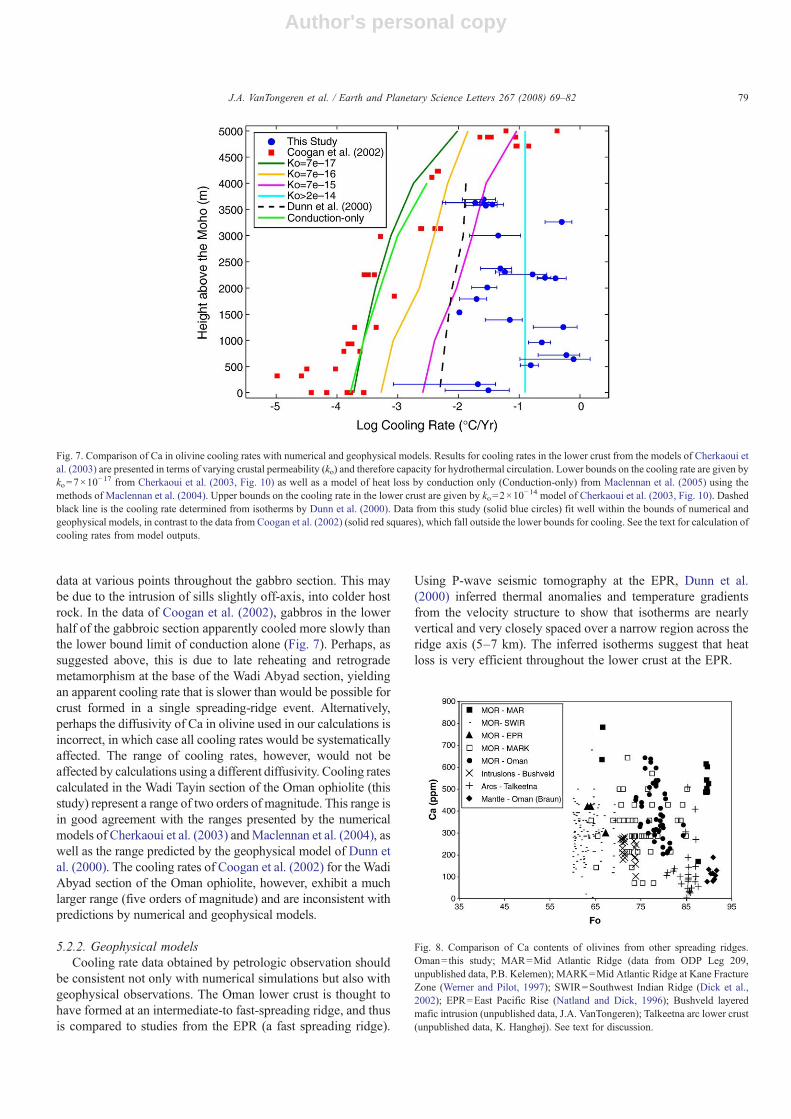
Cooling rates for all model outputs of Cherkaoui et al. (2003;Fig. 10) (with the exception of the 7×10–17 model run dis-cussed below) were calculated by digitizing the figure andmeasuring the off-axis distance from the 1200 °C isotherm tothe 700 °C isotherm. The resulting °C/km was then multipliedby the half-spreading rate used in the model (50 mm/yr) re-sulting in °C/yr. The lowest permeability model (7×10–17) wascalculated differently because the 700 °C isotherm does notreach Moho depths (6 km in Fig. 10 of Cherkaoui et al., 2003)within the bounds provided by the figure. In this case, thedetermination of °C/km was again made by digitizing the modeloutput, but the isotherms were then numerically fitted andextrapolated off-axis in order to obtain an accurate estimate of°C/km. The estimate of cooling rate in this calculation is notsignificantly affected by the choice of temperature interval (SeeSupplementary Fig. 1). The 700 °C isotherm was chosen as anend point because all Ca in olivine closure temperatures cal-culated in this study (Table 2) are above 700 °C.
Ca in olivine cooling rate data from this study fit well withinthe predicted cooling rates from both numerical studies (Fig. 7).A lower bound on cooling rates in the lower crust is provided bythe Maclennan et al. (2005) conduction-only model, as well asthe ko=7×10
−17 simulation of Cherkaoui et al. (2003). Coolingrates from this study are systematically higher than the lowerbounds, and are thus consistent with significant hydrothermalcooling of the lower oceanic crust. Upper bounds for coolingrate in Fig. 7 are calculated from the ko=2×10
−14 simulation ofCherkaoui et al. (2003) in which high permeability and rapidhydrothermal convection extends to the base of the crust. Theseupper bounds on cooling rate are exceeded by several of our
78 J.A. VanTongeren et al. / Earth and Planetary Science Letters 267 (2008) 69–82
Author's personal copy
data at various points throughout the gabbro section. This maybe due to the intrusion of sills slightly off-axis, into colder hostrock. In the data of Coogan et al. (2002), gabbros in the lowerhalf of the gabbroic section apparently cooled more slowly thanthe lower bound limit of conduction alone (Fig. 7). Perhaps, assuggested above, this is due to late reheating and retrogrademetamorphism at the base of the Wadi Abyad section, yieldingan apparent cooling rate that is slower than would be possible forcrust formed in a single spreading-ridge event. Alternatively,perhaps the diffusivity of Ca in olivine used in our calculations isincorrect, in which case all cooling rates would be systematicallyaffected. The range of cooling rates, however, would not beaffected by calculations using a different diffusivity. Cooling ratescalculated in the Wadi Tayin section of the Oman ophiolite (thisstudy) represent a range of two orders of magnitude. This range isin good agreement with the ranges presented by the numericalmodels of Cherkaoui et al. (2003) andMaclennan et al. (2004), aswell as the range predicted by the geophysical model of Dunn etal. (2000). The cooling rates of Coogan et al. (2002) for the WadiAbyad section of the Oman ophiolite, however, exhibit a muchlarger range (five orders of magnitude) and are inconsistent withpredictions by numerical and geophysical models.
5.2.2. Geophysical modelsCooling rate data obtained by petrologic observation should
be consistent not only with numerical simulations but also withgeophysical observations. The Oman lower crust is thought tohave formed at an intermediate-to fast-spreading ridge, and thusis compared to studies from the EPR (a fast spreading ridge).
Using P-wave seismic tomography at the EPR, Dunn et al.(2000) inferred thermal anomalies and temperature gradientsfrom the velocity structure to show that isotherms are nearlyvertical and very closely spaced over a narrow region across theridge axis (5–7 km). The inferred isotherms suggest that heatloss is very efficient throughout the lower crust at the EPR.
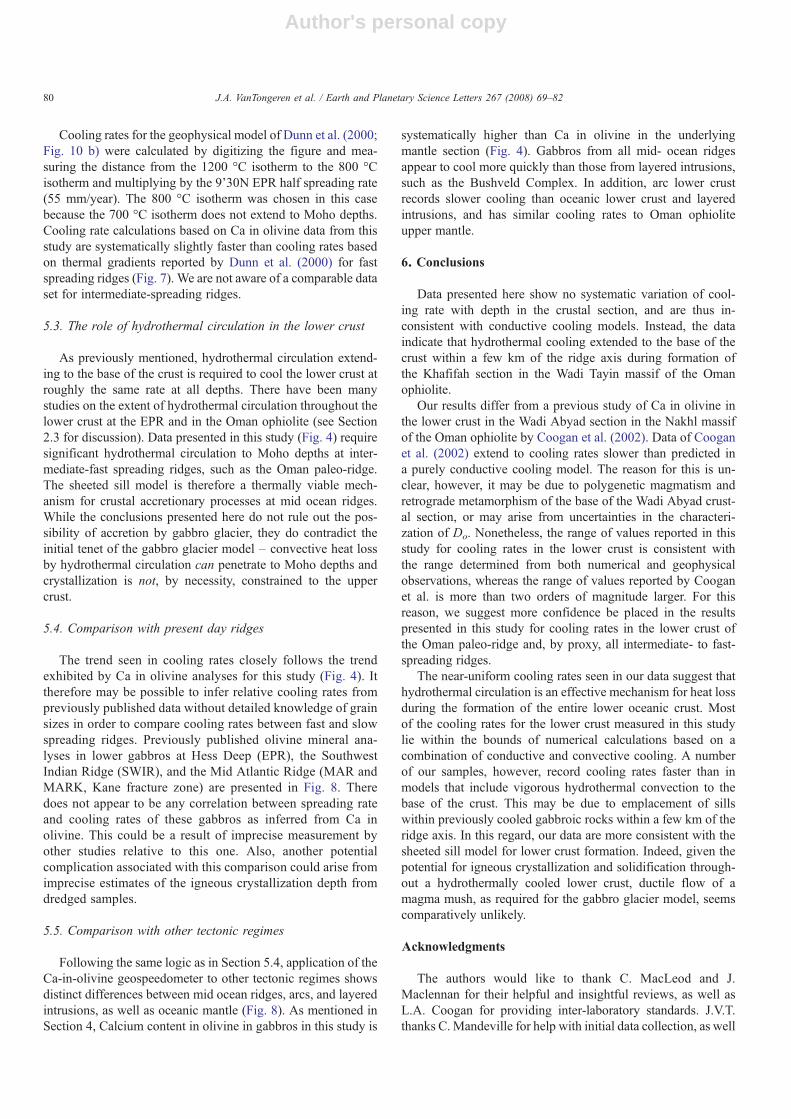
Fig. 8. Comparison of Ca contents of olivines from other spreading ridges.Oman=this study; MAR=Mid Atlantic Ridge (data from ODP Leg 209,unpublished data, P.B. Kelemen); MARK=Mid Atlantic Ridge at Kane FractureZone (Werner and Pilot, 1997); SWIR=Southwest Indian Ridge (Dick et al.,2002); EPR=East Pacific Rise (Natland and Dick, 1996); Bushveld layeredmafic intrusion (unpublished data, J.A. VanTongeren); Talkeetna arc lower crust(unpublished data, K. Hanghøj). See text for discussion.
Fig. 7. Comparison of Ca in olivine cooling rates with numerical and geophysical models. Results for cooling rates in the lower crust from the models of Cherkaoui etal. (2003) are presented in terms of varying crustal permeability (ko) and therefore capacity for hydrothermal circulation. Lower bounds on the cooling rate are given byko=7×10
−17 from Cherkaoui et al. (2003, Fig. 10) as well as a model of heat loss by conduction only (Conduction-only) from Maclennan et al. (2005) using themethods of Maclennan et al. (2004). Upper bounds on the cooling rate in the lower crust are given by ko=2×10
−14 model of Cherkaoui et al. (2003, Fig. 10). Dashedblack line is the cooling rate determined from isotherms by Dunn et al. (2000). Data from this study (solid blue circles) fit well within the bounds of numerical andgeophysical models, in contrast to the data from Coogan et al. (2002) (solid red squares), which fall outside the lower bounds for cooling. See the text for calculation ofcooling rates from model outputs.
79J.A. VanTongeren et al. / Earth and Planetary Science Letters 267 (2008) 69–82
Author's personal copy
Cooling rates for the geophysical model of Dunn et al. (2000;Fig. 10 b) were calculated by digitizing the figure and mea-suring the distance from the 1200 °C isotherm to the 800 °Cisotherm and multiplying by the 9'30N EPR half spreading rate(55 mm/year). The 800 °C isotherm was chosen in this casebecause the 700 °C isotherm does not extend to Moho depths.Cooling rate calculations based on Ca in olivine data from thisstudy are systematically slightly faster than cooling rates basedon thermal gradients reported by Dunn et al. (2000) for fastspreading ridges (Fig. 7). We are not aware of a comparable dataset for intermediate-spreading ridges.
5.3. The role of hydrothermal circulation in the lower crust
As previously mentioned, hydrothermal circulation extend-ing to the base of the crust is required to cool the lower crust atroughly the same rate at all depths. There have been manystudies on the extent of hydrothermal circulation throughout thelower crust at the EPR and in the Oman ophiolite (see Section2.3 for discussion). Data presented in this study (Fig. 4) requiresignificant hydrothermal circulation to Moho depths at inter-mediate-fast spreading ridges, such as the Oman paleo-ridge.The sheeted sill model is therefore a thermally viable mech-anism for crustal accretionary processes at mid ocean ridges.While the conclusions presented here do not rule out the pos-sibility of accretion by gabbro glacier, they do contradict theinitial tenet of the gabbro glacier model – convective heat lossby hydrothermal circulation can penetrate to Moho depths andcrystallization is not, by necessity, constrained to the uppercrust.
5.4. Comparison with present day ridges
The trend seen in cooling rates closely follows the trendexhibited by Ca in olivine analyses for this study (Fig. 4). Ittherefore may be possible to infer relative cooling rates frompreviously published data without detailed knowledge of grainsizes in order to compare cooling rates between fast and slowspreading ridges. Previously published olivine mineral ana-lyses in lower gabbros at Hess Deep (EPR), the SouthwestIndian Ridge (SWIR), and the Mid Atlantic Ridge (MAR andMARK, Kane fracture zone) are presented in Fig. 8. Theredoes not appear to be any correlation between spreading rateand cooling rates of these gabbros as inferred from Ca inolivine. This could be a result of imprecise measurement byother studies relative to this one. Also, another potentialcomplication associated with this comparison could arise fromimprecise estimates of the igneous crystallization depth fromdredged samples.
5.5. Comparison with other tectonic regimes
Following the same logic as in Section 5.4, application of theCa-in-olivine geospeedometer to other tectonic regimes showsdistinct differences between mid ocean ridges, arcs, and layeredintrusions, as well as oceanic mantle (Fig. 8). As mentioned inSection 4, Calcium content in olivine in gabbros in this study is
systematically higher than Ca in olivine in the underlyingmantle section (Fig. 4). Gabbros from all mid- ocean ridgesappear to cool more quickly than those from layered intrusions,such as the Bushveld Complex. In addition, arc lower crustrecords slower cooling than oceanic lower crust and layeredintrusions, and has similar cooling rates to Oman ophioliteupper mantle.
6. Conclusions
Data presented here show no systematic variation of cool-ing rate with depth in the crustal section, and are thus in-consistent with conductive cooling models. Instead, the dataindicate that hydrothermal cooling extended to the base of thecrust within a few km of the ridge axis during formation ofthe Khafifah section in the Wadi Tayin massif of the Omanophiolite.
Our results differ from a previous study of Ca in olivine inthe lower crust in the Wadi Abyad section in the Nakhl massifof the Oman ophiolite by Coogan et al. (2002). Data of Cooganet al. (2002) extend to cooling rates slower than predicted ina purely conductive cooling model. The reason for this is un-clear, however, it may be due to polygenetic magmatism andretrograde metamorphism of the base of the Wadi Abyad crust-al section, or may arise from uncertainties in the characteri-zation of Do. Nonetheless, the range of values reported in thisstudy for cooling rates in the lower crust is consistent withthe range determined from both numerical and geophysicalobservations, whereas the range of values reported by Cooganet al. is more than two orders of magnitude larger. For thisreason, we suggest more confidence be placed in the resultspresented in this study for cooling rates in the lower crust ofthe Oman paleo-ridge and, by proxy, all intermediate- to fast-spreading ridges.
The near-uniform cooling rates seen in our data suggest thathydrothermal circulation is an effective mechanism for heat lossduring the formation of the entire lower oceanic crust. Mostof the cooling rates for the lower crust measured in this studylie within the bounds of numerical calculations based on acombination of conductive and convective cooling. A numberof our samples, however, record cooling rates faster than inmodels that include vigorous hydrothermal convection to thebase of the crust. This may be due to emplacement of sillswithin previously cooled gabbroic rocks within a few km of theridge axis. In this regard, our data are more consistent with thesheeted sill model for lower crust formation. Indeed, given thepotential for igneous crystallization and solidification through-out a hydrothermally cooled lower crust, ductile flow of amagma mush, as required for the gabbro glacier model, seemscomparatively unlikely.
Acknowledgments
The authors would like to thank C. MacLeod and J.Maclennan for their helpful and insightful reviews, as well asL.A. Coogan for providing inter-laboratory standards. J.V.T.thanks C. Mandeville for help with initial data collection, as well
80 J.A. VanTongeren et al. / Earth and Planetary Science Letters 267 (2008) 69–82
Author's personal copy
as E.A. Mathez, and S. Goldstein for insightful discussions.Research was supported by NSF research grants OCE-0426160,OCE 0242233 and EAR-9910899. Lamont-Doherty EarthObservatory publication number 7110.
Appendix A. Supplementary data
Supplementary data associated with this article can be found,in the online version, at doi:10.1016/j.epsl.2007.11.034.
References
Alabaster, T., Pearce, J.A., Malpas, J., 1982. The volcanic stratigraphy andpetrogenesis of the Oman ophiolite complex. Contrib. Mineral. Petrol. 81,168–183.
Alt, J.C., Bach, W., 2006. Oxygen isotope composition of a section of loweroceanic crust, ODP Hole 735B. Geochem. Geophys. Geosys. 7.
Arai, S., Kadoshima, K., Morishita, T., 2006. Widespread arc-related melting inthe mantle section of the northern Oman ophiolite as inferred from detritalchromian spinels. J. Geol. Soc. 163, 869–879.
Bosch, D., Jamais, M., Boudier, F., Nicolas, A., Dautria, J.-M., Agrinier, P.,2004. Deep and high-temperature hydrothermal circulation in the Omanophiolite — petrological and isotopic evidence. J. Petrol. 45, 1181–1208.
Boudier, F., Coleman, R.G., 1981. Cross-section through the peridotite in theSamail Ophiolite, Southeastern Oman Mountains. J. Geophys. Res. 86,2573–2592.
Boudier, F., Nicolas, A., Ildefonse, B., 1996. Magma chambers in the Omanophiolite: fed from the top or the bottom? Earth Planet. Sci. Lett. 144,239–250.
Braun, M.G., Petrologic and microstructural constraints on focused melttransport in dunites and the rheology of the shallow mantle, Ph.D., JointProgram in Oceanography/Applied Ocean Science and Engineering(Massachusetts Institute of Technology, Dept. of Earth, Atmospheric, andPlanetary Sciences; and the Woods Hole Oceanographic Institution), 2004.
Buck, W.R., 2000. Can downward flow of dense cumulate slurry through mushyupper gabbros produce lower gabbros at a fast-spreading center? In: Dilek,Y., Moores, E.M., Elthon, D., Nicolas, A. (Eds.), Ophiolites and OceanicCrust: New Insights from Field Studies and the Ocean Drilling Program,Geological Society of America Special Paper, vol. 349. Geological Societyof America (GSA), Boulder, Colorado, pp. 121–127.
Cannat, M., 1996. How thick is the magmatic crust at slow spreading oceanicridges? J. Geophys. Res. 101, 2847–2857.
Carbotte, S.M., Ryan, W.B.F., Jin, W., Cormier, M.H., Bergmanis, E., Sinton, J.,White, S., 2003. Magmatic subsidence of the East Pacific Rise (EPR) at18 degrees 14' S revealed through fault restoration of ridge crest bathymetry.Geochem. Geophys. Geosys. 4.
Chen, Y.J., 2001. Thermal effects of gabbro accretion from a deeper secondmelt lens at the fast spreading East Pacific Rise. J. Geophys. Res. 106,8581–8588.
Cherkaoui, A.S.M., Wilcock, W.S.D., Dunn, R.A., Toomey, D.R., 2003. Anumerical model of hydrothermal cooling and crustal accretion at a fastspreading mid-ocean ridge. Geochem. Geophys. Geosys. 4.
Collier, J.S., Singh, S.C., 1997. Detailed structure of the top of the melt bodybeneath the East Pacific Rise at 9 degrees 40'N from waveform inversion ofseismic reflection data. J. Geophys. Res. 102, 20287–20304.
Coogan, L., Jenkin, G.R.T., Wilson, R.N., 2002. Constraining the cooling rate ofthe lower oceanic crust: a new approach applied to the Oman ophiolite. EarthPlanet. Sci. Lett. 199, 127–146.
Coogan, L.A., Hain, A., Stahl, S., Chakraborty, S., 2005. Experimentaldetermination of the diffusion coefficient for calcium in olivine between900 degrees C and 1500 degrees C. Geochim. Cosmochim. Acta 69,3683–3694.
Coogan, L.A., Howard, K.A., Gillis, K.M., Bickle, M.J., Chapman, H., Boyce,A.J., Jenkin, G.R.T., Wilson, R.N., 2006. Chemical and thermal constraintson focussed fluid flow in the lower oceanic crust. Amer. J. Sci. 306,389–427.
Crawford, W.C., Webb, S.C., 2002. Variations in the distribution of magma inthe lower crust and at the Moho beneath the East Pacific Rise at 9 degrees–10 degrees N. Earth Planet. Sci. Lett. 203, 117–130.
Crawford, W.C., Webb, S.C., Hildebrand, J.A., 1999. Constraints on melt in thelower crust and Moho at the East Pacific Rise, 9 degrees 48' N, usingseafloor compliance measurements. J. Geophys. Res. 104, 2923–2939.
Dalton, J.A., Lane, S.J., 1996. Electron microprobe analysis of Ca in olivineclose to grain boundaries: the problem of secondary X-ray fluorescence.Am. Mineral. 81, 194–201.
Detrick, R.S., Buhl, P., Vera, E., Mutter, J., Orcutt, J., Madsen, J., Brocher, T.,1987. Multi-channel seismic imaging of a crustal magma chamber along theEast Pacific Rise. Nature 326, 35–41.
Dick, H.J.B., Ozawa, K., Meyer, P.S., Niu, Y., Robinson, P.T., Constantin, M.,Hebert, R., Maeda, J., Natland, J.H., Hirth, J.G., Mackie, S.M., 2002.Primary silicate mineral chemistry of a 1.5-km section of very slowspreading lower ocean crust: ODP Hole 735B, Southwest Indian Ridge.In: Natland, J.H., Dick, H.J.B., Miller, D.J., Von Herzen, R.P. (Eds.),Proc. ODP, Sci. Results, vol. 176. College Station, TX (Ocean DrillingProgram), pp. 1–60.
Dodson, M.H., 1973. Closure temperature in cooling geochronological andpetrological systems. Contrib. Mineral. Petrol. 40, 259–274.
Dunn, R.A., Toomey, D.R., Solomon, S.C., 2000. Three-dimensional seismicstructure and physical properties of the crust and shallow mantle beneath theEast Pacific Rise at 9 degrees 30'N. J. Geophys. Res. 105, 23537–23555.
Ehlers, K., Powell, R., Stuwe, K., 1994. Cooling rate histories from garnet+biotite equilibrium. Am. Mineral. 79, 737–744.
Fisher, A.T., 1998. Permeability within basaltic oceanic crust. Rev. Geophys. 36,143–182.
Garrido, C.J., Kelemen, P.B., Hirth, G., 2001. Variation of cooling rate withdepth in lower crust formed at an oceanic spreading ridge: plagioclasecrystal size distributions in gabbros from the Oman ophiolite. Geochem.Geophys. Geosys. 2.
Gregory, R.T., Taylor, H.P., 1981. An oxygen isotope profile in a section ofCretaceous oceanic crust, Samail Ophiolite, Oman: evidence of del18Obuffering of the oceans by deep (N5 km) seawater-hydrothermal circulationat mid-ocean ridges. J. Geophys. Res. 86, 2737–2755.
Hanghoj, K., Kelemen, P.B., Hassler, D., Rudnick, R., Godard, M., Walker, R.,in preparation. Composition and genesis of depleted mantle peridotites fromthe wadi tayin massif, Oman ophiolite. Major and trace elementgeochemistry, and Os isotope and PGE systematics.
Harding, A.J., Orcutt, J., Kappus, M., Vera, E., Mutter, J., Buhl, P., Detrick,R., Brocher, T., 1989. The structure of young oceanic crust at 13N on theEast Pacific Rise from expanding spread profiles. J. Geophys. Res. 94,12163–12196.
Henstock, T.J., Woods, A.W., White, R.S., 1993. The accretion of oceanic-crustby Episodic Sill intrusion. J. Geophys. Res. 98, 4143–4161.
Hooft, E.E.E., Detrick, R.S., Kent, G.M., 1997. Seismic structure and indicatorsof magma budge along the southern East Pacific Rise. J. Geophys. Res. 102,27319–27340.
Hussenoeder, S.A., Collins, J.A., Kent, G.M., Detrick, R.S., Harding, A.J.,Orcutt, J.A., Mutter, J.C., Buhl, P., 1996. Seismic analysis of the axialmagma chamber reflector along the southern East Pacific Rise fromconventional reflection profiling. J. Geophys. Res. 101, 22087–22105.
Jurewicz, A.J.G., Watson, E.B., 1988. Cations in olivine, Part 2: diffusion inolivine xenocrysts, with applications to petrology and mineral physics.Contrib. Mineral. Petrol. 99, 186–201.
Juteau, T., Ernewein, M., Reuber, I., Whitechurch, H., Dahl, R., 1988a. Dualityof magmatism in the plutonic sequence of the Sumail nappe, Oman.Tectonophysics 151, 107–135.
Juteau, T., Beurrier, M., Dahl, R., Nehlig, P., 1988b. Segmentation at a fossilspreading axis: the plutonic sequence of the Wadi Haymiliyah area (haylaynblock, Sumail Nappe, Oman). Tectonophysics 51, 167–197.
Kawahata, H., Nohara, M., Ishizuka, H., Hasebe, S., Chiba, H., 2001. Sr isotopegeochemistry and hydrothermal alteration of the Oman ophiolite.J. Geophys. Res. 106, 11083–11099.
Kelemen, P.B., Aharonov, E., 1998. Periodic formation of magma fractures andgeneration of layered gabbros in the lower crust beneath oceanic spreadingridges. Geophys. Monograph. AGU 106, 267–289.
81J.A. VanTongeren et al. / Earth and Planetary Science Letters 267 (2008) 69–82
Author's personal copy
Kelemen, P.B., Koga, K., Shimizu, N., 1997. Geochemistry of gabbro sills in thecrust/mantle transition zone of the Oman ophiolite: Implications for theorigin of the oceanic lower crust. Earth Planet. Sci. Lett. 146, 475–488.
Kohler, T.P., Brey, G.P., 1990. Calcium exhange between olivine andclinopyroxene calibrated as a geothermometer for natural peridotites from2 to 60 kb with applications. Geochim. Cosmochim. Acta 54, 2375–2388.
Korenaga, J., Kelemen, P.B., 1998. Melt migration through the oceanic lowercrust: a constraint from melt percolation modeling with finite solid diffusion.Earth Planet. Sci. Lett. 156, 1–11.
Korenaga, J., Kelemen, P.B., 1997. The origin of gabbro sills in the Mohotransition zone of the Oman ophiolite: Implications for magma transport inthe oceanic lower crust. J. Geophys. Res. 102, 27,729–727,749.
Lachize, M., Lorand, J.P., Juteau, T., 1996. Calc-alkaline differentiation trend inthe plutonic sequence of the Wadi Haymiliyah section, Haylayn massif,Semail ophiolite, Oman. Lithos 38, 207–232.
Lanphere, M.A., Coleman, R.G., Hopson, C.A., 1981. Sr Isotopic Tracer Studyof the Samail Ophiolite, Oman. J. Geophys. Res. 86, 2709–2720.
Lecuyer, C., Reynard, B., 1996. High temperature alteration of oceanic gabbrosby seawater (Hess Deep, Ocean Drilling Program Leg 147): evidence fromoxygen isotopes and elemental fluxes. J. Geophys. Res. 101, 15883–15897.
Lewis, B.T.R., Garmany, J.D., 1982. Constraints on the structure of the EastPacific Rise from Seismic refraction data. J. Geophys. Res. 87, 8417–8425.
Libourel, G., 1999. Systematics of calcium partioning between olivine andsilicate melt: Implications for melt structure and calcium content ofmagmatic olivines. Contrib. Mineral. Petrol. 136, 63–80.
Longhi, J., Walker, D., Hays, J.F., 1978. The distribution of Fe and Mg betweenolivine and lunar basaltic liquids. Geochim. Cosmochim. Acta 42, 1545–1558.
Maclennan, J., Hulme, T., Singh, S.C., 2004. Thermal models of oceanic crustalaccretion: Linking geophysical, geological and petrological observations.Geochem. Geophys. Geosys. 5.
Maclennan, J., Hulme, T., Singh, S.C., 2005. Cooling of the lower oceanic crust.Geology 33, 357–360.
MacLeod, C.J., Yaouancq, G., 2000. A fossil melt lens in the Oman ophiolite:implications for magma chamber processes at fast spreading ridges. EarthPlanet. Sci. Lett. 176, 357–373.
McCulloch, M.T., Gregory, R.T., Wasserburg, G.J., Taylor, H.P., 1981. Sm–Nd,Rb–Sr, and O–18–O–16 isotopic systematics in an oceanic crustal section—evidence from the Samail Ophiolite. J. Geophys. Res. 86, 2721–2735.
Mevel, G., Faidy, C., Prieur, D., 1996. Distribution, activity, and diversity ofheterotrophic nitrifiers originating from East Pacific deep-sea hydrothermalvents. Can. J. Microbiol. 42, 162–171.
Morioka, M., 1981. Cation diffusion in olivine-II. Ni–Mg, Mn–Mg, Mg and Ca.Geochim. Cosmochim. Acta 45, 1573–1580.
Morton, J.L., Sleep, N.H., 1985. A mid-ocean ridge thermal-model-constraintson the volume of axial hydrothermal heat-flux. J. Geophys. Res.-Solid EarthPlanets 90, 1345–1353.
Natland, J.H., Dick, H.J.B., 1996. Melt migration through high-level gabbroiccumulates of the East Pacific Rise at Hess Deep: the origin of magma lensesand the deep crustal structure of fast-spreading ridges. In: Mével, C., Gillis,K.M., Allan, J.F., Meyer, P.S. (Eds.), Proc. ODP, Sci. Results, vol. 147.College Station, TX (Ocean Drilling Program), pp. 21–58.
Nedimovic, M.R., Carbotte, S.M., Harding, A.J., Detrick, R.S., Canales, J.P.,Diebold, J.B., Kent, G.M., Tischer, M., Babcock, J.M., 2005. Frozen magmalenses below the oceanic crust. Nature 436, 1149–1152.
Nehlig, P., 1994. Fracture and permeability analysis in magma–hydrothermaltransition zones in the SamailOphiolite (Oman). J. Geophys. Res. 99, 589–601.
Nicolas, A., 1992. Kinematics in magmatic rocks with special reference togabbros. J. Petrol. 33, 891–915.
Nicolas, A., Reuber, I., Benn, K., 1988. A new magma chamber model based onstructural studies in the Oman ophiolite. Tectonophysics 151, 87–105.
Nicolas, A., Freydier, C., Godard, M., Vauchez, A., 1993. Magma chambers atoceanic ridges: How large? Geology 21, 53–56.
Nicolas, A., Boudier, E., Ildefonse, B., Ball, E., 2000. Accretion of Oman andUnited Arab Emirates ophiolite- Discussion of a new structural map Marine.Geophys. Res. 21, 147–179.
Nicolas, A., Mainprice, D., Boudier, F., 2003. High-temperature seawatercirculation throughout crust of oceanic ridges: A model derived from theOman ophiolites. J. Geophys. Res. 108.
Ozawa, K., 1984. Olivine-Spinel Geospeedometry — analysis of diffusion-controlled Mg–Fe-2+exchange. Geochim. Cosmochim. Acta 48, 2597–2611.
Pallister, J.S., Hopson, C.J., 1981. Samail ophiolite plutonic suite: fieldrelations, phase variation, cryptic variation and layering, and a model of aspreading ridge magma chamber. J. Geophys. Res. 86, 2593–2644.
Pallister, J.S., Knight, R.J., 1981. Rare-earth element geochemistry of the Samailophiolite near Ibra, Oman. J. Geophys. Res. 86, 2673–2697.
Pearce, J.A., Alabaster, T., Shelton, A.W., Searle, M.P., 1981. The Omanophiolite as a cretaceous arc-basin complex: evidence and implications.Philos. Trans. R. Soc. Lond. A 300, 299–317.
Phipps Morgan, J., Chen, Y.J., 1993. The genesis of oceanic crust-magmainjection, hydrothermal cooling, and crustal flow. J. Geophys. Res. 98,6283–6297.
Quick, J.E., Denlinger, R.P., 1993. Ductile deformation and the origin of layeredgabbro in ophiolites. J. Geophys. Res. 98, 14015–14027.
Roeder, P., 1974. Activity of iron and olivine solubility in basaltic liquids. EarthPlanet. Sci. Lett. 23, 397–410.
Schouten, H., Denham, C., 1995. Virtual ocean crust. EOS Trans. AGU 76, S48.Singh, S., Kent, G.M., Collier, J.S., Harding, A.J., Orcutt, J.A., 1998. Melt to
mush variations in crustal magma properties along the ridge crest at thesouthern East Pacific Rise. Nature 394, 874–878.
Singh, S., Collier, J.S., Harding, A.J., Kent, G.M., Orcutt, J.A., 1999. Seismicevidence for a hydrothermal layer above the solid roof of the axial magmachamber at the southern East Pacific Rise. Geology 27, 219–222.
Singh, S.C., Harding, A.J., Kent, G.M., Sinha, M.C., Combier, V., Bazin, S.,Tong, C.H., Pye, J.W., Barton, P.J., Hobbs, R.W., White, R.S., Orcutt, J.A.,2006. Seismic reflection images of the Moho underlying melt sills at the EastPacific Rise. Nature 442, 287–290.
Smewing, J.D., 1981. Mixing characteristics and compositional differences inmantle-derived melts beneath spreading axes: evidence from cyclicallylayered rocks in the ophiolite of North Oman. J. Geophys. Res. 86,2645–2660.
Stahl, S., Hain, A., Chakraborty, S., Laqua, W., Palme, H., 1998. Tracerdiffusion of 42Ca in olivine as a function of composition and pO2 between800 and 1500 degrees C. EOS Trans. AGU 79, 5370.
Stakes, D., Vanko, D.A., 1986. Multistage hydrothermal alteration of gabbroicrocks from the failed mathematician ridge. Earth Planet. Sci. Lett. 79,75–92.
Tamura, A., Arai, S., 2006. Harzburgite-dunite-orthopyroxenite suite as a recordof supra-subduction zone setting for the Oman ophiolite mantle. Lithos 90,43–56.
Tilton, G.R., Hopson, C.A., Wright, J.E., 1981. Uranium-lead isotopic ages ofthe Samail Ophiolite, Oman, with applications to Tethyan ocean ridgetectonics. J. Geophys. Res. 86, 2763–2775.
Toomey, D.R., Purdy, G.M., Solomon, S., Wilcock, W., 1990. The threedimensional seismic velocity structure of the East Pacific Rise near latitude 930N. Nature 347, 639–644.
Vera, E.E., Mutter, J.C., Buhl, P., Orcutt, J.A., Harding, A.J., Kappus, M.E.,Detrick, R.S., Brocher, T.M., 1990. The Structure of 0-My to 0.2-MyOld Oceanic–Crust at 9-Degrees-N on the East Pacific Rise fromexpanded spread profiles. J. Geophys. Res.-Solid Earth Planets 95,15529–15556.
Werner, C.-D., Pilot, J., 1997. Data report: geochemistry and mineral chemistryof ultramafic rocks from the Kane area (MARK). In: Karson, J.A., Cannat,M., Miller, D.J., Elthon, D. (Eds.), Proc. ODP, Sci. Results, vol. 153. CollegeStation, TX (Ocean Drilling Program), pp. 457–470.
82 J.A. VanTongeren et al. / Earth and Planetary Science Letters 267 (2008) 69–82