Embed Size (px)
Citation preview
JOURNAL OF MAGNETIC RESONANCE 79,236-254 (1988)
Convolution Spectral Imaging
MICHAEL D. COCKMAN*,~ AND THOMAS H. MARECI?$
*Department of Chemistry, tDepartment ofRadiology, and SDepartment ofphysics, University of Florida, Gainesville, Florida 32610
Received September 16, 1987; revised January 19,1988
A new method of spectral imaging is introduced. It is based on a well-known three- dimensional chemical-shift imaging technique in which spatial and chemical-shift data are collected separately. The new method, however, mixes spectral information into each spatial dimension. This is accomplished in part by requiring that the magnitude of the controlled inhomogeneity introduced by the applied gradients be smaller than the magni- tude of the inherent inhomogeneity which gives rise to the chemical-shift phenomenon. This has the benefit of producing a greater signal-to-noise ratio than techniques in which the spectral information is obliterated by large applied gradients. A second requirement of the new method is that the length of a time delay, during which chemical-shift encod- ing occurs, and the amplitude of a gradient, during which spatial encoding occurs, are changed in concert with each other. This simultaneous stepping in the encoding dimen- sion and reduced applied gradient amplitudes in each dimension have the effect of creat- ing modulation functions whose Fourier transforms are the convolutions of functions of spatial position and spectral frequency. The new technique is therefore called “convolu- tion spectral imaging.” Because the spectral information does not comprise a separate dimension of a data set, a reduction in the number of dimensions required for acquisition and display occurs. This reduces both measurement time and processing requirements. Convolution spectral imaging is most effective when the spectral resonances of the sam- ple are well-separated and when the sample dimensions are small. Thus the technique may be best suited for microscopic NMR imaging at high magnetic field strengths. 0 1988 Academic Press, Inc.
INTRODUCTION
One of the challenges of NMR imaging is the simultaneous collection of spatial and spectral information. Here we will not be concerned with the acquisition of spectra corresponding to individual spatial positions (I). Rather, we will be addressing meth- ods of acquiring spatial maps corresponding to individual spectral resonances. Aue (I), Brateman (2), and Brady and coauthors (3) have reviewed many of these. The methods fall into two broad categories. One includes selective techniques in which a single resonance is chosen as the source of the spectral information contained in an image (4-9). Most of these require a separate measurement for each resonance of interest, an obvious disadvantage if several resonances are to be examined and time is at a premium. Nonselective methods circumvent this problem by obtaining spatial information simultaneously for every spectral resonance (10-13). The majority of these are Fourier imaging methods. Most encode the entire spectrum, which may include spin-spin coupling information, by allowing free precession in the absence of applied gradients. Fourier transformation with respect to the precession period
0022-2364188 $3.00 Copyright 0 1988 by Academic Press, Inc. All rights of reproduction in any form resewed.
236

CONVOLUTION SPECTRAL IMAGING 231
produces the spectrum which can be correlated with the spatial information encoded during other time periods in the pulse sequence. A potential disadvantage of these methods is that, in acquiring data from the entire spectrum, regions which do not contain resonances must be sampled, resulting in some amount of unused data ma- trix. Also the sampling of spectral as well as spatial information necessitates a longer total acquisition time. Sensitivity to B0 inhomogeneity is common to both categories of spectral imaging methods. When variations in the main field cause spectral reso- nances to broaden to the point of overlap, clean separation of spatial images as a function of spectral frequency can become difficult or impossible.
The new techniques described below are nonselective. They too are sensitive to main field inhomogeneity. However, they differ from other techniques in their cate- gory in that the number of dimensions required for image acquisition and display equals the number required to define the spatial image. For example, a three-dimen- sional experiment in which the information from each of two spatial dimensions and the spectral information are collected separately may be compressed into a two- dimensional experiment. This is accomplished by including the spectral information with the spatial dimensions rather than letting the spectrum comprise a separate di- mension.
METHOD
Our method is related to the three-dimensional method of Sepponen and co-work- ers (13), in which a frequency-encoding gradient generates information from one spatial dimension during data acquisition and a stepped phase-encoding gradient generates information from a second spatial dimension. A stepped time interval in the absence of gradients generates information from a spectral dimension. Spin-spin coupling information is not present since the start of acquisition occurs at a fixed time after the initial a/2 excitation pulse (14). The magnitude of the time increment by which the interval is stepped determines the magnitude of the spectral width. For each step in the variation of the phase-encode gradient, the time interval is stepped a number of times equal to the desired number of points in the spectral dimension. The time interval is then reset to its initial value and the phase-encode gradient is stepped to its next value. A complete cycle of time interval stepping is repeated for each phase-encode gradient step. Thus the technique defines a three-dimensional data matrix consisting of two spatial dimensions and one spectral dimension.
In our technique, however, the phase-encode gradient amplitude and the time in- terval are stepped simultaneously. The result of this process is a phase modulation of the acquired signal as a function of both spatial and spectral details of the object imaged. This phase modulation is the product of two phase modulations which we first examine separately. For a single spin, the phase modulation function corre- sponding to the gradient stepping has the form
h(k,, To) = @+o, ill where k, is a function of the applied gradient magnitude and r. is the position of the spin in r space. The function k, has the form
k, =
238 COCKMAN AND MARECI
where y is the gyromagnetic ratio, g,(t) is a function describing the time-dependent amplitude of the applied gradient, and 7 is the time during which the gradient is applied. In general, for a distribution of spins in r space, S(Q), the modulated signal has the form
[31
where R expresses the limits of integration imposed by the extent of the spin distribu- tion in r space. The phase modulation function corresponding to the stepping of the time interval has the form
h’@,) vo) = pvo, 141 where v. is the resonance frequency of the spin and tl is the time during which free precession occurs in the absence of gradients. In general, for a spectral distribution of spins, S’(V,), the modulated signal can be expressed by
s’(t1) = s WO)h’@l , ~OWO, Jv [51
where JV expresses the limits of integration imposed by the extent of the spectral distribution. If one takes FT to mean “the Fourier transform of,” then ideally
F-w%)1 = SVO) 161 FT[s'(t,)] = S'(Y,). [71
In the convolution spectral imaging technique, the amplitude of the phase-encode gradient and the time interval are stepped simultaneously. Thus k, and t, are related by a constant, a:
tl = ak,. PI The resulting doubly modulated signal may be expressed by the product of Eq. [3] and Eq. [5]. By the convolution theorem (15), the Fourier transform of this product is the convolution of the spatial and spectral spin distributions. The transform may be mapped into frequency space in which case the spatial spin distribution appears as a function of frequency scaled by u. Denoting the convolution by an asterisk and using Eq. [8], the Fourier transform can be written
FT[s(k,).s’(tl)] = a[S(avo)*S’(v,,)]. [91
Alternatively, the Fourier transform of the product may be mapped into I space. The spectral spin distribution appears as a function of spatial position scaled by the inverse of a:
1 F”Mk,)~.W~ >I = - LWo)*Wd~)l. a 1101
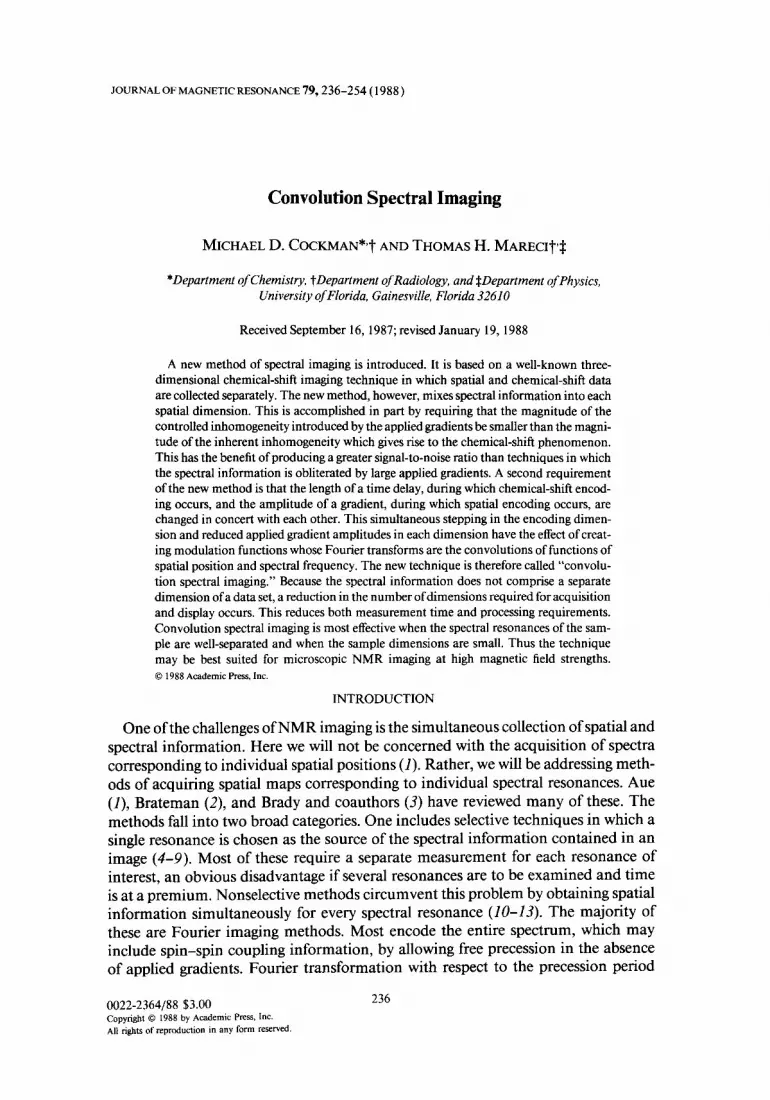
Each of the convolution functions shown in Eqs. [9] and [lo] is the spatial distribu- tion of the sample spins offset by their spectral resonance frequencies or vice versa. A plot of one of these functions for a hypothetical two-compartment phantom con-

CONVOLUTION SPECTRAL IMAGING 239
aining two different chemical species is shown in Fig. la. One may see that the func- tion is simply the convolution of the r space information shown in Fig. lb with the spectrum shown in Fig. lc. Another way of viewing Fig. la is as a series of spectral frequencies, each of which has an identical spatial field of view spread around it. The origin in spatial coordinates for a particular chemical species coincides with its spec- tral frequency. Any spatial offset of a nucleus from the origin appears as an offset from its spectral frequency. This convolution has led us to name our imaging technique “convolution spectral imaging.” The idea is analogous to the accordion experiment of Bodenhausen and Ernst (16) and the three-frequency experiment of Bolton (I 7). The convolution of a spatial axis and the zero-quantum spectrum has been accom- plished recently in a similar manner by Hall and Norwood (18).
Although Eqs. [9] and [lo] were derived for phase encoding, the mathematics are similar for frequency encoding. The two processes differ in that free precession, which is the source of spectral information, occurs in the presence of a gradient during fre- quency encoding. The result is still a doubly modulated signal, and Eqs. [9] and [lo] are valid. Equations [9] and [lo] represent the origin of the “chemical-shift artifact” (I 9, 20) observed when a gradient applied during signal acquisition is too weak to obliterate the separation between spectral resonances.
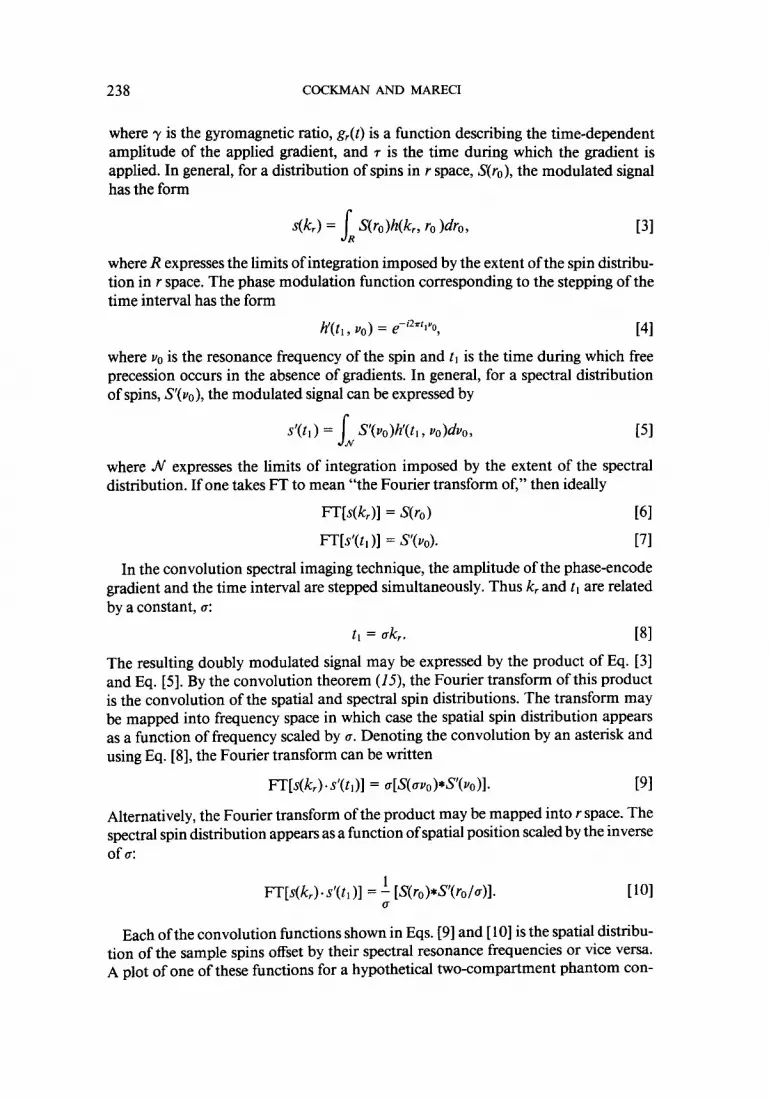
The pulse sequence for the acquisition of a two-dimensional convolution spectral image is shown in Fig. 2a. The interval between the initiation of the pulse sequence
b)
- t
-r
A/2
+
B/2
a)
“A 0 %I
-r
-
-
B
cl
-i I I I
b 1 I I I I 1 r “A 0 “B
0 r -r 0 r
FIG. 1. The convolution of spectral and spatial information. (a) The convolution of the spatial and spectral information shown in (b) and (c), respectively. (b) The spatial profile of a pair of vessels containing differing amounts oftwo molecular species, A and B. (c) The spectrum corresponding to (b).

240 COCKMAN AND MARECI
a) selective d2
t+w+- * - t,/2 t t2 __cI
k-+-T-d acq 1
.TE -
.TR 1
b) x.12 R
RF
gfe lCLFL
gwl 11
~ts~+t,12+*~2 - t,/2+T/2 - t,/P+- t,-+j

CONVOLUTION SPECTRAL IMAGING 241
at successive phase-encode steps, TR, is kept constant. The time to the echo forma- tion, TE, is also kept constant; thus, the T2 relaxation weightings of the phase-encod- ing steps are equivalent. Phase encoding of spectral information is accomplished by moving the 7~ pulse through the window labeled T by incrementing tl by an amount At, in a stepwise fashion.
The implementation of the pulse sequence of Fig. 2a with the frequency-encode gradient, gf,, defined as the z gradient, and the phase-encode gradient, g,, defined as the x gradient, would result in a z, v, versus x, V, image, where z and x define the spatial axes and v, and v, define the impressed spectral information. Each planar zx image corresponding to a spectral resonance will lie on a diagonal passing through the origin if the sample is centered on the crossing point of the z and x axes. The planar images will be located on a diagonal parallel to that passing through the origin if the sample is spatially offset from this crossing point. The center of each image will be separated from that of its chemically shifted neighbor along the diagonal by the chemical-shift difference of the two species multiplied by a scaling factor. If the spec- tral widths convolved with each spatial dimension were identical, this scaling factor would equal (2)“‘.
Like other nonselective spectral imaging methods, convolution spectral imaging techniques collect data from all regions of the spectrum including those which do not contain resonances. The advantage lies in the ability to compress three dimensions of data into two for planar spectral imaging or four dimensions into three for volume spectral imaging with a corresponding saving in total acquisition and processing time. We will show that the techniques optimize the available signal-to-noise ratio and are best suited for small samples whose frequency spectra are composed of well-separated resonances. Thus convolution spectral imaging may be most applicable to the field of microscopic NMR imaging.
EXPERIMENTAL
All experiments were carried out using a General Electric CSI-2 NMR imaging spectrometer equipped with a 2 T Oxford Instruments superconducting magnet with a 3 1 cm clear bore diameter. With shim and gradient coils installed, the working clear bore was reduced to a 23 cm diameter. The maximum attainable gradient strength was 0.03 mT mm-‘. The RF coil was a homebuilt slotted tube resonator with a length of 80 mm and a diameter of 56 mm with an effective RF magnetic field over a length
FIG. 2. (a) The pulse sequence of two-dimensional convolution spectral imaging. The timing of the sequence and the labels given to the various timing intervals are indicated at the bottom. The nonselective ?r pulse is moved through the window labeled T by an amount, At,, in a series of M steps at the same time as the amplitude of the phase-encode gradient, gW , is varied stepwise. RF = radiofrequency transmitter, grc = frequency-encode gradient, g, = phase-encode gradient, gd = slice gradient, acq = data acquisition. (b) The pulse sequence for three-dimensional convolution spectral imaging. The nonselective r pulse is moved through the window labeled T by an amount, At,, for each of a series of M steps at the same time that the amplitude of the phase-encode gradient, gW, , is varied stepwise. The ?r pulse is then moved through the window by an amount, A&, for each L step as the amplitude of the phase-encode gradient, g,,, is changed simultaneously. The cycle of M phase-encode steps is repeated for each L step. g,, = phase- encode gradient (A4 steps), g,, = phase-encode gradient (L steps), all other abbreviations as in (a).
242 COCKMAN AND MARECI
of 40 mm. It could be tuned to both ‘H and i9F frequencies. The pulse sequences used are shown in Fig. 2. Quadrature detection was employed in all experiments. Slice selectivity was used if the spectral resonances of the sample were sufficiently close that the application of a strong gradient during slice selection could obliterate the frequency separation. Otherwise, the entire sample volume was excited. A selec- tive sine-shaped 7r/2 RF pulse was used to select slices for all ‘H images. The ?r/2 RF pulse was nonselective in all 19F imaging experiments. All 7r pulses were nonselective. To reduce truncation artifacts, it was ensured that the echoes corresponding to the middle steps in the phase-encoding process were centered in the acquisition window. In most cases, the values of TR and TE were chosen such that very little relaxation attenuation was allowed.
The effects of imperfect K pulses and dc imbalance between the quadrature chan- nels were corrected by using a two-step phase cycle during signal averaging impressed on the 7r/2 pulse and receiver. This phase cycle had the effect of canceling out artifacts due to magnetization which was not phase-encoded. However, as pulse repetition times were decreased for more rapid image data acquisition, the ability of the cycle to suppress artifacts was diminished. Residual artifacts appeared at the midpoint of the phase-encoded axis and originated from non-steady-state magnetization which was not phase-encoded and instrumental errors causing dc offset. Therefore gradient proportional phase incrementation (GPPI) was added to the two-step phase cycle (21). This was designed to move these artifacts to the edges of the phase-encoded axis without increasing the image acquisition time by requiring signal averaging. Initially we wanted to impress GPPI on the n/2 pulse and the receiver to shift both types of artifact, but this was not allowed by the instrument design. Thus GPPI was impressed on the r pulse. This could shift only artifacts resulting from magnetization which had not been phase-encoded. Artifacts due to instrumental dc effects remained but were quite minimal. The phase cycle for the pulse sequence of Fig. 2a is shown in Table 1 and that for the sequence of Fig. 2b is shown in Table 2.
PRACTICAL ASPECTS OF THE METHOD
Convolution spectral imaging is most effective for small objects containing molecu- lar species with a spectrum of well-separated single peak resonances. The effectiveness of the method is enhanced if short phase-encode gradient times are employed. These conclusions become apparent if one considers the sources of signal modulation and makes the restriction that the frequency separation between spectral resonances is greater than the frequency spread caused by the applied gradients. This restriction is necessary to prevent the overlap of the spatial images composing the convolution spectral image. However, this restriction may be relaxed for certain sample geometries.
Consider a single spin, not spin-spin coupled to another, which is subjected to the two-dimensional technique of Fig. 2a, again letting z be the frequency-encode dimension and x be the phase-encode dimension. During the acquisition time, t2, the signal is modulated by the function
h”p)& t2) zz p+o+mz)%, 1111

CONVOLUTION SPECTRAL IMAGING 243
TABLE 1
Relative Pulse and Receiver Phases for the Two-Dimensional Convolution Spectral Imaging Technique”
Phases
Pulses
M Signal average *I2 7r Receiver
1 1 0 0 0 1 2 180 0 180
2 1 0 180 0 2 2 180 180 180
ii i 180 180 180
“Refer to the legend of Fig. 2a for the notation corresponding to this table.
where uO is the resonance frequency of the spin in hertz and m, = yG,r,/2a, where y is the gyromagnetic ratio in rad SC’ mT-‘, G, is the strength of the applied z gradient in mT mm-‘, and r, is the position of the spin in millimeters along the z direction. We have ignored the contribution of spin-spin coupling to this modulation function because it is usually obscured in the frequency-encode dimension by the effect of the applied gradients.
The signal is modulated differently during the combined time interval 7 + T, the relevant function having the form
h”‘(m,, t, , 7, T) = ,++‘,~,+~,7)~ e-h’,(T-7), [121 where v. has been previously defined and, assuming that the x gradient amplitude is constant during r, m, = yG,r,/2x. The parameters G, and r, are defined in analogy to the definitions of G, and r,. Free precession during (T - 7) appears in Eq. [ 121 as a phase-shift term which is constant because T and 7 are fixed. It will be ignored. How- ever, because Tis fixed, modulation by spin-spin coupling could appear as a constant term in Eq. [ 121. For two coupled spins with coupling constant J, the modulation represented by Eq. [ 121 would have an amplitude dependent on cos[?rJ(~ + T)] when the frequency-encode gradient is sufficient to cancel the antiphase multiplets. There- fore the choice of these time delays requires care for coupled spin systems. The contri- bution of spin-spin coupling to Eq. [ 121 will be ignored for the remainder of this discussion.
We now make the restriction that the frequency separation between resonances must be greater than the frequency spread caused by the applied gradients. By apply- ing this restriction to Eqs. [ 1 I] and [ 121 and including the effect of B. inhomogene- ities, it is found that the following inequalities must hold to obtain a convolution spectral image:
During t2 : IAvoI 3 IA&I = ]rG$,/27r] > ]yAB/27r]. [131

244 COCKMAN AND MARECI
TABLE 2
Relative Pulse and Receiver Phases for the Three-Dimensional Convolution Spectral Imaging Technique”
Phases
Pulses
L M Signal average *I2 * Receiver
0 0 180 0
0 180 180 180
0 180
0 180
L
M
1 1
2 2
M 2
180 180
0 180 180 180
0 0 180 0
180 0
180
0 180
0 180
180
“Refer to the legend of Fig. 2b for the notation corresponding to this table.
Here AVO is the frequency separation between spectral resonances, M, is the frequency spread across the object .of size R,, and AR is the largest linewidth in mT in the spectrum. For a fixed y and R,, this inequality states that the applied z gradient must be weak enough to prevent obliteration of the spectral information but strong enough to overcome main field inhomogeneity:
During T + T: I AVOW, > I 3 I (M,)T I > I yWAt, 10~ I. Wal Since y and the object size, R,, are constants for a particular spin distribution, one can write AM, = y(AGX)R,/2~. Substituting this into inequality [14a] and simplify- ing produces
IAvo] 3 > ]yAB/2a(. [14bl
Rearranging inequalities [ 131 and [ 14b] shows the limits of the applied gradient mag- nitudes in the frequency- and phase-encode dimensions:
For frequency encoding: I AB/R, I -c I G, I S I2?rAvo/yR, ] [ISI For phase encoding: I AB(Atl)/R,~ ] -C ) AG, I C ] 2*Avo(At1)/YRx~ I. 1161
Inequalities [ 151 and [ 161 express the conditions under which convolution spectral imaging is most effective. Inequality [ 161 will be satisfied as T, the duration of the
CONVOLUTION SPECTRAL IMAGING 245
phase-encode gradient, is reduced. This reduction allows a decrease in TE, shown in Fig. 2, thus reducing the attenuation of the acquired echo caused by transverse relax- ation processes. Another way to satisfy inequalities [ 151 and [ 161 is to simply use a sample whose spins are distributed over a small range; this allows a reduction in R, and R,. Inequalities [ 151 and [ 161 also indicate that a large spectral width is desirable, a condition which is determined by the nuclear spin system which is being imaged and the strength of the main magnetic field. Systems possessing large frequency sepa- rations between peaks require larger spectral bandwidths and are better able to satisfy [ 151 and [ 161. In summary, convolution spectral imaging experiments will be most effective at high field using small samples, indicating that the technique is most appli- cable to microscopic NMR imaging.
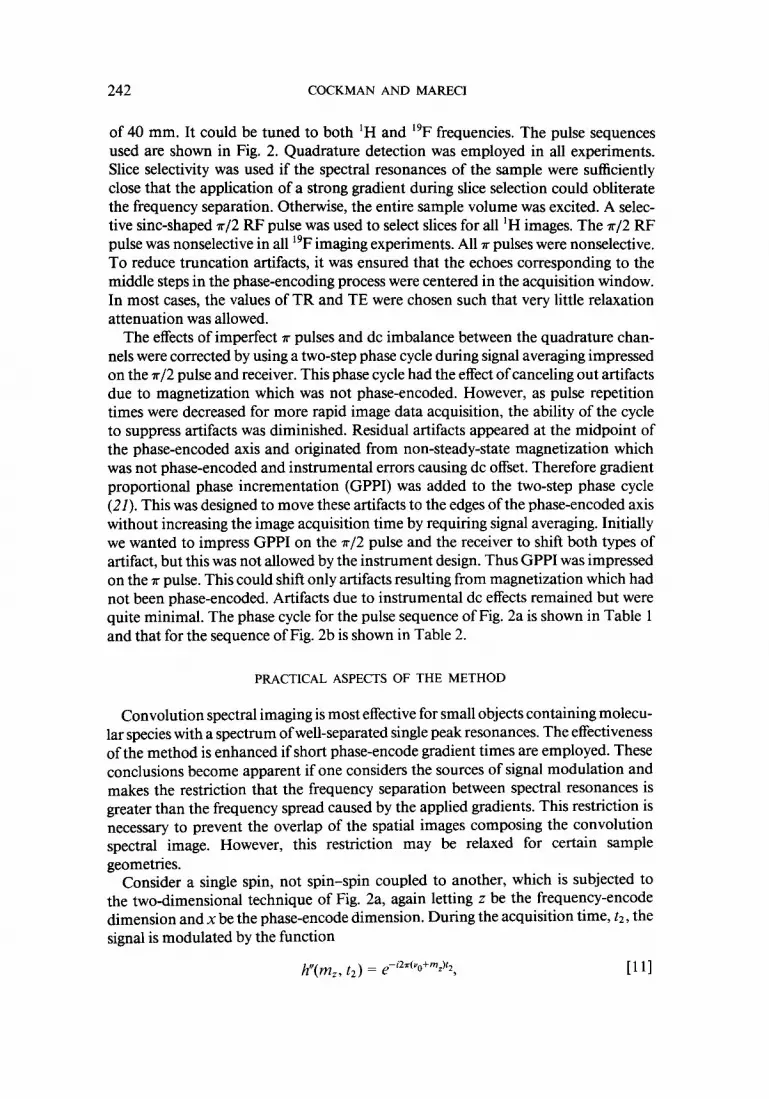
The effect of sample geometry. The diagonal through the centers of the spatial im- ages composing a convolution spectral image may be thought of as representing an exaggerated spectrum where the frequency differences between spectral resonances are multiplied by a factor greater than unity. This factor may be found using trigo- nometry and depends on both the number of spatial dimensions and the spectral widths convolved with them. For certain sample geometries, this exaggerated spectral resonance separation may be exploited to increase the spatial resolution of the convo- lution spectral image without destroying the spectral information. Figure 3a shows the spectrum of a mixture of hexafluorobenzene and hexafluoroacetone sesquihy- drate contained in a section of a 9 mm inside diameter NMR tube (Norell 1005) about 3 cm in length. The long axis of the tube was placed parallel to the y axis of the gradient coils. The transmitter frequency was placed between and equidistant from each of the two spectral frequencies of the sample liquid mixture. A convolution spectral image is shown in Fig. 3b. Its projection onto the x, uX axis is shown in Fig. 3c. Any spatial offset from a spectral frequency could be interpreted as a physical offset of the sample along the spatial axis. Had the sample been centered on the origin of the x axis, the center of the projection would be located at 0 Hz. Thus this projec- tion shows that the sample was slightly offset from the x-axis origin. The overlap of the two subimages in the projection is not seen in the two-dimensional image. This situation was possible because the sample was circular. This illustrates how a careful consideration of the sample geometry may be used to optimize the spatial resolution of a convolution spectral image while retaining spectral separation.
Convolving spectral and spatial information along the phase-encode direction be- comes more important as the ratio of sample length to width increases. Compared with a square sample of equal area, a long, thin sample requires fewer phase-encoding steps and more frequency-encoded points to maintain spatial resolution if the short axis lies along the phase-encoded direction. In this case it is best to allow complete separation of spatial and spectral information along the phase-encode axis using con- volution spectral imaging while allowing spectral and spatial information along the frequency-encode axis to overlap. This would produce an image similar to that pro- duced by conventional spin-echo imaging (22) if the frequency-encode gradient were weak and the object were rotated such that the short axis lay along the frequency- encode direction. However, this would not be optimum since more phase-encode steps would be required to maintain spatial resolution, which would significantly in- crease measurement time.

a)
Hexafluorobenrene - AV -
Hexafluoroacetone
sesquihydrate sesquihydrate
/ I b ’ ’ s I
-10000 -10000 -5000 -5000 0 0 5000 5000 10000 Hz 10000 Hz
b)
cl
L ,,‘,J_. 7 1 mm J X
FIG. 3. The effect of sample geometry. (a) The 19F spectrum of a mixture of hexafluorobenzene and hexafluoroacetone sesquihydrate contained in a single tube; AV = 6578 Hz. The corresponding 19F two- dimensional convolution spectral image is shown in (b). Its projection onto the x, V, axis is shown in (c). The image was obtained using the pulse sequence of Fig. 2a with the phase cycle of Table 1. The slice gradient was turned off and the selective ?r/2 pulse was replaced with a nonselective 7r/2 pulse. Parameters: Total time for acquisition = 8.5 min, N = 256, M = 128, TR = 2 s, TE = 30 ms. Resolution: z(fe) 84 rm/ point, vdfe) 78 Hz/point, -u(pe) 84 pm/point, VJpe) 78 Hz/point. The phase-encoded resolution re5ects the effect of zero-filling used in processing. Processing: Two-dimensional Fourier transformation, no apodi- ration, one zero-fill in the phase-encode dimension, magnitude display mode.
246

CONVOLUTION SPECTRAL IMAGING 247
The interaction of TE and the spatial resolution. Since the amplitude of the ac- quired echo can decrease as TE increases, the desire to conserve signal demands that TE be as short as possible. From Fig. 2a one sees that the minimization of TE is limited in part by the length of the time delay, T, which is controlled by the number of phase-encode steps, A& and the length of the time step, At,. Reducing the TE may be accomplished by reducing A& T, or At,. The latter option is not used in practice because a reduction in At, increases the spectral width. This increases the possibility of acquiring spectral regions containing no spectral data and can cause the subimages of a convolution spectral image to overlap.
The signal-to-noise ratio and image contrast of a convolution spectral image are highly dependent on the number of phase-encode steps and the magnitude of the spectral encoding time step. An image with high resolution of a small spectral width will necessarily require a longer TE than an image with lower resolution over the same spectral width. This is true of the technique of Sepponen and co-workers as well (13). Thus the relaxation properties of the nuclear spin system will determine the possible spectral and spatial resolution of the phase-encoded information for a given spectral width. Figure 4 illustrates this effect for a mixture of acetone and CuS04- doped water contained in a 4 mm inside diameter NMR tube (Wilmad 507-PP) about 3 cm long. The spectrum of the mixture is shown in Fig. 4a, demonstrating the quality of the main field homogeneity. Figure 4b is a 64 X 64 convolution spectral image with TE = 90 ms and Fig. 4c is a 128 X 128 convolution spectral image with TE = 180 ms. Since At, was fixed for both Figs. 4b and 4c and since more phase-encode steps were used to obtain Fig. 4c, the TE of the latter was forced to be longer. The faster-relaxing water begins to vanish from the image as the resolution and TE in- crease. The loss in signal due to relaxation is ameliorated somewhat in convolution spectral imaging techniques since small gradient magnitudes are used in the frequen- cy-encoding process. This point is addressed below.
The sample volume represented by the images of Figs. 4b and 4c occupied less than 1% of the active volume of the RF coil. However, the signal strength was sufficient to obtain good signal-to-noise with only two signal averages per phase-encode step and spatial resolutions on the order of 150-300 pm per data point while retaining spectral information. This suggests that convolution spectral microscopic imaging should be possible at main field strengths of 2 T if the B0 homogeneity is quite good, especially since the technique is most suitable for small samples where this condition is more easily satisfied.
Extension to three spatial dimensions. The two-dimensional convolution spectral imaging technique may be extended to three dimensions by inserting a second phase- encoding gradient, time interval pair into the pulse sequence of Fig. 2a. The result is shown in Fig. 2b. The second pair is stepped after each complete cycle of stepping the first pair. The result is a volume image in which spectral information is mixed into all spatial dimensions. Again, TR, TE, T, and 7 are fixed during an experiment. There are two more delays than in the two-dimensional technique and the magnitude of each of these is controlled by the size of the time steps, At, and At,, and the number of phase-encode steps, M and L. In the three-dimensional technique the restrictions of spatial resolution and relaxation make the minimization ofTE more difficult.
As in the two-dimensional case, one should consider sample geometry to optimize

248 COCKMAN AND MARECI
a)

CONVOLUTION SPECTRAL IMAGING 249
spatial resolution. Trigonometry shows that if the convolved spectral widths are the same in all three spatial dimensions, then the center of each spatial volume image corresponding to a spectral resonance will be separated from its neighbor by (3)“* times the frequency difference between the neighbors. Again, sample geometry may allow increases in the spatial resolution without image overlap; a spherical sample would be most favored.
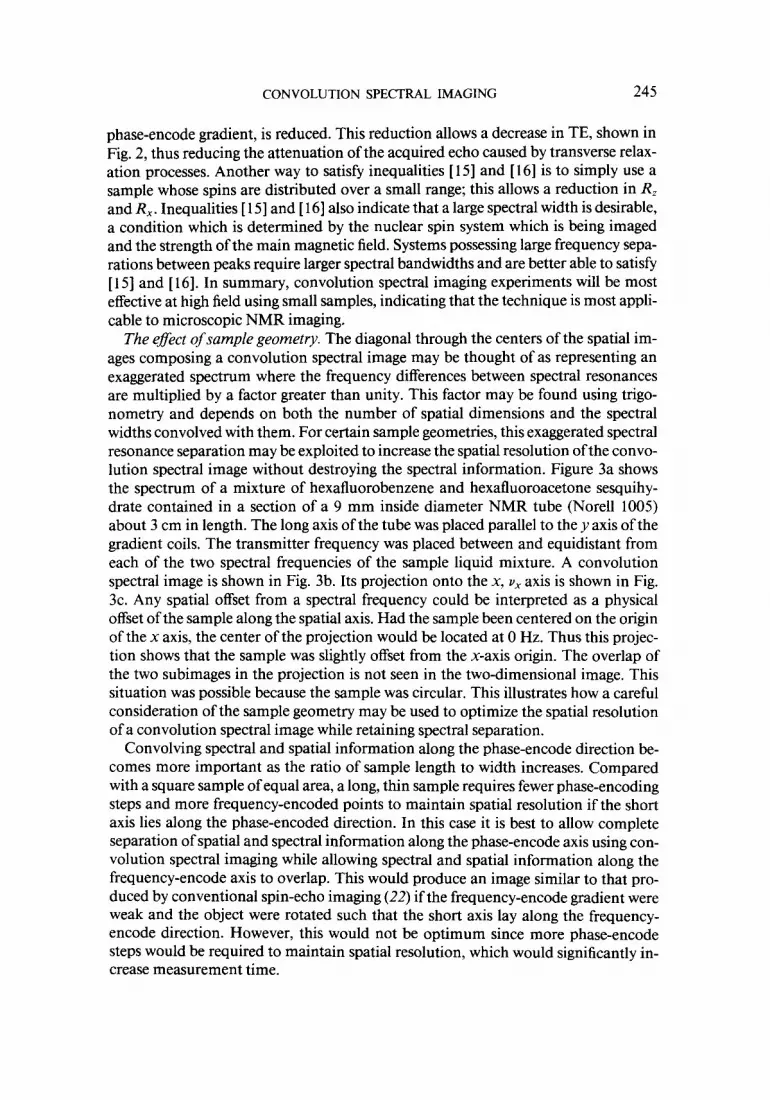
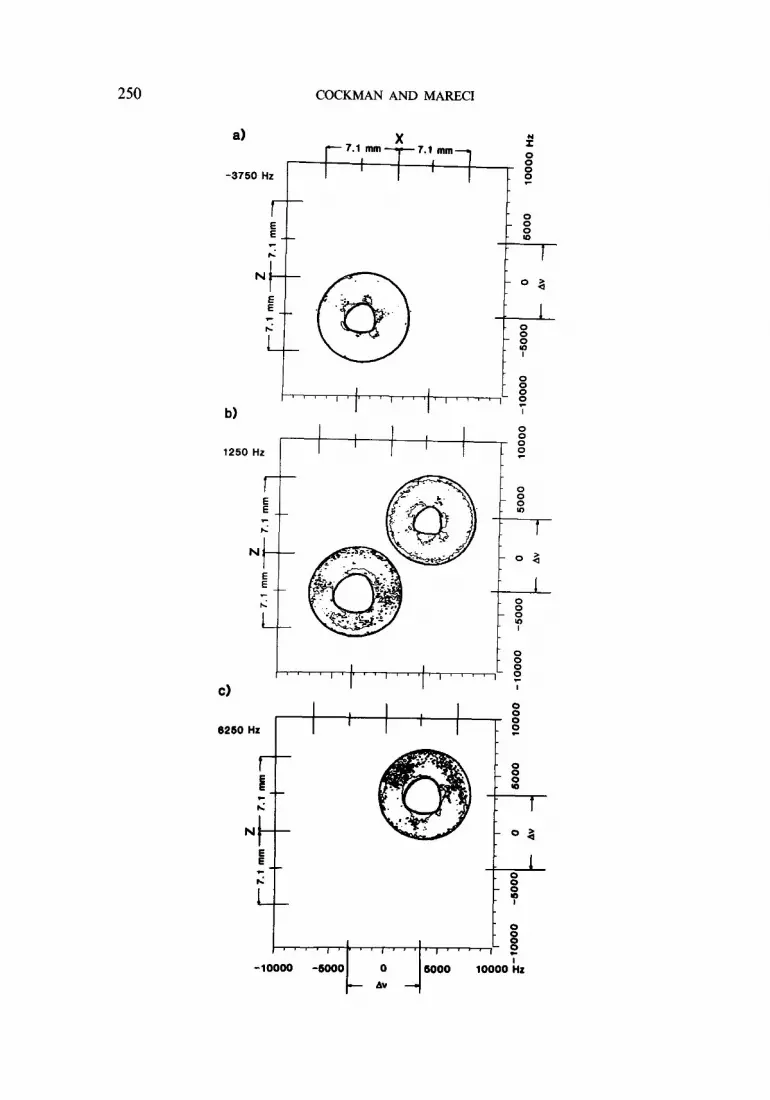
An example of three-dimensional convolution spectral imaging is shown in Fig. 5. It was obtained with the sequence of Fig. 2b using the phase cycle of Table 2. The phantom was identical to that of Fig. 3 but a glass spike was inserted into the sample tube along its long axis, which was aligned with the y axis of the gradient coil set. The transmitter frequency was placed as for Fig. 3. The resulting images are displayed as a series of two-dimensional slices in the z, v,-x, vX plane. Each slice corresponds to a small band of positions along the y axis; these bands are also functions of the spectral frequencies of the two types of nuclei composing the sample. The central frequency of each of these bands is indicated in the upper left corner of each image. By compar- ing the spectral frequencies of the bands indicated with these images with the spec- trum in Fig. 3a it may be seen that the sample was spatially offset along the y axis. In Figs. 5a and 5b, cross sections normal to the y, vY axis are shown for the lower fre- quency resonance (hexafluorobenzene). The size of the hole due to the presence of the glass spike increases. Irregularities in the hole shape reflect the shape of the glass spike. Figures 5b and 5c show cross sections normal to the y, vY axis for the higher frequency resonance (hexafluoroacetone sesquihydrate). The hole in the images starts out small and increases again. The presence of two subimages in Fig. 5b was inten- tionally produced to demonstrate the increase in spatial resolution along the y axis allowed by sample geometry. With a single three-dimensional data matrix and three- dimensional Fourier transform, a complete volume image for each spectral resonance has been defined. We emphasize that the short TE and the high resolution of this data matrix were made possible by the large separation between the two spectral reso- nances. To maintain the same resolution for two resonances which are closer together in frequency would require a longer TE. The resulting signal attenuation due to relax- ation may be unacceptable.
Three-dimensional convolution spectral imaging may also be used with thick slice excitation to obtain very thin slices. This is accomplished by replacing the hard 7r/2
FIG. 4. The interaction of TE and the spatial resolution. (a) The ‘H spectrum of a mixture of CuS04- doped water and acetone in a 4 mm inside diameter tube; Au = 203 Hz. The corresponding ‘H two- dimensional convolution spectral image is shown in (b). Without moving the sample, the number of phase- encode steps, M, was doubled. This forced the increase of TE. The resulting ‘H two-dimensional convolu- tion spectral image is shown in (c). The signal of the faster-relaxing water has been attenuated by T, pro- cesses. Both convolution spectral images were obtained using the pulse sequence of Fig. 2b and the phase cycle of Table 1. Processing was identical for both images. Parameters: Total time for acquisition = 8.5 min (b), = 17 min (c); N = 64 (b), = 128 (c); M = 32 (b), =64 (c); TR = 8 s, TE = 90 ms, (b), = 180 ms, (c); slice thickness = 2 mm. Resolution: (b) z(fe) 280 pm/point, v,(fe) 16 Hz/point, x(pe) 280 pm/point, v,(pe) 16 Hz/point; (c) z(fe) 140 pm/point, vZ(fe) 8 Hz/point, dpe) 140 pm/point, uX(pe) 8 Hz/point. The phase- encoded resolutions reflect the effect of zero-filling used in processing. Processing: Two-dimensional Fou- rier transformation, no apodization, one zero-fill in the phase-encode dimension, magnitude display mode.
250 COCKMAN AND MARECI
a) 7.1 L mm
0 1 -3750 Hz I I I I 8
z
1 I I 8 8260 Hz
I I _ 8
- f , I . . I , n > I . , , , , , ,- -
-10000 -so00 0 so00 10000 k - Av -
CONVOLUTION SPECTRAL IMAGING 251
pulse of Fig. 2b with a frequency-selective one in the presence of a slice gradient, as in Fig. 2a. The slice gradient axis coincides with one of the phase-encode gradient axes. In the presence of spectral separation and a relatively weak slice gradient, a different slice position would be excited for each spectral resonance. If the slice thick- ness and the phase-encode field of view along the slice axis were identical, spatial phase encoding alone along that axis would result in folding. The problem could be avoided by convolution spectral imaging phase encoding. Folding along the slice axis would not occur when the slice thickness and phase-encode field of view were equal, and the number of phase-encode steps could be maintained without a loss in spatial resolution. The convolution process does not remove slice overlap; this would have to be done in the other two dimensions.
Signal-to-noise considerations. The effect of changes in controllable variables on the signal-to-noise ratio (S/N) in the convolution spectral imaging technique may be seen by considering the frequency-encoding and phase-encoding processes sepa- rately. We define S/N in an image or a projection as the ratio of the peak amplitude of a signal to the amplitude of the rms background noise. Throughout this discussion it will be assumed that the linewidths in a spectrum are dominated by the effect of the applied gradients. Consider the generation of a Hahn echo from an ensemble of spins with a 7r/2-r-a pulse sequence. The experiment is modified to include the frequency-encoding process by applying a gradient of constant amplitude Gi, during the time T and applying a second gradient of constant amplitude GzX along the same direction as G1, for a time t2 immediately following the 7~ pulse. A gradient echo will also be formed. Under ideal conditions, this gradient echo and the Hahn spin echo will reach their maxima simultaneously when
G,,(T) = G&/2). [I71
Since data are acquired during the time t2, we assume that t2 is long enough to permit complete decay of the signal. This assumption allows us to ignore truncation artifacts in the Fourier-transformed result which would alter the S/N value. If the Nyquist sampling rate for quadrature detection is chosen, then t2 = N/F = AF-‘, where F is the total spectral bandwidth placed around the transmitter carrier frequency and N is the number of sampled complex data points. After Fourier transformation with respect to t2, the noise in the spectrum is proportional to the square root of the band- width per frequency-encode data point, AF (23). Since the signal is proportional to the spatial width per data point, Ar,,, we conclude that
FIG. 5. Three-dimensional convolution spectral imaging. This series of two-dimensional slices through the 19F three-dimensional data matrix was obtained using the sample phantom of Fig. 3 with a glass spike inserted into the tube of liquid. (a)-(b) Slices of a 19F volume image of the lower frequency spectral reso- nance; (b)-(c) Slices of a 19F volume image of the higher frequency spectral resonance. The data were obtained using the pulse sequence of Fig. 2b with the phase cycle of Table 2. Parameters: Total time for acquisition = 2.85 h, N = 256, M = 128, L = 8, TR = 5 s, TE = 30 ms. Resolution: z(fe) 84 pm/point, u,(fe) 78 Hz/point, x(pe) 84 pm/point, vX(pe) 78 Hz/point, y(pe) 4559 pm/point, Z&X) 2500 Hz/point. The resolution in the x, v, phase-encoded dimension reflects the effect of zero-filling during processing. Processing: Three-dimensional Fourier transformation, no apodization, one zero-fill in the x, v, dimension, magnitude display mode.

252 COCKMAN AND h4ARECI
SIN a Arr,(AF’-‘I* [I81 under these conditions. For frequency encoding, when the linewidths are dominated by the effect of applied field gradients,
AF = yGtiArrJ2a. [I91 By proportionality [ 181, when the spatial resolution, Ar,, , is fixed, the S/N is maxi- mized when aF is minimized. To maintain a particular spatial resolution, however, Eq. [ 193 shows that GZx must be minimized with AF. As Gti is reduced (while main- taining the relationship of Eq. [ 17]), spectral information can appear, as shown by inequality [ 151. Inequality [ 151 must be obeyed to produce a convolution spectral image. This contrasts with other techniques such as spin-echo imaging (22) and the chemical-shift imaging technique of Sepponen and co-workers (13) in which inequal- ity [ 151 is violated. We conclude that the SINwill be maximized for a technique when the spectral information is not obliterated by the effect of applied frequency-encode gradients.
For the phase-encode process, a separate signal consisting of N data points is ob- tained for each of M phase-encoding steps. Since the M signals are acquired sepa- rately, the noise between them is uncorrelated. Thus this noise sums as the square root of the number of phase-encode steps regardless of what transpires during the pulse sequence (24). For an imaging pulse sequence in which the linewidths in the phase-encode dimension are dominated by the effect of applied gradients, the signal is proportional to the spatial width per phase-encode data point, Ar, . Also the phase- encode process averages the signal from each step. We conclude that
S/N a Ar,(M)“*. PO1 This proportionality has important implications for convolution spectral imaging. Since it has no dependence on the phase-encode spectral width, the convolution of phase-encoded spectral information with phase-encoded spatial information will not alter the S/N in the phase-encode dimension for a fixed Arpe.
CONCLUSION
Convolution spectral imaging substantially reduces the total time required for data acquisition and processing without a loss of information. The use of weak gradients makes the technique inherently more sensitive than techniques in which large gradi- ents are used to destroy spectral information. However, because the minimum value of the echo time, TE, is restricted in part by the number of data points in the phase- encoded dimension(s), fast-relaxing nuclei whose resonances are not well-resolved could possibly not be imaged at high resolution. Convolution spectral imaging ap- pears to be best suited for slowly relaxing nuclei whose spectral resonances are well- separated and whose spatial distributions are small. These criteria suggest that the technique might find its greatest applications in the relatively new field of microscopic NMR imaging (25). The spatial resolutions obtained in the studies presented here are certainly very encouraging.
CONVOLUTION SPECTRAL IMAGING 253
The separation of spatial and spectral phase-encode processes, as is done in the three-dimensional technique of Sepponen et al. (13), has a S/N advantage over the convolution of the two phase-encode processes but only because more phase-encode data points are being sampled to create the three-dimensional data set. This requires a longer total acquisition time. The spectral dimension is separated from the spatial dimensions, but the technique is usually applied to cases where the spectral resolution is sacrificed so that greater spatial resolution may be obtained in a given total acquisi- tion time. Since few data points are obtained by spectral phase encoding, the peaks of the Fourier-transformed spectra, each of which corresponds to a two-dimensional spatial location, may not coincide with the true frequency positions of the spectral resonances. The observation of well-resolved, spatially localized spectra is not the goal of the Sepponen technique. Therefore, if two-dimensional spatial images corre- sponding to individual resonances are desired, and if inequalities [ 151 and [ 161 can be satisfied, then convolution spectral imaging is the more efficient technique.
The convolution spectral imaging concept could easily be extended to the fast spec- tral imaging method of Stroebel and Ratzel(26), reducing the total time required for data set acquisition by a factor of PZ, where n is the number of data points in the spectral dimension. This work is being pursued in this laboratory.
ACKNOWLEDGMENTS
The authors acknowledge the valuable contributions of Dr. Ralph Brooker, who provided one of us (M.D.C.) with a greater understanding of signal-to-noise and who clarified the mathematics of convolution and Fourier transformation. One of us (T.H.M.) acknowledges helpful discussions from Dr. David Hoult. This research was supported in part by the NIH Biotechnology Resource Grant (P41-RR-02778) and the Veterans Administration Medical Research Service, whose aid was secured for us through the efforts of Dr. Katherine Scott.
REFERENCES
1. W. P. AUE, Rev. Magn. Reson. Med. 1,2 1 (1986). 2. L. BRATEMAN,.~~. J. Roentgenol. 146,971(1986). 3. T. J. BRADY, G. L. WISMER, R. BUXTON, D. D. STARK, AND B. R. ROSEN, “Magnetic Resonance
Annual” (Herbert Y. Kressel, Ed.), p. 55, Raven Press, New York, 1986. 4. L. D. HALL, S. SUKUMAR, AND S. L. TALAGALA, J. Magn. Reson. 56,275 (1984). 5. A. HAASE AND J. FRAHM, J. Magn. Reson. 64,94 (1985). 6. P. M. JOSEPH, J. Comput. Assist. Tomogr. 9,65 1 (1985). 7. P. A. BOTTOMLEY, T. H. FOSTER, AND W. M. LEUE, Proc. Natl. Acad. Sci. USA 81,6856 (1984). 8. W. T. DIXON, Radiology 153, 189 (1984). 9. R. J. ORDIDGE AND F. L. VAN DE VYWER, Radiology 157,55 1 (1985).
10. S. J. Cox AND P. STYLES, J. Magn. Reson. 40,209 (1980). II. T. R. BROWN, B. M. KINCAID, AND K. UGURBIL, Proc. Natl. Acad. Sci. USA 79,3523 (1982). 12. Y. MANASSEN AND G. NAVON, J. Magn. Reson. 61,363 (1985). 13. R. E. SEPPONEN, J. T. SIPPONEN, AND J. I. TANTTU, J. Comput. Assist. Tomogr. 8,585 (1984). 14. A. BAX, A. F. MEHLKOPF, AND J. SMIDT, J. Magn. Reson. 35, 167 (1979). 15. E. 0. BRIGHAM, “The Fast Fourier Transform,” p. 6 1, Prentice-Hall, Englewood Cliffs, New Jersey,
1974.
16. G. BODENHAUSEN AND R. R. ERNST, J. Magn. Reson. 45,367 (198 1).

254 COCKMAN AND MARECI
17. P. H. BOLTON, J. Magn. Reson. 46,343 (1982). 18. L. D. HALLAND T. J. NORW~~D, J. Magn. Reson. 67,382 (1986). 19. K. P. SOILA, M. VIAMONTE, JR., AND P. M. STAREWICZ, Radiology 153,s 19 ( 1984). 20. A. J. DWYER, R. H. KNOP, AND D. I. HOLJLT, J. Comput. Assist. Tomogr. 9, 16 (1985). 21, R. GRAUMANN, A. OPPELT, AND E. STETTER, Magn. Reson. Med. 3,707 (1986). 22. W. A. EDELSTEIN, J. M. S. HUTCHISON, G. JOHNSON, AND T. REDPATH, Phys. Med. Biol. 25, 75 1
(1980). 23. R. R. ERNST AND W. A. ANDERSON, Rev. Sci. Instrum. 37,93 (1966). 24. H. R. BROOKER, T. H. MARECI, AND J. MAO, Magn. Reson. Med. 5,4 17 (1987). 25. J. B. AGUAYO, S. J. BLACKBAND, J. SCZHOENIGER, M. A. MA’IXNGLY, AND M. HINTERMANN, Nature
(London) 322, 190 ( 1986). 26. B. STROEBEL AND D. RATZEL, “Book of Abstracts, Society of Magnetic Resonance in Medicine,” Vol.
3, p. 664, 1986.


