Embed Size (px)
Citation preview

www.afm-journal.de
FULL P
APER
© 2014 WILEY-VCH Verlag GmbH & Co. KGaA, Weinheim 1
www.MaterialsViews.com
wileyonlinelibrary.com
1. Introduction
Porous carbon materials have been used as components in hydrogen storage cells, catalytic materials, fi lters, biosensors, capacitors and batteries. [ 1–7 ] It has been demonstrated that it is possible to modify the electronic, mechanical and chemical properties of carbon materials (CM) via doping: For example the introdution of foreign atoms within the carbon network. The most common elements able to dope CM are nitrogen and boron because of their similarities in size. Among various methods for doping porous carbon mate-rials (PCM), we could mention: 1) reac-tions of porous carbon with gaseous sources containing nitrogen, [ 8 ] 2) co-carbonization of precursors containing carbon and nitrogen; [ 9 ] and 3) carboniza-tion of materials containing nitrogen. [ 10 ] Other forms of CM include inverse opals, which consist of porous carbons obtained
Controlling the Optical, Electrical and Chemical Properties of Carbon Inverse Opal by Nitrogen Doping
Aarón Morelos-Gómez , Pierre G. Mani-González , Ali E. Aliev , Emilio Muñoz-Sandoval , Alberto Herrera-Gómez , Anvar A. Zakhidov , Humberto Terrones , Morinobu Endo , and Mauricio Terrones *
Nitrogen-doped carbon inverse opal (CIO-N) is synthesized by a two-step process involving the infi ltration of carbon-nitrogen precursors within opals followed by the thermolysis and removal of the opal structure in hydrofl uoric acid (HF). Undoped samples exhibit a refl ection peak in the red region of the spectrum whereas N-doped samples display shifts to the blue region of the spectrum as the nitrogen content is increased. The degree of crystallinity of CIO-N strongly depends upon the nitrogen content and on the size of the precursor silica particles used to prepare the inverted opals. In addition, the introduction of nitrogen into the samples is able to increase the electrical conductivity by one order of magnitude from 2 to 30 S cm −1 (at room temperature). All samples are characterized by scanning electron microscopy (SEM), transmission electron microscopy (TEM), X-ray diffraction (XRD), Raman spectroscopy, X-ray photoelectron spectroscopy (XPS), ultraviolet-visible (UV-Vis) spectroscopy, and electrical conductivity measurements. It is envisaged that CIO-N could have impor-tant applications in the fabrication of photonic crystals, photoconducting materials, molecular sensors, fi eld emission devices, capacitors, batteries, among many others.
Dr. A. Morelos-Gómez, Prof. E. Muñoz-Sandoval Advanced Materials Department, IPICYT, Camino a la Presa San José 2055, Col. Lomas 4a sección, San Luis Potosí S.L.P. , 78216 , México Dr. P. G. Mani-González, Prof. A. Herrera-Gómez CINVESTAV-Querétaro, Libramiento Norponiente 2000, Querétaro , 76230 , México Dr. P. G. Mani-González Instituto de Ingeniería y Tecnología Departamento de Física y Matemáticas Universidad Autónoma de Ciudad Juárez Ave. Del Charro 450, Cd. Juárez C.P. 32310 , Chihuahua , México Dr. A. Morelos-Gómez, Prof. A. E. Aliev, Prof. A. A. Zakhidov The Alan G. MacDiarmid NanoTech Institute University of Texas at Dallas Richardson , TX , 75083 , USA Prof. H. Terrones Department of Physics & Center for 2-Dimensional and Layered Materials The Pennsylvania State University 104 Davey Lab. , University Park , PA , 16802–6300 , USA
DOI: 10.1002/adfm.201303391
Dr. A. Morelos-Gómez, Prof. M. Endo Institute for Carbon Science and Technology Shinshu University 4–17–1 Wakasato , Nagano city , 380–8553 , Japan Prof. M. Endo, Prof. M. Terrones Research Center for Exotic Nanocarbons (JST) Shinshu University Wakasato 4–17–1 , Nagano , 380–8553 , Japan Prof. M. Terrones Department of Physics Department of Chemistry Department of Materials Science and Engineering and Materials Research Institute & Center for 2-Dimensional and Layered Materials The Pennsylvania State University 104 Davey Lab., University Park , PA , 16802–6300 , USA E-mail: [email protected], [email protected]
Adv. Funct. Mater. 2014, DOI: 10.1002/adfm.201303391
FULL
PAPER
2
www.afm-journal.dewww.MaterialsViews.com
wileyonlinelibrary.com © 2014 WILEY-VCH Verlag GmbH & Co. KGaA, Weinheim
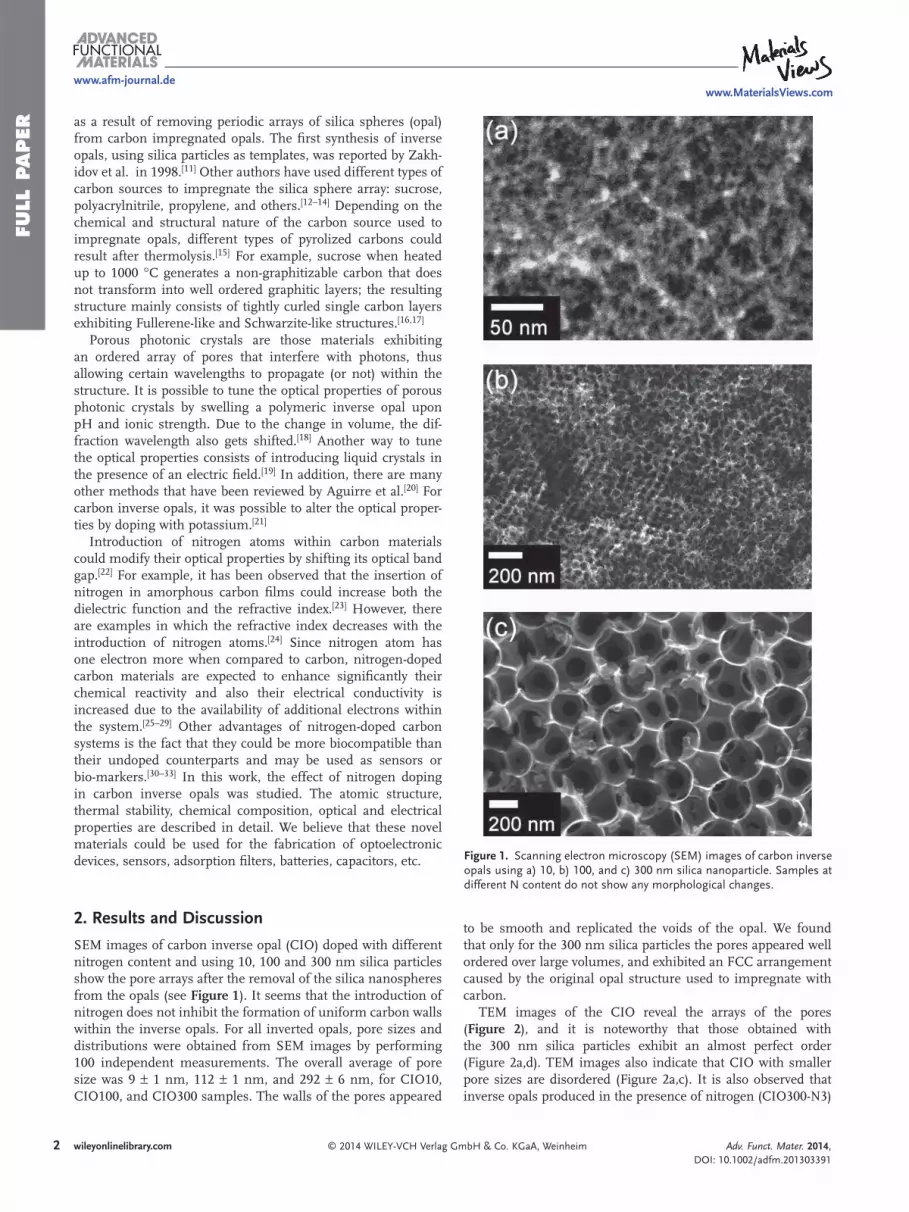
to be smooth and replicated the voids of the opal. We found that only for the 300 nm silica particles the pores appeared well ordered over large volumes, and exhibited an FCC arrangement caused by the original opal structure used to impregnate with carbon.
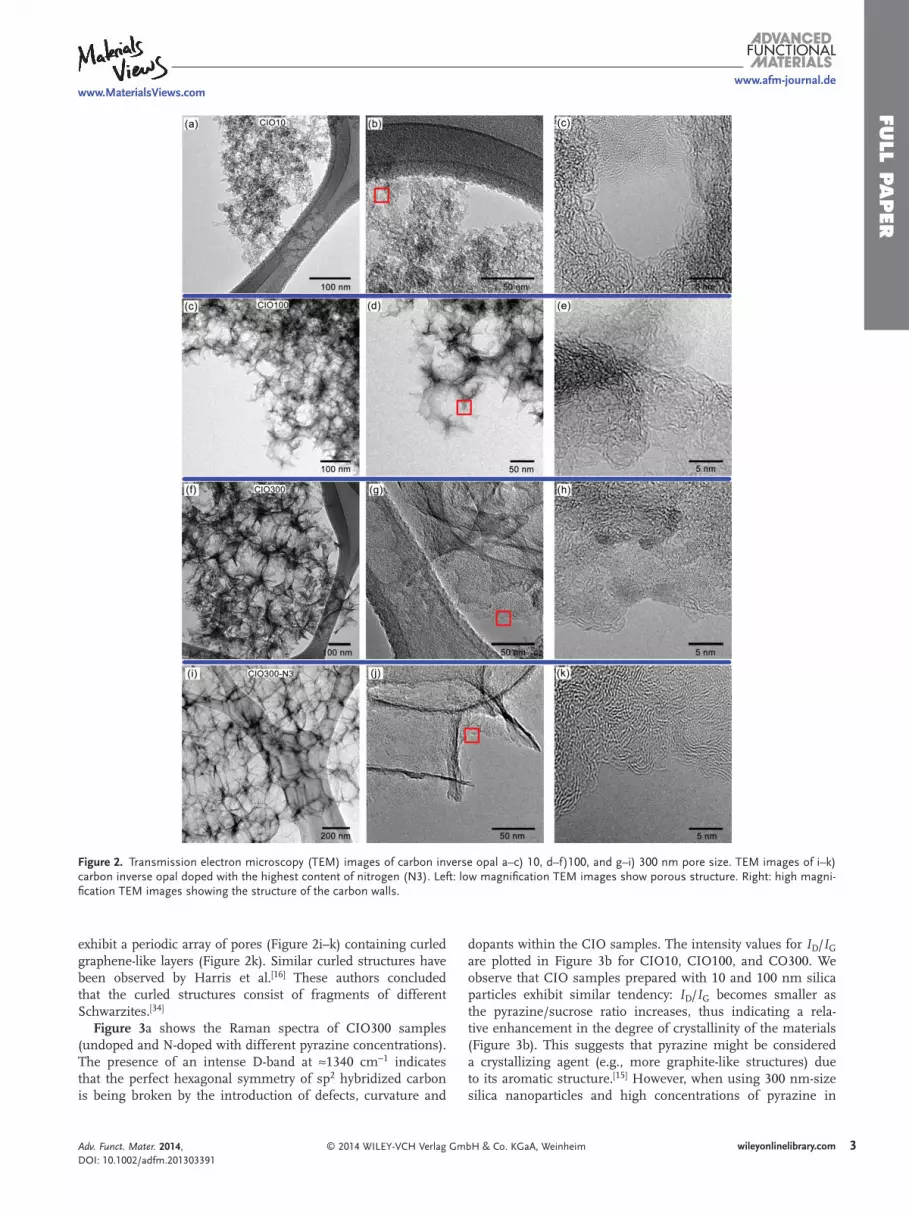
TEM images of the CIO reveal the arrays of the pores ( Figure 2 ), and it is noteworthy that those obtained with the 300 nm silica particles exhibit an almost perfect order (Figure 2 a,d). TEM images also indicate that CIO with smaller pore sizes are disordered (Figure 2 a,c). It is also observed that inverse opals produced in the presence of nitrogen (CIO300-N3)
as a result of removing periodic arrays of silica spheres (opal) from carbon impregnated opals. The fi rst synthesis of inverse opals, using silica particles as templates, was reported by Zakh-idov et al. in 1998. [ 11 ] Other authors have used different types of carbon sources to impregnate the silica sphere array: sucrose, polyacrylnitrile, propylene, and others. [ 12–14 ] Depending on the chemical and structural nature of the carbon source used to impregnate opals, different types of pyrolized carbons could result after thermolysis. [ 15 ] For example, sucrose when heated up to 1000 °C generates a non-graphitizable carbon that does not transform into well ordered graphitic layers; the resulting structure mainly consists of tightly curled single carbon layers exhibiting Fullerene-like and Schwarzite-like structures. [ 16,17 ]
Porous photonic crystals are those materials exhibiting an ordered array of pores that interfere with photons, thus allowing certain wavelengths to propagate (or not) within the structure. It is possible to tune the optical properties of porous photonic crystals by swelling a polymeric inverse opal upon pH and ionic strength. Due to the change in volume, the dif-fraction wavelength also gets shifted. [ 18 ] Another way to tune the optical properties consists of introducing liquid crystals in the presence of an electric fi eld. [ 19 ] In addition, there are many other methods that have been reviewed by Aguirre et al. [ 20 ] For carbon inverse opals, it was possible to alter the optical proper-ties by doping with potassium. [ 21 ]
Introduction of nitrogen atoms within carbon materials could modify their optical properties by shifting its optical band gap. [ 22 ] For example, it has been observed that the insertion of nitrogen in amorphous carbon fi lms could increase both the dielectric function and the refractive index. [ 23 ] However, there are examples in which the refractive index decreases with the introduction of nitrogen atoms. [ 24 ] Since nitrogen atom has one electron more when compared to carbon, nitrogen-doped carbon materials are expected to enhance signifi cantly their chemical reactivity and also their electrical conductivity is increased due to the availability of additional electrons within the system. [ 25–29 ] Other advantages of nitrogen-doped carbon systems is the fact that they could be more biocompatible than their undoped counterparts and may be used as sensors or bio-markers. [ 30–33 ] In this work, the effect of nitrogen doping in carbon inverse opals was studied. The atomic structure, thermal stability, chemical composition, optical and electrical properties are described in detail. We believe that these novel materials could be used for the fabrication of optoelectronic devices, sensors, adsorption fi lters, batteries, capacitors, etc.
2. Results and Discussion
SEM images of carbon inverse opal (CIO) doped with different nitrogen content and using 10, 100 and 300 nm silica particles show the pore arrays after the removal of the silica nanospheres from the opals (see Figure 1 ). It seems that the introduction of nitrogen does not inhibit the formation of uniform carbon walls within the inverse opals. For all inverted opals, pore sizes and distributions were obtained from SEM images by performing 100 independent measurements. The overall average of pore size was 9 ± 1 nm, 112 ± 1 nm, and 292 ± 6 nm, for CIO10, CIO100, and CIO300 samples. The walls of the pores appeared
Figure 1. Scanning electron microscopy (SEM) images of carbon inverse opals using a) 10, b) 100, and c) 300 nm silica nanoparticle. Samples at different N content do not show any morphological changes.
Adv. Funct. Mater. 2014, DOI: 10.1002/adfm.201303391
FULL P
APER
3
www.afm-journal.dewww.MaterialsViews.com
wileyonlinelibrary.com© 2014 WILEY-VCH Verlag GmbH & Co. KGaA, Weinheim
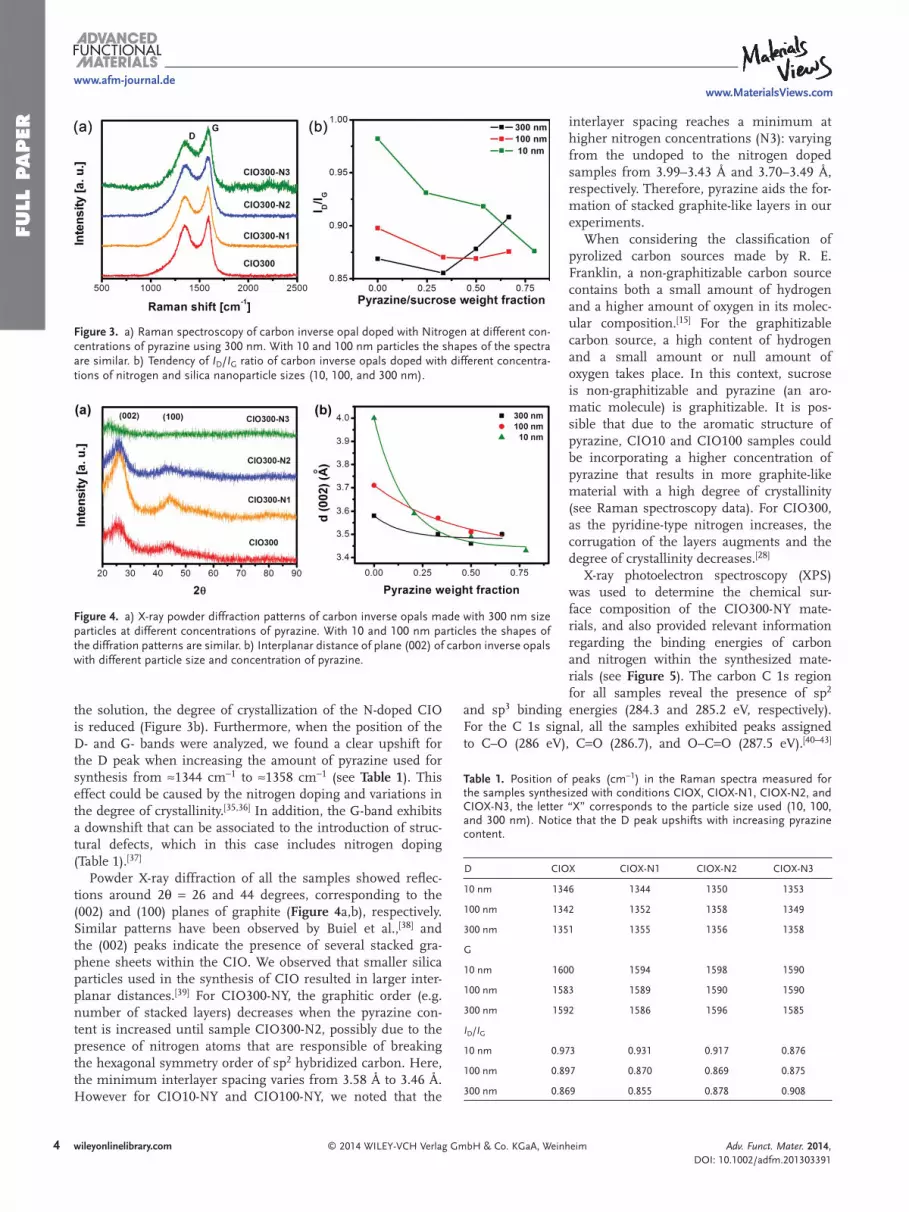
dopants within the CIO samples. The intensity values for I D / I G are plotted in Figure 3 b for CIO10, CIO100, and CO300. We observe that CIO samples prepared with 10 and 100 nm silica particles exhibit similar tendency: I D / I G becomes smaller as the pyrazine/sucrose ratio increases, thus indicating a rela-tive enhancement in the degree of crystallinity of the materials (Figure 3 b). This suggests that pyrazine might be considered a crystallizing agent (e.g., more graphite-like structures) due to its aromatic structure. [ 15 ] However, when using 300 nm-size silica nanoparticles and high concentrations of pyrazine in
exhibit a periodic array of pores (Figure 2 i–k) containing curled graphene-like layers (Figure 2 k). Similar curled structures have been observed by Harris et al. [ 16 ] These authors concluded that the curled structures consist of fragments of different Schwarzites. [ 34 ]
Figure 3 a shows the Raman spectra of CIO300 samples (undoped and N-doped with different pyrazine concentrations). The presence of an intense D-band at ≈1340 cm −1 indicates that the perfect hexagonal symmetry of sp 2 hybridized carbon is being broken by the introduction of defects, curvature and
Figure 2. Transmission electron microscopy (TEM) images of carbon inverse opal a–c) 10, d–f)100, and g–i) 300 nm pore size. TEM images of i–k) carbon inverse opal doped with the highest content of nitrogen (N3). Left: low magnifi cation TEM images show porous structure. Right: high magni-fi cation TEM images showing the structure of the carbon walls.
Adv. Funct. Mater. 2014, DOI: 10.1002/adfm.201303391
FULL
PAPER
4
www.afm-journal.dewww.MaterialsViews.com
wileyonlinelibrary.com © 2014 WILEY-VCH Verlag GmbH & Co. KGaA, Weinheim
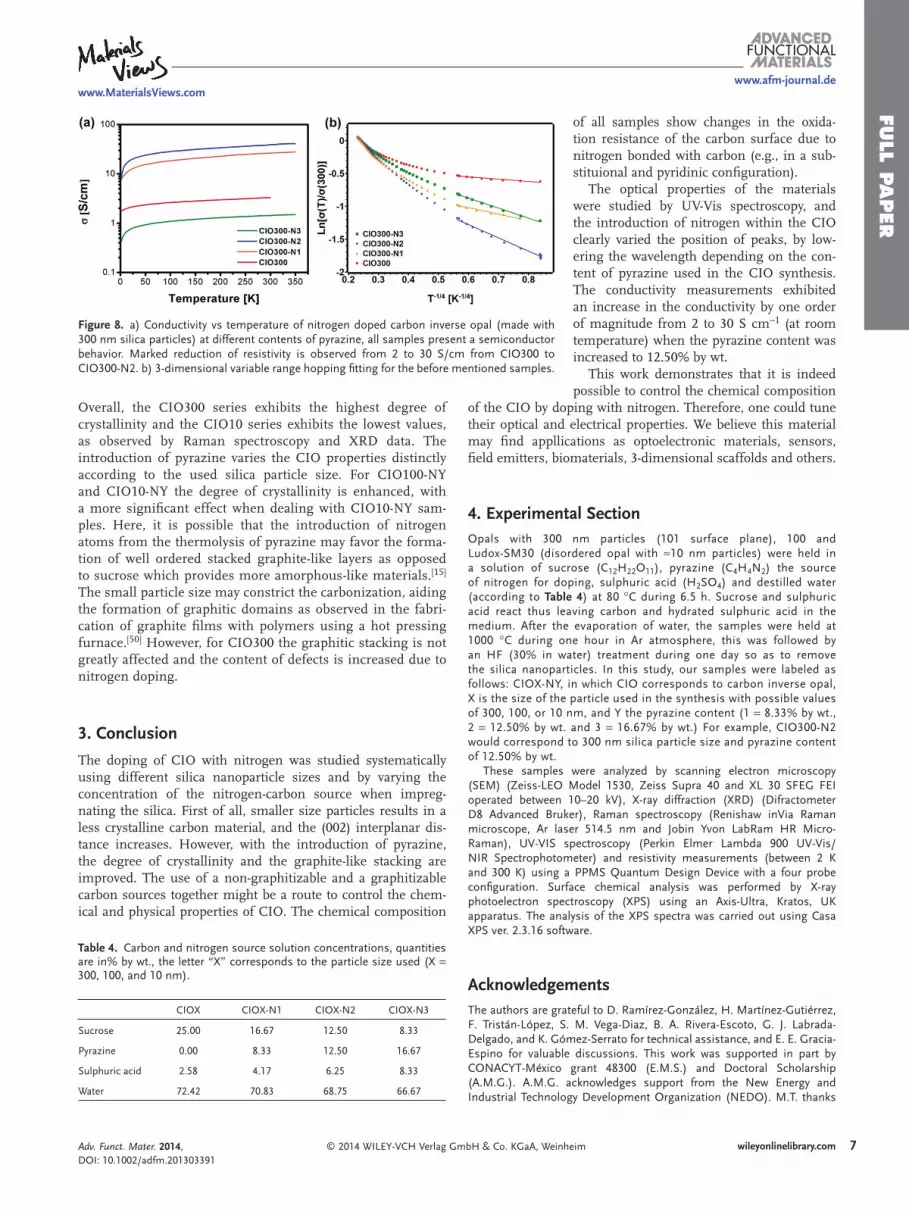
interlayer spacing reaches a minimum at higher nitrogen concentrations (N3): varying from the undoped to the nitrogen doped samples from 3.99–3.43 Å and 3.70–3.49 Å, respectively. Therefore, pyrazine aids the for-mation of stacked graphite-like layers in our experiments.
When considering the classifi cation of pyrolized carbon sources made by R. E. Franklin, a non-graphitizable carbon source contains both a small amount of hydrogen and a higher amount of oxygen in its molec-ular composition. [ 15 ] For the graphitizable carbon source, a high content of hydrogen and a small amount or null amount of oxygen takes place. In this context, sucrose is non-graphitizable and pyrazine (an aro-matic molecule) is graphitizable. It is pos-sible that due to the aromatic structure of pyrazine, CIO10 and CIO100 samples could be incorporating a higher concentration of pyrazine that results in more graphite-like material with a high degree of crystallinity (see Raman spectroscopy data). For CIO300, as the pyridine-type nitrogen increases, the corrugation of the layers augments and the degree of crystallinity decreases. [ 28 ]
X-ray photoelectron spectroscopy (XPS) was used to determine the chemical sur-face composition of the CIO300-NY mate-rials, and also provided relevant information regarding the binding energies of carbon and nitrogen within the synthesized mate-rials (see Figure 5 ). The carbon C 1s region for all samples reveal the presence of sp 2
and sp 3 binding energies (284.3 and 285.2 eV, respectively). For the C 1s signal, all the samples exhibited peaks assigned to C–O (286 eV), C=O (286.7), and O–C=O (287.5 eV). [ 40–43 ]
the solution, the degree of crystallization of the N-doped CIO is reduced (Figure 3 b). Furthermore, when the position of the D- and G- bands were analyzed, we found a clear upshift for the D peak when increasing the amount of pyrazine used for synthesis from ≈1344 cm −1 to ≈1358 cm −1 (see Table 1 ). This effect could be caused by the nitrogen doping and variations in the degree of crystallinity. [ 35,36 ] In addition, the G-band exhibits a downshift that can be associated to the introduction of struc-tural defects, which in this case includes nitrogen doping (Table 1 ). [ 37 ]
Powder X-ray diffraction of all the samples showed refl ec-tions around 2θ = 26 and 44 degrees, corresponding to the (002) and (100) planes of graphite ( Figure 4 a,b), respectively. Similar patterns have been observed by Buiel et al., [ 38 ] and the (002) peaks indicate the presence of several stacked gra-phene sheets within the CIO. We observed that smaller silica particles used in the synthesis of CIO resulted in larger inter-planar distances. [ 39 ] For CIO300-NY, the graphitic order (e.g. number of stacked layers) decreases when the pyrazine con-tent is increased until sample CIO300-N2, possibly due to the presence of nitrogen atoms that are responsible of breaking the hexagonal symmetry order of sp 2 hybridized carbon. Here, the minimum interlayer spacing varies from 3.58 Å to 3.46 Å. However for CIO10-NY and CIO100-NY, we noted that the
Table 1. Position of peaks (cm −1 ) in the Raman spectra measured for the samples synthesized with conditions CIOX, CIOX-N1, CIOX-N2, and CIOX-N3, the letter “X” corresponds to the particle size used (10, 100, and 300 nm). Notice that the D peak upshifts with increasing pyrazine content.
D CIOX CIOX-N1 CIOX-N2 CIOX-N3
10 nm 1346 1344 1350 1353
100 nm 1342 1352 1358 1349
300 nm 1351 1355 1356 1358
G
10 nm 1600 1594 1598 1590
100 nm 1583 1589 1590 1590
300 nm 1592 1586 1596 1585
I D / I G
10 nm 0.973 0.931 0.917 0.876
100 nm 0.897 0.870 0.869 0.875
300 nm 0.869 0.855 0.878 0.908
Figure 4. a) X-ray powder diffraction patterns of carbon inverse opals made with 300 nm size particles at different concentrations of pyrazine. With 10 and 100 nm particles the shapes of the diffration patterns are similar. b) Interplanar distance of plane (002) of carbon inverse opals with different particle size and concentration of pyrazine.
Figure 3. a) Raman spectroscopy of carbon inverse opal doped with Nitrogen at different con-centrations of pyrazine using 300 nm. With 10 and 100 nm particles the shapes of the spectra are similar. b) Tendency of I D / I G ratio of carbon inverse opals doped with different concentra-tions of nitrogen and silica nanoparticle sizes (10, 100, and 300 nm).
Adv. Funct. Mater. 2014, DOI: 10.1002/adfm.201303391

FULL P
APER
5
www.afm-journal.dewww.MaterialsViews.com
wileyonlinelibrary.com© 2014 WILEY-VCH Verlag GmbH & Co. KGaA, Weinheim
undoped and doped CIO synthesized using different amounts of pyrazine ( Figure 6 a). The highest surface area was obtained for pore sizes of 10 nm CIO10-N1 with a value of 1540 m 2 g −1 . For CIO10-NY and CIO100-NY samples, we found that the sur-face area tends to decrease when the concentration of pyrazine is increased; these results agree with the fi ndings reported by other research groups. [ 9,45–47 ] However, for CIO300-N3 the sur-face area increases from 94 to 163 m 2 g −1 ( Table 3 ). Therefore, and due to the large surface areas found, we believe that these CIO materials could serve as effi cient gas sensor materials with novel catalytic activities. In addition, the presence of nitrogen in the CIO could make the materials more reactive.
From the thermogravimetric analysis (TGA) analysis in air, we observed the loss of the majority of the material. We believe that the residual non-burned material (5% by wt. to 10% by wt.) at the end of the TGA may come from the undis-olved SiO 2 during the etching process (see crystalline domains in Figure 2 h). It is clear that for samples exhibiting 10 and 300 nm pore sizes, the decompostion temperature increases when increasing the pyrazine content (Figure 6 b). However, CIO samples with 100 nm pore always tend to decrease the decomposition temperature when increasing the pyrazine content.
The nitrogen N 1s region indicates the presence of pyrrolic (or N atoms bonded to two carbon atoms contributing to the π–system with two p-electrons) located at binding energies of 401.5 eV, pyridinc nitrogen (or N atoms bonded to two carbon atoms atoms contributing to the π–system with one p-elec-trons) located at energies of 399.5 eV and quaternary nitrogen at 402.6 eV (or N atoms bonded to three carbon atoms in a substitutional manner). [ 41,43,44 ] The atomic concentrations obtained from the XPS analysis indicate that samples contain 1.05 at%, 2.43 at%, and 5.48 at% of nitrogen for CIO300-N1, CIO300-N2, and CIO300-N3, respectively (see Table 2 ).
We also performed surface area analysis by nitrogen absorp-tion with Brunauer–Emmett–Teller (BET) theory of all the
Figure 5. High resolution X-ray photoelectron spectra of carbon inverse opal (upper spectra) and nitrogen doped carbon inverse opal of a) C 1s and b) N 1s. It is clear that the undoped carbon inverse opal does not contain nitrogen.
Table 2. Elemental analysis obtained from XPS measurements for undoped and nitrogen doped carbon inverse opals made with 300 nm particles.
at% CIO300 CIO300-N1 CIO300-N2 CIO300-N3
C 96.19 93.75 93.97 89.34
N 0.00 1.04 2.43 5.48
O 3.89 5.21 3.6 5.18
Adv. Funct. Mater. 2014, DOI: 10.1002/adfm.201303391

FULL
PAPER
6
www.afm-journal.dewww.MaterialsViews.com
wileyonlinelibrary.com © 2014 WILEY-VCH Verlag GmbH & Co. KGaA, Weinheim
as a semiconductor ( Figure 8 a) with an increase in the electrical conductivity by one order of magnitude from 2 S cm −1 (0.30 Ω cm) in CIO300 to 30 S cm −1 (0.02 Ω cm) in CIO300-N2. We applied the vari-able range hopping (VRH) theory to our data in order to understand better the elec-trical transport mechanism (Figure 8 b). [ 48 ] The data was plotted as Ln( σ ( T )/ σ (300)) versus T −1/2 , T −1/3 , or T −1/3 for Coulomb gap, 2-dimensional and 3-dimensional VRH, respectively (Figure SI-1, Supporting Information). A linear fi t was applied for each plot and their corresponding coef-fi cient of determination ( R 2 ) was obtained (Table SI-1, Supporting Information). From
the R 2 values we could determine that all the samples had a better fi tting for 3-dimensional VRH (3D-VRH) for tem-peratures below 100 K, as observed for carbon networks by Govor et al. [ 49 ] This 3D-VRH indicated that the electrons are moving throughout the entire 3-dimensional structure of the CIOs. For all samples studied, the electrical conduc-tivities and optical properties vary similarly (see Figure 8 ). For example, when the electrical conductivity is increased by one order of magnitude from 2 in CIO300 to 30 S cm −1 in CIO300-N2 (at room temperature) the refl ection color varies from red to blue, and then CIO300-N3 has an decrease in conductivity and an optical shift to green. The changes of the dielectric constant and electrical properties upon nitrogen doping in amorphous carbon has been reported by Yu et al., and attributed to changes in the carbon hybridization caused by the nitrogen doping. [ 23 ] The variations among the optical properties and electrical resistivity suggest that the optical and electrical properties are effectively modifi ed by the intro-duction of nitrogen species within the CIO materials.
From the characterization data, it also appears that the silica particle size and the content of pyrazine signifi cantly altered the chemical and physical properties of the CIO samples.
UV-Vis refl ection spectra were recorded for the different synthesized opals, doped and undoped obtained with the 300 nm silica particles ( Figure 7 a). Under a bright white light it is possible to observe the colors revealed by the UV-VIS spectra (Figure 7 b–f). The pure opal shows a red refl ected color (625 nm) that is also observed for the undoped carbon inverse opal (CIO300) at wavelengths of 609 nm. Interestingly, when we introduced pyrazine up to a 50% (CIO300-N2) the refl ection shifts down to the blue region of the spectrum (466 nm); and for 33% of pyrazine (CIO300-N1), a peak appears at 568 nm. In addi-tion, CIO300 and CIO300-N1 samples displayed secondary peaks located at 493 and 483 nm, respectively. Using 75% of pyrazine (CIO300-N3), the refl ection peak downshifts to a green color (528 nm). From these results, it was confi rmed that different concentrations of nitrogen within CIO could tune the optical properties signifi cantly, similar to the reported CIO doped with K. [ 21 ]
Furthermore, after conducting four probe electrical measurements, we observed that all the samples behave
Table 3. Measured surface area of CIO with different pore size at dis-tinct pyrazine content for synthesis. These values were obtained with the Brunauer–Emmett–Teller (BET) theory.
[m 2 g −1 ]
CIO10 1374
CIO10-N1 1539
CIO10-N2 923
CIO10-N3 839
CIO100 691
CIO100-N1 405
CIO100-N2 309
CIO100-N3 320
CIO300 94
CIO300-N1 130
CIO300-N2 117
CIO300-N3 163
Figure 7. a) UV-VIS refl ection spectra of carbon inverse opal with 300 nm particle at different pyrazine concentrations. b–f) Photograph of carbon inverse opal from CIO300-N3 to CIO300-N1, CIO and opal, respectively.
Figure 6. a) Surface area obtained by nitrogen absorption using BET and b) decomposition temperature for carbon inverse opal with 10, 100 and 300 nm pore size at different amounts of pyrazine used for synthesis.
Adv. Funct. Mater. 2014, DOI: 10.1002/adfm.201303391
FULL P
APER
7
www.afm-journal.dewww.MaterialsViews.com
wileyonlinelibrary.com© 2014 WILEY-VCH Verlag GmbH & Co. KGaA, Weinheim
of all samples show changes in the oxida-tion resistance of the carbon surface due to nitrogen bonded with carbon (e.g., in a sub-stituional and pyridinic confi guration).
The optical properties of the materials were studied by UV-Vis spectroscopy, and the introduction of nitrogen within the CIO clearly varied the position of peaks, by low-ering the wavelength depending on the con-tent of pyrazine used in the CIO synthesis. The conductivity measurements exhibited an increase in the conductivity by one order of magnitude from 2 to 30 S cm −1 (at room temperature) when the pyrazine content was increased to 12.50% by wt.
This work demonstrates that it is indeed possible to control the chemical composition
of the CIO by doping with nitrogen. Therefore, one could tune their optical and electrical properties. We believe this material may fi nd appllications as optoelectronic materials, sensors, fi eld emitters, biomaterials, 3-dimensional scaffolds and others.
4. Experimental Section Opals with 300 nm particles (101 surface plane), 100 and Ludox-SM30 (disordered opal with ≈10 nm particles) were held in a solution of sucrose (C 12 H 22 O 11 ), pyrazine (C 4 H 4 N 2 ) the source of nitrogen for doping, sulphuric acid (H 2 SO 4 ) and destilled water (according to Table 4 ) at 80 °C during 6.5 h. Sucrose and sulphuric acid react thus leaving carbon and hydrated sulphuric acid in the medium. After the evaporation of water, the samples were held at 1000 °C during one hour in Ar atmosphere, this was followed by an HF (30% in water) treatment during one day so as to remove the silica nanoparticles. In this study, our samples were labeled as follows: CIOX-NY, in which CIO corresponds to carbon inverse opal, X is the size of the particle used in the synthesis with possible values of 300, 100, or 10 nm, and Y the pyrazine content (1 = 8.33% by wt., 2 = 12.50% by wt. and 3 = 16.67% by wt.) For example, CIO300-N2 would correspond to 300 nm silica particle size and pyrazine content of 12.50% by wt.
These samples were analyzed by scanning electron microscopy (SEM) (Zeiss-LEO Model 1530, Zeiss Supra 40 and XL 30 SFEG FEI operated between 10–20 kV), X-ray diffraction (XRD) (Difractometer D8 Advanced Bruker), Raman spectroscopy (Renishaw inVia Raman microscope, Ar laser 514.5 nm and Jobin Yvon LabRam HR Micro-Raman), UV-VIS spectroscopy (Perkin Elmer Lambda 900 UV-Vis/NIR Spectrophotometer) and resistivity measurements (between 2 K and 300 K) using a PPMS Quantum Design Device with a four probe confi guration. Surface chemical analysis was performed by X-ray photoelectron spectroscopy (XPS) using an Axis-Ultra, Kratos, UK apparatus. The analysis of the XPS spectra was carried out using Casa XPS ver. 2.3.16 software.
Acknowledgements The authors are grateful to D. Ramírez-González, H. Martínez-Gutiérrez, F. Tristán-López, S. M. Vega-Diaz, B. A. Rivera-Escoto, G. J. Labrada-Delgado, and K. Gómez-Serrato for technical assistance, and E. E. Gracia-Espino for valuable discussions. This work was supported in part by CONACYT-México grant 48300 (E.M.S.) and Doctoral Scholarship (A.M.G.). A.M.G. acknowledges support from the New Energy and Industrial Technology Development Organization (NEDO). M.T. thanks
Overall, the CIO300 series exhibits the highest degree of crystallinity and the CIO10 series exhibits the lowest values, as observed by Raman spectroscopy and XRD data. The introduction of pyrazine varies the CIO properties distinctly according to the used silica particle size. For CIO100-NY and CIO10-NY the degree of crystallinity is enhanced, with a more signifi cant effect when dealing with CIO10-NY sam-ples. Here, it is possible that the introduction of nitrogen atoms from the thermolysis of pyrazine may favor the forma-tion of well ordered stacked graphite-like layers as opposed to sucrose which provides more amorphous-like materials. [ 15 ] The small particle size may constrict the carbonization, aiding the formation of graphitic domains as observed in the fabri-cation of graphite fi lms with polymers using a hot pressing furnace. [ 50 ] However, for CIO300 the graphitic stacking is not greatly affected and the content of defects is increased due to nitrogen doping.
3. Conclusion
The doping of CIO with nitrogen was studied systematically using different silica nanoparticle sizes and by varying the concentration of the nitrogen-carbon source when impreg-nating the silica. First of all, smaller size particles results in a less crystalline carbon material, and the (002) interplanar dis-tance increases. However, with the introduction of pyrazine, the degree of crystallinity and the graphite-like stacking are improved. The use of a non-graphitizable and a graphitizable carbon sources together might be a route to control the chem-ical and physical properties of CIO. The chemical composition
Table 4. Carbon and nitrogen source solution concentrations, quantities are in% by wt., the letter “X” corresponds to the particle size used (X = 300, 100, and 10 nm).
CIOX CIOX-N1 CIOX-N2 CIOX-N3
Sucrose 25.00 16.67 12.50 8.33
Pyrazine 0.00 8.33 12.50 16.67
Sulphuric acid 2.58 4.17 6.25 8.33
Water 72.42 70.83 68.75 66.67
Figure 8. a) Conductivity vs temperature of nitrogen doped carbon inverse opal (made with 300 nm silica particles) at different contents of pyrazine, all samples present a semiconductor behavior. Marked reduction of resistivity is observed from 2 to 30 S/cm from CIO300 to CIO300-N2. b) 3-dimensional variable range hopping fi tting for the before mentioned samples.
Adv. Funct. Mater. 2014, DOI: 10.1002/adfm.201303391
FULL
PAPER
8
www.afm-journal.dewww.MaterialsViews.com
wileyonlinelibrary.com © 2014 WILEY-VCH Verlag GmbH & Co. KGaA, Weinheim
JST-Japan for funding the Research Center for Exotic Nano Carbons, under the Japanese Regional Innovation Strategy Program by the Excellence. M.T. acknowledges the fi nancial support from the MURI project awards Nos. FA9550–12–1–0035 and FA9550–12–1–0471.
[1] D. Cao , P. Feng , J. Wu , Nano Lett. 2004 , 4 , 1489. [2] J.-S. Yu , S. Kang , S. B. Yoon , G. Chai , J. Am. Chem. Soc. 2002 , 124 ,
9382. [3] S. Han , K. Sohn , T. Hyeon , Chem. Mater. 2000 , 12 , 3337. [4] V. G. Gavalas , N. A. Chaniotakis , T. D. Gibson , Biosens. Bioelectron.
1998 , 13 , 1205. [5] S. Sotiropoulou , V. Gavalas , V. Vamvakaki , N.A. Chaniotakis , Bio-
sens. Bioelectron. 2003 , 18 , 211. [6] D.-Y. Kang , S.-O. Kim , Y. J. Chae , J. K. Lee , J. H. Moon , Langmuir
2013 , 29 , 1192. [7] Y. Isshiki , M. Nakamura , S. Tabata , K. Dokko , M. Watanabe , Polym.
Adv. Technol. 2011 , 22 , 1254. [8] C.-M. Yang , K. Kaneko , Carbon 2001 , 39 , 1075. [9] J. Machnikowski , B. Grzyb , J.V. Weber , E. Frackowiak , J.N. Rouzaud ,
F. Beguin , Electrochem. Acta 2004 , 49 , 423. [10] J. Lahaye , G. Nanse , A. Bagreev , V. Strelko , Carbon 1999 , 37 , 585. [11] A. A. Zakhidov , R. H. Baughman , Z. Iqbal , C. Cui , I. Khayrullin ,
S. O. Dantas , J. Marti , V. G. Ralchenko , Science 1998 , 282 , 897. [12] H. Bu , J. Rong , Z. Yang , Rapid Commun. 2002 , 23 , 460. [13] M. B. Shifl ett , H. C. Foley , Carbon 2001 , 39 , 1421. [14] R. Ryoo , S. H. Joo , S. Jun , J. Phys. Chem. B. 1999 , 103 , 7743. [15] R. E. Franklin , Proc. R. Soc. London Series A, Math. Phys. Sci. 1951 ,
209 , 196. [16] P. J. F. Harris , A. Burian , S. Duber . Phil. Mag. Lett. 2000 , 80 , 381. [17] P. J. F. Harris . Crit. Rev. Sol. State Mater. Sc. 2005 , 30 , 235. [18] Y.-J. Lee , P. V. Braun , Adv. Mater. 2003 , 15 , 563. [19] H. Takeda , K. Yoshino . J. Appl. Phys. 2002 , 92 , 5658. [20] C. I. Aguirre , E. Reguera , A. Stein . Adv. Funct. Mater 2010 , 20 ,
2565. [21] H. Kajii , Y. Kawagishi , H. Take , K. Yoshino , A. A. Zakhidov ,
R. H. Baughman . J. Appl. Phys. 2000 , 88 , 758. [22] Z. Y. Chen , J. P. Zhao , Y. H. Yu , X. Wang , S. Q. Yang , T. S. Shi , X.
H. Liu . Mater. Lett. 1997 , 33 , 85. [23] Y. H. Yu , Z. Y. Chen , E. Z. Luo , W. Y. Cheung , J. P. Zhao , X. Wang ,
J. B. Xu , S. P. Wong , I. H. Wilson . J. App. Phys. 2000 , 87 , 2874. [24] X. Wang , P. J. Martin . Appl. Phys. Lett. 1996 , 68 , 1177. [25] R. A. Sidik , A. B. Anderson , N. P. Subramanian , S. P. Kumaraguru ,
B. N. Popov . J. Phys. Chem. B 2006 , 110 , 1787.
Received: October 1, 2013 Revised: November 14, 2013
Published online :
[26] P. H. Chang , M. M. Labes . Chem. Mater. 1989 , 1 , 523. [27] R. Czerw , M. Terrones , J.-C. Charlier , X. Blase , B. Foley ,
R. Kamalakaran , N. Grobert , H. Terrones , D. Tekleab , P. M. Ajayan , W. Blau , M. Rühle , D. L. Carroll . Nano Lett. 2001 , 1 , 457.
[28] M. Terrones , P. M. Ajayan , F. Banhart , X. Blase , D. L. Carroll , J. C. Charlier , R. Czerw , B. Foley , N. Grobert , R. Kamalakaran , P. Kohler-Redlich , M. Rühle , T. Seeger , H. Terrones . Appl. Phys. A 2002 , 74 , 355.
[29] R. Lv , Q. Li , A. R. Botello-Méndez , T. Hayashi , B. Wang , A. Berkdemir , Q. Hao , A. L. Elías , R. Cruz-Silva , H. R. Gutiérrez , Y. Ahm Kim , H. Muramatsu , J. Zhu , M. Endo , H. Terrones , J.-C. Charlier , M. Pan , M. Terrones . Sci. Rep. 2012 , 2 , 586.
[30] A. L. Elías , J. C. Carrero-Sánchez , H. Terrones , M. Endo , J. P. Laclette , M. Terrones . Small 2007 , 3 , 1723.
[31] S. Peng , K. Cho . Nano Lett. 2003 , 3 , 513. [32] F. Villalpando-Pérez , A. H. Romero , E. Muñoz-Sandoval ,
L. M. Martínez , H. Terrones , M. Terrones . Chem. Phys. Lett. 2004 , 386 , 137.
[33] J. G. Lee , S. P. Lee . Sens. Actuators B 2005 , 108 , 450. [34] H. Terrones , M. Terrones . New J. Phys 2003 , 126 , 1. [35] L. G. Bulusheva , A. V. Okotrub , I. A. Kinloch , I. P. Asanov ,
A. G. Kurenya , A. G. Kudashov , X. Chen , H. Song . Phys. Stat. Sol. B 2008 , 245 , 1971.
[36] R. O. Dillon , John A. Woollam , V. Katkanant . Phys. Rev. B. 1984 , 3482.
[37] A. C. Ferrari , J. Robertson , Phys. Rev. B 2000 , 61 , 14096. [38] E. R. Buiel , A.E. George , J.R. Dahn , Carbon 1999 , 37 , 1399 . [39] H. Take , T. Matsumoto , S. Hiwatashi , T. Nakayama , K. Nihara ,
K. Yoshino , Jpn. J. Appl. Phys. 2004 , 43 , 4453 . [40] S. Talapatra , P. G. Ganesan , T. Kim , R. Vajtai , M. Huang , M. Shima ,
G. Ramanath , D. Srivastava , S. C. Deevi , P. M. Ajayan , Phys. Rev. Lett. 2005 , 95 , 097201 .
[41] S. Maldonado , S. Morin , K. J. Stevenson , Carbon 2006 , 44 , 1429 . [42] M. Tabbal , P. Mérel , S. Moisa , M. Chaker , A. Ricard , M. Moisan ,
Appl. Phys. Lett. 1996 , 69 , 1698. [43] Z. Yue , K. R. Benak , J. Wang , C. L. Mangun , J. Economy , J. Mater.
Chem. 2005 , 15 , 3142. [44] T. Sharifi , G. Hu , X. Jia , T. Wågberg , ACS Nano 2012 , 6 , 8904. [45] M.-C. Huang , H. Teng , Carbon 2003 , 41 , 951 [46] E. Raymundo-Piñero , D. Cazorla-Amorós , A. Linares-Solano , Carbon
2003 , 41 , 1925. [47] P.-X. Hou , H. Orikasa , T. Yamazaki , K. Matsuoka , A. Tomita ,
N. Setoyama , Y. Fukushima , T. Kyotani , Chem. Mater. 2005 , 17 , 5187. [48] B. I. Shklovskii , A. L. Efros , Electonic Properties of Doped Semi-
conductors , In: Spring Series In Solid-State Sciences 45, Springer , New York 1984 .
[49] L. V. Govor , M. Goldbach , I. A. Bashmakov , I. B. Butylina , J. Parisi. Phys. Rev. B 2000 , 62 , 2201.
[50] Y. Kaburagi , Y. Hishiyama , Carbon 1995 , 33 , 773.
Adv. Funct. Mater. 2014, DOI: 10.1002/adfm.201303391


