Embed Size (px)
Citation preview
Molecular Ecology (2007) 16, 4493–4503 doi: 10.1111/j.1365-294X.2007.03514.x
© 2007 The AuthorsJournal compilation © 2007 Blackwell Publishing Ltd
Blackwell Publishing LtdContrasting population genetic structure for workers and queens in the putatively unicolonial ant Formica exsecta
ROLF KÜMMERLI*† and LAURENT KELLER**Department of Ecology and Evolution, University of Lausanne, Biophore, 1015 Lausanne, Switzerland, †Institute of Evolutionary Biology, University of Edinburgh, West Mains Road, EH9 3JT, Edinburgh, UK
Abstract
The theory of inclusive fitness provides a powerful explanation for reproductive altruismin social insects, whereby workers gain inclusive fitness benefit by rearing the brood ofrelated queens. Some ant species, however, have unicolonial population structures wheremultiple nests, each containing numerous queens, are interconnected and individualsmove freely between nests. In such cases, nestmate relatedness values may often be indis-tinguishable from zero, which is problematic for inclusive fitness-based explanations ofreproductive altruism. We conducted a detailed population genetic study in the polygynousant Formica exsecta, which has been suggested to form unicolonial populations in its nativehabitat. Analyses based on adult workers indeed confirmed a genetic structuring consistentwith a unicolonial population structure. However, at the population level the genetic struc-turing inferred from worker pupae was not consistent with a unicolonial population struc-ture, but rather suggested a multicolonial population structure of extended family-basednests. These contrasting patterns suggest limited queen dispersal and free adult worker dis-persal. That workers indeed disperse as adults was confirmed by mark–recapture measuresshowing consistent worker movement between nests. Together, these findings describe anew form of social organization, which possibly also characterizes other ant species form-ing unicolonial populations in their native habitats. Moreover, the genetic analyses alsorevealed that while worker nestmate relatedness was indistinguishable from zero at a smallgeographical scale, it was significantly positive at the population level. This highlights theneed to consider the relevant geographical scale when investigating the role of inclusivefitness as a selective force maintaining reproductive altruism.
Keywords: dispersal, family groups, inclusive fitness, social insects, social organization,unicoloniality
Received 13 May 2007; revision accepted 18 July 2007
Introduction
The theory of inclusive fitness (Hamilton 1963, 1964)provides a powerful explanation for reproductive altruismin social insects (Bourke & Franks 1995; Crozier & Pamilo1996; Foster et al. 2006). The theory posits that individualscan pass on their genes not only directly through their ownoffspring, but also indirectly by favouring the reproductionof relatives (kin selection). In nests of social insects, related-ness among nest members is generally high and workers,although foregoing their own reproduction, obtain highinclusive fitness benefits through rearing the brood of relatedqueens (Bourke & Franks 1995).
In many ant species, however, nests contain multiplereproductive queens (polygyny), which results in a decreasedaverage relatedness among nest members (Keller 1993).Moreover, polygyny in ants is sometimes associated withhigh nest densities and the abolishment of nest boundaries,resulting in the mixing of individuals between nests suchthat multiple physically separated nests are interconnected(Hölldobler & Wilson 1977; Passera 1994; Holway et al.1998, 2002; Chapman & Bourke 2001; Giraud et al. 2002;Debout et al. 2007). Such nest networks are called super-colonies if there are no behavioural boundaries (aggres-sion) between nests within a supercolony and if directcooperative interactions are impossible between individualsin distant nests (Pedersen et al. 2006). Within a population,one or several supercolonies may occur with such populations
Correspondence: Rolf Kümmerli, Fax: + 44 131650 6564; E-mail:[email protected]
4494 R . K Ü M M E R L I and L . K E L L E R
© 2007 The AuthorsJournal compilation © 2007 Blackwell Publishing Ltd
being called unicolonial populations (Pedersen et al. 2006).Networks entailing up to several thousand interconnectednests have been observed in invasive ant species like thelittle fire ant, Wasmannia auropunctata (Le Breton et al. 2004;Errard et al. 2005), and the Argentine ant, Linepithemahumile (Passera 1994; Holway et al. 1998; Tsutsui et al. 2000;Giraud et al. 2002; Jaquiery et al. 2005; Thomas et al. 2006),but also occur in ant species in their native range such asthose in the genera Lasius (Yamauchi et al. 1981), Myrmica(Seppä & Pamilo 1995; Seppä & Walin 1996; Pedersen &Boomsma 1999a, b; van der Hammen et al. 2002), Formica(Higashi & Yamauchi 1979; Rosengren & Pamilo 1983;Chapuisat et al. 1997; Beye et al. 1998; Elias et al. 2005;Holzer et al. 2006), and L. humile (Pedersen et al. 2006).
Importantly, relatedness among members of the samesupercolony (i.e. the cooperative unit; Pedersen et al. 2006)is often indistinguishable from zero (Bourke & Franks1995; Keller 1995; Crozier & Pamilo 1996). This is poten-tially problematic to inclusive fitness-based explanationsfor reproductive altruism, and remains an unresolved issuein evolutionary biology. A first step towards resolving thisproblem is to obtain precise information on the geneticstructuring among nests and on whether nests are groupedin supercolonies. To date, all studies that have investigatedpopulation genetic structures of potentially unicolonial antspecies have used genotypes of adult workers for analysis.Unfortunately, such data do not allow one to disentanglethe effects of sexual and adult worker dispersal. This is im-portant because even if workers move freely between nests(which would suggest a unicolonial population structure),related queens might stay in the nest they founded orwhere they were born, which would lead to a multicolonialpopulation structure with significant positive within-nestrelatedness values among queens and among worker pupae.
The aim of this study was to investigate the pattern ofdispersion of both queens and workers. We used polymor-phic microsatellite markers to infer the population geneticstructure of worker pupae, which reflects the populationgenetic structure of their reproductive parents (providedthat brood is not moved between nests) as well as adultworkers, which also takes into account the dispersal patternof the nonreproductive workers. We studied a polygynouspopulation of the ant Formica exsecta, which is a particu-larly interesting species for such a study because it showsseveral characteristics usually associated with unicoloniality.For example, nests contain many queens (Brown & Keller2000) and occur at high densities (Liautard et al. 2003).However, there is evidence that queens and workersdiffer in their dispersal behaviour: new queens are oftenrecruited back to the nest where they were born (Brown& Keller 2002; Kümmerli & Keller unpublished data),whereas adult workers but not brood have been observedto move between nests (Cherix et al. 1980; Katzerke et al.2006; personal observations).
We used highly polymorphic microsatellite loci to estimatenestmate relatedness (r), genetic differentiation betweennests (FST), the overall inbreeding coefficient (FIT) and thegenetically effective number of queens (Ne) at two differentspatial scales (entire population and a smaller scale withinthe population). These estimates can be used to determinewhether a population consists of family-based nests (multi-colonial) or of one or several supercolonies (unicolonial;see Pedersen et al. 2006 and Table 1 for classifications basedon r, FST, FIT and Ne). For these analyses, we used FIT as ameasure of inbreeding because we were interested in thereduction of individual heterozygosity relative to the totalpopulation rather than to the nest (e.g. FIS). Populationsconsisting of family-based nests are typically characterizedby a limited number of reproductive queens per nest (1 <Ne < ∞) that mated randomly in the population (FIT = 0)with the effect that there is a significant genetic differen-tiation (FST > 0) between nests and significant positivenestmate relatedness (r > 0) (Bourke & Franks 1995). Bycontrast, if a population consists of nests belonging to asingle supercolony, r, FST and FIT are expected to be zeroand Ne to be infinite. Finally, if a population consists of mul-tiple supercolonies, the genetic differentiation (FST > 0, r> 0) between nests from different supercolonies should notresult from nests containing a limited number of reproduc-tive queens but from supercolonies being closed breedingunits. Thus, limited dispersal of queens and males amongsupercolonies results in FIT > 0 with the consequence thatrelatedness values must be corrected for such inbreeding(r*) to obtain the true effective number of breeding queensper nest (see Pamilo 1985; Ross 2001). By this correction,r* should become indistinguishable from zero, resultingin Ne = ∞. As the latter genetic pattern is also consistentwith genetic isolation by distance between nests, we testedwhether pairwise genetic differentiation between nestswas correlated with pairwise geographical distance.
Finally, we used the obtained genetic values to estimatethe proportion of migrating sexuals and workers andcompared these estimates with direct measures of workerdispersal obtained in a mark–recapture experiment in thestudy population.
Table 1 Classifications of different population structures based onestimates of F-statistic indices (FST and FIT), within-nest related-ness (r), relatedness corrected for inbreeding (r*) and the geneticeffective queen number (Ne) following Pedersen et al. (2006)
Population structure FST FIT r r* Ne
Multicolonial > 0 0 > 0 > 0 limitedOne supercolony 0 0 0 0 ∞Several supercolonies > 0 > 0 > 0 0 ∞
P O P U L AT I O N G E N E T I C S T R U C T U R E I N A N T S 4495
© 2007 The AuthorsJournal compilation © 2007 Blackwell Publishing Ltd
Materials and methods
Study population and sampling
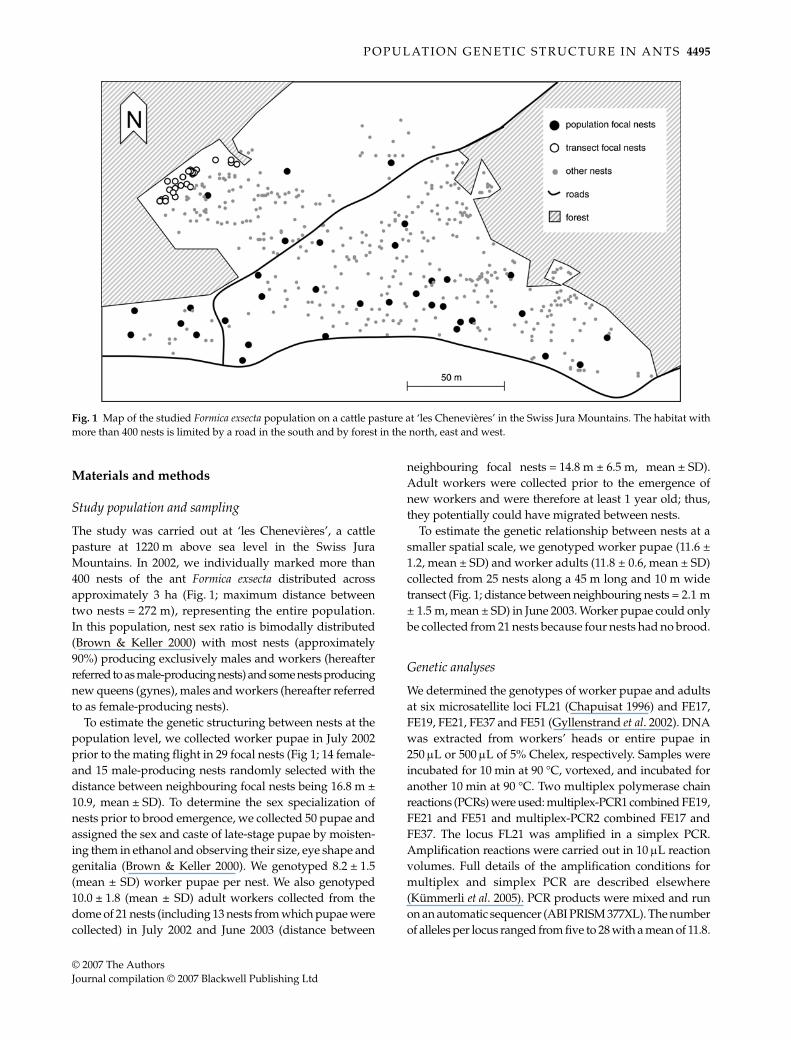
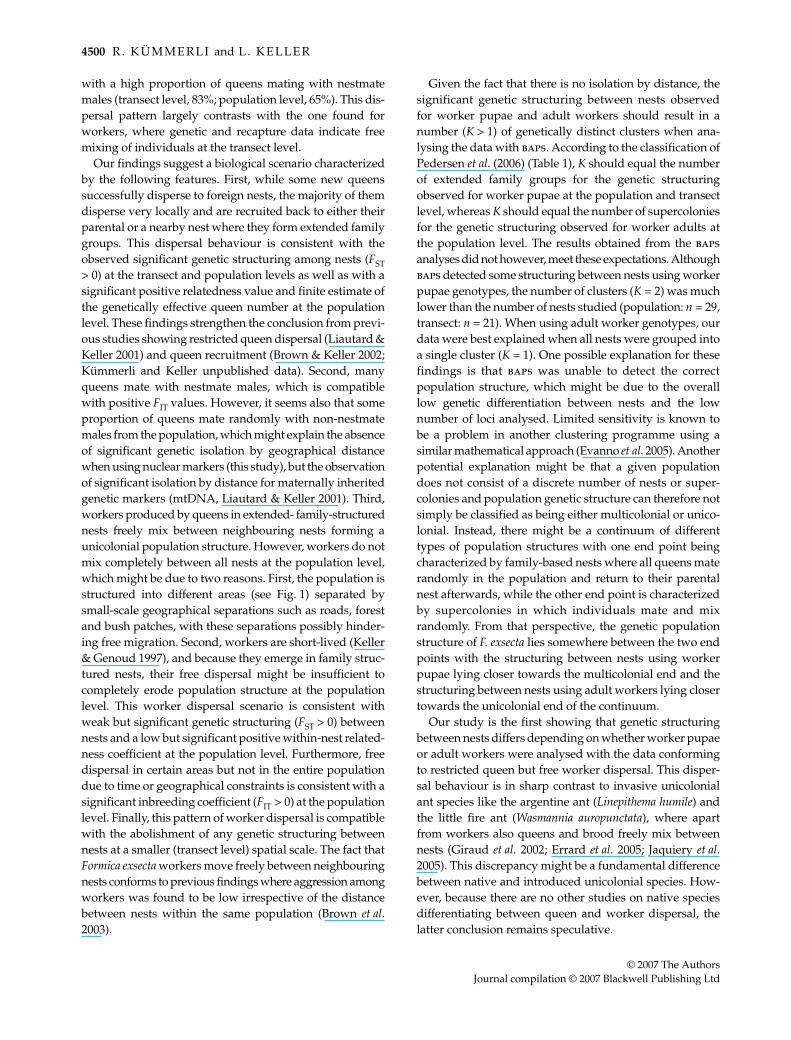
The study was carried out at ‘les Chenevières’, a cattlepasture at 1220 m above sea level in the Swiss JuraMountains. In 2002, we individually marked more than400 nests of the ant Formica exsecta distributed acrossapproximately 3 ha (Fig. 1; maximum distance betweentwo nests = 272 m), representing the entire population.In this population, nest sex ratio is bimodally distributed(Brown & Keller 2000) with most nests (approximately90%) producing exclusively males and workers (hereafterreferred to as male-producing nests) and some nests producingnew queens (gynes), males and workers (hereafter referredto as female-producing nests).
To estimate the genetic structuring between nests at thepopulation level, we collected worker pupae in July 2002prior to the mating flight in 29 focal nests (Fig 1; 14 female-and 15 male-producing nests randomly selected with thedistance between neighbouring focal nests being 16.8 m ±10.9, mean ± SD). To determine the sex specialization ofnests prior to brood emergence, we collected 50 pupae andassigned the sex and caste of late-stage pupae by moisten-ing them in ethanol and observing their size, eye shape andgenitalia (Brown & Keller 2000). We genotyped 8.2 ± 1.5(mean ± SD) worker pupae per nest. We also genotyped10.0 ± 1.8 (mean ± SD) adult workers collected from thedome of 21 nests (including 13 nests from which pupae werecollected) in July 2002 and June 2003 (distance between
neighbouring focal nests = 14.8 m ± 6.5 m, mean ± SD).Adult workers were collected prior to the emergence ofnew workers and were therefore at least 1 year old; thus,they potentially could have migrated between nests.
To estimate the genetic relationship between nests at asmaller spatial scale, we genotyped worker pupae (11.6 ±1.2, mean ± SD) and worker adults (11.8 ± 0.6, mean ± SD)collected from 25 nests along a 45 m long and 10 m widetransect (Fig. 1; distance between neighbouring nests = 2.1 m± 1.5 m, mean ± SD) in June 2003. Worker pupae could onlybe collected from 21 nests because four nests had no brood.
Genetic analyses
We determined the genotypes of worker pupae and adultsat six microsatellite loci FL21 (Chapuisat 1996) and FE17,FE19, FE21, FE37 and FE51 (Gyllenstrand et al. 2002). DNAwas extracted from workers’ heads or entire pupae in250 µL or 500 µL of 5% Chelex, respectively. Samples wereincubated for 10 min at 90 °C, vortexed, and incubated foranother 10 min at 90 °C. Two multiplex polymerase chainreactions (PCRs) were used: multiplex-PCR1 combined FE19,FE21 and FE51 and multiplex-PCR2 combined FE17 andFE37. The locus FL21 was amplified in a simplex PCR.Amplification reactions were carried out in 10 µL reactionvolumes. Full details of the amplification conditions formultiplex and simplex PCR are described elsewhere(Kümmerli et al. 2005). PCR products were mixed and runon an automatic sequencer (ABI PRISM 377XL). The numberof alleles per locus ranged from five to 28 with a mean of 11.8.
Fig. 1 Map of the studied Formica exsecta population on a cattle pasture at ‘les Chenevières’ in the Swiss Jura Mountains. The habitat withmore than 400 nests is limited by a road in the south and by forest in the north, east and west.
4496 R . K Ü M M E R L I and L . K E L L E R
© 2007 The AuthorsJournal compilation © 2007 Blackwell Publishing Ltd
Genetic data analyses
We quantified genetic diversity and structuring within andbetween nests using the program fstat 2.9.4 (Goudet 1995).First, we estimated the expected and observed hetero-zygosities following Nei (1978). We then tested each of ourfour data sets (worker pupae and adults at the populationand transect levels) for departures from the Hardy–Weinberg equilibrium by randomizing alleles amongindividuals within nests using 10 000 iterations. Linkagedisequilibrium between pairs of loci in each sample wastested separately for the four different data sets using Gstatistics (Goudet et al. 1996) implemented in fstat 2.9.4.We calculated the F-statistic indices FST and FIT followingWeir & Cockerham (1984), which provide measures of thereduction in heterozygosity between subpopulations (FST)and of individuals relative to the total population (FIT). Forthese analyses, we regarded each nest as a subpopulationconsisting of the individuals genotyped and the entiresample of nests as the total population. Standard errors ofF statistics were obtained by jackknifing over loci. Significantdeviations from zero were assessed using randomizationtests (Manly 1997) by applying 10 000 iterations. For FSTvalues, genotypes were permuted whereas for FIT valuesalleles were permuted among nests.
We estimated the relatedness (r) among nest memberswith the program relatedness 5.0.8 (Queller & Goodnight1989) and obtained standard errors by jackknifing overnests. Relatedness (r) is the probability by which an alleleis more likely to be shared among nest members thanwould be expected from the allele’s frequency in thepopulation (Bourke & Franks 1995; Crozier & Pamilo 1996).To obtain estimates of the true genetically effective queennumber (Ne) corresponding to the number of equallyreproducing queens needed to explain a given nest kinstructure, we used the relatedness values corrected forinbreeding effects (r*) following the method suggested byPamilo (1985). Ne is then given as
(eqn 1)
where rs is the relatedness among female offspring of thesame matriline, rq is the relatedness among nestmate queensand rm1 is the relatedness among the mates of nestmate queens(Seppä 1994). The relatedness among female offspringof the same matriline (rs) is 1/(2me) + 1/4, where me is themean effective mating frequency of queens in the nest(Queller 1993; Ross 1993). In our study population, rq, rm1and me have previously been estimated to be 0.084 ± 0.006(mean ± SE), 0.020 ± 0.003 (mean ± SE) and 1.2, respectively(Liautard, Pedersen, Ovaskainen and Keller unpublisheddata).
To determine whether population structuring originatedfrom division into genetically differentiated clusters (nestsor supercolonies), we used the program baps 4.12 (availableat http://www.rni.helsinki.fi/~jic/bapspage.html). Thissoftware implements a Bayesian approach to cluster groupsof individuals (in our case groups of nestmate workers),with the optimal number of clusters (K, in our case theoptimal number of estimated true nests or supercolonies)given by the highest log (ml = marginal likelihood) of thedata (Corander et al. 2003). We conducted repeated spatialanalyses (10 runs per data set) using the coordinates of nestlocations as information (Corander et al. in press) anddefined the maximal K as the number of nests from whichsamples were collected.
To determine whether population structuring originatedfrom isolation by distance, we tested whether there was anassociation between pairwise genetic and geographicaldistances between nests. Matrices of pairwise FST betweennests (obtained with fstat 2.9.4) were transformed by FST/(1 − FST) and the matrices of geographical distances werelog-transformed as proposed by Rousset (1997) for two-dimensional habitats. Geographical distances between nestsat the population level were measured by determining thegeographical coordinates of each nest using a GPS 12XL(Garmin). For distance measures within the transect, weused a measuring tape to assess the exact position of eachnest on a predefined grid. We calculated the correlationbetween the matrices of pairwise genetic and geographicaldistance with a Mantel test (r-statistics) using the programr-package 4.0 (available on http://www.bio.umontreal.ca/Casgrain/en/labo/R/).
Estimating dispersal of sexuals
We adopted the dispersal model proposed by Chapuisat &Keller (1999) which assumes that gene flow is mediated byqueens and males, with a proportion of queens originatingfrom within the nest that mate with nestmate males (α),and the remaining queens (1 − α) coming from the panmicticpopulation after having mated once at random (Chapuisat& Keller 1999).
These assumptions are reasonable because behaviouralexperiments revealed that some proportion of queens(35%) and males (66%) depart on mating flights, whereasthe remaining queens and males mate within or on thesurface of their parental nest (Schneider 2002). Moreover,genetic analyses also support the view that a highproportion of queens stay within their parental nest aftermating (Liautard & Keller 2001; Brown & Keller 2002) andmate with related males (Kümmerli & Keller in press).Meanwhile, our recent genetic results also suggest thatnests can recruit queens from other nests with these queenshaving probably mated randomly (Kümmerli and Kellerunpublished data).
Nr r r
r r res q m
q m
=− −
− −
4 2
4 21
1*,
P O P U L AT I O N G E N E T I C S T R U C T U R E I N A N T S 4497
© 2007 The AuthorsJournal compilation © 2007 Blackwell Publishing Ltd
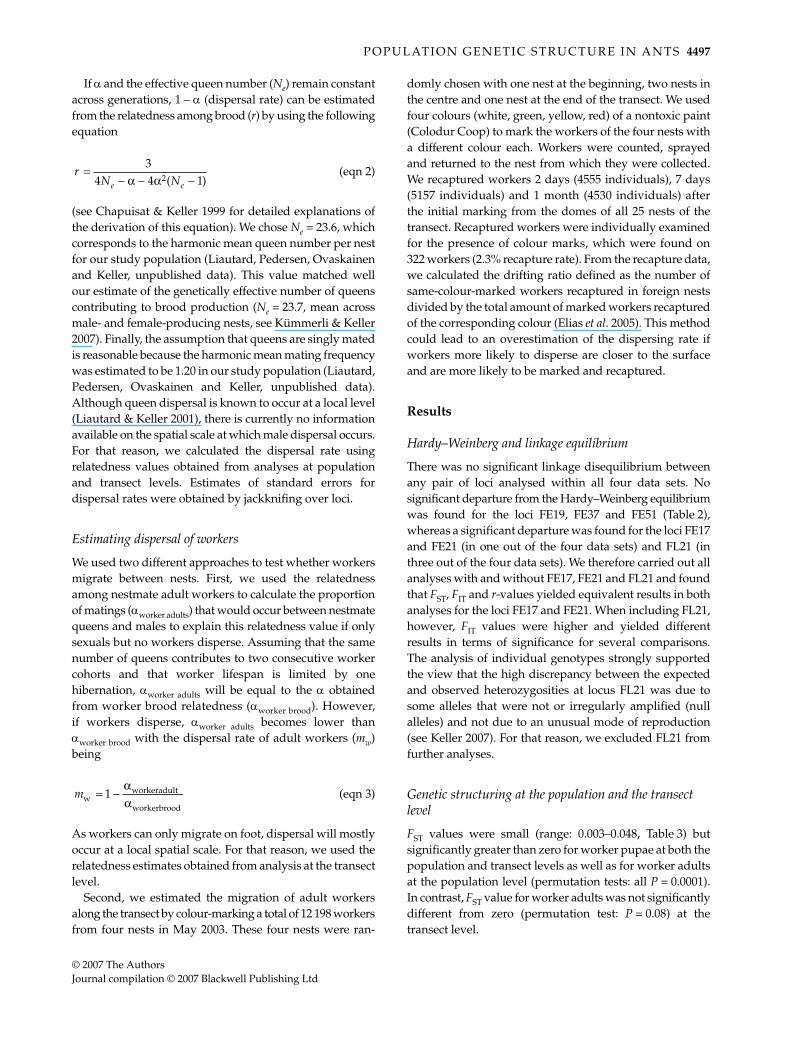
If α and the effective queen number (Ne) remain constantacross generations, 1 − α (dispersal rate) can be estimatedfrom the relatedness among brood (r) by using the followingequation
(eqn 2)
(see Chapuisat & Keller 1999 for detailed explanations ofthe derivation of this equation). We chose Ne = 23.6, whichcorresponds to the harmonic mean queen number per nestfor our study population (Liautard, Pedersen, Ovaskainenand Keller, unpublished data). This value matched wellour estimate of the genetically effective number of queenscontributing to brood production (Ne = 23.7, mean acrossmale- and female-producing nests, see Kümmerli & Keller2007). Finally, the assumption that queens are singly matedis reasonable because the harmonic mean mating frequencywas estimated to be 1.20 in our study population (Liautard,Pedersen, Ovaskainen and Keller, unpublished data).Although queen dispersal is known to occur at a local level(Liautard & Keller 2001), there is currently no informationavailable on the spatial scale at which male dispersal occurs.For that reason, we calculated the dispersal rate usingrelatedness values obtained from analyses at populationand transect levels. Estimates of standard errors fordispersal rates were obtained by jackknifing over loci.
Estimating dispersal of workers
We used two different approaches to test whether workersmigrate between nests. First, we used the relatednessamong nestmate adult workers to calculate the proportionof matings (αworker adults) that would occur between nestmatequeens and males to explain this relatedness value if onlysexuals but no workers disperse. Assuming that the samenumber of queens contributes to two consecutive workercohorts and that worker lifespan is limited by onehibernation, αworker adults will be equal to the α obtainedfrom worker brood relatedness (αworker brood). However,if workers disperse, αworker adults becomes lower thanαworker brood with the dispersal rate of adult workers (mw)being
(eqn 3)
As workers can only migrate on foot, dispersal will mostlyoccur at a local spatial scale. For that reason, we used therelatedness estimates obtained from analysis at the transectlevel.
Second, we estimated the migration of adult workersalong the transect by colour-marking a total of 12 198 workersfrom four nests in May 2003. These four nests were ran-
domly chosen with one nest at the beginning, two nests inthe centre and one nest at the end of the transect. We usedfour colours (white, green, yellow, red) of a nontoxic paint(Colodur Coop) to mark the workers of the four nests witha different colour each. Workers were counted, sprayedand returned to the nest from which they were collected.We recaptured workers 2 days (4555 individuals), 7 days(5157 individuals) and 1 month (4530 individuals) afterthe initial marking from the domes of all 25 nests of thetransect. Recaptured workers were individually examinedfor the presence of colour marks, which were found on322 workers (2.3% recapture rate). From the recapture data,we calculated the drifting ratio defined as the number ofsame-colour-marked workers recaptured in foreign nestsdivided by the total amount of marked workers recapturedof the corresponding colour (Elias et al. 2005). This methodcould lead to an overestimation of the dispersing rate ifworkers more likely to disperse are closer to the surfaceand are more likely to be marked and recaptured.
Results
Hardy–Weinberg and linkage equilibrium
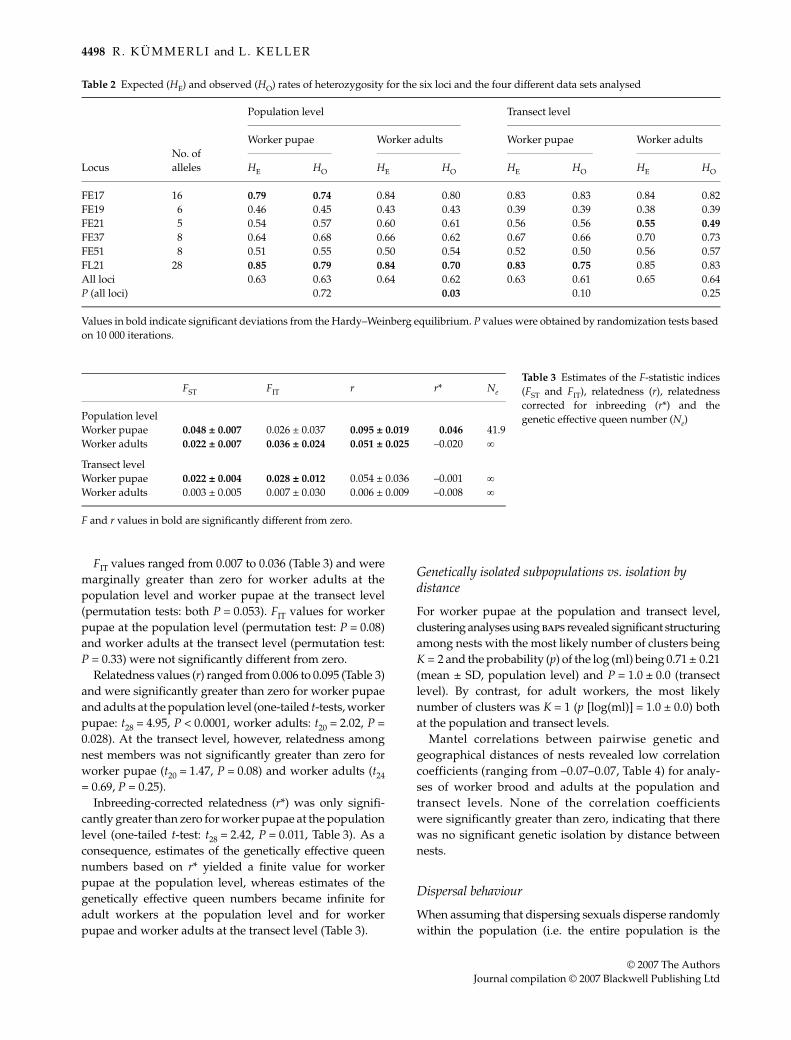
There was no significant linkage disequilibrium betweenany pair of loci analysed within all four data sets. Nosignificant departure from the Hardy–Weinberg equilibriumwas found for the loci FE19, FE37 and FE51 (Table 2),whereas a significant departure was found for the loci FE17and FE21 (in one out of the four data sets) and FL21 (inthree out of the four data sets). We therefore carried out allanalyses with and without FE17, FE21 and FL21 and foundthat FST, FIT and r-values yielded equivalent results in bothanalyses for the loci FE17 and FE21. When including FL21,however, FIT values were higher and yielded differentresults in terms of significance for several comparisons.The analysis of individual genotypes strongly supportedthe view that the high discrepancy between the expectedand observed heterozygosities at locus FL21 was due tosome alleles that were not or irregularly amplified (nullalleles) and not due to an unusual mode of reproduction(see Keller 2007). For that reason, we excluded FL21 fromfurther analyses.
Genetic structuring at the population and the transect level
FST values were small (range: 0.003–0.048, Table 3) butsignificantly greater than zero for worker pupae at both thepopulation and transect levels as well as for worker adultsat the population level (permutation tests: all P = 0.0001).In contrast, FST value for worker adults was not significantlydifferent from zero (permutation test: P = 0.08) at thetransect level.
rN Ne e
=− − −
34 4 12α α ( )
mwworkeradult
workerbrood
= −1αα
4498 R . K Ü M M E R L I and L . K E L L E R
© 2007 The AuthorsJournal compilation © 2007 Blackwell Publishing Ltd
FIT values ranged from 0.007 to 0.036 (Table 3) and weremarginally greater than zero for worker adults at thepopulation level and worker pupae at the transect level(permutation tests: both P = 0.053). FIT values for workerpupae at the population level (permutation test: P = 0.08)and worker adults at the transect level (permutation test:P = 0.33) were not significantly different from zero.
Relatedness values (r) ranged from 0.006 to 0.095 (Table 3)and were significantly greater than zero for worker pupaeand adults at the population level (one-tailed t-tests, workerpupae: t28 = 4.95, P < 0.0001, worker adults: t20 = 2.02, P =0.028). At the transect level, however, relatedness amongnest members was not significantly greater than zero forworker pupae (t20 = 1.47, P = 0.08) and worker adults (t24= 0.69, P = 0.25).
Inbreeding-corrected relatedness (r*) was only signifi-cantly greater than zero for worker pupae at the populationlevel (one-tailed t-test: t28 = 2.42, P = 0.011, Table 3). As aconsequence, estimates of the genetically effective queennumbers based on r* yielded a finite value for workerpupae at the population level, whereas estimates of thegenetically effective queen numbers became infinite foradult workers at the population level and for workerpupae and worker adults at the transect level (Table 3).
Genetically isolated subpopulations vs. isolation by distance
For worker pupae at the population and transect level,clustering analyses using baps revealed significant structuringamong nests with the most likely number of clusters beingK = 2 and the probability (p) of the log (ml) being 0.71 ± 0.21(mean ± SD, population level) and P = 1.0 ± 0.0 (transectlevel). By contrast, for adult workers, the most likelynumber of clusters was K = 1 (p [log(ml)] = 1.0 ± 0.0) bothat the population and transect levels.
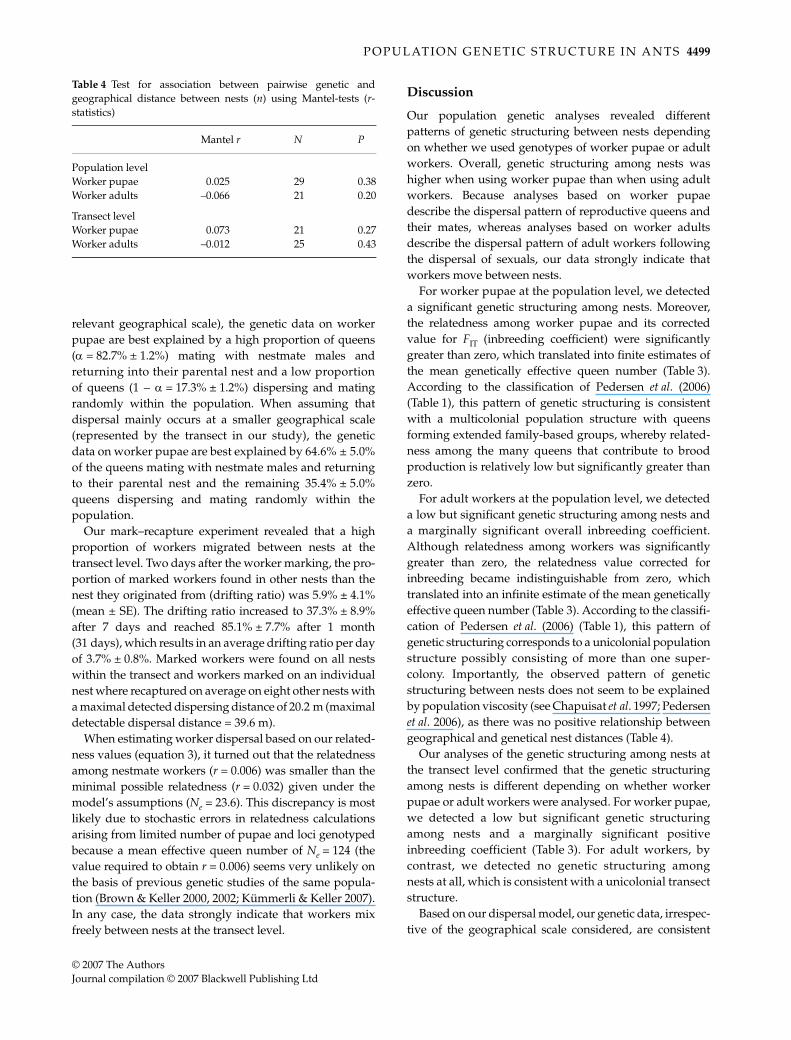
Mantel correlations between pairwise genetic andgeographical distances of nests revealed low correlationcoefficients (ranging from –0.07–0.07, Table 4) for analy-ses of worker brood and adults at the population andtransect levels. None of the correlation coefficientswere significantly greater than zero, indicating that therewas no significant genetic isolation by distance betweennests.
Dispersal behaviour
When assuming that dispersing sexuals disperse randomlywithin the population (i.e. the entire population is the
Table 2 Expected (HE) and observed (HO) rates of heterozygosity for the six loci and the four different data sets analysed
LocusNo. of alleles
Population level Transect level
Worker pupae Worker adults Worker pupae Worker adults
HE HO HE HO HE HO HE HO
FE17 16 0.79 0.74 0.84 0.80 0.83 0.83 0.84 0.82FE19 6 0.46 0.45 0.43 0.43 0.39 0.39 0.38 0.39FE21 5 0.54 0.57 0.60 0.61 0.56 0.56 0.55 0.49FE37 8 0.64 0.68 0.66 0.62 0.67 0.66 0.70 0.73FE51 8 0.51 0.55 0.50 0.54 0.52 0.50 0.56 0.57FL21 28 0.85 0.79 0.84 0.70 0.83 0.75 0.85 0.83All loci 0.63 0.63 0.64 0.62 0.63 0.61 0.65 0.64P (all loci) 0.72 0.03 0.10 0.25
Values in bold indicate significant deviations from the Hardy–Weinberg equilibrium. P values were obtained by randomization tests based on 10 000 iterations.
Table 3 Estimates of the F-statistic indices(FST and FIT), relatedness (r), relatednesscorrected for inbreeding (r*) and thegenetic effective queen number (Ne)
FST FIT r r* Ne
Population levelWorker pupae 0.048 ± 0.007 0.026 ± 0.037 0.095 ± 0.019 0.046 41.9Worker adults 0.022 ± 0.007 0.036 ± 0.024 0.051 ± 0.025 –0.020 ∞
Transect levelWorker pupae 0.022 ± 0.004 0.028 ± 0.012 0.054 ± 0.036 –0.001 ∞Worker adults 0.003 ± 0.005 0.007 ± 0.030 0.006 ± 0.009 –0.008 ∞
F and r values in bold are significantly different from zero.
P O P U L AT I O N G E N E T I C S T R U C T U R E I N A N T S 4499
© 2007 The AuthorsJournal compilation © 2007 Blackwell Publishing Ltd
relevant geographical scale), the genetic data on workerpupae are best explained by a high proportion of queens(α = 82.7% ± 1.2%) mating with nestmate males andreturning into their parental nest and a low proportionof queens (1 − α = 17.3% ± 1.2%) dispersing and matingrandomly within the population. When assuming thatdispersal mainly occurs at a smaller geographical scale(represented by the transect in our study), the geneticdata on worker pupae are best explained by 64.6% ± 5.0%of the queens mating with nestmate males and returningto their parental nest and the remaining 35.4% ± 5.0%queens dispersing and mating randomly within thepopulation.
Our mark–recapture experiment revealed that a highproportion of workers migrated between nests at thetransect level. Two days after the worker marking, the pro-portion of marked workers found in other nests than thenest they originated from (drifting ratio) was 5.9% ± 4.1%(mean ± SE). The drifting ratio increased to 37.3% ± 8.9%after 7 days and reached 85.1% ± 7.7% after 1 month(31 days), which results in an average drifting ratio per dayof 3.7% ± 0.8%. Marked workers were found on all nestswithin the transect and workers marked on an individualnest where recaptured on average on eight other nests witha maximal detected dispersing distance of 20.2 m (maximaldetectable dispersal distance = 39.6 m).
When estimating worker dispersal based on our related-ness values (equation 3), it turned out that the relatednessamong nestmate workers (r = 0.006) was smaller than theminimal possible relatedness (r = 0.032) given under themodel’s assumptions (Ne = 23.6). This discrepancy is mostlikely due to stochastic errors in relatedness calculationsarising from limited number of pupae and loci genotypedbecause a mean effective queen number of Ne = 124 (thevalue required to obtain r = 0.006) seems very unlikely onthe basis of previous genetic studies of the same popula-tion (Brown & Keller 2000, 2002; Kümmerli & Keller 2007).In any case, the data strongly indicate that workers mixfreely between nests at the transect level.
Discussion
Our population genetic analyses revealed differentpatterns of genetic structuring between nests dependingon whether we used genotypes of worker pupae or adultworkers. Overall, genetic structuring among nests washigher when using worker pupae than when using adultworkers. Because analyses based on worker pupaedescribe the dispersal pattern of reproductive queens andtheir mates, whereas analyses based on worker adultsdescribe the dispersal pattern of adult workers followingthe dispersal of sexuals, our data strongly indicate thatworkers move between nests.
For worker pupae at the population level, we detecteda significant genetic structuring among nests. Moreover,the relatedness among worker pupae and its correctedvalue for FIT (inbreeding coefficient) were significantlygreater than zero, which translated into finite estimates ofthe mean genetically effective queen number (Table 3).According to the classification of Pedersen et al. (2006)(Table 1), this pattern of genetic structuring is consistentwith a multicolonial population structure with queensforming extended family-based groups, whereby related-ness among the many queens that contribute to broodproduction is relatively low but significantly greater thanzero.
For adult workers at the population level, we detecteda low but significant genetic structuring among nests anda marginally significant overall inbreeding coefficient.Although relatedness among workers was significantlygreater than zero, the relatedness value corrected forinbreeding became indistinguishable from zero, whichtranslated into an infinite estimate of the mean geneticallyeffective queen number (Table 3). According to the classifi-cation of Pedersen et al. (2006) (Table 1), this pattern ofgenetic structuring corresponds to a unicolonial populationstructure possibly consisting of more than one super-colony. Importantly, the observed pattern of geneticstructuring between nests does not seem to be explainedby population viscosity (see Chapuisat et al. 1997; Pedersenet al. 2006), as there was no positive relationship betweengeographical and genetical nest distances (Table 4).
Our analyses of the genetic structuring among nests atthe transect level confirmed that the genetic structuringamong nests is different depending on whether workerpupae or adult workers were analysed. For worker pupae,we detected a low but significant genetic structuringamong nests and a marginally significant positiveinbreeding coefficient (Table 3). For adult workers, bycontrast, we detected no genetic structuring amongnests at all, which is consistent with a unicolonial transectstructure.
Based on our dispersal model, our genetic data, irrespec-tive of the geographical scale considered, are consistent
Table 4 Test for association between pairwise genetic andgeographical distance between nests (n) using Mantel-tests (r-statistics)
Mantel r N P
Population levelWorker pupae 0.025 29 0.38Worker adults –0.066 21 0.20
Transect levelWorker pupae 0.073 21 0.27Worker adults –0.012 25 0.43
4500 R . K Ü M M E R L I and L . K E L L E R
© 2007 The AuthorsJournal compilation © 2007 Blackwell Publishing Ltd
with a high proportion of queens mating with nestmatemales (transect level, 83%; population level, 65%). This dis-persal pattern largely contrasts with the one found forworkers, where genetic and recapture data indicate freemixing of individuals at the transect level.
Our findings suggest a biological scenario characterizedby the following features. First, while some new queenssuccessfully disperse to foreign nests, the majority of themdisperse very locally and are recruited back to either theirparental or a nearby nest where they form extended familygroups. This dispersal behaviour is consistent with theobserved significant genetic structuring among nests (FST> 0) at the transect and population levels as well as with asignificant positive relatedness value and finite estimate ofthe genetically effective queen number at the populationlevel. These findings strengthen the conclusion from previ-ous studies showing restricted queen dispersal (Liautard &Keller 2001) and queen recruitment (Brown & Keller 2002;Kümmerli and Keller unpublished data). Second, manyqueens mate with nestmate males, which is compatiblewith positive FIT values. However, it seems also that someproportion of queens mate randomly with non-nestmatemales from the population, which might explain the absenceof significant genetic isolation by geographical distancewhen using nuclear markers (this study), but the observationof significant isolation by distance for maternally inheritedgenetic markers (mtDNA, Liautard & Keller 2001). Third,workers produced by queens in extended- family-structurednests freely mix between neighbouring nests forming aunicolonial population structure. However, workers do notmix completely between all nests at the population level,which might be due to two reasons. First, the population isstructured into different areas (see Fig. 1) separated bysmall-scale geographical separations such as roads, forestand bush patches, with these separations possibly hinder-ing free migration. Second, workers are short-lived (Keller& Genoud 1997), and because they emerge in family struc-tured nests, their free dispersal might be insufficient tocompletely erode population structure at the populationlevel. This worker dispersal scenario is consistent withweak but significant genetic structuring (FST > 0) betweennests and a low but significant positive within-nest related-ness coefficient at the population level. Furthermore, freedispersal in certain areas but not in the entire populationdue to time or geographical constraints is consistent with asignificant inbreeding coefficient (FIT > 0) at the populationlevel. Finally, this pattern of worker dispersal is compatiblewith the abolishment of any genetic structuring betweennests at a smaller (transect level) spatial scale. The fact thatFormica exsecta workers move freely between neighbouringnests conforms to previous findings where aggression amongworkers was found to be low irrespective of the distancebetween nests within the same population (Brown et al.2003).
Given the fact that there is no isolation by distance, thesignificant genetic structuring between nests observedfor worker pupae and adult workers should result in anumber (K > 1) of genetically distinct clusters when ana-lysing the data with baps. According to the classification ofPedersen et al. (2006) (Table 1), K should equal the numberof extended family groups for the genetic structuringobserved for worker pupae at the population and transectlevel, whereas K should equal the number of supercoloniesfor the genetic structuring observed for worker adults atthe population level. The results obtained from the bapsanalyses did not however, meet these expectations. Althoughbaps detected some structuring between nests using workerpupae genotypes, the number of clusters (K = 2) was muchlower than the number of nests studied (population: n = 29,transect: n = 21). When using adult worker genotypes, ourdata were best explained when all nests were grouped intoa single cluster (K = 1). One possible explanation for thesefindings is that baps was unable to detect the correctpopulation structure, which might be due to the overalllow genetic differentiation between nests and the lownumber of loci analysed. Limited sensitivity is known tobe a problem in another clustering programme using asimilar mathematical approach (Evanno et al. 2005). Anotherpotential explanation might be that a given populationdoes not consist of a discrete number of nests or super-colonies and population genetic structure can therefore notsimply be classified as being either multicolonial or unico-lonial. Instead, there might be a continuum of differenttypes of population structures with one end point beingcharacterized by family-based nests where all queens materandomly in the population and return to their parentalnest afterwards, while the other end point is characterizedby supercolonies in which individuals mate and mixrandomly. From that perspective, the genetic populationstructure of F. exsecta lies somewhere between the two endpoints with the structuring between nests using workerpupae lying closer towards the multicolonial end and thestructuring between nests using adult workers lying closertowards the unicolonial end of the continuum.
Our study is the first showing that genetic structuringbetween nests differs depending on whether worker pupaeor adult workers were analysed with the data conformingto restricted queen but free worker dispersal. This disper-sal behaviour is in sharp contrast to invasive unicolonialant species like the argentine ant (Linepithema humile) andthe little fire ant (Wasmannia auropunctata), where apartfrom workers also queens and brood freely mix betweennests (Giraud et al. 2002; Errard et al. 2005; Jaquiery et al.2005). This discrepancy might be a fundamental differencebetween native and introduced unicolonial species. How-ever, because there are no other studies on native speciesdifferentiating between queen and worker dispersal, thelatter conclusion remains speculative.
P O P U L AT I O N G E N E T I C S T R U C T U R E I N A N T S 4501
© 2007 The AuthorsJournal compilation © 2007 Blackwell Publishing Ltd
Although reports of ant species exhibiting unicolonialpopulation structures are increasing, the question remains:what is the benefit of free dispersal? It has been suggestedthat by reducing the costs associated with territoriality,unicoloniality allows higher worker densities and moreeffective habitat monopolization (Holway et al. 1998;Holway & Suarez 2004; Debout et al. 2007). Although thismight be true and probably also applies to F. exsecta, it doesnot explain the effect of free dispersal on the erosion ofrelatedness, which leads to an evolutionary paradox inthat reproductive altruism can no longer be explained bykin selection. However, our analyses show that the erosionof relatedness is incomplete such that there was a signifi-cant genetic structuring between nests at the populationlevel, whereas no structuring was observed between nestsat the transect level. These findings raise the question of themost relevant scale to use when investigating the role ofkin selection in maintaining reproductive altruism inunicolonial species. Theoretical studies have shown thatrelatedness relevant for kin selection should be measuredat the level of the ‘economic neighbourhood’, the scale atwhich intraspecific competition generally takes place(Pollock 1983; Taylor 1992; Kelly 1994; Queller 1994; Westet al. 2002). If the relevant spatial scale at which competi-tion in F. exsecta occurs is small (i.e. represented by thetransect level in our study), the nestmate relatednessestimate (r = 0.006) is undistinguishable from zero. Thus,the maintenance of reproductive altruism could not beexplained by kin selection at this spatial scale of competi-tion. By contrast, if the relevant spatial scale at which com-petition in F. exsecta occurs is larger (i.e. represented by thepopulation level in our study), our nestmate relatednessestimate (r = 0.051) is significantly greater than zero, withkin selection being a plausible mechanism explainingthe maintenance of reproductive altruism in F. exsecta.Although the exact scale at which intraspecific competitionoccurs in unknown, the studied population is quite small(Fig. 1, maximum distance between two nests = 272 m); thus,it seems possible for intraspecific competition to occur atthe population scale.
In conclusion, this study reveals a new type of socialorganization among group-living animals, whereby queensof the ant F. exsecta form extended family-based nests(multicolonial population structure), whereas workers mixfreely between nests (unicolonial population structure). Sucha social organization might be a common characteristic ofother ant species forming unicolonial populations in theirnative habitats. However, our analyses also showed thatthe population genetic structure cannot simply be classi-fied as being either multicolonial or unicolonial, but ratherlies on a continuum of social organizations ranging fromstrictly family-based nests where all individuals return totheir parental nest, to supercolonies where all individualsmix freely between nests. While this study emphasizes the
importance of considering the type of individuals usedwhen interpreting genetic data, it also adds a new exampleto the incredible diversity of social organizations (Keller2007) existing in social insects.
Acknowledgements
We thank Sara Helms Cahan, Jes Pedersen, Adin Ross-Gillespie,Valérie Vogel and three anonymous referees for constructivecomments on the manuscript and Grégoire Castella for help in thelaboratory. This work was supported by several grants from theSwiss National Science Foundation.
References
Beye M, Neumann P, Chapuisat M, Pamilo P, Moritz RFA (1998)Nestmate recognition and the genetic relatedness of nests in the antFormica pratensis. Behavioral Ecology and Sociobiology, 43, 67–72.
Bourke AFG, Franks NR (1995) Social Evolution in Ants. PrincetonUniversity Press, Princeton, New Jersey.
Brown W, Keller L (2000) Colony sex ratios vary with queennumber but not relatedness asymmetry in the ant Formica exsecta.Proceedings of the Royal Society of London. Series B, BiologicalSciences, 267, 1751–1757.
Brown WD, Keller L (2002) Queen recruitment and split sex ratiosin polygynous colonies of the wood ant Formica exsecta. EcologyLetters, 5, 102–109.
Brown WD, Liautard C, Keller L (2003) Sex-ratio dependentexecution of queens in polygynous colonies of the ant Formicaexsecta. Oecologia, 134, 12–17.
Chapman RE, Bourke AFG (2001) The influence of sociality on theconservation biology of social insects. Ecology Letters, 4, 650–662.
Chapuisat M (1996) Characterization of microsatellite loci inFormica lugubris B and their variability in other ant species.Molecular Ecology, 5, 599–601.
Chapuisat M, Goudet J, Keller L (1997) Microsatellites reveal highpopulation viscosity and limited dispersal in the ant Formicaparalugubris. Evolution, 51, 475–482.
Chapuisat M, Keller L (1999) Extended family structure in the antFormica parlugubris: the role of the breeding system. BehavioralEcology and Sociobiology, 46, 405–412.
Cherix D, Werner P, Catzeflis F (1980) Organisation spatiale d’unsystème polycalique chez Formica (Coptoformica) exsecta Nyl.(Hymenoptera: Formicidae). Mitteilungen der SchweizerischenEntomologischen Gesellschaft, 53, 163–171.
Corander J, Sirén J, Arjas E (in press) Bayesian spatial modellingof genetic population structure. Computational Statistics, doi:10.1007/500180-007-0072x.
Corander J, Waldmann P, Sillanpää MJ (2003) Bayesian analysis ofgenetic differentiation between populations. Genetics, 163, 367–374.
Crozier R, Pamilo P (1996) Evolution of Social Insect Colonies: SexAllocation and Kin Selection. Oxford University Press, Oxford, UK.
Debout G, Schatz B, Elias M, McKey D (2007) Polydomy in ants:what we know, what we think we know, and what remains to bedone. Biological Journal of the Linnean Society, 90, 319–348.
Elias M, Rosengren R, Sundström L (2005) Seasonal polydomy andunicoloniality in a polygynous population of the red woodant Formica truncorum. Behavioral Ecology and Sociobiology, 57,339–349.
4502 R . K Ü M M E R L I and L . K E L L E R
© 2007 The AuthorsJournal compilation © 2007 Blackwell Publishing Ltd
Errard C, Delabie J, Jourdan H, Hefetz A (2005) Intercontinentalchemical variation in the invasive ant Wasmannia auropunctata(Roger) (Hymenoptera Formicidae): a key to the invasive successof a tramp species. Naturwissenschaften, 92, 319–323.
Evanno G, Regnaut S, Goudet J (2005) Detecting the numberof clusters of individuals using the software structure: asimulation study. Molecular Ecology, 14, 2611–2620.
Foster KR, Wenseleers T, Ratnieks FLW (2006) Kin selection is thekey to altruism. Trends in Ecology & Evolution, 21, 57–60.
Giraud T, Pedersen JS, Keller L (2002) Evolution of supercolonies:the Argentine ants of southern Europe. Proceedings of the NationalAcademy of Sciences, USA, 99, 6075–6079.
Goudet J (1995) fstat (version 1.2): a computer program to calculateF-statistics. Journal of Heredity, 86, 485–486.
Goudet J, Raymond M, De Meeüs T, Rousset F (1996) Testing differ-entiation in diploid populations. Genetics, 144, 1933–1940.
Gyllenstrand N, Gertsch PJ, Pamilo P (2002) Polymorphic micro-satellite DNA markers in the ant Formica exsecta. Molecular EcologyNotes, 2, 67–69.
Hamilton WD (1963) The evolution of altruistic behavior. AmericanNaturalist, 97, 354–356.
Hamilton WD (1964) The genetical evolution of social behaviour.Journal of Theoretical Biology, 7, 1–52.
van der Hammen T, Pedersen JS, Boomsma JJ (2002) Convergentdevelopment of low-relatedness supercolonies in Myrmica ants.Heredity, 89, 83–89.
Higashi S, Yamauchi K (1979) Influence of a supercolonial antFormica (Formica yessensis) Forel on the distribution of other antsin Ishikari coast. Japanese Journal of Ecology, 29, 257–264.
Hölldobler B, Wilson EO (1977) Number of queens: important traitin ant evolution. Naturwissenschaften, 64, 8–15.
Holway DA, Lach L, Suarez AV, Tsutsui ND, Case TJ (2002)The causes and consequences of ant invasions. Annual Review ofEcology and Systematics, 33, 181–233.
Holway DA, Suarez AV (2004) Colony-structure variation andinterspecific competitive ability in the invasive Argentine ant.Oecologia, 138, 216–222.
Holway DA, Suarez AV, Case TJ (1998) Loss of intraspecificaggression in the success of a widespread invasive social insect.Science, 282, 949–952.
Holzer B, Chapuisat M, Kremer N, Finet C, Keller L (2006a)Unicoloniality, recognition and genetic differentiation in a nativeFormica ant. Journal of Evolutionary Biology, 19, 2031–2039.
Jaquiery J, Vogel V, Keller L (2005) Multilevel genetic analyses oftwo European supercolonies of the Argentine ant, Linepithemahumile. Molecular Ecology, 14, 589–598.
Katzerke A, Neumann P, Pirk CWW, Bliss P, Moritz RFA (2006)Seasonal nestmate recognition in the ant Formica exsecta.Behavioral Ecology and Sociobiology, 61, 143–150.
Keller L (1993) Queen Number Sociality in Insects. Oxford UniversityPress, Oxford, UK.
Keller L (1995) Social life: the paradox of multiple-queen colonies.Trends in Ecology & Evolution, 10, 355–360.
Keller L (2007) Uncovering the biodiversity of genetic and re-productive systems. Time for a more open approach. AmericanNaturalist, 169, 1–8.
Keller L, Genoud M (1997) Extraordinary lifespans in ants: a testof evolutionary theories of ageing. Nature, 389, 958–960.
Kelly JK (1994) The effect of scale dependent processes on kinselection: mating and density regulation. Theoretical PopulationBiology, 46, 32–57.
Kümmerli R, Helms KR, Keller L (2005) Experimental manipula-tion of queen number affects colony sex ratio investment in thehighly polygynous ant Formica exsecta. Proceedings of the RoyalSociety of London. Series B, Biological Sciences, 272, 1789–1794.
Kümmerli R, Keller L (2007) Reproductive specialization amongnestmate queens in the polygynous ant Formica exsecta. Beha-vioral Ecology, 18, 375–383.
Kümmerli R, Keller L (in press) Extreme reproductive special-ization within ant colonies: some queens produce maleswhereas others produce workers. Animal Behaviour, doi:10.1016/j.anbehav.2007.03.014
Le Breton J, Delabie J, Chazeau J, Dejean A, Jourdan H (2004)Experimental evidence of large-scale unicoloniality in the trampant Wasmannia auropunctata (Roger). Journal of Insect Behavior, 17,263–271.
Liautard C, Brown WD, Helms KR, Keller L (2003) Temporal andspatial variations of gyne production in the ant Formica exsecta.Oecologia, 136, 558–564.
Liautard C, Keller L (2001) Restricted effective queen dispersal ata microgeographic scale in polygynous populations of the antFormica exsecta. Evolution, 55, 2484–2492.
Manly BFJ (1997) Randomization, Bootstrap and Monte Carlo Methodsin Biology. Chapman & Hall, London.
Nei M (1978) Estimation of average heterozygosity and geneticdistance from a small number of individuals. Genetics, 89, 583–590.
Pamilo P (1985) Effect of inbreeding on genetic relatedness. Hereditas,103, 195–200.
Passera L (1994) Characteristics of tramp species. In: Exotic AntsBiology, Impact, and Control of Introduced Species (ed. WilliamsDF), pp. 23–43. Westview Press, Boulder, Colorado.
Pedersen JS, Boomsma JJ (1999a) Effect of habitat saturation on thenumber and turnover of queens in the polygynous ant, Myrmicasulcinodis. Journal of Evolutionary Biology, 12, 903–917.
Pedersen JS, Boomsma JJ (1999b) Genetic analysis of colony struc-ture in polydomous and polygynous ant populations. BiologicalJournal of the Linnean Society, 66, 115–144.
Pedersen JS, Krieger MJB, Vogel V, Giraud T, Keller L (2006)Native supercolonies of unrelated individuals in the invasiveArgentine ant. Evolution, 60, 782–791.
Pollock GB (1983) Population viscosity and kin selection. AmericanNaturalist, 122, 817–829.
Queller DC (1993) Genetic relatedness and its components inpolygynous colonies of social insects. In: Queen Number Socialityin Insects (ed. Keller L), pp. 132–152. Oxford University Press,Oxford, UK.
Queller DC (1994) Genetic relatedness in viscous populations.Evolutionary Ecology, 8, 70–73.
Queller DC, Goodnight KF (1989) Estimating relatedness usinggenetic markers. Evolution, 43, 258–275.
Rosengren R, Pamilo P (1983) The evolution of polygyny andpolydomy in mound-building Formica ants. Acta EntomologicaFennica, 42, 65–77.
Ross KG (1993) The breeding system of the fire ant Solenopsisinvicta, and its effects on colony genetic structure. AmericanNaturalist, 141, 554–576.
Ross KG (2001) Molecular ecology of social behaviour: analyses ofbreeding systems and genetic structure. Molecular Ecology, 10,265–284.
Rousset F (1997) Genetic differentiation and estimation of geneflow from F-statistics under isolation by distance. Genetics, 145,1219–1228.
P O P U L AT I O N G E N E T I C S T R U C T U R E I N A N T S 4503
© 2007 The AuthorsJournal compilation © 2007 Blackwell Publishing Ltd
Schneider MA (2002) Stratégies de reproduction et dispersion chez troisespèces de fourmis du sous-genre Coptoformica (Hymenoptera,Formicidae). PhD Thesis, University of Lausanne, Switzerland.
Seppä P (1994) Sociogenetic organization of the ants Myrmicaruginodis and Myrmica lobicornis: number, relatedness andlongevity of reproducing individuals. Journal of EvolutionaryBiology, 7, 71–95.
Seppä P, Pamilo P (1995) Gene flow and population viscosity inMyrmica ants. Heredity, 74, 200–209.
Seppä P, Walin L (1996) Sociogenetic organization of the redant Myrmica rubra. Behavioral Ecology and Sociobiology, 38,207–217.
Taylor PD (1992) Altruism in viscous populations — an inclusivefitness model. Evolutionary Ecology, 6, 352–356.
Thomas ML, Payne-Makrisa CM, Suarez AV, Tsutsui ND, HolwayDA (2006) When supercolonies collide: territorial aggression inan invasive and unicolonial social insect. Molecular Ecology, 15,4303–4315.
Tsutsui ND, Suarez AV, Holway DA, Case TJ (2000) Reducedgenetic variation and the success of an invasive species.
Proceedings of the National Academy of Sciences, USA, 97, 5948–5953.
Weir BS, Cockerham CC (1984) Estimating F-statistics for the analysisof population structure. Evolution, 38, 1358–1370.
West SA, Pen I, Griffin AS (2002) Cooperation and competitionbetween relatives. Science, 296, 72–75.
Yamauchi K, Kinomura K, Miyake S (1981) Sociobiological studiesof the polygynic ant Lasius sakagamii. I. General features of itspolydomous system. Insectes Sociaux, 28, 279–296.
This work was part of R. Kümmerli’s PhD thesis under thesupervision of L. Keller. For his PhD, R. Kümmerli studieddifferent aspects of social organization (sex allocation, repro-ductive skew and population genetic structure) of Formica exsectaand is now studying social evolution in bacteria. L. Keller workson various aspects of evolutionary ecology such as reproductiveskew, sex allocation, caste determination as well as the molecularbasis of ageing and behaviour in ants.


