Embed Size (px)
Citation preview
Contrasting magnetic behavior of Ni50Mn35In15 and Ni50Mn34.5In15.5 alloysM. K. Chattopadhyay,1,a� M. A. Manekar,1 V. K. Sharma,1 Parul Arora,1 Pragya Tiwari,2
M. K. Tiwari,2 and S. B. Roy1
1Magnetic and Superconducting Materials Section, Raja Ramanna Centre for Advanced Technology, Indore452013, India2Indus Synchrotrons Utilization Division, Raja Ramanna Centre for Advanced Technology, Indore 452013,India
�Received 1 May 2010; accepted 15 July 2010; published online 5 October 2010�
We have studied the electrical resistivity, magnetization, and heat capacity of the off-stoichiometricHeusler alloys Ni50Mn35In15 and Ni50Mn34.5In15.5 as functions of temperature and magnetic field.The results show that the alloy system is more sensitive to the composition than what is apparentfrom the established phase diagram. We have found that the ground states as well as the nature ofphase transitions strongly depend on concentration differences as low as 0.5 at. %. While in the caseof Ni50Mn34.5In15.5 we do observe a magnetic field induced martensite to austenite phase transition,there is no detectable signature of any field induced transition in the Ni50Mn35In15 alloy even up tofields as high as 80 kOe. Accordingly, the functional properties of these two alloys are alsodrastically different. © 2010 American Institute of Physics. �doi:10.1063/1.3478774�
I. INTRODUCTION
The Ni–Mn–In off-stoichiometric Heusler alloys havebeen widely studied in recent times because of their potentialfor technological applications.1–4 Apart from ferromagneticshape memory effect,1–3 the alloys also show large mag-netoresistance �MR�,5,6 large magnetocaloric effect,4,7–14
large magnetothermal conductivity,15 and magneticsuperelasticity.8 The phase diagram of the Ni50Mn50−yIny sys-tem was determined in details by Sutou et al.1 In this phasediagram it is observed that these alloys undergo a first orderaustenite to martensite phase transformation with the lower-ing of temperature, and both these crystallographic phasesmay be either paramagnetic or ferromagnetic depending bothon the composition and temperature. It is further observed inthis phase diagram that the phase transition lines separatingdifferent crystallographic and magnetic phases inNi50Mn50−yIny have a common point of intersection close toy=16.1 In our previous works we have studied the physicalproperties of Ni50Mn34In16 in detail.6,7,13,16 The compositionrange between y=15 to 16 in this alloy system is particularlyinteresting because of the possibility of a paramagnetic aus-tenite transforming to a ferromagnetic martensite as a func-tion of temperature and magnetic field. Such magnetostruc-tural transition could be of great technological importance,particularly in connection with magnetocaloric effect, MR,and magnetostriction, respectively, where the change in lat-tice entropy, the change in the electron scattering process,and the induced strain associated with the change in latticeare likely to make important contributions. With this motiva-tion, we study and compare here the electrical resistivity,magnetization, and heat capacity of Ni50Mn35In15 andNi50Mn34.5In15.5 alloys as functions of temperature and mag-netic field. However, our results on the y=15 and y=15.5alloys show that the effect of magnetic field on these alloys
is qualitatively quite different from each other. We find thatthe physical properties of the Ni–Mn–In alloy system dependextremely sensitively on the doping concentration in this re-gime of y values. The work presented here on bulk propertiesof the y=15 and y=15.5 alloys, and the comparison of theresults with those published by other authors on alloys ofsimilar compositions10,11 show that the commonly used char-acterization techniques do not provide sufficient informationrequired for the realization of the functional application ofthese alloys.
II. EXPERIMENTAL
Polycrystalline samples of Ni–Mn–In off-stoichiometricHeusler alloys with nominal compositions Ni50Mn35In15 andNi50Mn34.5In15.5 were prepared by arc-melting of high�99.99%� purity Ni, Mn, and In taken in atomic proportions.The arc-melting was performed in an inert Ar atmosphere.Subsequently, the sample buttons were annealed at 800 K for2 h followed by quenching in ice water, which is a similarschedule as adopted by Krenke et al.3
The crystal structures of the samples were determined atroom temperature by doing x-ray diffraction �XRD� experi-ments on finely powdered specimens. The XRD measure-ment on Ni50Mn35In15 was performed in a Regaku X-ray
diffractometer, using Cu K� ��=1.5418 Å� radiation. Forthe Ni50Mn34.5In15.5 sample the XRD experiments were per-formed in a PANalytical X-‘Pert PRO MRD machine, using
Cu K�1 radiation ��=1.540 56 �.The chemical compositions of the samples were experi-
mentally determined through energy dispersive x-ray �EDX�analysis performed using a Philips XL-30pc machine. It wasfound that the samples with the nominal compositionsNi50Mn35In15 and Ni50Mn34.5In15.5, respectively, had the ac-tual compositions of Ni49.7Mn35.1In15.2 and Ni48.6Mn35.1In16.3.However, we wish to point out here that EDX may not be asuitable tool for resolving the very small composition differ-a�Electronic mail: [email protected].
JOURNAL OF APPLIED PHYSICS 108, 073909 �2010�
0021-8979/2010/108�7�/073909/10/$30.00 © 2010 American Institute of Physics108, 073909-1
ences in the Ni, Mn, and In concentrations as the error barfor EDX is of the order of 3 at. % for this alloy system. Thechemical compositions of the samples were also determinedthrough x-ray fluorescence �XRF� studies using a home-made spectrometer.17 According to the XRF results, thesamples with the nominal compositions Ni50Mn35In15 andNi50Mn34.5In15.5, respectively, had the actual compositions ofNi50.1Mn34.9In15.1 and Ni49.3Mn35.2In15.6. The error bar forXRF is of the order of 0.2 at. % for this alloy system. Wewill henceforth refer to these samples as In-15 and In-15.5,respectively, based on the nominal composition alone.
The electrical resistivity ��� of the samples as functionsof temperature �T� and magnetic field �H� were measuredusing the ac-transport option of a Physical Properties Mea-surement System �PPMS, Quantum Design� between 5 and390 K and in magnetic fields up to 80 kOe. For zero fieldelectrical resistivity measurements, a home-made set-up wasalso used working in the temperature range of 78–370 K.The magnetization �M� of the samples as a function of T andH was measured using a vibrating sample magnetometer�VSM, Quantum Design�, and a superconducting quantuminterference device magnetometer �MPMS-5, Quantum De-sign�. The heat capacity �C� of the alloys was measured as afunction of temperature between 2 and 400 K and magneticfield �0–80 kOe� using the PPMS.
III. RESULTS AND DISCUSSION
A. Crystal structure of Ni50Mn35In15 „In-15… andNi50Mn34.5In15.5 „In-15.5…
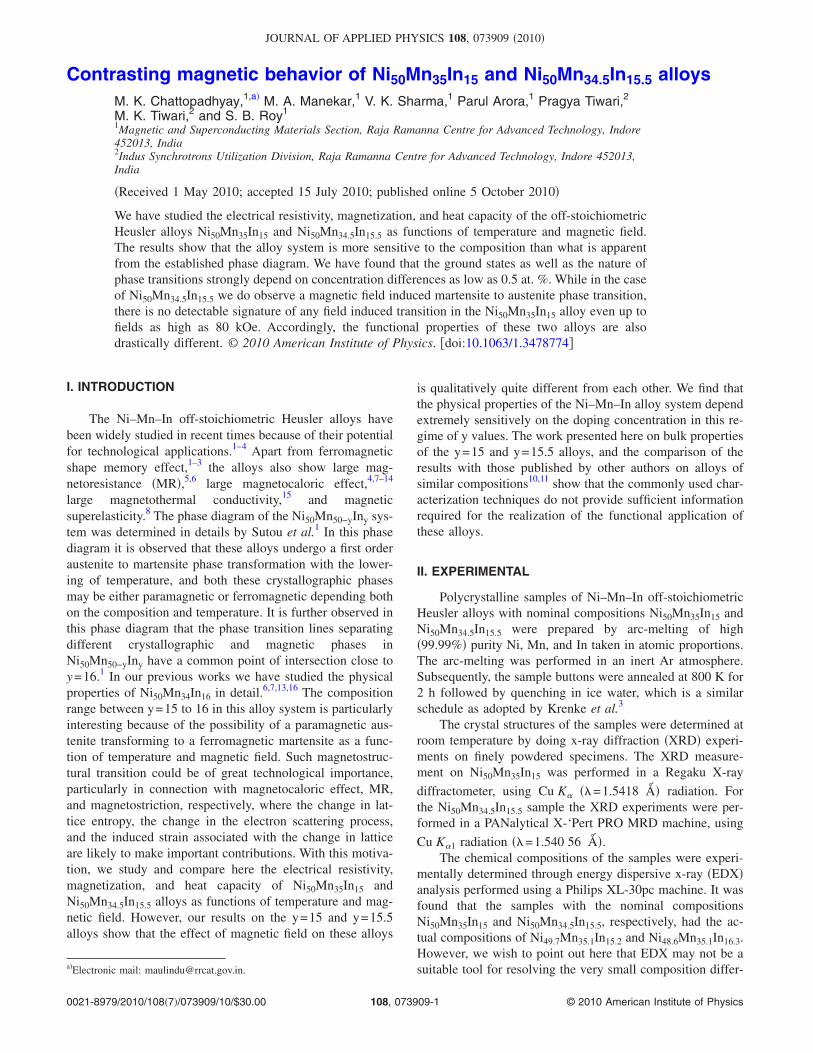
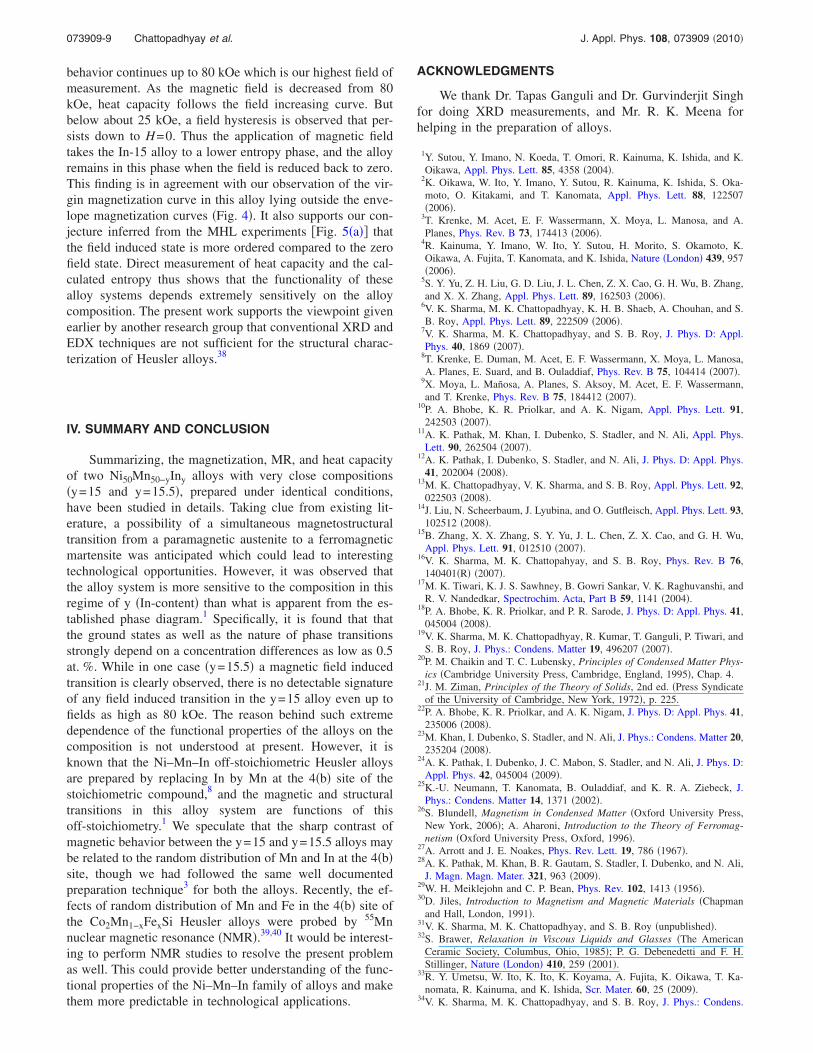
The XRD pattern obtained for the In-15 sample is shownin Fig. 1�a�. All the XRD peaks for this sample could beindexed for an orthorhombic crystal structure. Six XRDpeaks �Nos. 1, 3, 4, 5, 6, and 7, starting from the left of thefigure� in the 2� range of 20°–80° match well with thoseobserved by Pathak et al.,11 obtained for a sample of thesame nominal composition. The positions of some of thepeaks of our sample �Fig. 1�a��, appear to match with anunindexed XRD pattern reported by Bhobe et al.,18 for asample of the same nominal composition. In spite of thematching of the most intense XRD peak, the XRD patternpresented in Fig. 1�a� looks quite different from that ofBhobe et al. This difference is probably because of the factthat the actual composition �determined from EDX study� ofthe sample of Bhobe et al.18 was Ni50.17Mn34.59In15.24. Thelattice parameters for our In-15 sample are found to be a
=17.678 Å, b=10.66 Å, and c=4.632 Å, which are closerto the parameters reported by Pathak et al.11 for the samenominal composition. However, Bhobe et al.18 have at-tempted to fit their XRD pattern to a B2 structure with a
lattice parameter of 3.02 Å. The orthorhombic crystal struc-ture derived from the XRD pattern of our sample indicatesthat the sample is in the Martensite phase at room tempera-ture.
Figure 1�b� shows the XRD pattern obtained for the In-15.5 sample. The XRD peaks corresponding to both L21 andorthorhombic structures were found in this pattern, indicat-ing that both austenite and martensite phases are present inthe sample at room temperature. The lattice parameters ob-
tained from the analysis of the XRD results are a
=6.020 Å for the L21 phase, and a=18.156 Å, b
=10.786 Å, and c=4.555 Å for the orthorhombic phase.The lattice parameter for the L21 phase is quite close to thatof our Ni50Mn34In16 sample studied earlier.19 On the otherhand, the lattice parameters for the orthorhombic phase areclose to that of our In-15 sample mentioned above. From theXRD data, the relative amounts of the orthorhombic and L21
phases were found to be 16% and 84%, respectively.
B. Temperature and field dependence of the electricalresistivity of the In-15 alloy
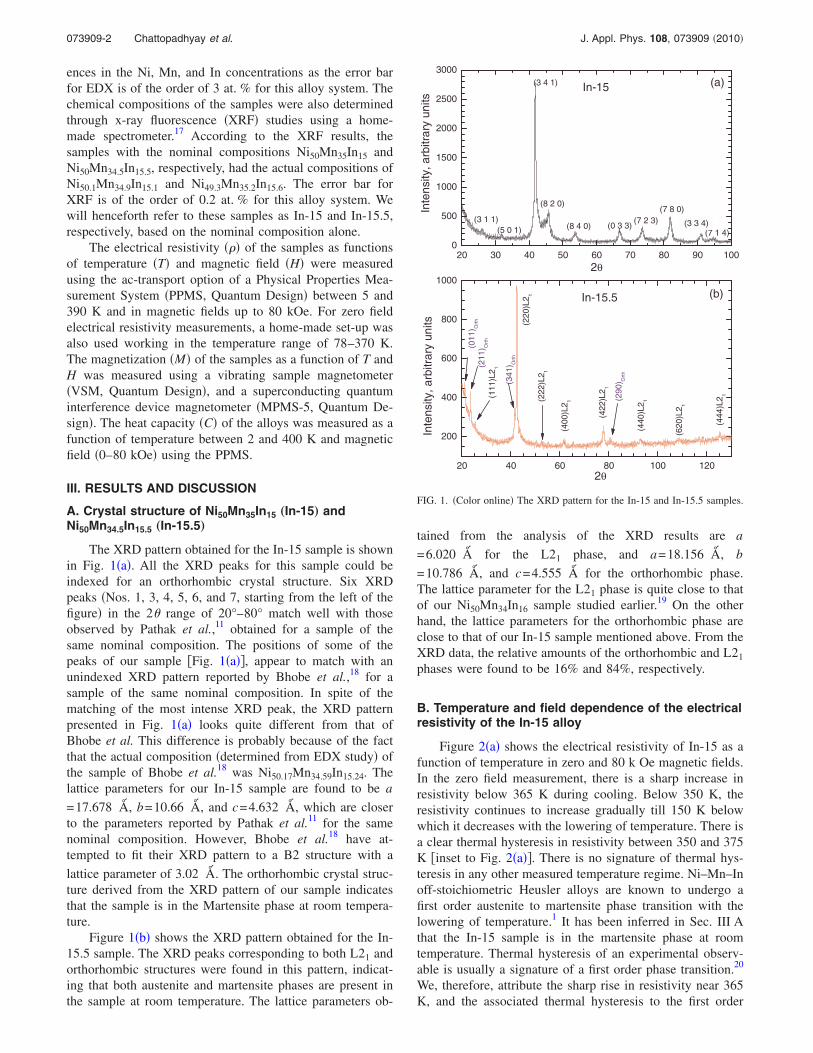
Figure 2�a� shows the electrical resistivity of In-15 as afunction of temperature in zero and 80 k Oe magnetic fields.In the zero field measurement, there is a sharp increase inresistivity below 365 K during cooling. Below 350 K, theresistivity continues to increase gradually till 150 K belowwhich it decreases with the lowering of temperature. There isa clear thermal hysteresis in resistivity between 350 and 375K �inset to Fig. 2�a��. There is no signature of thermal hys-teresis in any other measured temperature regime. Ni–Mn–Inoff-stoichiometric Heusler alloys are known to undergo afirst order austenite to martensite phase transition with thelowering of temperature.1 It has been inferred in Sec. III Athat the In-15 sample is in the martensite phase at roomtemperature. Thermal hysteresis of an experimental observ-able is usually a signature of a first order phase transition.20
We, therefore, attribute the sharp rise in resistivity near 365K, and the associated thermal hysteresis to the first order
20 30 40 50 60 70 80 90 1000
500
1000
1500
2000
2500
3000
20 40 60 80 100 120
200
400
600
800
1000
In-15
(7 1 4)(3 3 4)
(7 8 0)
(7 2 3)(0 3 3)(8 4 0)
(8 2 0)
(3 4 1)
(5 0 1)
Inte
nsity,a
rbitra
ryu
nits
2θ
(3 1 1)
(a)
(620)L
21
(222)L
21
(290) O
rth
(211) O
rth
(011) O
rth
(111)L
21
(341) O
rth
(220)L
21
(400)L
21
(422)L
21
(440)L
21
Inte
nsity,a
rbitra
ryu
nits
2θ
(444)L
21
In-15.5 (b)
FIG. 1. �Color online� The XRD pattern for the In-15 and In-15.5 samples.
073909-2 Chattopadhyay et al. J. Appl. Phys. 108, 073909 �2010�
nature of the austenite–martensite phase transition in thesample. Earlier we have observed similar sharp rise in resis-tivity, and associated thermal hysteresis across the austenite–martensite phase transition in our Ni50Mn34In16 alloy.6 Theend points of the thermal hysteresis demarcate the limits ofmetastability �supercooling and superheating�20 of this firstorder austenite–martensite phase transition. It is clear fromFig. 2�a� that below 350 K the sample is certainly in themartensite phase, a finding supported by XRD measurementsas well. In Fig. 2�a� it is observed that within this martensitephase the In-15 sample has a negative temperature coeffi-cient of resistivity between 350 and 150 K. This is quiteanomalous since metallic samples are expected to have apositive temperature coefficient of resistivity arising fromelectron–phonon scattering.21
The resistivity maximum observed in Fig. 2�a� at around150 K is quite interesting. The � versus T results on aNi50Mn35In15 �nominal composition� sample has been re-cently reported by Bhobe et al.22 Their sample exhibits asharp rise in resistivity below 300 K �nearly 365 K in ourcase�, which has been interpreted as an indication of theaustenite–martensite transition. A broad maximum is alsoseen in their ��T� curve close to 165 K, though its signifi-cance is not clear from their work. Clearly, the characteristic
features observed in the ��T� for the sample of Bhobe et al.occurs at temperatures different from those of the In-15 al-loy. Furthermore, thermal expansion measurements reportedby Pathak et al. show a martensitic transition near 310 K forthe same In-15 composition. This apparent mismatch be-tween the results obtained by various authors highlights theneed of characterizing the Ni–Mn–In family of alloys with atechnique that can resolve very small differences in the ac-tual composition. The effect of the Ni and Mn site replace-ment also needs to be investigated which could be importantin deciding the nature of magnetic interaction in thesesamples. Recently, a sharp rise in resistivity near and above300 K and a broad maximum in ��T� at a lower temperaturehas also been observed in some Ni50Mn25+xSb25−x alloys23
and Ni50Mn35In14X alloys �X=Si,Ge,Al�.24 While the sharprise in resistivity has been interpreted as the indication of theaustenite–martensite phase transition, the reason for thebroad maximum was not stated. On the other hand, a some-what similar broad maximum in ��T� observed earlier in aCo2NbSn shape memory alloy has been interpreted as thesignature of the Curie temperature of that material.25
To further probe the reason behind the resistivity maxi-mum, and to check whether the negative temperature coeffi-cient of resistivity between 350 and 150 K arises due to anykind of magnetic ordering, we have performed the tempera-ture dependent resistivity measurement in presence of 80kOe magnetic field. The � versus T experiments are per-formed in three different experimental protocols: zero fieldcooled �ZFC�, field cooled cooling �FCC�, and field cooledwarming �FCW�. In the ZFC mode, the sample is cooleddown to the lowest temperature of measurement �5 K� inzero field. The field �80 kOe� is then switched on, and themeasurement is done while warming up the sample in thepresence of this field. In the FCC protocol the sample iscooled in the presence of the field, and the measurements areperformed simultaneously. After the FCC experiments downto the lowest temperature of measurement, the sample iswarmed up in the same field while continuing the measure-ments. This last protocol is called FCW. The ZFC and FCWdata overlap over each other and are not shown separately inthe figure. The effect of magnetic field on the electrical re-sistivity of In-15 is observed only below 240 K, where theMR is found negative. Here, the MR is defined as MR= ���H�−��0� /��0���100, which denotes the percentagechange in resistivity because of applied field. Figure 2�b�shows the temperature dependence of MR for Ni50Mn35In15,which is less than 2% for 80 kOe magnetic field. A negativeMR clearly highlights the presence of magnetic ordering atlower temperatures. A striking feature in Fig. 2�b� is thatthere is almost no MR between 350 and 250 K where thenegative temperature coefficient of resistivity is observed.This indicates the absence of any kind of magnetic orderingin this temperature regime even in the presence of magneticfield. We conjecture that the negative temperature coefficientof resistivity between 350 and 250 K may be related to thestrain and disorder present in the system. The In-15 alloybeing in the martensite phase below 350 K, it is quite likelyto be strained with respect to the austenite phase. The effect
350 360 370 3800.10
0.12
0.14
0.16
0.18
0.20
0.10
0.12
0.14
0.16
0.18
0.20
0.22
0 50 100 150 200 250 300 350 400
-1
0
ρ(m
Ωcm
)
T (K)
ρ(m
Ωcm
)
H = 0
H = 80 kOe
(a)M
R(%
)
T (K)
(b)
FIG. 2. �Color online� �a� The temperature dependence of electrical resis-tivity of the In-15 sample in zero and 80 kOe magnetic fields. The insetshows the temperature regime where the electrical resistivity exhibits a ther-mal hysteresis. Magnetic field does not have any effect on the electricalresistivity in this temperature regime. �b� The temperature dependence ofMR of the In-15 sample for 80 kOe applied magnetic field.
073909-3 Chattopadhyay et al. J. Appl. Phys. 108, 073909 �2010�
of strain in the presence of twin boundaries in the martensiticphase could probably enhance the scattering of electrons andlead to such anomalous resistivity.
The effect of 80 kOe field on the onset and width of thethermal hysteresis across the martensitic transition is almostnegligible. This indicates that there is no field induced tran-sition from the martensite to austenite phase till a field of 80kOe. We further note that a positive temperature coefficientof resistivity is observed �both in H=0 and 80 kOe� in In-15above 375 K �within the austenite phase� and at low tem-peratures below 150 K, which is as expected for a metallicalloy.
C. Temperature and field dependent magnetization ofIn-15 alloy
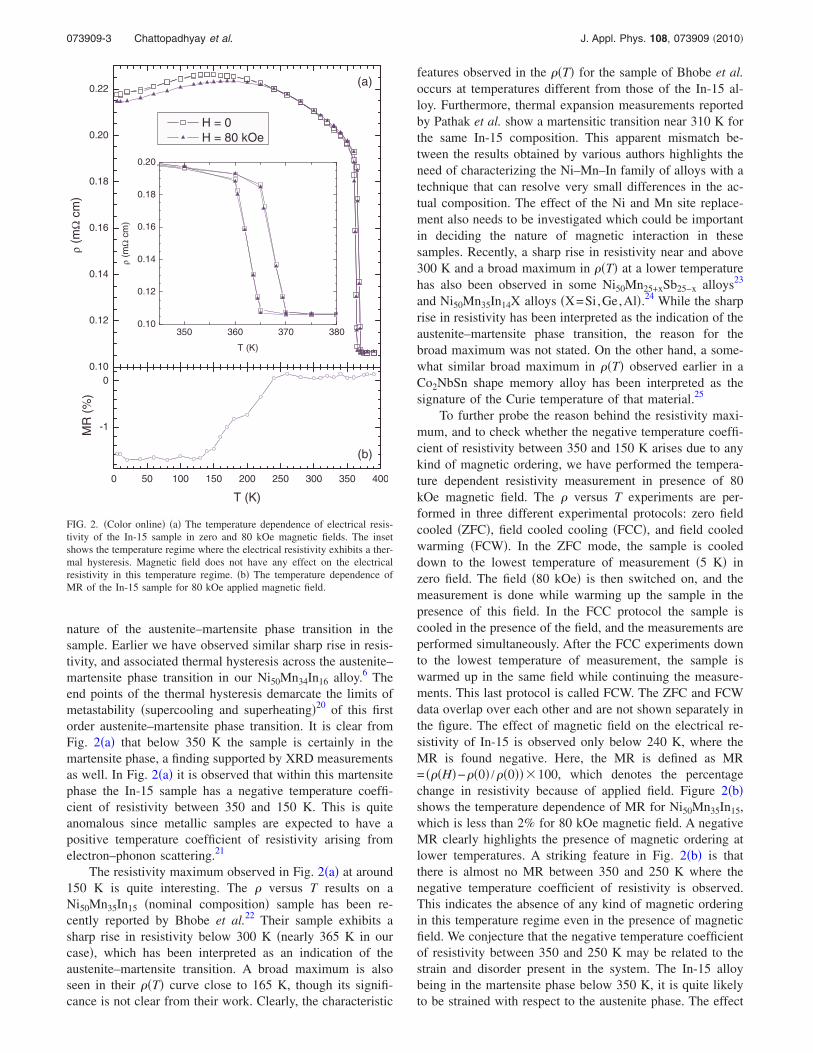
Figure 3�a� shows the M versus T curve of the In-15sample for H=100 Oe obtained using the FCW protocol.The inset to Fig. 3�a� shows the �−1 versus T curve obtainedfrom this M versus T data �here, �=M /H�. The straight linefitted through the high temperature part of this curve inter-sects the temperature axis at 150 K, showing that the para-magnetic Curie temperature for In-15 is at that temperature.This matches with the maximum observed at 150 K in thezero field � versus T data. Figure 3�b� shows the M versus Hcurves obtained at 80, 120, 170, and 350 K. The M versus Hcurves obtained above 150 K do not exhibit any signature oftechnical saturation. Figure 3�c� shows the M2 versus H /M
plots or Arrott plots26,27 for the In-15 alloy, constructed fromthe isothermal M versus H curves for the temperatures men-tioned above. The spontaneous magnetization of the In-15alloy at different temperatures were obtained from the Arrottplots using the standard procedure of extrapolation of thehigh field portions of the Arrott plots.26,27 Figure 3�d� showsthe temperature dependence of spontaneous magnetization ofthe In-15 alloy. The spontaneous magnetization is zero above150 K. Thus, Fig. 3 indicates that the Curie temperature ofthe In-15 alloys is at 150 K, which further confirms that theresistivity maximum observed at 150 K �Fig. 2�a�� is thesignature of this Curie temperature.
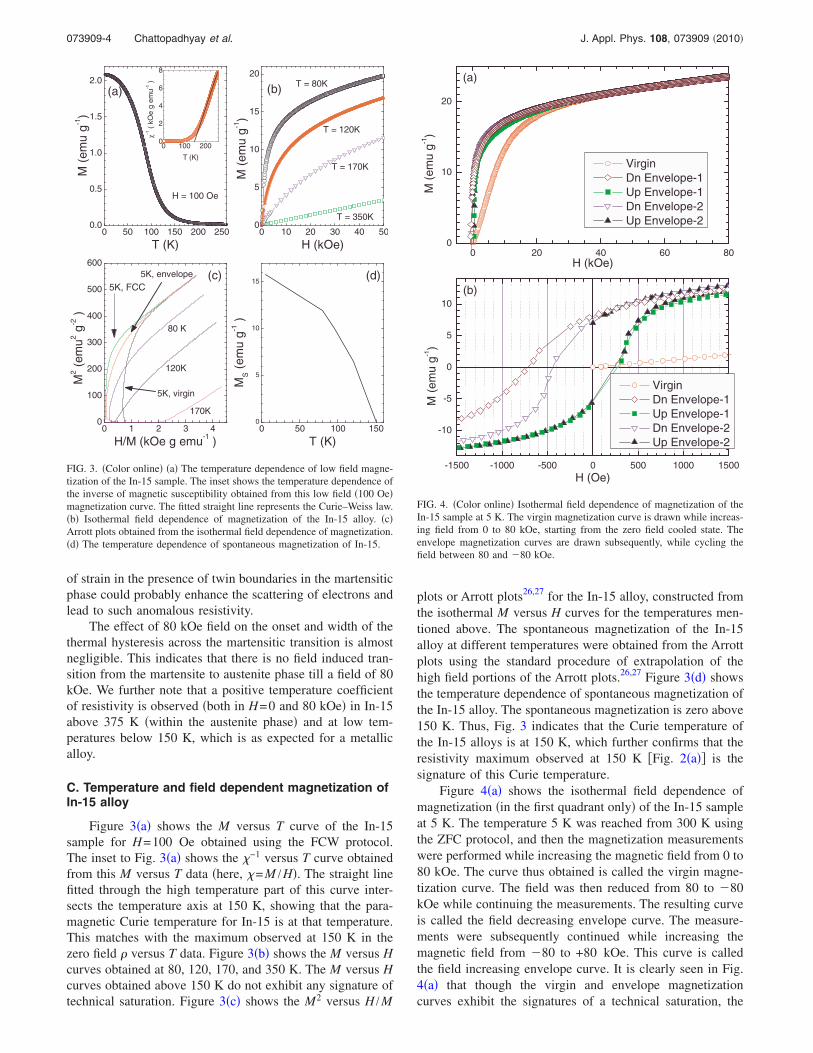
Figure 4�a� shows the isothermal field dependence ofmagnetization �in the first quadrant only� of the In-15 sampleat 5 K. The temperature 5 K was reached from 300 K usingthe ZFC protocol, and then the magnetization measurementswere performed while increasing the magnetic field from 0 to80 kOe. The curve thus obtained is called the virgin magne-tization curve. The field was then reduced from 80 to �80kOe while continuing the measurements. The resulting curveis called the field decreasing envelope curve. The measure-ments were subsequently continued while increasing themagnetic field from �80 to +80 kOe. This curve is calledthe field increasing envelope curve. It is clearly seen in Fig.4�a� that though the virgin and envelope magnetizationcurves exhibit the signatures of a technical saturation, the
0 1 2 3 40
100
200
300
400
500
600
0 10 20 30 40 500
5
10
15
20
0 50 100 1500
5
10
15
0 100 2000
2
4
6
8
0 50 100 150 200 2500.0
0.5
1.0
1.5
2.0M
2(e
mu
2g
-2)
H/M (kOe g emu-1
)
170K
120K
80 K
5K, virgin
5K, envelope
5K, FCC(c)
M(e
mu
g-1)
H (kOe)
T = 350K
T = 170K
T = 120K
T = 80K(b)
MS
(em
ug
-1)
T (K)
(d)
χ-1(
kO
eg
em
u-1
)T (K)
M(e
mu
g-1)
T (K)
H = 100 Oe
(a)
FIG. 3. �Color online� �a� The temperature dependence of low field magne-tization of the In-15 sample. The inset shows the temperature dependence ofthe inverse of magnetic susceptibility obtained from this low field �100 Oe�magnetization curve. The fitted straight line represents the Curie–Weiss law.�b� Isothermal field dependence of magnetization of the In-15 alloy. �c�Arrott plots obtained from the isothermal field dependence of magnetization.�d� The temperature dependence of spontaneous magnetization of In-15.
0 20 40 60 800
10
20
-1500 -1000 -500 0 500 1000 1500
-10
-5
0
5
10
M(e
mu
g-1)
H (kOe)
Virgin
Dn Envelope-1
Up Envelope-1
Dn Envelope-2
Up Envelope-2
(a)
M(e
mu
g-1)
H (Oe)
Virgin
Dn Envelope-1
Up Envelope-1
Dn Envelope-2
Up Envelope-2
(b)
FIG. 4. �Color online� Isothermal field dependence of magnetization of theIn-15 sample at 5 K. The virgin magnetization curve is drawn while increas-ing field from 0 to 80 kOe, starting from the zero field cooled state. Theenvelope magnetization curves are drawn subsequently, while cycling thefield between 80 and �80 kOe.
073909-4 Chattopadhyay et al. J. Appl. Phys. 108, 073909 �2010�
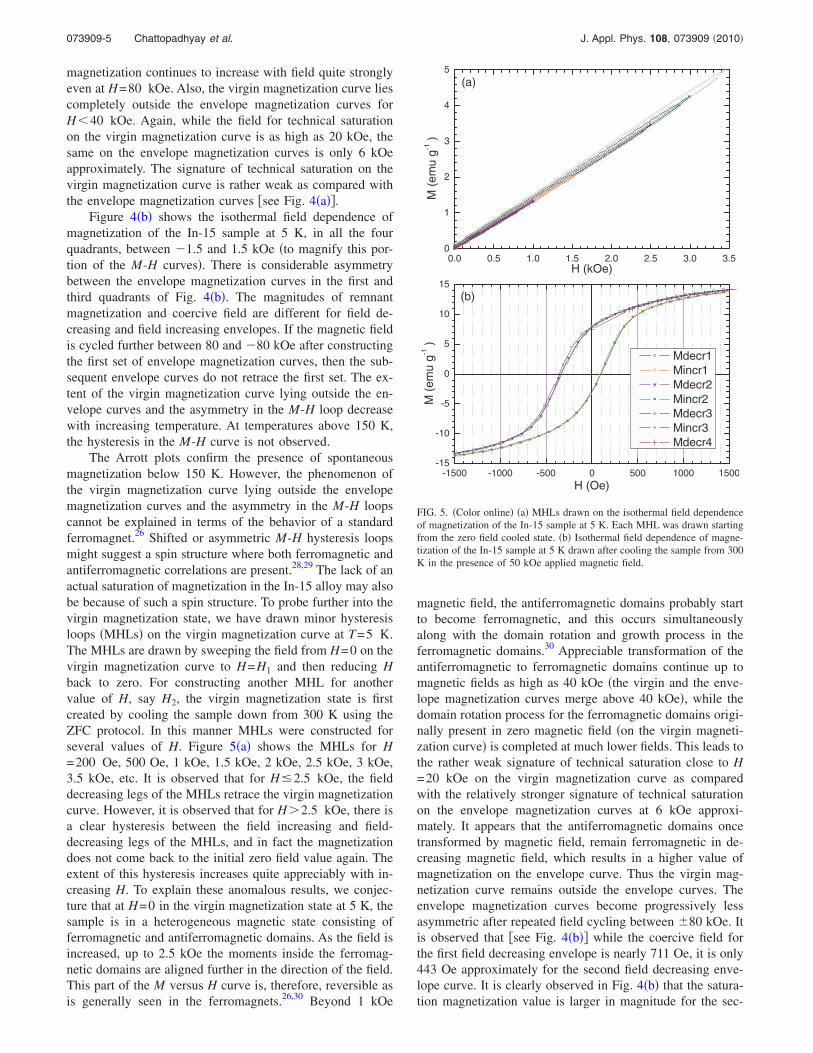
magnetization continues to increase with field quite stronglyeven at H=80 kOe. Also, the virgin magnetization curve liescompletely outside the envelope magnetization curves forH40 kOe. Again, while the field for technical saturationon the virgin magnetization curve is as high as 20 kOe, thesame on the envelope magnetization curves is only 6 kOeapproximately. The signature of technical saturation on thevirgin magnetization curve is rather weak as compared withthe envelope magnetization curves �see Fig. 4�a��.
Figure 4�b� shows the isothermal field dependence ofmagnetization of the In-15 sample at 5 K, in all the fourquadrants, between �1.5 and 1.5 kOe �to magnify this por-tion of the M-H curves�. There is considerable asymmetrybetween the envelope magnetization curves in the first andthird quadrants of Fig. 4�b�. The magnitudes of remnantmagnetization and coercive field are different for field de-creasing and field increasing envelopes. If the magnetic fieldis cycled further between 80 and �80 kOe after constructingthe first set of envelope magnetization curves, then the sub-sequent envelope curves do not retrace the first set. The ex-tent of the virgin magnetization curve lying outside the en-velope curves and the asymmetry in the M-H loop decreasewith increasing temperature. At temperatures above 150 K,the hysteresis in the M-H curve is not observed.
The Arrott plots confirm the presence of spontaneousmagnetization below 150 K. However, the phenomenon ofthe virgin magnetization curve lying outside the envelopemagnetization curves and the asymmetry in the M-H loopscannot be explained in terms of the behavior of a standardferromagnet.26 Shifted or asymmetric M-H hysteresis loopsmight suggest a spin structure where both ferromagnetic andantiferromagnetic correlations are present.28,29 The lack of anactual saturation of magnetization in the In-15 alloy may alsobe because of such a spin structure. To probe further into thevirgin magnetization state, we have drawn minor hysteresisloops �MHLs� on the virgin magnetization curve at T=5 K.The MHLs are drawn by sweeping the field from H=0 on thevirgin magnetization curve to H=H1 and then reducing Hback to zero. For constructing another MHL for anothervalue of H, say H2, the virgin magnetization state is firstcreated by cooling the sample down from 300 K using theZFC protocol. In this manner MHLs were constructed forseveral values of H. Figure 5�a� shows the MHLs for H=200 Oe, 500 Oe, 1 kOe, 1.5 kOe, 2 kOe, 2.5 kOe, 3 kOe,3.5 kOe, etc. It is observed that for H2.5 kOe, the fielddecreasing legs of the MHLs retrace the virgin magnetizationcurve. However, it is observed that for H�2.5 kOe, there isa clear hysteresis between the field increasing and field-decreasing legs of the MHLs, and in fact the magnetizationdoes not come back to the initial zero field value again. Theextent of this hysteresis increases quite appreciably with in-creasing H. To explain these anomalous results, we conjec-ture that at H=0 in the virgin magnetization state at 5 K, thesample is in a heterogeneous magnetic state consisting offerromagnetic and antiferromagnetic domains. As the field isincreased, up to 2.5 kOe the moments inside the ferromag-netic domains are aligned further in the direction of the field.This part of the M versus H curve is, therefore, reversible asis generally seen in the ferromagnets.26,30 Beyond 1 kOe
magnetic field, the antiferromagnetic domains probably startto become ferromagnetic, and this occurs simultaneouslyalong with the domain rotation and growth process in theferromagnetic domains.30 Appreciable transformation of theantiferromagnetic to ferromagnetic domains continue up tomagnetic fields as high as 40 kOe �the virgin and the enve-lope magnetization curves merge above 40 kOe�, while thedomain rotation process for the ferromagnetic domains origi-nally present in zero magnetic field �on the virgin magneti-zation curve� is completed at much lower fields. This leads tothe rather weak signature of technical saturation close to H=20 kOe on the virgin magnetization curve as comparedwith the relatively stronger signature of technical saturationon the envelope magnetization curves at 6 kOe approxi-mately. It appears that the antiferromagnetic domains oncetransformed by magnetic field, remain ferromagnetic in de-creasing magnetic field, which results in a higher value ofmagnetization on the envelope curve. Thus the virgin mag-netization curve remains outside the envelope curves. Theenvelope magnetization curves become progressively lessasymmetric after repeated field cycling between �80 kOe. Itis observed that �see Fig. 4�b�� while the coercive field forthe first field decreasing envelope is nearly 711 Oe, it is only443 Oe approximately for the second field decreasing enve-lope curve. It is clearly observed in Fig. 4�b� that the satura-tion magnetization value is larger in magnitude for the sec-
-1500 -1000 -500 0 500 1000 1500-15
-10
-5
0
5
10
15
0.0 0.5 1.0 1.5 2.0 2.5 3.0 3.50
1
2
3
4
5
M(e
mu
g-1
)
H (Oe)
Mdecr1
Mincr1
Mdecr2
Mincr2
Mdecr3
Mincr3
Mdecr4
(b)
M(e
mu
g-1
)
H (kOe)
(a)
FIG. 5. �Color online� �a� MHLs drawn on the isothermal field dependenceof magnetization of the In-15 sample at 5 K. Each MHL was drawn startingfrom the zero field cooled state. �b� Isothermal field dependence of magne-tization of the In-15 sample at 5 K drawn after cooling the sample from 300K in the presence of 50 kOe applied magnetic field.
073909-5 Chattopadhyay et al. J. Appl. Phys. 108, 073909 �2010�
ond field decreasing envelope as compared to the first fielddecreasing envelope. Again, while the coercive fields for thefirst and second field increasing envelopes are nearly thesame, the saturation magnetization value is larger in magni-tude for the second field increasing envelope. We infer thatthough most of the antiferromagnetic domains are convertedto ferromagnetic above 40 kOe on the virgin magnetizationcurve, some antiferromagnetic domains still remain untrans-formed even at 80 kOe magnetic field. These domains gettransformed only through the process of repeated cycling,which takes the system closer to the equilibrium configura-tion.
To further verify this conjecture we perform isothermalM-H measurement starting from the FCC state. Figure 5�b�shows the M versus H hysteresis loop of the In-15 alloyobtained at 5 K after cooling the sample in presence of 50kOe applied magnetic field. Based on our conjecture above,the sample should be largely in the ferromagnetic state afterfollowing this thermomagnetic history. This M versus Hcurve was constructed by cycling the magnetic field between�50 kOe. However, in Fig. 5�b� we have shown the hyster-esis loop between �1.5 kOe only to highlight the low fieldregion. The coercive field for the field decreasing curve ob-tained after FCC is 341 Oe approximately, and the same forthe field increasing curve is close to 96 Oe. Thus the FCC Mversus H hysteresis loop is more symmetric than the ZFC Mversus H hysteresis loop. Repeated field cycling has verylittle effect on this hysteresis loop, which means that thesystem is closer to an equilibrium configuration when thealloy is cooled down to 5 K in the FCC protocol. The fieldfor technical saturation for the FCC M versus H curve isfound to be 3.5 kOe approximately. Figure 3�c� presents theArrott plots obtained for the M versus H curve obtained afterFCC, and for the field increasing envelope magnetizationcurve constructed during the ZFC M versus H experimentsas well, along with that for the virgin magnetization curve�after ZFC� described earlier. Though these plots look quitedifferent from each other, the spontaneous magnetization isfound to be same for all of them. Thus in the ground state,the In-15 alloy has a heterogeneous magnetic configurationwith an overall ferromagnetic order.
D. Temperature and field dependence of electricalresistivity of the In-15.5 alloy
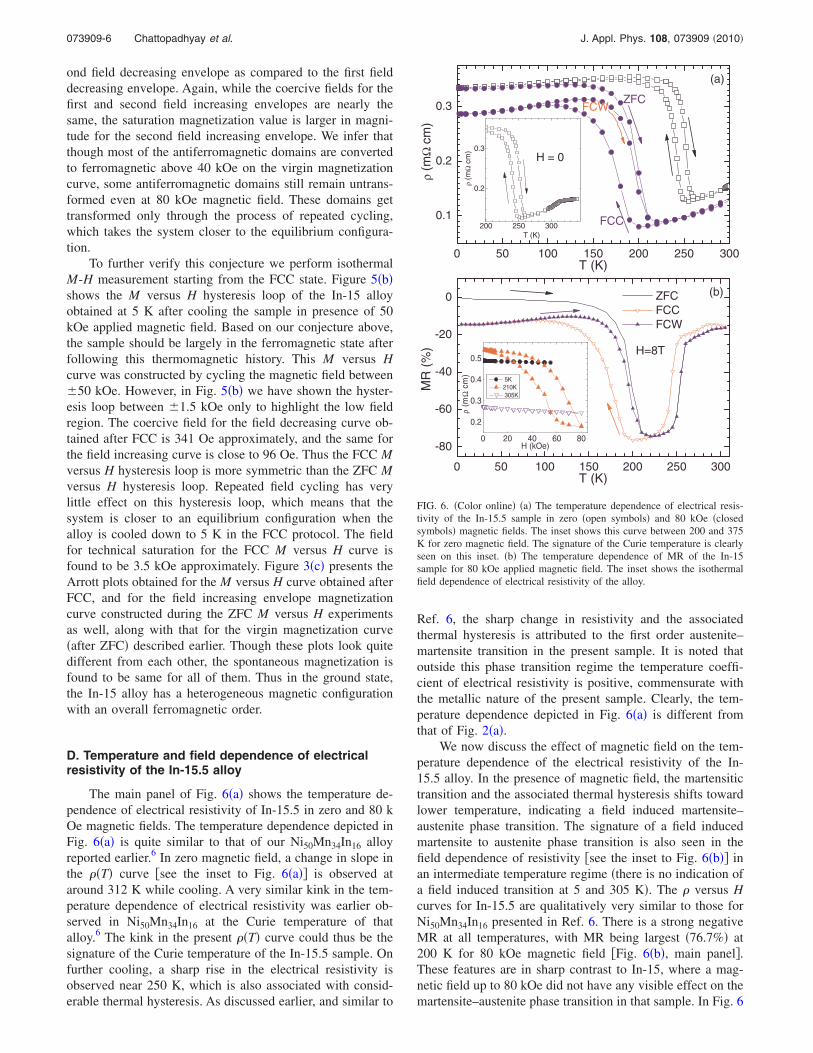
The main panel of Fig. 6�a� shows the temperature de-pendence of electrical resistivity of In-15.5 in zero and 80 kOe magnetic fields. The temperature dependence depicted inFig. 6�a� is quite similar to that of our Ni50Mn34In16 alloyreported earlier.6 In zero magnetic field, a change in slope inthe ��T� curve �see the inset to Fig. 6�a�� is observed ataround 312 K while cooling. A very similar kink in the tem-perature dependence of electrical resistivity was earlier ob-served in Ni50Mn34In16 at the Curie temperature of thatalloy.6 The kink in the present ��T� curve could thus be thesignature of the Curie temperature of the In-15.5 sample. Onfurther cooling, a sharp rise in the electrical resistivity isobserved near 250 K, which is also associated with consid-erable thermal hysteresis. As discussed earlier, and similar to
Ref. 6, the sharp change in resistivity and the associatedthermal hysteresis is attributed to the first order austenite–martensite transition in the present sample. It is noted thatoutside this phase transition regime the temperature coeffi-cient of electrical resistivity is positive, commensurate withthe metallic nature of the present sample. Clearly, the tem-perature dependence depicted in Fig. 6�a� is different fromthat of Fig. 2�a�.
We now discuss the effect of magnetic field on the tem-perature dependence of the electrical resistivity of the In-15.5 alloy. In the presence of magnetic field, the martensitictransition and the associated thermal hysteresis shifts towardlower temperature, indicating a field induced martensite–austenite phase transition. The signature of a field inducedmartensite to austenite phase transition is also seen in thefield dependence of resistivity �see the inset to Fig. 6�b�� inan intermediate temperature regime �there is no indication ofa field induced transition at 5 and 305 K�. The � versus Hcurves for In-15.5 are qualitatively very similar to those forNi50Mn34In16 presented in Ref. 6. There is a strong negativeMR at all temperatures, with MR being largest �76.7%� at200 K for 80 kOe magnetic field �Fig. 6�b�, main panel�.These features are in sharp contrast to In-15, where a mag-netic field up to 80 kOe did not have any visible effect on themartensite–austenite phase transition in that sample. In Fig. 6
0 50 100 150 200 250 300
0.1
0.2
0.3
200 250 300
0.2
0.3
0 50 100 150 200 250 300
-80
-60
-40
-20
0
ρ(m
Ωcm
)
T (K)
ZFC
FCC
FCW
(a)
ρ(m
Ωcm
)
T (K)
H = 0
0 20 40 60 80
0.2
0.3
0.4
0.5
ρ(m
Ωcm
)
H (kOe)
5K
210K
305K
MR
(%)
T (K)
ZFC
FCC
FCW
H=8T
(b)
FIG. 6. �Color online� �a� The temperature dependence of electrical resis-tivity of the In-15.5 sample in zero �open symbols� and 80 kOe �closedsymbols� magnetic fields. The inset shows this curve between 200 and 375K for zero magnetic field. The signature of the Curie temperature is clearlyseen on this inset. �b� The temperature dependence of MR of the In-15sample for 80 kOe applied magnetic field. The inset shows the isothermalfield dependence of electrical resistivity of the alloy.
073909-6 Chattopadhyay et al. J. Appl. Phys. 108, 073909 �2010�
it is also observed that the ZFC and FCW curves for 80 kOemagnetic field do not overlap over one another at tempera-tures below the austenite–martensite phase transition regime.Similar ��T� curves at high fields were earlier obtained forthe Ni50Mn34In16 sample stated above.31 A similar phenom-enon at high fields �more than 40 kOe� was also observed inthe temperature dependence of magnetization of the sameNi50Mn34In16 alloy.16 There it was shown that in the presenceof a high magnetic field, the austenite to martensite first or-der phase transition in this alloy is kinetically arrested. It wasalso shown that the low-temperature and high-field magneticstate of Ni50Mn34In16 alloy shows a typical nonergodic glass-like dynamical response.16,32 The signature of kinetic arrestin a Ni50Mn34In16 alloy has been observed by Umetsu et al.33
as well. We believe that a similar picture of kinetic arrest canexplain the observed difference between the ZFC and FCW��T� curves of the In-15.5 alloy in 80 kOe magnetic field.
E. Temperature and field dependence ofmagnetization of In-15.5 alloys
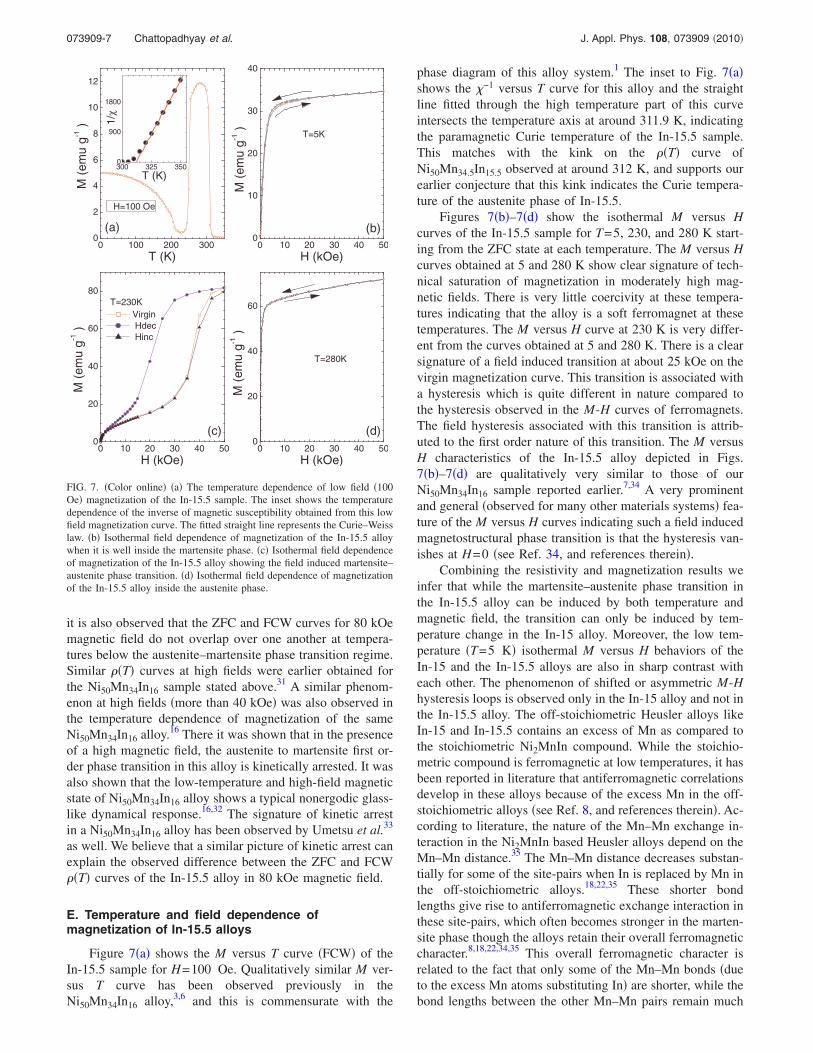
Figure 7�a� shows the M versus T curve �FCW� of theIn-15.5 sample for H=100 Oe. Qualitatively similar M ver-sus T curve has been observed previously in theNi50Mn34In16 alloy,3,6 and this is commensurate with the
phase diagram of this alloy system.1 The inset to Fig. 7�a�shows the �−1 versus T curve for this alloy and the straightline fitted through the high temperature part of this curveintersects the temperature axis at around 311.9 K, indicatingthe paramagnetic Curie temperature of the In-15.5 sample.This matches with the kink on the ��T� curve ofNi50Mn34.5In15.5 observed at around 312 K, and supports ourearlier conjecture that this kink indicates the Curie tempera-ture of the austenite phase of In-15.5.
Figures 7�b�–7�d� show the isothermal M versus Hcurves of the In-15.5 sample for T=5, 230, and 280 K start-ing from the ZFC state at each temperature. The M versus Hcurves obtained at 5 and 280 K show clear signature of tech-nical saturation of magnetization in moderately high mag-netic fields. There is very little coercivity at these tempera-tures indicating that the alloy is a soft ferromagnet at thesetemperatures. The M versus H curve at 230 K is very differ-ent from the curves obtained at 5 and 280 K. There is a clearsignature of a field induced transition at about 25 kOe on thevirgin magnetization curve. This transition is associated witha hysteresis which is quite different in nature compared tothe hysteresis observed in the M-H curves of ferromagnets.The field hysteresis associated with this transition is attrib-uted to the first order nature of this transition. The M versusH characteristics of the In-15.5 alloy depicted in Figs.7�b�–7�d� are qualitatively very similar to those of ourNi50Mn34In16 sample reported earlier.7,34 A very prominentand general �observed for many other materials systems� fea-ture of the M versus H curves indicating such a field inducedmagnetostructural phase transition is that the hysteresis van-ishes at H=0 �see Ref. 34, and references therein�.
Combining the resistivity and magnetization results weinfer that while the martensite–austenite phase transition inthe In-15.5 alloy can be induced by both temperature andmagnetic field, the transition can only be induced by tem-perature change in the In-15 alloy. Moreover, the low tem-perature �T=5 K� isothermal M versus H behaviors of theIn-15 and the In-15.5 alloys are also in sharp contrast witheach other. The phenomenon of shifted or asymmetric M-Hhysteresis loops is observed only in the In-15 alloy and not inthe In-15.5 alloy. The off-stoichiometric Heusler alloys likeIn-15 and In-15.5 contains an excess of Mn as compared tothe stoichiometric Ni2MnIn compound. While the stoichio-metric compound is ferromagnetic at low temperatures, it hasbeen reported in literature that antiferromagnetic correlationsdevelop in these alloys because of the excess Mn in the off-stoichiometric alloys �see Ref. 8, and references therein�. Ac-cording to literature, the nature of the Mn–Mn exchange in-teraction in the Ni2MnIn based Heusler alloys depend on theMn–Mn distance.35 The Mn–Mn distance decreases substan-tially for some of the site-pairs when In is replaced by Mn inthe off-stoichiometric alloys.18,22,35 These shorter bondlengths give rise to antiferromagnetic exchange interaction inthese site-pairs, which often becomes stronger in the marten-site phase though the alloys retain their overall ferromagneticcharacter.8,18,22,34,35 This overall ferromagnetic character isrelated to the fact that only some of the Mn–Mn bonds �dueto the excess Mn atoms substituting In� are shorter, while thebond lengths between the other Mn–Mn pairs remain much
0 10 20 30 40 500
20
40
60
80
0 10 20 30 40 500
20
40
60
0 10 20 30 40 500
10
20
30
40
300 325 3500
900
1800
0 100 200 3000
2
4
6
8
10
12
T=230K
Virgin
Hdec
Hinc
M(e
mu
g-1
)
H (kOe)
(c)
T=280K
M(e
mu
g-1
)
H (kOe)
(d)
T=5K
M(e
mu
g-1
)
H (kOe)
(b)
1/χ
T (K)
M(e
mu
g-1
)
T (K)
H=100 Oe
(a)
FIG. 7. �Color online� �a� The temperature dependence of low field �100Oe� magnetization of the In-15.5 sample. The inset shows the temperaturedependence of the inverse of magnetic susceptibility obtained from this lowfield magnetization curve. The fitted straight line represents the Curie–Weisslaw. �b� Isothermal field dependence of magnetization of the In-15.5 alloywhen it is well inside the martensite phase. �c� Isothermal field dependenceof magnetization of the In-15.5 alloy showing the field induced martensite–austenite phase transition. �d� Isothermal field dependence of magnetizationof the In-15.5 alloy inside the austenite phase.
073909-7 Chattopadhyay et al. J. Appl. Phys. 108, 073909 �2010�
larger.35 When the antiferromagnetic correlations are stron-ger in the martensite phase, the saturation magnetization inthe martensitic phase is lesser than that in the austenitephase.34 This latter phenomenon is also observed here for theIn-15.5 alloy �see Figs. 5�a� and 5�b��. A similar comparisonof the saturation magnetization for the In-15 alloy could notbe done here as the temperature range needed to reach theaustenite phase of this alloy was beyond the allowed limit ofour experimental set-up. However, the response of the twoalloys In-15 and In-15.5 to applied magnetic field is clearlyvery different, and a competition between the incipient anti-ferromagnetic ordering and the overall long range ferromag-netic order alone may not give rise to these differences in themagnetic behavior of the two alloys with such close compo-sitions. Again, it may be noted here that though there issupport in the literature �as mentioned above� for the exis-tence of antiferromagnetic correlations coming due to excessMn, literature also exist which show that the excess Mn at-oms which substitute for In sites are coupled ferromagneti-cally to the ferromagnetic Mn-sublattice.36 Clearly, the na-ture of the magnetic interactions in the off-stoichiometricHeusler alloys is yet to be fully understood.
To further probe the nature of the ground state of boththese alloys, we have performed heat capacity measure-ments, the results of which are presented below. These re-sults also provide valuable information on the paramagneticto ferromagnetic transitions in the In-15 and In-15.5 alloys,and the effect of magnetic field on these alloys and its prac-tical implications.
F. Heat capacity and magnetocaloric effect of In-15and In-15.5 alloys
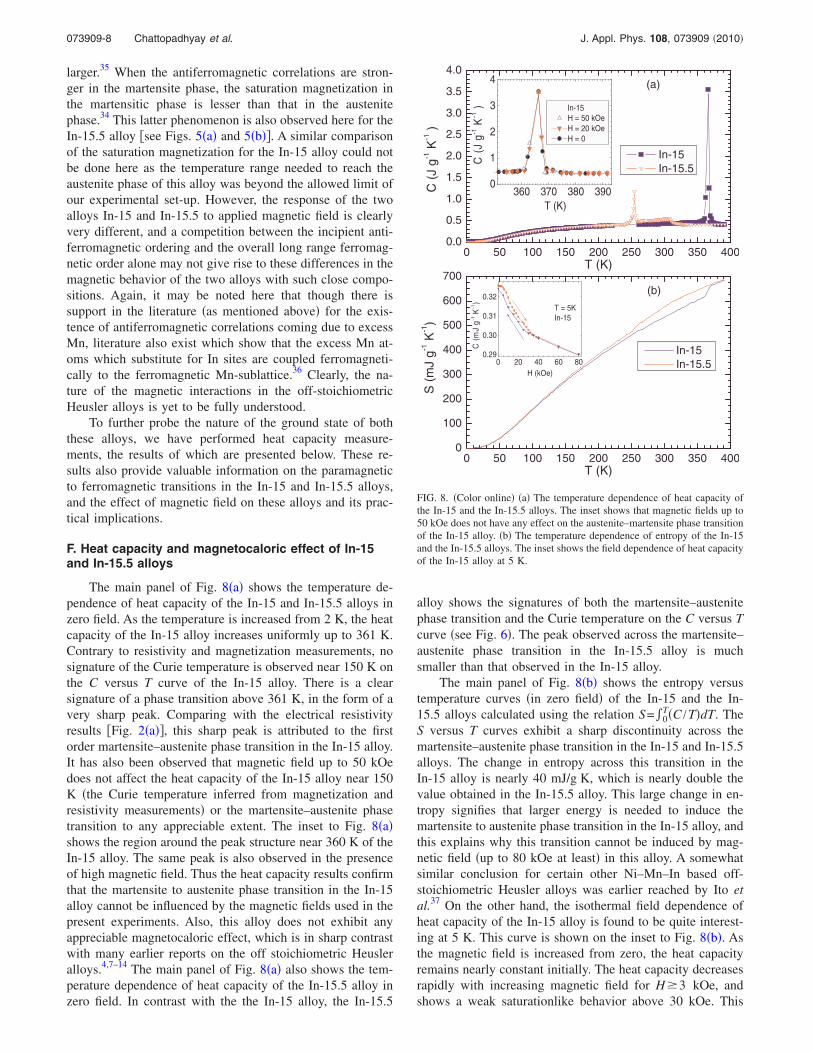
The main panel of Fig. 8�a� shows the temperature de-pendence of heat capacity of the In-15 and In-15.5 alloys inzero field. As the temperature is increased from 2 K, the heatcapacity of the In-15 alloy increases uniformly up to 361 K.Contrary to resistivity and magnetization measurements, nosignature of the Curie temperature is observed near 150 K onthe C versus T curve of the In-15 alloy. There is a clearsignature of a phase transition above 361 K, in the form of avery sharp peak. Comparing with the electrical resistivityresults �Fig. 2�a��, this sharp peak is attributed to the firstorder martensite–austenite phase transition in the In-15 alloy.It has also been observed that magnetic field up to 50 kOedoes not affect the heat capacity of the In-15 alloy near 150K �the Curie temperature inferred from magnetization andresistivity measurements� or the martensite–austenite phasetransition to any appreciable extent. The inset to Fig. 8�a�shows the region around the peak structure near 360 K of theIn-15 alloy. The same peak is also observed in the presenceof high magnetic field. Thus the heat capacity results confirmthat the martensite to austenite phase transition in the In-15alloy cannot be influenced by the magnetic fields used in thepresent experiments. Also, this alloy does not exhibit anyappreciable magnetocaloric effect, which is in sharp contrastwith many earlier reports on the off stoichiometric Heusleralloys.4,7–14 The main panel of Fig. 8�a� also shows the tem-perature dependence of heat capacity of the In-15.5 alloy inzero field. In contrast with the the In-15 alloy, the In-15.5
alloy shows the signatures of both the martensite–austenitephase transition and the Curie temperature on the C versus Tcurve �see Fig. 6�. The peak observed across the martensite–austenite phase transition in the In-15.5 alloy is muchsmaller than that observed in the In-15 alloy.
The main panel of Fig. 8�b� shows the entropy versustemperature curves �in zero field� of the In-15 and the In-15.5 alloys calculated using the relation S=�0
T�C /T�dT. TheS versus T curves exhibit a sharp discontinuity across themartensite–austenite phase transition in the In-15 and In-15.5alloys. The change in entropy across this transition in theIn-15 alloy is nearly 40 mJ/g K, which is nearly double thevalue obtained in the In-15.5 alloy. This large change in en-tropy signifies that larger energy is needed to induce themartensite to austenite phase transition in the In-15 alloy, andthis explains why this transition cannot be induced by mag-netic field �up to 80 kOe at least� in this alloy. A somewhatsimilar conclusion for certain other Ni–Mn–In based off-stoichiometric Heusler alloys was earlier reached by Ito etal.37 On the other hand, the isothermal field dependence ofheat capacity of the In-15 alloy is found to be quite interest-ing at 5 K. This curve is shown on the inset to Fig. 8�b�. Asthe magnetic field is increased from zero, the heat capacityremains nearly constant initially. The heat capacity decreasesrapidly with increasing magnetic field for H 3 kOe, andshows a weak saturationlike behavior above 30 kOe. This
0 50 100 150 200 250 300 350 4000.0
0.5
1.0
1.5
2.0
2.5
3.0
3.5
4.0
0 50 100 150 200 250 300 350 4000
100
200
300
400
500
600
700
360 370 380 3900
1
2
3
4
In-15
H = 50 kOe
H = 20 kOe
H = 0
C(J
g-1
K-1
)
T (K)
C(J
g-1
K-1
)
T (K)
In-15
In-15.5
(a)
0 20 40 60 800.29
0.30
0.31
0.32
C(m
Jg
-1K
-1)
H (kOe)
T = 5K
In-15
S(m
Jg
-1K
-1)
T (K)
In-15
In-15.5
(b)
FIG. 8. �Color online� �a� The temperature dependence of heat capacity ofthe In-15 and the In-15.5 alloys. The inset shows that magnetic fields up to50 kOe does not have any effect on the austenite–martensite phase transitionof the In-15 alloy. �b� The temperature dependence of entropy of the In-15and the In-15.5 alloys. The inset shows the field dependence of heat capacityof the In-15 alloy at 5 K.
073909-8 Chattopadhyay et al. J. Appl. Phys. 108, 073909 �2010�
behavior continues up to 80 kOe which is our highest field ofmeasurement. As the magnetic field is decreased from 80kOe, heat capacity follows the field increasing curve. Butbelow about 25 kOe, a field hysteresis is observed that per-sists down to H=0. Thus the application of magnetic fieldtakes the In-15 alloy to a lower entropy phase, and the alloyremains in this phase when the field is reduced back to zero.This finding is in agreement with our observation of the vir-gin magnetization curve in this alloy lying outside the enve-lope magnetization curves �Fig. 4�. It also supports our con-jecture inferred from the MHL experiments �Fig. 5�a�� thatthe field induced state is more ordered compared to the zerofield state. Direct measurement of heat capacity and the cal-culated entropy thus shows that the functionality of thesealloy systems depends extremely sensitively on the alloycomposition. The present work supports the viewpoint givenearlier by another research group that conventional XRD andEDX techniques are not sufficient for the structural charac-terization of Heusler alloys.38
IV. SUMMARY AND CONCLUSION
Summarizing, the magnetization, MR, and heat capacityof two Ni50Mn50−yIny alloys with very close compositions�y=15 and y=15.5�, prepared under identical conditions,have been studied in details. Taking clue from existing lit-erature, a possibility of a simultaneous magnetostructuraltransition from a paramagnetic austenite to a ferromagneticmartensite was anticipated which could lead to interestingtechnological opportunities. However, it was observed thatthe alloy system is more sensitive to the composition in thisregime of y �In-content� than what is apparent from the es-tablished phase diagram.1 Specifically, it is found that thatthe ground states as well as the nature of phase transitionsstrongly depend on a concentration differences as low as 0.5at. %. While in one case �y=15.5� a magnetic field inducedtransition is clearly observed, there is no detectable signatureof any field induced transition in the y=15 alloy even up tofields as high as 80 kOe. The reason behind such extremedependence of the functional properties of the alloys on thecomposition is not understood at present. However, it isknown that the Ni–Mn–In off-stoichiometric Heusler alloysare prepared by replacing In by Mn at the 4�b� site of thestoichiometric compound,8 and the magnetic and structuraltransitions in this alloy system are functions of thisoff-stoichiometry.1 We speculate that the sharp contrast ofmagnetic behavior between the y=15 and y=15.5 alloys maybe related to the random distribution of Mn and In at the 4�b�site, though we had followed the same well documentedpreparation technique3 for both the alloys. Recently, the ef-fects of random distribution of Mn and Fe in the 4�b� site ofthe Co2Mn1−xFexSi Heusler alloys were probed by 55Mnnuclear magnetic resonance �NMR�.39,40 It would be interest-ing to perform NMR studies to resolve the present problemas well. This could provide better understanding of the func-tional properties of the Ni–Mn–In family of alloys and makethem more predictable in technological applications.
ACKNOWLEDGMENTS
We thank Dr. Tapas Ganguli and Dr. Gurvinderjit Singhfor doing XRD measurements, and Mr. R. K. Meena forhelping in the preparation of alloys.
1Y. Sutou, Y. Imano, N. Koeda, T. Omori, R. Kainuma, K. Ishida, and K.Oikawa, Appl. Phys. Lett. 85, 4358 �2004�.
2K. Oikawa, W. Ito, Y. Imano, Y. Sutou, R. Kainuma, K. Ishida, S. Oka-moto, O. Kitakami, and T. Kanomata, Appl. Phys. Lett. 88, 122507�2006�.
3T. Krenke, M. Acet, E. F. Wassermann, X. Moya, L. Manosa, and A.Planes, Phys. Rev. B 73, 174413 �2006�.
4R. Kainuma, Y. Imano, W. Ito, Y. Sutou, H. Morito, S. Okamoto, K.Oikawa, A. Fujita, T. Kanomata, and K. Ishida, Nature �London� 439, 957�2006�.
5S. Y. Yu, Z. H. Liu, G. D. Liu, J. L. Chen, Z. X. Cao, G. H. Wu, B. Zhang,and X. X. Zhang, Appl. Phys. Lett. 89, 162503 �2006�.
6V. K. Sharma, M. K. Chattopadhyay, K. H. B. Shaeb, A. Chouhan, and S.B. Roy, Appl. Phys. Lett. 89, 222509 �2006�.
7V. K. Sharma, M. K. Chattopadhyay, and S. B. Roy, J. Phys. D: Appl.Phys. 40, 1869 �2007�.
8T. Krenke, E. Duman, M. Acet, E. F. Wassermann, X. Moya, L. Manosa,A. Planes, E. Suard, and B. Ouladdiaf, Phys. Rev. B 75, 104414 �2007�.
9X. Moya, L. Mañosa, A. Planes, S. Aksoy, M. Acet, E. F. Wassermann,and T. Krenke, Phys. Rev. B 75, 184412 �2007�.
10P. A. Bhobe, K. R. Priolkar, and A. K. Nigam, Appl. Phys. Lett. 91,242503 �2007�.
11A. K. Pathak, M. Khan, I. Dubenko, S. Stadler, and N. Ali, Appl. Phys.Lett. 90, 262504 �2007�.
12A. K. Pathak, I. Dubenko, S. Stadler, and N. Ali, J. Phys. D: Appl. Phys.41, 202004 �2008�.
13M. K. Chattopadhyay, V. K. Sharma, and S. B. Roy, Appl. Phys. Lett. 92,022503 �2008�.
14J. Liu, N. Scheerbaum, J. Lyubina, and O. Gutfleisch, Appl. Phys. Lett. 93,102512 �2008�.
15B. Zhang, X. X. Zhang, S. Y. Yu, J. L. Chen, Z. X. Cao, and G. H. Wu,Appl. Phys. Lett. 91, 012510 �2007�.
16V. K. Sharma, M. K. Chattopahyay, and S. B. Roy, Phys. Rev. B 76,140401�R� �2007�.
17M. K. Tiwari, K. J. S. Sawhney, B. Gowri Sankar, V. K. Raghuvanshi, andR. V. Nandedkar, Spectrochim. Acta, Part B 59, 1141 �2004�.
18P. A. Bhobe, K. R. Priolkar, and P. R. Sarode, J. Phys. D: Appl. Phys. 41,045004 �2008�.
19V. K. Sharma, M. K. Chattopadhyay, R. Kumar, T. Ganguli, P. Tiwari, andS. B. Roy, J. Phys.: Condens. Matter 19, 496207 �2007�.
20P. M. Chaikin and T. C. Lubensky, Principles of Condensed Matter Phys-ics �Cambridge University Press, Cambridge, England, 1995�, Chap. 4.
21J. M. Ziman, Principles of the Theory of Solids, 2nd ed. �Press Syndicateof the University of Cambridge, New York, 1972�, p. 225.
22P. A. Bhobe, K. R. Priolkar, and A. K. Nigam, J. Phys. D: Appl. Phys. 41,235006 �2008�.
23M. Khan, I. Dubenko, S. Stadler, and N. Ali, J. Phys.: Condens. Matter 20,235204 �2008�.
24A. K. Pathak, I. Dubenko, J. C. Mabon, S. Stadler, and N. Ali, J. Phys. D:Appl. Phys. 42, 045004 �2009�.
25K.-U. Neumann, T. Kanomata, B. Ouladdiaf, and K. R. A. Ziebeck, J.Phys.: Condens. Matter 14, 1371 �2002�.
26S. Blundell, Magnetism in Condensed Matter �Oxford University Press,New York, 2006�; A. Aharoni, Introduction to the Theory of Ferromag-netism �Oxford University Press, Oxford, 1996�.
27A. Arrott and J. E. Noakes, Phys. Rev. Lett. 19, 786 �1967�.28A. K. Pathak, M. Khan, B. R. Gautam, S. Stadler, I. Dubenko, and N. Ali,
J. Magn. Magn. Mater. 321, 963 �2009�.29W. H. Meiklejohn and C. P. Bean, Phys. Rev. 102, 1413 �1956�.30D. Jiles, Introduction to Magnetism and Magnetic Materials �Chapman
and Hall, London, 1991�.31V. K. Sharma, M. K. Chattopadhyay, and S. B. Roy �unpublished�.32S. Brawer, Relaxation in Viscous Liquids and Glasses �The American
Ceramic Society, Columbus, Ohio, 1985�; P. G. Debenedetti and F. H.Stillinger, Nature �London� 410, 259 �2001�.
33R. Y. Umetsu, W. Ito, K. Ito, K. Koyama, A. Fujita, K. Oikawa, T. Ka-nomata, R. Kainuma, and K. Ishida, Scr. Mater. 60, 25 �2009�.
34V. K. Sharma, M. K. Chattopadhyay, and S. B. Roy, J. Phys.: Condens.
073909-9 Chattopadhyay et al. J. Appl. Phys. 108, 073909 �2010�

Matter 20, 425210 �2008�.35V. V. Khovaylo, T. Kanomata, T. Tanaka, M. Nakashima, Y. Amako, R.
Kainuma, R. Y. Umetsu, H. Morito, and H. Miki, Phys. Rev. B 80, 144409�2009�.
36T. Kanomata, T. Yasuda, S. Sasaki, H. Nishihara, R. Kainuma, W. Ito, K.Oikawa, K. Ishida, K.-U. Neumann, and K. R. A. Ziebeck, J. Magn. Magn.Mater. 321, 773 �2009�.
37W. Ito, Y. Imano, R. Kainuma, Y. Sutou, K. Oikawa, and K. Ishida, Metall.Mater. Trans. A 38, 759 �2007�.
38B. Balke, S. Wurmehl, G. H. Fecher, and C. Felser, Appl. Phys. Lett. 90,172501 �2007�.
39S. Wurmehl, J. T. Kohlhepp, H. J. M. Swagten, B. Koopmans, M. Wojcik,B. Balke, C. G. F. Blum, V. Ksenofontov, G. H. Fecher, and C. Felser,Appl. Phys. Lett. 91, 052506 �2007�.
40S. Wurmehl, J. T. Kohlhepp, H. J. M. Swagten, B. Koopmans, M. Wojcik,B. Balke, C. G. F. Blum, V. Ksenofontov, G. H. Fecher, and C. Felser, J.Appl. Phys. 103, 07D706 �2008�.
073909-10 Chattopadhyay et al. J. Appl. Phys. 108, 073909 �2010�


