Embed Size (px)
Citation preview
1
Chairman’s Communique 02
Highlights 04
Decade at a Glance 05
A Commitment to Value Creation 06
Notice 26
Directors’ Report 30
Report on Corporate Governance 38
Enterprise Risk Management 47
Corporate Social Responsibility 49
Indian GAAP Financial Statements 53
Additional Information to Investors 91
Indian GAAP Consolidated Financial Statements 97
IFRS Consolidated Financial Statements 125
Proxy Form 171
Route Map 172
ECS Mandate 173
Global Offices 174
Contents
2
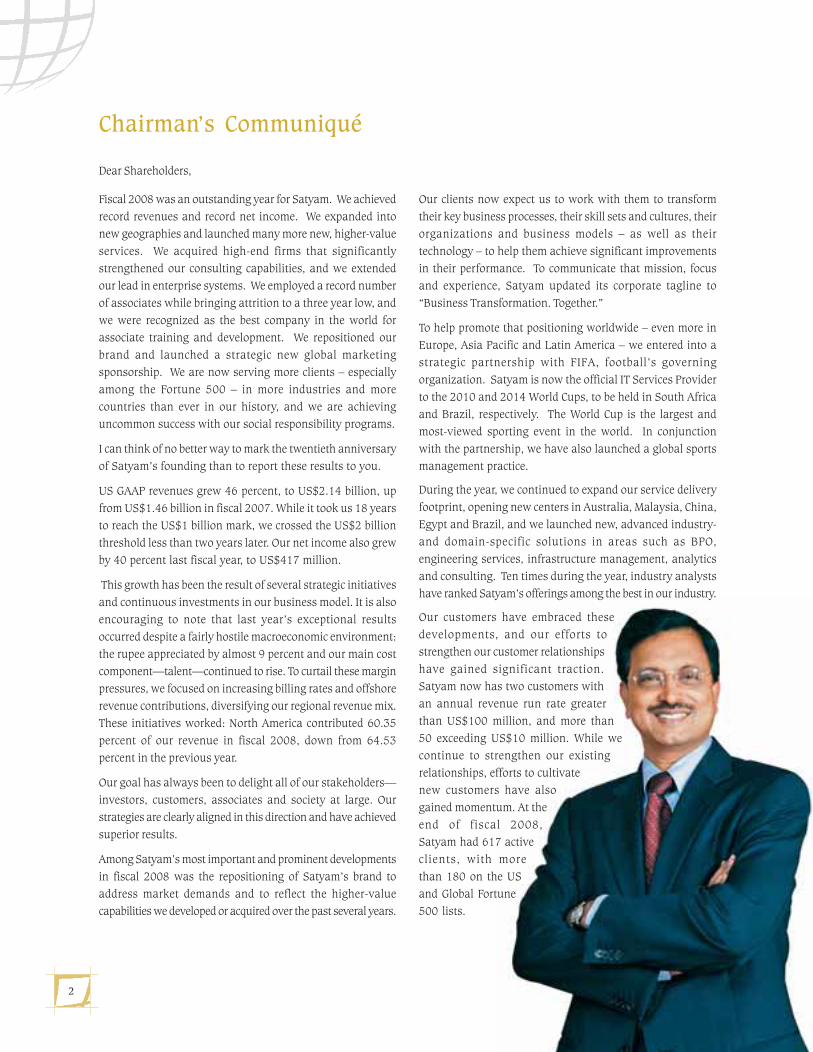
Chairman’s Communiqué
Fiscal 2008 was an outstanding year for Satyam. We achieved
record revenues and record net income. We expanded into
new geographies and launched many more new, higher-value
services. We acquired high-end firms that significantly
strengthened our consulting capabilities, and we extended
our lead in enterprise systems. We employed a record number
of associates while bringing attrition to a three year low, and
we were recognized as the best company in the world for
associate training and development. We repositioned our
brand and launched a strategic new global marketing
sponsorship. We are now serving more clients – especially
among the Fortune 500 – in more industries and more
countries than ever in our history, and we are achieving
uncommon success with our social responsibility programs.
I can think of no better way to mark the twentieth anniversary
of Satyam’s founding than to report these results to you.
US GAAP revenues grew 46 percent, to US$2.14 billion, up
from US$1.46 billion in fiscal 2007. While it took us 18 years
to reach the US$1 billion mark, we crossed the US$2 billion
threshold less than two years later. Our net income also grew
by 40 percent last fiscal year, to US$417 million.
This growth has been the result of several strategic initiatives
and continuous investments in our business model. It is also
encouraging to note that last year’s exceptional results
occurred despite a fairly hostile macroeconomic environment:
the rupee appreciated by almost 9 percent and our main cost
component—talent—continued to rise. To curtail these margin
pressures, we focused on increasing billing rates and offshore
revenue contributions, diversifying our regional revenue mix.
These initiatives worked: North America contributed 60.35
percent of our revenue in fiscal 2008, down from 64.53
percent in the previous year.
Our goal has always been to delight all of our stakeholders—
investors, customers, associates and society at large. Our
strategies are clearly aligned in this direction and have achieved
superior results.
Among Satyam’s most important and prominent developments
in fiscal 2008 was the repositioning of Satyam’s brand to
address market demands and to reflect the higher-value
capabilities we developed or acquired over the past several years.
Our clients now expect us to work with them to transform
their key business processes, their skill sets and cultures, their
organizations and business models – as well as their
technology – to help them achieve significant improvements
in their performance. To communicate that mission, focus
and experience, Satyam updated its corporate tagline to
“Business Transformation. Together.”
To help promote that positioning worldwide – even more in
Europe, Asia Pacific and Latin America – we entered into a
strategic partnership with FIFA, football’s governing
organization. Satyam is now the official IT Services Provider
to the 2010 and 2014 World Cups, to be held in South Africa
and Brazil, respectively. The World Cup is the largest and
most-viewed sporting event in the world. In conjunction
with the partnership, we have also launched a global sports
management practice.
During the year, we continued to expand our service delivery
footprint, opening new centers in Australia, Malaysia, China,
Egypt and Brazil, and we launched new, advanced industry-
and domain-specific solutions in areas such as BPO,
engineering services, infrastructure management, analytics
and consulting. Ten times during the year, industry analysts
have ranked Satyam’s offerings among the best in our industry.
Our customers have embraced these
developments, and our efforts to
strengthen our customer relationships
have gained significant traction.
Satyam now has two customers with
an annual revenue run rate greater
than US$100 million, and more than
50 exceeding US$10 million. While we
continue to strengthen our existing
relationships, efforts to cultivate
new customers have also
gained momentum. At the
end of fiscal 2008,
Satyam had 617 active
clients, with more
than 180 on the US
and Global Fortune
500 lists.
Dear Shareholders,

3
I am pleased to report that MZ Consult, a global investor
relations and financial communications firm, included Satyam
among the five organizations it determined to have the “Best
IR Website” in the Asia Pacific and Africa regions. Satyam also
earned the top ranking in the global technology industry for
“Best Earnings Release and Financial Disclosures Procedures.”
Additionally, we were named among the region’s top two
companies for “Best Corporate Governance Practices.”
Additionally, in January, we listed our existing ADSs on the
NYSE Euronext stock exchange in Amsterdam. The listing
has made investing in Satyam easier, enabled extended trading,
and enhanced the organization’s visibility in Europe.
I am confident that as we continue to work more closely with
clients on their most strategic and critical transformation
initiatives, we will both succeed, and Satyam’s excellent growth
will continue. Against this backdrop, we look forward to a
revenue growth rate of 24 to 26 percent in fiscal 2009 (in
both Indian and US GAAP). While EPS is expected to grow
between 17 and 19 percent in Indian GAAP, EPADS is expected
to grow from 15.2 to 17.6 percent, as per US GAAP. The Board
has proposed a final dividend of 125 percent. The total
dividend for fiscal 2008 stands at 175 percent.
The extraordinary successes I described here are the results of
some 51,000 associates who embody Satyam’s values of
entrepreneurship, collaboration, inventiveness and
responsibility. I am proud to count myself among them, and
I look forward to working with them, with our clients, and
with you as we take Satyam into its next twenty years.
Best regards,
B. Ramalinga Raju
Place : Hyderabad
Date : April 21, 2008
Our ability to acquire and retain talented professionals has
also been exemplary. Today, Satyam has more than 51,000
employees, and our annualized attrition rate in Q4 was 11.5
percent—among the industry’s lowest. Our excellent retention
is a result of our considerable efforts to provide excellent career
and leadership opportunities, efforts recognized by the
American Society for Training and Development last year when
they named Satyam the single best company in the world for
associate development – the first time a non-American
company was ever cited for this honor.
Superior innovation is also fundamental to Satyam’s success,
and draws on our culture of continuous learning. The capacity
to innovate is a primary determinant of market value for
companies like ours.
A new venture with Cisco Systems, Inc. is an example of
innovation that resulted in a transformational opportunity.
The venture provides secure medical and emergency
management services to local and national governments,
among other segments. The services are built on advanced –
yet proven – processes and technology, and are designed to be
replicated and implemented across the world.
Innovation extends to how we build our capabilities. From
this perspective, we made four key acquisitions in fiscal 2008.
In Q2, we acquired Nitor Global Solutions, a UK-based
infrastructure management services firm to bolster our
growing remote IMS capabilities. Nitor helps customers design,
implement and manage Microsoft technologies. In Q3, we
acquired Bridge Strategy Group, a high-end, US-based
management consulting firm. Bridge strengthens our
business strategy formulation and business transformation
capabilities and provides us expanded access to additional
clients, at higher levels.
In the fourth quarter, we entered into a definitive agreement
with S&V Management Consultants, a renowned, Belgium-
based supply chain management consulting firm that ARC
Advisory Group ranks among the world’s premier boutique
SCM consulting companies. And, to augment our capabilities
in the increasingly important market research and customer
analytics field, we acquired Caterpillar’s Market research and
customer analytics business, including its intellectual property.
4
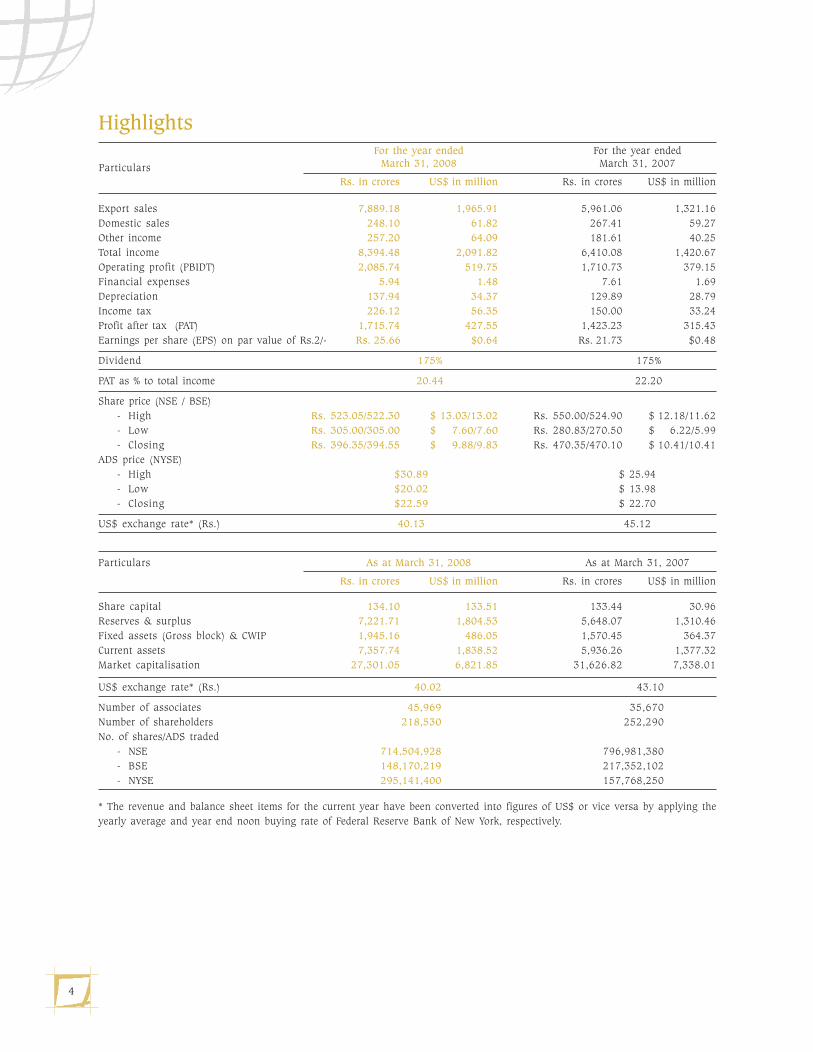
HighlightsFor the year ended For the year ended
March 31, 2008 March 31, 2007
Rs. in crores US$ in million Rs. in crores US$ in million
Export sales 7,889.18 1,965.91 5,961.06 1,321.16
Domestic sales 248.10 61.82 267.41 59.27
Other income 257.20 64.09 181.61 40.25
Total income 8,394.48 2,091.82 6,410.08 1,420.67
Operating profit (PBIDT) 2,085.74 519.75 1,710.73 379.15
Financial expenses 5.94 1.48 7.61 1.69
Depreciation 137.94 34.37 129.89 28.79
Income tax 226.12 56.35 150.00 33.24
Profit after tax (PAT) 1,715.74 427.55 1,423.23 315.43
Earnings per share (EPS) on par value of Rs.2/- Rs. 25.66 $0.64 Rs. 21.73 $0.48
Dividend 175% 175%
PAT as % to total income 20.44 22.20
Share price (NSE / BSE)
- High Rs. 523.05/522.30 $ 13.03/13.02 Rs. 550.00/524.90 $ 12.18/11.62
- Low Rs. 305.00/305.00 $ 7.60/7.60 Rs. 280.83/270.50 $ 6.22/5.99
- Closing Rs. 396.35/394.55 $ 9.88/9.83 Rs. 470.35/470.10 $ 10.41/10.41
ADS price (NYSE)
- High $30.89 $ 25.94
- Low $20.02 $ 13.98
- Closing $22.59 $ 22.70
US$ exchange rate* (Rs.) 40.13 45.12
Particulars As at March 31, 2008 As at March 31, 2007
Rs. in crores US$ in million Rs. in crores US$ in million
Share capital 134.10 133.51 133.44 30.96
Reserves & surplus 7,221.71 1,804.53 5,648.07 1,310.46
Fixed assets (Gross block) & CWIP 1,945.16 486.05 1,570.45 364.37
Current assets 7,357.74 1,838.52 5,936.26 1,377.32
Market capitalisation 27,301.05 6,821.85 31,626.82 7,338.01
US$ exchange rate* (Rs.) 40.02 43.10
Number of associates 45,969 35,670
Number of shareholders 218,530 252,290
No. of shares/ADS traded
- NSE 714,504,928 796,981,380
- BSE 148,170,219 217,352,102
- NYSE 295,141,400 157,768,250
* The revenue and balance sheet items for the current year have been converted into figures of US$ or vice versa by applying the
yearly average and year end noon buying rate of Federal Reserve Bank of New York, respectively.
Particulars
5
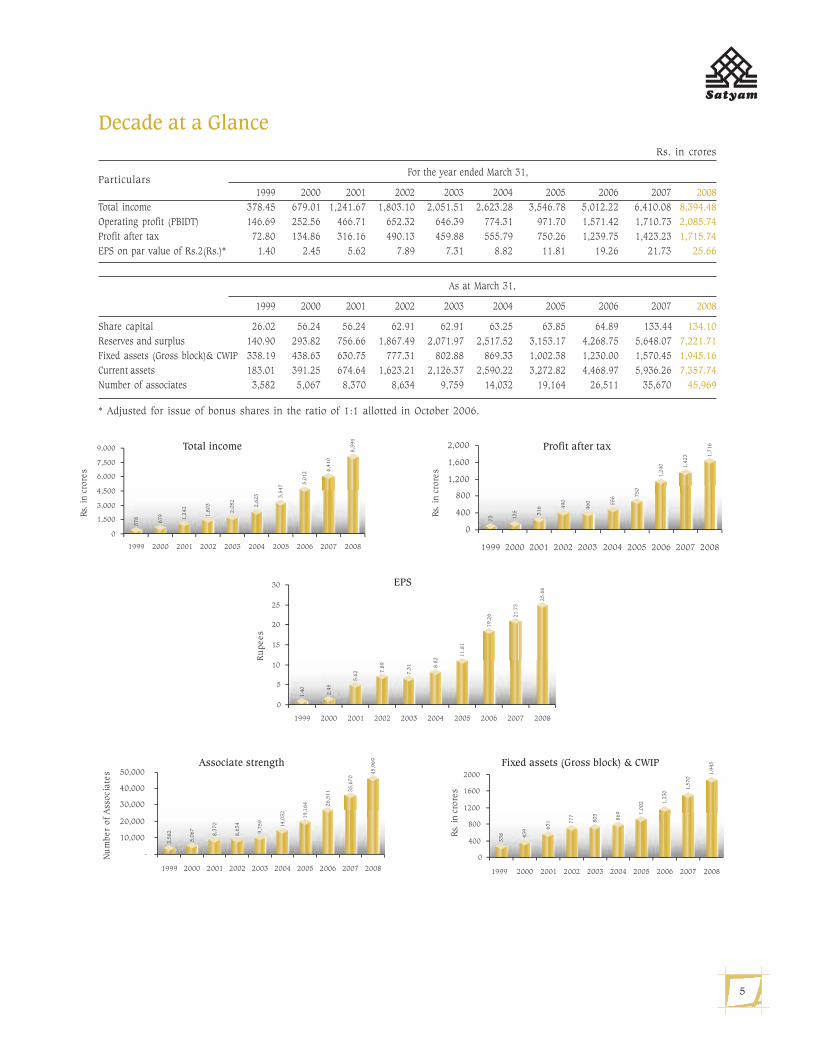
Decade at a GlanceRs. in crores
ParticularsFor the year ended March 31,
1999 2000 2001 2002 2003 2004 2005 2006 2007 2008
Total income 378.45 679.01 1,241.67 1,803.10 2,051.51 2,623.28 3,546.78 5,012.22 6,410.08 8,394.48
Operating profit (PBIDT) 146.69 252.56 466.71 652.32 646.39 774.31 971.70 1,571.42 1,710.73 2,085.74
Profit after tax 72.80 134.86 316.16 490.13 459.88 555.79 750.26 1,239.75 1,423.23 1,715.74
EPS on par value of Rs.2(Rs.)* 1.40 2.45 5.62 7.89 7.31 8.82 11.81 19.26 21.73 25.66
ParticularsAs at March 31,
1999 2000 2001 2002 2003 2004 2005 2006 2007 2008
Share capital 26.02 56.24 56.24 62.91 62.91 63.25 63.85 64.89 133.44 134.10
Reserves and surplus 140.90 293.82 756.66 1,867.49 2,071.97 2,517.52 3,153.17 4,268.75 5,648.07 7,221.71
Fixed assets (Gross block)& CWIP 338.19 438.63 630.75 777.31 802.88 869.33 1,002.38 1,230.00 1,570.45 1,945.16
Current assets 183.01 391.25 674.64 1,623.21 2,126.37 2,590.22 3,272.82 4,468.97 5,936.26 7,357.74
Number of associates 3,582 5,067 8,370 8,634 9,759 14,032 19,164 26,511 35,670 45,969
* Adjusted for issue of bonus shares in the ratio of 1:1 allotted in October 2006.
6
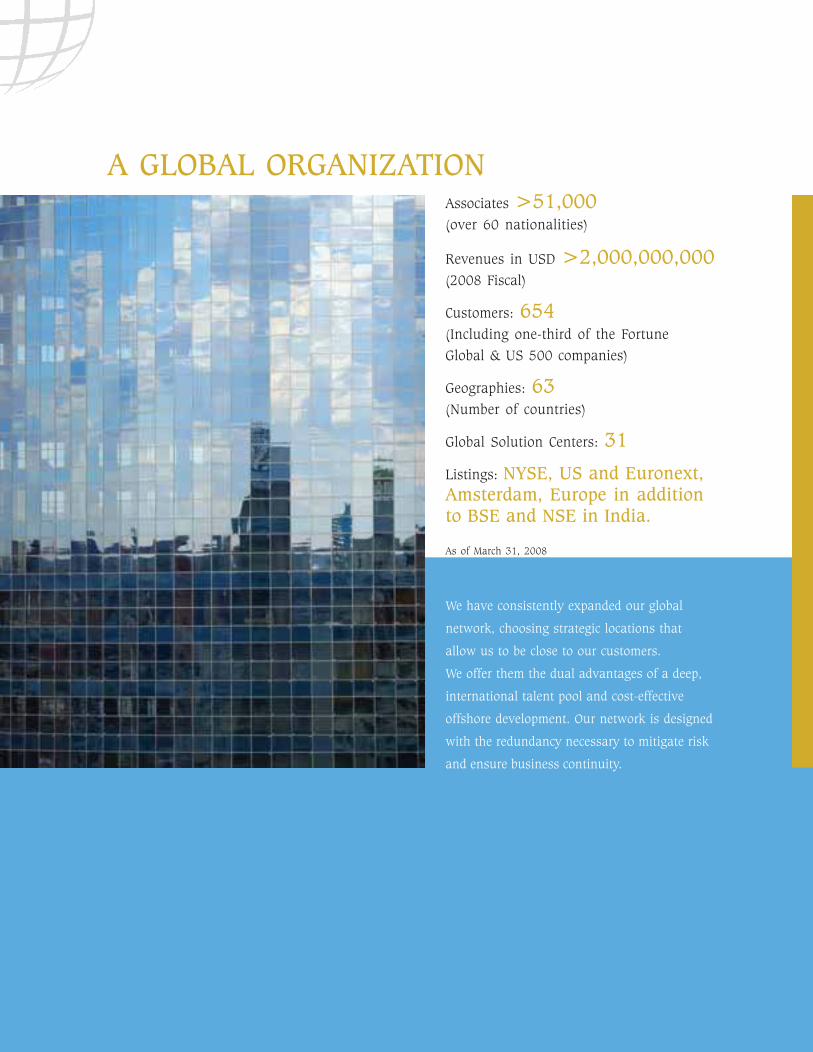
We have consistently expanded our global
network, choosing strategic locations that
allow us to be close to our customers.
We offer them the dual advantages of a deep,
international talent pool and cost-effective
offshore development. Our network is designed
with the redundancy necessary to mitigate risk
and ensure business continuity.
A GLOBAL ORGANIZATIONAssociates >51,000(over 60 nationalities)
Revenues in USD >2,000,000,000(2008 Fiscal)
Customers: 654(Including one-third of the Fortune
Global & US 500 companies)
Geographies: 63(Number of countries)
Global Solution Centers: 31
Listings: NYSE, US and Euronext,Amsterdam, Europe in additionto BSE and NSE in India.
As of March 31, 2008

7
We thrive on diversity. The varied perspectives our
associates bring form the basis for fresh thinking and
innovation. At an operational level, cultural diversity
helps us connect with our customers and understand
global markets better.
ENRICHED BYDIVERSITY
PRISCILLA D. NELSONHEAD - EXECUTIVE COACHING & MENTORING
NISHI LEVITTHEAD - EMERGING
AND NEW LEADER PROGRAMS
We believe that our people need an atmosphere
that nurtures their diversity, intelligence and
curiosity. A prime example is the Satyam
Technology Center (STC) in Hyderabad, India.
STC is quite unique in the way it combines
state-of-the-art infrastructure with a
close-to-nature setting. Right outside the
windows of the high-tech building, are a golf
course, a deer park and an aviary that houses
a number of exotic species. This proximity to
nature helps to create a harmonious, productive
environment and adds a special dimension to
both business and leisure activities.
WORLD-CLASSWORKPLACES
8
BUSINESSTRANSFORMATION.TOGETHER.
To remain competitive and succeed, organizations
must continually change and adapt. This cycle of
change is not new. However, the speed at which this
change is happening demands new ways of thinking
and working. It is imperative for organizations to
consider critical issues holistically, instead of in an
isolated or tactical manner. As we go forward on our
journey of value-creation, we will work closely with
our partners to create and implement integrated,
interconnected programs that help them thrive
in this volatile, global marketplace. Together,
we will enact bold, large-scale change that leads
to dramatic business improvement. We will enable
Business Transformation. Together.

9
We exist to create value
FOR OUR ASSOCIATESWe enable them to realize their potential as leaders.
FOR OUR INVESTORSWe repay their faith in us with consistent business performance.
FOR OUR CUSTOMERSWe partner with them in their business endeavors.
AND FOR SOCIETYWe help to empower them towards sustainability.
�
�
�
�
V A L U E C R E A T I O N
10
CREATING VALUEFOR ASSOCIATES
We create value for our associates through accelerated leadership
opportunities and empowerment. We want our associates to become leaders
early in their careers, so they can meet their long-term professional and
personal goals faster. Long ago we recognized that empowerment is truly
about providing a non-threatening environment where associates are nurtured
to take calculated risks and total accountability. Empowered teams are
happier and more successful. Our long-term success lies in providing our
people with the information, the decision-making power and training they
need to satisfy their stakeholders and meet their goals.
11
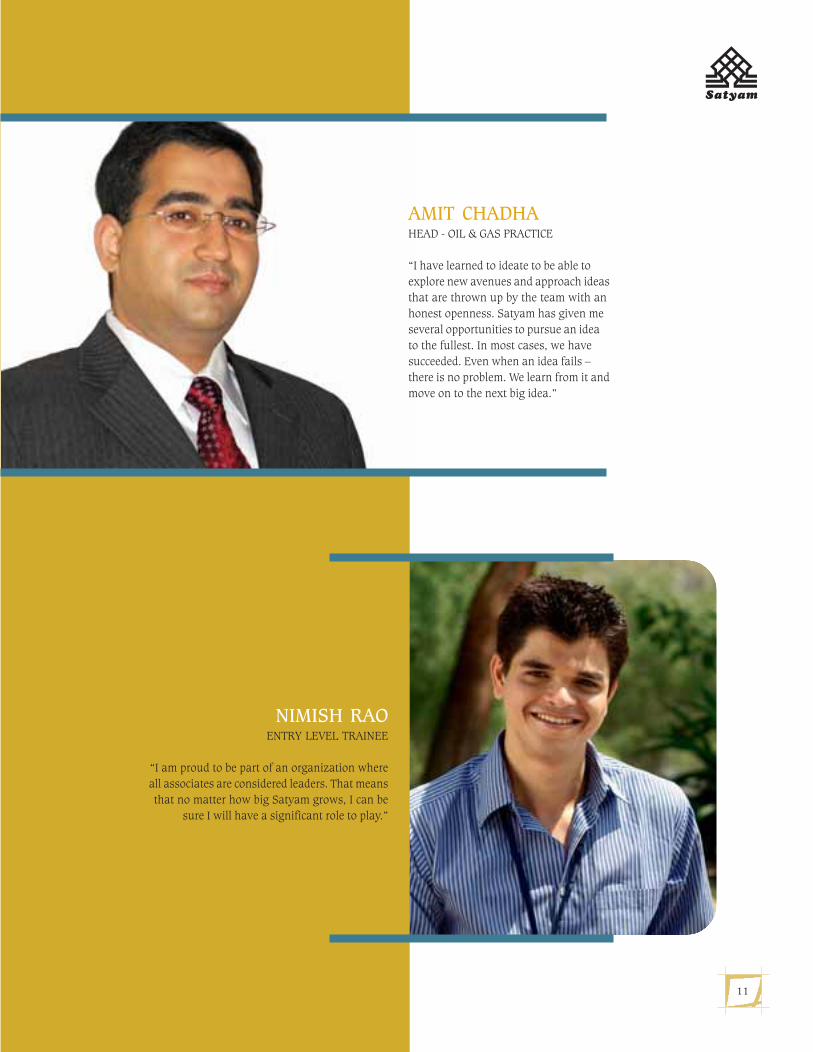
NIMISH RAOENTRY LEVEL TRAINEE
“I am proud to be part of an organization where
all associates are considered leaders. That means
that no matter how big Satyam grows, I can be
sure I will have a significant role to play.”
AMIT CHADHAHEAD - OIL & GAS PRACTICE
“I have learned to ideate to be able to
explore new avenues and approach ideas
that are thrown up by the team with an
honest openness. Satyam has given me
several opportunities to pursue an idea
to the fullest. In most cases, we have
succeeded. Even when an idea fails –
there is no problem. We learn from it and
move on to the next big idea.”

12
CREATING VALUEFOR INVESTORS
Our investors desire profits and growth.
To ensure that we focus on profits at every level,
we encourage an entrepreneurial mindset at Satyam.
We treat every significant value creating entity
at Satyam as a business that is required to fulfill
its commitment of being profitable to its investor.
With this entrepreneurial mindset, we also pursue
growth opportunities aggressively to deliver both
near and long-term value for our investors.
13
G. MEENAKSHILAB TECHNICIAN
GOVERNMENT DENTAL COLLEGE
“I have never really invested in the stock market but applied
for a hundred Satyam shares in 1992. They have now
multiplied many times over and the share value has grown
tremendously. Knowing I have made a good investment
makes me feel very secure and confident.”
Y.V. RAMANA MURTHYRETIRED DEPUTY GENERAL MANAGER
PUBLIC SECTOR BANK
“I am very pleased with my decision to invest in Satyam
and so is my family. My original investment was just
Rs. 2000. Today, of course it is in hundreds of thousands
of rupees. Just the dividend I have received from the company
in the last 16 years is many times more than my original
investment. The consistency and predictability of my returns
have helped to give me peace-of-mind.”

14
CREATING VALUEFOR CUSTOMERS
We have always wanted to foster deep,
long-term partnerships with our customers.
These partnerships go much beyond their IT function.
In our engagement with customers, we seek to
co-create value rather than merely execute
contractual specifications. We seek to play the role
of a trusted advisor, who will conceive and
implement solutions jointly with customers,
continuously working towards their success in their
respective business domains. Our goal is to deliver
lasting impact. To create enduring partnerships,
we need to continually come up with win-win
solutions. That’s because we believe that it is
important for both parties to win at all times and
that innovation is constantly required to make this
happen. Our objective is to deliver business
transformation for our customers – making them
globally competitive and helping them to always
stay one step ahead of the curve.
15
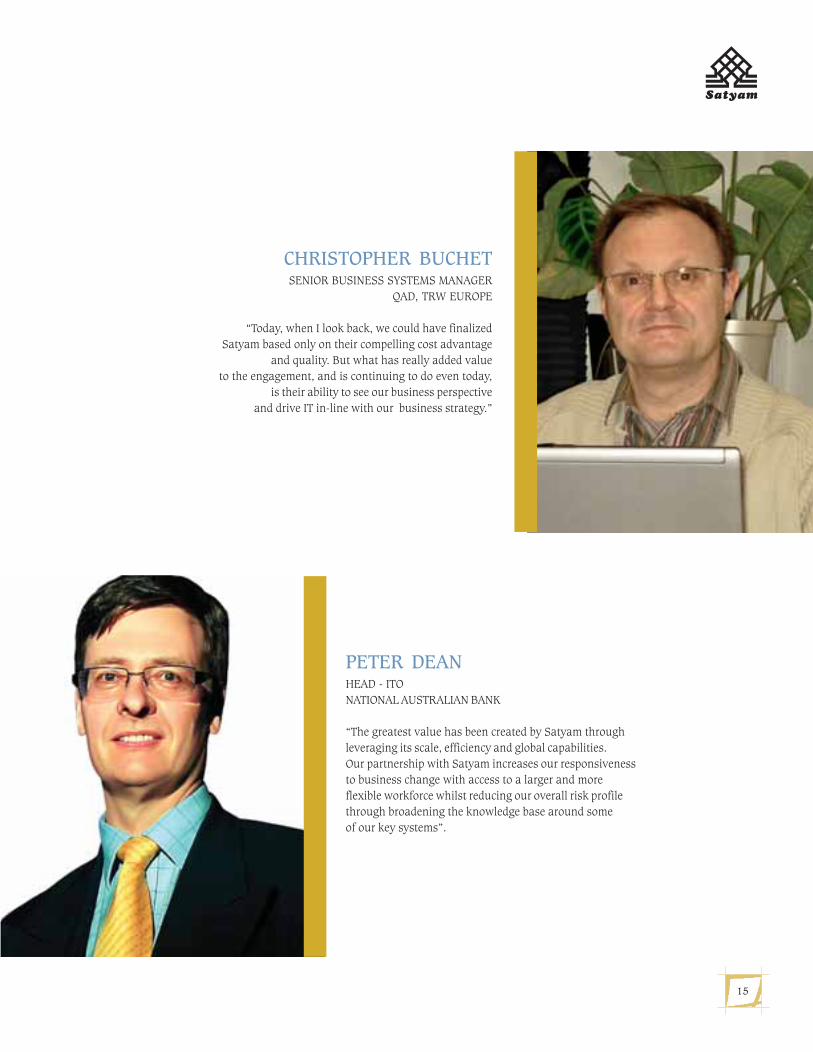
PETER DEANHEAD - ITO
NATIONAL AUSTRALIAN BANK
“The greatest value has been created by Satyam through
leveraging its scale, efficiency and global capabilities.
Our partnership with Satyam increases our responsiveness
to business change with access to a larger and more
flexible workforce whilst reducing our overall risk profile
through broadening the knowledge base around some
of our key systems”.
CHRISTOPHER BUCHETSENIOR BUSINESS SYSTEMS MANAGER
QAD, TRW EUROPE
“Today, when I look back, we could have finalized
Satyam based only on their compelling cost advantage
and quality. But what has really added value
to the engagement, and is continuing to do even today,
is their ability to see our business perspective
and drive IT in-line with our business strategy.”
16
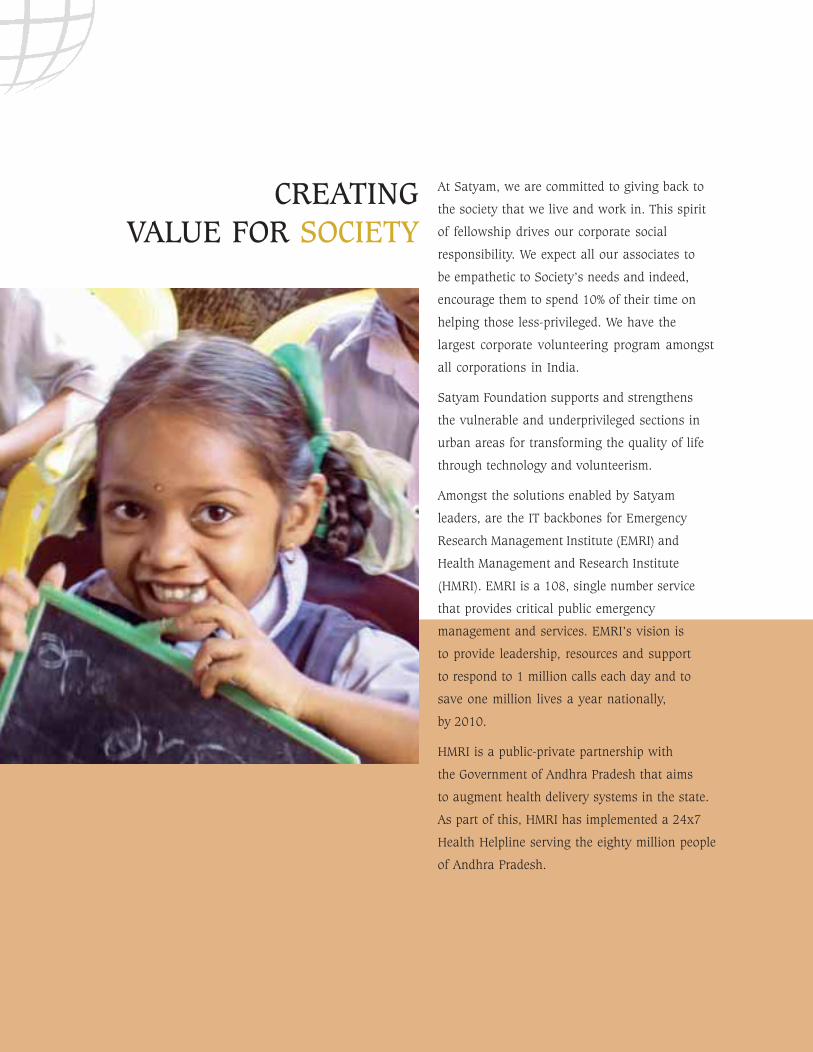
CREATINGVALUE FOR SOCIETY
At Satyam, we are committed to giving back to
the society that we live and work in. This spirit
of fellowship drives our corporate social
responsibility. We expect all our associates to
be empathetic to Society’s needs and indeed,
encourage them to spend 10% of their time on
helping those less-privileged. We have the
largest corporate volunteering program amongst
all corporations in India.
Satyam Foundation supports and strengthens
the vulnerable and underprivileged sections in
urban areas for transforming the quality of life
through technology and volunteerism.
Amongst the solutions enabled by Satyam
leaders, are the IT backbones for Emergency
Research Management Institute (EMRI) and
Health Management and Research Institute
(HMRI). EMRI is a 108, single number service
that provides critical public emergency
management and services. EMRI’s vision is
to provide leadership, resources and support
to respond to 1 million calls each day and to
save one million lives a year nationally,
by 2010.
HMRI is a public-private partnership with
the Government of Andhra Pradesh that aims
to augment health delivery systems in the state.
As part of this, HMRI has implemented a 24x7
Health Helpline serving the eighty million people
of Andhra Pradesh.
17
MALATHI
“At the end of the training, I was confident for the
first time in life that I would be able to take care of
my child and myself. Though I know that I will not
be cured of the virus, with due care and proper
medication, I will be able to live longer and see my
child grow. My child is healthy, free of the HIV virus
and is going to school. Thank you, Satyam
Foundation for helping me reclaim my life.”
VENKAT RAMANA
“I used to think that I will keep struggling like my father
and would not be able to change things.
Satyam Foundation helped me to break free and realize
my potential. I joined the IT school run by the foundation,
where I learnt spoken English, improved my communication
skills and also picked up some computer skills.
After the course, I applied for and won a job as
a computer operator in Kuwait.”
18
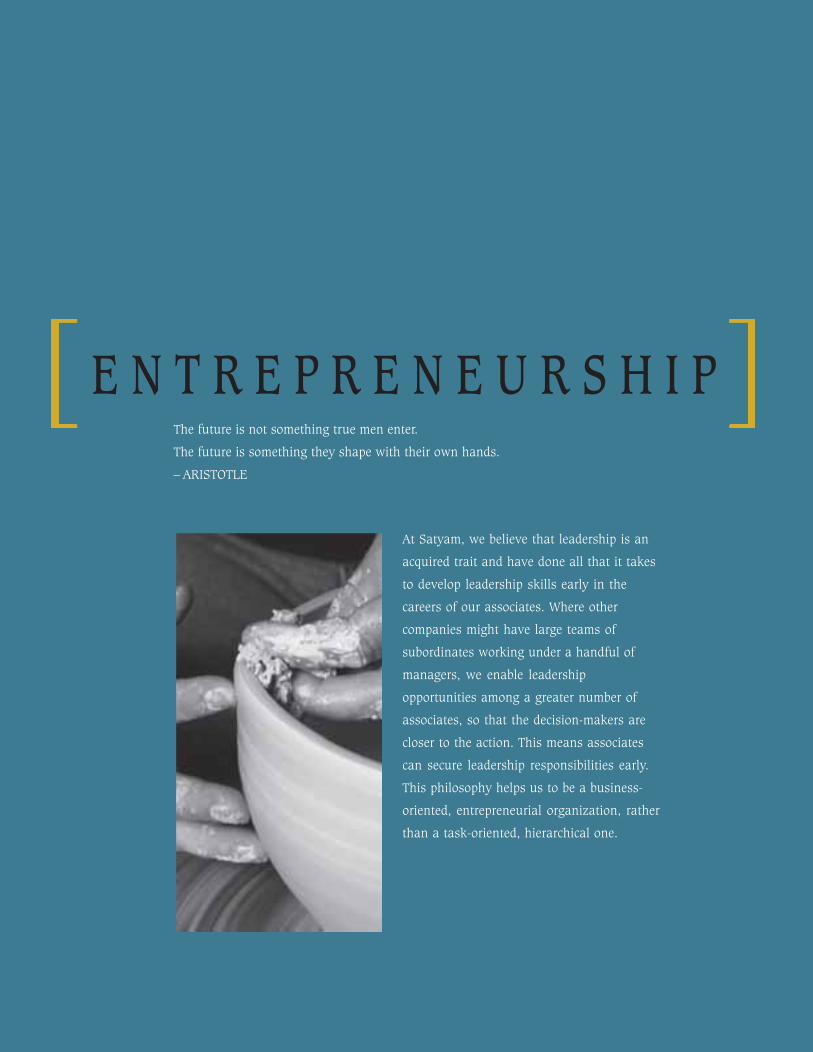
E N T R E P R E N E U R S H I PThe future is not something true men enter.
The future is something they shape with their own hands.
– ARISTOTLE
At Satyam, we believe that leadership is an
acquired trait and have done all that it takes
to develop leadership skills early in the
careers of our associates. Where other
companies might have large teams of
subordinates working under a handful of
managers, we enable leadership
opportunities among a greater number of
associates, so that the decision-makers are
closer to the action. This means associates
can secure leadership responsibilities early.
This philosophy helps us to be a business-
oriented, entrepreneurial organization, rather
than a task-oriented, hierarchical one.
19
KIR
AN
CA
VA
LE
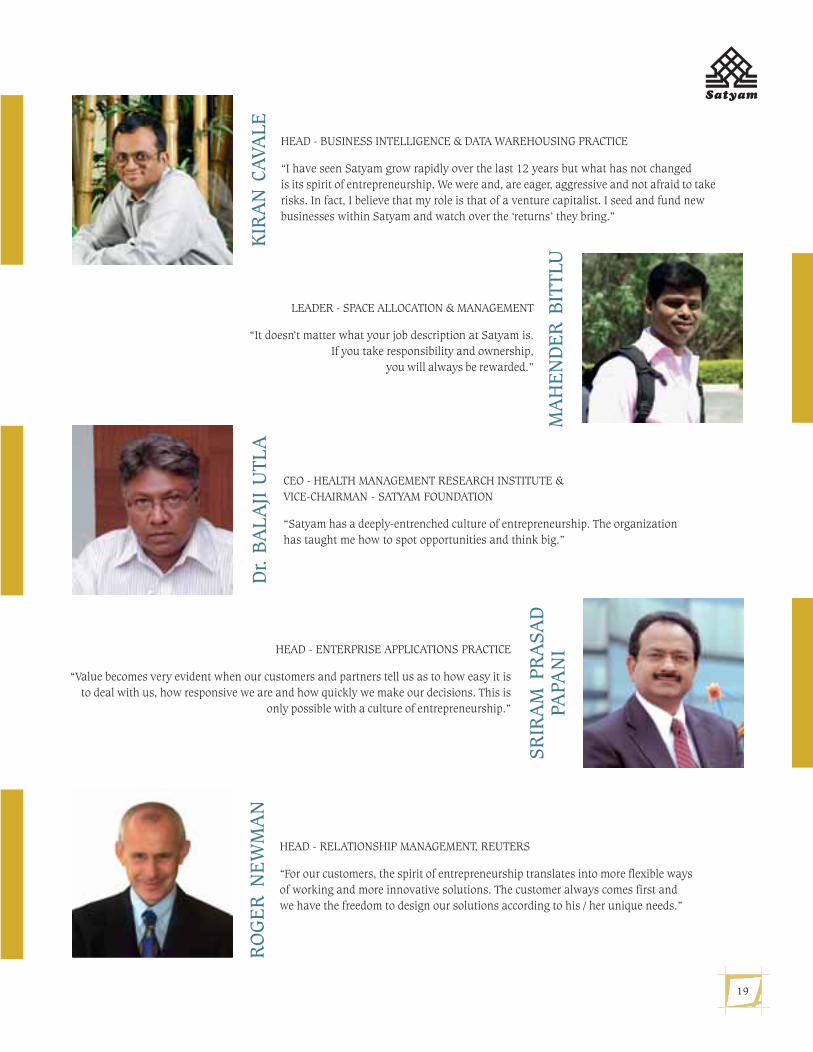
HEAD - BUSINESS INTELLIGENCE & DATA WAREHOUSING PRACTICE
“I have seen Satyam grow rapidly over the last 12 years but what has not changed
is its spirit of entrepreneurship. We were and, are eager, aggressive and not afraid to take
risks. In fact, I believe that my role is that of a venture capitalist. I seed and fund new
businesses within Satyam and watch over the ‘returns’ they bring.”
SR
IRA
M P
RA
SA
DPA
PAN
IHEAD - ENTERPRISE APPLICATIONS PRACTICE
“Value becomes very evident when our customers and partners tell us as to how easy it is
to deal with us, how responsive we are and how quickly we make our decisions. This is
only possible with a culture of entrepreneurship.”
RO
GE
R N
EW
MA
N
HEAD - RELATIONSHIP MANAGEMENT, REUTERS
“For our customers, the spirit of entrepreneurship translates into more flexible ways
of working and more innovative solutions. The customer always comes first and
we have the freedom to design our solutions according to his / her unique needs.”
MA
HE
ND
ER
BIT
TLU
LEADER - SPACE ALLOCATION & MANAGEMENT
“It doesn’t matter what your job description at Satyam is.
If you take responsibility and ownership,
you will always be rewarded.”
Dr. B
AL
AJI
UTL
A
CEO - HEALTH MANAGEMENT RESEARCH INSTITUTE &
VICE-CHAIRMAN - SATYAM FOUNDATION
“Satyam has a deeply-entrenched culture of entrepreneurship. The organization
has taught me how to spot opportunities and think big.”

20
L E A D E R S H I P
If you ask us
what business
we are really in,
we’d say we are in
the Business of
Growing Leaders
21
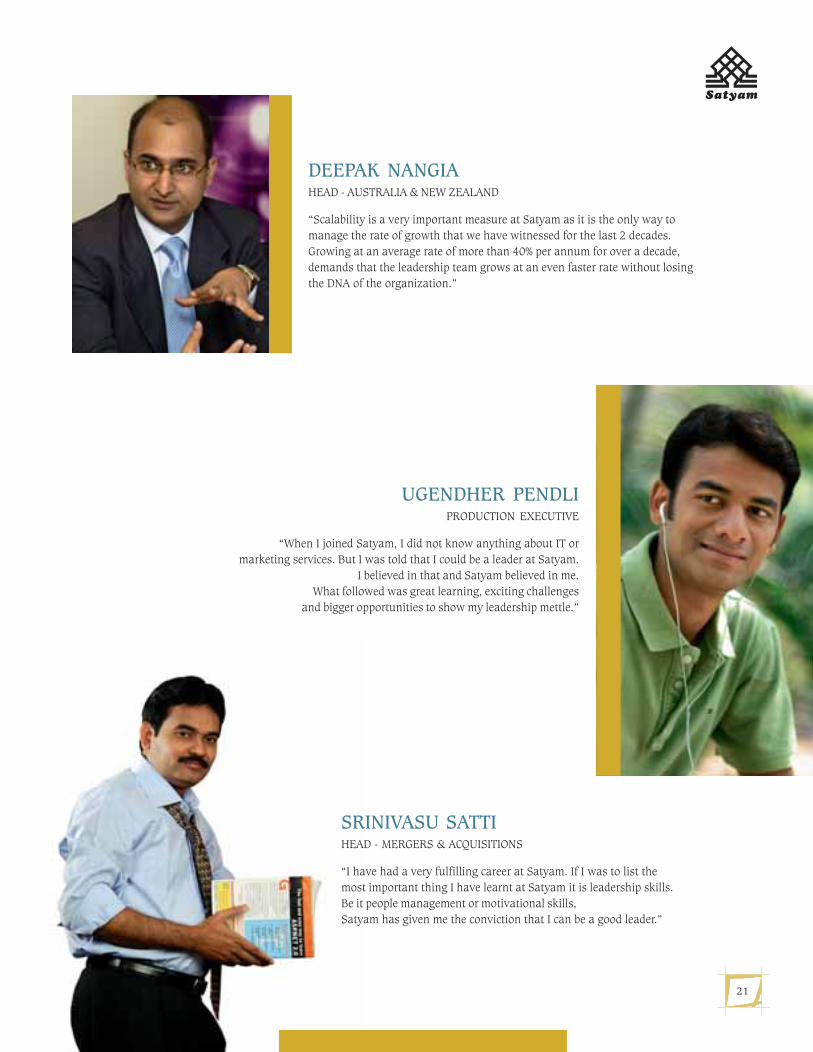
DEEPAK NANGIAHEAD - AUSTRALIA & NEW ZEALAND
“Scalability is a very important measure at Satyam as it is the only way to
manage the rate of growth that we have witnessed for the last 2 decades.
Growing at an average rate of more than 40% per annum for over a decade,
demands that the leadership team grows at an even faster rate without losing
the DNA of the organization.”
UGENDHER PENDLIPRODUCTION EXECUTIVE
“When I joined Satyam, I did not know anything about IT or
marketing services. But I was told that I could be a leader at Satyam.
I believed in that and Satyam believed in me.
What followed was great learning, exciting challenges
and bigger opportunities to show my leadership mettle.”
SRINIVASU SATTIHEAD - MERGERS & ACQUISITIONS
“I have had a very fulfilling career at Satyam. If I was to list the
most important thing I have learnt at Satyam it is leadership skills.
Be it people management or motivational skills,
Satyam has given me the conviction that I can be a good leader.”
22
I N N O V A T I N
You won’t
find an
R&D
Department
at Satyam
Innovation is the successful exploitation
of creative ideas. An innovative organization
delivers higher earnings for its investors. For
associates, it means more interesting work,
better skills and higher wages.
For customers, it means higher quality and
better value. Instead of creating incremental
enhancements, we want innovation at
Satyam to change the game. That’s why
we want the spirit of innovation to be
all-pervasive, both in market-facing
businesses as well as our internal processes.
23
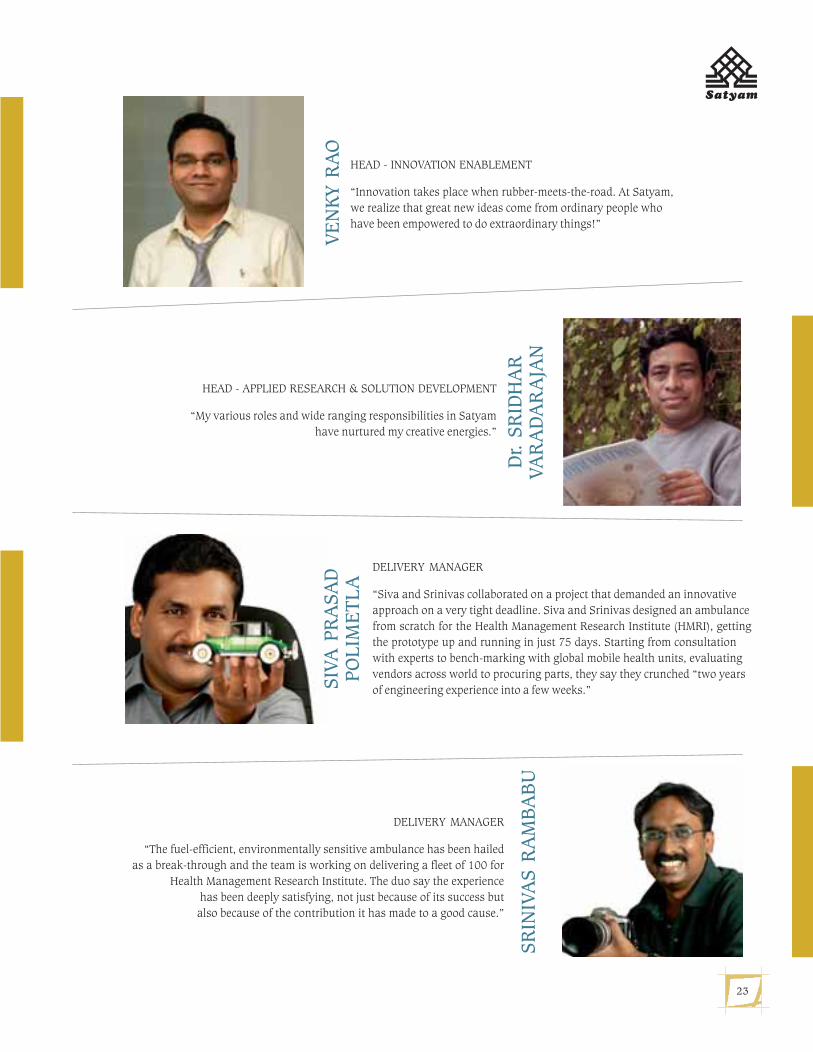
VE
NK
Y R
AO
HEAD - INNOVATION ENABLEMENT
“Innovation takes place when rubber-meets-the-road. At Satyam,
we realize that great new ideas come from ordinary people who
have been empowered to do extraordinary things!”
DELIVERY MANAGER
“The fuel-efficient, environmentally sensitive ambulance has been hailed
as a break-through and the team is working on delivering a fleet of 100 for
Health Management Research Institute. The duo say the experience
has been deeply satisfying, not just because of its success but
also because of the contribution it has made to a good cause.”
SR
INIV
AS R
AM
BA
BU
Dr. S
RID
HA
RV
AR
AD
AR
AJA
N
HEAD - APPLIED RESEARCH & SOLUTION DEVELOPMENT
“My various roles and wide ranging responsibilities in Satyam
have nurtured my creative energies.”
DELIVERY MANAGER
“Siva and Srinivas collaborated on a project that demanded an innovative
approach on a very tight deadline. Siva and Srinivas designed an ambulance
from scratch for the Health Management Research Institute (HMRI), getting
the prototype up and running in just 75 days. Starting from consultation
with experts to bench-marking with global mobile health units, evaluating
vendors across world to procuring parts, they say they crunched “two years
of engineering experience into a few weeks.”SIV
A P
RA
SA
DPO
LIM
ET
LA

24
As we continue our journey,
we reaffirm our commitment
to placing our customer’s
success before ours,
upholding our values and
creating value
for our stakeholders.
25
Board of Directors
B Ramalinga RajuChairman
B Rama RajuManaging Director
Ram MynampatiPresident & Whole-time Director
Dr. (Mrs.) Mangalam Srinivasan
Prof. Krishna G Palepu
Vinod K Dham
Prof. M Rammohan Rao
T R Prasad
Prof. V S Raju
Chief Financial Officer
V SrinivasDirector & Sr. Vice President
Company Secretary
G JayaramanGlobal Head – Corporate Governance
Auditors
Price Waterhouse,Chartered Accountants,Hyderabad – 500 034
BankersBank of BarodaBNP ParibasCitibank N.A.HDFC Bank LimitedHSBC LimitedICICI Bank Limited
Registered Office
Mayfair Centre, I Floor, 1-8-303/36,S.P. Road, Secunderabad – 500 003. A.P., India
Sat_AR08_Final_Jul22_TP 2 Col.pmd 7/23/2008, 7:18 PM25
26
Ordinary Business1. To receive, consider and adopt
a) The audited Balance Sheet as at March 31, 2008;
b) The audited Profit and Loss Account for the yearended on that date;
c) The auditors' report, thereon; and
d) The directors' report.
2. To declare dividend on equity shares.
3. To appoint a Director in place of Prof. M RammohanRao, director, who retires by rotation and, being eligible,offers himself for reappointment.
4. To appoint a Director in place of Mr. Vinod K Dham, director,who retires by rotation and, being eligible, offers himselffor reappointment.
5. To appoint M/s. Pricewaterhouse, Chartered Accountants,as auditors of the Company for the period commencingfrom the conclusion of this meeting until the conclusionof the next Annual General Meeting, and to fix theirremuneration.
Special Business6. To consider and if thought fit, to pass with or without
modification(s), the following resolution as an ordinaryresolution:
“RESOLVED THAT further to the resolution passed at theAnnual General Meeting held on July 23, 2004 and pursuantto the provisions of Sections 198, 269, 309, 310, 311,Schedule XIII to the Act, and other applicable provisions, ifany, of the Companies Act, 1956 (including any statutorymodification or re-enactment thereof, for the time being inforce) and subject to such sanctions and approvals as maybe necessary, approval be and is hereby accorded to thereappointment of Mr. B Ramalinga Raju, as Chairman andDirector in the whole-time employment of the Company fora further period of five years with effect from April 1, 2009at a remuneration as has been set out below:
i. Salary (per month) – Rs. 200,000/-
ii. Commission – Not more than one percent of the net
profits of the Company computed in accordance with
Section 349 of the Companies Act, 1956.
iii. Perquisites:
a) Contribution to Provident Fund, SuperannuationFund to the extent these either singly or puttogether are not taxable under the Income TaxAct, 1961.
b) Gratuity payable at a rate not exceeding half amonth’s salary for each completed year ofservice.
c) Leave encashment as per the Company’s rules.
d) Leave travel concession for self and family asper actuals.
e) Medical reimbursement as per actuals.
f) Furnished accommodation with gas, water,electricity, security, etc.
g ) Provision of Company owned cars and telephonefor personal purposes.
h) Club fees (maximum two clubs).
Note: The perquisites shall be valued on cost toCompany basis.
RESOLVED FURTHER THAT the Board be and is herebyauthorized to vary, alter or modify the different componentsof the above remuneration as may be agreed to by theBoard of Directors and Mr. B Ramalinga Raju.
RESOLVED FURTHER THAT in case of absence orinadequacy of profits for any financial year, the Chairmanshall be paid remuneration as per Section II of Part II ofSchedule XIII to the Companies Act, 1956 (including anystatutory modification or re-enactment thereof, for the timebeing in force) as may be applicable from time to time.”
7. To consider and if thought fit, to pass with or withoutmodification(s), the following resolution as an ordinaryresolution:
“RESOLVED THAT further to the resolution passed at theAnnual General Meeting held on July 23, 2004 and pursuantto the provisions of Sections 198, 269, 309, 310, 311 andschedule XIII to the Act, and other applicable provisions, ifany, of the Companies Act, 1956 (including any statutorymodification or re-enactment thereof, for the time being in
Notice
Notice is hereby given that the 21st Annual General Meeting of Satyam Computer Services Limited will be held as per the
schedule given below.
Day and Date : Tuesday, August 26, 2008
Time : 11.00 AM
Venue : Sri Sathya Sai Nigamagamam (Kalyana Mandapam)
8-3-987/2, Srinagar Colony, Hyderabad – 500 073
Sat_AR08_Final_Jul22_TP 2 Col.pmd 7/23/2008, 7:18 PM26
27
force) and subject to such sanctions and approvals as maybe necessary, approval be and is hereby accorded to thereappointment of Mr. B Rama Raju, as Managing Directorof the Company for a further period of five years with effectfrom April 1, 2009 at a remuneration as has been set outbelow:
i) Salary (per month) – Rs. 190,000/-
ii) Commission – Not more than one percent of the netprofits of the Company computed in accordance withSection 349 of the Companies Act, 1956.
iii) Perquisites:
a) Contribution to Provident Fund, SuperannuationFund to the extent these either singly or puttogether are not taxable under the Income TaxAct, 1961.
b) Gratuity payable at a rate not exceeding half amonth’s salary for each completed year ofservice.
c) Leave encashment as per the Company’s rules.
d) Leave travel concession for self and family asper actuals.
e) Medical reimbursement as per actuals.
f) Furnished accommodation with gas, water,electricity, security, etc.
g ) Provision of Company owned cars and telephonefor personal purposes.
h) Club fees (maximum two clubs).
Note: The perquisites shall be valued on cost toCompany basis.
RESOLVED FURTHER THAT the Board be and is herebyauthorized to vary, alter or modify the different componentsof the above remuneration as may be agreed to by theBoard of Directors and Mr. B. Rama Raju.
RESOLVED FURTHER THAT in case of absence orinadequacy of profits for any financial year, the ManagingDirector shall be paid remuneration as per Section II of PartII of Schedule XIII to the Companies Act, 1956 (includingany statutory modification or re-enactment thereof, for thetime being in force) as may be applicable from time totime.”
8. To consider and if thought fit, to pass with or withoutmodification(s), the following resolution as a specialresolution:
"RESOLVED THAT in accordance with the provisions ofSection 309(4) and other applicable provisions of theCompanies Act, 1956 including any statutory modificationor re-enactment thereof, for the time being in force and inaccordance with other applicable guidelines and/orregulations if any, issued in this regard by statutory/regulatory authorities, consent of the Company be and is
hereby accorded for the payment of remuneration to theDirectors, who are not in the whole time employment of theCompany, by way of commission for every financial year orpart thereof as may be decided and computed by the Boardof Directors subject to the limits as prescribed under theCompanies Act, 1956, commencing from the financial year2008-09".
By order of the Board of DirectorsFor Satyam Computer Services Ltd.
G JayaramanPlace : Hyderabad Global Head - Corp. GovernanceDate : July 18, 2008 & Company Secretary
Notes:1. A member entitled to attend and vote at the meeting is
entitled to appoint a proxy to attend and, on a poll, to voteinstead of himself or herself. A proxy need not be a memberof the Company. Proxies in order to be effective must bereceived by the Company, not later than 48 hours before thecommencement of the meeting. Completion and return ofthe form of proxy will not prevent a member attending themeeting and voting in person if he or she so wishes. A formof proxy is given at the end of this Annual Report.
2. The register of members and share transfer books of theCompany will remain closed from August 21, 2008 to August26, 2008 (both days inclusive).
3. The dividend of 125% for the year ended March 31, 2008 asrecommended by the Board, if sanctioned at the annualgeneral meeting, will be payable to those members whosenames appear on the Company's register of members onAugust 21, 2008.
4. While members holding shares in physical form may writeto the Company for any change in their addresses and bankmandates, members holding shares in electronic form maywrite to their depository participants for immediate updationso as to enable the Company to dispatch dividend warrantsto the correct addresses.
5. Members/proxies are requested to bring duly filled inattendance slips to the meeting. The form of attendance slipis given at the end of this Annual Report.
6. The statutory registers maintained under Section 307 of theCompanies Act, 1956 and the certificate from the auditorsof the Company certifying that the Company’s stock optionplans are implemented in accordance with the SEBI(Employees Stock Option Scheme and Employees StockPurchase Scheme) Guidelines, 1999, and in accordancewith the resolutions passed by the members in the generalmeetings will be available at the venue of annual generalmeeting for inspection by members.
7. The profiles of directors who are recommended forreappointment and retiring by rotation & seekingreappointment, are provided at the end of this notice.
Sat_AR08_Final_Jul22_TP 2 Col.pmd 7/23/2008, 7:18 PM27
28
8. Route map for the venue of annual general meeting is givenat the end of the annual report for the convenience ofmembers.
Explanatory statement pursuant to Section 173 (2) of theCompanies Act, 1956 and Clause 23 (a) of the Articles ofAssociation of the Company.
Item no. 6
Mr. B Ramalinga Raju was reappointed as Chairman anddirector in whole time employment of the Company at theannual general meeting held on July 23, 2004 with effectfrom April 1, 2004 for a period of five years. Consideringthe phenomenal growth the Company has achieved overthe past two decades under the leadership of Mr. Raju, yourdirectors were pleased to consider and approve thereappointment of Mr. Raju as Chairman and director inwhole time employment of the Company for a further periodof five years with effect from April 1, 2009, as per the termsand conditions set out the in the resolution.
The reappointment is subject to the approval of membersand your directors recommend the resolution as set out initem no. 6 of the notice for approval of their approval.
No director other than Mr. B Rama Raju, Managing Directorand Mr. B Ramalinga Raju is, in any way, concerned orinterested in this resolution. This may also be treated as amemorandum issued pursuant to Section 302 of theCompanies Act, 1956.
Item no. 7
Mr. B Rama Raju was reappointed as Managing Director ofthe Company at the annual general meeting held on July 23,2004 with effect from April 1, 2004 for a period of fiveyears. Considering the spectacular performance intransformation of the Company over the past 2 decades,your directors were pleased to consider and approve thereappointment of Mr. B Rama Raju as Managing Directorof the Company for a further period of five years with effectfrom April 1, 2009, as per the terms and conditions set outthe in the resolution.
The reappointment is subject to the approval of membersand your directors recommend the resolution as set out initem no. 7 of the notice for their approval.
No director other than Mr. B Ramalinga Raju, Chairmanand Mr. B Rama Raju is, in any way, concerned or interestedin this resolution. This may also be treated as amemorandum issued pursuant to Section 302 of theCompanies Act, 1956.
Item no. 8
The Board of the Company currently has six non-executivedirectors and three executive directors. As required undersection 309(4) of the Companies Act, 1956, the shareholdersin the annual general meeting held on July 25, 2003approved the payment of remuneration to the directors,who are not in the whole time employment of the Company,by way of commission with effect from the financial year
2003-04 and authorized the Board to decide subject to thelimits as prescribed under the Companies Act, 1956.Accordingly, the Company has been paying a commissionof Rs. Twelve lakhs per financial year at quarterly intervalsto each of its non-executive directors.
As per section 309(7) of the Companies Act, 1956, theresolution referred above shall not remain in force for aperiod of more than five years. Hence, approval of themembers is now sought to renew for a further period of fiveyears. Members are requested to accord their consent forthe resolution set out in item no. 8 of the notice.
All the non-executive directors shall be deemed to beinterested in the above resolution.
By order of the Board of DirectorsFor Satyam Computer Services Ltd.
G Jayaraman
Place: Hyderabad Global Head - Corp. GovernanceDate: July 18, 2008 & Company Secretary
Profiles of directors who are recommended forreappointment and retiring by rotation & seekingreappointment:
Prof. M Rammohan Rao:
Prof. M Rammohan Rao, Dean, Indian School of Businesshas been on the Board of the Company since July 2005. Mr.Rao has a Ph.D. in Industrial Administration from theGraduate School of Industrial Administration, Carnegie-Mellon University, Pittsburgh, Pennsylvania, USA. Hecompleted two Masters Degrees – Master of Science inIndustrial Administration, Carnegie-Mellon University,Pittsburgh, Pennsylvania and Master of Engineering(Industrial), Cornell University, New York.
Prof. Rao is renowned worldwide for his research andteaching capabilities. As a Research Fellow, he wasassociated with the International Institute of Management,Science Center, Berlin, Germany, and the International Centerfor Management Sciences, Center for Operations Researchand Econometrics, University Catholique de Louvain,Belgium. He also conducted research at the OperationsResearch Group, United States Steel Corporation, AppliedResearch Laboratory, Monroeville, Pennsylvania.
Prof. Rao has published more than 85 articles in variousprofessional journals. He is a member of the Board of Editors,OPSEARCH – a journal of the Operational Research Societyof India. He was earlier the President of the OperationalResearch Society of India. Prof. Rao is the vice president ofthe Association of Indian Management schools. He is amember of the Board of Graduate Management AdmissionsCouncil. Prof. Rao has won several prestigious awardsconferred on him by leading institutions across the world.Prof. Rao is also on the Boards of MosChip Semiconductor
Sat_AR08_Final_Jul22_TP 2 Col.pmd 7/23/2008, 7:18 PM28
29
Technology Ltd, Krishna Fabrications Pvt. Ltd, APIDC VentureCapital Ltd, Bharat Electronics Ltd and Mazagon DocksLtd. He is also a member of the Citigroup India AdvisoryCouncil. He was earlier a member of the Advisory Board ofGeneral Motors India Science Laboratory. Prof. Rao doesnot hold any shares in the Company.
Mr. Vinod K Dham:
Mr. Vinod K Dham has been on the Board of the Companysince January, 2003. Mr. Dham is famous as the “Father ofthe Pentium” and held the positions of Vice President ofIntel’s Microprocessor Products Group and General Managerof the Pentium Processor Division. After 16 years at Intel, hejoined Nexgen as the Chief Operating Officer and became aGroup Vice president at AMD after they acquired Nexgen. InMay, 2000, US President William J. Clinton appointed Mr.Dham to the President’s Advisory Commission on AsianAmericans and Pacific Islanders. In 1999, he was namedas one of the top 100 Asian Americans of the decade. Mr.Dham obtained his Bachelors in Electrical Engineering(Electronics) from the University of Delhi in 1971 and fromwhich he received a Distinguished Alumni Award. Hereceived his Masters in Electrical Engineering (Solid State)from the University of Cincinnati in 1977, from which healso received a Distinguished Alumni Award. He has co-authored numerous technical papers and patents.
Mr. Dham is also on the Boards of NewPath Ventures LLC,NEA-IndoUS Ventures LLC, Sasken CommunicationTechnologies Ltd, Nevis Networks Inc., Telsima Corporation,Insilica Inc., Montalvo Systems and TelsimaCommunications Pvt. Ltd. Mr. Dham does not hold anyshares in the Company.
Mr. B Ramalinga Raju
Mr. B Ramalinga Raju (Raju) is Satyam’s Founder andChairman. He is a world-renowned visionary, globalbusiness leader, and thinker. He uses a simple, yet extensivemanagement model to create value, which promotesentrepreneurship, a focus on the customer, and the constantpursuit of excellence. Raju is passionate about developingleaders within the organizations and has conceptualized /institutionalized the Full Life Cycle Leadership (FLCL)model—a unique entrepreneurship framework that developsleaders at all levels of Satyam.
Raju has an MBA from Ohio University, and is an alumnusof the Harvard Business School. He has won numerousawards not only for building a best-in-class business butalso taking innovative steps to positively impact the society.Some of the awards won by Raju include: the Ernst & YoungEntrepreneur of the Year (2007), CNBC’s Asian BusinessLeader—Corporate Citizen of the Year (2002), Dataquest ITMan of the Year (2000), and the Ernst & Young Entrepreneurof the Year for Services (1999).
Raju’s keen understanding of IT and institution buildinghas enabled him to contribute to policy formulation in Indiaand abroad. He was the ex-chairman of the National
Association of Software and Service Companies(NASSCOM), a 1,100-member industry body of Indian ITservices companies. He is:
A member of the National Executive Councils of thetwo national business associations of India: CII andFICCI.
A member of the International Advisory Panel ofMalaysia’s Multimedia Super-Corridor.
A member of Executive Board of the Indian School ofBusiness.
Raju’s social vision of greater social equity andopportunities to the under-privileged, led to theestablishment of Satyam foundation, Byrraju foundationand Emergency Management & Research Institute(EMRI).
A voracious reader, Raju is deeply influenced by science.He has adopted several scientific principles in runningbusiness operations. Mr. Raju chairs the Board of SatyamBPO Ltd. and is the director of SRSR Holdings Pvt. Ltd.
B Rama Raju:
Mr. B Rama Raju is the Co-Founder and Managing Directorof the Company. He has been on the company’s board sinceits inception in 1987. He was appointed as the ManagingDirector in 1991. Rama Raju has always been a key resourcefor the Board of Directors for successfully driving thestrategies and initiatives, which positioned the Companyas a global player. His focus oriented approach, passionfor operational excellence, and thrust on continuouslearning, created a process-driven organization and keptpace with the challenges posed by the spectacular growthof the Company.
Rama Raju shares a social vision and emphasizes on theimportance of rural transformation through self-help groupsand use of technology. He takes an active part in the activitiesof the family Trust, “Byrraju Foundation” which was set upto aid greater social equity and providing opportunities forthe under-privileged and the Emergency ManagementResearch Institute (EMRI) set up to provide EmergencyResponse Services across India (108) in line with similarservices (911) and standards as in the USA, has achievedseveral milestones.
Rama Raju has a master's in economics from Madras LoyolaCollege and an MBA, with a specialization in internationaltrade, from Texas A&M International University (formerlyLaredo State University).
He also attended the owner/president course at HarvardBusiness School.
He is the Chairman of Satyam-Venture Engineering ServicesPvt. Ltd. and is the director of Satyam BPO Ltd and SRSRHoldings Pvt. Ltd. Rama Raju is also the Chairman of therecently acquired Bridge Strategy Group, a high-endconsultancy company based in Chicago.
Sat_AR08_Final_Jul22_TP 2 Col.pmd 7/23/2008, 7:18 PM29
30
Directors’ reportDear Members,
Your directors are pleased to present their report for the financialyear 2007-08.
Financial highlights
Rs. in crores
Particulars 2007-08 2006-07 Growth%
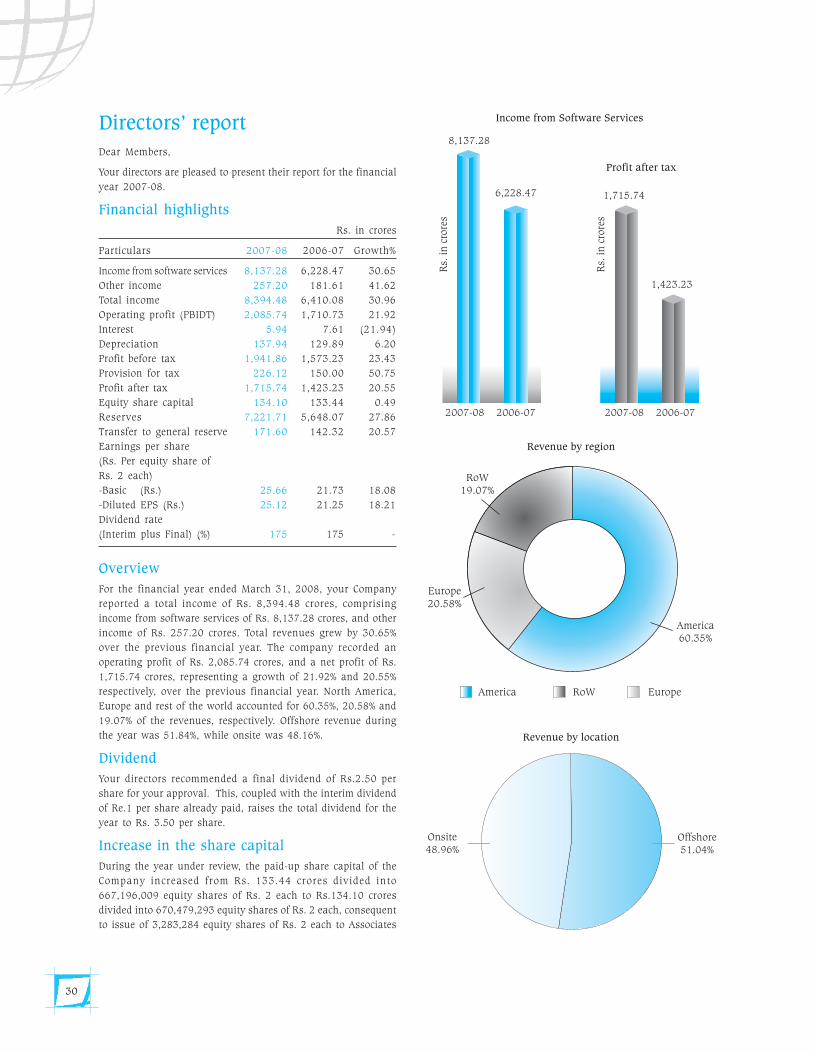
Income from software services 8,137.28 6,228.47 30.65Other income 257.20 181.61 41.62Total income 8,394.48 6,410.08 30.96Operating profit (PBIDT) 2,085.74 1,710.73 21.92Interest 5.94 7.61 (21.94)Depreciation 137.94 129.89 6.20Profit before tax 1,941.86 1,573.23 23.43Provision for tax 226.12 150.00 50.75Profit after tax 1,715.74 1,423.23 20.55Equity share capital 134.10 133.44 0.49Reserves 7,221.71 5,648.07 27.86Transfer to general reserve 171.60 142.32 20.57Earnings per share(Rs. Per equity share ofRs. 2 each)-Basic (Rs.) 25.66 21.73 18.08-Diluted EPS (Rs.) 25.12 21.25 18.21Dividend rate(Interim plus Final) (%) 175 175 -
Overview
For the financial year ended March 31, 2008, your Companyreported a total income of Rs. 8,394.48 crores, comprisingincome from software services of Rs. 8,137.28 crores, and otherincome of Rs. 257.20 crores. Total revenues grew by 30.65%over the previous financial year. The company recorded anoperating profit of Rs. 2,085.74 crores, and a net profit of Rs.1,715.74 crores, representing a growth of 21.92% and 20.55%respectively, over the previous financial year. North America,Europe and rest of the world accounted for 60.35%, 20.58% and19.07% of the revenues, respectively. Offshore revenue duringthe year was 51.84%, while onsite was 48.16%.
Dividend
Your directors recommended a final dividend of Rs.2.50 pershare for your approval. This, coupled with the interim dividendof Re.1 per share already paid, raises the total dividend for theyear to Rs. 3.50 per share.
Increase in the share capital
During the year under review, the paid-up share capital of theCompany increased from Rs. 133.44 crores divided into667,196,009 equity shares of Rs. 2 each to Rs.134.10 croresdivided into 670,479,293 equity shares of Rs. 2 each, consequentto issue of 3,283,284 equity shares of Rs. 2 each to Associates
Sat_AR08_Final_Jul22_TP 2 Col.pmd 7/23/2008, 7:18 PM30
31
upon exercise of options under the stock option plans of theCompany
Listing on Euronext
In a path-setting initiative, your Company listed its existingADSs with Euronext Stock Exchange (NYSE’s European tradingplatform). With this move, Satyam became the first Indiancompany to list on three major trading platforms around theworld, making it a truly globally-tradeable entity. The listingwas also the first of its kind globally, under the fast-trackmechanism. Europe is a dynamic and growing market for yourCompany and our listing will demonstrate our continued andgrowing commitment to the region.
Human resources
The total number of Associates on March 31, 2008 was 45,969,against 35,670 on March 31, 2007. The attrition rate for theyear 2007-08 was 13.09%.
Your Company believes that today a major HR challenge for anyorganization is capability building and enhancement andassociate engagement. Your Company continued to work towardthese three components through various initiatives, such as:
Building capability through collaboration with institutionsat the national and international levels, and via campuslink programs
Capability enhancement by realigning leadershipcompetency frameworks to new business realities and thecompany’s future roadmap
Delighting associates through empowerment, uniqueorganization design and enablement of social participationfor better productivity and less attrition
Satyam Learning World: The emergence of knowledgeeconomies has made learning and leadership critical. SatyamLearning World is the enterprise-wide learning ecosystem thatcaptures and delivers the learning and development needs ofthe entire corporation through a single platform. SatyamLearning Center and Satyam School of Leadership, the two pillarsof this ecosystem, are the learning and development partners ofbusinesses across Satyam, each having a well-defined mandate.
More than 70% of all learning at Satyam is delivered virtually.We have a carefully designed learning and development strategyto meet the entire life cycle of learning and development of ourAssociates, from entry-level personnel to senior leaders. TheSSL’s vision is to make Satyam one of the top five organizationsin the world in building global Associates, through effectivelearning and development.
Further, our globally distributed workforce warrants theapplication of pervasive and potent communication technologiesto ensure accessibility of learning and development initiativesto all associates. Through the newly launched Web Radio/TVstation called Planet Satyam, more than 50,000 associates acrossthe globe have access to an entire range of learning anddevelopment programs via a mouse click. A first-of-its-kindinitiative in the industry, Planet Satyam takes the organization’s
learning programs to another level of accessibility, convenienceand inclusiveness. Complimenting the traditional model ofclassroom-based learning and development programs, itsignificantly virtualizes the learning ecosystem.
Infrastructure
During the year under review, your Company continued to createbest-in-class infrastructure facilities to support its growthstrategies and has added 10,000 spaces, an increase ofapproximately 25% over the previous year. Of these, more than40% have been created in own campuses at different locations.The Company has established base for the first time in a Tier 2city, i.e., Vishakhapatham in Andhra Pradesh. We have alsoestablished new development centers in Egypt, Malaysia andNanjing in China and new marketing offices in Singapore andSydney.
During the current year, we will develop infrastructure in theSEZ campuses at two locations in Hyderabad and one locationeach in Chennai and Nagpur, in addition to taking on leasedSEZ spaces in Hyderabad, Bangalore, Chennai and Pune.
Network and Systems: Your Company continuously focuses onupgrading SatyamNet, its sophisticated high-speed data, voiceand other communicating network, to keep pace withcontemporary global trends world. Your directors are happy tostate that during the year under review, the Company hassuccessfully undertaken technological upgrades in the wide areanetworking, security, business continuity and collaboration tools.
Quality
Quality is an integral part of everything that we do at Satyam. Itimplies the right Processes, Service Offerings and Projects are
operating at the highest levels of maturity and are benchmarked
with best niche players.
Your company has set benchmarks by developing and deploying
simple, efficient and effective processes related to Health Safety
& Environment (HSE) in accordance with ISO 14001 and OHSAS18001 standards. Your company has received Payment Card
Industry (PCI DSS1.1) certification for its banking sub-vertical
operations. And, as part of ongoing efforts to reinforce the qualityculture and customer orientation, your company has successfully
implemented Quality Management Systems (QMS) certification
for all associates.
Your company has a comprehensive Business Continuity and
Disaster Recovery framework in place to prevent and containpotential business disruptions in the event of disaster. It can
quickly resume services to customers’ acceptable service levels.
Your company has also established leadership throughparticipation and sharing of best practices in industry forums
on Business Continuity Management.
Six Sigma has been the main driver of continuous improvementsand customer delight this year, with 2,200 Six Sigma projectsimplemented for new process definitions and solutions tobusiness problems. A total of 2,200 associates are certified asGreen Belts, Black Belts and Master Black Belts.
Sat_AR08_Final_Jul22_TP 2 Col.pmd 7/23/2008, 7:18 PM31
32
Moving forward, your company will continue to endeavor toimplement and institutionalize best-in-class systems andprocesses to achieve delivery excellence and stakeholder delight.
Awards and recognitions
Some of the recognitions your Company earned during 2007-08are listed below.
Satyam has been ranked No. 1 in the American Society forTraining and Development (ASTD)’s annual BEST awardsprogram for 2007. This made Satyam the first non-USorganization and the first in Asia to earn the top ranking. Satyamwas tops among 103 organizations from in eight countries. TheBEST awards recognize organizations that demonstrateenterprise-wide success through employee learning anddevelopment.
Satyam has earned a Most Admired Knowledge Enterprise(MAKE) award—as a top Asian Knowledge Organization—forthe second year in a row. The MAKE awards are given to leadingAsian organizations that leverage enterprise knowledge to createvalue through innovation, product or service excellence, andoperational effectiveness.
Satyam also won the “Partner of the Year 2007 award forAcquired Applications” from Oracle. The award recognizesSatyam’s capabilities in building new competencies quickly andits ability to add value to Oracle, its customers, and products.
Satyam won the VIP (Vision, Impact, and Progress) Award in theIMPACT category from Computer Associate’s Business ServiceOptimization (BSO). The Impact Award recognizes demonstrableand measurable results from improved IT, especially in terms ofproductivity, financial benefits, quality improvements and/orcustomer satisfaction.
Satyam became the first Indian Service Integrator to win theprestigious “Competitive Strategy Leadership Award for OffshoreTesting Market” from Frost & Sullivan, a leading Internationalresearch and consulting company. The organization honoredSatyam in the Thought Leadership Quadrant in the testing space.
A Brown-Wilson survey ranked Satyam No. 1 among Indian ITservices providers and No. 3 globally (based on cumulativerankings for years 2004 through 2007). Satyam was selectedfrom among 1,455 outsourcing vendors in 77 countries in asurvey published in The Black Book of Outsourcing. Satyamalso ranked No. 1 globally on the following sub categories: ITO:Application Services; ITO: Process Consulting; ITO: BusinessIntelligence & Data Warehousing; ITO: Full Service ERP: SAP/Oracle/PeopleSoft/JD Edwards; ESO: Integrated Solutions; ESO:Full-Service PLM /End-to-End.
Satyam was “Citizenship Partner of the Year” at the MicrosoftWorldwide Partner Conference Awards. The Citizenship Partnerof the Year recognizes exceptional partners that have made asustained commitment to society and their communities andcan demonstrate the impact of their work.
Chairman B. Ramalinga Raju won the Ernst & YoungEntrepreneur of the Year Award. Raju was selected for this honorfor his business acumen and efforts to enhance the community.
Corporate Governance
Your Company retained its eminent position in the 2008 InvestorRelations Global Rankings for the Asia, Pacific and AfricaRegion and won the following recognitions:
• IR Website: Top 5 in region
• Corporate Governance Practices: Top 2 in region
• Financial Disclosure Procedures: Top 5 in region; Firstin Technology; and First in India
A report on Corporate Governance, along with Auditors’certificate in compliance with clause 49 of the listing agreement,is provided elsewhere in the Annual Report.
Subsidiaries
Ministry of Company Affairs vide their letter dated February 29,2008 granted approval under section 212 (8) of the CompaniesAct, 1956 exempting the Company from attaching the documentsof subsidiaries as specified under section 212 (1) of theCompanies Act, 1956. Accordingly, the documents as referredabove are not attached to the Balance sheet. However, thesummarised financial information of the subsidiaries is publishedelsewhere in this Annual Report—2007-08, for information ofmembers of the Company.
The name of Nipuna Services Ltd., subsidiary of the Company,has been changed to Satyam BPO Ltd. effective December 28,2007. During the year under review, your Company acquiredequity shares of Satyam BPO held by the strategic investors andconsequently, it has become wholly owned subsidiary effectiveDecember 31, 2007.
During the year under review, your Company has set upsubsidiaries viz., Satyam Computer Services Egypt in Cairo,Egypt and SATYAM SERVIÇOS DE INFORMÁTICA LTDA in Brazil,to tap further potential business opportunities. Further, yourCompany incorporated its second subsidiary in Nanjing, Chinaviz. Satyam Computer Services (Nanjing) Company Ltd.
In line with the organization’s strategy to add higher valueservice offerings, bridge competency gaps, enhance leadershipcapabilities, add sound and significant customer relationshipsand to strengthen the brand, your Company has been makingacquisitions in various industry verticals and technology spaces.During the year under review, your Company acquired NitorGlobal Solutions Limited (Nitor), UK, a niche consulting firmproviding Infrastructure Management Services (IMS) and BridgeStrategy Group (BSG), an US-based management consultingfirm. Consequently, Nitor and BSG became subsidiaries effectiveJanuary 4, 2008 and April 4, 2008, respectively.
On April 21, 2008, your Board of directors approved theacquisition of:
i) S&V Management Consultants (“S&V”) a Belgium-based SCM strategy consulting firm in Supply ChainManagement area for a total consideration ofRs. 141.50 crores (equivalent US$ 35.5 million). Theacquisition will take place through a Company’ssubsidiary.
Sat_AR08_Final_Jul22_TP 2 Col.pmd 7/23/2008, 7:18 PM32
33
ii) Market research and Customer Analytics (MR&CA)operations from Caterpillar Inc., USA (CAT) includingthe related Intellectual Property. The proposedacquisition is for a consideration of Rs. 239.16 crores(equivalent US$60 million) comprising of initial anddeferred considerations.
iii) the remaining 50% equity held by CA Inc in its jointventure CA Satyam ASP Pvt. Ltd. (“CA Satyam”) for atotal consideration of Rs. 5.98 crores (equivalent US$1.5 million) payable in two tranches.
Info-On-Demand Sdn, the Malaysian based subsidiary ofKnowledge Dynamics Pte Ltd. (the Company’s subsidiary), hasbeen formally dissolved during the last fiscal.
Joint ventures
Satyam Venture Engineering Services Pvt. Ltd., a joint venture
between Satyam and Venture Global Engineering (VGE), US,
earned revenue of Rs. 69.73 crores and a net profit of Rs. 0.45crores for the year ended March 31, 2008. Based on VGE’s
breaches of the joint venture agreement and events of default,
your Company filed a Demand for Arbitration with the LondonCourt of International Arbitration, seeking, among other things,
to purchase VGE’s 50% interest in SVES at the agreed upon book
value price of the shares. The sole arbitrator issued an Awardgranting all the relief your Company sought. Your company was
then successful in enforcing the Award in the US courts. During
the pendency of the enforcement proceedings in the US, the suitfiled by VGE challenging the Award before the district court,
Secunderabad and the appeal to the High court of Andhra
Pradesh respectively, were rejected. Subsequently, in a specialleave petition filed by VGE, Supreme Court granted an interim
stay of the share transfer portion of the Award, set aside the
orders of the district court and the High court and remanded thematter back to district court to try on merits.
Social programs
Creating value for society is an integral part of our business.
Your Company believes that contributing to the well-being anddevelopment of society is an extension of everything we do.
Reaffirming our role as a contributing member of social and
economic environment, your Company aligns our businessoperations with social values. As a responsible corporate citizen,
the Company leverages the power of IT to bridge the “digital
divide” that limits opportunities for success and prosperity. Asa result, we transform the lives of the underprivileged. In
addition, Satyam reaches out to the society through its CorporateSocial Responsibility partners, like Byrraju Foundation, for ruraltransformation and EMRI, for emergency management services.
Another unique public-private partnership model that waslaunched during the year under review was Health ManagementResearch Institute (HMRI), in association with the Governmentof Andhra Pradesh and Satyam Foundation, the CSR arm ofSatyam, to provide health services on call. HMRI’s vision is totransform health delivery services via an easily accessible virtualplatform.
During the year under review your Company contributedRs. 4.19 crores to Satyam Foundation. A report on the “CorporateSocial Responsibility” is given elsewhere in the Annual Report.
Fixed deposits
Your Company did not accept any deposits during the year underreview.
Directors
Prof. M Rammohan Rao and Mr. Vinod K Dham non-executiveand independent directors, retire by rotation at the ensuingAnnual General Meeting and are eligible for re-appointment.
Auditors
The statutory auditors M/s Price Waterhouse, CharteredAccountants, Hyderabad, retire at this Annual General Meeting.Your directors recommend their reappointment as auditors.
Conservation of Energy, Technology Absorptionand Foreign Exchange earnings and outgo
The particulars as prescribed under sub-section (1)(e) of Section217 of the Companies Act, 1956 read with Companies (Disclosureof particulars in the report of Board of Directors) Rules, 1988forms part of this report (Annexure – A).
Employee particulars
Particulars of employees as required under Section 217(2A) ofthe Companies Act, 1956 and the Companies (Particulars ofEmployees) Rules 1975 as amended forms part of this report.However, in pursuance of Section 219(1)(b)(iv) of the CompaniesAct, 1956 this report is being sent to all the shareholders of theCompany excluding the aforesaid information and the saidparticulars are made available at the registered office of theCompany. The members interested in obtaining informationunder section 217 (2A) may write to the Company Secretary atthe registered office of the Company.
Directors’ Responsibility Statement
As required by the provisions of Section 217 (2AA) of theCompanies Act, 1956, the Directors’ Responsibility Statement isattached as Annexure – B.
Associate Stock Option Plans (ASOP)
As required by clause 12 of SEBI (Employee Stock Option Schemeand Employee Stock Purchase Scheme) Guidelines, 1999, theparticulars of the Stock option plans of the Company are furnishedas Annexure – C.
Acknowledgements
Your directors gratefully acknowledge the continued support beingreceived from all investors, customers, vendors, banks, and otherservice providers as well as regulatory and government authoritiesin the initiatives of the Company. Your directors specially thankAssociates of the Company for their focussed contributions inrealizing the growth strategies of the Company.
For and on behalf of the Board of directors
Place : Hyderabad B Ramalinga Raju
Date : April 21, 2008 Chairman
Sat_AR08_Final_Jul22_TP 2 Col.pmd 7/23/2008, 7:18 PM33
34
Annexure ’A’ to the Directors’ report
Particulars pursuant to Companies (Disclosure of Particulars inthe Report of Board of Directors) Rules, 1988.
A) Details of Conservation of Energy:
Satyam uses electrical energy for its equipment such as air-conditioners, computer terminals, lighting and utilities atwork places. As an ongoing process, we continue toundertake the following measures to conserve energy:
• Incorporating new technologies in the air-conditioningsystem in upcoming facilities to optimise powerconsumption.
• Identification and replacement of low-efficientmachinery (AC) in a phased manner.
• Identification and replacement of outdated and low-efficient UPS systems in a phased manner.
• Conducting continuous energy-conservationawareness and training sessions for operationalpersonnel.
B) Technology Absorption
(a) Research and Development (R&D):
1. Specific areas of R&D and benefits expected: TheCompany believes that domain-based innovation andprocess-related innovation lay a solid foundation tomeet and exceed customer and investor expectations.Domain-based innovations help customers enhancetheir products/services, and achieve significant time/cost reductions. Innovation-led artifacts add to the IPassets of the company and provide an opportunity forus to create market-led solutions fairly regularly.Ourgroup focuses on creating IPs (includes patentableinnovations) and solutions. Further, our group focuseson collaborative innovation by co-working with ourcustomer R&D labs and academia. Our research anddevelopment activities will help us gear for futureopportunities. We invest and encourage continuousinnovation. Our R&D is always focused to provideunique benefits to our customers and otherstakeholders by working both proactively (self-drivenresearch) and reactively (customer-driven research).Our vision is to be recognized as an R&D partner inselected areas of communication and computationleading to the design and development of algorithms.Our objectives are to (a) carry out applied research inthe areas that are closely related to the businessobjectives of our company; (b) create tangible IPartefacts; (c) present and publish papers ininternational conferences; (d) publish papers inrefereed journals; (e) file patent applications, mostlyin USPTO; and (f) help build market-led showcaseand market-ready solutions based on research results.We participate in international conferences (a) asprogram committee members; (b) as reviewers; and(c) to present our papers. We have a team of dedicatedresearchers comprising of Ph.Ds and Post-Graduates
(in Computer Science and Networking from IITs/IISc/US universities) focusing on applied research leadingto collaborations with our customer R&D labs andacademia.
During the year 2007-08,
• We successfully collaborated with a majorJapanese IT and Network Technology integratedsolutions company to deliver solutions on threeresearch problems in real-time event delivery,next-generation networks (in this case, we areleading the project through novel productproposals), and reconfigurable architectures;
• We successfully collaborated with academia andundertook 10 different research collaborationswith IISc, Bangalore, and IITB, Mumbai, andinteracted with professors from USC and UCSD;
• We published about 15 peer-reviewed papers ininternational conferences and journals mainly inthe areas of (a) Networking and QoS; (b) Contentdistribution networks; (c) Media andEntertainment; and (d) Information processingalgorithms (in the areas such as grid computingand image processing). Additionally, four papershave been submitted/are under revision forsubmission to various international conferenceand journals; Further, we are in the final stages ofrevising six technical reports related to variousof our solutions under development and researchacademic collaborations;
• We participated/presented in two internationalconferences, and were a sponsor of twointernational conferences;
• We filed two patent specifications (one in thearea of M&E and another in the area ofnetworking) and filed response to office actionreports related to seven filed patent applicationsfiled in USPTO with allowability indications inone patent application; and
• We worked on 10 algorithms to create our ownreusable IP and created initial versions of fourend-to-end solutions based on these algorithmsin the areas of deep-packet analysis, ad targeting,text and video analyses, and proxy systems.In total, we have published about 192 technicalpapers in international conferences andjournals, and have filed about 19 patentapplications. The full version of our publicationsis available on CD and is made available to theR&D groups of our customers for their perusal.To expand our reach of technology and expertise,we collaborate with academic institutions andresearch laboratories, both within India (IndianInstitute of Science, Bangalore and IndianInstitute of Technology, Bombay, and abroad{mostly in USA}).
Sat_AR08_Final_Jul22_TP 2 Col.pmd 7/23/2008, 7:18 PM34
35
2. Future plan of action: During 2008-09, we will continueour applied research focus in Telecom, TechInfrastructure, and Media & Entertainment to createreusable IP artifacts and build reusable solutionsaround the created IPs. We plan to publish technicalpapers and file patent applications as a basis for thesolutions under consideration and development anddevelop prototypes for demonstration purposes. Also,we plan to use some published algorithms and ideasdescribed in patent applications as part of customer-related solutions. Furthermore, we plan to undertakecustomer-driven research activities leading to the state-of-the-art solutions for our customers. In fact, we expectthe acceptance of our IPs by our customers leading tothe customization and integration of the IPs with ourcustomer products. In short, our plan is to bring IP-based, market-ready solutions for reducing time tomarket for our customers.
3. Expenditure on R&D:
a. Capital : Nilb. Recurring : Rs. 1.51 croresc. Total: : Rs. 1.51 croresd. Total R&D expenditure as a percentage of total turnover : 0.02%
(b). Technology absorption, adaptation and innovation
1. Technology absorption, adaptation & innovation, and
benefits derived: The algorithms and systemsdeveloped as part of the applied research activitiesare used to build showcase solutions. The technologyand domain knowledge obtained during R&D work,and algorithms, frameworks, and solutions developedas part of R&D work are quite useful in effectivelyexecuting customer projects. Further, the algorithmsare also to be used as part of demo software andsolutions such as (a) ad targeting; (b) context-awaremobile solutions; (c) proxy systems, and (d) rich mediaspam and leak for IPS/IDS systems.
2. Information about imported technology: Nil
(c). Foreign exchange earnings and outgo
1. Initiatives like increasing : 96.95% of revenues ofexports, development of the Company are fromnew export markets etc. exportsto increase foreign exchange.
2. Foreign exchange earned : Rs.6,535.43 crores
3. Foreign exchange outgo : Rs.4,728.86 crores
ANNEXURE-B to the Directors’ report
DIRECTORS’ RESPONSIBILITY STATEMENT
To the Members,
We the directors of Satyam Computer Services Limited, confirmthe following:
i. The applicable accounting standards had been followedalong with proper explanation relating to material departuresin the preparation of the annual accounts;
ii. The directors had selected such accounting polices andapplied them consistently and made judgements andestimates that are reasonable and prudent so as to give atrue and fair view of the state of affairs of the Company atthe end of the financial year and of the profit of the Companyfor that period;
iii. The directors had taken proper and sufficient care for themaintenance of adequate accounting records in accordancewith the provisions of the Companies Act, 1956 forsafeguarding the assets of the Company and for preventingand detecting fraud and other irregularities;
iv. The directors had prepared the annual accounts on a goingconcern basis.
For and on behalf of the Board of directors
Place : Hyderabad B Ramalinga Raju
Date : April 21, 2008 Chairman
Sat_AR08_Final_Jul22_TP 2 Col.pmd 7/23/2008, 7:18 PM35
36
ANNEXURE-C to the Directors’ report
Associate Stock Option Plan (ASOP)
The details of Associate Stock Option Plans (ASOP) are given below.
Particulars ASOP – B ASOP – ADS ASOP – RSUs ASOP – RSUs (ADS)
a) No. of options granted 55,516,499 1,457,713 3,452,140 140,060b) The pricing formula: Refer foot note 1 Refer foot note 1 Refer foot note 2 Refer foot note 2c) The maximum vesting period 5 years 5 years 5 years 5 yearsd) Options vested 10,429,602 1,090,446 662,107 46,146e) Options exercised 2,866,407 140,494 120,449 7,720f) The total number of shares
arising as a result of exerciseof options. 2,866,407 280,988 120,449 15,440
g) Options lapsed. 44,379 740 - -h) Variation of terms of options. Not applicable Not applicable Not applicable Not applicablei) Total number of options in force 15,641,127 1,283,118 3,150,202 249,715
j) Money realised by exercise of options under all the plans on receipt basis Rs.598.98 crores
k) (i) Details of options granted to key management personnel
Name of the Associate Plan No. of RSUs
Mr. Joseph Lagioia ASOP – RSUs (ADS) 15,000
Total 15,000
(ii) Any other employee who receives a grant in any one year of options amounting to 5%or more of options granted during that year. No
(iii) Identified employees who were granted options, during any one year, equal to orexceeding 1% of the issued capital (excluding outstanding warrants and conversions)of the Company at the time of grant. Nil
l) Diluted Earnings Per Share (EPS) (on par value of Rs. 2 per share) calculated in accordancewith Accounting Standard 20. 25.12
m) In accordance with SEBI (Employee Stock Option Scheme and Employee Stock Purchase Scheme) Guidelines, 1999, hadcompensation cost for associate stock option plans been recognized based on the fair value at the date of grant in accordancewith Black Scholes’ model, the pro-forma amounts of the Company’s net profit and earnings per share would have been asfollows:
Particulars Year ended March 31,
2008 2007
1. Profit after Taxation
- As reported (Rs. in crores) 1,715.74 1,423.23- Proforma (Rs. in crores) 1,701.29 1,373.05
2. Earnings per share:
Basic
- No. of shares 668,673,978 654,853,959- EPS as reported (Rs.) 25.66 21.73- Proforma EPS (Rs.) 25.44 20.97
Diluted
- No. of shares 683,138,400 669,705,425- EPS as reported (Rs.) 25.12 21.25- Proforma EPS (Rs.) 24.90 20.50
Sat_AR08_Final_Jul22_TP 2 Col.pmd 7/23/2008, 7:18 PM36
37
n) Weighted-average exercise price of stocks and weighted-average fair values of options, which are equal to market price on thedate of grant –
Options Weighted-average exercise price Weighted-average fair valueRs. Rs.
ASOP - RSUs 2.00 322.56ASOP - RSUs (ADS) 4.00 357.58 ( $ 8.93 @ 40.02)
o) A description of the method and significant assumptions used during the year to estimate the fair values of options.
1. Risk-free interest rate - 8.00%
2. Expected life - 2.51 Years
3. Expected volatility - 56.64 %
4. Expected dividends - 0.78 %
5. The price of the underlying share in market at the time of option grant:
Grant Date ASOP-RSUs (Rs.) ASOP-RSUs (ADS) (Rs.)
17.04.07 455.90 511.94
20.07.07 477.85 576.78
11.10.07 447.95 527.24
The fair value of options has been calculated by using Black Scholes’ method.
Note no: 1) The closing price of the shares on the date of the meeting of the Compensation Committee convened to grant the stockoptions, on the stock exchange where highest volumes are traded;
or
the average of the two weeks high and low price of the share preceding the date of grant of option on the stock exchange on whichthe shares of the company are listed; whichever is higher.
Note no: 2) Not less than the face value of the equity shares or such other price as may be calculated in accordance with theapplicable statutory rules, regulations, guidelines and laws, on the date of grant.
Sat_AR08_Final_Jul22_TP 2 Col.pmd 7/23/2008, 7:18 PM37
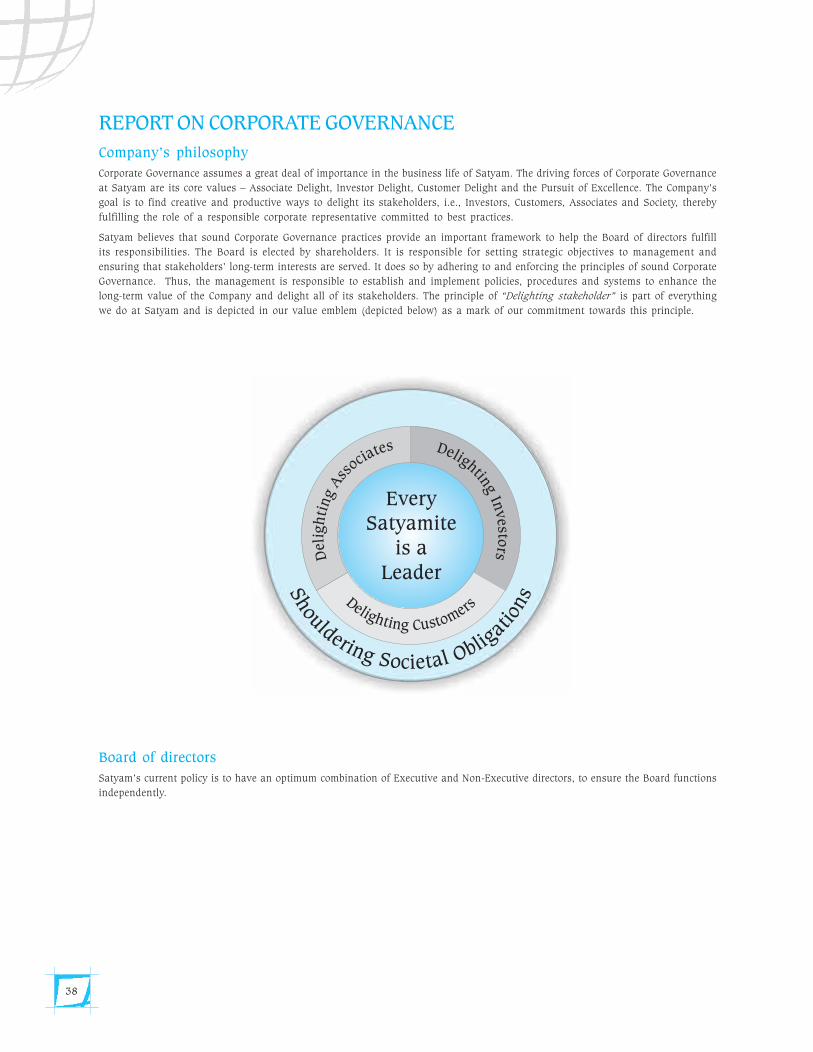
38
REPORT ON CORPORATE GOVERNANCE
Company’s philosophy
Corporate Governance assumes a great deal of importance in the business life of Satyam. The driving forces of Corporate Governanceat Satyam are its core values – Associate Delight, Investor Delight, Customer Delight and the Pursuit of Excellence. The Company’sgoal is to find creative and productive ways to delight its stakeholders, i.e., Investors, Customers, Associates and Society, therebyfulfilling the role of a responsible corporate representative committed to best practices.
Satyam believes that sound Corporate Governance practices provide an important framework to help the Board of directors fulfillits responsibilities. The Board is elected by shareholders. It is responsible for setting strategic objectives to management andensuring that stakeholders’ long-term interests are served. It does so by adhering to and enforcing the principles of sound CorporateGovernance. Thus, the management is responsible to establish and implement policies, procedures and systems to enhance thelong-term value of the Company and delight all of its stakeholders. The principle of “Delighting stakeholder” is part of everythingwe do at Satyam and is depicted in our value emblem (depicted below) as a mark of our commitment towards this principle.
Board of directors
Satyam’s current policy is to have an optimum combination of Executive and Non-Executive directors, to ensure the Board functionsindependently.
Sat_AR08_Final_Jul22_TP 2 Col.pmd 7/23/2008, 7:18 PM38
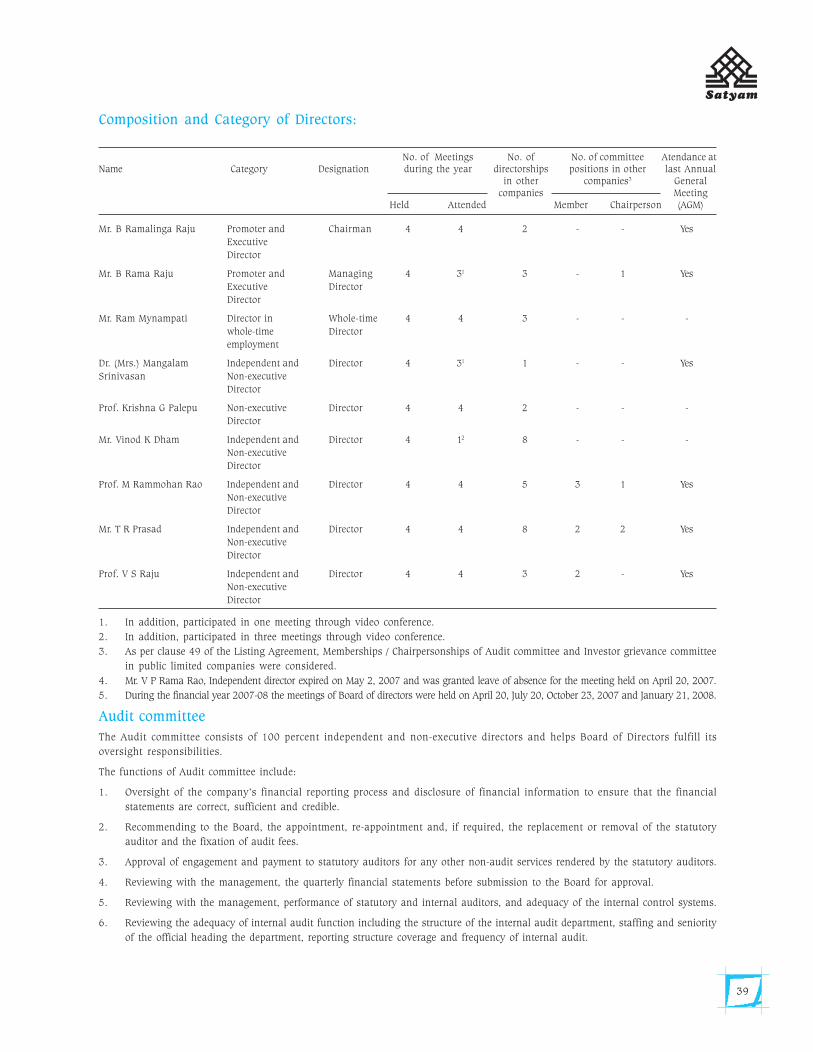
39
1. In addition, participated in one meeting through video conference.2. In addition, participated in three meetings through video conference.3. As per clause 49 of the Listing Agreement, Memberships / Chairpersonships of Audit committee and Investor grievance committee
in public limited companies were considered.4. Mr. V P Rama Rao, Independent director expired on May 2, 2007 and was granted leave of absence for the meeting held on April 20, 2007.5. During the financial year 2007-08 the meetings of Board of directors were held on April 20, July 20, October 23, 2007 and January 21, 2008.
Audit committee
The Audit committee consists of 100 percent independent and non-executive directors and helps Board of Directors fulfill itsoversight responsibilities.
The functions of Audit committee include:
1. Oversight of the company’s financial reporting process and disclosure of financial information to ensure that the financialstatements are correct, sufficient and credible.
2. Recommending to the Board, the appointment, re-appointment and, if required, the replacement or removal of the statutoryauditor and the fixation of audit fees.
3. Approval of engagement and payment to statutory auditors for any other non-audit services rendered by the statutory auditors.
4. Reviewing with the management, the quarterly financial statements before submission to the Board for approval.
5. Reviewing with the management, performance of statutory and internal auditors, and adequacy of the internal control systems.
6. Reviewing the adequacy of internal audit function including the structure of the internal audit department, staffing and seniorityof the official heading the department, reporting structure coverage and frequency of internal audit.
Composition and Category of Directors:
No. of Meetings No. of No. of committee Atendance atName Category Designation during the year directorships positions in other last Annual
in other companies3 Generalcompanies Meeting
Held Attended Member Chairperson (AGM)
Mr. B Ramalinga Raju Promoter and Chairman 4 4 2 - - Yes
Executive
Director
Mr. B Rama Raju Promoter and Managing 4 31 3 - 1 Yes
Executive Director
Director
Mr. Ram Mynampati Director in Whole-time 4 4 3 - - -
whole-time Director
employment
Dr. (Mrs.) Mangalam Independent and Director 4 31 1 - - Yes
Srinivasan Non-executive
Director
Prof. Krishna G Palepu Non-executive Director 4 4 2 - - -
Director
Mr. Vinod K Dham Independent and Director 4 12 8 - - -
Non-executive
Director
Prof. M Rammohan Rao Independent and Director 4 4 5 3 1 Yes
Non-executive
Director
Mr. T R Prasad Independent and Director 4 4 8 2 2 Yes
Non-executive
Director
Prof. V S Raju Independent and Director 4 4 3 2 - Yes
Non-executive
Director
Sat_AR08_Final_Jul22_TP 2 Col.pmd 7/23/2008, 7:18 PM39
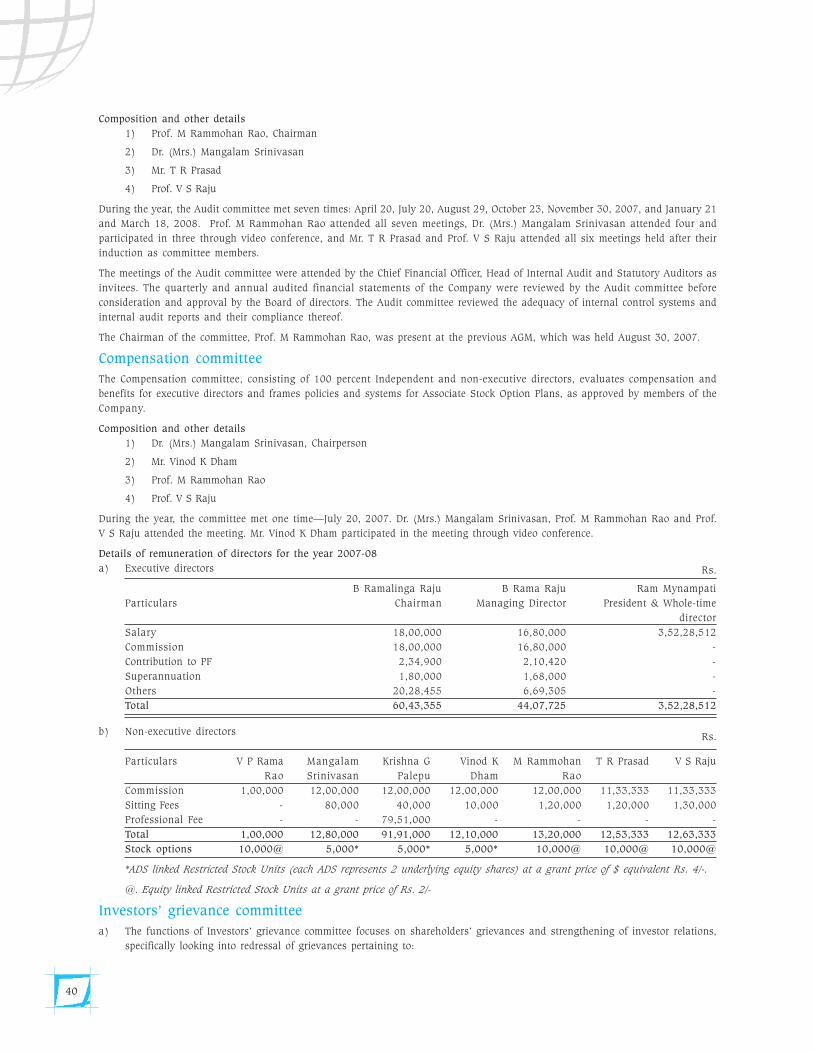
40
Composition and other details
1) Prof. M Rammohan Rao, Chairman
2) Dr. (Mrs.) Mangalam Srinivasan
3) Mr. T R Prasad
4) Prof. V S Raju
During the year, the Audit committee met seven times: April 20, July 20, August 29, October 23, November 30, 2007, and January 21and March 18, 2008. Prof. M Rammohan Rao attended all seven meetings, Dr. (Mrs.) Mangalam Srinivasan attended four andparticipated in three through video conference, and Mr. T R Prasad and Prof. V S Raju attended all six meetings held after theirinduction as committee members.
The meetings of the Audit committee were attended by the Chief Financial Officer, Head of Internal Audit and Statutory Auditors asinvitees. The quarterly and annual audited financial statements of the Company were reviewed by the Audit committee beforeconsideration and approval by the Board of directors. The Audit committee reviewed the adequacy of internal control systems andinternal audit reports and their compliance thereof.
The Chairman of the committee, Prof. M Rammohan Rao, was present at the previous AGM, which was held August 30, 2007.
Compensation committee
The Compensation committee, consisting of 100 percent Independent and non-executive directors, evaluates compensation andbenefits for executive directors and frames policies and systems for Associate Stock Option Plans, as approved by members of theCompany.
Composition and other details
1) Dr. (Mrs.) Mangalam Srinivasan, Chairperson
2) Mr. Vinod K Dham
3) Prof. M Rammohan Rao
4) Prof. V S Raju
During the year, the committee met one time—July 20, 2007. Dr. (Mrs.) Mangalam Srinivasan, Prof. M Rammohan Rao and Prof.V S Raju attended the meeting. Mr. Vinod K Dham participated in the meeting through video conference.
Details of remuneration of directors for the year 2007-08
a) Executive directors
B Ramalinga Raju B Rama Raju Ram MynampatiParticulars Chairman Managing Director President & Whole-time
directorSalary 18,00,000 16,80,000 3,52,28,512Commission 18,00,000 16,80,000 -Contribution to PF 2,34,900 2,10,420 -Superannuation 1,80,000 1,68,000 -Others 20,28,455 6,69,305 -Total 60,43,355 44,07,725 3,52,28,512
b) Non-executive directors
Particulars V P Rama Mangalam Krishna G Vinod K M Rammohan T R Prasad V S RajuRao Srinivasan Palepu Dham Rao
Commission 1,00,000 12,00,000 12,00,000 12,00,000 12,00,000 11,33,333 11,33,333Sitting Fees - 80,000 40,000 10,000 1,20,000 1,20,000 1,30,000Professional Fee - - 79,51,000 - - - -Total 1,00,000 12,80,000 91,91,000 12,10,000 13,20,000 12,53,333 12,63,333
Stock options 10,000@ 5,000* 5,000* 5,000* 10,000@ 10,000@ 10,000@
*ADS linked Restricted Stock Units (each ADS represents 2 underlying equity shares) at a grant price of $ equivalent Rs. 4/-.
@. Equity linked Restricted Stock Units at a grant price of Rs. 2/-
Investors’ grievance committee
a) The functions of Investors’ grievance committee focuses on shareholders’ grievances and strengthening of investor relations,specifically looking into redressal of grievances pertaining to:
Rs.
Rs.
Sat_AR08_Final_Jul22_TP 2 Col.pmd 7/23/2008, 7:18 PM40
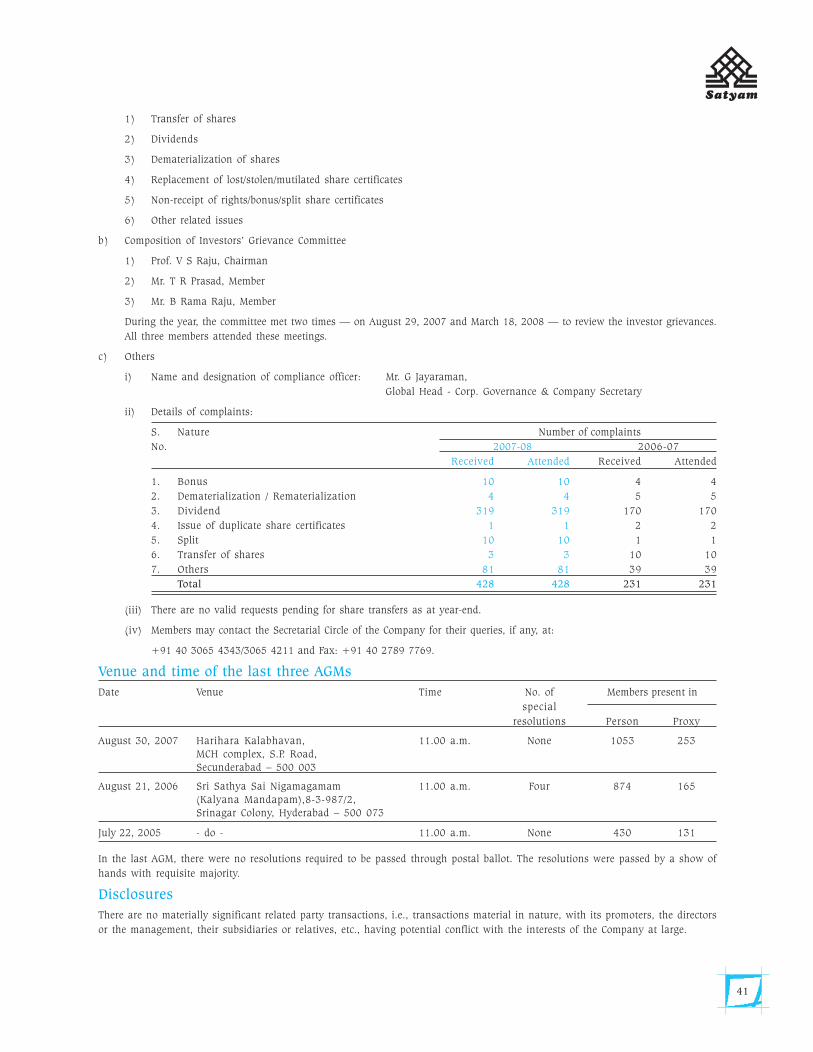
41
1) Transfer of shares
2) Dividends
3) Dematerialization of shares
4) Replacement of lost/stolen/mutilated share certificates
5) Non-receipt of rights/bonus/split share certificates
6) Other related issues
b) Composition of Investors’ Grievance Committee
1) Prof. V S Raju, Chairman
2) Mr. T R Prasad, Member
3) Mr. B Rama Raju, Member
During the year, the committee met two times — on August 29, 2007 and March 18, 2008 — to review the investor grievances.All three members attended these meetings.
c) Others
i) Name and designation of compliance officer: Mr. G Jayaraman,Global Head - Corp. Governance & Company Secretary
ii) Details of complaints:
S. Nature Number of complaintsNo. 2007-08 2006-07
Received Attended Received Attended
1. Bonus 10 10 4 42. Dematerialization / Rematerialization 4 4 5 53. Dividend 319 319 170 1704. Issue of duplicate share certificates 1 1 2 25. Split 10 10 1 16. Transfer of shares 3 3 10 107. Others 81 81 39 39
Total 428 428 231 231
(iii) There are no valid requests pending for share transfers as at year-end.
(iv) Members may contact the Secretarial Circle of the Company for their queries, if any, at:
+91 40 3065 4343/3065 4211 and Fax: +91 40 2789 7769.
Venue and time of the last three AGMs
Date Venue Time No. of Members present inspecial
resolutions Person Proxy
August 30, 2007 Harihara Kalabhavan, 11.00 a.m. None 1053 253MCH complex, S.P. Road,Secunderabad – 500 003
August 21, 2006 Sri Sathya Sai Nigamagamam 11.00 a.m. Four 874 165(Kalyana Mandapam),8-3-987/2,Srinagar Colony, Hyderabad – 500 073
July 22, 2005 - do - 11.00 a.m. None 430 131
In the last AGM, there were no resolutions required to be passed through postal ballot. The resolutions were passed by a show ofhands with requisite majority.
Disclosures
There are no materially significant related party transactions, i.e., transactions material in nature, with its promoters, the directorsor the management, their subsidiaries or relatives, etc., having potential conflict with the interests of the Company at large.
Sat_AR08_Final_Jul22_TP 2 Col.pmd 7/23/2008, 7:18 PM41
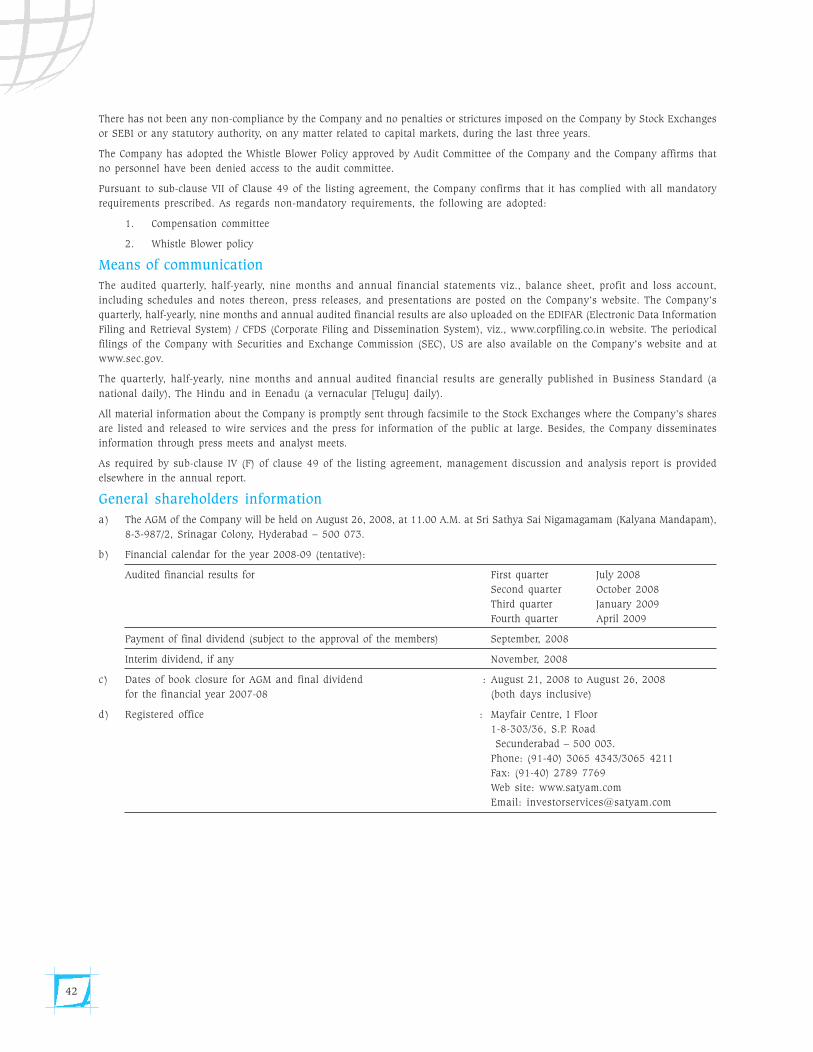
42
There has not been any non-compliance by the Company and no penalties or strictures imposed on the Company by Stock Exchangesor SEBI or any statutory authority, on any matter related to capital markets, during the last three years.
The Company has adopted the Whistle Blower Policy approved by Audit Committee of the Company and the Company affirms thatno personnel have been denied access to the audit committee.
Pursuant to sub-clause VII of Clause 49 of the listing agreement, the Company confirms that it has complied with all mandatoryrequirements prescribed. As regards non-mandatory requirements, the following are adopted:
1. Compensation committee
2. Whistle Blower policy
Means of communication
The audited quarterly, half-yearly, nine months and annual financial statements viz., balance sheet, profit and loss account,including schedules and notes thereon, press releases, and presentations are posted on the Company’s website. The Company’squarterly, half-yearly, nine months and annual audited financial results are also uploaded on the EDIFAR (Electronic Data InformationFiling and Retrieval System) / CFDS (Corporate Filing and Dissemination System), viz., www.corpfiling.co.in website. The periodicalfilings of the Company with Securities and Exchange Commission (SEC), US are also available on the Company’s website and atwww.sec.gov.
The quarterly, half-yearly, nine months and annual audited financial results are generally published in Business Standard (anational daily), The Hindu and in Eenadu (a vernacular [Telugu] daily).
All material information about the Company is promptly sent through facsimile to the Stock Exchanges where the Company’s sharesare listed and released to wire services and the press for information of the public at large. Besides, the Company disseminatesinformation through press meets and analyst meets.
As required by sub-clause IV (F) of clause 49 of the listing agreement, management discussion and analysis report is providedelsewhere in the annual report.
General shareholders information
a) The AGM of the Company will be held on August 26, 2008, at 11.00 A.M. at Sri Sathya Sai Nigamagamam (Kalyana Mandapam),8-3-987/2, Srinagar Colony, Hyderabad – 500 073.
b) Financial calendar for the year 2008-09 (tentative):
Audited financial results for First quarter July 2008Second quarter October 2008Third quarter January 2009Fourth quarter April 2009
Payment of final dividend (subject to the approval of the members) September, 2008
Interim dividend, if any November, 2008
c) Dates of book closure for AGM and final dividend : August 21, 2008 to August 26, 2008for the financial year 2007-08 (both days inclusive)
d) Registered office : Mayfair Centre, I Floor1-8-303/36, S.P. Road
Secunderabad – 500 003.Phone: (91-40) 3065 4343/3065 4211Fax: (91-40) 2789 7769Web site: www.satyam.comEmail: [email protected]
Sat_AR08_Final_Jul22_TP 2 Col.pmd 7/23/2008, 7:18 PM42
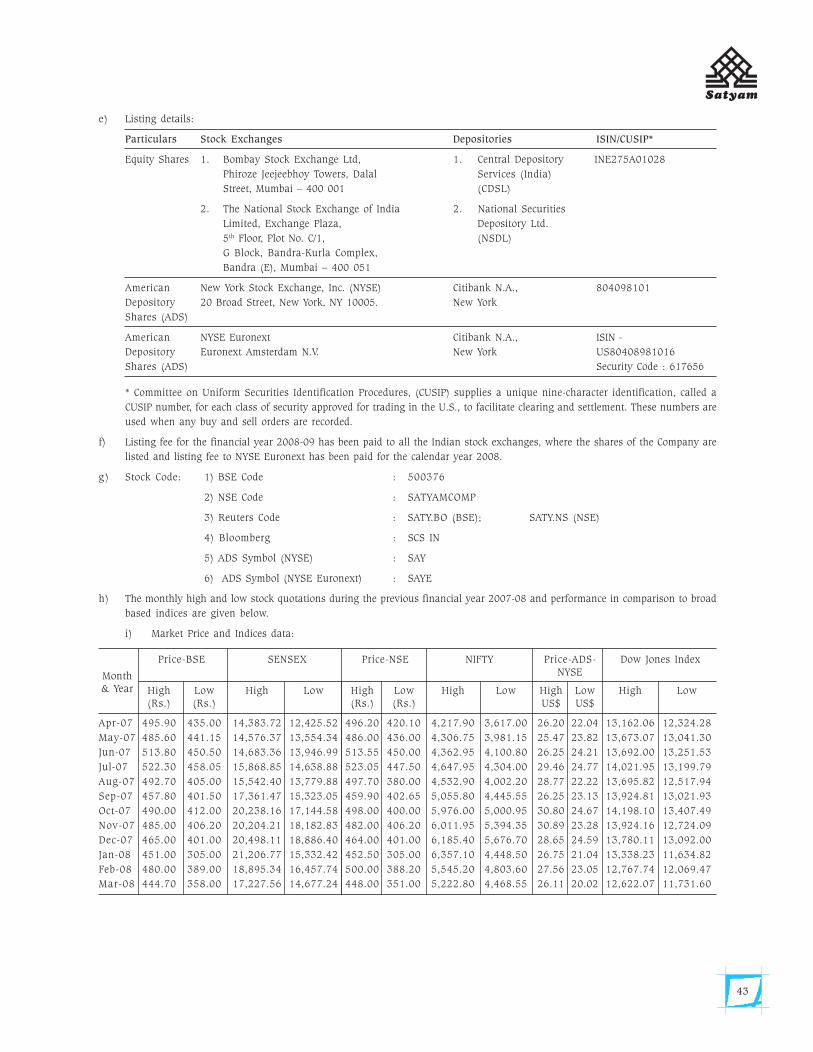
43
e) Listing details:
Particulars Stock Exchanges Depositories ISIN/CUSIP*
Equity Shares 1. Bombay Stock Exchange Ltd, 1. Central Depository INE275A01028Phiroze Jeejeebhoy Towers, Dalal Services (India)Street, Mumbai – 400 001 (CDSL)
2. The National Stock Exchange of India 2. National SecuritiesLimited, Exchange Plaza, Depository Ltd.5th Floor, Plot No. C/1, (NSDL)G Block, Bandra-Kurla Complex,Bandra (E), Mumbai – 400 051
American New York Stock Exchange, Inc. (NYSE) Citibank N.A., 804098101Depository 20 Broad Street, New York, NY 10005. New YorkShares (ADS)
American NYSE Euronext Citibank N.A., ISIN -Depository Euronext Amsterdam N.V. New York US80408981016Shares (ADS) Security Code : 617656
* Committee on Uniform Securities Identification Procedures, (CUSIP) supplies a unique nine-character identification, called aCUSIP number, for each class of security approved for trading in the U.S., to facilitate clearing and settlement. These numbers areused when any buy and sell orders are recorded.
f) Listing fee for the financial year 2008-09 has been paid to all the Indian stock exchanges, where the shares of the Company arelisted and listing fee to NYSE Euronext has been paid for the calendar year 2008.
g) Stock Code: 1) BSE Code : 500376
2) NSE Code : SATYAMCOMP
3) Reuters Code : SATY.BO (BSE); SATY.NS (NSE)
4) Bloomberg : SCS IN
5) ADS Symbol (NYSE) : SAY
6) ADS Symbol (NYSE Euronext) : SAYE
h) The monthly high and low stock quotations during the previous financial year 2007-08 and performance in comparison to broadbased indices are given below.
i) Market Price and Indices data:
Price-BSE SENSEX Price-NSE NIFTY Price-ADS- Dow Jones IndexNYSE
High Low High Low High Low High Low High Low High Low(Rs.) (Rs.) (Rs.) (Rs.) US$ US$
Apr-07 495.90 435.00 14,383.72 12,425.52 496.20 420.10 4,217.90 3,617.00 26.20 22.04 13,162.06 12,324.28May-07 485.60 441.15 14,576.37 13,554.34 486.00 436.00 4,306.75 3,981.15 25.47 23.82 13,673.07 13,041.30Jun-07 513.80 450.50 14,683.36 13,946.99 513.55 450.00 4,362.95 4,100.80 26.25 24.21 13,692.00 13,251.53Jul-07 522.30 458.05 15,868.85 14,638.88 523.05 447.50 4,647.95 4,304.00 29.46 24.77 14,021.95 13,199.79Aug-07 492.70 405.00 15,542.40 13,779.88 497.70 380.00 4,532.90 4,002.20 28.77 22.22 13,695.82 12,517.94Sep-07 457.80 401.50 17,361.47 15,323.05 459.90 402.65 5,055.80 4,445.55 26.25 23.13 13,924.81 13,021.93Oct-07 490.00 412.00 20,238.16 17,144.58 498.00 400.00 5,976.00 5,000.95 30.80 24.67 14,198.10 13,407.49Nov-07 485.00 406.20 20,204.21 18,182.83 482.00 406.20 6,011.95 5,394.35 30.89 23.28 13,924.16 12,724.09Dec-07 465.00 401.00 20,498.11 18,886.40 464.00 401.00 6,185.40 5,676.70 28.65 24.59 13,780.11 13,092.00Jan-08 451.00 305.00 21,206.77 15,332.42 452.50 305.00 6,357.10 4,448.50 26.75 21.04 13,338.23 11,634.82Feb-08 480.00 389.00 18,895.34 16,457.74 500.00 388.20 5,545.20 4,803.60 27.56 23.05 12,767.74 12,069.47Mar-08 444.70 358.00 17,227.56 14,677.24 448.00 351.00 5,222.80 4,468.55 26.11 20.02 12,622.07 11,731.60
Month& Year
Sat_AR08_Final_Jul22_TP 2 Col.pmd 7/23/2008, 7:18 PM43
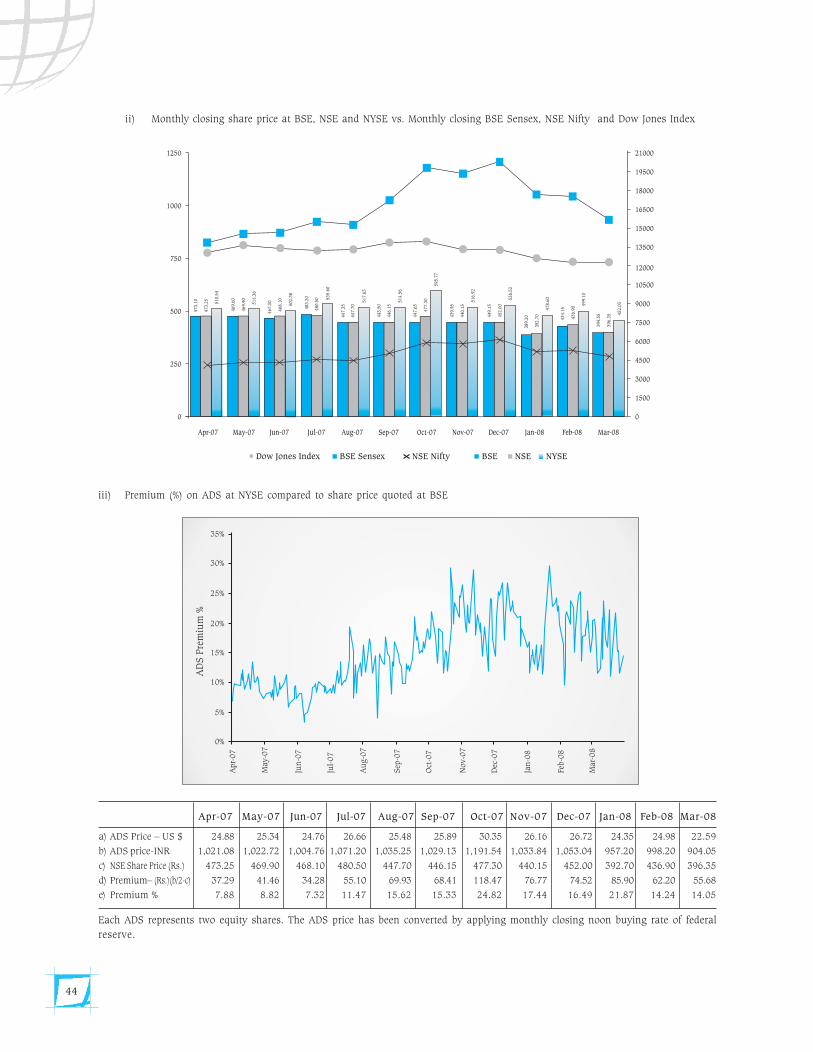
44
ii) Monthly closing share price at BSE, NSE and NYSE vs. Monthly closing BSE Sensex, NSE Nifty and Dow Jones Index
Each ADS represents two equity shares. The ADS price has been converted by applying monthly closing noon buying rate of federalreserve.
iii) Premium (%) on ADS at NYSE compared to share price quoted at BSE
Apr-07 May-07 Jun-07 Jul-07 Aug-07 Sep-07 Oct-07 Nov-07 Dec-07 Jan-08 Feb-08 Mar-08
a) ADS Price – US $ 24.88 25.34 24.76 26.66 25.48 25.89 30.35 26.16 26.72 24.35 24.98 22.59
b) ADS price-INR 1,021.08 1,022.72 1,004.76 1,071.20 1,035.25 1,029.13 1,191.54 1,033.84 1,053.04 957.20 998.20 904.05
c) NSE Share Price (Rs.) 473.25 469.90 468.10 480.50 447.70 446.15 477.30 440.15 452.00 392.70 436.90 396.35
d) Premium– (Rs.)(b/2-c) 37.29 41.46 34.28 55.10 69.93 68.41 118.47 76.77 74.52 85.90 62.20 55.68
e) Premium % 7.88 8.82 7.32 11.47 15.62 15.33 24.82 17.44 16.49 21.87 14.24 14.05
Sat_AR08_Final_Jul22_TP 2 Col.pmd 7/23/2008, 7:18 PM44
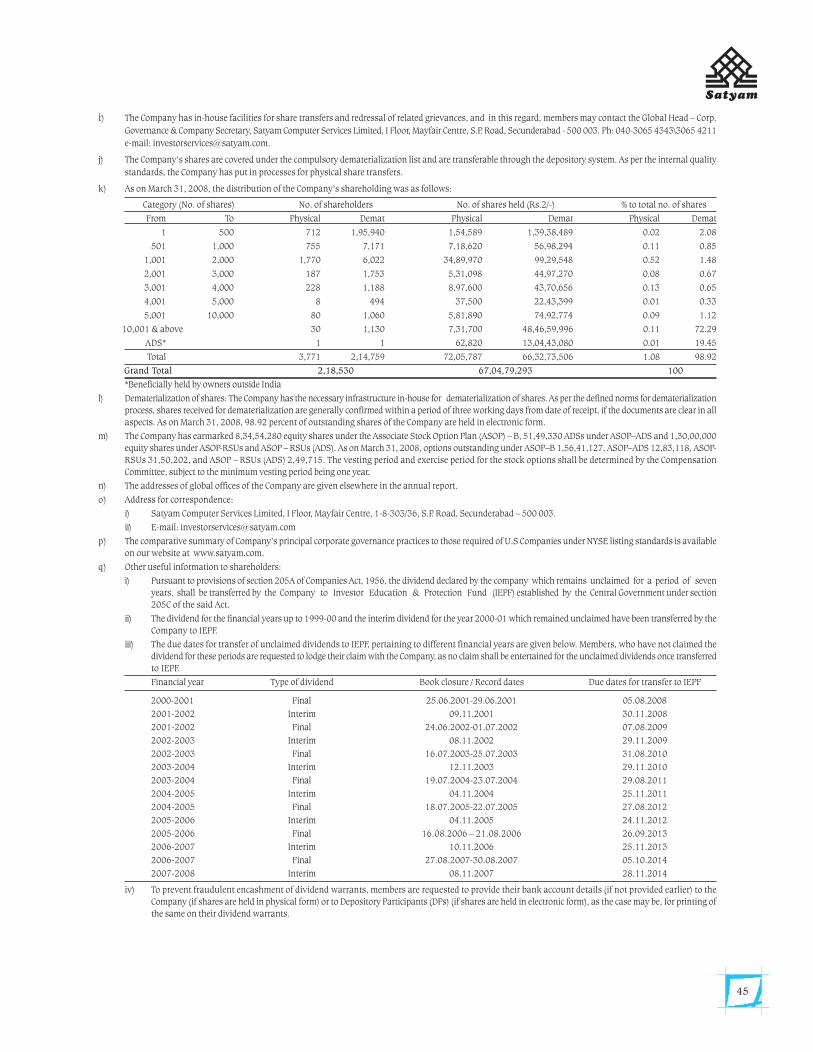
45
i) The Company has in-house facilities for share transfers and redressal of related grievances, and in this regard, members may contact the Global Head – Corp.
Governance & Company Secretary, Satyam Computer Services Limited, I Floor, Mayfair Centre, S.P. Road, Secunderabad - 500 003. Ph: 040-3065 4343\3065 4211
e-mail: [email protected].
j) The Company’s shares are covered under the compulsory dematerialization list and are transferable through the depository system. As per the internal quality
standards, the Company has put in processes for physical share transfers.
k) As on March 31, 2008, the distribution of the Company’s shareholding was as follows:
Category (No. of shares) No. of shareholders No. of shares held (Rs.2/-) % to total no. of shares
From To Physical Demat Physical Demat Physical Demat
1 500 712 1,95,940 1,54,589 1,39,38,489 0.02 2.08
501 1,000 755 7,171 7,18,620 56,98,294 0.11 0.85
1,001 2,000 1,770 6,022 34,89,970 99,29,548 0.52 1.48
2,001 3,000 187 1,753 5,31,098 44,97,270 0.08 0.67
3,001 4,000 228 1,188 8,97,600 43,70,656 0.13 0.65
4,001 5,000 8 494 37,500 22,43,399 0.01 0.33
5,001 10,000 80 1,060 5,81,890 74,92,774 0.09 1.12
10,001 & above 30 1,130 7,31,700 48,46,59,996 0.11 72.29
ADS* 1 1 62,820 13,04,43,080 0.01 19.45
Total 3,771 2,14,759 72,05,787 66,32,73,506 1.08 98.92
Grand Total 2,18,530 67,04,79,293 100
*Beneficially held by owners outside India
l) Dematerialization of shares: The Company has the necessary infrastructure in-house for dematerialization of shares. As per the defined norms for dematerialization
process, shares received for dematerialization are generally confirmed within a period of three working days from date of receipt, if the documents are clear in all
aspects. As on March 31, 2008, 98.92 percent of outstanding shares of the Company are held in electronic form.
m) The Company has earmarked 8,34,54,280 equity shares under the Associate Stock Option Plan (ASOP) – B, 51,49,330 ADSs under ASOP–ADS and 1,30,00,000
equity shares under ASOP-RSUs and ASOP – RSUs (ADS). As on March 31, 2008, options outstanding under ASOP–B 1,56,41,127, ASOP–ADS 12,83,118, ASOP-
RSUs 31,50,202, and ASOP – RSUs (ADS) 2,49,715. The vesting period and exercise period for the stock options shall be determined by the Compensation
Committee, subject to the minimum vesting period being one year.
n) The addresses of global offices of the Company are given elsewhere in the annual report.
o) Address for correspondence:
i) Satyam Computer Services Limited, I Floor, Mayfair Centre, 1-8-303/36, S.P. Road, Secunderabad – 500 003.
ii) E-mail: [email protected]
p) The comparative summary of Company’s principal corporate governance practices to those required of U.S Companies under NYSE listing standards is available
on our website at www.satyam.com.
q) Other useful information to shareholders:
i) Pursuant to provisions of section 205A of Companies Act, 1956, the dividend declared by the company which remains unclaimed for a period of seven
years, shall be transferred by the Company to Investor Education & Protection Fund (IEPF) established by the Central Government under section
205C of the said Act.
ii) The dividend for the financial years up to 1999-00 and the interim dividend for the year 2000-01 which remained unclaimed have been transferred by the
Company to IEPF.
iii) The due dates for transfer of unclaimed dividends to IEPF, pertaining to different financial years are given below. Members, who have not claimed the
dividend for these periods are requested to lodge their claim with the Company, as no claim shall be entertained for the unclaimed dividends once transferred
to IEPF.
Financial year Type of dividend Book closure / Record dates Due dates for transfer to IEPF
2000-2001 Final 25.06.2001-29.06.2001 05.08.2008
2001-2002 Interim 09.11.2001 30.11.2008
2001-2002 Final 24.06.2002-01.07.2002 07.08.2009
2002-2003 Interim 08.11.2002 29.11.2009
2002-2003 Final 16.07.2003-25.07.2003 31.08.2010
2003-2004 Interim 12.11.2003 29.11.2010
2003-2004 Final 19.07.2004-23.07.2004 29.08.2011
2004-2005 Interim 04.11.2004 25.11.2011
2004-2005 Final 18.07.2005-22.07.2005 27.08.2012
2005-2006 Interim 04.11.2005 24.11.2012
2005-2006 Final 16.08.2006 – 21.08.2006 26.09.2013
2006-2007 Interim 10.11.2006 25.11.2013
2006-2007 Final 27.08.2007-30.08.2007 05.10.2014
2007-2008 Interim 08.11.2007 28.11.2014
iv) To prevent fraudulent encashment of dividend warrants, members are requested to provide their bank account details (if not provided earlier) to the
Company (if shares are held in physical form) or to Depository Participants (DPs) (if shares are held in electronic form), as the case may be, for printing of
the same on their dividend warrants.
Sat_AR08_Final_Jul22_TP 2 Col.pmd 7/23/2008, 7:18 PM45
46
v) Members holding shares in electronic form are advised that in terms of the byelaws of NSDL & CDSL, their bank account details, as furnished to the DP,
will be printed on their dividend warrants. The Company will not entertain requests for change of such bank details printed on their dividend warrants.
vi) Members are requested to send the duly filled in ECS mandate to depository participant with a copy to the Company’s registered office address provided
in this annual report to enable the Company to credit the dividend into their bank account through Electronic Clearing Service mechanism.
vii) Shares received for physical transfer are generally registered within a period of three working days from the date of receipt, if the documents are clear in
all respects. In case no response is received from the Company within 15 days of lodgment of transfer request, the transferee may write to the Company
with full details so that necessary action could be taken to safeguard the interest of the concerned against any possible loss/interception during postal
transit.
viii) Members holding shares in physical form are requested to notify to the Company, any change in their registered address and bank account details promptly
by written request under the signatures of sole/first joint holder. Members holding shares in electronic form are requested to send their instructions regarding
change of name, change of address, bank details, nomination, power of attorney, etc., directly to their Depository Participant (DP) as the same are
maintained by them.
ix) Non-resident members are advised to immediately notify to the company or to the DPs as the case may be:
• change in their residential status on return to India for permanent settlement;
• particulars of their NRE bank account with a bank in India, if not furnished earlier;
x) In case of loss/misplacement of shares, a complaint shall be lodged with the police station, and intimation to this effect shall be sent to the Company along
with original or certified copy of FIR/acknowledgment of the complaint.
xi) For expeditious transfer of shares, shareholders should fill in complete and correct particulars in the transfer deed. Wherever applicable, the registration
number of the power of attorney should also be quoted in the transfer deed at the appropriate place.
xii) Equity shares of the Company are under compulsory demat trading by all investors. Considering the advantages of scrip-less trading, members are
encouraged to consider dematerialization of their shareholding.
xiii) Members are requested to quote their folio/DP and client ID nos., as the case may be, in all correspondence with the Company. All correspondences regarding
shares of the Company should be addressed to Secretarial Circle of the Company at the Registered Office at 1-8-303/36, I Floor, Mayfair Centre, S.P. Road,
Secunderabad – 500 003, and not to the addressof the erstwhile registrars and transfer agents or any other offices of the Company.
xiv) Members who have multiple folios in identical name(s) or holding more than one share certificate in the same name under different ledger folio(s) are
requested to apply for consolidation of such folio(s) and send the relevant share certificates to the Company.
xv) Section 109A of the Companies Act, 1956 extends nomination facility to individuals holding shares in physical form in companies. Members, in particular
those holding shares in single name may avail of this facility by furnishing the particulars of their nominations in the prescribed nomination form.
xvi) Members are welcome to give us their valuable suggestions for improvement of investor services.
Declaration regarding compliance with the Code of Conduct and Ethics Policy of the Company by Boardmembers and senior management personnel
This is to confirm that the Company has adopted Code of Conduct and Ethics Policy for the Board of Directors and Associates of the Company, which is available atwww.satyam.com.
I declare that the Board of Directors and senior managmenet personnel have affirmed compliance with the Code of Conduct and Ethics policy of the Company.
Place : Hyderabad B Rama RajuDate : April 21, 2008 Managing Director
Auditors' Certificate regarding compliance of conditions of Corporate Governance under Clause 49 of theListing Agreement
To the Members ofSatyam Computer Services Limited
We have examined the compliance of conditions of Corporate Governance by Satyam Computer Services Limited ('the Company'), for the year ended March 31, 2008,as stipulated in Clause 49 of the Listing Agreement of the said Company with stock exchanges in India.
The compliance of conditions of Corporate Governance is the responsibility of the Company's management. Our examination was carried out in accordance with the"Guidance Note on Certification of Corporate Governance (as stipulated in Clause 49 of the Listing Agreement)", issued by the Institute of Chartered Accountants of Indiaand was limited to procedures and implementation thereof, adopted by the Company for ensuring the compliance of the conditions of Corporate Governance. It is neitheran audit nor an expression of opinion on the financial statements of the Company.
In our opinion and to the best of our information and according to the explanations given to us, we certify that the Company has complied with the conditions ofCorporate Governance as stipulated in the above mentioned Listing Agreement.
We state that such compliance is neither an assurance as to the future viability of the Company nor the efficiency or effectiveness with which the management liasconducted the affairs of the Company.
Srinivas TalluriPartner
Membership Number 29864For and on behalf of
Place : Hyderabad Price WaterhouseDate : April 21, 2008 Chartered Accountants
Sat_AR08_Final_Jul22_TP 2 Col.pmd 7/23/2008, 7:18 PM46
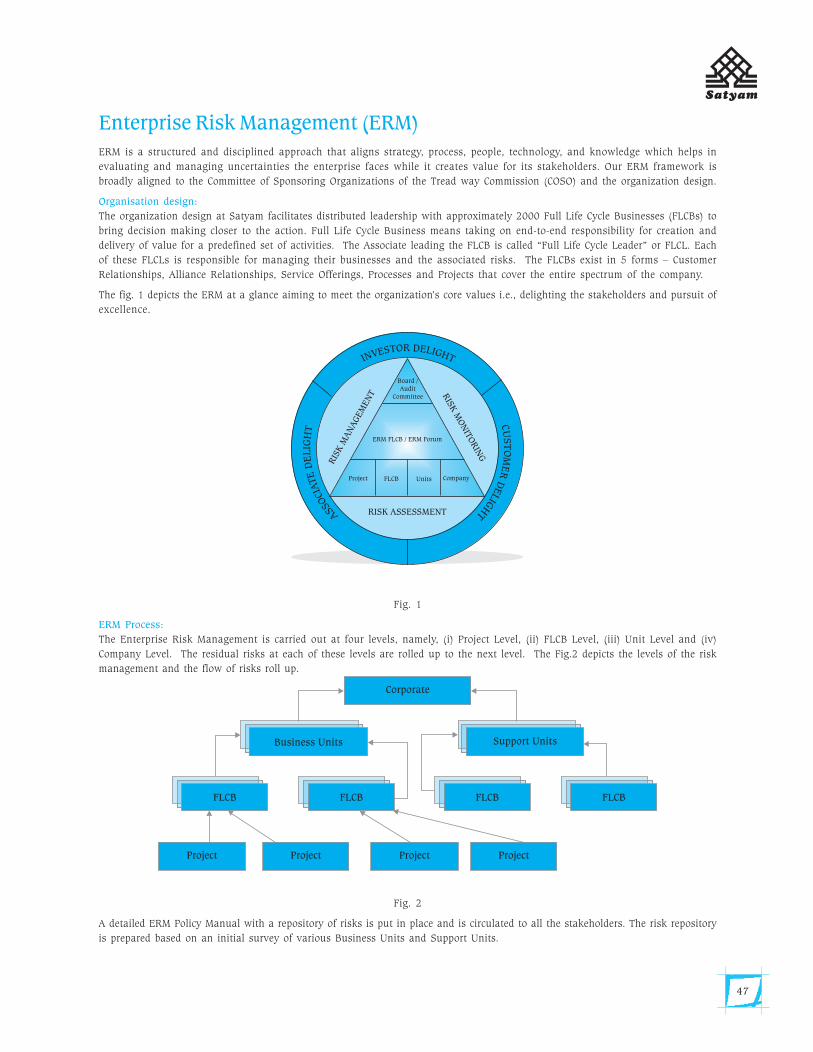
47
Enterprise Risk Management (ERM)ERM is a structured and disciplined approach that aligns strategy, process, people, technology, and knowledge which helps inevaluating and managing uncertainties the enterprise faces while it creates value for its stakeholders. Our ERM framework isbroadly aligned to the Committee of Sponsoring Organizations of the Tread way Commission (COSO) and the organization design.
Organisation design:
The organization design at Satyam facilitates distributed leadership with approximately 2000 Full Life Cycle Businesses (FLCBs) tobring decision making closer to the action. Full Life Cycle Business means taking on end-to-end responsibility for creation anddelivery of value for a predefined set of activities. The Associate leading the FLCB is called “Full Life Cycle Leader” or FLCL. Eachof these FLCLs is responsible for managing their businesses and the associated risks. The FLCBs exist in 5 forms – CustomerRelationships, Alliance Relationships, Service Offerings, Processes and Projects that cover the entire spectrum of the company.
The fig. 1 depicts the ERM at a glance aiming to meet the organization’s core values i.e., delighting the stakeholders and pursuit ofexcellence.
Fig. 1
ERM Process:
The Enterprise Risk Management is carried out at four levels, namely, (i) Project Level, (ii) FLCB Level, (iii) Unit Level and (iv)Company Level. The residual risks at each of these levels are rolled up to the next level. The Fig.2 depicts the levels of the riskmanagement and the flow of risks roll up.
Fig. 2
A detailed ERM Policy Manual with a repository of risks is put in place and is circulated to all the stakeholders. The risk repositoryis prepared based on an initial survey of various Business Units and Support Units.
Sat_AR08_Final_Jul22_TP 2 Col.pmd 7/23/2008, 7:18 PM47
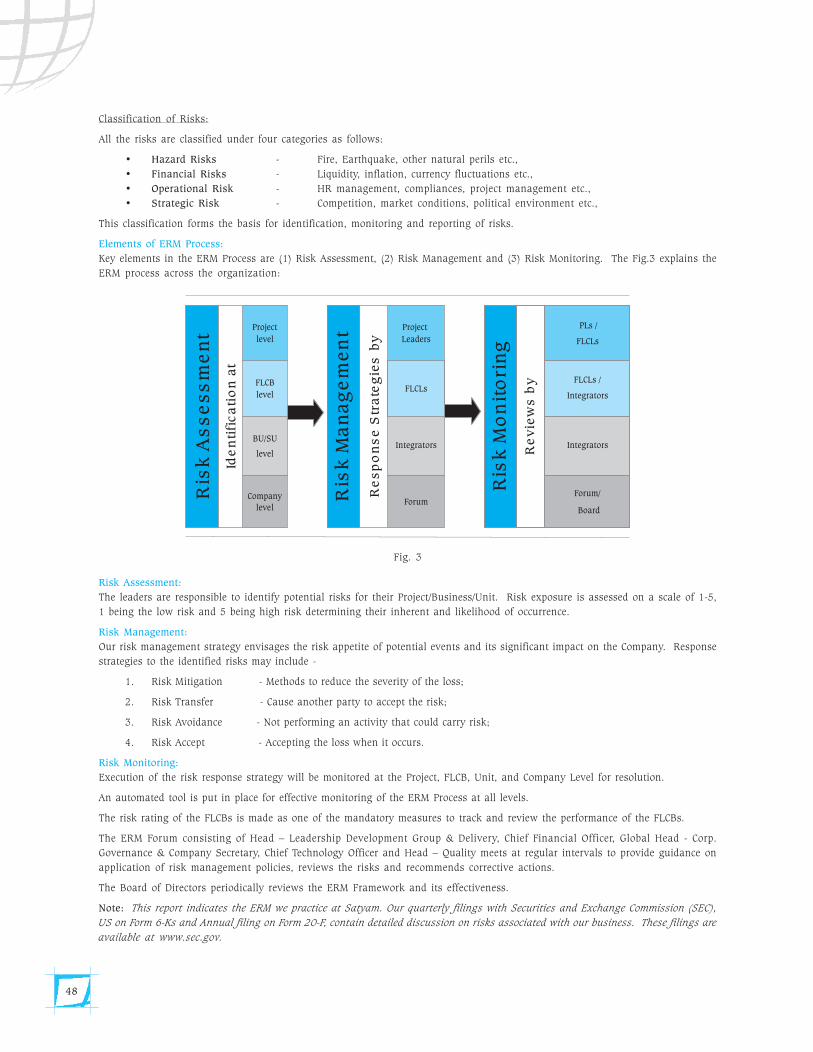
48
Classification of Risks:
All the risks are classified under four categories as follows:
• Hazard Risks - Fire, Earthquake, other natural perils etc.,• Financial Risks - Liquidity, inflation, currency fluctuations etc.,• Operational Risk - HR management, compliances, project management etc.,• Strategic Risk - Competition, market conditions, political environment etc.,
This classification forms the basis for identification, monitoring and reporting of risks.
Elements of ERM Process:
Key elements in the ERM Process are (1) Risk Assessment, (2) Risk Management and (3) Risk Monitoring. The Fig.3 explains theERM process across the organization:
Fig. 3
Risk Assessment:
The leaders are responsible to identify potential risks for their Project/Business/Unit. Risk exposure is assessed on a scale of 1-5,1 being the low risk and 5 being high risk determining their inherent and likelihood of occurrence.
Risk Management:
Our risk management strategy envisages the risk appetite of potential events and its significant impact on the Company. Responsestrategies to the identified risks may include -
1. Risk Mitigation - Methods to reduce the severity of the loss;
2. Risk Transfer - Cause another party to accept the risk;
3. Risk Avoidance - Not performing an activity that could carry risk;
4. Risk Accept - Accepting the loss when it occurs.
Risk Monitoring:
Execution of the risk response strategy will be monitored at the Project, FLCB, Unit, and Company Level for resolution.
An automated tool is put in place for effective monitoring of the ERM Process at all levels.
The risk rating of the FLCBs is made as one of the mandatory measures to track and review the performance of the FLCBs.
The ERM Forum consisting of Head – Leadership Development Group & Delivery, Chief Financial Officer, Global Head - Corp.Governance & Company Secretary, Chief Technology Officer and Head – Quality meets at regular intervals to provide guidance onapplication of risk management policies, reviews the risks and recommends corrective actions.
The Board of Directors periodically reviews the ERM Framework and its effectiveness.
Note: This report indicates the ERM we practice at Satyam. Our quarterly filings with Securities and Exchange Commission (SEC),
US on Form 6-Ks and Annual filing on Form 20-F, contain detailed discussion on risks associated with our business. These filings are
available at www.sec.gov.
Sat_AR08_Final_Jul22_TP 2 Col.pmd 7/23/2008, 7:18 PM48
49
Corporate Social Responsibility
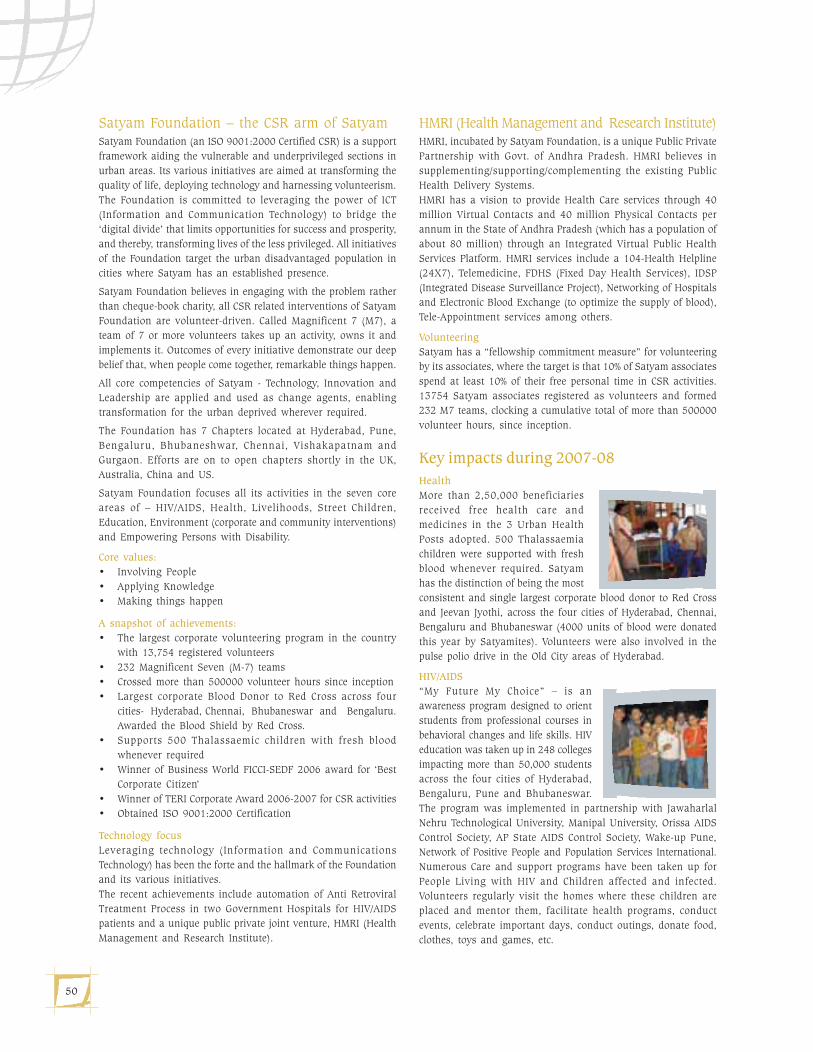
50
Satyam Foundation – the CSR arm of SatyamSatyam Foundation (an ISO 9001:2000 Certified CSR) is a support
framework aiding the vulnerable and underprivileged sections in
urban areas. Its various initiatives are aimed at transforming the
quality of life, deploying technology and harnessing volunteerism.
The Foundation is committed to leveraging the power of ICT
(Information and Communication Technology) to bridge the
‘digital divide’ that limits opportunities for success and prosperity,
and thereby, transforming lives of the less privileged. All initiatives
of the Foundation target the urban disadvantaged population in
cities where Satyam has an established presence.
Satyam Foundation believes in engaging with the problem rather
than cheque-book charity, all CSR related interventions of Satyam
Foundation are volunteer-driven. Called Magnificent 7 (M7), a
team of 7 or more volunteers takes up an activity, owns it and
implements it. Outcomes of every initiative demonstrate our deep
belief that, when people come together, remarkable things happen.
All core competencies of Satyam - Technology, Innovation and
Leadership are applied and used as change agents, enabling
transformation for the urban deprived wherever required.
The Foundation has 7 Chapters located at Hyderabad, Pune,
Bengaluru, Bhubaneshwar, Chennai, Vishakapatnam and
Gurgaon. Efforts are on to open chapters shortly in the UK,
Australia, China and US.
Satyam Foundation focuses all its activities in the seven core
areas of – HIV/AIDS, Health, Livelihoods, Street Children,
Education, Environment (corporate and community interventions)
and Empowering Persons with Disability.
Core values:
• Involving People
• Applying Knowledge
• Making things happen
A snapshot of achievements:
• The largest corporate volunteering program in the country
with 13,754 registered volunteers
• 232 Magnificent Seven (M-7) teams
• Crossed more than 500000 volunteer hours since inception
• Largest corporate Blood Donor to Red Cross across four
cities- Hyderabad, Chennai, Bhubaneswar and Bengaluru.
Awarded the Blood Shield by Red Cross.
• Supports 500 Thalassaemic children with fresh blood
whenever required
• Winner of Business World FICCI-SEDF 2006 award for ‘Best
Corporate Citizen’
• Winner of TERI Corporate Award 2006-2007 for CSR activities
• Obtained ISO 9001:2000 Certification
Technology focus
Leveraging technology (Information and Communications
Technology) has been the forte and the hallmark of the Foundation
and its various initiatives.
The recent achievements include automation of Anti Retroviral
Treatment Process in two Government Hospitals for HIV/AIDS
patients and a unique public private joint venture, HMRI (Health
Management and Research Institute).
HMRI (Health Management and Research Institute)HMRI, incubated by Satyam Foundation, is a unique Public Private
Partnership with Govt. of Andhra Pradesh. HMRI believes in
supplementing/supporting/complementing the existing Public
Health Delivery Systems.
HMRI has a vision to provide Health Care services through 40
million Virtual Contacts and 40 million Physical Contacts per
annum in the State of Andhra Pradesh (which has a population of
about 80 million) through an Integrated Virtual Public Health
Services Platform. HMRI services include a 104-Health Helpline
(24X7), Telemedicine, FDHS (Fixed Day Health Services), IDSP
(Integrated Disease Surveillance Project), Networking of Hospitals
and Electronic Blood Exchange (to optimize the supply of blood),
Tele-Appointment services among others.
Volunteering
Satyam has a “fellowship commitment measure” for volunteering
by its associates, where the target is that 10% of Satyam associates
spend at least 10% of their free personal time in CSR activities.
13754 Satyam associates registered as volunteers and formed
232 M7 teams, clocking a cumulative total of more than 500000
volunteer hours, since inception.
Key impacts during 2007-08
Health
More than 2,50,000 beneficiaries
received free health care and
medicines in the 3 Urban Health
Posts adopted. 500 Thalassaemia
children were supported with fresh
blood whenever required. Satyam
has the distinction of being the most
consistent and single largest corporate blood donor to Red Cross
and Jeevan Jyothi, across the four cities of Hyderabad, Chennai,
Bengaluru and Bhubaneswar (4000 units of blood were donated
this year by Satyamites). Volunteers were also involved in the
pulse polio drive in the Old City areas of Hyderabad.
HIV/AIDS
“My Future My Choice” – is an
awareness program designed to orient
students from professional courses in
behavioral changes and life skills. HIV
education was taken up in 248 colleges
impacting more than 50,000 students
across the four cities of Hyderabad,
Bengaluru, Pune and Bhubaneswar.
The program was implemented in partnership with Jawaharlal
Nehru Technological University, Manipal University, Orissa AIDS
Control Society, AP State AIDS Control Society, Wake-up Pune,
Network of Positive People and Population Services International.
Numerous Care and support programs have been taken up for
People Living with HIV and Children affected and infected.
Volunteers regularly visit the homes where these children are
placed and mentor them, facilitate health programs, conduct
events, celebrate important days, conduct outings, donate food,
clothes, toys and games, etc.
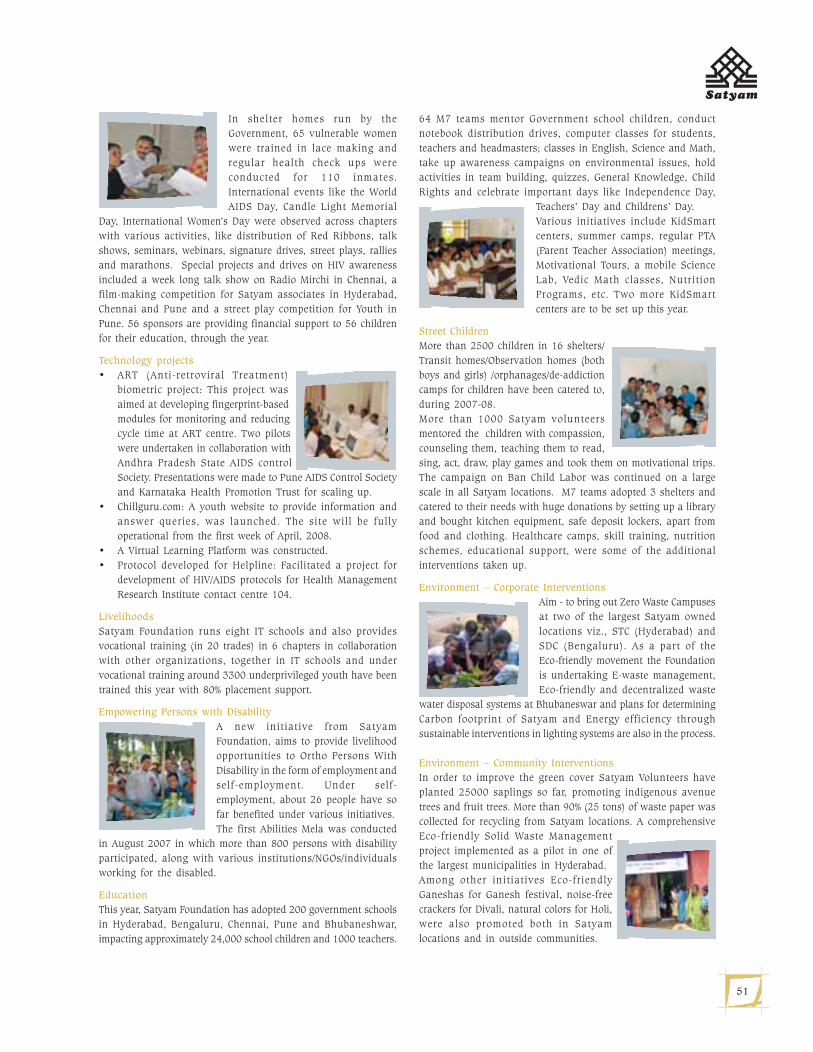
51
In shelter homes run by the
Government, 65 vulnerable women
were trained in lace making and
regular health check ups were
conducted for 110 inmates.
International events like the World
AIDS Day, Candle Light Memorial
Day, International Women’s Day were observed across chapters
with various activities, like distribution of Red Ribbons, talk
shows, seminars, webinars, signature drives, street plays, rallies
and marathons. Special projects and drives on HIV awareness
included a week long talk show on Radio Mirchi in Chennai, a
film-making competition for Satyam associates in Hyderabad,
Chennai and Pune and a street play competition for Youth in
Pune. 56 sponsors are providing financial support to 56 children
for their education, through the year.
Technology projects
• ART (Anti-retroviral Treatment)
biometric project: This project was
aimed at developing fingerprint-based
modules for monitoring and reducing
cycle time at ART centre. Two pilots
were undertaken in collaboration with
Andhra Pradesh State AIDS control
Society. Presentations were made to Pune AIDS Control Society
and Karnataka Health Promotion Trust for scaling up.
• Chillguru.com: A youth website to provide information and
answer queries, was launched. The site will be fully
operational from the first week of April, 2008.
• A Virtual Learning Platform was constructed.
• Protocol developed for Helpline: Facilitated a project for
development of HIV/AIDS protocols for Health Management
Research Institute contact centre 104.
Livelihoods
Satyam Foundation runs eight IT schools and also provides
vocational training (in 20 trades) in 6 chapters in collaboration
with other organizations, together in IT schools and under
vocational training around 3300 underprivileged youth have been
trained this year with 80% placement support.
Empowering Persons with Disability
A new initiative from Satyam
Foundation, aims to provide livelihood
opportunities to Ortho Persons With
Disability in the form of employment and
self-employment. Under self-
employment, about 26 people have so
far benefited under various initiatives.
The first Abilities Mela was conducted
in August 2007 in which more than 800 persons with disability
participated, along with various institutions/NGOs/individuals
working for the disabled.
Education
This year, Satyam Foundation has adopted 200 government schools
in Hyderabad, Bengaluru, Chennai, Pune and Bhubaneshwar,
impacting approximately 24,000 school children and 1000 teachers.
64 M7 teams mentor Government school children, conduct
notebook distribution drives, computer classes for students,
teachers and headmasters; classes in English, Science and Math,
take up awareness campaigns on environmental issues, hold
activities in team building, quizzes, General Knowledge, Child
Rights and celebrate important days like Independence Day,
Teachers’ Day and Childrens’ Day.
Various initiatives include KidSmart
centers, summer camps, regular PTA
(Parent Teacher Association) meetings,
Motivational Tours, a mobile Science
Lab, Vedic Math classes, Nutrition
Programs, etc. Two more KidSmart
centers are to be set up this year.
Street Children
More than 2500 children in 16 shelters/
Transit homes/Observation homes (both
boys and girls) /orphanages/de-addiction
camps for children have been catered to,
during 2007-08.
More than 1000 Satyam volunteers
mentored the children with compassion,
counseling them, teaching them to read,
sing, act, draw, play games and took them on motivational trips.
The campaign on Ban Child Labor was continued on a large
scale in all Satyam locations. M7 teams adopted 3 shelters and
catered to their needs with huge donations by setting up a library
and bought kitchen equipment, safe deposit lockers, apart from
food and clothing. Healthcare camps, skill training, nutrition
schemes, educational support, were some of the additional
interventions taken up.
Environment – Corporate Interventions
Aim - to bring out Zero Waste Campuses
at two of the largest Satyam owned
locations viz., STC (Hyderabad) and
SDC (Bengaluru). As a part of the
Eco-friendly movement the Foundation
is undertaking E-waste management,
Eco-friendly and decentralized waste
water disposal systems at Bhubaneswar and plans for determining
Carbon footprint of Satyam and Energy efficiency through
sustainable interventions in lighting systems are also in the process.
Environment – Community Interventions
In order to improve the green cover Satyam Volunteers have
planted 25000 saplings so far, promoting indigenous avenue
trees and fruit trees. More than 90% (25 tons) of waste paper was
collected for recycling from Satyam locations. A comprehensive
Eco-friendly Solid Waste Management
project implemented as a pilot in one of
the largest municipalities in Hyderabad.
Among other initiatives Eco-friendly
Ganeshas for Ganesh festival, noise-free
crackers for Divali, natural colors for Holi,
were also promoted both in Satyam
locations and in outside communities.
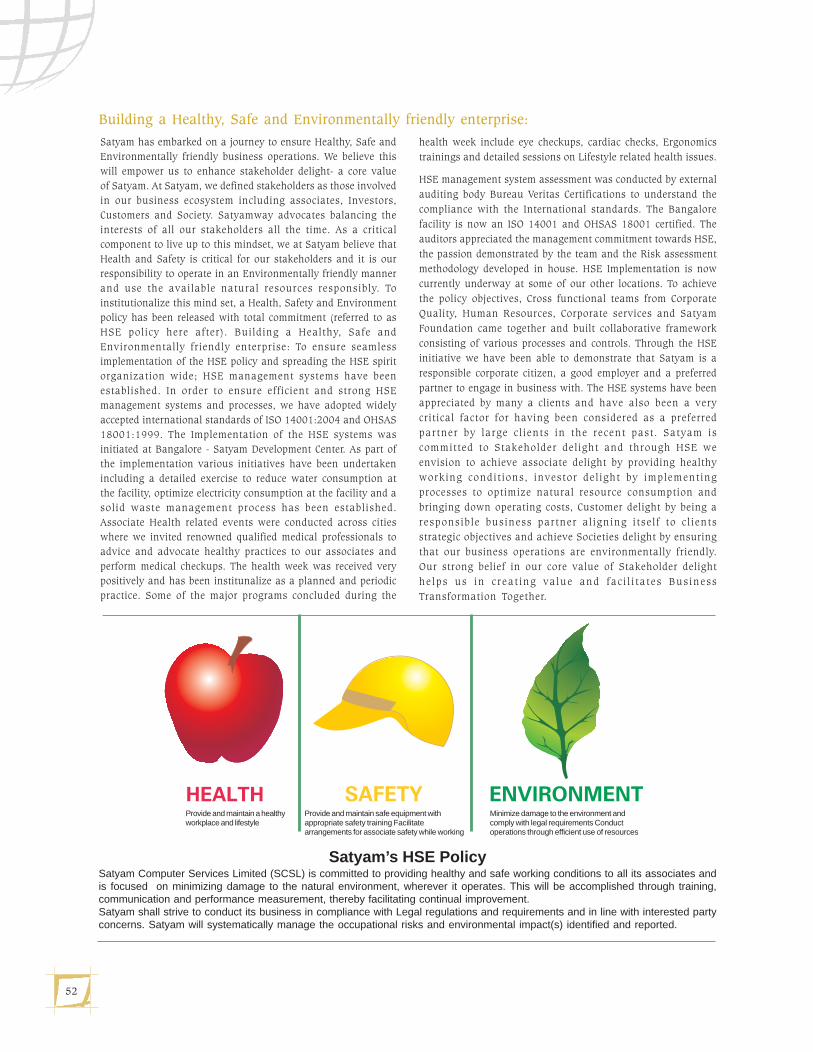
52
Building a Healthy, Safe and Environmentally friendly enterprise:
Satyam has embarked on a journey to ensure Healthy, Safe and
Environmentally friendly business operations. We believe this
will empower us to enhance stakeholder delight- a core value
of Satyam. At Satyam, we defined stakeholders as those involved
in our business ecosystem including associates, Investors,
Customers and Society. Satyamway advocates balancing the
interests of all our stakeholders all the time. As a critical
component to live up to this mindset, we at Satyam believe that
Health and Safety is critical for our stakeholders and it is our
responsibility to operate in an Environmentally friendly manner
and use the available natural resources responsibly. To
institutionalize this mind set, a Health, Safety and Environment
policy has been released with total commitment (referred to as
HSE policy here after). Building a Healthy, Safe and
Environmentally friendly enterprise: To ensure seamless
implementation of the HSE policy and spreading the HSE spirit
organization wide; HSE management systems have been
established. In order to ensure efficient and strong HSE
management systems and processes, we have adopted widely
accepted international standards of ISO 14001:2004 and OHSAS
18001:1999. The Implementation of the HSE systems was
initiated at Bangalore - Satyam Development Center. As part of
the implementation various initiatives have been undertaken
including a detailed exercise to reduce water consumption at
the facility, optimize electricity consumption at the facility and a
solid waste management process has been established.
Associate Health related events were conducted across cities
where we invited renowned qualified medical professionals to
advice and advocate healthy practices to our associates and
perform medical checkups. The health week was received very
positively and has been institunalize as a planned and periodic
practice. Some of the major programs concluded during the
health week include eye checkups, cardiac checks, Ergonomics
trainings and detailed sessions on Lifestyle related health issues.
HSE management system assessment was conducted by external
auditing body Bureau Veritas Certifications to understand the
compliance with the International standards. The Bangalore
facility is now an ISO 14001 and OHSAS 18001 certified. The
auditors appreciated the management commitment towards HSE,
the passion demonstrated by the team and the Risk assessment
methodology developed in house. HSE Implementation is now
currently underway at some of our other locations. To achieve
the policy objectives, Cross functional teams from Corporate
Quality, Human Resources, Corporate services and Satyam
Foundation came together and built collaborative framework
consisting of various processes and controls. Through the HSE
initiative we have been able to demonstrate that Satyam is a
responsible corporate citizen, a good employer and a preferred
partner to engage in business with. The HSE systems have been
appreciated by many a clients and have also been a very
critical factor for having been considered as a preferred
partner by large clients in the recent past. Satyam is
committed to Stakeholder delight and through HSE we
envision to achieve associate delight by providing healthy
working conditions, investor delight by implementing
processes to optimize natural resource consumption and
bringing down operating costs, Customer delight by being a
responsible business partner aligning itself to cl ients
strategic objectives and achieve Societies delight by ensuring
that our business operations are environmentally friendly.
Our strong belief in our core value of Stakeholder delight
helps us in creat ing value and fac i l i tates Business
Transformation Together.
Satyam’s HSE PolicySatyam Computer Services Limited (SCSL) is committed to providing healthy and safe working conditions to all its associates andis focused on minimizing damage to the natural environment, wherever it operates. This will be accomplished through training,communication and performance measurement, thereby facilitating continual improvement.Satyam shall strive to conduct its business in compliance with Legal regulations and requirements and in line with interested partyconcerns. Satyam will systematically manage the occupational risks and environmental impact(s) identified and reported.
Provide and maintain a healthyworkplace and lifestyle
Provide and maintain safe equipment withappropriate safety training Facilitatearrangements for associate safety while working
Minimize damage to the environment andcomply with legal requirements Conductoperations through efficient use of resources
53
Indian GAAP Financial Statements
• Management’s discussion and analysis
• Auditors’ report
• Description of business and statement onsignificant accounting policies
• Balance Sheet
• Profit and Loss Account
• Schedules
• Cash Flow statement
• Balance sheet abstract and Company’s generalbusiness profile
• Statement pursuant to Section 212(e) of theCompanies Act, 1956 relating to subsidiarycompanies
• Statement pursuant to exemption received underSection 212(8) of the Companies Act, 1956relating to subsidiary companies
Sat_AR08_Final_Jul22_TP 2 Col.pmd 7/23/2008, 7:19 PM53
54
Management’s discussion and analysis
Industry structure and developments
Global IT services overview
Global IT services spending has been estimated to have aggregated to $467.0 billion in fiscal 2006. The global IT services spending
remained strong in fiscal 2007 with the estimated aggregate total of $495.0 billion a growth of 6% compared to 2006.
Satyam believes that the growth of global IT services spending is driven by the following factors and trends:
• Increased importance of IT to businesses. In today’s increasingly competitive business environment, companies have become
dependent on information technology not only to conduct day-to-day operations, but also as a strategic tool to enable them
change their business model, optimize their operations and enable new revenue growth. As information systems continually
become more complex with the use of multiple applications and rapidly changing technologies, companies are increasingly
turning to external IT service providers to develop and implement new technologies and integrate them with existing applications
in which they may have already made considerable investments.
• Impact of the Internet and other new technologies on business. Businesses are increasingly using the Internet to interact with
new and existing customers and create new revenue opportunities. Businesses conducted electronically over the Internet extend
beyond Internet-based applications to include packaged software tools, such as customer and supply chain management
software, that need to be integrated with a company’s enterprise systems. These initiatives are often large and difficult to manage
in-house and need to keep pace with constantly evolving business processes and technological innovations leading to demand
for IT services companies.
• Managing and upgrading existing systems. Managing and upgrading existing systems has become critical given the importance
of IT and related systems to new business initiatives. Internal IT departments often do not have the appropriate resources or
breadth of skills necessary to manage or upgrade existing systems. As a result, companies are increasingly looking to external
service providers to design, integrate, implement and maintain their applications based on new technologies.
• Increasing trend towards adoption of global delivery model. The increasing complexities and costs of IT services, together with
an increasing need for highly skilled technology professionals and tightening IT budgets for companies, are driving demand for
professional IT services companies who are able to provide a cost effective, high quality, comprehensive range of services using
the global delivery model. The model is enabling companies to increasingly outsource complex assignments and generate not
only cost savings in IT services but also greater efficiencies in their business processes. In addition, companies are increasingly
using the “utility computing” or “pay for what you use”, model for infrastructure, data- warehousing and IT system usage, which
is further fueling growth in infrastructure, network outsourcing and network management services.
Indian IT Services Industry Overview
India is considered to be the most favored destination for offshore IT service delivery. According to the National Association of
Software and Services Companies, or NASSCOM strategic review 2008, the export revenue generated from the software and service
industry (IT-BPO) in India was approximately $ 24 billion in fiscal 2006. In fiscal 2007, the export revenue increased by 31% to $31.8
billion. The projected export revenue for fiscal 2008 is approximately $40.8 billion and which is likely to increase to $60 billion by
the end of 2010. The key factors that are expected to contribute to this growth are:
• High quality delivery record. Indian companies have developed high quality delivery processes. As of December 2007, over 498
India-based centres had acquired quality certifications with 85 companies certified at SEI CMM level 5 – which was higher than
any other country. Level five is the highest level attainable under the SEI-CMM standards, which assess an organization’s quality
management system and systems engineering processes and methodologies.
• Large supply of English-speaking IT professionals. We believe that India ranks second only to the United States as the country
with the largest population of English-speaking IT professionals. According to the NASSCOM strategic review 2008, educational
institutes in India were expected to add approximately 500,000 technical personnel (Engineering degree/master’s degree in
computer applications) in fiscal 2008. Given the shortage of technical labour in the United States and other developed economies,
the availability of technically skilled personnel is proving to be a competitive advantage for Indian IT service companies.
• Significant cost advantage. We believe that the cost of employing IT professionals in India is significantly lower than in developed
countries such as the United States. The use of high quality, low cost resources provides a significant opportunity for companies
to realize cost savings by offshoring IT services to India.
• Evolving “beyond-cost” proposition. The Indian IT industry continues to explore means of delivering value beyond operational
cost savings. These beyond-cost benefits offer the potential to realize cost savings significantly higher than the traditional cost
advantages derived by offshoring the delivery of IT services.
Sat_AR08_Final_Jul22_TP 2 Col.pmd 7/23/2008, 7:19 PM54
55
Trends
The Indian IT services industry has been witnessing changes in customer demands and we believe that service providers who are
best able to adapt to these changes will succeed in the long run. Some key emerging industry trends are described below:
• Enhanced expectations. Increasingly, companies are expecting more value from their IT service providers than just the traditional
cost advantages derived by offshoring the delivery of IT services. Companies increasingly prefer service providers that can
provide strategic advice related to designing and increasing efficiencies of business processes and also assist in implementing
their recommendations. Also, service providers with strong industry expertise are favored over those who can only provide
strong technical skills.
• Large, multi-year, end-to-end contracts. Companies are increasingly looking for IT service providers that can provide end-to-end
solutions over a long period of time. In addition, companies, which have a presence across various geographies, need IT support
on a global scale and often seek a single service provider that can offer a comprehensive range of services on a long-term basis
across the world, and understand and integrate a wide spectrum of emerging technologies with existing systems.
• Relationships with customers’ key senior management. As outsourcing contracts increasingly gain strategic importance to
businesses, customers’ senior management teams have become more involved in outsourcing contract negotiation and monitoring.
As a result, IT service providers need to ensure that their senior account managers develop strong and lasting working
relationships with customers’ senior management.
• Performance measurement. Companies are increasingly demanding transparency in performance measurement. IT service
providers with their own well developed benchmarks, frameworks and models to measure performance or demonstrate potential
benefits are likely to have significant advantage over their competitors who offer more generic IT services.
• Increasing globalization of engineering and R&D. Companies are increasingly looking for IT applications not only to achieve
operational efficiencies but across the value chain, including the product development process. There is an increasing reliance on
technology for R&D and engineering which is evident by the incorporation of technology in end-products in sectors such as
telecom and automobile.
Business Process Outsourcing:
Outsourcing to India has provided companies with significant benefits over the arbitrage in labour costs - through business process
enhancements and improvements. Indian vendors are expanding their service offerings, enabling customers to deepen their
offshore engagements; the shift from low-end business processes to higher-value, a knowledge-based process is having a positive
impact on the overall industry growth. In spite of the rising elements of cost, Indian offshore operations provide cost savings of 40-
50 per cent; in spite of wage inflation averaging 10-15 per cent annually, companies are able to leverage declines in telecom and
other overhead costs, productivity gains and economies of scale to sustain the cost arbitrage.
India has already registered its mark on the globe in ITES-BPO sector.
There was steady growth across the key service categories of finance and accounting, customer interaction and human resource
administration. These three segments accounted for an estimated 89 per cent of the industry revenues.
According to a recent study by Forrester, IT spending and staff hiring by businesses and government agencies in India is growing
rapidly, at higher rates compared to their North American, European, and Asia Pacific counterparts.
Opportunities, Threats, Risks and Concerns
Satyam recognizes the need to accelerate our ability to connect more deeply with our customers to enable true transformation. One
way of achieving these objectives is through inorganic growth intervention. We have entered a definitive agreement with (i) Bridge
Strategy Group, a high-end, Chicago-based management consulting firm, (ii) S&V, a renowned, Belgium-based supply chain
management organization that ARC Advisory Group ranks among the world’s premier boutique SCM shops. And to better accommodate
our clients’ needs for knowledge process outsourcing, we also intend to acquire Caterpillar’s market research and customer
analytics operations, including its intellectual property. This acquisition will strengthen our longstanding relationship with a critical
customer and enable Satyam to offer MR&CA services to the global marketplace, thereby contributing to non-linear growth.
On the services front, the increasing portfolio of high value services led to strengthening of our dominance in Enterprise Business
Solutions. Satyam’s focus on Infrastructure Management Services would enable it to capitalize on the increasing demand in this
area. A recent study by the Yankee Group has revealed that with the high priority accorded to mitigating risk and reducing network
complexity by a large number of enterprises, managed services market is set to grow at a Compound Annual Growth Rate (CAGR)
of 8 percent from 2005 to 2008, exceeding US$ 25 billion by 2008.
The domestic IT market too is coming into its own and witnessing a high degree of merger and acquisitions activity, involving some
of the key players in the market. Increasing IT usage and adoption within the country is enhancing competitiveness of the Indian
economy and the user community. Indian businesses, that are using IT, as an enabler, are becoming increasingly competitive in the
global arena.
Sat_AR08_Final_Jul22_TP 2 Col.pmd 7/23/2008, 7:19 PM55
56
It is reassuring to note the enhanced business potential for integrated business solutions in the global market place and we are
hopeful that the growth momentum experienced in fiscal 2006 would continue.
The demand environment will continue to remain buoyant in fiscal 2007 due to increased IT spend by organizations as well as
greater acceptance of the global delivery model. To address the available opportunities, we are strengthening our business solutions
capability by hiring best-in-class associates from across the world, and are making a focused attempt at enhancing our competence
in new service areas that would be the drivers of growth going forward.
The next phase of evolution of the Indian IT-ITES industries will be led by innovation, which will pervade almost all aspects of these
segments. Companies will focus on innovation to create significant differentiators in the global markets. The Indian IT-ITES sectors
will build an eco-system for innovation in order to sustain its leadership in these domains as well as stave off competition from
emerging, alternate offshore outsourcing destinations. The latest NASSCOM-McKinsey Study 2005 indicates that India has the
potential to accelerate export growth and achieve an additional US$ 15-20 billion in revenues by 2010, provided its places its chips
on innovation.
The 2005 Appropriations Bill further precludes foreign companies from obtaining L-1 visas for employees with specialized
knowledge: (1) if such employees will be stationed primarily at the worksite of another company in the U.S. and the employee will
not be controlled and supervised by his employer, or (2) if the placement is essentially an arrangement to provide labour for hire
rather than in connection with the employee’s specialized knowledge. The U.S. Citizenship and Immigration Services or CIS has
also issued new guidelines to more closely verify the qualifying criteria to restrict the liberal usage of L-1 visas. Immigration laws
in the United States may also require us to meet certain levels of compensation and to comply with other legal requirements
including labour certifications as a condition to obtaining or maintaining work visas for our associates working on H1B in the
United States. The CIS announced on April 8, 2008 that it had received sufficient applications to fill up all 65,000 H-1B visas
that are available for the calendar year 2009.
Indian Rupee has depreciated by 2.20% (approx.) against US dollar during fiscal 2007. The exchange rate between the rupee and
the US dollar has changed substantially in recent years and may fluctuate in the future. Satyam has sought to reduce the effect of
exchange rate fluctuations on our operating results by entering into foreign exchange forward and options contracts. As of March
31, 2008, forward and options contracts outstanding amounted to Rs. 4,534.46 crores (Equivalent US$1,133.07 millions).
Outlook
The outlook for the fiscal year ending March 31, 2008 under Indian GAAP consolidated is as follows:
For fiscal 2008, income from services is expected to be between Rs. 7,793 crores and Rs. 7,916 crores, implying a growth rate of
20.0% to 22.0% over fiscal 2007 income of Rs. 6,485 crores. Earnings Per Share (EPS) for the fiscal 2008 is expected to be between
Rs. 25.32 and Rs. 25.73, implying a growth rate of 18.00% to 20.00% over fiscal 2007 EPS of Rs. 21.45.
Internal Control Systems and their Adequacy
The philosophy we have with regard to internal control systems and their adequacy has been formulation of effective systems and
their strict implementation to ensure that assets and interests of the Company are safeguarded; checks and balances are in place to
determine the accuracy and reliability of accounting data.
The internal audit, an independent appraisal function to examine and evaluate the adequacy and effectiveness of the internal control
system, appraises periodically about activities and audit findings to the Audit Committee.
Internal audit ensures that systems are designed and implemented with adequate internal controls commensurate with the size and
operations; transactions are executed and assets are safeguarded and deployed in accordance with the policies; existence of
adequacy of internal controls in all existing policies and procedures.
The Audit Committee was constituted as a sub-committee to the Board of Directors and it consists solely of independent directors.
The meetings of the committee are held periodically to review and recommend, inter alia, the quarterly, half yearly, nine months and
annual financial statements. The committee also holds discussions with statutory auditors, internal auditors and the Management
on matters pertaining to internal controls, auditing and financial reporting. The Committee reviews with the statutory auditors the
scope and results of the audit.
In particular, our efforts to comply with Section 404 of the Sarbanes-Oxley Act of 2002 and the related regulations regarding our
required assessment of our internal controls over financial reporting. We consistently assess the adequacy of our internal controls
over financial reporting, remediate any control deficiencies that may be identified, and validate through testing that our controls are
functioning as documented. While we do not anticipate any material weaknesses or significant deficiencies, our independent
auditors may be unable to issue unqualified attestation reports on management’s assessment on the operating effectiveness of our
internal controls over financial reporting.
Sat_AR08_Final_Jul22_TP 2 Col.pmd 7/23/2008, 7:19 PM56
57
Additionally, under revised corporate governance standards adopted by The Stock Exchange, Mumbai, or the BSE, and The National
Stock Exchange of India Limited, or the NSE, which we collectively refer to as the Indian Stock Exchanges, we have been required
to comply with additional standards from December 31, 2005. These standards include a certification by our chief executive officer
and chief financial officer that they have evaluated the effectiveness of our internal control systems and that they have disclosed to
our auditors and our audit committee any deficiencies in the design or operation of our internal controls of which they may become
aware, as well as any steps taken or proposed to resolve the deficiencies.
M/s. Price Waterhouse, Chartered Accountants, Hyderabad have been re-appointed as statutory auditors to audit financial statements
under Indian GAAP, US GAAP, and IFRS and conduct such tests and related procedures as they deem necessary in accordance with
generally accepted auditing principles. The reports of the statutory auditors based upon their audit of the financial statements, are
contained elsewhere in the Annual Report.
Financial performance
Share capital and reserves and surplus
During the year, we allotted 3,283,284 equity shares of Rs. 2 each fully paid up pursuant to exercise of stock options under various
stock option plans of the Company. Consequently, the total outstanding equity shares increased to 670,479,293 as at March 31, 2008
from 667,196,009 as at March 31, 2007 and the paid up share capital increased to Rs. 134.10 crores from Rs. 133.34 crores and
the share premium account increased to Rs. 1,368.57 crores from Rs. 1,321.18 crores during the same periods respectively. During
the year, Satyam recorded a net profit after tax of Rs.1,715.74 crores and Rs. 171.60 crores was transferred to general reserve
account.
Secured loans
The secured loans, comprising of vehicle loans, increased to Rs. 23.67 crores as of March 31, 2008 from Rs. 13.79 crores as of
March 31, 2007.
Fixed assets
To keep pace with the expansion plans of the Company, world class infrastructure facilities are being developed at various locations.
The capital expenditure during fiscal 2008 amounted to Rs. 383.85 crores as compared to Rs. 345.82 crores in fiscal 2007. This
primarily comprised of expenditure on plant and machinery including computers and software which amounted to Rs. 136.15 crores
during fiscal 2008.
Investments
Investments increased by Rs. 292.65 crores to Rs. 493.80 crores in fiscal 2008 from Rs. 201.15 crores in fiscal 2007.
On August 14, 2007, the Company purchased 4,816,750 equity shares of Satyam BPO from Olympus BPO Holdings Ltd for Rs.
141.81 crores (equivalent US$34.88 million) and also subscribed to further 8,055,000 equity shares of Satyam BPO of Rs. 10 each
at a premium of Rs. 60 per share aggregating Rs. 56.39 crores.
On December 31, 2007, the Company purchased 1,605,617 equity shares of Satyam BPO from Intel Capital (Cayman) Corporation
for Rs.45.94 crores (equivalent US$11.62 million).
During the year, the Company purchased 358,952 equity shares vested and exercised by the employees of Satyam BPO under its
Employee Stock Option plan for a consideration of Rs. 10.55 crores
On June 29, 2007, the Company entered into an amendment agreement with the selling shareholders of Citisoft providing for an early
exit of the selling shareholders. As per the amendment agreement, an exit consideration of Rs. 14.25 crores (equivalent GBP 1.74
million) and payment towards EBT of Rs. 0.65 crores (equivalent GBP 0.08 million) has been paid in July 2007 upon selling
shareholders agreeing for removal of provisions of deferred consideration, maximum earn-out consideration and a portion of
payments towards EBT.
On July 19 2007, the Company entered into an amendment agreement with the selling shareholders of Knowledge Dynamics Pte. Ltd
on agreeing to the terms of the agreement including removal of provisions relating to earn out consideration. As per the amendment
agreement, an exit consideration of Rs. 2.97 crores (equivalent SGD 1.11 million) has been paid by the company in July 2007. In
addition to the exit consideration the company agreed to make a deferred payment of Rs. 0.99 crores (equivalent SGD 0.37 million)
payable by May 15, 2008. The exit consideration and deferred payment has been recognised as cost of investment by the Company.
On October 23, 2007, the Company acquired 100% of the shares of NITOR Global Solutions Ltd, United Kingdom (“Nitor”), a
Company specialized in the Infrastructure Management Services (IMS) space. The total consideration for this acquisition was
approximately Rs.22.40 crores (equivalent GBP 2.76 million) including a performance-based payment of up to Rs. 10.34 crores
(equivalent GBP 1.3 million) over two years conditional upon specified revenue and profit targets being met. The Company has paid
initial consideration of Rs.12.06 crores (equivalent GBP 1.46 million) on January 04, 2008.
Sat_AR08_Final_Jul22_TP 2 Col.pmd 7/23/2008, 7:19 PM57
58
During the year the Company made additional investments in wholly owned subsidiaries amounting to Rs. 9.27 crores, Rs.1.05
crores and Rs.7.94 crores in Satyam Computer Services (Shanghai) Co Limited, China, Satyam Computer Services (Egypt) S.A.E and
Satyam Computer Services (Nanjing) Co. Limited respectively.
Deferred tax assets
We account for the deferred tax in compliance with the Accounting Standard 22 issued by the Institute of Chartered Accountants of
India. Deferred tax assets and deferred tax liabilities are recognized for the future tax consequences attributable to differences
between financial statements carrying amounts of existing assets and liabilities and their respective tax bases. The deferred tax
assets (net) amounted Rs. 87.65 crores as of March 31, 2008, as compared to Rs. 43.36 crores as of March 31, 2007. The deferred
tax assets were primarily in respect of provision for debtors, advances and retirement benefits whereas deferred tax liabilities were
in respect of fixed assets.
Net current assets
Net current assets comprised primarily of cash and bank balances, sundry debtors, loans and advances, interest accrued on fixed
deposits, current liabilities and provisions. The net current assets increased to Rs. 5,916.75 crores as of March 31, 2008 from Rs.
4,918.64 crores as of March 31, 2007, primarily on account of increase in the cash and bank balances by Rs. 501.86 crores,
increase in debtors by Rs. 573.55 crores, increase in interest accrued on fixed deposits by Rs.207.62 crores This increase in interest
income was primarily due to accrual of interest for full year in fiscal 2008 as against accrual for four months (since December 2006)
in fiscal 2007 and loans and advances by Rs. 138.45 crores. Debtors increased primarily as a result of an increase in revenues and
increase in collection period. Loans and advances increased primarily as a result of increase in advances to suppliers by Rs. 52.49
crores, increase in rental deposits by Rs. 54.89 crores and salary advances by Rs 9.16 crores. These increases in current assets were
offset by increase in current liabilities and provisions by Rs. 293.55 crores and Rs. 129.83 crores respectively. Current liabilities
increased primarily on account of increase in salaries payable and accruals for sub-contracting charges. Provisions increased
primarily on account of increase in provision for gratuity and leave encashment and provision for taxation by Rs. 70.32 crores and
Rs. 58.51 crores respectively.
During the year, net cash flow from operating activities amounted to Rs. 1,412.92 crores, net cash flow used in investing activities
amounted to Rs. 641.22 crores including investment in subsidiary companies of Rs. 292.65 crores. Net cash flow provided by
financing activities amounted to Rs. 227.29 crores. Exchange differences on translation of foreign currency cash and cash equivalents
amounted to Rs. 42.05 crores. Due to the foregoing, cash and cash equivalents increased by Rs. 501.86 crores to Rs.1,153.27 crores
as of March 31, 2008 from Rs. 651.41 crores as of March 31, 2007.
Total income
Total income comprised of income from IT services, a majority of which is from exports, and other income. Total income increased
to Rs. 8,394.48 crores in fiscal 2008 from Rs. 6,410.08 crores in fiscal 2007, signifying an increase of 30.96% primarily on account
of increase in export services revenues.
Income from IT services were Rs. 8,137.28 crores and Rs. 6,228.47 crores in fiscal 2008 and 2007 respectively. Other income
amounted to Rs. 257.20 crores and Rs. 181.61 crores in fiscal 2008 and 2007 respectively.
IT services revenues
Revenues from IT services increased by 30.65 % to Rs. 8,137.28 crores for the year ended March 31, 2008 from Rs. 6,228.47 crores
for the year ended March 31, 2007.
During the year, we added 130 new customers including 12 Fortune Global 500 and US 500 companies. There was healthy addition
in the mature verticals (Manufacturing, Banking and finance, TIMES and Insurance) as well as nascent verticals (Healthcare, Retail
and Transportation). The expanding global nature of our business has been truly reflected in the customer additions of current year
with significant additions in Europe and Asia Pacific regions. Our ability to identify and nurture new business practices resulted in
creating a footprint in chosen areas thus assisting the process of customer acquisition. Our dominance in Enterprise Business
Solutions enhanced our ability to compete successfully with global players resulting in significant customer additions.
On the services front, the increasing portfolio of high value services led to strengthening of our dominance in Enterprise Business
Solutions. Our focus on Infrastructure Management Services would enable us capitalize on the increasing demand in this area.
The software revenue mix based on various parameters is as follows:
Sat_AR08_Final_Jul22_TP 2 Col.pmd 7/23/2008, 7:19 PM58
59
Revenues based on offshore and onsite/offsite
Rs. in crores
Location Year ended March 31,
2008 2007
Offshore 4,218.37 51.84% 3,030.77 48.66%
Onsite / Offsite 3,918.91 48.16% 3,197.70 51.34%
Total 8,137.28 100.00% 6,228.47 100.00%
We provide our IT services through a combination of (i) offshore centers located throughout India, (ii) teams working onsite at a
customer’s location, (iii) nearshore centers located in Canada, China and Hungary to serve U.S.-based, Asia Pacific based and
Europe based customers, respectively and (iv) offsite centers in locations including Australia, Brazil, Canada, China, Germany,
Hungary, Japan, Korea, Malaysia, Singapore, South Africa, Thailand, the United Arab Emirates, the United Kingdom and the United
States. Offshore IT services’ revenues consist of revenues earned both from IT services work conducted at our offshore centers in
India as well as onsite work conducted at customers’ premises which is related to offshore work. Offshore IT services’ revenues do
not include revenues from our offsite or nearshore centers located outside of India or revenues from onsite work which is not related
to any offshore work. These latter revenues are included in onsite/offsite revenues.
We generally charge higher rates and incur higher compensation expenses for work performed by our onsite teams at our customer’s
premises or at our offsite and nearshore centers, as compared to work performed at our offshore centers in India. Services performed
by our onsite teams or at our offsite centers typically generate higher revenues per capita, but at a lower gross margin, than the same
amount of services performed at our offshore centers in India.
Revenues based on geography
We have experienced increasing volumes of business from customers located in North America Europe, attributable to both new
customers and additional business from existing customers. We expect that most of our revenues will be from North America
followed by Europe in fiscal 2009.
The following table gives the composition of our IT services revenues based on the location customers for the years indicated:
Rs. in crores
Region Year ended March 31,
2008 2007
North America 4,911.09 60.35% 4,029.50 64.69%
Europe 1,674.72 20.58% 1,163.13 18.67%
Asia Pacific 1,101.10 13.53% 661.93 10.63%
India 248.10 3.05% 267.41 4.29%
Rest of the World 202.27 2.49% 106.50 1.71%
Total 8,137.28 100.00% 6,228.47 100.00%
Revenues by technology
We provide a comprehensive range of IT services, including application development and maintenance, consulting and enterprise
business solutions, extended engineering solutions, and infrastructure management services. We seek to be the single service
provider capable of servicing all of our customers’ IT requirements. Our consulting and enterprise business solutions includes
services in the area of enterprise resource planning, customer relationship management and supply chain management, data
warehousing and business intelligence, knowledge management, document management and enterprise application integration.
The following table presents our IT services revenues by type of service offerings:
Rs. in crores
Technology Year ended March 31,
2008 2007
Software Development and Maintenance 3,582.03 44.02% 2,956.03 47.46%
Consulting and Enterprise Business Solutions 3,651.20 44.87% 2,579.21 41.41%
Extended Engineering Solutions 553.34 6.80% 409.83 6.58%
Infrastructure Management Services 350.72 4.31% 283.40 4.55%
Total 8,137.28 100.00% 6,228.47 100.00%
Sat_AR08_Final_Jul22_TP 2 Col.pmd 7/23/2008, 7:19 PM59
60
Revenues by contract type
Our IT services are provided on a time-and-material basis or on a fixed-price basis. Revenues from IT services provided on a time-
and-material basis are recognized in the period that the services are performed. Revenues from IT services provided on a fixed-price
basis are recognized under the percentage of completion method of accounting and are recorded when we can reasonably estimate
the time period to complete the work. The percentage of completion estimates are subject to periodic revisions and the cumulative
impact of any revision in the estimates of the percentage of completion is reflected in the period in which the changes become known
to us. Although we have revised our project completion estimates from time to time, such revisions have not materially affected our
reported revenues to date. In recent years, we have experienced some pricing pressure from our customers, which has had a
negative impact on margins. In response to current market trends, we are considering the viability of introducing performance-
based or variable-pricing contracts. In the near term, we expect that revenue from fixed-price contracts will continue to increase as
current market trends indicate a customer preference towards fixed- price contracts.
The following table presents our IT services revenues by type of contract for the years indicated:
Rs. in crores
Nature of Contract Year ended March 31,
2008 2007
Time-and-Material 5,504.06 67.64% 3,781.30 60.71%
Fixed-Bid 2,633.22 32.36% 2,447.17 39.29%
Total 8,137.28 100.00% 6,228.47 100.00%
Even though in percentage terms there has been decline in fixed-price contracts in fiscal 2008 as compared with fiscal 2007, we
expect that revenue from fixed-price contracts will increase in the long term.
Other Income
Other income primarily comprises of interest on deposits and gain or loss on exchange fluctuations. Other income increased by
41.62% to Rs. 257.20 crores in fiscal 2008 from Rs. 181.61 crores in fiscal 2007 increase in interest accrued on fixed deposits by
Rs.207.62 crores This increase in interest income was primarily due to accrual of interest for full year in fiscal 2008 as against
accrual for four months (since December 2006) in fiscal 2007.
Majority of our revenues are generated in U.S. dollars and a significant portion of our expenses, including personnel costs as well
as capital and operating expenditures, will continue to be denominated in Indian rupees. Consequently, our results of operations
have been affected to the extent the rupee appreciates/depreciates against the foreign currencies. During the year ended March 31,
2008, the average rupee exchange rate against the US dollar appreciated by 8.56% (approximately) and the year end rupee
exchange rate against the US dollar appreciated by 8.56% (approximately). As a result of rupee appreciation/depreciation against
the major foreign currencies (viz., USD, GBP, Euro, AUD, Yen, etc.,) we had a foreign exchange loss (net) of Rs. 20.67 crores during
the year ended March 31, 2008, as compared to gain (net) of Rs. 13.54 crores during the year ended March 31, 2007. We enter into
foreign exchange forward and options contracts to mitigate the risk of changes in foreign exchange rates on cash flows denominated
in certain foreign currencies. During the year, we recorded a gain of Rs. 38.27 crores on the forward and options contracts as
compared to a gain of Rs. 26.64 crores in the previous year.
Personnel Costs
Personnel costs increased by 36.14% to Rs. 5,045.54 crores in fiscal 2008 from Rs. 3,706.04 crores in fiscal 2007. This increase in
personnel costs was primarily on account of: (1) increase in the total number of technical associates by 9,467 to 43,279 in fiscal
2008 from 33,812 in fiscal 2007 and increase in non-technical associates by 832 to 2,690 in fiscal 2008 from 1,858 associates in
fiscal 2007; (2) increase in number of onsite technical associates by 2,567 to 9,391 in fiscal 2008 from 6,824 in fiscal 2007 for which
we pay a higher compensation; (3) salary incentives amounting to Rs. 524.01 crores were given in fiscal 2008 as compared to Rs.
251.31 crores in fiscal 2007. Salary incentives increased primarily due to staggered cash rewards by the company in fiscal 2008.
As a percentage of revenues, personnel costs increased to 62.01% in fiscal 2008 from 59.50% in fiscal 2007.
Operating and administrative expenses
Operating and administrative expenses increased by 27.17% to Rs. 1,263.20 crores in fiscal 2008 from Rs. 993.31 crores in fiscal
2007. This increase was primarily due to increase in travelling expenses, legal and professional, rent, communication, repairs and
maintenance and other expenses. Travelling expenses increased by 25.35% to Rs. 460.76 crores or 5.66% of revenues in fiscal 2008
from Rs. 367.57 crores or 5.90% of revenues in fiscal 2007. Traveling expenses increased primarily due to increase in travels by our
associates. Legal and professional charges increased by 29.90% to Rs. 181.19 crores or 2.23% of revenues in fiscal 2008 from Rs.
139.48 crores or 2.24% of revenues in fiscal 2007. Rental expenses increased by 43.07% to Rs. 126.00 crores or 1.55% of revenues
in fiscal 2008 from Rs. 88.07 crores or 1.41% of revenues in fiscal 2007. Rental expenses increased primarily on account of
additional premises taken on rent at offshore and overseas locations. Communication expenses increased by 26.74% to Rs. 81.52
Sat_AR08_Final_Jul22_TP 2 Col.pmd 7/23/2008, 7:19 PM60
61
crores or 1.00% of revenues in fiscal 2008 from Rs. 64.32 crores or 1.03% of revenues in fiscal 2007. Repairs and maintenance
increased by 22.77% to Rs. 54.20 crores or 0.67% of revenues in fiscal 2008 from Rs. 44.14 crores or 0.71% of revenues in fiscal
2007. Other expenses comprised primarily of power and fuel, rates and taxes, marketing expenses, training and development,
advertising and insurance. Other expenses increased by 24.09% to Rs. 359.54 crores or 4.42% of revenues in fiscal 2008 from Rs.
289.73 crores or 4.65% of revenues in fiscal 2007. As a percentage of revenues, total operating and administrative expenses
decreased to 15.52% for the year ended March 31, 2008 from 15.95% for the year ended March 31, 2007. This reduction in operating
and administration expenses expressed as percentage of revenues was due to cost reduction measures.
Depreciation
Depreciation expense increased by 8.05% to Rs. 137.94 crores in fiscal 2008 from Rs. 129.89 crores in fiscal 2007. The increase in
depreciation was primarily due to increase in depreciation on furniture and fixtures by Rs 2.09 crores to Rs.20.34 crores from
Rs.18.25 crores, on buildings by Rs. 0.51 crores to Rs.4.11 crores from Rs.3.60 crores and vehicles by Rs. 2.43 crores to Rs.9.04
crores in fiscal 2008 from Rs.6.61 crores in fiscal 2007.
Provision for taxation
We are liable to pay income-tax in countries where we are providing software services. Provision for current taxation increased by
51.57% to Rs. 254.86 crores in fiscal 2008 from Rs. 168.15 crores in fiscal 2007. This increase of Rs. 86.71 crores was primarily on
account of expiry of tax exemption benefit for one STP unit each in Hyderabad, Chennai, Pune and Bhubaneswar at the beginning
of fiscal 2008 and due to increase in revenue. Deferred tax credit amounting to Rs. 44.28 crores was recognised in fiscal 2008 as
against deferred tax credit of Rs.30.21 crores in fiscal 2007. Deferred tax credit was primarily on account of increase in provision
for gratuity and leave encashment in fiscal 2008. Fringe benefit tax expense for fiscal 2008 amounted to Rs. 15.54 crores as
compared to Rs 12.06 crores in fiscal 2007.
Dividend
We declared a dividend of 175% for fiscal 2008 (including interim dividend of 50%) as against 175% for fiscal 2007.
Development in Human Resources
For material developments in Human resources, please refer to directors’ report.
Sat_AR08_Final_Jul22_TP 2 Col.pmd 7/23/2008, 7:19 PM61
62
1. We have audited the attached Balance Sheet of Satyam
Computer Services Limited (the Company), as at March 31,
2008, and the related Profit and Loss Account and Cash
Flow Statement for the year ended on that date annexed
thereto, which we have signed under reference to this report.
These financial statements are the responsibility of the
Company’s management. Our responsibility is to express
an opinion on these financial statements based on our audit.
2. We conducted our audit in accordance with the auditing
standards generally accepted in India. Those Standards
require that we plan and perform the audit to obtain
reasonable assurance about whether the financial
statements are free of material misstatement. An audit
includes examining, on a test basis, evidence supporting
the amounts and disclosures in the financial statements.
An audit also includes assessing the accounting principles
used and significant estimates made by management, as
well as evaluating the overall financial statement
presentation. We believe that our audit provides a
reasonable basis for our opinion.
3. As required by the Companies (Auditors’ Report) Order,
2003, as amended by the Companies (Auditor’s Report)
(Amendment) Order, 2004, issued by the Central Government
of India in terms of sub-section (4A) of Section 227 of ‘The
Companies Act, 1956’ of India (‘the Act’) and on the basis
of such checks of the books and records of the Company as
we considered appropriate and according to the information
and explanations given to us, we give in the Annexure a
statement on the matters specified in paragraphs 4 and 5 of
the said Order.
4. Further to our comments in the Annexure referred to in
paragraph 3 above, we report that:
(a) We have obtained all the information and
explanations, which to the best of our knowledge and
belief were necessary for the purposes of our audit;
(b) In our opinion, proper books of account as required
by law have been kept by the Company so far as
appears from our examination of those books;
Auditors’ Report to the Members of Satyam Computer Services Limited
(c) The Balance Sheet, Profit and Loss Account and Cash
Flow Statement dealt with by this report are in
agreement with the books of account;
(d) In our opinion, the Balance Sheet, Profit and Loss
Account and Cash Flow Statement dealt with by this
report comply with the accounting standards referred
to in sub-section (3C) of section 211 of the Act;
(e) On the basis of written representations received from
the directors, as on March 31, 2008 and taken on
record by the Board of Directors, none of the directors
is disqualified as on March 31, 2008 from being
appointed as a director in terms of clause (g) of sub-
section (1) of section 274 of the Act;
(f) In our opinion and to the best of our information and
according to the explanations given to us, the said
financial statements together with the notes thereon
and attached thereto give in the prescribed manner
the information required by the Act and give a true
and fair view in conformity with the accounting
principles generally accepted in India:
(i) in the case of the Balance Sheet, of the state of
affairs of the Company as at March 31, 2008;
(ii) in the case of the Profit and Loss Account, of the
profit for the year ended on that date; and
(iii) in the case of the Cash Flow Statement, of the
cash flows for the year ended on that date.
Srinivas Talluri
Partner
Membership No. 29864
for and on behalf of
Place : Hyderabad Price Waterhouse
Date : April 21, 2008 Chartered Accountants
Sat_AR08_Final_Jul22_TP 2 Col.pmd 7/23/2008, 7:19 PM62
63
[Referred to in paragraph 3 of the Auditors’ Report of even date
to the members of Satyam Computer Services Limited on the
financial statements as at and for the year ended March 31,
2008]
1. (a) The company is maintaining proper records showing
full particulars including quantitative details and
situation of fixed assets.
(b) The fixed assets are physically verified by the
management according to a phased programme
designed to cover all the items over a period of three
years, which in our opinion, is reasonable having
regard to the size of the company and the nature of its
assets. Pursuant to the programme, a portion of the
fixed assets has been physically verified by the
management during the year and no material
discrepancies between the book records and the
physical inventory have been noticed.
(c) In our opinion and according to the information and
explanations given to us, a substantial part of fixed
assets has not been disposed of by the company during
the year.
2. The company has not granted/taken any loans, secured or
unsecured, to/from companies, firms or other parties covered
in the register maintained under Section 301 of the Act.
3. In our opinion and according to the information and
explanations given to us, having regard to the explanation
that certain items purchased are of special nature for which
suitable alternative sources do not exist for obtaining
comparative quotations, there is an adequate internal
control system commensurate with the size of the company
and the nature of its business for the purchase of fixed
assets and for the sale of services. The activities of the
company do not involve purchase of inventory and sale of
goods. Further, on the basis of our examination of the books
and records of the company, and according to the
information and explanations given to us, we have neither
come across nor have been informed of any continuing
failure to correct major weaknesses in the aforesaid internal
control system.
4. According to the information and explanations given to us,
there have been no contracts or arrangements referred to in
Section 301 of the Act during the year to be entered in the
register required to be maintained under that section.
Accordingly, commenting on transactions made in
pursuance of such contracts or arrangements does not arise.
5. The company has not accepted any deposits from the public
within the meaning of Sections 58A and 58AA of the Act
and the rules framed there under.
6. In our opinion, the company has an internal audit system
commensurate with its size and nature of its business.
7. (a) According to the information and explanations given
to us and the records of the company examined by us,
in our opinion, the company is generally regular in
depositing the undisputed statutory dues including
provident fund, investor education and protection
fund, employees’ state insurance, income-tax, sales-
tax, wealth tax, service tax, customs duty and other
material statutory dues as applicable with the
appropriate authorities. According to the information
and explanations given to us and the records of the
company examined by us, excise duty and cess are
not applicable to the company for the current year.
(b) According to the information and explanations given
to us and the records of the company examined by us,
the particulars of dues of Income Tax as at March 31,
2008 which have not been deposited on account of
dispute, are as follows - ,
According to the information and explanations given to us and
the records of the company examined by us, there are no dues of
Sales Tax, wealth tax, service tax, customs duty which have not
been deposited on account of any dispute. According to the
information and explanations given to us and the records of the
company examined by us, excise duty and cess are not applicable
to the company for the current year.
Annexure to the Auditors’ Report
Name of the statute Nature of dues Amount (Rs.) Period to which the Forum where the dispute is
amount relates pending
Income Tax Tax and Interest on 13,35,05,579 2002-03 The
Act, 1961 disallowance of loss Commissioner
in one of the STP’s of Income Tax
and disallowance of (Appeals)-I,
excess claim U/s Hyderabad
Section 10A.
Sat_AR08_Final_Jul22_TP 2 Col.pmd 7/23/2008, 7:19 PM63
64
8. The company has no accumulated losses as at March 31,
2008 and it has not incurred any cash losses in the financial
year ended on that date or in the immediately preceding
financial year.
9. According to the records of the company examined by us
and the information and explanation given to us, the
company has not defaulted in repayment of dues to any
financial institution or bank or debenture holders as at the
balance sheet date.
10. The company has not granted any loans and advances on
the basis of security by way of pledge of shares, debentures
and other securities.
11. In our opinion, the company is not a dealer or trader in
shares, securities, debentures and other investments.
12. In our opinion and according to the information and
explanations given to us, the terms and conditions of the
guarantees given by the company, for loans taken by others
from banks or financial institutions during the year, are not
prejudicial to the interest of the company
13. The company has not obtained any term loans.
14. On the basis of an overall examination of the balance sheet
of the company, in our opinion and according to the
information and explanations given to us, there are no
funds raised on a short-term basis which have been used
for long-term investment.
15. The company has not made any preferential allotment of
shares to parties and companies covered in the register
maintained under Section 301 of the Act during the year.
16. The company has not raised any money by public issues
during the year.
17. During the course of our examination of the books and
records of the company, carried out in accordance with the
generally accepted auditing practices in India, and according
to the information and explanations given to us, we have
neither come across any instance of fraud on or by the
company, noticed or reported during the year, nor have we
been informed of such case by the management.
18. The other clauses (ii), (iii) (b), (iii) (c), (iii) (d), (iii) (f), (iii)
(g), (viii), (xiii), and (xix) of paragraph 4 of the Companies
(Auditor’s Report) Order 2003, as amended by the Companies
(Auditor’s Report) (Amendment) Order, 2004 are not
applicable in the case of the company for the current year,
since in our opinion there is no matter which arises to be
reported in the aforesaid order.
Srinivas Talluri
Partner
Membership No. 29864
for and on behalf of
Place : Hyderabad Price Waterhouse
Date : April 21, 2008 Chartered Accountants
Sat_AR08_Final_Jul22_TP 2 Col.pmd 7/23/2008, 7:19 PM64
65
Description of Business
Satyam Computer Services Limited is an information technology (“IT”) services provider that uses a global infrastructure to deliver
value-added services to its customers, to address IT needs in specific industries and to facilitate electronic business, or eBusiness,
initiatives. The Company was incorporated on June 24, 1987 in Hyderabad, Andhra Pradesh, India. The range of services offered by
it, either on a “time and material” basis or “fixed price”, includes consulting, systems design, software development, system integration
and application maintenance. The Company offers a comprehensive range of IT services, including application development and
maintenance, consulting and enterprise business solutions, extended engineering solutions and infrastructure management services.
Satyam Computer Services has established a diversified base of corporate customers in a wide range of industries including insurance,
banking and financial services, manufacturing, telecommunications, transportation and engineering services.
Statement on Significant Accounting Policies
a) Basis of Presentation
The financial statements of the Company are prepared under historical cost convention in accordance with the Generally Accepted
Accounting Principles (GAAP) applicable in India and the provisions of the Indian Companies Act, 1956.
b) Use of Estimates
The preparation of the financial statements in conformity with the GAAP requires that the management makes estimates and
assumptions that affect the reported amounts of assets and liabilities, disclosure of contingent liabilities as at the date of the
financial statements, and the reported amounts of revenue and expenses during the reported period/year. Actual results could
differ from those estimates.
c) Revenue Recognition
Revenue from professional services consist primarily of revenue earned from services performed on a “time and material” basis.
The related revenue is recognized as and when the services are performe The Company also performs time bound fixed-price
engagements, under which revenue is recognized using the percentage of completion method of accounting. The cumulative
impact of any revision in estimates of the percentage of work completed is reflected in the year in which the change becomes
known. Provisions for estimated losses on such engagements are made during the period/year in which a loss becomes probable
and can be reasonably estimated.
Amounts received or billed in advance of services performed are recorded as advance from customers/unearned revenue.
Unbilled revenue, included in debtors, represents amounts recognized based on services performed in advance of billing in
accordance with contract terms.
d) Fixed Assets
Fixed assets are stated at actual cost less accumulated depreciation. The actual cost capitalized includes material cost, freight,
installation cost, duties and taxes, finance charges and other incidental expenses incurred during the construction/installation
stage.
Depreciation on fixed assets is computed on the straight line method over their estimated useful lives at the rates which are higher
than the rates prescribed under Schedule XIV of the Companies Act, 1956. Individual assets acquired for less than Rs.5,000 are
entirely depreciated in the period/year of acquisition.
The cost of and the accumulated depreciation of fixed assets sold, retired or otherwise disposed off are removed from the stated
values and the resulting gains and losses are included in the profit and loss account.
Costs of application software for internal use are generally charged to revenue as incurred due to its estimated useful lives being
relatively short, usually less than one year.
Sat_AR08_Final_Jul22_TP 2 Col.pmd 7/23/2008, 7:19 PM65
66
The estimated useful lives are as follows:
Buildings 28 years
Computers 2 years
Plant and Machinery (Other than Computers) 5 years
Software – used in Development for Projects 3 years
Office Equipment 5 years
Furniture, Fixtures and Interiors 5 years
Vehicles 5 years
Capital work in progress
Assets under installation or under construction as at the Balance sheet date are shown as Capital work in progress. Advances
paid towards acquisition of assets are also included under Capital work in progress.
e) Investments
Investments are classified into current investments and long-term investments. Current investments are carried at the lower of
cost and market value. Any reduction in carrying amount and any reversals of such reductions are charged or credited to the profit
and loss account. Long-term investments are carried at cost less provision made to recognize any decline, other than temporary,
in the value of such investments.
f) Foreign Currency Translation
Transactions in foreign currency are recorded at exchange rate prevailing on the date of transaction. Monetary assets and
liabilities denominated in foreign currency are translated at the rate of exchange at the balance sheet date and resultant gain or
loss is recognized in the profit and loss account.
Non-monetary assets and liabilities are translated at the rate prevailing on the date of transaction.
The operations of foreign branches of the company are of integral in nature and the financial statements of these branches are
translated using the same principles and procedures as those of head office.
Gain or loss on forward exchange contract is computed by multiplying the foreign currency amount of the forward exchange
contract by the difference between the forward rate available at the reporting date for the remaining maturity of the contract and
the contracted forward rate (or the forward rate last used to measure a gain or loss on that contract for an earlier period), is
recognized in the profit and loss account of the period/year.
Gain/Loss on settlement of transaction arising on cancellation or renewal of a forward exchange contract is recognized as income
or as expense of the period / year.
Pursuant to ICAI Announcement “Accounting for Derivatives” on the early adoption of Accounting Standard AS 30 “Financial
Instruments: Recognisation and Measurement”, the Company has early adopted the standard for the year under review, to the
extent that the adoption does not conflict with existing mandatory accounting standards and other authoritative pronouncements,
Company law and other regulatory requirements.
g) Employee Benefits
Contributions to defined Schemes such as Provident Fund, Employee State Insurance Scheme and Superannuation are charged as
incurred on accrual basis. The Company also provides for gratuity and leave encashment in accordance with the requirements of
revised Accounting Standard – 15 “Employee Benefits” based on actuarial valuation carried out as at the balance sheet date.
h) Taxes on Income
Tax expense for the year comprises of current tax and deferred tax. Current taxes are measured at the amounts expected to be paid
using the applicable tax rates and tax laws. Deferred tax assets and liabilities are measured using tax rates and tax laws that
have been enacted or substantively enacted by the balance sheet date. The effect on deferred tax assets and liabilities of a change
in tax rates is recognized in the profit and loss account in the period / year of change. Deferred tax assets and deferred tax
liabilities are recognized for the future tax consequences attributable to differences between the financial statements carrying
amounts of existing assets and liabilities and their respective tax bases and operating loss carry forwards.
i) Earnings per Share
The earnings considered in ascertaining the Company’s Earnings Per Share (EPS) comprises the net profit after tax (and includes
the post tax effect of any extra ordinary items). The number of shares used in computing Basic EPS is the weighted average
number of shares outstanding during the period / year. The number of shares used in computing Diluted EPS comprises of
weighted average shares considered for deriving Basic EPS, and also the weighted average number of equity shares which could
have been issued on the conversion of all dilutive potential equity shares. Dilutive potential equity shares are deemed converted
as of the beginning of the period / year, unless they have been issued at a later date. The diluted potential equity shares have been
Sat_AR08_Final_Jul22_TP 2 Col.pmd 7/23/2008, 7:19 PM66
67
adjusted for the proceeds receivable had the shares been actually issued at fair value (i.e. average market value of the
outstanding shares). The number of shares and potentially dilutive shares are adjusted for share splits/reverse share splits and
bonus shares, as appropriate.
j) Associate Stock Option Scheme
Stock options granted to the associates under the stock option schemes established after June 19, 1999 are evaluated as per the
accounting treatment prescribed by Employee Stock Option Scheme and Employee Stock Purchase Scheme Guidelines, 1999
issued by Securities and Exchange Board of India. Accordingly the excess of market value of the stock options as on the date of
grant over the exercise price of the options is recognized as deferred employee compensation and is charged to profit and loss
account on graded vesting basis over the vesting period of the options. The employee stock option outstanding is shown under
Reserves and Surplus.
k) Research and Development
Revenue expenditure incurred on research and development is charged to revenue in the year/period in which it is incurred. Assets
used for research and development activities are included in fixed assets.
Sat_AR08_Final_Jul22_TP 2 Col.pmd 7/23/2008, 7:19 PM67
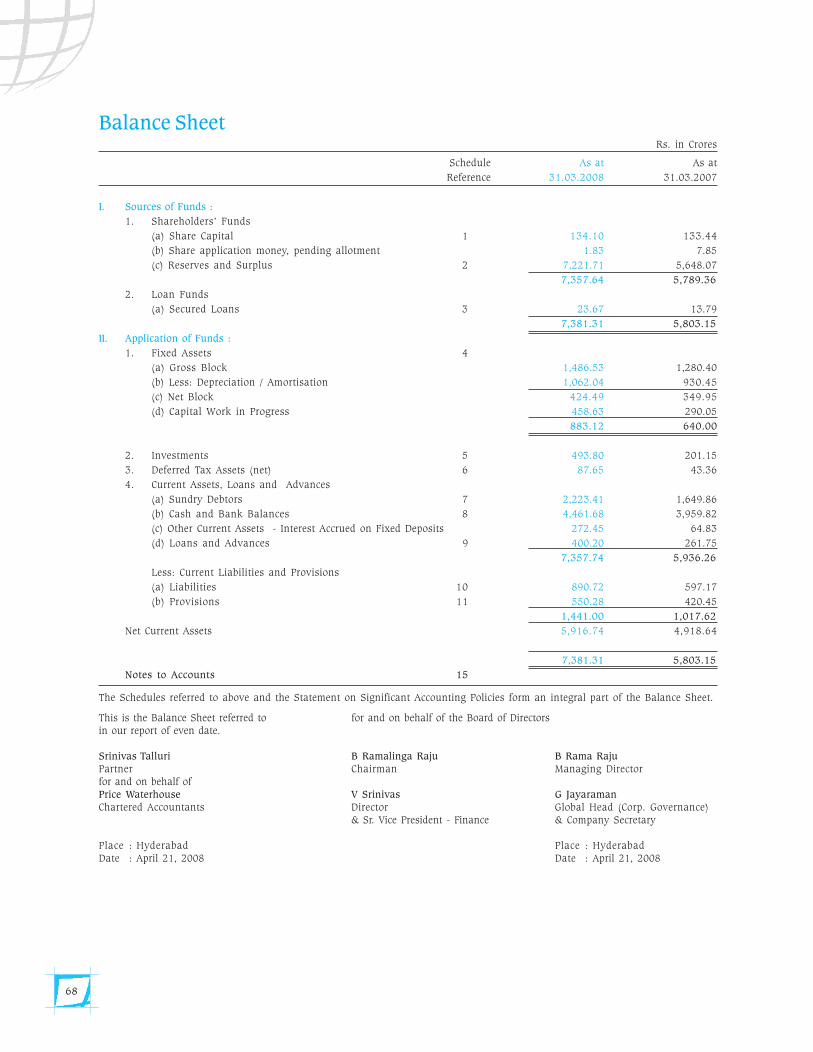
68
Balance SheetRs. in Crores
Schedule As at As at
Reference 31.03.2008 31.03.2007
I. Sources of Funds :
1. Shareholders’ Funds
(a) Share Capital 1 134.10 133.44
(b) Share application money, pending allotment 1.83 7.85
(c) Reserves and Surplus 2 7,221.71 5,648.07
7,357.64 5,789.36
2. Loan Funds
(a) Secured Loans 3 23.67 13.79
7,381.31 5,803.15
II. Application of Funds :
1. Fixed Assets 4
(a) Gross Block 1,486.53 1,280.40
(b) Less: Depreciation / Amortisation 1,062.04 930.45
(c) Net Block 424.49 349.95
(d) Capital Work in Progress 458.63 290.05
883.12 640.00
2. Investments 5 493.80 201.15
3. Deferred Tax Assets (net) 6 87.65 43.36
4. Current Assets, Loans and Advances
(a) Sundry Debtors 7 2,223.41 1,649.86
(b) Cash and Bank Balances 8 4,461.68 3,959.82
(c) Other Current Assets - Interest Accrued on Fixed Deposits 272.45 64.83
(d) Loans and Advances 9 400.20 261.75
7,357.74 5,936.26
Less: Current Liabilities and Provisions
(a) Liabilities 10 890.72 597.17
(b) Provisions 11 550.28 420.45
1,441.00 1,017.62
Net Current Assets 5,916.74 4,918.64
7,381.31 5,803.15
Notes to Accounts 15
The Schedules referred to above and the Statement on Significant Accounting Policies form an integral part of the Balance Sheet.
This is the Balance Sheet referred to for and on behalf of the Board of Directorsin our report of even date.
Srinivas Talluri B Ramalinga Raju B Rama RajuPartner Chairman Managing Directorfor and on behalf ofPrice Waterhouse V Srinivas G JayaramanChartered Accountants Director Global Head (Corp. Governance)
& Sr. Vice President - Finance & Company Secretary
Place : Hyderabad Place : HyderabadDate : April 21, 2008 Date : April 21, 2008
Sat_AR08_Final_Jul22_TP 2 Col.pmd 7/23/2008, 7:19 PM68
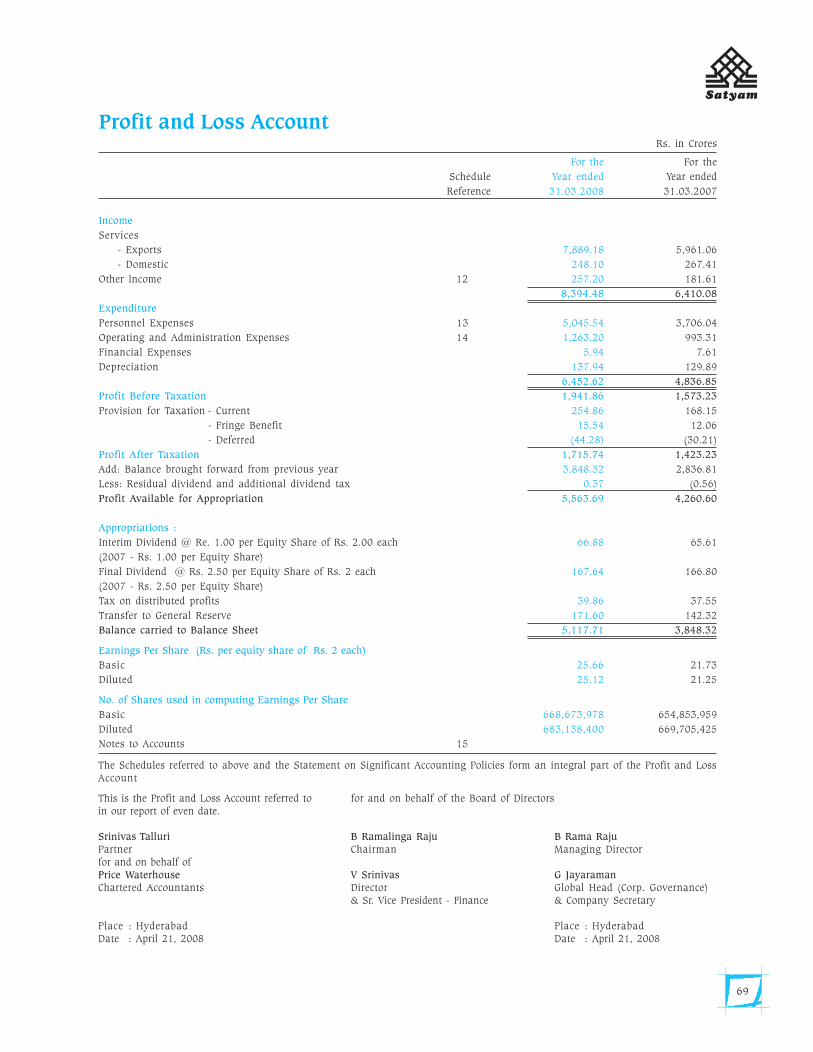
69
Profit and Loss AccountRs. in Crores
For the For the
Schedule Year ended Year ended
Reference 31.03.2008 31.03.2007
Income
Services
- Exports 7,889.18 5,961.06
- Domestic 248.10 267.41
Other Income 12 257.20 181.61
8,394.48 6,410.08
Expenditure
Personnel Expenses 13 5,045.54 3,706.04
Operating and Administration Expenses 14 1,263.20 993.31
Financial Expenses 5.94 7.61
Depreciation 137.94 129.89
6,452.62 4,836.85
Profit Before Taxation 1,941.86 1,573.23
Provision for Taxation - Current 254.86 168.15
- Fringe Benefit 15.54 12.06
- Deferred (44.28) (30.21)
Profit After Taxation 1,715.74 1,423.23
Add: Balance brought forward from previous year 3,848.32 2,836.81
Less: Residual dividend and additional dividend tax 0.37 (0.56)
Profit Available for Appropriation 5,563.69 4,260.60
Appropriations :
Interim Dividend @ Re. 1.00 per Equity Share of Rs. 2.00 each 66.88 65.61
(2007 - Rs. 1.00 per Equity Share)
Final Dividend @ Rs. 2.50 per Equity Share of Rs. 2 each 167.64 166.80
(2007 - Rs. 2.50 per Equity Share)
Tax on distributed profits 39.86 37.55
Transfer to General Reserve 171.60 142.32
Balance carried to Balance Sheet 5,117.71 3,848.32
Earnings Per Share (Rs. per equity share of Rs. 2 each)
Basic 25.66 21.73
Diluted 25.12 21.25
No. of Shares used in computing Earnings Per Share
Basic 668,673,978 654,853,959
Diluted 683,138,400 669,705,425
Notes to Accounts 15
The Schedules referred to above and the Statement on Significant Accounting Policies form an integral part of the Profit and LossAccount
This is the Profit and Loss Account referred to for and on behalf of the Board of Directorsin our report of even date.
Srinivas Talluri B Ramalinga Raju B Rama RajuPartner Chairman Managing Directorfor and on behalf ofPrice Waterhouse V Srinivas G JayaramanChartered Accountants Director Global Head (Corp. Governance)
& Sr. Vice President - Finance & Company Secretary
Place : Hyderabad Place : HyderabadDate : April 21, 2008 Date : April 21, 2008
Sat_AR08_Final_Jul22_TP 2 Col.pmd 7/23/2008, 7:19 PM69
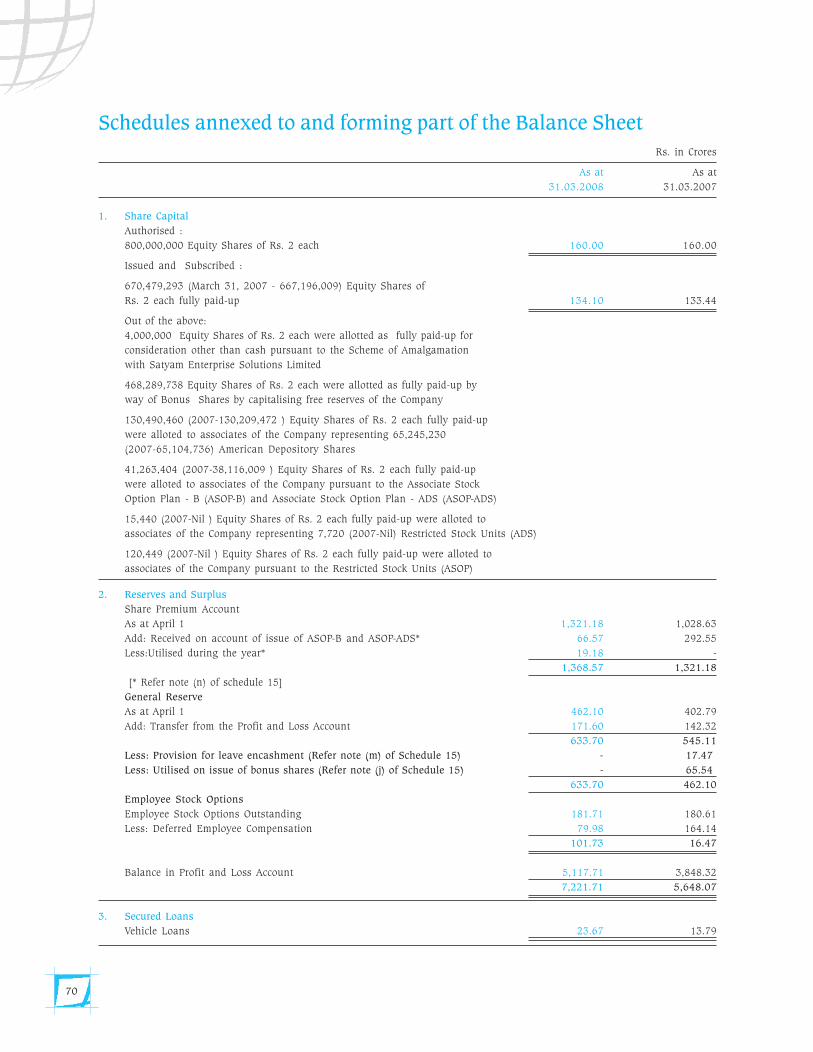
70
Schedules annexed to and forming part of the Balance SheetRs. in Crores
As at As at
31.03.2008 31.03.2007
1. Share Capital
Authorised :
800,000,000 Equity Shares of Rs. 2 each 160.00 160.00
Issued and Subscribed :
670,479,293 (March 31, 2007 - 667,196,009) Equity Shares of
Rs. 2 each fully paid-up 134.10 133.44
Out of the above:
4,000,000 Equity Shares of Rs. 2 each were allotted as fully paid-up for
consideration other than cash pursuant to the Scheme of Amalgamation
with Satyam Enterprise Solutions Limited
468,289,738 Equity Shares of Rs. 2 each were allotted as fully paid-up by
way of Bonus Shares by capitalising free reserves of the Company
130,490,460 (2007-130,209,472 ) Equity Shares of Rs. 2 each fully paid-up
were alloted to associates of the Company representing 65,245,230
(2007-65,104,736) American Depository Shares
41,263,404 (2007-38,116,009 ) Equity Shares of Rs. 2 each fully paid-up
were alloted to associates of the Company pursuant to the Associate Stock
Option Plan - B (ASOP-B) and Associate Stock Option Plan - ADS (ASOP-ADS)
15,440 (2007-Nil ) Equity Shares of Rs. 2 each fully paid-up were alloted to
associates of the Company representing 7,720 (2007-Nil) Restricted Stock Units (ADS)
120,449 (2007-Nil ) Equity Shares of Rs. 2 each fully paid-up were alloted to
associates of the Company pursuant to the Restricted Stock Units (ASOP)
2. Reserves and Surplus
Share Premium Account
As at April 1 1,321.18 1,028.63
Add: Received on account of issue of ASOP-B and ASOP-ADS* 66.57 292.55
Less:Utilised during the year* 19.18 -
1,368.57 1,321.18
[* Refer note (n) of schedule 15]
General Reserve
As at April 1 462.10 402.79
Add: Transfer from the Profit and Loss Account 171.60 142.32
633.70 545.11
Less: Provision for leave encashment (Refer note (m) of Schedule 15) - 17.47
Less: Utilised on issue of bonus shares (Refer note (j) of Schedule 15) - 65.54
633.70 462.10
Employee Stock Options
Employee Stock Options Outstanding 181.71 180.61
Less: Deferred Employee Compensation 79.98 164.14
101.73 16.47
Balance in Profit and Loss Account 5,117.71 3,848.32
7,221.71 5,648.07
3. Secured Loans
Vehicle Loans 23.67 13.79
Sat_AR08_Final_Jul22_TP 2 Col.pmd 7/23/2008, 7:19 PM70
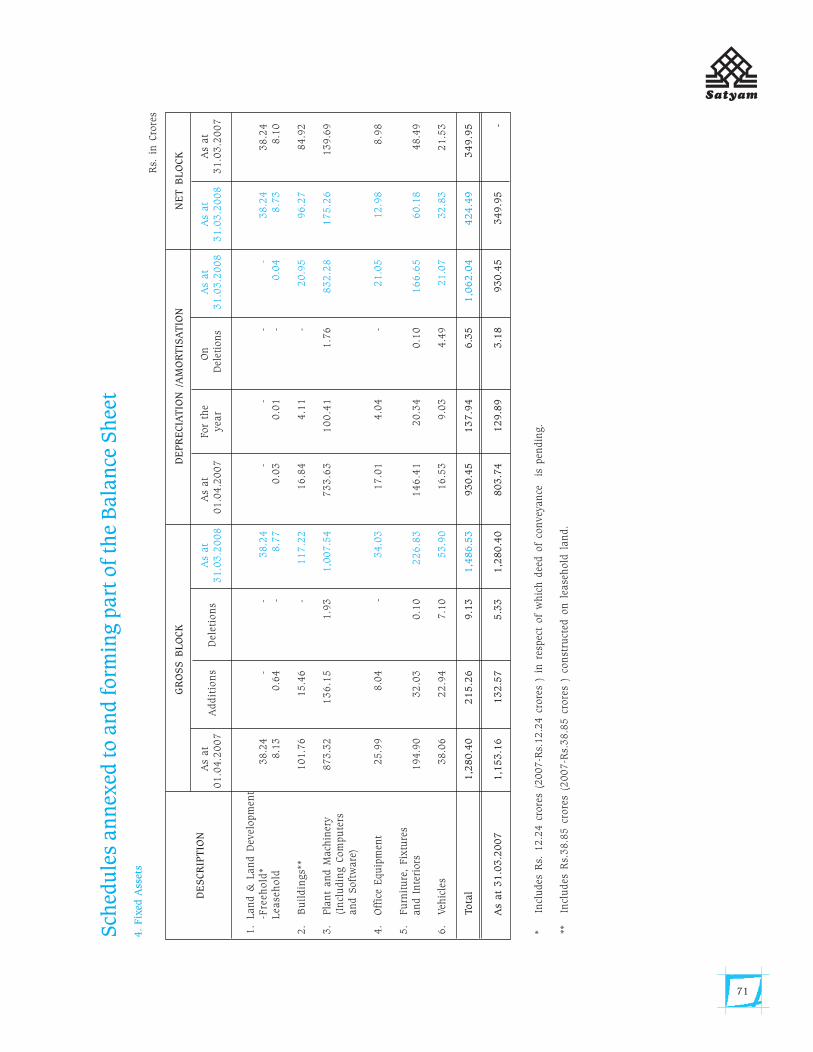
71
As
at
Ad
dit
ion
sD
elet
ion
sA
s at
As
at
For
the
On
As
at
As
at
As
at
01
.04
.20
07
31
.03
.20
08
01
.04
.20
07
yea
r D
elet
ion
s3
1.0
3.2
00
83
1.0
3.2
00
83
1.0
3.2
00
7
1.
Lan
d &
Lan
d D
evel
opm
ent
-Fre
eh
old
*
38
.24
--
38
.24
--
--
38
.24
38
.24
Lea
seh
old
8
.13
0
.64
-8
.77
0.0
30
.01
-0
.04
8.7
3
8
.10
2.
Bu
ild
ings*
*
10
1.7
6
1
5.4
6-
11
7.2
21
6.8
44
.11
-2
0.9
59
6.2
7
8
4.9
2
3.
Pla
nt
an
d M
ach
iner
y 8
73
.32
13
6.1
51
.93
1,0
07
.54
73
3.6
31
00
.41
1.7
68
32
.28
17
5.2
6
13
9.6
9 (
Incl
ud
ing C
om
pu
ters
an
d S
oft
ware
)
4.
Off
ice
Equ
ipm
ent
2
5.9
9
8.0
4
-3
4.0
31
7.0
14
.04
-2
1.0
51
2.9
88
.98
5.
Fu
rnit
ure
, Fix
ture
s a
nd I
nte
riors
19
4.9
03
2.0
30
.10
22
6.8
31
46
.41
20
.34
0.1
01
66
.65
60
.18
48
.49
6.
Veh
icle
s
38
.06
22
.94
7.1
05
3.9
01
6.5
39
.03
4.4
9 2
1.0
73
2.8
32
1.5
3
Tota
l
1
,28
0.4
02
15
.26
9.1
3
1
,48
6.5
3
93
0.4
51
37
.94
6.3
51
,06
2.0
44
24
.49
34
9.9
5
As
at
31
.03
.20
07
1
,15
3.1
6
1
32
.57
5.3
3
1
,28
0.4
0
80
3.7
4
1
29
.89
3.1
8 9
30
.45
3
49
.95
-
*In
clu
des
Rs.
12
.24
cro
res
(20
07
-Rs.
12
.24
cro
res
) in
res
pec
t of
wh
ich
dee
d o
f co
nvey
an
ce
is p
endin
g.
**
Incl
ud
es R
s.3
8.8
5 c
rore
s (2
00
7-R
s.3
8.8
5 c
rore
s )
con
stru
cted
on
lea
seh
old
lan
d.
DE
SCR
IPT
ION
GR
OS
S B
LO
CK
DE
PR
ECIA
TIO
N /
AM
OR
TIS
AT
ION
NE
T B
LO
CK
Sch
edu
les
an
nex
ed t
o a
nd f
orm
ing p
art
of
the
Bala
nce
Sh
eet
4.
Fix
ed A
sset
s
Rs.
in
Cro
res
Sat_AR08_Final_Jul22_TP 2 Col.pmd 7/23/2008, 7:19 PM71
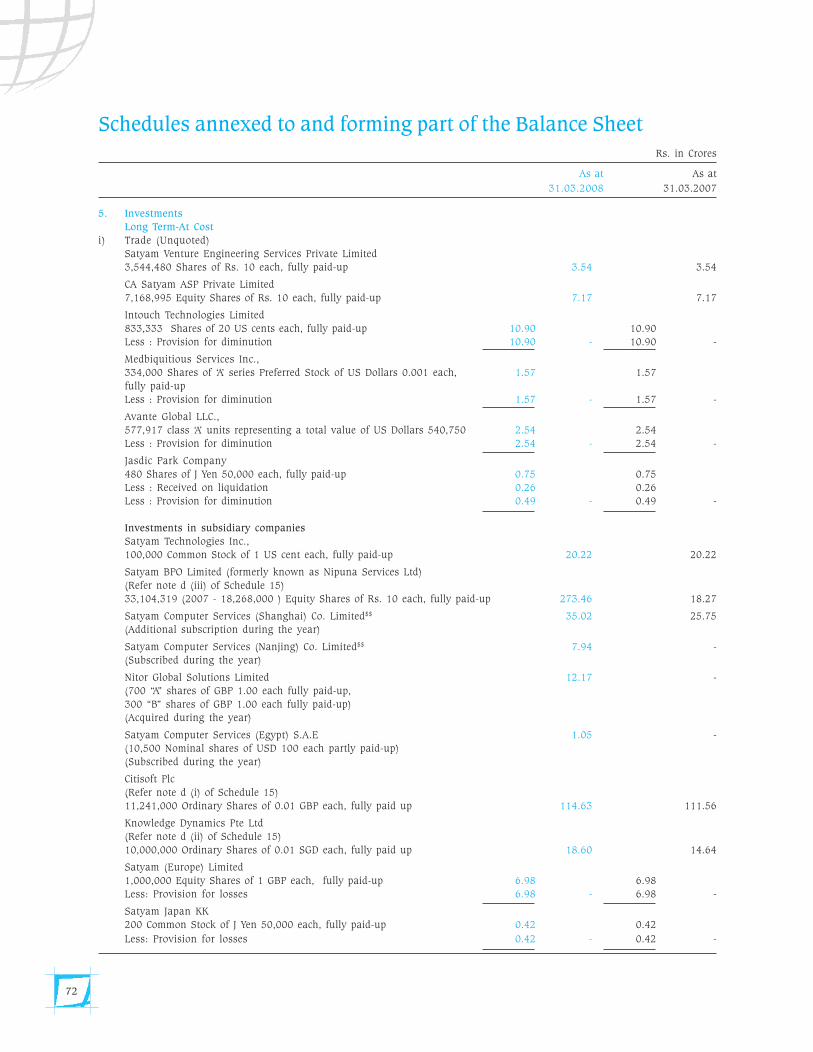
72
Schedules annexed to and forming part of the Balance SheetRs. in Crores
As at As at
31.03.2008 31.03.2007
5. Investments
Long Term-At Cost
i) Trade (Unquoted)
Satyam Venture Engineering Services Private Limited
3,544,480 Shares of Rs. 10 each, fully paid-up 3.54 3.54
CA Satyam ASP Private Limited
7,168,995 Equity Shares of Rs. 10 each, fully paid-up 7.17 7.17
Intouch Technologies Limited
833,333 Shares of 20 US cents each, fully paid-up 10.90 10.90
Less : Provision for diminution 10.90 - 10.90 -
Medbiquitious Services Inc.,
334,000 Shares of ‘A’ series Preferred Stock of US Dollars 0.001 each, 1.57 1.57
fully paid-up
Less : Provision for diminution 1.57 - 1.57 -
Avante Global LLC.,
577,917 class ‘A’ units representing a total value of US Dollars 540,750 2.54 2.54
Less : Provision for diminution 2.54 - 2.54 -
Jasdic Park Company
480 Shares of J Yen 50,000 each, fully paid-up 0.75 0.75
Less : Received on liquidation 0.26 0.26
Less : Provision for diminution 0.49 - 0.49 -
Investments in subsidiary companies
Satyam Technologies Inc.,
100,000 Common Stock of 1 US cent each, fully paid-up 20.22 20.22
Satyam BPO Limited (formerly known as Nipuna Services Ltd)
(Refer note d (iii) of Schedule 15)
33,104,319 (2007 - 18,268,000 ) Equity Shares of Rs. 10 each, fully paid-up 273.46 18.27
Satyam Computer Services (Shanghai) Co. Limited$$ 35.02 25.75
(Additional subscription during the year)
Satyam Computer Services (Nanjing) Co. Limited$$ 7.94 -
(Subscribed during the year)
Nitor Global Solutions Limited 12.17 -
(700 “A” shares of GBP 1.00 each fully paid-up,
300 “B” shares of GBP 1.00 each fully paid-up)
(Acquired during the year)
Satyam Computer Services (Egypt) S.A.E 1.05 -
(10,500 Nominal shares of USD 100 each partly paid-up)
(Subscribed during the year)
Citisoft Plc
(Refer note d (i) of Schedule 15)
11,241,000 Ordinary Shares of 0.01 GBP each, fully paid up 114.63 111.56
Knowledge Dynamics Pte Ltd
(Refer note d (ii) of Schedule 15)
10,000,000 Ordinary Shares of 0.01 SGD each, fully paid up 18.60 14.64
Satyam (Europe) Limited
1,000,000 Equity Shares of 1 GBP each, fully paid-up 6.98 6.98
Less: Provision for losses 6.98 - 6.98 -
Satyam Japan KK
200 Common Stock of J Yen 50,000 each, fully paid-up 0.42 0.42
Less: Provision for losses 0.42 - 0.42 -
Sat_AR08_Final_Jul22_TP 2 Col.pmd 7/23/2008, 7:19 PM72
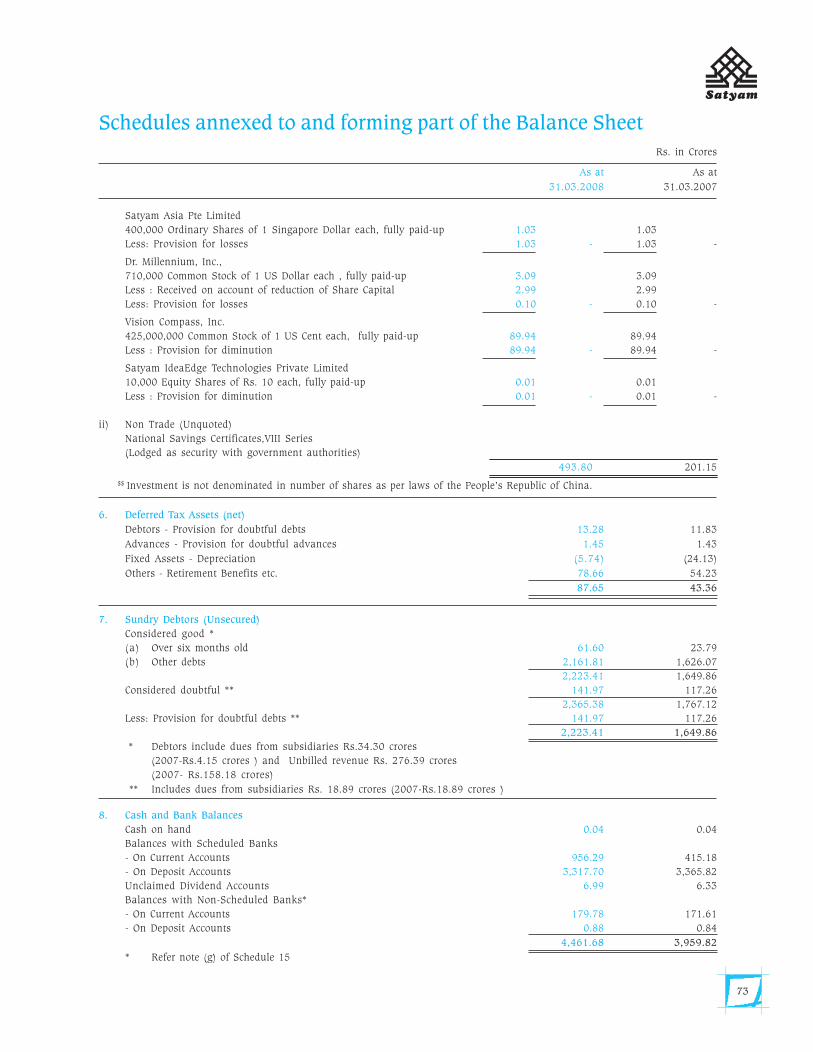
73
Schedules annexed to and forming part of the Balance SheetRs. in Crores
As at As at
31.03.2008 31.03.2007
Satyam Asia Pte Limited
400,000 Ordinary Shares of 1 Singapore Dollar each, fully paid-up 1.03 1.03
Less: Provision for losses 1.03 - 1.03 -
Dr. Millennium, Inc.,
710,000 Common Stock of 1 US Dollar each , fully paid-up 3.09 3.09
Less : Received on account of reduction of Share Capital 2.99 2.99
Less: Provision for losses 0.10 - 0.10 -
Vision Compass, Inc.
425,000,000 Common Stock of 1 US Cent each, fully paid-up 89.94 89.94
Less : Provision for diminution 89.94 - 89.94 -
Satyam IdeaEdge Technologies Private Limited
10,000 Equity Shares of Rs. 10 each, fully paid-up 0.01 0.01
Less : Provision for diminution 0.01 - 0.01 -
ii) Non Trade (Unquoted)
National Savings Certificates,VIII Series
(Lodged as security with government authorities)
493.80 201.15
$$ Investment is not denominated in number of shares as per laws of the People’s Republic of China.
6. Deferred Tax Assets (net)
Debtors - Provision for doubtful debts 13.28 11.83
Advances - Provision for doubtful advances 1.45 1.43
Fixed Assets - Depreciation (5.74) (24.13)
Others - Retirement Benefits etc. 78.66 54.23
87.65 43.36
7. Sundry Debtors (Unsecured)
Considered good *
(a) Over six months old 61.60 23.79
(b) Other debts 2,161.81 1,626.07
2,223.41 1,649.86
Considered doubtful ** 141.97 117.26
2,365.38 1,767.12
Less: Provision for doubtful debts ** 141.97 117.26
2,223.41 1,649.86
* Debtors include dues from subsidiaries Rs.34.30 crores
(2007-Rs.4.15 crores ) and Unbilled revenue Rs. 276.39 crores
(2007- Rs.158.18 crores)
** Includes dues from subsidiaries Rs. 18.89 crores (2007-Rs.18.89 crores )
8. Cash and Bank Balances
Cash on hand 0.04 0.04
Balances with Scheduled Banks
- On Current Accounts 956.29 415.18
- On Deposit Accounts 3,317.70 3,365.82
Unclaimed Dividend Accounts 6.99 6.33
Balances with Non-Scheduled Banks*
- On Current Accounts 179.78 171.61
- On Deposit Accounts 0.88 0.84
4,461.68 3,959.82
* Refer note (g) of Schedule 15
Sat_AR08_Final_Jul22_TP 2 Col.pmd 7/23/2008, 7:19 PM73
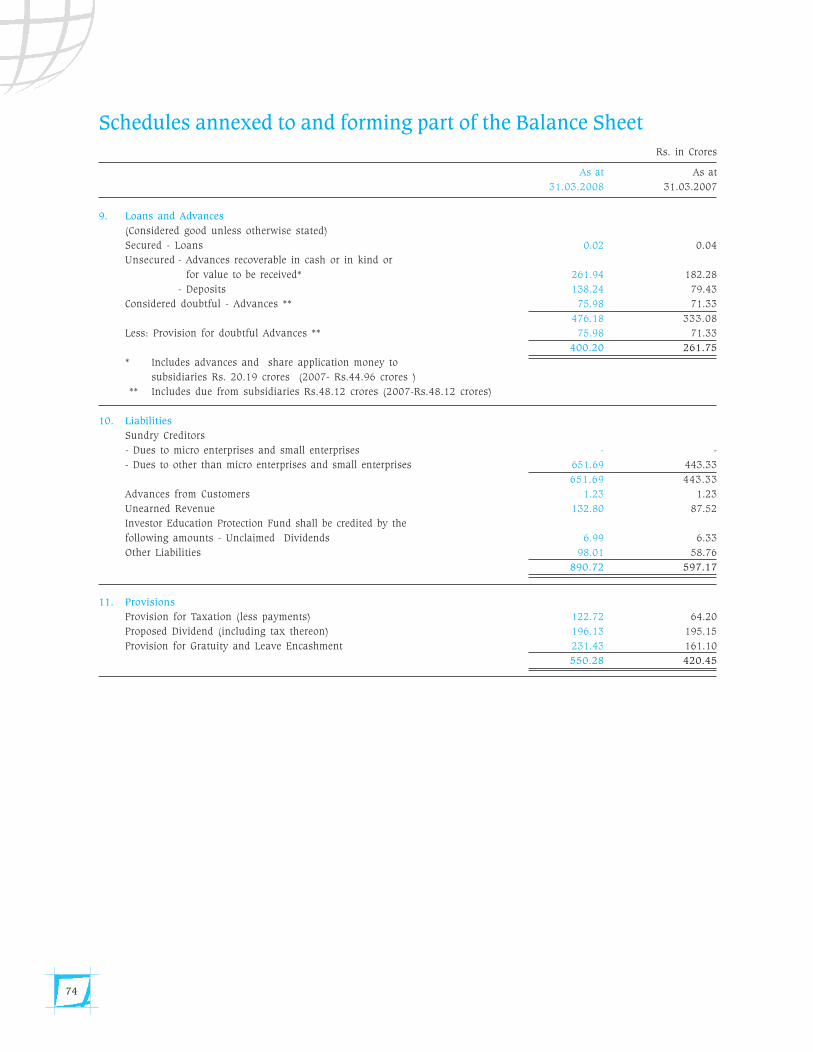
74
Schedules annexed to and forming part of the Balance SheetRs. in Crores
As at As at
31.03.2008 31.03.2007
9. Loans and Advances
(Considered good unless otherwise stated)
Secured - Loans 0.02 0.04
Unsecured - Advances recoverable in cash or in kind or
for value to be received* 261.94 182.28
- Deposits 138.24 79.43
Considered doubtful - Advances ** 75.98 71.33
476.18 333.08
Less: Provision for doubtful Advances ** 75.98 71.33
400.20 261.75
* Includes advances and share application money to
subsidiaries Rs. 20.19 crores (2007- Rs.44.96 crores )
** Includes due from subsidiaries Rs.48.12 crores (2007-Rs.48.12 crores)
10. Liabilities
Sundry Creditors
- Dues to micro enterprises and small enterprises - -
- Dues to other than micro enterprises and small enterprises 651.69 443.33
651.69 443.33
Advances from Customers 1.23 1.23
Unearned Revenue 132.80 87.52
Investor Education Protection Fund shall be credited by the
following amounts - Unclaimed Dividends 6.99 6.33
Other Liabilities 98.01 58.76
890.72 597.17
11. Provisions
Provision for Taxation (less payments) 122.72 64.20
Proposed Dividend (including tax thereon) 196.13 195.15
Provision for Gratuity and Leave Encashment 231.43 161.10
550.28 420.45
Sat_AR08_Final_Jul22_TP 2 Col.pmd 7/23/2008, 7:19 PM74
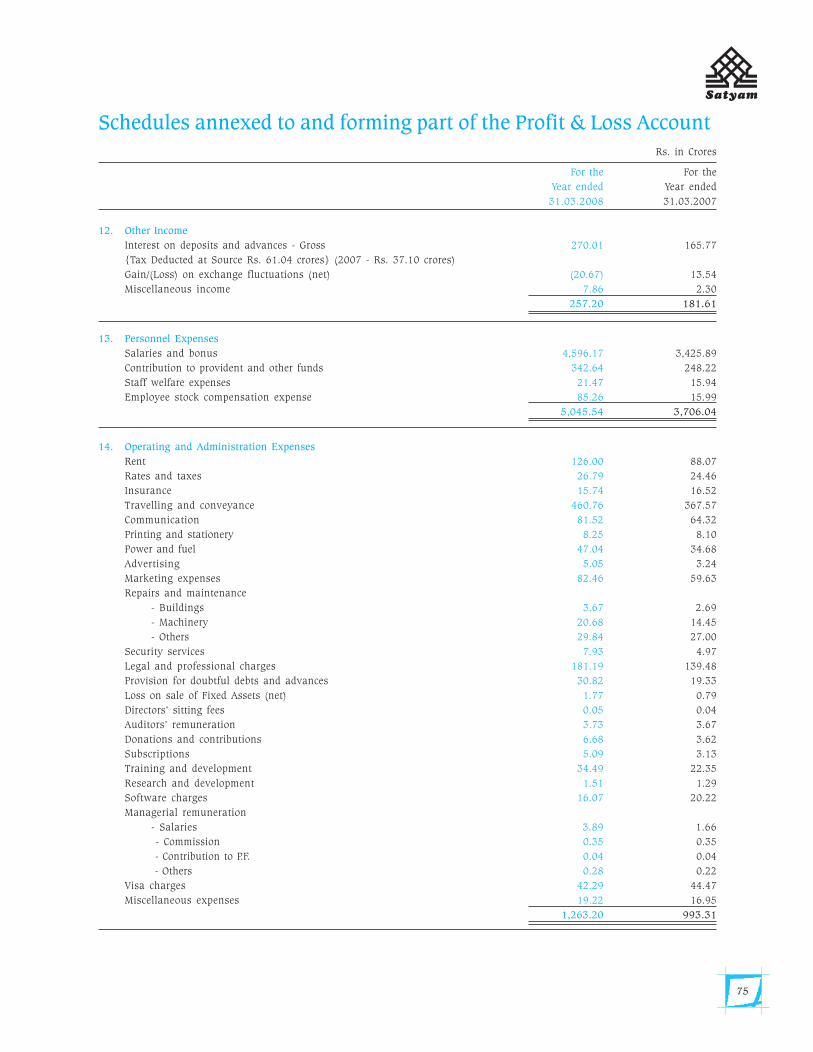
75
Schedules annexed to and forming part of the Profit & Loss AccountRs. in Crores
For the For the
Year ended Year ended
31.03.2008 31.03.2007
12. Other Income
Interest on deposits and advances - Gross 270.01 165.77
{Tax Deducted at Source Rs. 61.04 crores} (2007 - Rs. 37.10 crores)
Gain/(Loss) on exchange fluctuations (net) (20.67) 13.54
Miscellaneous income 7.86 2.30
257.20 181.61
13. Personnel Expenses
Salaries and bonus 4,596.17 3,425.89
Contribution to provident and other funds 342.64 248.22
Staff welfare expenses 21.47 15.94
Employee stock compensation expense 85.26 15.99
5,045.54 3,706.04
14. Operating and Administration Expenses
Rent 126.00 88.07
Rates and taxes 26.79 24.46
Insurance 15.74 16.52
Travelling and conveyance 460.76 367.57
Communication 81.52 64.32
Printing and stationery 8.25 8.10
Power and fuel 47.04 34.68
Advertising 5.05 3.24
Marketing expenses 82.46 59.63
Repairs and maintenance
- Buildings 3.67 2.69
- Machinery 20.68 14.45
- Others 29.84 27.00
Security services 7.93 4.97
Legal and professional charges 181.19 139.48
Provision for doubtful debts and advances 30.82 19.33
Loss on sale of Fixed Assets (net) 1.77 0.79
Directors’ sitting fees 0.05 0.04
Auditors’ remuneration 3.73 3.67
Donations and contributions 6.68 3.62
Subscriptions 5.09 3.13
Training and development 34.49 22.35
Research and development 1.51 1.29
Software charges 16.07 20.22
Managerial remuneration
- Salaries 3.89 1.66
- Commission 0.35 0.35
- Contribution to P.F. 0.04 0.04
- Others 0.28 0.22
Visa charges 42.29 44.47
Miscellaneous expenses 19.22 16.95
1,263.20 993.31
Sat_AR08_Final_Jul22_TP 2 Col.pmd 7/23/2008, 7:19 PM75
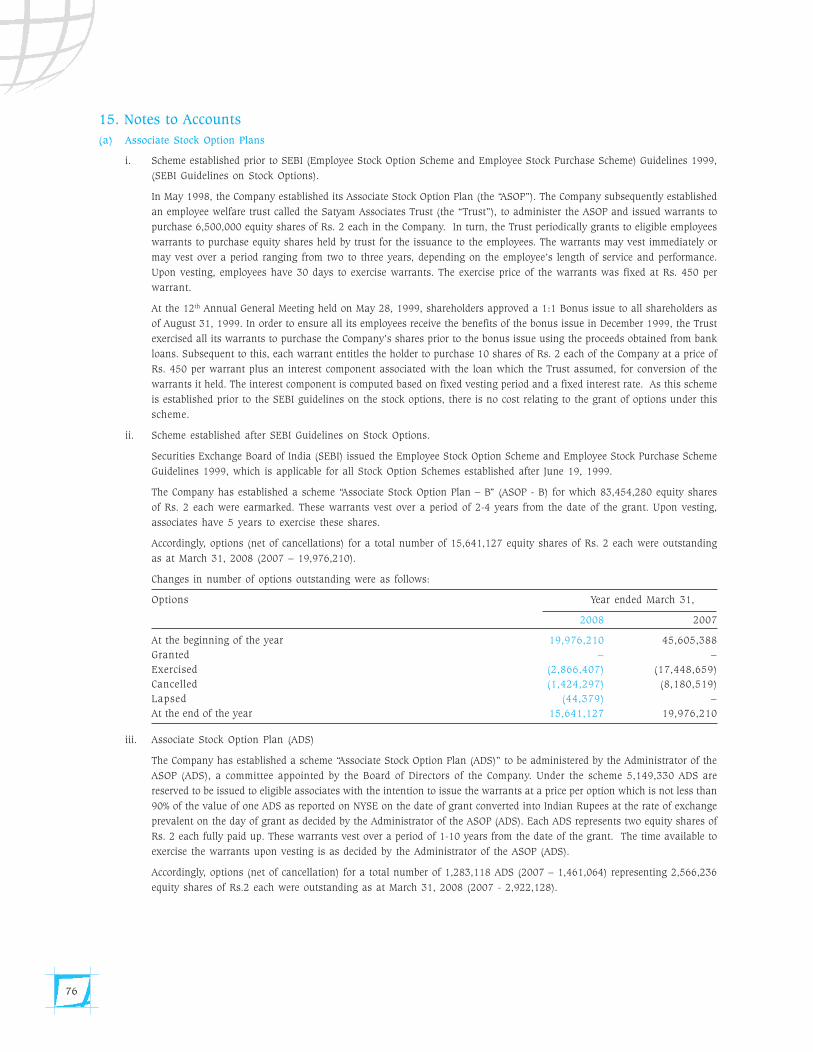
76
15. Notes to Accounts
(a) Associate Stock Option Plans
i. Scheme established prior to SEBI (Employee Stock Option Scheme and Employee Stock Purchase Scheme) Guidelines 1999,
(SEBI Guidelines on Stock Options).
In May 1998, the Company established its Associate Stock Option Plan (the “ASOP”). The Company subsequently established
an employee welfare trust called the Satyam Associates Trust (the “Trust”), to administer the ASOP and issued warrants to
purchase 6,500,000 equity shares of Rs. 2 each in the Company. In turn, the Trust periodically grants to eligible employees
warrants to purchase equity shares held by trust for the issuance to the employees. The warrants may vest immediately or
may vest over a period ranging from two to three years, depending on the employee’s length of service and performance.
Upon vesting, employees have 30 days to exercise warrants. The exercise price of the warrants was fixed at Rs. 450 per
warrant.
At the 12th Annual General Meeting held on May 28, 1999, shareholders approved a 1:1 Bonus issue to all shareholders as
of August 31, 1999. In order to ensure all its employees receive the benefits of the bonus issue in December 1999, the Trust
exercised all its warrants to purchase the Company’s shares prior to the bonus issue using the proceeds obtained from bank
loans. Subsequent to this, each warrant entitles the holder to purchase 10 shares of Rs. 2 each of the Company at a price of
Rs. 450 per warrant plus an interest component associated with the loan which the Trust assumed, for conversion of the
warrants it held. The interest component is computed based on fixed vesting period and a fixed interest rate. As this scheme
is established prior to the SEBI guidelines on the stock options, there is no cost relating to the grant of options under this
scheme.
ii. Scheme established after SEBI Guidelines on Stock Options.
Securities Exchange Board of India (SEBI) issued the Employee Stock Option Scheme and Employee Stock Purchase Scheme
Guidelines 1999, which is applicable for all Stock Option Schemes established after June 19, 1999.
The Company has established a scheme “Associate Stock Option Plan – B” (ASOP - B) for which 83,454,280 equity shares
of Rs. 2 each were earmarked. These warrants vest over a period of 2-4 years from the date of the grant. Upon vesting,
associates have 5 years to exercise these shares.
Accordingly, options (net of cancellations) for a total number of 15,641,127 equity shares of Rs. 2 each were outstanding
as at March 31, 2008 (2007 – 19,976,210).
Changes in number of options outstanding were as follows:
Options Year ended March 31,
2008 2007
At the beginning of the year 19,976,210 45,605,388
Granted – –
Exercised (2,866,407) (17,448,659)
Cancelled (1,424,297) (8,180,519)
Lapsed (44,379) –
At the end of the year 15,641,127 19,976,210
iii. Associate Stock Option Plan (ADS)
The Company has established a scheme “Associate Stock Option Plan (ADS)” to be administered by the Administrator of the
ASOP (ADS), a committee appointed by the Board of Directors of the Company. Under the scheme 5,149,330 ADS are
reserved to be issued to eligible associates with the intention to issue the warrants at a price per option which is not less than
90% of the value of one ADS as reported on NYSE on the date of grant converted into Indian Rupees at the rate of exchange
prevalent on the day of grant as decided by the Administrator of the ASOP (ADS). Each ADS represents two equity shares of
Rs. 2 each fully paid up. These warrants vest over a period of 1-10 years from the date of the grant. The time available to
exercise the warrants upon vesting is as decided by the Administrator of the ASOP (ADS).
Accordingly, options (net of cancellation) for a total number of 1,283,118 ADS (2007 – 1,461,064) representing 2,566,236
equity shares of Rs.2 each were outstanding as at March 31, 2008 (2007 - 2,922,128).
Sat_AR08_Final_Jul22_TP 2 Col.pmd 7/23/2008, 7:19 PM76
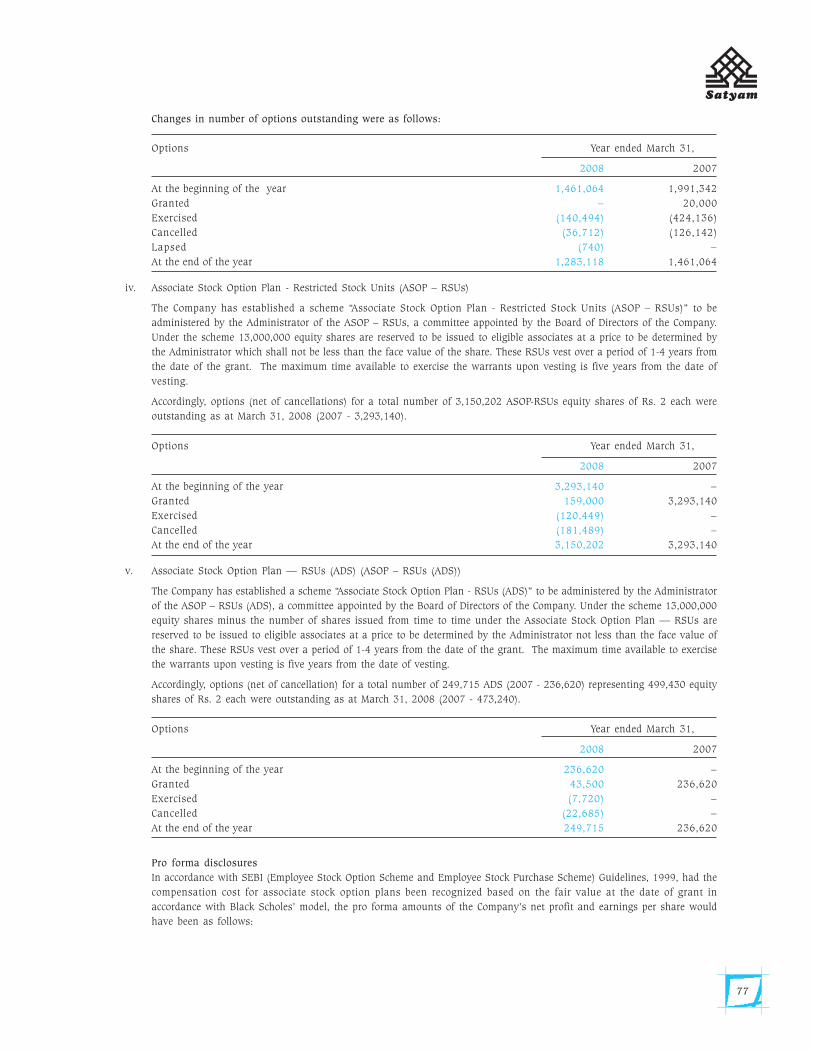
77
Changes in number of options outstanding were as follows:
Options Year ended March 31,
2008 2007
At the beginning of the year 1,461,064 1,991,342
Granted – 20,000
Exercised (140,494) (424,136)
Cancelled (36,712) (126,142)
Lapsed (740) –
At the end of the year 1,283,118 1,461,064
iv. Associate Stock Option Plan - Restricted Stock Units (ASOP – RSUs)
The Company has established a scheme “Associate Stock Option Plan - Restricted Stock Units (ASOP – RSUs)” to be
administered by the Administrator of the ASOP – RSUs, a committee appointed by the Board of Directors of the Company.
Under the scheme 13,000,000 equity shares are reserved to be issued to eligible associates at a price to be determined by
the Administrator which shall not be less than the face value of the share. These RSUs vest over a period of 1-4 years from
the date of the grant. The maximum time available to exercise the warrants upon vesting is five years from the date of
vesting.
Accordingly, options (net of cancellations) for a total number of 3,150,202 ASOP-RSUs equity shares of Rs. 2 each were
outstanding as at March 31, 2008 (2007 - 3,293,140).
Options Year ended March 31,
2008 2007
At the beginning of the year 3,293,140 –
Granted 159,000 3,293,140
Exercised (120,449) –
Cancelled (181,489) –
At the end of the year 3,150,202 3,293,140
v. Associate Stock Option Plan — RSUs (ADS) (ASOP – RSUs (ADS))
The Company has established a scheme “Associate Stock Option Plan - RSUs (ADS)” to be administered by the Administrator
of the ASOP – RSUs (ADS), a committee appointed by the Board of Directors of the Company. Under the scheme 13,000,000
equity shares minus the number of shares issued from time to time under the Associate Stock Option Plan — RSUs are
reserved to be issued to eligible associates at a price to be determined by the Administrator not less than the face value of
the share. These RSUs vest over a period of 1-4 years from the date of the grant. The maximum time available to exercise
the warrants upon vesting is five years from the date of vesting.
Accordingly, options (net of cancellation) for a total number of 249,715 ADS (2007 - 236,620) representing 499,430 equity
shares of Rs. 2 each were outstanding as at March 31, 2008 (2007 - 473,240).
Options Year ended March 31,
2008 2007
At the beginning of the year 236,620 –
Granted 43,500 236,620
Exercised (7,720) –
Cancelled (22,685) –
At the end of the year 249,715 236,620
Pro forma disclosures
In accordance with SEBI (Employee Stock Option Scheme and Employee Stock Purchase Scheme) Guidelines, 1999, had the
compensation cost for associate stock option plans been recognized based on the fair value at the date of grant in
accordance with Black Scholes’ model, the pro forma amounts of the Company’s net profit and earnings per share would
have been as follows:
Sat_AR08_Final_Jul22_TP 2 Col.pmd 7/23/2008, 7:19 PM77
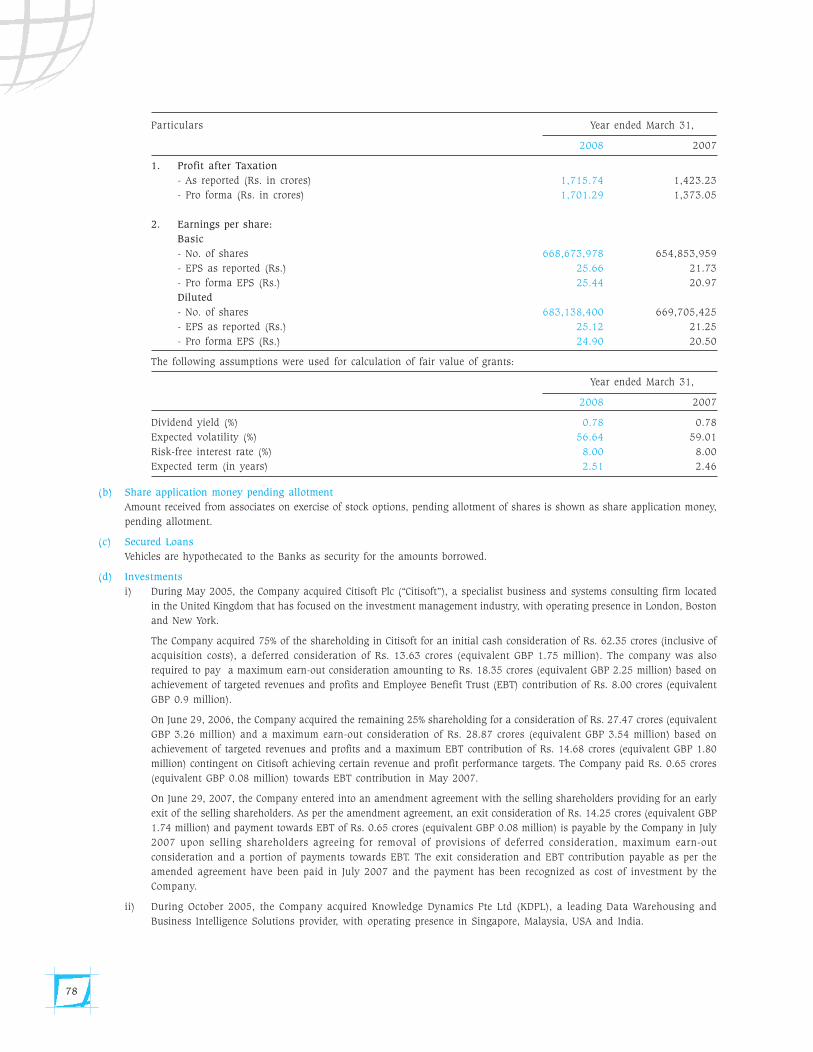
78
Particulars Year ended March 31,
2008 2007
1. Profit after Taxation
- As reported (Rs. in crores) 1,715.74 1,423.23
- Pro forma (Rs. in crores) 1,701.29 1,373.05
2. Earnings per share:
Basic
- No. of shares 668,673,978 654,853,959
- EPS as reported (Rs.) 25.66 21.73
- Pro forma EPS (Rs.) 25.44 20.97
Diluted
- No. of shares 683,138,400 669,705,425
- EPS as reported (Rs.) 25.12 21.25
- Pro forma EPS (Rs.) 24.90 20.50
The following assumptions were used for calculation of fair value of grants:
Year ended March 31,
2008 2007
Dividend yield (%) 0.78 0.78
Expected volatility (%) 56.64 59.01
Risk-free interest rate (%) 8.00 8.00
Expected term (in years) 2.51 2.46
(b) Share application money pending allotment
Amount received from associates on exercise of stock options, pending allotment of shares is shown as share application money,
pending allotment.
(c) Secured Loans
Vehicles are hypothecated to the Banks as security for the amounts borrowed.
(d) Investments
i) During May 2005, the Company acquired Citisoft Plc (“Citisoft”), a specialist business and systems consulting firm located
in the United Kingdom that has focused on the investment management industry, with operating presence in London, Boston
and New York.
The Company acquired 75% of the shareholding in Citisoft for an initial cash consideration of Rs. 62.35 crores (inclusive of
acquisition costs), a deferred consideration of Rs. 13.63 crores (equivalent GBP 1.75 million). The company was also
required to pay a maximum earn-out consideration amounting to Rs. 18.35 crores (equivalent GBP 2.25 million) based on
achievement of targeted revenues and profits and Employee Benefit Trust (EBT) contribution of Rs. 8.00 crores (equivalent
GBP 0.9 million).
On June 29, 2006, the Company acquired the remaining 25% shareholding for a consideration of Rs. 27.47 crores (equivalent
GBP 3.26 million) and a maximum earn-out consideration of Rs. 28.87 crores (equivalent GBP 3.54 million) based on
achievement of targeted revenues and profits and a maximum EBT contribution of Rs. 14.68 crores (equivalent GBP 1.80
million) contingent on Citisoft achieving certain revenue and profit performance targets. The Company paid Rs. 0.65 crores
(equivalent GBP 0.08 million) towards EBT contribution in May 2007.
On June 29, 2007, the Company entered into an amendment agreement with the selling shareholders providing for an early
exit of the selling shareholders. As per the amendment agreement, an exit consideration of Rs. 14.25 crores (equivalent GBP
1.74 million) and payment towards EBT of Rs. 0.65 crores (equivalent GBP 0.08 million) is payable by the Company in July
2007 upon selling shareholders agreeing for removal of provisions of deferred consideration, maximum earn-out
consideration and a portion of payments towards EBT. The exit consideration and EBT contribution payable as per the
amended agreement have been paid in July 2007 and the payment has been recognized as cost of investment by the
Company.
ii) During October 2005, the Company acquired Knowledge Dynamics Pte Ltd (KDPL), a leading Data Warehousing and
Business Intelligence Solutions provider, with operating presence in Singapore, Malaysia, USA and India.
Sat_AR08_Final_Jul22_TP 2 Col.pmd 7/23/2008, 7:19 PM78
79
The Company acquired 100% of the shareholding in KDPL for a consideration of Rs. 14.64 crores (inclusive of acquisition
costs). A maximum earn out consideration of Rs. 4.87 crores (Equivalent SGD 1.84 million) is payable on April 30, 2008,
based on achievement of targeted revenues and profits.
On July 19 2007, the company entered into an amendment agreement with the selling shareholders of KDPL on agreeing to
the terms of the agreement including removal of provisions relating to earn out consideration. As per the amendment
agreement, an exit consideration of Rs. 2.97 Crores (Equivalent SGD 1.11 million) has been paid by the company in July
2007. In addition to the exit consideration the company agreed to make a deferred payment of Rs. 0.99 Crores (Equivalent
SGD 0.37 million) payable by May 15, 2008.The exit consideration and deferred payment has been recognised as cost of
investment by the Company.
Further the Company agreed to make a maximum earn-out payment of Rs. 2.14 crores (Equivalent SGD 0.74 million) on or
before May 15, 2008. The actual amount of earn-out payment to be made is based on the revenue of KDPL for the year
2007-08.
iii) Satyam BPO Limited (formerly known as Nipuna Services Ltd.) (“Satyam BPO”) issued 45,669,999 and 45,340,000 0.05%
Convertible Redeemable Cumulative Preference Shares of par value of Rs.10 each fully paid–up in October 2003 and June
2004 respectively to Olympus BPO Holdings Ltd. and Intel Capital Corporation (“Preference shareholders”) for an aggregate
consideration of Rs. 91.01 crores (equivalent to US$ 20 millions). These Preference shares are to be mandatorily converted
into such number of equity shares latest by June 2007 or redeemed based on certain provisions in the agreement entered
with the preference shareholders relating to revenues and profits earned up to March 31, 2006. The said preference shares,
if not converted or early converted at the option of the preference shareholders based on certain triggering events, are
redeemable on maturity in June 2007 at a redemption premium, which could range in between 7.5% to 13.5% p.a.
On November 20, 2006, a Share Purchase, Redemption and Amendment Agreement (“SPRA Agreement”) was entered into
between the Company, the preference shareholders and Satyam BPO. Out of the total preference shares, 50% of the
preference shares of Rs. 45.51 crores (Equivalent US$ 10 million) were redeemable for Rs. 60.10 crores (Equivalent US$
13.6 million) at the target date on May 21, 2007 and the balance 50% were to be converted into equity shares of Satyam BPO
based on the terms of the subscription agreement. The preference shareholders gave Satyam BPO a Notice of Conversion
of Preference Shares and in January 2007, 45,505,000 preference shares have been converted into 6,422,267 equity shares
of Satyam BPO.
Further as per the SPRA Agreement, the Company agreed to purchase and the preference shareholders agreed to sell these
equity shares at an aggregate purchase price based on a formula. If the share purchase closing occurred on or before the
share purchase target date (May 21, 2007) then the purchase price would range from a minimum of Rs. 152.57 crores
(Equivalent US$ 35 million) to maximum of Rs. 196.16 crores (Equivalent US$ 45 million), however if an acceleration event
occurred the purchase price would equal Rs. 196.16 crores (Equivalent US$45 million). If the share purchase closing
occurred after the share purchase target date then the purchase price shall not been less than Rs. 152.57 crores (Equivalent
US$ 35 million) however if an acceleration event occurred the purchase price shall not been less than Rs. 196.16 crores
(Equivalent US$45 million). This was subject to fulfillment of terms and conditions specified in the agreement and obtaining
necessary approvals from appropriate authorities. As of March 31, 2007, an acceleration event had occurred. On July 27,
2007 the Company has agreed to pay additional consideration of US$ 1.5 million to the preference shareholders if the share
purchase closing occurs after August 07, 2007.
On August 14, 2007, the Company purchased 4,816,750 equity shares of Satyam BPO from Olympus BPO Holdings Ltd for
Rs. 141.81 crores (Equivalent US$34.88 million).
On August 14, 2007, the Company subscribed to further 8,055,000 equity shares of Satyam BPO of Rs. 10 each at a premium
of Rs. 60 per share aggregating to Rs. 56.39 crores.
The Company also purchased 286,952 equity shares vested and exercised by Satyam BPO employees under the Employee
Stock Options plan for Rs.8.47 crores as consideration for the transaction.
On December 31, 2007, the Company purchased 1,605,617 equity shares of Satyam BPO from Intel Capital (Cayman)
Corporation for Rs.45.94 Crores (equivalent US$11.62 million).
The Company has purchased 72,000 equity shares vested and exercised by Satyam BPO employee under the Employee
Stock Options plan for Rs. 2.08 crores as consideration for the transaction.
iv) On October 23, 2007, the Company announced its intention to acquire 100% of the shares of NITOR Global Solutions Ltd,
United Kingdom (“Nitor”), a Company specialized in the Infrastructure Management Services (IMS) space. The total
consideration for this acquisition is approximately Rs.22.40 crores (equivalent GBP 2.76 million) including a performance-
based payment of up to Rs. 10.34 crores (Equivalent GBP 1.3 million) over two years conditional upon specified revenue
and profit targets being met.
Sat_AR08_Final_Jul22_TP 2 Col.pmd 7/23/2008, 7:19 PM79
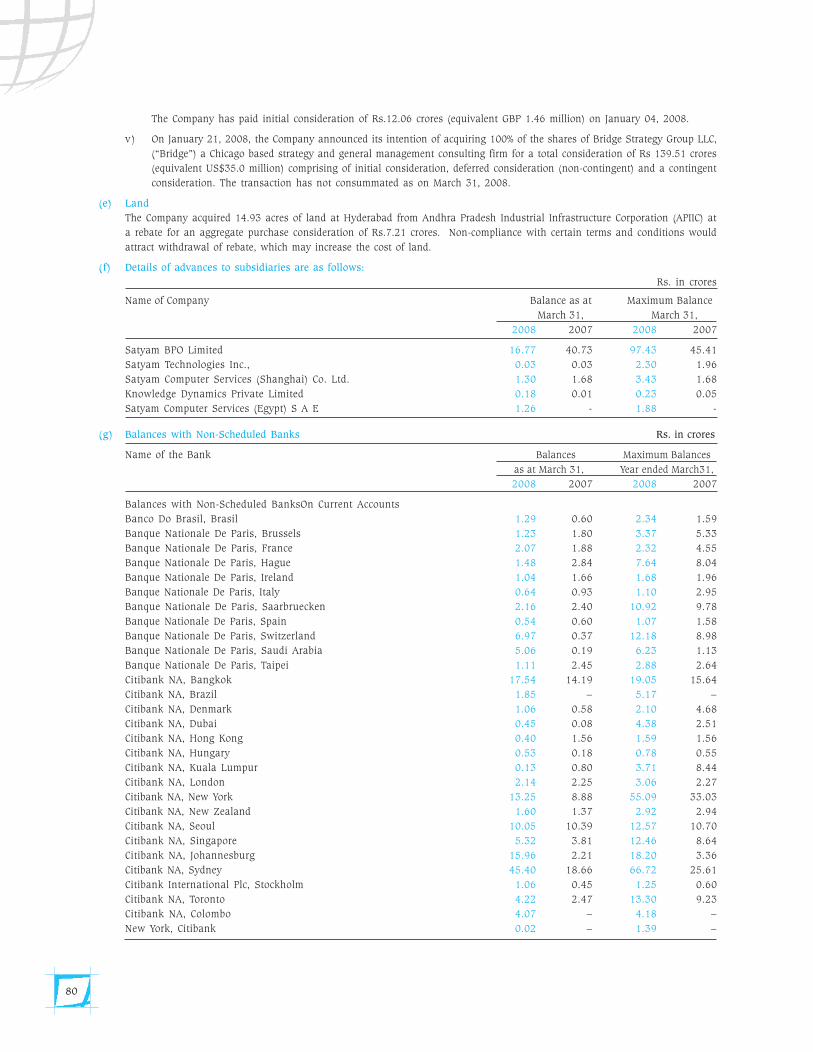
80
The Company has paid initial consideration of Rs.12.06 crores (equivalent GBP 1.46 million) on January 04, 2008.
v) On January 21, 2008, the Company announced its intention of acquiring 100% of the shares of Bridge Strategy Group LLC,
(“Bridge”) a Chicago based strategy and general management consulting firm for a total consideration of Rs 139.51 crores
(equivalent US$35.0 million) comprising of initial consideration, deferred consideration (non-contingent) and a contingent
consideration. The transaction has not consummated as on March 31, 2008.
(e) Land
The Company acquired 14.93 acres of land at Hyderabad from Andhra Pradesh Industrial Infrastructure Corporation (APIIC) at
a rebate for an aggregate purchase consideration of Rs.7.21 crores. Non-compliance with certain terms and conditions would
attract withdrawal of rebate, which may increase the cost of land.
(f) Details of advances to subsidiaries are as follows:
Rs. in crores
Name of Company Balance as at Maximum Balance
March 31, March 31,
2008 2007 2008 2007
Satyam BPO Limited 16.77 40.73 97.43 45.41
Satyam Technologies Inc., 0.03 0.03 2.30 1.96
Satyam Computer Services (Shanghai) Co. Ltd. 1.30 1.68 3.43 1.68
Knowledge Dynamics Private Limited 0.18 0.01 0.23 0.05
Satyam Computer Services (Egypt) S A E 1.26 - 1.88 -
(g) Balances with Non-Scheduled Banks Rs. in crores
Name of the Bank Balances Maximum Balances
as at March 31, Year ended March31,
2008 2007 2008 2007
Balances with Non-Scheduled BanksOn Current Accounts
Banco Do Brasil, Brasil 1.29 0.60 2.34 1.59
Banque Nationale De Paris, Brussels 1.23 1.80 3.37 5.33
Banque Nationale De Paris, France 2.07 1.88 2.32 4.55
Banque Nationale De Paris, Hague 1.48 2.84 7.64 8.04
Banque Nationale De Paris, Ireland 1.04 1.66 1.68 1.96
Banque Nationale De Paris, Italy 0.64 0.93 1.10 2.95
Banque Nationale De Paris, Saarbruecken 2.16 2.40 10.92 9.78
Banque Nationale De Paris, Spain 0.54 0.60 1.07 1.58
Banque Nationale De Paris, Switzerland 6.97 0.37 12.18 8.98
Banque Nationale De Paris, Saudi Arabia 5.06 0.19 6.23 1.13
Banque Nationale De Paris, Taipei 1.11 2.45 2.88 2.64
Citibank NA, Bangkok 17.54 14.19 19.05 15.64
Citibank NA, Brazil 1.85 – 5.17 –
Citibank NA, Denmark 1.06 0.58 2.10 4.68
Citibank NA, Dubai 0.45 0.08 4.38 2.51
Citibank NA, Hong Kong 0.40 1.56 1.59 1.56
Citibank NA, Hungary 0.53 0.18 0.78 0.55
Citibank NA, Kuala Lumpur 0.13 0.80 3.71 8.44
Citibank NA, London 2.14 2.25 3.06 2.27
Citibank NA, New York 13.25 8.88 55.09 33.03
Citibank NA, New Zealand 1.60 1.37 2.92 2.94
Citibank NA, Seoul 10.05 10.39 12.57 10.70
Citibank NA, Singapore 5.32 3.81 12.46 8.64
Citibank NA, Johannesburg 15.96 2.21 18.20 3.36
Citibank NA, Sydney 45.40 18.66 66.72 25.61
Citibank International Plc, Stockholm 1.06 0.45 1.25 0.60
Citibank NA, Toronto 4.22 2.47 13.30 9.23
Citibank NA, Colombo 4.07 – 4.18 –
New York, Citibank 0.02 – 1.39 –
Sat_AR08_Final_Jul22_TP 2 Col.pmd 7/23/2008, 7:19 PM80
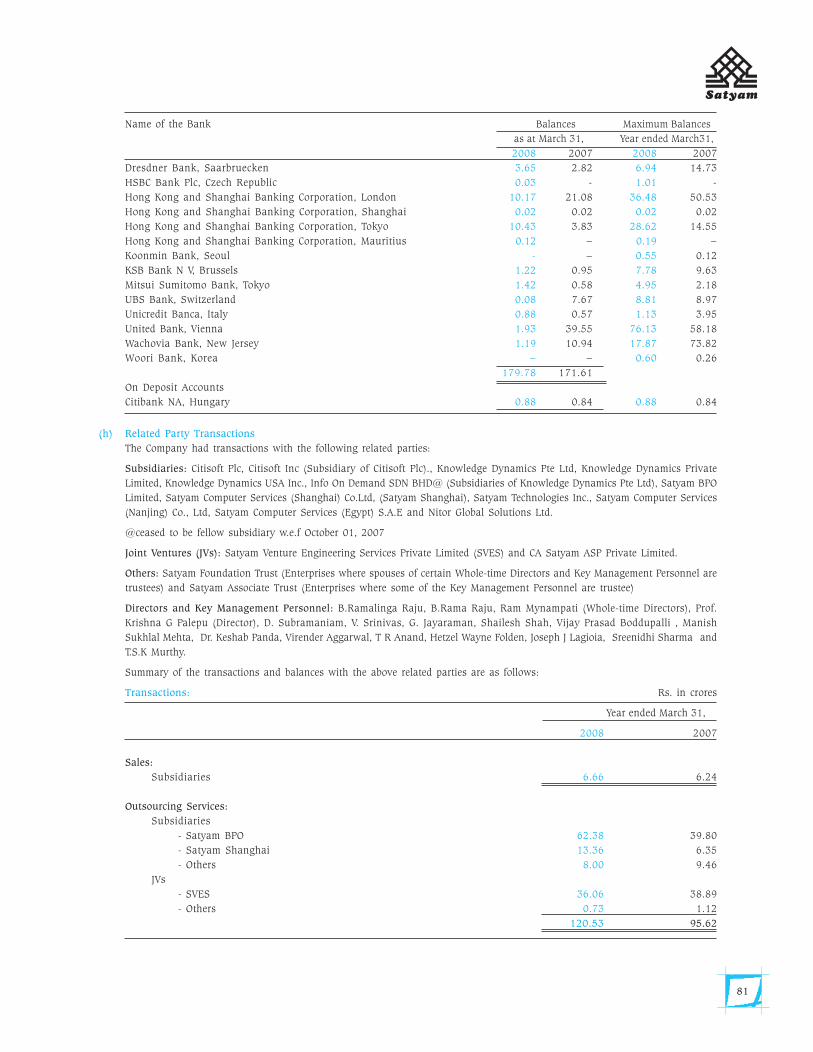
81
Name of the Bank Balances Maximum Balances
as at March 31, Year ended March31,
2008 2007 2008 2007
Dresdner Bank, Saarbruecken 3.65 2.82 6.94 14.73
HSBC Bank Plc, Czech Republic 0.03 - 1.01 -
Hong Kong and Shanghai Banking Corporation, London 10.17 21.08 36.48 50.53
Hong Kong and Shanghai Banking Corporation, Shanghai 0.02 0.02 0.02 0.02
Hong Kong and Shanghai Banking Corporation, Tokyo 10.43 3.83 28.62 14.55
Hong Kong and Shanghai Banking Corporation, Mauritius 0.12 – 0.19 –
Koonmin Bank, Seoul - – 0.55 0.12
KSB Bank N V, Brussels 1.22 0.95 7.78 9.63
Mitsui Sumitomo Bank, Tokyo 1.42 0.58 4.95 2.18
UBS Bank, Switzerland 0.08 7.67 8.81 8.97
Unicredit Banca, Italy 0.88 0.57 1.13 3.95
United Bank, Vienna 1.93 39.55 76.13 58.18
Wachovia Bank, New Jersey 1.19 10.94 17.87 73.82
Woori Bank, Korea – – 0.60 0.26
179.78 171.61
On Deposit Accounts
Citibank NA, Hungary 0.88 0.84 0.88 0.84
(h) Related Party Transactions
The Company had transactions with the following related parties:
Subsidiaries: Citisoft Plc, Citisoft Inc (Subsidiary of Citisoft Plc)., Knowledge Dynamics Pte Ltd, Knowledge Dynamics Private
Limited, Knowledge Dynamics USA Inc., Info On Demand SDN BHD@ (Subsidiaries of Knowledge Dynamics Pte Ltd), Satyam BPO
Limited, Satyam Computer Services (Shanghai) Co.Ltd, (Satyam Shanghai), Satyam Technologies Inc., Satyam Computer Services
(Nanjing) Co., Ltd, Satyam Computer Services (Egypt) S.A.E and Nitor Global Solutions Ltd.
@ceased to be fellow subsidiary w.e.f October 01, 2007
Joint Ventures (JVs): Satyam Venture Engineering Services Private Limited (SVES) and CA Satyam ASP Private Limited.
Others: Satyam Foundation Trust (Enterprises where spouses of certain Whole-time Directors and Key Management Personnel are
trustees) and Satyam Associate Trust (Enterprises where some of the Key Management Personnel are trustee)
Directors and Key Management Personnel: B.Ramalinga Raju, B.Rama Raju, Ram Mynampati (Whole-time Directors), Prof.
Krishna G Palepu (Director), D. Subramaniam, V. Srinivas, G. Jayaraman, Shailesh Shah, Vijay Prasad Boddupalli , Manish
Sukhlal Mehta, Dr. Keshab Panda, Virender Aggarwal, T R Anand, Hetzel Wayne Folden, Joseph J Lagioia, Sreenidhi Sharma and
T.S.K Murthy.
Summary of the transactions and balances with the above related parties are as follows:
Transactions: Rs. in crores
Year ended March 31,
2008 2007
Sales:
Subsidiaries 6.66 6.24
Outsourcing Services:
Subsidiaries
- Satyam BPO 62.38 39.80
- Satyam Shanghai 13.36 6.35
- Others 8.00 9.46
JVs
- SVES 36.06 38.89
- Others 0.73 1.12
120.53 95.62
Sat_AR08_Final_Jul22_TP 2 Col.pmd 7/23/2008, 7:19 PM81
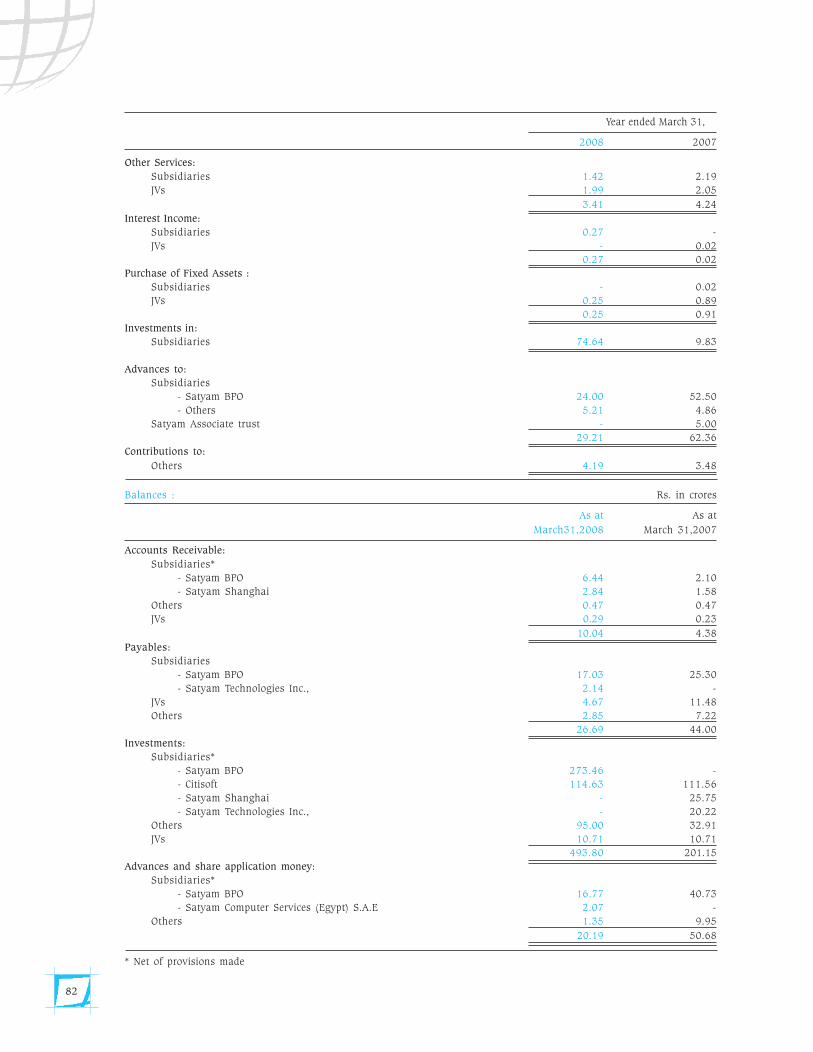
82
Year ended March 31,
2008 2007
Other Services:
Subsidiaries 1.42 2.19
JVs 1.99 2.05
3.41 4.24
Interest Income:
Subsidiaries 0.27 -
JVs - 0.02
0.27 0.02
Purchase of Fixed Assets :
Subsidiaries - 0.02
JVs 0.25 0.89
0.25 0.91
Investments in:
Subsidiaries 74.64 9.83
Advances to:
Subsidiaries
- Satyam BPO 24.00 52.50
- Others 5.21 4.86
Satyam Associate trust - 5.00
29.21 62.36
Contributions to:
Others 4.19 3.48
Balances : Rs. in crores
As at As at
March31,2008 March 31,2007
Accounts Receivable:
Subsidiaries*
- Satyam BPO 6.44 2.10
- Satyam Shanghai 2.84 1.58
Others 0.47 0.47
JVs 0.29 0.23
10.04 4.38
Payables:
Subsidiaries
- Satyam BPO 17.03 25.30
- Satyam Technologies Inc., 2.14 -
JVs 4.67 11.48
Others 2.85 7.22
26.69 44.00
Investments:
Subsidiaries*
- Satyam BPO 273.46 -
- Citisoft 114.63 111.56
- Satyam Shanghai - 25.75
- Satyam Technologies Inc., - 20.22
Others 95.00 32.91
JVs 10.71 10.71
493.80 201.15
Advances and share application money:
Subsidiaries*
- Satyam BPO 16.77 40.73
- Satyam Computer Services (Egypt) S.A.E 2.07 -
Others 1.35 9.95
20.19 50.68
* Net of provisions made
Sat_AR08_Final_Jul22_TP 2 Col.pmd 7/23/2008, 7:19 PM82
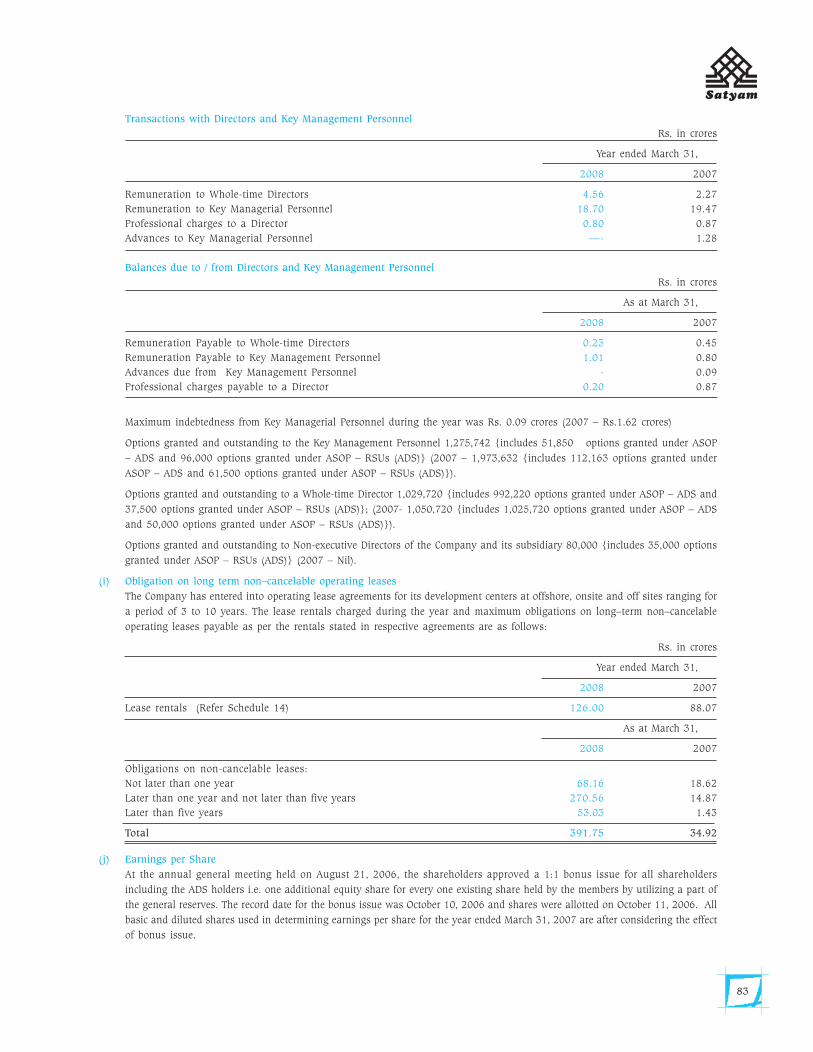
83
Transactions with Directors and Key Management Personnel
Rs. in crores
Year ended March 31,
2008 2007
Remuneration to Whole-time Directors 4.56 2.27
Remuneration to Key Managerial Personnel 18.70 19.47
Professional charges to a Director 0.80 0.87
Advances to Key Managerial Personnel —- 1.28
Balances due to / from Directors and Key Management Personnel
Rs. in crores
As at March 31,
2008 2007
Remuneration Payable to Whole-time Directors 0.23 0.45
Remuneration Payable to Key Management Personnel 1.01 0.80
Advances due from Key Management Personnel - 0.09
Professional charges payable to a Director 0.20 0.87
Maximum indebtedness from Key Managerial Personnel during the year was Rs. 0.09 crores (2007 – Rs.1.62 crores)
Options granted and outstanding to the Key Management Personnel 1,275,742 {includes 51,850 options granted under ASOP
– ADS and 96,000 options granted under ASOP – RSUs (ADS)} (2007 – 1,973,632 {includes 112,163 options granted under
ASOP – ADS and 61,500 options granted under ASOP – RSUs (ADS)}).
Options granted and outstanding to a Whole-time Director 1,029,720 {includes 992,220 options granted under ASOP – ADS and
37,500 options granted under ASOP – RSUs (ADS)}; (2007- 1,050,720 {includes 1,025,720 options granted under ASOP – ADS
and 50,000 options granted under ASOP – RSUs (ADS)}).
Options granted and outstanding to Non-executive Directors of the Company and its subsidiary 80,000 {includes 35,000 options
granted under ASOP – RSUs (ADS)} (2007 – Nil).
(i) Obligation on long term non–cancelable operating leases
The Company has entered into operating lease agreements for its development centers at offshore, onsite and off sites ranging for
a period of 3 to 10 years. The lease rentals charged during the year and maximum obligations on long–term non–cancelable
operating leases payable as per the rentals stated in respective agreements are as follows:
Rs. in crores
Year ended March 31,
2008 2007
Lease rentals (Refer Schedule 14) 126.00 88.07
As at March 31,
2008 2007
Obligations on non-cancelable leases:
Not later than one year 68.16 18.62
Later than one year and not later than five years 270.56 14.87
Later than five years 53.03 1.43
Total 391.75 34.92
(j) Earnings per Share
At the annual general meeting held on August 21, 2006, the shareholders approved a 1:1 bonus issue for all shareholders
including the ADS holders i.e. one additional equity share for every one existing share held by the members by utilizing a part of
the general reserves. The record date for the bonus issue was October 10, 2006 and shares were allotted on October 11, 2006. All
basic and diluted shares used in determining earnings per share for the year ended March 31, 2007 are after considering the effect
of bonus issue.
Sat_AR08_Final_Jul22_TP 2 Col.pmd 7/23/2008, 7:19 PM83
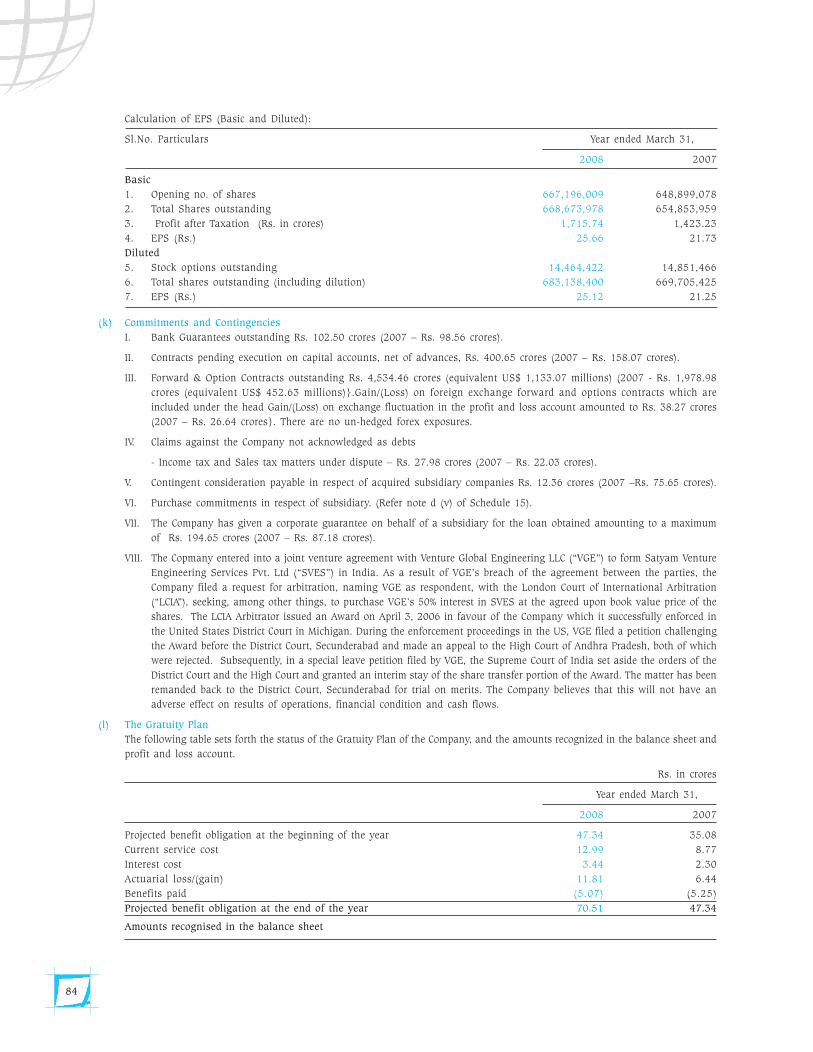
84
Calculation of EPS (Basic and Diluted):
Sl.No. Particulars Year ended March 31,
2008 2007
Basic
1. Opening no. of shares 667,196,009 648,899,078
2. Total Shares outstanding 668,673,978 654,853,959
3. Profit after Taxation (Rs. in crores) 1,715.74 1,423.23
4. EPS (Rs.) 25.66 21.73
Diluted
5. Stock options outstanding 14,464,422 14,851,466
6. Total shares outstanding (including dilution) 683,138,400 669,705,425
7. EPS (Rs.) 25.12 21.25
(k) Commitments and Contingencies
I. Bank Guarantees outstanding Rs. 102.50 crores (2007 – Rs. 98.56 crores).
II. Contracts pending execution on capital accounts, net of advances, Rs. 400.65 crores (2007 – Rs. 158.07 crores).
III. Forward & Option Contracts outstanding Rs. 4,534.46 crores (equivalent US$ 1,133.07 millions) (2007 - Rs. 1,978.98
crores (equivalent US$ 452.63 millions)}.Gain/(Loss) on foreign exchange forward and options contracts which are
included under the head Gain/(Loss) on exchange fluctuation in the profit and loss account amounted to Rs. 38.27 crores
(2007 – Rs. 26.64 crores}. There are no un-hedged forex exposures.
IV. Claims against the Company not acknowledged as debts
- Income tax and Sales tax matters under dispute – Rs. 27.98 crores (2007 – Rs. 22.03 crores).
V. Contingent consideration payable in respect of acquired subsidiary companies Rs. 12.36 crores (2007 –Rs. 75.65 crores).
VI. Purchase commitments in respect of subsidiary. (Refer note d (v) of Schedule 15).
VII. The Company has given a corporate guarantee on behalf of a subsidiary for the loan obtained amounting to a maximum
of Rs. 194.65 crores (2007 – Rs. 87.18 crores).
VIII. The Copmany entered into a joint venture agreement with Venture Global Engineering LLC (“VGE”) to form Satyam Venture
Engineering Services Pvt. Ltd (“SVES”) in India. As a result of VGE’s breach of the agreement between the parties, the
Company filed a request for arbitration, naming VGE as respondent, with the London Court of International Arbitration
(“LCIA”), seeking, among other things, to purchase VGE’s 50% interest in SVES at the agreed upon book value price of the
shares. The LCIA Arbitrator issued an Award on April 3, 2006 in favour of the Company which it successfully enforced in
the United States District Court in Michigan. During the enforcement proceedings in the US, VGE filed a petition challenging
the Award before the District Court, Secunderabad and made an appeal to the High Court of Andhra Pradesh, both of which
were rejected. Subsequently, in a special leave petition filed by VGE, the Supreme Court of India set aside the orders of the
District Court and the High Court and granted an interim stay of the share transfer portion of the Award. The matter has been
remanded back to the District Court, Secunderabad for trial on merits. The Company believes that this will not have an
adverse effect on results of operations, financial condition and cash flows.
(l) The Gratuity Plan
The following table sets forth the status of the Gratuity Plan of the Company, and the amounts recognized in the balance sheet and
profit and loss account.
Rs. in crores
Year ended March 31,
2008 2007
Projected benefit obligation at the beginning of the year 47.34 35.08
Current service cost 12.99 8.77
Interest cost 3.44 2.30
Actuarial loss/(gain) 11.81 6.44
Benefits paid (5.07) (5.25)
Projected benefit obligation at the end of the year 70.51 47.34
Amounts recognised in the balance sheet
Sat_AR08_Final_Jul22_TP 2 Col.pmd 7/23/2008, 7:19 PM84
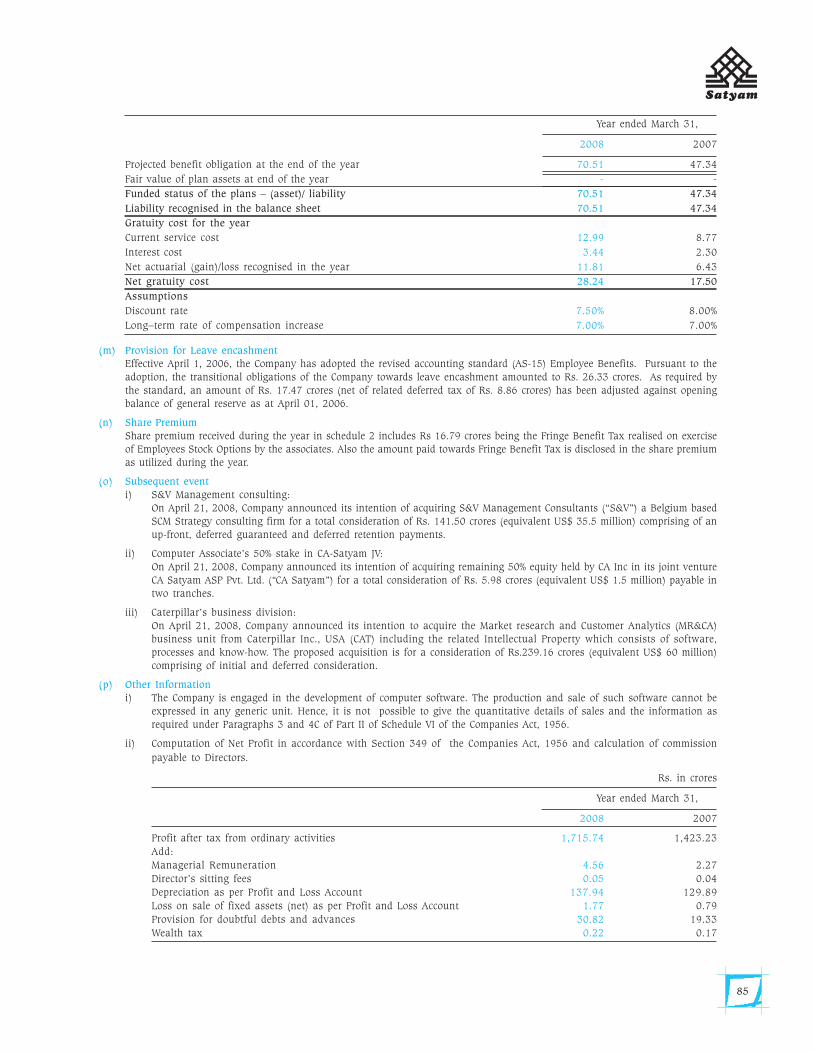
85
Year ended March 31,
2008 2007
Projected benefit obligation at the end of the year 70.51 47.34
Fair value of plan assets at end of the year - -
Funded status of the plans – (asset)/ liability 70.51 47.34
Liability recognised in the balance sheet 70.51 47.34
Gratuity cost for the year
Current service cost 12.99 8.77
Interest cost 3.44 2.30
Net actuarial (gain)/loss recognised in the year 11.81 6.43
Net gratuity cost 28.24 17.50
Assumptions
Discount rate 7.50% 8.00%
Long–term rate of compensation increase 7.00% 7.00%
(m) Provision for Leave encashmentEffective April 1, 2006, the Company has adopted the revised accounting standard (AS-15) Employee Benefits. Pursuant to the
adoption, the transitional obligations of the Company towards leave encashment amounted to Rs. 26.33 crores. As required by
the standard, an amount of Rs. 17.47 crores (net of related deferred tax of Rs. 8.86 crores) has been adjusted against opening
balance of general reserve as at April 01, 2006.
(n) Share Premium
Share premium received during the year in schedule 2 includes Rs 16.79 crores being the Fringe Benefit Tax realised on exercise
of Employees Stock Options by the associates. Also the amount paid towards Fringe Benefit Tax is disclosed in the share premium
as utilized during the year.
(o) Subsequent event
i) S&V Management consulting:
On April 21, 2008, Company announced its intention of acquiring S&V Management Consultants (“S&V”) a Belgium based
SCM Strategy consulting firm for a total consideration of Rs. 141.50 crores (equivalent US$ 35.5 million) comprising of an
up-front, deferred guaranteed and deferred retention payments.
ii) Computer Associate’s 50% stake in CA-Satyam JV:
On April 21, 2008, Company announced its intention of acquiring remaining 50% equity held by CA Inc in its joint venture
CA Satyam ASP Pvt. Ltd. (“CA Satyam”) for a total consideration of Rs. 5.98 crores (equivalent US$ 1.5 million) payable in
two tranches.
iii) Caterpillar’s business division:
On April 21, 2008, Company announced its intention to acquire the Market research and Customer Analytics (MR&CA)
business unit from Caterpillar Inc., USA (CAT) including the related Intellectual Property which consists of software,
processes and know-how. The proposed acquisition is for a consideration of Rs.239.16 crores (equivalent US$ 60 million)
comprising of initial and deferred consideration.
(p) Other Information
i) The Company is engaged in the development of computer software. The production and sale of such software cannot be
expressed in any generic unit. Hence, it is not possible to give the quantitative details of sales and the information as
required under Paragraphs 3 and 4C of Part II of Schedule VI of the Companies Act, 1956.
ii) Computation of Net Profit in accordance with Section 349 of the Companies Act, 1956 and calculation of commission
payable to Directors.
Rs. in crores
Year ended March 31,
2008 2007
Profit after tax from ordinary activities 1,715.74 1,423.23
Add:
Managerial Remuneration 4.56 2.27
Director’s sitting fees 0.05 0.04
Depreciation as per Profit and Loss Account 137.94 129.89
Loss on sale of fixed assets (net) as per Profit and Loss Account 1.77 0.79
Provision for doubtful debts and advances 30.82 19.33
Wealth tax 0.22 0.17
Sat_AR08_Final_Jul22_TP 2 Col.pmd 7/23/2008, 7:19 PM85
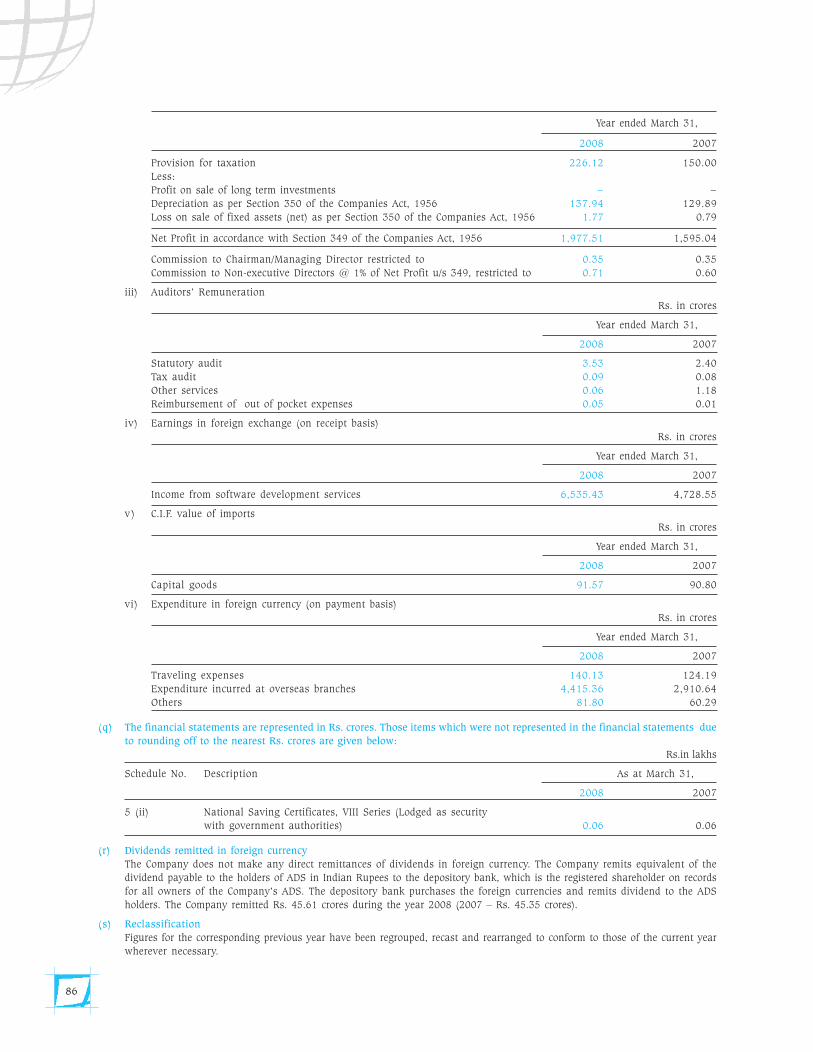
86
Year ended March 31,
2008 2007
Provision for taxation 226.12 150.00
Less:
Profit on sale of long term investments – –
Depreciation as per Section 350 of the Companies Act, 1956 137.94 129.89
Loss on sale of fixed assets (net) as per Section 350 of the Companies Act, 1956 1.77 0.79
Net Profit in accordance with Section 349 of the Companies Act, 1956 1,977.51 1,595.04
Commission to Chairman/Managing Director restricted to 0.35 0.35
Commission to Non-executive Directors @ 1% of Net Profit u/s 349, restricted to 0.71 0.60
iii) Auditors’ Remuneration
Rs. in crores
Year ended March 31,
2008 2007
Statutory audit 3.53 2.40
Tax audit 0.09 0.08
Other services 0.06 1.18
Reimbursement of out of pocket expenses 0.05 0.01
iv) Earnings in foreign exchange (on receipt basis)
Rs. in crores
Year ended March 31,
2008 2007
Income from software development services 6,535.43 4,728.55
v) C.I.F. value of imports
Rs. in crores
Year ended March 31,
2008 2007
Capital goods 91.57 90.80
vi) Expenditure in foreign currency (on payment basis)
Rs. in crores
Year ended March 31,
2008 2007
Traveling expenses 140.13 124.19
Expenditure incurred at overseas branches 4,415.36 2,910.64
Others 81.80 60.29
(q) The financial statements are represented in Rs. crores. Those items which were not represented in the financial statements due
to rounding off to the nearest Rs. crores are given below:
Rs.in lakhs
Schedule No. Description As at March 31,
2008 2007
5 (ii) National Saving Certificates, VIII Series (Lodged as security
with government authorities) 0.06 0.06
(r) Dividends remitted in foreign currency
The Company does not make any direct remittances of dividends in foreign currency. The Company remits equivalent of the
dividend payable to the holders of ADS in Indian Rupees to the depository bank, which is the registered shareholder on records
for all owners of the Company’s ADS. The depository bank purchases the foreign currencies and remits dividend to the ADS
holders. The Company remitted Rs. 45.61 crores during the year 2008 (2007 – Rs. 45.35 crores).
(s) Reclassification
Figures for the corresponding previous year have been regrouped, recast and rearranged to conform to those of the current year
wherever necessary.
Sat_AR08_Final_Jul22_TP 2 Col.pmd 7/23/2008, 7:19 PM86
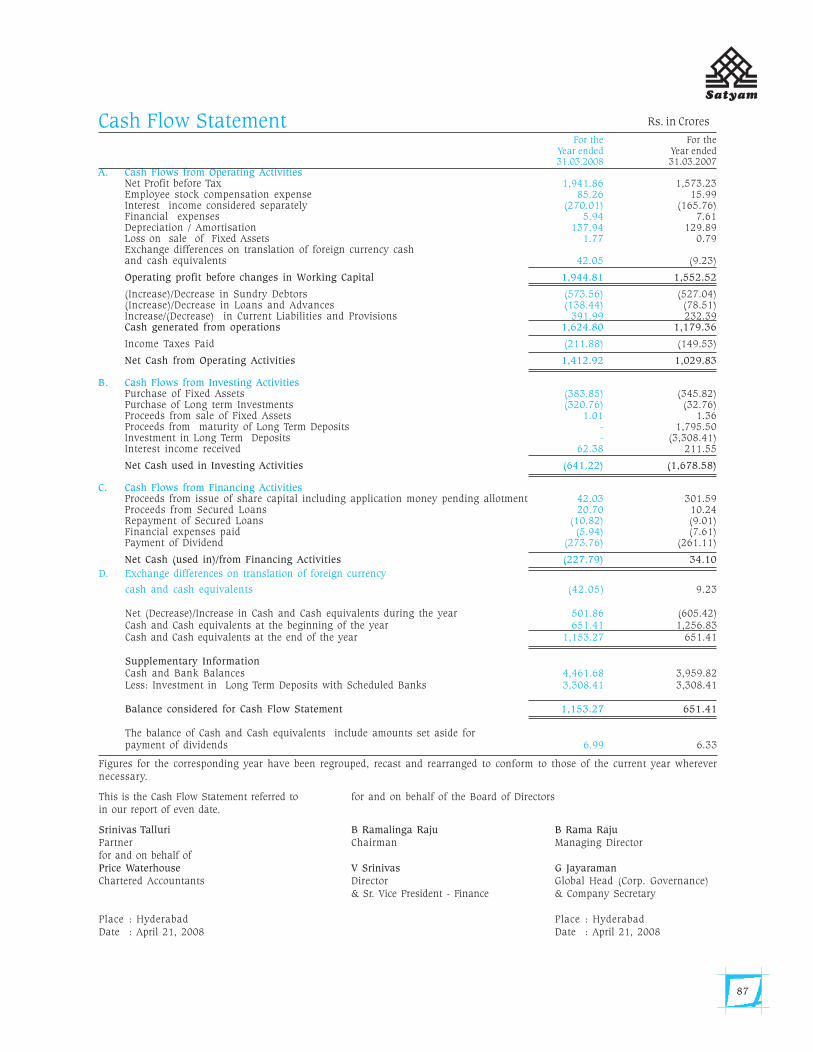
87
Cash Flow StatementFor the For the
Year ended Year ended31.03.2008 31.03.2007
A. Cash Flows from Operating ActivitiesNet Profit before Tax 1,941.86 1,573.23Employee stock compensation expense 85.26 15.99Interest income considered separately (270.01) (165.76)Financial expenses 5.94 7.61Depreciation / Amortisation 137.94 129.89Loss on sale of Fixed Assets 1.77 0.79Exchange differences on translation of foreign currency cashand cash equivalents 42.05 (9.23)
Operating profit before changes in Working Capital 1,944.81 1,552.52
(Increase)/Decrease in Sundry Debtors (573.56) (527.04)(Increase)/Decrease in Loans and Advances (138.44) (78.51)Increase/(Decrease) in Current Liabilities and Provisions 391.99 232.39Cash generated from operations 1,624.80 1,179.36
Income Taxes Paid (211.88) (149.53)
Net Cash from Operating Activities 1,412.92 1,029.83
B. Cash Flows from Investing ActivitiesPurchase of Fixed Assets (383.85) (345.82)Purchase of Long term Investments (320.76) (32.76)Proceeds from sale of Fixed Assets 1.01 1.36Proceeds from maturity of Long Term Deposits - 1,795.50Investment in Long Term Deposits - (3,308.41)Interest income received 62.38 211.55
Net Cash used in Investing Activities (641.22) (1,678.58)
C. Cash Flows from Financing ActivitiesProceeds from issue of share capital including application money pending allotment 42.03 301.59Proceeds from Secured Loans 20.70 10.24Repayment of Secured Loans (10.82) (9.01)Financial expenses paid (5.94) (7.61)Payment of Dividend (273.76) (261.11)
Net Cash (used in)/from Financing Activities (227.79) 34.10
D. Exchange differences on translation of foreign currency
cash and cash equivalents (42.05) 9.23
Net (Decrease)/Increase in Cash and Cash equivalents during the year 501.86 (605.42)Cash and Cash equivalents at the beginning of the year 651.41 1,256.83Cash and Cash equivalents at the end of the year 1,153.27 651.41
Supplementary InformationCash and Bank Balances 4,461.68 3,959.82Less: Investment in Long Term Deposits with Scheduled Banks 3,308.41 3,308.41
Balance considered for Cash Flow Statement 1,153.27 651.41
The balance of Cash and Cash equivalents include amounts set aside forpayment of dividends 6.99 6.33
Figures for the corresponding year have been regrouped, recast and rearranged to conform to those of the current year wherevernecessary.
This is the Cash Flow Statement referred to for and on behalf of the Board of Directorsin our report of even date.
Srinivas Talluri B Ramalinga Raju B Rama RajuPartner Chairman Managing Directorfor and on behalf ofPrice Waterhouse V Srinivas G JayaramanChartered Accountants Director Global Head (Corp. Governance)
& Sr. Vice President - Finance & Company Secretary
Place : Hyderabad Place : HyderabadDate : April 21, 2008 Date : April 21, 2008
Rs. in Crores
Sat_AR08_Final_Jul22_TP 2 Col.pmd 7/23/2008, 7:19 PM87
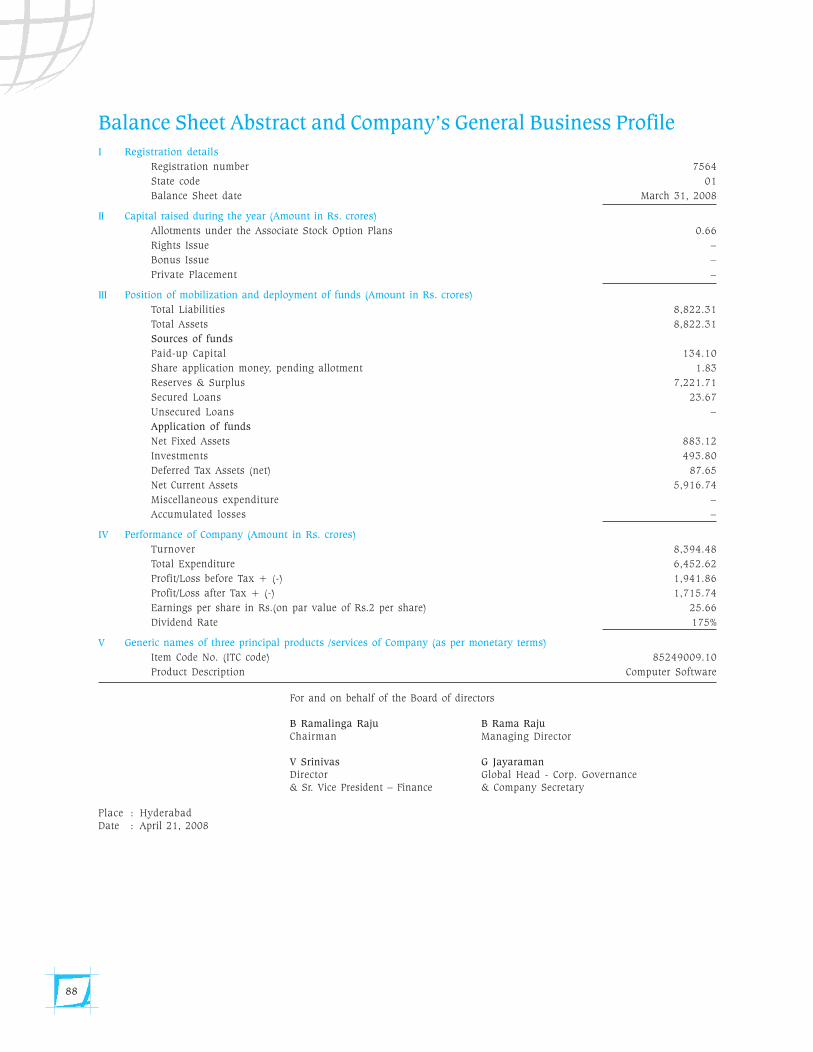
88
Balance Sheet Abstract and Company’s General Business ProfileI Registration details
Registration number 7564
State code 01
Balance Sheet date March 31, 2008
II Capital raised during the year (Amount in Rs. crores)
Allotments under the Associate Stock Option Plans 0.66
Rights Issue –
Bonus Issue –
Private Placement –
III Position of mobilization and deployment of funds (Amount in Rs. crores)
Total Liabilities 8,822.31
Total Assets 8,822.31
Sources of funds
Paid-up Capital 134.10
Share application money, pending allotment 1.83
Reserves & Surplus 7,221.71
Secured Loans 23.67
Unsecured Loans –
Application of funds
Net Fixed Assets 883.12
Investments 493.80
Deferred Tax Assets (net) 87.65
Net Current Assets 5,916.74
Miscellaneous expenditure –
Accumulated losses –
IV Performance of Company (Amount in Rs. crores)
Turnover 8,394.48
Total Expenditure 6,452.62
Profit/Loss before Tax + (-) 1,941.86
Profit/Loss after Tax + (-) 1,715.74
Earnings per share in Rs.(on par value of Rs.2 per share) 25.66
Dividend Rate 175%
V Generic names of three principal products /services of Company (as per monetary terms)
Item Code No. (ITC code) 85249009.10
Product Description Computer Software
For and on behalf of the Board of directors
B Ramalinga Raju B Rama RajuChairman Managing Director
V Srinivas G JayaramanDirector Global Head - Corp. Governance& Sr. Vice President – Finance & Company Secretary
Place : HyderabadDate : April 21, 2008
Sat_AR08_Final_Jul22_TP 2 Col.pmd 7/23/2008, 7:19 PM88
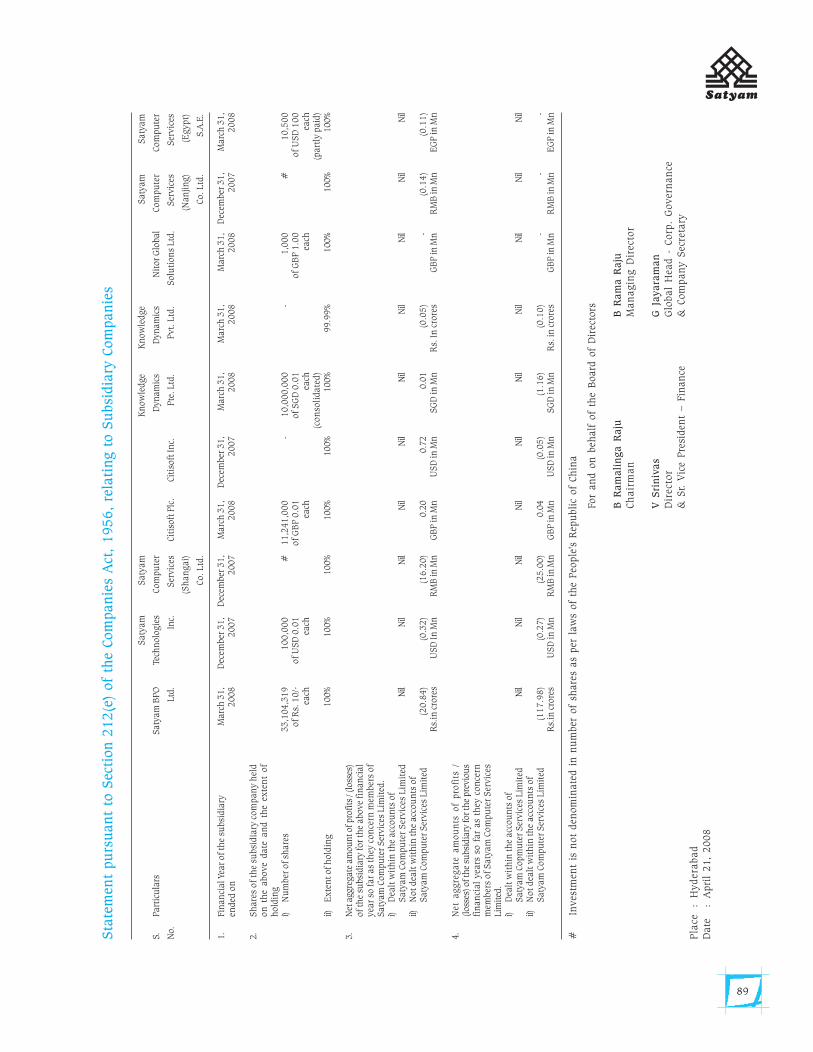
89
Sta
tem
ent
pu
rsu
an
t to
Sec
tion
21
2(e
) of
the
Com
pan
ies
Act
, 1
95
6,
rela
tin
g t
o S
ubsi
dia
ry C
om
pan
ies
Saty
am
Saty
am
Kn
ow
ledge
Kn
ow
ledge
Saty
am
Saty
am
S.Part
icu
lars
Saty
am
BPO
Tech
nolo
gie
sCom
pu
ter
Dyn
am
ics
Dyn
am
ics
Nit
or
Glo
bal
Com
pu
ter
Com
pu
ter
No.
Ltd
.In
c.Ser
vic
esCit
isoft
Plc
.Cit
isoft
In
c.Pte
. Ltd
.Pvt.
Ltd
.Solu
tion
s Ltd
.Ser
vic
esSer
vic
es
(Sh
an
gai)
(Nan
jin
g)
(Egypt)
Co. Ltd
.Co. Ltd
.S.A
.E.
#
In
ves
tmen
t is
not
den
om
inate
d i
n n
um
ber
of
share
s as
per
law
s of
the
Peo
ple
's R
epu
bli
c of
Ch
ina
For
an
d o
n b
ehalf
of
the
Board
of
Dir
ecto
rs
B R
am
ali
nga R
aju
B R
am
a R
aju
Ch
air
ma
nM
an
agin
g D
irec
tor
V S
rin
ivas
G J
ayara
man
Dir
ecto
rG
lobal
Hea
d -
Corp
. G
over
nan
ce&
Sr. V
ice
Pre
siden
t – F
inan
ce&
Com
pan
y S
ecre
tary
Pla
ce:
Hyd
era
ba
dD
ate
:A
pri
l 2
1,
20
08
1.Fi
nan
cial Y
ear
of th
e su
bsi
dia
ryen
ded
on
2.S
hare
s of th
e su
bsi
dia
ry c
om
pan
y h
eld
on
th
e above
date
an
d t
he
exte
nt
of
hold
ing
i)N
um
ber
of sh
are
s
ii)E
xte
nt of h
old
ing
3.N
et a
ggre
gate
am
ou
nt o
f pro
fits
/ (l
oss
es)
of th
e su
bsi
dia
ry for
the
above
fin
an
cial
yea
r so
far
as
they
con
cern
mem
ber
s of
Saty
am
Com
pu
ter
Ser
vic
es L
imit
ed.
i)D
ealt
wit
hin
th
e acc
ou
nts
of
Saty
am
Com
pu
ter
Ser
vic
es L
imit
edii)
Not dea
lt w
ith
in th
e acc
ou
nts
of
Saty
am
Com
pu
ter
Ser
vic
es L
imit
ed
4.N
et a
ggre
gate
am
ou
nts
of
pro
fits
/(l
oss
es) of th
e su
bsid
iary
for th
e pre
viou
sfi
nan
cial
yea
rs s
o f
ar
as
they
con
cern
mem
ber
s of S
aty
am
Com
pu
ter
Ser
vic
esLim
ited
.i)
Dea
lt w
ith
in th
e acc
ou
nts
of
Saty
am
Copm
ute
r Ser
vic
es L
imit
edii)
Not dea
lt w
ith
in th
e acc
ou
nts
of
Saty
am
Com
pu
ter
Ser
vic
es L
imit
ed
Marc
h 3
1,
Dec
ember
31,
Dec
ember
31,
Marc
h 3
1,
Dec
ember
31,
Marc
h 3
1,
Marc
h 3
1,
Marc
h 3
1,
Dec
ember
31,
Marc
h 3
1,
2008
2007
2007
2008
2007
2008
2008
2008
2007
2008
33,1
04,3
19
100,0
00
#11,2
41,0
00
-10,0
00,0
00
-1,0
00
#10,5
00
of R
s. 1
0/-
of U
SD
0.0
1of G
BP 0
.01
of SG
D 0
.01
of G
BP 1
.00
of U
SD
100
each
each
each
each
each
each
(con
soli
date
d)
(part
ly p
aid
)100%
100%
100%
100%
100%
100%
99.9
9%
100%
100%
100%
Nil
Nil
Nil
Nil
Nil
Nil
Nil
Nil
Nil
Nil
(20.8
4)
(0.3
2)
(16.2
0)
0.2
00.7
20.0
1(0
.05)
-(0
.14)
(0.1
1)
Rs.
in c
rore
sU
SD
In
Mn
RM
B in
Mn
GB
P in
Mn
USD
in M
nSG
D in
Mn
Rs.
In
cro
res
GB
P in
Mn
RM
B in
Mn
EG
P in
Mn
Nil
Nil
Nil
Nil
Nil
Nil
Nil
Nil
Nil
Nil
(117.9
8)
(0.2
7)
(25.0
0)
0.0
4(0
.05)
(1.1
6)
(0.1
0)
--
-R
s.in
cro
res
USD
in M
nR
MB
in M
nG
BP in
Mn
USD
in M
nSG
D in
Mn
Rs.
in c
rore
sG
BP in
Mn
RM
B in
Mn
EG
P in
Mn
Sat_AR08_Final_Jul22_TP 2 Col.pmd 7/23/2008, 7:19 PM89
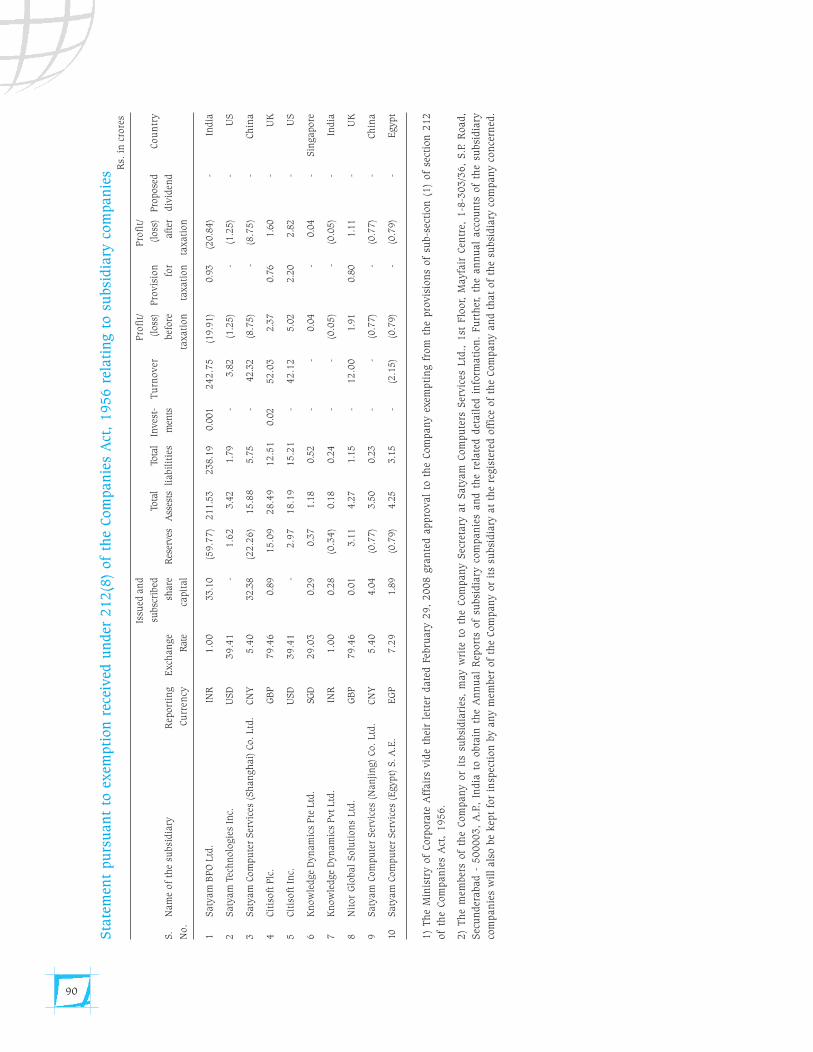
90
Sta
tem
ent
pu
rsu
an
t to
exem
pti
on
rec
eived
un
der
21
2(8
) of
the
Com
pan
ies
Act
, 1
95
6 r
elati
ng t
o s
ubsi
dia
ry c
om
pan
ies
Issu
ed a
nd
Pro
fit/
Pro
fit/
subsc
ribed
Tota
lTo
tal
Inves
t-T
urn
over
(loss
)Pro
vis
ion
(loss
)Pro
pose
dCou
ntr
y
S.
Nam
e of
the
subsi
dia
ryR
eport
ing
Exch
an
ge
share
Res
erve
sA
sses
tsli
abil
itie
sm
ents
bef
ore
for
aft
erdiv
iden
d
No.
Cu
rren
cyR
ate
capit
al
taxati
on
taxati
on
taxati
on
1S
aty
am
BPO
Ltd
.IN
R
1
.00
33.1
0 (5
9.7
7)
211.5
3238.1
90.0
01
2
42
.75
(19.9
1)
0.9
3(2
0.8
4)
-In
dia
2S
aty
am
Tec
hn
olo
gie
s In
c.U
SD
3
9.4
1
-
1
.62
3.4
21.7
9-
3.8
2(1
.25)
-(1
.25)
-
US
3S
aty
am
Com
pu
ter
Ser
vic
es (
Sh
an
gh
ai)
Co.
Ltd
.CN
Y
5
.40
32.3
8 (2
2.2
6)
15
.88
5.7
5-
42.3
2(8
.75)
-
(8
.75
)-
Ch
ina
4Cit
isoft
Plc
.G
BP
7
9.4
60.8
9
15
.09
2
8.4
9
1
2.5
10.0
2
5
2.0
32.3
70.7
61.6
0-
UK
5Cit
isoft
In
c.U
SD
3
9.4
1-
2.9
7
1
8.1
9
1
5.2
1-
42
.12
5.0
22.2
02.8
2-
US
6K
now
ledge
Dyn
am
ics
Pte
Ltd
.SG
D
29
.03
0.2
90.3
71.1
80.5
2-
-0.0
4-
0.0
4-
Sin
gapore
7K
now
ledge
Dyn
am
ics
Pvt
Ltd
.IN
R
1
.00
0.2
8
(0.3
4)
0.1
80.2
4-
-
(0
.05
)
-(0
.05)
-
India
8N
itor
Glo
bal
Solu
tion
s Ltd
.G
BP
7
9.4
60.0
13.1
14.2
71.1
5-
12
.00
1.9
10.8
01.1
1-
UK
9S
aty
am
Com
pu
ter
Ser
vic
es (
Nan
jin
g)
Co.
Ltd
.CN
Y
5
.40
4.0
4(0
.77)
3.5
00.2
3 -
-(0
.77)
-(0
.77)
-Ch
ina
10S
aty
am
Com
pu
ter
Ser
vic
es (
Egypt)
S.
A.E
.E
GP
7.2
91.8
9(0
.79)
4.2
53.1
5-
(2.1
5)
(0.7
9)
-(0
.79)
-E
gyp
t
1)
Th
e M
inis
try o
f Corp
ora
te A
ffair
s vid
e th
eir
lett
er d
ate
d F
ebru
ary
29
, 2
00
8 g
ran
ted a
ppro
val
to t
he
Com
pan
y e
xem
pti
ng f
rom
th
e pro
vis
ion
s of
sub-s
ecti
on
(1
) of
sect
ion
21
2
of
the
Com
pan
ies
Act
, 1
95
6.
2)
Th
e m
ember
s of
the
Com
pan
y o
r it
s su
bsi
dia
ries
, m
ay w
rite
to t
he
Com
pan
y S
ecre
tary
at
Saty
am
Com
pu
ters
Ser
vic
es L
td.,
1st
Flo
or,
Mayfa
ir C
entr
e, 1
-8-3
03
/36
, S
.P.
Road,
Sec
un
der
abad -
50
00
03
, A
.P.,
In
dia
to o
bta
in t
he
An
nu
al
Rep
ort
s of
subsi
dia
ry c
om
pan
ies
an
d t
he
rela
ted d
etail
ed i
nfo
rmati
on
. Fu
rth
er,
the
an
nu
al
acc
ou
nts
of
the
subsi
dia
ry
com
pan
ies
wil
l als
o b
e kep
t fo
r in
spec
tion
by a
ny m
ember
of
the
Com
pan
y o
r it
s su
bsi
dia
ry a
t th
e re
gis
tere
d o
ffic
e of
the
Com
pan
y a
nd t
hat
of
the
subsi
dia
ry c
om
pan
y c
on
cern
ed.
Rs.
in
cro
res
Sat_AR08_Final_Jul22_TP 2 Col.pmd 7/23/2008, 7:19 PM90
91
Additional Information to Investors
• Balance sheet with tangibles and intangibles
• Human resource accounting
• Brand value
• Economic Value Added statement
• Enterprise value
• Financial ratios
Sat_AR08_Final_Jul22_TP 2 Col.pmd 7/23/2008, 7:19 PM91
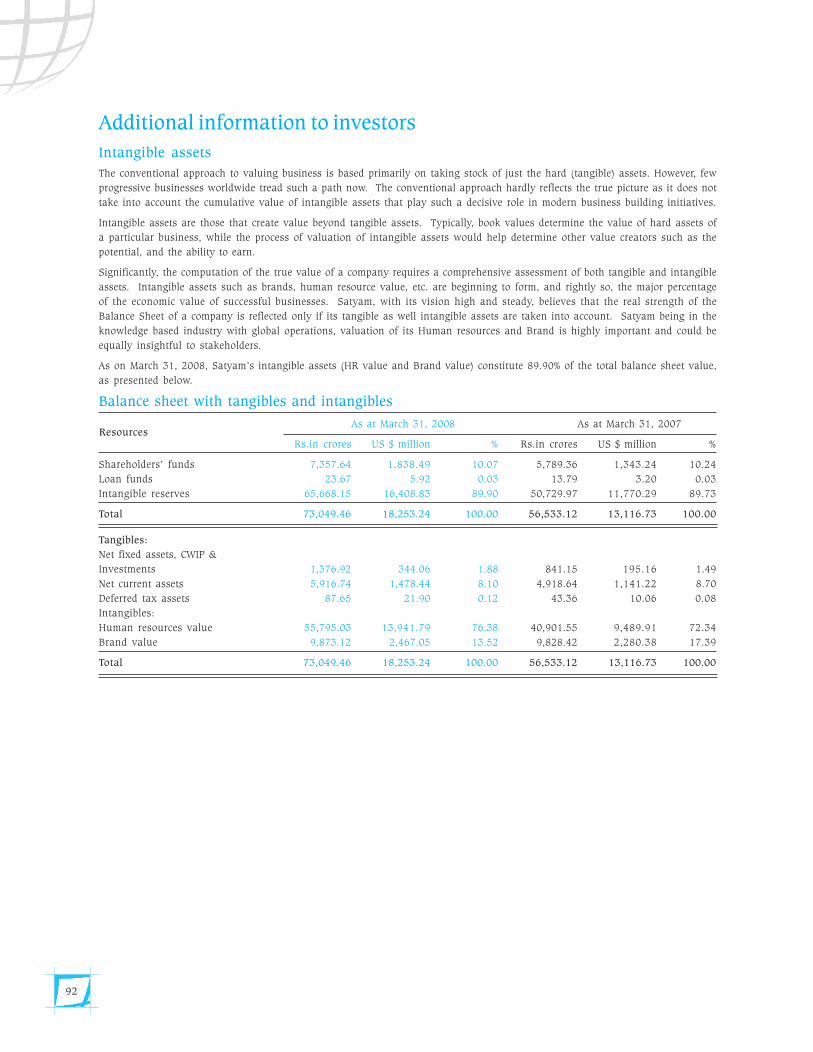
92
Additional information to investors
Intangible assets
The conventional approach to valuing business is based primarily on taking stock of just the hard (tangible) assets. However, few
progressive businesses worldwide tread such a path now. The conventional approach hardly reflects the true picture as it does not
take into account the cumulative value of intangible assets that play such a decisive role in modern business building initiatives.
Intangible assets are those that create value beyond tangible assets. Typically, book values determine the value of hard assets of
a particular business, while the process of valuation of intangible assets would help determine other value creators such as the
potential, and the ability to earn.
Significantly, the computation of the true value of a company requires a comprehensive assessment of both tangible and intangible
assets. Intangible assets such as brands, human resource value, etc. are beginning to form, and rightly so, the major percentage
of the economic value of successful businesses. Satyam, with its vision high and steady, believes that the real strength of the
Balance Sheet of a company is reflected only if its tangible as well intangible assets are taken into account. Satyam being in the
knowledge based industry with global operations, valuation of its Human resources and Brand is highly important and could be
equally insightful to stakeholders.
As on March 31, 2008, Satyam’s intangible assets (HR value and Brand value) constitute 89.90% of the total balance sheet value,
as presented below.
Balance sheet with tangibles and intangibles
As at March 31, 2008 As at March 31, 2007
Rs.in crores US $ million % Rs.in crores US $ million %
Shareholders’ funds 7,357.64 1,838.49 10.07 5,789.36 1,343.24 10.24
Loan funds 23.67 5.92 0.03 13.79 3.20 0.03
Intangible reserves 65,668.15 16,408.83 89.90 50,729.97 11,770.29 89.73
Total 73,049.46 18,253.24 100.00 56,533.12 13,116.73 100.00
Tangibles:
Net fixed assets, CWIP &
Investments 1,376.92 344.06 1.88 841.15 195.16 1.49
Net current assets 5,916.74 1,478.44 8.10 4,918.64 1,141.22 8.70
Deferred tax assets 87.65 21.90 0.12 43.36 10.06 0.08
Intangibles:
Human resources value 55,795.03 13,941.79 76.38 40,901.55 9,489.91 72.34
Brand value 9,873.12 2,467.05 13.52 9,828.42 2,280.38 17.39
Total 73,049.46 18,253.24 100.00 56,533.12 13,116.73 100.00
Resources
Sat_AR08_Final_Jul22_TP 2 Col.pmd 7/23/2008, 7:19 PM92
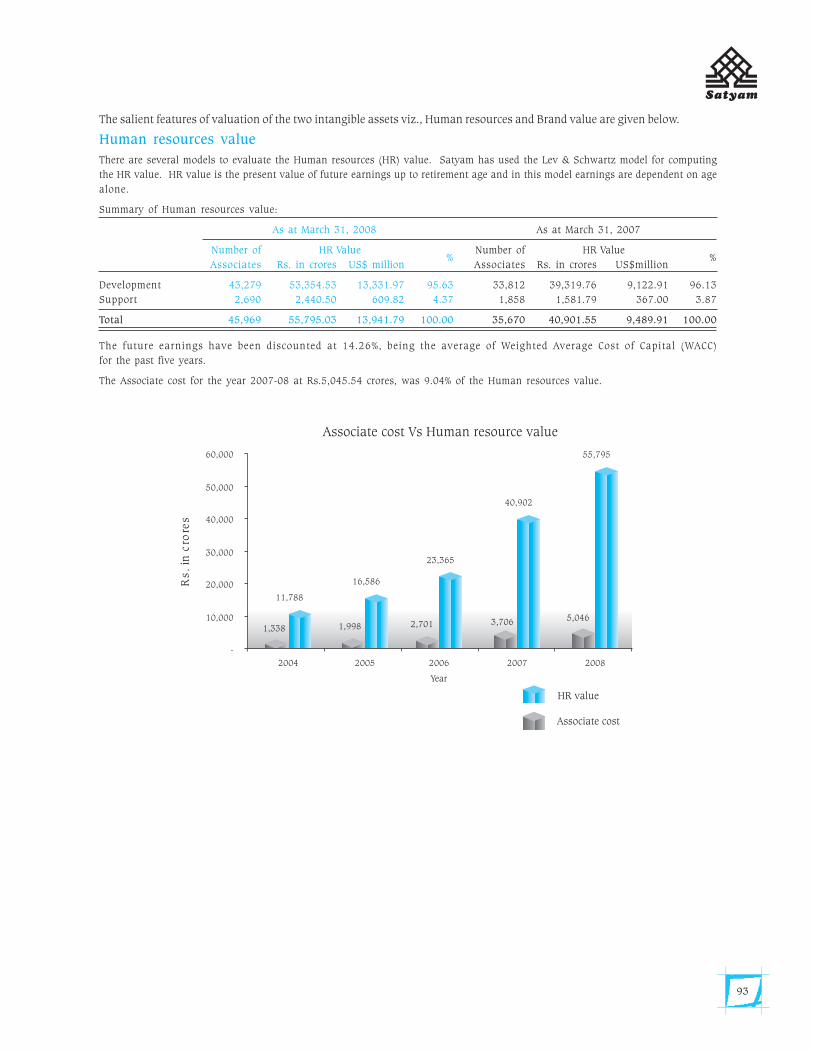
93
The salient features of valuation of the two intangible assets viz., Human resources and Brand value are given below.
Human resources value
There are several models to evaluate the Human resources (HR) value. Satyam has used the Lev & Schwartz model for computing
the HR value. HR value is the present value of future earnings up to retirement age and in this model earnings are dependent on age
alone.
Summary of Human resources value:
As at March 31, 2008 As at March 31, 2007
Number of HR Value%
Number of HR Value%
Associates Rs. in crores US$ million Associates Rs. in crores US$million
Development 43,279 53,354.53 13,331.97 95.63 33,812 39,319.76 9,122.91 96.13
Support 2,690 2,440.50 609.82 4.37 1,858 1,581.79 367.00 3.87
Total 45,969 55,795.03 13,941.79 100.00 35,670 40,901.55 9,489.91 100.00
The future earnings have been discounted at 14.26%, being the average of Weighted Average Cost of Capital (WACC)
for the past five years.
The Associate cost for the year 2007-08 at Rs.5,045.54 crores, was 9.04% of the Human resources value.
Sat_AR08_Final_Jul22_TP 2 Col.pmd 7/23/2008, 7:19 PM93
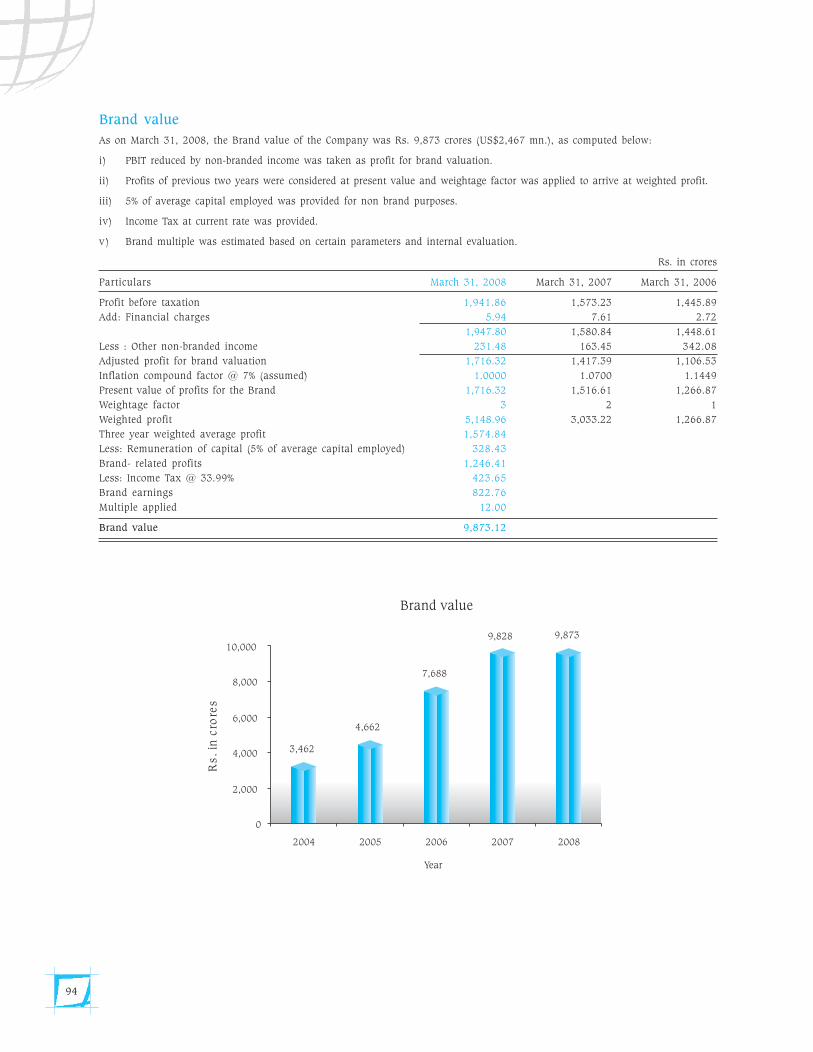
94
Brand value
As on March 31, 2008, the Brand value of the Company was Rs. 9,873 crores (US$2,467 mn.), as computed below:
i) PBIT reduced by non-branded income was taken as profit for brand valuation.
ii) Profits of previous two years were considered at present value and weightage factor was applied to arrive at weighted profit.
iii) 5% of average capital employed was provided for non brand purposes.
iv) Income Tax at current rate was provided.
v) Brand multiple was estimated based on certain parameters and internal evaluation.
Rs. in crores
Particulars March 31, 2008 March 31, 2007 March 31, 2006
Profit before taxation 1,941.86 1,573.23 1,445.89
Add: Financial charges 5.94 7.61 2.72
1,947.80 1,580.84 1,448.61
Less : Other non-branded income 231.48 163.45 342.08
Adjusted profit for brand valuation 1,716.32 1,417.39 1,106.53
Inflation compound factor @ 7% (assumed) 1.0000 1.0700 1.1449
Present value of profits for the Brand 1,716.32 1,516.61 1,266.87
Weightage factor 3 2 1
Weighted profit 5,148.96 3,033.22 1,266.87
Three year weighted average profit 1,574.84
Less: Remuneration of capital (5% of average capital employed) 328.43
Brand- related profits 1,246.41
Less: Income Tax @ 33.99% 423.65
Brand earnings 822.76
Multiple applied 12.00
Brand value 9,873.12
Sat_AR08_Final_Jul22_TP 2 Col.pmd 7/23/2008, 7:19 PM94
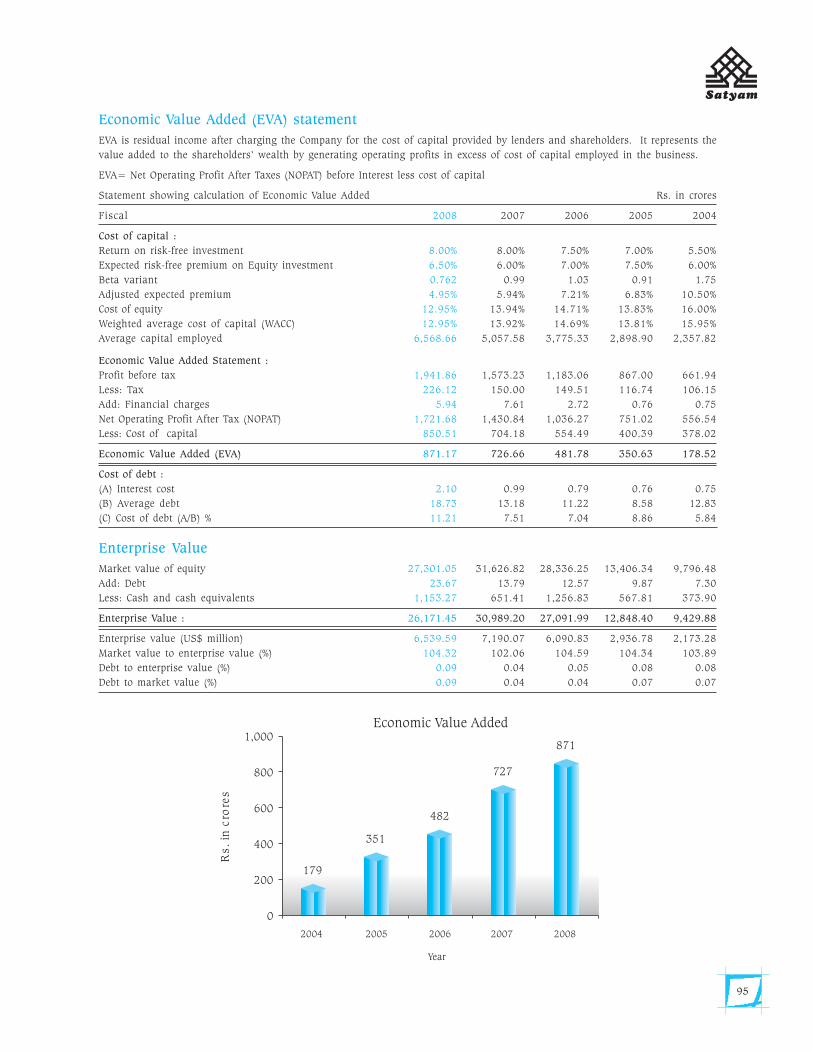
95
Economic Value Added (EVA) statement
EVA is residual income after charging the Company for the cost of capital provided by lenders and shareholders. It represents the
value added to the shareholders’ wealth by generating operating profits in excess of cost of capital employed in the business.
EVA= Net Operating Profit After Taxes (NOPAT) before Interest less cost of capital
Statement showing calculation of Economic Value Added Rs. in crores
Fiscal 2008 2007 2006 2005 2004
Cost of capital :
Return on risk-free investment 8.00% 8.00% 7.50% 7.00% 5.50%
Expected risk-free premium on Equity investment 6.50% 6.00% 7.00% 7.50% 6.00%
Beta variant 0.762 0.99 1.03 0.91 1.75
Adjusted expected premium 4.95% 5.94% 7.21% 6.83% 10.50%
Cost of equity 12.95% 13.94% 14.71% 13.83% 16.00%
Weighted average cost of capital (WACC) 12.95% 13.92% 14.69% 13.81% 15.95%
Average capital employed 6,568.66 5,057.58 3,775.33 2,898.90 2,357.82
Economic Value Added Statement :
Profit before tax 1,941.86 1,573.23 1,183.06 867.00 661.94
Less: Tax 226.12 150.00 149.51 116.74 106.15
Add: Financial charges 5.94 7.61 2.72 0.76 0.75
Net Operating Profit After Tax (NOPAT) 1,721.68 1,430.84 1,036.27 751.02 556.54
Less: Cost of capital 850.51 704.18 554.49 400.39 378.02
Economic Value Added (EVA) 871.17 726.66 481.78 350.63 178.52
Cost of debt :
(A) Interest cost 2.10 0.99 0.79 0.76 0.75
(B) Average debt 18.73 13.18 11.22 8.58 12.83
(C) Cost of debt (A/B) % 11.21 7.51 7.04 8.86 5.84
Enterprise Value
Market value of equity 27,301.05 31,626.82 28,336.25 13,406.34 9,796.48
Add: Debt 23.67 13.79 12.57 9.87 7.30
Less: Cash and cash equivalents 1,153.27 651.41 1,256.83 567.81 373.90
Enterprise Value : 26,171.45 30,989.20 27,091.99 12,848.40 9,429.88
Enterprise value (US$ million) 6,539.59 7,190.07 6,090.83 2,936.78 2,173.28
Market value to enterprise value (%) 104.32 102.06 104.59 104.34 103.89
Debt to enterprise value (%) 0.09 0.04 0.05 0.08 0.08
Debt to market value (%) 0.09 0.04 0.04 0.07 0.07
Sat_AR08_Final_Jul22_TP 2 Col.pmd 7/23/2008, 7:19 PM95
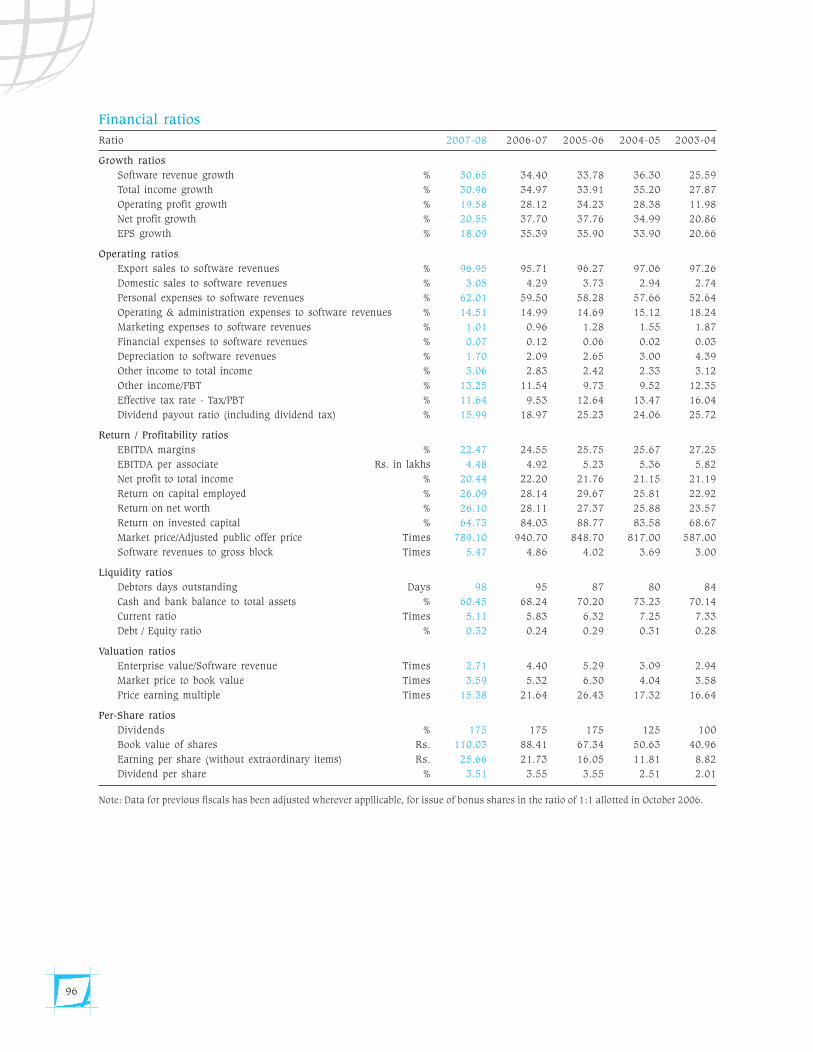
96
Financial ratios
Ratio 2007-08 2006-07 2005-06 2004-05 2003-04
Growth ratios
Software revenue growth % 30.65 34.40 33.78 36.30 25.59
Total income growth % 30.96 34.97 33.91 35.20 27.87
Operating profit growth % 19.58 28.12 34.23 28.38 11.98
Net profit growth % 20.55 37.70 37.76 34.99 20.86
EPS growth % 18.09 35.39 35.90 33.90 20.66
Operating ratios
Export sales to software revenues % 96.95 95.71 96.27 97.06 97.26
Domestic sales to software revenues % 3.05 4.29 3.73 2.94 2.74
Personal expenses to software revenues % 62.01 59.50 58.28 57.66 52.64
Operating & administration expenses to software revenues % 14.51 14.99 14.69 15.12 18.24
Marketing expenses to software revenues % 1.01 0.96 1.28 1.55 1.87
Financial expenses to software revenues % 0.07 0.12 0.06 0.02 0.03
Depreciation to software revenues % 1.70 2.09 2.65 3.00 4.39
Other income to total income % 3.06 2.83 2.42 2.33 3.12
Other income/PBT % 13.25 11.54 9.73 9.52 12.35
Effective tax rate - Tax/PBT % 11.64 9.53 12.64 13.47 16.04
Dividend payout ratio (including dividend tax) % 15.99 18.97 25.23 24.06 25.72
Return / Profitability ratios
EBITDA margins % 22.47 24.55 25.75 25.67 27.25
EBITDA per associate Rs. in lakhs 4.48 4.92 5.23 5.36 5.82
Net profit to total income % 20.44 22.20 21.76 21.15 21.19
Return on capital employed % 26.09 28.14 29.67 25.81 22.92
Return on net worth % 26.10 28.11 27.37 25.88 23.57
Return on invested capital % 64.73 84.03 88.77 83.58 68.67
Market price/Adjusted public offer price Times 789.10 940.70 848.70 817.00 587.00
Software revenues to gross block Times 5.47 4.86 4.02 3.69 3.00
Liquidity ratios
Debtors days outstanding Days 98 95 87 80 84
Cash and bank balance to total assets % 60.45 68.24 70.20 73.23 70.14
Current ratio Times 5.11 5.83 6.32 7.25 7.33
Debt / Equity ratio % 0.32 0.24 0.29 0.31 0.28
Valuation ratios
Enterprise value/Software revenue Times 2.71 4.40 5.29 3.09 2.94
Market price to book value Times 3.59 5.32 6.30 4.04 3.58
Price earning multiple Times 15.38 21.64 26.43 17.32 16.64
Per-Share ratios
Dividends % 175 175 175 125 100
Book value of shares Rs. 110.03 88.41 67.34 50.63 40.96
Earning per share (without extraordinary items) Rs. 25.66 21.73 16.05 11.81 8.82
Dividend per share % 3.51 3.55 3.55 2.51 2.01
Note: Data for previous fiscals has been adjusted wherever appllicable, for issue of bonus shares in the ratio of 1:1 allotted in October 2006.
Sat_AR08_Final_Jul22_TP 2 Col.pmd 7/23/2008, 7:19 PM96
97
Indian GAAP Consolidated Financial Statements
• Highlights
• Auditors’ report on the Consolidated financialstatements
• Descripton of business and statement on significantaccounting policies
• Consolidated Balance sheet
• Consolidated Profit and Loss Account
• Schedules
• Consolidated Cash Flow statements
Sat_AR08_Final_Jul22_TP 2 Col.pmd 7/23/2008, 7:19 PM97
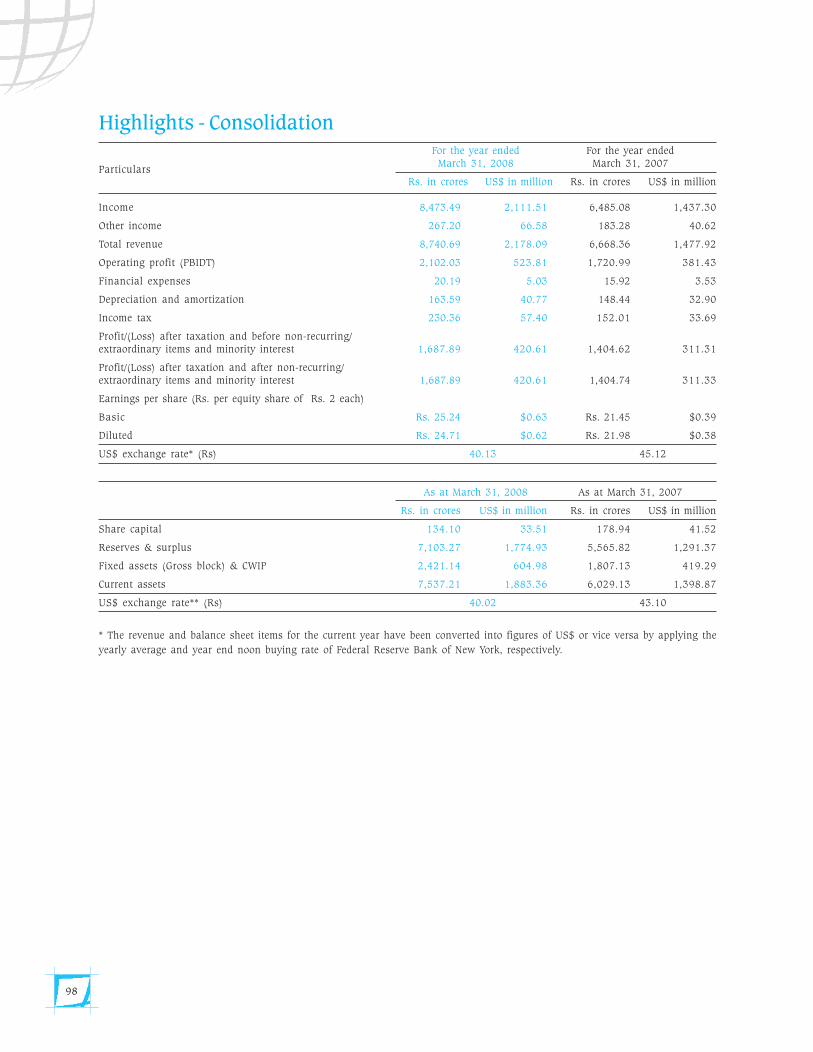
98
Highlights - Consolidation
Particulars
For the year ended For the year endedMarch 31, 2008 March 31, 2007
Rs. in crores US$ in million Rs. in crores US$ in million
Income 8,473.49 2,111.51 6,485.08 1,437.30
Other income 267.20 66.58 183.28 40.62
Total revenue 8,740.69 2,178.09 6,668.36 1,477.92
Operating profit (PBIDT) 2,102.03 523.81 1,720.99 381.43
Financial expenses 20.19 5.03 15.92 3.53
Depreciation and amortization 163.59 40.77 148.44 32.90
Income tax 230.36 57.40 152.01 33.69
Profit/(Loss) after taxation and before non-recurring/extraordinary items and minority interest 1,687.89 420.61 1,404.62 311.31
Profit/(Loss) after taxation and after non-recurring/extraordinary items and minority interest 1,687.89 420.61 1,404.74 311.33
Earnings per share (Rs. per equity share of Rs. 2 each)
Basic Rs. 25.24 $0.63 Rs. 21.45 $0.39
Diluted Rs. 24.71 $0.62 Rs. 21.98 $0.38
US$ exchange rate* (Rs) 40.13 45.12
As at March 31, 2008 As at March 31, 2007
Rs. in crores US$ in million Rs. in crores US$ in million
Share capital 134.10 33.51 178.94 41.52
Reserves & surplus 7,103.27 1,774.93 5,565.82 1,291.37
Fixed assets (Gross block) & CWIP 2,421.14 604.98 1,807.13 419.29
Current assets 7,537.21 1,883.36 6,029.13 1,398.87
US$ exchange rate** (Rs) 40.02 43.10
* The revenue and balance sheet items for the current year have been converted into figures of US$ or vice versa by applying the
yearly average and year end noon buying rate of Federal Reserve Bank of New York, respectively.
Sat_AR08_Final_Jul22_TP 2 Col.pmd 7/23/2008, 7:19 PM98
99
Report of the Auditors to the Board of Directors of
Satyam Computer Services Limited
1. We have audited the attached consolidated Balance Sheet
of Satyam Computer Services Limited and its subsidiaries
and joint ventures (the Group) as at March 31, 2008 and
the related consolidated Profit and Loss Account and
consolidated Cash Flow Statement for the year ended on
that date annexed thereto, which we have signed under
reference to this report. These consolidated financial
statements are the responsibility of the Company’s
management and have been prepared by the management
on the basis of separate financial statements and other
financial information regarding components. Our
responsibility is to express an opinion on these consolidated
financial statements based on our audit.
2. We conducted our audit in accordance with the auditing
standards generally accepted in India. Those Standards
require that we plan and perform the audit to obtain
reasonable assurance about whether the financial
statements are free of material misstatements. An audit
includes examining, on a test basis, evidence supporting
the amounts and disclosures in the financial statements.
An audit also includes assessing the accounting principles
used and significant estimates made by management, as
well as evaluating the overall financial statement
presentation. We believe that our audit provides a
reasonable basis for our opinion.
3. We did not audit the financial statements of certain
subsidiaries and a joint venture whose financial statements
reflect the Group’s share of total assets of Rs. 26.47 crores
as at March 31, 2008 and the Group’s share of total revenues
of Rs. 20.52 crores and net cash inflows amounting to Rs.
6.29 crores for the year ended on that date as considered in
the consolidated financial statements. These financial
statements have been audited by other auditors whose
reports have been furnished to us, and our opinion, in so
far as it relates to the amounts included in respect of these
subsidiaries and the joint venture, is based solely on the
reports of the other auditors.
4. We report that the consolidated financial statements have
been prepared by the Company’s management in
accordance with the requirements of Accounting Standard
21 - Consolidated Financial Statements; and Accounting
Standard 27 – Financial Reporting of Interest in Joint
Ventures notified under Section 211 (3C) of the Companies
Act, 1956.
5. Based on our audit and on consideration of the reports of
other auditors on separate financial statements and on the
other financial information of the components, in our opinion
and to the best of our information and according to the
explanations given to us, the attached consolidated financial
statements give a true and fair view in conformity with the
accounting principles generally accepted in India:
(i) in the case of the consolidated Balance Sheet, of the
state of affairs of the Group as at March 31, 2008;
(ii) in the case of the consolidated Profit and Loss Account,
of the profit for the year ended on that date; and
(iii) in the case of the consolidated Cash Flow Statement,
of the cash flows for the year ended on that date.
Srinivas Talluri
Partner
Membership No. 29864
for and on behalf of
Place : Hyderabad Price Waterhouse
Date : April 21, 2008 Chartered Accountants
Sat_AR08_Final_Jul22_TP 2 Col.pmd 7/23/2008, 7:19 PM99
100
Description of BusinessSatyam Computer Services Limited and its consolidated subsidiaries, Joint Ventures and Associates (hereinafter referred to as “Satyam”) are engaged in providing
information technology services, developing software products and business process outsourcing.
Satyam Computer Services Limited (hereinafter referred to as “Satyam Computer Services”) is an information technology (“IT”) services provider that uses a global
infrastructure to deliver value-added services to its customers, to address IT needs in specific industries and to facilitate electronic business, or eBusiness, initiatives.
Satyam Computer Services was incorporated on June 24, 1987 in Hyderabad, Andhra Pradesh, India. The range of services offered by it, either on a “time and material”
basis or “fixed price”, includes consulting, systems design, software development, system integration and application maintenance. Satyam Computer Services offers
a comprehensive range of IT services, including application development and maintenance, consulting and enterprise business solutions, extended engineering solutions
and infrastructure management services. Satyam Computer Services has established a diversified base of corporate customers in a wide range of industries including
insurance, banking and financial services, manufacturing, telecommunications, transportation and engineering services.
Satyam BPO Limited (“Satyam BPO”) a majority owned subsidiary of Satyam Computer Services is engaged in providing Business Process Outsourcing services covering
HR, Finance & Accounting, Customer Contact (Voice, Mail and Chat), and Transaction Processing (industry-specific offerings).
Statement on Significant Accounting Policiesa) Basis of Consolidation
The Consolidated Financial Statements include the accounts of Satyam Computer Services and its subsidiary companies. Subsidiary companies are those in which
Satyam Computer Services, directly or indirectly, have an interest of more than one half of the voting power or otherwise have power to exercise control over the
operations. Subsidiaries are consolidated from the date on which effective control is transferred to the Group and are no longer consolidated from the date of
disposal.
All inter company transactions, balances and unrealized surpluses and deficits on transactions between Group companies are eliminated. Consistency in adoption
of accounting polices among all group companies is ensured to the extent practicable. Separate disclosure is made of minority interest.
Investments in Business entities over which the company exercises joint control are accounted for using the proportionate consolidation except where the control
is considered to be temporary. Investment in associates are accounted for using the equity method.
On occasion, a subsidiary or associated company accounted for by the equity method (“offering company”) may issue its shares to third parties as either a public
offering or private placement at per share amounts in excess of or less than Satyam’s average per share carrying value. With respect to such transactions, the
resulting gains or losses arising from the dilution of interest are recorded as Capital Reserve/Goodwill. Gain or losses arising on the direct sales by Satyam of its
investment in its subsidiaries or associated companies to third parties are transferred to Profit and Loss Account. Such gains or losses are the difference between
the sale proceeds and net carrying value of investments.
Minority Interest in subsidiaries represents the minority shareholders proportionate share of net assets and the net income of Satyam’s majority owned subsidiaries.
b) Use of Estimates
The preparation of the financial statements in conformity with the GAAP requires that the management makes estimates and assumptions that affect the reported
amounts of assets and liabilities, disclosure of contingent liabilities as at the date of the financial statements, and the reported amounts of revenue and expenses
during the reported period / year. Actual results could differ from those estimates.
c) Revenue Recognition
i) IT Services
Revenue from professional services consist primarily of revenue earned from services performed on a “time and material” basis. The related revenue is
recognized as and when the services are performed. Satyam Computer Services also performs time bound fixed-price engagements, under which revenue
is recognized using the percentage of completion method of accounting. The cumulative impact of any revision in estimates of the percentage of work
completed is reflected in the period / year in which the change becomes known. Provisions for estimated losses on such engagements are made during the
period / year in which a loss becomes probable and can be reasonably estimated.
Amounts received or billed in advance of services performed are recorded as advance from customers/unearned revenue. Unbilled revenue, included in
debtors, represents amounts recognized based on services performed in advance of billing in accordance with contract terms.
ii) Business Process Outsourcing
Revenue from per engagement services is recognized based on the number of engagements performed. Revenues from per time period services are
recognized based on the time incurred in providing services at contracted rates. Revenue from per incident services is based on the performance of specific
criteria at contracted rates.
d) Foreign Currency Transactions/Translations
Transactions in foreign currency are recorded at exchange rate prevailing on the date of transaction. Monetary assets and liabilities denominated in foreign
currency are translated at the rate of exchange at the balance sheet date and resultant gain or loss is recognized in the profit and loss account.
Non-monetary assets and liabilities are translated at the rate prevailing on the date of transaction.
Foreign subsidiaries are non-integral in nature. Assets and Liabilities of such subsidiaries are translated at the period / year end exchange rate, income and
expenditure are translated at the average rate during the period. The resultant translation adjustment is reflected as a separate component of shareholders’ funds
as a ‘Currency Translation Reserve’.
Gain or loss on forward exchange contract is computed by multiplying the foreign currency amount of the forward exchange contract by the difference between
the forward rate available at the reporting date for the remaining maturity of the contract and the contracted forward rate (or the forward rate last used to measure
a gain or loss on that contract for an earlier period / year), is recognized in the profit and loss account for the period / year.
Gains/losses on settlement of transaction arising on cancellation or renewal of a forward exchange contract is recognized as income or as expense for the period
/ year.
Pursuant to ICAI announcement of “Accounting for Derivatives” on the early adoption of Accounting Standard AS-30 “Financial Instruments: Recognisation
and Measurement”, Satyam Computer Services has early adopted the standard for the year under review, to the extent that the adoption does not conflict with
existing mandatory accounting standards and other authoritative pronouncements, Company law and other regulatory requirements.
Sat_AR08_Final_Jul22_TP 2 Col.pmd 7/23/2008, 7:19 PM100
101
e) Fixed Assets
Fixed assets are stated at actual cost less accumulated depreciation. The actual cost capitalized includes material cost, freight, installation cost, duties and taxes,
finance charges and other incidental expenses incurred during the construction/installation stage.
Depreciation on fixed assets is computed on the straight line method over their estimated useful lives at the rates which are higher than the rates prescribed under
Schedule XIV of the Companies Act, 1956. Individual assets acquired for less than Rs. 5,000 are entirely depreciated in the period / year of acquisition.
The cost of and the accumulated depreciation for fixed assets sold, retired or otherwise disposed off are removed from the stated values and the resulting gains
and losses are included in the profit and loss account.
Costs of application software for internal use are generally charged to revenue as incurred due to its estimated useful lives being relatively short, usually less than
one year.
The estimated useful lives are as follows:
Buildings 28 years
Computers 2 years
Plant and Machinery (Other than Computers) 5 years
Software – used in Development for Projects 3 years
Office Equipment 5 years
Furniture, Fixtures and Interiors 5 years
Vehicles 5 years
Capital work in Progress:
Assets under installation or under construction as at the Balance sheet date are shown as capital work in progress.
Advances paid towards acquisition of assets are also included under capital work in progress.
f) Goodwill and Other Intangible Assets
Goodwill represents the difference between the purchase price and the book value of assets and liabilities acquired. Goodwill is amortized over the useful life of
the asset. The goodwill is reviewed for impairment whenever events or changes in business circumstances indicate the carrying amount of assets may not be fully
recoverable. If impairment is indicated, the asset is written down to its fair value.
g) Investments
Investments are classified into current investments and long-term investments. Current investments are carried at the lower of cost and market value. Any
reduction in carrying amount and any reversals of such reductions are charged or credited to the profit and loss account. Long-term investments are carried at
cost less provision made to recognize any decline, other than temporary, in the value of such investments.
h) Inventories
Inventories are stated at the lower of cost and net realizable value. Cost of hardware and software purchased for the purpose of resale is determined using the
first-in-first-out method.
i) Employee Benefits
Contributions to defined schemes such as Provident Fund, Employee State Insurance Scheme and Superannuation are charged as incurred on accrual basis.
Satyam Computer Services also provides for gratuity and leave encashment in accordance with the requirements of revised Accounting Standard – 15 “Employee
Benefits” based on actuarial valuation carried out as at the balance sheet date.
j) Taxes on Income
Tax expense for a year comprises of current tax and deferred tax. Current taxes are measured at the amounts expected to be paid using the applicable tax rates
and tax laws. Deferred tax assets and liabilities are measured using tax rates and tax laws that have been enacted or substantively enacted by the balance sheet
date. The effect on deferred tax assets and liabilities of a change in tax rates is recognized in the profit and loss account in the period / year of change. Deferred
tax assets and deferred tax liabilities are recognized for the future tax consequences attributable to differences between the financial statements carrying amounts
of existing assets and liabilities and their respective tax bases and operating loss carry forwards.
k) Earnings per Share
The earnings considered in ascertaining Satyam’s Earnings Per Share (EPS) comprises the net profit after tax (and includes the post tax effect of any extra ordinary
items). The number of shares used in computing Basic EPS is the weighted average number of shares outstanding during the period / year. The number of shares
used in computing Diluted EPS comprises of weighted average shares considered for deriving Basic EPS, and also the weighted average number of equity shares
which could have been issued on the conversion of all dilutive potential equity shares. Dilutive potential equity shares are deemed converted as at the beginning
of the period / year, unless they have been issued at a later date. The diluted potential equity shares have been adjusted for the proceeds receivable had the shares
been actually issued at fair value (i.e. average market value of the outstanding shares). The number of shares and potentially dilutive shares are adjusted for share
splits/reverse share splits and bonus shares, as appropriate.
l) Associate Stock Option Scheme
Stock options granted to the employees under the stock option schemes established after June 19, 1999 are evaluated as per the accounting treatment prescribed
by Employee Stock Option Scheme and Employee Stock Purchase Scheme Guidelines 1999 issued by Securities and Exchange Board of India. Accordingly the
excess of market value of the stock options as on the date of grant over the exercise price of the options is recognized as deferred employee compensation and
is charged to profit and loss account on graded vesting basis over the vesting period of the options. The employee stock option outstanding is shown under
Reserves and Surplus.
m) Research and Development
Revenue expenditure incurred on research and development is charged to revenue in the period / year in which it is incurred. Assets used for research and
development activities are included in fixed assets.
Sat_AR08_Final_Jul22_TP 2 Col.pmd 7/23/2008, 7:19 PM101
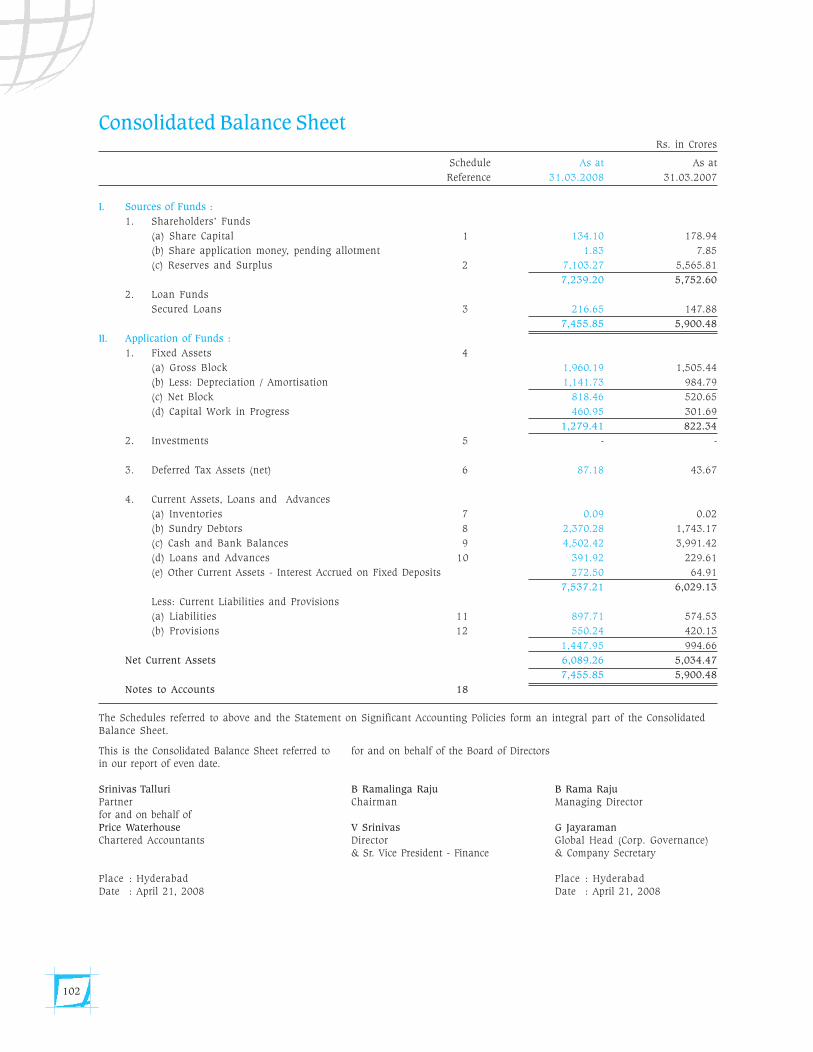
102
Consolidated Balance SheetRs. in Crores
Schedule As at As at
Reference 31.03.2008 31.03.2007
I. Sources of Funds :
1. Shareholders’ Funds
(a) Share Capital 1 134.10 178.94
(b) Share application money, pending allotment 1.83 7.85
(c) Reserves and Surplus 2 7,103.27 5,565.81
7,239.20 5,752.60
2. Loan Funds
Secured Loans 3 216.65 147.88
7,455.85 5,900.48
II. Application of Funds :
1. Fixed Assets 4
(a) Gross Block 1,960.19 1,505.44
(b) Less: Depreciation / Amortisation 1,141.73 984.79
(c) Net Block 818.46 520.65
(d) Capital Work in Progress 460.95 301.69
1,279.41 822.34
2. Investments 5 - -
3. Deferred Tax Assets (net) 6 87.18 43.67
4. Current Assets, Loans and Advances
(a) Inventories 7 0.09 0.02
(b) Sundry Debtors 8 2,370.28 1,743.17
(c) Cash and Bank Balances 9 4,502.42 3,991.42
(d) Loans and Advances 10 391.92 229.61
(e) Other Current Assets - Interest Accrued on Fixed Deposits 272.50 64.91
7,537.21 6,029.13
Less: Current Liabilities and Provisions
(a) Liabilities 11 897.71 574.53
(b) Provisions 12 550.24 420.13
1,447.95 994.66
Net Current Assets 6,089.26 5,034.47
7,455.85 5,900.48
Notes to Accounts 18
The Schedules referred to above and the Statement on Significant Accounting Policies form an integral part of the ConsolidatedBalance Sheet.
This is the Consolidated Balance Sheet referred to for and on behalf of the Board of Directorsin our report of even date.
Srinivas Talluri B Ramalinga Raju B Rama RajuPartner Chairman Managing Directorfor and on behalf ofPrice Waterhouse V Srinivas G JayaramanChartered Accountants Director Global Head (Corp. Governance)
& Sr. Vice President - Finance & Company Secretary
Place : Hyderabad Place : HyderabadDate : April 21, 2008 Date : April 21, 2008
Sat_AR08_Final_Jul22_TP 2 Col.pmd 7/23/2008, 7:19 PM102
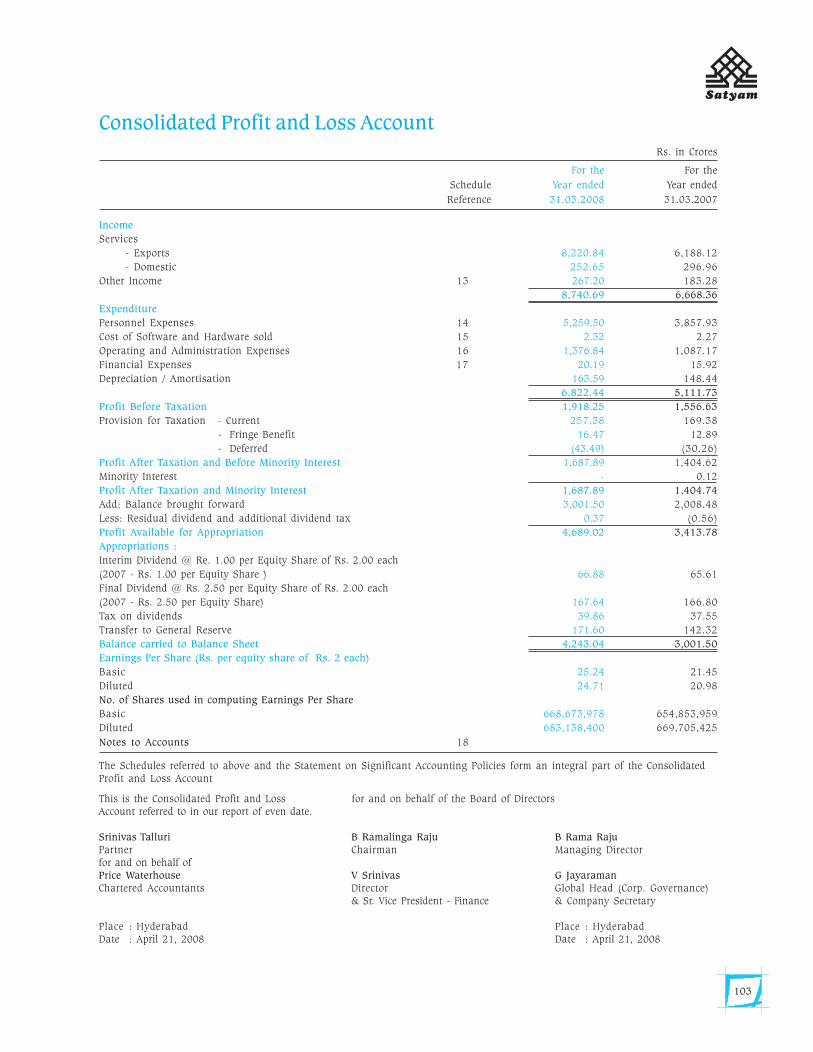
103
Consolidated Profit and Loss AccountRs. in Crores
For the For the
Schedule Year ended Year ended
Reference 31.03.2008 31.03.2007
Income
Services
- Exports 8,220.84 6,188.12
- Domestic 252.65 296.96
Other Income 13 267.20 183.28
8,740.69 6,668.36
Expenditure
Personnel Expenses 14 5,259.50 3,857.93
Cost of Software and Hardware sold 15 2.32 2.27
Operating and Administration Expenses 16 1,376.84 1,087.17
Financial Expenses 17 20.19 15.92
Depreciation / Amortisation 163.59 148.44
6,822.44 5,111.73
Profit Before Taxation 1,918.25 1,556.63
Provision for Taxation - Current 257.38 169.38
- Fringe Benefit 16.47 12.89
- Deferred (43.49) (30.26)
Profit After Taxation and Before Minority Interest 1,687.89 1,404.62
Minority Interest - 0.12
Profit After Taxation and Minority Interest 1,687.89 1,404.74
Add: Balance brought forward 3,001.50 2,008.48
Less: Residual dividend and additional dividend tax 0.37 (0.56)
Profit Available for Appropriation 4,689.02 3,413.78
Appropriations :
Interim Dividend @ Re. 1.00 per Equity Share of Rs. 2.00 each
(2007 - Rs. 1.00 per Equity Share ) 66.88 65.61
Final Dividend @ Rs. 2.50 per Equity Share of Rs. 2.00 each
(2007 - Rs. 2.50 per Equity Share) 167.64 166.80
Tax on dividends 39.86 37.55
Transfer to General Reserve 171.60 142.32
Balance carried to Balance Sheet 4,243.04 3,001.50
Earnings Per Share (Rs. per equity share of Rs. 2 each)
Basic 25.24 21.45
Diluted 24.71 20.98
No. of Shares used in computing Earnings Per Share
Basic 668,673,978 654,853,959
Diluted 683,138,400 669,705,425
Notes to Accounts 18
The Schedules referred to above and the Statement on Significant Accounting Policies form an integral part of the ConsolidatedProfit and Loss Account
This is the Consolidated Profit and Loss for and on behalf of the Board of DirectorsAccount referred to in our report of even date.
Srinivas Talluri B Ramalinga Raju B Rama RajuPartner Chairman Managing Directorfor and on behalf ofPrice Waterhouse V Srinivas G JayaramanChartered Accountants Director Global Head (Corp. Governance)
& Sr. Vice President - Finance & Company Secretary
Place : Hyderabad Place : HyderabadDate : April 21, 2008 Date : April 21, 2008
Sat_AR08_Final_Jul22_TP 2 Col.pmd 7/23/2008, 7:19 PM103
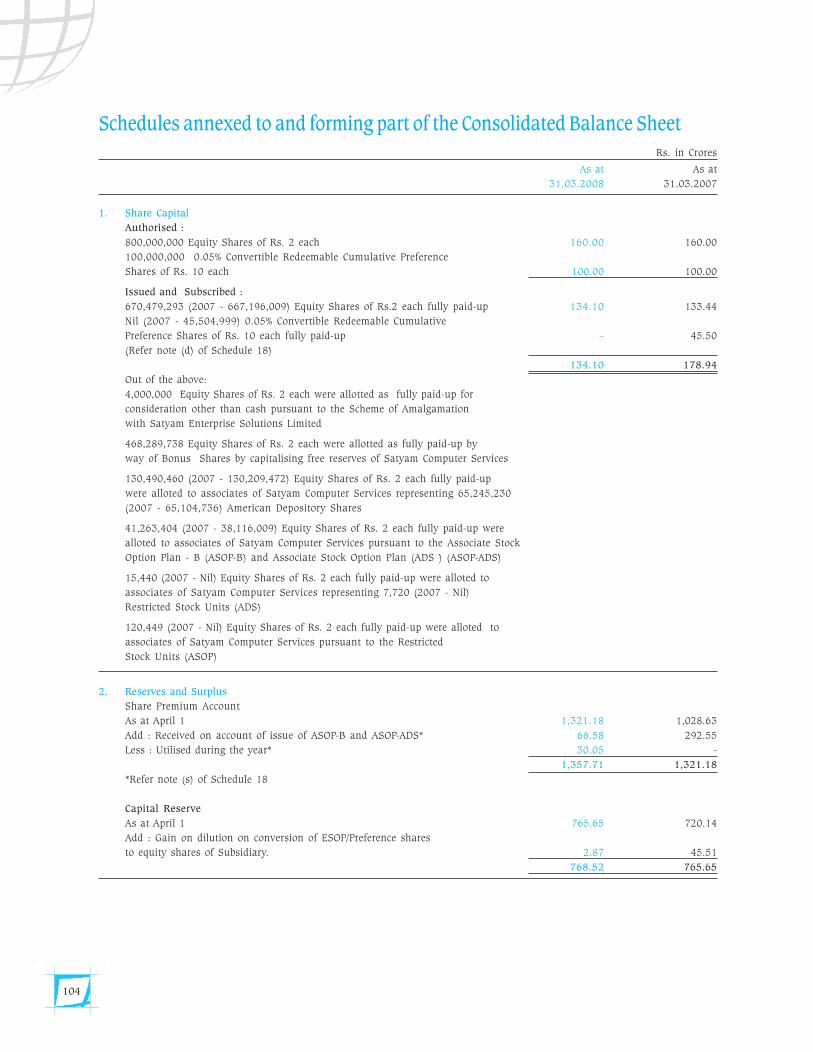
104
Schedules annexed to and forming part of the Consolidated Balance SheetRs. in Crores
As at As at
31.03.2008 31.03.2007
1. Share Capital
Authorised :
800,000,000 Equity Shares of Rs. 2 each 160.00 160.00
100,000,000 0.05% Convertible Redeemable Cumulative Preference
Shares of Rs. 10 each 100.00 100.00
Issued and Subscribed :
670,479,293 (2007 - 667,196,009) Equity Shares of Rs.2 each fully paid-up 134.10 133.44
Nil (2007 - 45,504,999) 0.05% Convertible Redeemable Cumulative
Preference Shares of Rs. 10 each fully paid-up - 45.50
(Refer note (d) of Schedule 18)
134.10 178.94
Out of the above:
4,000,000 Equity Shares of Rs. 2 each were allotted as fully paid-up for
consideration other than cash pursuant to the Scheme of Amalgamation
with Satyam Enterprise Solutions Limited
468,289,738 Equity Shares of Rs. 2 each were allotted as fully paid-up by
way of Bonus Shares by capitalising free reserves of Satyam Computer Services
130,490,460 (2007 - 130,209,472) Equity Shares of Rs. 2 each fully paid-up
were alloted to associates of Satyam Computer Services representing 65,245,230
(2007 - 65,104,736) American Depository Shares
41,263,404 (2007 - 38,116,009) Equity Shares of Rs. 2 each fully paid-up were
alloted to associates of Satyam Computer Services pursuant to the Associate Stock
Option Plan - B (ASOP-B) and Associate Stock Option Plan (ADS ) (ASOP-ADS)
15,440 (2007 - Nil) Equity Shares of Rs. 2 each fully paid-up were alloted to
associates of Satyam Computer Services representing 7,720 (2007 - Nil)
Restricted Stock Units (ADS)
120,449 (2007 - Nil) Equity Shares of Rs. 2 each fully paid-up were alloted to
associates of Satyam Computer Services pursuant to the Restricted
Stock Units (ASOP)
2. Reserves and Surplus
Share Premium Account
As at April 1 1,321.18 1,028.63
Add : Received on account of issue of ASOP-B and ASOP-ADS* 66.58 292.55
Less : Utilised during the year* 30.05 -
1,357.71 1,321.18
*Refer note (s) of Schedule 18
Capital Reserve
As at April 1 765.65 720.14
Add : Gain on dilution on conversion of ESOP/Preference shares
to equity shares of Subsidiary. 2.87 45.51
768.52 765.65
Sat_AR08_Final_Jul22_TP 2 Col.pmd 7/23/2008, 7:19 PM104
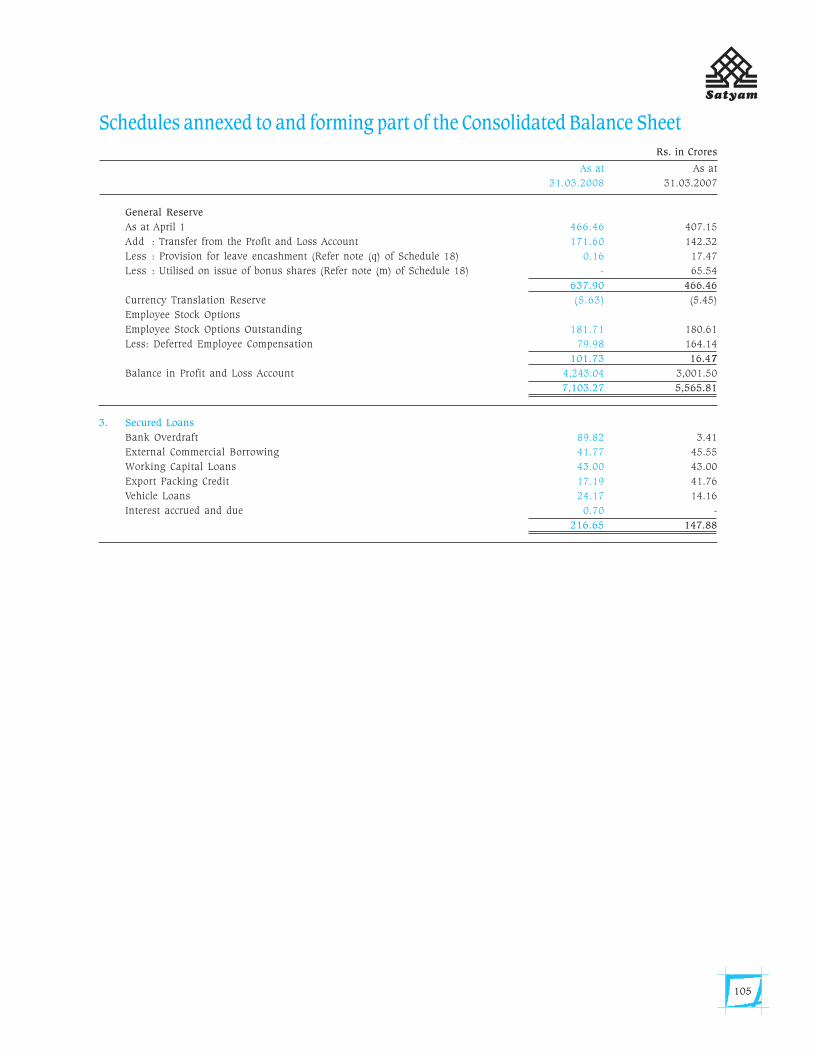
105
Schedules annexed to and forming part of the Consolidated Balance SheetRs. in Crores
As at As at
31.03.2008 31.03.2007
General Reserve
As at April 1 466.46 407.15
Add : Transfer from the Profit and Loss Account 171.60 142.32
Less : Provision for leave encashment (Refer note (q) of Schedule 18) 0.16 17.47
Less : Utilised on issue of bonus shares (Refer note (m) of Schedule 18) - 65.54
637.90 466.46
Currency Translation Reserve (5.63) (5.45)
Employee Stock Options
Employee Stock Options Outstanding 181.71 180.61
Less: Deferred Employee Compensation 79.98 164.14
101.73 16.47
Balance in Profit and Loss Account 4,243.04 3,001.50
7,103.27 5,565.81
3. Secured Loans
Bank Overdraft 89.82 3.41
External Commercial Borrowing 41.77 45.55
Working Capital Loans 43.00 43.00
Export Packing Credit 17.19 41.76
Vehicle Loans 24.17 14.16
Interest accrued and due 0.70 -
216.65 147.88
Sat_AR08_Final_Jul22_TP 2 Col.pmd 7/23/2008, 7:19 PM105
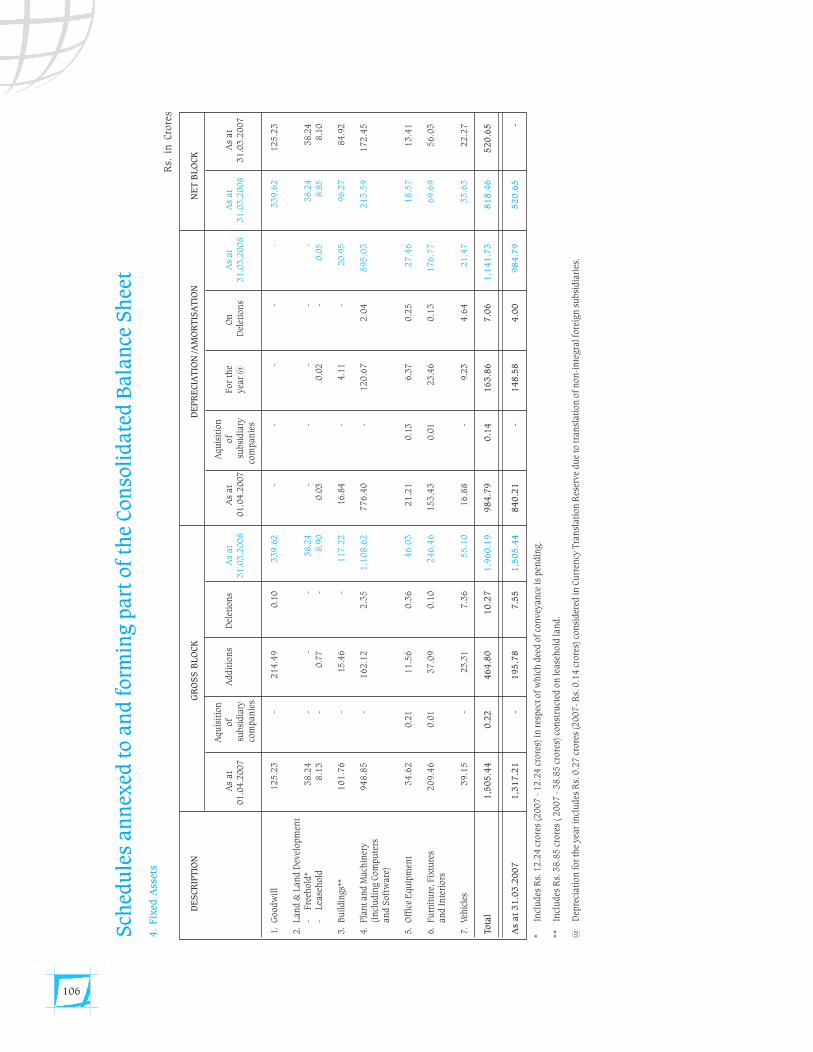
106
DE
SCR
IPT
ION
GR
OS
S B
LO
CK
DE
PR
ECIA
TIO
N /A
MO
RT
ISA
TIO
NN
ET
BL
OCK
Aqu
isit
ion
Aqu
isit
ion
As
at
of
Addit
ion
sD
elet
ion
sA
s at
As
at
of
For
the
On
As
at
As
at
As
at
01.0
4.2
007
su
bsi
dia
ry31.0
3.2
008
01.0
4.2
007
su
bsi
dia
ryye
ar
@ D
elet
ion
s31.0
3.2
008
31.0
3.2
008
31.0
3.2
007
com
pan
ies
com
pan
ies
1.G
oodw
ill
125.2
3-
214.4
90.1
0339.6
2-
--
--
339.6
2125.2
3
2.Lan
d &
Lan
d D
evel
opm
ent
-Fre
ehold
*
3
8.2
4-
--
38.2
4-
--
--
38.2
438.2
4-
Lea
seh
old
8
.13
-0.7
7-
8.9
00.0
3 0
.02
-0.0
58.8
58.1
0
3.B
uildin
gs*
*
10
1.7
6-
15.4
6-
117.2
216.8
4-
4.1
1-
20.9
596.2
784.9
2
4.Pla
nt an
d M
ach
iner
y
94
8.8
5 -
162.1
2
2
.35
1
,10
8.6
2
776.4
0-
120.6
7
2
.04
8
95
.03
21
3.5
9
17
2.4
5(I
ncl
udin
g C
om
pu
ters
an
d S
oft
ware
)
5.O
ffic
e E
qu
ipm
ent
34
.62
0.2
1 1
1.5
6
0
.36
46
.03
2
1.2
10.1
36.3
7
0
.25
2
7.4
6
18
.57
13
.41
6.Fu
rnit
ure
, Fix
ture
s
20
9.4
60.0
1 3
7.0
9
0.1
0
24
6.4
6
1
53.4
30.0
123.4
6
0.1
3
17
6.7
7
69
.69
5
6.0
3an
d In
teri
ors
7.Ve
hic
les
39
.15
-23.3
1
7
.36
55
.10
1
6.8
8-
9.2
3
4
.64
21
.47
3
3.6
3
22
.27
Tota
l1
,50
5.4
40
.22
46
4.8
0
10
.27
1
,96
0.1
9 9
84
.79
0.1
41
63
.86
7
.06
1
,14
1.7
3
81
8.4
6
52
0.6
5
As a
t 3
1.0
3.2
00
7
1,3
17
.21
-1
95
.78
7
.55
1
,50
5.4
4
84
0.2
1-
14
8.5
8
4.0
0
98
4.7
9
52
0.6
5-
*In
clu
des
Rs.
12.2
4 c
rore
s (2
007 - 1
2.2
4 c
rore
s) in
res
pec
t of w
hic
h d
eed o
f co
nvey
an
ce is
pen
din
g.
**In
clu
des
Rs.
38.8
5 c
rore
s ( 2007 - 3
8.8
5 c
rore
s) c
on
stru
cted
on
lease
hold
lan
d.
@D
epre
ciati
on
for
the
year
incl
udes
Rs.
0.2
7 c
rore
s (2
007- R
s. 0
.14 c
rore
s) c
on
sider
ed in
Cu
rren
cy T
ran
slati
on
Res
erve
du
e to
tra
nsl
ati
on
of n
on
-in
tegra
l fore
ign
su
bsi
dia
ries
.
Sch
edu
les
an
nex
ed t
o a
nd form
ing p
art
of th
e Con
soli
date
d B
ala
nce
Sh
eet
4.
Fix
ed A
sset
s
Rs.
in
Cro
res
Sat_AR08_Final_Jul22_TP 2 Col.pmd 7/23/2008, 7:19 PM106
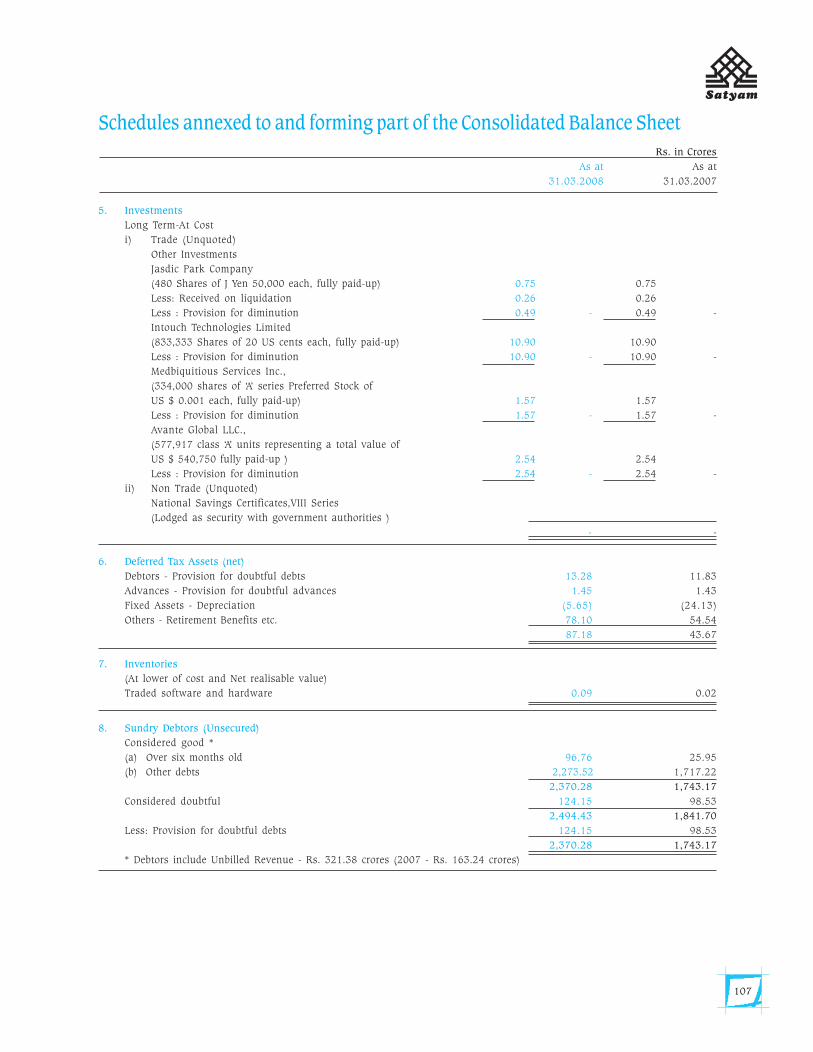
107
Schedules annexed to and forming part of the Consolidated Balance SheetRs. in Crores
As at As at
31.03.2008 31.03.2007
5. Investments
Long Term-At Cost
i) Trade (Unquoted)
Other Investments
Jasdic Park Company
(480 Shares of J Yen 50,000 each, fully paid-up) 0.75 0.75
Less: Received on liquidation 0.26 0.26
Less : Provision for diminution 0.49 - 0.49 -
Intouch Technologies Limited
(833,333 Shares of 20 US cents each, fully paid-up) 10.90 10.90
Less : Provision for diminution 10.90 - 10.90 -
Medbiquitious Services Inc.,
(334,000 shares of ‘A’ series Preferred Stock of
US $ 0.001 each, fully paid-up) 1.57 1.57
Less : Provision for diminution 1.57 - 1.57 -
Avante Global LLC.,
(577,917 class ‘A’ units representing a total value of
US $ 540,750 fully paid-up ) 2.54 2.54
Less : Provision for diminution 2.54 - 2.54 -
ii) Non Trade (Unquoted)
National Savings Certificates,VIII Series
(Lodged as security with government authorities )
- -
6. Deferred Tax Assets (net)
Debtors - Provision for doubtful debts 13.28 11.83
Advances - Provision for doubtful advances 1.45 1.43
Fixed Assets - Depreciation (5.65) (24.13)
Others - Retirement Benefits etc. 78.10 54.54
87.18 43.67
7. Inventories
(At lower of cost and Net realisable value)
Traded software and hardware 0.09 0.02
8. Sundry Debtors (Unsecured)
Considered good *
(a) Over six months old 96.76 25.95
(b) Other debts 2,273.52 1,717.22
2,370.28 1,743.17
Considered doubtful 124.15 98.53
2,494.43 1,841.70
Less: Provision for doubtful debts 124.15 98.53
2,370.28 1,743.17
* Debtors include Unbilled Revenue - Rs. 321.38 crores (2007 - Rs. 163.24 crores)
Sat_AR08_Final_Jul22_TP 2 Col.pmd 7/23/2008, 7:19 PM107
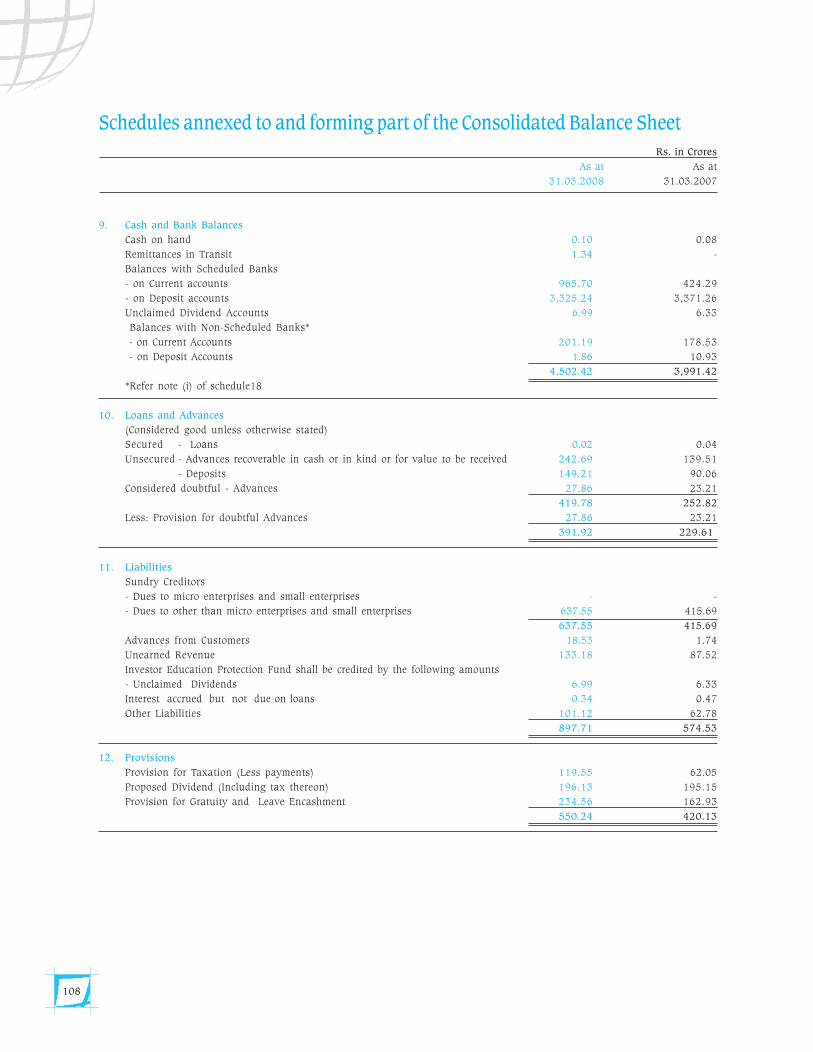
108
Schedules annexed to and forming part of the Consolidated Balance SheetRs. in Crores
As at As at
31.03.2008 31.03.2007
9. Cash and Bank Balances
Cash on hand 0.10 0.08
Remittances in Transit 1.34 -
Balances with Scheduled Banks
- on Current accounts 965.70 424.29
- on Deposit accounts 3,325.24 3,371.26
Unclaimed Dividend Accounts 6.99 6.33
Balances with Non-Scheduled Banks*
- on Current Accounts 201.19 178.53
- on Deposit Accounts 1.86 10.93
4,502.42 3,991.42
*Refer note (i) of schedule18
10. Loans and Advances
(Considered good unless otherwise stated)
Secured - Loans 0.02 0.04
Unsecured - Advances recoverable in cash or in kind or for value to be received 242.69 139.51
- Deposits 149.21 90.06
Considered doubtful - Advances 27.86 23.21
419.78 252.82
Less: Provision for doubtful Advances 27.86 23.21
391.92 229.61
11. Liabilities
Sundry Creditors
- Dues to micro enterprises and small enterprises - -
- Dues to other than micro enterprises and small enterprises 637.55 415.69
637.55 415.69
Advances from Customers 18.53 1.74
Unearned Revenue 133.18 87.52
Investor Education Protection Fund shall be credited by the following amounts
- Unclaimed Dividends 6.99 6.33
Interest accrued but not due on loans 0.34 0.47
Other Liabilities 101.12 62.78
897.71 574.53
12. Provisions
Provision for Taxation (Less payments) 119.55 62.05
Proposed Dividend (Including tax thereon) 196.13 195.15
Provision for Gratuity and Leave Encashment 234.56 162.93
550.24 420.13
Sat_AR08_Final_Jul22_TP 2 Col.pmd 7/23/2008, 7:19 PM108
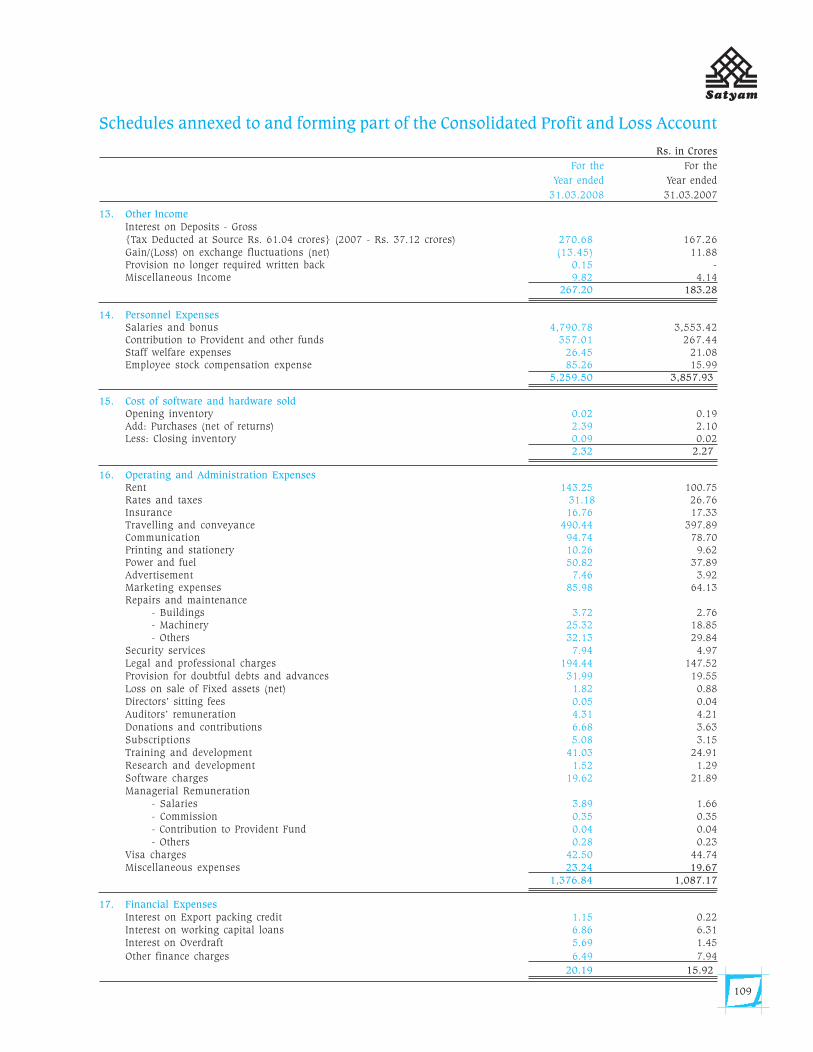
109
Schedules annexed to and forming part of the Consolidated Profit and Loss Account
Rs. in Crores
For the For the
Year ended Year ended
31.03.2008 31.03.2007
13. Other IncomeInterest on Deposits - Gross{Tax Deducted at Source Rs. 61.04 crores} (2007 - Rs. 37.12 crores) 270.68 167.26Gain/(Loss) on exchange fluctuations (net) (13.45) 11.88Provision no longer required written back 0.15 -Miscellaneous Income 9.82 4.14
267.20 183.28
14. Personnel ExpensesSalaries and bonus 4,790.78 3,553.42Contribution to Provident and other funds 357.01 267.44Staff welfare expenses 26.45 21.08Employee stock compensation expense 85.26 15.99
5,259.50 3,857.93
15. Cost of software and hardware soldOpening inventory 0.02 0.19Add: Purchases (net of returns) 2.39 2.10Less: Closing inventory 0.09 0.02
2.32 2.27
16. Operating and Administration ExpensesRent 143.25 100.75Rates and taxes 31.18 26.76Insurance 16.76 17.33Travelling and conveyance 490.44 397.89Communication 94.74 78.70Printing and stationery 10.26 9.62Power and fuel 50.82 37.89Advertisement 7.46 3.92Marketing expenses 85.98 64.13Repairs and maintenance
- Buildings 3.72 2.76- Machinery 25.32 18.85- Others 32.13 29.84
Security services 7.94 4.97Legal and professional charges 194.44 147.52Provision for doubtful debts and advances 31.99 19.55Loss on sale of Fixed assets (net) 1.82 0.88Directors’ sitting fees 0.05 0.04Auditors’ remuneration 4.31 4.21Donations and contributions 6.68 3.63Subscriptions 5.08 3.15Training and development 41.03 24.91Research and development 1.52 1.29Software charges 19.62 21.89Managerial Remuneration
- Salaries 3.89 1.66- Commission 0.35 0.35- Contribution to Provident Fund 0.04 0.04- Others 0.28 0.23
Visa charges 42.50 44.74Miscellaneous expenses 23.24 19.67
1,376.84 1,087.17
17. Financial ExpensesInterest on Export packing credit 1.15 0.22Interest on working capital loans 6.86 6.31Interest on Overdraft 5.69 1.45
Other finance charges 6.49 7.94
20.19 15.92
Sat_AR08_Final_Jul22_TP 2 Col.pmd 7/23/2008, 7:19 PM109
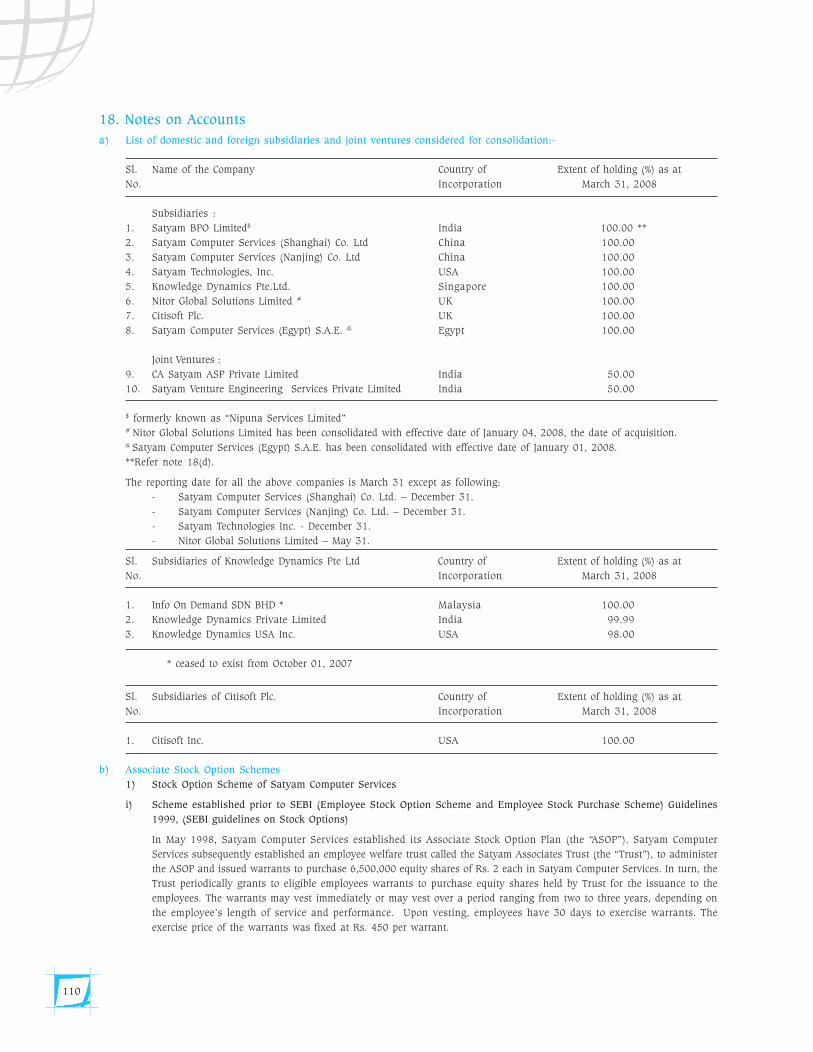
110
18. Notes on Accounts
a) List of domestic and foreign subsidiaries and joint ventures considered for consolidation:-
Sl. Name of the Company Country of Extent of holding (%) as at
No. Incorporation March 31, 2008
Subsidiaries :
1. Satyam BPO Limited$ India 100.00 **
2. Satyam Computer Services (Shanghai) Co. Ltd China 100.00
3. Satyam Computer Services (Nanjing) Co. Ltd China 100.00
4. Satyam Technologies, Inc. USA 100.00
5. Knowledge Dynamics Pte.Ltd. Singapore 100.00
6. Nitor Global Solutions Limited # UK 100.00
7. Citisoft Plc. UK 100.00
8. Satyam Computer Services (Egypt) S.A.E. & Egypt 100.00
Joint Ventures :
9. CA Satyam ASP Private Limited India 50.00
10. Satyam Venture Engineering Services Private Limited India 50.00
$ formerly known as “Nipuna Services Limited”# Nitor Global Solutions Limited has been consolidated with effective date of January 04, 2008, the date of acquisition.& Satyam Computer Services (Egypt) S.A.E. has been consolidated with effective date of January 01, 2008.
**Refer note 18(d).
The reporting date for all the above companies is March 31 except as following:
- Satyam Computer Services (Shanghai) Co. Ltd. – December 31.
- Satyam Computer Services (Nanjing) Co. Ltd. – December 31.
- Satyam Technologies Inc. - December 31.
- Nitor Global Solutions Limited – May 31.
Sl. Subsidiaries of Knowledge Dynamics Pte Ltd Country of Extent of holding (%) as at
No. Incorporation March 31, 2008
1. Info On Demand SDN BHD * Malaysia 100.00
2. Knowledge Dynamics Private Limited India 99.99
3. Knowledge Dynamics USA Inc. USA 98.00
* ceased to exist from October 01, 2007
Sl. Subsidiaries of Citisoft Plc. Country of Extent of holding (%) as at
No. Incorporation March 31, 2008
1. Citisoft Inc. USA 100.00
b) Associate Stock Option Schemes
1) Stock Option Scheme of Satyam Computer Services
i) Scheme established prior to SEBI (Employee Stock Option Scheme and Employee Stock Purchase Scheme) Guidelines
1999, (SEBI guidelines on Stock Options)
In May 1998, Satyam Computer Services established its Associate Stock Option Plan (the “ASOP”). Satyam Computer
Services subsequently established an employee welfare trust called the Satyam Associates Trust (the “Trust”), to administer
the ASOP and issued warrants to purchase 6,500,000 equity shares of Rs. 2 each in Satyam Computer Services. In turn, the
Trust periodically grants to eligible employees warrants to purchase equity shares held by Trust for the issuance to the
employees. The warrants may vest immediately or may vest over a period ranging from two to three years, depending on
the employee’s length of service and performance. Upon vesting, employees have 30 days to exercise warrants. The
exercise price of the warrants was fixed at Rs. 450 per warrant.
Sat_AR08_Final_Jul22_TP 2 Col.pmd 7/23/2008, 7:19 PM110
111
At the 12th Annual General Meeting held on May 28, 1999, shareholders approved a 1:1 Bonus issue to all shareholders as
of August 31, 1999. In order to ensure all its employees receive the benefits of the bonus issue in December 1999, the Trust
exercised all its warrants to purchase Satyam Computer Service’s shares prior to the bonus issue using the proceeds
obtained from bank loans. Subsequent to this, each warrant entitles the holder to purchase 10 shares of Rs. 2 each of
Satyam Computer Services at a price of Rs. 450 per warrant plus an interest component associated with the loan which the
Trust assumed, for conversion of the warrants it held. The interest component is computed based on fixed vesting period
and a fixed interest rate. As this scheme is established prior to the SEBI guidelines on the stock options, there is no cost
relating to the grant of options under this scheme.
ii) Scheme established after SEBI Guidelines on Stock Options
Securities Exchange Board of India (SEBI) issued the Employee Stock Option Scheme and Employee Stock Purchase Scheme
Guidelines 1999, which is applicable for all Stock Option Schemes established after June 19, 1999.
Satyam Computer Services established a scheme “Associate Stock Option Plan – B” (ASOP - B) for which 83,454,280 equity
shares of Rs. 2 each were earmarked. These warrants vest over a period of 2-4 years from the date of the grant. Upon
vesting, associates have 5 years to exercise these shares.
Accordingly, options (net of cancellations) for a total number of 15,641,127 equity shares of Rs. 2 each were outstanding
as at March 31, 2008 (2007 – 19,976,210).
Changes in number of options outstanding were as follows:
Options Year ended March 31,
2008 2007
At the beginning of the year 19,976,210 45,605,388
Granted – –
Exercised (2,866,407) (17,448,659)
Cancelled (1,424,297) (8,180,519)
Lapsed (44,379) –
At the end of the year 15,641,127 19,976,210
iii) Associate Stock Option Plan (ADS)
Satyam Computer Services has established a scheme “Associate Stock Option Plan (ADS)” to be administered by the
Administrator of the ASOP (ADS), a committee appointed by the Board of Directors of Satyam Computer Services. Under the
scheme 5,149,330 ADS are reserved to be issued to eligible associates with the intention to issue the warrants at a price per
option which is not less than 90% of the value of one ADS as reported on NYSE on the date of grant converted into Indian
Rupees at the rate of exchange prevalent on the day of grant as decided by the Administrator of the ASOP (ADS). Each ADS
represents two equity shares of Rs. 2 each fully paid up. These warrants vest over a period of 1-10 years from the date of
the grant. The time available to exercise the warrants upon vesting is as decided by the Administrator of the ASOP (ADS).
Accordingly, options (net of cancellation) for a total number of 1,283,118 ADS (2007 – 1,461,064) representing 2,566,236
equity shares of Rs. 2 each were outstanding as at March 31, 2008 (2007 – 2,922,128).
Changes in number of options outstanding were as follows:
Options Year ended March 31,
2008 2007
At the beginning of the year 1,461,064 1,991,342
Granted – 20,000
Exercised (140,494) (424,136)
Cancelled (36,712) (126,142)
Lapsed (740) –
At the end of the year 1,283,118 1,461,064
iv) Associate Stock Option Plan - Restricted Stock Units (ASOP – RSUs)
Satyam Computer Services has established a scheme “Associate Stock Option Plan - Restricted Stock Units (ASOP – RSUs)”
to be administered by the Administrator of the ASOP – RSUs, a committee appointed by the Board of Directors of Satyam
Computer Services. Under the scheme 13,000,000 equity shares are reserved to be issued to eligible associates at a price to
Sat_AR08_Final_Jul22_TP 2 Col.pmd 7/23/2008, 7:19 PM111
112
be determined by the Administrator which shall not be less than the face value of the share. These RSUs vest over a period
of 1-4 years from the date of the grant. The maximum time available to exercise the warrants upon vesting is five years from
the date of vesting.
Accordingly, options (net of cancellations) for a total number of 3,150,202 ASOP-RSUs equity shares of Rs. 2 each were
outstanding as at March 31, 2008 (2007 – 3,293,140).
Options Year ended March 31,
2008 2007
At the beginning of the year 3,293,140 –
Granted 159,000 3,293,140
Exercised (120,449) –
Cancelled (181,489) –
At the end of the year 3,150,202 3,293,140
v) Associate Stock Option Plan — RSUs(ADS) (ASOP – RSUs(ADS))
Satyam Computer Services has established a scheme “Associate Stock Option Plan - RSUs (ADS)” to be administered by the
Administrator of the ASOP – RSUs (ADS), a committee appointed by the Board of Directors of Satyam Computer Services.
Under the scheme 13,000,000 equity shares minus the number of shares issued from time to time under the Associate Stock
Option Plan — RSUs are reserved to be issued to eligible associates at a price to be determined by the Administrator not less
than the face value of the share. These RSUs vest over a period of 1-4 years from the date of the grant. The maximum time
available to exercise the warrants upon vesting is five years from the date of vesting.
Accordingly, options (net of cancellation) for a total number of 249,715 ADS (2007 – 236,620) representing 499,430 equity
shares of Rs. 2 each were outstanding as at March 31, 2008 (2007 – 473,240).
Options Year ended March 31,
2008 2007
At the beginning of the year 236,620 –
Granted 43,500 236,620
Exercised (7,720) –
Cancelled (22,685) –
At the end of the year 249,715 236,620
2) Stock Option Scheme of Satyam BPO Limited (“Satyam BPO”)
In April 2004, Satyam BPO established its Employee Stock Option Plan (the “ESOP”) for its employees. The exercise price is
equal to the fair market value on the date of the grant. These options vest over a period ranging from two to four years,
starting with 33.33% in the second year, 33.33% in the third year and remaining 33.34% in the fourth year from the date of
grant and are subject to lock in period of one year from the grant date.
Accordingly, options (net of cancellations) for a total number of 639,750 equity shares of Rs. 80 each were outstanding as
at March 31, 2008 (2007 – 998,702).
Options Year ended March 31,
2008 2007
At the beginning of the year 998,702 1,215,506
Granted – 324,000
Exercised 358,952 –
Cancelled – (540,804)
At the end of the year 639,750 998,702
c) Pro forma disclosures
In accordance with SEBI (Employee Stock Option Scheme and Employee Stock Purchase Scheme) Guidelines, 1999, had the
compensation cost for associate stock option plans been recognized based on the fair value at the date of grant in accordance
with Black Scholes’ model, the pro forma amounts of Satyam’s net profit and earnings per share would have been as follows:
Sat_AR08_Final_Jul22_TP 2 Col.pmd 7/23/2008, 7:19 PM112
113
Particulars Year ended March 31,
2008 2007
1. Profit After Taxation and Minority Interest
- As reported (Rs. in crores ) 1,687.89 1,404.74
- Pro forma (Rs. in crores ) 1,673.45 1,354.56
2. Earnings Per Share:
Basic
- No. of shares 668,673,978 654,853,959
- EPS as reported (Rs.) 25.24 21.45
- Pro forma EPS (Rs.) 25.02 20.68
Diluted
- No. of shares 683,138,400 669,705,425
- EPS as reported (Rs.) 24.71 20.98
- Pro forma EPS (Rs.) 24.50 20.23
The following assumptions were used for calculation of fair value of grants:
Options Year ended March 31,
2008 2007
Dividend yield (%) 0.78 0.78
Expected volatility (%) 56.64 59.01
Risk-free interest rate (%) 8.00 8.00
Expected term (in years) 2.51 2.46
d) Convertible Redeemable Cumulative Preference Shares
Satyam BPO issued 45,669,999 and 45,340,000 0.05% Convertible Redeemable Cumulative Preference Shares of par value Rs.10
each fully paid-up in October 2003 and June 2004 respectively to Olympus BPO Holdings Ltd. and Intel Capital Corporation
(“Preference shareholders”) for an aggregate consideration of Rs. 91.01 crores (equivalent to US$ 20 millions). These Preference
shares were to be mandatorily converted/redeemed into such number of equity shares latest by June 2007 based on certain
provisions in the agreement entered with the preference shareholders relating to revenues and profits earned up to March 31,
2006. The said preference shares, if not converted or early converted at the option of the preference shareholders based on certain
triggering events, were redeemable on maturity in June 2007 at a redemption premium, which could range in between 7.5% to
13.5% p.a. Accordingly, Satyam BPO received a notice of conversion of fifty percent of preference shares into equity shares, from
its preference share holders, on December 1, 2006. And in January 2007 45,505,000 preference shares have converted into
6,422,267 equity shares of Satyam BPO. The balance preference shares were to be redeemed at a premium to be mutually agreed
upon at a later date. Satyam Computer Services guaranteed payment of all sums payable by Satyam BPO to the preference
shareholders on redemption of the said preference shares.
Due to the issue of shares by Satyam BPO, Satyam Computer Services’ ownership interest in Satyam BPO was reduced from 100%
as at March 31, 2006 to 74% as at March 31, 2007. The shares issued to the Investors are at amounts per share higher than
Satyam Computer Services’ average cost per share. With respect to this transaction, the resulting gain of Rs.45.51 crores during
the year ended March 31, 2007 has been recorded as an increase in capital reserve. Since the losses applicable to the minority
interest in Satyam BPO exceeded the minority interest in the equity capital of Satyam BPO, such excess and further losses have
been charged in Satyam’s consolidated statement of income.
On July 27, 2007, Satyam Computer Services has agreed to pay additional consideration of US$ 1.5 million to the preference share
holder if the share purchase closing occurs after August 07, 2007.
On August 14, 2007, Satyam Computer Services purchased 4,816,750 equity shares of Satyam BPO from Olympus BPO Holdings
Ltd for Rs.141.81 Crores (equivalent US$34.88 million).
On August 14, 2007, Satyam Computer Services subscribed to further 8,055,000 equity shares of Satyam BPO of Rs. 10 each at
a premium of Rs. 60 per share aggregating to Rs. 56.39 crores.
Satyam BPO has redeemed 45,504,999 Preference Shares on August 14, 2007 at a redemption value of Rs.56.37 crores including
premium on redemption of Rs.10.87 crores. The premium on redemption was reduced from the share premium account.
Sat_AR08_Final_Jul22_TP 2 Col.pmd 7/23/2008, 7:19 PM113
114
In September 2007, 286,952 equity shares vested and exercised by Satyam BPO employees under its Employee Stock Option Plan.
As a result of the above, Satyam Computer Services ownership interest in Satyam BPO reduced from 95.10% to 94.27% and a gain
on dilution of Rs. 2.60 crores has been recorded as increase in Capital Reserve. Satyam Computer Services purchased these
286,952 Equity shares for a consideration of Rs. 8.47 crores.
On December 31, 2007, Satyam Computer Services purchased 1,605,617 equity shares of Satyam BPO from Intel Capital
(Cayman) Corporation for Rs.45.94 Crores (equivalent US$11.62 million).
On March 14, 2008, 72,000 equity shares vested to and exercised by Satyam BPO employee under its Employee Stock Option Plan,
resulting in a gain on dilution of Rs. 0.58 crores has been recorded as increase in Capital Reserve. Satyam Computer Services
purchased these 72,000 equity shares for a consideration of Rs. 2.09 crores.
e) Share application money pending allotment
Amount received from associates of Satyam Computer Services on exercise of stock options, pending allotment of shares is
shown as share application money pending allotment.
f) Secured Loans
Bank Overdraft and Export Packing Credit are secured by way of hypothecation of book debts. External Commercial Borrowing
and Working Capital loan are secured by way of movable and immovable property.
Vehicles are hypothecated to the banks as security for the amounts borrowed.
g) Investments
i. During May 2005, Satyam Computer Services acquired Citisoft Plc (“Citisoft”), a specialist business and systems consulting
firm located in the United Kingdom that has focused on the investment management industry, with operating presence in
London, Boston and New York.
Satyam Computer Services acquired 75% of the shareholding in Citisoft for an initial cash consideration of Rs. 62.35 crores
(inclusive of acquisition costs) and a deferred consideration of Rs.13.63 crores (equivalent GBP 1.75 million). Satyam
Computer Services was also required to pay a maximum earn out consideration amounting to Rs.18.35 crores (equivalent
GBP 2.25 million) based on achievement of targeted revenues and profits and Employee Benefit Trust (EBT) contribution of
Rs. 8.00 crores (equivalent GBP 0.9 million).
On June 29, 2006, Satyam Computer Services acquired the remaining 25% shareholding for a consideration of Rs. 27.47
crores (equivalent GBP 3.26 million) and a maximum earn-out consideration of Rs. 28.87 crores (equivalent GBP 3.54
million) based on achievement of targeted revenues and profits and a maximum EBT contribution of Rs. 14.68 crores
(equivalent GBP 1.80 million) contingent on Citisoft achieving certain revenue and profit performance targets. Satyam
Computer Service paid Rs. 0.65 crores (equivalent GBP 0.08 million) towards EBT contribution in May 2007.
On June 29, 2007, Satyam Computer Services entered into an amendment agreement with the selling shareholders providing
for an early exit of the selling shareholders. As per the amendment agreement, an exit consideration of Rs. 14.25 crores
(equivalent GBP 1.74 million) and payment towards EBT of Rs.0.65 crores (equivalent GBP 0.08 million) is payable by
Satyam Computer Services in July 2007 upon selling shareholders agreeing for removal of provisions of deferred consideration,
maximum earn-out consideration and a portion of payments towards EBT. The exit consideration and EBT contribution
payable as per the amended agreement have been paid in July 2007 and the payment has been recognized as cost of
investment by Satyam Computer Services.
ii. During October 2005, Satyam Computer Services acquired Knowledge Dynamics Pte Ltd (KDPL), a leading Data Warehousing
and Business Intelligence Solutions provider, with operating presence in Singapore, Malaysia, USA and India.
Satyam Computer Services acquired 100% of the shareholding in KDPL for a consideration of Rs. 14.64 crores (inclusive of
acquisition costs) and a maximum earn out consideration of Rs. 4.87 crores (equivalent SGD 1.84 million) payable on April
30, 2008, based on achievement of targeted revenues and profits.
On July 19 2007, Satyam Computer Services entered into an amendment agreement with the selling shareholders of KDPL
on agreeing to the terms of the agreement including removal of provisions relating to earn out consideration. As per the
amendment agreement, an exit consideration of Rs. 2.97 crores (equivalent SGD 1.11 million) has been paid by Satyam
Computer Services in July 2007. In addition to the exit consideration Satyam Computer Services agreed to make a deferred
payment of Rs. 0.99 crores (equivalent SGD 0.37 million) payable by May 15, 2008.The exit consideration and deferred
payment has been recognised as Goodwill. Further Satyam Computer Services agreed to make a maximum earn-out
payment of Rs. 2.14 crores (equivalent SGD 0.74 million) on or before May 15, 2008. The actual amount of earn-out
payment to be made is based on the revenue of KDPL for the year 2007-08.
iii. On October 23, 2007, Satyam Computer Services announced its intention to acquire 100% of the shares of NITOR Global
Solutions Ltd, United Kingdom (“Nitor”), a Company specialized in the Infrastructure Management Services (IMS) space.
Sat_AR08_Final_Jul22_TP 2 Col.pmd 7/23/2008, 7:19 PM114
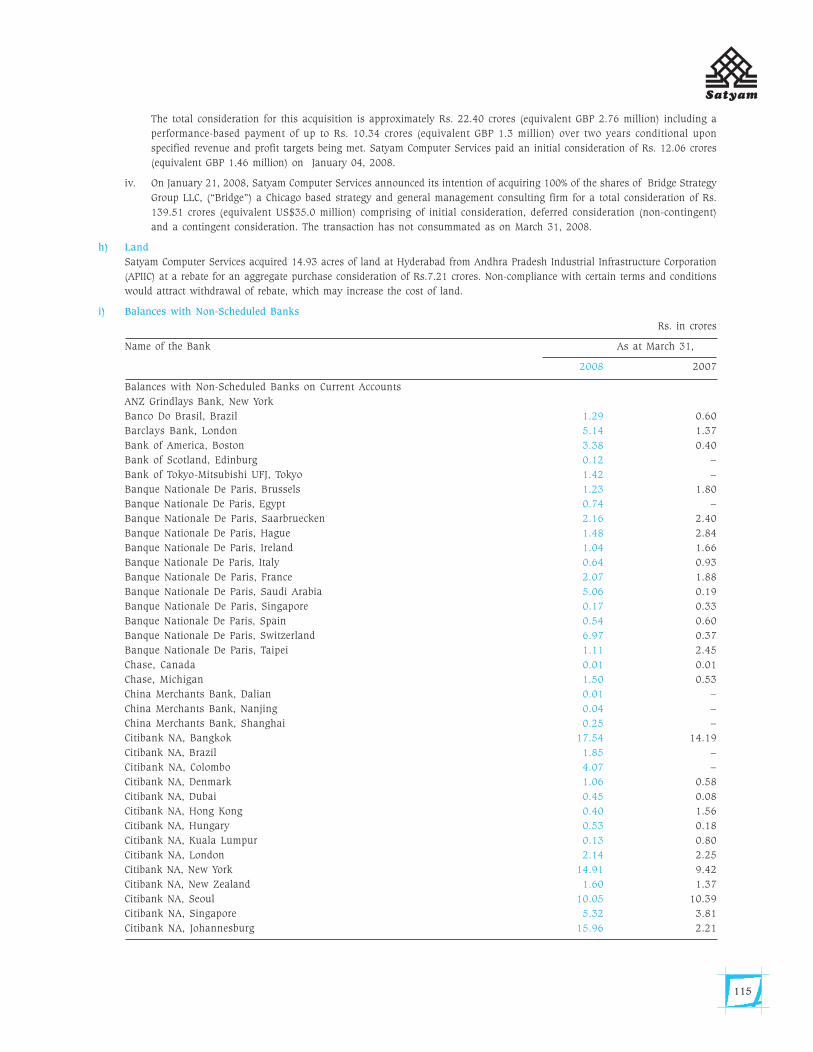
115
The total consideration for this acquisition is approximately Rs. 22.40 crores (equivalent GBP 2.76 million) including a
performance-based payment of up to Rs. 10.34 crores (equivalent GBP 1.3 million) over two years conditional upon
specified revenue and profit targets being met. Satyam Computer Services paid an initial consideration of Rs. 12.06 crores
(equivalent GBP 1.46 million) on January 04, 2008.
iv. On January 21, 2008, Satyam Computer Services announced its intention of acquiring 100% of the shares of Bridge Strategy
Group LLC, (“Bridge”) a Chicago based strategy and general management consulting firm for a total consideration of Rs.
139.51 crores (equivalent US$35.0 million) comprising of initial consideration, deferred consideration (non-contingent)
and a contingent consideration. The transaction has not consummated as on March 31, 2008.
h) Land
Satyam Computer Services acquired 14.93 acres of land at Hyderabad from Andhra Pradesh Industrial Infrastructure Corporation
(APIIC) at a rebate for an aggregate purchase consideration of Rs.7.21 crores. Non-compliance with certain terms and conditions
would attract withdrawal of rebate, which may increase the cost of land.
i) Balances with Non-Scheduled Banks
Rs. in crores
Name of the Bank As at March 31,
2008 2007
Balances with Non-Scheduled Banks on Current Accounts
ANZ Grindlays Bank, New York
Banco Do Brasil, Brazil 1.29 0.60
Barclays Bank, London 5.14 1.37
Bank of America, Boston 3.38 0.40
Bank of Scotland, Edinburg 0.12 –
Bank of Tokyo-Mitsubishi UFJ, Tokyo 1.42 –
Banque Nationale De Paris, Brussels 1.23 1.80
Banque Nationale De Paris, Egypt 0.74 –
Banque Nationale De Paris, Saarbruecken 2.16 2.40
Banque Nationale De Paris, Hague 1.48 2.84
Banque Nationale De Paris, Ireland 1.04 1.66
Banque Nationale De Paris, Italy 0.64 0.93
Banque Nationale De Paris, France 2.07 1.88
Banque Nationale De Paris, Saudi Arabia 5.06 0.19
Banque Nationale De Paris, Singapore 0.17 0.33
Banque Nationale De Paris, Spain 0.54 0.60
Banque Nationale De Paris, Switzerland 6.97 0.37
Banque Nationale De Paris, Taipei 1.11 2.45
Chase, Canada 0.01 0.01
Chase, Michigan 1.50 0.53
China Merchants Bank, Dalian 0.01 –
China Merchants Bank, Nanjing 0.04 –
China Merchants Bank, Shanghai 0.25 –
Citibank NA, Bangkok 17.54 14.19
Citibank NA, Brazil 1.85 –
Citibank NA, Colombo 4.07 –
Citibank NA, Denmark 1.06 0.58
Citibank NA, Dubai 0.45 0.08
Citibank NA, Hong Kong 0.40 1.56
Citibank NA, Hungary 0.53 0.18
Citibank NA, Kuala Lumpur 0.13 0.80
Citibank NA, London 2.14 2.25
Citibank NA, New York 14.91 9.42
Citibank NA, New Zealand 1.60 1.37
Citibank NA, Seoul 10.05 10.39
Citibank NA, Singapore 5.32 3.81
Citibank NA, Johannesburg 15.96 2.21
Sat_AR08_Final_Jul22_TP 2 Col.pmd 7/23/2008, 7:19 PM115
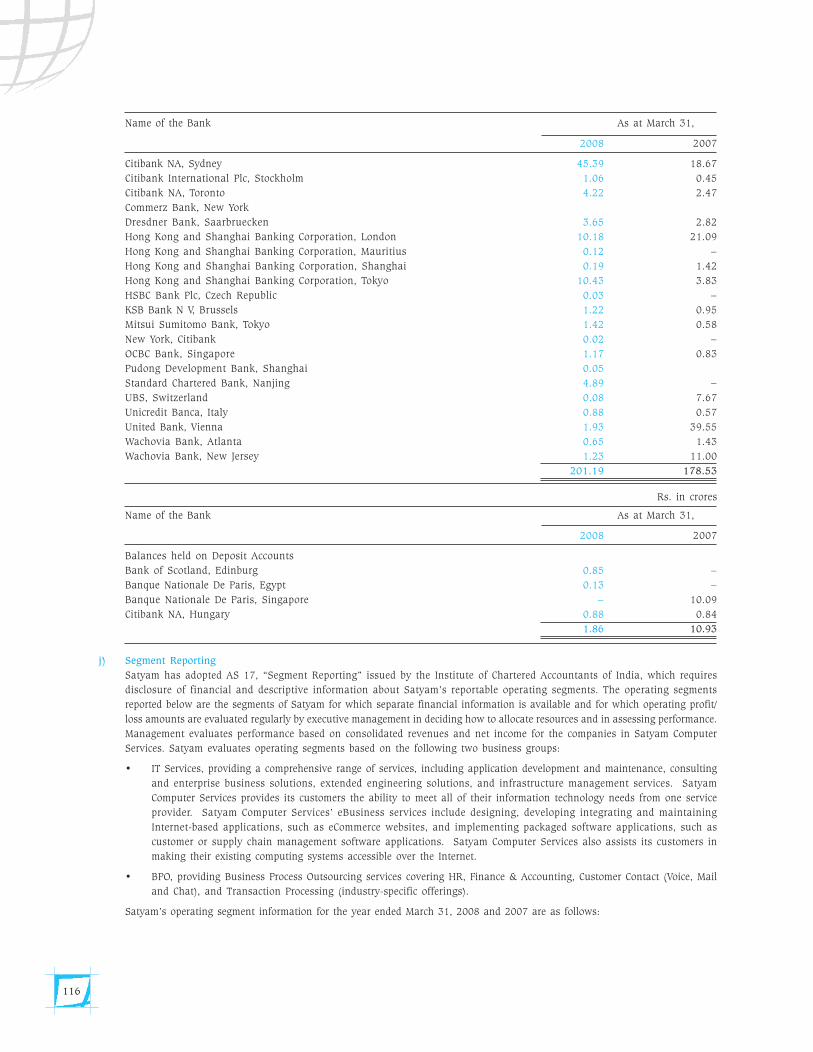
116
Name of the Bank As at March 31,
2008 2007
Citibank NA, Sydney 45.39 18.67
Citibank International Plc, Stockholm 1.06 0.45
Citibank NA, Toronto 4.22 2.47
Commerz Bank, New York
Dresdner Bank, Saarbruecken 3.65 2.82
Hong Kong and Shanghai Banking Corporation, London 10.18 21.09
Hong Kong and Shanghai Banking Corporation, Mauritius 0.12 –
Hong Kong and Shanghai Banking Corporation, Shanghai 0.19 1.42
Hong Kong and Shanghai Banking Corporation, Tokyo 10.43 3.83
HSBC Bank Plc, Czech Republic 0.03 –
KSB Bank N V, Brussels 1.22 0.95
Mitsui Sumitomo Bank, Tokyo 1.42 0.58
New York, Citibank 0.02 –
OCBC Bank, Singapore 1.17 0.83
Pudong Development Bank, Shanghai 0.05
Standard Chartered Bank, Nanjing 4.89 –
UBS, Switzerland 0.08 7.67
Unicredit Banca, Italy 0.88 0.57
United Bank, Vienna 1.93 39.55
Wachovia Bank, Atlanta 0.65 1.43
Wachovia Bank, New Jersey 1.23 11.00
201.19 178.53
Rs. in crores
Name of the Bank As at March 31,
2008 2007
Balances held on Deposit Accounts
Bank of Scotland, Edinburg 0.85 –
Banque Nationale De Paris, Egypt 0.13 –
Banque Nationale De Paris, Singapore – 10.09
Citibank NA, Hungary 0.88 0.84
1.86 10.93
j) Segment Reporting
Satyam has adopted AS 17, “Segment Reporting” issued by the Institute of Chartered Accountants of India, which requires
disclosure of financial and descriptive information about Satyam’s reportable operating segments. The operating segments
reported below are the segments of Satyam for which separate financial information is available and for which operating profit/
loss amounts are evaluated regularly by executive management in deciding how to allocate resources and in assessing performance.
Management evaluates performance based on consolidated revenues and net income for the companies in Satyam Computer
Services. Satyam evaluates operating segments based on the following two business groups:
• IT Services, providing a comprehensive range of services, including application development and maintenance, consulting
and enterprise business solutions, extended engineering solutions, and infrastructure management services. Satyam
Computer Services provides its customers the ability to meet all of their information technology needs from one service
provider. Satyam Computer Services’ eBusiness services include designing, developing integrating and maintaining
Internet-based applications, such as eCommerce websites, and implementing packaged software applications, such as
customer or supply chain management software applications. Satyam Computer Services also assists its customers in
making their existing computing systems accessible over the Internet.
• BPO, providing Business Process Outsourcing services covering HR, Finance & Accounting, Customer Contact (Voice, Mail
and Chat), and Transaction Processing (industry-specific offerings).
Satyam’s operating segment information for the year ended March 31, 2008 and 2007 are as follows:
Sat_AR08_Final_Jul22_TP 2 Col.pmd 7/23/2008, 7:19 PM116
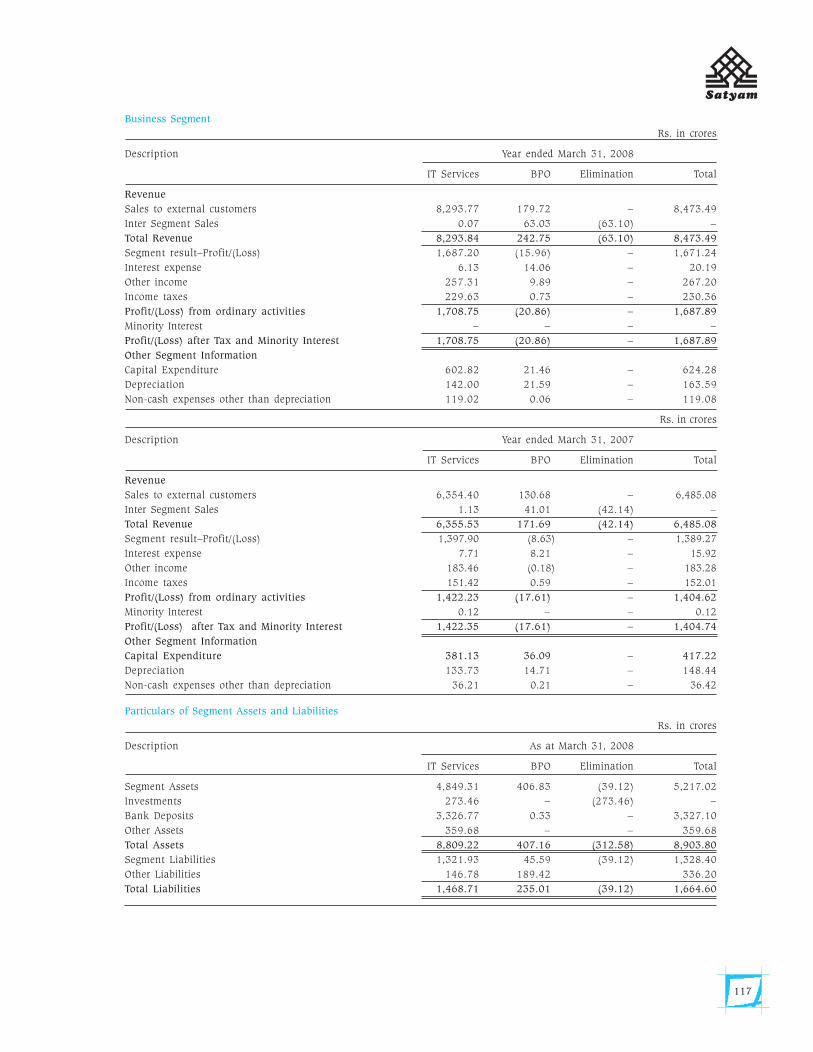
117
Business Segment
Rs. in crores
Description Year ended March 31, 2008
IT Services BPO Elimination Total
Revenue
Sales to external customers 8,293.77 179.72 – 8,473.49
Inter Segment Sales 0.07 63.03 (63.10) –
Total Revenue 8,293.84 242.75 (63.10) 8,473.49
Segment result–Profit/(Loss) 1,687.20 (15.96) – 1,671.24
Interest expense 6.13 14.06 – 20.19
Other income 257.31 9.89 – 267.20
Income taxes 229.63 0.73 – 230.36
Profit/(Loss) from ordinary activities 1,708.75 (20.86) – 1,687.89
Minority Interest – – – –
Profit/(Loss) after Tax and Minority Interest 1,708.75 (20.86) – 1,687.89
Other Segment Information
Capital Expenditure 602.82 21.46 – 624.28
Depreciation 142.00 21.59 – 163.59
Non-cash expenses other than depreciation 119.02 0.06 – 119.08
Rs. in crores
Description Year ended March 31, 2007
IT Services BPO Elimination Total
Revenue
Sales to external customers 6,354.40 130.68 – 6,485.08
Inter Segment Sales 1.13 41.01 (42.14) –
Total Revenue 6,355.53 171.69 (42.14) 6,485.08
Segment result–Profit/(Loss) 1,397.90 (8.63) – 1,389.27
Interest expense 7.71 8.21 – 15.92
Other income 183.46 (0.18) – 183.28
Income taxes 151.42 0.59 – 152.01
Profit/(Loss) from ordinary activities 1,422.23 (17.61) – 1,404.62
Minority Interest 0.12 – – 0.12
Profit/(Loss) after Tax and Minority Interest 1,422.35 (17.61) – 1,404.74
Other Segment Information
Capital Expenditure 381.13 36.09 – 417.22
Depreciation 133.73 14.71 – 148.44
Non-cash expenses other than depreciation 36.21 0.21 – 36.42
Particulars of Segment Assets and Liabilities
Rs. in crores
Description As at March 31, 2008
IT Services BPO Elimination Total
Segment Assets 4,849.31 406.83 (39.12) 5,217.02
Investments 273.46 – (273.46) –
Bank Deposits 3,326.77 0.33 – 3,327.10
Other Assets 359.68 – – 359.68
Total Assets 8,809.22 407.16 (312.58) 8,903.80
Segment Liabilities 1,321.93 45.59 (39.12) 1,328.40
Other Liabilities 146.78 189.42 336.20
Total Liabilities 1,468.71 235.01 (39.12) 1,664.60
Sat_AR08_Final_Jul22_TP 2 Col.pmd 7/23/2008, 7:19 PM117
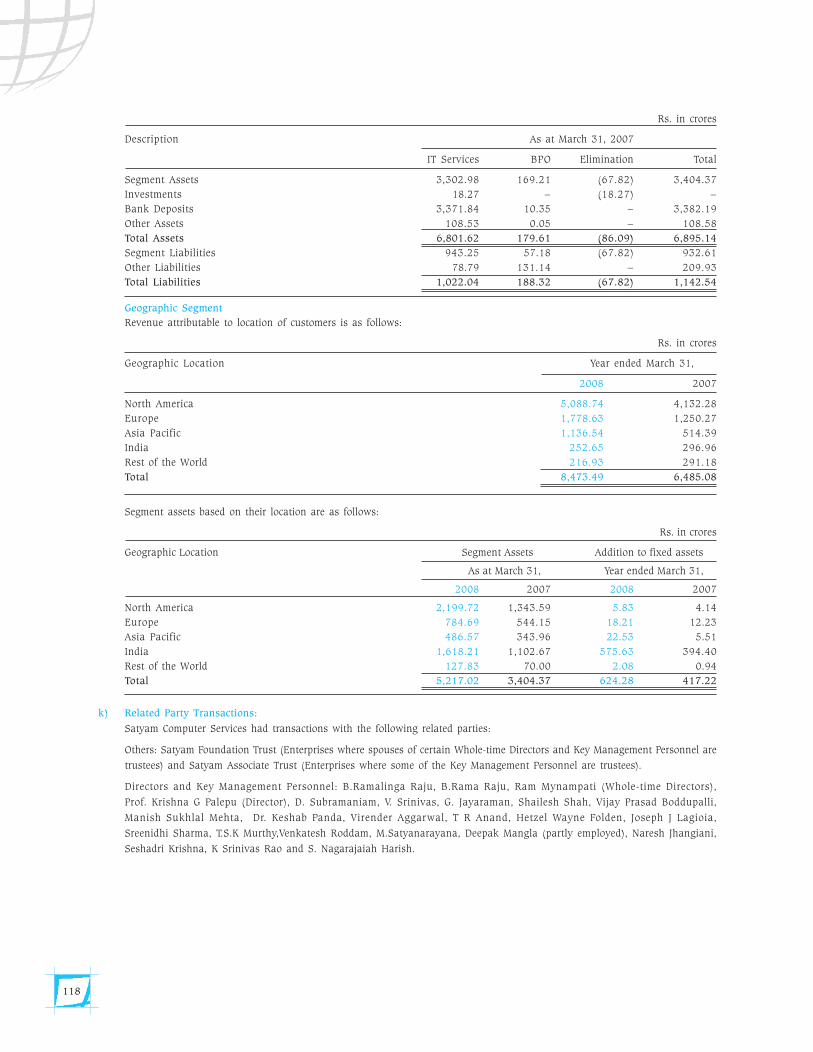
118
Rs. in crores
Description As at March 31, 2007
IT Services BPO Elimination Total
Segment Assets 3,302.98 169.21 (67.82) 3,404.37
Investments 18.27 – (18.27) –
Bank Deposits 3,371.84 10.35 – 3,382.19
Other Assets 108.53 0.05 – 108.58
Total Assets 6,801.62 179.61 (86.09) 6,895.14
Segment Liabilities 943.25 57.18 (67.82) 932.61
Other Liabilities 78.79 131.14 – 209.93
Total Liabilities 1,022.04 188.32 (67.82) 1,142.54
Geographic Segment
Revenue attributable to location of customers is as follows:
Rs. in crores
Geographic Location Year ended March 31,
2008 2007
North America 5,088.74 4,132.28
Europe 1,778.63 1,250.27
Asia Pacific 1,136.54 514.39
India 252.65 296.96
Rest of the World 216.93 291.18
Total 8,473.49 6,485.08
Segment assets based on their location are as follows:
Rs. in crores
Geographic Location Segment Assets Addition to fixed assets
As at March 31, Year ended March 31,
2008 2007 2008 2007
North America 2,199.72 1,343.59 5.83 4.14
Europe 784.69 544.15 18.21 12.23
Asia Pacific 486.57 343.96 22.53 5.51
India 1,618.21 1,102.67 575.63 394.40
Rest of the World 127.83 70.00 2.08 0.94
Total 5,217.02 3,404.37 624.28 417.22
k) Related Party Transactions:
Satyam Computer Services had transactions with the following related parties:
Others: Satyam Foundation Trust (Enterprises where spouses of certain Whole-time Directors and Key Management Personnel are
trustees) and Satyam Associate Trust (Enterprises where some of the Key Management Personnel are trustees).
Directors and Key Management Personnel: B.Ramalinga Raju, B.Rama Raju, Ram Mynampati (Whole-time Directors),
Prof. Krishna G Palepu (Director), D. Subramaniam, V. Srinivas, G. Jayaraman, Shailesh Shah, Vijay Prasad Boddupalli,
Manish Sukhlal Mehta, Dr. Keshab Panda, Virender Aggarwal, T R Anand, Hetzel Wayne Folden, Joseph J Lagioia,
Sreenidhi Sharma, T.S.K Murthy,Venkatesh Roddam, M.Satyanarayana, Deepak Mangla (partly employed), Naresh Jhangiani,
Seshadri Krishna, K Srinivas Rao and S. Nagarajaiah Harish.
Sat_AR08_Final_Jul22_TP 2 Col.pmd 7/23/2008, 7:19 PM118
119
Summary of the transactions and balances with the above related parties are as follows:
Transactions:
Rs. in crores
Year ended March 31,
2008 2007
Others
Contributions 4.19 3.48
Balances:
Rs. in crores
As at March 31,
Others 2008 2007
Advances 5.72 5.72
Payables 1.10 0.99
Transactions with Directors and Key Management Personnel
Rs. in crores
Year ended March 31,
Nature of Transactions 2008 2007
Remuneration to Whole-time Directors 4.56 2.27
Remuneration to Key Management Personnel 24.83 24.01
Professional charges to Director 0.80 0.87
Advances to Key Management Personnel 0.21 1.58
Balances due to / from Directors and Key Management Personnel
Rs. in crores
As at March 31,
2008 2007
Remuneration payable to Whole-time Directors 0.23 0.45
Remuneration payable to Key Management Personnel 1.13 0.89
Advances due from Key Management Personnel 0.16 0.19
Professional charges payable to Director 0.20 0.87
a) Maximum indebtedness from Key Managerial Personnel during the year was Rs. 0.31 crores (2007 – Rs.1.95 crores).
b ) Options granted and outstanding to the Key Management Personnel 1,915,492 {includes 51,850 options granted under
ASOP – ADS and 96,000 options granted under ASOP – RSUs (ADS)} (2007 – 2,969,128 {includes 139,554 options granted
under ASOP – ADS and 61,500 options granted under ASOP – RSUs (ADS)} ).
Options granted and outstanding to a Whole-time Director 1,029,720 {includes 992,220 options granted under ASOP –
ADS and 37,500 options granted under ASOP – RSUs (ADS)}; (2007- 1,050,720 {includes 1,025,720 options granted
under ASOP – ADS and 50,000 options granted under ASOP – RSUs (ADS)}).
Options granted and outstanding to Non-executive Directors of Satyam 80,000 {includes 35,000 options granted under
ASOP – RSUs (ADS)} (2007 – Nil).
l) Obligation on long term non-cancelable operating leases
Satyam Computer Services has entered into operating lease agreements for its development centres at offshore, onsite and offsites
ranging for a period of 3 to 10 years. The lease rentals charged during the year and maximum obligations on long-term non-
cancelable operating leases payable as per the rentals stated in respective agreements are as follows:
Sat_AR08_Final_Jul22_TP 2 Col.pmd 7/23/2008, 7:19 PM119
120
Rs. in crores
Year ended March 31,
2008 2007
Lease rentals (Refer Schedule 16) 143.25 100.75
As at March 31,
2008 2007
Obligations on non-cancelable leases
Not later than one year 69.46 20.23
Later than one year and not later than five years 272.66 17.20
Later than five years 53.03 1.43
Total 395.15 38.86
m) Earnings per Share
At the Annual General Meeting of Satyam Computer Services held on August 21, 2006, the shareholders approved a 1:1 bonus
issue for all shareholders including the ADS holders i.e. one additional equity share for every one existing equity share held by the
members by utilising a part of the general reserves. The record date for the bonus issue was October 10, 2006 and shares were
allotted on October 11, 2006. All basic and diluted shares used in determining earnings per share for the year ended March 31,
2007 are after considering the effect of bonus issue.
Calculation of EPS (Basic and Diluted):
S.No. Particulars Year ended March 31,
2008 2007
Basic
1. Opening no. of shares 667,196,009 648,899,078
2. Total Shares outstanding 668,673,978 654,853,959
3. Profit after Taxation and Minority Interest (Rs. in crores ) 1,687.89 1,404.74
4. EPS (Rs.) 25.24 21.45
Diluted
5. Stock options outstanding 14,464,422 14,851,466
6. Total shares outstanding (including dilution) 683,138,400 669,705,425
7. EPS (Rs.) 24.71 20.98
n) The aggregate amounts of the assets, liabilities, income and expenses related to Satyam’s share in joint venture companies
that are consolidated and included in these financial statements are as follows:
Rs. in crores
Description Year ended March 31,
2008 2007
Income from Sales and Services 39.21 38.38
Other Income 0.26 1.97
Total 39.47 40.35
Personnel expenses 22.37 19.57
Other expenses 14.13 12.74
Interest 0.04 0.09
Depreciation 2.10 2.02
Total 38.64 34.42
Net Profit 0.83 5.93
Sat_AR08_Final_Jul22_TP 2 Col.pmd 7/23/2008, 7:19 PM120
121
Rs. in crores
Description As at March 31,
2008 2007
Secured Loans 0.06 0.06
Fixed Assets 1.43 2.96
Inventories 0.09 0.02
Sundry Debtors 13.66 12.12
Cash and Bank Balances 16.30 9.84
Loans and Advances 6.18 3.32
Interest Accrued on Fixed Deposits 0.05 0.03
Current Liabilities 15.14 6.46
Provisions 1.07 0.61
o) Commitments and Contingencies
i. Bank Guarantees outstanding Rs. 104.51 crores (2007 – Rs. 99.46 crores).
ii. Contracts pending execution on capital accounts, net of advances, Rs. 402.19 crores (2007 – Rs. 164.58 crores)
iii. Forward & Option Contracts outstanding Rs. 4,534.46 crores (equivalent US 1,133.07 millions) {2007 - Rs. 1,978.98 crores
(equivalent US$ 452.63 millions)}.Gain/(Loss) on foreign exchange forward and options contracts which are included
under the head Gain/(Loss) on exchange fluctuation in the profit and loss account amounted to Rs. 38.27 crores {2007 –
Rs. 26.64 crores}. There are no unhedged forex exposures.
iv. Claims against the company not acknowledged as debts
Income tax and Sales tax matters under dispute – Rs. 27.98 crores (2007 – Rs. 22.03 crores)
v. Purchase commitments in respect of subsidiary (Refer note g (iv) of Schedule 18).
vi. Arrears on 0.05% Convertible Redeemable Cumulative Preference Shares amounting to Rs. Nil (2007 – Rs. 0.14 crores)
vii. Contingent consideration payable in respect of acquired subsidiary companies Rs. 12.36 crores (2007 – Rs. 75.56 crores)
viii. Satyam Computer Services has given a corporate guarantee on behalf of a subsidiary for the loan obtained amounting to
a maximum of Rs. 194.65 crores (2007 – Rs. 87.18 crores).
ix. Satyam Computer Services entered into a joint venture agreement with Venture Global Engineering LLC (“VGE”) to form
Satyam Venture Engineering Services Pvt. Ltd (“SVES”) in India. As a result of VGE’s breach of the agreement between the
parties, Satyam Computer Services filed a request for arbitration, naming VGE as respondent, with the London Court of
International Arbitration (“LCIA”), seeking, among other things, to purchase VGE’s 50% interest in SVES at the agreed upon
book value price of the shares. The LCIA Arbitrator issued an Award on April 3, 2006 in favour of Satyam Computer
Services which it successfully enforced in the United States District Court in Michigan. During the enforcement proceedings
in the US, VGE filed a petition challenging the Award before the District Court, Secunderabad and made an appeal to the High
Court of Andhra Pradesh, both of which were rejected. Subsequently, in a special leave petition filed by VGE, the Supreme
Court of India set aside the orders of the District Court and the High Court and granted an interim stay of the share transfer
portion of the Award. The matter has been remanded back to the District Court, Secunderabad for trial on merits. Satyam
Computer Services believes that this will not have an adverse effect on results of operations, financial condition and cash
flows.
p) The Gratuity Plan
The following table sets forth the status of the Gratuity Plan of the company, and the amounts recognized in the consolidated
balance sheets and profit and loss account.
Rs. in crores
Description Year ended March 31,
2008 2007
Projected benefit obligation at the beginning of the year 47.54 35.34
Current service cost 13.10 8.96
Interest cost 3.45 2.32
Actuarial loss/(gain) 12.01 6.17
Benefits paid (5.07) (5.25)
Projected benefit obligation at the end of the year 71.04 47.54
Sat_AR08_Final_Jul22_TP 2 Col.pmd 7/23/2008, 7:19 PM121
122
Description Year ended March 31,
2008 2007
Amounts recognized in the balance sheetProjected benefit obligation at the end of the year 71.04 47.54Fair value of plan assets at end of the year – –
Funded status of the plans – (asset) / liability 71.04 47.54Liability recognised in the balance sheet 71.04 47.54
Gratuity cost for the yearCurrent service cost 13.10 8.96Interest cost 3.45 2.32Net actuarial (gain)/loss recognised in the year 12.01 6.19
Net gratuity cost 28.56 17.47
AssumptionsDiscount rate 7.50% 8.00%
Long-term rate of compensation increase 7.00% 7.00%
q) Provision For Leave encashment
Effective April 01, 2006, Satyam Computer Services has adopted the revised accounting standard (AS-15) on Employee Benefits.
Pursuant to the adoption, the transitional obligations of Satyam Computer Services towards leave encashment amounted to Rs.27.07 crores. As required by the standard, an amount of Rs. 17.47 crores (net of related deferred tax of Rs. 8.86 crores) has been
adjusted against opening balance of general reserve as at April 01, 2006.
r) The financial statements are represented in Rs. crores. Those items which were not represented in the financial statements due
to rounding off to the nearest Rs. crores are given below:
Rs. in lakhs
Schedule No. Description As at March 31,
2008 2007
5 (ii) National Saving Certificates, VIII Series (Lodged as security with government authorities) 0.16 0.16
18(i) Balances with non-scheduled banks ANZ Grindlays Bank, New York 0.09 0.09 Commerz Bank, New York 0.24 0.24
Pudong Development Bank, Shanghai 0.35
s) Share Premium
Share premium received during the year in schedule 2 includes Rs 18.89 crores being the Fringe Benefit Tax realised on exercise
of Employees Stock Options by the associates. Also the amount paid towards Fringe Benefit Tax is disclosed in the share premium
as utilized during the year.
t) Subsequent event
i) S&V Management consulting:
On April 21, 2008, Satyam Computer Services announced its intention of acquiring S&V Management Consultants (“S&V”)a Belgium based SCM Strategy consulting firm for a total consideration of Rs. 141.50 crores (equivalent US$ 35.5 million)comprising of an up-front, deferred guaranteed and deferred retention payments.
ii) Computer Associate’s 50% stake in CA-Satyam JV:On April 21, 2008, Satyam Computer Services announced its intention of acquiring remaining 50% equity held by CA Inc inits joint venture CA Satyam ASP Pvt. Ltd. (“CA Satyam”) for a total consideration of Rs. 5.98 crores (equivalent US$ 1.5million) payable in two tranches.
iii) Caterpillar’s business division:On April 21, 2008, Satyam Computer Services announced its intention to acquire the Market research and CustomerAnalytics (MR&CA) business unit from Caterpillar Inc., USA (CAT) including the related Intellectual Property which consistsof software, processes and know-how. The proposed acquisition is for a consideration of Rs. 239.16 crores (equivalent US$
60 million) comprising of initial and deferred consideration.
u) Reclassification
Figures for the corresponding previous year have been regrouped, recast and rearranged to conform to those of the current year
wherever necessary.
Sat_AR08_Final_Jul22_TP 2 Col.pmd 7/23/2008, 7:19 PM122
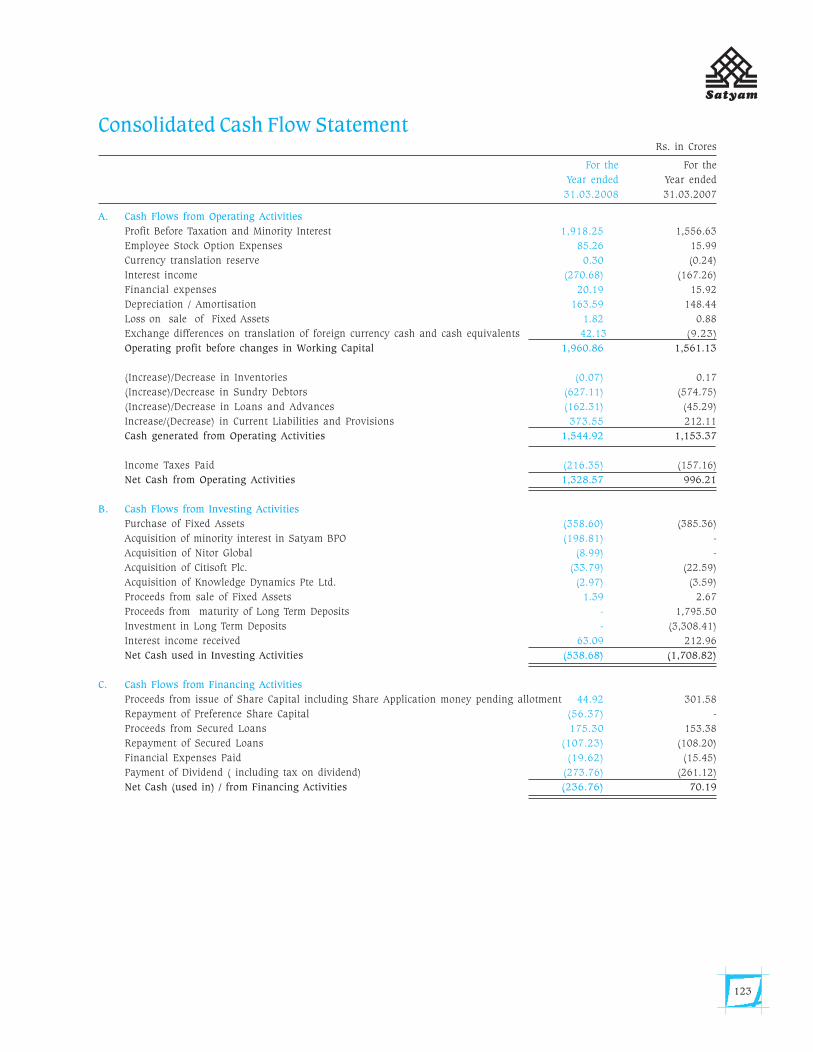
123
Consolidated Cash Flow StatementRs. in Crores
For the For the
Year ended Year ended
31.03.2008 31.03.2007
A. Cash Flows from Operating Activities
Profit Before Taxation and Minority Interest 1,918.25 1,556.63
Employee Stock Option Expenses 85.26 15.99
Currency translation reserve 0.30 (0.24)
Interest income (270.68) (167.26)
Financial expenses 20.19 15.92
Depreciation / Amortisation 163.59 148.44
Loss on sale of Fixed Assets 1.82 0.88
Exchange differences on translation of foreign currency cash and cash equivalents 42.13 (9.23)
Operating profit before changes in Working Capital 1,960.86 1,561.13
(Increase)/Decrease in Inventories (0.07) 0.17
(Increase)/Decrease in Sundry Debtors (627.11) (574.75)
(Increase)/Decrease in Loans and Advances (162.31) (45.29)
Increase/(Decrease) in Current Liabilities and Provisions 373.55 212.11
Cash generated from Operating Activities 1,544.92 1,153.37
Income Taxes Paid (216.35) (157.16)
Net Cash from Operating Activities 1,328.57 996.21
B. Cash Flows from Investing Activities
Purchase of Fixed Assets (358.60) (385.36)
Acquisition of minority interest in Satyam BPO (198.81) -
Acquisition of Nitor Global (8.99) -
Acquisition of Citisoft Plc. (33.79) (22.59)
Acquisition of Knowledge Dynamics Pte Ltd. (2.97) (3.59)
Proceeds from sale of Fixed Assets 1.39 2.67
Proceeds from maturity of Long Term Deposits - 1,795.50
Investment in Long Term Deposits - (3,308.41)
Interest income received 63.09 212.96
Net Cash used in Investing Activities (538.68) (1,708.82)
C. Cash Flows from Financing Activities
Proceeds from issue of Share Capital including Share Application money pending allotment 44.92 301.58
Repayment of Preference Share Capital (56.37) -
Proceeds from Secured Loans 175.30 153.38
Repayment of Secured Loans (107.23) (108.20)
Financial Expenses Paid (19.62) (15.45)
Payment of Dividend ( including tax on dividend) (273.76) (261.12)
Net Cash (used in) / from Financing Activities (236.76) 70.19
Sat_AR08_Final_Jul22_TP 2 Col.pmd 7/23/2008, 7:19 PM123
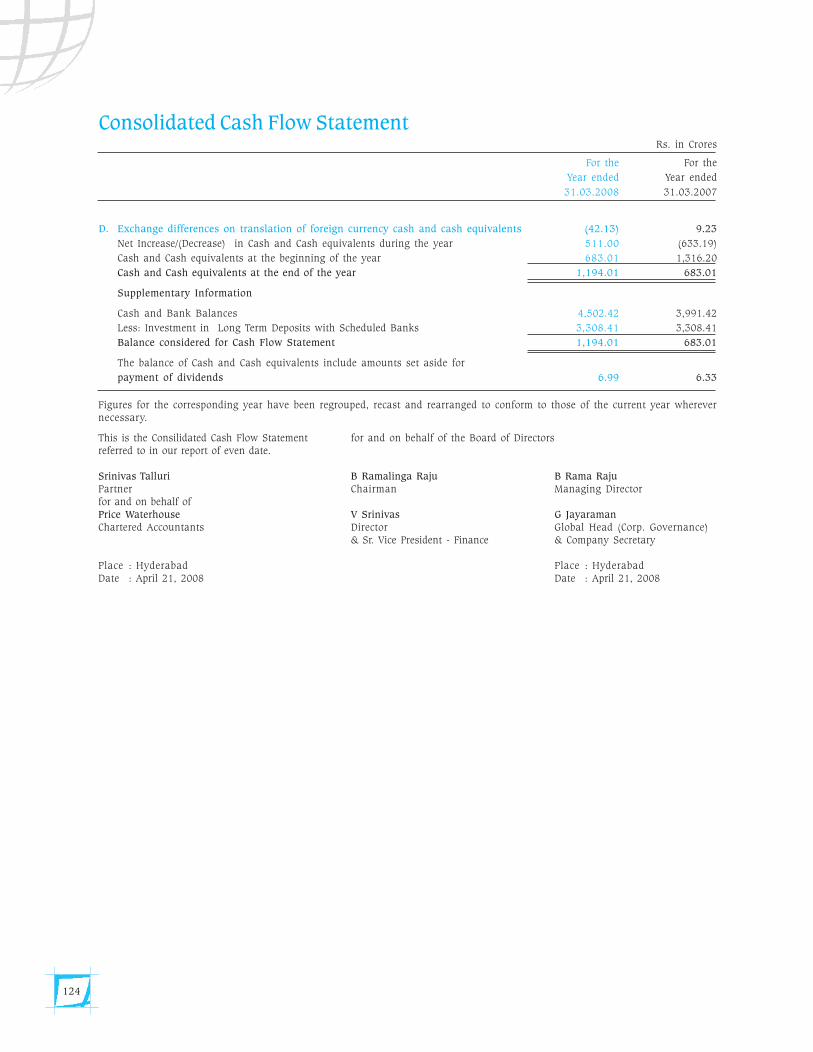
124
Consolidated Cash Flow StatementRs. in Crores
For the For the
Year ended Year ended
31.03.2008 31.03.2007
D. Exchange differences on translation of foreign currency cash and cash equivalents (42.13) 9.23
Net Increase/(Decrease) in Cash and Cash equivalents during the year 511.00 (633.19)
Cash and Cash equivalents at the beginning of the year 683.01 1,316.20
Cash and Cash equivalents at the end of the year 1,194.01 683.01
Supplementary Information
Cash and Bank Balances 4,502.42 3,991.42
Less: Investment in Long Term Deposits with Scheduled Banks 3,308.41 3,308.41
Balance considered for Cash Flow Statement 1,194.01 683.01
The balance of Cash and Cash equivalents include amounts set aside for
payment of dividends 6.99 6.33
Figures for the corresponding year have been regrouped, recast and rearranged to conform to those of the current year wherevernecessary.
This is the Consilidated Cash Flow Statement for and on behalf of the Board of Directorsreferred to in our report of even date.
Srinivas Talluri B Ramalinga Raju B Rama RajuPartner Chairman Managing Directorfor and on behalf ofPrice Waterhouse V Srinivas G JayaramanChartered Accountants Director Global Head (Corp. Governance)
& Sr. Vice President - Finance & Company Secretary
Place : Hyderabad Place : HyderabadDate : April 21, 2008 Date : April 21, 2008
Sat_AR08_Final_Jul22_TP 2 Col.pmd 7/23/2008, 7:19 PM124
125
IFRS Consolidated Financial Statements
• Independent Auditors’ Report
• Consolidated Balance Sheet
• Consolidated Income Statement
• Consolidated statement of changes in equity
• Consolidated Cash Flow Statement
• Notes to the consolidated financial statements
Sat_AR08_Final_Jul22_TP 2 Col.pmd 7/23/2008, 7:19 PM125

126
Sat_AR08_Final_Jul22_TP 2 Col.pmd 7/23/2008, 7:19 PM126
127
Report on the financial statements
We have audited the consolidated financial statements of Satyam
Computer Services Limited and its subsidiaries and joint ventures
(collectively referred to as “the group”), which comprise the
consolidated balance sheets as at March 31, 2008 and 2007,
and the consolidated income statement, consolidated statement
of changes in equity and consolidated cash flow statement for
the years ended March 31, 2008 and 2007, and a summary of
significant accounting policies and other explanatory related
notes.
Management’s responsibility for the financial statements
Management is responsible for the preparation and fair
presentation of these consolidated financial statements in
accordance with International Financial Reporting Standards
(“IFRSs”) issued by the International Accounting Standards
Board (“IASB”). This responsibility includes: designing,
implementing and maintaining internal control relevant to the
preparation and fair presentation of financial statements that
are free from material misstatement, whether due to fraud or
error; selecting and applying appropriate accounting policies;
and making accounting estimates that are reasonable in the
circumstances.
Auditor’s responsibility
Our responsibility is to express an opinion on these consolidated
financial statements based on our audit. We conducted our audit
in accordance with International Standards on Auditing. Those
standards require that we comply with ethical requirements and
plan and perform the audit to obtain reasonable assurance
whether the financial statements are free from material
misstatement.
Independent Auditors’ Report
To the shareholders of Satyam Computer Services Limited
An audit involves performing procedures to obtain audit evidence
about the amounts and disclosures in the financial statements.
The procedures selected depend on the auditor’s judgment,
including the assessment of the risks of material misstatement
of the financial statements, whether due to fraud or error. In
making those risk assessments, the auditor considers internal
control relevant to the entity’s preparation and fair presentation
of the financial statements in order to design audit procedures
that are appropriate in the circumstances, but not for the purpose
of expressing an opinion on the effectiveness of the entity’s
internal control. An audit also includes evaluating the
appropriateness of accounting policies used and the
reasonableness of accounting estimates made by management,
as well as evaluating the overall presentation of the financial
statements.
We believe that the audit evidence we have obtained is sufficient
and appropriate to provide a basis for our audit opinion.
Opinion
In our opinion, the accompanying consolidated financial
statements present fairly, in all material aspects the financial
position of the group as at March 31, 2008 and 2007, and of its
financial performance and its cash flows for the years then
ended in accordance with International Financial Reporting
Standards (IFRSs) issued by the IASB.
Price Waterhouse
Chartered Accountants
Hyderabad, India
April 21, 2008
Sat_AR08_Final_Jul22_TP 2 Col.pmd 7/23/2008, 7:19 PM127
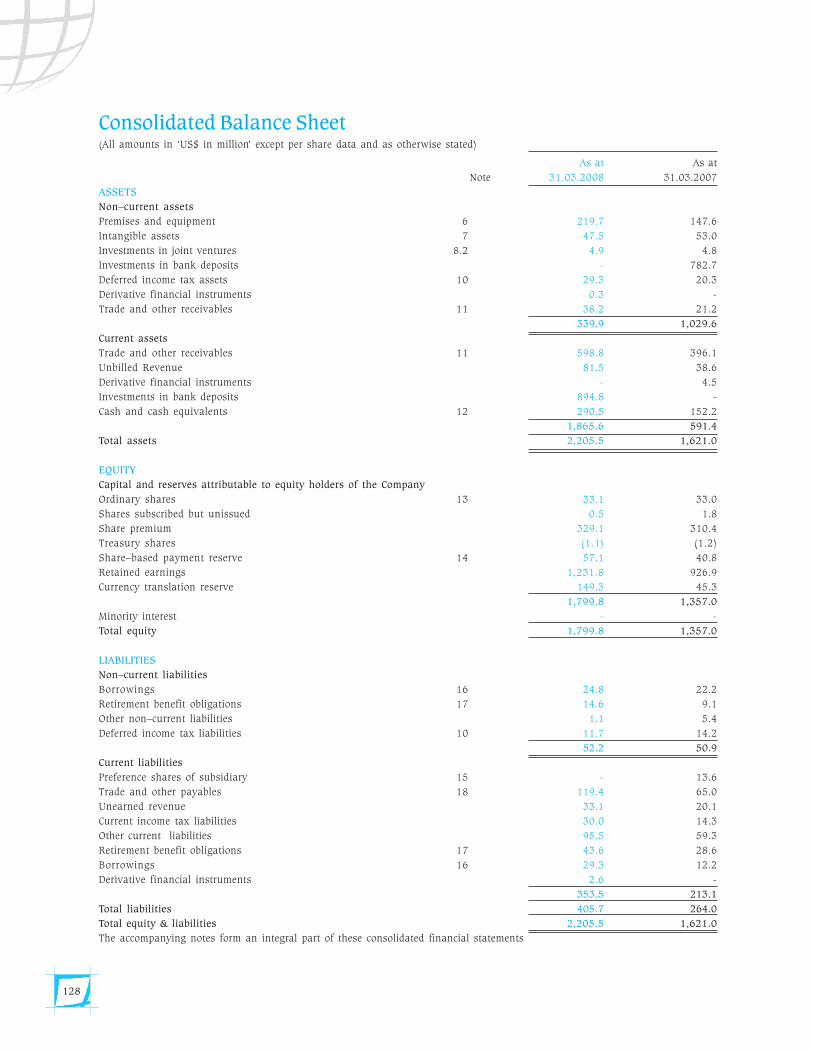
128
Consolidated Balance Sheet(All amounts in ‘US$ in million’ except per share data and as otherwise stated)
As at As at
Note 31.03.2008 31.03.2007
ASSETS
Non–current assets
Premises and equipment 6 219.7 147.6
Intangible assets 7 47.5 53.0
Investments in joint ventures 8.2 4.9 4.8
Investments in bank deposits - 782.7
Deferred income tax assets 10 29.3 20.3
Derivative financial instruments 0.3 -
Trade and other receivables 11 38.2 21.2
339.9 1,029.6
Current assets
Trade and other receivables 11 598.8 396.1
Unbilled Revenue 81.5 38.6
Derivative financial instruments - 4.5
Investments in bank deposits 894.8 -
Cash and cash equivalents 12 290.5 152.2
1,865.6 591.4
Total assets 2,205.5 1,621.0
EQUITY
Capital and reserves attributable to equity holders of the Company
Ordinary shares 13 33.1 33.0
Shares subscribed but unissued 0.5 1.8
Share premium 329.1 310.4
Treasury shares (1.1) (1.2)
Share–based payment reserve 14 57.1 40.8
Retained earnings 1,231.8 926.9
Currency translation reserve 149.3 45.3
1,799.8 1,357.0
Minority interest - -
Total equity 1,799.8 1,357.0
LIABILITIES
Non–current liabilities
Borrowings 16 24.8 22.2
Retirement benefit obligations 17 14.6 9.1
Other non–current liabilities 1.1 5.4
Deferred income tax liabilities 10 11.7 14.2
52.2 50.9
Current liabilities
Preference shares of subsidiary 15 - 13.6
Trade and other payables 18 119.4 65.0
Unearned revenue 33.1 20.1
Current income tax liabilities 30.0 14.3
Other current liabilities 95.5 59.3
Retirement benefit obligations 17 43.6 28.6
Borrowings 16 29.3 12.2
Derivative financial instruments 2.6 -
353.5 213.1
Total liabilities 405.7 264.0
Total equity & liabilities 2,205.5 1,621.0
The accompanying notes form an integral part of these consolidated financial statements
Sat_AR08_Final_Jul22_TP 2 Col.pmd 7/23/2008, 7:19 PM128
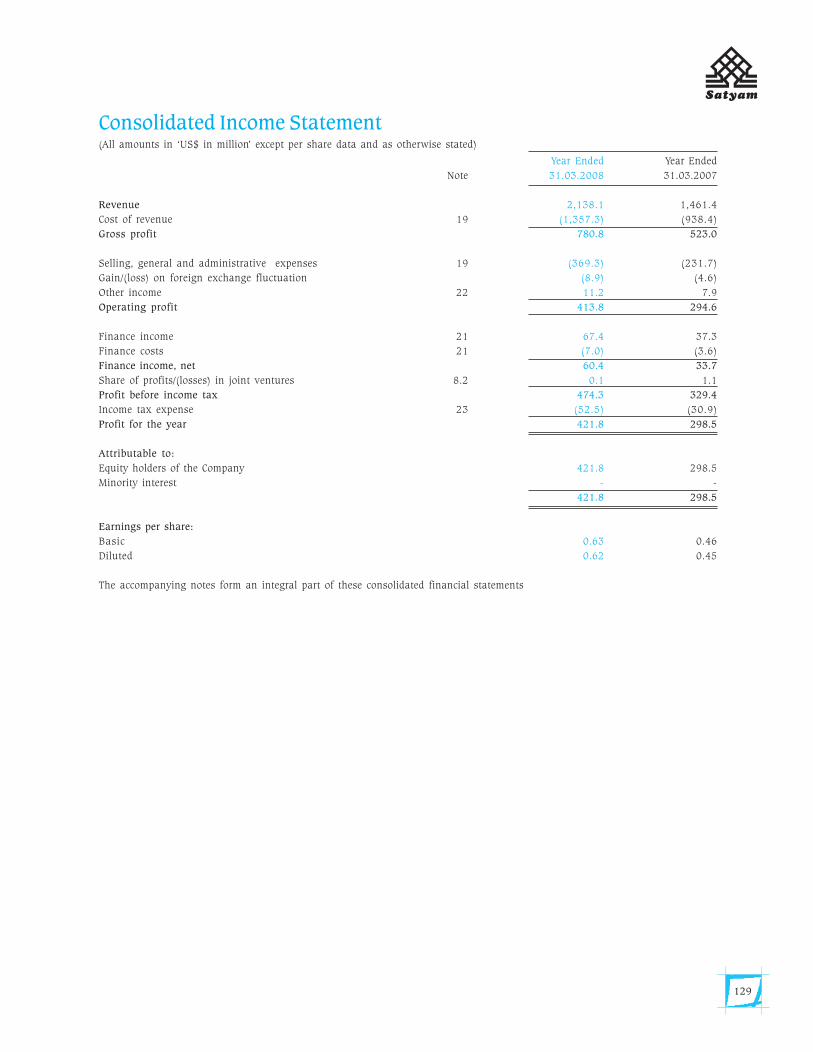
129
Consolidated Income Statement(All amounts in ‘US$ in million’ except per share data and as otherwise stated)
Year Ended Year Ended
Note 31.03.2008 31.03.2007
Revenue 2,138.1 1,461.4
Cost of revenue 19 (1,357.3) (938.4)
Gross profit 780.8 523.0
Selling, general and administrative expenses 19 (369.3) (231.7)
Gain/(loss) on foreign exchange fluctuation (8.9) (4.6)
Other income 22 11.2 7.9
Operating profit 413.8 294.6
Finance income 21 67.4 37.3
Finance costs 21 (7.0) (3.6)
Finance income, net 60.4 33.7
Share of profits/(losses) in joint ventures 8.2 0.1 1.1
Profit before income tax 474.3 329.4
Income tax expense 23 (52.5) (30.9)
Profit for the year 421.8 298.5
Attributable to:
Equity holders of the Company 421.8 298.5
Minority interest - -
421.8 298.5
Earnings per share:
Basic 0.63 0.46
Diluted 0.62 0.45
The accompanying notes form an integral part of these consolidated financial statements
Sat_AR08_Final_Jul22_TP 2 Col.pmd 7/23/2008, 7:19 PM129
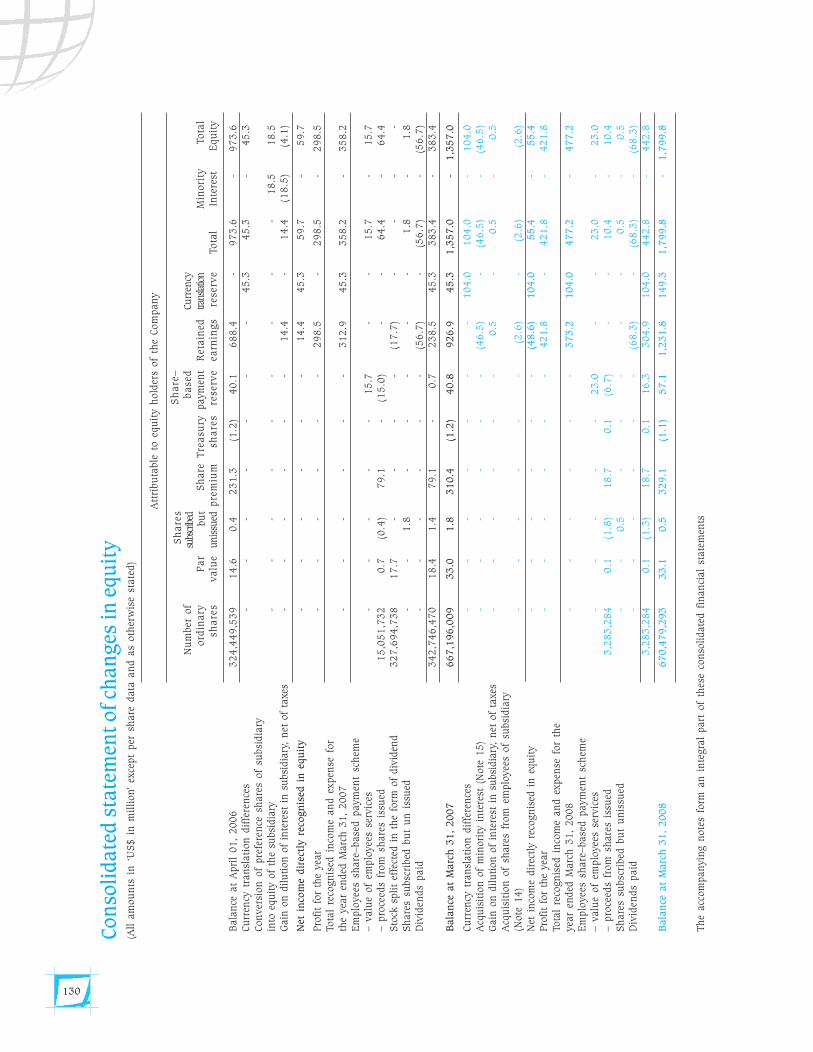
130
Con
soli
date
d s
tate
men
t of ch
an
ges
in
equ
ity
(All
am
ou
nts
in
‘U
S$
in
mil
lion’
exce
pt
per
sh
are
data
an
d a
s oth
erw
ise
state
d)
Bala
nce
at
Apri
l 0
1,
20
06
32
4,4
49
,53
91
4.6
0.4
23
1.3
(1.2
)4
0.1
68
8.4
-9
73
.6-
97
3.6
Cu
rren
cy t
ran
slati
on
dif
fere
nce
s-
--
--
--
45
.34
5.3
-4
5.3
Con
ver
sion
of
pre
fere
nce
sh
are
s of
subsi
dia
ryin
to e
qu
ity
of
the
subsi
dia
ry-
--
--
--
--
18
.51
8.5
Gain
on
dil
uti
on
of
inte
rest
in
su
bsi
dia
ry,
net
of
taxes
--
--
--
14
.4-
14
.4(1
8.5
)(4
.1)
Net
in
com
e dir
ectl
y r
ecogn
ised
in
equ
ity
--
--
--
14
.44
5.3
59
.7-
59
.7
Pro
fit
for
the
year
--
--
--
29
8.5
-2
98
.5-
29
8.5
Tota
l re
cogn
ised
in
com
e an
d e
xpen
se f
or
the
year
ended
Marc
h 3
1,
2007
--
--
--
31
2.9
45
.33
58
.2-
35
8.2
Em
plo
yee
s sh
are
–base
d p
aym
ent
sch
eme
– v
alu
e of
emplo
yees
ser
vic
es-
--
--
15
.7-
-1
5.7
-1
5.7
– p
roce
eds
from
sh
are
s is
sued
15
,05
1,7
32
0.7
(0.4
)7
9.1
-(1
5.0
)-
-6
4.4
-6
4.4
Sto
ck s
pli
t ef
fect
ed i
n t
he
form
of
div
iden
d3
27
,69
4,7
38
17
.7-
--
-(1
7.7
)-
--
-S
hare
s su
bsc
ribed
bu
t u
n i
ssu
ed-
-1
.8-
--
--
1.8
-1
.8D
ivid
end
s p
aid
--
--
--
(56
.7)
-(5
6.7
)-
(56
.7)
34
2,7
46
,47
01
8.4
1.4
79
.1-
0.7
23
8.5
45
.33
83
.4-
38
3.4
Bala
nce
at
Marc
h 3
1,
20
07
66
7,1
96
,00
93
3.0
1.8
31
0.4
(1.2
)4
0.8
92
6.9
45
.31
,35
7.0
-1
,35
7.0
Cu
rren
cy t
ran
slati
on
dif
fere
nce
s-
--
--
--
10
4.0
10
4.0
-1
04
.0A
cqu
isit
ion
of
min
ori
ty i
nte
rest
(N
ote
15
)-
--
--
-(4
6.5
)-
(46
.5)
-(4
6.5
)G
ain
on
dil
uti
on
of
inte
rest
in
su
bsi
dia
ry,
net
of
taxes
--
--
--
0.5
-0
.5-
0.5
Acq
uis
itio
n o
f sh
are
s fr
om
em
plo
yees
of
subsi
dia
ry(N
ote
14
)-
--
--
-(2
.6)
-(2
.6)
(2.6
)N
et i
nco
me
dir
ectl
y re
cogn
ised
in
equ
ity
--
--
--
(48
.6)
10
4.0
55
.4-
55
.4Pro
fit
for
the
year
--
--
--
42
1.8
-4
21
.8-
42
1.8
Tota
l re
cogn
ised
in
com
e an
d e
xpen
se f
or
the
year
ended
Marc
h 3
1,
2008
--
--
--
37
3.2
10
4.0
47
7.2
-4
77
.2E
mplo
yee
s sh
are
–base
d p
aym
ent
sch
eme
– v
alu
e of
emplo
yees
ser
vic
es-
--
--
23
.0-
-2
3.0
-2
3.0
– p
roce
eds
from
sh
are
s is
sued
3,2
83
,28
40
.1(1
.8)
18
.70
.1(6
.7)
--
10
.4-
10
.4S
hare
s su
bsc
ribed
bu
t u
nis
sued
--
0.5
--
--
-0
.5-
0.5
Div
iden
ds
paid
--
--
--
(68
.3)
-(6
8.3
)-
(68
.3)
3,2
83
,28
40
.1(1
.3)
18
.70
.11
6.3
30
4.9
10
4.0
44
2.8
-4
42
.8
Bala
nce
at
Marc
h 3
1,
20
08
67
0,4
79
,29
33
3.1
0.5
32
9.1
(1.1
)5
7.1
1,2
31
.81
49
.31
,79
9.8
-1
,79
9.8
Th
e acc
om
pan
yin
g n
ote
s fo
rm a
n i
nte
gra
l part
of
thes
e co
nso
lidate
d f
inan
cial
state
men
ts
Nu
mber
of
ord
ina
rysh
are
sP
ar
va
lue
Sh
are
ssu
bscr
ibed
bu
tunis
sued
Sh
are
pre
miu
mT
rea
sury
sha
res
Sh
are
–b
ase
dpaym
ent
rese
rve
Ret
ain
edea
rnin
gs
Curr
ency
trans
latio
nre
serv
eTo
tal
Min
ori
tyIn
tere
stTo
tal
Equ
ity
Att
ribu
table
to e
qu
ity h
old
ers
of
the
Com
pan
y
Sat_AR08_Final_Jul22_TP 2 Col.pmd 7/23/2008, 7:19 PM130
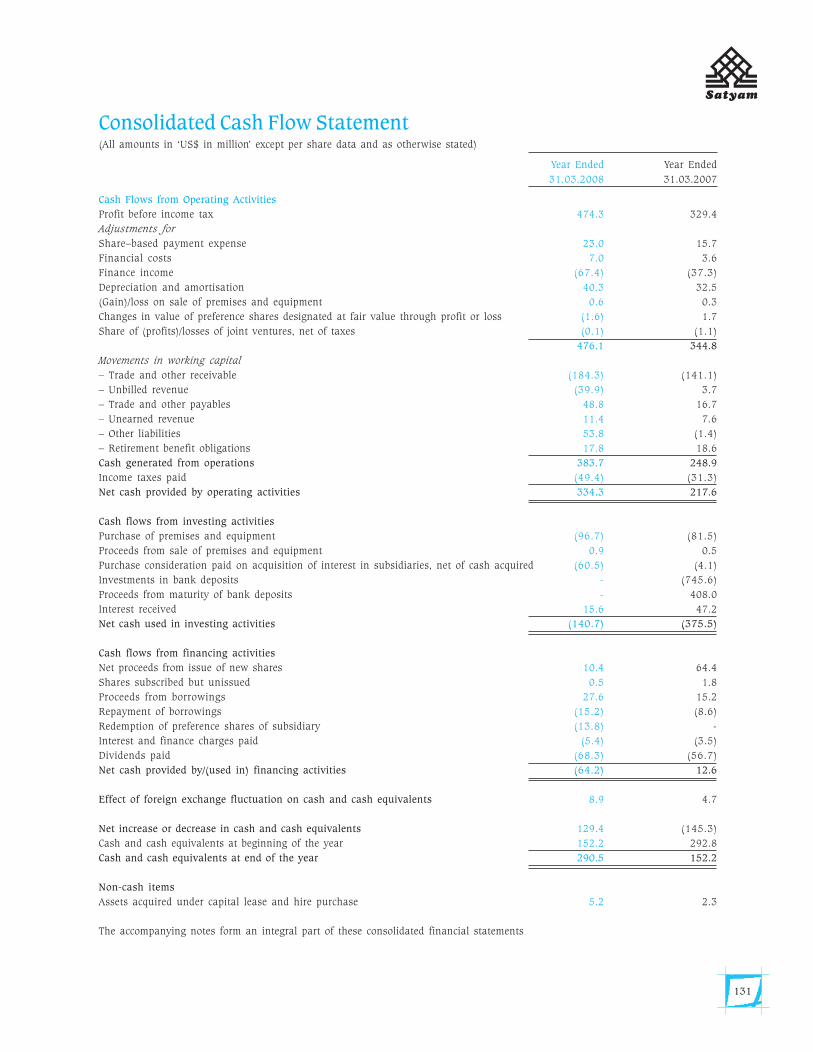
131
Consolidated Cash Flow Statement(All amounts in ‘US$ in million’ except per share data and as otherwise stated)
Year Ended Year Ended
31.03.2008 31.03.2007
Cash Flows from Operating Activities
Profit before income tax 474.3 329.4
Adjustments for
Share–based payment expense 23.0 15.7
Financial costs 7.0 3.6
Finance income (67.4) (37.3)
Depreciation and amortisation 40.3 32.5
(Gain)/loss on sale of premises and equipment 0.6 0.3
Changes in value of preference shares designated at fair value through profit or loss (1.6) 1.7
Share of (profits)/losses of joint ventures, net of taxes (0.1) (1.1)
476.1 344.8
Movements in working capital
– Trade and other receivable (184.3) (141.1)
– Unbilled revenue (39.9) 3.7
– Trade and other payables 48.8 16.7
– Unearned revenue 11.4 7.6
– Other liabilities 53.8 (1.4)
– Retirement benefit obligations 17.8 18.6
Cash generated from operations 383.7 248.9
Income taxes paid (49.4) (31.3)
Net cash provided by operating activities 334.3 217.6
Cash flows from investing activities
Purchase of premises and equipment (96.7) (81.5)
Proceeds from sale of premises and equipment 0.9 0.5
Purchase consideration paid on acquisition of interest in subsidiaries, net of cash acquired (60.5) (4.1)
Investments in bank deposits - (745.6)
Proceeds from maturity of bank deposits - 408.0
Interest received 15.6 47.2
Net cash used in investing activities (140.7) (375.5)
Cash flows from financing activities
Net proceeds from issue of new shares 10.4 64.4
Shares subscribed but unissued 0.5 1.8
Proceeds from borrowings 27.6 15.2
Repayment of borrowings (15.2) (8.6)
Redemption of preference shares of subsidiary (13.8) -
Interest and finance charges paid (5.4) (3.5)
Dividends paid (68.3) (56.7)
Net cash provided by/(used in) financing activities (64.2) 12.6
Effect of foreign exchange fluctuation on cash and cash equivalents 8.9 4.7
Net increase or decrease in cash and cash equivalents 129.4 (145.3)
Cash and cash equivalents at beginning of the year 152.2 292.8
Cash and cash equivalents at end of the year 290.5 152.2
Non-cash items
Assets acquired under capital lease and hire purchase 5.2 2.3
The accompanying notes form an integral part of these consolidated financial statements
Sat_AR08_Final_Jul22_TP 2 Col.pmd 7/23/2008, 7:19 PM131
132
Notes to the consolidated financial statements1. General information
Satyam Computer Services Limited and its consolidated subsidiaries and joint ventures (hereinafter referred to as “Satyam” or
“the group”) are engaged in providing Information Technology (“IT”) services and Business Process Outsourcing (“BPO”)
services. Satyam Computer Services Limited (hereinafter referred to as “Satyam Computer Services” or “the Company”) is an IT
services provider that uses a global infrastructure to deliver value–added services to its customers, to address IT needs in specific
industries and to facilitate electronic business or eBusiness initiatives. Satyam Computer Services was incorporated on June 24,
1987 in Hyderabad, Andhra Pradesh, India. The range of services offered by Satyam Computer Services includes consulting,
systems design, software development, systems integration and application maintenance. Satyam Computer Services offers a
comprehensive range of IT services, including application development and maintenance, consulting and enterprise business
solutions, extended engineering solutions and infrastructure management services. Satyam provides its customers the ability to
meet all of their information technology needs from one service provider. Satyam’s eBusiness services include designing,
developing integrating and maintaining internet–based applications, such as eCommerce websites, and implementing packaged
software applications, such as customer or supply chain management software applications. Satyam also assists its customers
in making their existing computing systems accessible over the internet. Satyam has established a diversified base of corporate
customers in a wide range of industries including insurance, banking and financial services, manufacturing, telecommunications,
transportation and engineering services.
Satyam BPO Limited (“Satyam BPO”), erstwhile Nipuna Services Limited (“Nipuna”) a wholly owned subsidiary of Satyam
Computer Services is engaged in providing BPO services covering HR, finance and accounting, customer care (voice, mail and
chat) and transaction processing (industry–specific offerings).
Satyam Computer Services is listed on the Bombay Stock Exchange (“BSE”) and the National Stock Exchange (“NSE”) in India,
New York Stock Exchange (“NYSE”) in the US and the NYSE Euronext in the Netherlands.
These consolidated financial statements have been approved for issue by the Board of Directors on April 21, 2008.
2. Summary of significant accounting policies
2.1. Basis of preparation
These consolidated financial statements have been prepared in accordance with the International Financial Reporting Standards
(“IFRS”), as issued by the International Accounting Standards Board.
These consolidated financial statements being the first IFRS financial statements, are covered by IFRS 1, First–time Adoption of
International Financial Reporting Standards. These consolidated financial statements have been prepared in accordance with
those IFRS standards and IFRIC interpretations issued and effective or issued and early adopted as at March 31, 2008. The
policies set out below have been consistently applied to all the years presented.
Satyam continues to prepare its consolidated financial statements under generally accepted accounting principles in India
(“Indian GAAP”) for its local statutory reporting purposes. Indian GAAP differs in some areas from IFRS. In preparing Satyam’s
consolidated financial statements for the years ended March 31, 2007 and 2008, certain accounting, valuation and consolidation
methods applied in the Indian GAAP financial statements have been amended to comply with IFRS.
Reconciliations and descriptions of the effect of the transition from Indian GAAP to IFRS on Satyam’s equity, its net income and
cash flows are provided in Note 28.
These consolidated financial statements have been prepared under the historical cost convention, as modified by the revaluation
of available-for-sale financial assets and financial assets /financial liabilities (including derivative instruments) at fair value
through profit or loss.
The preparation of financial statements in accordance with IFRS requires the use of certain critical accounting estimates. It also
requires management to exercise judgement in the process of applying the group’s accounting policies. The areas involving a
higher degree of judgement or complexity, or areas where assumptions and estimates are significant to the consolidated financial
statements are disclosed in Note 4.
2.1.1.Basis of transition to IFRS
Satyam’s financial statements for the year ended March 31, 2008 are its first annual financial statements that comply with IFRS.
Satyam has applied IFRS 1 in preparing these consolidated financial statements.
Satyam’s transition date is April 01, 2006. Satyam prepared its opening IFRS balance sheet at that date. The reporting date of
these consolidated financial statements is March 31, 2008.
In preparing these consolidated financial statements in accordance with IFRS 1 Satyam has applied the mandatory exceptions
and certain of the optional exemptions from full retrospective application of IFRS.
(All amounts in ‘US$ in million’ except per share data and as otherwise stated)
Sat_AR08_Final_Jul22_TP 2 Col.pmd 7/23/2008, 7:19 PM132
133
Exemptions from retrospective application
Satyam has elected to apply / not to apply the following optional exemptions from full retrospective application.
a) Business combinations exemption – business combinations that took place prior to the April 01, 2006 (transition date) have
not been restated. The application of this exemption is detailed in Note 8.1.
b) Fair value as deemed cost exemption – Satyam has not elected to measure any item of premises and equipment at its fair
value at the date of transition; premises and equipment have been measured at cost in accordance with IFRS.
c) Employee benefits exemption – all actuarial gains/losses are recognised in the income statement. At the date of transition,
full net benefit obligation has been accounted on the balance sheet.
d) Cumulative translation differences exemption – cumulative translation reserve has been set to zero as at April 01, 2006.
This exemption has been applied to all subsidiaries in accordance with IFRS 1.
e) Compound financial instruments exemption – Satyam has not issued any compound financial instruments
f) Assets and liabilities of subsidiaries, associates and joint ventures exemption – all the entities in the group are transitioning
to IFRS on the same date; this exemption is not applicable.
g ) Designation of financial assets and financial liabilities exemption – Satyam has designated convertible redeemable preference
share issued by Satyam BPO as a financial liability ‘at fair value through profit or loss’ (“FVTPL”). The convertible
redeemable preference shares are hybrid instruments that contain embedded derivatives which qualify for separation.
h) Share–based payment transaction exemption – Satyam has elected to apply the share–based payment exemption. It applied
IFRS 2, Share–based payment, from April 01, 2006 to those options that were issued after November 07, 2002 but that have
not vested by April 01, 2006. The application of this exemption is detailed in Note 14.
i) Insurance contracts exemption – Satyam does not issue insurance contracts; this exemption is not applicable.
j) Decommissioning liabilities included in the cost of property, plant and equipment exemption – Satyam does not have any
decommissioning liabilities included in the cost of premises and equipment; this exemption is not applicable.
k) Leases exemption – there are no arrangements covered under IFRIC Interpretation 4, Determining whether an arrangement
contains a lease as at the date of transition; this exemption is not applicable.
l) Fair value measurement of financial assets or liabilities at initial recognition – Satyam has not applied the exemption
offered by the revision of IAS 39, Financial Instruments: Recognition and Measurement, on the initial recognition of the
financial instruments measured at fair value through profit and loss where there is no active market.
m) IFRIC interpretation 12, Service concession arrangements exemption – IFRIC 12 is not yet effective as at March 31, 2008 and
Satyam has not early adopted the interpretation; this exemption is not applicable.
n) Borrowing cost exemption –This exemption is not yet effective as at March 31, 2008 and Satyam has not early adopted the
interpretation; this exemption is not applicable.
Exceptions from full retrospective application followed by Satyam
Satyam has applied the following mandatory exceptions from retrospective application.
a) Derecognition of financial assets and liabilities exception – Financial assets and liabilities derecognized before January 01,
2004 are not re–recognised under IFRS. Satyam has not chosen to apply the IAS 39 derecognition criteria to an earlier date.
No significant arrangements were identified that had to be assessed under this exception.
b) Hedge accounting exception – Satyam has not identified any hedging relationships. Hence, this exception is not applicable.
c) Estimates exception – On an assessment of the estimates made under Indian GAAP, Satyam has concluded that there was
no necessity to revise the estimates under IFRS except where estimates were required by IFRS and not required by Indian
GAAP. The application of this exception is detailed in Note 8.1.1.
d) Assets held for sale and discontinued operations exception – This exception requires a company with a date of adoption
after December 31, 2005 to restate its comparatives for IFRS 5, Non–current Assets Held for Sale and Discontinued
Operations. However, Satyam did not have any assets that met the held–for–sale criteria during the years presented and
hence no adjustment is required.
2.1.2.Standards, amendments and interpretations effective as at March 31, 2008
IFRS 7, Financial instruments: Disclosures, and the complementary amendment to IAS 1, Presentation of financial statements –
Capital disclosures, introduces new disclosures relating to financial instruments and does not have any impact on the classification
and valuation of the group’s financial instruments, or the disclosures relating to taxation and trade and other payables.
(All amounts in ‘US$ in million’ except per share data and as otherwise stated)
Sat_AR08_Final_Jul22_TP 2 Col.pmd 7/23/2008, 7:19 PM133
134
IFRIC 8, Scope of IFRS 2, requires consideration of transactions involving the issuance of equity instruments, where the identifiable
consideration received is less than the fair value of the equity instruments issued in order to establish whether or not they fall
within the scope of IFRS 2. This standard does not have any impact on the group’s financial statements.
IFRIC 9, Re–assessment of embedded derivatives, requires subsequent reassessment of embedded derivatives if there is a change
in the terms of the host contract that significantly modifies the cash flows that otherwise would be required under the host contract.
This interpretation does not have any impact on the group’s financial statements.
IFRIC 10, Interim financial reporting and impairment, prohibits the impairment losses recognized in an interim period on
goodwill and investments in equity instruments and in financial assets carried at cost to be reversed at a subsequent balance
sheet date. This interpretation does not have any impact on the group’s financial statements.
IFRIC 11, IFRS 2 – Group and treasury share transactions, provides guidance on whether share–based transactions involving
treasury shares or involving group entities (for example, options over a parent’s shares) should be accounted for as equity–
settled or cash–settled share–based payment transactions in the stand–alone accounts of the parent and group companies. This
interpretation does not have an impact on the group’s financial statements.
2.1.3.Standards, amendments and interpretations effective as at March 31, 2008 but not relevant
The following standards, amendments and interpretations to published standards are mandatory from the financial year beginning
on April 01, 2007 but are not relevant to Satyam’s operations:
• IFRS 4, Insurance contracts; and
• IFRIC 7, Applying the restatement approach under IAS 29, Financial reporting in hyper–inflationary economies.
2.1.4.Standards, amendments and interpretations to existing standards that are not yet effective and have been early adopted by
the group
The following standards, amendments and interpretations to existing standards have been published and are mandatory for the
group’s financial year beginning on April 01, 2009 or later periods, but Satyam has early adopted them:
• IFRS 8, Operating segments was early adopted by Satyam as at March 31, 2008. IFRS 8 replaces IAS 14 and aligns segment
reporting with the requirements of the US standard SFAS 131, ‘Disclosures about segments of an enterprise and related
information’. The new standard requires a ‘management approach’, under which segment information is presented on the
same basis as that used for internal reporting provided to the chief operating decision-maker. The application of this
standard did not result in any change in the number of reportable segments. Reallocation of goodwill was not required and
there has been no further impact on the measurement of Satyam’s assets and liabilities.
2.1.5.Standards, amendments and interpretations to existing standards that are not yet effective and have not been early adopted
by the group
The following standards, amendments and interpretations to existing standards have been published and are mandatory for the
group’s financial year beginning on April 01, 2008 or later periods, but Satyam has not early adopted them:
• IAS 23 (Revised), Borrowing costs. It requires an entity to capitalise borrowing costs directly attributable to the acquisition,
construction or production of a qualifying asset (one that takes a substantial period of time to get ready for use or sale) as
part of the cost of that asset. The option of immediately expensing those borrowing costs will be removed. The group will
apply IAS 23 (revised) from April 01, 2009 but is currently not applicable to the group as there are no qualifying assets.
• IAS 27 (Revised), Consolidated and Separate Financial Statements. It requires a mandatory adoption of economic entity
model which treats all providers of equity capital as shareholders of the entity. Consequently, a partial disposal of interest
in a subsidiary in which the parent company retains control does not result in a gain or loss but in an increase or decrease
in equity. Purchase of some or all of the non-controlling interests (also known as minority interests) (“NCI”) is treated as
treasury transaction and accounted for in equity. A partial disposal of interest in a subsidiary in which the parent company
loses control triggers recognition of gain or loss on the entire interest. A gain or loss is recognised on the portion that has
been disposed of; a further holding gain is recognised on the interest retained, being the difference between the fair value of
the interest and book value of the interest.
The revised standard requires an entity to attribute their share of net income and reserves to the NCI even if this results in
the NCI having a deficit balance.
The group will apply IAS 27 (Revised) from April 01, 2010. Satyam does not expect the adoption of this standard to have
a material effect on the consolidated financials statements.
• IFRS 3 (Revised), Business Combinations. It has expanded the scope to include combinations by contract alone and
combination of mutual entities and slightly amended the definition of business as ‘capable of being conducted’ rather than
‘are conducted and managed’. All the acquisition-related costs are to be recognised as period expenses in accordance with
the appropriate IFRS. Costs incurred to issue debt or equity securities will be recognised in accordance with IAS 39.
(All amounts in ‘US$ in million’ except per share data and as otherwise stated)
Sat_AR08_Final_Jul22_TP 2 Col.pmd 7/23/2008, 7:19 PM134
135
Consideration would include fair value of all interests previously held by the acquirer. Remeasurement of such interests to
fair value would be through income statement. Contingent consideration is required to be recognised at fair value even if not
deemed probable of payment at the date of acquisition. All subsequent changes in debt contingent consideration are
recognised in income statement and not in goodwill as required in the existing standard.
IFRS 3 (Revised) provides an explicit option, available on a transaction-by-transaction basis, to measure any NCI in the
entity acquired at fair value of their proportion of identifiable assets and liabilities or full fair value. The first will result in
measurement of goodwill little different from existing IFRS 3; the second approach will record goodwill on the NCI as well
as on the acquired controlling interest.
The standard further provides additional guidance on share-based payment grants that form part of the business combination
and on assessment for classification of certain contracts and arrangements of the acquired business at the date of the
acquisition. Current guidance requires deferred tax assets of the acquired business that are not recognised at the date of the
combination but subsequently meet the recognition criteria to be adjusted against goodwill. The revised standard will only
allow adjustments against goodwill within the one-year window for finalisation of the purchase accounting.
The group will apply IFRS 3 (Revised) from April 01, 2010. The effect of the standard on future periods will depend on the
nature and significance of any acquisitions that are subject to this standard.
• IFRIC 13, Customer loyalty programmes (effective from April 01, 2008). IFRIC 13 clarifies that where goods or services
are sold together with a customer loyalty incentive (for example, loyalty points or free products), the arrangement is
a multiple–element arrangement and the consideration receivable from the customer is allocated between the components
of the arrangement using fair values. Satyam is in the process of analysing the impact of this interpretation on the
accounts.
• IFRIC 14, IAS 19 – The limit on a defined benefit asset, minimum funding requirements and their interaction. IFRIC 14
provides guidance on assessing the limit in IAS 19 on the amount of the surplus that can be recognized as an asset.
It also explains how the pension asset or liability may be affected by a statutory or contractual minimum funding
requirement. The group will apply IFRIC 14 from April 01, 2008, but it is not expected to have any impact on the
group’s accounts.
2.1.6.Interpretations to existing standards that is not yet effective and not relevant for the group’s operations
The following interpretations to existing standards have been published and are mandatory for financial year beginning on April
01, 2008 or later periods but are not relevant for Satyam’s operations:
• IFRIC 12, Service concession arrangements (effective from April 01, 2008). IFRIC 12 applies to contractual arrangements
whereby a private sector operator participates in the development, financing, operation and maintenance of infrastructure
for public sector services. IFRIC 12 is not relevant to the group’s operations as none of the group’s companies provide for
public sector services.
2.2. Consolidation
Domestic and foreign subsidiaries, joint ventures and special purpose entities considered for consolidation are as follows:
Direct subsidiaries Country of Percentage of holdingas
incorporation at March 31, 2008
1) Satyam BPO Limited India 100.00%
2) Satyam Computer Services (Shanghai) Co. Limited China 100.00%
3) Satyam Computer Services (Nanjing) Co. Limited China 100.00%
4) Satyam Computer Services (Egypt) S. A. E. Egypt 100.00%
5) Satyam Technologies, Inc. USA 100.00%
6) Knowledge Dynamics Pte Limited Singapore 100.00%
7) Citisoft Plc UK 100.00%
8) Nitor Global Solutions Limited UK 100.00%
Indirect subsidiaries
9) Subsidiaries of Knowledge Dynamics Pte Limited
– Knowledge Dynamics Private Limited India 99.99%
– Knowledge Dynamics USA, Inc. USA 98.00%
– Info on Demand SDN BHD (ceased to exist from October 1, 2007) Malaysia -
(All amounts in ‘US$ in million’ except per share data and as otherwise stated)
Sat_AR08_Final_Jul22_TP 2 Col.pmd 7/23/2008, 7:19 PM135
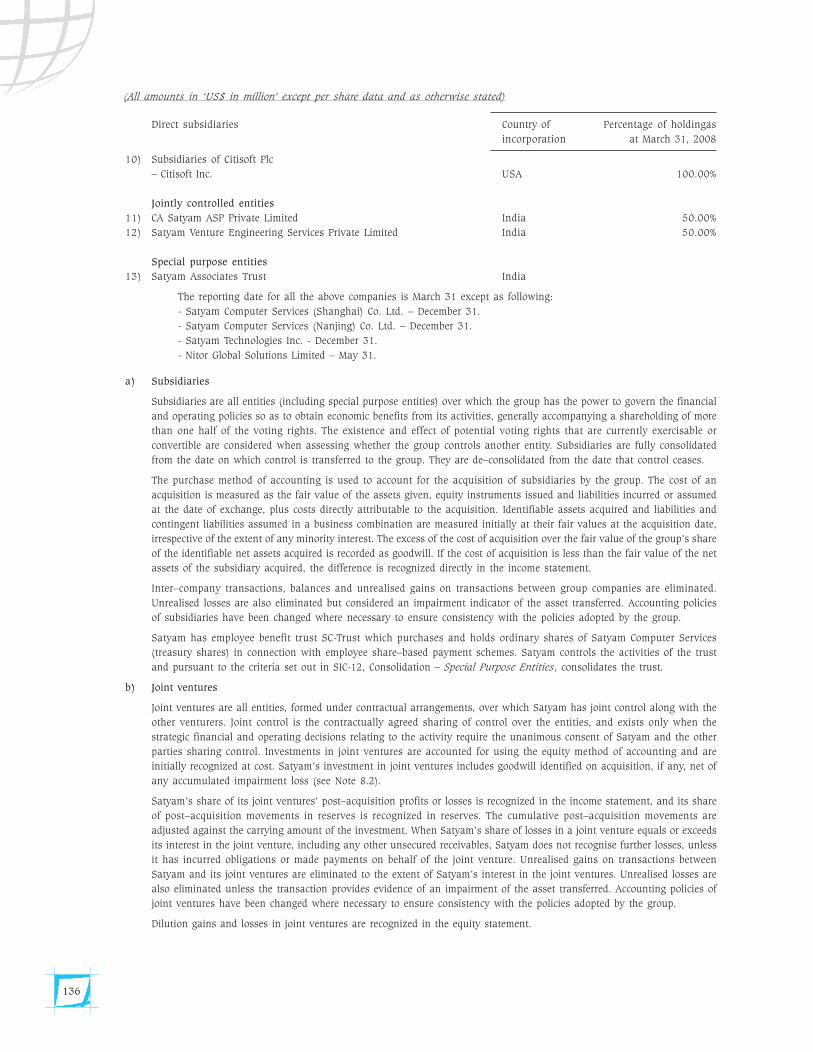
136
Direct subsidiaries Country of Percentage of holdingas
incorporation at March 31, 2008
10) Subsidiaries of Citisoft Plc
– Citisoft Inc. USA 100.00%
Jointly controlled entities
11) CA Satyam ASP Private Limited India 50.00%
12) Satyam Venture Engineering Services Private Limited India 50.00%
Special purpose entities
13) Satyam Associates Trust India
The reporting date for all the above companies is March 31 except as following:
- Satyam Computer Services (Shanghai) Co. Ltd. – December 31.
- Satyam Computer Services (Nanjing) Co. Ltd. – December 31.
- Satyam Technologies Inc. - December 31.
- Nitor Global Solutions Limited – May 31.
a) Subsidiaries
Subsidiaries are all entities (including special purpose entities) over which the group has the power to govern the financial
and operating policies so as to obtain economic benefits from its activities, generally accompanying a shareholding of more
than one half of the voting rights. The existence and effect of potential voting rights that are currently exercisable or
convertible are considered when assessing whether the group controls another entity. Subsidiaries are fully consolidated
from the date on which control is transferred to the group. They are de–consolidated from the date that control ceases.
The purchase method of accounting is used to account for the acquisition of subsidiaries by the group. The cost of an
acquisition is measured as the fair value of the assets given, equity instruments issued and liabilities incurred or assumed
at the date of exchange, plus costs directly attributable to the acquisition. Identifiable assets acquired and liabilities and
contingent liabilities assumed in a business combination are measured initially at their fair values at the acquisition date,
irrespective of the extent of any minority interest. The excess of the cost of acquisition over the fair value of the group’s share
of the identifiable net assets acquired is recorded as goodwill. If the cost of acquisition is less than the fair value of the net
assets of the subsidiary acquired, the difference is recognized directly in the income statement.
Inter–company transactions, balances and unrealised gains on transactions between group companies are eliminated.
Unrealised losses are also eliminated but considered an impairment indicator of the asset transferred. Accounting policies
of subsidiaries have been changed where necessary to ensure consistency with the policies adopted by the group.
Satyam has employee benefit trust SC-Trust which purchases and holds ordinary shares of Satyam Computer Services
(treasury shares) in connection with employee share–based payment schemes. Satyam controls the activities of the trust
and pursuant to the criteria set out in SIC-12, Consolidation – Special Purpose Entities, consolidates the trust.
b) Joint ventures
Joint ventures are all entities, formed under contractual arrangements, over which Satyam has joint control along with the
other venturers. Joint control is the contractually agreed sharing of control over the entities, and exists only when the
strategic financial and operating decisions relating to the activity require the unanimous consent of Satyam and the other
parties sharing control. Investments in joint ventures are accounted for using the equity method of accounting and are
initially recognized at cost. Satyam’s investment in joint ventures includes goodwill identified on acquisition, if any, net of
any accumulated impairment loss (see Note 8.2).
Satyam’s share of its joint ventures’ post–acquisition profits or losses is recognized in the income statement, and its share
of post–acquisition movements in reserves is recognized in reserves. The cumulative post–acquisition movements are
adjusted against the carrying amount of the investment. When Satyam’s share of losses in a joint venture equals or exceeds
its interest in the joint venture, including any other unsecured receivables, Satyam does not recognise further losses, unless
it has incurred obligations or made payments on behalf of the joint venture. Unrealised gains on transactions between
Satyam and its joint ventures are eliminated to the extent of Satyam’s interest in the joint ventures. Unrealised losses are
also eliminated unless the transaction provides evidence of an impairment of the asset transferred. Accounting policies of
joint ventures have been changed where necessary to ensure consistency with the policies adopted by the group.
Dilution gains and losses in joint ventures are recognized in the equity statement.
(All amounts in ‘US$ in million’ except per share data and as otherwise stated)
Sat_AR08_Final_Jul22_TP 2 Col.pmd 7/23/2008, 7:19 PM136
137
c) Transactions with minority interests
The group applies a policy of treating transactions with minority interests as transactions with shareholders of the group.
On disposal to minority interest, the difference between the proceeds and the share disposed off is accounted for in reserves.
Similarly, on purchase of minority interests, the difference between any consideration paid and the relevant share acquired
of the carrying value of net assets of the subsidiary is recorded in equity.
2.3. Segment reporting
Operating segments are reported in a manner consistent with the internal reporting provided to the chief operating decision-
maker. The Managing Director of Satyam Computer Services has been identified as the chief operating decision-maker that makes
strategic decisions, allocates resources to and assesses the performance of the operating segments.
2.4. Foreign currency translation
a) Functional and presentation currency
Items included in the financial statements in each of the group’s entities are measured using the currency of the primary
economic environment in which the entity operates (“the functional currency”). Indian rupee is the functional currency of
Satyam Computer Services, its domestic subsidiaries and joint ventures. US dollar, Pound sterling, Singapore dollar and
Renminbi are the functional currencies of Satyam’s foreign subsidiaries located in the US, the UK, Singapore and China
respectively. These consolidated financial statements are presented in US Dollars (“US$”), which is the group’s presentation
currency. The results and financial position of the group are translated into presentation currency as follows:
• assets and liabilities for each balance sheet presented are translated at the closing rate at the date of that balance
sheet;
• income and expenses for each income statement are translated at average exchange rates; and
• all resulting exchange differences are recognised as a separate component of equity.
b) Transactions and balances
Foreign currency transactions are translated into the functional currency using the exchange rates prevailing at the dates of
the transactions. Foreign exchange gains and losses resulting from the settlement of such transactions and from the
translation at year–end exchange rates of monetary assets and liabilities denominated in foreign currencies are recognized
in the income statement.
c) Group companies
On consolidation, exchange differences arising from the translation of the net investment in foreign operations are taken to
shareholders’ equity. When a foreign operation is partially disposed off or sold, exchange differences that were recorded in
equity are recognized in the income statement as part of the gain or loss on sale. Goodwill and fair value adjustments
arising on the acquisition of a foreign entity are treated as assets and liabilities of the foreign entity and translated at the
closing rate.
2.5. Premises and equipment
Premises and equipment are stated at actual cost less accumulated depreciation and any accumulated impairment losses. The
cost of an item of premises and equipment comprises its purchase price and any costs directly attributable to bringing the asset
into use.
Depreciation on premises and equipment is recognized on the straight line basis over their estimated useful lives. The cost of and
the accumulated depreciation for premises and equipment sold, retired or otherwise disposed off are removed from the stated
values and the resulting gains and losses are included in the income statement.
The estimated useful lives are as follows:
Buildings 28 years
Computers and servers 2-5 years
Office equipment 5 years
Furniture, fixtures and interiors 5 years
Vehicles 5 years
The residual values and useful economic lives of premises and equipment are reviewed annually.
Depreciation on leasehold improvements and assets acquired under a finance lease is provided using the straight–line method
over the shorter of the lease term or the useful life of the asset.
Eligible borrowing cost related to the construction of qualifying assets is capitalized
(All amounts in ‘US$ in million’ except per share data and as otherwise stated)
Sat_AR08_Final_Jul22_TP 2 Col.pmd 7/23/2008, 7:19 PM137
138
Assets under construction
Assets under installation or under construction as at the balance sheet date are shown as assets under construction. Advances
paid towards acquisition of assets are also included under assets under construction.
2.6. Intangible assets
All intangible assets, except goodwill, are stated at cost less accumulated amortisation and any accumulated impairment losses.
Goodwill is not amortised and is stated at cost less any accumulated impairment losses.
a) Goodwill
Goodwill represents the excess of the cost of an acquisition over the fair value of Satyam’s share of the net identifiable assets
of the acquired subsidiary or associate at the date of acquisition. Goodwill on acquisitions of subsidiaries is included in
intangible assets. Goodwill on acquisitions of associates is included in investments in associates and is tested for impairment
as part of the overall balance. Separately recognized goodwill is tested annually for impairment and carried at cost less
accumulated impairment losses. Impairment losses on goodwill are not reversed. Gains and losses on the disposal of an
entity include the carrying amount of goodwill relating to the entity sold. Goodwill is allocated to cash–generating units for
the purpose of impairment testing. The allocation is made to those cash–generating units or groups of cash–generating
units that are expected to benefit from the business combination in which the goodwill arose.
b) Software
Expenditure incurred on research is expensed in the income statement as incurred. Cost of acquired software for internal use
is generally charged to the income statement as incurred if the estimated useful lives are relatively short, usually less than
one year and amortised over the estimated useful lives on a straight–line basis if the estimated useful lives are beyond one
year.
c) Other intangible assets
Other intangible assets identified in business combinations, comprising of customer contracts, internally developed technology
and non-compete agreements are amortised over their estimated useful life on a straight-line basis.
2.7. Impairment of non–financial assets
Assets that have an indefinite useful life, for example goodwill, are not subject to amortisation and are tested annually for
impairment. Assets that are subject to amortisation are reviewed for impairment whenever events or changes in circumstances
indicate that the carrying amount may not be recoverable. An impairment loss is recognized for the amount by which the asset’s
carrying amount exceeds its recoverable amount. The recoverable amount is the higher of an asset’s fair value less costs to sell
and value in use. For the purposes of assessing impairment, assets are grouped at the lowest levels for which there are separately
identifiable cash flows (cash–generating units). Non–financial assets other than goodwill that suffered impairment are reviewed
for possible reversal of the impairment at each reporting date.
2.8. Financial assets
The financial assets held by Satyam are primarily loans and receivables. The classification of financial assets depends on the
purpose for which the financial assets were acquired. Management determines the classification of its financial assets at initial
recognition.
Loans and receivables
Loans and receivables are non–derivative financial assets with fixed or determinable payments that are not quoted in an active
market. They are included in current assets, except for maturities greater than 12 months after the balance sheet date. These are
classified as non–current assets. The group’s loans and receivables comprise trade and other receivables, investments in bank
deposits and cash and cash equivalents in the balance sheet (Note 2.10, 2.12 and 2.13).
Satyam assesses at each balance sheet date whether there is objective evidence that a financial asset or a group of financial assets
is impaired. Impairment testing of trade receivables is described in Note 2.10.
2.9. Derivative financial instruments
The group purchases foreign exchange forward contracts and options to mitigate the risk of changes in foreign exchange rates
associated with certain payables, receivables and forecasted transactions denominated in certain foreign currencies. These
derivative contracts do not qualify for hedge accounting under IAS 39, and are initially recognized at fair value on the date the
contract is entered into and subsequently remeasured at their fair value. Gains or losses arising from changes in the fair value of
the derivative contracts are recognized in the income statement.
2.10. Trade and other receivables
Trade receivables are recognized initially at fair value. They are subsequently measured at amortised cost using the effective
interest method, net of provision for impairment, if the effect of discounting is considered material. The carrying amounts, net of
(All amounts in ‘US$ in million’ except per share data and as otherwise stated)
Sat_AR08_Final_Jul22_TP 2 Col.pmd 7/23/2008, 7:19 PM138
139
provision for impairment, reported in the balance sheet approximate the fair value due to their short realisation period. A
provision for impairment of trade receivables is established when there is objective evidence that Satyam will not be able to collect
all amounts due according to the original terms of receivables. The provision is established at amounts considered to be
appropriate, based primarily upon Satyam’s past credit loss experience and an evaluation of potential losses on the receivables.
The amount of the provision is recognized in the income statement.
2.11. Unbilled revenue and unearned revenue
Amounts which relate to recoverable costs and accrued profits not yet billed on contracts are classified in current assets as
“Unbilled revenue on contracts”. Billings on uncompleted contracts in excess of recoverable cost and accrued profit are classified
in current liabilities as “Unearned revenue”.
2.12. Investments in bank deposits
Investments in bank deposits represent term deposits placed with banks earning fixed rate of interest. Investments in bank
deposits with maturities of less than a year are disclosed as current assets and more than one year as non current. At the balance
sheet date, these deposits are measured at amortised cost using effective interest method.
2.13. Cash and cash equivalents
Cash and cash equivalents include cash in hand and at bank, and short–term deposits with an original maturity period of three
months or less. Bank overdrafts that are an integral part of cash management and where there is a legal right of set–off against
positive cash balances are included in cash and cash equivalents. Otherwise bank overdrafts are classified as borrowings.
2.14. Share capital
Ordinary shares are classified as equity. Preference shares are assessed for classification under equity or liability (Note 2.15).
Incremental costs directly attributable to the issue of new shares or options are shown in equity as a deduction, net of tax, from
the proceeds.
Where any group entity purchases the equity share capital of Satyam Computer Services (treasury shares), the consideration paid,
including any directly attributable incremental costs (net of taxes) is deducted from equity attributable to the equity holders of
Satyam Computer Services until the shares are reissued. Where such shares are subsequently reissued, any consideration
received net of any directly attributable incremental transaction costs and the related income tax effects, is included in the equity
attributable to equity holders of Satyam Computer Services.
2.15. Borrowings
Borrowings are recognized initially at fair value, net of transaction costs incurred. Borrowings are subsequently stated at
amortised cost; any difference between the proceeds (net of transaction costs) and the redemption value is recognized in the
income statement over the period of the borrowings using the effective interest method.
Borrowings are classified as current liabilities unless the group has an unconditional right to defer settlement of the liability for
at least 12 months after the balance sheet date. In respect of borrowings with repayment schedule, classification as current and
non–current liabilities is based on the repayment schedule.
Borrowings designated at fair value through profit or loss are initially recognised at fair value. A borrowing is classified in this
category if it contains embedded derivatives, which significantly modify the cash flows that otherwise would be required by the
host instrument. These borrowings are re-measured at each reporting date with the changes in fair value recognised in the income
statement.
2.16. Current and deferred income tax
The current income tax charge is calculated on the basis of the tax laws enacted or substantively enacted at the balance sheet date
in the countries where the group operates and generates taxable income. Management periodically evaluates positions taken in
tax returns with respect to situations in which applicable tax regulations are subject to interpretation and establishes provisions,
where appropriate, on the basis of amounts expected to be paid to the tax authorities.
Deferred income tax is provided in full, using the liability method, on temporary differences arising between the tax bases of assets
and liabilities and their carrying amounts in the consolidated financial statements. However, the deferred income tax is not
accounted for if it arises from initial recognition of an asset or liability in a transaction other than a business combination that at
the time of the transaction affects neither accounting nor taxable profit or loss. Deferred income tax is determined using tax rates
and laws that have been enacted or substantially enacted by the balance sheet date and are expected to apply when the related
deferred income tax asset is realised or the deferred income tax liability is settled.
Deferred income tax assets are recognised to the extent that it is probable that future taxable profit will be available against which
the temporary differences can be utilised.
Deferred income tax is provided on temporary differences, if any, arising on investments in subsidiaries and joint ventures, except
where the timing of the reversal of the temporary difference is controlled by the group and it is probable that the temporary
difference will not reverse in the foreseeable future.
(All amounts in ‘US$ in million’ except per share data and as otherwise stated)
Sat_AR08_Final_Jul22_TP 2 Col.pmd 7/23/2008, 7:19 PM139
140
Current and deferred income tax are recognized in the income statement, except when the tax relates to items charged or credited
directly to equity, in which case the tax is also dealt with directly in equity.
2.17. Employee benefits
Employee benefits are accrued in the period in which the associated services are rendered by employees of the group. Contributions
to defined contribution schemes such as Provident Fund, Employee State Insurance Scheme and Superannuation are charged to
income statement on accrual basis.
a) Gratuity
The Gratuity Plan is a defined benefit plan that, at retirement or termination of employment, provides eligible employees with
a lump sum payment, which is a function of the last drawn salary and completed years of service. The liability recognised
in the balance sheet in respect of gratuity plan is the present value of the defined benefit obligation at the balance sheet date
less the fair value of plan assets, if any, together with adjustments for unrecognised past–service costs. The defined benefit
obligation is calculated annually by independent actuaries using the projected unit credit method. The present value of the
defined benefit obligation is determined by discounting the estimated future cash outflows using interest rates of Government
of India securities and that have terms to maturity approximating to the terms of the related gratuity liability.
Actuarial gains and losses arising from experience adjustments and changes in actuarial assumptions are charged or
credited to income statement in the period in which they arise.
b) Compensated absences
Satyam operates both accumulating and non–accumulating absences plan. Satyam measures the expected cost of
accumulating compensated absences as the additional amount expected to be paid as a result of the unused entitlement that
has accumulated at the balance sheet date. Expense on non–accumulating compensated absences is recognised in the
period in which the absences occur.
c) Share–based payment
Satyam operates a number of equity–settled share–based compensation plans. The fair value of the employee services
received in exchange for the grant of the options is recognized as an expense. The total amount to be expensed over the
vesting period is determined by reference to the fair value of the options granted, excluding the impact of any non–market
vesting conditions (for example, profitability and sales growth targets). Non–market vesting conditions are included in
assumptions about the number of options that are expected to vest. At each balance sheet date, the entity revises its
estimates of the number of options that are expected to vest. It recognises the impact of the revision to original estimates,
if any, in the income statement, with a corresponding adjustment to equity.
2.18. Revenue Recognition
a) IT Services
Revenues from IT services, which includes software development, system maintenance, package software implementation,
engineering design services and e–Business consist of revenues earned from services performed either on a time–and–
material basis or time bound fixed price engagements.
Revenues earned from services performed on a time–and–material basis are recognized as the services are performed. IT
services performed on time bound fixed–price engagements; require accurate estimation of the costs which include salaries
and related expenses of technical associates, related communication expenses, travel costs and scope and duration of each
engagement. Revenue and the related costs for these projects are recognized on percentage–of–completion basis, with
revisions to estimates reflected in the period in which changes become known. Provisions for estimated losses on such
engagements are made during the period in which a loss becomes probable and can be reasonably estimated.
The use of the percentage-of-completion method reflects the pattern in which the obligations to the customer are fulfilled.
Satyam has used an input-based approach since the input measures are a reasonable surrogate for output measures. The
progress of the projects is measured using the efforts expended approach which is based on units of work performed (hours
spent by project staff).
The extent of progress to date on the projects, estimates of future efforts for completion of the projects and the variance of
the revised project plans from the original project plan are continuously monitored. The direct relationship between the
efforts expended and the productivity in measuring progress towards completion makes the efforts expended method more
reliable and also the best approximation of progress towards completion.
b) Business Process Outsourcing
Revenues from BPO services consist of revenues from time–and–material services or time bound fixed- price engagements.
Revenues from time–and–material services are recognized as the services are performed. Revenues from BPO services are
also on time bound fixed price engagements, under which revenue is recognized using the percentage–of–completion
(All amounts in ‘US$ in million’ except per share data and as otherwise stated)
Sat_AR08_Final_Jul22_TP 2 Col.pmd 7/23/2008, 7:19 PM140
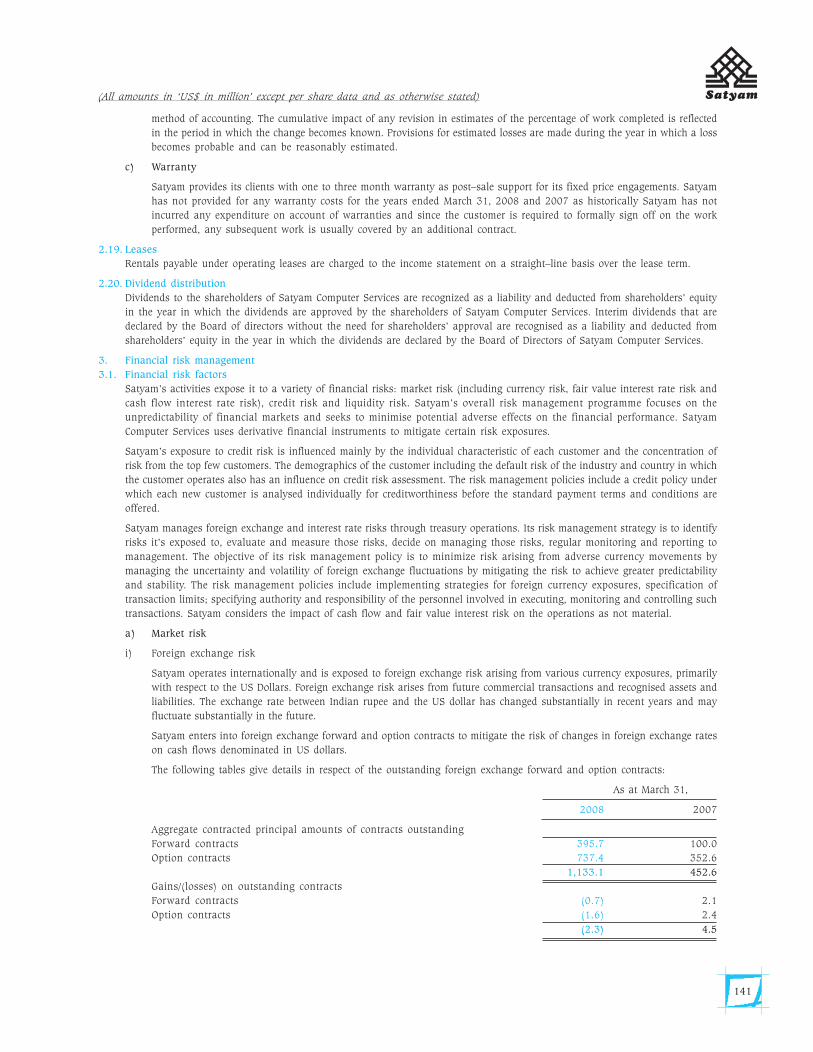
141
method of accounting. The cumulative impact of any revision in estimates of the percentage of work completed is reflected
in the period in which the change becomes known. Provisions for estimated losses are made during the year in which a loss
becomes probable and can be reasonably estimated.
c) Warranty
Satyam provides its clients with one to three month warranty as post–sale support for its fixed price engagements. Satyam
has not provided for any warranty costs for the years ended March 31, 2008 and 2007 as historically Satyam has not
incurred any expenditure on account of warranties and since the customer is required to formally sign off on the work
performed, any subsequent work is usually covered by an additional contract.
2.19. Leases
Rentals payable under operating leases are charged to the income statement on a straight–line basis over the lease term.
2.20. Dividend distribution
Dividends to the shareholders of Satyam Computer Services are recognized as a liability and deducted from shareholders’ equity
in the year in which the dividends are approved by the shareholders of Satyam Computer Services. Interim dividends that are
declared by the Board of directors without the need for shareholders’ approval are recognised as a liability and deducted from
shareholders’ equity in the year in which the dividends are declared by the Board of Directors of Satyam Computer Services.
3. Financial risk management
3.1. Financial risk factors
Satyam’s activities expose it to a variety of financial risks: market risk (including currency risk, fair value interest rate risk and
cash flow interest rate risk), credit risk and liquidity risk. Satyam’s overall risk management programme focuses on the
unpredictability of financial markets and seeks to minimise potential adverse effects on the financial performance. Satyam
Computer Services uses derivative financial instruments to mitigate certain risk exposures.
Satyam’s exposure to credit risk is influenced mainly by the individual characteristic of each customer and the concentration of
risk from the top few customers. The demographics of the customer including the default risk of the industry and country in which
the customer operates also has an influence on credit risk assessment. The risk management policies include a credit policy under
which each new customer is analysed individually for creditworthiness before the standard payment terms and conditions are
offered.
Satyam manages foreign exchange and interest rate risks through treasury operations. Its risk management strategy is to identify
risks it’s exposed to, evaluate and measure those risks, decide on managing those risks, regular monitoring and reporting to
management. The objective of its risk management policy is to minimize risk arising from adverse currency movements by
managing the uncertainty and volatility of foreign exchange fluctuations by mitigating the risk to achieve greater predictability
and stability. The risk management policies include implementing strategies for foreign currency exposures, specification of
transaction limits; specifying authority and responsibility of the personnel involved in executing, monitoring and controlling such
transactions. Satyam considers the impact of cash flow and fair value interest risk on the operations as not material.
a) Market risk
i) Foreign exchange risk
Satyam operates internationally and is exposed to foreign exchange risk arising from various currency exposures, primarily
with respect to the US Dollars. Foreign exchange risk arises from future commercial transactions and recognised assets and
liabilities. The exchange rate between Indian rupee and the US dollar has changed substantially in recent years and may
fluctuate substantially in the future.
Satyam enters into foreign exchange forward and option contracts to mitigate the risk of changes in foreign exchange rates
on cash flows denominated in US dollars.
The following tables give details in respect of the outstanding foreign exchange forward and option contracts:
As at March 31,
2008 2007
Aggregate contracted principal amounts of contracts outstanding
Forward contracts 395.7 100.0
Option contracts 737.4 352.6
1,133.1 452.6
Gains/(losses) on outstanding contracts
Forward contracts (0.7) 2.1
Option contracts (1.6) 2.4
(2.3) 4.5
(All amounts in ‘US$ in million’ except per share data and as otherwise stated)
Sat_AR08_Final_Jul22_TP 2 Col.pmd 7/23/2008, 7:19 PM141
142
The outstanding foreign exchange forward and option contracts as at March 31, 2008 mature between one to twenty seven
months.
Gains/(losses) on all foreign exchange forward and option contracts are included under ‘Other income’ in the consolidated
income statement are as follows:
Year ended March 31,
2008 2007
Forward contracts 5.4 2.6
Option contracts 3.6 3.6
9.0 6.2
A 2% increase/decrease in the value of the Indian rupee against US dollar would decrease/increase the gains on outstanding
foreign exchange forward and option contracts by US$4.5 and US$2.1 for the years ended March 31, 2008 and 2007
respectively.
A 3% increase/decrease in the value of the Indian rupee against UK pound, Euro and Australian dollar would decrease/
increase the gains on outstanding foreign exchange forward and option contracts by US$0.1 and Nil for the years ended
March 31, 2008 and 2007 respectively.
The sensitivity analysis is based on a reasonably possible change in the underlying foreign currency against the Indian
rupee computed from historical data.
ii) Cash flow and fair value interest rate risk
The group’s interest rate risk arises from long–term borrowings and investment in bank deposits. Borrowings issued at
variable rates expose the group to cash flow interest rate risk while borrowings issued and investment in bank deposits at
fixed rates expose the group to fair value interest rate risk.
Satyam has not entered into any interest rate swaps in respect of the borrowings or investment in bank deposits. However,
Satyam continuously monitors the movement of interest rates to determine whether the new borrowings have to be raised
or deposits have to be placed at fixed or floating interest rates.
Borrowings
The profile of Satyam’s borrowings as at March 31, 2008 is as follows:
Loan type Lenders Interest Computation Amount
(per annum) method Outstanding
Working capital loan BNP Paribas 6 month LIBOR +0.95% Floating 10.7
External commercial borrowing BNP Paribas 6 month LIBOR +0.95% Floating 10.4
Overdraft facility BNP Paribas 6 month LIBOR +0.25% Floating 26.9
Vehicle loans Various other 3%–14% Fixed 6.1
parties
The table below provides information about group’s financial instruments that are sensitive to changes in interest rates as
at the dates shown. Weighted average interest rates were based on average interest rates applicable to the loans.
Year ended March 31,
2008 2007
Weighted Weighted
average Amount average Amount
interest rate Outstanduing interest rate Outstanding
Fixed interest rate long term borrowings 10.0% 6.0 7.9% 3.2
Variable interest rate long term borrowings 8.0% 21.2 7.2% 20.6
Variable interest rate short term borrowings 8.4% 26.9 6.7% 10.6
54.1 34.4
A 100 bps increase/decrease in the borrowing interest rates would have impacted the interest on floating interest rate
borrowings and decreased/increased the net profit by US$0.4 and US$0.3 for the year ended March 31, 2008 and 2007,
respectively.
(All amounts in ‘US$ in million’ except per share data and as otherwise stated)
Sat_AR08_Final_Jul22_TP 2 Col.pmd 7/23/2008, 7:19 PM142
143
The approximate fair value of fixed interest rate long–term debts, as determined using current interest rates was US$6.1 and
US$3.2 as at March 31, 2008 and 2007 respectively as compared to the carrying amounts of US$6.0 and US$3.2 as at
March 31, 2008 and 2007 respectively.
A 100 bps increase/decrease in the interest rates would have resulted in a decrease/increase in the fair value by US$8.0
thousand and US$4.0 thousand as at March 31, 2008 and 2007, respectively.
Investment in bank deposits
Investments in bank deposits denominated in Indian rupee represent term deposits placed with banks earning fixed rate of
interest. The carrying value of investments in bank deposits amounted to US$894.8 and US$782.7 as at March 31, 2008
and 2007 respectively. The approximate fair value of investment in bank deposits, as determined using current interest rates
was US$902.7 and US$759.7 as at March 31, 2008 and 2007 respectively. The weighted average rate of interest earned on
investment in bank deposits amounted to 8.0% and 7.0% during the year ended March 31, 2008 and 2007 respectively.
A 100 bps increase in current interest rates would have reduced the fair value of investment in bank deposits by US$5.6 and
US$11.5 as at March 31, 2008 and 2007 respectively whereas a 100 bps decrease in current interest rates would have
increased the fair value of investment in bank deposits by US$5.7 and US$11.8 as at March 31, 2008 and 2007 respectively.
The sensitivity analysis is based on a reasonably possible change in the market interest rates computed from historical
data.
b) Credit risk
Credit risk refers to the risk of default on its obligation by the counterparty resulting in a financial loss. Trade receivables
are typically unsecured and are derived from revenue earned from customers primarily located in the United States. Credit
risk is managed through credit approvals, establishing credit limits and continuously monitoring the creditworthiness of
customers to which Satyam grants credit terms in the normal course of business. The following table gives details in respect
of percentage of revenues generated from top two and top five customers:
Year ended March 31,
2008 2007
Revenue from top two customers
Customer I 4.88% 6.34%
Customer II 4.85% 4.41%
Revenue from top five customers 19.27% 21.04%
Satyam maintains banking relationships with only creditworthy banks which it reviews on an on–going basis. Satyam
enters into foreign exchange derivative instruments where the counter party is generally a bank. Consequently, the credit
risk on the derivatives and bank deposits is not considered material.
c) Liquidity risk
Satyam manages liquidity risk by maintaining adequate reserves, banking facilities and reserve borrowing facilities, by
continuously monitoring forecast and actual cash flows and matching the maturity profiles of financial assets and liabilities.
The following table sets forth group’s financial liabilities to make future payments as at March 31, 2008.
Within 1 1–3 years 3–5 years After 5 Total
year years
As at March 31, 2008
Trade and other payables 119.4 - - - 119.4
Borrowings 29.7 25.1 0.2 - 55.0
Acquisition consideration 1.7 1.6 - - 3.3
Derivative financial liabilities 2.6 - - - 2.6
153.4 26.7 0.2 - 180.3
As at March 31, 2007
Trade and other payables 65.0 - - - 65.0
Borrowings 12.3 18.0 4.4 - 34.7
Acquisition consideration 12.9 8.7 - - 21.6
Derivative financial liabilities - - - - -
90.2 26.7 4.4 - 121.3
(All amounts in ‘US$ in million’ except per share data and as otherwise stated)
Sat_AR08_Final_Jul22_TP 2 Col.pmd 7/23/2008, 7:19 PM143
144
Satyam has at its disposal cash and cash equivalents of US$290.5 (March 31, 2007: US$152.2) and investment in bank
deposits of US$894.8 (March 31, 2007: US$782.7) in addition to the unused lines of credit from banks as at March 31,
2008.
Details of unused lines of credit available from banks as at the balance sheet date are as follows:
As at March 31,
2008 2007
Short term debt 1.6 9.0
Long term debt - -
Non–fund facilities 33.4 16.2
Total 35.0 25.2
Based on past performance and current expectations, Satyam believes that the cash and cash equivalents and cash
generated from operations will satisfy its working capital needs, capital expenditure, investment requirements, stock
repurchases, commitments and other liquidity requirements associated with its existing operations through at least the next
12 months. In addition, there are no transactions, arrangements, and other relationships with unconsolidated entities or
other persons that are reasonably likely to materially affect liquidity or the availability of the requirements for capital
resources.
3.2. Capital risk management
Satyam’s objective when managing capital is to safeguard its ability to continue as a going concern in order to provide returns
for shareholders and benefits for other stakeholders.
Total capital of Satyam is ‘equity’ as shown in the consolidated balance sheet plus net debt. Net debt is calculated as total
borrowings (including ‘current and non-current borrowings’ as shown in the consolidated balance sheet) less cash and cash
equivalents. Net debt as at the reporting date is zero.
In order to maintain or adjust the capital structure, Satyam may adjust the amount of dividends paid to shareholders, issue new
shares to reduce debt.
3.3. Fair value estimation
The fair value of financial instruments traded in active markets (such as trading and available-for-sale securities) is based on
quoted market prices at the balance sheet date. The quoted market price used for financial assets held by the group is the current
bid price. The fair value of financial instruments that are not traded in an active market (for example, over-the counter
derivatives) is determined by using valuation techniques. The group uses a variety of methods and makes assumptions that are
based on market conditions existing at each balance sheet date. Quoted market prices or dealer quotes for similar instruments are
used for long-term debt. Other techniques, such as estimated discounted cash flows, are used to determine fair value for the
remaining financial instruments. The fair value of interest rate swaps is calculated as the present value of the estimated future
cash flows. The fair value of forward foreign exchange contracts is determined using quoted forward exchange rates at the
balance sheet date.
The carrying value less impairment provision, of trade receivables and payables, are assumed to approximate their fair values.
The fair value of financial liabilities for disclosure purposes is estimated by discounting the future contractual cash flows at the
current market interest rate that is available to the group for similar financial instruments.
4. Critical accounting estimates and judgements
Estimates and judgments are continually evaluated and are based on historical experience and other factors, including expectations
of future events that are believed to be reasonable under the circumstances.
Satyam makes estimates and assumptions concerning the future. The resulting accounting estimates will, by definition, seldom
equal the related actual results. The estimates and assumptions that have a significant risk of causing a material adjustment to
the carrying amounts of assets and liabilities within the next financial year are discussed below.
a) Income taxes
Satyam is subject to income taxes in a number of jurisdictions. Significant judgment is required in determining provision
for income taxes. There are many transactions and calculations for which the ultimate tax determination is uncertain during
the ordinary course of business. Satyam recognises liabilities for anticipated tax issues based on estimates of whether
additional taxes will be due. Where the final tax outcome of these matters is different from the amounts that were initially
recorded, such differences will impact the income tax and deferred tax provisions in the period in which such determination
is made.
(All amounts in ‘US$ in million’ except per share data and as otherwise stated)
Sat_AR08_Final_Jul22_TP 2 Col.pmd 7/23/2008, 7:19 PM144
145
b) Estimated impairment of goodwill
Satyam tests annually goodwill for any impairment, in accordance with the accounting policy Note 2.7 above. The
recoverable amount of cash generating units is determined based on value–in–use calculations. These calculations require
the use of estimates.
If the budgeted gross margin used in the value-in-use calculation had been 1% lower than Satyam’s estimates at March 31,
2008, there would not be any impairment of goodwill. Similarly, if the estimated pre-tax discount rate applied to the
discounted cash flows had been 1% higher than Satyam’s estimates, there would not be any impairment of goodwill.
c) Revenue recognition
Satyam uses the percentage–of–completion method in accounting for its fixed–price contracts. The use of the percentage of
completion method reflects the pattern in which the obligations to the customer are fulfilled. Satyam has used an input–
based approach since the input measures are a reasonable surrogate for output measures. Provisions for estimated losses
on such engagements are made during the period in which a loss becomes probable and can be reasonably estimated.
5. Segmental reporting
The operating segments reported below are the segments of Satyam for which separate financial information is available and for
which operating profit/loss amounts are evaluated regularly by executive management in deciding how to allocate resources and
in assessing performance. Management evaluates performance based on stand-alone revenues and net income for the companies
in Satyam. The executive management evaluates Satyam’s operating segments based on the following two business groups:
– IT services; and
– Business Process Outsourcing
Business Segments
The segment results for the year ended March 31, 2008 are as follows:
IT Services BPO Elimination Group
Revenue - external customers 2,093.2 44.9 - 2,138.1
Revenue - Inter-segment 1.3 15.8 (17.1) -
Total Revenue 2,094.5 60.7 (17.1) 2,138.1
Operating profit/ (loss) 415.7 (1.9) - 413.8
Finance income 67.4 - - 67.4
Finance cost (3.3) (3.7) - (7.0)
Share of profit in joint ventures 0.1 - - 0.1
Profit/(loss) before income tax 479.9 (5.6) - 474.3
Income tax expense 52.5 - - 52.5
Profit/(loss) for the year 427.4 (5.6) - 421.8
Depreciation and amortization 35.0 5.3 - 40.3
Non–cash expenses other than depreciation 31.9 - - 31.9
Capital expenditure 101.1 5.3 - 106.4
Investment in joint ventures 4.9 - - 4.9
Segment assets 2,210.3 39.6 (44.4) 2,205.5
Segment liabilities 351.4 64.1 (9.9) 405.7
The segment results for the year ended March 31, 2007 are as follows:
IT Services BPO Elimination Group
Revenue - external customers 1,432.5 28.9 - 1,461.4
Revenue - Inter-segment 0.6 9.2 (9.8) -
Total Revenue 1,433.1 38.1 (9.8) 1,461.4
Operating profit/ (loss) 297.0 (2.4) - 294.6
Finance income 37.0 0.3 - 37.3
Finance cost (1.8) (1.8) - (3.6)
Share of profit in joint ventures 1.1 - - 1.1
Profit/(loss) before income tax 333.3 (3.9) - 329.4
Income tax expense 30.9 - - 30.9
Profit/(loss) for the year 302.4 (3.9) - 298.5
Depreciation and amortization 29.3 3.2 - 32.5
(All amounts in ‘US$ in million’ except per share data and as otherwise stated)
Sat_AR08_Final_Jul22_TP 2 Col.pmd 7/23/2008, 7:19 PM145
146
IT Services BPO Elimination Group
Non–cash expenses other than depreciation 20.3 - - 20.3
Capital expenditure 75.8 8.0 - 83.8
Investment in joint ventures 4.8 - - 4.8
Segment assets 1,555.7 46.7 18.6 1,621.0
Segment liabilities 212.6 66.4 (15.0) 264.0
Inter–segment transfers or transactions are entered into under the normal commercial terms and conditions that would also be
available to unrelated third parties.
Capital expenditure comprises additions to premises and equipment (Note 6) and intangible assets (Note 7).
Reportable segments’ assets are reconciled to total assets as follows:
IT Services BPO Elimination Group
As at March 31, 2008
Segment assets 2,210.3 39.6 (44.4) 2,205.5
Total assets as per the balance sheet 2,210.3 39.6 (44.4) 2,205.5
As at March 31, 2007
Segment assets 1,555.7 46.7 18.6 1,621.0
Total assets as per the balance sheet 1,555.7 46.7 18.6 1,621.0
Geographical information
Satyam’s business segments operate in five main geographical areas, even though they are managed on a worldwide basis. The
home country of Satyam Computer Services, which is also the main operating company, is India. Satyam’s revenue is generated
mainly within America, Europe, Asia Pacific and India.
The revenues are attributable to countries based on location of customers. Non-current assets are based on the location of the
assets.
Revenue from external
customers Non-current assets
Year ended March 31, As at March 31,
2008 2007 2008 2007
America 1,285.0 924.0 4.2 4.0
Europe 439.8 276.5 2.3 2.3
Asia Pacific 288.9 160.7 5.3 2.1
India 68.5 75.2 253.8 191.4
Rest of the world 55.9 25.0 1.6 0.8
2,138.1 1,461.4 267.2 200.6
The non-current assets in the above table represent premises and equipment and intangible assets of each segment.
6. Premises and equipment
Furniture
Computers fittings
Land and and and Assets under
buildings servers equipment Vehicles construction Total
Cost
As at April 01, 2006 31.6 169.8 46.9 7.0 18.0 273.3
Additions 1.6 19.1 7.7 2.7 49.1 80.2
Disposals - (0.4) - (1.2) - (1.6)
Exchange difference 1.1 7.6 1.9 0.5 2.9 14.0
As at March 31, 2007 34.3 196.1 56.5 9.0 70.0 365.9
Additions 3.8 35.1 12.2 6.0 39.9 97.0
Disposals - (0.5) (0.1) (1.8) (2.4)
Exchange difference 2.7 14.9 4.5 0.6 5.1 27.8
As at March 31, 2008 40.8 245.6 73.1 13.8 115.0 488.3
(All amounts in ‘US$ in million’ except per share data and as otherwise stated)
Sat_AR08_Final_Jul22_TP 2 Col.pmd 7/23/2008, 7:19 PM146
147
Furniture
Computers fittings
Land and and and Assets under
buildings servers equipment Vehicles construction Total
Accumulated depreciation
As at April 01, 2006 3.0 144.5 33.3 2.7 - 183.5
Charge for the year 0.8 20.3 5.8 1.5 - 28.4
Disposals - (0.3) - (0.5) - (0.8)
Exchange difference 0.1 5.5 1.4 0.2 - 7.2
As at March 31, 2007 3.9 170.0 40.5 3.9 - 218.3
Charge for the year 1.1 24.5 7.3 2.3 - 35.2
Disposals - (0.5) - (1.2) - (1.7)
Exchange difference 0.2 13.0 3.3 0.3 - 16.8
As at March 31, 2008 5.2 207.0 51.1 5.3 - 268.6
Net book amount as at
March 31, 2007 30.4 26.1 16.0 5.1 70.0 147.6
March 31, 2008 35.6 38.6 22.0 8.5 115.0 219.7
Depreciation expense of US$31.4 (March 31, 2007: US$25.1) charged in cost of revenue and US$3.8 (March 31, 2007: US$3.3)
charged in selling general and administrative expenses.
External commercial borrowing and working capital loan of Satyam BPO are secured against movable and immovable assets for
the value of US$11.3 (March 31, 2007: US$10.7) (Note 16).
7. Intangible Assets
Goodwill Software Others Total
Cost
As at April 01, 2006 38.4 17.2 - 55.6
Additions 0.1 3.6 - 3.7
Exchange difference 1.1 0.7 - 1.8
As at March 31, 2007 39.6 21.5 - 61.1
Additions 3.2 5.3 0.9 9.4
Adjustments (13.4) - - (13.4)
Exchange difference 2.6 1.6 - 4.2
As at March 31, 2008 32.0 28.4 0.9 61.3
Accumulated amortisation and impairment
As at April 01, 2006 - 3 . 7 - 3 . 7
Charge for the year - 4.1 - 4.1
Exchange difference - 0.3 - 0.3
As at March 31, 2007 - 8.1 - 8.1
Charge for the year - 5.0 0.1 5.1
Exchange difference - 0.6 - 0.6
As at March 31, 2008 - 13.7 0.1 13.8
Net book amount as at
March 31, 2007 39.6 13.4 - 53.0
March 31, 2008 32.0 14.7 0.8 47.5
Impairment tests for goodwill
Goodwill is allocated to Satyam’s cash–generating units (‘CGUs’) identified to the entities acquired by Satyam in the IT services
segment. A summary of the goodwill allocation is presented below.
As at March 31,
2008 2007
Citisoft Plc. (“Citisoft”) 22.0 30.8
Knowledge Dynamics Pte Limited (“KDPL”) 3.0 5.2
Satyam Technologies, Inc. (“STI”) 3.9 3.6
Nitor Global Solutions Limited (“Nitor”) 3.1 -
32.0 39.6
(All amounts in ‘US$ in million’ except per share data and as otherwise stated)
Sat_AR08_Final_Jul22_TP 2 Col.pmd 7/23/2008, 7:19 PM147
148
The recoverable amount of a CGU is determined based on value–in–use calculations. These calculations use pre–tax cash flow
projections based on financial budgets approved by management. Cash flows beyond five years are extrapolated using the
estimated long-term conservative growth rates stated below. The key assumptions used for value–in–use calculations are as
follows:
Citisoft KDPL STI Nitor
Operating margin 16% 5% 24% 20%
Long-term growth rate 5% 5% 5% 2%
Pre-tax discount rate 21% 18% 19% 30%
Management determined budgeted operating margin based on past performance and its expectations of market development.
The long term growth rates do not exceed the long–term average growth rate for the IT business in which the CGU operates. The
discount rates used are pre–tax and reflect specific risks.
8. Investments
8.1. Acquisitions
8.1.1.Citisoft Plc.
On May 12, 2005, Satyam acquired a 75% interest in Citisoft Plc (“Citisoft”), a business and systems consulting firm located in the
United Kingdom that has focused on the investment management industry since 1986. The acquisition, as accounted under Indian
GAAP has not been restated pursuant to the application of business combinations exemption under IFRS 1. The consideration for
the 75% equity interest in Citisoft aggregated to US$17.4 comprising of an initial consideration of US$14.3 (including direct
acquisition costs of US$0.9) and deferred consideration (non–contingent) of US$3.1. Deferred consideration for the acquisition
of the 75% equity interest was accounted for as part of the purchase consideration and classified as a current liability in the
opening IFRS balance sheet as at April 01, 2006. This has been paid subsequently in June 2006.
The group was also required to pay a maximum earn out consideration aggregating to US$3.9 in May 2007 based on achievement
of targeted revenues and profits for the year ended April 30, 2007. Satyam expected a pay–out as at April 01, 2006 of US$3.9 and
accordingly accounted for the expected pay–out as a liability with a corresponding adjustment to goodwill as at the opening IFRS
balance sheet date of April 01, 2006.
Satyam also had a call option and the minority shareholders had a put option to acquire / sell the balance 25% equity shares in
two tranches – 12.5% on April 30, 2007 and 12.5% on April 30, 2008. The consideration payable for the first tranche of 12.5%
equity shares on April 30, 2007 would amount to US$2.8 and a maximum earn–out consideration amounting to US$2.4 based
on achievement of targeted revenues and profits. The consideration payable for the second tranche of 12.5% equity shares on April
30, 2008 would amount to US$2.9 and a maximum earn–out consideration amounting to US$3.7 based on achievement of
targeted revenues and profits. However, with a written put on the balance 25% equity shares, Satyam Computer Services had
effectively acquired 100% of Citisoft at the date of acquisition. Hence, in relation to the opening IFRS balance sheet as at April 01,
2006:
• minority interest of US$1.0 recognized in Indian GAAP, in respect of shares subject to put has been derecognized on the date
of business combination treating the shares as if they had been acquired by Satyam Computer Services as a part of the
business combination.
• consequently, goodwill is adjusted to the extent of the difference of US $10.8 between the minority interest and the fair value
of put liability. Fair value of the put liability of US$11.8 represented the amount Satyam expected to pay on the date of
business combination.
Subsequently, the deferred consideration has been paid on June 30, 2007. Since the revenue and profit targets have not been
achieved, the earn–out consideration to be paid on April 30, 2007 is no longer payable; accordingly the goodwill amount has
been adjusted.
On June 29, 2007, Satyam entered into an amendment agreement with the selling shareholders. In accordance with the amendment
agreement, Satyam was required to pay a settlement consideration of US$3.5 in lieu of the outstanding deferred consideration,
and the difference between the settlement consideration and the outstanding deferred consideration has been recognised in the
income statement. The outstanding earn-out consideration payable has been de-recognised and goodwill has been adjusted
accordingly.
Satyam was also required to fund an Employee Benefit Trust (“EBT”) formed by Citisoft for the purpose of providing additional
incentive to employees to contribute to the success of Citisoft. Satyam was required to fund a maximum of US$3.4 and US$1.7 on
April 30, 2007 and 2008 respectively, based on achievement of targeted revenues and profits. Under IFRS, contribution to EBT,
since required for the purpose of providing additional incentive to employees to contribute to the success of Citisoft, has been
considered as compensation for post–acquisition services and hence is in the nature of employee benefit expense. Pursuant to the
application of mandatory estimates exception under IFRS 1, the group recognized a liability of US$1.4 on April 01, 2006 towards
(All amounts in ‘US$ in million’ except per share data and as otherwise stated)
Sat_AR08_Final_Jul22_TP 2 Col.pmd 7/23/2008, 7:19 PM148
149
expected contribution to EBT with a corresponding adjustment to retained earnings. Further, Satyam Computer Services has
recognized US$1.7 in the consolidated statement of income as part of cost of revenues in respect of the EBT contribution for the
year ended March 31, 2007. Pursuant to the amendment agreement, the excess liability in respect of contribution to EBT has been
de-recognised.
8.1.2.Knowledge Dynamics Pte Limited
On October 01 2005, the group acquired the entire share capital of Knowledge Dynamics Pte Limited, Singapore, (“Knowledge
Dynamics”), a data warehousing and business intelligence solutions provider. The acquisition, as accounted under Indian GAAP
has not been restated pursuant to the application of business combinations exemption under IFRS 1. The consideration for this
acquisition aggregated to US$3.3 comprising of initial consideration of US$1.8 (including direct acquisition costs of $11
thousand) and deferred consideration of US$1.5. The entire deferred consideration of US$1.5 has been paid in two tranches of
US$0.8 and US$0.7 in March 2007 and June 2007respectively.
Additionally the group was also required to pay a maximum earn-out consideration aggregating to US$1.1 and US$1.1 on April
30, 2007 and 2008 respectively based on the achievement of targeted revenues and profits from the date of acquisition up to April
30, 2007 and 2008 respectively. The group expected a pay–out as at April 01, 2006 of US$2.2 and accordingly accounted for the
expected pay–out as a liability with a corresponding adjustment to goodwill as at the opening IFRS balance sheet date of April
01, 2006. However the revenue and profit targets have not been achieved, therefore the earn–out consideration has been de-
recognised and adjusted against goodwill.
On July 19, 2007, the group entered into an amendment agreement with the selling shareholders. As per the amendment
agreement, the group is required to pay US$0.7 to the selling shareholders in July 2007 and deferred payment of US$0.2 and a
maximum earn out consideration of US$0.5 payable in May 2008 in lieu of the earn–out consideration payable in 2008. Satyam
has paid US$0.7 in July 2007 and the difference between the settlement consideration and the outstanding deferred and earn-out
consideration has been recognised in the income statement.
8.1.3.Nitor Global Solutions Limited
On January 04, 2008, Satyam acquired the entire share capital of Nitor Global Solutions Limited, United Kingdom (“Nitor”), an IT
professional consultancy services company engaged in assisting clients in managing infrastructure programs, liaison and
communications, architecture, designing, planning and deploying Microsoft technologies. The total consideration for this acquisition
aggregated to approximately US$5.6 including a performance-based payment of up to US$1.5 payable over two years conditional
upon achievement of specified revenue and profit targets and a service based consideration of up to US$1.2 to be accounted on
accrual. The acquired business contributed revenues of US$0.8 and net profit of US$17 thousand to Satyam for the period from
January 04, 2008 to March 31, 2008. Pro-forma disclosures regarding this acquisition have not been provided because it is not
material to the operations of Satyam.
Details of net assets acquired and goodwill are as follows:
Amount
Purchase consideration
– Cash paid 2.9
– Contingent consideration 1.5
Total purchase consideration 4.4
Fair value of net assets acquired 1.4
Goodwill 3.0
The goodwill is attributable to the further development of a specialised technology and the business development initiatives that
allow Nitor to acquire new customers and generate revenue.
The assets and liabilities as at January 04, 2008 arising from the acquisition are as follows:
Acquiree’s
Fair value carrying amount
Cash and cash equivalents 0.6 0.6
Customer contracts and relationships 0.6 -
Non-compete agreements 0.1 -
Internally developed technology 0.2 -
Trade and other receivables 0.8 0.8
Trade and other payables (0.6) (0.6)
Deferred tax liabilities (0.3) -
Net assets acquired 1.4 0.8
(All amounts in ‘US$ in million’ except per share data and as otherwise stated)
Sat_AR08_Final_Jul22_TP 2 Col.pmd 7/23/2008, 7:19 PM149
150
Amount
Purchase consideration settled in cash 2.9
Cash and cash equivalents in subsidiary acquired 0.6
Cash outflow on acquisition 2.3
8.1.4.Bridge Strategy Group
On January 21, 2008, Satyam Computer Services announced its intention of acquiring 100% of the shares of Bridge Strategy Group
LLC, (“Bridge”) a Chicago based strategy and general management consulting firm for a total consideration of US$35.0
comprising of initial consideration, deferred consideration (non-contingent) and a contingent consideration. The transaction has
not been consummated as at March 31, 2008. The initial consideration of US$19.0 has been paid on April 04, 2008.
8.2. Investments in joint ventures
8.2.1.Satyam Venture Engineering Services Private Limited
On October 28, 1999, Satyam entered into an agreement with Venture Industries, USA (“Venture”) to form an equally held joint
venture company Satyam Venture Engineering Services Private Limited. (“Satyam Venture”). Satyam holds 50% in Satyam
Venture. The joint venture was formed on January 3, 2000 at Hyderabad, India. Satyam Venture is engaged in providing
engineering solutions, software development and customization services specifically for the automotive industries worldwide.
(Also refer Note 26(e))
8.2.2.CA Satyam ASP Private Limited
On December 29, 2000, Satyam entered into an agreement with Computer Associates International, Inc. (“CA”) to form an equally
held joint venture company CA Satyam ASP Private Limited (“CA Satyam”). Satyam holds 50% in CA Satyam. The joint venture
was formed in January 2001, in Mumbai, India. As per the agreement, both Satyam Computer Services and CA have invested
US$1.5 each in the joint venture. (Also refer Note 29(b))
Satyam has made an accounting policy decision of accounting for investment in joint ventures using equity method in the
accounts prepared under IFRS.
The carrying value of Satyam’s investments in joint ventures as at March 31, 2008 and 2007 are as shown below:
Year ended March 31,
2008 2007
Beginning of year 4.8 3.7
Share of post tax profits 0.1 1.1
End of year 4.9 4.8
Satyam’s share of the results of its joint ventures, all of which are unlisted, and its aggregated assets and liabilities, are as follows:
Name Assets Liabilities Revenues Profit % interest
after tax held
March 31, 2008
Satyam Venture 7.2 (3.7) 8.8 - 50%
CA Satyam 1.7 (0.3) 1.2 0.1 50%
8.9 (4.0) 10.0 0.1
March 31, 2007
Satyam Venture 5.2 (1.5) 7.7 0.7 50%
CA Satyam 1.3 (0.2) 0.9 0.4 50%
6.5 (1.7) 8.6 1.1
(All amounts in ‘US$ in million’ except per share data and as otherwise stated)
Sat_AR08_Final_Jul22_TP 2 Col.pmd 7/23/2008, 7:19 PM150
151
9. Financial instruments by category
The accounting policies for financial instruments have been applied to the line items below:
Assets at fair
value through
Loans and the profit Available
March 31, 2008 receivables and loss for sale Total
Assets as per balance sheet
Investments in non–marketable equity securities - - 3.9 3.9
– Accumulated impairment - - (3.9) (3.9)
Derivative financial instruments - 0.3 - 0.3
Trade and other receivables 625.8 - - 625.8
Investments in bank deposits 894.8 - - 894.8
Cash and cash equivalents 290.5 - - 290.5
1,811.1 0.3 - 1,811.4
Liabilities at
fair value other
through the Financial
March 31, 2008 profit and loss liabilities Total
Liabilities as per balance sheet
Borrowings - 54.1 54.1
Derivative financial instruments - - -
- 54.1 54.1
Assets at fair
value through
Loans and the profit Available
March 31, 2007 receivables and loss for sale Total
Assets as per balance sheet
Investments in non–marketable equity securities - - 3.7 3.7
– Accumulated impairment - - (3.7) (3.7)
Derivative financial instruments - 4.5 - 4.5
Trade and other receivables 377.4 - - 377.4
Investments in bank deposits 782.7 - - 782.7
Cash and cash equivalents 152.2 - - 152.2
1,312.3 4.5 - 1,316.8
Liabilities at
fair value other
through the Financial
March 31, 2007 profit and loss liabilities Total
Liabilities as per balance sheet
Preference shares 13.6 - 13.6
Borrowings - 34.4 34.4
Derivative financial instruments - - -
13.6 34.4 48.0
The carrying amounts reported in the balance sheet for cash and cash equivalents, trade and other receivables, amounts due to
or from related parties, accounts payable and other liabilities approximate their respective fair values due to their short maturity.
Interest accrued on investment in bank deposits aggregated to US$68.1 and US$15.1 as at March 31, 2008 and 2007 respectively.
(All amounts in ‘US$ in million’ except per share data and as otherwise stated)
Sat_AR08_Final_Jul22_TP 2 Col.pmd 7/23/2008, 7:19 PM151
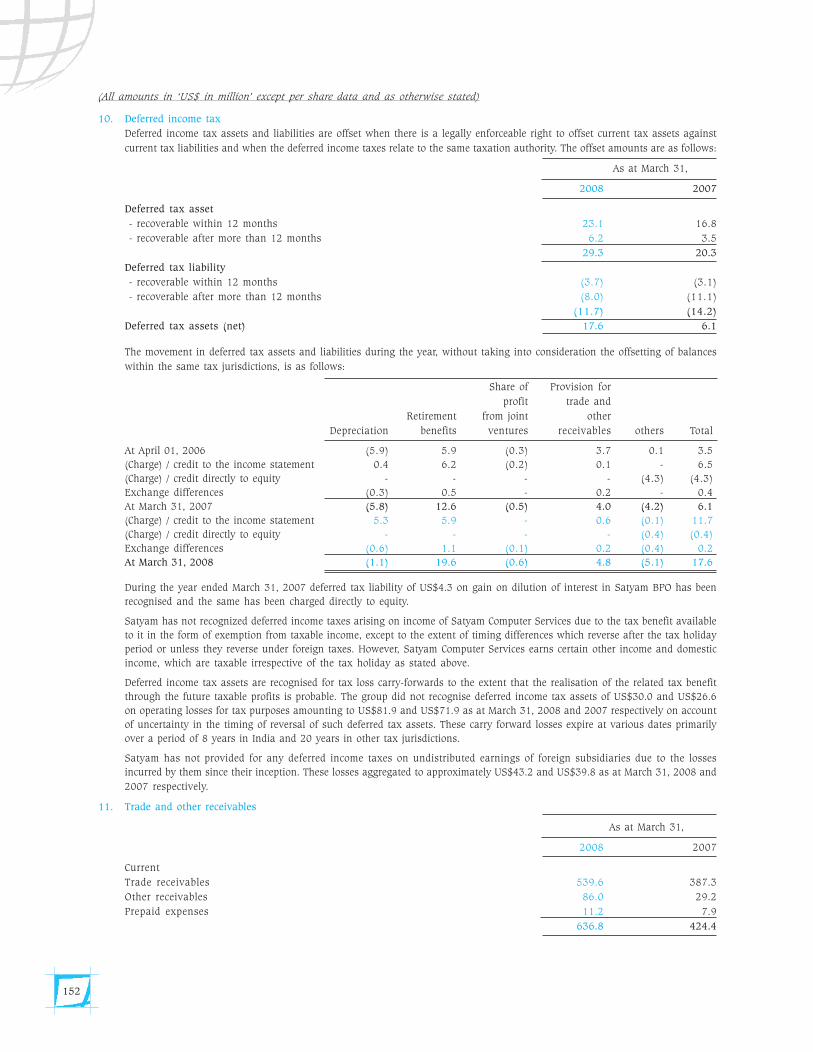
152
10. Deferred income tax
Deferred income tax assets and liabilities are offset when there is a legally enforceable right to offset current tax assets against
current tax liabilities and when the deferred income taxes relate to the same taxation authority. The offset amounts are as follows:
As at March 31,
2008 2007
Deferred tax asset
- recoverable within 12 months 23.1 16.8
- recoverable after more than 12 months 6.2 3.5
29.3 20.3
Deferred tax liability
- recoverable within 12 months (3.7) (3.1)
- recoverable after more than 12 months (8.0) (11.1)
(11.7) (14.2)
Deferred tax assets (net) 17.6 6.1
The movement in deferred tax assets and liabilities during the year, without taking into consideration the offsetting of balances
within the same tax jurisdictions, is as follows:
Share of Provision for
profit trade and
Retirement from joint other
Depreciation benefits ventures receivables others Total
At April 01, 2006 (5.9) 5.9 (0.3) 3.7 0.1 3.5
(Charge) / credit to the income statement 0.4 6.2 (0.2) 0.1 - 6.5
(Charge) / credit directly to equity - - - - (4.3) (4.3)
Exchange differences (0.3) 0.5 - 0.2 - 0.4
At March 31, 2007 (5.8) 12.6 (0.5) 4.0 (4.2) 6.1
(Charge) / credit to the income statement 5.3 5.9 - 0.6 (0.1) 11.7
(Charge) / credit directly to equity - - - - (0.4) (0.4)
Exchange differences (0.6) 1.1 (0.1) 0.2 (0.4) 0.2
At March 31, 2008 (1.1) 19.6 (0.6) 4.8 (5.1) 17.6
During the year ended March 31, 2007 deferred tax liability of US$4.3 on gain on dilution of interest in Satyam BPO has been
recognised and the same has been charged directly to equity.
Satyam has not recognized deferred income taxes arising on income of Satyam Computer Services due to the tax benefit available
to it in the form of exemption from taxable income, except to the extent of timing differences which reverse after the tax holiday
period or unless they reverse under foreign taxes. However, Satyam Computer Services earns certain other income and domestic
income, which are taxable irrespective of the tax holiday as stated above.
Deferred income tax assets are recognised for tax loss carry-forwards to the extent that the realisation of the related tax benefit
through the future taxable profits is probable. The group did not recognise deferred income tax assets of US$30.0 and US$26.6
on operating losses for tax purposes amounting to US$81.9 and US$71.9 as at March 31, 2008 and 2007 respectively on account
of uncertainty in the timing of reversal of such deferred tax assets. These carry forward losses expire at various dates primarily
over a period of 8 years in India and 20 years in other tax jurisdictions.
Satyam has not provided for any deferred income taxes on undistributed earnings of foreign subsidiaries due to the losses
incurred by them since their inception. These losses aggregated to approximately US$43.2 and US$39.8 as at March 31, 2008 and
2007 respectively.
11. Trade and other receivables
As at March 31,
2008 2007
Current
Trade receivables 539.6 387.3
Other receivables 86.0 29.2
Prepaid expenses 11.2 7.9
636.8 424.4
(All amounts in ‘US$ in million’ except per share data and as otherwise stated)
Sat_AR08_Final_Jul22_TP 2 Col.pmd 7/23/2008, 7:19 PM152
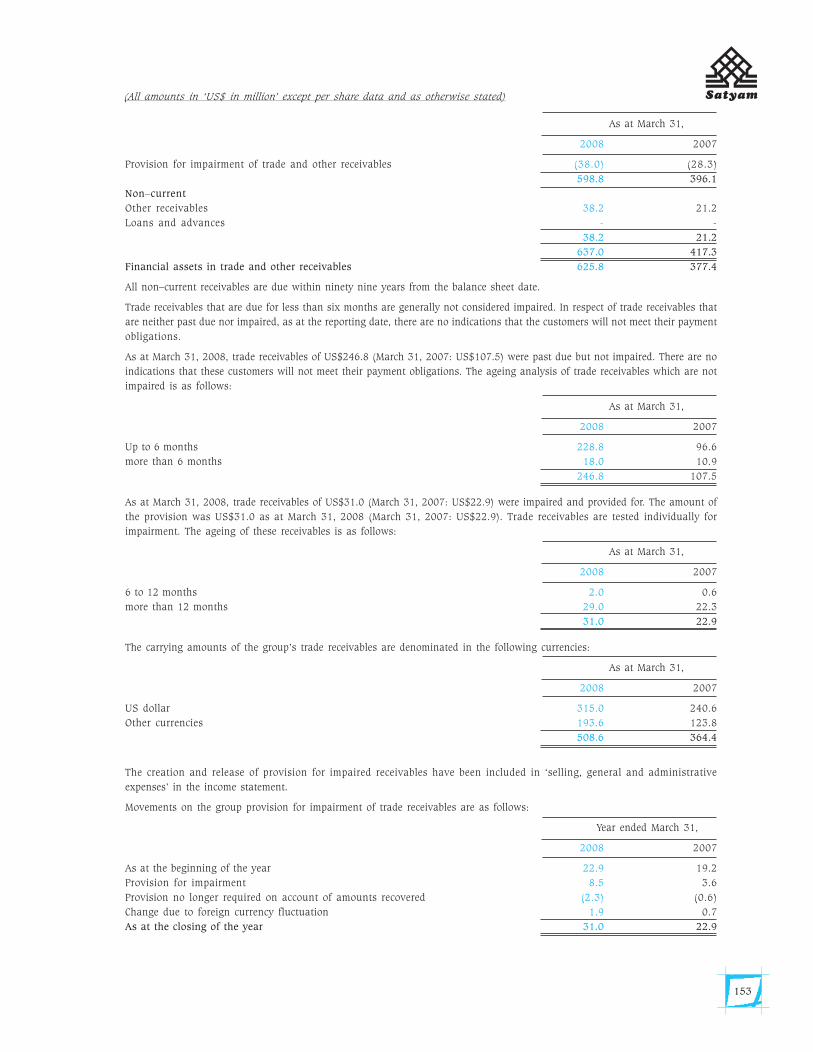
153
As at March 31,
2008 2007
Provision for impairment of trade and other receivables (38.0) (28.3)
598.8 396.1
Non–current
Other receivables 38.2 21.2
Loans and advances - -
38.2 21.2
637.0 417.3
Financial assets in trade and other receivables 625.8 377.4
All non–current receivables are due within ninety nine years from the balance sheet date.
Trade receivables that are due for less than six months are generally not considered impaired. In respect of trade receivables that
are neither past due nor impaired, as at the reporting date, there are no indications that the customers will not meet their payment
obligations.
As at March 31, 2008, trade receivables of US$246.8 (March 31, 2007: US$107.5) were past due but not impaired. There are no
indications that these customers will not meet their payment obligations. The ageing analysis of trade receivables which are not
impaired is as follows:
As at March 31,
2008 2007
Up to 6 months 228.8 96.6
more than 6 months 18.0 10.9
246.8 107.5
As at March 31, 2008, trade receivables of US$31.0 (March 31, 2007: US$22.9) were impaired and provided for. The amount of
the provision was US$31.0 as at March 31, 2008 (March 31, 2007: US$22.9). Trade receivables are tested individually for
impairment. The ageing of these receivables is as follows:
As at March 31,
2008 2007
6 to 12 months 2.0 0.6
more than 12 months 29.0 22.3
31.0 22.9
The carrying amounts of the group’s trade receivables are denominated in the following currencies:
As at March 31,
2008 2007
US dollar 315.0 240.6
Other currencies 193.6 123.8
508.6 364.4
The creation and release of provision for impaired receivables have been included in ‘selling, general and administrative
expenses’ in the income statement.
Movements on the group provision for impairment of trade receivables are as follows:
Year ended March 31,
2008 2007
As at the beginning of the year 22.9 19.2
Provision for impairment 8.5 3.6
Provision no longer required on account of amounts recovered (2.3) (0.6)
Change due to foreign currency fluctuation 1.9 0.7
As at the closing of the year 31.0 22.9
(All amounts in ‘US$ in million’ except per share data and as otherwise stated)
Sat_AR08_Final_Jul22_TP 2 Col.pmd 7/23/2008, 7:19 PM153
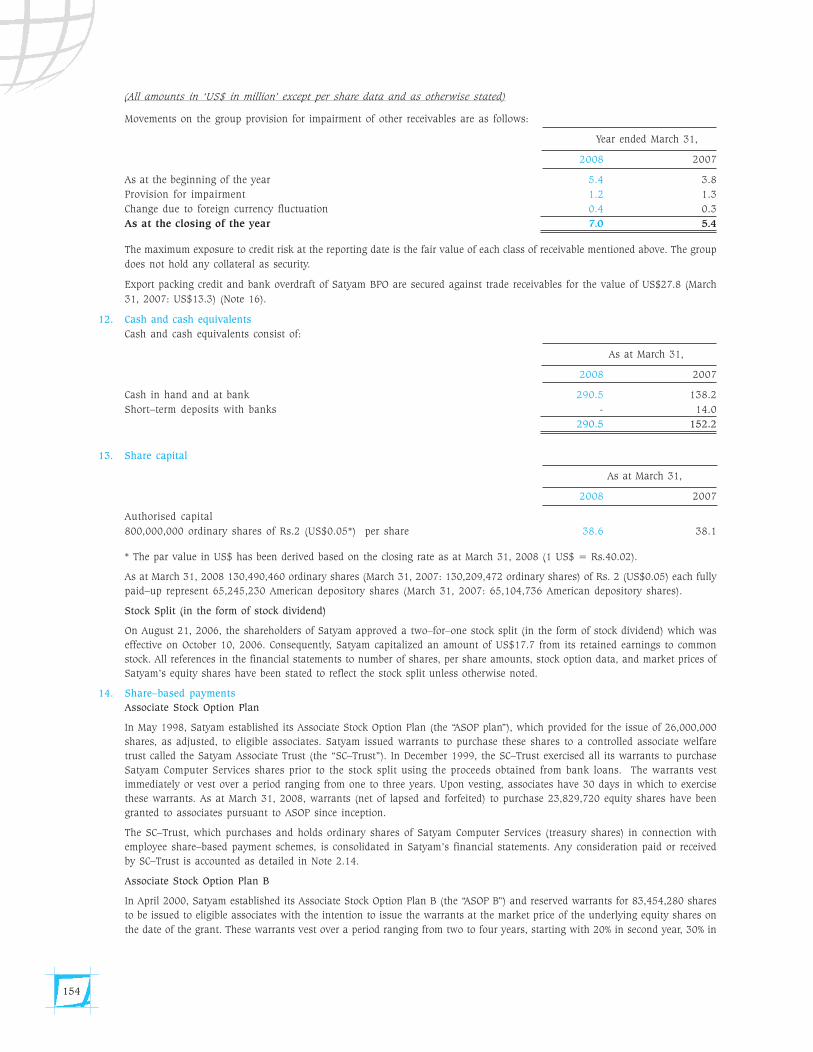
154
Movements on the group provision for impairment of other receivables are as follows:
Year ended March 31,
2008 2007
As at the beginning of the year 5.4 3.8
Provision for impairment 1.2 1.3
Change due to foreign currency fluctuation 0.4 0.3
As at the closing of the year 7.0 5.4
The maximum exposure to credit risk at the reporting date is the fair value of each class of receivable mentioned above. The group
does not hold any collateral as security.
Export packing credit and bank overdraft of Satyam BPO are secured against trade receivables for the value of US$27.8 (March
31, 2007: US$13.3) (Note 16).
12. Cash and cash equivalents
Cash and cash equivalents consist of:
As at March 31,
2008 2007
Cash in hand and at bank 290.5 138.2
Short–term deposits with banks - 14.0
290.5 152.2
13. Share capital
As at March 31,
2008 2007
Authorised capital
800,000,000 ordinary shares of Rs.2 (US$0.05*) per share 38.6 38.1
* The par value in US$ has been derived based on the closing rate as at March 31, 2008 (1 US$ = Rs.40.02).
As at March 31, 2008 130,490,460 ordinary shares (March 31, 2007: 130,209,472 ordinary shares) of Rs. 2 (US$0.05) each fully
paid–up represent 65,245,230 American depository shares (March 31, 2007: 65,104,736 American depository shares).
Stock Split (in the form of stock dividend)
On August 21, 2006, the shareholders of Satyam approved a two–for–one stock split (in the form of stock dividend) which was
effective on October 10, 2006. Consequently, Satyam capitalized an amount of US$17.7 from its retained earnings to common
stock. All references in the financial statements to number of shares, per share amounts, stock option data, and market prices of
Satyam’s equity shares have been stated to reflect the stock split unless otherwise noted.
14. Share–based payments
Associate Stock Option Plan
In May 1998, Satyam established its Associate Stock Option Plan (the “ASOP plan”), which provided for the issue of 26,000,000
shares, as adjusted, to eligible associates. Satyam issued warrants to purchase these shares to a controlled associate welfare
trust called the Satyam Associate Trust (the “SC–Trust”). In December 1999, the SC–Trust exercised all its warrants to purchase
Satyam Computer Services shares prior to the stock split using the proceeds obtained from bank loans. The warrants vest
immediately or vest over a period ranging from one to three years. Upon vesting, associates have 30 days in which to exercise
these warrants. As at March 31, 2008, warrants (net of lapsed and forfeited) to purchase 23,829,720 equity shares have been
granted to associates pursuant to ASOP since inception.
The SC–Trust, which purchases and holds ordinary shares of Satyam Computer Services (treasury shares) in connection with
employee share–based payment schemes, is consolidated in Satyam’s financial statements. Any consideration paid or received
by SC–Trust is accounted as detailed in Note 2.14.
Associate Stock Option Plan B
In April 2000, Satyam established its Associate Stock Option Plan B (the “ASOP B”) and reserved warrants for 83,454,280 shares
to be issued to eligible associates with the intention to issue the warrants at the market price of the underlying equity shares on
the date of the grant. These warrants vest over a period ranging from two to four years, starting with 20% in second year, 30% in
(All amounts in ‘US$ in million’ except per share data and as otherwise stated)
Sat_AR08_Final_Jul22_TP 2 Col.pmd 7/23/2008, 7:19 PM154
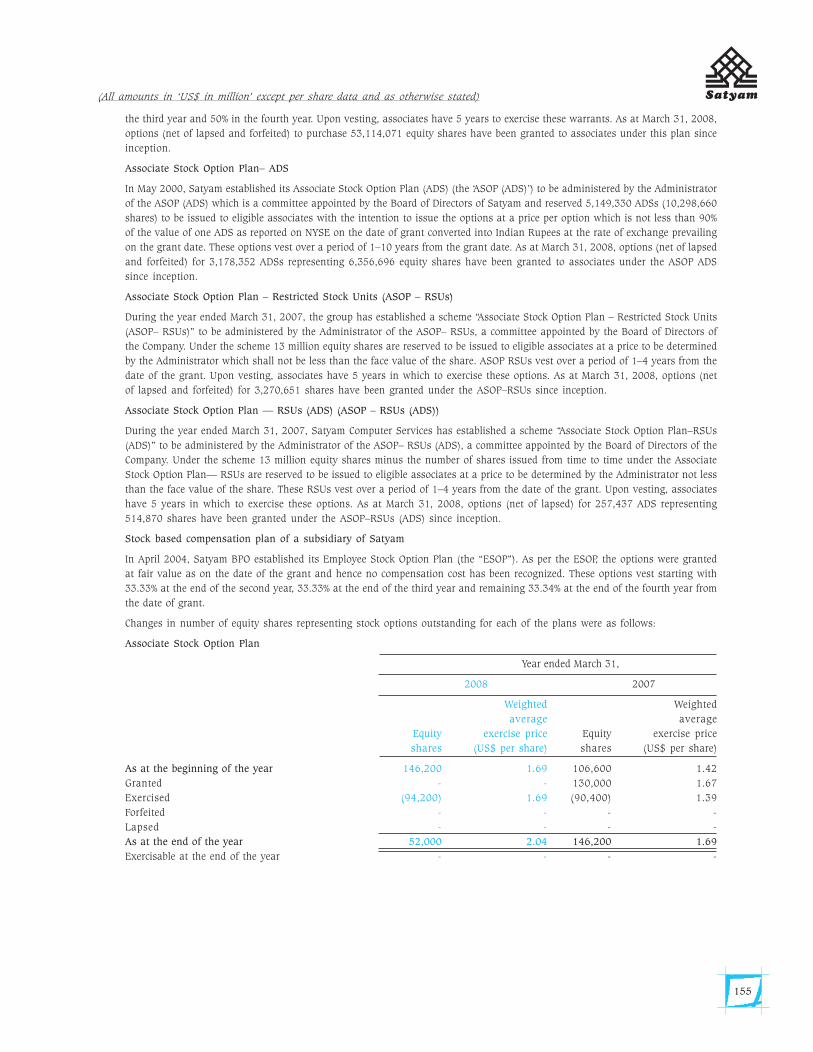
155
the third year and 50% in the fourth year. Upon vesting, associates have 5 years to exercise these warrants. As at March 31, 2008,
options (net of lapsed and forfeited) to purchase 53,114,071 equity shares have been granted to associates under this plan since
inception.
Associate Stock Option Plan– ADS
In May 2000, Satyam established its Associate Stock Option Plan (ADS) (the ‘ASOP (ADS)’) to be administered by the Administrator
of the ASOP (ADS) which is a committee appointed by the Board of Directors of Satyam and reserved 5,149,330 ADSs (10,298,660
shares) to be issued to eligible associates with the intention to issue the options at a price per option which is not less than 90%
of the value of one ADS as reported on NYSE on the date of grant converted into Indian Rupees at the rate of exchange prevailing
on the grant date. These options vest over a period of 1–10 years from the grant date. As at March 31, 2008, options (net of lapsed
and forfeited) for 3,178,352 ADSs representing 6,356,696 equity shares have been granted to associates under the ASOP ADS
since inception.
Associate Stock Option Plan – Restricted Stock Units (ASOP – RSUs)
During the year ended March 31, 2007, the group has established a scheme “Associate Stock Option Plan – Restricted Stock Units
(ASOP– RSUs)” to be administered by the Administrator of the ASOP– RSUs, a committee appointed by the Board of Directors of
the Company. Under the scheme 13 million equity shares are reserved to be issued to eligible associates at a price to be determined
by the Administrator which shall not be less than the face value of the share. ASOP RSUs vest over a period of 1–4 years from the
date of the grant. Upon vesting, associates have 5 years in which to exercise these options. As at March 31, 2008, options (net
of lapsed and forfeited) for 3,270,651 shares have been granted under the ASOP–RSUs since inception.
Associate Stock Option Plan — RSUs (ADS) (ASOP – RSUs (ADS))
During the year ended March 31, 2007, Satyam Computer Services has established a scheme “Associate Stock Option Plan–RSUs
(ADS)” to be administered by the Administrator of the ASOP– RSUs (ADS), a committee appointed by the Board of Directors of the
Company. Under the scheme 13 million equity shares minus the number of shares issued from time to time under the Associate
Stock Option Plan— RSUs are reserved to be issued to eligible associates at a price to be determined by the Administrator not less
than the face value of the share. These RSUs vest over a period of 1–4 years from the date of the grant. Upon vesting, associates
have 5 years in which to exercise these options. As at March 31, 2008, options (net of lapsed) for 257,437 ADS representing
514,870 shares have been granted under the ASOP–RSUs (ADS) since inception.
Stock based compensation plan of a subsidiary of Satyam
In April 2004, Satyam BPO established its Employee Stock Option Plan (the “ESOP”). As per the ESOP, the options were granted
at fair value as on the date of the grant and hence no compensation cost has been recognized. These options vest starting with
33.33% at the end of the second year, 33.33% at the end of the third year and remaining 33.34% at the end of the fourth year from
the date of grant.
Changes in number of equity shares representing stock options outstanding for each of the plans were as follows:
Associate Stock Option Plan
Year ended March 31,
2008 2007
Weighted Weighted
average average
Equity exercise price Equity exercise price
shares (US$ per share) shares (US$ per share)
As at the beginning of the year 146,200 1.69 106,600 1.42
Granted - - 130,000 1.67
Exercised (94,200) 1.69 (90,400) 1.39
Forfeited - - - -
Lapsed - - - -
As at the end of the year 52,000 2.04 146,200 1.69
Exercisable at the end of the year - - - -
(All amounts in ‘US$ in million’ except per share data and as otherwise stated)
Sat_AR08_Final_Jul22_TP 2 Col.pmd 7/23/2008, 7:19 PM155
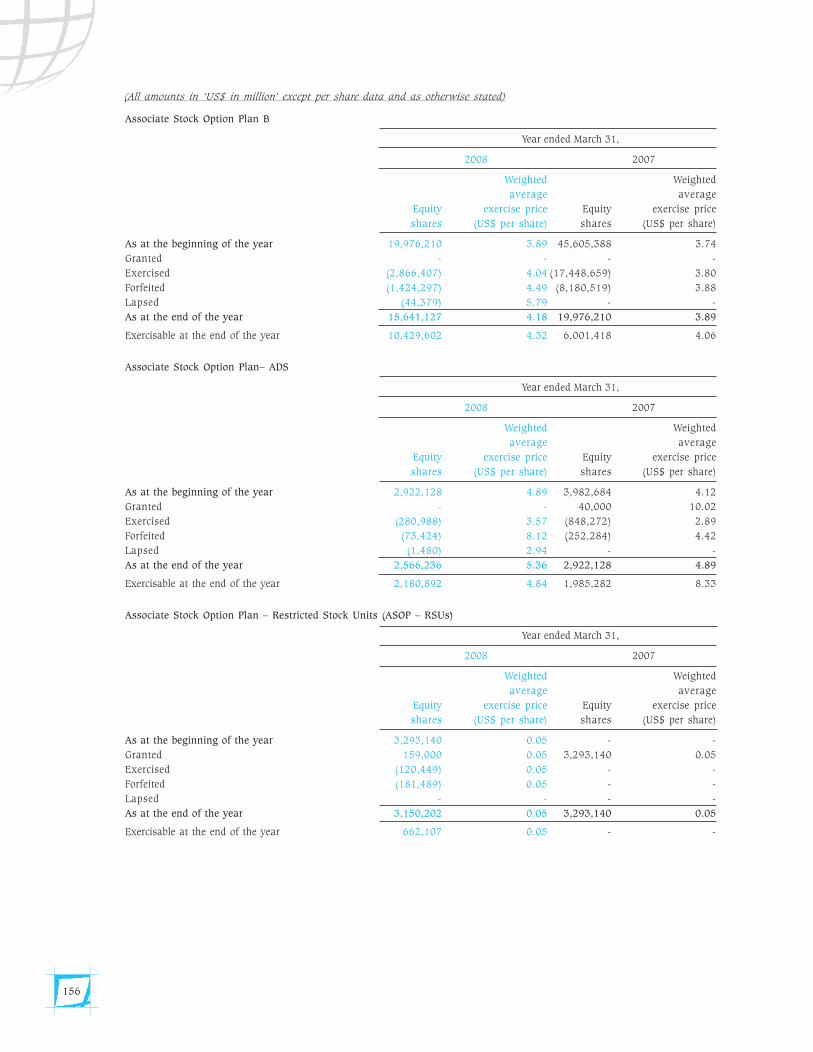
156
Associate Stock Option Plan B
Year ended March 31,
2008 2007
Weighted Weighted
average average
Equity exercise price Equity exercise price
shares (US$ per share) shares (US$ per share)
As at the beginning of the year 19,976,210 3.89 45,605,388 3.74
Granted - - - -
Exercised (2,866,407) 4.04 (17,448,659) 3.80
Forfeited (1,424,297) 4.49 (8,180,519) 3.88
Lapsed (44,379) 5.79 - -
As at the end of the year 15,641,127 4.18 19,976,210 3.89
Exercisable at the end of the year 10,429,602 4.32 6,001,418 4.06
Associate Stock Option Plan– ADS
Year ended March 31,
2008 2007
Weighted Weighted
average average
Equity exercise price Equity exercise price
shares (US$ per share) shares (US$ per share)
As at the beginning of the year 2,922,128 4.89 3,982,684 4.12
Granted - - 40,000 10.02
Exercised (280,988) 3.57 (848,272) 2.89
Forfeited (73,424) 8.12 (252,284) 4.42
Lapsed (1,480) 2.94 - -
As at the end of the year 2,566,236 5.36 2,922,128 4.89
Exercisable at the end of the year 2,180,892 4.84 1,985,282 8.33
Associate Stock Option Plan – Restricted Stock Units (ASOP – RSUs)
Year ended March 31,
2008 2007
Weighted Weighted
average average
Equity exercise price Equity exercise price
shares (US$ per share) shares (US$ per share)
As at the beginning of the year 3,293,140 0.05 - -
Granted 159,000 0.05 3,293,140 0.05
Exercised (120,449) 0.05 - -
Forfeited (181,489) 0.05 - -
Lapsed - - - -
As at the end of the year 3,150,202 0.05 3,293,140 0.05
Exercisable at the end of the year 662,107 0.05 - -
(All amounts in ‘US$ in million’ except per share data and as otherwise stated)
Sat_AR08_Final_Jul22_TP 2 Col.pmd 7/23/2008, 7:19 PM156
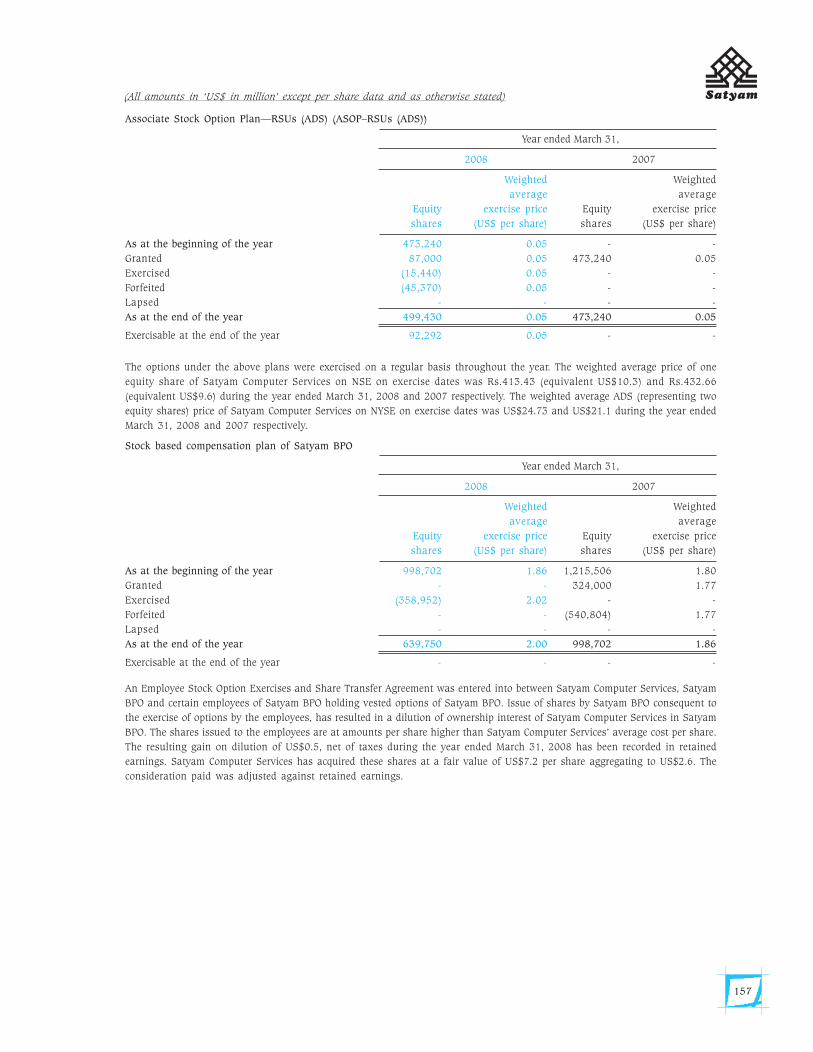
157
Associate Stock Option Plan—RSUs (ADS) (ASOP–RSUs (ADS))
Year ended March 31,
2008 2007
Weighted Weighted
average average
Equity exercise price Equity exercise price
shares (US$ per share) shares (US$ per share)
As at the beginning of the year 473,240 0.05 - -
Granted 87,000 0.05 473,240 0.05
Exercised (15,440) 0.05 - -
Forfeited (45,370) 0.05 - -
Lapsed - - - -
As at the end of the year 499,430 0.05 473,240 0.05
Exercisable at the end of the year 92,292 0.05 - -
The options under the above plans were exercised on a regular basis throughout the year. The weighted average price of one
equity share of Satyam Computer Services on NSE on exercise dates was Rs.413.43 (equivalent US$10.3) and Rs.432.66
(equivalent US$9.6) during the year ended March 31, 2008 and 2007 respectively. The weighted average ADS (representing two
equity shares) price of Satyam Computer Services on NYSE on exercise dates was US$24.73 and US$21.1 during the year ended
March 31, 2008 and 2007 respectively.
Stock based compensation plan of Satyam BPO
Year ended March 31,
2008 2007
Weighted Weighted
average average
Equity exercise price Equity exercise price
shares (US$ per share) shares (US$ per share)
As at the beginning of the year 998,702 1.86 1,215,506 1.80
Granted - - 324,000 1.77
Exercised (358,952) 2.02 - -
Forfeited - - (540,804) 1.77
Lapsed - - - -
As at the end of the year 639,750 2.00 998,702 1.86
Exercisable at the end of the year - - - -
An Employee Stock Option Exercises and Share Transfer Agreement was entered into between Satyam Computer Services, Satyam
BPO and certain employees of Satyam BPO holding vested options of Satyam BPO. Issue of shares by Satyam BPO consequent to
the exercise of options by the employees, has resulted in a dilution of ownership interest of Satyam Computer Services in Satyam
BPO. The shares issued to the employees are at amounts per share higher than Satyam Computer Services’ average cost per share.
The resulting gain on dilution of US$0.5, net of taxes during the year ended March 31, 2008 has been recorded in retained
earnings. Satyam Computer Services has acquired these shares at a fair value of US$7.2 per share aggregating to US$2.6. The
consideration paid was adjusted against retained earnings.
(All amounts in ‘US$ in million’ except per share data and as otherwise stated)
Sat_AR08_Final_Jul22_TP 2 Col.pmd 7/23/2008, 7:19 PM157
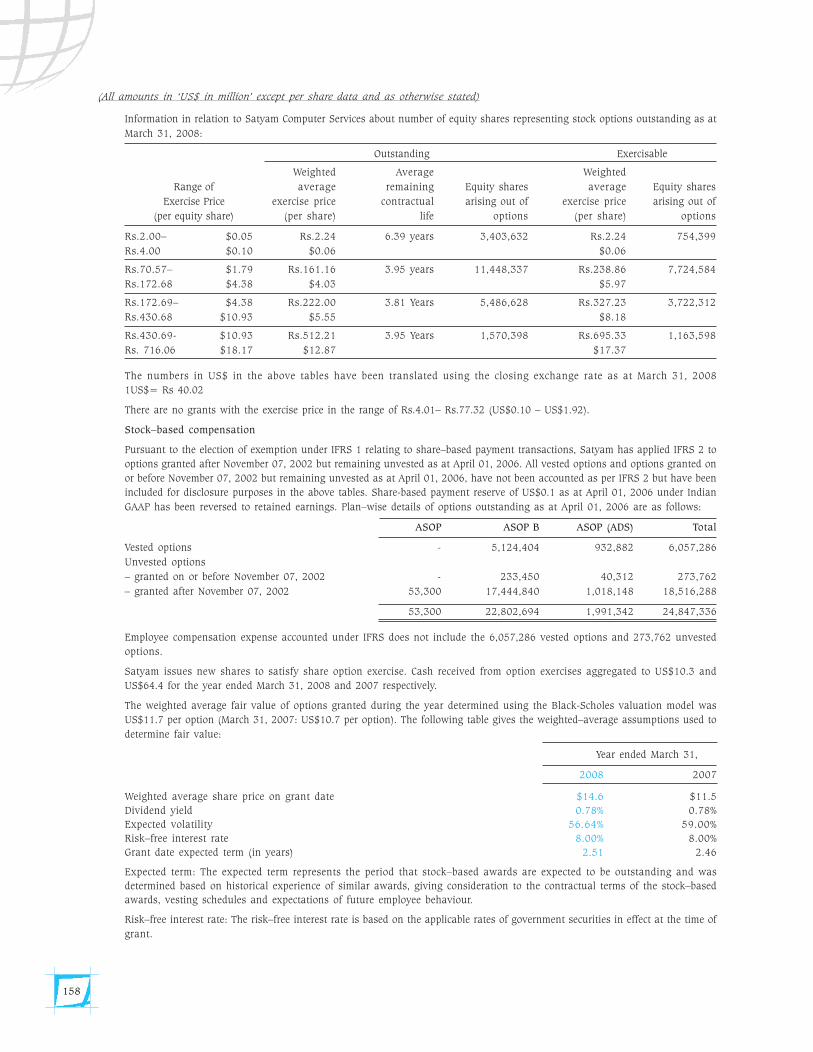
158
Information in relation to Satyam Computer Services about number of equity shares representing stock options outstanding as at
March 31, 2008:
Outstanding Exercisable
Weighted Average Weighted
Range of average remaining Equity shares average Equity shares
Exercise Price exercise price contractual arising out of exercise price arising out of
(per equity share) (per share) life options (per share) options
Rs.2.00– $0.05 Rs.2.24 6.39 years 3,403,632 Rs.2.24 754,399
Rs.4.00 $0.10 $0.06 $0.06
Rs.70.57– $1.79 Rs.161.16 3.95 years 11,448,337 Rs.238.86 7,724,584
Rs.172.68 $4.38 $4.03 $5.97
Rs.172.69– $4.38 Rs.222.00 3.81 Years 5,486,628 Rs.327.23 3,722,312
Rs.430.68 $10.93 $5.55 $8.18
Rs.430.69- $10.93 Rs.512.21 3.95 Years 1,570,398 Rs.695.33 1,163,598
Rs. 716.06 $18.17 $12.87 $17.37
The numbers in US$ in the above tables have been translated using the closing exchange rate as at March 31, 2008
1US$= Rs 40.02
There are no grants with the exercise price in the range of Rs.4.01– Rs.77.32 (US$0.10 – US$1.92).
Stock–based compensation
Pursuant to the election of exemption under IFRS 1 relating to share–based payment transactions, Satyam has applied IFRS 2 to
options granted after November 07, 2002 but remaining unvested as at April 01, 2006. All vested options and options granted on
or before November 07, 2002 but remaining unvested as at April 01, 2006, have not been accounted as per IFRS 2 but have been
included for disclosure purposes in the above tables. Share-based payment reserve of US$0.1 as at April 01, 2006 under Indian
GAAP has been reversed to retained earnings. Plan–wise details of options outstanding as at April 01, 2006 are as follows:
ASOP ASOP B ASOP (ADS) Total
Vested options - 5,124,404 932,882 6,057,286
Unvested options
– granted on or before November 07, 2002 - 233,450 40,312 273,762
– granted after November 07, 2002 53,300 17,444,840 1,018,148 18,516,288
53,300 22,802,694 1,991,342 24,847,336
Employee compensation expense accounted under IFRS does not include the 6,057,286 vested options and 273,762 unvested
options.
Satyam issues new shares to satisfy share option exercise. Cash received from option exercises aggregated to US$10.3 and
US$64.4 for the year ended March 31, 2008 and 2007 respectively.
The weighted average fair value of options granted during the year determined using the Black-Scholes valuation model was
US$11.7 per option (March 31, 2007: US$10.7 per option). The following table gives the weighted–average assumptions used to
determine fair value:
Year ended March 31,
2008 2007
Weighted average share price on grant date $14.6 $11.5
Dividend yield 0.78% 0.78%
Expected volatility 56.64% 59.00%
Risk–free interest rate 8.00% 8.00%
Grant date expected term (in years) 2.51 2.46
Expected term: The expected term represents the period that stock–based awards are expected to be outstanding and was
determined based on historical experience of similar awards, giving consideration to the contractual terms of the stock–based
awards, vesting schedules and expectations of future employee behaviour.
Risk–free interest rate: The risk–free interest rate is based on the applicable rates of government securities in effect at the time of
grant.
(All amounts in ‘US$ in million’ except per share data and as otherwise stated)
Sat_AR08_Final_Jul22_TP 2 Col.pmd 7/23/2008, 7:19 PM158
159
Expected volatility: The fair values of stock–based payments were valued using a volatility factor based on the historical stock
prices of Satyam Computer Services.
Expected dividend: The Black–Scholes option–pricing model calls for a single expected dividend yield as an input.
Estimated pre–vesting forfeitures: When estimating forfeitures, Satyam Computer Services considers voluntary termination
behaviour. Estimated forfeiture rates are trued–up to actual forfeiture results as the stock–based awards vest.
15. Preference shares issued by Satyam BPO
Satyam BPO issued 45,669,999 and 45,340,000 0.05% convertible redeemable cumulative preference shares of par value Rs.10
(US$0.23) per share in October 2003 and June 2004 respectively to Olympus BPO Holdings Limited and Intel Capital Corporation
(“the investors”) at an issue price of Rs.10 (US$0.23) per share, in exchange for an aggregate consideration of US$20.
As per the agreement, these preference shares were mandatorily convertible into equity shares of Satyam BPO no later than June
2006, if Satyam BPO achieved certain targets for revenues and profits earned up to March 31, 2006. If these targeted revenues and
profits were not achieved by Satyam BPO along with other triggering events, the investors had an option to either redeem these
preference shares or convert them. Although certain triggering events for early redemption as per the agreement occurred during
the period January 2004 to December 2004, the investors waived the right of early redemption. Further Satyam BPO did not
achieve the targeted revenues and profit up to March 2006. If not converted, early converted or early redeemed, these convertible
preference shares were redeemable on maturity in June 2007 at a redemption premium, which could range between 7.5% and
13.5% per annum. Satyam had guaranteed the payment of all sums payable by Satyam BPO to the investors on redemption of the
said preference shares.
The Investors were entitled to receive cumulative dividends at the rate of 0.05% per cent per annum, on the face value of Rs.10
(US$0.23) from the date of issuance of such preference shares. The preference shares were classified under Indian GAAP as equity
in accordance with the local regulation. The carrying amount of these preference shares as at the date of transition was US$20.
However, under IFRS, these preference shares have been classified as financial liability. The early redemption feature and the
conversion feature represent embedded derivatives that qualify for separation from the host instrument under IAS 39. Satyam
elected to use the optional exemption provided by IFRS 1 and designated the preference shares at fair value through profit or loss
as at the date of transition to IFRSs. The fair value as at the said date was US$33.9. The difference of US$13.9 between the carrying
value and the fair value, was adjusted to retained earnings. Further, the amount Satyam would be contractually required to pay
if it were to be fully redeemed at maturity would have been US$25.2.
On November 20, 2006, a Share Purchase, Redemption and Amendment Agreement (“SPRA Agreement”) was entered into
between Satyam, the investors and Satyam BPO. Out of the total preference shares, fifty percent of the preference shares would be
redeemed for US$13.6 at the target date on May 21, 2007 and the remaining fifty percent would get converted into equity shares
of Satyam BPO based on the terms of the existing subscription agreement. Accordingly, Satyam BPO received a notice of
conversion of fifty percent of preference shares into equity shares, from the investors, on December 01, 2006. The preference
shares were fair valued at US$37.1 as at December 01, 2006 with the difference of US$3.2 between the fair value and the carrying
value recognised, in profit or loss. There has been no change in the fair value of the preference shares that is attributable to
changes in the credit risk, determined as the amount of change in its fair value that is not attributable to changes in market
conditions that give rise to market risk. Satyam accounted for a gain of US$4.9 on December 01, 2006, being the difference
between fifty percent of the fair value of the preference shares and the agreed redemption price in the income statement.
In January 2007, 45,505,000 preference shares were converted into 6,422,267 equity shares of Satyam BPO. The amount
recognised as minority interest is equal to fifty percent of the fair value of the preference shares as at December 01, 2006.
Consequently, there was a dilution of stake of Satyam in Satyam BPO and a dilution gain, net of taxes, of US$14.4 was recognised
in equity by way of a transfer between minority interest and retained earnings.
Further as per the SPRA Agreement, Satyam Computer Services agreed to purchase and the investors agreed to sell the said equity
shares at an aggregate purchase price based on a formula. If the share purchase closing occurs on or before the share purchase
target date (May 21, 2007) then the purchase price would range from a minimum of US$35.0 to maximum of US$45.0 and if an
acceleration event occurs, the purchase price would equal US$45.0. If the share purchase closing occurs after the share purchase
target date then the purchase price shall not be less than US$35.0 and if an acceleration event occurs, the purchase price shall not
be less than US$45.0. This was subject to fulfilment of terms and conditions specified in the agreement. As at March 31, 2007 an
acceleration event occurred. The forward contract was not accounted as at March 31, 2007, since per regulatory requirements the
transaction can take place only at fair value and regulatory approvals that were substantial to the proposed acquisition were not
obtained on the said date.
During the year ended March 31, 2008, Satyam Computer Services obtained the necessary approvals and a forward liability was
recorded at US$46.5 with a corresponding adjustment to retained earnings. The additional consideration was on account of delay
in transaction closing beyond the target date. The consideration paid to the investors was adjusted against the forward liability.
(All amounts in ‘US$ in million’ except per share data and as otherwise stated)
Sat_AR08_Final_Jul22_TP 2 Col.pmd 7/23/2008, 7:19 PM159
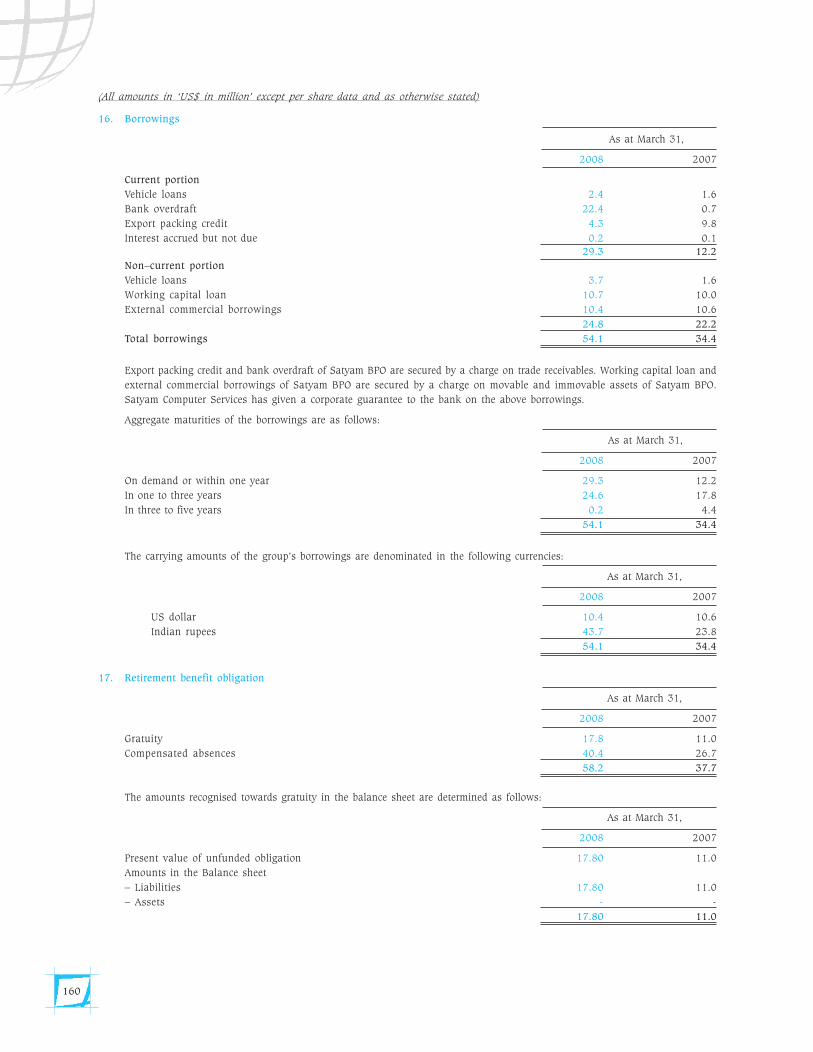
160
16. Borrowings
As at March 31,
2008 2007
Current portion
Vehicle loans 2.4 1.6
Bank overdraft 22.4 0.7
Export packing credit 4.3 9.8
Interest accrued but not due 0.2 0.1
29.3 12.2
Non–current portion
Vehicle loans 3.7 1.6
Working capital loan 10.7 10.0
External commercial borrowings 10.4 10.6
24.8 22.2
Total borrowings 54.1 34.4
Export packing credit and bank overdraft of Satyam BPO are secured by a charge on trade receivables. Working capital loan and
external commercial borrowings of Satyam BPO are secured by a charge on movable and immovable assets of Satyam BPO.
Satyam Computer Services has given a corporate guarantee to the bank on the above borrowings.
Aggregate maturities of the borrowings are as follows:
As at March 31,
2008 2007
On demand or within one year 29.3 12.2
In one to three years 24.6 17.8
In three to five years 0.2 4.4
54.1 34.4
The carrying amounts of the group’s borrowings are denominated in the following currencies:
As at March 31,
2008 2007
US dollar 10.4 10.6
Indian rupees 43.7 23.8
54.1 34.4
17. Retirement benefit obligation
As at March 31,
2008 2007
Gratuity 17.8 11.0
Compensated absences 40.4 26.7
58.2 37.7
The amounts recognised towards gratuity in the balance sheet are determined as follows:
As at March 31,
2008 2007
Present value of unfunded obligation 17.80 11.0
Amounts in the Balance sheet
– Liabilities 17.80 11.0
– Assets - -
17.80 11.0
(All amounts in ‘US$ in million’ except per share data and as otherwise stated)
Sat_AR08_Final_Jul22_TP 2 Col.pmd 7/23/2008, 7:19 PM160
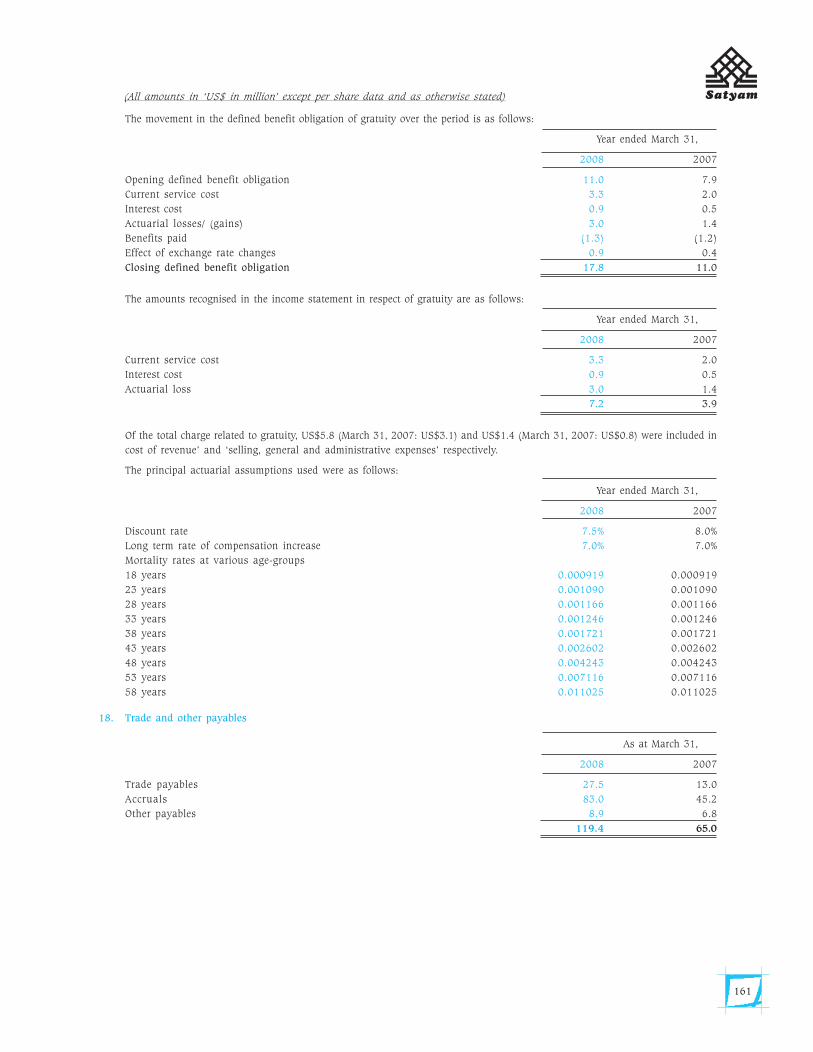
161
The movement in the defined benefit obligation of gratuity over the period is as follows:
Year ended March 31,
2008 2007
Opening defined benefit obligation 11.0 7.9
Current service cost 3.3 2.0
Interest cost 0.9 0.5
Actuarial losses/ (gains) 3.0 1.4
Benefits paid (1.3) (1.2)
Effect of exchange rate changes 0.9 0.4
Closing defined benefit obligation 17.8 11.0
The amounts recognised in the income statement in respect of gratuity are as follows:
Year ended March 31,
2008 2007
Current service cost 3.3 2.0
Interest cost 0.9 0.5
Actuarial loss 3.0 1.4
7.2 3.9
Of the total charge related to gratuity, US$5.8 (March 31, 2007: US$3.1) and US$1.4 (March 31, 2007: US$0.8) were included in
cost of revenue’ and ‘selling, general and administrative expenses’ respectively.
The principal actuarial assumptions used were as follows:
Year ended March 31,
2008 2007
Discount rate 7.5% 8.0%
Long term rate of compensation increase 7.0% 7.0%
Mortality rates at various age-groups
18 years 0.000919 0.000919
23 years 0.001090 0.001090
28 years 0.001166 0.001166
33 years 0.001246 0.001246
38 years 0.001721 0.001721
43 years 0.002602 0.002602
48 years 0.004243 0.004243
53 years 0.007116 0.007116
58 years 0.011025 0.011025
18. Trade and other payables
As at March 31,
2008 2007
Trade payables 27.5 13.0
Accruals 83.0 45.2
Other payables 8.9 6.8
119.4 65.0
(All amounts in ‘US$ in million’ except per share data and as otherwise stated)
Sat_AR08_Final_Jul22_TP 2 Col.pmd 7/23/2008, 7:19 PM161
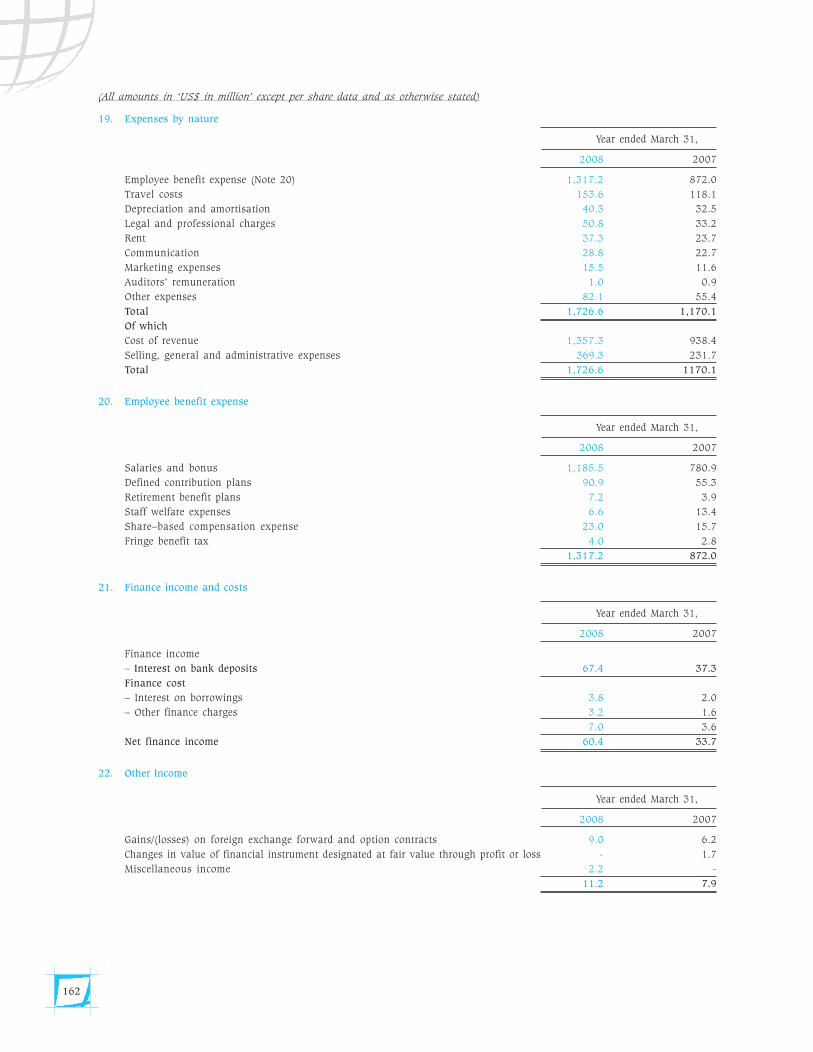
162
19. Expenses by nature
Year ended March 31,
2008 2007
Employee benefit expense (Note 20) 1,317.2 872.0
Travel costs 153.6 118.1
Depreciation and amortisation 40.3 32.5
Legal and professional charges 50.8 33.2
Rent 37.3 23.7
Communication 28.8 22.7
Marketing expenses 15.5 11.6
Auditors’ remuneration 1.0 0.9
Other expenses 82.1 55.4
Total 1,726.6 1,170.1
Of which
Cost of revenue 1,357.3 938.4
Selling, general and administrative expenses 369.3 231.7
Total 1,726.6 1170.1
20. Employee benefit expense
Year ended March 31,
2008 2007
Salaries and bonus 1,185.5 780.9
Defined contribution plans 90.9 55.3
Retirement benefit plans 7.2 3.9
Staff welfare expenses 6.6 13.4
Share–based compensation expense 23.0 15.7
Fringe benefit tax 4.0 2.8
1,317.2 872.0
21. Finance income and costs
Year ended March 31,
2008 2007
Finance income
– Interest on bank deposits 67.4 37.3
Finance cost
– Interest on borrowings 3.8 2.0
– Other finance charges 3.2 1.6
7.0 3.6
Net finance income 60.4 33.7
22. Other Income
Year ended March 31,
2008 2007
Gains/(losses) on foreign exchange forward and option contracts 9.0 6.2
Changes in value of financial instrument designated at fair value through profit or loss - 1.7
Miscellaneous income 2.2 -
11.2 7.9
(All amounts in ‘US$ in million’ except per share data and as otherwise stated)
Sat_AR08_Final_Jul22_TP 2 Col.pmd 7/23/2008, 7:19 PM162
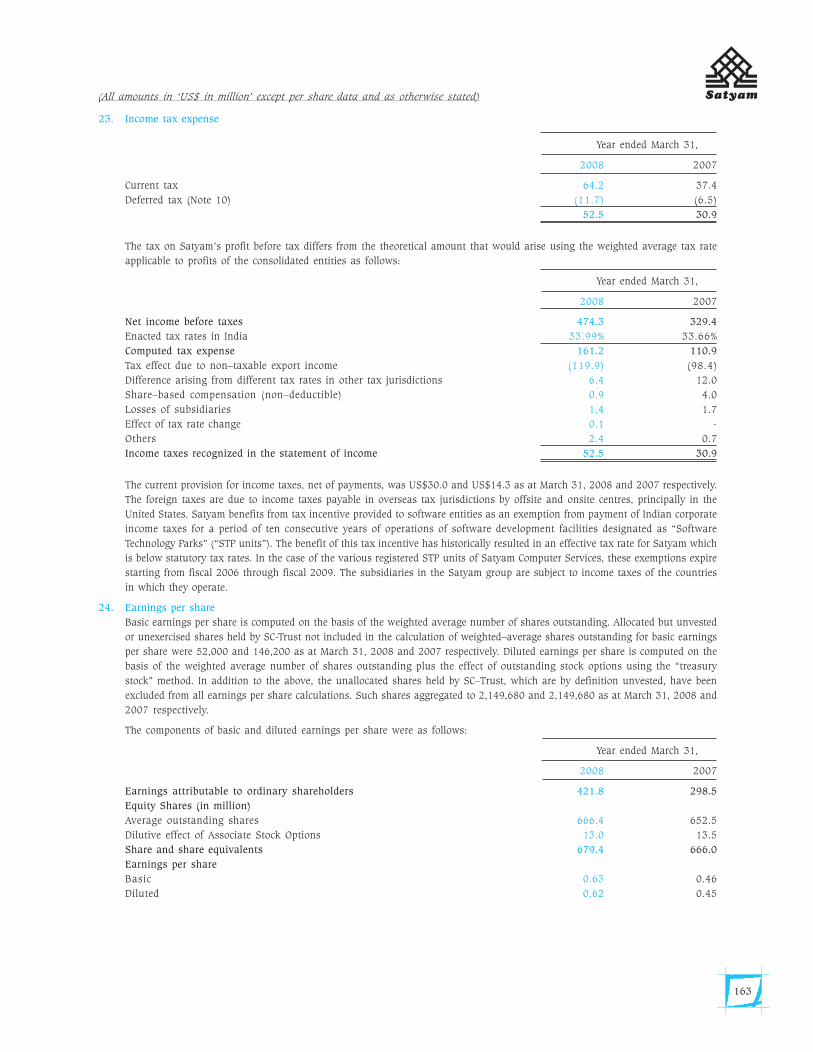
163
23. Income tax expense
Year ended March 31,
2008 2007
Current tax 64.2 37.4
Deferred tax (Note 10) (11.7) (6.5)
52.5 30.9
The tax on Satyam’s profit before tax differs from the theoretical amount that would arise using the weighted average tax rate
applicable to profits of the consolidated entities as follows:
Year ended March 31,
2008 2007
Net income before taxes 474.3 329.4
Enacted tax rates in India 33.99% 33.66%
Computed tax expense 161.2 110.9
Tax effect due to non–taxable export income (119.9) (98.4)
Difference arising from different tax rates in other tax jurisdictions 6.4 12.0
Share–based compensation (non–deductible) 0.9 4.0
Losses of subsidiaries 1.4 1.7
Effect of tax rate change 0.1 -
Others 2.4 0.7
Income taxes recognized in the statement of income 52.5 30.9
The current provision for income taxes, net of payments, was US$30.0 and US$14.3 as at March 31, 2008 and 2007 respectively.
The foreign taxes are due to income taxes payable in overseas tax jurisdictions by offsite and onsite centres, principally in the
United States. Satyam benefits from tax incentive provided to software entities as an exemption from payment of Indian corporate
income taxes for a period of ten consecutive years of operations of software development facilities designated as “Software
Technology Parks” (“STP units”). The benefit of this tax incentive has historically resulted in an effective tax rate for Satyam which
is below statutory tax rates. In the case of the various registered STP units of Satyam Computer Services, these exemptions expire
starting from fiscal 2006 through fiscal 2009. The subsidiaries in the Satyam group are subject to income taxes of the countries
in which they operate.
24. Earnings per share
Basic earnings per share is computed on the basis of the weighted average number of shares outstanding. Allocated but unvested
or unexercised shares held by SC-Trust not included in the calculation of weighted–average shares outstanding for basic earnings
per share were 52,000 and 146,200 as at March 31, 2008 and 2007 respectively. Diluted earnings per share is computed on the
basis of the weighted average number of shares outstanding plus the effect of outstanding stock options using the “treasury
stock” method. In addition to the above, the unallocated shares held by SC–Trust, which are by definition unvested, have been
excluded from all earnings per share calculations. Such shares aggregated to 2,149,680 and 2,149,680 as at March 31, 2008 and
2007 respectively.
The components of basic and diluted earnings per share were as follows:
Year ended March 31,
2008 2007
Earnings attributable to ordinary shareholders 421.8 298.5
Equity Shares (in million)
Average outstanding shares 666.4 652.5
Dilutive effect of Associate Stock Options 13.0 13.5
Share and share equivalents 679.4 666.0
Earnings per share
Basic 0.63 0.46
Diluted 0.62 0.45
(All amounts in ‘US$ in million’ except per share data and as otherwise stated)
Sat_AR08_Final_Jul22_TP 2 Col.pmd 7/23/2008, 7:19 PM163
164
25. Dividend distribution
The directors are proposing a final dividend in respect of the year ended March 31, 2008 of US$0.06 (Rs.2.50) per share, which
would reduce shareholders’ funds by US$49.4. The proposed dividend is subject to approval of the shareholders at the Annual
General Meeting and has not been recognised as a liability in these financial statements.
Cash dividend aggregating to US$68.3 and US$56.7 was paid to equity shareholders during the year ended March 31, 2008 and
2007 respectively.
Dividends payable to equity shareholders are based on the net income available for distribution as reported in the stand–alone
financial statements of Satyam prepared in accordance with Indian GAAP. As such, dividends are declared and paid in Indian
Rupees. The net income in accordance with IFRS may, in certain years, either not be fully available or will be additionally
available for distribution to equity shareholders. Under Indian GAAP, the retained earnings available for distribution to equity
shareholders was US$1,505.8 and US$1,062.6 as at March 31, 2008 and 2007 respectively.
Under the Companies Act, 1956 of India dividends may be paid out of the profits of a company in the year in which the dividend
is declared or out of the undistributed profits of previous fiscal years. Before declaring a dividend greater than 10.0% of the par
value of its equity shares, a company is required to transfer to its reserves a minimum percentage of its profits for that year,
ranging from 2.5% to 10.0%, depending on the dividend percentage to be declared in such year.
26. Commitments and contingencies
a) Operating lease commitments – Satyam as lessee
Satyam has certain operating leases for land, office premises and guesthouses. Rental expense aggregated to US$37.3 and
US$23.7 for the years ended March 31, 2008 and 2007 respectively.
Future minimum annual lease commitments for non–cancellable lease arrangements, including those leases for which
renewal options may be exercised, are as below.
As at March 31,
2008 2007
Not later than 1 year 17.5 4.6
Later than 1 year and not later than 5 years 68.3 4.0
Later than 5 years 13.3 0.3
99.1 8.9
b) Capital commitments
Contractual commitments for capital expenditure pending execution were US$101.0 and US$38.2 as at March 31, 2008 and
2007 respectively. Contractual commitments for capital expenditures are relating to acquisition of premises and equipment.
c) Funding and Warrant commitments – Satyam BPO
Satyam Computer Services has guaranteed payment of all sums payable by Satyam BPO to the Investors on redemption of
the 0.05% cumulative convertible redeemable preference shares. Satyam Computer Services, Satyam BPO and the Investors
had also entered into a warrant agreement whereby Satyam BPO agreed to issue to the Investors, one warrant in consideration
of and based upon every US$0.1 referral revenues received by Satyam BPO or its subsidiaries. As at March 31, 2007, there
were no referral revenues and hence no warrants have been issued.
d) Bank guarantees
Bank guarantees outstanding are US$26.0 and US$23.1 as at March 31, 2008 and 2007 respectively. Bank guarantees are
generally provided to government agencies, excise and customs authorities for the purposes of maintaining a bonded
warehouse. These guarantees may be revoked by the governmental agencies if they suffer any losses or damage through the
breach of any of the covenants contained in the agreements.
e) Claims against venturers – Venture Global Engineering LLC, USA
Satyam Computer Services entered into a joint venture agreement with Venture Global Engineering LLC (“VGE”) to form
Satyam Venture Engineering Services Pvt. Ltd (“SVES”) in India. As a result of VGE’s breach of the agreement between the
parties, Satyam Computer Services filed a request for arbitration, naming VGE as respondent, with the London Court of
International Arbitration (“LCIA”), seeking, among other things, to purchase VGE’s 50% interest in SVES at the agreed upon
book value price of the shares. The LCIA Arbitrator issued an Award on April 3, 2006 in favour of Satyam Computer
Services which it successfully enforced in the United States District Court in Michigan. During the enforcement proceedings
in the US, VGE filed a petition challenging the Award before the District Court, Secunderabad and made an appeal to the High
(All amounts in ‘US$ in million’ except per share data and as otherwise stated)
Sat_AR08_Final_Jul22_TP 2 Col.pmd 7/23/2008, 7:19 PM164
165
Court of Andhra Pradesh, both of which were rejected. Subsequently, in a special leave petition filed by VGE, the Supreme
Court of India set aside the orders of the District Court and the High Court and granted an interim stay of the share transfer
portion of the Award. The matter has been remanded back to the District Court, Secunderabad for trial on merits. Satyam
believes that this will not have an adverse effect on results of operations, financial condition and cash flows.
27. Related party transactions
a) Transactions involving services
Year ended March 31,
2008 2007
Infrastructure and other services provided by Satyam to
Satyam Venture 0.3 0.5
CA Satyam 0.1 -
0.4 0.5
Infrastructure and other services received by Satyam from
Satyam Venture 6.7 8.6
CA Satyam 2.7 0.2
9.4 8.8
b) Key management compensation
Year ended March 31,
2008 2007
Salaries and other short-term employee benefits 5.5 4.7
Termination benefits - 0.1
Post-employment benefits - -
Other long-term benefits - 0.1
Share-based payments 2.7 1.7
8.2 6.6
c) Year-end balances arising from transactions involving services
As at March 31,
2008 2007
Satyam Venture (1.8) (2.6)
CA Satyam - -
(1.8) (2.6)
d) Loans and advances to key management personnel
Year ended March 31,
2008 2007
At the beginning of the year 0.1 0.1
Advances during the year 0.1 0.3
Repayments during the year (0.2) (0.3)
At the end of the year - 0.1
Advances to the key management personnel are interest free advances. No provision has been required for such loans.
(All amounts in ‘US$ in million’ except per share data and as otherwise stated)
Sat_AR08_Final_Jul22_TP 2 Col.pmd 7/23/2008, 7:19 PM165
166
28. Transition to IFRS
Reconciliations between IFRS and Indian GAAP
28.1. Reconciliation of equity as at the opening of April 01, 2006
Note Amount
Total equity under Indian GAAP 971.5
– Restatement of the provision for employee benefits on a projected unit credit method basis a (3.9)
– Designation of preference shares issued by Satyam BPO as financial liability at FVTPL
at transition date b (33.9)
– Adjustments on consolidation of SC–Trust c (0.5)
– Recognition of estimated contribution to EBT of Citisoft d (1.4)
– Reversal of proposed ordinary dividends payable e 42.0
– Reversal of minority interest f (0.9)
– Deferred tax adjustments g 0.6
– Cumulative impact of other non–material items 0.1
Total equity under IFRS 973.6
Total equity under Indian GAAP includes equity share capital, preference share capital and reserves and surplus.
a) The liability in respect of the obligation under the defined benefit plans operated by Satyam has been measured using the
projected unit credit method. Satyam has opted to recognize all actuarial gains and losses in the income statement as and
when they arise.
b ) Preference shares issued by Satyam BPO – Refer Note 15
c) Consolidation of SC–Trust
Amount
Treasury shares (1.2)
Retained earnings 0.7
Total impact – decrease in equity (0.5)
Special purpose entities not required to be considered for consolidation under Indian GAAP have been consolidated under
IFRS. Shares of Satyam Computer Services held by SC–Trust are hence recognised as Treasury shares.
d) Recognition of estimated contribution to EBT of Citisoft – Refer Note 8.1.1
e) Dividends proposed after the balance sheet date but before the financial statements are finalised were treated as an
adjusting post–balance sheet event under Indian GAAP and accrued in the financial statements. Such dividends are treated
as a non–adjusting balance sheet event under IFRS and are not accrued.
f) Reversal of minority interest – Refer Note 8.1.1
g) Deferred tax has been recalculated in accordance with IAS 12 (Revised), Income taxes.
28.2. Reconciliation of equity as at March 31, 2007
Note Amount
Total equity under Indian GAAP 1,289.6
– Designation of preference shares issued by Satyam BPO as financial liability at FVTPL
at transition date and subsequent re-measurement. a (13.6)
– Adjustments on consolidation of SC–Trust b (0.6)
– Recognition of estimated contribution to EBT of Citisoft c (3.1)
– Reversal of proposed ordinary dividends payable d 45.1
– Cumulative translation difference e 45.3
– Deferred tax adjustments f (3.6)
– Cumulative impact of other non–material items (2.1)
Total equity under IFRS 1,357.0
(All amounts in ‘US$ in million’ except per share data and as otherwise stated)
Sat_AR08_Final_Jul22_TP 2 Col.pmd 7/23/2008, 7:19 PM166
167
Total equity under Indian GAAP includes equity share capital, preference share capital and reserves and surplus.
a) Preference shares issued by Satyam BPO – Refer Note 15
b) Consolidation of SC–Trust
Amount
Treasury shares (1.2)
Retained earnings 0.6
Total impact – decrease in equity (0.6)
Special purpose entities not required to be considered for consolidation under Indian GAAP have been consolidated under
IFRS. Shares of Satyam Computer Services held by SC–Trust are hence recognised as Treasury shares.
c) Recognition of estimated contribution to EBT of Citisoft – Refer Note 8.1.1
d) Dividends proposed after the balance sheet date but before the financial statements are finalised were treated as an
adjusting post–balance sheet event under Indian GAAP and accrued in the financial statements. Such dividends are treated
as a non–adjusting balance sheet event under IFRS and are not accrued.
e) Cumulative translation difference is arising on translation of amounts from functional currency to presentation currency.
f) Deferred tax has been recalculated in accordance with IAS 12 (Revised), Income taxes.
28.3. Reconciliation of equity as at March 31, 2008
Note Amount
Total equity under Indian GAAP 1,660.2
– Acquisition of minority interest of subsidiary a (46.5)
– Acquisition of shares from employees of a subsidiary b (2.6)
– Adjustments on consolidation of SC–Trust c (0.6)
– Recognition of estimated contribution to EBT of Citisoft d (2.0)
– Reversal of proposed ordinary dividends payable e 49.4
– Cumulative translation difference f 149.4
– Deferred tax adjustments g (3.0)
– Cumulative impact of other non–material items (4.5)
Total equity under IFRS 1,799.8
Total equity under Indian GAAP includes equity share capital, preference share capital and reserves and surplus.
a) Preference shares issued by Satyam BPO – Refer Note 15
b) Acquisition of shares from employees of Satyam BPO – Refer Note 14
c) Consolidation of SC–Trust
Amount
Treasury shares (1.2)
Retained earnings 0.6
Total impact – decrease in equity (0.6)
Special purpose entities not required to be considered for consolidation under Indian GAAP have been consolidated under
IFRS. Shares of Satyam Computer Services held by SC–Trust are hence recognised as Treasury shares.
d) Recognition of estimated contribution to EBT of Citisoft – Refer Note 8.1.1
e) Dividends proposed after the balance sheet date but before the financial statements are finalised were treated as an
adjusting post–balance sheet event under Indian GAAP and accrued in the financial statements. Such dividends are treated
as a non–adjusting balance sheet event under IFRS and are not accrued.
f) Cumulative translation difference is arising on translation of amounts from functional currency to presentation currency.
g) Deferred tax has been recalculated in accordance with IAS 12 (Revised), Income taxes.
(All amounts in ‘US$ in million’ except per share data and as otherwise stated)
Sat_AR08_Final_Jul22_TP 2 Col.pmd 7/23/2008, 7:19 PM167
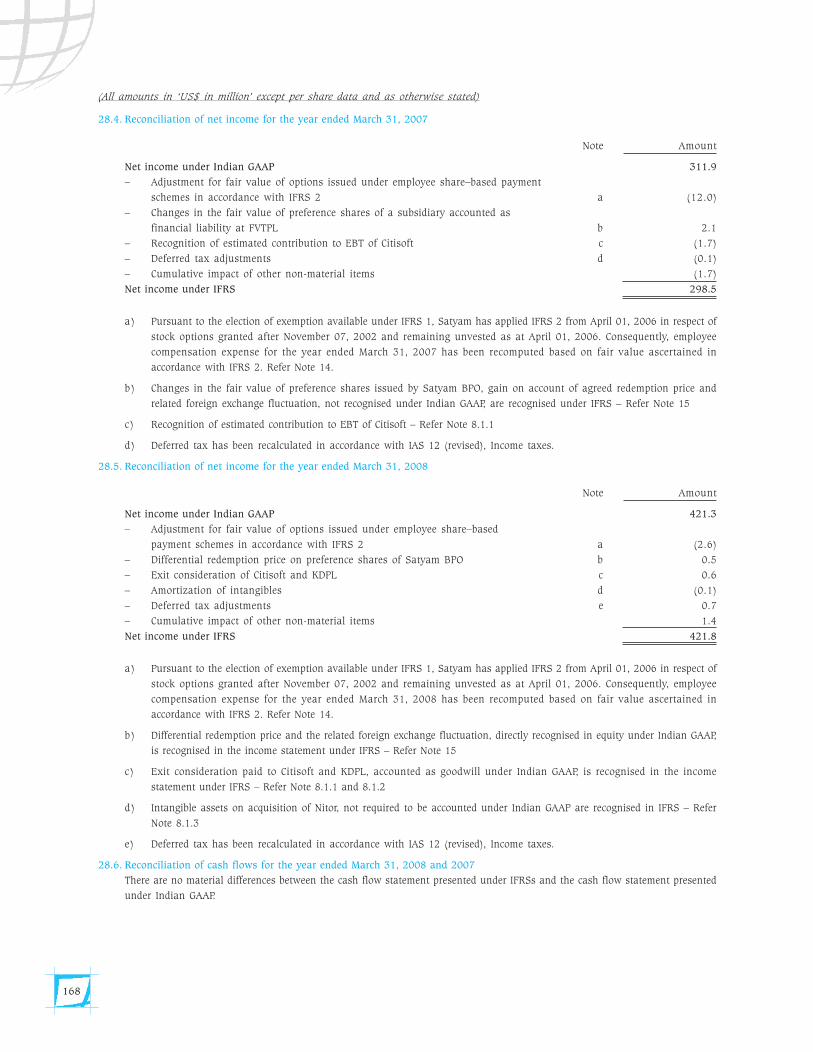
168
28.4. Reconciliation of net income for the year ended March 31, 2007
Note Amount
Net income under Indian GAAP 311.9
– Adjustment for fair value of options issued under employee share–based payment
schemes in accordance with IFRS 2 a (12.0)
– Changes in the fair value of preference shares of a subsidiary accounted as
financial liability at FVTPL b 2.1
– Recognition of estimated contribution to EBT of Citisoft c (1.7)
– Deferred tax adjustments d (0.1)
– Cumulative impact of other non-material items (1.7)
Net income under IFRS 298.5
a) Pursuant to the election of exemption available under IFRS 1, Satyam has applied IFRS 2 from April 01, 2006 in respect of
stock options granted after November 07, 2002 and remaining unvested as at April 01, 2006. Consequently, employee
compensation expense for the year ended March 31, 2007 has been recomputed based on fair value ascertained in
accordance with IFRS 2. Refer Note 14.
b) Changes in the fair value of preference shares issued by Satyam BPO, gain on account of agreed redemption price and
related foreign exchange fluctuation, not recognised under Indian GAAP, are recognised under IFRS – Refer Note 15
c) Recognition of estimated contribution to EBT of Citisoft – Refer Note 8.1.1
d) Deferred tax has been recalculated in accordance with IAS 12 (revised), Income taxes.
28.5. Reconciliation of net income for the year ended March 31, 2008
Note Amount
Net income under Indian GAAP 421.3
– Adjustment for fair value of options issued under employee share–based
payment schemes in accordance with IFRS 2 a (2.6)
– Differential redemption price on preference shares of Satyam BPO b 0.5
– Exit consideration of Citisoft and KDPL c 0.6
– Amortization of intangibles d (0.1)
– Deferred tax adjustments e 0.7
– Cumulative impact of other non-material items 1.4
Net income under IFRS 421.8
a) Pursuant to the election of exemption available under IFRS 1, Satyam has applied IFRS 2 from April 01, 2006 in respect of
stock options granted after November 07, 2002 and remaining unvested as at April 01, 2006. Consequently, employee
compensation expense for the year ended March 31, 2008 has been recomputed based on fair value ascertained in
accordance with IFRS 2. Refer Note 14.
b) Differential redemption price and the related foreign exchange fluctuation, directly recognised in equity under Indian GAAP,
is recognised in the income statement under IFRS – Refer Note 15
c) Exit consideration paid to Citisoft and KDPL, accounted as goodwill under Indian GAAP, is recognised in the income
statement under IFRS – Refer Note 8.1.1 and 8.1.2
d) Intangible assets on acquisition of Nitor, not required to be accounted under Indian GAAP are recognised in IFRS – Refer
Note 8.1.3
e) Deferred tax has been recalculated in accordance with IAS 12 (revised), Income taxes.
28.6. Reconciliation of cash flows for the year ended March 31, 2008 and 2007
There are no material differences between the cash flow statement presented under IFRSs and the cash flow statement presented
under Indian GAAP.
(All amounts in ‘US$ in million’ except per share data and as otherwise stated)
Sat_AR08_Final_Jul22_TP 2 Col.pmd 7/23/2008, 7:19 PM168
169
29. Events after the balance sheet date
Acquisitions
a) S&V Management consulting:
On April 21, 2008, Satyam Computer Services announced its intention of acquiring S&V Management Consultants (“S&V”),
a Belgium based SCM Strategy consulting firm, for a total consideration of US$35.5 comprising of an up-front, deferred
guaranteed and deferred retention payments.
b) Computer Associate’s 50% stake in CA-Satyam JV:
On April 21, 2008, Satyam Computer Services announced its intention of acquiring remaining 50% equity held by CA Inc in
its joint venture CA Satyam ASP Pvt. Ltd. (“CA Satyam”) for a total consideration US$ 1.5 payable in two tranches.
c) Caterpillar’s business division:
On April 21, 2008, Satyam Computer Services announced its intention to acquire the Market Research and Customer
Analytics (MR&CA) business unit from Caterpillar Inc., USA (CAT), including the related Intellectual Property which consists
of software, processes and know-how. The proposed acquisition is for a consideration of US$60.0 comprising of initial and
deferred consideration
(All amounts in ‘US$ in million’ except per share data and as otherwise stated)
Sat_AR08_Final_Jul22_TP 2 Col.pmd 7/23/2008, 7:19 PM169
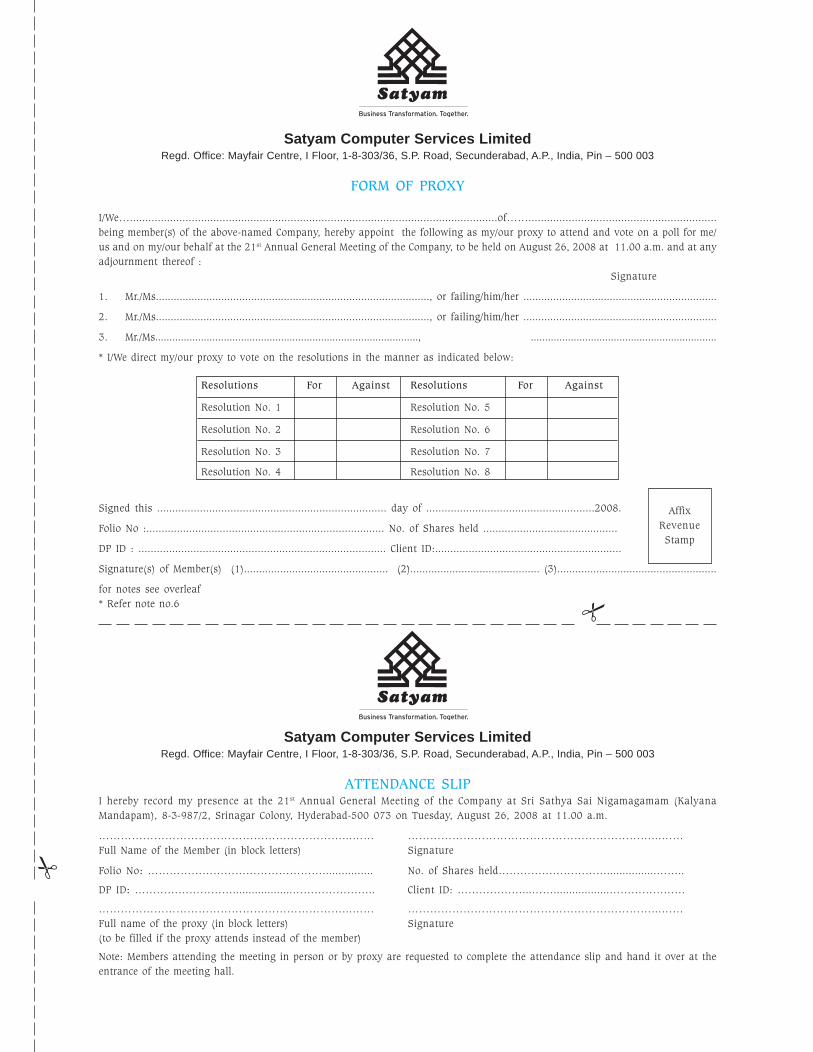
Satyam Computer Services LimitedRegd. Office: Mayfair Centre, I Floor, 1-8-303/36, S.P. Road, Secunderabad, A.P., India, Pin – 500 003
FORM OF PROXY
I/We….......................................................................................................................of…….............................................................
being member(s) of the above-named Company, hereby appoint the following as my/our proxy to attend and vote on a poll for me/
us and on my/our behalf at the 21st Annual General Meeting of the Company, to be held on August 26, 2008 at 11.00 a.m. and at any
adjournment thereof :
Signature
1. Mr./Ms............................................................................................, or failing/him/her .................................................................
2. Mr./Ms............................................................................................, or failing/him/her .................................................................
3. Mr./Ms............................................................................................, .................................................................
* I/We direct my/our proxy to vote on the resolutions in the manner as indicated below:
Signed this ........................................................................... day of .......................................................2008.
Folio No :.............................................................................. No. of Shares held ............................................
DP ID : ................................................................................. Client ID:.............................................................
Signature(s) of Member(s) (1)................................................ (2)........................................... (3).....................................................
for notes see overleaf
* Refer note no.6
Resolutions For Against Resolutions For Against
Resolution No. 1 Resolution No. 5
Resolution No. 2 Resolution No. 6
Resolution No. 3 Resolution No. 7
Resolution No. 4 Resolution No. 8
Satyam Computer Services LimitedRegd. Office: Mayfair Centre, I Floor, 1-8-303/36, S.P. Road, Secunderabad, A.P., India, Pin – 500 003
ATTENDANCE SLIPI hereby record my presence at the 21st Annual General Meeting of the Company at Sri Sathya Sai Nigamagamam (Kalyana
Mandapam), 8-3-987/2, Srinagar Colony, Hyderabad-500 073 on Tuesday, August 26, 2008 at 11.00 a.m.
…………………………………………………………...…… …………………………………………………………...……
Full Name of the Member (in block letters) Signature
Folio No: …………………………………………................ No. of Shares held…………………………................……..
DP ID: ………………………...................………………….. Client ID: ………………...……..................…………………
…………………………………………………………...…… …………………………………………………………...……
Full name of the proxy (in block letters) Signature
(to be filled if the proxy attends instead of the member)
Note: Members attending the meeting in person or by proxy are requested to complete the attendance slip and hand it over at the
entrance of the meeting hall.
�
�
Affix
Revenue
Stamp
Sat_AR08_Final_Jul22_TP 2 Col.pmd 7/23/2008, 7:19 PM171
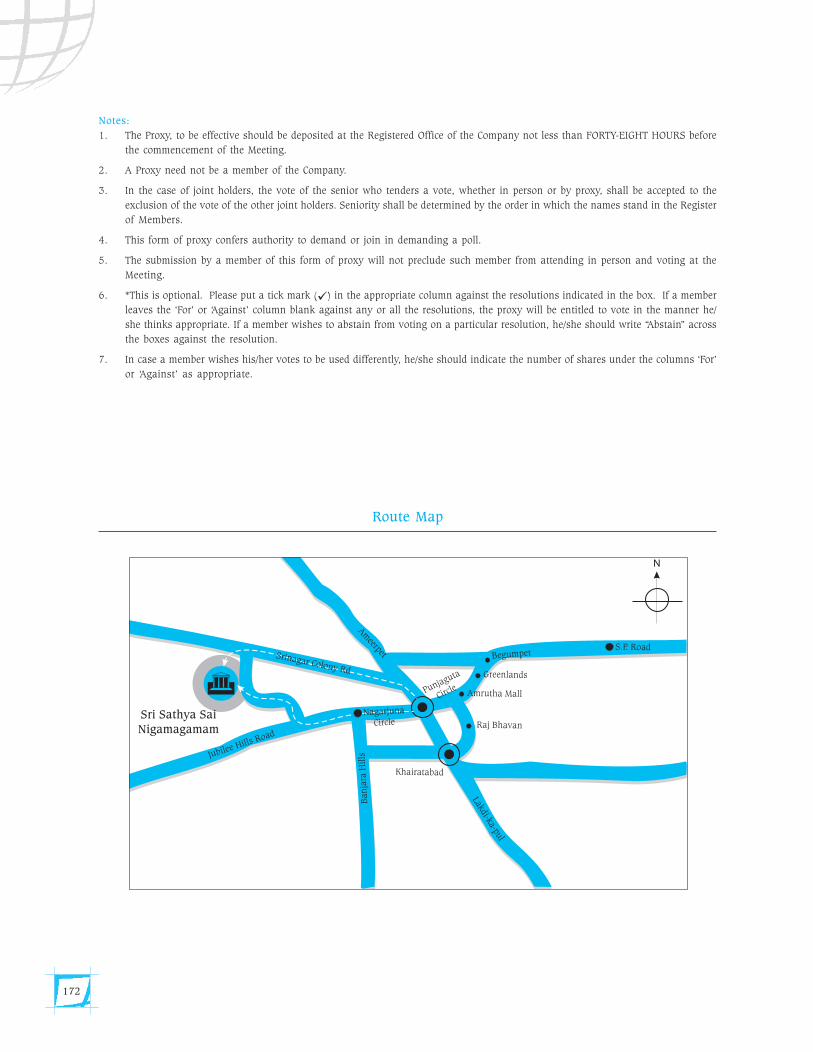
172
Notes:
1. The Proxy, to be effective should be deposited at the Registered Office of the Company not less than FORTY-EIGHT HOURS before
the commencement of the Meeting.
2. A Proxy need not be a member of the Company.
3. In the case of joint holders, the vote of the senior who tenders a vote, whether in person or by proxy, shall be accepted to the
exclusion of the vote of the other joint holders. Seniority shall be determined by the order in which the names stand in the Register
of Members.
4. This form of proxy confers authority to demand or join in demanding a poll.
5. The submission by a member of this form of proxy will not preclude such member from attending in person and voting at the
Meeting.
6. *This is optional. Please put a tick mark (�) in the appropriate column against the resolutions indicated in the box. If a member
leaves the ‘For’ or ‘Against’ column blank against any or all the resolutions, the proxy will be entitled to vote in the manner he/
she thinks appropriate. If a member wishes to abstain from voting on a particular resolution, he/she should write “Abstain” across
the boxes against the resolution.
7. In case a member wishes his/her votes to be used differently, he/she should indicate the number of shares under the columns ‘For’
or ‘Against’ as appropriate.
Route Map
Sat_AR08_Final_Jul22_TP 2 Col.pmd 7/23/2008, 7:19 PM172
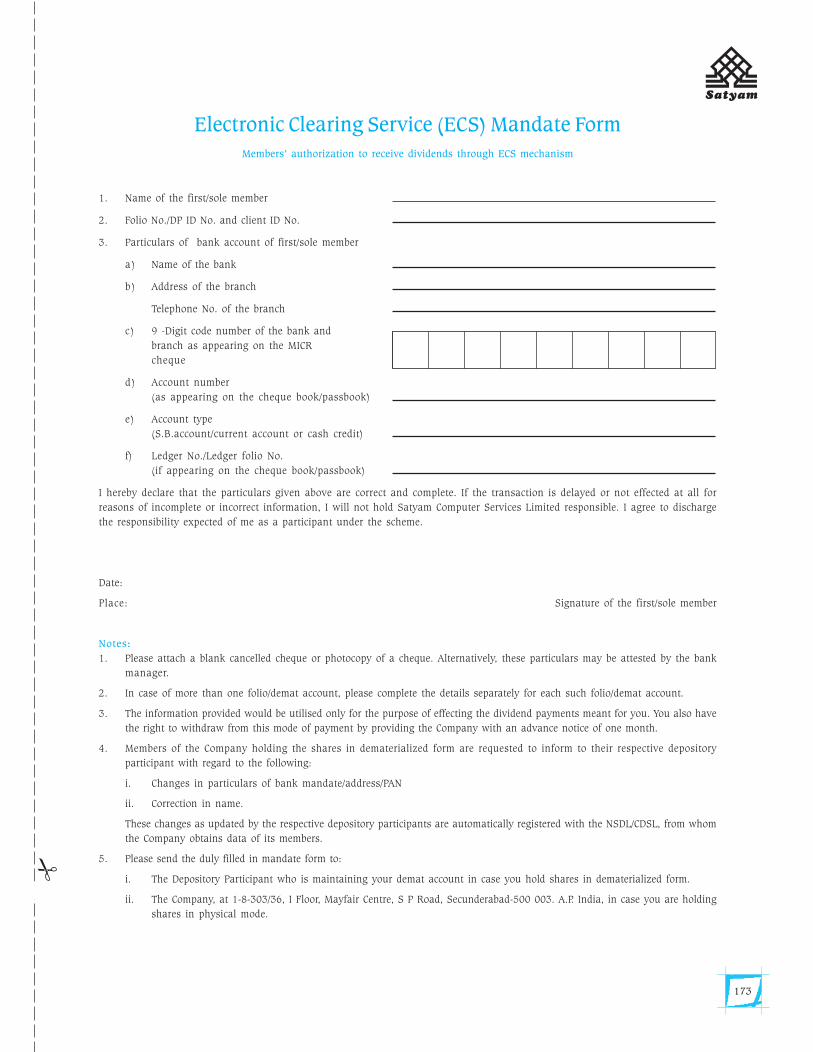
173
Electronic Clearing Service (ECS) Mandate FormMembers’ authorization to receive dividends through ECS mechanism
1. Name of the first/sole member
2. Folio No./DP ID No. and client ID No.
3. Particulars of bank account of first/sole member
a) Name of the bank
b) Address of the branch
Telephone No. of the branch
c) 9 -Digit code number of the bank and
branch as appearing on the MICR
cheque
d) Account number
(as appearing on the cheque book/passbook)
e) Account type
(S.B.account/current account or cash credit)
f) Ledger No./Ledger folio No.
(if appearing on the cheque book/passbook)
I hereby declare that the particulars given above are correct and complete. If the transaction is delayed or not effected at all for
reasons of incomplete or incorrect information, I will not hold Satyam Computer Services Limited responsible. I agree to discharge
the responsibility expected of me as a participant under the scheme.
Date:
Place: Signature of the first/sole member
Notes:
1. Please attach a blank cancelled cheque or photocopy of a cheque. Alternatively, these particulars may be attested by the bank
manager.
2. In case of more than one folio/demat account, please complete the details separately for each such folio/demat account.
3. The information provided would be utilised only for the purpose of effecting the dividend payments meant for you. You also have
the right to withdraw from this mode of payment by providing the Company with an advance notice of one month.
4. Members of the Company holding the shares in dematerialized form are requested to inform to their respective depository
participant with regard to the following:
i. Changes in particulars of bank mandate/address/PAN
ii. Correction in name.
These changes as updated by the respective depository participants are automatically registered with the NSDL/CDSL, from whom
the Company obtains data of its members.
5. Please send the duly filled in mandate form to:
i. The Depository Participant who is maintaining your demat account in case you hold shares in dematerialized form.
ii. The Company, at 1-8-303/36, I Floor, Mayfair Centre, S P Road, Secunderabad-500 003. A.P. India, in case you are holding
shares in physical mode.
�
Sat_AR08_Final_Jul22_TP 2 Col.pmd 7/23/2008, 7:19 PM173
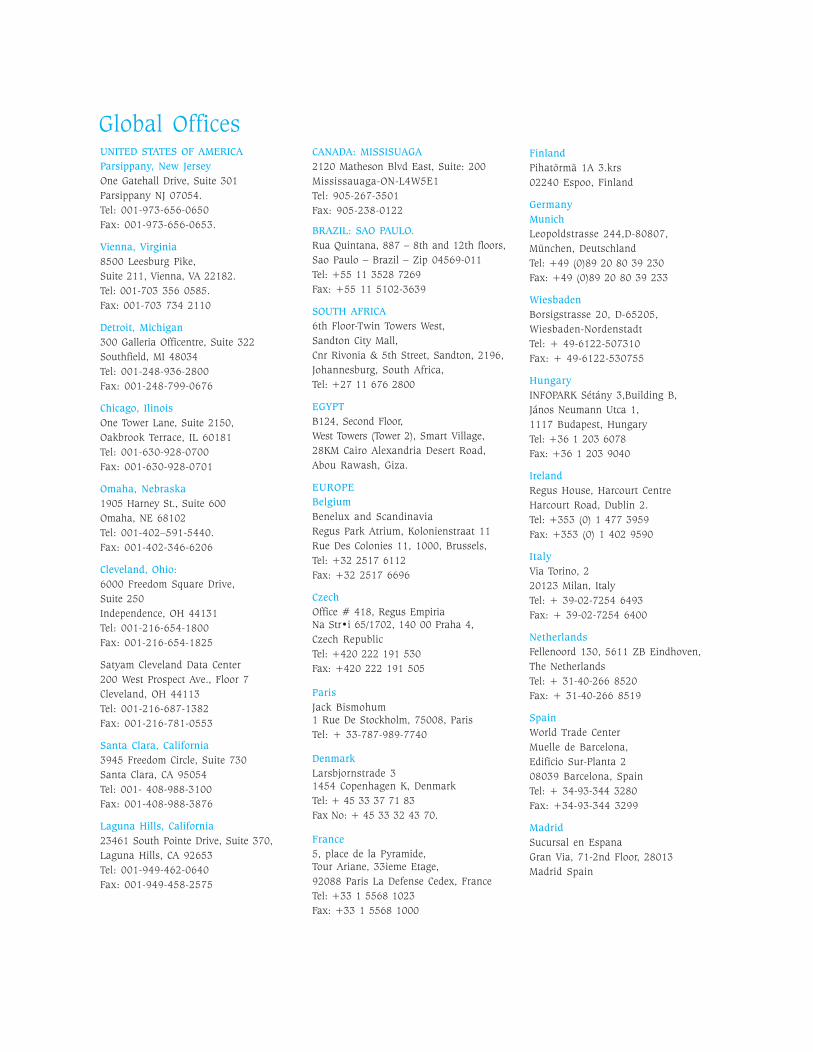
UNITED STATES OF AMERICA
Parsippany, New Jersey
One Gatehall Drive, Suite 301
Parsippany NJ 07054.
Tel: 001-973-656-0650
Fax: 001-973-656-0653.
Vienna, Virginia
8500 Leesburg Pike,
Suite 211, Vienna, VA 22182.
Tel: 001-703 356 0585.
Fax: 001-703 734 2110
Detroit, Michigan
300 Galleria Officentre, Suite 322
Southfield, MI 48034
Tel: 001-248-936-2800
Fax: 001-248-799-0676
Chicago, Ilinois
One Tower Lane, Suite 2150,
Oakbrook Terrace, IL 60181
Tel: 001-630-928-0700
Fax: 001-630-928-0701
Omaha, Nebraska
1905 Harney St., Suite 600
Omaha, NE 68102
Tel: 001-402–591-5440.
Fax: 001-402-346-6206
Cleveland, Ohio:
6000 Freedom Square Drive,
Suite 250
Independence, OH 44131
Tel: 001-216-654-1800
Fax: 001-216-654-1825
Satyam Cleveland Data Center
200 West Prospect Ave., Floor 7
Cleveland, OH 44113
Tel: 001-216-687-1382
Fax: 001-216-781-0553
Santa Clara, California
3945 Freedom Circle, Suite 730
Santa Clara, CA 95054
Tel: 001- 408-988-3100
Fax: 001-408-988-3876
Laguna Hills, California
23461 South Pointe Drive, Suite 370,
Laguna Hills, CA 92653
Tel: 001-949-462-0640
Fax: 001-949-458-2575
CANADA: MISSISUAGA
2120 Matheson Blvd East, Suite: 200
Mississauaga-ON-L4W5E1
Tel: 905-267-3501
Fax: 905-238-0122
BRAZIL: SAO PAULO.
Rua Quintana, 887 – 8th and 12th floors,
Sao Paulo – Brazil – Zip 04569-011
Tel: +55 11 3528 7269
Fax: +55 11 5102-3639
SOUTH AFRICA
6th Floor-Twin Towers West,
Sandton City Mall,
Cnr Rivonia & 5th Street, Sandton, 2196,
Johannesburg, South Africa,
Tel: +27 11 676 2800
EGYPT
B124, Second Floor,
West Towers (Tower 2), Smart Village,
28KM Cairo Alexandria Desert Road,
Abou Rawash, Giza.
EUROPE
Belgium
Benelux and Scandinavia
Regus Park Atrium, Kolonienstraat 11
Rue Des Colonies 11, 1000, Brussels,
Tel: +32 2517 6112
Fax: +32 2517 6696
Czech
Office # 418, Regus EmpiriaNa Str•i 65/1702, 140 00 Praha 4,
Czech Republic
Tel: +420 222 191 530
Fax: +420 222 191 505
Paris
Jack Bismohum1 Rue De Stockholm, 75008, Paris
Tel: + 33-787-989-7740
Denmark
Larsbjornstrade 31454 Copenhagen K, Denmark
Tel: + 45 33 37 71 83
Fax No: + 45 33 32 43 70.
France
5, place de la Pyramide,Tour Ariane, 33ieme Etage,
92088 Paris La Defense Cedex, France
Tel: +33 1 5568 1023
Fax: +33 1 5568 1000
Finland
Pihatörmä 1A 3.krs
02240 Espoo, Finland
Germany
Munich
Leopoldstrasse 244,D-80807,
München, Deutschland
Tel: +49 (0)89 20 80 39 230
Fax: +49 (0)89 20 80 39 233
Wiesbaden
Borsigstrasse 20, D-65205,
Wiesbaden-Nordenstadt
Tel: + 49-6122-507310
Fax: + 49-6122-530755
Hungary
INFOPARK Sétány 3,Building B,
János Neumann Utca 1,
1117 Budapest, Hungary
Tel: +36 1 203 6078
Fax: +36 1 203 9040
Ireland
Regus House, Harcourt Centre
Harcourt Road, Dublin 2.
Tel: +353 (0) 1 477 3959
Fax: +353 (0) 1 402 9590
Italy
Via Torino, 2
20123 Milan, Italy
Tel: + 39-02-7254 6493
Fax: + 39-02-7254 6400
Netherlands
Fellenoord 130, 5611 ZB Eindhoven,
The Netherlands
Tel: + 31-40-266 8520
Fax: + 31-40-266 8519
Spain
World Trade Center
Muelle de Barcelona,
Edificio Sur-Planta 2
08039 Barcelona, Spain
Tel: + 34-93-344 3280
Fax: +34-93-344 3299
Madrid
Sucursal en Espana
Gran Via, 71-2nd Floor, 28013
Madrid Spain
Global Offices
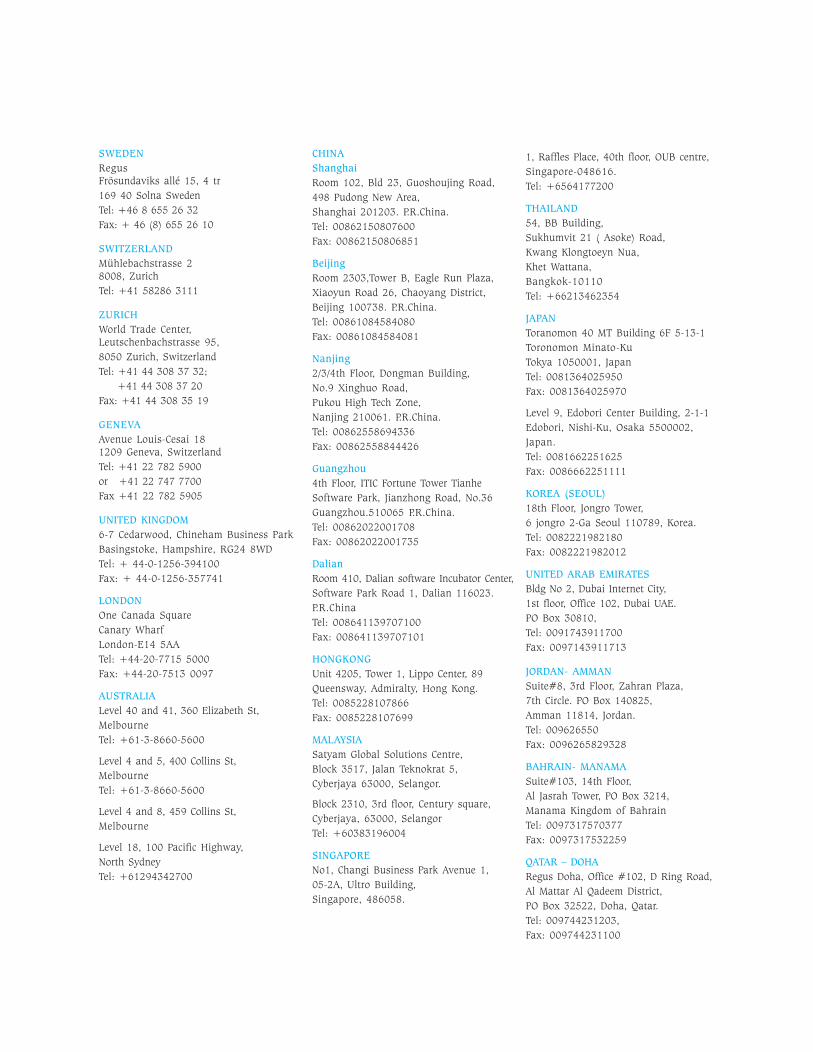
SWEDEN
RegusFrösundaviks allé 15, 4 tr
169 40 Solna Sweden
Tel: +46 8 655 26 32
Fax: + 46 (8) 655 26 10
SWITZERLAND
Mühlebachstrasse 28008, Zurich
Tel: +41 58286 3111
ZURICH
World Trade Center,Leutschenbachstrasse 95,
8050 Zurich, Switzerland
Tel: +41 44 308 37 32;
+41 44 308 37 20
Fax: +41 44 308 35 19
GENEVA
Avenue Louis-Cesai 181209 Geneva, Switzerland
Tel: +41 22 782 5900
or +41 22 747 7700
Fax +41 22 782 5905
UNITED KINGDOM
6-7 Cedarwood, Chineham Business Park
Basingstoke, Hampshire, RG24 8WD
Tel: + 44-0-1256-394100
Fax: + 44-0-1256-357741
LONDON
One Canada Square
Canary Wharf
London-E14 5AA
Tel: +44-20-7715 5000
Fax: +44-20-7513 0097
AUSTRALIA
Level 40 and 41, 360 Elizabeth St,
Melbourne
Tel: +61-3-8660-5600
Level 4 and 5, 400 Collins St,
Melbourne
Tel: +61-3-8660-5600
Level 4 and 8, 459 Collins St,
Melbourne
Level 18, 100 Pacific Highway,
North Sydney
Tel: +61294342700
CHINA
Shanghai
Room 102, Bld 23, Guoshoujing Road,
498 Pudong New Area,
Shanghai 201203. P.R.China.
Tel: 00862150807600
Fax: 00862150806851
Beijing
Room 2303,Tower B, Eagle Run Plaza,
Xiaoyun Road 26, Chaoyang District,
Beijing 100738. P.R.China.
Tel: 00861084584080
Fax: 00861084584081
Nanjing
2/3/4th Floor, Dongman Building,
No.9 Xinghuo Road,
Pukou High Tech Zone,
Nanjing 210061. P.R.China.
Tel: 00862558694336
Fax: 00862558844426
Guangzhou
4th Floor, ITIC Fortune Tower Tianhe
Software Park, Jianzhong Road, No.36
Guangzhou.510065 P.R.China.
Tel: 00862022001708
Fax: 00862022001735
Dalian
Room 410, Dalian software Incubator Center,
Software Park Road 1, Dalian 116023.
P.R.China
Tel: 008641139707100
Fax: 008641139707101
HONGKONG
Unit 4205, Tower 1, Lippo Center, 89
Queensway, Admiralty, Hong Kong.
Tel: 0085228107866
Fax: 0085228107699
MALAYSIA
Satyam Global Solutions Centre,
Block 3517, Jalan Teknokrat 5,
Cyberjaya 63000, Selangor.
Block 2310, 3rd floor, Century square,
Cyberjaya, 63000, Selangor
Tel: +60383196004
SINGAPORE
No1, Changi Business Park Avenue 1,
05-2A, Ultro Building,
Singapore, 486058.
1, Raffles Place, 40th floor, OUB centre,
Singapore-048616.
Tel: +6564177200
THAILAND
54, BB Building,
Sukhumvit 21 ( Asoke) Road,
Kwang Klongtoeyn Nua,
Khet Wattana,
Bangkok-10110
Tel: +66213462354
JAPAN
Toranomon 40 MT Building 6F 5-13-1
Toronomon Minato-Ku
Tokya 1050001, Japan
Tel: 0081364025950
Fax: 0081364025970
Level 9, Edobori Center Building, 2-1-1
Edobori, Nishi-Ku, Osaka 5500002,
Japan.
Tel: 0081662251625
Fax: 0086662251111
KOREA (SEOUL)
18th Floor, Jongro Tower,
6 jongro 2-Ga Seoul 110789, Korea.
Tel: 0082221982180
Fax: 0082221982012
UNITED ARAB EMIRATES
Bldg No 2, Dubai Internet City,
1st floor, Office 102, Dubai UAE.
PO Box 30810,
Tel: 0091743911700
Fax: 0097143911713
JORDAN- AMMAN
Suite#8, 3rd Floor, Zahran Plaza,
7th Circle. PO Box 140825,
Amman 11814, Jordan.
Tel: 009626550
Fax: 0096265829328
BAHRAIN- MANAMA
Suite#103, 14th Floor,
Al Jasrah Tower, PO Box 3214,
Manama Kingdom of Bahrain
Tel: 0097317570377
Fax: 0097317532259
QATAR – DOHA
Regus Doha, Office #102, D Ring Road,
Al Mattar Al Qadeem District,
PO Box 32522, Doha, Qatar.
Tel: 009744231203,
Fax: 009744231100
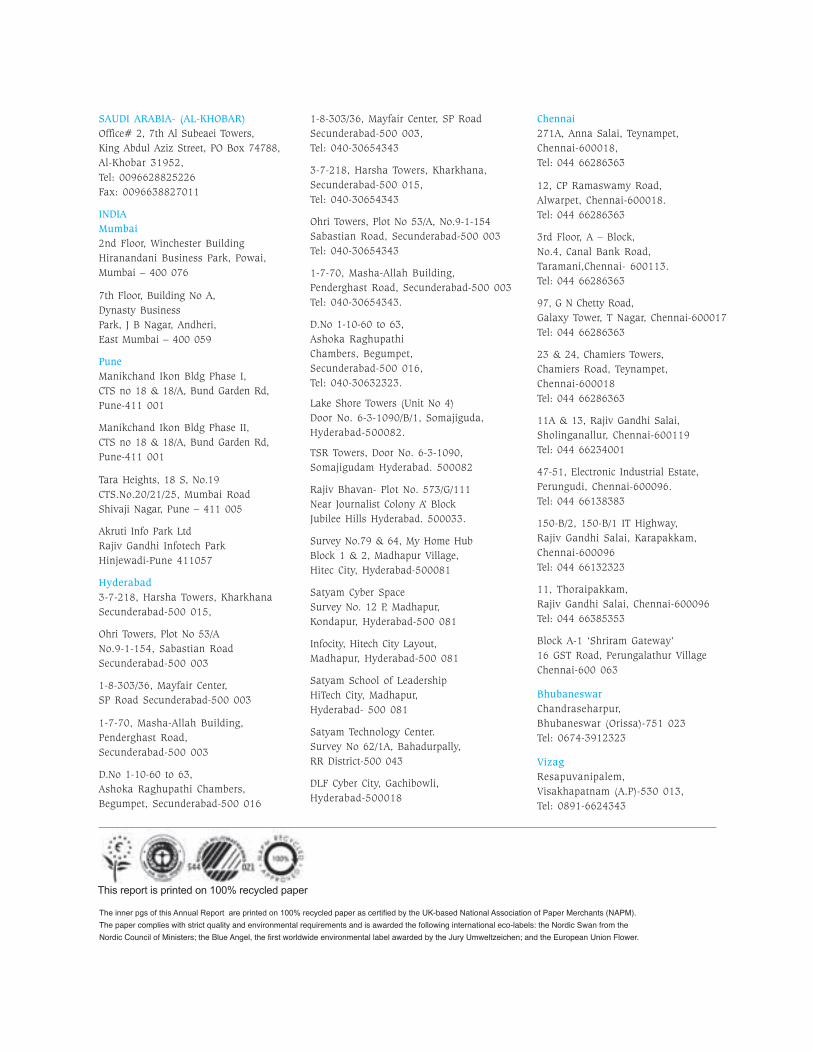
SAUDI ARABIA- (AL-KHOBAR)
Office# 2, 7th Al Subeaei Towers,
King Abdul Aziz Street, PO Box 74788,
Al-Khobar 31952,
Tel: 0096628825226
Fax: 0096638827011
INDIA
Mumbai
2nd Floor, Winchester Building
Hiranandani Business Park, Powai,
Mumbai – 400 076
7th Floor, Building No A,
Dynasty Business
Park, J B Nagar, Andheri,
East Mumbai – 400 059
Pune
Manikchand Ikon Bldg Phase I,
CTS no 18 & 18/A, Bund Garden Rd,
Pune-411 001
Manikchand Ikon Bldg Phase II,
CTS no 18 & 18/A, Bund Garden Rd,
Pune-411 001
Tara Heights, 18 S, No.19
CTS.No.20/21/25, Mumbai Road
Shivaji Nagar, Pune – 411 005
Akruti Info Park Ltd
Rajiv Gandhi Infotech Park
Hinjewadi-Pune 411057
Hyderabad
3-7-218, Harsha Towers, Kharkhana
Secunderabad-500 015,
Ohri Towers, Plot No 53/A
No.9-1-154, Sabastian Road
Secunderabad-500 003
1-8-303/36, Mayfair Center,
SP Road Secunderabad-500 003
1-7-70, Masha-Allah Building,
Penderghast Road,
Secunderabad-500 003
D.No 1-10-60 to 63,
Ashoka Raghupathi Chambers,
Begumpet, Secunderabad-500 016
1-8-303/36, Mayfair Center, SP Road
Secunderabad-500 003,
Tel: 040-30654343
3-7-218, Harsha Towers, Kharkhana,
Secunderabad-500 015,
Tel: 040-30654343
Ohri Towers, Plot No 53/A, No.9-1-154
Sabastian Road, Secunderabad-500 003
Tel: 040-30654343
1-7-70, Masha-Allah Building,
Penderghast Road, Secunderabad-500 003
Tel: 040-30654343.
D.No 1-10-60 to 63,
Ashoka Raghupathi
Chambers, Begumpet,
Secunderabad-500 016,
Tel: 040-30632323.
Lake Shore Towers (Unit No 4)
Door No. 6-3-1090/B/1, Somajiguda,
Hyderabad-500082.
TSR Towers, Door No. 6-3-1090,
Somajigudam Hyderabad. 500082
Rajiv Bhavan- Plot No. 573/G/111
Near Journalist Colony A’ Block
Jubilee Hills Hyderabad. 500033.
Survey No.79 & 64, My Home Hub
Block 1 & 2, Madhapur Village,
Hitec City, Hyderabad-500081
Satyam Cyber Space
Survey No. 12 P, Madhapur,
Kondapur, Hyderabad-500 081
Infocity, Hitech City Layout,
Madhapur, Hyderabad-500 081
Satyam School of Leadership
HiTech City, Madhapur,
Hyderabad- 500 081
Satyam Technology Center.
Survey No 62/1A, Bahadurpally,
RR District-500 043
DLF Cyber City, Gachibowli,
Hyderabad-500018
Chennai
271A, Anna Salai, Teynampet,
Chennai-600018,
Tel: 044 66286363
12, CP Ramaswamy Road,
Alwarpet, Chennai-600018.
Tel: 044 66286363
3rd Floor, A – Block,
No.4, Canal Bank Road,
Taramani,Chennai- 600113.
Tel: 044 66286363
97, G N Chetty Road,
Galaxy Tower, T Nagar, Chennai-600017
Tel: 044 66286363
23 & 24, Chamiers Towers,
Chamiers Road, Teynampet,
Chennai-600018
Tel: 044 66286363
11A & 13, Rajiv Gandhi Salai,
Sholinganallur, Chennai-600119
Tel: 044 66234001
47-51, Electronic Industrial Estate,
Perungudi, Chennai-600096.
Tel: 044 66138383
150-B/2, 150-B/1 IT Highway,
Rajiv Gandhi Salai, Karapakkam,
Chennai-600096
Tel: 044 66132323
11, Thoraipakkam,
Rajiv Gandhi Salai, Chennai-600096
Tel: 044 66385353
Block A-1 ‘Shriram Gateway’
16 GST Road, Perungalathur Village
Chennai-600 063
Bhubaneswar
Chandraseharpur,
Bhubaneswar (Orissa)-751 023
Tel: 0674-3912323
Vizag
Resapuvanipalem,
Visakhapatnam (A.P)-530 013,
Tel: 0891-6624343