Embed Size (px)
Citation preview

Contents State of Air Environment
Page i
CONTENTS
Contents Page
List of Figures I List of Tables III List of Boxes V List of Abbreviation Executive Summary
VI IX
Sr. No.
Section
1 Introduction
1
2 Section – I – Pressures 3
1.1 Air Pollutants 3 1.2 Pressures on Air Quality 4 1.2.1 Meteorological & Climatic Conditions
1.2.2 Population Growth & Urbanisation 1.2.3 Urban Heat Islands 1.2.4 Industrialisation 1.2.5 Power Sector 1.2.6 Mining 1.2.7 Vehicular Growth 1.2.8 Fuel Usage 1.2.9 Travel Mode Characteristics 1.2.10 Indoor Air Pollution
4 7 10 10 15 19 21 33 35 36
3 Section – II – State 39 2.1 Trends in Annual Average Concentration of
SO2 in Residential Areas 2.2 Trends in Annual Average Concentration of SO2 in Industrial Areas 2.3 Trends in Annual Average Concentration of
NOx in Residential Areas 2.4 Trends in Annual Average Concentration of NOx in Industrial Areas 2.5 Trends in Annual Average Concentration of SPM in Residential Areas 2.6 Trends in Annual Average Concentration of SPM in Industrial Areas 2.7 Trends in Annual Average Concentration of RSPM in Residential Areas 2.8 Trends in Annual Average Concentration of RSPM in Industrial Areas 2.9 Trends in PM2.5 in Ahmedabad 2.10 Monitoring of VOCs 2.11 Noise Monitoring 2.12 Odour Monitoring 2.13 Hot Spots
40
42
43
44
46
47
49
53
55 58 63 66 67
Contents State of Air Environment
Page ii
3 Section – III – Impact 73 3.1 Economic Impacts
3.2 Health Impacts 3.2.1 Health Impacts due to Indoor Air Pollution 3.2.2 Health Impacts due to Mining 3.2.3 Health Impacts due to Noise Pollution 3.2.4 Health Impacts due to Heat Islands 3.2.5 Health Impacts due to Odour
3.3 Other Impacts 3.4. Some Impact Studies Carried Out In Recent Past
3.4.1 National Environmental Health Profile and Comparative Health Risk Assessment of Ahmedabad, sponsored by WHO through Ministry of Environment & Forests. Conducted by NIOH 2004‐05
3.4.2 Survey of Traffic Policemen conducted by Traffic Department in January 2012
3.4.3 Health Impacts of Air Pollution in Ahmedabad 3.4.4 Effect of Air Pollution on Human Health
(adults)in Delhi
73 73 74 75 75 76 76 76 77 77
78
78 79
4 Section – IV – Response 80 4.1 At National Level
4.1.1 Ambient Air Quality Norms 4.1.2 Preparation of Zoning Atlas 4.1.3 Improved Vehicle Emission Norms 4.1.4 Improved Fuel Quality Norms
4.2 At State Level 4.2.1 Air Action Plans 4.2.2 Monitoring of Industries 4.2.3 Roping in Technical Institutes to Control Air
Pollution 4.2.4 Strengthening of PUC Stations 4.2.5 CNG/LPG Infrastructure for Auto Gas Supply 4.2.6 Registration of Retrofitters 4.2.7 Banning of Old Autos & Conversion to CNG in
Ahmedabad 4.2.8 Improved Public Transport System 4.2.9 Promoting Renewable Energy
4.3 At Individual Level 4.3.1 Conversion of Vehicles to Cleaner Fuel
(CNG/LPG) 4.3.2 Use of Natural Gas by Industries 4.3.3 Households having PNG
80 80 82 82 83 84 84 85 86
87 89 89 90
91 93 93 93
94 95
5 Section – V – Recommendation 96 5.1 Need To Extend Ambient Air Quality Monitoring
Programme 5.2 Source Apportionment Studies 5.3 Health Impact Studies 5.4 Pollution Control from Vehicles 5.5 Regulatory Agencies 5.6 Awareness Programmes
96
96 97 97 98 98
Contents State of Air Environment
Page iii
6 References 99
7 Annexure I 102
8 Annexure II 109
9 Annexure III 119
10 Annexure IV 145
List of Figures State of Air Environment
Page I
LIST OF FIGURES
Page No. Introduction
1. Fig A: Performance of Gujarat in ESI 1
2. Fig B: PSIR Framework 2
Section I ‐ Pressures
1. Fig 1.1: Climate in Gujarat 5
2. Fig 1.2: Soil Map of Gujarat 5
3. Fig 1.3: Physiography in Gujarat 6
4. Fig 1.4: Rainfall in Gujarat 6
5. Fig 1.5: Industrial Estates, SEZs, SIRs & DMIC Nodes in Gujarat 11
6. Fig 1.6: Jurisdiction Area of Regional Offices of GPCB 12
7. Fig 1.7: Location of Thermal Power Plants in Gujarat 16
8. Fig 1.8: Fuel wise distribution in total installation 18
9. Fig 1.9: Percentage of Renewable Energy Sources in Gujarat 19
10. Fig 1.10: Mining Areas of Gujarat 20
11. Fig 1.11: Categorywise Distribution of Vehicles In Gujarat (31/03/2011) 22
12. Fig1.12 Vehicle Population : All Vehicles 24
13. Fig 1.13: Transport and NonTransport Vehicles in Gujarat 25
14. Fig 1.14: Distribution of Vehicles in Major Urban Centers of Gujarat 33
15. Fig 1.15: Travel Mode Chracteristics‐Ahmedabad 2007 36
16. Fig 1.16: Fuel Usage for Rural Gujarat at HH Level NFHS 2 37
17. Fig 1.17: Fuel Usage for Rural Gujarat at HH Level NFHS 3 37
18. Fig 1.18: Fuel Usage in Gujarat State 38
Section II ‐ State 1. Fig 2.1: Air Quality Monitoring Stations in Gujarat 39
2. Fig 2.2: RSPM ‐ Ahmedabad (Residential Areas) 51
3. Fig 2.3: RSPM ‐ Vadodara (ResidentialAreas) 51
4. Fig 2.4: RSPM ‐ Surat (Residential) 52
5. Fig 2.5: RSPM ‐ Rajkot (Residential Area) 52
6. Fig 2.6: RSPM ‐ Jamnagar (Residential Area) 53
7 Fig 2.7: RSPM levels at Important Industrial Locations 55
8 Fig 2.8: GIDC Naroda(Above Police Chowki) ‐ Industrial Area 57
List of Figures State of Air Environment
Page II
9 Fig 2.9: Nehru Bridge ‐ Traffic Junction 57
10 Fig2.10: Satellite Area, Chinmay Seva Trust ‐ Residential Area 58
11 Fig 2.11: Ambient Air Quality Monitoring Stations for VOCs in Gujarat 60
12 Fig 2.12: Benzene Concentration ‐Pandesara 61
13 Fig 2.13: Benzene Concentration ‐ Ankleshwar 61
14 Fig 2.14: Benzene Concentration ‐ Dahej 61
15 Fig 2.15: Benzene Concentration ‐ Panoli 62
16 Fig 2.16: Benzene Concentration ‐ Naroda 62
17 Fig 2.17: Benzene Concentration ‐ Vatva 62
Section IV‐ Response
1. Fig 4.1: Samples Collected under Air Act 86
List of Tables State of Air Environment
Page III
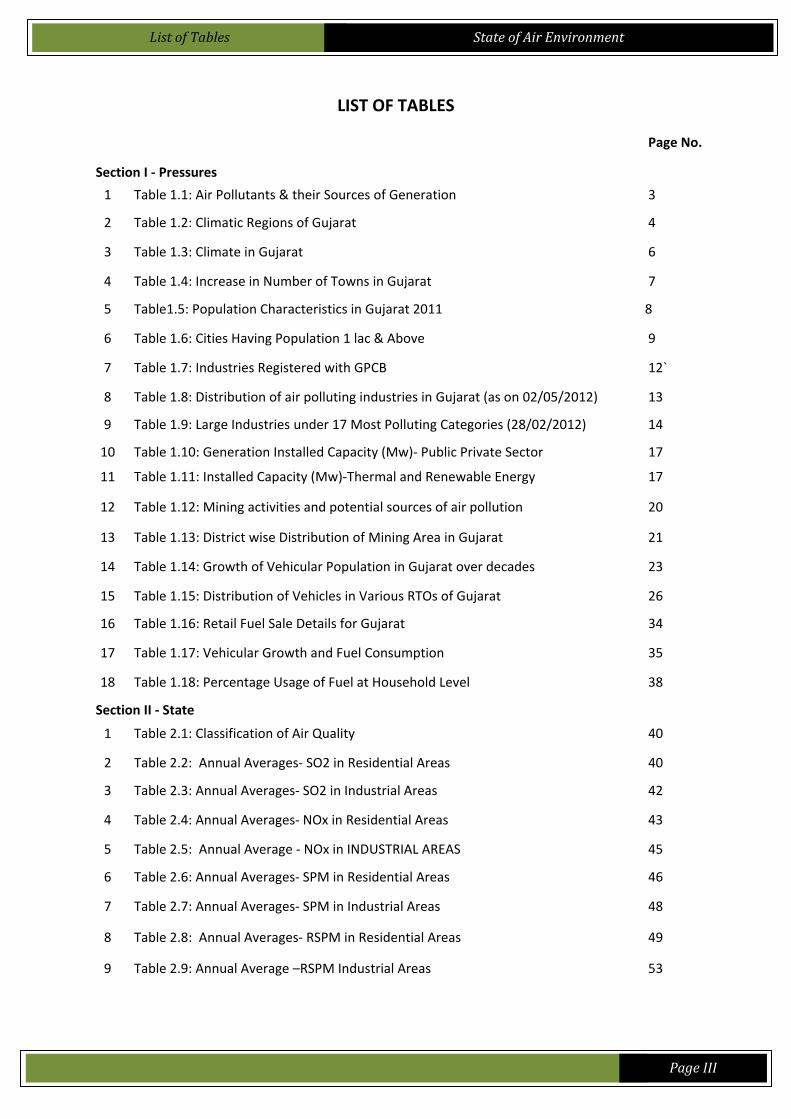
LIST OF TABLES
Page No.
Section I ‐ Pressures
1 Table 1.1: Air Pollutants & their Sources of Generation 3
2 Table 1.2: Climatic Regions of Gujarat 4
3 Table 1.3: Climate in Gujarat 6
4 Table 1.4: Increase in Number of Towns in Gujarat 7
5 Table1.5: Population Characteristics in Gujarat 2011 8
6 Table 1.6: Cities Having Population 1 lac & Above 9
7 Table 1.7: Industries Registered with GPCB 12`
8 Table 1.8: Distribution of air polluting industries in Gujarat (as on 02/05/2012) 13
9 Table 1.9: Large Industries under 17 Most Polluting Categories (28/02/2012) 14
10 Table 1.10: Generation Installed Capacity (Mw)‐ Public Private Sector 17
11 Table 1.11: Installed Capacity (Mw)‐Thermal and Renewable Energy 17
12 Table 1.12: Mining activities and potential sources of air pollution 20
13 Table 1.13: District wise Distribution of Mining Area in Gujarat 21
14 Table 1.14: Growth of Vehicular Population in Gujarat over decades 23
15 Table 1.15: Distribution of Vehicles in Various RTOs of Gujarat 26
16 Table 1.16: Retail Fuel Sale Details for Gujarat 34
17 Table 1.17: Vehicular Growth and Fuel Consumption 35
18 Table 1.18: Percentage Usage of Fuel at Household Level 38
Section II ‐ State
1 Table 2.1: Classification of Air Quality 40
2 Table 2.2: Annual Averages‐ SO2 in Residential Areas 40
3 Table 2.3: Annual Averages‐ SO2 in Industrial Areas 42
4 Table 2.4: Annual Averages‐ NOx in Residential Areas 43
5 Table 2.5: Annual Average ‐ NOx in INDUSTRIAL AREAS 45
6 Table 2.6: Annual Averages‐ SPM in Residential Areas 46
7 Table 2.7: Annual Averages‐ SPM in Industrial Areas 48
8 Table 2.8: Annual Averages‐ RSPM in Residential Areas 49
9 Table 2.9: Annual Average –RSPM Industrial Areas 53
List of Tables State of Air Environment
Page IV
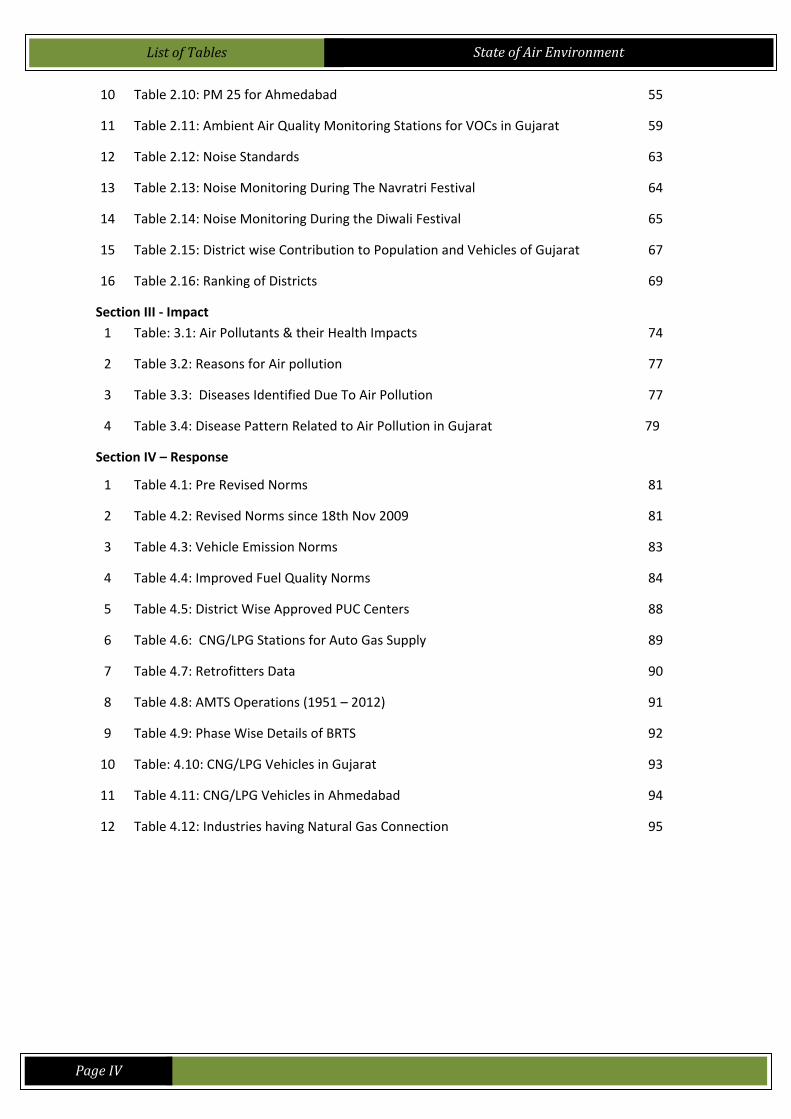
10 Table 2.10: PM 25 for Ahmedabad 55
11 Table 2.11: Ambient Air Quality Monitoring Stations for VOCs in Gujarat 59
12 Table 2.12: Noise Standards 63
13 Table 2.13: Noise Monitoring During The Navratri Festival 64
14 Table 2.14: Noise Monitoring During the Diwali Festival 65
15 Table 2.15: District wise Contribution to Population and Vehicles of Gujarat 67
16 Table 2.16: Ranking of Districts 69
Section III ‐ Impact 1 Table: 3.1: Air Pollutants & their Health Impacts 74
2 Table 3.2: Reasons for Air pollution 77
3 Table 3.3: Diseases Identified Due To Air Pollution 77
4 Table 3.4: Disease Pattern Related to Air Pollution in Gujarat 79
Section IV – Response
1 Table 4.1: Pre Revised Norms 81
2 Table 4.2: Revised Norms since 18th Nov 2009 81
3 Table 4.3: Vehicle Emission Norms 83
4 Table 4.4: Improved Fuel Quality Norms 84
5 Table 4.5: District Wise Approved PUC Centers 88
6 Table 4.6: CNG/LPG Stations for Auto Gas Supply 89
7 Table 4.7: Retrofitters Data 90
8 Table 4.8: AMTS Operations (1951 – 2012) 91
9 Table 4.9: Phase Wise Details of BRTS 92
10 Table: 4.10: CNG/LPG Vehicles in Gujarat 93
11 Table 4.11: CNG/LPG Vehicles in Ahmedabad 94
12 Table 4.12: Industries having Natural Gas Connection 95
List of Boxes State of Air Environment
Page V
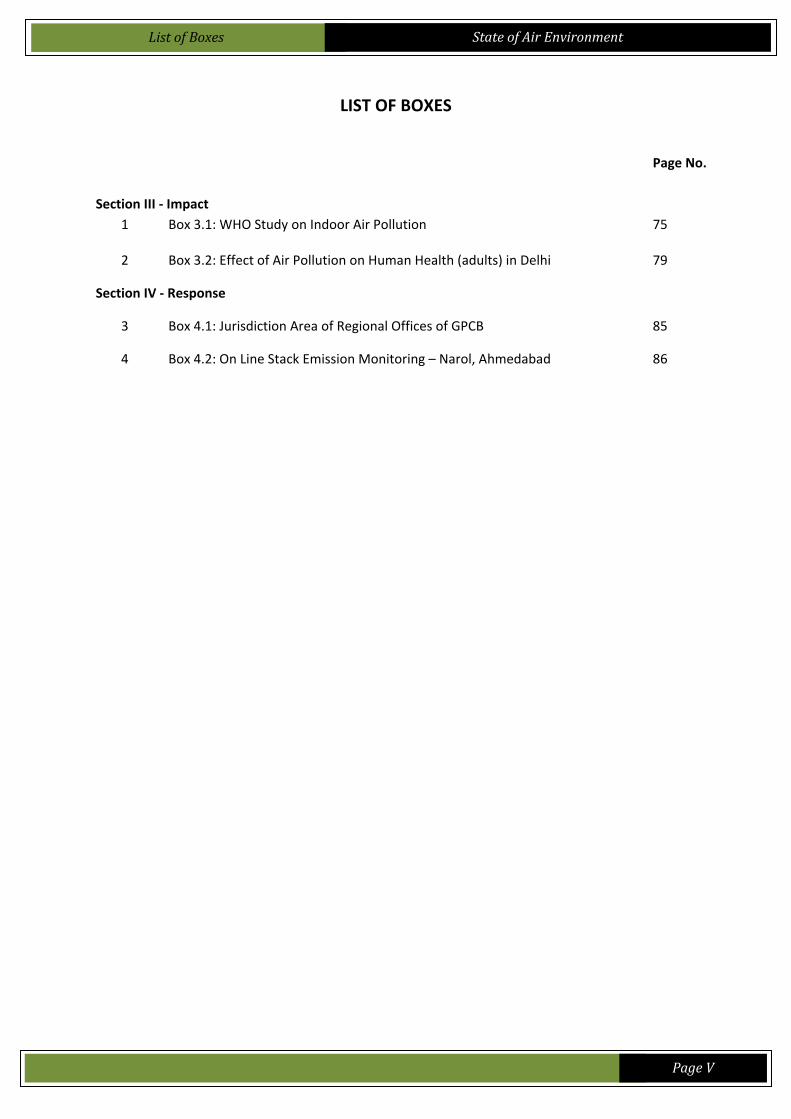
LIST OF BOXES
Page No.
Section III ‐ Impact
1 Box 3.1: WHO Study on Indoor Air Pollution
75
2 Box 3.2: Effect of Air Pollution on Human Health (adults) in Delhi 79
Section IV ‐ Response
3 Box 4.1: Jurisdiction Area of Regional Offices of GPCB 85
4 Box 4.2: On Line Stack Emission Monitoring – Narol, Ahmedabad 86
List of Abbreviation State of Air Environment
Page VI
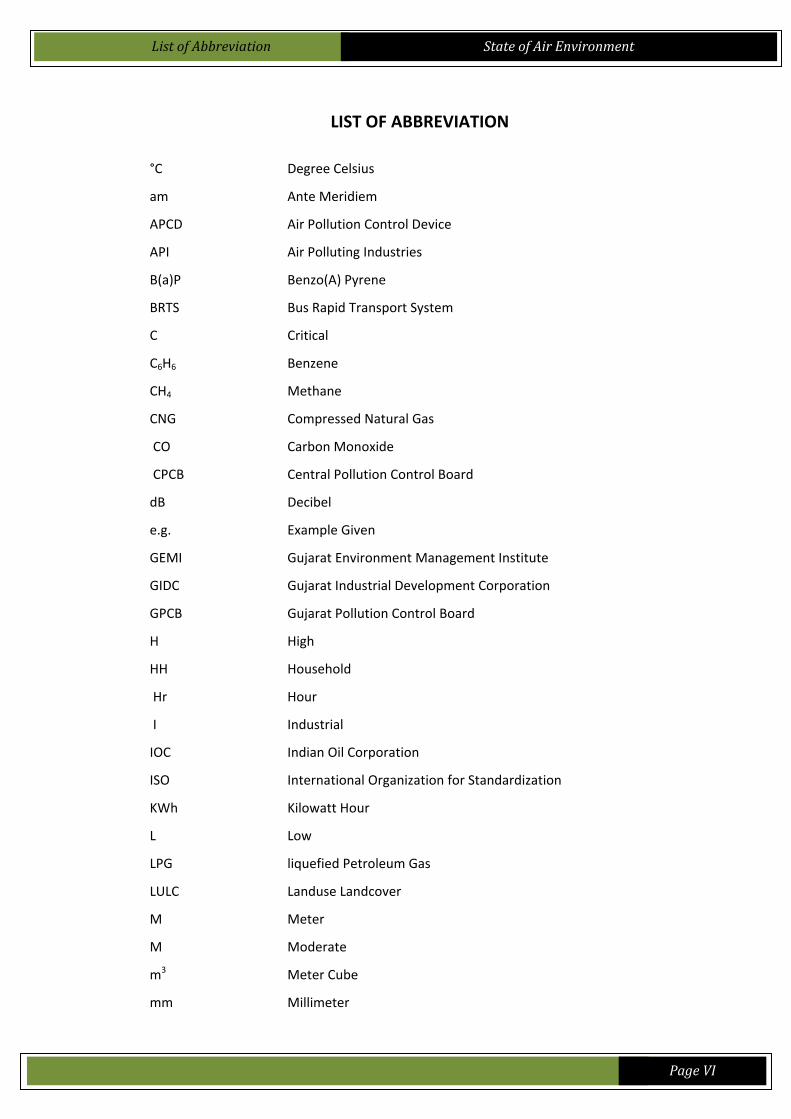
LIST OF ABBREVIATION
°C Degree Celsius
am Ante Meridiem
APCD Air Pollution Control Device
API Air Polluting Industries
B(a)P Benzo(A) Pyrene
BRTS Bus Rapid Transport System
C Critical
C6H6 Benzene
CH4 Methane
CNG Compressed Natural Gas
CO Carbon Monoxide
CPCB Central Pollution Control Board
dB Decibel
e.g. Example Given
GEMI Gujarat Environment Management Institute
GIDC Gujarat Industrial Development Corporation
GPCB Gujarat Pollution Control Board
H High
HH Household
Hr Hour
I Industrial
IOC Indian Oil Corporation
ISO International Organization for Standardization
KWh Kilowatt Hour
L Low
LPG liquefied Petroleum Gas
LULC Landuse Landcover
M Meter
M Moderate
m3 Meter Cube
mm Millimeter

List of Abbreviation State of Air Environment
Page VII
MoEF Ministry of Environment and Forest
MoPNG Union Ministry of Petroleum And Natural Gas
MW Mega Watt
NAAQS National Ambient Air Quality Standards
NAMP National Air Quality Monitoring Programme
NFHS National Family Health Survey
NG Natural Gas
NH3 Ammonia
Ni Nickel
NIOH National institute of Occupational Hazard
NO Nitric Oxide
No. Number
NO2 Nitrogen Dioxide
NOx Oxides of Nitrogen
O3 Ozone
PAHs Polycyclic Aromatic Hydrocarbons
Pb Lead
PM Particulate Matter
pm Post meridiem
PM10 Particles having diameter of less than 10 µm
PM2.5 Particles having diameter of less than 2.5 µm
ppm Parts Per Million
PSU Public Sector Undertaking
PUC Pollution Under Control
Pvt. Ltd. Private Limited
R Residential
R & D Research and Development
RO Regional Office
RSPM Respiratory Suspended Particulate Matter
SAMP State Air Quality Monitoring Programme
SMEs Small and Medium Enterprises
SO2 Sulfur Dioxide
SPM Suspended Particulate Matter
List of Abbreviation State of Air Environment
Page VIII
TB Tuberculosis
ug/m3 Microgram/cubic meter
um Micro‐Meters
UNEP United Nations Environment Program
UV UltraViolet
viz. Videlicet (namely)
VOCs Volatile Organic Compounds
WHO World Health Organisation

Executive Summary
Executive Summary State of Air Environment
Page IX
EXECUTIVE SUMMARY
Air is an important life sustaining resource. Given the fact that a person breathes in more than six liters of air every minute, the quality of air becomes a prime concern. The composition of air in natural environment is constant but is being changed due to release of large amount of emissions by industries, automobiles and other sources. This changed quality became a great threat to survival of life, properties, materials and ecosystem as a whole. Gujarat was among the States scoring minimum percentile (0‐20) for Air quality in a study undertaken by ‘Center for Development Finance – Institute For Financial Management & Research’ ‐ Chennai in 2011 named ‘Environmental Sustainability Index for Indian States.’
This report on Air is divided into five sections namely – ‘Pressure’ which discusses the factors which contribute to the quality of Air in Gujarat, ‘State’ elaborates the present quality of Air with respect to various parameters such as SO2, NOx, SPM, RSPM, PM2.5, VOCs etc, ‘Impact’ details out the impact of air quality especially on human health and other things, ‘Response’ features various steps taken at national and state level to improve overall air quality and ‘Recommendations’ suggest some measures which can help improve the present scenario of Air Quality at policy level. Local initiatives that can go a long way in improving quality of air have also been mentioned.
The contributing factors to air pollution are largely Population, Urbanisation, Industries, Vehicles, domestic sources etc. In addition, meteorological and climatic conditions of any area are responsible for contributing to the background air quality levels. Rainfall, wind speed, temperature and soil type are important in this category.
Urban population in Gujarat has risen from 37.36 per cent in 2001 to 42.58% in 2011, making it one of the fastest growing urbanised states. This Concentration of population in urban centers makes huge pressures on land, air and water pollution. Ahmedabad is the largest city of Gujarat with 7.2 million people living here. Surat and Vadodara are other two major cities with high number of urban population followed by Rajkot with population of 1.50 million. As per Census 2011, Gujarat has 30 urban centers with more than 1 lac population. Seven Municipal Corporations contribute to 56.12% of the total urban population of the state. The air temperatures in densely built urban areas are often higher than the temperatures of the surrounding countryside.
The State has continued to witness impressive industrial development since its inception. There are 182 industrial estates spread throughout the State covering an area of 3200 hectares, 83 industrial clusters, 60 notified SEZs and 11 notified SIRs. Also a major part of DMIC corridor (38%) is going to pass through Gujarat. The total number of industries having pollution potential as registered with Gujarat Pollution Control Board as on 02/05/2012 is 22125 out of which 16511 belong to air polluting category. Coal based power generation is considered to be a major contributor to air pollution and in Gujarat; power generation is largely coal based to the tune of 54%. Among air polluting sectors, minerals industry ranks among the top. The impact of mining on air starts from exploration phase, increases manifold during operational phase and may even extend beyond the mine closure. The fugitive emission is a common phenomena related to mining, which is very significant in case of open cast mining as compared to undergrounding. In addition to this, waste handling, transportation and its storage also have high dust potential. Mining covers only 0.033% of
Page X
Executive Summary State of Air Environment
the total state area. Though Kachchh (28.18km2) has maximum area under mining, Sabarkantha has highest percentage in landuse under mining. Mining in Gujarat is usually done for production of Agate, Steatite , Gypsum, Limestone, Lignite, Bauxite, Laterite, Dolomite, Clay (others), China Clay, Bentonite, Quartz ,Silica sand and Chalk.
Vehicular air pollution is one of the major contributors to the overall air pollution in any area. The fleet of vehicles in Gujarat has been growing at phenomenal proportion. The vehicular population in the last decade has grown from 5576040 to 12993135 (133%). In 2011 major contributor to the fleet are the two wheelers forming 73.17%, followed by private cars and goods vehicles. Public transport systems have not been able to keep pace with the rapid and substantial increases in demand over the past few decades.
Another major source of air pollution is burning of fossil fuels. The household sector is the second largest consumer of energy in India after the industrial sector. Gujarat still has 77.30% rural population using unprocessed solid fuel. The improvement in 5 years from NFHS‐ 2 and NFHS ‐3 is marginal and the usage of unprocessed fuel is reduced only by marginal 4.7 % in rural areas. For a progressive state like Gujarat having abundant natural resources, this is an alarming figure.
An inventory of air pollutants is a necessary first step towards control of air pollution. The ambient air quality is monitored in the State by Gujarat Pollution Control Board. The parameters being monitored are SO2, NOx, SPM & RSPM. The data for the years 2006 to 2010 has been analysed. Monitoring of PM 2.5 has also been started in Ahmedabad since June 2011. Monitoring of VOCs for 25 industrial clusters in Gujarat has also been initiated since May 2011. Noise levels are being monitored only during festivals of Navratri and Diwali.
Trends in Annual Average Concentration of SO2, NOx, SPM and RSPM show that the air pollution in residential areas with respect to SO2 and NOx is within limits but SPM and RSPM levels are a cause for concern in most cities in the state. Trends in PM2.5 for Ahmedabad which is a recent addition have also been shown. Values are consistently high at traffic junctions like Nehru Bridge in Ahmedabad. At other locations, higher values are observed during winter months and lower levels are observed during monsoon months. The winter months are relatively much calmer than other months. The prevailing calm conditions facilitate more stability to atmosphere and consequently slow dispersion of pollutants generated and help in build up of pollutants in vicinity of the pollutant sources. If we look into the industrial clusters, the values of SO2, NOx, SPM and RSPM do not cross the critical levels in general. However, if we consider benzene, then industrial areas of Naroda, Vatva, Pandesara, Ankleshwar, Panoli and Dahej exhibit continuously higher values. Hot Spots based on the pressures have been identified in the state. Major contributors to air pollution are Population, industries and Vehicles. Rate of urbanisation and industrialization leading to growth of vehicles overall make cities Ahmedabad, Surat, Vadodara and Rajkot the hot spots for air pollution.
The United Nations Environment Programme has estimated that globally 1.1 billion people breathe unhealthy air (UNEP, 2002). Epidemiological studies have shown that concentrations of ambient air particles are associated with a wide range of effects on human health, especially on the cardio‐respiratory system. Beyond its human health impacts, air pollution is also detrimental to ecosystems. Through direct exposure and accumulation, reactive compounds negatively impact plant growth and are primary contributors to acid rain, which can diminish fish stocks, decrease biological diversity in
Executive Summary State of Air Environment
Page XI
sensitive ecosystems, degrade forests and soils, and diminish agricultural productivity. Air pollution is also known to have damaging effect on non living materials in the form of corrosion of metal, soiling and eroding of building surfaces etc. No health impact studies due to air pollution have been carried out in Gujarat in recent past.
Various efforts have been made by stakeholders to abate air pollution from different sources. These efforts are being made at national, state and individual level to adopt strategies that can reduce the impacts due to air pollution. Government of India enacted the Air (Prevention and Control of Pollution) Act 1981 to arrest the deterioration in the air quality. At national level, the efforts were in the form of Tightening of Ambient Air Quality Norms, Preparation of Zoning Atlas, Improved Vehicle Emission Norms, Improved Fuel Quality Norms etc. At state level, efforts are in the form of Air Action Plans, Monitoring of Industries, Strengthening of PUC Stations, CNG/LPG Infrastructure for Auto Gas Supply, Registration of Retrofitters, Banning of Old Autos & Conversion to CNG in Ahmedabad, Improved Public Transport System. Promoting public bus transport is viewed as a top priority area to improve urban road traffic and for controlling air pollution from automobiles. Efforts at individual level are in the form of Conversion of Vehicles to Cleaner Fuel (CNG/LPG), Use of Natural Gas by Industries, shifting from solid fuels at household level.
To focus the actions in right direction to reduce ambient air pollution; source apportionment exercises to find out the qualitative and quantitative contribution of various sources are needed to be carried out. Also there is a need to extend Ambient Air Quality Monitoring Programme to remaining areas in the State and to incorporate other parameters in monitoring as per the ambient air quality standards notified in 2009. More epidemiological studies need to be conducted at regular intervals to detect and analyze the health effects of air pollution. There is a need to strengthen Mass Transportation in cities and to promote use of cleaner fuel. Improvement in traffic management system to relieve congestion is urgently called for by linking the by lanes and introducing parallel road system. Pedestrianising busy areas in peak periods, permitting parking at nodal points by designating parking areas need to be implemented. Since there are multiple contributors to air pollution like vehicles, industries, fuel burning etc., therefore, control strategies require active co‐operation among all the concerned agencies and require creation of some common form where all the agencies can come together to plan strategies and programmes to prevent and control air pollution.

Introduction
Introduction
State of Air Environment
Page 1
INTRODUCTION
Air is an important life sustaining resource. Given the fact that a person breathes in more
than six liters of air every minute, the quality of air becomes a prime concern. Air
pollution as defined under Air (Prevention & Control of Pollution) Act 1981 is “presence
of any solid, liquid or gaseous substance (including noise) in the atmosphere in such
concentrations as may be injurious to human beings or other living creatures or plants or
property or environment.” The composition of air in natural environment is constant but
is being changed due to release of large amount of emissions by industries, automobiles
and other sources. This changed quality has become a great threat to survival of life and
ecosystem as a whole.
The World Bank has predicted that India’s water, air, soil and forest resources will be
under more human pressure than those of any other country by the year 2020. India is
also ranked lowest (132) for its air quality (effect on Human Health) in the recent
Environmental Performance Index conducted by Environmental Research Centers at Yale
and Columbia Universities in 2011. A study ‘Environmental Sustainability Index for Indian
States’ undertaken by the Center for Development Finance of Institute For Financial
Management & Research’ Chennai indicates that Gujarat faces maximum challenge in
maintaining environment. ESI is constructed as a composite index using 41 key
environmental indicators which are further grouped into nine thematic sub indices –air
quality and pollution, water quality and availability, land use and agriculture, forest and
biodiversity, waste generation and management, energy management, impact on human
health & disaster, population pressure on ecosystem and environmental budget. Gujarat
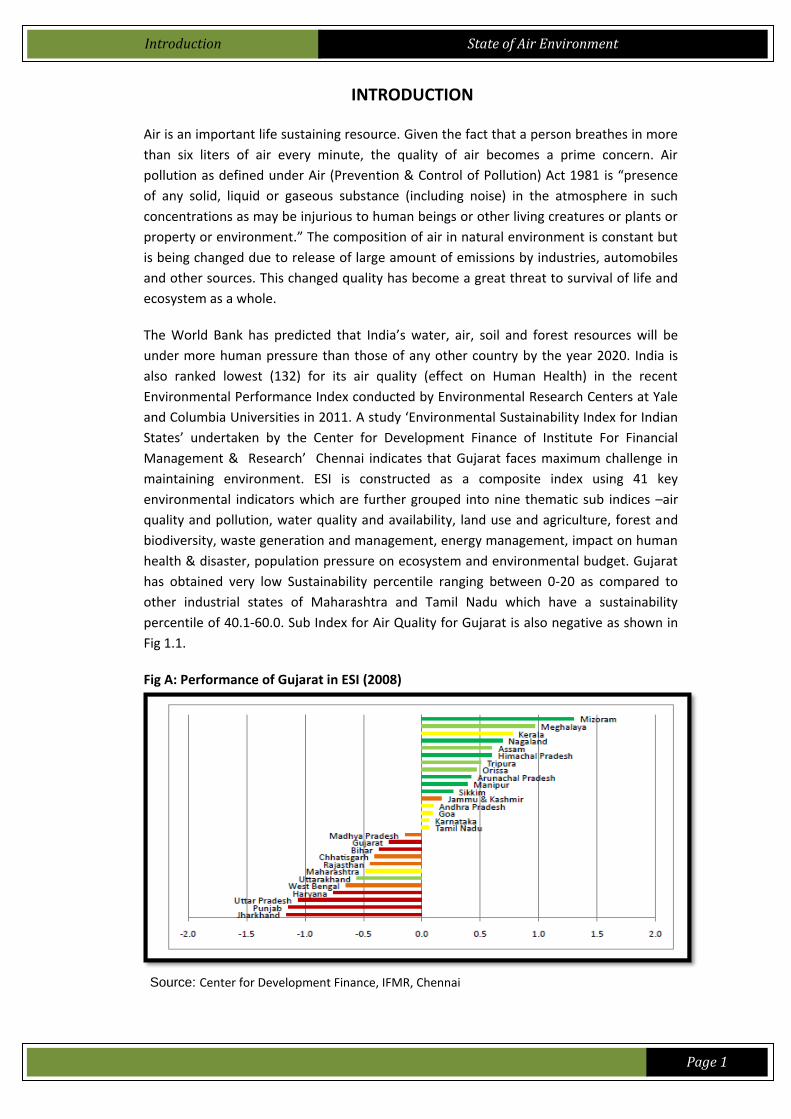
has obtained very low Sustainability percentile ranging between 0-20 as compared to
other industrial states of Maharashtra and Tamil Nadu which have a sustainability
percentile of 40.1-60.0. Sub Index for Air Quality for Gujarat is also negative as shown in
Fig 1.1.
Fig A: Performance of Gujarat in ESI (2008)
Source: Center for Development Finance, IFMR, Chennai
Introduction
State of Air Environment
Page 2
Another study titled ‘Comprehensive Environmental Assessment of Industrial Clusters’
was done by CPCB in 2009 for 88 industrial clusters. From Gujarat; Ahmedabad,
Ankleshwar, Junagadh, Rajkot, Surat, Vadodara, Vapi, and Vatva figure in this list in
terms of air pollution.
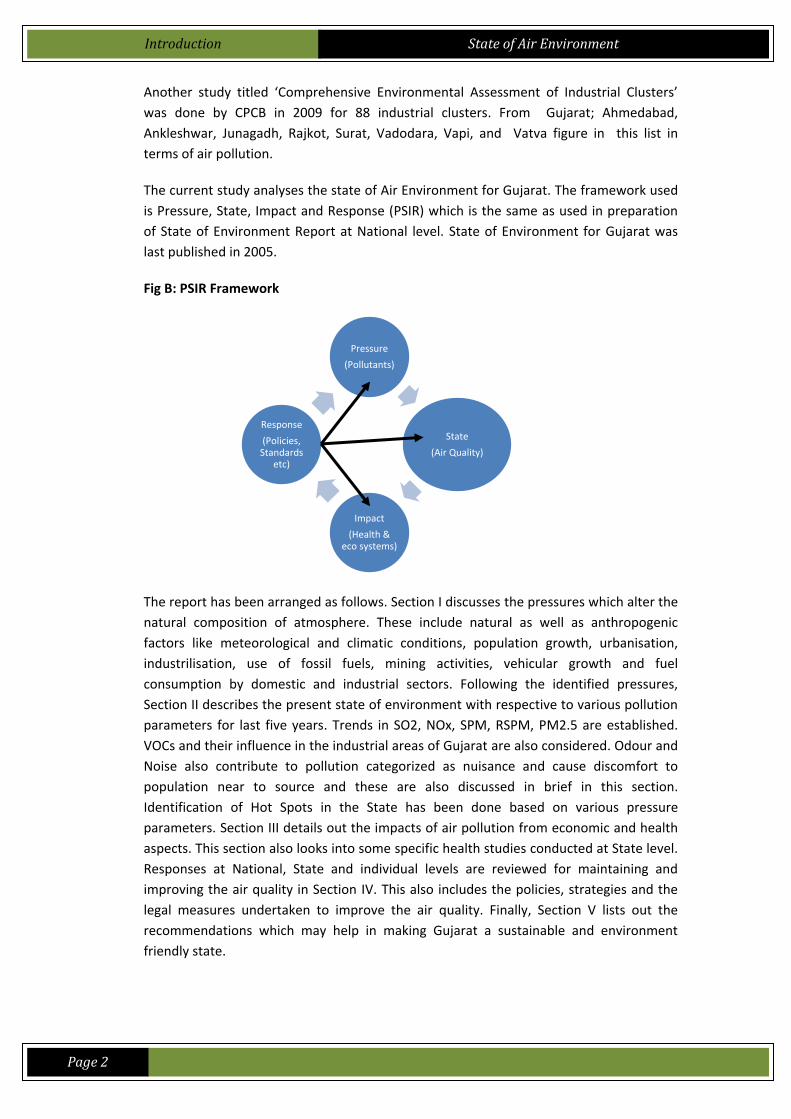
The current study analyses the state of Air Environment for Gujarat. The framework used
is Pressure, State, Impact and Response (PSIR) which is the same as used in preparation
of State of Environment Report at National level. State of Environment for Gujarat was
last published in 2005.
Fig B: PSIR Framework
The report has been arranged as follows. Section I discusses the pressures which alter the
natural composition of atmosphere. These include natural as well as anthropogenic
factors like meteorological and climatic conditions, population growth, urbanisation,
industrilisation, use of fossil fuels, mining activities, vehicular growth and fuel
consumption by domestic and industrial sectors. Following the identified pressures,
Section II describes the present state of environment with respective to various pollution
parameters for last five years. Trends in SO2, NOx, SPM, RSPM, PM2.5 are established.
VOCs and their influence in the industrial areas of Gujarat are also considered. Odour and
Noise also contribute to pollution categorized as nuisance and cause discomfort to
population near to source and these are also discussed in brief in this section.
Identification of Hot Spots in the State has been done based on various pressure
parameters. Section III details out the impacts of air pollution from economic and health
aspects. This section also looks into some specific health studies conducted at State level.
Responses at National, State and individual levels are reviewed for maintaining and
improving the air quality in Section IV. This also includes the policies, strategies and the
legal measures undertaken to improve the air quality. Finally, Section V lists out the
recommendations which may help in making Gujarat a sustainable and environment
friendly state.
Pressure
(Pollutants)
State
(Air Quality)
Impact
(Health & eco systems)
Response
(Policies, Standards
etc)
Section I - Pressures
Section I – Pressure
State of Air Environment
Page 3
SECTION I - PRESSURE
The study of air pollution requires a clear understanding of all sources contributing to air
pollutants. Even from the control point of view; the sources of pollution need to be
identified to take corrective measures in the right direction. Following sub sections
describe the various sources which exert pressure on air quality.
1.1 Air Pollutants
Air pollutants can be natural or may be the result of various anthropogenic activities like
industrial, vehicular or other emissions. Further the air pollutants can be primary or
secondary depending upon their formation mechanism. Primary pollutants are directly
emitted from the source and secondary pollutants are formed in the atmosphere. Air
pollutants are classified into particulate matter and gaseous pollutants. Table 1.1
highlights various air pollutants and their most common sources of generation.
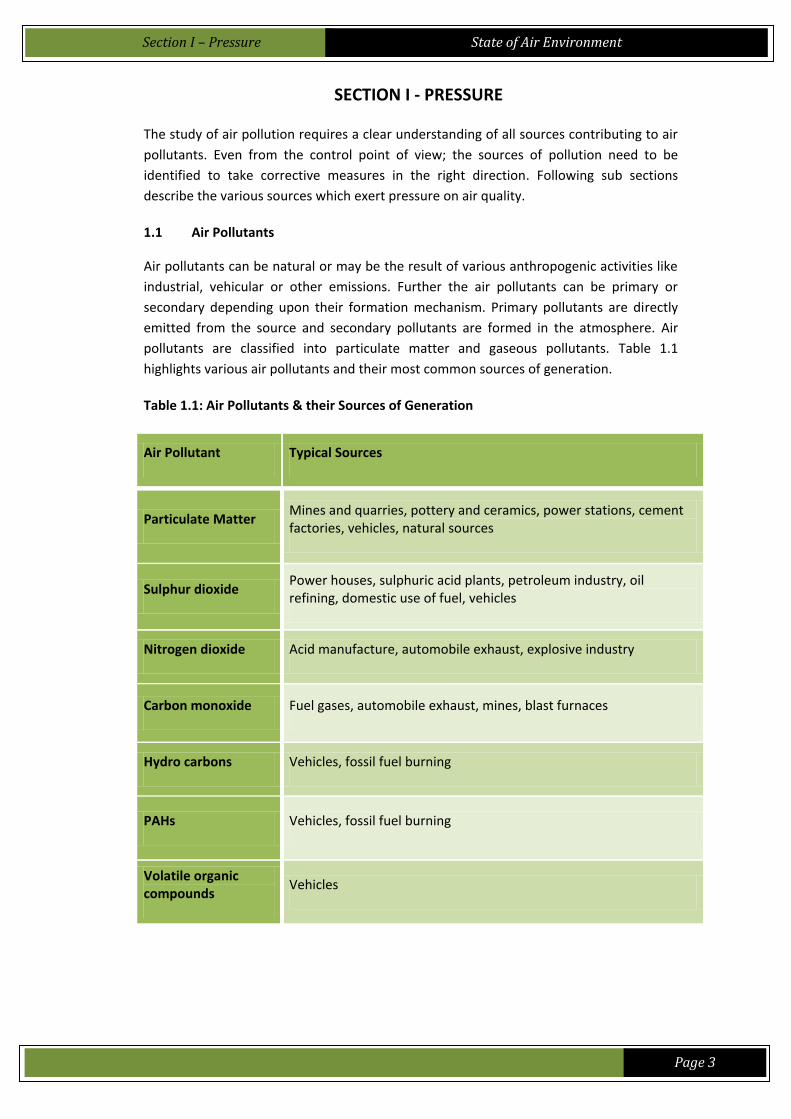
Table 1.1: Air Pollutants & their Sources of Generation
Air Pollutant Typical Sources
Particulate Matter Mines and quarries, pottery and ceramics, power stations, cement factories, vehicles, natural sources
Sulphur dioxide Power houses, sulphuric acid plants, petroleum industry, oil refining, domestic use of fuel, vehicles
Nitrogen dioxide Acid manufacture, automobile exhaust, explosive industry
Carbon monoxide Fuel gases, automobile exhaust, mines, blast furnaces
Hydro carbons Vehicles, fossil fuel burning
PAHs Vehicles, fossil fuel burning
Volatile organic compounds
Vehicles

Section I – Pressure
State of Air Environment
Page 4
1.2 Pressures on Air Quality
1.2.1 Meteorological & Climatic Conditions
Meteorological variables are a major contributor to the overall air quality of an area.
Even though the total discharge of air pollutants into the atmosphere may remain
constant, the ambient concentrations of air pollutants may vary depending upon the
meteorological conditions. The main parameters which directly affect concentrations of
pollutants are geophysical features of an area, rainfall and wind speed. Higher
concentrations are observed in the winter months when poor dispersion conditions
prevail. This relationship is reflected in the seasonal variation in the pollutant
concentrations.
Another important contributing factor is ambient temperature. Low temperatures during
the winter months lead to increased fuel usage for heating purposes. When solid fuels
are combusted for domestic heating, particulate emissions increase. This, together with
poor dispersion conditions, is likely to be key contributor to high concentration of air
pollutants in winter. During summer, the phenomenon of natural dust-laden winds from
arid and semi arid regions increase the PM levels.
Table 1.2: Climatic Regions of Gujarat
Region Districts Climate Rainfall (mm) Soil
Southern Hills Dang &Valsad Semi arid dry sub humid
1793 Deep black and coastal alluvial
Southern Gujarat
Surat, Bharuch Semi arid dry sub humid
974 Deep black and coastal alluvial
Middle Gujarat Vadodara, Kheda, Panchmahals
Semi arid 904 Medium black
North Gujarat Ahemdabad, Mehsana,Gandhinagar, Sabarkantha, Banaskantha
Arid 735 Gray brown costal alluvial
North west arid Kachchh Arid 340 Gray brown Deltic alluvial
North Saurashtra
Amreli, Bhavnagar, Jamnagar, Rajkot, Surendranagar
Semi Arid 537 Medium Black Calcarous
South Saurashtra
Junagadh Dry sub humid 844 Costal Alluvium Medium blacks
Source:GEC Report 2007
Section I – Pressure
State of Air Environment
Page 5
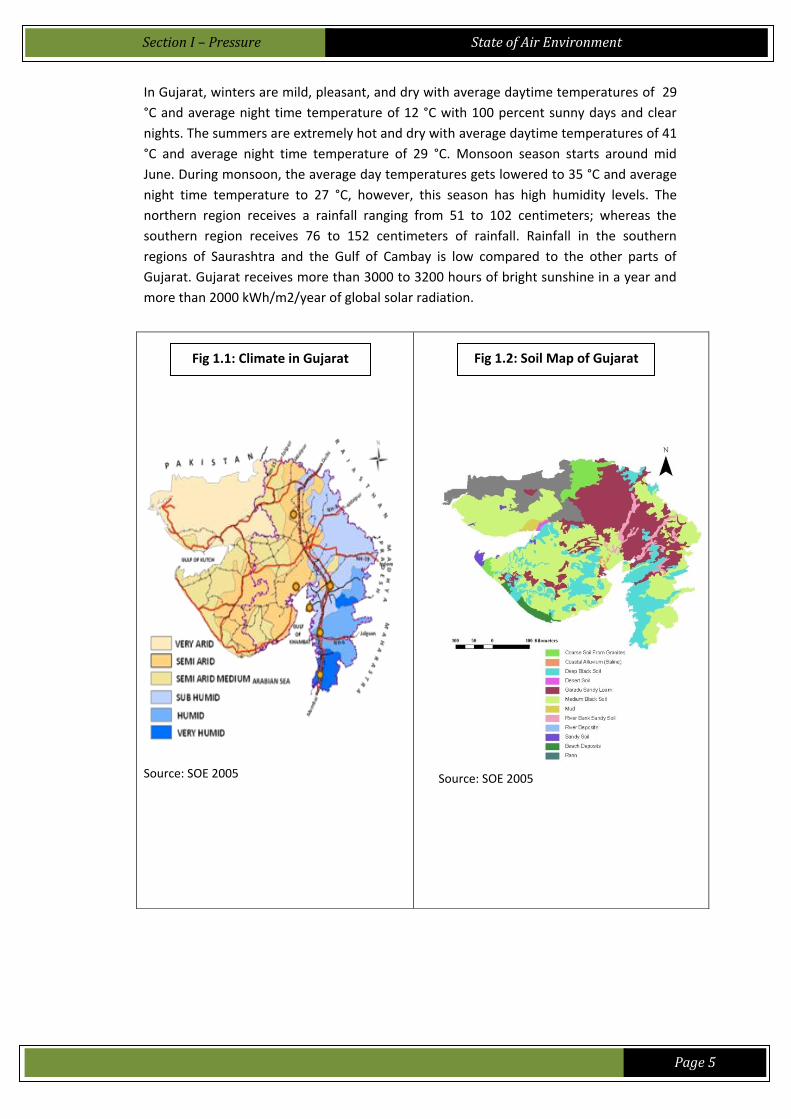
In Gujarat, winters are mild, pleasant, and dry with average daytime temperatures of 29
°C and average night time temperature of 12 °C with 100 percent sunny days and clear
nights. The summers are extremely hot and dry with average daytime temperatures of 41
°C and average night time temperature of 29 °C. Monsoon season starts around mid
June. During monsoon, the average day temperatures gets lowered to 35 °C and average
night time temperature to 27 °C, however, this season has high humidity levels. The
northern region receives a rainfall ranging from 51 to 102 centimeters; whereas the
southern region receives 76 to 152 centimeters of rainfall. Rainfall in the southern
regions of Saurashtra and the Gulf of Cambay is low compared to the other parts of
Gujarat. Gujarat receives more than 3000 to 3200 hours of bright sunshine in a year and
more than 2000 kWh/m2/year of global solar radiation.
Source: SOE 2005
Source: SOE 2005
Fig 1.1: Climate in Gujarat
Fig 1.2: Soil Map of Gujarat
Section I – Pressure
State of Air Environment
Page 6
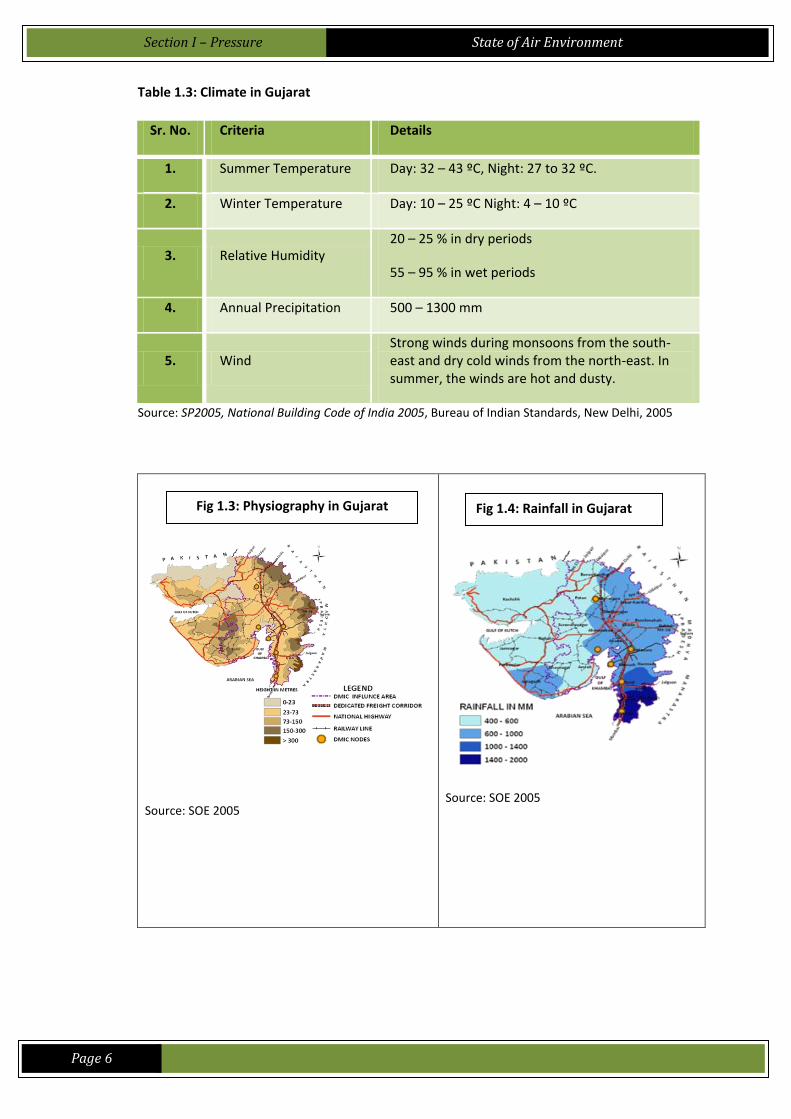
Table 1.3: Climate in Gujarat
Sr. No. Criteria Details
1. Summer Temperature Day: 32 – 43 ºC, Night: 27 to 32 ºC.
2. Winter Temperature Day: 10 – 25 ºC Night: 4 – 10 ºC
3. Relative Humidity 20 – 25 % in dry periods
55 – 95 % in wet periods
4. Annual Precipitation 500 – 1300 mm
5. Wind Strong winds during monsoons from the south-east and dry cold winds from the north-east. In summer, the winds are hot and dusty.
Source: SP2005, National Building Code of India 2005, Bureau of Indian Standards, New Delhi, 2005
Source: SOE 2005
Source: SOE 2005
Fig 1.3: Physiography in Gujarat
Fig 1.4: Rainfall in Gujarat
Section I – Pressure
State of Air Environment
Page 7
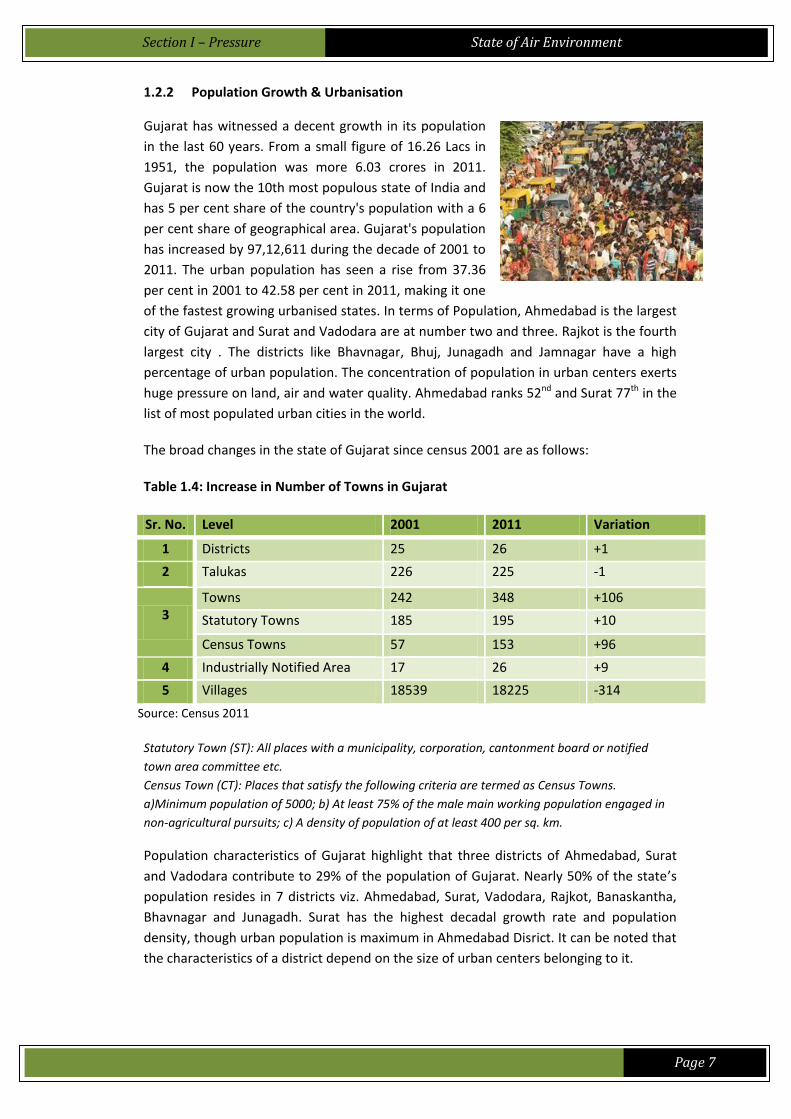
1.2.2 Population Growth & Urbanisation
Gujarat has witnessed a decent growth in its population
in the last 60 years. From a small figure of 16.26 Lacs in
1951, the population was more 6.03 crores in 2011.
Gujarat is now the 10th most populous state of India and
has 5 per cent share of the country's population with a 6
per cent share of geographical area. Gujarat's population
has increased by 97,12,611 during the decade of 2001 to
2011. The urban population has seen a rise from 37.36
per cent in 2001 to 42.58 per cent in 2011, making it one
of the fastest growing urbanised states. In terms of Population, Ahmedabad is the largest
city of Gujarat and Surat and Vadodara are at number two and three. Rajkot is the fourth
largest city . The districts like Bhavnagar, Bhuj, Junagadh and Jamnagar have a high
percentage of urban population. The concentration of population in urban centers exerts
huge pressure on land, air and water quality. Ahmedabad ranks 52nd and Surat 77th in the
list of most populated urban cities in the world.
The broad changes in the state of Gujarat since census 2001 are as follows:
Table 1.4: Increase in Number of Towns in Gujarat
Sr. No. Level 2001 2011 Variation
1 Districts 25 26 +1
2 Talukas 226 225 -1
3 Towns 242 348 +106
Statutory Towns 185 195 +10
Census Towns 57 153 +96
4 Industrially Notified Area 17 26 +9
5 Villages 18539 18225 -314
Source: Census 2011
Statutory Town (ST): All places with a municipality, corporation, cantonment board or notified
town area committee etc.
Census Town (CT): Places that satisfy the following criteria are termed as Census Towns.
a)Minimum population of 5000; b) At least 75% of the male main working population engaged in
non-agricultural pursuits; c) A density of population of at least 400 per sq. km.
Population characteristics of Gujarat highlight that three districts of Ahmedabad, Surat
and Vadodara contribute to 29% of the population of Gujarat. Nearly 50% of the state’s
population resides in 7 districts viz. Ahmedabad, Surat, Vadodara, Rajkot, Banaskantha,
Bhavnagar and Junagadh. Surat has the highest decadal growth rate and population
density, though urban population is maximum in Ahmedabad Disrict. It can be noted that
the characteristics of a district depend on the size of urban centers belonging to it.

Section I – Pressure
State of Air Environment
Page 8
Table1.5: Population Characteristics in Gujarat 2011
Sr. No. DISTRICT
Po
pu
lati
on
De
cad
al
Gro
wth
Rat
e
% o
f St
ate
Po
pu
lati
on
% R
ura
l
% U
rban
Po
pu
lati
on
De
nsi
ty
1 Ahmedabad 7208200
22.31 11.94 15.95 84.05 890
2 Amreli 1513614
8.59 2.51 74.51 25.49 205
3 Anand 2090276
12.57 3.46 69.68 30.32 711
4 Banaskantha 3116045
24.43 5.16 86.73 13.27 290
5 Bharuch 1550822
13.14 2.57 65.93 34.07 238
6 Bhavnagar 2877961
16.53 4.77 58.99 41.01 288
7 Dahod 2126558
29.95 3.52 91.01 8.99 582
8 Gandhinagar 1387478
12.15 2.30 56.79 43.21 660
9 Jamnagar 2159130
13.38 3.58 55.04 44.96 153
10 Junagadh 2742291
12.01 4.54 66.95 33.05 310
11 Kachchh 2090313
32.03 3.46 65.28 34.72 46
12 Kheda 2298934
12.81 3.81 77.24 22.76 541
13 Mehsana 2027727
9.91 3.36 74.65 25.35 462
14 Narmada 590379 14.77 0.98 89.56 10.44 214
15 Navsari 1330711
8.24 2.20 69.26 30.74 602
16 Panchmahal 2388267
17.92 3.96 86 14 458
17 Patan 1342746
13.53 2.22 79.07 20.93 234
18 Porbandar 586062 9.17 0.97 51.23 48.77 255
19 Rajkot 3799770
19.87 6.29 41.88 58.12 339
20 Sabarkantha 2427346
16.56 4.02 85.04 14.96 328
21 Surat 6079231
42.19 10.07 20.32 79.68 1376
22 Surendranagar
1755873
15.89 2.91 71.7 28.3 167
23 Tapi 806489 12.07 1.34 90.21 9.79 249
24 The Dang 226769 21.44 0.38 89.11 10.89 129
25 Vadodara 4157568
14.16 6.89 50.46 49.54 551
26 Valsad 1703068
20.74 2.82 62.77 37.23 561
Gujarat 60383628
19.17 100.00 57.42 42.58 308
India
68.84 31.16
Source: Provisional Population Totals, Census of India 2011
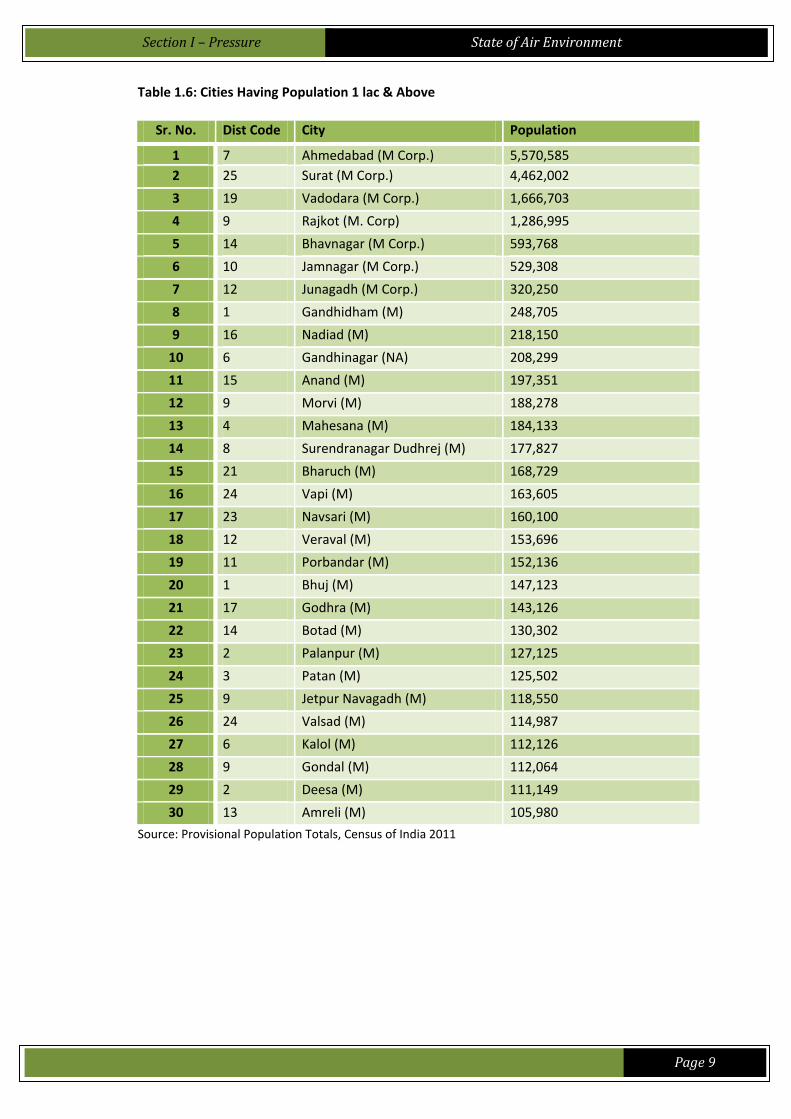
The State with a 42.58 percent urban population in 2011 has 30 urban centers with more
than 1 lac population. Seven Municipal Corporations contribute to 56.12 percent of the
total urban population of the state.
Section I – Pressure
State of Air Environment
Page 9
Table 1.6: Cities Having Population 1 lac & Above
Sr. No. Dist Code City Population
1 7 Ahmedabad (M Corp.) 5,570,585
2 25 Surat (M Corp.) 4,462,002
3 19 Vadodara (M Corp.) 1,666,703
4 9 Rajkot (M. Corp) 1,286,995
5 14 Bhavnagar (M Corp.) 593,768
6 10 Jamnagar (M Corp.) 529,308
7 12 Junagadh (M Corp.) 320,250
8 1 Gandhidham (M) 248,705
9 16 Nadiad (M) 218,150
10 6 Gandhinagar (NA) 208,299
11 15 Anand (M) 197,351
12 9 Morvi (M) 188,278
13 4 Mahesana (M) 184,133
14 8 Surendranagar Dudhrej (M) 177,827
15 21 Bharuch (M) 168,729
16 24 Vapi (M) 163,605
17 23 Navsari (M) 160,100
18 12 Veraval (M) 153,696
19 11 Porbandar (M) 152,136
20 1 Bhuj (M) 147,123
21 17 Godhra (M) 143,126
22 14 Botad (M) 130,302
23 2 Palanpur (M) 127,125
24 3 Patan (M) 125,502
25 9 Jetpur Navagadh (M) 118,550
26 24 Valsad (M) 114,987
27 6 Kalol (M) 112,126
28 9 Gondal (M) 112,064
29 2 Deesa (M) 111,149
30 13 Amreli (M) 105,980
Source: Provisional Population Totals, Census of India 2011

Section I – Pressure
State of Air Environment
Page 10
1.2.3 Urban Heat Islands
The air temperatures in densely built urban
areas are often higher than the temperatures
of the surrounding countryside. The term
“urban heat island” refers to increased surface
temperatures in some pockets of a city, caused
by an ever changing microclimate. The
difference between the maximum city
temperature (measured at the city center) and
the surrounding countryside is the urban heat-
island intensity. The density of the built
environment and the extent of tree cover or vegetation primarily affect the heat-island
intensity. Pollution and heat due to vehicular traffic, industrialisation and human
activities are other contributing factors. The heat released from combustion of fuels also
adds to the ambient temperature of a city.
The hot and still anti-cyclonic weather conditions that are responsible for intense urban
heat island events also produce high air pollution levels. The chemical reactions that
produce ozone and smog are accelerated by high temperatures whilst low wind speeds
ensure that the heat and pollution remains trapped in the city. Climate Variables
affecting Heat Island are temperature, wind speed, solar irradiance & cloud cover,
relative humidity and precipitation.
Very few Heat island studies have been conducted so far and the pressure of Heat Island
in urban India is deliberated only in some conferences, seminars and papers published in
various journals. Remote Sensing and image processing tools are used to analyse the heat
island phenomenon. Detailed studies for Heat Island Intensity of Gujarat cities are not
available. It is likely that Amedabad and Surat may have a high Heat Island Intensity due
to high urbanization, vehicular growth and industrialisation. Vadodara and Rajkot with
their urban expansion and reducing tree cover may also possess moderate Heat Island
Intensity.
1.2.4 Industrialisation
Gujarat has continued to witness impressive
industrial development. Government of Gujarat
while announcing Industrial Policy in 2003 and 2009
had given strong emphasis on making Gujarat based
industries competitive enough to meet with
challenges of globalization. For this purpose
Government also announced various schemes such
as assistance for cleaner technology, upgradation of
technology for manufacturing and environmental
management system, subsidy for R & D activities and interest subsidy to SMES etc. An
important feature of the Industrial Policy is the scheme of cluster development. In the
state, 83 clusters have been identified with a range of industries. They are being
Section I – Pressure
State of Air Environment
Page 11
strengthened with Government assistance in the form of developing common facilities
centers, up gradation of infrastructure, conducting training programmes for skill up
gradation etc. Gujarat Industrial Development Corporation is the agency responsible for
developing industrial estates in the State & industrial units get developed plots/sheds
with all amenities for setting up their units. There are 182 industrial estates spread
throughout the State covering an area of 3200 hectares. Also 60 SEZs have been notified
in the State so far. SIR Act was enacted by the State in 2009 for creating large size
investment regions in the State and to develop these regions as global hubs of economic
activity having world class infrastructure. Eleven such SIRs have been notified so far and
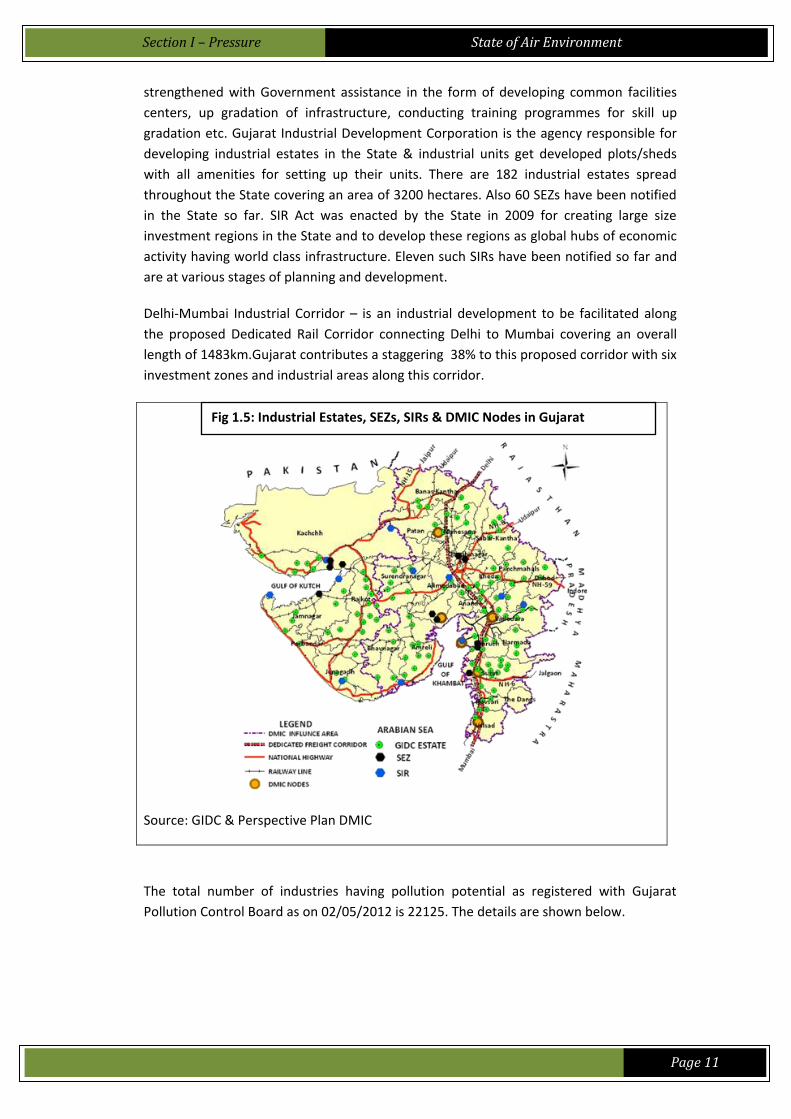
are at various stages of planning and development.
Delhi-Mumbai Industrial Corridor – is an industrial development to be facilitated along
the proposed Dedicated Rail Corridor connecting Delhi to Mumbai covering an overall
length of 1483km.Gujarat contributes a staggering 38% to this proposed corridor with six
investment zones and industrial areas along this corridor.
Source: GIDC & Perspective Plan DMIC
The total number of industries having pollution potential as registered with Gujarat
Pollution Control Board as on 02/05/2012 is 22125. The details are shown below.
Fig 1.5: Industrial Estates, SEZs, SIRs & DMIC Nodes in Gujarat
Section I – Pressure
State of Air Environment
Page 12
Table 1.7: Industries Registered with GPCB
Details of Industries Number
Total industries registered with GPCB 22125 Industries falling under Water Act 19302
Industries falling under Air Act 16509
Industries falling under Hazardous Waste Rules 14856
Industry under Red category 13780
Industry under Orange category 4694
Industry under Green category 3651
Small Scale industries 19132
Medium Scale Industries 984
Large Scale Industries 2006 Source: GPCB
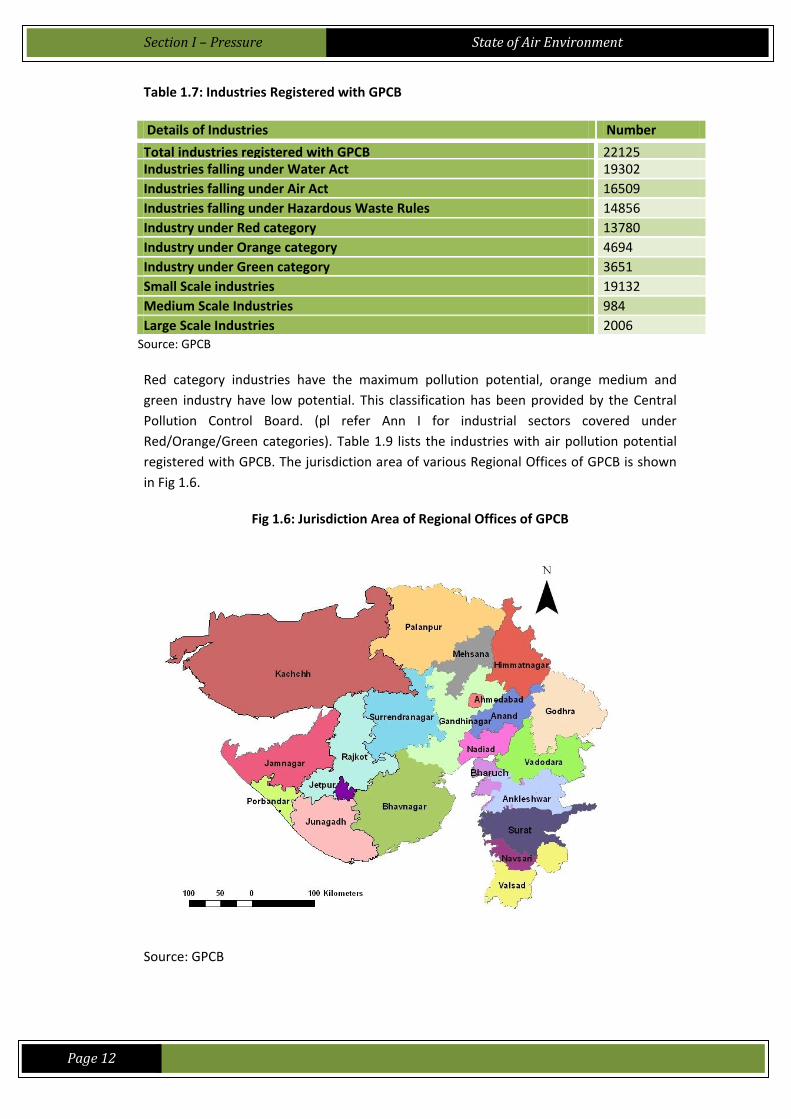
Red category industries have the maximum pollution potential, orange medium and
green industry have low potential. This classification has been provided by the Central
Pollution Control Board. (pl refer Ann I for industrial sectors covered under
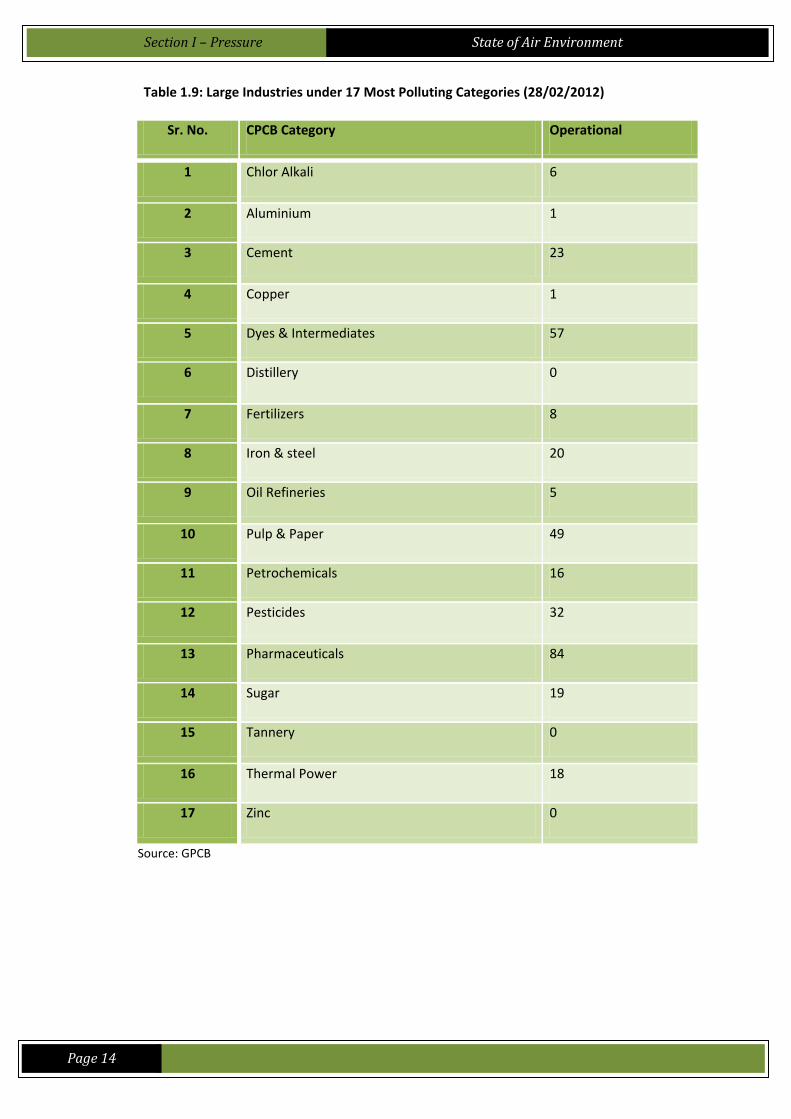
Red/Orange/Green categories). Table 1.9 lists the industries with air pollution potential
registered with GPCB. The jurisdiction area of various Regional Offices of GPCB is shown
in Fig 1.6.
Fig 1.6: Jurisdiction Area of Regional Offices of GPCB
Source: GPCB
Section I – Pressure
State of Air Environment
Page 13
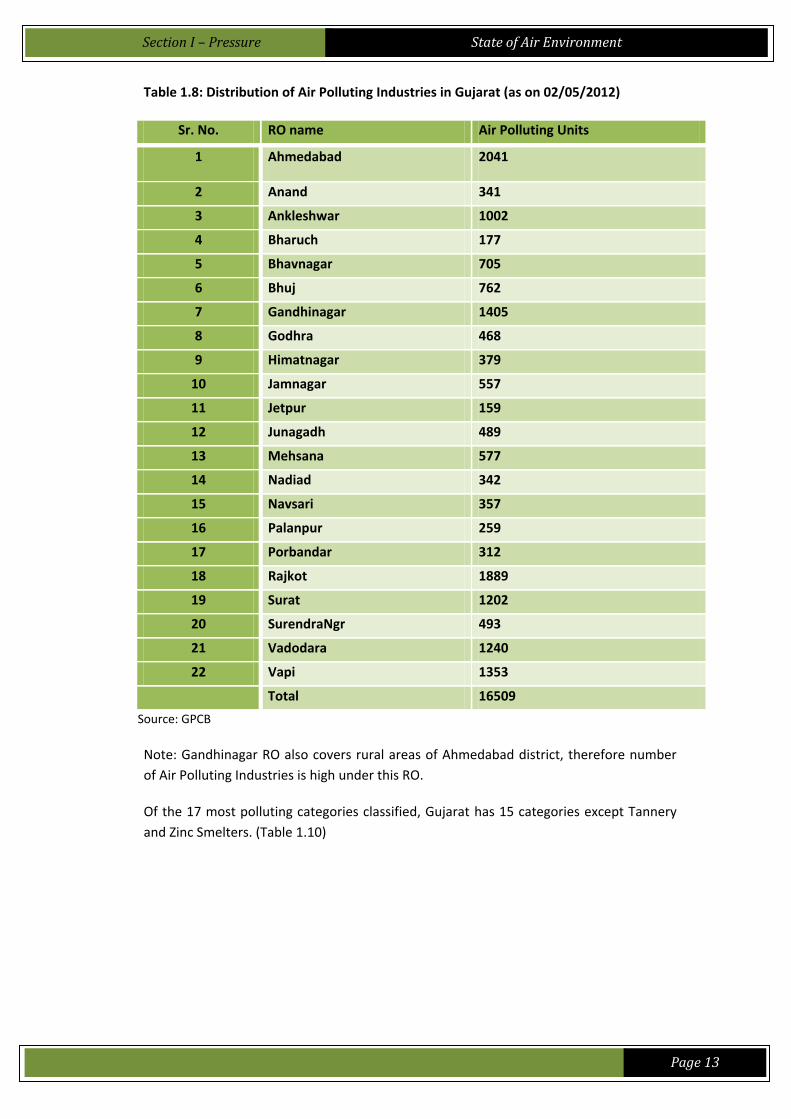
Table 1.8: Distribution of Air Polluting Industries in Gujarat (as on 02/05/2012)
Sr. No. RO name Air Polluting Units
1 Ahmedabad 2041
2 Anand 341
3 Ankleshwar 1002
4 Bharuch 177
5 Bhavnagar 705
6 Bhuj 762
7 Gandhinagar 1405
8 Godhra 468
9 Himatnagar 379
10 Jamnagar 557
11 Jetpur 159
12 Junagadh 489
13 Mehsana 577
14 Nadiad 342
15 Navsari 357
16 Palanpur 259
17 Porbandar 312
18 Rajkot 1889
19 Surat 1202
20 SurendraNgr 493
21 Vadodara 1240
22 Vapi 1353
Total 16509
Source: GPCB
Note: Gandhinagar RO also covers rural areas of Ahmedabad district, therefore number
of Air Polluting Industries is high under this RO.
Of the 17 most polluting categories classified, Gujarat has 15 categories except Tannery
and Zinc Smelters. (Table 1.10)
Section I – Pressure
State of Air Environment
Page 14
Table 1.9: Large Industries under 17 Most Polluting Categories (28/02/2012)
Sr. No. CPCB Category Operational
1 Chlor Alkali 6
2 Aluminium 1
3 Cement 23
4 Copper 1
5 Dyes & Intermediates 57
6 Distillery 0
7 Fertilizers 8
8 Iron & steel 20
9 Oil Refineries 5
10 Pulp & Paper 49
11 Petrochemicals 16
12 Pesticides 32
13 Pharmaceuticals 84
14 Sugar 19
15 Tannery 0
16 Thermal Power 18
17 Zinc 0
Source: GPCB
Section I – Pressure
State of Air Environment
Page 15
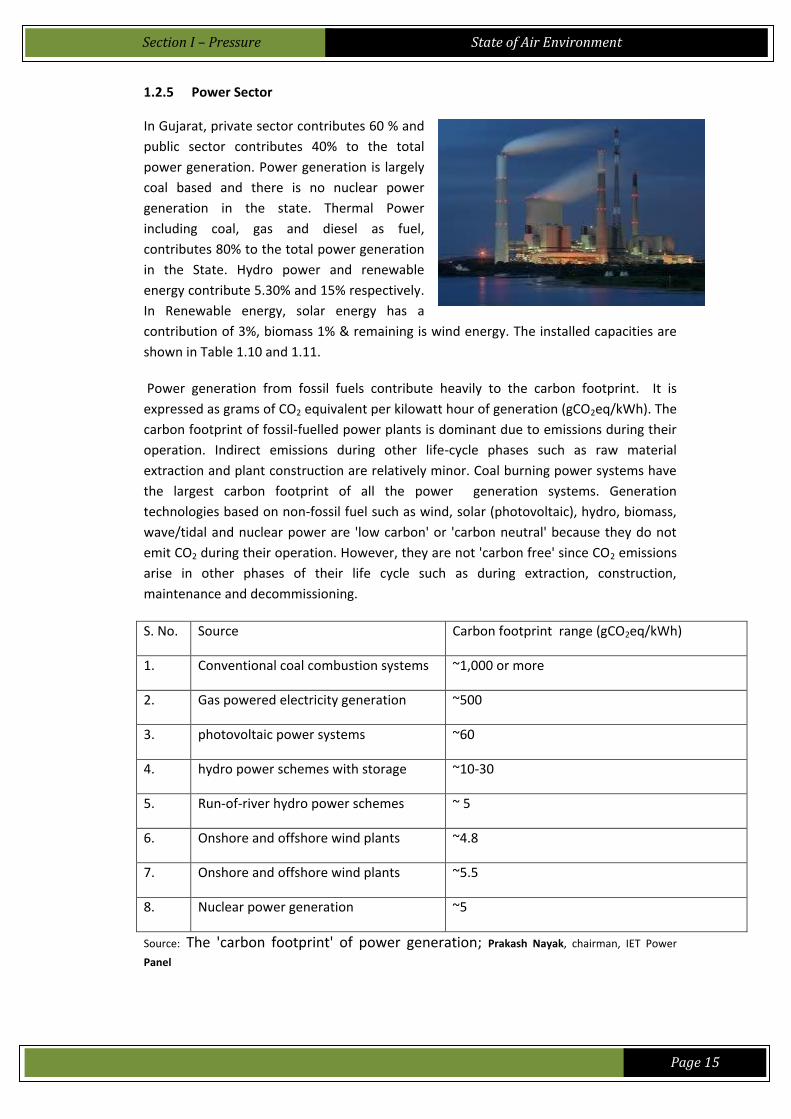
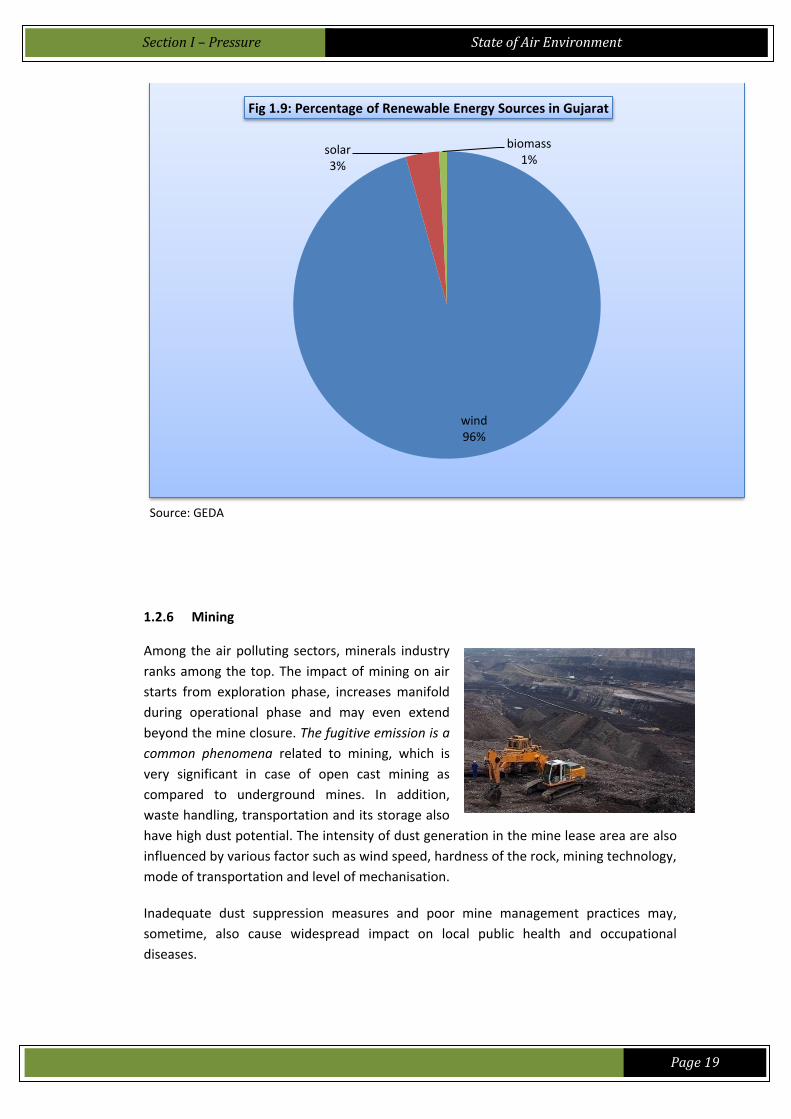
1.2.5 Power Sector
In Gujarat, private sector contributes 60 % and
public sector contributes 40% to the total
power generation. Power generation is largely
coal based and there is no nuclear power
generation in the state. Thermal Power
including coal, gas and diesel as fuel,
contributes 80% to the total power generation
in the State. Hydro power and renewable
energy contribute 5.30% and 15% respectively.
In Renewable energy, solar energy has a
contribution of 3%, biomass 1% & remaining is wind energy. The installed capacities are
shown in Table 1.10 and 1.11.
Power generation from fossil fuels contribute heavily to the carbon footprint. It is
expressed as grams of CO2 equivalent per kilowatt hour of generation (gCO2eq/kWh). The
carbon footprint of fossil-fuelled power plants is dominant due to emissions during their
operation. Indirect emissions during other life-cycle phases such as raw material
extraction and plant construction are relatively minor. Coal burning power systems have
the largest carbon footprint of all the power generation systems. Generation
technologies based on non-fossil fuel such as wind, solar (photovoltaic), hydro, biomass,
wave/tidal and nuclear power are 'low carbon' or 'carbon neutral' because they do not
emit CO2 during their operation. However, they are not 'carbon free' since CO2 emissions
arise in other phases of their life cycle such as during extraction, construction,
maintenance and decommissioning.
S. No. Source Carbon footprint range (gCO2eq/kWh)
1. Conventional coal combustion systems ~1,000 or more
2. Gas powered electricity generation ~500
3. photovoltaic power systems ~60
4. hydro power schemes with storage ~10-30
5. Run-of-river hydro power schemes ~ 5
6. Onshore and offshore wind plants ~4.8
7. Onshore and offshore wind plants ~5.5
8. Nuclear power generation ~5
Source: The 'carbon footprint' of power generation; Prakash Nayak, chairman, IET Power
Panel
Section I – Pressure
State of Air Environment
Page 16
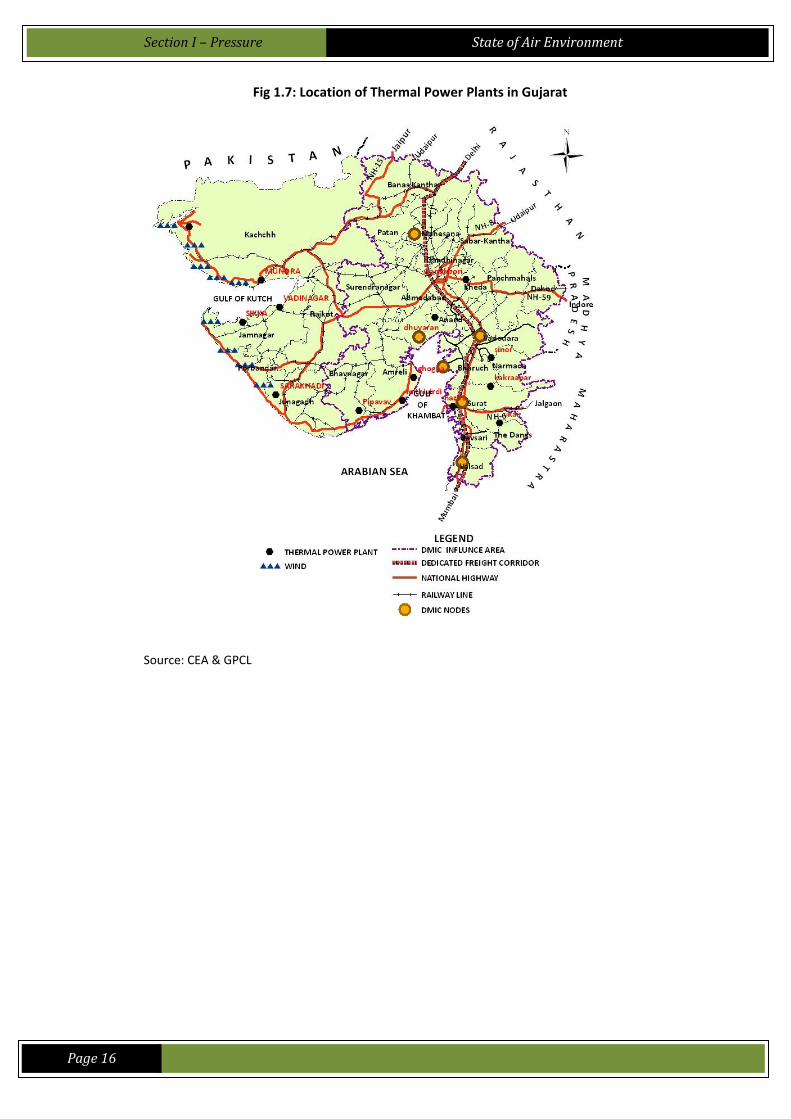
Fig 1.7: Location of Thermal Power Plants in Gujarat
Source: CEA & GPCL
Section I – Pressure
State of Air Environment
Page 17
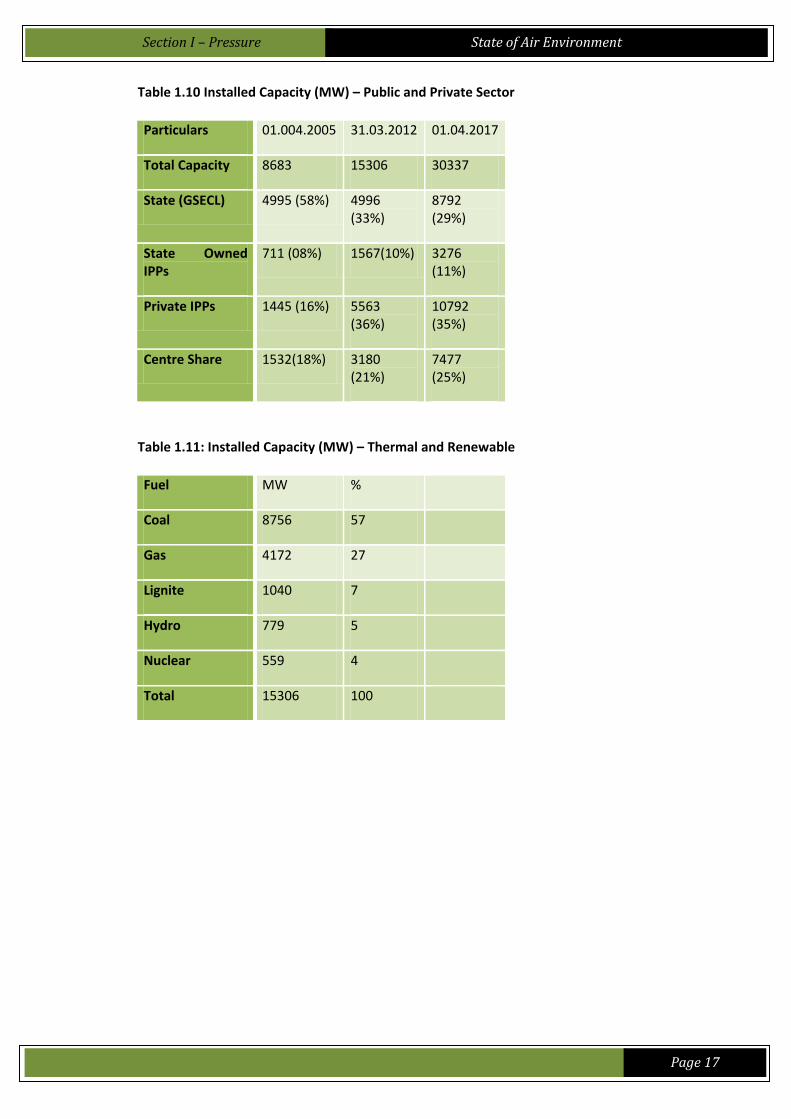
Table 1.10 Installed Capacity (MW) – Public and Private Sector
Particulars 01.004.2005 31.03.2012 01.04.2017
Total Capacity 8683 15306 30337
State (GSECL) 4995 (58%) 4996 (33%)
8792 (29%)
State Owned IPPs
711 (08%) 1567(10%) 3276 (11%)
Private IPPs 1445 (16%) 5563 (36%)
10792 (35%)
Centre Share 1532(18%) 3180 (21%)
7477 (25%)
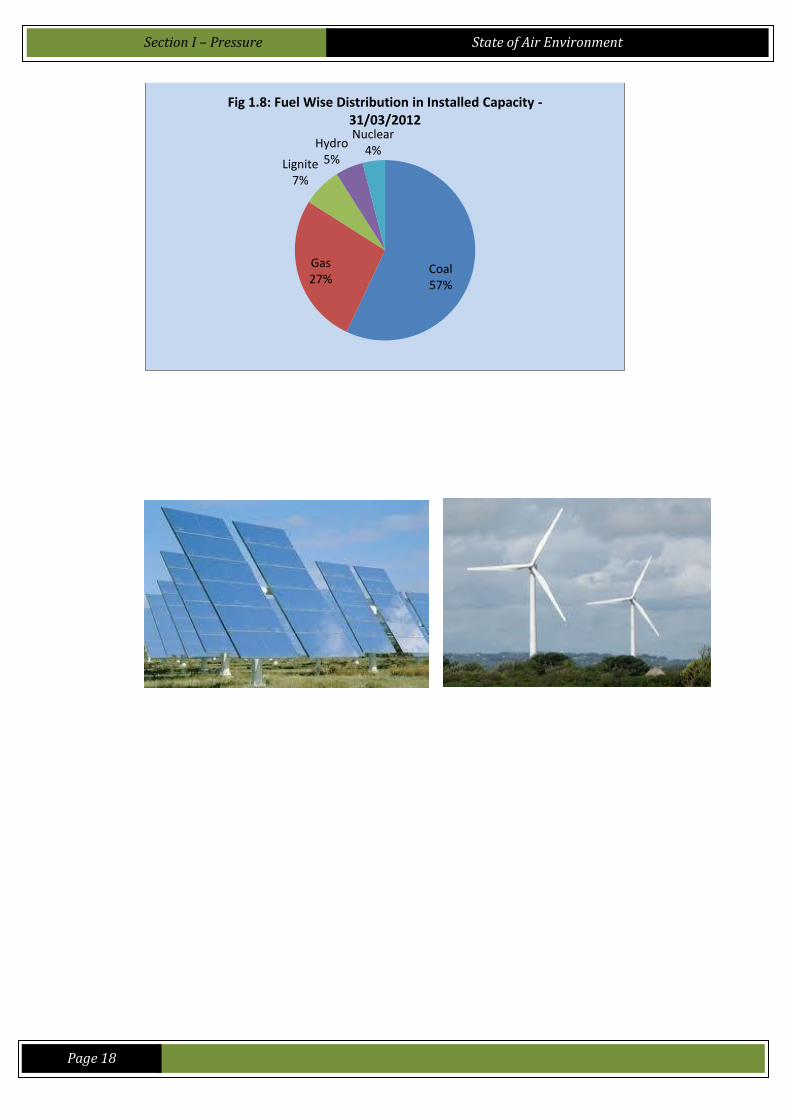
Table 1.11: Installed Capacity (MW) – Thermal and Renewable
Fuel MW %
Coal 8756 57
Gas 4172 27
Lignite 1040 7
Hydro 779 5
Nuclear 559 4
Total 15306 100
Section I – Pressure
State of Air Environment
Page 18
Coal 57%
Gas 27%
Lignite 7%
Hydro 5%
Nuclear 4%
Fig 1.8: Fuel Wise Distribution in Installed Capacity - 31/03/2012
Section I – Pressure
State of Air Environment
Page 19
Source: GEDA
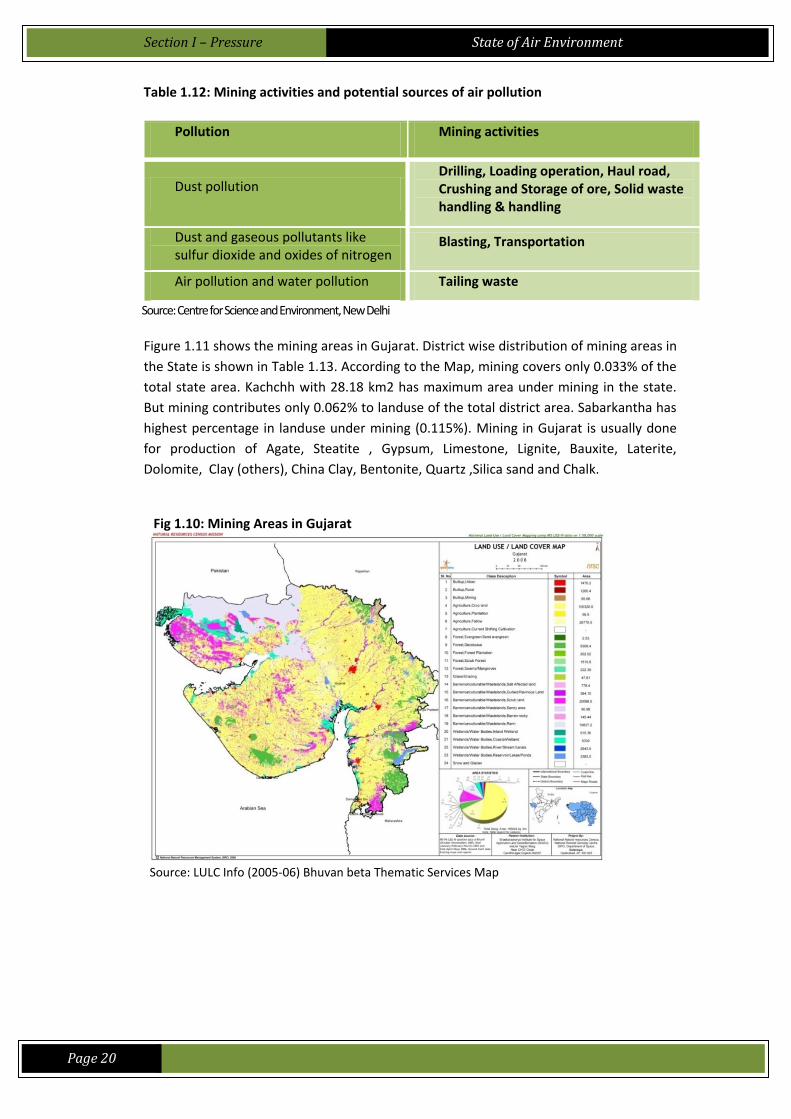
1.2.6 Mining
Among the air polluting sectors, minerals industry
ranks among the top. The impact of mining on air
starts from exploration phase, increases manifold
during operational phase and may even extend
beyond the mine closure. The fugitive emission is a
common phenomena related to mining, which is
very significant in case of open cast mining as
compared to underground mines. In addition,
waste handling, transportation and its storage also
have high dust potential. The intensity of dust generation in the mine lease area are also
influenced by various factor such as wind speed, hardness of the rock, mining technology,
mode of transportation and level of mechanisation.
Inadequate dust suppression measures and poor mine management practices may,
sometime, also cause widespread impact on local public health and occupational
diseases.
wind 96%
solar 3%
biomass 1%
Fig 1.9: Percentage of Renewable Energy Sources in Gujarat
Section I – Pressure
State of Air Environment
Page 20
Table 1.12: Mining activities and potential sources of air pollution
Pollution Mining activities
Dust pollution Drilling, Loading operation, Haul road, Crushing and Storage of ore, Solid waste handling & handling
Dust and gaseous pollutants like sulfur dioxide and oxides of nitrogen
Blasting, Transportation
Air pollution and water pollution Tailing waste
Source: Centre for Science and Environment, New Delhi
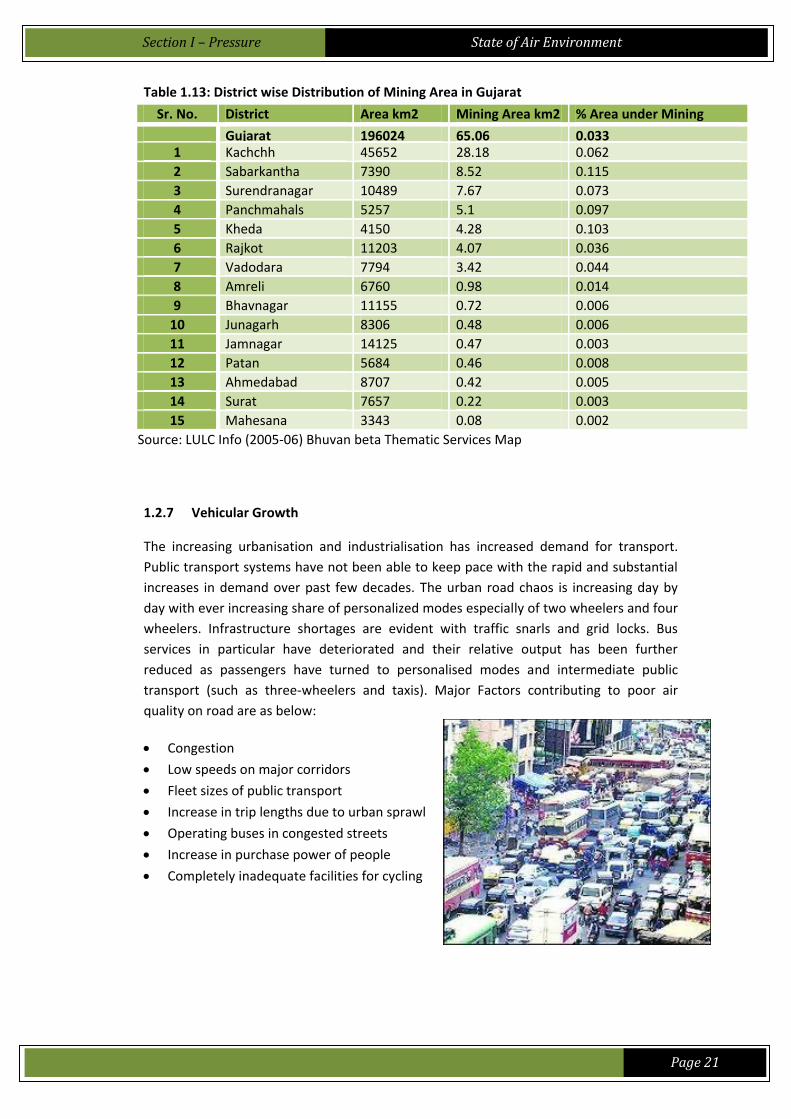
Figure 1.11 shows the mining areas in Gujarat. District wise distribution of mining areas in
the State is shown in Table 1.13. According to the Map, mining covers only 0.033% of the
total state area. Kachchh with 28.18 km2 has maximum area under mining in the state.
But mining contributes only 0.062% to landuse of the total district area. Sabarkantha has
highest percentage in landuse under mining (0.115%). Mining in Gujarat is usually done
for production of Agate, Steatite , Gypsum, Limestone, Lignite, Bauxite, Laterite,
Dolomite, Clay (others), China Clay, Bentonite, Quartz ,Silica sand and Chalk.
Fig 1.10: Mining Areas in Gujarat
Source: LULC Info (2005-06) Bhuvan beta Thematic Services Map
Section I – Pressure
State of Air Environment
Page 21
Table 1.13: District wise Distribution of Mining Area in Gujarat
Sr. No. District Area km2 Mining Area km2 % Area under Mining
under Mining Gujarat 196024 65.06 0.033
1 Kachchh 45652 28.18 0.062
2 Sabarkantha 7390 8.52 0.115
3 Surendranagar 10489 7.67 0.073
4 Panchmahals 5257 5.1 0.097
5 Kheda 4150 4.28 0.103
6 Rajkot 11203 4.07 0.036
7 Vadodara 7794 3.42 0.044
8 Amreli 6760 0.98 0.014
9 Bhavnagar 11155 0.72 0.006
10 Junagarh 8306 0.48 0.006
11 Jamnagar 14125 0.47 0.003
12 Patan 5684 0.46 0.008
13 Ahmedabad 8707 0.42 0.005
14 Surat 7657 0.22 0.003
15 Mahesana 3343 0.08 0.002
Source: LULC Info (2005-06) Bhuvan beta Thematic Services Map
1.2.7 Vehicular Growth
The increasing urbanisation and industrialisation has increased demand for transport.
Public transport systems have not been able to keep pace with the rapid and substantial
increases in demand over past few decades. The urban road chaos is increasing day by
day with ever increasing share of personalized modes especially of two wheelers and four
wheelers. Infrastructure shortages are evident with traffic snarls and grid locks. Bus
services in particular have deteriorated and their relative output has been further
reduced as passengers have turned to personalised modes and intermediate public
transport (such as three-wheelers and taxis). Major Factors contributing to poor air
quality on road are as below:
Congestion
Low speeds on major corridors
Fleet sizes of public transport
Increase in trip lengths due to urban sprawl
Operating buses in congested streets
Increase in purchase power of people
Completely inadequate facilities for cycling
Section I – Pressure
State of Air Environment
Page 22
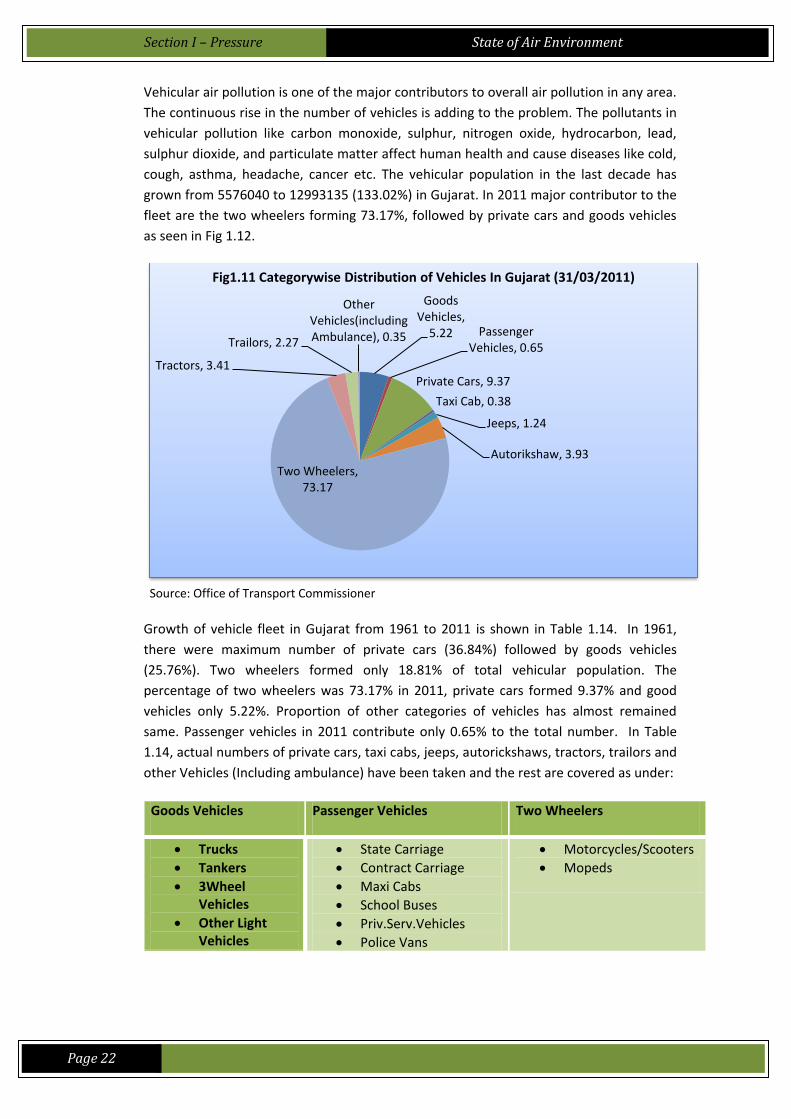
Vehicular air pollution is one of the major contributors to overall air pollution in any area.
The continuous rise in the number of vehicles is adding to the problem. The pollutants in
vehicular pollution like carbon monoxide, sulphur, nitrogen oxide, hydrocarbon, lead,
sulphur dioxide, and particulate matter affect human health and cause diseases like cold,
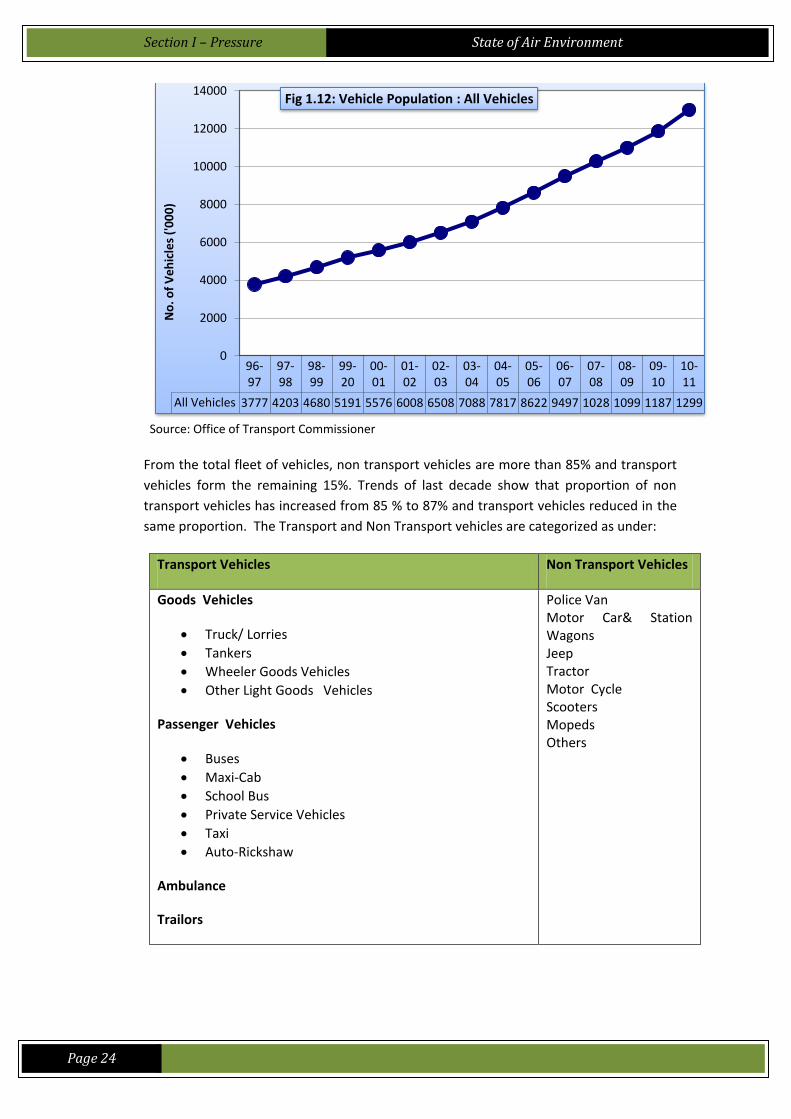
cough, asthma, headache, cancer etc. The vehicular population in the last decade has
grown from 5576040 to 12993135 (133.02%) in Gujarat. In 2011 major contributor to the
fleet are the two wheelers forming 73.17%, followed by private cars and goods vehicles
as seen in Fig 1.12.
Source: Office of Transport Commissioner
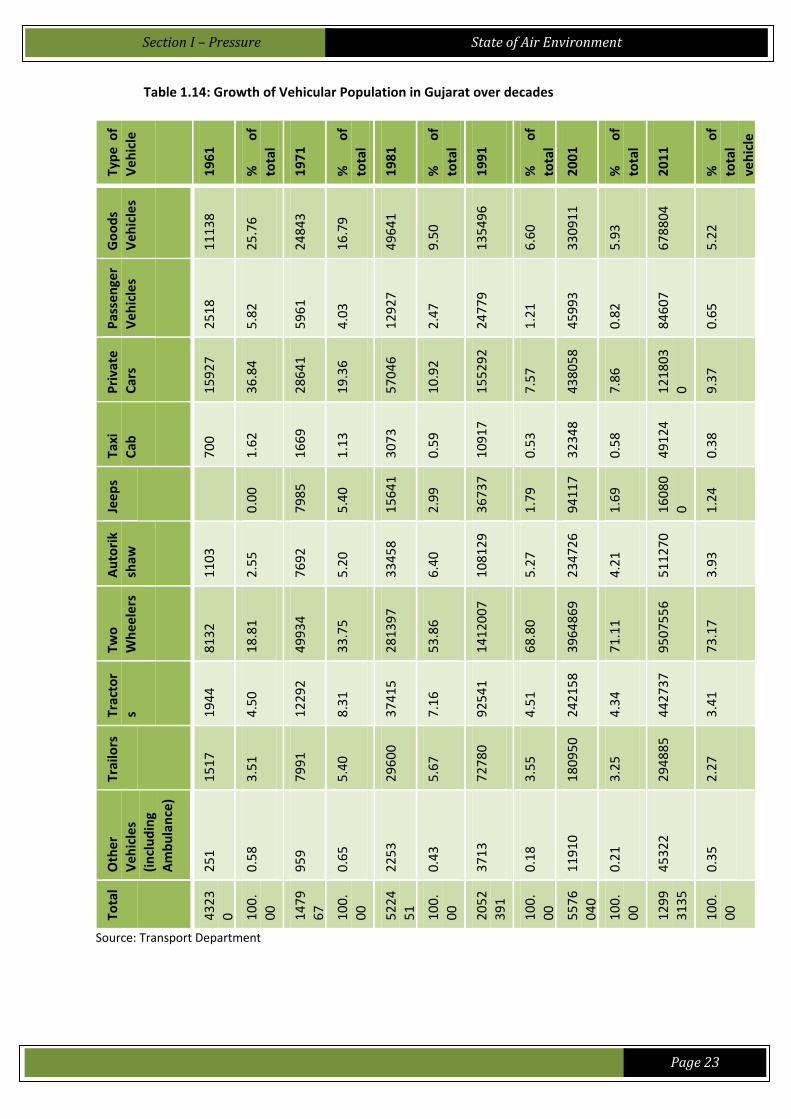
Growth of vehicle fleet in Gujarat from 1961 to 2011 is shown in Table 1.14. In 1961,
there were maximum number of private cars (36.84%) followed by goods vehicles
(25.76%). Two wheelers formed only 18.81% of total vehicular population. The
percentage of two wheelers was 73.17% in 2011, private cars formed 9.37% and good
vehicles only 5.22%. Proportion of other categories of vehicles has almost remained
same. Passenger vehicles in 2011 contribute only 0.65% to the total number. In Table
1.14, actual numbers of private cars, taxi cabs, jeeps, autorickshaws, tractors, trailors and
other Vehicles (Including ambulance) have been taken and the rest are covered as under:
Goods Vehicles Passenger Vehicles Two Wheelers
Trucks
Tankers
3Wheel Vehicles
Other Light Vehicles
State Carriage
Contract Carriage
Maxi Cabs
School Buses
Priv.Serv.Vehicles
Police Vans
Motorcycles/Scooters
Mopeds
Goods Vehicles,
5.22 Passenger Vehicles, 0.65
Private Cars, 9.37
Taxi Cab, 0.38
Jeeps, 1.24
Autorikshaw, 3.93
Two Wheelers, 73.17
Tractors, 3.41
Trailors, 2.27
Other Vehicles(including Ambulance), 0.35
Fig1.11 Categorywise Distribution of Vehicles In Gujarat (31/03/2011)
Section I – Pressure
State of Air Environment
Page 23
Table 1.14: Growth of Vehicular Population in Gujarat over decades
Typ
e o
f
Ve
hic
le
19
61
%
of
tota
l
veh
icle
s 19
71
%
of
tota
l
veh
icle
s 19
81
%
of
tota
l
veh
icle
s 19
91
%
of
tota
l
veh
icle
s 20
01
%
of
tota
l
veh
icle
s 20
11
%
of
tota
l
veh
icle
s
Go
od
s
Ve
hic
les
11
13
8
25
.76
24
84
3
16
.79
49
64
1
9.5
0
13
54
96
6.6
0
33
09
11
5.9
3
67
88
04
5.2
2
Pas
sen
ger
Ve
hic
les
25
18
5.8
2
59
61
4.0
3
12
92
7
2.4
7
24
77
9
1.2
1
45
99
3
0.8
2
84
60
7
0.6
5
Pri
vate
Car
s
15
92
7
36
.84
28
64
1
19
.36
57
04
6
10
.92
15
52
92
7.5
7
43
80
58
7.8
6
12
18
03
0
9.3
7
Taxi
Cab
70
0
1.6
2
16
69
1.1
3
30
73
0.5
9
10
91
7
0.5
3
32
34
8
0.5
8
49
12
4
0.3
8
Jee
ps
0.0
0
79
85
5.4
0
15
64
1
2.9
9
36
73
7
1.7
9
94
11
7
1.6
9
16
08
0
0
1.2
4
Au
tori
k
shaw
11
03
2.5
5
76
92
5.2
0
33
45
8
6.4
0
10
81
29
5.2
7
23
47
26
4.2
1
51
12
70
3.9
3
Two
Wh
ee
lers
81
32
18
.81
49
93
4
33
.75
28
13
97
53
.86
14
12
00
7
68
.80
39
64
86
9
71
.11
95
07
55
6
73
.17
Trac
tor
s 19
44
4.5
0
12
29
2
8.3
1
37
41
5
7.1
6
92
54
1
4.5
1
24
21
58
4.3
4
44
27
37
3.4
1
Trai
lors
15
17
3.5
1
79
91
5.4
0
29
60
0
5.6
7
72
78
0
3.5
5
18
09
50
3.2
5
29
48
85
2.2
7
Oth
er
Ve
hic
les
(in
clu
din
g
Am
bu
lan
ce)
25
1
0.5
8
95
9
0.6
5
22
53
0.4
3
37
13
0.1
8
11
91
0
0.2
1
45
32
2
0.3
5
Tota
l
43
23
0
10
0.
00
14
79
67
10
0.
00
52
24
51
10
0.
00
20
52
39
1
10
0.
00
55
76
04
0
10
0.
00
12
99
31
35
10
0.
00
Source: Transport Department
Section I – Pressure
State of Air Environment
Page 24
Source: Office of Transport Commissioner
From the total fleet of vehicles, non transport vehicles are more than 85% and transport
vehicles form the remaining 15%. Trends of last decade show that proportion of non
transport vehicles has increased from 85 % to 87% and transport vehicles reduced in the
same proportion. The Transport and Non Transport vehicles are categorized as under:
Transport Vehicles Non Transport Vehicles
Goods Vehicles
Truck/ Lorries
Tankers
Wheeler Goods Vehicles
Other Light Goods Vehicles
Passenger Vehicles
Buses
Maxi-Cab
School Bus
Private Service Vehicles
Taxi
Auto-Rickshaw
Ambulance
Trailors
Police Van Motor Car& Station Wagons Jeep Tractor Motor Cycle Scooters Mopeds Others
96-97
97-98
98-99
99-20
00-01
01-02
02-03
03-04
04-05
05-06
06-07
07-08
08-09
09-10
10-11
All Vehicles 3777 4203 4680 5191 5576 6008 6508 7088 7817 8622 9497 1028 1099 1187 1299
0
2000
4000
6000
8000
10000
12000
14000
No
. of
Ve
hic
les
('0
00
)
Fig 1.12: Vehicle Population : All Vehicles
Section I – Pressure
State of Air Environment
Page 25
Source: Office of Transport Commissioner
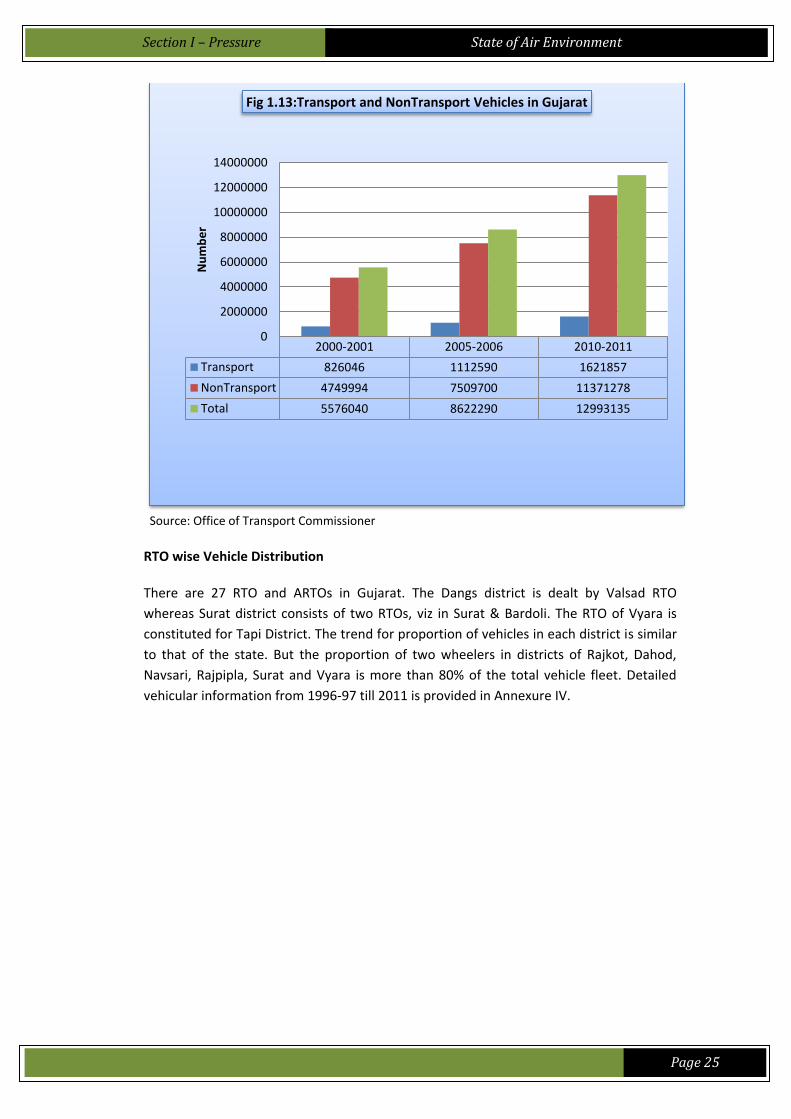
RTO wise Vehicle Distribution
There are 27 RTO and ARTOs in Gujarat. The Dangs district is dealt by Valsad RTO
whereas Surat district consists of two RTOs, viz in Surat & Bardoli. The RTO of Vyara is
constituted for Tapi District. The trend for proportion of vehicles in each district is similar
to that of the state. But the proportion of two wheelers in districts of Rajkot, Dahod,
Navsari, Rajpipla, Surat and Vyara is more than 80% of the total vehicle fleet. Detailed
vehicular information from 1996-97 till 2011 is provided in Annexure IV.
2000-2001 2005-2006 2010-2011
Transport 826046 1112590 1621857
NonTransport 4749994 7509700 11371278
Total 5576040 8622290 12993135
0
2000000
4000000
6000000
8000000
10000000
12000000
14000000
Nu
mb
er
Fig 1.13:Transport and NonTransport Vehicles in Gujarat
Section I – Pressure
State of Air Environment
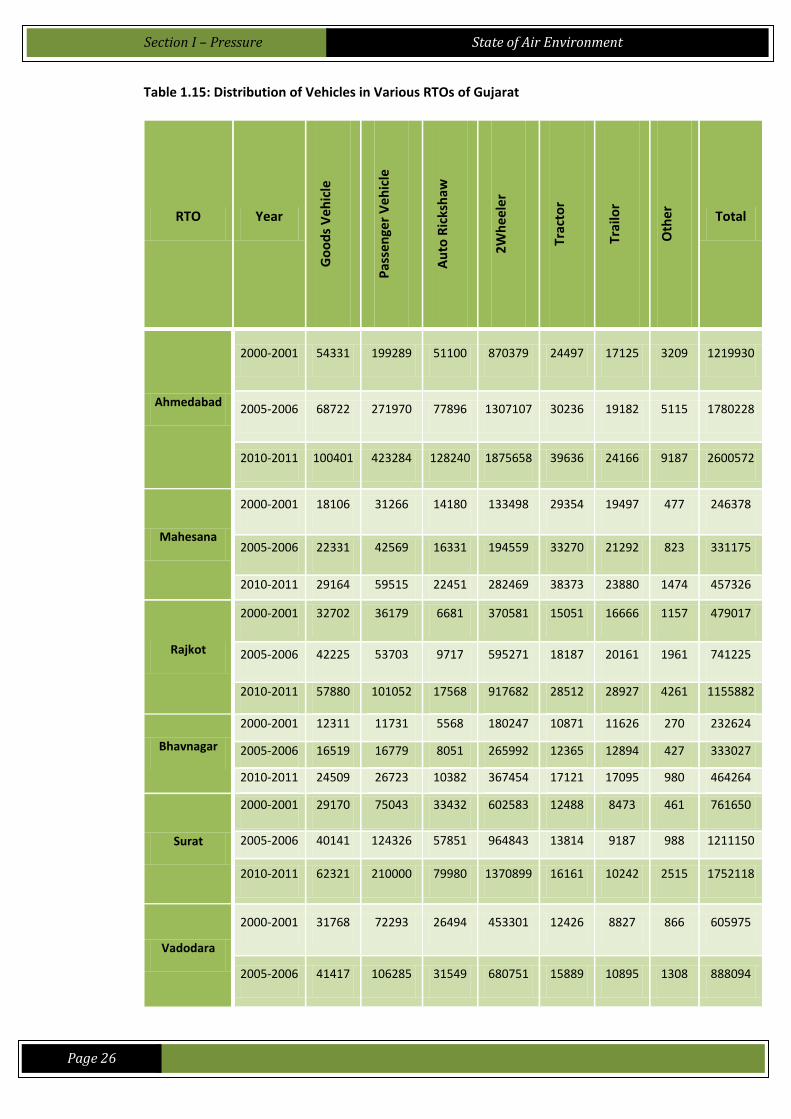
Page 26
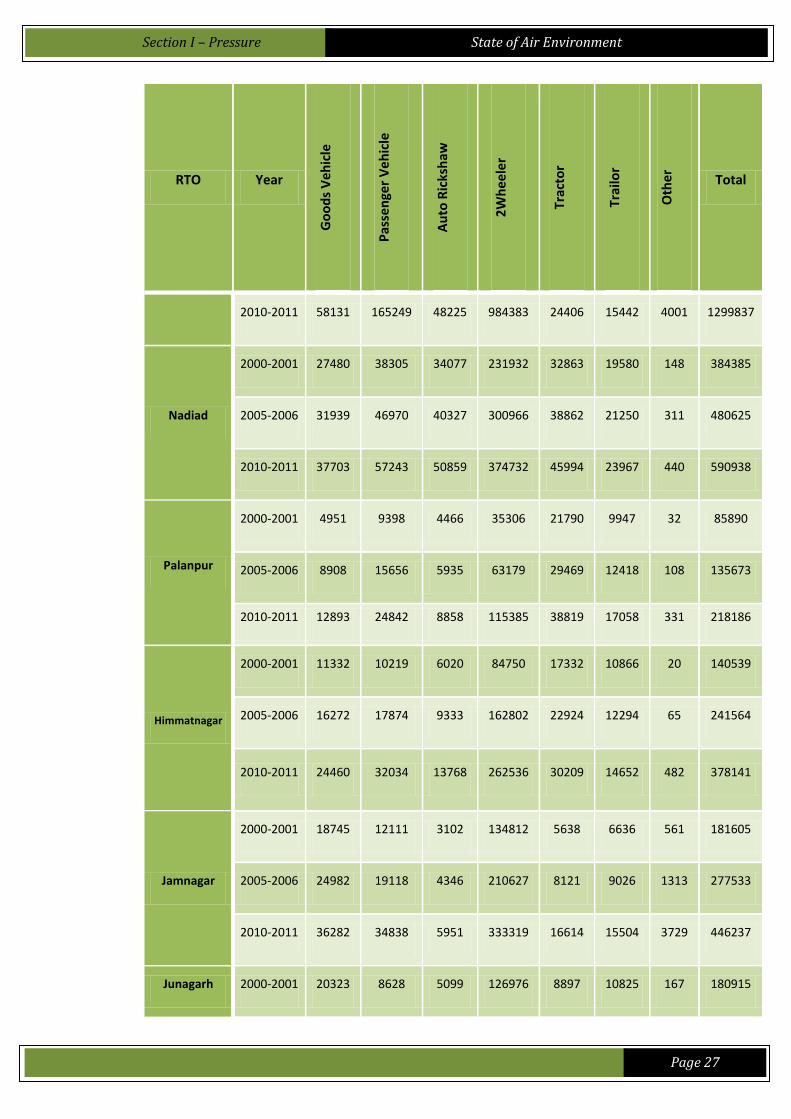
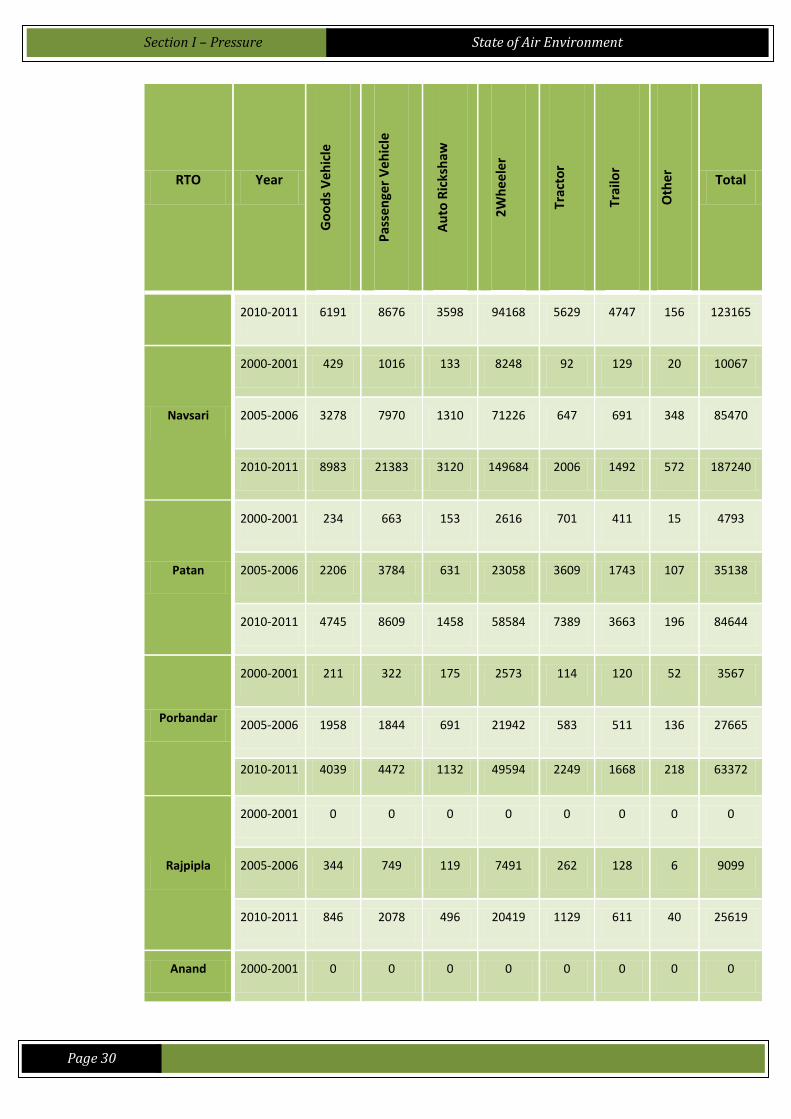
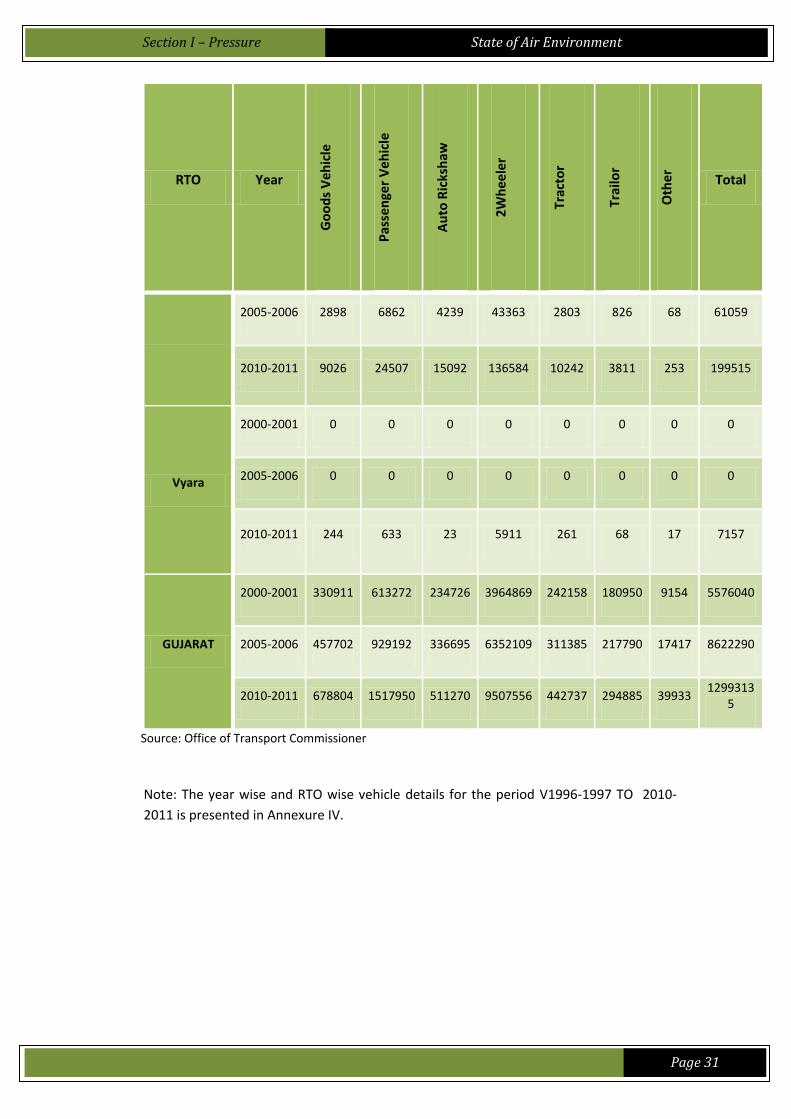
Table 1.15: Distribution of Vehicles in Various RTOs of Gujarat
RTO Year
Go
od
s V
eh
icle
Pas
sen
ger
Ve
hic
le
Au
to R
icks
haw
2W
he
ele
r
Trac
tor
Trai
lor
Oth
er
Total
Ahmedabad
2000-2001 54331 199289 51100 870379 24497 17125 3209 1219930
2005-2006 68722 271970 77896 1307107 30236 19182 5115 1780228
2010-2011 100401 423284 128240 1875658 39636 24166 9187 2600572
Mahesana
2000-2001 18106 31266 14180 133498 29354 19497 477 246378
2005-2006 22331 42569 16331 194559 33270 21292 823 331175
2010-2011 29164 59515 22451 282469 38373 23880 1474 457326
Rajkot
2000-2001 32702 36179 6681 370581 15051 16666 1157 479017
2005-2006 42225 53703 9717 595271 18187 20161 1961 741225
2010-2011 57880 101052 17568 917682 28512 28927 4261 1155882
Bhavnagar
2000-2001 12311 11731 5568 180247 10871 11626 270 232624
2005-2006 16519 16779 8051 265992 12365 12894 427 333027
2010-2011 24509 26723 10382 367454 17121 17095 980 464264
Surat
2000-2001 29170 75043 33432 602583 12488 8473 461 761650
2005-2006 40141 124326 57851 964843 13814 9187 988 1211150
2010-2011 62321 210000 79980 1370899 16161 10242 2515 1752118
Vadodara
2000-2001 31768 72293 26494 453301 12426 8827 866 605975
2005-2006 41417 106285 31549 680751 15889 10895 1308 888094
Section I – Pressure
State of Air Environment
Page 27
RTO Year
Go
od
s V
eh
icle
Pas
sen
ger
Ve
hic
le
Au
to R
icks
haw
2W
he
ele
r
Trac
tor
Trai
lor
Oth
er
Total
2010-2011 58131 165249 48225 984383 24406 15442 4001 1299837
Nadiad
2000-2001 27480 38305 34077 231932 32863 19580 148 384385
2005-2006 31939 46970 40327 300966 38862 21250 311 480625
2010-2011 37703 57243 50859 374732 45994 23967 440 590938
Palanpur
2000-2001 4951 9398 4466 35306 21790 9947 32 85890
2005-2006 8908 15656 5935 63179 29469 12418 108 135673
2010-2011 12893 24842 8858 115385 38819 17058 331 218186
Himmatnagar
2000-2001 11332 10219 6020 84750 17332 10866 20 140539
2005-2006 16272 17874 9333 162802 22924 12294 65 241564
2010-2011 24460 32034 13768 262536 30209 14652 482 378141
Jamnagar
2000-2001 18745 12111 3102 134812 5638 6636 561 181605
2005-2006 24982 19118 4346 210627 8121 9026 1313 277533
2010-2011 36282 34838 5951 333319 16614 15504 3729 446237
Junagarh 2000-2001 20323 8628 5099 126976 8897 10825 167 180915

Section I – Pressure
State of Air Environment
Page 28
RTO Year
Go
od
s V
eh
icle
Pas
sen
ger
Ve
hic
le
Au
to R
icks
haw
2W
he
ele
r
Trac
tor
Trai
lor
Oth
er
Total
2005-2006 25132 12823 6166 200480 11126 12679 199 268605
2010-2011 34212 21202 7062 311658 17459 15329 418 407340
Bhuj
2000-2001 20763 17120 6058 125167 11275 9040 668 190091
2005-2006 33669 28991 9095 222677 14817 12338 1625 323212
2010-2011 52855 52612 12876 348160 22528 18206 4324 511561
Surendranagar
2000-2001 4842 3528 930 56088 12508 9623 60 87579
2005-2006 8201 6445 1784 95922 17216 11811 106 141485
2010-2011 13094 11157 3406 149264 23909 15508 397 216735
Amreli
2000-2001 4317 2436 415 38947 4367 5565 56 56103
2005-2006 5894 4459 628 69758 5236 6718 92 92785
2010-2011 8812 7849 855 114492 8573 10486 145 151212
Valsad
2000-2001 16139 31839 15804 210171 6085 4684 327 285049
2005-2006 21629 41627 22150 292296 6497 5126 866 390191
2010-2011 30501 61884 30083 405531 7827 5938 1537 543301

Section I – Pressure
State of Air Environment
Page 29
RTO Year
Go
od
s V
eh
icle
Pas
sen
ger
Ve
hic
le
Au
to R
icks
haw
2W
he
ele
r
Trac
tor
Trai
lor
Oth
er
Total
Bharuch
2000-2001 9270 16397 10004 112821 6339 3776 244 158851
2005-2006 14351 30971 12043 194396 8289 4558 498 265106
2010-2011 21003 51142 19392 277047 11885 6108 1847 388424
Godhara
2000-2001 8627 9778 7360 74312 5043 4404 128 109652
2005-2006 7991 11284 8863 97628 6179 4999 230 137174
2010-2011 11541 18002 12196 153848 10998 8196 323 215104
Gandhinagar
2000-2001 2787 19326 1920 54220 1842 1010 161 81266
2005-2006 9006 40591 3651 129472 4868 2120 509 190217
2010-2011 21566 70748 11511 217635 9419 4195 1674 336748
Bardoli
2000-2001 1419 4535 714 39473 1480 1064 43 48728
2005-2006 3784 9828 1313 83847 2981 2092 150 103995
2010-2011 7402 18216 2688 130460 5389 3926 416 168497
Dahod
2000-2001 654 1850 841 15868 1105 1056 12 21386
2005-2006 3905 5714 2676 52456 3135 2851 58 70795
Section I – Pressure
State of Air Environment
Page 30
RTO Year
Go
od
s V
eh
icle
Pas
sen
ger
Ve
hic
le
Au
to R
icks
haw
2W
he
ele
r
Trac
tor
Trai
lor
Oth
er
Total
2010-2011 6191 8676 3598 94168 5629 4747 156 123165
Navsari
2000-2001 429 1016 133 8248 92 129 20 10067
2005-2006 3278 7970 1310 71226 647 691 348 85470
2010-2011 8983 21383 3120 149684 2006 1492 572 187240
Patan
2000-2001 234 663 153 2616 701 411 15 4793
2005-2006 2206 3784 631 23058 3609 1743 107 35138
2010-2011 4745 8609 1458 58584 7389 3663 196 84644
Porbandar
2000-2001 211 322 175 2573 114 120 52 3567
2005-2006 1958 1844 691 21942 583 511 136 27665
2010-2011 4039 4472 1132 49594 2249 1668 218 63372
Rajpipla
2000-2001 0 0 0 0 0 0 0 0
2005-2006 344 749 119 7491 262 128 6 9099
2010-2011 846 2078 496 20419 1129 611 40 25619
Anand 2000-2001 0 0 0 0 0 0 0 0
Section I – Pressure
State of Air Environment
Page 31
RTO Year
Go
od
s V
eh
icle
Pas
sen
ger
Ve
hic
le
Au
to R
icks
haw
2W
he
ele
r
Trac
tor
Trai
lor
Oth
er
Total
2005-2006 2898 6862 4239 43363 2803 826 68 61059
2010-2011 9026 24507 15092 136584 10242 3811 253 199515
Vyara
2000-2001 0 0 0 0 0 0 0 0
2005-2006 0 0 0 0 0 0 0 0
2010-2011 244 633 23 5911 261 68 17 7157
GUJARAT
2000-2001 330911 613272 234726 3964869 242158 180950 9154 5576040
2005-2006 457702 929192 336695 6352109 311385 217790 17417 8622290
2010-2011 678804 1517950 511270 9507556 442737 294885 39933 1299313
5
Source: Office of Transport Commissioner
Note: The year wise and RTO wise vehicle details for the period V1996-1997 TO 2010-
2011 is presented in Annexure IV.
Section I – Pressure
State of Air Environment
Page 32
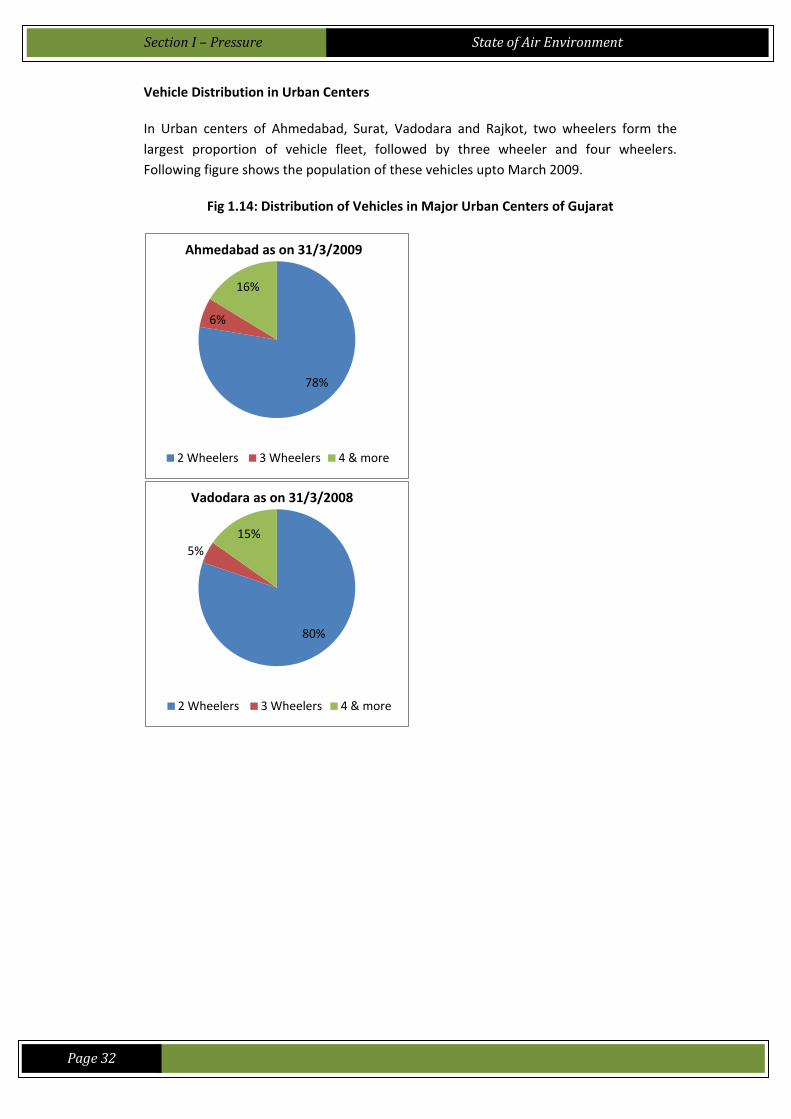
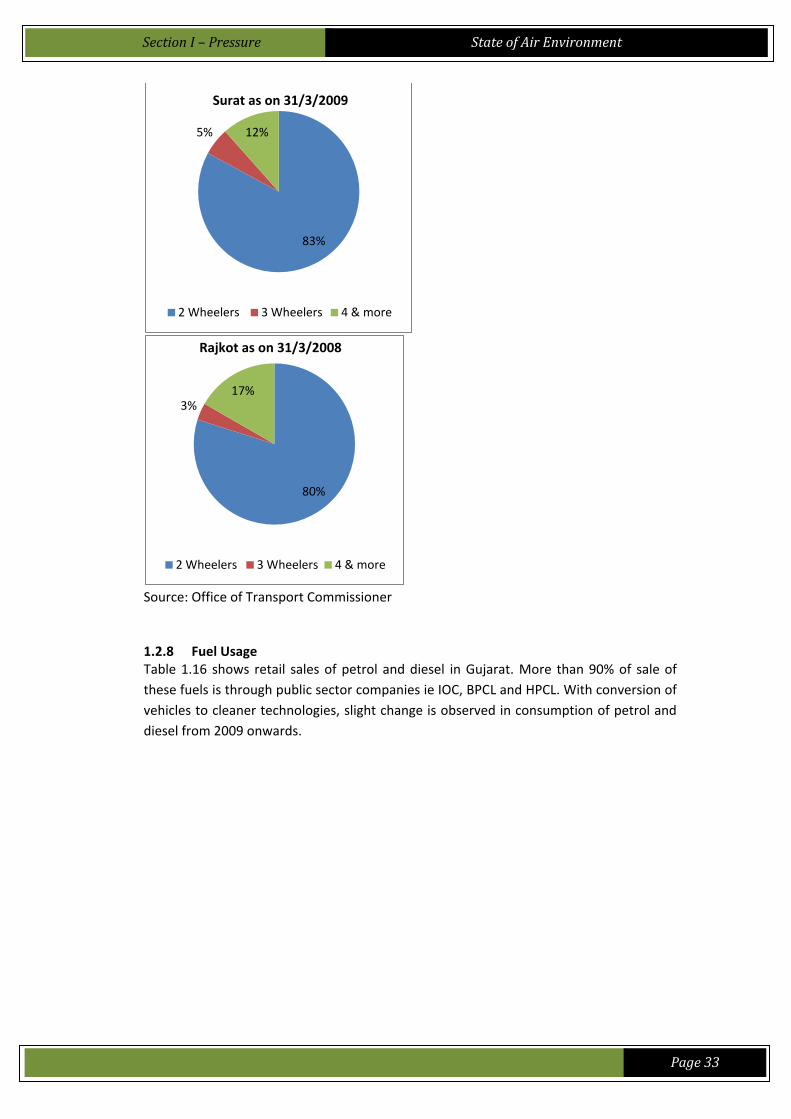
Vehicle Distribution in Urban Centers
In Urban centers of Ahmedabad, Surat, Vadodara and Rajkot, two wheelers form the
largest proportion of vehicle fleet, followed by three wheeler and four wheelers.
Following figure shows the population of these vehicles upto March 2009.
Fig 1.14: Distribution of Vehicles in Major Urban Centers of Gujarat
78%
6%
16%
Ahmedabad as on 31/3/2009
2 Wheelers 3 Wheelers 4 & more
80%
5%
15%
Vadodara as on 31/3/2008
2 Wheelers 3 Wheelers 4 & more
Section I – Pressure
State of Air Environment
Page 33
Source: Office of Transport Commissioner
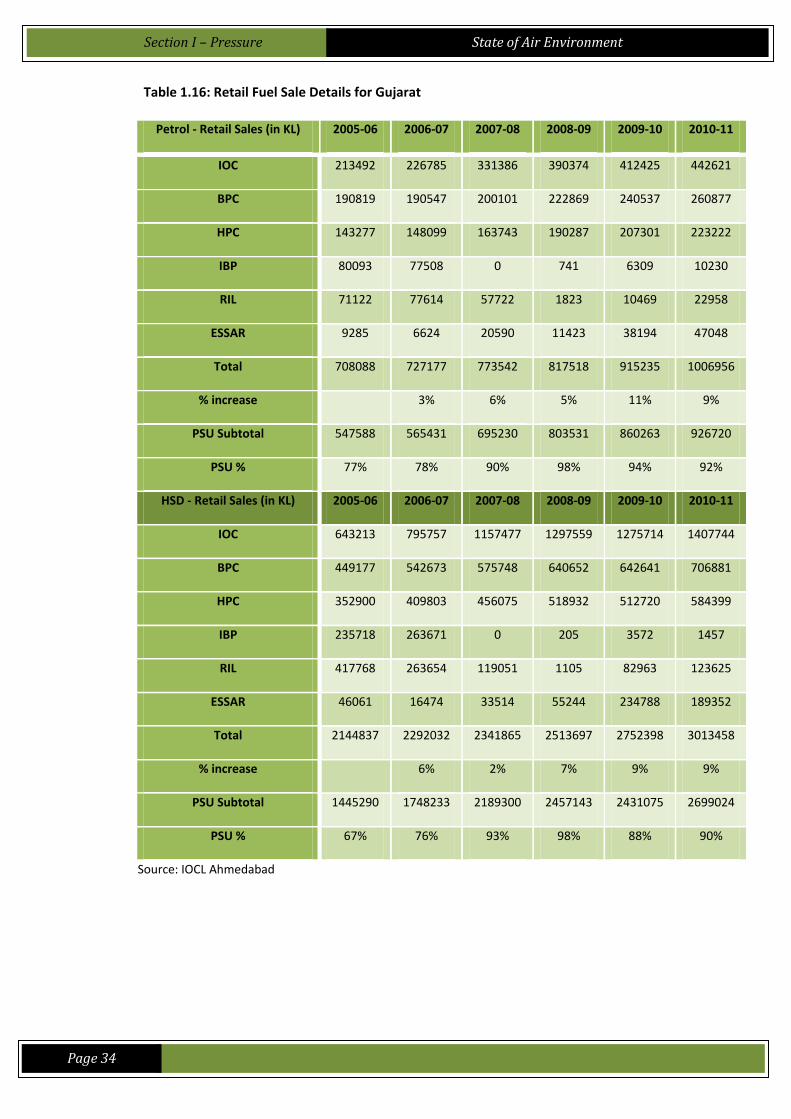
1.2.8 Fuel Usage Table 1.16 shows retail sales of petrol and diesel in Gujarat. More than 90% of sale of
these fuels is through public sector companies ie IOC, BPCL and HPCL. With conversion of
vehicles to cleaner technologies, slight change is observed in consumption of petrol and
diesel from 2009 onwards.
83%
5% 12%
Surat as on 31/3/2009
2 Wheelers 3 Wheelers 4 & more
80%
3% 17%
Rajkot as on 31/3/2008
2 Wheelers 3 Wheelers 4 & more
Section I – Pressure
State of Air Environment
Page 34
Table 1.16: Retail Fuel Sale Details for Gujarat
Petrol - Retail Sales (in KL) 2005-06 2006-07 2007-08 2008-09 2009-10 2010-11
IOC 213492 226785 331386 390374 412425 442621
BPC 190819 190547 200101 222869 240537 260877
HPC 143277 148099 163743 190287 207301 223222
IBP 80093 77508 0 741 6309 10230
RIL 71122 77614 57722 1823 10469 22958
ESSAR 9285 6624 20590 11423 38194 47048
Total 708088 727177 773542 817518 915235 1006956
% increase
3% 6% 5% 11% 9%
PSU Subtotal 547588 565431 695230 803531 860263 926720
PSU % 77% 78% 90% 98% 94% 92%
HSD - Retail Sales (in KL) 2005-06 2006-07 2007-08 2008-09 2009-10 2010-11
IOC 643213 795757 1157477 1297559 1275714 1407744
BPC 449177 542673 575748 640652 642641 706881
HPC 352900 409803 456075 518932 512720 584399
IBP 235718 263671 0 205 3572 1457
RIL 417768 263654 119051 1105 82963 123625
ESSAR 46061 16474 33514 55244 234788 189352
Total 2144837 2292032 2341865 2513697 2752398 3013458
% increase
6% 2% 7% 9% 9%
PSU Subtotal 1445290 1748233 2189300 2457143 2431075 2699024
PSU % 67% 76% 93% 98% 88% 90%
Source: IOCL Ahmedabad
Section I – Pressure
State of Air Environment
Page 35
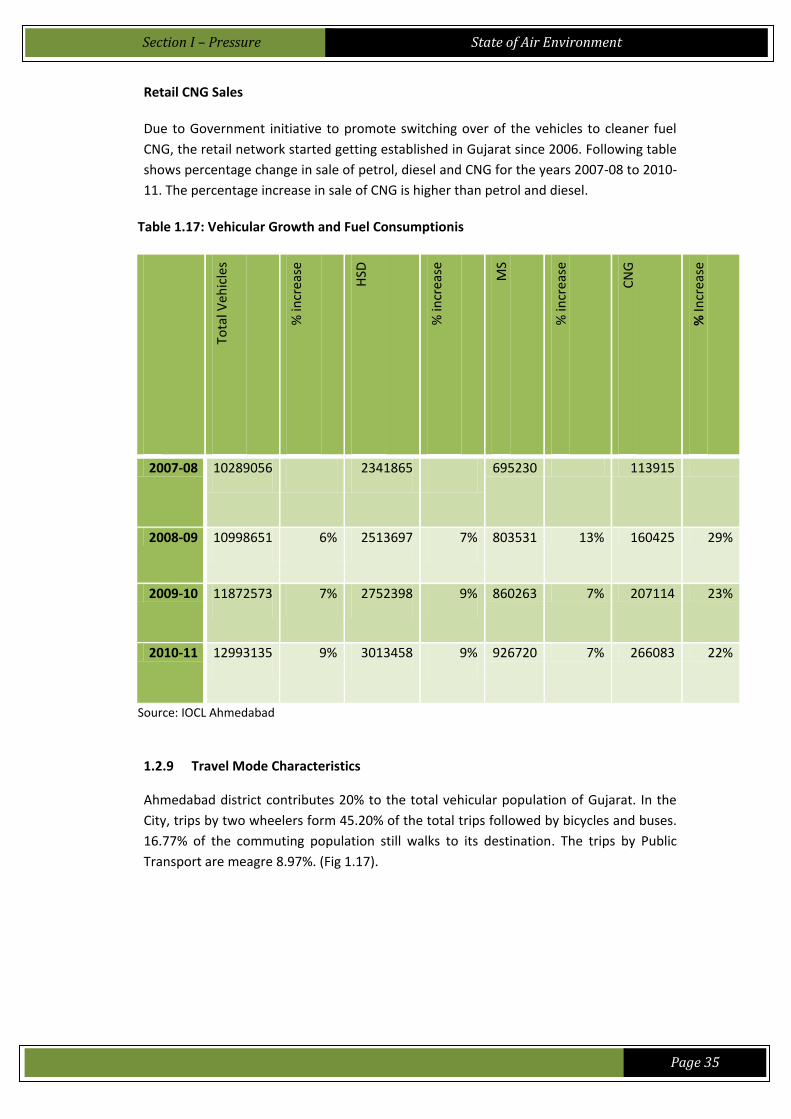
Retail CNG Sales
Due to Government initiative to promote switching over of the vehicles to cleaner fuel
CNG, the retail network started getting established in Gujarat since 2006. Following table
shows percentage change in sale of petrol, diesel and CNG for the years 2007-08 to 2010-
11. The percentage increase in sale of CNG is higher than petrol and diesel.
Table 1.17: Vehicular Growth and Fuel Consumptionis
Tota
l Veh
icle
s
% in
crea
se
HSD
% in
crea
se
MS
% in
crea
se
CN
G
% In
crea
se
2007-08 10289056 2341865 695230 113915
2008-09 10998651 6% 2513697 7% 803531 13% 160425 29%
2009-10 11872573 7% 2752398 9% 860263 7% 207114 23%
2010-11 12993135 9% 3013458 9% 926720 7% 266083 22%
Source: IOCL Ahmedabad
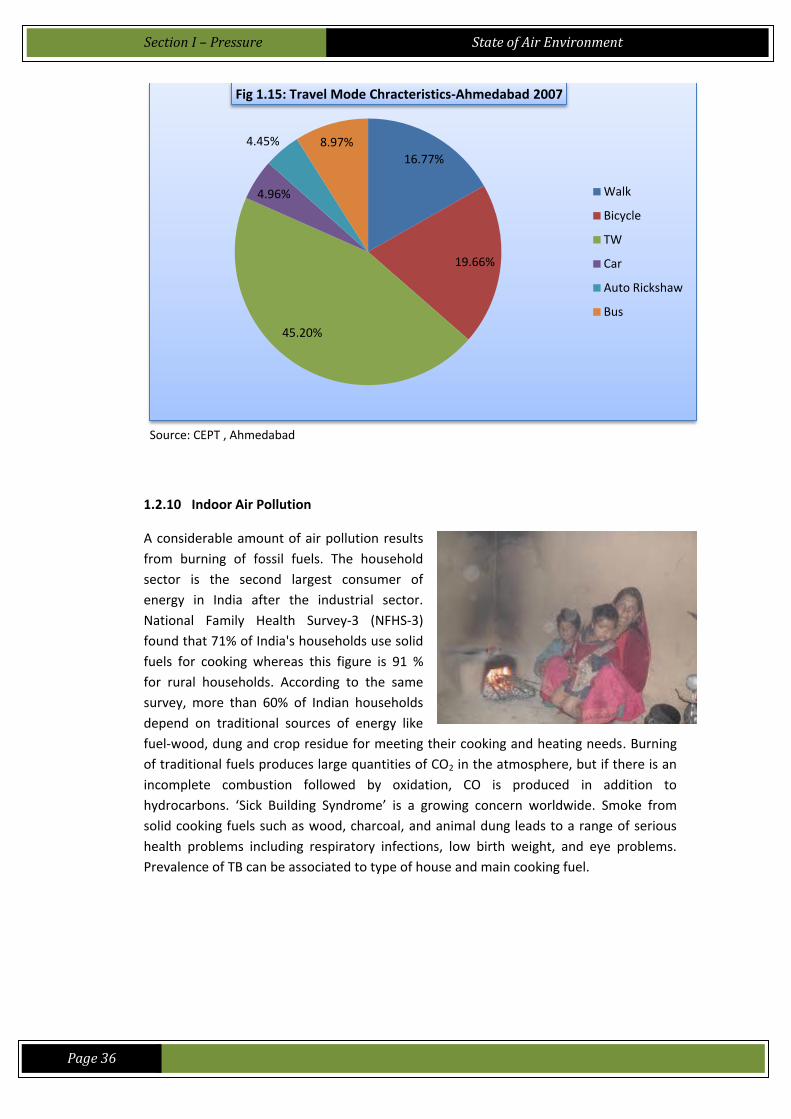
1.2.9 Travel Mode Characteristics
Ahmedabad district contributes 20% to the total vehicular population of Gujarat. In the
City, trips by two wheelers form 45.20% of the total trips followed by bicycles and buses.
16.77% of the commuting population still walks to its destination. The trips by Public
Transport are meagre 8.97%. (Fig 1.17).
Section I – Pressure
State of Air Environment
Page 36
Source: CEPT , Ahmedabad
1.2.10 Indoor Air Pollution
A considerable amount of air pollution results
from burning of fossil fuels. The household
sector is the second largest consumer of
energy in India after the industrial sector.
National Family Health Survey-3 (NFHS-3)
found that 71% of India's households use solid
fuels for cooking whereas this figure is 91 %
for rural households. According to the same
survey, more than 60% of Indian households
depend on traditional sources of energy like
fuel-wood, dung and crop residue for meeting their cooking and heating needs. Burning
of traditional fuels produces large quantities of CO2 in the atmosphere, but if there is an
incomplete combustion followed by oxidation, CO is produced in addition to
hydrocarbons. ‘Sick Building Syndrome’ is a growing concern worldwide. Smoke from
solid cooking fuels such as wood, charcoal, and animal dung leads to a range of serious
health problems including respiratory infections, low birth weight, and eye problems.
Prevalence of TB can be associated to type of house and main cooking fuel.
16.77%
19.66%
45.20%
4.96%
4.45% 8.97%
Fig 1.15: Travel Mode Chracteristics-Ahmedabad 2007
Walk
Bicycle
TW
Car
Auto Rickshaw
Bus
Section I – Pressure
State of Air Environment
Page 37
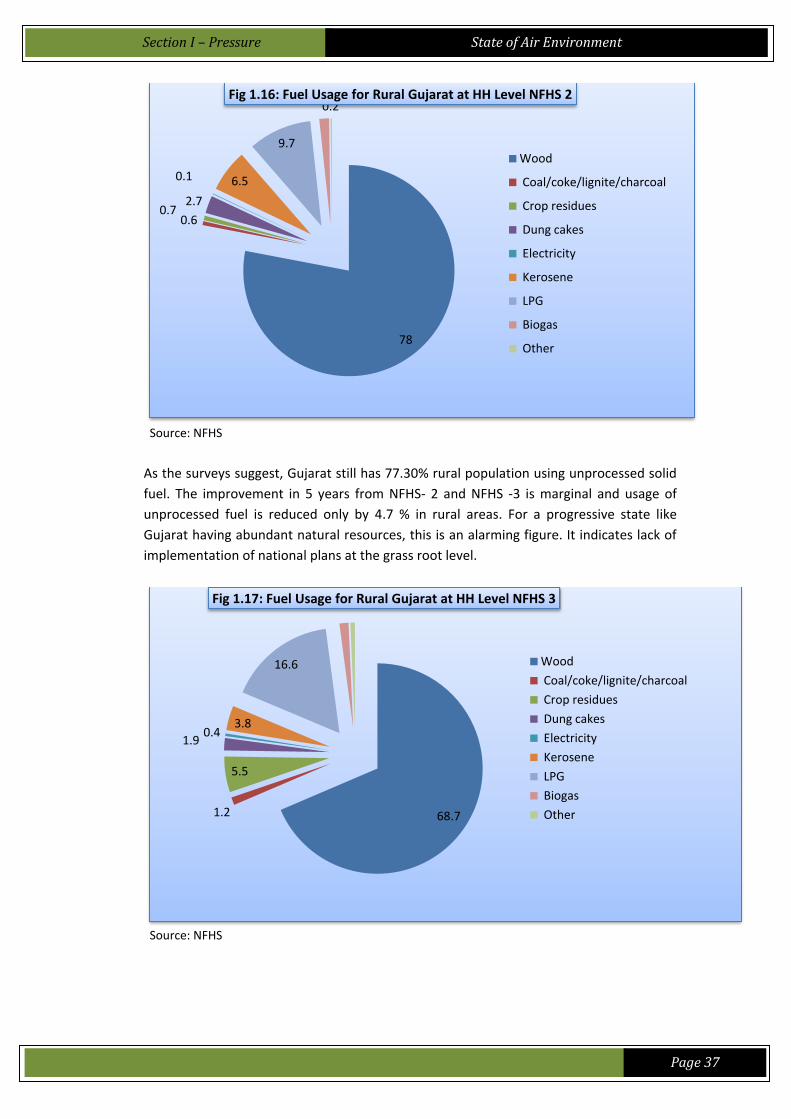
Source: NFHS
As the surveys suggest, Gujarat still has 77.30% rural population using unprocessed solid
fuel. The improvement in 5 years from NFHS- 2 and NFHS -3 is marginal and usage of
unprocessed fuel is reduced only by 4.7 % in rural areas. For a progressive state like
Gujarat having abundant natural resources, this is an alarming figure. It indicates lack of
implementation of national plans at the grass root level.
Source: NFHS
78
0.6 0.7
2.7
0.1 6.5
9.7
1.5 0.2
Fig 1.16: Fuel Usage for Rural Gujarat at HH Level NFHS 2
Wood
Coal/coke/lignite/charcoal
Crop residues
Dung cakes
Electricity
Kerosene
LPG
Biogas
Other
68.7 1.2
5.5
1.9 0.4
3.8
16.6
1.4 0.7 Fig 1.17: Fuel Usage for Rural Gujarat at HH Level NFHS 3
Wood
Coal/coke/lignite/charcoal
Crop residues
Dung cakes
Electricity
Kerosene
LPG
Biogas
Other
Section I – Pressure
State of Air Environment
Page 38
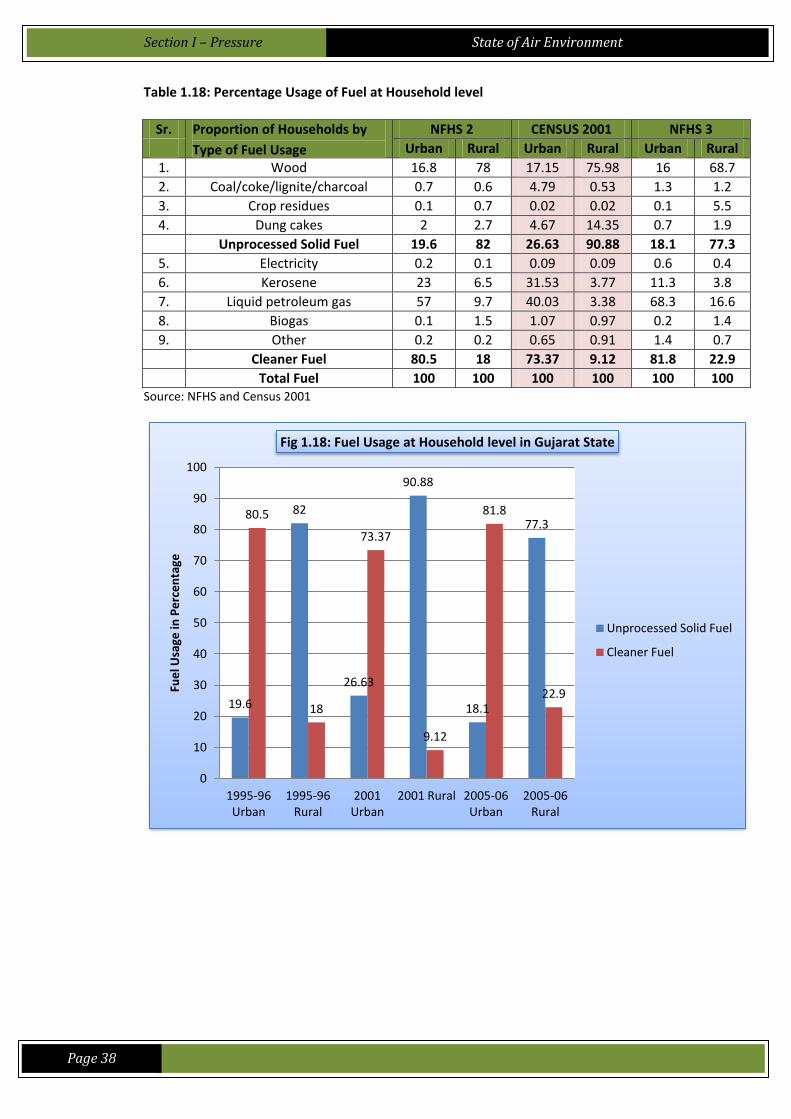
Table 1.18: Percentage Usage of Fuel at Household level
Sr.
No.
Proportion of Households by
Type of Fuel Usage
NFHS 2
(1998-1999)
CENSUS 2001 NFHS 3
(2005-06) Urban Rural Urban Rural Urban Rural
1. Wood 16.8 78 17.15 75.98 16 68.7
2. Coal/coke/lignite/charcoal 0.7 0.6 4.79 0.53 1.3 1.2
3. Crop residues 0.1 0.7 0.02 0.02 0.1 5.5
4. Dung cakes 2 2.7 4.67 14.35 0.7 1.9
Unprocessed Solid Fuel 19.6 82 26.63 90.88 18.1 77.3
5. Electricity 0.2 0.1 0.09 0.09 0.6 0.4
6. Kerosene 23 6.5 31.53 3.77 11.3 3.8
7. Liquid petroleum gas 57 9.7 40.03 3.38 68.3 16.6
8. Biogas 0.1 1.5 1.07 0.97 0.2 1.4
9. Other 0.2 0.2 0.65 0.91 1.4 0.7
Cleaner Fuel 80.5 18 73.37 9.12 81.8 22.9
Total Fuel 100 100 100 100 100 100 Source: NFHS and Census 2001
19.6
82
26.63
90.88
18.1
77.3 80.5
18
73.37
9.12
81.8
22.9
0
10
20
30
40
50
60
70
80
90
100
1995-96 Urban
1995-96 Rural
2001 Urban
2001 Rural 2005-06 Urban
2005-06 Rural
Fue
l Usa
ge in
Pe
rce
nta
ge
Fig 1.18: Fuel Usage at Household level in Gujarat State
Unprocessed Solid Fuel
Cleaner Fuel
Section II- State

Section II – State
State of Air Environment
Page 39
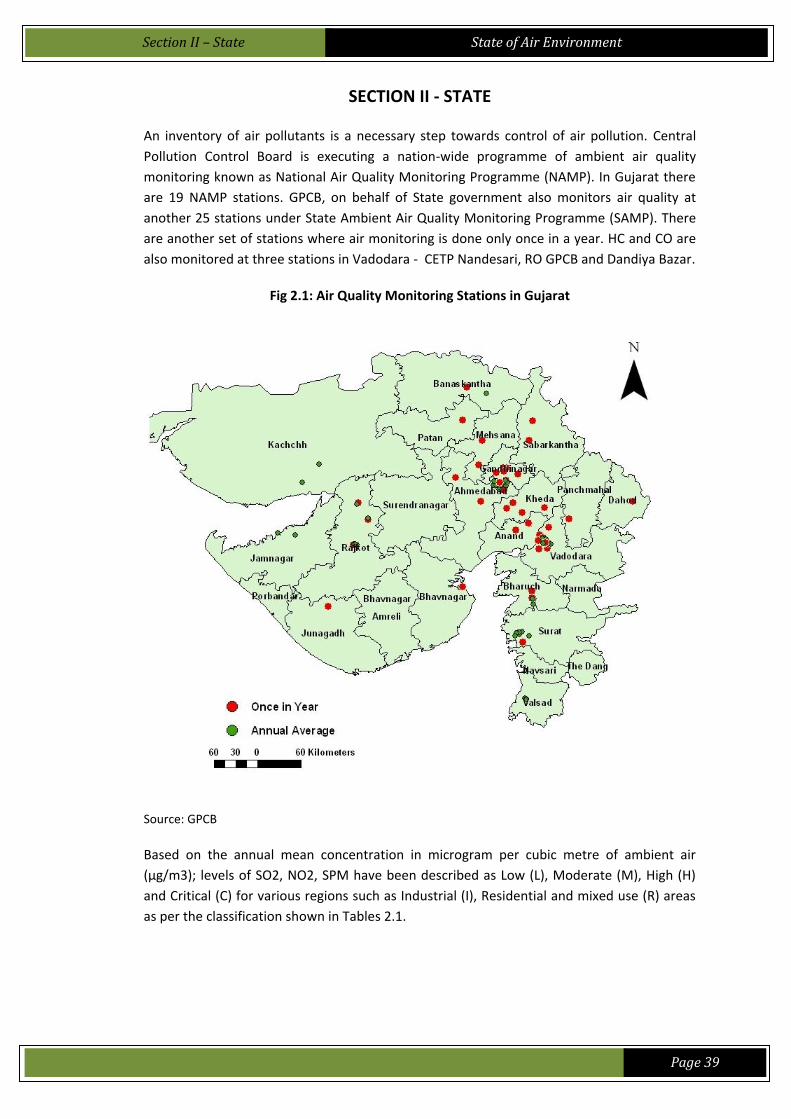
SECTION II - STATE
An inventory of air pollutants is a necessary step towards control of air pollution. Central
Pollution Control Board is executing a nation-wide programme of ambient air quality
monitoring known as National Air Quality Monitoring Programme (NAMP). In Gujarat there
are 19 NAMP stations. GPCB, on behalf of State government also monitors air quality at
another 25 stations under State Ambient Air Quality Monitoring Programme (SAMP). There
are another set of stations where air monitoring is done only once in a year. HC and CO are
also monitored at three stations in Vadodara - CETP Nandesari, RO GPCB and Dandiya Bazar.
Fig 2.1: Air Quality Monitoring Stations in Gujarat
Source: GPCB
Based on the annual mean concentration in microgram per cubic metre of ambient air
(μg/m3); levels of SO2, NO2, SPM have been described as Low (L), Moderate (M), High (H)
and Critical (C) for various regions such as Industrial (I), Residential and mixed use (R) areas
as per the classification shown in Tables 2.1.
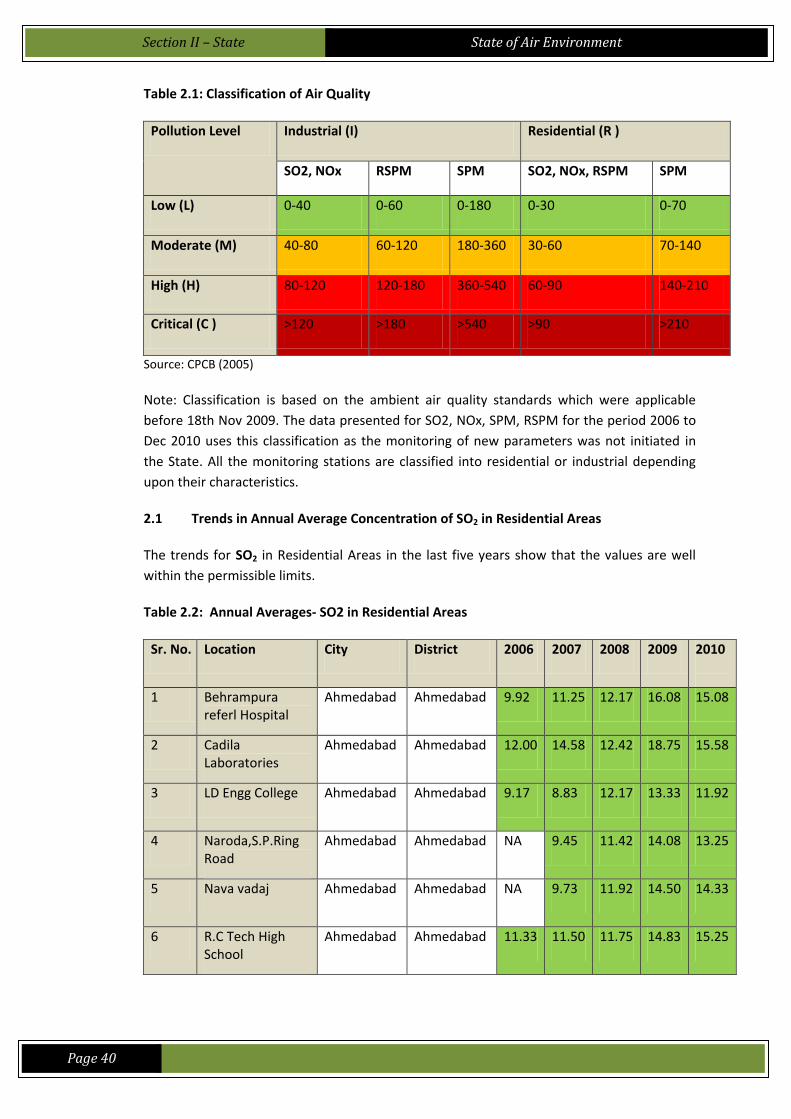
Section II – State
State of Air Environment
Page 40
Table 2.1: Classification of Air Quality
Pollution Level Industrial (I) Residential (R )
SO2, NOx RSPM SPM SO2, NOx, RSPM SPM
Low (L) 0-40 0-60 0-180 0-30 0-70
Moderate (M) 40-80 60-120 180-360 30-60 70-140
High (H) 80-120 120-180 360-540 60-90 140-210
Critical (C ) >120 >180 >540 >90 >210
Source: CPCB (2005)
Note: Classification is based on the ambient air quality standards which were applicable
before 18th Nov 2009. The data presented for SO2, NOx, SPM, RSPM for the period 2006 to
Dec 2010 uses this classification as the monitoring of new parameters was not initiated in
the State. All the monitoring stations are classified into residential or industrial depending
upon their characteristics.
2.1 Trends in Annual Average Concentration of SO2 in Residential Areas
The trends for SO2 in Residential Areas in the last five years show that the values are well
within the permissible limits.
Table 2.2: Annual Averages- SO2 in Residential Areas
Sr. No. Sr.No. Location City District 2006 2007 2008 2009 2010
1 Behrampura
referl Hospital Ahmedabad Ahmedabad 9.92 11.25 12.17 16.08 15.08
2 Cadila Laboratories
Ahmedabad Ahmedabad 12.00 14.58 12.42 18.75 15.58
3 LD Engg College Ahmedabad Ahmedabad 9.17 8.83 12.17 13.33 11.92
4 Naroda,S.P.Ring Road
Ahmedabad Ahmedabad NA 9.45 11.42 14.08 13.25
5 Nava vadaj Ahmedabad Ahmedabad NA 9.73 11.92 14.50 14.33
6 R.C Tech High School
Ahmedabad Ahmedabad 11.33 11.50 11.75 14.83 15.25
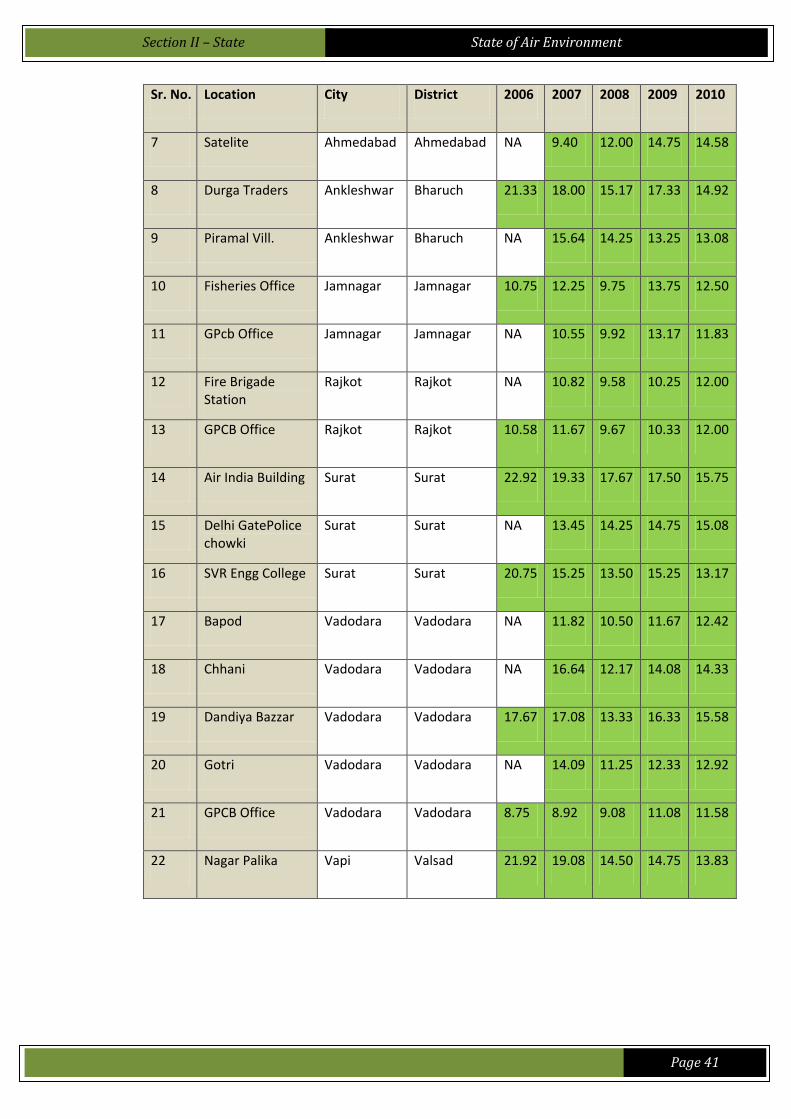
Section II – State
State of Air Environment
Page 41
Sr. No. Sr.No. Location City District 2006 2007 2008 2009 2010
7 Satelite Ahmedabad Ahmedabad NA 9.40 12.00 14.75 14.58
8 Durga Traders Ankleshwar Bharuch 21.33 18.00 15.17 17.33 14.92
9 Piramal Vill. Ankleshwar Bharuch NA 15.64 14.25 13.25 13.08
10 Fisheries Office Jamnagar Jamnagar 10.75 12.25 9.75 13.75 12.50
11 GPcb Office Jamnagar Jamnagar NA 10.55 9.92 13.17 11.83
12 Fire Brigade Station
Rajkot Rajkot NA 10.82 9.58 10.25 12.00
13 GPCB Office Rajkot Rajkot 10.58 11.67 9.67 10.33 12.00
14 Air India Building Surat Surat 22.92 19.33 17.67 17.50 15.75
15 Delhi GatePolice chowki
Surat Surat NA 13.45 14.25 14.75 15.08
16 SVR Engg College Surat Surat 20.75 15.25 13.50 15.25 13.17
17 Bapod Vadodara Vadodara NA 11.82 10.50 11.67 12.42
18 Chhani Vadodara Vadodara NA 16.64 12.17 14.08 14.33
19 Dandiya Bazzar Vadodara Vadodara 17.67 17.08 13.33 16.33 15.58
20 Gotri Vadodara Vadodara NA 14.09 11.25 12.33 12.92
21 GPCB Office Vadodara Vadodara 8.75 8.92 9.08 11.08 11.58
22 Nagar Palika Vapi Valsad 21.92 19.08 14.50 14.75 13.83
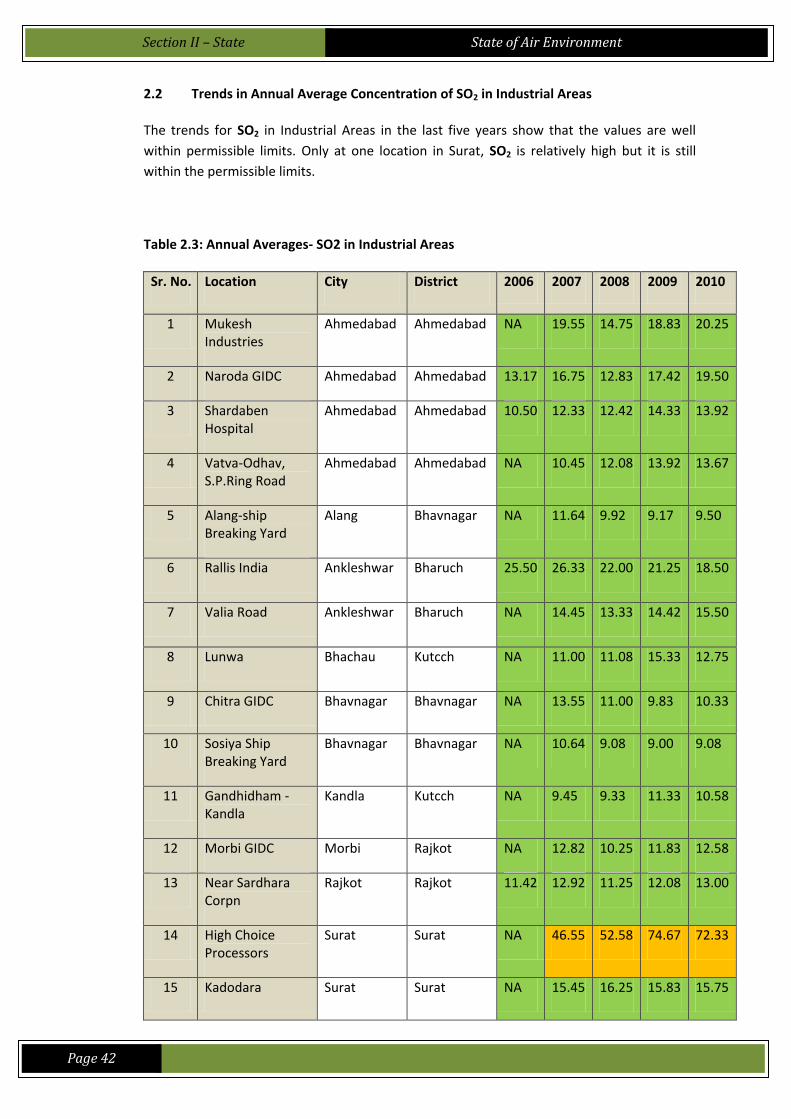
Section II – State
State of Air Environment
Page 42
2.2 Trends in Annual Average Concentration of SO2 in Industrial Areas
The trends for SO2 in Industrial Areas in the last five years show that the values are well
within permissible limits. Only at one location in Surat, SO2 is relatively high but it is still
within the permissible limits.
Table 2.3: Annual Averages- SO2 in Industrial Areas
Sr. No. Location City District 2006 2007 2008 2009 2010
1 Mukesh Industries
Ahmedabad Ahmedabad NA 19.55 14.75 18.83 20.25
2 Naroda GIDC Ahmedabad Ahmedabad 13.17 16.75 12.83 17.42 19.50
3 Shardaben Hospital
Ahmedabad Ahmedabad 10.50 12.33 12.42 14.33 13.92
4 Vatva-Odhav, S.P.Ring Road
Ahmedabad Ahmedabad NA 10.45 12.08 13.92 13.67
5 Alang-ship Breaking Yard
Alang Bhavnagar NA 11.64 9.92 9.17 9.50
6 Rallis India Ankleshwar Bharuch 25.50 26.33 22.00 21.25 18.50
7 Valia Road Ankleshwar Bharuch NA 14.45 13.33 14.42 15.50
8 Lunwa Bhachau Kutcch NA 11.00 11.08 15.33 12.75
9 Chitra GIDC Bhavnagar Bhavnagar NA 13.55 11.00 9.83 10.33
10 Sosiya Ship Breaking Yard
Bhavnagar Bhavnagar NA 10.64 9.08 9.00 9.08
11 Gandhidham - Kandla
Kandla Kutcch NA 9.45 9.33 11.33 10.58
12 Morbi GIDC Morbi Rajkot NA 12.82 10.25 11.83 12.58
13 Near Sardhara Corpn
Rajkot Rajkot 11.42 12.92 11.25 12.08 13.00
14 High Choice Processors
Surat Surat NA 46.55 52.58 74.67 72.33
15 Kadodara Surat Surat NA 15.45 16.25 15.83 15.75
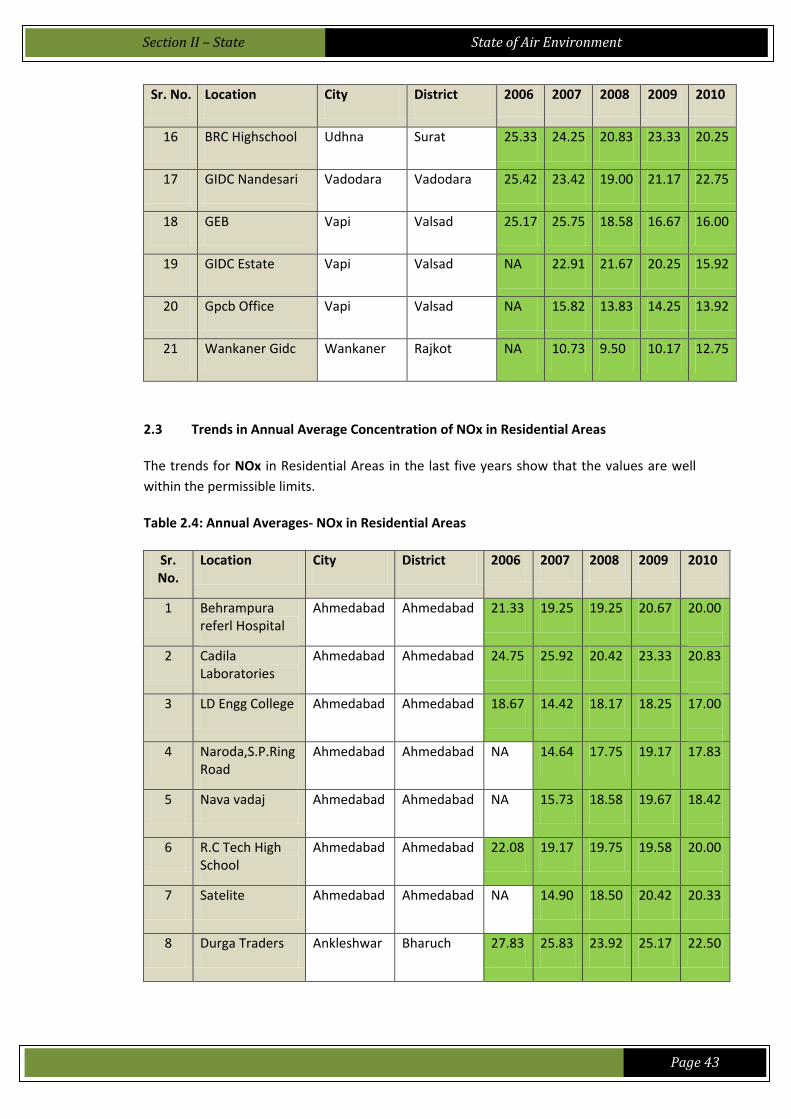
Section II – State
State of Air Environment
Page 43
Sr. No. Location City District 2006 2007 2008 2009 2010
16 BRC Highschool Udhna Surat 25.33 24.25 20.83 23.33 20.25
17 GIDC Nandesari Vadodara Vadodara 25.42 23.42 19.00 21.17 22.75
18 GEB Vapi Valsad 25.17 25.75 18.58 16.67 16.00
19 GIDC Estate Vapi Valsad NA 22.91 21.67 20.25 15.92
20 Gpcb Office Vapi Valsad NA 15.82 13.83 14.25 13.92
21 Wankaner Gidc Wankaner Rajkot NA 10.73 9.50 10.17 12.75
2.3 Trends in Annual Average Concentration of NOx in Residential Areas
The trends for NOx in Residential Areas in the last five years show that the values are well
within the permissible limits.
Table 2.4: Annual Averages- NOx in Residential Areas
Sr. No.
Location City District 2006 2007 2008 2009 2010
1 Behrampura
referl Hospital Ahmedabad Ahmedabad 21.33 19.25 19.25 20.67 20.00
2 Cadila
Laboratories Ahmedabad Ahmedabad 24.75 25.92 20.42 23.33 20.83
3 LD Engg College Ahmedabad Ahmedabad 18.67 14.42 18.17 18.25 17.00
4 Naroda,S.P.Ring
Road Ahmedabad Ahmedabad NA 14.64 17.75 19.17 17.83
5 Nava vadaj Ahmedabad Ahmedabad NA 15.73 18.58 19.67 18.42
6 R.C Tech High
School Ahmedabad Ahmedabad 22.08 19.17 19.75 19.58 20.00
7 Satelite Ahmedabad Ahmedabad NA 14.90 18.50 20.42 20.33
8 Durga Traders Ankleshwar Bharuch 27.83 25.83 23.92 25.17 22.50
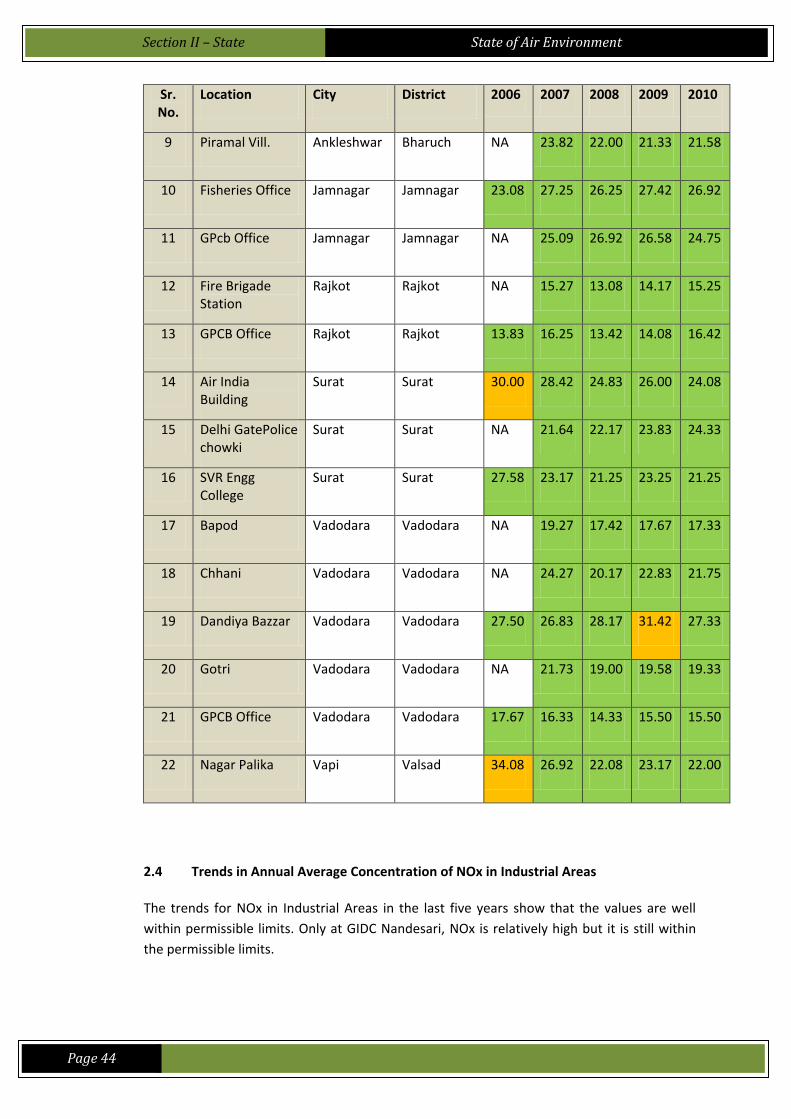
Section II – State
State of Air Environment
Page 44
Sr. No.
Location City District 2006 2007 2008 2009 2010
9 Piramal Vill. Ankleshwar Bharuch NA 23.82 22.00 21.33 21.58
10 Fisheries Office Jamnagar Jamnagar 23.08 27.25 26.25 27.42 26.92
11 GPcb Office Jamnagar Jamnagar NA 25.09 26.92 26.58 24.75
12 Fire Brigade Station
Rajkot Rajkot NA 15.27 13.08 14.17 15.25
13 GPCB Office Rajkot Rajkot 13.83 16.25 13.42 14.08 16.42
14 Air India Building
Surat Surat 30.00 28.42 24.83 26.00 24.08
15 Delhi GatePolice chowki
Surat Surat NA 21.64 22.17 23.83 24.33
16 SVR Engg College
Surat Surat 27.58 23.17 21.25 23.25 21.25
17 Bapod Vadodara Vadodara NA 19.27 17.42 17.67 17.33
18 Chhani Vadodara Vadodara NA 24.27 20.17 22.83 21.75
19 Dandiya Bazzar Vadodara Vadodara 27.50 26.83 28.17 31.42 27.33
20 Gotri Vadodara Vadodara NA 21.73 19.00 19.58 19.33
21 GPCB Office Vadodara Vadodara 17.67 16.33 14.33 15.50 15.50
22 Nagar Palika Vapi Valsad 34.08 26.92 22.08 23.17 22.00
2.4 Trends in Annual Average Concentration of NOx in Industrial Areas
The trends for NOx in Industrial Areas in the last five years show that the values are well
within permissible limits. Only at GIDC Nandesari, NOx is relatively high but it is still within
the permissible limits.
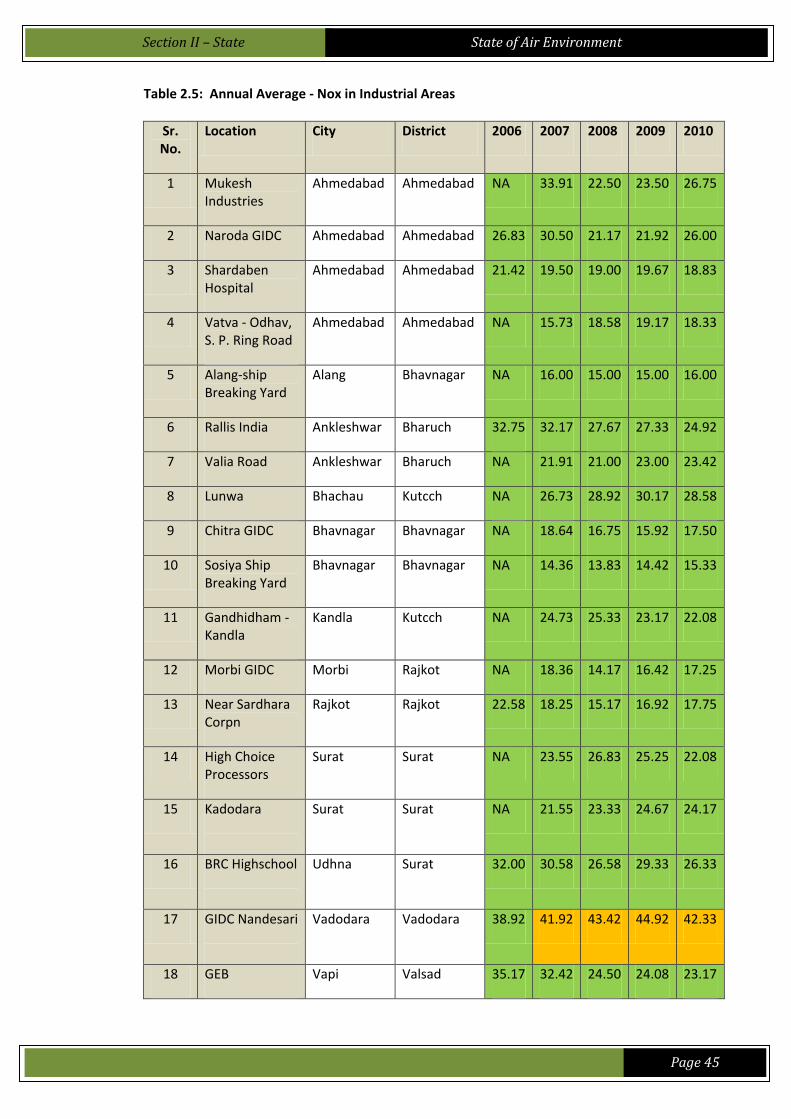
Section II – State
State of Air Environment
Page 45
Table 2.5: Annual Average - Nox in Industrial Areas
Sr. No.
Location City District 2006 2007 2008 2009 2010
1 Mukesh Industries
Ahmedabad Ahmedabad NA 33.91 22.50 23.50 26.75
2 Naroda GIDC Ahmedabad Ahmedabad 26.83 30.50 21.17 21.92 26.00
3 Shardaben Hospital
Ahmedabad Ahmedabad 21.42 19.50 19.00 19.67 18.83
4 Vatva - Odhav, S. P. Ring Road
Ahmedabad Ahmedabad NA 15.73 18.58 19.17 18.33
5 Alang-ship Breaking Yard
Alang Bhavnagar NA 16.00 15.00 15.00 16.00
6 Rallis India Ankleshwar Bharuch 32.75 32.17 27.67 27.33 24.92
7 Valia Road Ankleshwar Bharuch NA 21.91 21.00 23.00 23.42
8 Lunwa Bhachau Kutcch NA 26.73 28.92 30.17 28.58
9 Chitra GIDC Bhavnagar Bhavnagar NA 18.64 16.75 15.92 17.50
10 Sosiya Ship Breaking Yard
Bhavnagar Bhavnagar NA 14.36 13.83 14.42 15.33
11 Gandhidham - Kandla
Kandla Kutcch NA 24.73 25.33 23.17 22.08
12 Morbi GIDC Morbi Rajkot NA 18.36 14.17 16.42 17.25
13 Near Sardhara Corpn
Rajkot Rajkot 22.58 18.25 15.17 16.92 17.75
14 High Choice Processors
Surat Surat NA 23.55 26.83 25.25 22.08
15 Kadodara
Surat Surat NA 21.55 23.33 24.67 24.17
16 BRC Highschool
Udhna Surat 32.00 30.58 26.58 29.33 26.33
17 GIDC Nandesari
Vadodara Vadodara 38.92 41.92 43.42 44.92 42.33
18 GEB Vapi Valsad 35.17 32.42 24.50 24.08 23.17
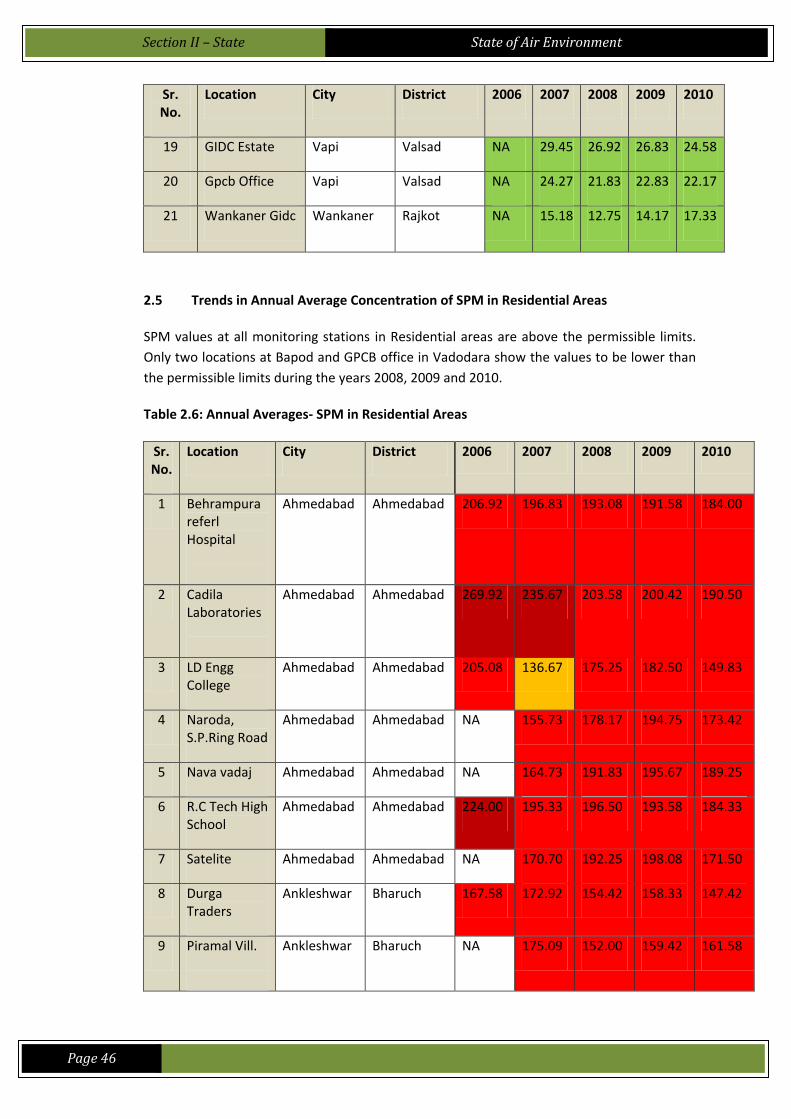
Section II – State
State of Air Environment
Page 46
Sr. No.
Location City District 2006 2007 2008 2009 2010
19 GIDC Estate Vapi Valsad NA 29.45 26.92 26.83 24.58
20 Gpcb Office Vapi Valsad NA 24.27 21.83 22.83 22.17
21 Wankaner Gidc Wankaner Rajkot NA 15.18 12.75 14.17 17.33
2.5 Trends in Annual Average Concentration of SPM in Residential Areas
SPM values at all monitoring stations in Residential areas are above the permissible limits.
Only two locations at Bapod and GPCB office in Vadodara show the values to be lower than
the permissible limits during the years 2008, 2009 and 2010.
Table 2.6: Annual Averages- SPM in Residential Areas
Sr. No.
Location City District 2006 2007 2008 2009 2010
1 Behrampura referl Hospital
Ahmedabad Ahmedabad 206.92 196.83 193.08 191.58 184.00
2 Cadila Laboratories
Ahmedabad Ahmedabad 269.92 235.67 203.58 200.42 190.50
3 LD Engg College
Ahmedabad Ahmedabad 205.08 136.67 175.25 182.50 149.83
4 Naroda, S.P.Ring Road
Ahmedabad Ahmedabad NA 155.73 178.17 194.75 173.42
5 Nava vadaj Ahmedabad Ahmedabad NA 164.73 191.83 195.67 189.25
6 R.C Tech High School
Ahmedabad Ahmedabad 224.00 195.33 196.50 193.58 184.33
7 Satelite Ahmedabad Ahmedabad NA 170.70 192.25 198.08 171.50
8 Durga Traders
Ankleshwar Bharuch 167.58 172.92 154.42 158.33 147.42
9 Piramal Vill.
Ankleshwar Bharuch NA 175.09 152.00 159.42 161.58
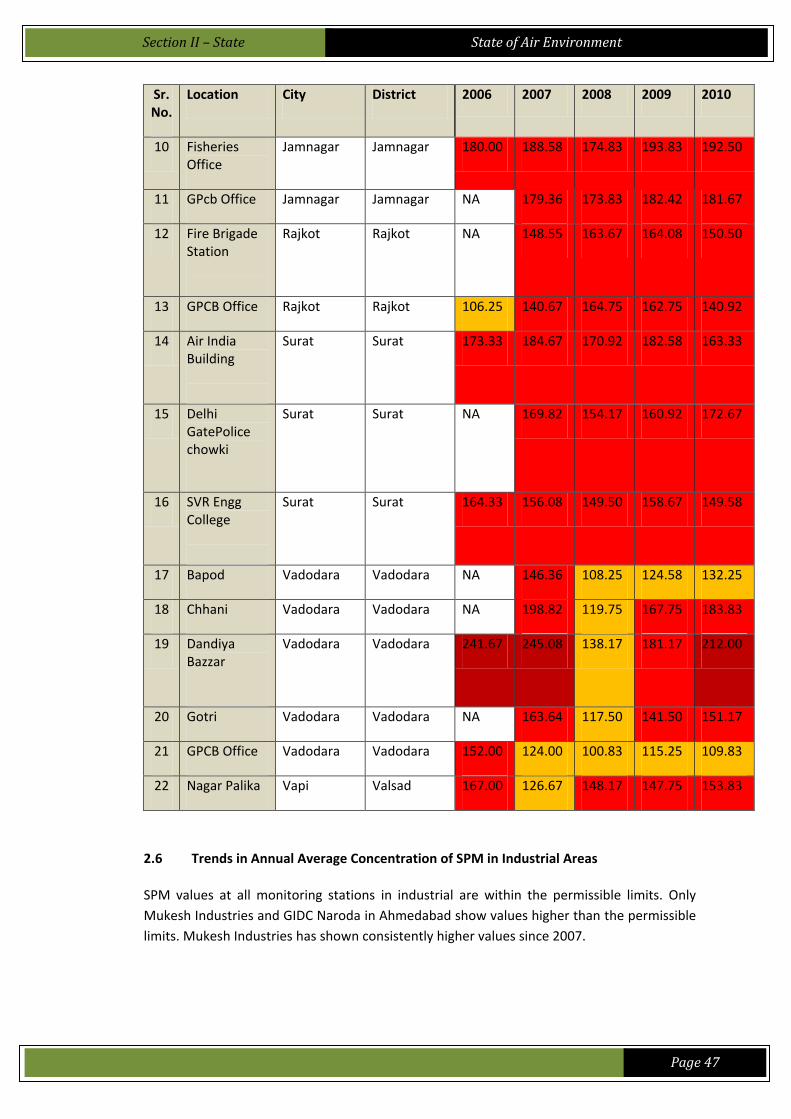
Section II – State
State of Air Environment
Page 47
Sr. No.
Location City District 2006 2007 2008 2009 2010
10 Fisheries Office
Jamnagar Jamnagar 180.00 188.58 174.83 193.83 192.50
11 GPcb Office Jamnagar Jamnagar NA 179.36 173.83 182.42 181.67
12 Fire Brigade Station
Rajkot Rajkot NA 148.55 163.67 164.08 150.50
13 GPCB Office Rajkot Rajkot 106.25 140.67 164.75 162.75 140.92
14 Air India Building
Surat Surat 173.33 184.67 170.92 182.58 163.33
15 Delhi GatePolice chowki
Surat Surat NA 169.82 154.17 160.92 172.67
16 SVR Engg College
Surat Surat 164.33 156.08 149.50 158.67 149.58
17 Bapod Vadodara Vadodara NA 146.36 108.25 124.58 132.25
18 Chhani Vadodara Vadodara NA 198.82 119.75 167.75 183.83
19 Dandiya Bazzar
Vadodara Vadodara 241.67 245.08 138.17 181.17 212.00
20 Gotri Vadodara Vadodara NA 163.64 117.50 141.50 151.17
21 GPCB Office Vadodara Vadodara 152.00 124.00 100.83 115.25 109.83
22 Nagar Palika Vapi Valsad 167.00 126.67 148.17 147.75 153.83
2.6 Trends in Annual Average Concentration of SPM in Industrial Areas
SPM values at all monitoring stations in industrial are within the permissible limits. Only
Mukesh Industries and GIDC Naroda in Ahmedabad show values higher than the permissible
limits. Mukesh Industries has shown consistently higher values since 2007.
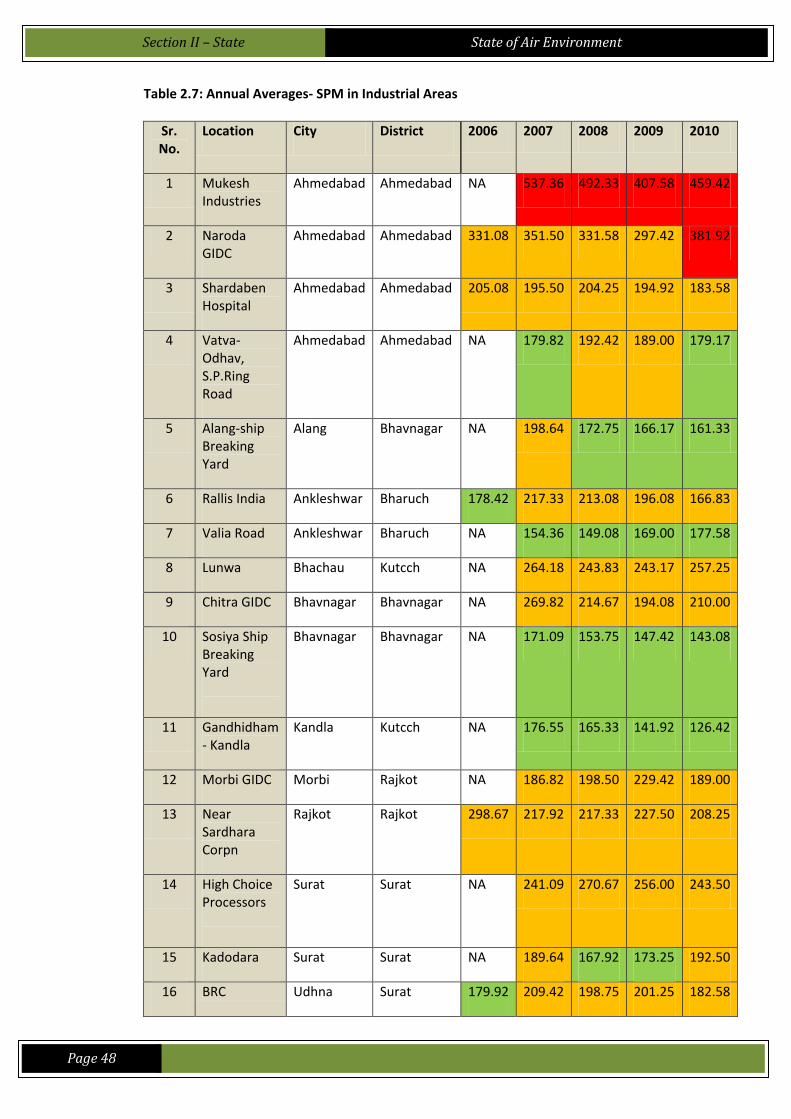
Section II – State
State of Air Environment
Page 48
Table 2.7: Annual Averages- SPM in Industrial Areas
Sr. No.
Location City District 2006 2007 2008 2009 2010
1 Mukesh Industries
Ahmedabad Ahmedabad NA 537.36 492.33 407.58 459.42
2 Naroda GIDC
Ahmedabad Ahmedabad 331.08 351.50 331.58 297.42 381.92
3 Shardaben Hospital
Ahmedabad Ahmedabad 205.08 195.50 204.25 194.92 183.58
4 Vatva-Odhav, S.P.Ring Road
Ahmedabad Ahmedabad NA 179.82 192.42 189.00 179.17
5 Alang-ship Breaking Yard
Alang Bhavnagar NA 198.64 172.75 166.17 161.33
6 Rallis India Ankleshwar Bharuch 178.42 217.33 213.08 196.08 166.83
7 Valia Road Ankleshwar Bharuch NA 154.36 149.08 169.00 177.58
8 Lunwa Bhachau Kutcch NA 264.18 243.83 243.17 257.25
9 Chitra GIDC Bhavnagar Bhavnagar NA 269.82 214.67 194.08 210.00
10 Sosiya Ship Breaking Yard
Bhavnagar Bhavnagar NA 171.09 153.75 147.42 143.08
11 Gandhidham - Kandla
Kandla Kutcch NA 176.55 165.33 141.92 126.42
12 Morbi GIDC Morbi Rajkot NA 186.82 198.50 229.42 189.00
13 Near Sardhara Corpn
Rajkot Rajkot 298.67 217.92 217.33 227.50 208.25
14 High Choice Processors
Surat Surat NA 241.09 270.67 256.00 243.50
15 Kadodara Surat Surat NA 189.64 167.92 173.25 192.50
16 BRC Udhna Surat 179.92 209.42 198.75 201.25 182.58
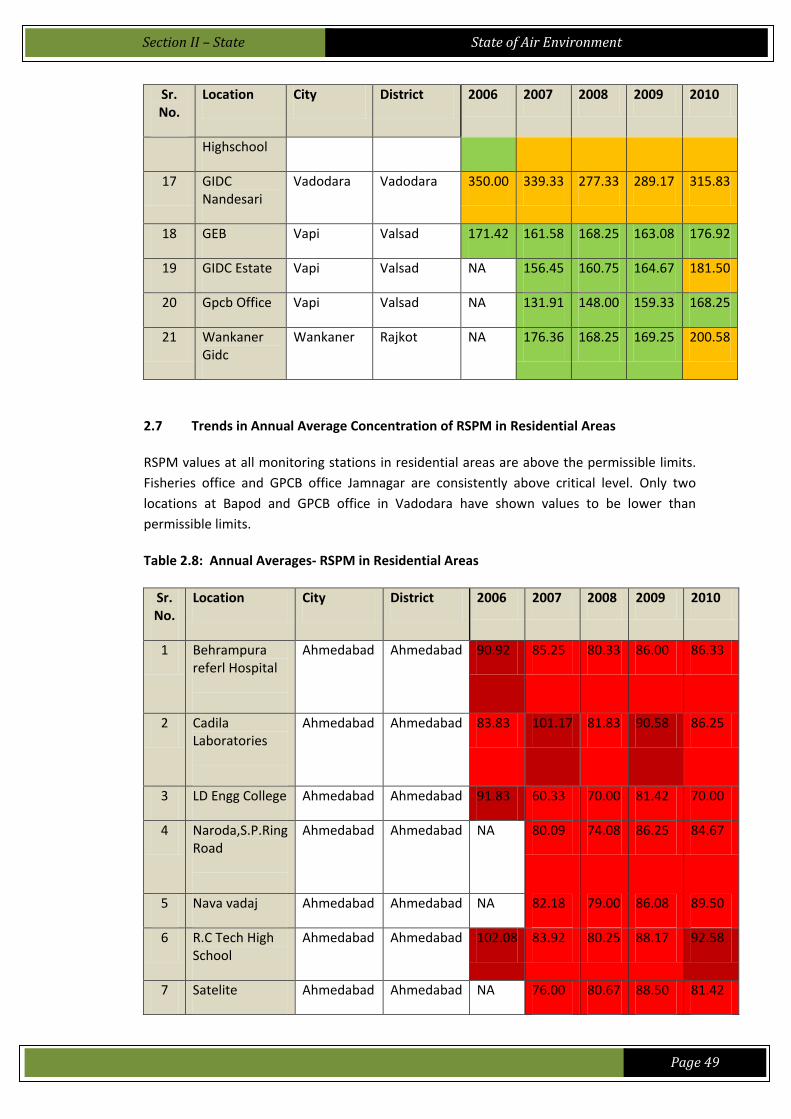
Section II – State
State of Air Environment
Page 49
Sr. No.
Location City District 2006 2007 2008 2009 2010
Highschool
17 GIDC Nandesari
Vadodara Vadodara 350.00 339.33 277.33 289.17 315.83
18 GEB Vapi Valsad 171.42 161.58 168.25 163.08 176.92
19 GIDC Estate Vapi Valsad NA 156.45 160.75 164.67 181.50
20 Gpcb Office Vapi Valsad NA 131.91 148.00 159.33 168.25
21 Wankaner Gidc
Wankaner Rajkot NA 176.36 168.25 169.25 200.58
2.7 Trends in Annual Average Concentration of RSPM in Residential Areas
RSPM values at all monitoring stations in residential areas are above the permissible limits.
Fisheries office and GPCB office Jamnagar are consistently above critical level. Only two
locations at Bapod and GPCB office in Vadodara have shown values to be lower than
permissible limits.
Table 2.8: Annual Averages- RSPM in Residential Areas
Sr. No.
Location City District 2006 2007 2008 2009 2010
1 Behrampura referl Hospital
Ahmedabad Ahmedabad 90.92 85.25 80.33 86.00 86.33
2 Cadila Laboratories
Ahmedabad Ahmedabad 83.83 101.17 81.83 90.58 86.25
3 LD Engg College Ahmedabad Ahmedabad 91.83 60.33 70.00 81.42 70.00
4 Naroda,S.P.Ring Road
Ahmedabad Ahmedabad NA 80.09 74.08 86.25 84.67
5 Nava vadaj Ahmedabad Ahmedabad NA 82.18 79.00 86.08 89.50
6 R.C Tech High School
Ahmedabad Ahmedabad 102.08 83.92 80.25 88.17 92.58
7 Satelite Ahmedabad Ahmedabad NA 76.00 80.67 88.50 81.42
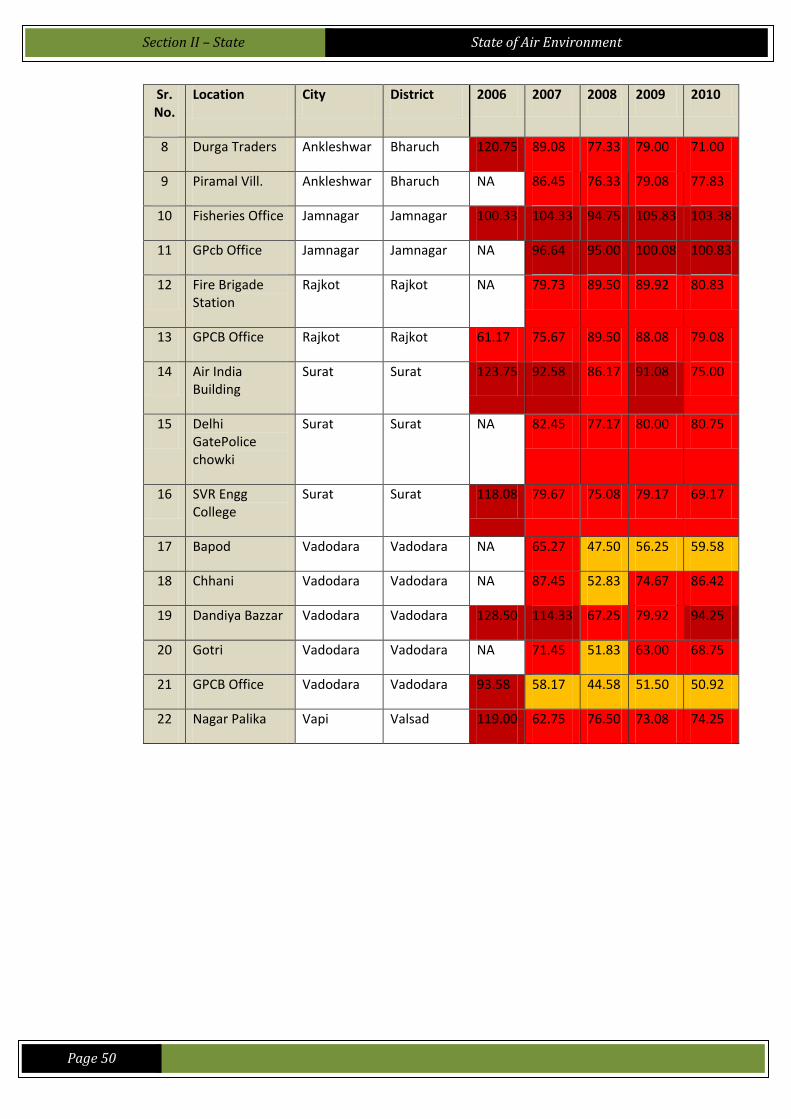
Section II – State
State of Air Environment
Page 50
Sr. No.
Location City District 2006 2007 2008 2009 2010
8 Durga Traders Ankleshwar Bharuch 120.75 89.08 77.33 79.00 71.00
9 Piramal Vill. Ankleshwar Bharuch NA 86.45 76.33 79.08 77.83
10 Fisheries Office Jamnagar Jamnagar 100.33 104.33 94.75 105.83 103.38
11 GPcb Office Jamnagar Jamnagar NA 96.64 95.00 100.08 100.83
12 Fire Brigade Station
Rajkot Rajkot NA 79.73 89.50 89.92 80.83
13 GPCB Office Rajkot Rajkot 61.17 75.67 89.50 88.08 79.08
14 Air India Building
Surat Surat 123.75 92.58 86.17 91.08 75.00
15 Delhi GatePolice chowki
Surat Surat NA 82.45 77.17 80.00 80.75
16 SVR Engg College
Surat Surat 118.08 79.67 75.08 79.17 69.17
17 Bapod Vadodara Vadodara NA 65.27 47.50 56.25 59.58
18 Chhani Vadodara Vadodara NA 87.45 52.83 74.67 86.42
19 Dandiya Bazzar Vadodara Vadodara 128.50 114.33 67.25 79.92 94.25
20 Gotri Vadodara Vadodara NA 71.45 51.83 63.00 68.75
21 GPCB Office Vadodara Vadodara 93.58 58.17 44.58 51.50 50.92
22 Nagar Palika Vapi Valsad 119.00 62.75 76.50 73.08 74.25
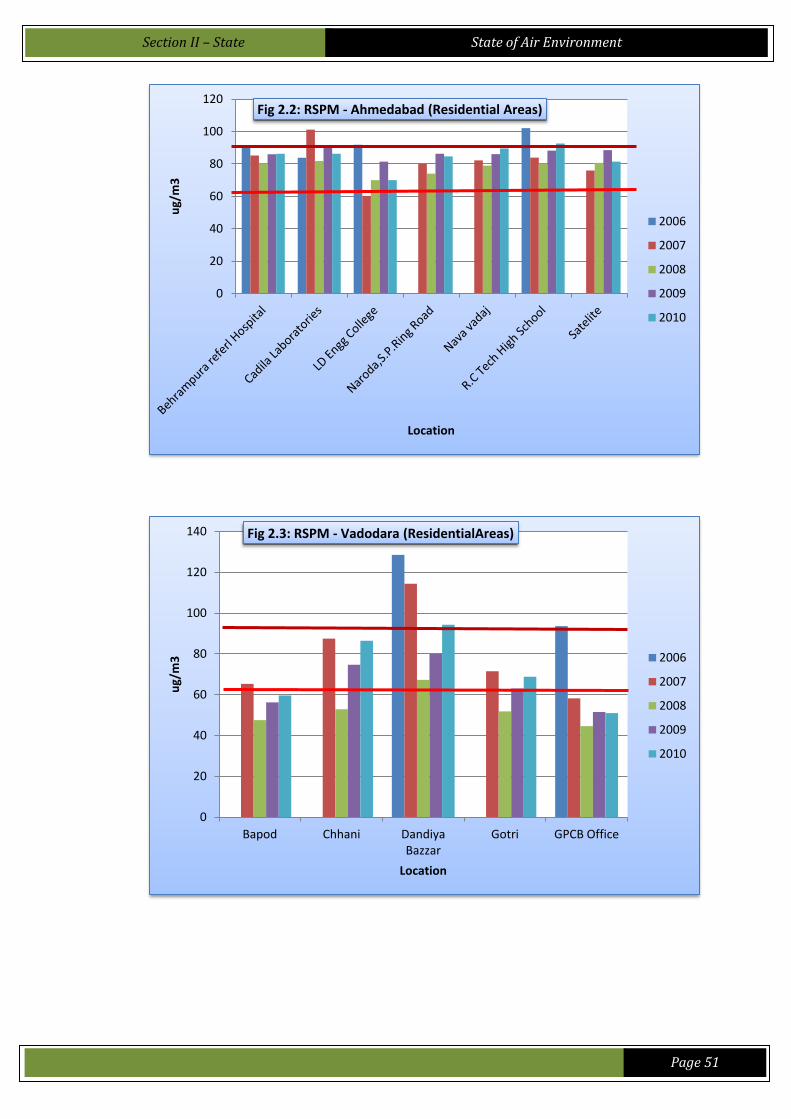
Section II – State
State of Air Environment
Page 51
0
20
40
60
80
100
120
ug/
m3
Location
Fig 2.2: RSPM - Ahmedabad (Residential Areas)
2006
2007
2008
2009
2010
0
20
40
60
80
100
120
140
Bapod Chhani Dandiya Bazzar
Gotri GPCB Office
ug/
m3
Location
Fig 2.3: RSPM - Vadodara (ResidentialAreas)
2006
2007
2008
2009
2010

Section II – State
State of Air Environment
Page 52
0
20
40
60
80
100
120
140
Air India Building Delhi GatePolice chowki SVR Engg College
μg/
Nm
3
Location
Fig 2.4: RSPM - Surat (Residential)
2006
2007
2008
2009
2010
0
10
20
30
40
50
60
70
80
90
100
Fire Brigade Station GPCB Office
μg/
Nm
3
Location
Fig 2.5: RSPM - Rajkot (Residential Area)
2006
2007
2008
2009
2010

Section II – State
State of Air Environment
Page 53
2.8 Trends in Annual Average Concentration of RSPM in Industrial Areas
RSPM values at all monitoring stations in industrial are within the permissible limits. Mukesh
Industries and GIDC Naroda in Ahmedabad show values to be higher than the permissible
limits. Lunva Bhachau and GIDC Nandesari also exhibit the same characteristics.
Table 2.9: Annual Average –RSPM in Industrial Areas
Sr. No.
Location City District 2006 2007 2008 2009 2010
1 Mukesh Industries
Ahmedabad Ahmedabad NA 214.2
7 170.2
5 174.1
7 189.3
3
2 Naroda GIDC
Ahmedabad Ahmedabad 143.92 150.42
133.67
128.92
160.42
3 Shardaben Hospital
Ahmedabad Ahmedabad 91.83 84.17 79.42 88.08 82.17
4 Vatva-Odhav, S.P.Ring
Road
Ahmedabad Ahmedabad NA 79.18 78.83 84.17 85.00
0
20
40
60
80
100
120
Fisheries Office GPcb Office
μg/
Nm
3
Location
Fig 2.6: RSPM - Jamnagar (Residential Area)
2006
2007
2008
2009
2010
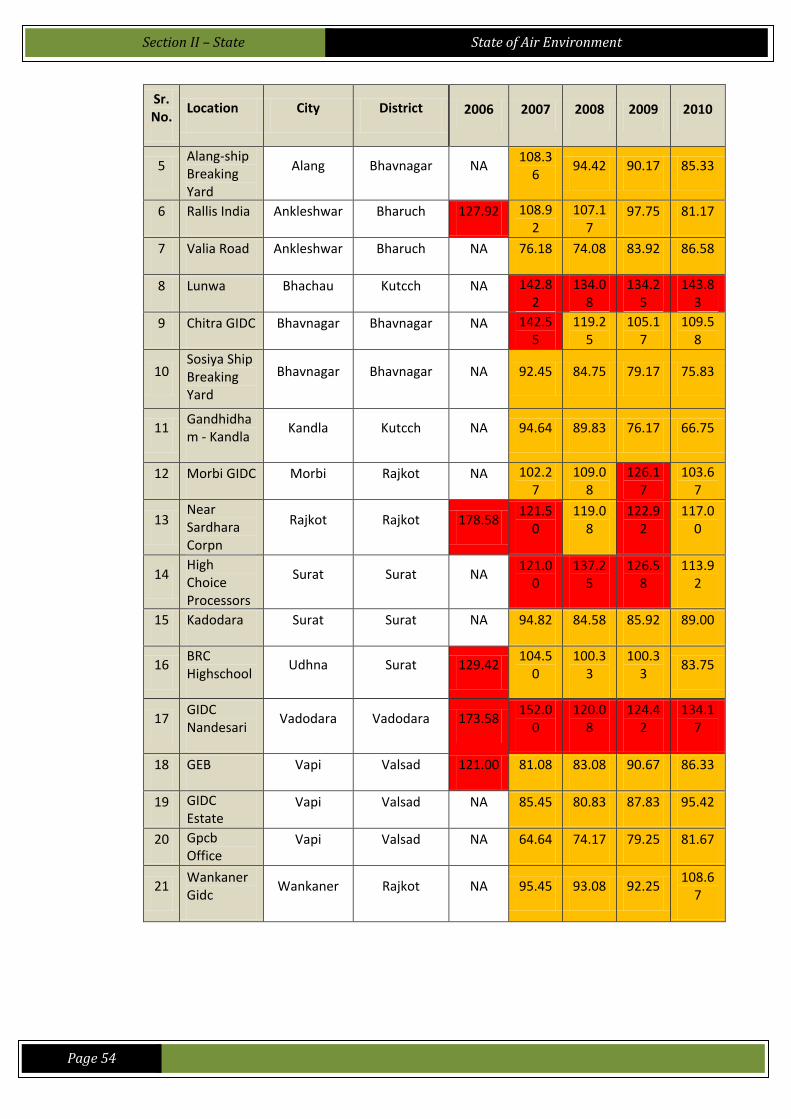
Section II – State
State of Air Environment
Page 54
Sr. No.
Location City District 2006 2007 2008 2009 2010
5 Alang-ship Breaking Yard
Alang Bhavnagar NA 108.3
6 94.42 90.17 85.33
6 Rallis India Ankleshwar Bharuch 127.92 108.92
107.17
97.75 81.17
7 Valia Road Ankleshwar Bharuch NA 76.18 74.08 83.92 86.58
8 Lunwa Bhachau Kutcch NA 142.82
134.08
134.25
143.83
9 Chitra GIDC Bhavnagar Bhavnagar NA 142.55
119.25
105.17
109.58
10 Sosiya Ship Breaking Yard
Bhavnagar Bhavnagar NA 92.45 84.75 79.17 75.83
11 Gandhidham - Kandla
Kandla Kutcch NA 94.64 89.83 76.17 66.75
12 Morbi GIDC Morbi Rajkot NA 102.27
109.08
126.17
103.67
13 Near Sardhara Corpn
Rajkot Rajkot 178.58 121.5
0 119.0
8 122.9
2 117.0
0
14 High Choice Processors
Surat Surat NA 121.0
0 137.2
5 126.5
8 113.9
2
15 Kadodara Surat Surat NA 94.82 84.58 85.92 89.00
16 BRC Highschool
Udhna Surat 129.42 104.5
0 100.3
3 100.3
3 83.75
17 GIDC Nandesari
Vadodara Vadodara 173.58 152.0
0 120.0
8 124.4
2 134.1
7
18 GEB Vapi Valsad 121.00 81.08 83.08 90.67 86.33
19 GIDC Estate
Vapi Valsad NA 85.45 80.83 87.83 95.42
20 Gpcb Office
Vapi Valsad NA 64.64 74.17 79.25 81.67
21 Wankaner Gidc
Wankaner Rajkot NA 95.45 93.08 92.25 108.6
7
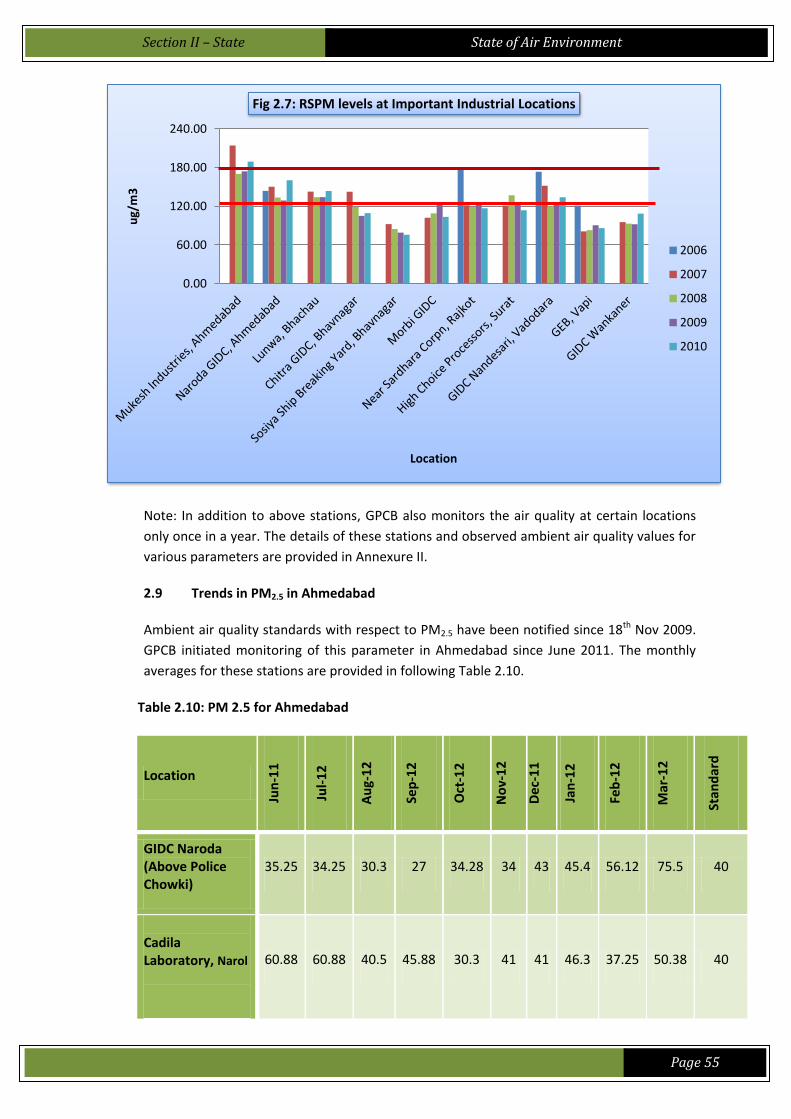
Section II – State
State of Air Environment
Page 55
Note: In addition to above stations, GPCB also monitors the air quality at certain locations
only once in a year. The details of these stations and observed ambient air quality values for
various parameters are provided in Annexure II.
2.9 Trends in PM2.5 in Ahmedabad
Ambient air quality standards with respect to PM2.5 have been notified since 18th Nov 2009.
GPCB initiated monitoring of this parameter in Ahmedabad since June 2011. The monthly
averages for these stations are provided in following Table 2.10.
Table 2.10: PM 2.5 for Ahmedabad
Location
Jun
-11
Jul-
12
Au
g-1
2
Sep
-12
Oct
-12
No
v-1
2
De
c-1
1
Jan
-12
Feb
-12
Mar
-12
Stan
dar
d
GIDC Naroda (Above Police Chowki)
35.25 34.25 30.3 27 34.28 34 43 45.4 56.12 75.5 40
Cadila Laboratory, Narol
60.88 60.88 40.5 45.88 30.3 41 41 46.3 37.25 50.38 40
0.00
60.00
120.00
180.00
240.00 u
g/m
3
Location
Fig 2.7: RSPM levels at Important Industrial Locations
2006
2007
2008
2009
2010
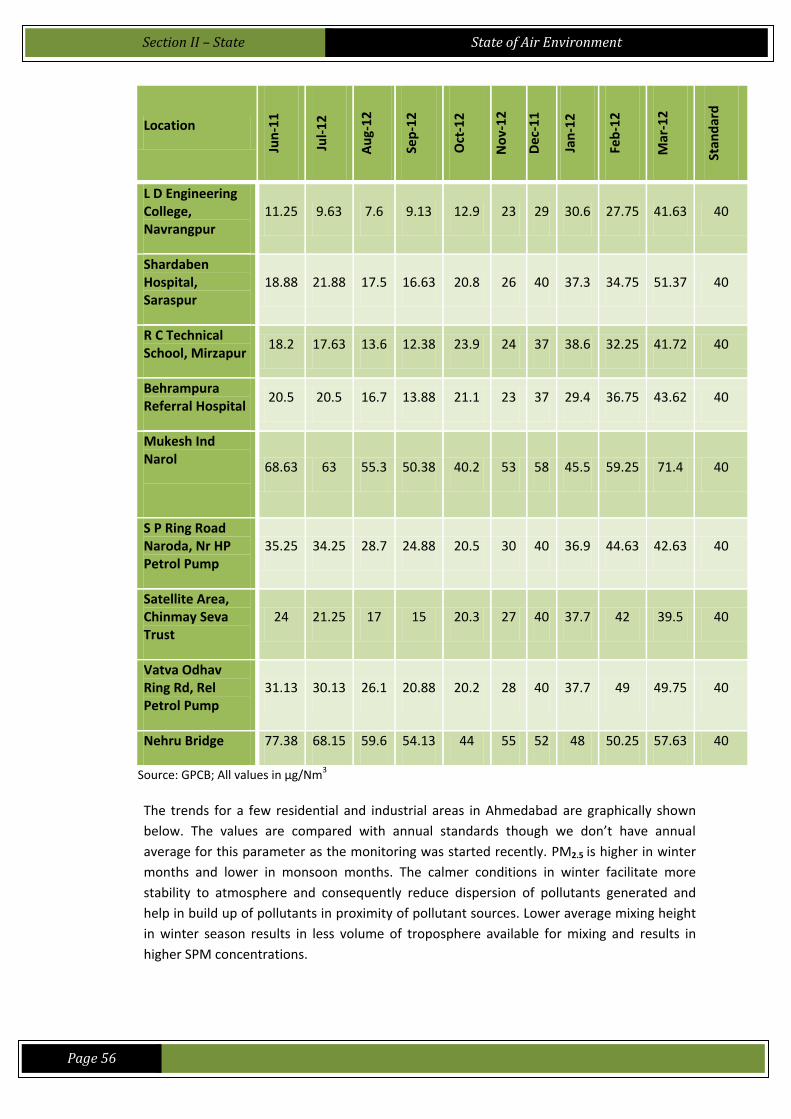
Section II – State
State of Air Environment
Page 56
Location
Jun
-11
Jul-
12
Au
g-1
2
Sep
-12
Oct
-12
No
v-1
2
De
c-1
1
Jan
-12
Feb
-12
Mar
-12
Stan
dar
d
L D Engineering College, Navrangpur
11.25 9.63 7.6 9.13 12.9 23 29 30.6 27.75 41.63 40
Shardaben Hospital, Saraspur
18.88 21.88 17.5 16.63 20.8 26 40 37.3 34.75 51.37 40
R C Technical School, Mirzapur
18.2 17.63 13.6 12.38 23.9 24 37 38.6 32.25 41.72 40
Behrampura Referral Hospital
20.5 20.5 16.7 13.88 21.1 23 37 29.4 36.75 43.62 40
Mukesh Ind Narol
68.63 63 55.3 50.38 40.2 53 58 45.5 59.25 71.4 40
S P Ring Road Naroda, Nr HP Petrol Pump
35.25 34.25 28.7 24.88 20.5 30 40 36.9 44.63 42.63 40
Satellite Area, Chinmay Seva Trust
24 21.25 17 15 20.3 27 40 37.7 42 39.5 40
Vatva Odhav Ring Rd, Rel Petrol Pump
31.13 30.13 26.1 20.88 20.2 28 40 37.7 49 49.75 40
Nehru Bridge 77.38 68.15 59.6 54.13 44 55 52 48 50.25 57.63 40
Source: GPCB; All values in µg/Nm3
The trends for a few residential and industrial areas in Ahmedabad are graphically shown
below. The values are compared with annual standards though we don’t have annual
average for this parameter as the monitoring was started recently. PM2.5 is higher in winter
months and lower in monsoon months. The calmer conditions in winter facilitate more
stability to atmosphere and consequently reduce dispersion of pollutants generated and
help in build up of pollutants in proximity of pollutant sources. Lower average mixing height
in winter season results in less volume of troposphere available for mixing and results in
higher SPM concentrations.
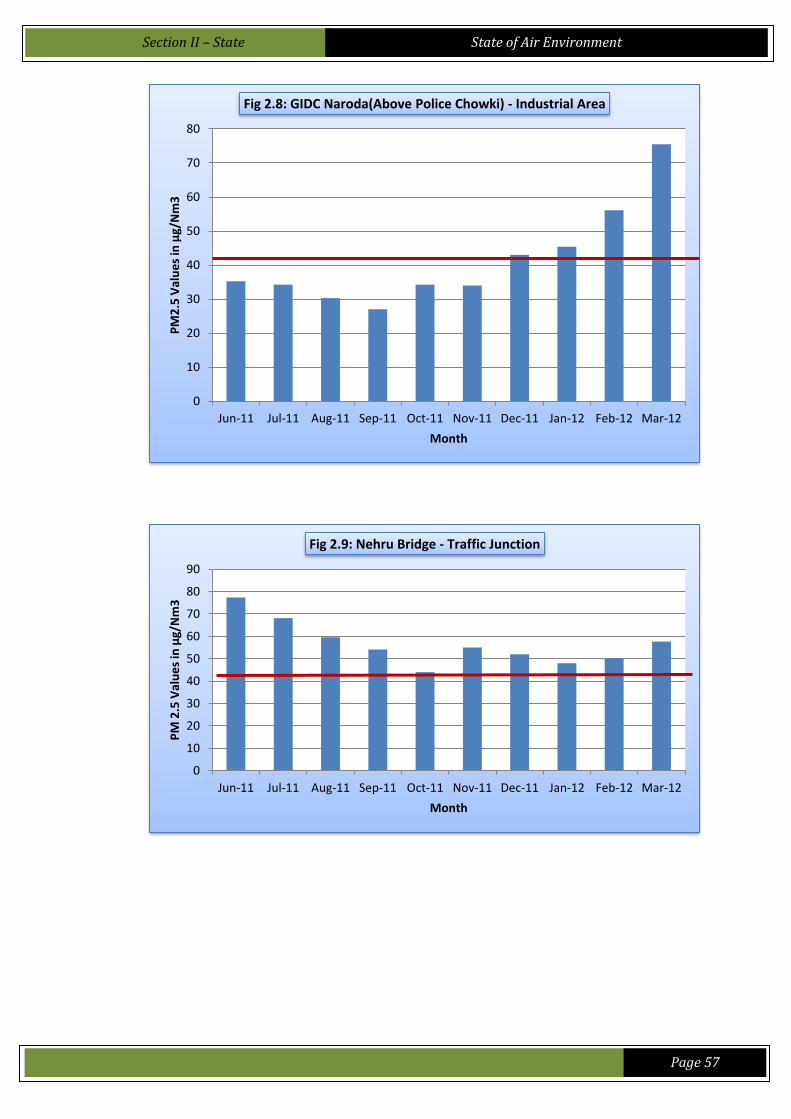
Section II – State
State of Air Environment
Page 57
0
10
20
30
40
50
60
70
80
Jun-11 Jul-11 Aug-11 Sep-11 Oct-11 Nov-11 Dec-11 Jan-12 Feb-12 Mar-12
PM
2.5
Val
ue
s in
µg/
Nm
3
Month
Fig 2.8: GIDC Naroda(Above Police Chowki) - Industrial Area
0
10
20
30
40
50
60
70
80
90
Jun-11 Jul-11 Aug-11 Sep-11 Oct-11 Nov-11 Dec-11 Jan-12 Feb-12 Mar-12
PM
2.5
Val
ue
s in
µg/
Nm
3
Month
Fig 2.9: Nehru Bridge - Traffic Junction
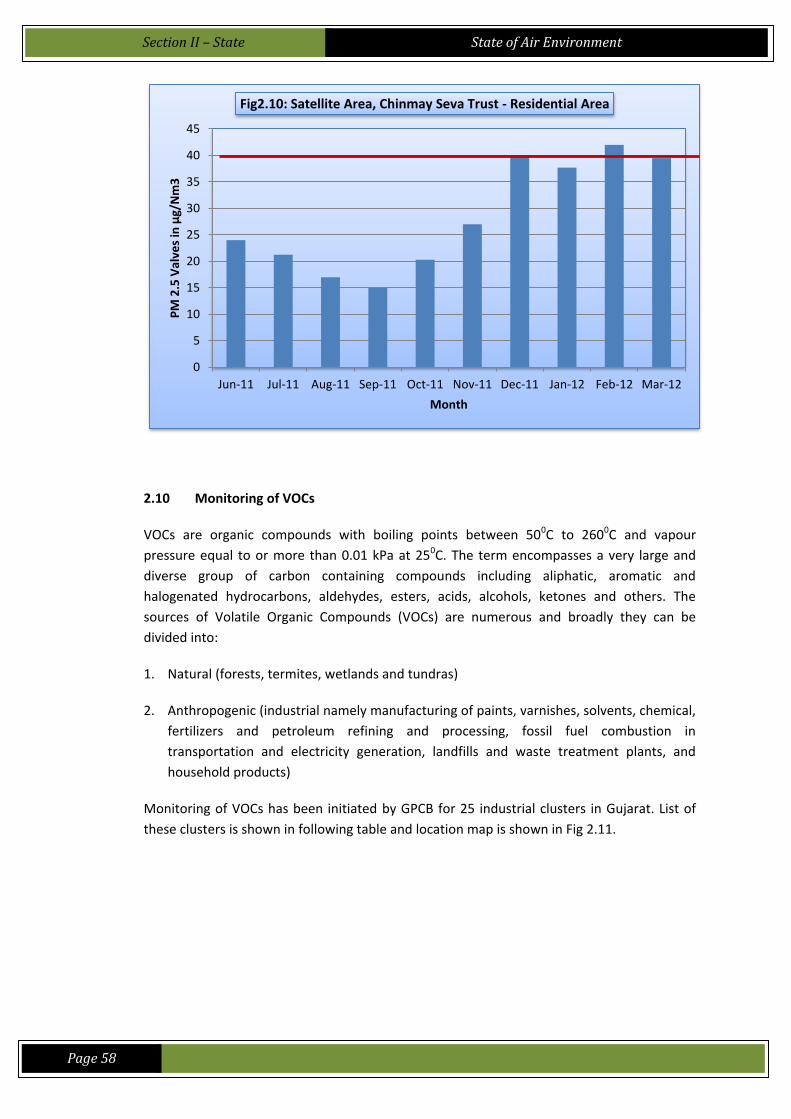
Section II – State
State of Air Environment
Page 58
2.10 Monitoring of VOCs
VOCs are organic compounds with boiling points between 500C to 2600C and vapour
pressure equal to or more than 0.01 kPa at 250C. The term encompasses a very large and
diverse group of carbon containing compounds including aliphatic, aromatic and
halogenated hydrocarbons, aldehydes, esters, acids, alcohols, ketones and others. The
sources of Volatile Organic Compounds (VOCs) are numerous and broadly they can be
divided into:
1. Natural (forests, termites, wetlands and tundras)
2. Anthropogenic (industrial namely manufacturing of paints, varnishes, solvents, chemical,
fertilizers and petroleum refining and processing, fossil fuel combustion in
transportation and electricity generation, landfills and waste treatment plants, and
household products)
Monitoring of VOCs has been initiated by GPCB for 25 industrial clusters in Gujarat. List of
these clusters is shown in following table and location map is shown in Fig 2.11.
0
5
10
15
20
25
30
35
40
45
Jun-11 Jul-11 Aug-11 Sep-11 Oct-11 Nov-11 Dec-11 Jan-12 Feb-12 Mar-12
PM
2.5
Val
ves
in µ
g/N
m3
Month
Fig2.10: Satellite Area, Chinmay Seva Trust - Residential Area
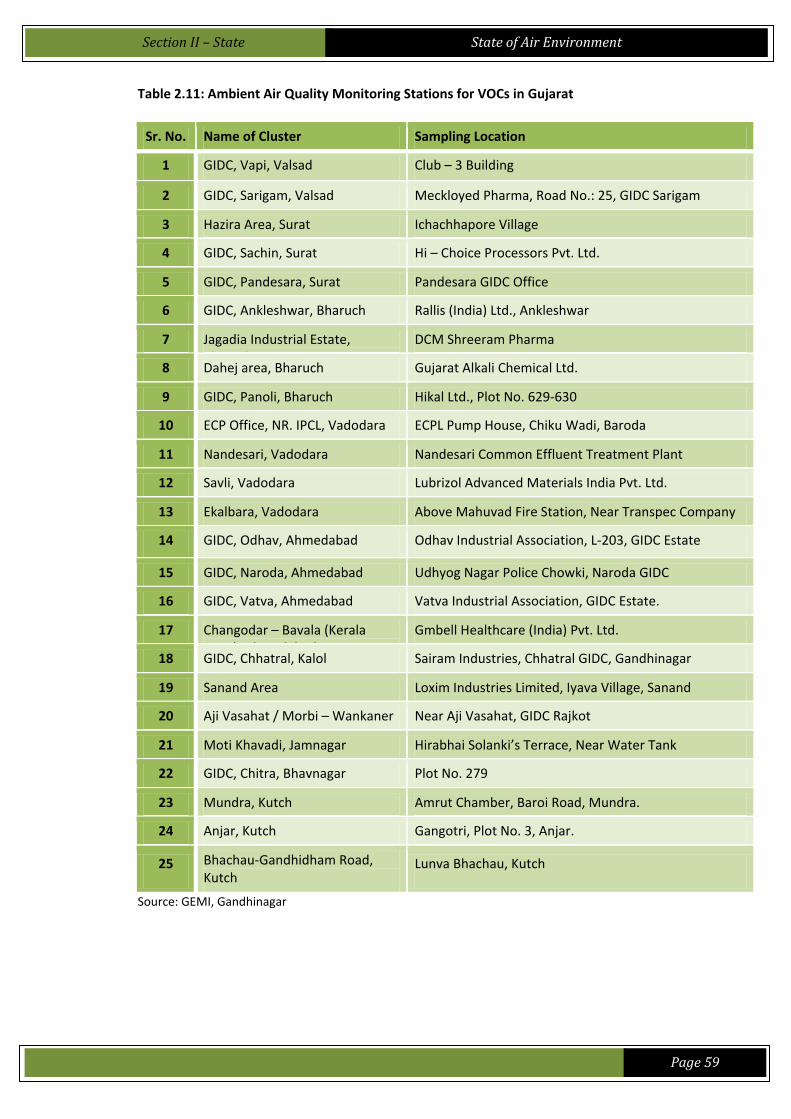
Section II – State
State of Air Environment
Page 59
Table 2.11: Ambient Air Quality Monitoring Stations for VOCs in Gujarat
Sr. No. Name of Cluster Sampling Location
1 GIDC, Vapi, Valsad Club – 3 Building
2 GIDC, Sarigam, Valsad Meckloyed Pharma, Road No.: 25, GIDC Sarigam
3 Hazira Area, Surat Ichachhapore Village
4 GIDC, Sachin, Surat Hi – Choice Processors Pvt. Ltd.
5 GIDC, Pandesara, Surat Pandesara GIDC Office
6 GIDC, Ankleshwar, Bharuch Rallis (India) Ltd., Ankleshwar
7 Jagadia Industrial Estate, Bharuch
DCM Shreeram Pharma
8 Dahej area, Bharuch Gujarat Alkali Chemical Ltd.
9 GIDC, Panoli, Bharuch Hikal Ltd., Plot No. 629-630
10 ECP Office, NR. IPCL, Vadodara ECPL Pump House, Chiku Wadi, Baroda
11 Nandesari, Vadodara Nandesari Common Effluent Treatment Plant
12 Savli, Vadodara Lubrizol Advanced Materials India Pvt. Ltd.
13 Ekalbara, Vadodara Above Mahuvad Fire Station, Near Transpec Company
14 GIDC, Odhav, Ahmedabad Odhav Industrial Association, L-203, GIDC Estate
15 GIDC, Naroda, Ahmedabad Udhyog Nagar Police Chowki, Naroda GIDC
16 GIDC, Vatva, Ahmedabad Vatva Industrial Association, GIDC Estate.
17 Changodar – Bavala (Kerala GIDC), Ahmedabad
Gmbell Healthcare (India) Pvt. Ltd.
18 GIDC, Chhatral, Kalol Sairam Industries, Chhatral GIDC, Gandhinagar
19 Sanand Area Loxim Industries Limited, Iyava Village, Sanand
20 Aji Vasahat / Morbi – Wankaner Near Aji Vasahat, GIDC Rajkot
21 Moti Khavadi, Jamnagar Hirabhai Solanki’s Terrace, Near Water Tank
22 GIDC, Chitra, Bhavnagar Plot No. 279
23 Mundra, Kutch Amrut Chamber, Baroi Road, Mundra.
24 Anjar, Kutch Gangotri, Plot No. 3, Anjar.
25 Bhachau-Gandhidham Road, Kutch
Lunva Bhachau, Kutch
Source: GEMI, Gandhinagar
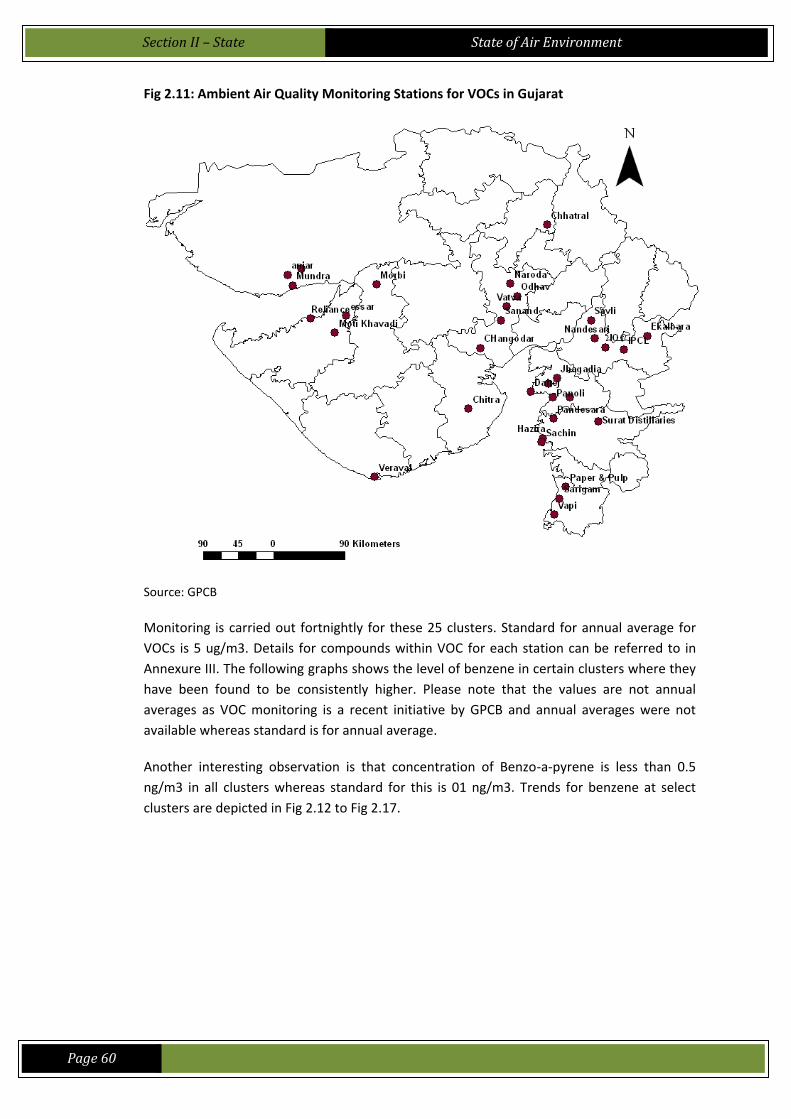
Section II – State
State of Air Environment
Page 60
Fig 2.11: Ambient Air Quality Monitoring Stations for VOCs in Gujarat
Source: GPCB
Monitoring is carried out fortnightly for these 25 clusters. Standard for annual average for
VOCs is 5 ug/m3. Details for compounds within VOC for each station can be referred to in
Annexure III. The following graphs shows the level of benzene in certain clusters where they
have been found to be consistently higher. Please note that the values are not annual
averages as VOC monitoring is a recent initiative by GPCB and annual averages were not
available whereas standard is for annual average.
Another interesting observation is that concentration of Benzo-a-pyrene is less than 0.5
ng/m3 in all clusters whereas standard for this is 01 ng/m3. Trends for benzene at select
clusters are depicted in Fig 2.12 to Fig 2.17.
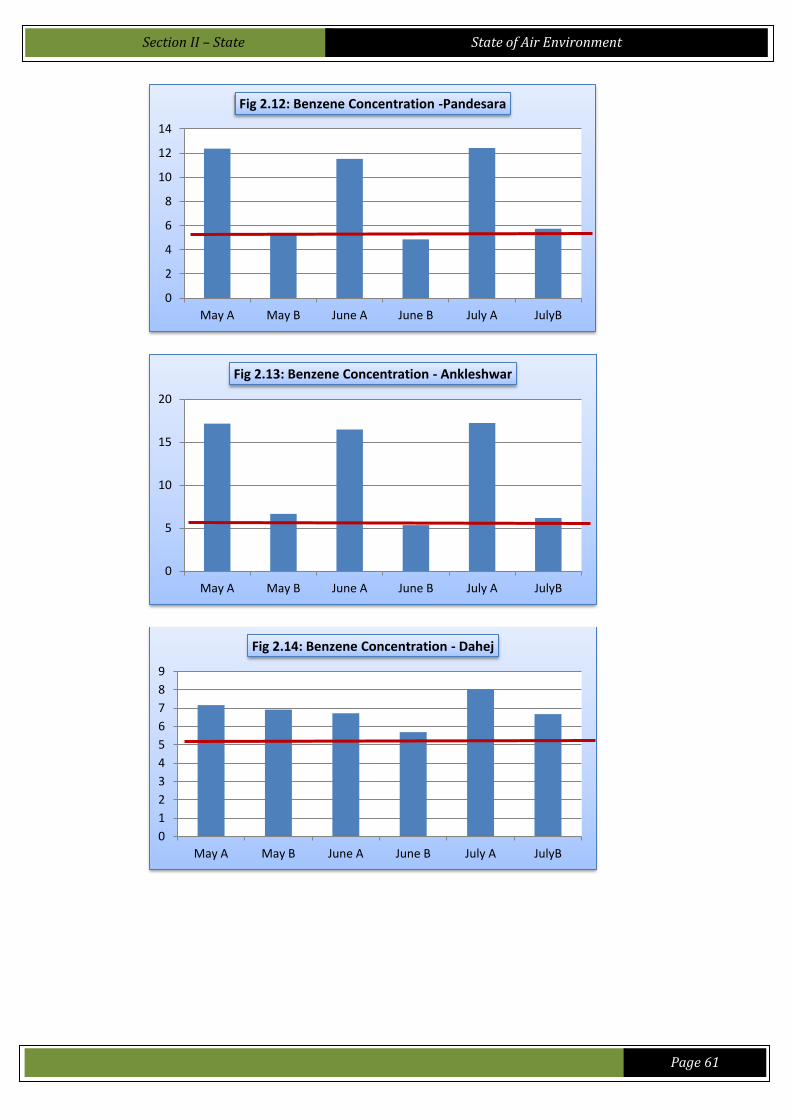
Section II – State
State of Air Environment
Page 61
0
2
4
6
8
10
12
14
May A May B June A June B July A JulyB
Fig 2.12: Benzene Concentration -Pandesara
0
5
10
15
20
May A May B June A June B July A JulyB
Fig 2.13: Benzene Concentration - Ankleshwar
0
1
2
3
4
5
6
7
8
9
May A May B June A June B July A JulyB
Fig 2.14: Benzene Concentration - Dahej
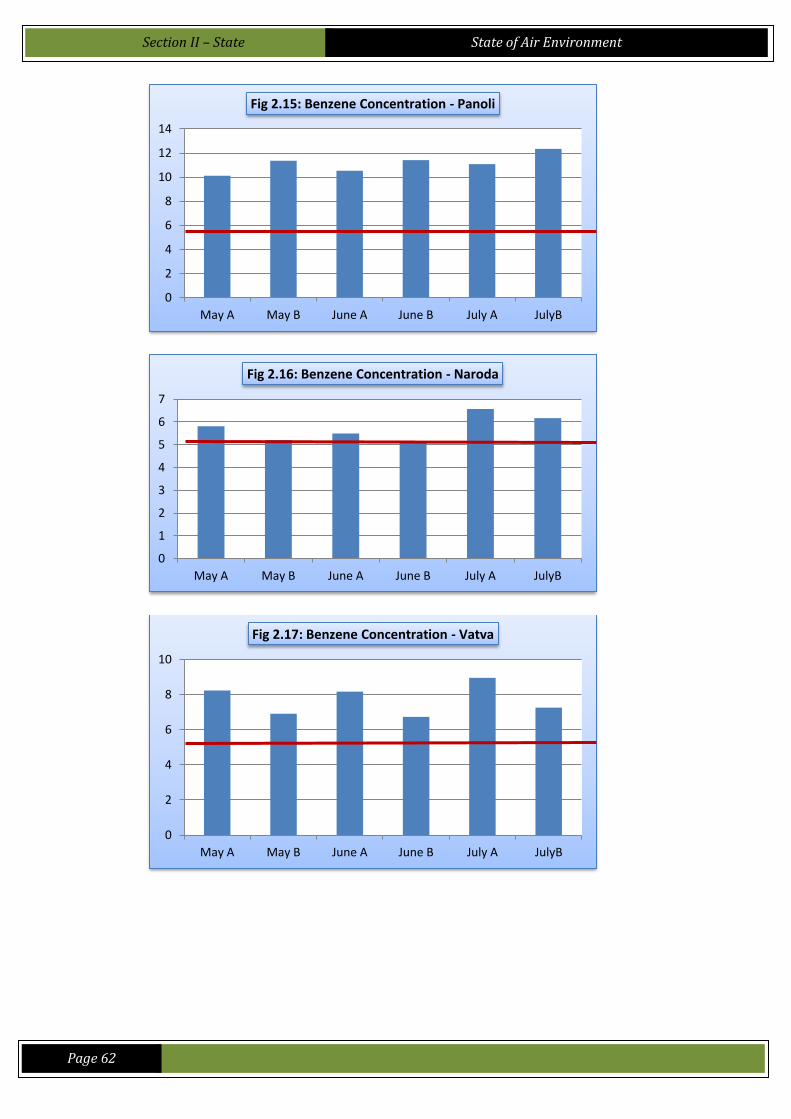
Section II – State
State of Air Environment
Page 62
0
2
4
6
8
10
12
14
May A May B June A June B July A JulyB
Fig 2.15: Benzene Concentration - Panoli
0
1
2
3
4
5
6
7
May A May B June A June B July A JulyB
Fig 2.16: Benzene Concentration - Naroda
0
2
4
6
8
10
May A May B June A June B July A JulyB
Fig 2.17: Benzene Concentration - Vatva
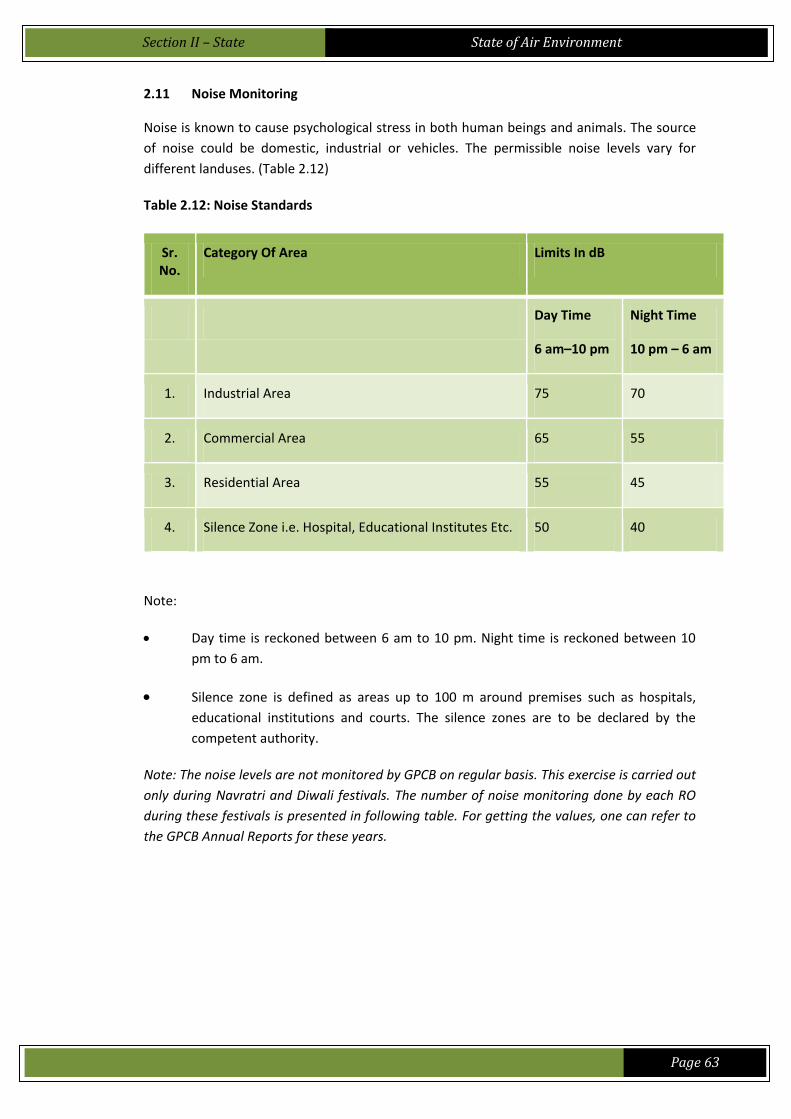
Section II – State
State of Air Environment
Page 63
2.11 Noise Monitoring
Noise is known to cause psychological stress in both human beings and animals. The source
of noise could be domestic, industrial or vehicles. The permissible noise levels vary for
different landuses. (Table 2.12)
Table 2.12: Noise Standards
Sr. No.
Category Of Area Limits In dB
Day Time
6 am–10 pm
Night Time
10 pm – 6 am
1. Industrial Area 75 70
2. Commercial Area 65 55
3. Residential Area 55 45
4. Silence Zone i.e. Hospital, Educational Institutes Etc. 50 40
Note:
Day time is reckoned between 6 am to 10 pm. Night time is reckoned between 10
pm to 6 am.
Silence zone is defined as areas up to 100 m around premises such as hospitals,
educational institutions and courts. The silence zones are to be declared by the
competent authority.
Note: The noise levels are not monitored by GPCB on regular basis. This exercise is carried out
only during Navratri and Diwali festivals. The number of noise monitoring done by each RO
during these festivals is presented in following table. For getting the values, one can refer to
the GPCB Annual Reports for these years.
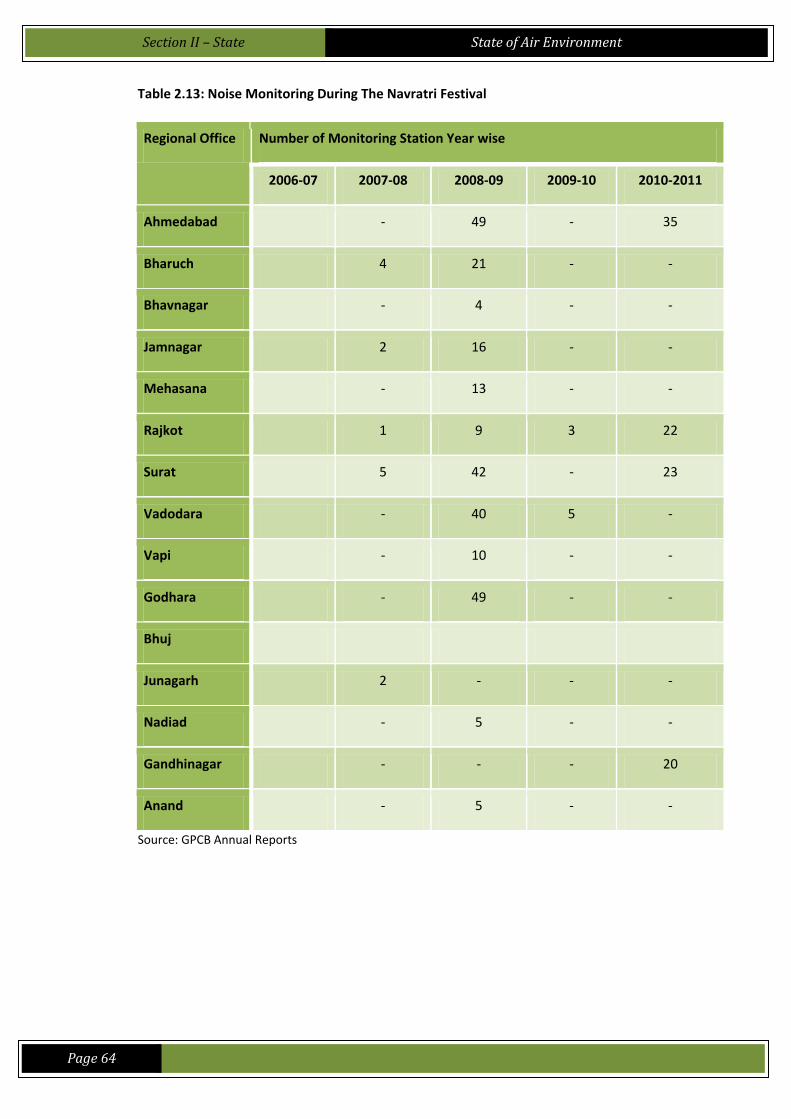
Section II – State
State of Air Environment
Page 64
Table 2.13: Noise Monitoring During The Navratri Festival
Regional Office Number of Monitoring Station Year wise
2006-07 2007-08 2008-09 2009-10 2010-2011
Ahmedabad - 49 - 35
Bharuch 4 21 - -
Bhavnagar - 4 - -
Jamnagar 2 16 - -
Mehasana - 13 - -
Rajkot 1 9 3 22
Surat 5 42 - 23
Vadodara - 40 5 -
Vapi - 10 - -
Godhara - 49 - -
Bhuj
Junagarh 2 - - -
Nadiad - 5 - -
Gandhinagar - - - 20
Anand - 5 - -
Source: GPCB Annual Reports
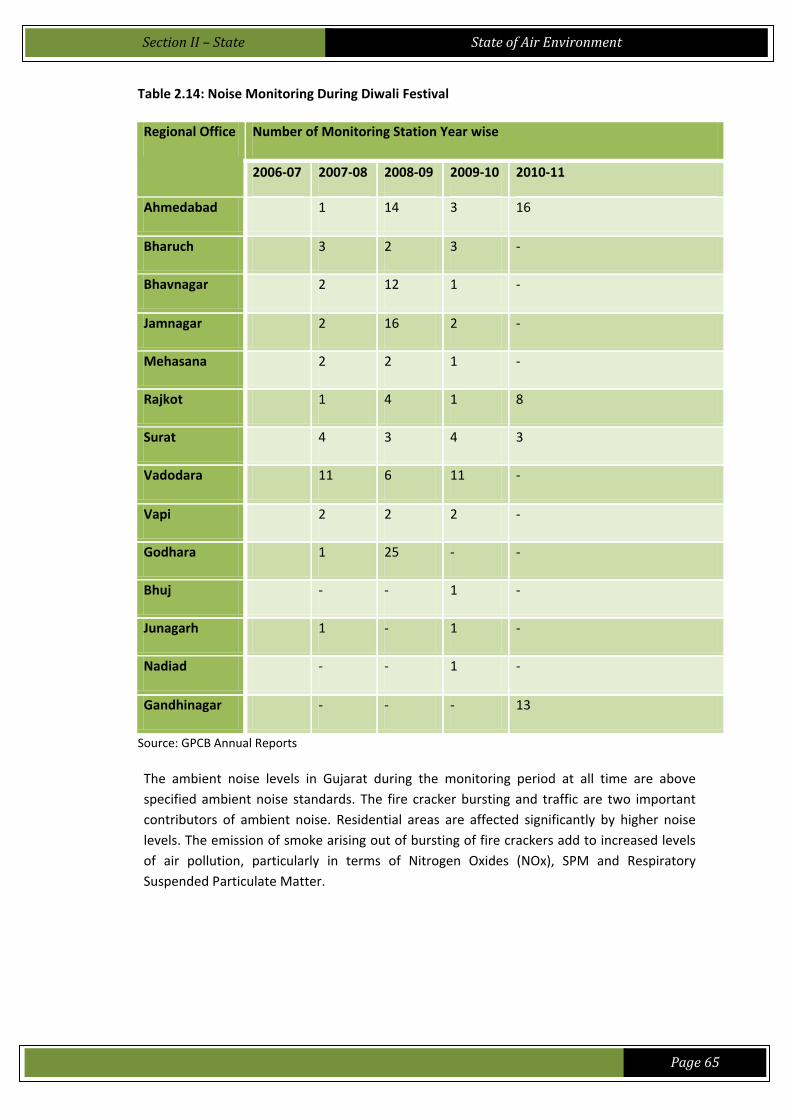
Section II – State
State of Air Environment
Page 65
Table 2.14: Noise Monitoring During Diwali Festival
Regional Office Number of Monitoring Station Year wise
2006-07 2007-08 2008-09 2009-10 2010-11
Ahmedabad 1 14 3 16
Bharuch 3 2 3 -
Bhavnagar 2 12 1 -
Jamnagar 2 16 2 -
Mehasana 2 2 1 -
Rajkot 1 4 1 8
Surat 4 3 4 3
Vadodara 11 6 11 -
Vapi 2 2 2 -
Godhara 1 25 - -
Bhuj - - 1 -
Junagarh 1 - 1 -
Nadiad - - 1 -
Gandhinagar - - - 13
Source: GPCB Annual Reports
The ambient noise levels in Gujarat during the monitoring period at all time are above
specified ambient noise standards. The fire cracker bursting and traffic are two important
contributors of ambient noise. Residential areas are affected significantly by higher noise
levels. The emission of smoke arising out of bursting of fire crackers add to increased levels
of air pollution, particularly in terms of Nitrogen Oxides (NOx), SPM and Respiratory
Suspended Particulate Matter.
Section II – State
State of Air Environment
Page 66
2.12 Odour Monitoring
Most commonly reported odour-producing compounds are hydrogen sulfide (rotten egg
odour) and ammonia (sharp pungent odour). Carbon disulfide, mercaptans, product of
decomposition of proteins (especially of animal origin) phenols and some petroleum
hydrocarbons are other common odorants. Most offensive odour is created by the
anaerobic decay of wet organic matter such as flesh, manure etc. For example, odour
originating from livestock manure is a result of a broad range of over 168 odour producing
compounds. Warm temperature enhances anaerobic decay and foul odour production.
Odour can arise from many sources and most of the sources are man-made. Garbage
dumping on vacant land is a common phenomenon. It leads to foul smell due to putrefaction
of dumped garbage, which lies uncollected for days together. Unscientific design of landfill &
improper sewage treatment practices produce unpleasant odour. Industries such as Pulp &
Paper, Fertilizer, Pesticides, Tanneries, Sugar & Distillery, Chemical, Dye & Dye
Intermediates, Bulk Drugs & Pharmaceuticals, Large Livestock operations, Poultry Farms,
Slaughter Houses, Food and Meat processing industries and Bone Mills are among major
contributors to odour pollution. Agricultural activities like decaying of vegetation,
production and application of compost etc. also contribute to odour pollution. In urban
areas, improper handling of public amenities like toilets of cinema hall, bus / railway
stations, hospitals, shopping complex etc. generate pungent odour, which affects the users
as well as neighbourhood residents. Congested markets do not allow the escape of odour
from markets, thus causing problems to shop-owners and customers. Vehicular sector also
has its share in odour pollution. Rapidly growing vehicular population as well as pollutants
emitted by them generate harmful and pungent odour.
Measurement of Odour Pollution
Of the five senses, the sense of smell is the most complex and unique in structure and
organization. Sense of smell is accomplished with two main nerves. The olfactometry nerve
(first cranial nerve) processes the perception of chemicals. The trigeminal nerve (fifth cranial
nerve) processes the irritation or pungency (sensation) of chemicals. All olfactory signals
meet in the olfactory bulb where the information is distributed to two different parts of the
brain. One major pathway of information is to the limbic system which processes emotion
and memory response of the body. The second major information pathway is to the frontal
cortex. This is where conscious sensations take place, as the information is processed with
other sensations and is compared with accumulated life experiences for the individual to
possibly recognize the odour and make some decisions about the experiences. The entire
trip, from nostril to signal in the brain, takes as little as 500 milliseconds.
In India, Schedule II and Schedule VI (General standards for discharge of effluents) under
Environmental (Protection) Rules, 1986 prescribe that all efforts shall be made to remove
unpleasant odour as far as practicable. Nonetheless, there are only two industries, wherein
industry specific standards under Schedule I of these Rules have made odour removal
compulsory. These are the fermentation industries and the natural rubber industries. The
standards for many other major odour pollution causing industries such as pulp and paper
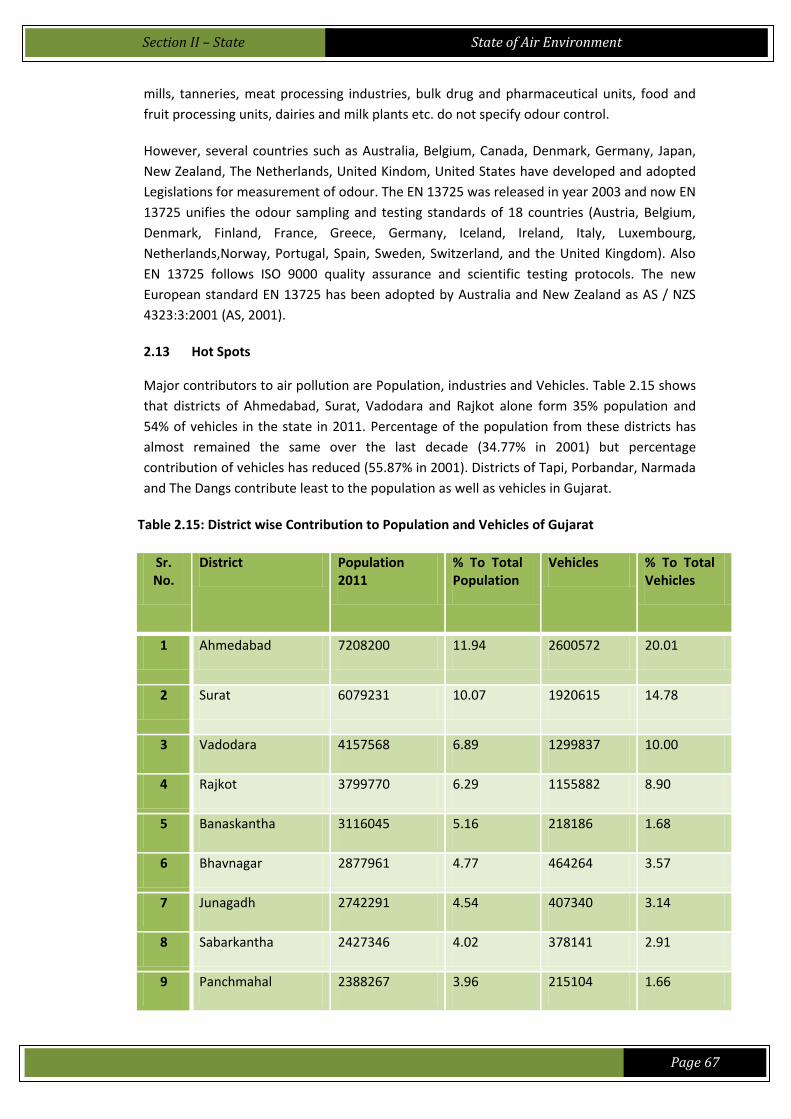
Section II – State
State of Air Environment
Page 67
mills, tanneries, meat processing industries, bulk drug and pharmaceutical units, food and
fruit processing units, dairies and milk plants etc. do not specify odour control.
However, several countries such as Australia, Belgium, Canada, Denmark, Germany, Japan,
New Zealand, The Netherlands, United Kindom, United States have developed and adopted
Legislations for measurement of odour. The EN 13725 was released in year 2003 and now EN
13725 unifies the odour sampling and testing standards of 18 countries (Austria, Belgium,
Denmark, Finland, France, Greece, Germany, Iceland, Ireland, Italy, Luxembourg,
Netherlands,Norway, Portugal, Spain, Sweden, Switzerland, and the United Kingdom). Also
EN 13725 follows ISO 9000 quality assurance and scientific testing protocols. The new
European standard EN 13725 has been adopted by Australia and New Zealand as AS / NZS
4323:3:2001 (AS, 2001).
2.13 Hot Spots
Major contributors to air pollution are Population, industries and Vehicles. Table 2.15 shows
that districts of Ahmedabad, Surat, Vadodara and Rajkot alone form 35% population and
54% of vehicles in the state in 2011. Percentage of the population from these districts has
almost remained the same over the last decade (34.77% in 2001) but percentage
contribution of vehicles has reduced (55.87% in 2001). Districts of Tapi, Porbandar, Narmada
and The Dangs contribute least to the population as well as vehicles in Gujarat.
Table 2.15: District wise Contribution to Population and Vehicles of Gujarat
Sr. No.
District Population 2011
% To Total Population
Vehicles % To Total Vehicles
1 Ahmedabad 7208200 11.94 2600572 20.01
2 Surat 6079231 10.07 1920615 14.78
3 Vadodara 4157568 6.89 1299837 10.00
4 Rajkot 3799770 6.29 1155882 8.90
5 Banaskantha 3116045 5.16 218186 1.68
6 Bhavnagar 2877961 4.77 464264 3.57
7 Junagadh 2742291 4.54 407340 3.14
8 Sabarkantha 2427346 4.02 378141 2.91
9 Panchmahal 2388267 3.96 215104 1.66
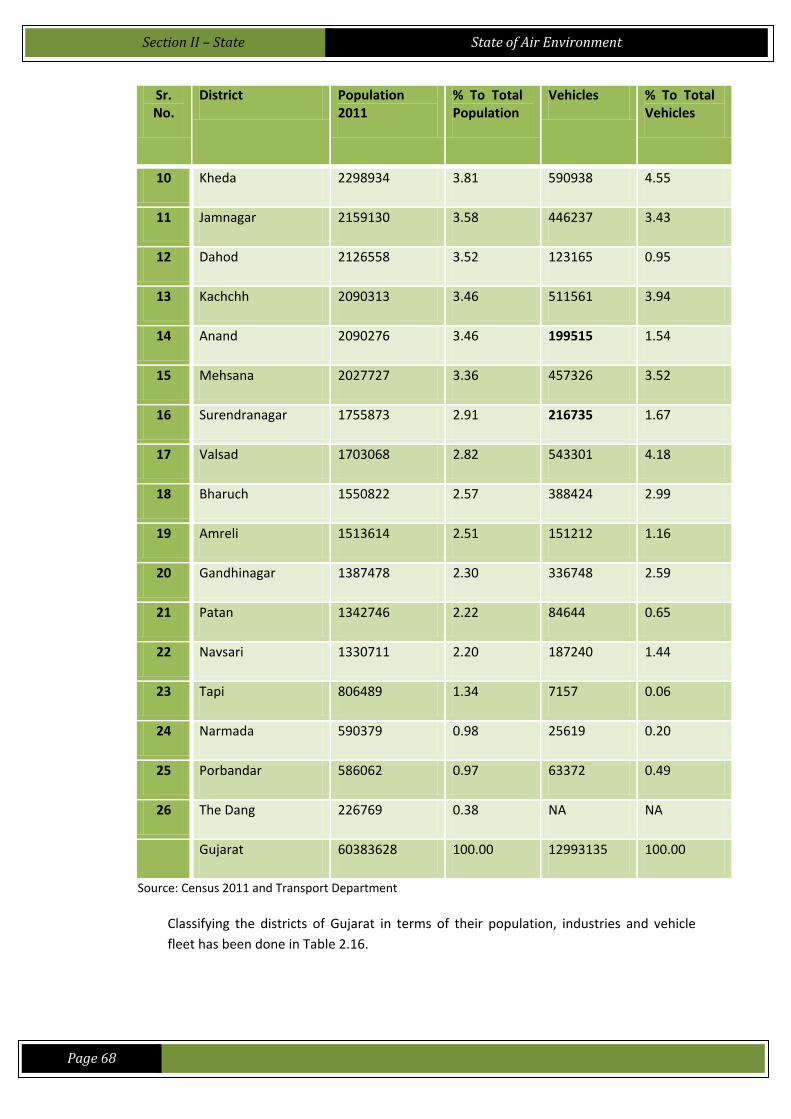
Section II – State
State of Air Environment
Page 68
Sr. No.
District Population 2011
% To Total Population
Vehicles % To Total Vehicles
10 Kheda 2298934 3.81 590938 4.55
11 Jamnagar 2159130 3.58 446237 3.43
12 Dahod 2126558 3.52 123165 0.95
13 Kachchh 2090313 3.46 511561 3.94
14 Anand 2090276 3.46 199515 1.54
15 Mehsana 2027727 3.36 457326 3.52
16 Surendranagar 1755873 2.91 216735 1.67
17 Valsad 1703068 2.82 543301 4.18
18 Bharuch 1550822 2.57 388424 2.99
19 Amreli 1513614 2.51 151212 1.16
20 Gandhinagar 1387478 2.30 336748 2.59
21 Patan 1342746 2.22 84644 0.65
22 Navsari 1330711 2.20 187240 1.44
23 Tapi 806489 1.34 7157 0.06
24 Narmada 590379 0.98 25619 0.20
25 Porbandar 586062 0.97 63372 0.49
26 The Dang 226769 0.38 NA NA
Gujarat 60383628 100.00 12993135 100.00
Source: Census 2011 and Transport Department
Classifying the districts of Gujarat in terms of their population, industries and vehicle
fleet has been done in Table 2.16.

Section II – State
State of Air Environment
Page 69
Table 2.16: Ranking of Districts
Sr. No.
Dis
tric
t
Po
pu
lati
on
Po
pu
lati
on
Ran
k
Air
Po
lluti
ng
Ind
ust
ries
Air
Po
lluti
ng
Ind
ust
ries
Ran
k
Ve
hic
le P
op
ula
tio
n
Ve
hic
le P
op
ula
tio
n
Ran
k
Po
pu
lati
on
Den
sity
Po
pu
lati
on
Den
sity
Ran
k
De
cad
al G
row
th
De
cad
al G
row
th R
ank
Urb
an P
op
ula
tio
n %
Urb
an P
op
ula
tio
n
Ran
k
Ru
ral P
op
ula
tio
n %
Ru
ral P
op
ula
tio
n R
ank
1
Ah
med
abad
72
08
20
0
1
20
41
2
26
00
57
2
1
89
0
2
22
.31
5
84
.05
1
15
.95
26
2
Sura
t
60
79
23
1
2
12
02
6
19
20
61
5
2
13
76
1
42
.19
1
79
.68
2
20
.32
25
3
Vad
od
ara
41
57
56
8
3
12
40
5
12
99
83
7
3
55
1
8
14
.16
14
49
.54
4
50
.46
23
4
Raj
kot
37
99
77
0
4
20
48
1
11
55
88
2
4
33
9
12
19
.87
8
58
.12
3
41
.88
24
5
Ban
aska
nth
a
31
16
04
5
5
25
9
20
21
81
86
15
29
0
15
24
.43
4
13
.27
22
86
.73
5
6
Bh
avn
agar
28
77
96
1
6
70
5
9
46
42
64
8
28
8
16
16
.53
11
41
.01
8
58
.99
19
7
Jun
agad
h
27
42
29
1
7
48
9
13
40
73
40
11
31
0
14
12
.01
22
33
.05
12
66
.95
15
8
Sab
arka
nth
a
24
27
34
6
8
37
9
15
37
81
41
13
32
8
13
16
.56
10
14
.96
20
85
.04
7
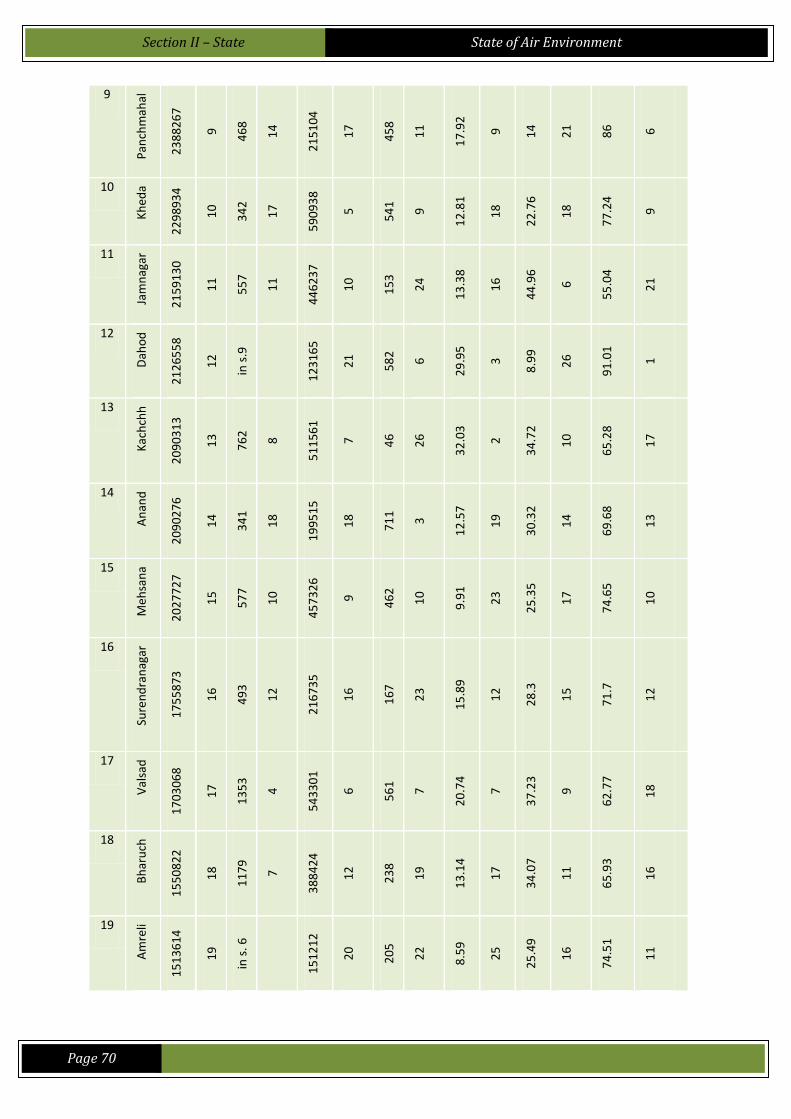
Section II – State
State of Air Environment
Page 70
9
Pan
chm
ahal
23
88
26
7
9
46
8
14
21
51
04
17
45
8
11
17
.92
9
14
21
86
6
10
Kh
eda
22
98
93
4
10
34
2
17
59
09
38
5
54
1
9
12
.81
18
22
.76
18
77
.24
9
11
Jam
nag
ar
21
59
13
0
11
55
7
11
44
62
37
10
15
3
24
13
.38
16
44
.96
6
55
.04
21
12
Dah
od
21
26
55
8
12
in s
.9
12
31
65
21
58
2
6
29
.95
3
8.9
9
26
91
.01
1
13
Kac
hch
h
20
90
31
3
13
76
2
8
51
15
61
7
46
26
32
.03
2
34
.72
10
65
.28
17
14
An
and
20
90
27
6
14
34
1
18
19
95
15
18
71
1
3
12
.57
19
30
.32
14
69
.68
13
15
Meh
san
a
20
27
72
7
15
57
7
10
45
73
26
9
46
2
10
9.9
1
23
25
.35
17
74
.65
10
16
Sure
nd
ran
agar
17
55
87
3
16
49
3
12
21
67
35
16
16
7
23
15
.89
12
28
.3
15
71
.7
12
17
Val
sad
17
03
06
8
17
13
53
4
54
33
01
6
56
1
7
20
.74
7
37
.23
9
62
.77
18
18
Bh
aru
ch
15
50
82
2
18
11
79
7
38
84
24
12
23
8
19
13
.14
17
34
.07
11
65
.93
16
19
Am
reli
15
13
61
4
19
in s
. 6
15
12
12
20
20
5
22
8.5
9
25
25
.49
16
74
.51
11

Section II – State
State of Air Environment
Page 71
20
Gan
dh
inag
ar
13
87
47
8
20
14
05
3
33
67
48
14
66
0
4
12
.15
20
43
.21
7
56
.79
20
21
Pat
an
13
42
74
6
21
in s
. 5
84
64
4
22
23
4
20
13
.53
15
20
.93
19
79
.07
8
22
Nav
sari
13
30
71
1
22
35
7
16
18
72
40
19
60
2
5
8.2
4
26
30
.74
13
69
.26
14
23
Tap
i
80
64
89
23
ins.
22
71
57
25
24
9
18
12
.07
21
9.7
9
25
90
.21
2
24
Nar
mad
a
59
03
79
24
in s
. 18
25
61
9
24
21
4
21
14
.77
13
10
.44
24
89
.56
3
25
Po
rban
dar
58
60
62
25
31
2
19
63
37
2
23
25
5
17
9.1
7
24
48
.77
5
51
.23
22
26
The
Dan
g
22
67
69
26
in s
. 17
NA
NA
12
9
25
21
.44
6
10
.89
23
89
.11
4
Gu
jara
t
60
38
36
28
16
50
9
12
99
31
35
30
8
19
.17
42
.58
57
.42
*Note: Gandinagar includes Gandhinagar district with Ahmedabad Rural districts,
Banaskantha includes Patan district, Panchmahal includes Dahod District, Navsari includes
Tapi District, Valsad includes The Dangs district, Bhavnagar includes Amreli district. Jetpur
RO is falls under Rajkot district and Ankleshwar under Bharuch district.
Section II – State
State of Air Environment
Page 72
Rate of urbanisation and industrialization leading to growth of vehicles make cities
Ahmedabad, Surat, Vadodara and Rajkot the hot spots for air pollution. The density of
population and vehicles is also highest in these urban centres. Surat leads followed by
Ahmedabad, Anand and Gandhinagar districts respectively for density of population. The
districts have grown differently in last decade with highest growth in Surat followed by
Kachchh, Dahod, Banaskantha and Ahmedabad. The Dangs district which has 89 % rural
population follows Ahmedabad with 84% urban population in decadal growth. According to
the pressure due to air polluting industries, Rajkot has maximum API followed by
Ahmedabad, Gandhinagar, Valsad, Vadodara and Surat.
If we look into the industrial clusters, the values of SO2, NOx, SPM and RSPM do not cross
the critical levels in general. However, if we consider benzene, then industrial areas of
Naroda, Vatva, Pandesara, Ankleshwar, Panoli and Dahej exhibit continuously higher values.
Section III - Impact

Section III – Impact
State of Air Environment
Page 73
SECTION III - IMPACT
The United Nations Environment Programme has estimated that globally 1.1 billion
people breathe unhealthy air (UNEP, 2002). Epidemiological studies have shown that
concentrations of ambient air particles are associated with a wide range of effects on
human health, especially on the cardio-respiratory system. Beyond its human health
impacts, air pollution is also detrimental to ecosystems. Through direct exposure and
accumulation, reactive compounds negatively impact plant growth and are primary
contributors to acid rain, which can diminish fish stocks, decrease biological diversity in
sensitive ecosystems, degrade forests and soils, and diminish agricultural productivity. Air
pollution is also known to have damaging effect on non living materials in the form of
corrosion of metal, soiling and eroding of building surfaces etc. People with low immune
systems, those suffering from other diseases, children, the aged, and people with lung
diseases are the people who suffer more. There is no dependable database to track these
disease and death rates so it is difficult to produce scientific evidence.
3.1 Economic Impacts
Improvement of air quality is associated with reduction in the number of premature
deaths, episodes of acute illness such as asthma attacks and the number of chronic
respiratory illness cases. Economic value of an illness episode is quantified as:
The value of work time lost due to the illness by the patient or the caregiver, or
both
The medical cost of treatment
The amount paid to avoid the pain and suffering associated with the illness, and
The value of leisure time lost due to the illness by the patient or caregiver.
Not many studies have been conducted to estimate the economic loss due to
effect of air pollution on materials. Depreciation in property value occurs near
odour causing operations/ industries and odorous environment.
3.2 Health Impacts
Several epidemiological studies have established a direct relationship between the
pollutants and health hazards ranging from morbidity (illness) to mortality (death from
illness).The health impacts of various air pollutants are summarized in Table 3.1.
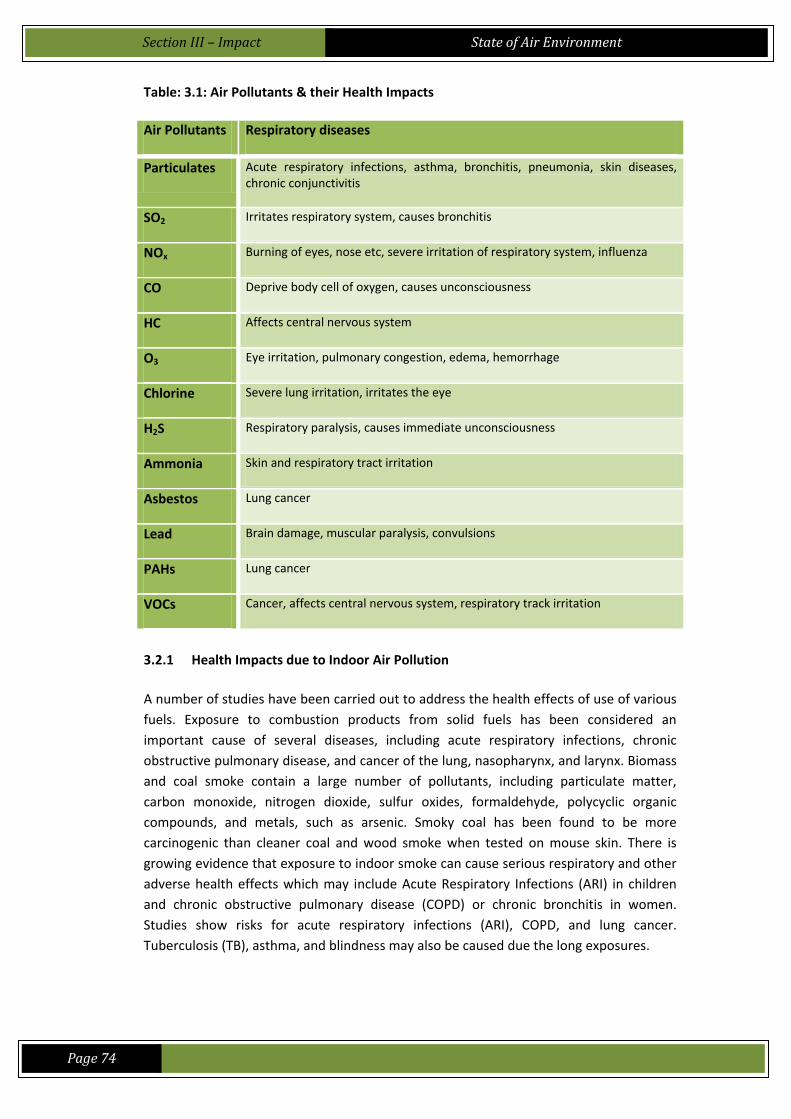
Section III – Impact
State of Air Environment
Page 74
Table: 3.1: Air Pollutants & their Health Impacts
Air Pollutants Respiratory diseases
Particulates Acute respiratory infections, asthma, bronchitis, pneumonia, skin diseases, chronic conjunctivitis
SO2 Irritates respiratory system, causes bronchitis
NOx Burning of eyes, nose etc, severe irritation of respiratory system, influenza
CO Deprive body cell of oxygen, causes unconsciousness
HC Affects central nervous system
O3 Eye irritation, pulmonary congestion, edema, hemorrhage
Chlorine Severe lung irritation, irritates the eye
H2S Respiratory paralysis, causes immediate unconsciousness
Ammonia Skin and respiratory tract irritation
Asbestos Lung cancer
Lead Brain damage, muscular paralysis, convulsions
PAHs Lung cancer
VOCs Cancer, affects central nervous system, respiratory track irritation
3.2.1 Health Impacts due to Indoor Air Pollution
A number of studies have been carried out to address the health effects of use of various
fuels. Exposure to combustion products from solid fuels has been considered an
important cause of several diseases, including acute respiratory infections, chronic
obstructive pulmonary disease, and cancer of the lung, nasopharynx, and larynx. Biomass
and coal smoke contain a large number of pollutants, including particulate matter,
carbon monoxide, nitrogen dioxide, sulfur oxides, formaldehyde, polycyclic organic
compounds, and metals, such as arsenic. Smoky coal has been found to be more
carcinogenic than cleaner coal and wood smoke when tested on mouse skin. There is
growing evidence that exposure to indoor smoke can cause serious respiratory and other
adverse health effects which may include Acute Respiratory Infections (ARI) in children
and chronic obstructive pulmonary disease (COPD) or chronic bronchitis in women.
Studies show risks for acute respiratory infections (ARI), COPD, and lung cancer.
Tuberculosis (TB), asthma, and blindness may also be caused due the long exposures.
Section III – Impact
State of Air Environment
Page 75
Box 3.1: WHO Study on Indoor Air Pollution
3.2.2 Health Impacts due to Mining
The generation of fugitive dust during mining activities is a serious concern. It not only
causes direct impact on the health of the workers and community, but also affects the
land productivity and general well being of a region. The incidence of respiratory and
ophthalmic illness is far more acute in mining workers, whose workplaces are choked
with dust. In addition to pneumoconiosis and bronchitis, coal miners also experiences
various other diseases such as black lung diseases like sever dyspnea (shortness of
breath) and air ways obstruction. Tuberculosis, blood dysentery and seasonal fevers are
quite common. The common ailments associated with mining sector include
Respiratory diseases: Pneumoconiosis including silicosis and asbestosis
bronchitis, asthma, tuberculosis
Eye ailments: cataract, conjunctivitis, corneal ulcers, glaucoma and squint
trachoma
3.2.3 Health Impacts due to Noise Pollution
Often neglected, noise induces a severe impact on humans and on living organisms.
Some of the adverse effects are summarised below.
Annoyance It creates annoyance to the receptors due to sound level fluctuations.
Physiological effects The physiological features like breathing amplitude, blood pressure,
heart-beat rate, pulse rate, blood cholesterol are effected.
Loss of hearing Long exposure to high sound levels cause loss of hearing. This is mostly
unnoticed, but has an adverse impact on hearing function.
Human performance The working performance of workers/human will be affected as they'll
be losing their concentration.
Nervous system It causes pain, ringing in the ears, feeling of tiredness, thereby
affecting the functioning of human system.
Sleeplessness It affects the sleeping thereby inducing the people to become restless
and suffer from lose of concentration.
According to World Health Organization, Household Air Pollution from Solid Fuels ranks
1st and Pollution from other sources ranks 6th in the top 10 risk factors for diseases in
2010 in Asia (mainly India). Indoor Air Pollution was claiming 5,00,000 lives in India every
year, most of whom were women and children. India accounted for 80% of the 6,00,000
premature deaths that occur in south east Asia annually due to exposure to Indoor Air
Pollution. Nearly 70% of rural households don’t even have ventilation. WHO has
estimated that pollution levels in rural Indian kitchens are 30 times higher than
recommended levels and 6 times higher than air pollution level.
Section III – Impact
State of Air Environment
Page 76
3.2.4 Health Impacts due to Heat Islands
Hot weather places additional stress on the body, raising health risks for the vulnerable
and increasing discomfort for everyone. During extreme weather events such as heat
waves, the urban heat island has the potential to prevent the city from cooling down,
maintaining night time temperatures at a level that affects human health and comfort.
The consequences for the health can be severe with increased chances of heat stroke,
physiological disruption, organ damage, and even death.
3.2.5 Health Impacts due to Odour
Odour affects human beings in a number of ways. Strong, unpleasant or offensive smells
can interfere with a person’s enjoyment of life especially if they are frequent and / or
persistent. Though foul odour may not cause direct damage to health, toxic stimulants of
odour may cause ill health or respiratory symptoms. Secondary effects may be nausea,
insomnia and discomfort. Very strong odour can result in nasal irritation, trigger
symptoms in individuals with breathing problems or asthma.
3.3 Other Impacts
Mining also has impact on climate change due to release of methane gas from the
coal seams. On an average, Indian open cast coal mine release 1 m3 of methane per
ton of coal, whereas in underground mine, methane release varies from 1 to 23
m3/ton of coal produced.
The buildings and materials may get damaged by exposure to infrasonic / ultrasonic
waves and even get collapsed.
Evapo-transpiration rates will also be enhanced by high urban temperatures and
plants & trees will potentially extract water from the soil at greater rates than
normal.
Plant growth is inhibited due to reduction in photosynthesis as the layers of
particulates deposit on the leaves.
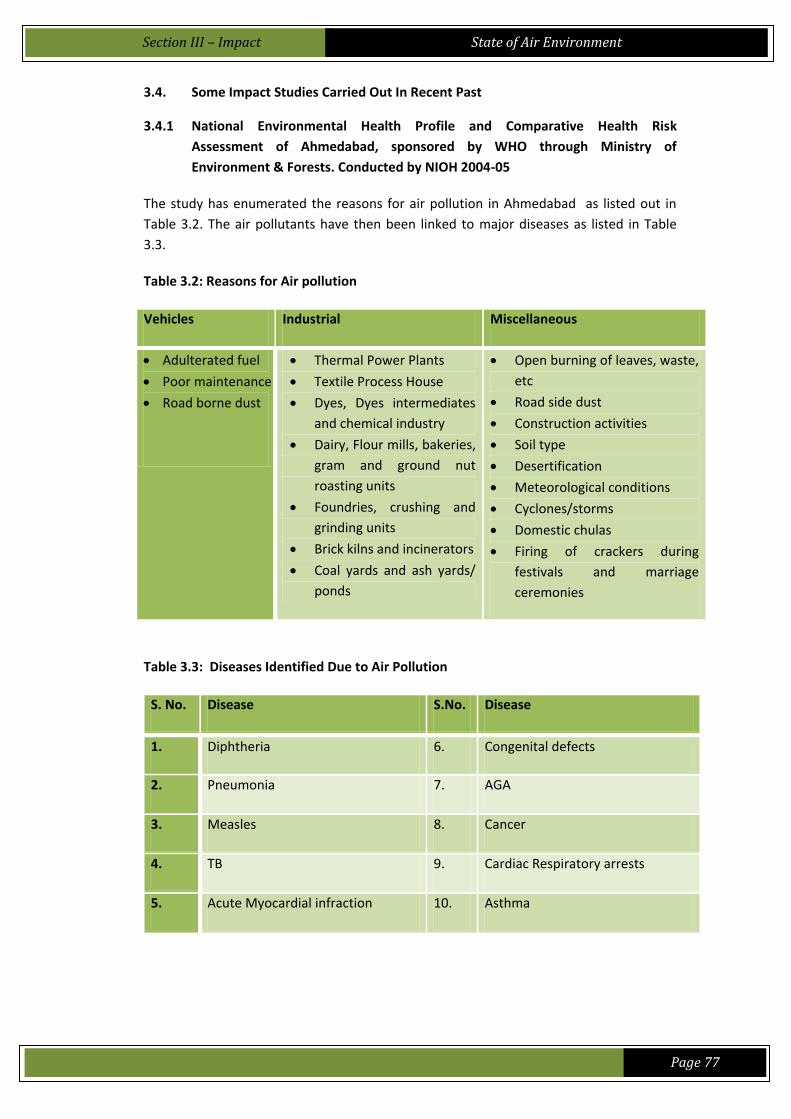
Section III – Impact
State of Air Environment
Page 77
3.4. Some Impact Studies Carried Out In Recent Past
3.4.1 National Environmental Health Profile and Comparative Health Risk
Assessment of Ahmedabad, sponsored by WHO through Ministry of
Environment & Forests. Conducted by NIOH 2004-05
The study has enumerated the reasons for air pollution in Ahmedabad as listed out in
Table 3.2. The air pollutants have then been linked to major diseases as listed in Table
3.3.
Table 3.2: Reasons for Air pollution
Vehicles Industrial Miscellaneous
Adulterated fuel
Poor maintenance
Road borne dust
Thermal Power Plants
Textile Process House
Dyes, Dyes intermediates
and chemical industry
Dairy, Flour mills, bakeries,
gram and ground nut
roasting units
Foundries, crushing and
grinding units
Brick kilns and incinerators
Coal yards and ash yards/
ponds
Open burning of leaves, waste,
etc
Road side dust
Construction activities
Soil type
Desertification
Meteorological conditions
Cyclones/storms
Domestic chulas
Firing of crackers during
festivals and marriage
ceremonies
Table 3.3: Diseases Identified Due to Air Pollution
S. No. Disease S.No. Disease
1. Diphtheria 6. Congenital defects
2. Pneumonia 7. AGA
3. Measles 8. Cancer
4. TB 9. Cardiac Respiratory arrests
5. Acute Myocardial infraction 10. Asthma

Section III – Impact
State of Air Environment
Page 78
3.4.2 Survey of Traffic Policemen conducted by Traffic Department in January 2012
The survey was conducted to find pulmonary problems like Chronic Obstructive
Pulmonary Diseases (COPD), asthma, pulmonary fibrosis and cystic fibrosis in traffic
policemen.
Lung Function tests conducted on the traffic police men confirmed that 45 % of the
policemen tested were suffering from breathing and other respiratory problems. Some of
them have been found to have definite abnormalities.
3.4.3 Health Impacts of Air Pollution in Ahmedabad
A medical study was conducted by National Institute of Occupational Health (NIOH) in
2003 in three different areas of Ahmedabad, viz. Residential area (L.D.Engg. College),
Commercial area (Nehru Bridge), Industrial area (Naroda). Distribution of percentage
morbidity is as follows:
(Total families covered: 679 – Residential: 200, Commercial: 242, Industrial: 237)
Morbidity Industrial area Commercial area Residential area
No. % No. % No. % Chronic Cough 37 3.7 16 1.6 15 2.0
Breathlessness while walking
53 5.5 50 4.6 27 3.3
Wheezing 36 3.7 9 0.8 19 2.3
Hemoptysis 6 0.6 4 0.4 4 0.5
Asthma 23 2.4 8 0.7 14 0.5
T. B. 6 0.6 5 0.5 2 0.2
Nausea 56 5.8 11 1.0 11 1.4
Eye Irritation 234 24.3 32 3.5 49 6.7
Cataract 32 3.5 64 5.9 17 2.1
Observations of NIOH
The study showed that symptoms like cough, breathlessness while walking,
haemoptysis have been more in industrial area. Asthma, Tuberculosis and chronic
bronchitis were also higher in industrial area. Wheezing has been significantly
higher in industrial area.
The medical data from the different hospitals from Ahmedabad were also collected;
however correct database regarding disease pattern due to air pollution was not
available. Amongst air borne disease pattern, maximum cases of T.B. were reported
in 1997 to 2003. While cases of Pneumonia, Diphtheria and Measles were
comparatively less reported. High RSPM levels probably enhance chest disease
pattern.

Section III – Impact
State of Air Environment
Page 79
3.4.4 Disease Pattern Related to Air Pollution
The following table presents the number of reported cases of diseases in Gujarat which
can be linked to air pollution. Though we do not have any study which directly links these
cases to air pollution; this is an indicative pattern. The numbers of cases reported for
Cardio Vascular Diseases, Cancer and Pulmonary Pneumonia have substantially increased
in the last five years. Though the number of cases reported in whooping cough is very
nominal the trend of increased patients in last five years is observed. Numbers of cases
reported in lung diseases have also doubled.
Table 3.4: Disease Pattern Related to Air Pollution in Gujarat
S. No.
Disease 2006-07 2007-08 2008-09 2009-10 2010-11
1. No. of Sputum examined under National Tuberculosis Control Programme
348473 357333 388774 409815 438613 2. Cardio Vascular
Diseases - 23098 55449 63465 68980
3. Lungs disease - 55896 81303 82107 96373
4. Cancer - 488 228 11459* 32034
5. Whooping Cough 25 0 5 84 -
6. Acute respiratory infection Including Influenza and excluding Pneumonia
609501 557035 571034 604468 -
7. Pneumonia 5883 8092 6265 4573 -
8. Pulmonary Tuberculosis
30988 20759 33778 394119 -
Source: Health Report 2010-2011 *including Cancer Hospital Ahmedabad
Box 3.2: Effect of Air Pollution on Human Health (adults) in Delhi
In order to determine health effects of air pollution, CPCB initiated an Epidemiological Study
in Delhi with the help of Chittaranjan National Cancer Institute, Kolkata. The study was
carried out during November 2002 and August 2005 in various parts of Delhi and in different
seasons and the report was published in 2008. The study findings had shown that 33.2%
residents of Delhi had one or more respiratory symptoms as compared to 19.6% of control
subjects. Lung function was reduced in 40.3% individuals of Delhi compared with 20.1% in
control group. Lung function reduction was more prevalent in women than in men both in
rural and urban settings. People from lower SES had greater prevalence of lung function
deficits. Besides gender, smoking habit, Body mass index and Socio economic status,
particulate air pollution was positively associated with lung function deficits. hronic
obstructive pulmonary disease (COPD) was detected in 3.9% residents of Delhi against 0.8%
of controls.

Section IV - Response

Section IV – Response
State of Air Environment
Page 80
SECTION IV - RESPONSE
Efforts have been made by various stakeholders to abate air pollution from different sources. These efforts are being made by national & state agencies and individuals to adopt strategies that can reduce the impacts due to air pollution. Government of India had enacted the Air (Prevention and Control of Pollution) Act 1981 to arrest the deterioration in the air quality. The efforts by various stakeholders can be categorized into three main categories:
1. At National Level
2. At State Level
3. At Individual Level
A set of initiatives have been taken under all the three categories. These are discussed in
detail in the following paragraphs.
4.1 At National Level
The Central Government enjoys the powers to make Acts, Rules, Regulations, Norms and
Standards for the purpose of protecting the environment. The State Government agencies
are mainly enforcing agencies. The State agencies normally adopt these standards or make
them stringent where they would like to prevent the air pollution and improve upon the air
quality.
4.1.1 Ambient Air Quality Norms
Standards are a pre-requisite for effective management of ambient air quality. The
objectives of air quality standards are:
• To indicate the levels of air quality necessary with an adequate margin of safety to
protect the public health, vegetation and property
• To assist in establishing priorities for abatement and control of pollutant level
• To provide uniform yardstick for assessing air quality at national level
• To indicate the need and extent of monitoring programme
The Central Pollution Control Board introduced Ambient Air Quality Standards on November
11, 1982 as per section 16 (2) (h) of the Air (Prevention and Control of Pollution) Act, 1981.
The air quality standards have been revised by the Central Pollution Control Board on April
11, 1994. These have been further made stringent by notification dated 18th Nov 2009.
These standards are presented in following tables.
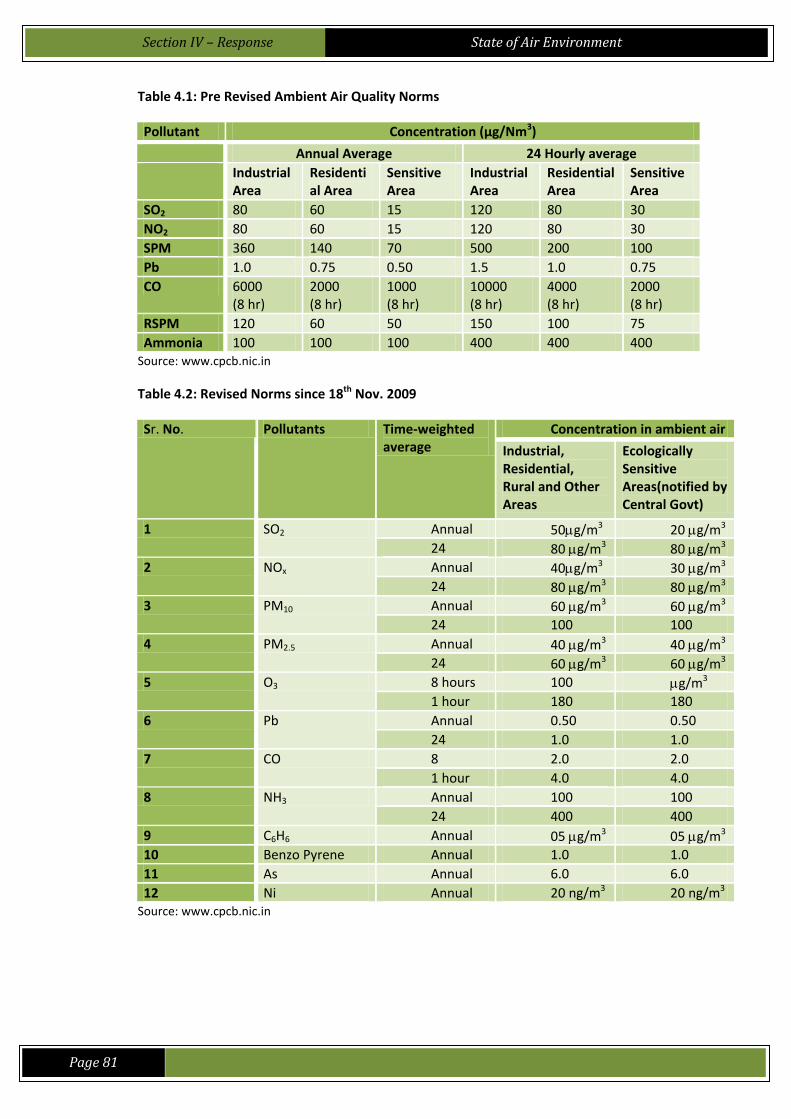
Section IV – Response
State of Air Environment
Page 81
Table 4.1: Pre Revised Ambient Air Quality Norms
Pollutant Concentration (μg/Nm3)
Annual Average 24 Hourly average
Industrial Area
Residential Area
Sensitive Area
Industrial Area
Residential Area
Sensitive Area
SO2 80 60 15 120 80 30
NO2 80 60 15 120 80 30
SPM 360 140 70 500 200 100
Pb 1.0 0.75 0.50 1.5 1.0 0.75
CO 6000 (8 hr)
2000 (8 hr)
1000 (8 hr)
10000 (8 hr)
4000 (8 hr)
2000 (8 hr)
RSPM 120 60 50 150 100 75
Ammonia 100 100 100 400 400 400 Source: www.cpcb.nic.in
Table 4.2: Revised Norms since 18th Nov. 2009
Sr. No. Pollutants Time-weighted average
Concentration in ambient air
Industrial, Residential, Rural and Other Areas
Ecologically Sensitive Areas(notified by Central Govt)
1 SO2 Annual Average*
50g/m3 20 g/m3
24 hours**
80 g/m3 80 g/m3
2 NOx Annual Average*
40g/m3 30 g/m3
24 hours**
80 g/m3 80 g/m3
3 PM10 Annual Average*
60 g/m3 60 g/m3
24 hours**
100
g/m3
100
g/m3 4 PM2.5 Annual Average*
40 g/m3 40 g/m3
24 hours**
60 g/m3 60 g/m3
5 O3 8 hours 100
g/m3 g/m3
1 hour 180
g/m3
180
g/m3 6 Pb Annual Average*
0.50
g/m3
0.50
g/m3 24 hours**
1.0
g/m3
1.0
g/m3 7 CO 8 hours**
2.0 mg/m3
2.0 mg/m3 1 hour 4.0
mg/m3 4.0 mg/m3 8 NH3 Annual
Average* 100
g/m3
100
g/m3 24 hours**
400
g/m3
400
g/m3 9 C6H6 Annual 05 g/m3 05 g/m3
10 Benzo Pyrene Annual 1.0 ng/m3
1.0 ng/m3 11 As Annual 6.0
ng/m3 6.0 ng/m3 12 Ni Annual 20 ng/m3 20 ng/m3
Source: www.cpcb.nic.in
Section IV – Response
State of Air Environment
Page 82
* Annual Arithmetic mean of min 104 measurements in that year. Monitoring conducted
for 24 hours at uniform intervals.
** 24 hourly / 8 hourly/ 01 hourly monitored values, as applicable shall be complied with
98% of the time in a year. However 2% of the time it may exceed but not on two
consecutive days of monitoring.
4.1.2 Preparation of Zoning Atlas
The "Zoning Atlas" programme covering various spatial environmental planning activities has
been conceived as a tool for protection of the environmental resources and for achieving
developmental targets in an environmentally sound manner. “Zoning Atlas for Siting of
Industries” zones and classifies the environment and presents the pollution receiving
potential of various sites/zones in the State. It identifies the possible alternate sites for
industries, through easy-to-read maps. For Gujarat, interactive GIS based Zoning Atlas
prepared at taluka level along with revenue map is ready for utilisation. Its incorporation in
the State Industrial Policy can result in optimization of pollution abatement. Pollution
Control Board can use it as a ready reckoner for granting No Objection Certificates.
In continuation of the Zoning Atlas studies, the Industrial Estate Planning (IEP) studies have
been taken up at micro-level by GPCB to identify environmentally acceptable sites for
industrial estates, to suggest wastewater disposal points and to provide suggestions on
control of surrounding land uses. More IEP studies will be helpful to the Industrial
Development Corporation and the Industries Departments to properly locate the industrial
estates and provide the needed pollution abatement infrastructure.
4.1.3 Improved Vehicle Emission Norms
In 1991 and 1994, the European Environment council and European Commission regulated
the permissible pollution limit for vehicles within the European Union. Standards were set
for the amount of carbon monoxide (CO), oxides of nitrogen (NOx), hydrocarbon (CO) and
particulate matter a vehicle could emit. These emission norms are known as Euro I. These
were followed by stricter Euro II norms in 1998 and so on. In India, the first emission norms
came into force for petrol and diesel vehicles in 1991 which were further made stricter over
time. Euro I norms were introduced in India – in the National Capital Region (NCR) Delhi in
1999. India introduced its similar vehicle emission norms series to Euro norms known as
Bharat Stage norms. Currently the country is following Bharat Stage IV norms. All the vehicle
manufacturers need to implement these standards for the vehicles being manufactured by
them. The details of permissible vehicular emissions under various norms are given in
following tables:
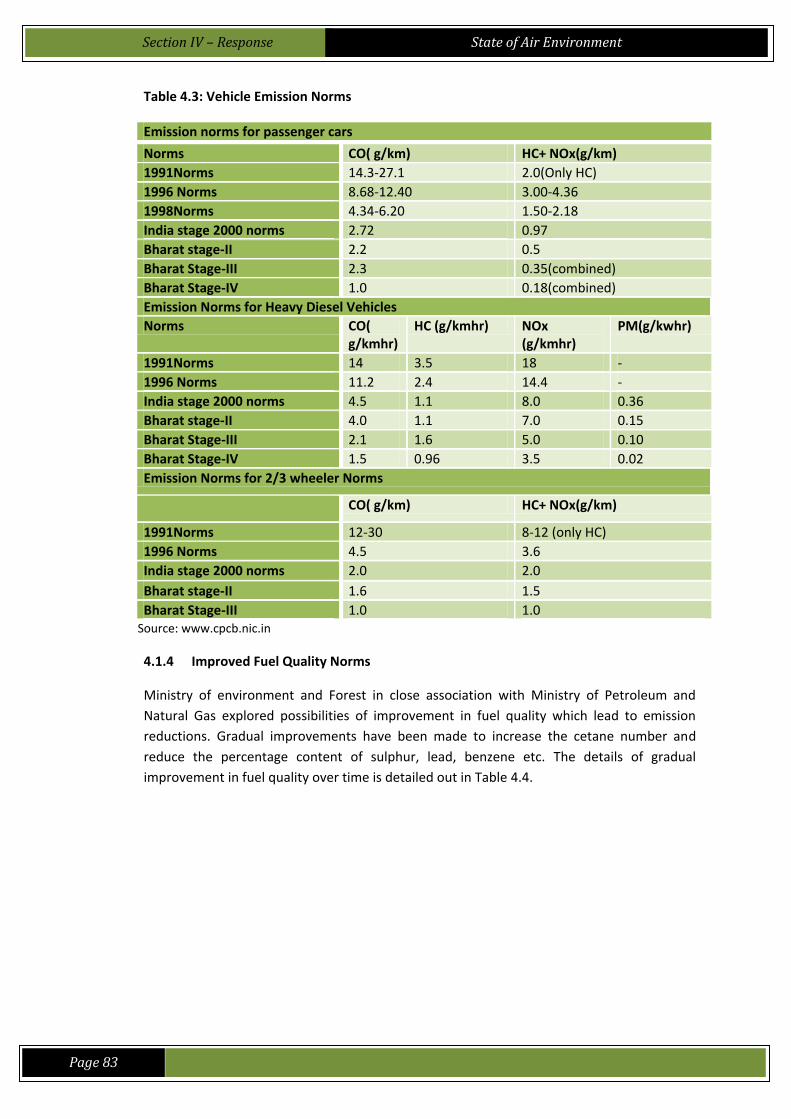
Section IV – Response
State of Air Environment
Page 83
Table 4.3: Vehicle Emission Norms
Emission norms for passenger cars
Norms CO( g/km) HC+ NOx(g/km)
1991Norms 14.3-27.1 2.0(Only HC)
1996 Norms 8.68-12.40 3.00-4.36
1998Norms 4.34-6.20 1.50-2.18
India stage 2000 norms 2.72 0.97
Bharat stage-II 2.2 0.5
Bharat Stage-III 2.3 0.35(combined)
Bharat Stage-IV 1.0 0.18(combined)
Emission Norms for Heavy Diesel Vehicles
Norms CO( g/kmhr)
HC (g/kmhr) NOx (g/kmhr)
PM(g/kwhr)
1991Norms 14 3.5 18 -
1996 Norms 11.2 2.4 14.4 -
India stage 2000 norms 4.5 1.1 8.0 0.36
Bharat stage-II 4.0 1.1 7.0 0.15
Bharat Stage-III 2.1 1.6 5.0 0.10
Bharat Stage-IV 1.5 0.96 3.5 0.02
Emission Norms for 2/3 wheeler Norms
CO( g/km) HC+ NOx(g/km)
1991Norms 12-30 8-12 (only HC)
1996 Norms 4.5 3.6
India stage 2000 norms 2.0 2.0
Bharat stage-II 1.6 1.5
Bharat Stage-III 1.0 1.0 Source: www.cpcb.nic.in
4.1.4 Improved Fuel Quality Norms
Ministry of environment and Forest in close association with Ministry of Petroleum and
Natural Gas explored possibilities of improvement in fuel quality which lead to emission
reductions. Gradual improvements have been made to increase the cetane number and
reduce the percentage content of sulphur, lead, benzene etc. The details of gradual
improvement in fuel quality over time is detailed out in Table 4.4.
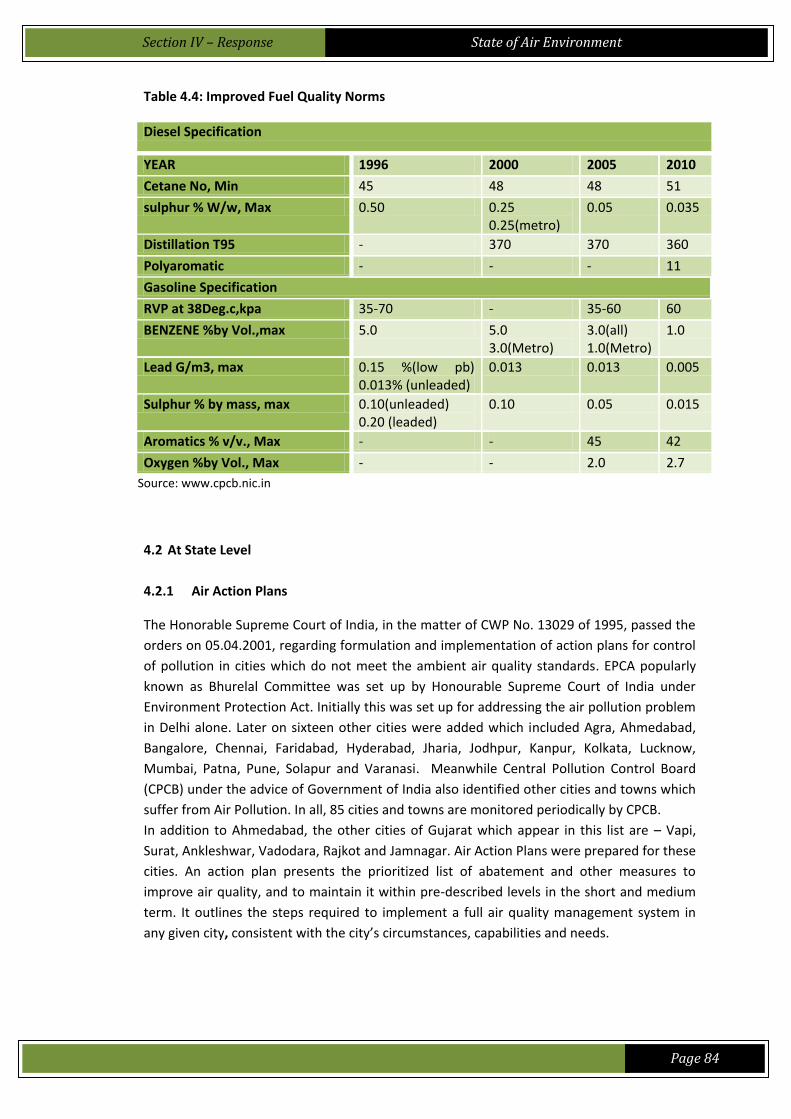
Section IV – Response
State of Air Environment
Page 84
Table 4.4: Improved Fuel Quality Norms
Diesel Specification
YEAR 1996 2000 2005 2010
Cetane No, Min 45 48 48 51
sulphur % W/w, Max 0.50 0.25 0.25(metro)
0.05 0.035
Distillation T95 - 370 370 360
Polyaromatic - - - 11
Gasoline Specification
RVP at 38Deg.c,kpa 35-70 - 35-60 60
BENZENE %by Vol.,max 5.0 5.0 3.0(Metro)
3.0(all) 1.0(Metro)
1.0
Lead G/m3, max 0.15 %(low pb) 0.013% (unleaded)
0.013 0.013 0.005
Sulphur % by mass, max 0.10(unleaded) 0.20 (leaded)
0.10 0.05 0.015
Aromatics % v/v., Max - - 45 42
Oxygen %by Vol., Max - - 2.0 2.7
Source: www.cpcb.nic.in
4.2 At State Level
4.2.1 Air Action Plans
The Honorable Supreme Court of India, in the matter of CWP No. 13029 of 1995, passed the
orders on 05.04.2001, regarding formulation and implementation of action plans for control
of pollution in cities which do not meet the ambient air quality standards. EPCA popularly
known as Bhurelal Committee was set up by Honourable Supreme Court of India under
Environment Protection Act. Initially this was set up for addressing the air pollution problem
in Delhi alone. Later on sixteen other cities were added which included Agra, Ahmedabad,
Bangalore, Chennai, Faridabad, Hyderabad, Jharia, Jodhpur, Kanpur, Kolkata, Lucknow,
Mumbai, Patna, Pune, Solapur and Varanasi. Meanwhile Central Pollution Control Board
(CPCB) under the advice of Government of India also identified other cities and towns which
suffer from Air Pollution. In all, 85 cities and towns are monitored periodically by CPCB.
In addition to Ahmedabad, the other cities of Gujarat which appear in this list are – Vapi,
Surat, Ankleshwar, Vadodara, Rajkot and Jamnagar. Air Action Plans were prepared for these
cities. An action plan presents the prioritized list of abatement and other measures to
improve air quality, and to maintain it within pre-described levels in the short and medium
term. It outlines the steps required to implement a full air quality management system in
any given city, consistent with the city’s circumstances, capabilities and needs.
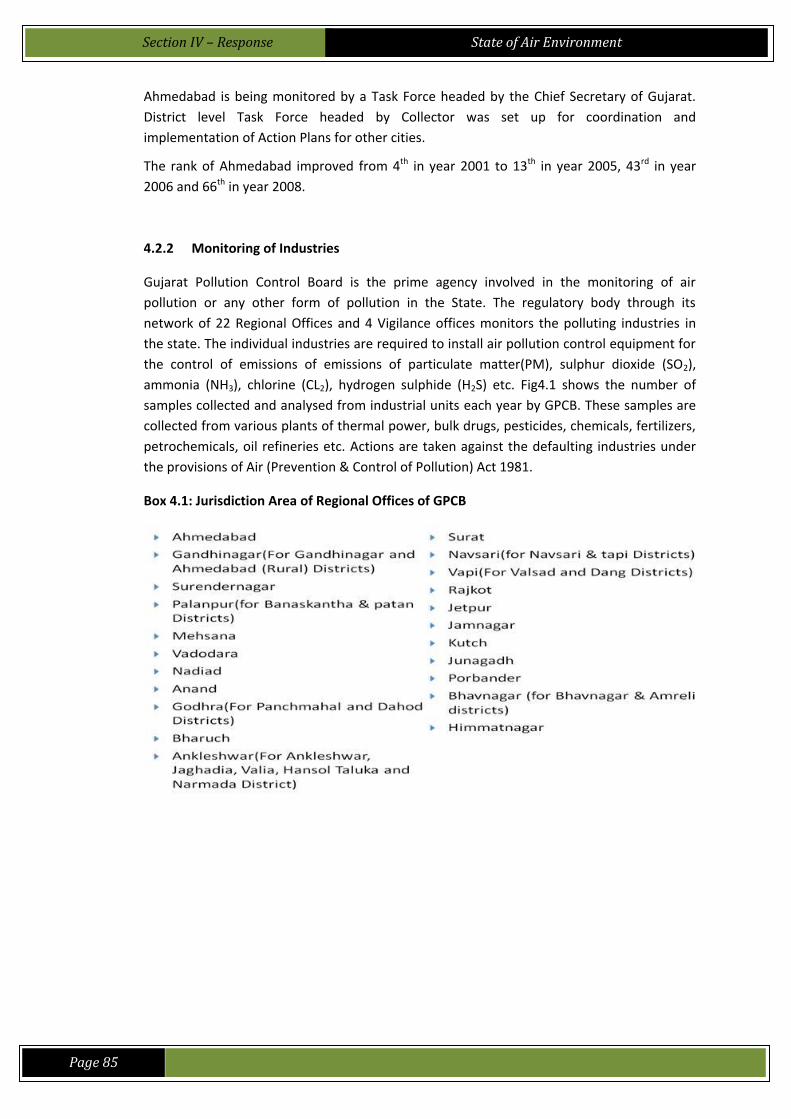
Section IV – Response
State of Air Environment
Page 85
Ahmedabad is being monitored by a Task Force headed by the Chief Secretary of Gujarat.
District level Task Force headed by Collector was set up for coordination and
implementation of Action Plans for other cities.
The rank of Ahmedabad improved from 4th in year 2001 to 13th in year 2005, 43rd in year
2006 and 66th in year 2008.
4.2.2 Monitoring of Industries
Gujarat Pollution Control Board is the prime agency involved in the monitoring of air
pollution or any other form of pollution in the State. The regulatory body through its
network of 22 Regional Offices and 4 Vigilance offices monitors the polluting industries in
the state. The individual industries are required to install air pollution control equipment for
the control of emissions of emissions of particulate matter(PM), sulphur dioxide (SO2),
ammonia (NH3), chlorine (CL2), hydrogen sulphide (H2S) etc. Fig4.1 shows the number of
samples collected and analysed from industrial units each year by GPCB. These samples are
collected from various plants of thermal power, bulk drugs, pesticides, chemicals, fertilizers,
petrochemicals, oil refineries etc. Actions are taken against the defaulting industries under
the provisions of Air (Prevention & Control of Pollution) Act 1981.
Box 4.1: Jurisdiction Area of Regional Offices of GPCB
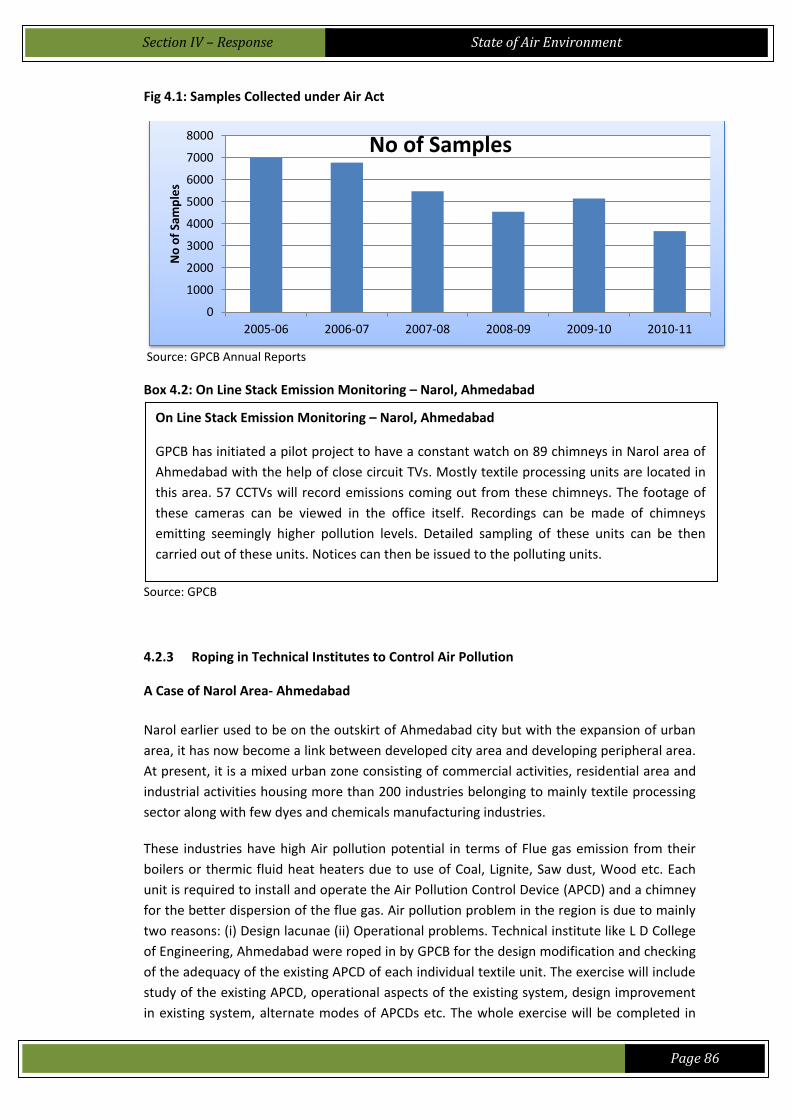
Section IV – Response
State of Air Environment
Page 86
Fig 4.1: Samples Collected under Air Act
Source: GPCB Annual Reports
Box 4.2: On Line Stack Emission Monitoring – Narol, Ahmedabad
Source: GPCB
4.2.3 Roping in Technical Institutes to Control Air Pollution
A Case of Narol Area- Ahmedabad
Narol earlier used to be on the outskirt of Ahmedabad city but with the expansion of urban
area, it has now become a link between developed city area and developing peripheral area.
At present, it is a mixed urban zone consisting of commercial activities, residential area and
industrial activities housing more than 200 industries belonging to mainly textile processing
sector along with few dyes and chemicals manufacturing industries.
These industries have high Air pollution potential in terms of Flue gas emission from their
boilers or thermic fluid heat heaters due to use of Coal, Lignite, Saw dust, Wood etc. Each
unit is required to install and operate the Air Pollution Control Device (APCD) and a chimney
for the better dispersion of the flue gas. Air pollution problem in the region is due to mainly
two reasons: (i) Design lacunae (ii) Operational problems. Technical institute like L D College
of Engineering, Ahmedabad were roped in by GPCB for the design modification and checking
of the adequacy of the existing APCD of each individual textile unit. The exercise will include
study of the existing APCD, operational aspects of the existing system, design improvement
in existing system, alternate modes of APCDs etc. The whole exercise will be completed in
0
1000
2000
3000
4000
5000
6000
7000
8000
2005-06 2006-07 2007-08 2008-09 2009-10 2010-11
No
of
Sam
ple
s
No of Samples
On Line Stack Emission Monitoring – Narol, Ahmedabad
GPCB has initiated a pilot project to have a constant watch on 89 chimneys in Narol area of
Ahmedabad with the help of close circuit TVs. Mostly textile processing units are located in
this area. 57 CCTVs will record emissions coming out from these chimneys. The footage of
these cameras can be viewed in the office itself. Recordings can be made of chimneys
emitting seemingly higher pollution levels. Detailed sampling of these units can be then
carried out of these units. Notices can then be issued to the polluting units.
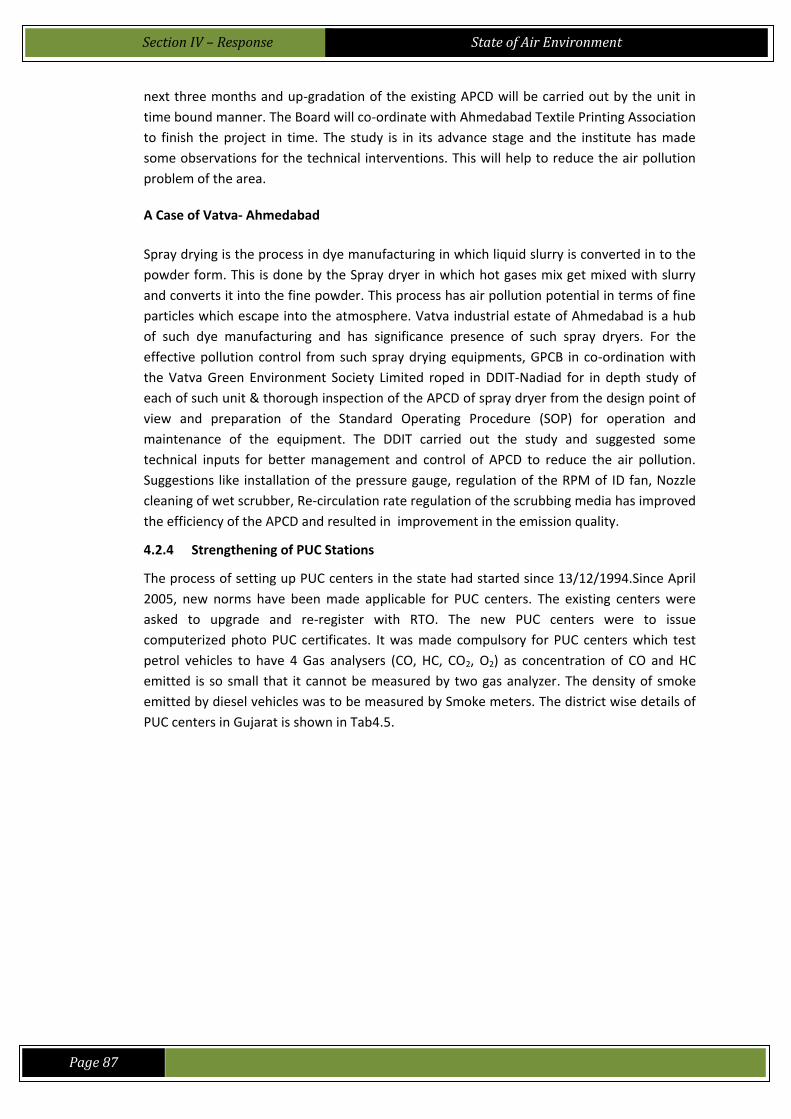
Section IV – Response
State of Air Environment
Page 87
next three months and up-gradation of the existing APCD will be carried out by the unit in
time bound manner. The Board will co-ordinate with Ahmedabad Textile Printing Association
to finish the project in time. The study is in its advance stage and the institute has made
some observations for the technical interventions. This will help to reduce the air pollution
problem of the area.
A Case of Vatva- Ahmedabad
Spray drying is the process in dye manufacturing in which liquid slurry is converted in to the
powder form. This is done by the Spray dryer in which hot gases mix get mixed with slurry
and converts it into the fine powder. This process has air pollution potential in terms of fine
particles which escape into the atmosphere. Vatva industrial estate of Ahmedabad is a hub
of such dye manufacturing and has significance presence of such spray dryers. For the
effective pollution control from such spray drying equipments, GPCB in co-ordination with
the Vatva Green Environment Society Limited roped in DDIT-Nadiad for in depth study of
each of such unit & thorough inspection of the APCD of spray dryer from the design point of
view and preparation of the Standard Operating Procedure (SOP) for operation and
maintenance of the equipment. The DDIT carried out the study and suggested some
technical inputs for better management and control of APCD to reduce the air pollution.
Suggestions like installation of the pressure gauge, regulation of the RPM of ID fan, Nozzle
cleaning of wet scrubber, Re-circulation rate regulation of the scrubbing media has improved
the efficiency of the APCD and resulted in improvement in the emission quality.
4.2.4 Strengthening of PUC Stations
The process of setting up PUC centers in the state had started since 13/12/1994.Since April
2005, new norms have been made applicable for PUC centers. The existing centers were
asked to upgrade and re-register with RTO. The new PUC centers were to issue
computerized photo PUC certificates. It was made compulsory for PUC centers which test
petrol vehicles to have 4 Gas analysers (CO, HC, CO2, O2) as concentration of CO and HC
emitted is so small that it cannot be measured by two gas analyzer. The density of smoke
emitted by diesel vehicles was to be measured by Smoke meters. The district wise details of
PUC centers in Gujarat is shown in Tab4.5.
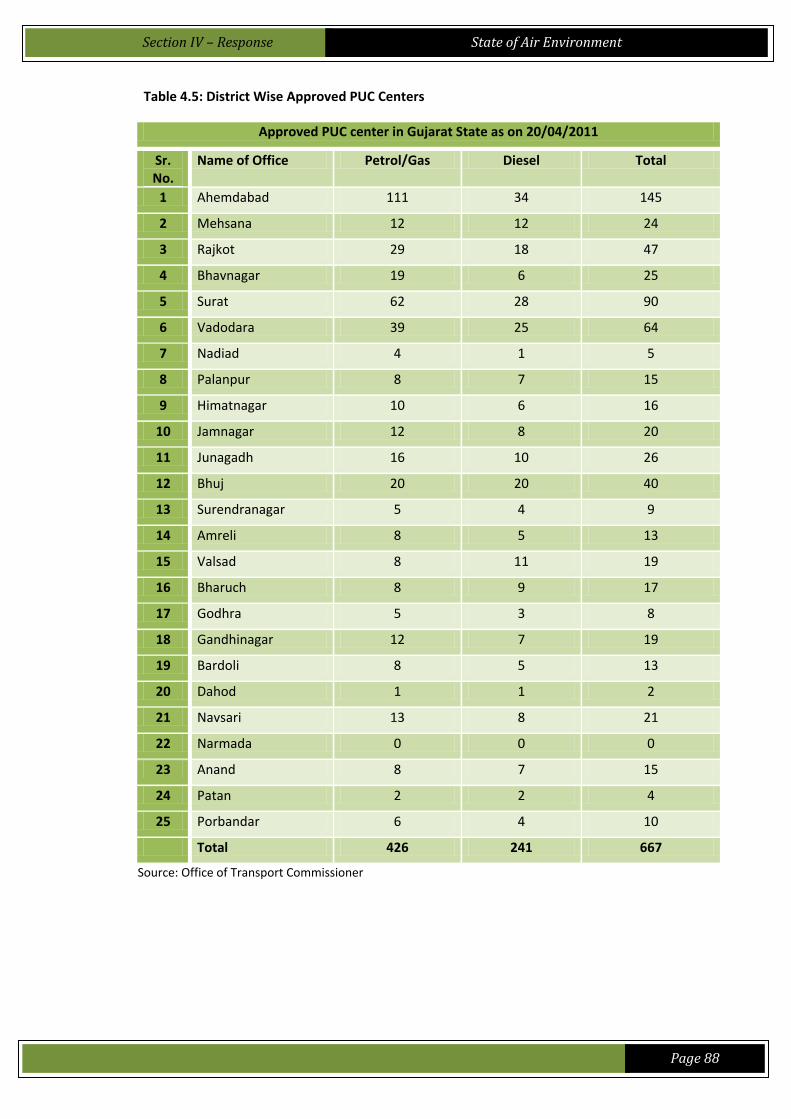
Section IV – Response
State of Air Environment
Page 88
Table 4.5: District Wise Approved PUC Centers
Approved PUC center in Gujarat State as on 20/04/2011
Sr. No.
Name of Office Petrol/Gas Diesel Total
1 Ahemdabad 111 34 145
2 Mehsana 12 12 24
3 Rajkot 29 18 47
4 Bhavnagar 19 6 25
5 Surat 62 28 90
6 Vadodara 39 25 64
7 Nadiad 4 1 5
8 Palanpur 8 7 15
9 Himatnagar 10 6 16
10 Jamnagar 12 8 20
11 Junagadh 16 10 26
12 Bhuj 20 20 40
13 Surendranagar 5 4 9
14 Amreli 8 5 13
15 Valsad 8 11 19
16 Bharuch 8 9 17
17 Godhra 5 3 8
18 Gandhinagar 12 7 19
19 Bardoli 8 5 13
20 Dahod 1 1 2
21 Navsari 13 8 21
22 Narmada 0 0 0
23 Anand 8 7 15
24 Patan 2 2 4
25 Porbandar 6 4 10
Total 426 241 667
Source: Office of Transport Commissioner
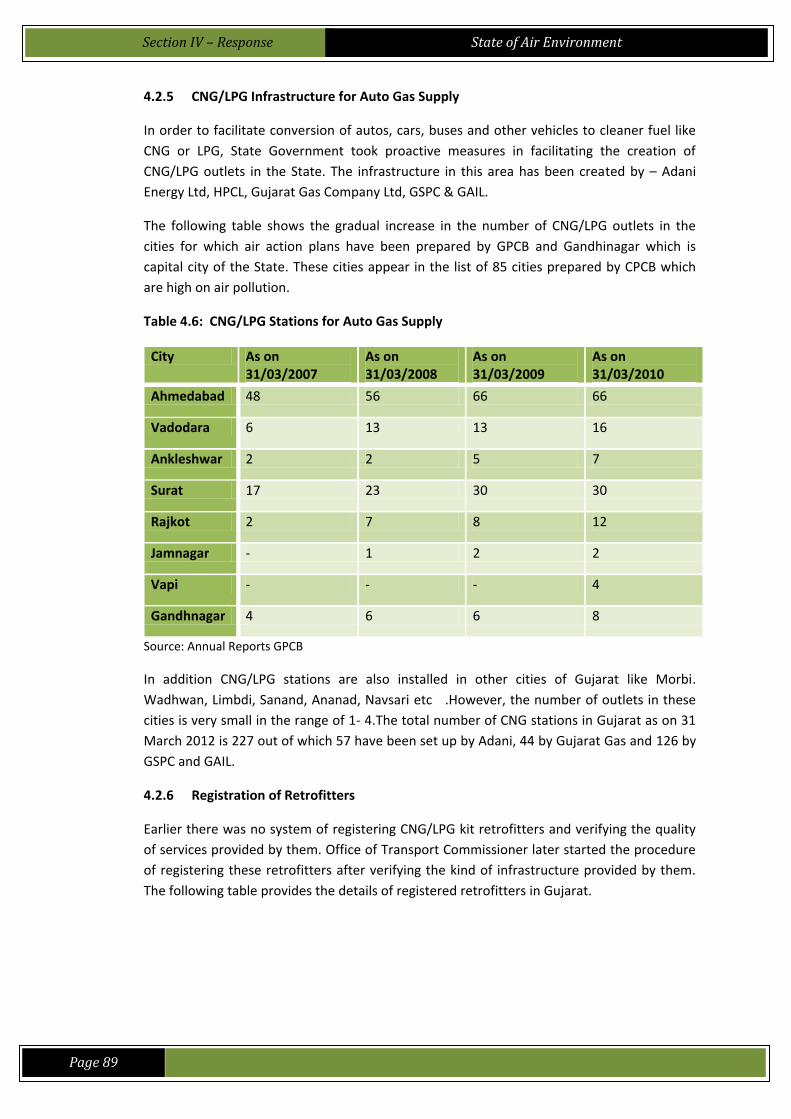
Section IV – Response
State of Air Environment
Page 89
4.2.5 CNG/LPG Infrastructure for Auto Gas Supply
In order to facilitate conversion of autos, cars, buses and other vehicles to cleaner fuel like
CNG or LPG, State Government took proactive measures in facilitating the creation of
CNG/LPG outlets in the State. The infrastructure in this area has been created by – Adani
Energy Ltd, HPCL, Gujarat Gas Company Ltd, GSPC & GAIL.
The following table shows the gradual increase in the number of CNG/LPG outlets in the
cities for which air action plans have been prepared by GPCB and Gandhinagar which is
capital city of the State. These cities appear in the list of 85 cities prepared by CPCB which
are high on air pollution.
Table 4.6: CNG/LPG Stations for Auto Gas Supply
City As on 31/03/2007
As on 31/03/2008
As on 31/03/2009
As on 31/03/2010
Ahmedabad 48 56 66 66
Vadodara 6 13 13 16
Ankleshwar 2 2 5 7
Surat 17 23 30 30
Rajkot 2 7 8 12
Jamnagar - 1 2 2
Vapi - - - 4
Gandhnagar 4 6 6 8
Source: Annual Reports GPCB
In addition CNG/LPG stations are also installed in other cities of Gujarat like Morbi.
Wadhwan, Limbdi, Sanand, Ananad, Navsari etc .However, the number of outlets in these
cities is very small in the range of 1- 4.The total number of CNG stations in Gujarat as on 31
March 2012 is 227 out of which 57 have been set up by Adani, 44 by Gujarat Gas and 126 by
GSPC and GAIL.
4.2.6 Registration of Retrofitters
Earlier there was no system of registering CNG/LPG kit retrofitters and verifying the quality
of services provided by them. Office of Transport Commissioner later started the procedure
of registering these retrofitters after verifying the kind of infrastructure provided by them.
The following table provides the details of registered retrofitters in Gujarat.
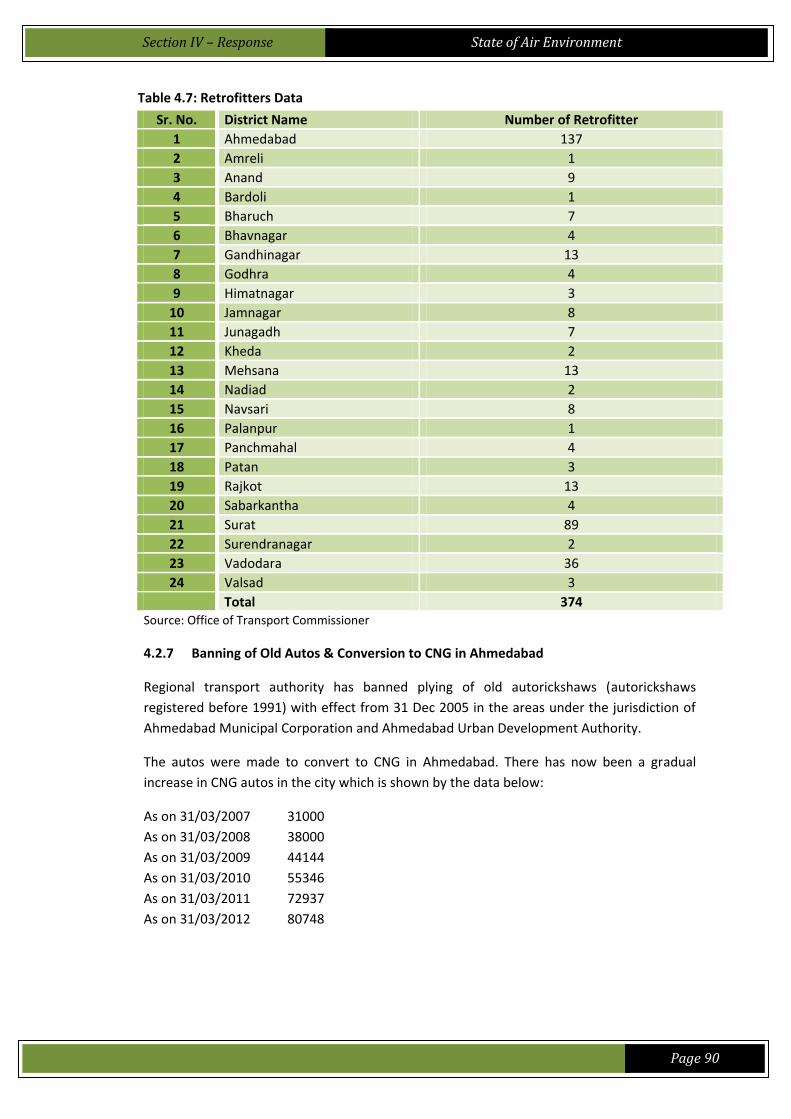
Section IV – Response
State of Air Environment
Page 90
Table 4.7: Retrofitters Data
Sr. No. District Name Number of Retrofitter
1 Ahmedabad 137
2 Amreli 1
3 Anand 9
4 Bardoli 1
5 Bharuch 7
6 Bhavnagar 4
7 Gandhinagar 13
8 Godhra 4
9 Himatnagar 3
10 Jamnagar 8
11 Junagadh 7
12 Kheda 2
13 Mehsana 13
14 Nadiad 2
15 Navsari 8
16 Palanpur 1
17 Panchmahal 4
18 Patan 3
19 Rajkot 13
20 Sabarkantha 4
21 Surat 89
22 Surendranagar 2
23 Vadodara 36
24 Valsad 3
Total 374 Source: Office of Transport Commissioner
4.2.7 Banning of Old Autos & Conversion to CNG in Ahmedabad
Regional transport authority has banned plying of old autorickshaws (autorickshaws
registered before 1991) with effect from 31 Dec 2005 in the areas under the jurisdiction of
Ahmedabad Municipal Corporation and Ahmedabad Urban Development Authority.
The autos were made to convert to CNG in Ahmedabad. There has now been a gradual
increase in CNG autos in the city which is shown by the data below:
As on 31/03/2007 31000
As on 31/03/2008 38000
As on 31/03/2009 44144
As on 31/03/2010 55346
As on 31/03/2011 72937
As on 31/03/2012 80748
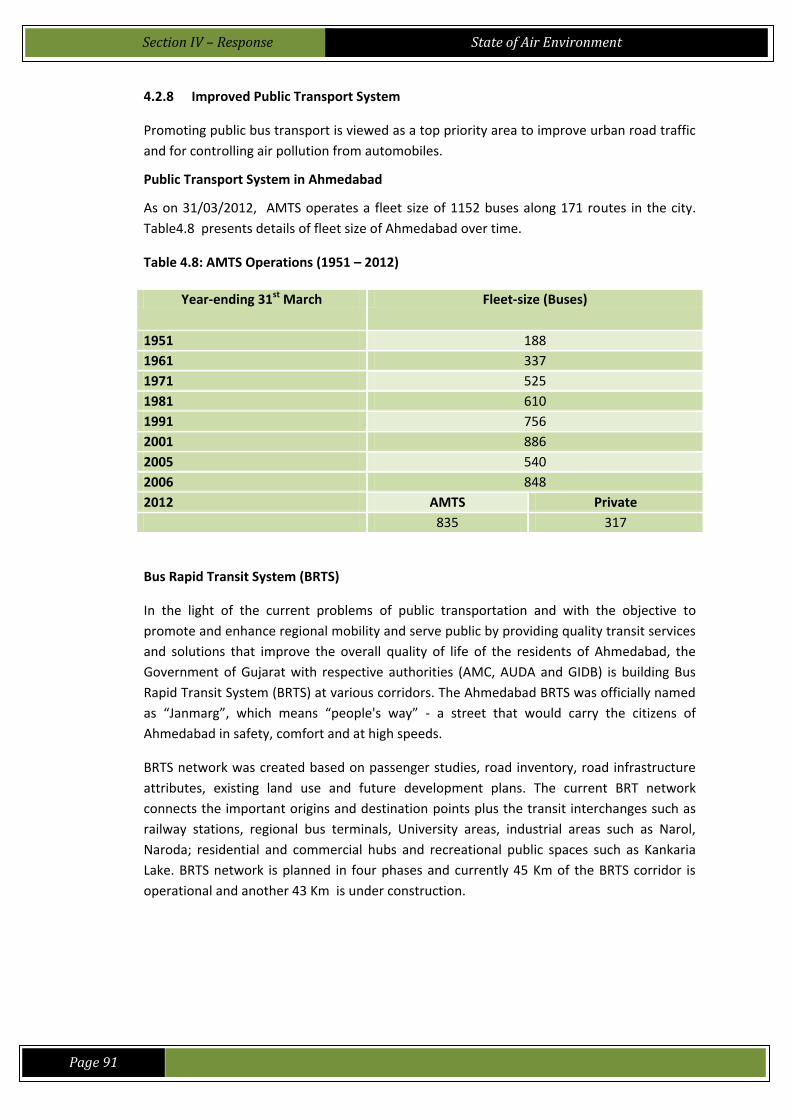
Section IV – Response
State of Air Environment
Page 91
4.2.8 Improved Public Transport System
Promoting public bus transport is viewed as a top priority area to improve urban road traffic
and for controlling air pollution from automobiles.
Public Transport System in Ahmedabad
As on 31/03/2012, AMTS operates a fleet size of 1152 buses along 171 routes in the city.
Table4.8 presents details of fleet size of Ahmedabad over time.
Table 4.8: AMTS Operations (1951 – 2012)
Year-ending 31st March Fleet-size (Buses)
1951 188
1961 337
1971 525
1981 610
1991 756
2001 886
2005 540
2006 848
2012 AMTS Private
835 317
Bus Rapid Transit System (BRTS)
In the light of the current problems of public transportation and with the objective to
promote and enhance regional mobility and serve public by providing quality transit services
and solutions that improve the overall quality of life of the residents of Ahmedabad, the
Government of Gujarat with respective authorities (AMC, AUDA and GIDB) is building Bus
Rapid Transit System (BRTS) at various corridors. The Ahmedabad BRTS was officially named
as “Janmarg”, which means “people's way” - a street that would carry the citizens of
Ahmedabad in safety, comfort and at high speeds.
BRTS network was created based on passenger studies, road inventory, road infrastructure
attributes, existing land use and future development plans. The current BRT network
connects the important origins and destination points plus the transit interchanges such as
railway stations, regional bus terminals, University areas, industrial areas such as Narol,
Naroda; residential and commercial hubs and recreational public spaces such as Kankaria
Lake. BRTS network is planned in four phases and currently 45 Km of the BRTS corridor is
operational and another 43 Km is under construction.
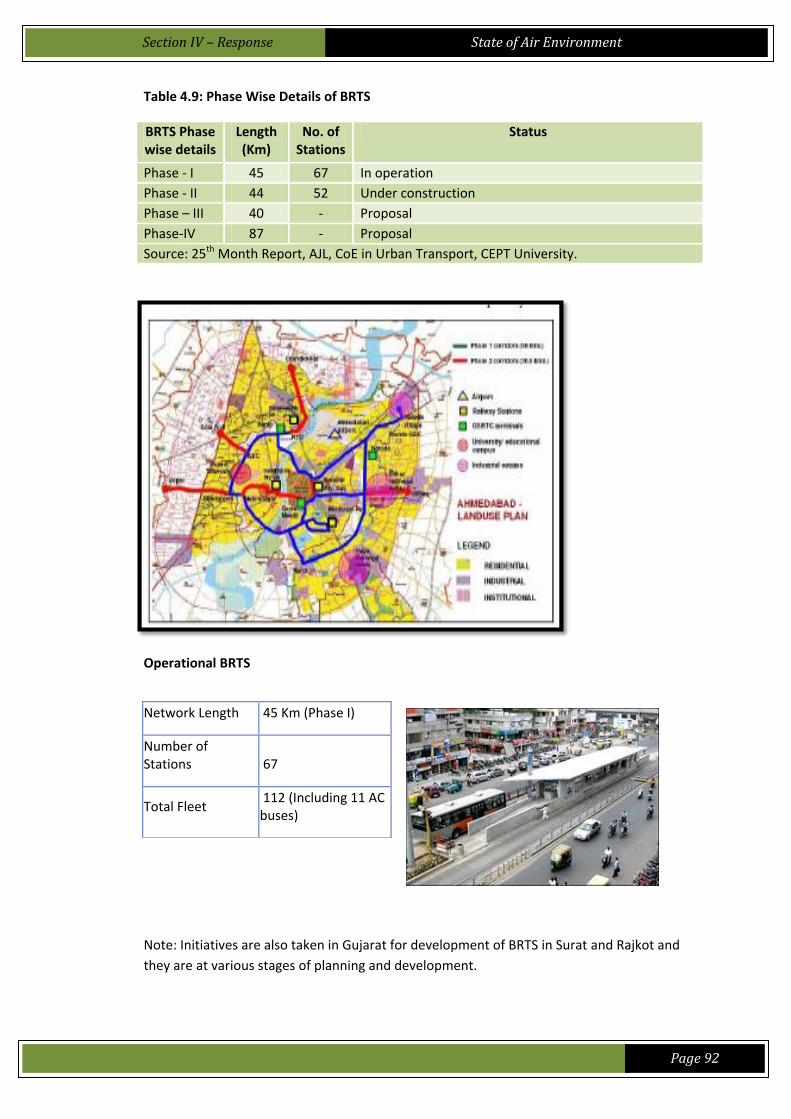
Section IV – Response
State of Air Environment
Page 92
Table 4.9: Phase Wise Details of BRTS
BRTS Phase wise details
Length (Km)
No. of Stations
Status
Phase - I 45 67 In operation
Phase - II 44 52 Under construction
Phase – III 40 - Proposal
Phase-IV 87 - Proposal
Source: 25th Month Report, AJL, CoE in Urban Transport, CEPT University.
Operational BRTS
Note: Initiatives are also taken in Gujarat for development of BRTS in Surat and Rajkot and
they are at various stages of planning and development.
Network Length 45 Km (Phase I)
Number of Stations 67
Total Fleet 112 (Including 11 AC buses)
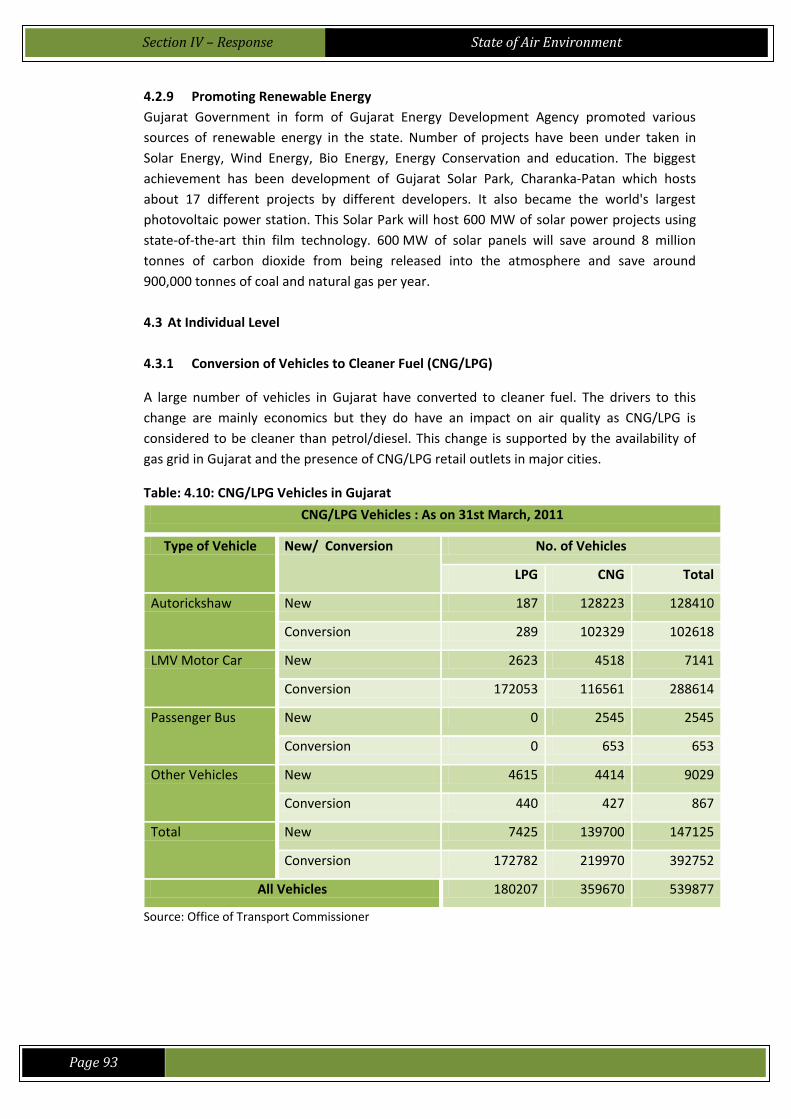
Section IV – Response
State of Air Environment
Page 93
4.2.9 Promoting Renewable Energy
Gujarat Government in form of Gujarat Energy Development Agency promoted various
sources of renewable energy in the state. Number of projects have been under taken in
Solar Energy, Wind Energy, Bio Energy, Energy Conservation and education. The biggest
achievement has been development of Gujarat Solar Park, Charanka-Patan which hosts
about 17 different projects by different developers. It also became the world's largest
photovoltaic power station. This Solar Park will host 600 MW of solar power projects using
state-of-the-art thin film technology. 600 MW of solar panels will save around 8 million
tonnes of carbon dioxide from being released into the atmosphere and save around
900,000 tonnes of coal and natural gas per year.
4.3 At Individual Level
4.3.1 Conversion of Vehicles to Cleaner Fuel (CNG/LPG)
A large number of vehicles in Gujarat have converted to cleaner fuel. The drivers to this
change are mainly economics but they do have an impact on air quality as CNG/LPG is
considered to be cleaner than petrol/diesel. This change is supported by the availability of
gas grid in Gujarat and the presence of CNG/LPG retail outlets in major cities.
Table: 4.10: CNG/LPG Vehicles in Gujarat
CNG/LPG Vehicles : As on 31st March, 2011
Type of Vehicle New/ Conversion No. of Vehicles
LPG CNG Total
Autorickshaw New 187 128223 128410
Conversion 289 102329 102618
LMV Motor Car New 2623 4518 7141
Conversion 172053 116561 288614
Passenger Bus New 0 2545 2545
Conversion 0 653 653
Other Vehicles New 4615 4414 9029
Conversion 440 427 867
Total New 7425 139700 147125
Conversion 172782 219970 392752
All Vehicles 180207 359670 539877
Source: Office of Transport Commissioner
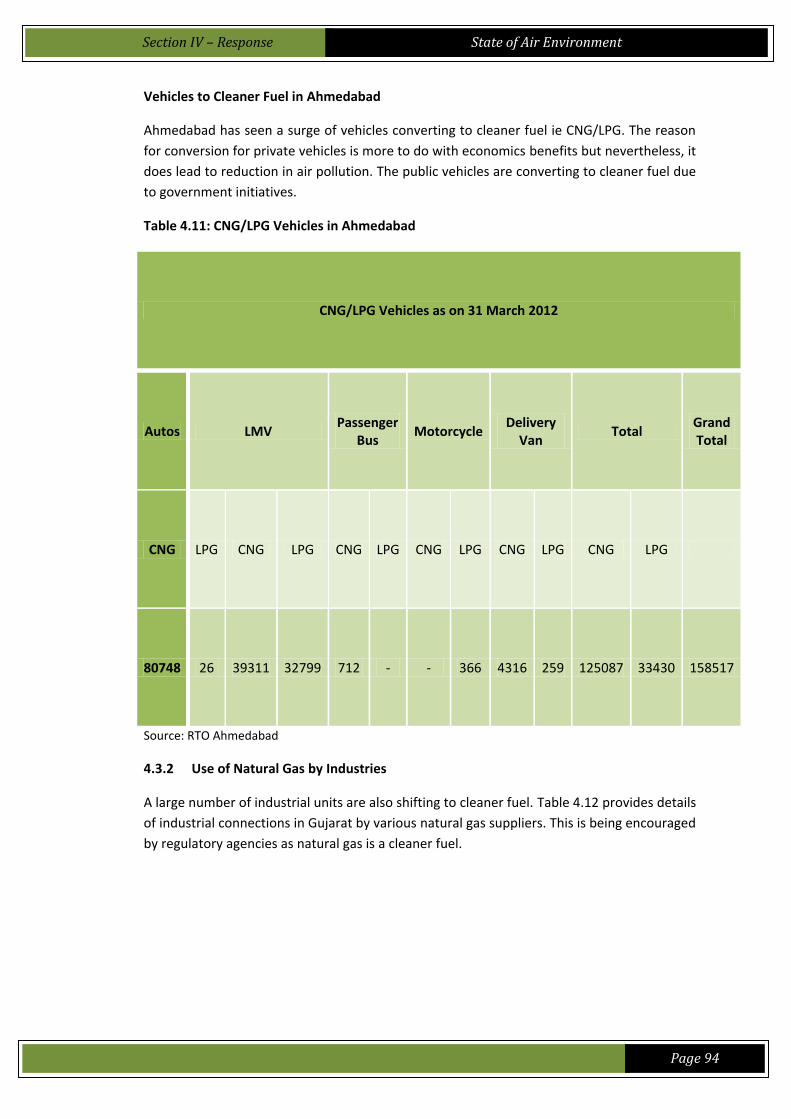
Section IV – Response
State of Air Environment
Page 94
Vehicles to Cleaner Fuel in Ahmedabad
Ahmedabad has seen a surge of vehicles converting to cleaner fuel ie CNG/LPG. The reason
for conversion for private vehicles is more to do with economics benefits but nevertheless, it
does lead to reduction in air pollution. The public vehicles are converting to cleaner fuel due
to government initiatives.
Table 4.11: CNG/LPG Vehicles in Ahmedabad
CNG/LPG Vehicles as on 31 March 2012
Autos LMV Passenger
Bus Motorcycle
Delivery Van
Total Grand Total
CNG LPG CNG LPG CNG LPG CNG LPG CNG LPG CNG LPG
80748 26 39311 32799 712 - - 366 4316 259 125087 33430 158517
Source: RTO Ahmedabad
4.3.2 Use of Natural Gas by Industries
A large number of industrial units are also shifting to cleaner fuel. Table 4.12 provides details
of industrial connections in Gujarat by various natural gas suppliers. This is being encouraged
by regulatory agencies as natural gas is a cleaner fuel.

Section IV – Response
State of Air Environment
Page 95
Table 4.12: Industries having Natural Gas Connection
Commissioned Industrial Customers as on 31 Jan 2012
GSPC Adani Energy Ltd Gujarat Gas
North Gujarat
Ahmedabad
Vatva
Naroda
Memco
Narol
Odhav
Changodar
Rakhial
259
136
10
63
92
62
01
South Gujarat
Sarigam 86
Vapi 264
Valsad 28
Navsari 14
Hazira 5
Umargam 47
Bilimora 8
Surat 875
Central Gujarat
Vadodara 75
Karjan-Palej 3
Halol 42
Dahej 7
Gandhinagar 17
Nadiad 12
Khambat 4
North Saurashtra
Surendranagar 59
Rajkot 171
Morbi
Morbi 561
Thangadh 153
Total 1481 698 875 Source: GSPC & Adani Energy Ltd
4.3.3 Households having PNG
Use of cleaner fuel at house hold level has also increased. Between NFHS- 2 and NFHS -3 an
additional 2 % households shifted to cleaner fuel in urban areas, in rural areas, additional
5% households shifted to cleaner fuel taking total percentage to 81.8% and 23% in urban
and rural areas respectively.
Section V - Recommendation

Section V –Recommendations
State of Air Environment
Page 96
SECTION V - RECOMMENDATIONS
For improved air quality, there is a need to involve all stake holders - government agencies,
NGOS, academic institutions, R & D organisations and public. State of art air quality
monitoring equipments, modeling techniques, meteorological data, source apportionment
studies and regular health surveys are a prerequisite to pragmatic policy interventions.
5.1 Need to Extend Ambient Air Quality Monitoring Programme
Most of the ambient air quality monitoring stations measuring annual averages are
located in the golden corridor. Only 09 districts are covered by them. There is a need to
spread this network to remaining districts in Gujarat to start building temporal data.
More stations are needed particularly in hot spots where the vehicular and industrial
emissions are high.
Potential air pollutants in ambient air namely Volatile organic compounds and polycyclic
aromatic hydrocarbons should be monitored regularly in order to minimize their
emissions to protect public health. Currently these are being monitored only in industrial
clusters. A need is there to extend this to major traffic junctions in the major urban
centers as vehicular traffic is a major contributor to these VOCs.
Annual averages are measured only for four parameters namely SO2, NOX, SPM and
RSPM. Twelve parameters are now notified under the Ambient Air Quality norms since
18th Nov 2009. There is an urgent need to extend the parameters being monitored. The
collected air quality data should be comprehensively and statistically analyzed to get an
insight into temporal and spatial trends.
The performance of existing stations needs to be overhauled for strict quality control.
Also there is a need for relocation of monitoring equipment at some locations to have
data indicating actual ambient air quality status.
5.2 Source Apportionment Studies
Source Apportionment Studies for ambient air quality attributing contribution of various
sources of air pollutants have not been initiated in Gujarat. Such studies when
undertaken periodically will highlight the impact of policy interventions for improvement
of air quality.
Section V –Recommendations
State of Air Environment
Page 97
5.3 Health Impact Studies
Data on health effects of air pollution from Indian cities is minimal and investigation on
the health effects of chronic, long-term exposures to ambient air pollution is almost
absent. It is important to undertake health impact studies to know the effect of specific
air pollutants on public health.
Collaboration of impact analysis on health with air monitoring data and various research
and development initiatives will improve policy interventions for air quality.
There is utmost requirement to collect better and systematic information about actual
exposure levels experienced by households and develop a model for predicting the
exposure levels based on fuel use and other household data (exposure atlas). Effective
tackling of indoor air pollution also requires collaboration and commitment between
agencies responsible for health, energy, environment, housing and rural development.
5.4 Pollution Control from Vehicles
Traffic mode characteristics show that trips by Public Transport are only 8.97% in 2007
for Ahmedabad. For other cities, this data was not available. For cities like Ahmedabad,
this percentage is very low and should have been more than 20% as per the study on
‘Traffic & Transportation Policies and Strategies in Urban Areas in India, 2008’,
conducted by Ministry Of Urban Development, New Delhi. Therefore, there is a need to
strengthen Mass Transportation in cities.
Diesel exhausts contain fine and ultrafine particles that are very harmful particularly for
children. School buses and other vehicles used for transportation of the school children
everywhere in the country should be changed from diesel to cleaner fuel like CNG or
LPG.
The State Government needs to make necessary amendments to Motor Vehicles Act, to
enable spot checking of vehicles and levy fines on owners, who fail to pass tests for
carbon monoxide, hydrocarbons and lead emissions. Regulation to restrict the
registration of two-stroke motored vehicles and movements of diesel transport vehicles
in major cities could also be initiated.
Improvement in traffic management system to relieve congestion is urgently called for
by linking the bylanes and introducing parallel road system.
Congested areas should be designated as ‘Pedestrian Streets’ during peak periods.
Parking should be allowed only in designated parking areas at nodal points.
Section V –Recommendations
State of Air Environment
Page 98
5.5 Regulatory Agencies
There are multiple contributors to air pollution like vehicles, industries, fuel burning etc.
Therefore control strategies require active co-operation among all the concerned
agencies and require developing some common platform where they can plan strategies
and programmes to prevent and control air pollution.
Suitability of a new industry or industrial estate with environment can be assessed by
using the Zoning Atlas for Gujarat which provides a taluka level GIS based interactive
approach for site suitability. This is based on pollution potential of an industry taking
into account its effect on Land, Air, Water and Environmentally Sensitive Zones.
Integration of local policies for air, water, soil and waste in cities will lead to better
environmental quality.
Staggering of holidays and workdays for business establishments, rescheduling of
timings of schools and cinema theatres in different parts of the cities may be
implemented.
5.6 Awareness Programmes
Accelerating the national programmes for dissemination of solar cookers and improved
fuel wood stoves suited to local cooking practices and biomass resources can help in
preventing health impacts from indoor air pollution.
Encouraging public to walk or use bicycles for traveling short distances and to share
vehicles for long distances will help in controlling vehicular air pollution. The individual
level action that can be initiated to minimise pollution from vehicles should also be
popularised.
City and land use pattern should encourage designing and redevelopment of
communities to promote mass transit, carpooling, pedestrian walkways, and bicycle use.
Saving the existing trees and planting more trees wherever possible will help in
controlling air pollution.
A mass awareness campaign should be carried out on air pollution and its impact on our
health.


References


References
State of Air Environment
Page 99
REFERENCES
1. Annual Reports 2006-07, 2007-08, 2008-09,2009-2010, Central Pollution Control
Board, New Delhi
2. Annual Reports 2006-07, 2007-08, 2008-09,2009-2010, Gujarat Pollution Control
Board, Gandhinagar
3. Air Quality Trends And Action Plan For Control Of Air Pollution For Seventeen Cities
2006, 2007, 2008, Central Pollution Control Board, New Delhi
4. Minimising Release And Environmental Implications Of Chlorine And Its
Compounds, 2008, Central Pollution Control Board, New Delhi
5. Guidelines On Odour Pollution & Its Control, 2008, Central Pollution Control Board,
New Delhi
6. Status Of The Vehicular Pollution Control Programme In India, 2010, Central
Pollution Control Board, New Delhi
7. Evaluation Study On National Project On Biogas Development Programme, May
2002, Planning Commission, Government Of India, New Delhi
8. Dr. Arunachalam Gunasekar, Tracking Delhi’s Air Quality 2012, New York Times
9. Environmental Performance Index, 2012, Environmental Research Centers At Yale
And Columbia Universities
10. Study On Traffic And Transportation Policies And Strategies In Urban Areas In India,
2008, Ministry of Urban Development, New Delhi
11. Epidemiological Study On Effect Of Air Pollution On Human Health (Adults) In Delhi,
2008, Central Pollution Control Board , New Delhi
12. Study On Ambient Air Quality, Respiratory Symptoms And Lung Function Of Children
In Delhi, 2008, Central Pollution Control Board, New Delhi
13. Study Of Urban Air Quality In Kolkata For Source Identification And Estimation Of
Ozone, Carbonyls, NOx And VOC Emissions, 2010, Central Pollution Control Board,
New Delhi
14. Tishyarakshit Chatterjee, (2009) Reorienting Environment Policy In India Towards A
Local Area-Based Development And Management Paradigm, The Journal Of Trans
disciplinary Environmental Studies Vol. 8, No. 1
15. Sruthijith K K, CNG: Environmentalism Vs Economics, Centre For Civil Society
16. Sanjeev Kumar K., Ankur Paliwal, Sumana Narayanan (Jul 15, 2011) Gentle On Critical
Pollution, Down To Earth, Jul 15, 2011
References State of Air Environment
Page 100
17. Bureau Of Indian Standards, National Building Code Of India 1983 – Incorporating
Amendments No.1 And 2, 1990, Bureau Of Indian Standards, New Delhi
18. SP 7:2005, National Building Code Of India 2005, Bureau Of Indian Standards, New
Delhi
19. Goyal, Rohit, Khandelwal, Sumit And Kaul, Nivedita, 2011, Analysis Of Relative
Importance Of Parameters Representing Vegetation, Urbanization And Elevation
With Land Surface Temperature Using ANN, Geo Spatial World Forum, Hydrabad
20. Prajna Paramita Mishra, 2005, Impact Of Mining On Agricultural Productivity, Centre
For Economic And Social Studies (CESS), Hyderabad
21. Rapid Environmental Impact Assessment Of Iron Ore Mining In Bellary-Hospet
Region, 2004, National Environmental Engineering Research Institute, Nagpur,
22. London’s Urban Heat Island: A Summary For Decision Makers, October 2006, Greater
London Authority
23. For A Breath Of Fresh Air 10 year Progress And Challenges In Urban Air Quality
Management In India ( 1993-2002), The World Bank; Environment And Social
Development Unit; South Asia Region
24. Integrated Environment Epidemiology Study In Identified Critically Polluted Areas In
Country, National Institute of Occupational Hazard, Ahmedabad.
25. Determination Of Impact On Health And Vegetation Due To Air Pollution, NIOH,
2003, Central Pollution Control Board Sponsored by World Bank Aided Training
Program
26. Environmental Standards for Ambient Air, Automobiles, Fuels, Industries and Noise,
2000, Central Pollution Control Board, Ministry Of Environment & Forests, New Delhi
27. Air Pollution Due To Vehicular Traffic In Designated Cities / Towns Of The Gujarat
State And Evaluation Of Health Status Of School Children Studying Nearby Traffic
Junction In Cities, 2000, National Institute of Occupational Hazard, Identified By The
Honble High Court, Ahmedabad
28. National Environmental Health Profile And Comparative Health Risk Assessment,
2004-05, National Institute of Occupational Hazard Sponsored By WHO Through
Ministry Of Environment & Forests, New Delhi
29. Socio-Economic Review, Gujarat State 2007-08; February 2008; Directorate of
Economic and Statistics; Government of Gujarat; Gandhinagar
30. Compendium Of Environment Statistics India, 2010, Central Statistics Office, Ministry
Of Statistics And Programme Implementation, Government Of India
References
State of Air Environment
Page 101
31. Smoke Screen Ambient Air Quality In India; 2006, Website:
www.Sipcotcuddalore.Com ; Community Environmental Monitoring
32. Action Plans Of Various Cities In Gujarat; Ahmedabad; Vadodara; Surat; Jamnagar;
Bhavnagar; Rajkot; Vapi; Ankleshwar; Etc, Gujarat Pollution Control Board
33. State Of Environment Reports; Maharashtra, Tamil Nadu, Andra Pradesh, Gujarat,
India; Etc
34. Bhuvans Thematic Maps,
35. Comprehensive environmental Pollution Index, 2009, Central Pollution Control
Board, New Delhi
36. Mowli P Pratapa and Subbayya, Air Pollution and Control, Divyajyoti Prakashan,
Jodhpur.
37. Singal S P, Air Quality Monitoring and Control Strategy, Narosa Publishing House,
New Delhi.


Annexure

Annexure – I
State of Air Environment
Page 102
ANNEXURE – I
Classification of industries as per Pollution Potential [Red, Orange & Green Categories]
I. List of Industries under “ RED ” Category A. Industries identified by Ministry of Environment & Forests, Govt. of India, as Heavily polluting and covered under Central Action Plan, viz.
1. Distillery including Fermentation industry. 2. Sugar (excluding Khandsari). 3. Fertiliser. 4. Pulp & Paper (Paper manufacturing with or without pulping). 5. Chlor alkali. 6. Pharmaceuticals (Basic) (excluding formulation). 7. Dyes and dye-intermediates. 8. Pesticides (Technical) (excluding formulation). 9. Oil refinery (Mineral Oil and Petro refineries). 10. Tanneries. 11. Petrochemicals (Manufacture of and not merely use of as raw material). 12. Cement. 13. Thermal power Plants. 14. Iron and Steel (Involving processing from ore / scrap / Integrated steel plants). 15. Zinc smelter. 16. Copper smelter. 17. Aluminum smelter.
B. Industries manufacturing following products or carrying out following activities:-
1. Tyres and tubes Vulcanisation / Retreading / moulding. 2. Synthetic rubber. 3. Glass and fiber glass production and processing. 4. Industrial carbon including electrodes and graphite blocks, activated carbon, carbon black
etc. 5. Paints and varnishes (excluding blending / mixing). 6. Pigments and intermediates. 7. Synthetic resin. 8. Petroleum products, involving storage, transfer or processing. 9. Lubricating Oils, grease or petroleum – based products. 10. Synthetic fiber including rayon, tyre cord, polyester filament yarn. 11. Surgical and medical products involving prophylactics and latex. 12. Synthetic detergent and soap. 13. Photographic films and chemicals. 14. Chemical, petrochemical and electrochemicals including manufacture of acids such as
Sulphuric Acid, Nitric Acid, Phosphoric Acid etc. 15. Industrial or inorganic gases. 16. Chlorates, perchlorates and peroxides. 17. Glue and gelatine. 18. Yarn and textile processing involving scouring, bleaching, dyeing or any effluent / emission
generating process.
Annexure – I
State of Air Environment
Page 103
19. Vegetables oils including solvent extracted oils, hydro-generated ols. 20. Industry or process Involving metal treatment or process such as picking, surface coating,
paint baking, paint stripping, heat treatment phosphating or finishing etc. 21. Industry or process involving electroplating operations. 22. Asbestos and asbestos – based industries. 23. Slaughter houses and meat processing units. 24. Fermentation industry including manufacture of yeast, beer etc. 25. Steel and steel products including coke plants involving use of any of the equipment ’ s such
as blast furnaces, open hearth furnaces, induction furnace or arc furnace etc. or any of the operations or processes such as heat treatment, acid pickling, rolling or galvanizing etc.
26. Incineration plants. 27. Power generating plants (excluding D.G.Sets). 28. Lime manufacturing. 29. Tobacco products including cigarettes and tobacco processing. 30. Dry coal processing / Mineral processing industries like ore sintering, palletization etc. 31. Phosphate rock processing plants. 32. Coke making, coal liquefaction, coaltar distillation or flue gas making. 33. Phosphate and detonators, fuses etc. 34. Explosives including detonators, fuses etc. 35. Fire crackers. 36. Processes involving chlorinated hydrocarbons. 37. Chlorine, fluorine, bromine, iodine and their compounds. 38. Hydrocyanic acid and its derivatives. 39. Milk processing and dairy products (Integrated Project). 40. Industry or process involving foundry operations. 41. Potable alcohol (IMFL) by blending or distillation of alcohol. 42. Anodizing. 43. Ceramic / refractories. 44. Lead processing and battery reconditioning & manufacturing lead smelting. 45. Hot Mix plants. 46. Hospitals. 47. Mining and ore beneficiation.
II. List of Industries “ Orange ” Category.
1. Manufacture of mirror from sheet glass photo framing. 2. Cotton spinning and weaving. 3. Automobile servicing and repairs stations. 4. Hotels and restaurants. 5. Flour mills (excluding Domestic Aatta Chakki). 6. Malted food. 7. Food including fruits and vegetable processing. 8. Pulping and fermenting of coffee beans. 9. Instant tea/coffee, coffee processing. 10. Non – alcoholic beverages (soft drinks) 11. Fragrances and Industrial perfumes. 12. Food additives, nutrients and flavours. 13. Fish processing. 14. Organic nutrients. 15. Surgical & medical products not involving effluent / emission 16. Laboratory wares.
Annexure – I
State of Air Environment
Page 104
17. Wire drawing (cold process) and bailing straps. 18. Stone crushers. 19. Laboratory chemicals involving distillation, purification process. 20. Tyres and tubes vulcanization, vulcanization, retreading moulding. 21. Pesticides/insecticides/fungicides/herbicides/Agrochemical 22. NPK Fertilizers/Granulation. 23. Pharmaceutical formulation. 24. Khandsari Sugar. 25. Pulverizing units.
III. List of Industries under “ Green ” Category. A. Industries in Small Scale, Cottage / Village Category suggested under notification of the State Government / Union Territory for issuance of simplified NOC / Consent from State Pollution Control Board / Pollution Control Committee, as the case may be, B. Al those industries or processes which are not covered the “ Red ” and / or “ Orange ” category: An illustrative List is provided below.
1. Washing of used sand by hydraulic discharge. 2. Atta-chakkies. 3. Rice mullors. 4. Steeling and processing of grains. 5. Mineralized water. 6. Dal mills. 7. Bakery products, biscuits confectionery. 8. Groundnut decorticating.(dry). 9. Supari (Betelnut) & masala grinding. 10. Chilling plants & cold storages. 11. Ice-creams or Ice-cream making. 12. 2) Tailoring & garment making. 13. Cotton & woolen hosiery. 14. Apparel making. 15. Handloom weaving. 16. Shoelace manufacturing. 17. Gold & Silver thread zari work. 18. Gold and Silver smithy. 19. Leather footwear & leather products excluding tanning & hiding processing. 20. Musical instruments manufacturing. 21. Sports goods. 22. Bamboo & cane products (only dry operations). 23. Cardboard or corrugated box & paper products (paper or pulp manufacturing excluded). 24. Insulation & other coated papers (paper or pulp manufacturing excluded). 25. Scientific & mathematical appliances. 26. Furniture (wooden and steel). 27. Assembly of domestic electrical appliances. 28. Radio assembling. 29. Fountain pens. 30. Polythene, plastic and P.V.C. goods through extrusion moulding. 31. Rope (cotton & plastic)
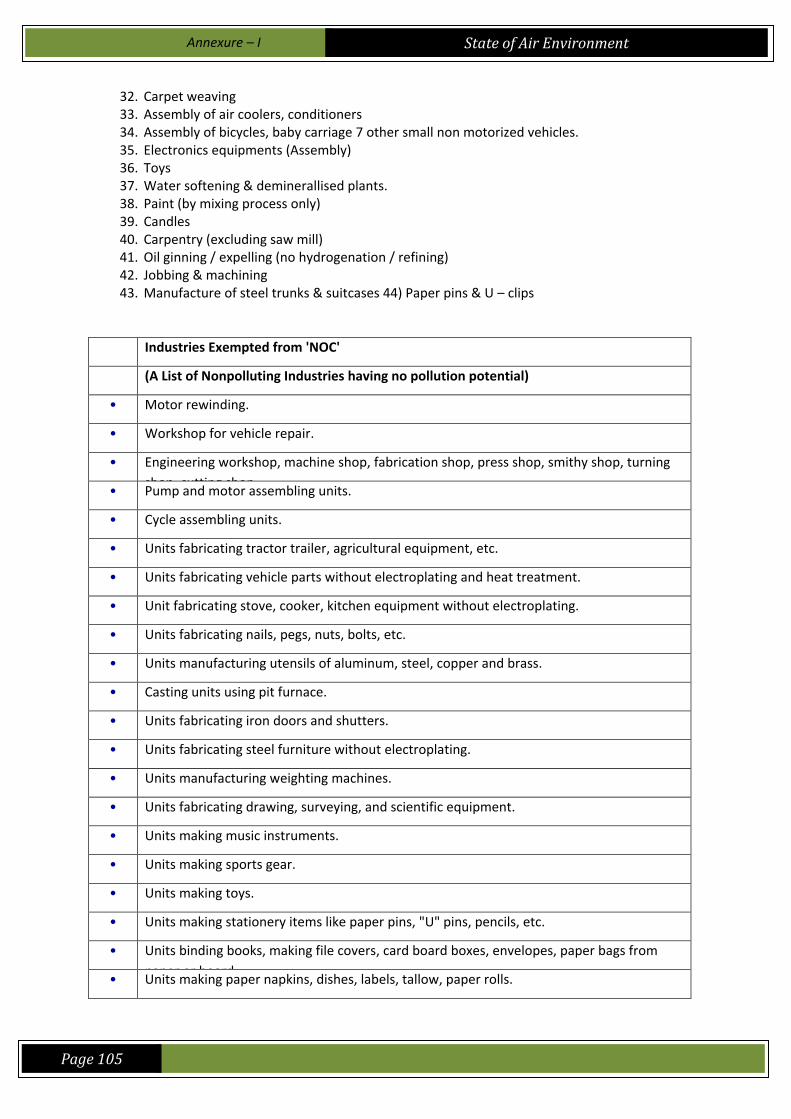
Annexure – I
State of Air Environment
Page 105
32. Carpet weaving 33. Assembly of air coolers, conditioners 34. Assembly of bicycles, baby carriage 7 other small non motorized vehicles. 35. Electronics equipments (Assembly) 36. Toys 37. Water softening & deminerallised plants. 38. Paint (by mixing process only) 39. Candles 40. Carpentry (excluding saw mill) 41. Oil ginning / expelling (no hydrogenation / refining) 42. Jobbing & machining 43. Manufacture of steel trunks & suitcases 44) Paper pins & U – clips
Industries Exempted from 'NOC'
(A List of Nonpolluting Industries having no pollution potential)
• Motor rewinding.
• Workshop for vehicle repair.
• Engineering workshop, machine shop, fabrication shop, press shop, smithy shop, turning
shop, cutting shop. • Pump and motor assembling units.
• Cycle assembling units.
• Units fabricating tractor trailer, agricultural equipment, etc.
• Units fabricating vehicle parts without electroplating and heat treatment.
• Unit fabricating stove, cooker, kitchen equipment without electroplating.
• Units fabricating nails, pegs, nuts, bolts, etc.
• Units manufacturing utensils of aluminum, steel, copper and brass.
• Casting units using pit furnace.
• Units fabricating iron doors and shutters.
• Units fabricating steel furniture without electroplating.
• Units manufacturing weighting machines.
• Units fabricating drawing, surveying, and scientific equipment.
• Units making music instruments.
• Units making sports gear.
• Units making toys.
• Units making stationery items like paper pins, "U" pins, pencils, etc.
• Units binding books, making file covers, card board boxes, envelopes, paper bags from
paper or board. • Units making paper napkins, dishes, labels, tallow, paper rolls.
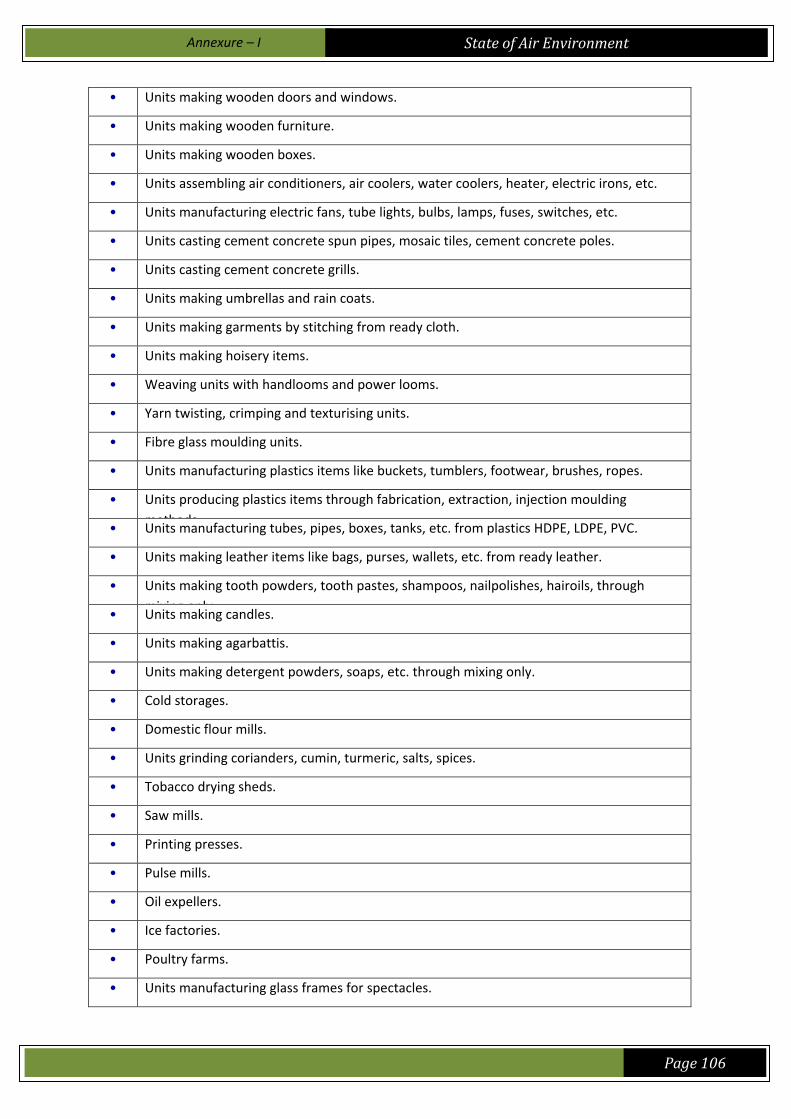
Annexure – I
State of Air Environment
Page 106
• Units making wooden doors and windows.
• Units making wooden furniture.
• Units making wooden boxes.
• Units assembling air conditioners, air coolers, water coolers, heater, electric irons, etc.
• Units manufacturing electric fans, tube lights, bulbs, lamps, fuses, switches, etc.
• Units casting cement concrete spun pipes, mosaic tiles, cement concrete poles.
• Units casting cement concrete grills.
• Units making umbrellas and rain coats.
• Units making garments by stitching from ready cloth.
• Units making hoisery items.
• Weaving units with handlooms and power looms.
• Yarn twisting, crimping and texturising units.
• Fibre glass moulding units.
• Units manufacturing plastics items like buckets, tumblers, footwear, brushes, ropes.
• Units producing plastics items through fabrication, extraction, injection moulding
methods. • Units manufacturing tubes, pipes, boxes, tanks, etc. from plastics HDPE, LDPE, PVC.
• Units making leather items like bags, purses, wallets, etc. from ready leather.
• Units making tooth powders, tooth pastes, shampoos, nailpolishes, hairoils, through
mixing only. • Units making candles.
• Units making agarbattis.
• Units making detergent powders, soaps, etc. through mixing only.
• Cold storages.
• Domestic flour mills.
• Units grinding corianders, cumin, turmeric, salts, spices.
• Tobacco drying sheds.
• Saw mills.
• Printing presses.
• Pulse mills.
• Oil expellers.
• Ice factories.
• Poultry farms.
• Units manufacturing glass frames for spectacles.
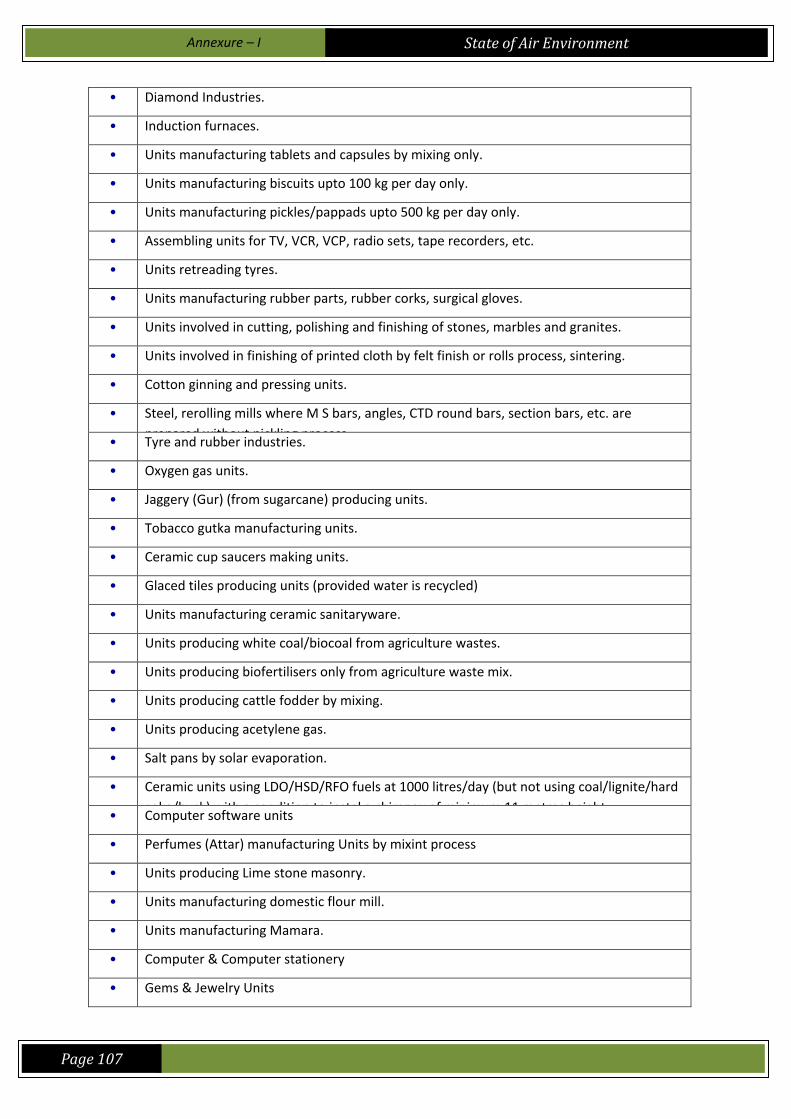
Annexure – I
State of Air Environment
Page 107
• Diamond Industries.
• Induction furnaces.
• Units manufacturing tablets and capsules by mixing only.
• Units manufacturing biscuits upto 100 kg per day only.
• Units manufacturing pickles/pappads upto 500 kg per day only.
• Assembling units for TV, VCR, VCP, radio sets, tape recorders, etc.
• Units retreading tyres.
• Units manufacturing rubber parts, rubber corks, surgical gloves.
• Units involved in cutting, polishing and finishing of stones, marbles and granites.
• Units involved in finishing of printed cloth by felt finish or rolls process, sintering.
• Cotton ginning and pressing units.
• Steel, rerolling mills where M S bars, angles, CTD round bars, section bars, etc. are
prepared without pickling process. • Tyre and rubber industries.
• Oxygen gas units.
• Jaggery (Gur) (from sugarcane) producing units.
• Tobacco gutka manufacturing units.
• Ceramic cup saucers making units.
• Glaced tiles producing units (provided water is recycled)
• Units manufacturing ceramic sanitaryware.
• Units producing white coal/biocoal from agriculture wastes.
• Units producing biofertilisers only from agriculture waste mix.
• Units producing cattle fodder by mixing.
• Units producing acetylene gas.
• Salt pans by solar evaporation.
• Ceramic units using LDO/HSD/RFO fuels at 1000 litres/day (but not using coal/lignite/hard
coke/husk) with a condition to instal a chimney of minimum 11 metres height. • Computer software units
• Perfumes (Attar) manufacturing Units by mixint process
• Units producing Lime stone masonry.
• Units manufacturing domestic flour mill.
• Units manufacturing Mamara.
• Computer & Computer stationery
• Gems & Jewelry Units
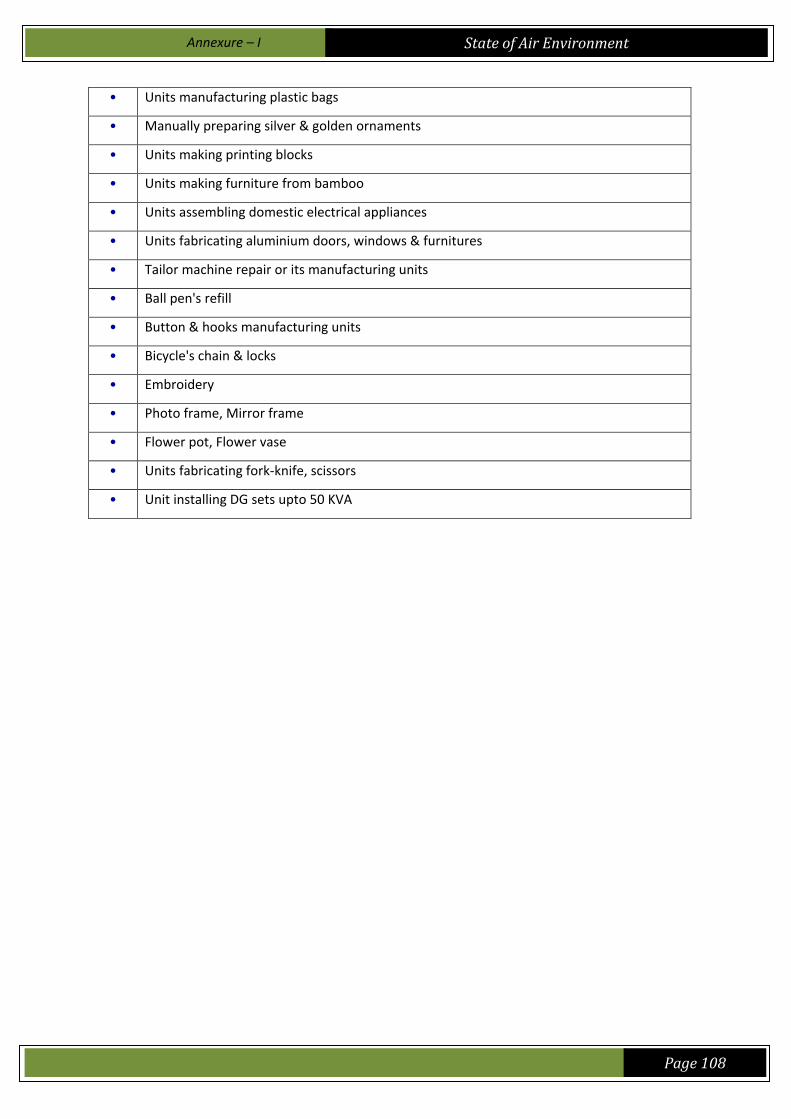
Annexure – I
State of Air Environment
Page 108
• Units manufacturing plastic bags
• Manually preparing silver & golden ornaments
• Units making printing blocks
• Units making furniture from bamboo
• Units assembling domestic electrical appliances
• Units fabricating aluminium doors, windows & furnitures
• Tailor machine repair or its manufacturing units
• Ball pen's refill
• Button & hooks manufacturing units
• Bicycle's chain & locks
• Embroidery
• Photo frame, Mirror frame
• Flower pot, Flower vase
• Units fabricating fork-knife, scissors
• Unit installing DG sets upto 50 KVA

Annexure – II
State of Air Environment
Page 109
ANNEXURE II
Ambient Air Quality Monitoring (Once in a year)
Trends in SO2
Sr. No. Location City District 6002 6002 6002 6002 6000
1 Kadi Char Rasta, Mehsana
Mehsana Mehsana 3.00 20.00 17.00 8.33 8.30
2 Modhera Char Rasta
Mehsana Mehsana 0.00 16.00 12.00 4.00 14.60
3 Char Rasta
Patan Patan 3.00 16.00 15.00 4.16 8.30
4 Himatnagar Nagarpalika
Himatnagar Sabarkantha 6.00 13.00 15.00 8.33 20.90
5 Nagarpalika Office Idar Sabarkantha 4.00 16.00 12.00 9.37 7.90
6 Nr. Vishram Gruh
Palanpur Banaskantha 4.00 15.00 12.00 6.24 12.50
7 Nr. Gandhi Lincon Hospital
Deesa Banaskantha 3.00 14.00 12.00 4.16 10.40
8 Cadila Laboratories, Narol
Ahmedabad Ahmedabad 13.00 5.00 11.00 10.41 9.00
9 LD Engg. College, Ahmedabad
Ahmedabad Ahmedabad 8.00 14.00 6.00 14.92 4.20
10 CETP, Vatva GIDC, Ahmedabad
Ahmedabad Ahmedabad 26.00 24.00 9.00 29.16 34.00
11 GIDC Office Naroda, Ahmedabad
Ahmedabad Ahmedabad 8.00 18.00 11.90 20.83 18.00
12 At CETP ,Odhav, Ahmedabad
Ahmedabad Ahmedabad 8.00 5.00 9.00 16.66 17.70
13 TPAEC, Sabarmati, Ahmedabad
Ahmedabad Ahmedabad 6.00 5.0 0
24.92 230.00 23.30
14 Karanj Police Station, Ahmedabad
Ahmedabad Ahmedabad 6.00 8.00 11.00 7.29 7.90
15 Gujarat Vidhyapith, Ahmedabad
Ahmedabad Ahmedabad 5.00 10.00 12.00 11.45 9.00
16 Bavla Nagarpalika
Bavla Ahmedabad 5.00 7.00 12.00 15.62 6.40
17 Viramgam Nagarpalika
Viramgam Ahmedabad 3.00 5.00 11.00 13.54 7.30
18 Rupam Chowk
Bhavnagar Bhavnagar 16.00 9.64 6.35 13.92 6.90
19 Nr. Primary School, Gandhi Road, Bajwa, Vadodara
Vadodara Vadodara 3.00 1.44 3.25 3.39 12.70
20 Community Health Centre, Padra, Vadodara
Vadodara Vadodara 1.00 4.34 0.00 6.78 0.20
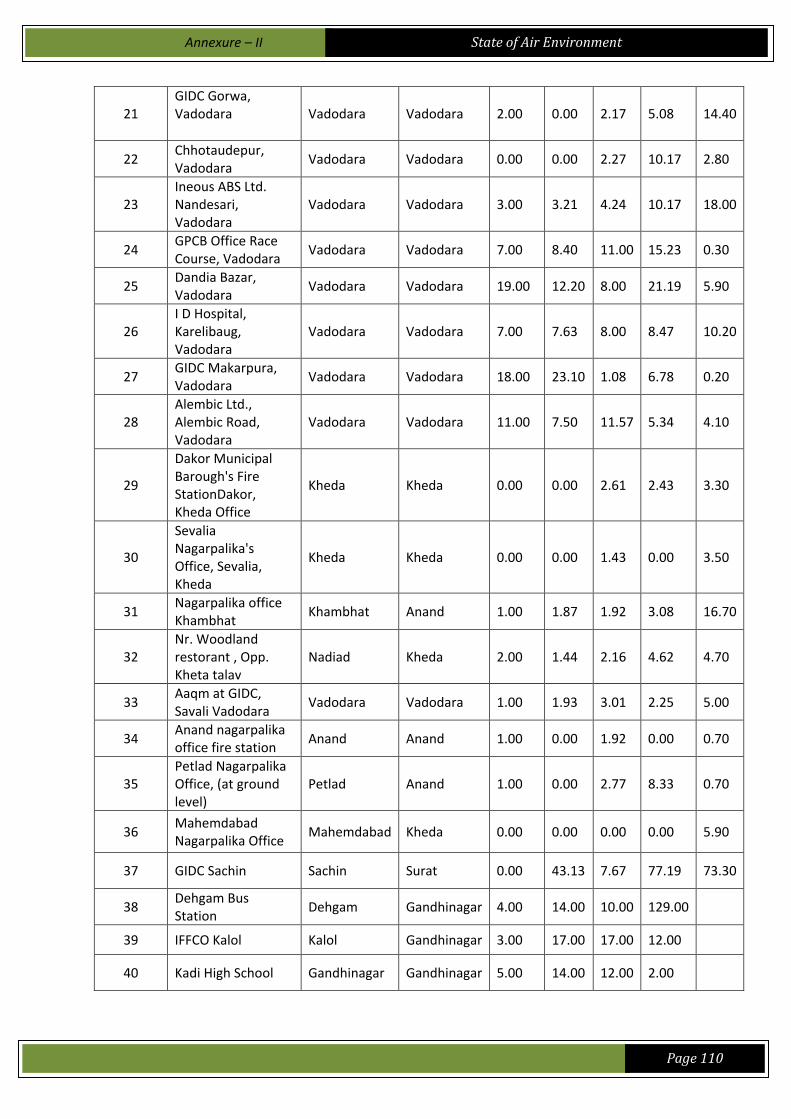
Annexure – II
State of Air Environment
Page 110
21 GIDC Gorwa, Vadodara
Vadodara Vadodara 2.00 0.00 2.17 5.08 14.40
22 Chhotaudepur, Vadodara
Vadodara Vadodara 0.00 0.00 2.27 10.17 2.80
23 Ineous ABS Ltd. Nandesari, Vadodara
Vadodara Vadodara 3.00 3.21 4.24 10.17 18.00
24 GPCB Office Race Course, Vadodara
Vadodara Vadodara 7.00 8.40 11.00 15.23 0.30
25 Dandia Bazar, Vadodara
Vadodara Vadodara 19.00 12.20 8.00 21.19 5.90
26 I D Hospital, Karelibaug, Vadodara
Vadodara Vadodara 7.00 7.63 8.00 8.47 10.20
27 GIDC Makarpura, Vadodara
Vadodara Vadodara 18.00 23.10 1.08 6.78 0.20
28 Alembic Ltd., Alembic Road, Vadodara
Vadodara Vadodara 11.00 7.50 11.57 5.34 4.10
29
Dakor Municipal Barough's Fire StationDakor, Kheda Office
Kheda Kheda 0.00 0.00 2.61 2.43 3.30
30
Sevalia Nagarpalika's Office, Sevalia, Kheda
Kheda Kheda 0.00 0.00 1.43 0.00 3.50
31 Nagarpalika office Khambhat
Khambhat Anand 1.00 1.87 1.92 3.08 16.70
32 Nr. Woodland restorant , Opp. Kheta talav
Nadiad Kheda 2.00 1.44 2.16 4.62 4.70
33 Aaqm at GIDC, Savali Vadodara
Vadodara Vadodara 1.00 1.93 3.01 2.25 5.00
34 Anand nagarpalika office fire station
Anand Anand 1.00 0.00 1.92 0.00 0.70
35 Petlad Nagarpalika Office, (at ground level)
Petlad Anand 1.00 0.00 2.77 8.33 0.70
36 Mahemdabad Nagarpalika Office
Mahemdabad Kheda 0.00 0.00 0.00 0.00 5.90
37 GIDC Sachin Sachin Surat 0.00 43.13 7.67 77.19 73.30
38 Dehgam Bus Station
Dehgam Gandhinagar 4.00 14.00 10.00 129.00
39 IFFCO Kalol Kalol Gandhinagar 3.00 17.00 17.00 12.00
40 Kadi High School Gandhinagar Gandhinagar 5.00 14.00 12.00 2.00
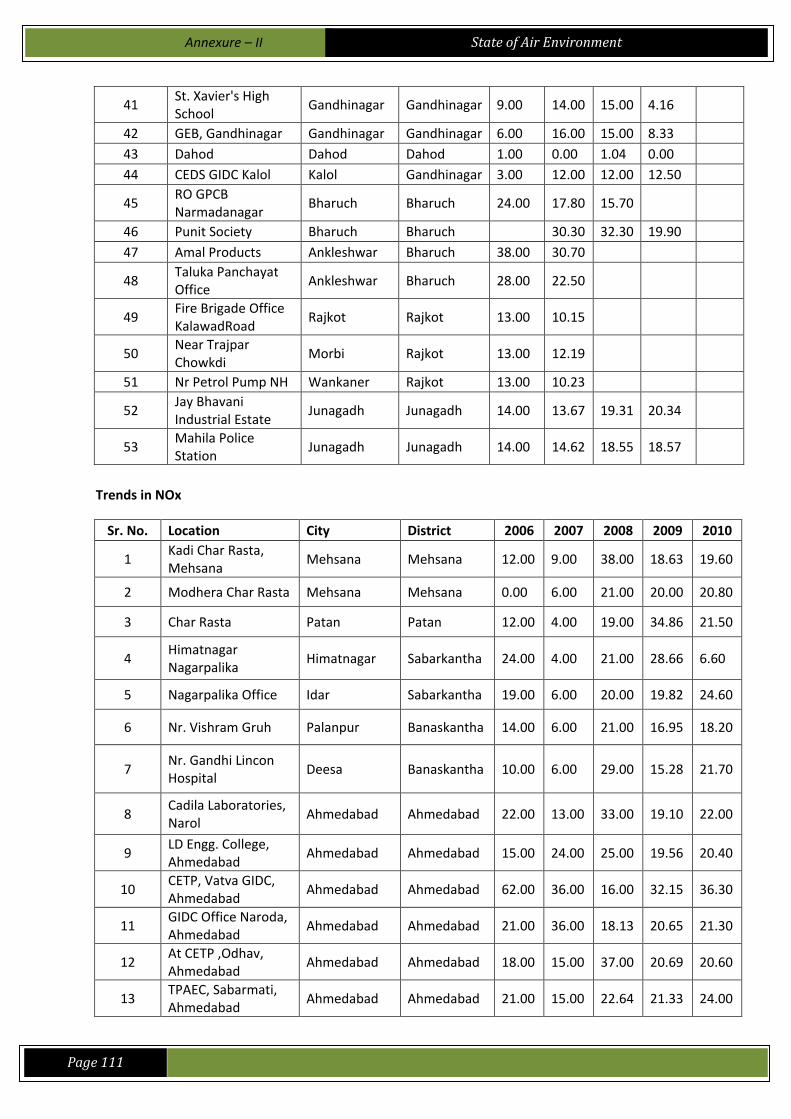
Annexure – II
State of Air Environment
Page 111
41 St. Xavier's High School
Gandhinagar Gandhinagar 9.00 14.00 15.00 4.16
42 GEB, Gandhinagar Gandhinagar Gandhinagar 6.00 16.00 15.00 8.33
43 Dahod Dahod Dahod 1.00 0.00 1.04 0.00
44 CEDS GIDC Kalol Kalol Gandhinagar 3.00 12.00 12.00 12.50
45 RO GPCB Narmadanagar
Bharuch Bharuch 24.00 17.80 15.70
46 Punit Society Bharuch Bharuch 30.30 32.30 19.90
47 Amal Products Ankleshwar Bharuch 38.00 30.70
48 Taluka Panchayat Office
Ankleshwar Bharuch 28.00 22.50
49 Fire Brigade Office KalawadRoad
Rajkot Rajkot 13.00 10.15
50 Near Trajpar Chowkdi
Morbi Rajkot 13.00 12.19
51 Nr Petrol Pump NH Wankaner Rajkot 13.00 10.23
52 Jay Bhavani Industrial Estate
Junagadh Junagadh 14.00 13.67 19.31 20.34
53 Mahila Police Station
Junagadh Junagadh 14.00 14.62 18.55 18.57
Trends in NOx
Sr. No. Location City District 6002 6002 6002 6002 6000
1 Kadi Char Rasta, Mehsana
Mehsana Mehsana 12.00 9.00 38.00 18.63 19.60
2 Modhera Char Rasta Mehsana Mehsana 0.00 6.00 21.00 20.00 20.80
3 Char Rasta Patan Patan 12.00 4.00 19.00 34.86 21.50
4 Himatnagar Nagarpalika
Himatnagar Sabarkantha 24.00 4.00 21.00 28.66 6.60
5 Nagarpalika Office Idar Sabarkantha 19.00 6.00 20.00 19.82 24.60
6 Nr. Vishram Gruh Palanpur Banaskantha 14.00 6.00 21.00 16.95 18.20
7 Nr. Gandhi Lincon Hospital
Deesa Banaskantha 10.00 6.00 29.00 15.28 21.70
8 Cadila Laboratories, Narol
Ahmedabad Ahmedabad 22.00 13.00 33.00 19.10 22.00
9 LD Engg. College, Ahmedabad
Ahmedabad Ahmedabad 15.00 24.00 25.00 19.56 20.40
10 CETP, Vatva GIDC, Ahmedabad
Ahmedabad Ahmedabad 62.00 36.00 16.00 32.15 36.30
11 GIDC Office Naroda, Ahmedabad
Ahmedabad Ahmedabad 21.00 36.00 18.13 20.65 21.30
12 At CETP ,Odhav, Ahmedabad
Ahmedabad Ahmedabad 18.00 15.00 37.00 20.69 20.60
13 TPAEC, Sabarmati, Ahmedabad
Ahmedabad Ahmedabad 21.00 15.00 22.64 21.33 24.00
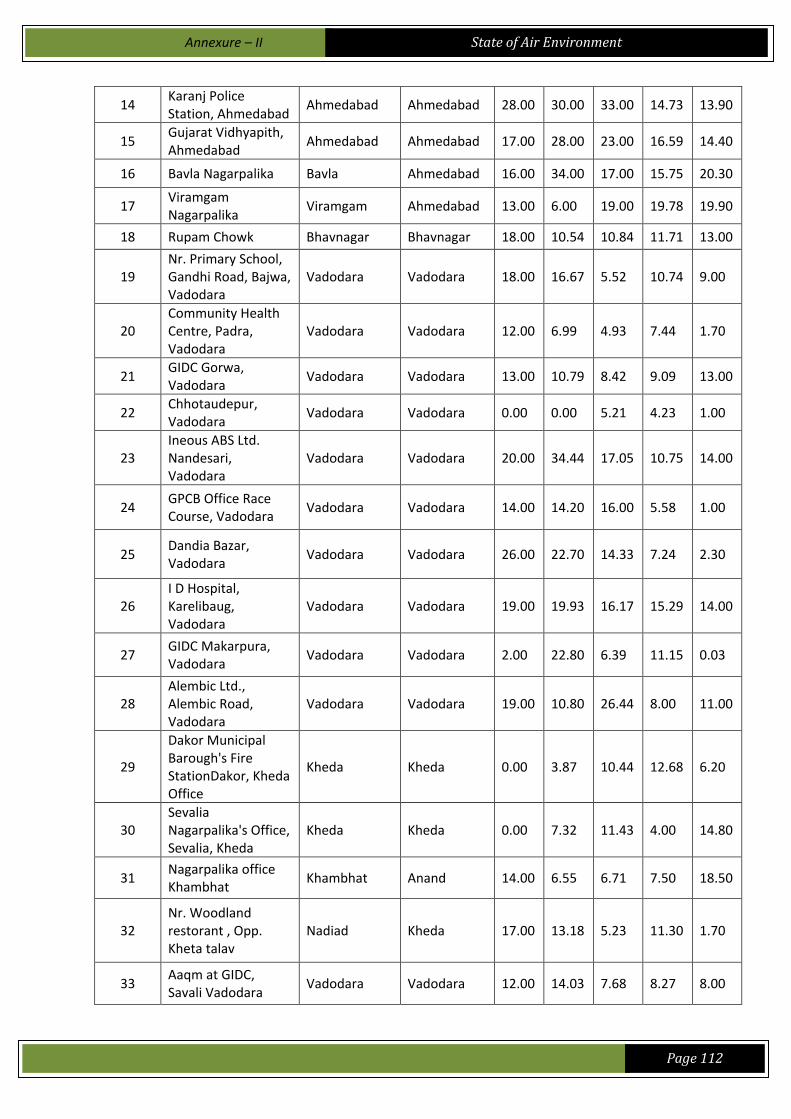
Annexure – II
State of Air Environment
Page 112
14 Karanj Police Station, Ahmedabad
Ahmedabad Ahmedabad 28.00 30.00 33.00 14.73 13.90
15 Gujarat Vidhyapith, Ahmedabad
Ahmedabad Ahmedabad 17.00 28.00 23.00 16.59 14.40
16 Bavla Nagarpalika Bavla Ahmedabad 16.00 34.00 17.00 15.75 20.30
17 Viramgam Nagarpalika
Viramgam Ahmedabad 13.00 6.00 19.00 19.78 19.90
18 Rupam Chowk Bhavnagar Bhavnagar 18.00 10.54 10.84 11.71 13.00
19 Nr. Primary School, Gandhi Road, Bajwa, Vadodara
Vadodara Vadodara 18.00 16.67 5.52 10.74 9.00
20 Community Health Centre, Padra, Vadodara
Vadodara Vadodara 12.00 6.99 4.93 7.44 1.70
21 GIDC Gorwa, Vadodara
Vadodara Vadodara 13.00 10.79 8.42 9.09 13.00
22 Chhotaudepur, Vadodara
Vadodara Vadodara 0.00 0.00 5.21 4.23 1.00
23 Ineous ABS Ltd. Nandesari, Vadodara
Vadodara Vadodara 20.00 34.44 17.05 10.75 14.00
24 GPCB Office Race Course, Vadodara
Vadodara Vadodara 14.00 14.20 16.00 5.58 1.00
25 Dandia Bazar, Vadodara
Vadodara Vadodara 26.00 22.70 14.33 7.24 2.30
26 I D Hospital, Karelibaug, Vadodara
Vadodara Vadodara 19.00 19.93 16.17 15.29 14.00
27 GIDC Makarpura, Vadodara
Vadodara Vadodara 2.00 22.80 6.39 11.15 0.03
28 Alembic Ltd., Alembic Road, Vadodara
Vadodara Vadodara 19.00 10.80 26.44 8.00 11.00
29
Dakor Municipal Barough's Fire StationDakor, Kheda Office
Kheda Kheda 0.00 3.87 10.44 12.68 6.20
30 Sevalia Nagarpalika's Office, Sevalia, Kheda
Kheda Kheda 0.00 7.32 11.43 4.00 14.80
31 Nagarpalika office Khambhat
Khambhat Anand 14.00 6.55 6.71 7.50 18.50
32 Nr. Woodland restorant , Opp. Kheta talav
Nadiad Kheda 17.00 13.18 5.23 11.30 1.70
33 Aaqm at GIDC, Savali Vadodara
Vadodara Vadodara 12.00 14.03 7.68 8.27 8.00
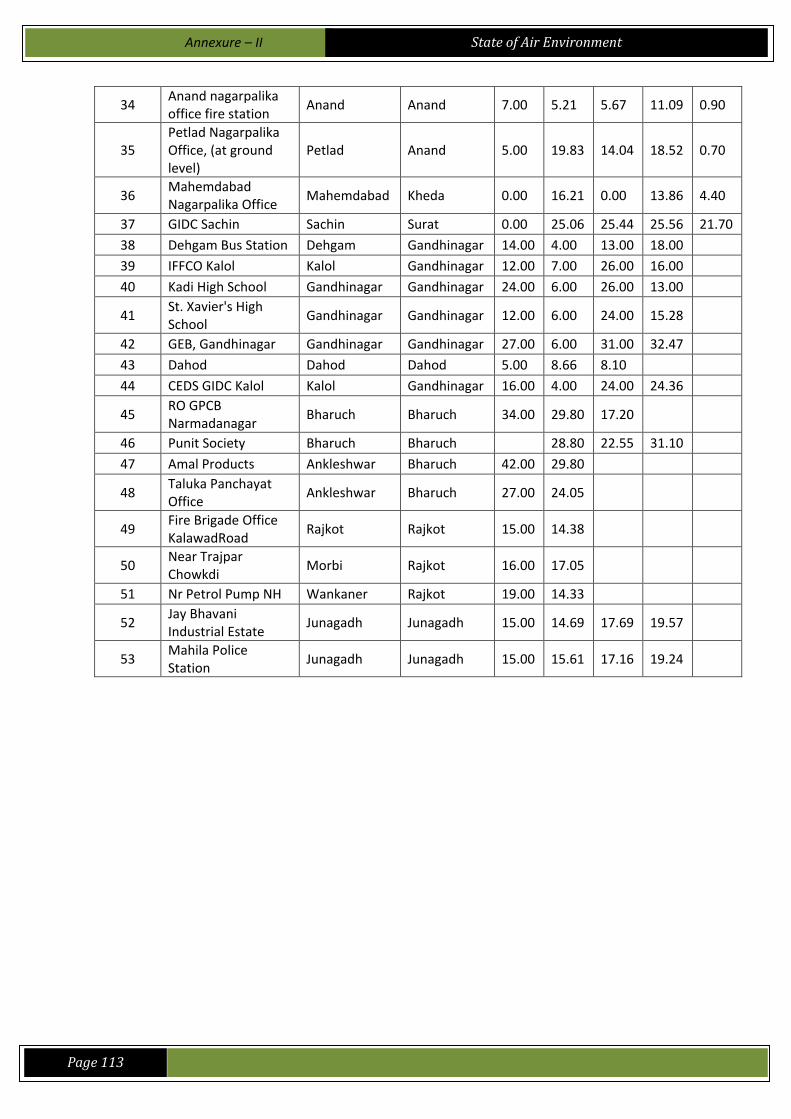
Annexure – II
State of Air Environment
Page 113
34 Anand nagarpalika office fire station
Anand Anand 7.00 5.21 5.67 11.09 0.90
35 Petlad Nagarpalika Office, (at ground level)
Petlad Anand 5.00 19.83 14.04 18.52 0.70
36 Mahemdabad Nagarpalika Office
Mahemdabad Kheda 0.00 16.21 0.00 13.86 4.40
37 GIDC Sachin Sachin Surat 0.00 25.06 25.44 25.56 21.70
38 Dehgam Bus Station Dehgam Gandhinagar 14.00 4.00 13.00 18.00
39 IFFCO Kalol Kalol Gandhinagar 12.00 7.00 26.00 16.00
40 Kadi High School Gandhinagar Gandhinagar 24.00 6.00 26.00 13.00
41 St. Xavier's High School
Gandhinagar Gandhinagar 12.00 6.00 24.00 15.28
42 GEB, Gandhinagar Gandhinagar Gandhinagar 27.00 6.00 31.00 32.47
43 Dahod Dahod Dahod 5.00 8.66 8.10
44 CEDS GIDC Kalol Kalol Gandhinagar 16.00 4.00 24.00 24.36
45 RO GPCB Narmadanagar
Bharuch Bharuch 34.00 29.80 17.20
46 Punit Society Bharuch Bharuch 28.80 22.55 31.10
47 Amal Products Ankleshwar Bharuch 42.00 29.80
48 Taluka Panchayat Office
Ankleshwar Bharuch 27.00 24.05
49 Fire Brigade Office KalawadRoad
Rajkot Rajkot 15.00 14.38
50 Near Trajpar Chowkdi
Morbi Rajkot 16.00 17.05
51 Nr Petrol Pump NH Wankaner Rajkot 19.00 14.33
52 Jay Bhavani Industrial Estate
Junagadh Junagadh 15.00 14.69 17.69 19.57
53 Mahila Police Station
Junagadh Junagadh 15.00 15.61 17.16 19.24
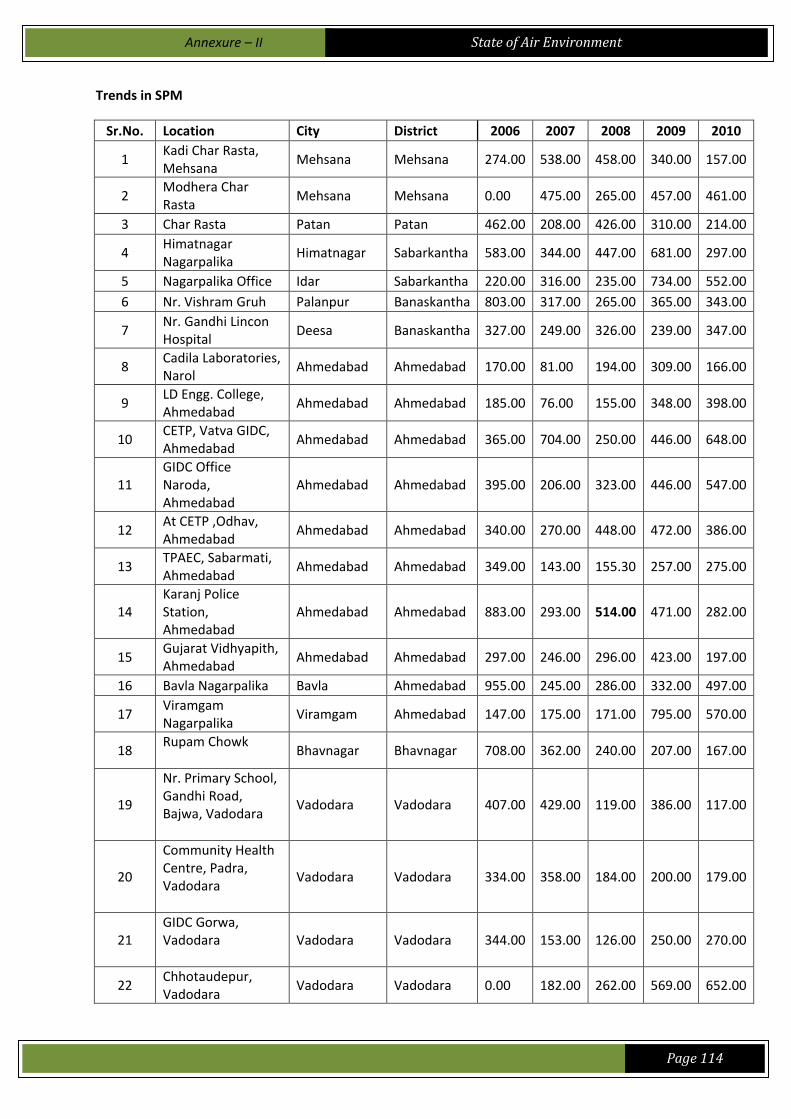
Annexure – II
State of Air Environment
Page 114
Trends in SPM
Sr.No. Location City District 6002 6002 6002 6002 6000
1 Kadi Char Rasta, Mehsana
Mehsana Mehsana 274.00 538.00 458.00 340.00 157.00
2 Modhera Char Rasta
Mehsana Mehsana 0.00 475.00 265.00 457.00 461.00
3 Char Rasta Patan Patan 462.00 208.00 426.00 310.00 214.00
4 Himatnagar Nagarpalika
Himatnagar Sabarkantha 583.00 344.00 447.00 681.00 297.00
5 Nagarpalika Office Idar Sabarkantha 220.00 316.00 235.00 734.00 552.00
6 Nr. Vishram Gruh Palanpur Banaskantha 803.00 317.00 265.00 365.00 343.00
7 Nr. Gandhi Lincon Hospital
Deesa Banaskantha 327.00 249.00 326.00 239.00 347.00
8 Cadila Laboratories, Narol
Ahmedabad Ahmedabad 170.00 81.00 194.00 309.00 166.00
9 LD Engg. College, Ahmedabad
Ahmedabad Ahmedabad 185.00 76.00 155.00 348.00 398.00
10 CETP, Vatva GIDC, Ahmedabad
Ahmedabad Ahmedabad 365.00 704.00 250.00 446.00 648.00
11 GIDC Office Naroda, Ahmedabad
Ahmedabad Ahmedabad 395.00 206.00 323.00 446.00 547.00
12 At CETP ,Odhav, Ahmedabad
Ahmedabad Ahmedabad 340.00 270.00 448.00 472.00 386.00
13 TPAEC, Sabarmati, Ahmedabad
Ahmedabad Ahmedabad 349.00 143.00 155.30 257.00 275.00
14 Karanj Police Station, Ahmedabad
Ahmedabad Ahmedabad 883.00 293.00 514.00 471.00 282.00
15 Gujarat Vidhyapith, Ahmedabad
Ahmedabad Ahmedabad 297.00 246.00 296.00 423.00 197.00
16 Bavla Nagarpalika Bavla Ahmedabad 955.00 245.00 286.00 332.00 497.00
17 Viramgam Nagarpalika
Viramgam Ahmedabad 147.00 175.00 171.00 795.00 570.00
18 Rupam Chowk
Bhavnagar Bhavnagar 708.00 362.00 240.00 207.00 167.00
19
Nr. Primary School, Gandhi Road, Bajwa, Vadodara
Vadodara Vadodara 407.00 429.00 119.00 386.00 117.00
20
Community Health Centre, Padra, Vadodara
Vadodara Vadodara 334.00 358.00 184.00 200.00 179.00
21 GIDC Gorwa, Vadodara
Vadodara Vadodara 344.00 153.00 126.00 250.00 270.00
22 Chhotaudepur, Vadodara
Vadodara Vadodara 0.00 182.00 262.00 569.00 652.00
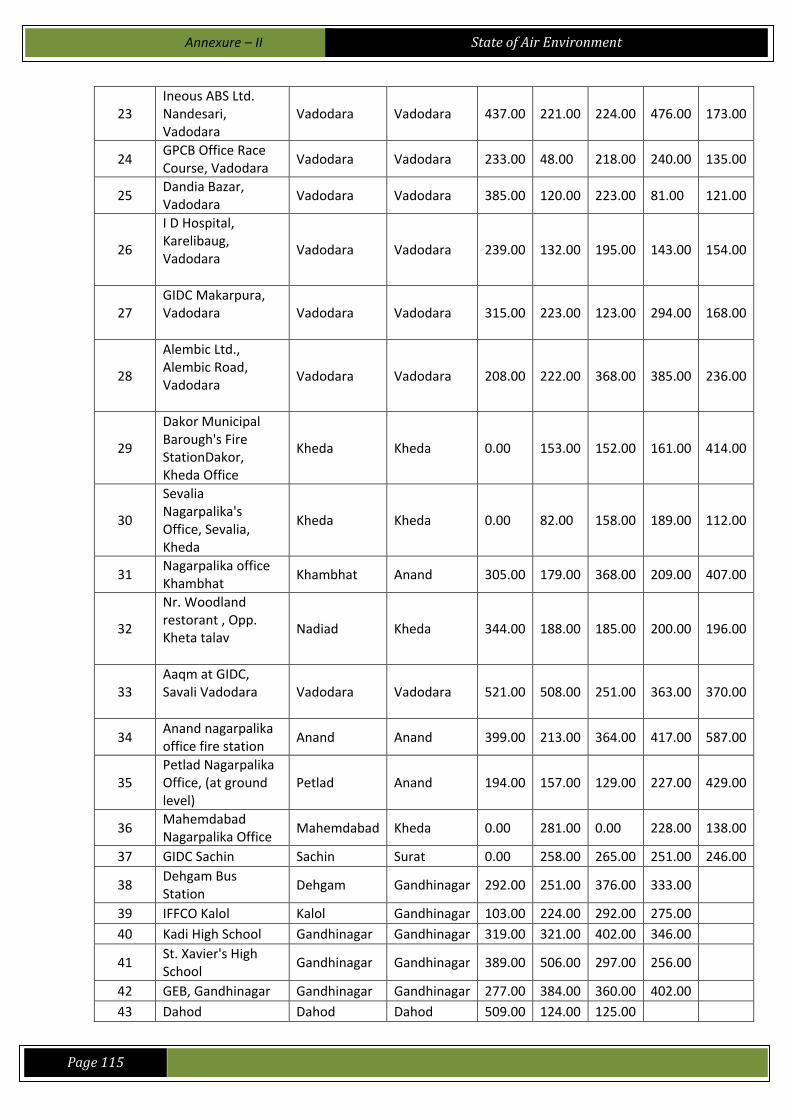
Annexure – II
State of Air Environment
Page 115
23 Ineous ABS Ltd. Nandesari, Vadodara
Vadodara Vadodara 437.00 221.00 224.00 476.00 173.00
24 GPCB Office Race Course, Vadodara
Vadodara Vadodara 233.00 48.00 218.00 240.00 135.00
25 Dandia Bazar, Vadodara
Vadodara Vadodara 385.00 120.00 223.00 81.00 121.00
26
I D Hospital, Karelibaug, Vadodara
Vadodara Vadodara 239.00 132.00 195.00 143.00 154.00
27 GIDC Makarpura, Vadodara
Vadodara Vadodara 315.00 223.00 123.00 294.00 168.00
28
Alembic Ltd., Alembic Road, Vadodara
Vadodara Vadodara 208.00 222.00 368.00 385.00 236.00
29
Dakor Municipal Barough's Fire StationDakor, Kheda Office
Kheda Kheda 0.00 153.00 152.00 161.00 414.00
30
Sevalia Nagarpalika's Office, Sevalia, Kheda
Kheda Kheda 0.00 82.00 158.00 189.00 112.00
31 Nagarpalika office Khambhat
Khambhat Anand 305.00 179.00 368.00 209.00 407.00
32
Nr. Woodland restorant , Opp. Kheta talav
Nadiad Kheda 344.00 188.00 185.00 200.00 196.00
33 Aaqm at GIDC, Savali Vadodara
Vadodara Vadodara 521.00 508.00 251.00 363.00 370.00
34 Anand nagarpalika office fire station
Anand Anand 399.00 213.00 364.00 417.00 587.00
35 Petlad Nagarpalika Office, (at ground level)
Petlad Anand 194.00 157.00 129.00 227.00 429.00
36 Mahemdabad Nagarpalika Office
Mahemdabad Kheda 0.00 281.00 0.00 228.00 138.00
37 GIDC Sachin Sachin Surat 0.00 258.00 265.00 251.00 246.00
38 Dehgam Bus Station
Dehgam Gandhinagar 292.00 251.00 376.00 333.00
39 IFFCO Kalol Kalol Gandhinagar 103.00 224.00 292.00 275.00
40 Kadi High School Gandhinagar Gandhinagar 319.00 321.00 402.00 346.00
41 St. Xavier's High School
Gandhinagar Gandhinagar 389.00 506.00 297.00 256.00
42 GEB, Gandhinagar Gandhinagar Gandhinagar 277.00 384.00 360.00 402.00
43 Dahod Dahod Dahod 509.00 124.00 125.00
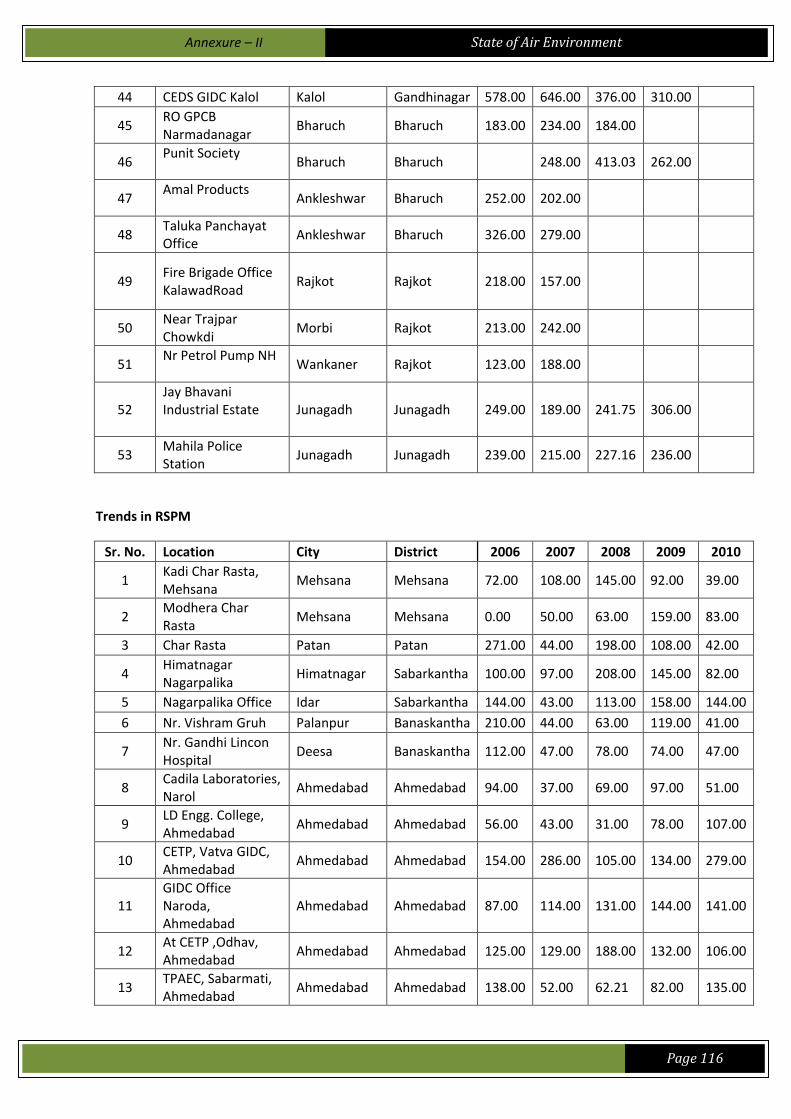
Annexure – II
State of Air Environment
Page 116
44 CEDS GIDC Kalol Kalol Gandhinagar 578.00 646.00 376.00 310.00
45 RO GPCB Narmadanagar
Bharuch Bharuch 183.00 234.00 184.00
46 Punit Society
Bharuch Bharuch 248.00 413.03 262.00
47 Amal Products
Ankleshwar Bharuch 252.00 202.00
48 Taluka Panchayat Office
Ankleshwar Bharuch 326.00 279.00
49 Fire Brigade Office KalawadRoad
Rajkot Rajkot 218.00 157.00
50 Near Trajpar Chowkdi
Morbi Rajkot 213.00 242.00
51 Nr Petrol Pump NH
Wankaner Rajkot 123.00 188.00
52 Jay Bhavani Industrial Estate
Junagadh Junagadh 249.00 189.00 241.75 306.00
53 Mahila Police Station
Junagadh Junagadh 239.00 215.00 227.16 236.00
Trends in RSPM
Sr. No. Location City District 6002 6002 6002 6002 6000
1 Kadi Char Rasta, Mehsana
Mehsana Mehsana 72.00 108.00 145.00 92.00 39.00
2 Modhera Char Rasta
Mehsana Mehsana 0.00 50.00 63.00 159.00 83.00
3 Char Rasta Patan Patan 271.00 44.00 198.00 108.00 42.00
4 Himatnagar Nagarpalika
Himatnagar Sabarkantha 100.00 97.00 208.00 145.00 82.00
5 Nagarpalika Office Idar Sabarkantha 144.00 43.00 113.00 158.00 144.00
6 Nr. Vishram Gruh Palanpur Banaskantha 210.00 44.00 63.00 119.00 41.00
7 Nr. Gandhi Lincon Hospital
Deesa Banaskantha 112.00 47.00 78.00 74.00 47.00
8 Cadila Laboratories, Narol
Ahmedabad Ahmedabad 94.00 37.00 69.00 97.00 51.00
9 LD Engg. College, Ahmedabad
Ahmedabad Ahmedabad 56.00 43.00 31.00 78.00 107.00
10 CETP, Vatva GIDC, Ahmedabad
Ahmedabad Ahmedabad 154.00 286.00 105.00 134.00 279.00
11 GIDC Office Naroda, Ahmedabad
Ahmedabad Ahmedabad 87.00 114.00 131.00 144.00 141.00
12 At CETP ,Odhav, Ahmedabad
Ahmedabad Ahmedabad 125.00 129.00 188.00 132.00 106.00
13 TPAEC, Sabarmati, Ahmedabad
Ahmedabad Ahmedabad 138.00 52.00 62.21 82.00 135.00
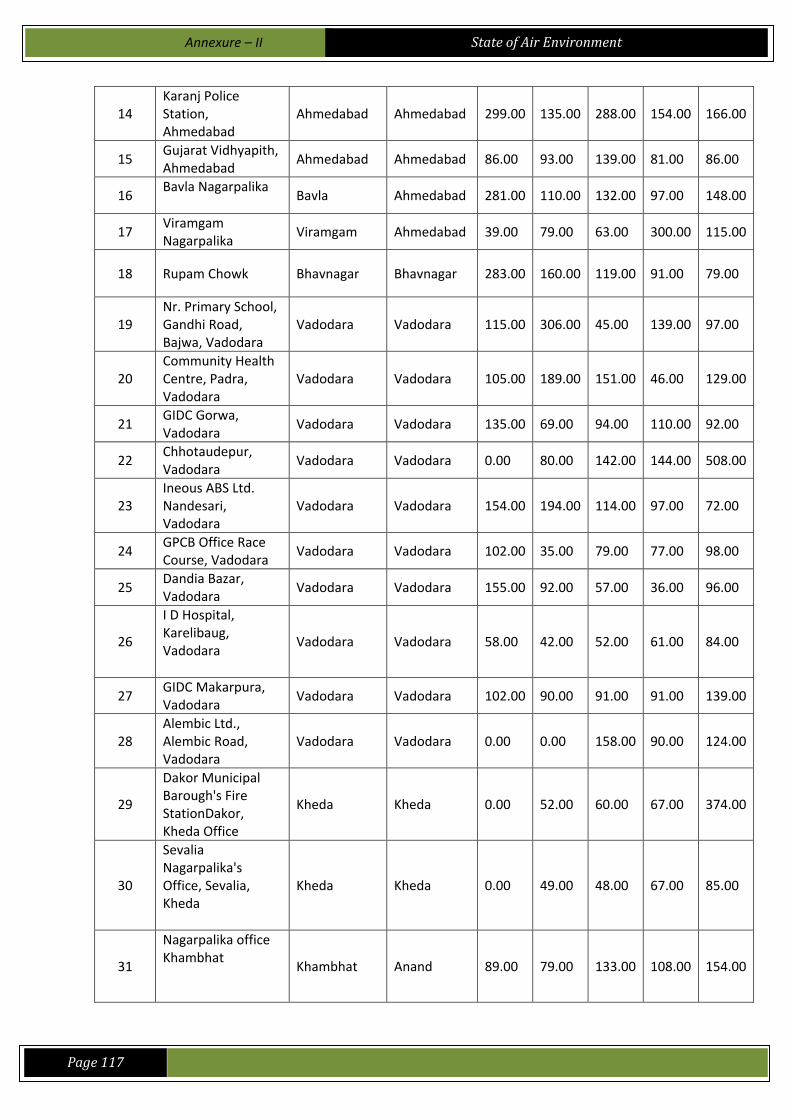
Annexure – II
State of Air Environment
Page 117
14 Karanj Police Station, Ahmedabad
Ahmedabad Ahmedabad 299.00 135.00 288.00 154.00 166.00
15 Gujarat Vidhyapith, Ahmedabad
Ahmedabad Ahmedabad 86.00 93.00 139.00 81.00 86.00
16 Bavla Nagarpalika
Bavla Ahmedabad 281.00 110.00 132.00 97.00 148.00
17 Viramgam Nagarpalika
Viramgam Ahmedabad 39.00 79.00 63.00 300.00 115.00
18 Rupam Chowk Bhavnagar Bhavnagar 283.00 160.00 119.00 91.00 79.00
19 Nr. Primary School, Gandhi Road, Bajwa, Vadodara
Vadodara Vadodara 115.00 306.00 45.00 139.00 97.00
20 Community Health Centre, Padra, Vadodara
Vadodara Vadodara 105.00 189.00 151.00 46.00 129.00
21 GIDC Gorwa, Vadodara
Vadodara Vadodara 135.00 69.00 94.00 110.00 92.00
22 Chhotaudepur, Vadodara
Vadodara Vadodara 0.00 80.00 142.00 144.00 508.00
23 Ineous ABS Ltd. Nandesari, Vadodara
Vadodara Vadodara 154.00 194.00 114.00 97.00 72.00
24 GPCB Office Race Course, Vadodara
Vadodara Vadodara 102.00 35.00 79.00 77.00 98.00
25 Dandia Bazar, Vadodara
Vadodara Vadodara 155.00 92.00 57.00 36.00 96.00
26
I D Hospital, Karelibaug, Vadodara
Vadodara Vadodara 58.00 42.00 52.00 61.00 84.00
27 GIDC Makarpura, Vadodara
Vadodara Vadodara 102.00 90.00 91.00 91.00 139.00
28 Alembic Ltd., Alembic Road, Vadodara
Vadodara Vadodara 0.00 0.00 158.00 90.00 124.00
29
Dakor Municipal Barough's Fire StationDakor, Kheda Office
Kheda Kheda 0.00 52.00 60.00 67.00 374.00
30
Sevalia Nagarpalika's Office, Sevalia, Kheda
Kheda Kheda 0.00 49.00 48.00 67.00 85.00
31
Nagarpalika office Khambhat
Khambhat Anand 89.00 79.00 133.00 108.00 154.00

Annexure – II
State of Air Environment
Page 118
32 Nr. Woodland restorant , Opp. Kheta talav
Nadiad Kheda 159.00 115.00 100.00 106.00 44.00
33 Aaqm at GIDC, Savali Vadodara
Vadodara Vadodara 279.00 285.00 131.00 144.00 90.00
34 Anand nagarpalika office fire station
Anand Anand 107.00 191.00 212.00 119.00 227.00
35 Petlad Nagarpalika Office, (at ground level)
Petlad Anand 91.00 107.00 73.00 174.00 109.00
36 Mahemdabad Nagarpalika Office
Mahemdabad Kheda 0.00 125.00 0.00 39.00 60.00
37 GIDC Sachin Sachin Surat 0.00 125.00 135.00 125.00 111.00
38 Dehgam Bus Station
Dehgam Gandhinagar 63.00 35.00 132.00 129.00
39 IFFCO Kalol Kalol Gandhinagar 38.00 56.00 88.00 50.00
40 Kadi High School Gandhinagar Gandhinagar 137.00 87.00 261.00 76.00
41 St. Xavier's High School
Gandhinagar Gandhinagar 81.00 158.00 88.00 94.00
42 GEB, Gandhinagar Gandhinagar Gandhinagar 113.00 66.00 95.00 151.00
43 Dahod Dahod Dahod 206.00 116.00 81.00
44 CEDS GIDC Kalol Kalol Gandhinagar 147.00 74.00 183.00 83.00
45 RO GPCB Narmadanagar
Bharuch Bharuch 115.00 124.00 85.00
46 Punit Society Bharuch Bharuch 122.00 118.40 118.00
47 Amal Products Ankleshwar Bharuch 137.00 93.00
48 Taluka Panchayat Office
Ankleshwar Bharuch 141.00 132.00
49 Fire Brigade Office KalawadRoad
Rajkot Rajkot 162.00 84.00
50 Near Trajpar Chowkdi
Morbi Rajkot 155.00 136.00
51 Nr Petrol Pump NH Wankaner Rajkot 67.00 103.00
52 Jay Bhavani Industrial Estate
Junagadh Junagadh 195.00 121.00 129.50 156.00
53 Mahila Police Station
Junagadh Junagadh 180.00 145.00 122.40 100.00
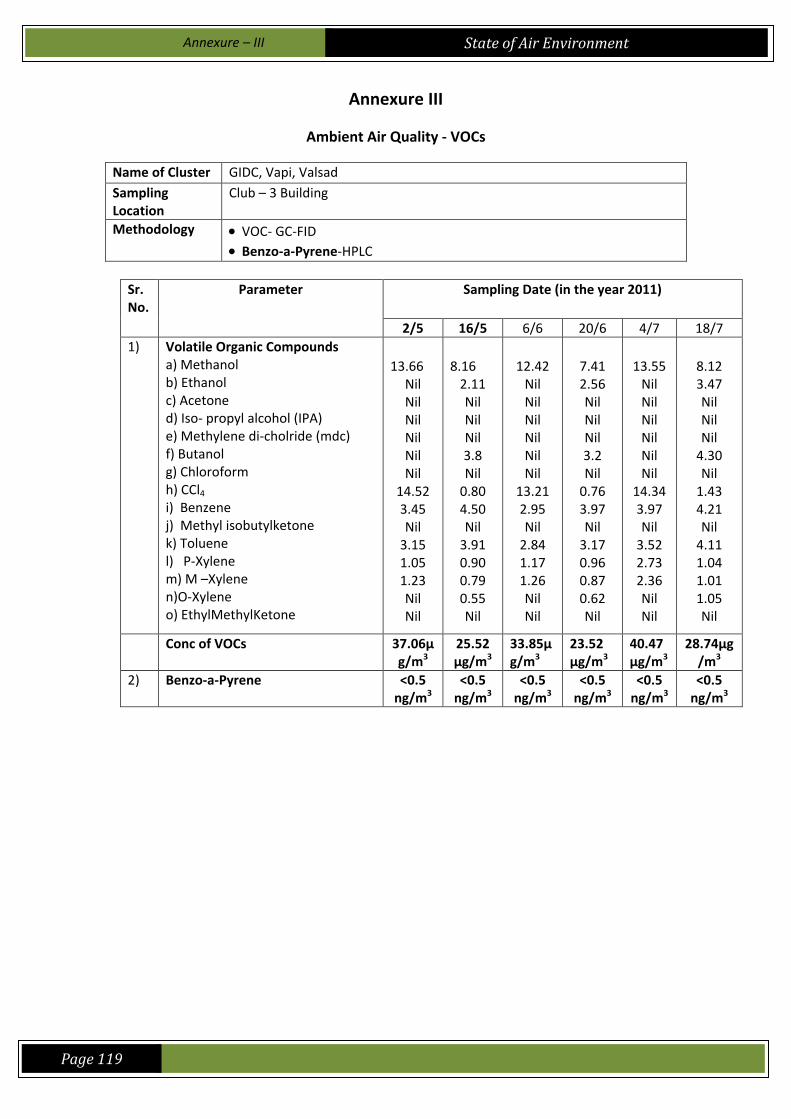
Annexure – III
State of Air Environment
Page 119
Annexure III
Ambient Air Quality - VOCs
Name of Cluster GIDC, Vapi, Valsad
Sampling Location
Club – 3 Building
Methodology VOC- GC-FID Benzo-a-Pyrene-HPLC
Sr. No.
Parameter Sampling Date (in the year 2011)
2/5 16/5 6/6 20/6 4/7 18/7 1) Volatile Organic Compounds
a) Methanol b) Ethanol c) Acetone d) Iso- propyl alcohol (IPA) e) Methylene di-cholride (mdc) f) Butanol g) Chloroform h) CCl4 i) Benzene j) Methyl isobutylketone k) Toluene l) P-Xylene m) M –Xylene n)O-Xylene o) EthylMethylKetone
13.66
Nil Nil Nil Nil Nil Nil
14.52 3.45 Nil
3.15 1.05 1.23 Nil Nil
8.16
2.11 Nil Nil Nil 3.8 Nil
0.80 4.50 Nil
3.91 0.90 0.79 0.55 Nil
12.42
Nil Nil Nil Nil Nil Nil
13.21 2.95 Nil
2.84 1.17 1.26 Nil Nil
7.41 2.56 Nil Nil Nil 3.2 Nil
0.76 3.97 Nil
3.17 0.96 0.87 0.62 Nil
13.55
Nil Nil Nil Nil Nil Nil
14.34 3.97 Nil
3.52 2.73 2.36 Nil Nil
8.12 3.47 Nil Nil Nil
4.30 Nil
1.43 4.21 Nil
4.11 1.04 1.01 1.05 Nil
Conc of VOCs 37.06μg/m3
25.52 μg/m3
33.85μg/m3
23.52 μg/m3
40.47 μg/m3
28.74μg/m3
2) Benzo-a-Pyrene <0.5 ng/m3
<0.5 ng/m3
<0.5 ng/m3
<0.5 ng/m3
<0.5 ng/m3
<0.5 ng/m3

Annexure – III
State of Air Environment
Page 120
Name of Cluster GIDC, Sarigam, Valsad Sampling Location MeckloyedPharma, Road No.: 25, GIDC Sarigam Methodology VOC- GC-FID
Benzo-a-Pyrene -HPLC
Sr. No.
Parameter Sampling Date (in the year 2011)
3/5 17/5 7/6 21/6 5/7 19/7
1) Volatile Organic Compounds a) Methanol b) Ethanol c) Acetone d) Iso- propyl alcohol (IPA) e) Methylene di-cholride (mdc) f) Butanol g) Chloroform h) CCl4 i) Benzene j) Methyl isobutylketone k) Toluene l) P-Xylene m) M –Xylene n)O-Xylene o) EthylMethylKetone
1.03 4.61 10.76 Nil Nil Nil Nil 15.52 6.14 12.46 4.11 4.03 1.48 1.32 Nil
Nil 12.14 11.16 Nil Nil 0.51
Nil 8.32 Nil
10.08 16.27 10.11 3.24 5.19 Nil
1.06
3.92 9.98 Nil Nil Nil Nil
15.24 6.32
11.67 4.17 3.83 1.28 1.12 Nil
Nil
11.94 11.25
Nil Nil
0.49 Nil
8.14 Nil
10.15 15.76 10.27 3.34 5.04 Nil
2.07
4.51 10.44
Nil Nil Nil Nil
16.14 7.28
12.35 5.64 4.23 2.16 2.07 Nil
Nil 12.74 12.36
Nil Nil
1.12 Nil
9.14 Nil
11.24 16.37 11.57 4.42 6.09 Nil
Conc of VOCs 61.46 μg/m3
77.02 μg/m3
58.59 μg/m3
76.38 μg/m3
66.89 μg/m3
85.05μg/m3
2) Benzo-a-Pyrene <0.5 ng/m3
<0.5 ng/m3
<0.5 ng/m3
<0.5 ng/m3
<0.5 ng/m3
<0.5 ng/m3
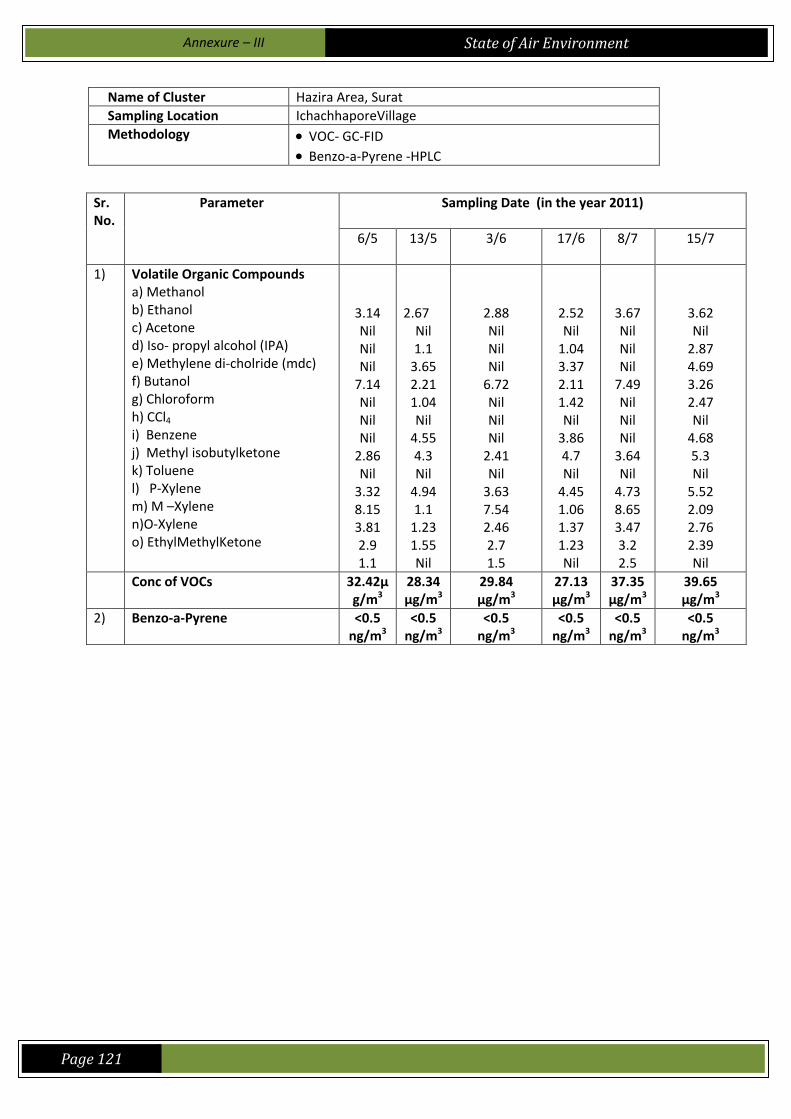
Annexure – III
State of Air Environment
Page 121
Name of Cluster Hazira Area, Surat Sampling Location IchachhaporeVillage Methodology VOC- GC-FID
Benzo-a-Pyrene -HPLC
Sr. No.
Parameter Sampling Date (in the year 2011)
6/5 13/5 3/6 17/6 8/7 15/7
1) Volatile Organic Compounds a) Methanol b) Ethanol c) Acetone d) Iso- propyl alcohol (IPA) e) Methylene di-cholride (mdc) f) Butanol g) Chloroform h) CCl4 i) Benzene j) Methyl isobutylketone k) Toluene l) P-Xylene m) M –Xylene n)O-Xylene o) EthylMethylKetone
3.14 Nil Nil Nil
7.14 Nil Nil Nil
2.86 Nil
3.32 8.15 3.81 2.9 1.1
2.67
Nil 1.1
3.65 2.21 1.04 Nil
4.55 4.3 Nil
4.94 1.1
1.23 1.55 Nil
2.88 Nil Nil Nil
6.72 Nil Nil Nil
2.41 Nil
3.63 7.54 2.46 2.7 1.5
2.52 Nil
1.04 3.37 2.11 1.42 Nil
3.86 4.7 Nil
4.45 1.06 1.37 1.23 Nil
3.67 Nil Nil Nil
7.49 Nil Nil Nil
3.64 Nil
4.73 8.65 3.47 3.2 2.5
3.62 Nil
2.87 4.69 3.26 2.47 Nil
4.68 5.3 Nil
5.52 2.09 2.76 2.39 Nil
Conc of VOCs 32.42μg/m3
28.34 μg/m3
29.84 μg/m3
27.13 μg/m3
37.35 μg/m3
39.65 μg/m3
2) Benzo-a-Pyrene <0.5 ng/m3
<0.5 ng/m3
<0.5 ng/m3
<0.5 ng/m3
<0.5 ng/m3
<0.5 ng/m3
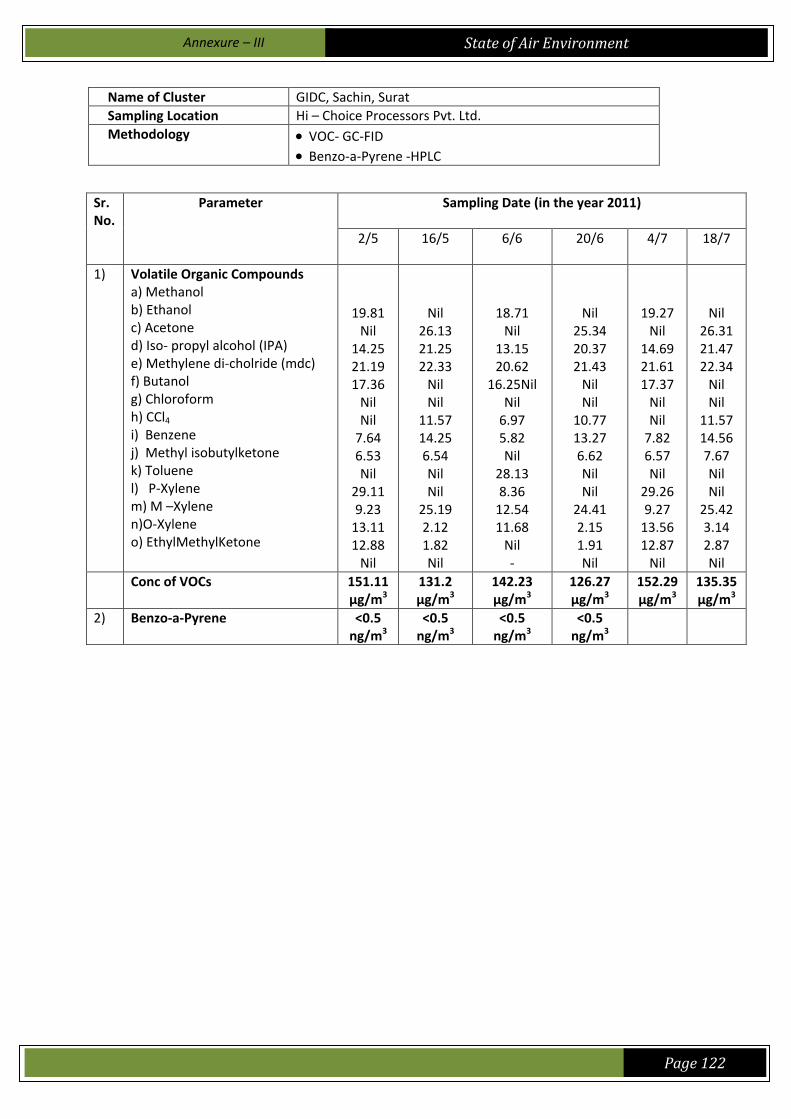
Annexure – III
State of Air Environment
Page 122
Name of Cluster GIDC, Sachin, Surat Sampling Location Hi – Choice Processors Pvt. Ltd. Methodology VOC- GC-FID
Benzo-a-Pyrene -HPLC
Sr. No.
Parameter Sampling Date (in the year 2011)
2/5 16/5 6/6 20/6 4/7 18/7
1) Volatile Organic Compounds a) Methanol b) Ethanol c) Acetone d) Iso- propyl alcohol (IPA) e) Methylene di-cholride (mdc) f) Butanol g) Chloroform h) CCl4 i) Benzene j) Methyl isobutylketone k) Toluene l) P-Xylene m) M –Xylene n)O-Xylene o) EthylMethylKetone
19.81 Nil
14.25 21.19 17.36
Nil Nil
7.64 6.53 Nil
29.11 9.23
13.11 12.88
Nil
Nil 26.13 21.25 22.33
Nil Nil
11.57 14.25 6.54 Nil Nil
25.19 2.12 1.82 Nil
18.71 Nil
13.15 20.62
16.25Nil Nil
6.97 5.82 Nil
28.13 8.36
12.54 11.68
Nil -
Nil 25.34 20.37 21.43
Nil Nil
10.77 13.27 6.62 Nil Nil
24.41 2.15 1.91 Nil
19.27 Nil
14.69 21.61 17.37
Nil Nil
7.82 6.57 Nil
29.26 9.27
13.56 12.87
Nil
Nil 26.31 21.47 22.34
Nil Nil
11.57 14.56 7.67 Nil Nil
25.42 3.14 2.87 Nil
Conc of VOCs 151.11 μg/m3
131.2 μg/m3
142.23 μg/m3
126.27 μg/m3
152.29μg/m3
135.35μg/m3
2) Benzo-a-Pyrene <0.5 ng/m3
<0.5 ng/m3
<0.5 ng/m3
<0.5 ng/m3

Annexure – III
State of Air Environment
Page 123
Name of Cluster GIDC, Pandesara, Surat Sampling Location Pandesara GIDC Office Methodology VOC- GC-FID
Benzo-a-Pyrene -HPLC
Sr. No.
Parameter Sampling Date (in the year 2011)
3/5 17/5 7/6 21/6 5/7 19/7
1) Volatile Organic Compounds a) Methanol b) Ethanol c) Acetone d) Iso- propyl alcohol (IPA) e) Methylene di-cholride (mdc) f) Butanol g) Chloroform h) CCl4 i) Benzene j) Methyl isobutylketone k) Toluene l) P-Xylene m) M –Xylene n)O-Xylene o) EthylMethylKetone
12.81
4.44 3.27 Nil Nil Nil Nil Nil
12.37 Nil Nil
7.22 1.80 1.1 Nil
13.11
Nil 8.25 Nil Nil
2.35 Nil
7.53 5.22 Nil Nil
1.35 2.27 1.44 Nil
11.47
4.69 2.73 Nil Nil Nil Nil Nil
11.52 Nil Nil
7.38 1.43 1.09 Nil
12.64
Nil 7.85 Nil Nil
2.27 Nil
7.72 4.86 Nil Nil
1.29 2.14 1.32 Nil
12.76
5.73 3.46 Nil Nil Nil Nil Nil
12.42 Nil Nil
8.35 2.47 2.07 Nil
13.27
Nil 8.35 Nil Nil
3.16 Nil
8.67 5.74 Nil Nil
2.37 3.10 2.24 Nil
Conc of VOCs 43.01 μg/m3
41.52 μg/m3
40.31 μg/m3
40.09 μg/m3
47.26 μg/m3
46.90 μg/m3
2) Benzo-a-Pyrene <0.5 ng/m3
<0.5 ng/m3
<0.5 ng/m3
<0.5 ng/m3
<0.5 ng/m3
<0.5 ng/m3
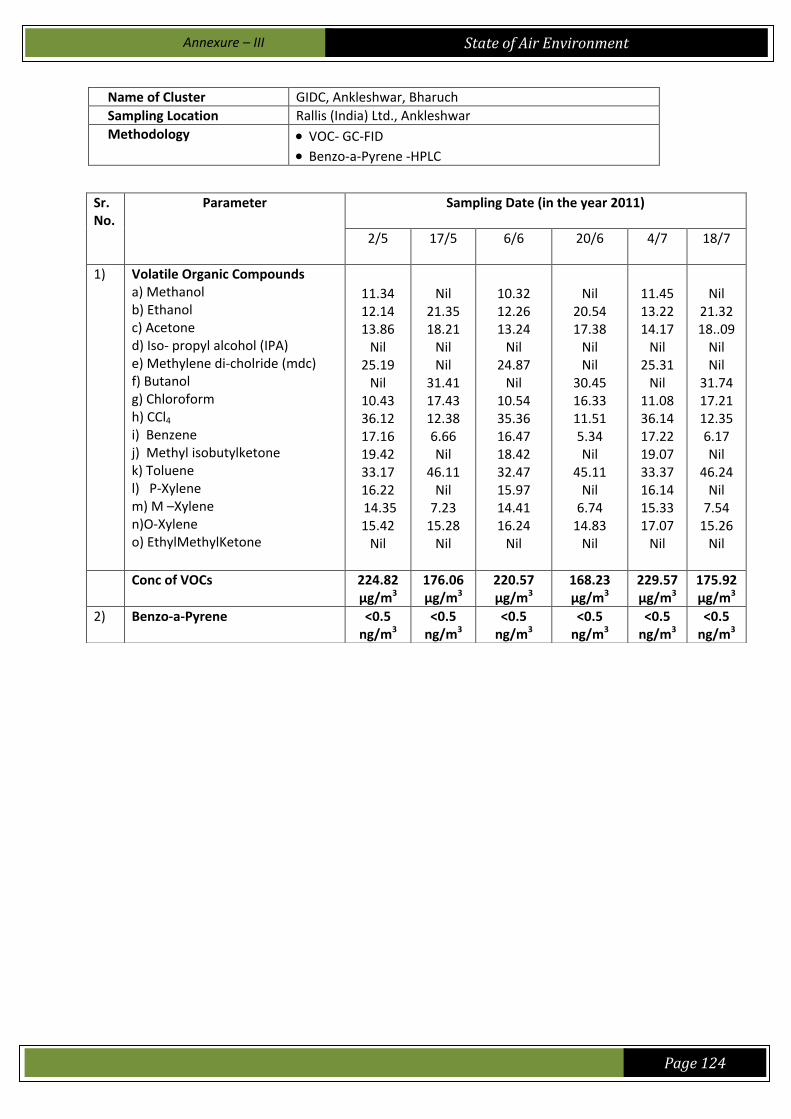
Annexure – III
State of Air Environment
Page 124
Name of Cluster GIDC, Ankleshwar, Bharuch Sampling Location Rallis (India) Ltd., Ankleshwar Methodology VOC- GC-FID
Benzo-a-Pyrene -HPLC
Sr. No.
Parameter Sampling Date (in the year 2011)
2/5 17/5 6/6 20/6 4/7 18/7
1) Volatile Organic Compounds a) Methanol b) Ethanol c) Acetone d) Iso- propyl alcohol (IPA) e) Methylene di-cholride (mdc) f) Butanol g) Chloroform h) CCl4 i) Benzene j) Methyl isobutylketone k) Toluene l) P-Xylene m) M –Xylene n)O-Xylene o) EthylMethylKetone
11.34 12.14 13.86
Nil 25.19
Nil 10.43 36.12 17.16 19.42 33.17 16.22
14.35 15.42
Nil
Nil
21.35 18.21
Nil Nil
31.41 17.43 12.38 6.66 Nil
46.11 Nil
7.23 15.28
Nil
10.32 12.26 13.24
Nil 24.87
Nil 10.54 35.36 16.47 18.42 32.47 15.97 14.41 16.24
Nil
Nil
20.54 17.38
Nil Nil
30.45 16.33 11.51 5.34 Nil
45.11 Nil
6.74 14.83
Nil
11.45 13.22 14.17
Nil 25.31
Nil 11.08 36.14 17.22 19.07 33.37 16.14 15.33 17.07
Nil
Nil
21.32 18..09
Nil Nil
31.74 17.21 12.35 6.17 Nil
46.24 Nil
7.54 15.26
Nil
Conc of VOCs 224.82 μg/m3
176.06 μg/m3
220.57 μg/m3
168.23 μg/m3
229.57 μg/m3
175.92μg/m3
2) Benzo-a-Pyrene <0.5 ng/m3
<0.5 ng/m3
<0.5 ng/m3
<0.5 ng/m3
<0.5 ng/m3
<0.5 ng/m3
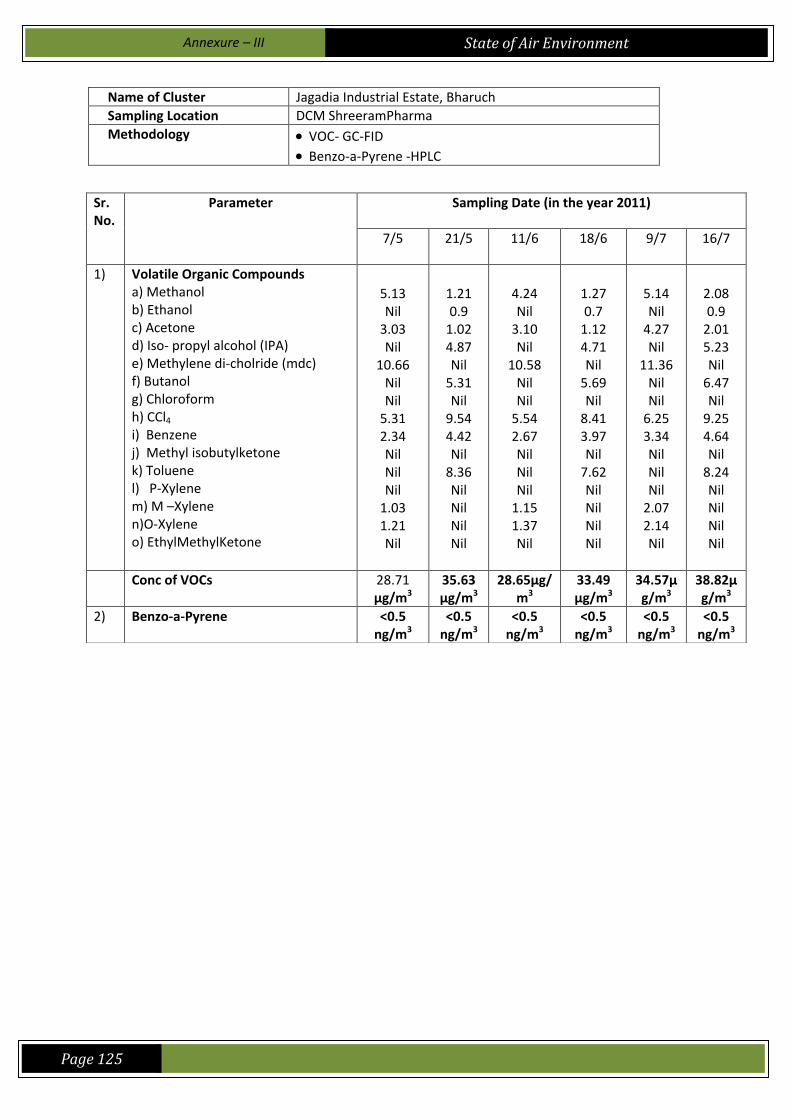
Annexure – III
State of Air Environment
Page 125
Name of Cluster Jagadia Industrial Estate, Bharuch Sampling Location DCM ShreeramPharma Methodology VOC- GC-FID
Benzo-a-Pyrene -HPLC
Sr. No.
Parameter Sampling Date (in the year 2011)
7/5 21/5 11/6 18/6 9/7 16/7
1) Volatile Organic Compounds a) Methanol b) Ethanol c) Acetone d) Iso- propyl alcohol (IPA) e) Methylene di-cholride (mdc) f) Butanol g) Chloroform h) CCl4 i) Benzene j) Methyl isobutylketone k) Toluene l) P-Xylene m) M –Xylene n)O-Xylene o) EthylMethylKetone
5.13 Nil
3.03 Nil
10.66 Nil Nil
5.31 2.34 Nil Nil Nil
1.03 1.21 Nil
1.21 0.9
1.02 4.87 Nil
5.31 Nil
9.54 4.42 Nil
8.36 Nil Nil Nil Nil
4.24 Nil
3.10 Nil
10.58 Nil Nil
5.54 2.67 Nil Nil Nil
1.15 1.37 Nil
1.27 0.7
1.12 4.71 Nil
5.69 Nil
8.41 3.97 Nil
7.62 Nil Nil Nil Nil
5.14 Nil
4.27 Nil
11.36 Nil Nil
6.25 3.34 Nil Nil Nil
2.07 2.14 Nil
2.08 0.9
2.01 5.23 Nil
6.47 Nil
9.25 4.64 Nil
8.24 Nil Nil Nil Nil
Conc of VOCs 28.71 μg/m3
35.63 μg/m3
28.65μg/m3
33.49 μg/m3
34.57μg/m3
38.82μg/m3
2) Benzo-a-Pyrene <0.5 ng/m3
<0.5 ng/m3
<0.5 ng/m3
<0.5 ng/m3
<0.5 ng/m3
<0.5 ng/m3

Annexure – III
State of Air Environment
Page 126
Name of Cluster Dahej Area, Bharuch Sampling Location Gujarat Alkali Chemical Ltd. Methodology VOC- GC-FID
Benzo-a-Pyrene -HPLC
Sr. No.
Parameter Sampling Date(in the year 2011)
2/5 16/5 6/6 20/6 4/7 18/7
1) Volatile Organic Compounds a) Methanol b) Ethanol c) Acetone d) Iso- propyl alcohol (IPA) e) Methylene di-cholride (mdc) f) Butanol g) Chloroform h) CCl4 i) Benzene j) Methyl isobutylketone k) Toluene l) P-Xylene m) M –Xylene n)O-Xylene o) EthylMethylKetone
6.68 Nil
1.24 Nil
7.35 Nil Nil Nil
7.16 22.13 5.63 3.62 2.37 3.86 Nil
19.84
Nil 2.24 Nil
15.16 Nil Nil
2.54 6.92 Nil Nil
1.93 2.35 2.25 Nil
6.14 Nil
1.97 Nil
7.66 Nil Nil Nil
6.72 21.67 5.24 3.17 2.73 2.81 Nil
18.64
Nil 2.47 Nil
14.56 Nil Nil
2.17 5.69 Nil Nil
1.28 2.12 2.27 Nil
7.23 Nil
2.07 Nil
8.34 Nil Nil Nil
8.03 23.41 6.27 4.36 3.47 4.59 Nil
19.37
Nil 3.48 Nil
15.37 Nil Nil
3.25 6.67 Nil Nil
2.12 3.07 3.09 Nil
Conc of VOCs 60.04 μg/m3
53.23 μg/m3
58.11μg/m3
49.20μg/m3
67.77μg/m3
56.42μg/m3
2) Benzo-a-Pyrene <0.5 ng/m3
<0.5 ng/m3
<0.5 ng/m3
<0.5 ng/m3
<0.5 ng/m3
<0.5 ng/m3
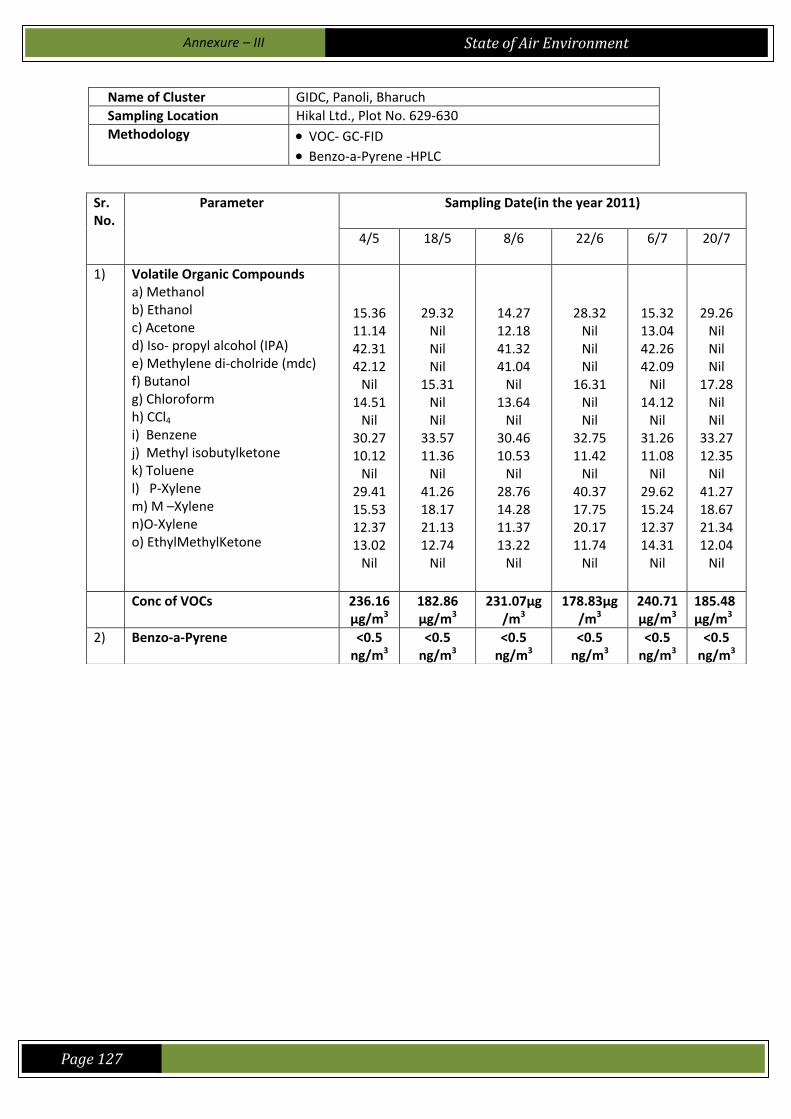
Annexure – III
State of Air Environment
Page 127
Name of Cluster GIDC, Panoli, Bharuch Sampling Location Hikal Ltd., Plot No. 629-630 Methodology VOC- GC-FID
Benzo-a-Pyrene -HPLC
Sr. No.
Parameter Sampling Date(in the year 2011)
4/5 18/5 8/6 22/6 6/7 20/7
1) Volatile Organic Compounds a) Methanol b) Ethanol c) Acetone d) Iso- propyl alcohol (IPA) e) Methylene di-cholride (mdc) f) Butanol g) Chloroform h) CCl4 i) Benzene j) Methyl isobutylketone k) Toluene l) P-Xylene m) M –Xylene n)O-Xylene o) EthylMethylKetone
15.36 11.14 42.31 42.12
Nil 14.51
Nil 30.27 10.12
Nil 29.41 15.53 12.37 13.02
Nil
29.32 Nil Nil Nil
15.31 Nil Nil
33.57 11.36
Nil 41.26 18.17 21.13 12.74
Nil
14.27 12.18 41.32 41.04
Nil 13.64
Nil 30.46 10.53
Nil 28.76 14.28 11.37 13.22
Nil
28.32 Nil Nil Nil
16.31 Nil Nil
32.75 11.42
Nil 40.37 17.75 20.17 11.74
Nil
15.32 13.04 42.26 42.09
Nil 14.12
Nil 31.26 11.08
Nil 29.62 15.24 12.37 14.31
Nil
29.26 Nil Nil Nil
17.28 Nil Nil
33.27 12.35
Nil 41.27 18.67 21.34 12.04
Nil
Conc of VOCs 236.16 μg/m3
182.86 μg/m3
231.07μg/m3
178.83μg/m3
240.71μg/m3
185.48μg/m3
2) Benzo-a-Pyrene <0.5 ng/m3
<0.5 ng/m3
<0.5 ng/m3
<0.5 ng/m3
<0.5 ng/m3
<0.5 ng/m3
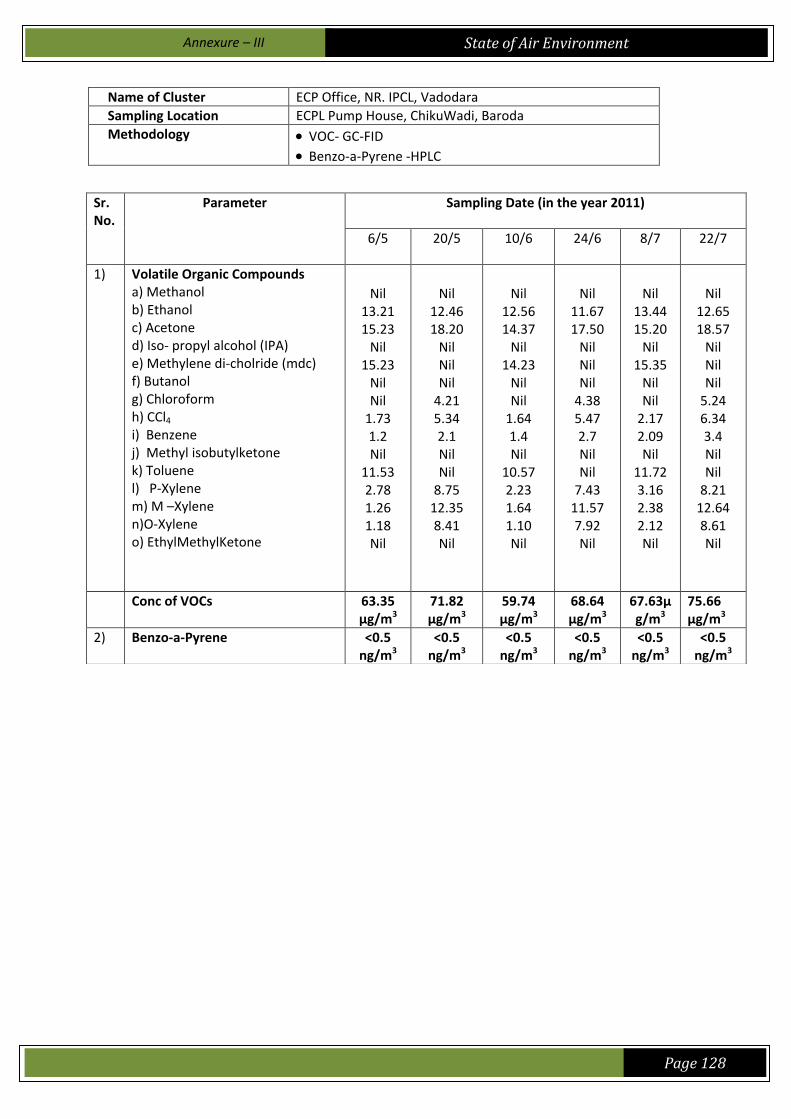
Annexure – III
State of Air Environment
Page 128
Name of Cluster ECP Office, NR. IPCL, Vadodara Sampling Location ECPL Pump House, ChikuWadi, Baroda Methodology VOC- GC-FID
Benzo-a-Pyrene -HPLC
Sr. No.
Parameter Sampling Date (in the year 2011)
6/5 20/5 10/6 24/6 8/7 22/7
1) Volatile Organic Compounds a) Methanol b) Ethanol c) Acetone d) Iso- propyl alcohol (IPA) e) Methylene di-cholride (mdc) f) Butanol g) Chloroform h) CCl4 i) Benzene j) Methyl isobutylketone k) Toluene l) P-Xylene m) M –Xylene n)O-Xylene o) EthylMethylKetone
Nil
13.21 15.23
Nil 15.23
Nil Nil
1.73 1.2 Nil
11.53 2.78 1.26 1.18 Nil
Nil
12.46 18.20
Nil Nil Nil
4.21 5.34 2.1 Nil Nil
8.75 12.35 8.41 Nil
Nil
12.56 14.37
Nil 14.23
Nil Nil
1.64 1.4 Nil
10.57 2.23 1.64 1.10 Nil
Nil
11.67 17.50
Nil Nil Nil
4.38 5.47 2.7 Nil Nil
7.43 11.57 7.92 Nil
Nil
13.44 15.20
Nil 15.35
Nil Nil
2.17 2.09 Nil
11.72 3.16 2.38 2.12 Nil
Nil
12.65 18.57
Nil Nil Nil
5.24 6.34 3.4 Nil Nil
8.21 12.64 8.61 Nil
Conc of VOCs 63.35 μg/m3
71.82 μg/m3
59.74 μg/m3
68.64 μg/m3
67.63μg/m3
75.66 μg/m3
2) Benzo-a-Pyrene <0.5 ng/m3
<0.5 ng/m3
<0.5 ng/m3
<0.5 ng/m3
<0.5 ng/m3
<0.5 ng/m3

Annexure – III
State of Air Environment
Page 129
Name of Cluster Nandesari, Vadodara Sampling Location Nandesari Common Effluent Treatment Plant Methodology VOC- GC-FID
Benzo-a-Pyrene -HPLC
Sr. No.
Parameter Sampling Date (in the year 2011)
7/5 21/5 11/6 25/6 9/7 23/7
1) Volatile Organic Compounds a) Methanol b) Ethanol c) Acetone d) Iso- propyl alcohol (IPA) e) Methylene di-cholride (mdc) f) Butanol g) Chloroform h) CCl4 i) Benzene j) Methyl isobutylketone k) Toluene l) P-Xylene m) M –Xylene n)O-Xylene o) EthylMethylKetone
1.34 2.10 Nil Nil
12.33 12.45
Nil 4.55 2.13 Nil
18.34 1.2
1.43 1.51 Nil
8.21 Nil
5.42 Nil
16.51 13.23
Nil Nil
4.65 Nil
11.23 6.35 5.71 4.92 Nil
1.76 2.92 Nil Nil
12.67 12.82
Nil 3.74 2.80 Nil
17.61 1.9
1.68 1.97 Nil
7.58 Nil
5.71 Nil
15.24 12.36
Nil Nil
4.51 Nil
10.92 6.14 5.43 4.76 Nil
2.46 3.47 Nil Nil
13.56 13.64
Nil 5.26 3.47 Nil
19.27 1.9
2.07 2.34 Nil
8.54 Nil
6.35 Nil
16.37 13.57
Nil Nil
5.37 Nil
11.74 7.87 6.34 5.24 Nil
Conc of VOCs 57.38 μg/m3
76.23 μg/m3
59.87 μg/m3
72.65 μg/m3
67.44 μg/m3
81.39μg/m3
2) Benzo-a-Pyrene <0.5 ng/m3
<0.5 ng/m3
<0.5 ng/m3
<0.5 ng/m3
<0.5 ng/m3
<0.5 ng/m3
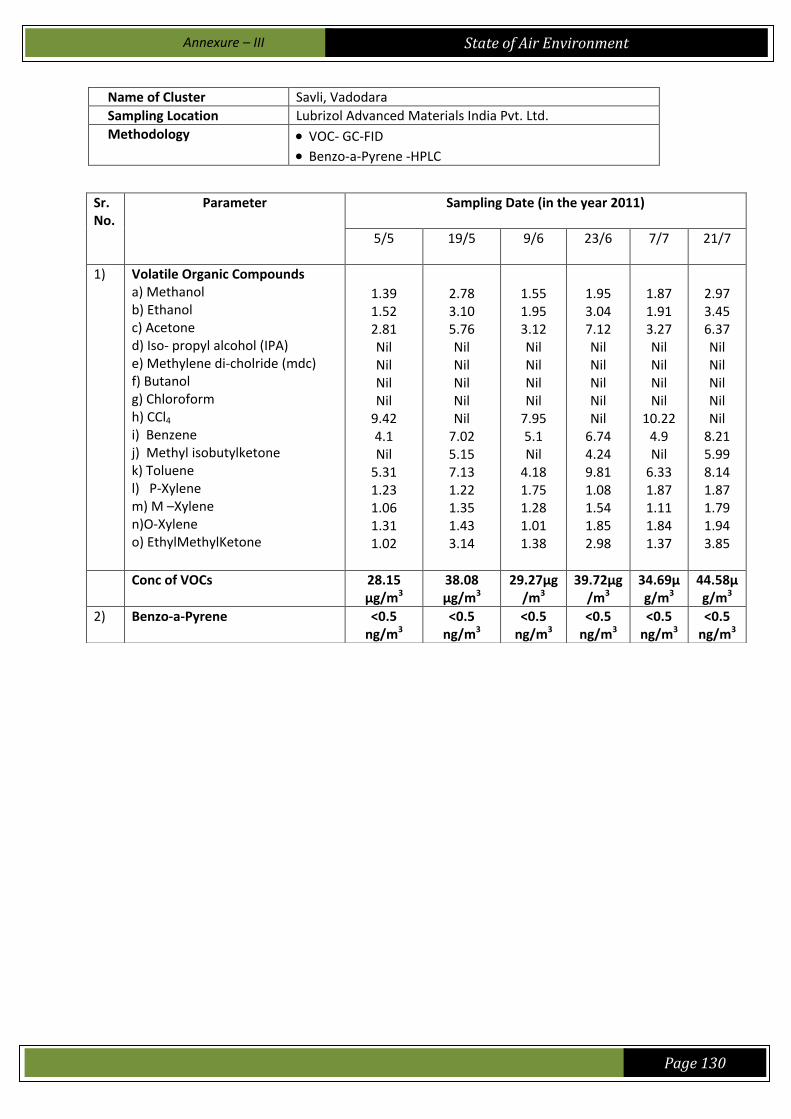
Annexure – III
State of Air Environment
Page 130
Name of Cluster Savli, Vadodara Sampling Location Lubrizol Advanced Materials India Pvt. Ltd. Methodology VOC- GC-FID
Benzo-a-Pyrene -HPLC
Sr. No.
Parameter Sampling Date (in the year 2011)
5/5 19/5 9/6 23/6 7/7 21/7
1) Volatile Organic Compounds a) Methanol b) Ethanol c) Acetone d) Iso- propyl alcohol (IPA) e) Methylene di-cholride (mdc) f) Butanol g) Chloroform h) CCl4 i) Benzene j) Methyl isobutylketone k) Toluene l) P-Xylene m) M –Xylene n)O-Xylene o) EthylMethylKetone
1.39 1.52 2.81 Nil Nil Nil Nil
9.42 4.1 Nil
5.31 1.23 1.06 1.31 1.02
2.78 3.10 5.76 Nil Nil Nil Nil Nil
7.02 5.15 7.13 1.22 1.35 1.43 3.14
1.55 1.95 3.12 Nil Nil Nil Nil
7.95 5.1 Nil
4.18 1.75 1.28 1.01 1.38
1.95 3.04 7.12 Nil Nil Nil Nil Nil
6.74 4.24 9.81 1.08 1.54 1.85 2.98
1.87 1.91 3.27 Nil Nil Nil Nil
10.22 4.9 Nil
6.33 1.87 1.11 1.84 1.37
2.97 3.45 6.37 Nil Nil Nil Nil Nil
8.21 5.99 8.14 1.87 1.79 1.94 3.85
Conc of VOCs 28.15 μg/m3
38.08 μg/m3
29.27μg/m3
39.72μg/m3
34.69μg/m3
44.58μg/m3
2) Benzo-a-Pyrene <0.5 ng/m3
<0.5 ng/m3
<0.5 ng/m3
<0.5 ng/m3
<0.5 ng/m3
<0.5 ng/m3

Annexure – III
State of Air Environment
Page 131
Name of Cluster Ekalbara, Vadodara Sampling Location Above Mahuvad Fire Station, Near Transpec Company Methodology VOC- GC-FID
Benzo-a-Pyrene -HPLC
Sr. No.
Parameter Sampling Date (in the year 2011)
6/5 20/5 10/6 24/6 8/7 22/7
1) Volatile Organic Compounds a) Methanol b) Ethanol c) Acetone d) Iso- propyl alcohol (IPA) e) Methylene di-cholride (mdc) f) Butanol g) Chloroform h) CCl4 i) Benzene j) Methyl isobutylketone k) Toluene l) P-Xylene m) M –Xylene n)O-Xylene o) EthylMethylKetone
11.12
Nil 3.13 Nil
2.64 Nil Nil
16.66 5.12 Nil
10.66 8.91 7.65 7.84 Nil
13.52
Nil 7.21 Nil
5.31 Nil Nil
13.73 4.90 Nil
10.12 7.53 8.31 8.11 Nil
11.36
Nil 3.07 Nil
2.16 Nil Nil
15.42 5.17 Nil
10.36 8.51 6.25 6.78 Nil
12.54
Nil 7.14 Nil
4.93 Nil Nil
13.21 4.62 Nil
9.86 7.16 8.11 7.74 Nil
12.54
Nil 3.91 Nil
2.97 Nil Nil
16.37 5.98 Nil
11.32 9.64 6.73 7.38 Nil
12.97
Nil 7.88 Nil
5.57 Nil Nil
14.79 5.74 Nil
10.47 7.94 8.76 8.79 Nil
Conc of VOCs 73.73 μg/m3
78.74 μg/m3
69.08 μg/m3
75.31 μg/m3
76.84μg/m3
82.91μg/m3
2) Benzo-a-Pyrene <0.5 ng/m3
<0.5 ng/m3
<0.5 ng/m3
<0.5 ng/m3
<0.5 ng/m3
<0.5 ng/m3

Annexure – III
State of Air Environment
Page 132
Name of Cluster GIDC, Odhav, Ahmedabad Sampling Location Odhav Industrial Association, L-203, GIDC Estate Methodology VOC- GC-FID
Benzo-a-Pyrene -HPLC
Sr. No.
Parameter Sampling Date (in the year 2011)
12/5 26/5 7/6 21/6 9/7 23/7
1) Volatile Organic Compounds a) Methanol b) Ethanol c) Acetone d) Iso- propyl alcohol (IPA) e) Methylene di-cholride (mdc) f) Butanol g) Chloroform h) CCl4 i) Benzene j) Methyl isobutylketone k) Toluene l) P-Xylene m) M –Xylene n)O-Xylene o) EthylMethylKetone
9.32 10.11 21.14
Nil 16.15
Nil 8.12
14.26 2.34 Nil Nil
6.67 6.96 5.84 Nil
8.33 7.43
18.53 Nil
12.14 Nil
10.43 16.26 3.45 Nil Nil
5.66 7.10 5.96 Nil
9.14 10.07 20.87
Nil 15.10
Nil 8.25
13.47 2.14 Nil Nil
6.27 6.31 5.26 Nil
8.14 7.28
17.19 Nil
12.27 Nil
10.13 15.75 3.14 Nil Nil
5.36 6.64 5.18 Nil
9.87 10.88 21.69
Nil 15.84
Nil 8.94
14.57 3.24 Nil Nil
6.88 6.94 6.94 Nil
9.10 8.12
18.27 Nil
13.09 Nil
11.35 16.27 4.26 Nil Nil
6.28 7.18 6.57 Nil
Conc of VOCs 100.91 μg/m3
95.29 μg/m3
96.88 μg/m3
91.08 μg/m3
105.79 μg/m3
100.49 μg/m3
2) Benzo-a-Pyrene <0.5 ng/m3
<0.5 ng/m3
<0.5 ng/m3
<0.5 ng/m3
<0.5 ng/m3
<0.5 ng/m3
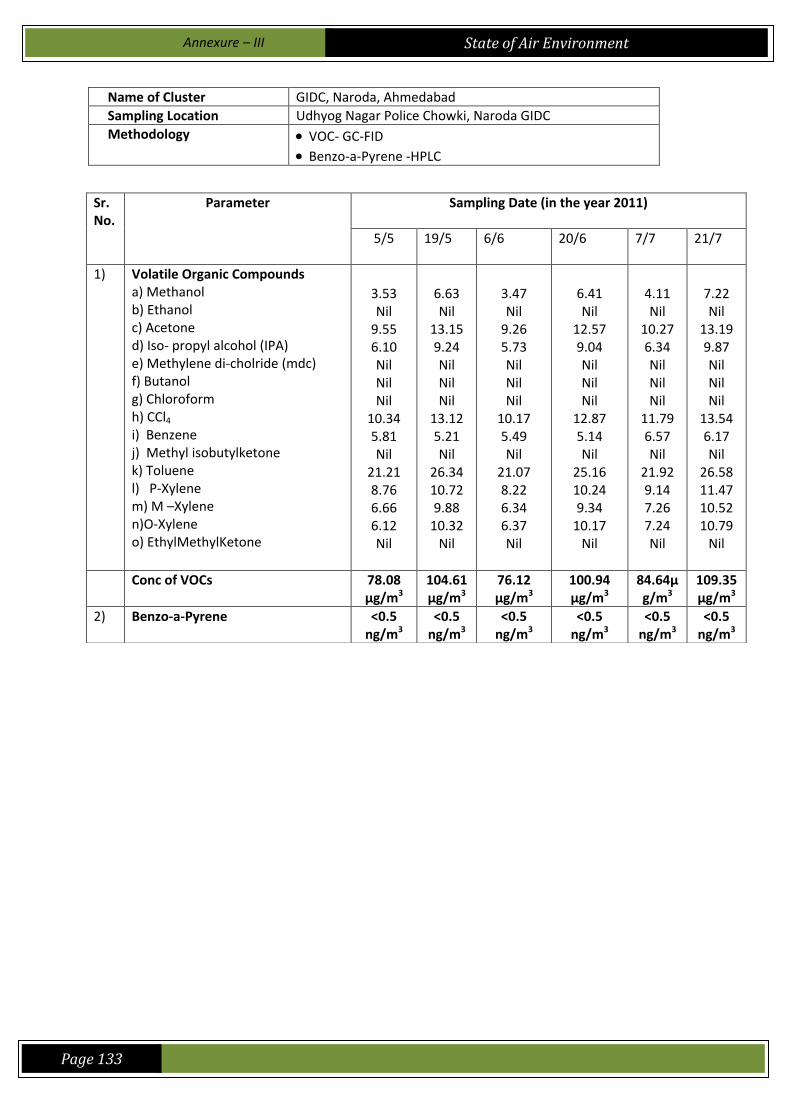
Annexure – III
State of Air Environment
Page 133
Name of Cluster GIDC, Naroda, Ahmedabad Sampling Location Udhyog Nagar Police Chowki, Naroda GIDC Methodology VOC- GC-FID
Benzo-a-Pyrene -HPLC
Sr. No.
Parameter Sampling Date (in the year 2011)
5/5 19/5 6/6 20/6 7/7 21/7
1) Volatile Organic Compounds a) Methanol b) Ethanol c) Acetone d) Iso- propyl alcohol (IPA) e) Methylene di-cholride (mdc) f) Butanol g) Chloroform h) CCl4 i) Benzene j) Methyl isobutylketone k) Toluene l) P-Xylene m) M –Xylene n)O-Xylene o) EthylMethylKetone
3.53 Nil
9.55 6.10 Nil Nil Nil
10.34 5.81 Nil
21.21 8.76 6.66 6.12 Nil
6.63 Nil
13.15 9.24 Nil Nil Nil
13.12 5.21 Nil
26.34 10.72 9.88
10.32 Nil
3.47 Nil
9.26 5.73 Nil Nil Nil
10.17 5.49 Nil
21.07 8.22 6.34 6.37 Nil
6.41 Nil
12.57 9.04 Nil Nil Nil
12.87 5.14 Nil
25.16 10.24 9.34
10.17 Nil
4.11 Nil
10.27 6.34 Nil Nil Nil
11.79 6.57 Nil
21.92 9.14 7.26 7.24 Nil
7.22 Nil
13.19 9.87 Nil Nil Nil
13.54 6.17 Nil
26.58 11.47 10.52 10.79
Nil
Conc of VOCs 78.08 μg/m3
104.61 μg/m3
76.12 μg/m3
100.94 μg/m3
84.64μg/m3
109.35μg/m3
2) Benzo-a-Pyrene <0.5 ng/m3
<0.5 ng/m3
<0.5 ng/m3
<0.5 ng/m3
<0.5 ng/m3
<0.5 ng/m3

Annexure – III
State of Air Environment
Page 134
Name of Cluster GIDC, Vatva, Ahmedabad Sampling Location Vatva Industrial Association, GIDC Estate Methodology VOC- GC-FID
Benzo-a-Pyrene -HPLC
Sr. No.
Parameter Sampling Date (in the year 2011)
6/5 20/5 7/6 21/6 8/7 22/7
1) Volatile Organic Compounds a) Methanol b) Ethanol c) Acetone d) Iso- propyl alcohol (IPA) e) Methylene di-cholride (mdc) f) Butanol g) Chloroform h) CCl4 i) Benzene j) Methyl isobutylketone k) Toluene l) P-Xylene m) M –Xylene n)O-Xylene o) EthylMethylKetone
18.23
Nil 7.15 Nil
10.24 Nil Nil
9.85 8.23 Nil
21.16 13.12 11.19 13.12
Nil
10.23
Nil 6.67 Nil
9.43 Nil Nil
7.53 6.91 Nil
19.26 12.43 14.12 15.21
Nil
17.14
Nil 7.02 Nil
10.16 Nil Nil
9.47 8.17 Nil
20.76 12.16 11.04 12.74
Nil
10.12
Nil 6.34 Nil
9.22 Nil Nil
7.24 6.73 Nil
18.62 12.47 13.62 14.21
Nil
17.90
Nil 7.84 Nil
11.37 Nil Nil
10.17 8.95 Nil
21.48 13.46 11.75 13.37
Nil
10.88
Nil 7.67 Nil
10.75 Nil Nil
7.96 7.26 Nil
19.45 13.86 14.54 14.82
Nil
Conc of VOCs 112.29 μg/m3
101.79 μg/m3
108.66μg/m3
98.57μg/m3
116.29μg/m3
107.19μg/m3
2) Benzo-a-Pyrene <0.5 ng/m3
<0.5 ng/m3
<0.5 ng/m3
<0.5 ng/m3
<0.5 ng/m3
<0.5 ng/m3

Annexure – III
State of Air Environment
Page 135
Name of Cluster Changodar – Bavala (Kerala GIDC), Ahmedabad Sampling Location Gmbell Healthcare (India) Pvt. Ltd. Methodology VOC- GC-FID
Benzo-a-Pyrene -HPLC
Sr. No.
Parameter Sampling Date (in the year 2011)
9/5 23/5 13/6 20/6 14/7 21/7
1) Volatile Organic Compounds a) Methanol b) Ethanol c) Acetone d) Iso- propyl alcohol (IPA) e) Methylene di-cholride (mdc) f) Butanol g) Chloroform h) CCl4 i) Benzene j) Methyl isobutylketone k) Toluene l) P-Xylene m) M –Xylene n)O-Xylene o) EthylMethylKetone
15.12
Nil 9.32 4.16 Nil
8.73 9.34 7.32 5.63 Nil
21.17 8.11 6.59 5.78 Nil
10.11
Nil 7.02 5.14 Nil
10.73 11.21 8.37 5.25 Nil
18.17 6.73 4.56 7.36 Nil
14.12
Nil 9.24 4.06 Nil
8.31 9.14 7.22 4.63 Nil
20.17 7.71 6.39 5.28 Nil
9.51 Nil
6.84 5.21 Nil
10.23 10.61 8.17 5.05 Nil
17.57 6.33 4.23 7.16 Nil
14.83
Nil 9.76 4.77 Nil
9.25 10.07 8.35 5.31 Nil
21.74 8.64 7.32 6.24 Nil
10.13
Nil 5.97 6.07 Nil
10.84 11.23 8.76 5.89 Nil
16.67 7.14 4.82 7.71 Nil
Conc of VOCs 101.27 μg/m3
94.65 μg/m3
96.27 μg/m3
90.91 μg/m3
106.28μg/m3
95.23μg/m3
2) Benzo-a-Pyrene <0.5 ng/m3
<0.5 ng/m3
<0.5 ng/m3
<0.5 ng/m3
<0.5 ng/m3
<0.5 ng/m3
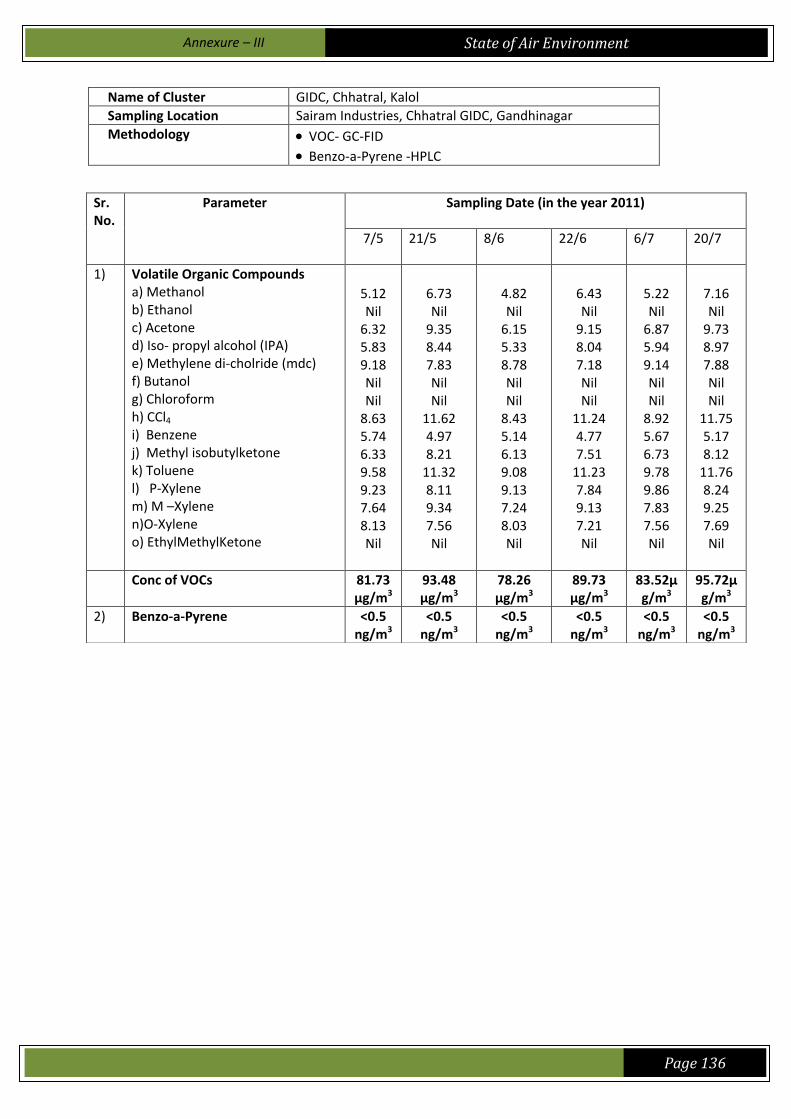
Annexure – III
State of Air Environment
Page 136
Name of Cluster GIDC, Chhatral, Kalol Sampling Location Sairam Industries, Chhatral GIDC, Gandhinagar Methodology VOC- GC-FID
Benzo-a-Pyrene -HPLC
Sr. No.
Parameter Sampling Date (in the year 2011)
7/5 21/5 8/6 22/6 6/7 20/7
1) Volatile Organic Compounds a) Methanol b) Ethanol c) Acetone d) Iso- propyl alcohol (IPA) e) Methylene di-cholride (mdc) f) Butanol g) Chloroform h) CCl4 i) Benzene j) Methyl isobutylketone k) Toluene l) P-Xylene m) M –Xylene n)O-Xylene o) EthylMethylKetone
5.12 Nil
6.32 5.83 9.18 Nil Nil
8.63 5.74 6.33 9.58 9.23 7.64 8.13 Nil
6.73 Nil
9.35 8.44 7.83 Nil Nil
11.62 4.97 8.21
11.32 8.11 9.34 7.56 Nil
4.82 Nil
6.15 5.33 8.78 Nil Nil
8.43 5.14 6.13 9.08 9.13 7.24 8.03 Nil
6.43 Nil
9.15 8.04 7.18 Nil Nil
11.24 4.77 7.51
11.23 7.84 9.13 7.21 Nil
5.22 Nil
6.87 5.94 9.14 Nil Nil
8.92 5.67 6.73 9.78 9.86 7.83 7.56 Nil
7.16 Nil
9.73 8.97 7.88 Nil Nil
11.75 5.17 8.12
11.76 8.24 9.25 7.69 Nil
Conc of VOCs 81.73 μg/m3
93.48 μg/m3
78.26 μg/m3
89.73 μg/m3
83.52μg/m3
95.72μg/m3
2) Benzo-a-Pyrene <0.5 ng/m3
<0.5 ng/m3
<0.5 ng/m3
<0.5 ng/m3
<0.5 ng/m3
<0.5 ng/m3

Annexure – III
State of Air Environment
Page 137
Name of Cluster Sanand Area Sampling Location Loxim Industries Limited, Iyava Village, Sanand Methodology VOC- GC-FID
Benzo-a-Pyrene -HPLC
Sr. No.
Parameter Sampling Date (in the year 2011)
7/5 21/5 11/6 25/6 6/7 20/7
1) Volatile Organic Compounds a) Methanol b) Ethanol c) Acetone d) Iso- propyl alcohol (IPA) e) Methylene di-cholride (mdc) f) Butanol g) Chloroform h) CCl4 i) Benzene j) Methyl isobutylketone k) Toluene l) P-Xylene m) M –Xylene n)O-Xylene o) EthylMethylKetone
1.1 Nil
5.46 3.47 2.31 Nil
4.56 2.74 2.33 Nil
8.41 2.14 3.12 2.19 Nil
1.72
Nil 12.43
Nil Nil Nil
7.83 6.21
3.75 Nil
9.63. 4.37 3.93 3.51 Nil
1.3 Nil
5.14 2.97 2.11 Nil
4.24 2.43 2.13 Nil
7.61 2.07 3.10 2.08 Nil
1.52 Nil
11.75 Nil Nil Nil
7.33 6.01 3.25 Nil
9.23. 4.17 3.24 3.21 Nil
1.9 Nil
4.97 2.13 2.68 Nil
4.78 1.87 2.74 Nil
8.23 2.64 3.82 2.74 Nil
1.67 Nil
12.17 Nil Nil Nil
7.84 6.79 3.57 Nil
10.24 4.75 3.67 3.89 Nil
Conc of VOCs 37.83 μg/m3
43.75 μg/m3
35.18 μg/m3
49.71 μg/m3
38.5 μg/m3
54.59 μg/m3
2) Benzo-a-Pyrene <0.5 ng/m3
<0.5 ng/m3
<0.5 ng/m3
<0.5 ng/m3
<0.5 ng/m3
<0.5 ng/m3

Annexure – III
State of Air Environment
Page 138
Name of Cluster Aji Vasahat / Morbi – Wankaner Sampling Location Near AjiVasahat, GIDC Rajkot Methodology VOC- GC-FID
Benzo-a-Pyrene -HPLC
Sr. No.
Parameter Sampling Date (in the year 2011)
6/5 20/5 7/6 21/6 5/7 19/7
1) Volatile Organic Compounds a) Methanol b) Ethanol c) Acetone d) Iso- propyl alcohol (IPA) e) Methylene di-cholride (mdc) f) Butanol g) Chloroform h) CCl4 i) Benzene j) Methyl isobutylketone k) Toluene l) P-Xylene m) M –Xylene n)O-Xylene o) EthylMethylKetone
3.06 Nil
12.07 Nil Nil
6.08 11.09 14.12 4.18 Nil
15.67 2.43 2.13 2.52 Nil
4.25 Nil
14.15 1.1 Nil
4.67 16.32 12.85 5.12 Nil
18.13 6.41 5.93
10.12 Nil
3.01 Nil
11.67 Nil Nil
5.88 10.67 13.71 4.05 Nil
15.57 2.13 1.84 2.12 Nil
4.17 Nil
13.75 1.07 Nil
4.24 16.11 12.23 5.07 Nil
17.83 6.17 5.32
10.04 Nil
3.74 Nil
12.67 Nil Nil
6.34 11.44 14.34 4.76 Nil
15.81 2.66 2.14 2.61 Nil
4.76 Nil
14.22 1.87 Nil
4.67 16.83 12.82 5.97 Nil
18.30 6.77 5.64
10.69 Nil
Conc of VOCs 73.35 μg/m3
99.05 μg/m3
70.65 μg/m3
96.00 μg/m3
76.51μg/m3
102.54μg/m3
2) Benzo-a-Pyrene <0.5 ng/m3
<0.5 ng/m3
<0.5 ng/m3
<0.5 ng/m3
<0.5 ng/m3
<0.5 ng/m3

Annexure – III
State of Air Environment
Page 139
Name of Cluster MotiKhavadi, Jamnagar Sampling Location HirabhaiSolanki’s Terrace, Near Water Tank Methodology VOC- GC-FID
Benzo-a-Pyrene -HPLC
Sr. No.
Parameter Sampling Date (in the year 2011)
9/5 23/5 6/6 20/6 4/7 18/7
1) Volatile Organic Compounds a) Methanol b) Ethanol c) Acetone d) Iso- propyl alcohol (IPA) e) Methylene di-cholride (mdc) f) Butanol g) Chloroform h) CCl4 i) Benzene j) Methyl isobutylketone k) Toluene l) P-Xylene m) M –Xylene n)O-Xylene o) EthylMethylKetone
1.43 Nil
11.46 2.10 3.34 3.12 4.33 5.23 5.31 Nil
12.34 8.24 6.52 7.89 Nil
1.23 Nil
10.2 1.33 1.57 1.55 4.65 2.92 4.65 Nil
8.54 9.23
11.54 6.47 Nil
1.17 Nil
11.09 1.90 3.13 2.87 4.16 5.03 5.12 Nil
12.14 8.09 6.11 7.10 Nil
1.03 Nil
9.62 1.07 1.14 1.25 4.17 2.23 4.31 Nil
8.30 9.07
11.26 6.15 Nil
1.78 Nil
11.83 2.14 4.25 3.10 4.67 5.96 5.64 Nil
12.57 8.78 6.87 7.94 Nil
1.27 Nil
9.79 1.77 1.84 1.64 4.57 2.93 5.64 Nil
8.57 9.96
12.34 6.54 Nil
Conc of VOCs 71.31 μg/m3
63.88 μg/m3
67.91 μg/m3
59.60 μg/m3
75.53μg/m3
66.86μg/m3
2) Benzo-a-Pyrene <0.5 ng/m3
<0.5 ng/m3
<0.5 ng/m3
<0.5 ng/m3
<0.5 ng/m3
<0.5 ng/m3

Annexure – III
State of Air Environment
Page 140
Name of Cluster GIDC, Chitra, Bhavnagar Sampling Location Plot No. 279 Methodology VOC- GC-FID
Benzo-a-Pyrene -HPLC
Sr. No.
Parameter Sampling Date (in the year 2011)
5/5 19/5 9/6 23/6 7/7 21/7
1) Volatile Organic Compounds a) Methanol b) Ethanol c) Acetone d) Iso- propyl alcohol (IPA) e) Methylene di-cholride (mdc) f) Butanol g) Chloroform h) CCl4 i) Benzene j) Methyl isobutylketone k) Toluene l) P-Xylene m) M –Xylene n)O-Xylene o) EthylMethylKetone
3.62 1.33 4.26 Nil
1.81 Nil 2.3
7.35 5.23 Nil
10.2 4.03 5.33 4.62 Nil
3.39
2.14 4.21 Nil Nil
2.53 Nil
8.24 5.74 Nil
8.32 3.32 4.21 6.34 Nil
3.24 1.07 3.82 Nil
1.26 Nil 2.1
7.09 5.11 Nil
9.76 3.73 5.04 4.22 Nil
3.18 1.76 3.84 Nil Nil
2.32 Nil
8.03 5.16 Nil
8.09 3.11 3.67 6.21 Nil
4.12 1.65 4.37 Nil
1.86 Nil 3.2
7.72 5.84 Nil
10.24 4.28 5.67 5.04 Nil
2.87 1.24 3.31 Nil Nil
2.64 Nil
8.76 5.61 Nil
8.84 3.92 3.14 6.65 Nil
Conc of VOCs 50.08 μg/m3
48.44 μg/m3
46.44 μg/m3
45.37 μg/m3
53.99μg/m3
46.98 μg/m3
2) Benzo-a-Pyrene <0.5 ng/m3
<0.5 ng/m3
<0.5 ng/m3
<0.5 ng/m3
<0.5 ng/m3
<0.5 ng/m3

Annexure – III
State of Air Environment
Page 141
Name of Cluster Mundra, Kutch Sampling Location Amrut Chamber, Baroi Road, Mundra. Methodology VOC- GC-FID
Benzo-a-Pyrene -HPLC
Sr. No.
Parameter Sampling Date (in the year 2011)
9/5 23/5 7/6 21/6 7/7 21/7
1) Volatile Organic Compounds a) Methanol b) Ethanol c) Acetone d) Iso- propyl alcohol (IPA) e) Methylene di-cholride (mdc) f) Butanol g) Chloroform h) CCl4 i) Benzene j) Methyl isobutylketone k) Toluene l) P-Xylene m) M –Xylene n)O-Xylene o) EthylMethylKetone
10.12
4.47 5.21 Nil
11.31 Nil
1.74 6.61 6.12 Nil
2.12 1.34 1.14 1.36 Nil
12.07 5.13 1.08
16.13 11.27
Nil Nil
4.04 5.06 Nil
12.46 2.46 3.20 4.21 2.07
9.82 4.17 5.10 Nil
11.03 Nil
1.44 6.27 5.86 Nil
1.84 1.13 1.07 1.22 Nil
11.87 5.02 1.01
15.73 11.04
Nil Nil
3.62 4.97 Nil
12.06 2.07 2.03 4.12 1.77
4.12 1.65 4.37 Nil
1.86 Nil 3.2
7.72 5.84 Nil
10.24 4.28 5.67 5.04 Nil
2.87 1.24 3.31 Nil Nil
2.64 Nil
8.76 5.61 Nil
8.84 3.92 3.14 6.65 Nil
Conc of VOCs 51.54 μg/m3
79.18 μg/m3
48.95 μg/m3
75.31 μg/m3
53.99 μg/m3
46.98 μg/m3
2) Benzo-a-Pyrene <0.5 ng/m3
<0.5 ng/m3
<0.5 ng/m3
<0.5 ng/m3
<0.5 ng/m3
<0.5 ng/m3
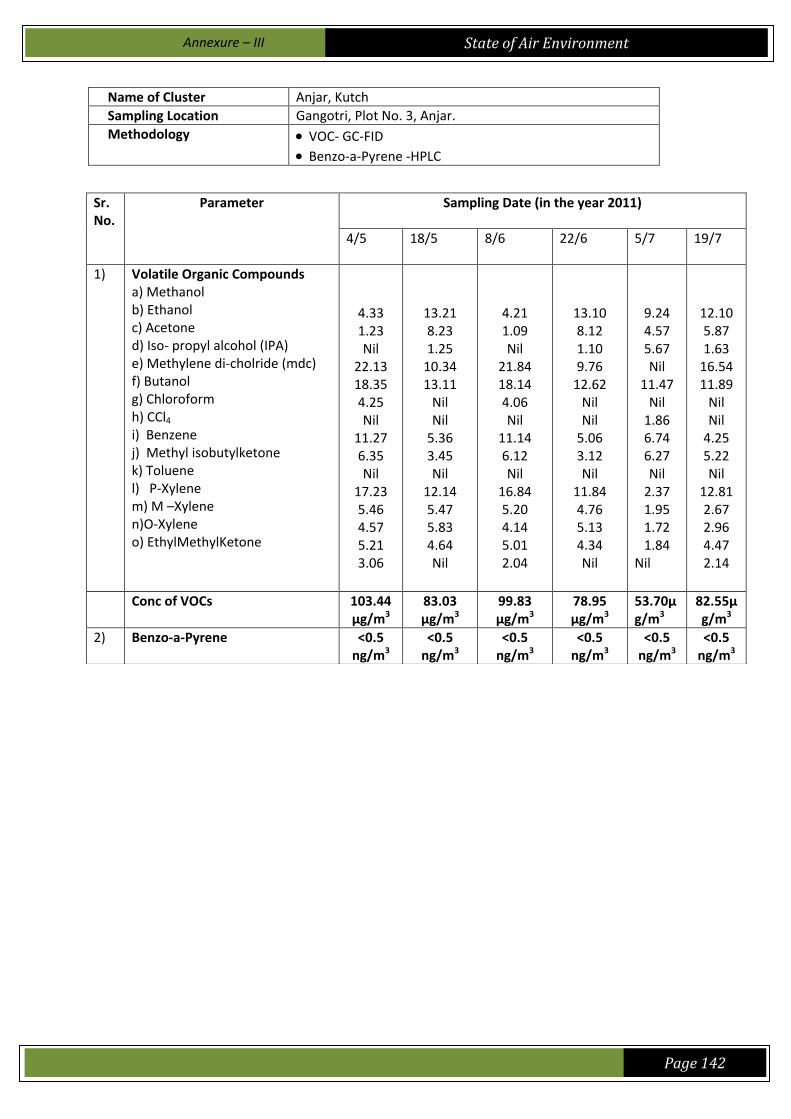
Annexure – III
State of Air Environment
Page 142
Name of Cluster Anjar, Kutch Sampling Location Gangotri, Plot No. 3, Anjar. Methodology VOC- GC-FID
Benzo-a-Pyrene -HPLC
Sr. No.
Parameter Sampling Date (in the year 2011)
4/5 18/5 8/6 22/6 5/7 19/7
1) Volatile Organic Compounds a) Methanol b) Ethanol c) Acetone d) Iso- propyl alcohol (IPA) e) Methylene di-cholride (mdc) f) Butanol g) Chloroform h) CCl4 i) Benzene j) Methyl isobutylketone k) Toluene l) P-Xylene m) M –Xylene n)O-Xylene o) EthylMethylKetone
4.33 1.23 Nil
22.13 18.35 4.25 Nil
11.27 6.35 Nil
17.23 5.46 4.57 5.21 3.06
13.21 8.23 1.25
10.34 13.11
Nil Nil
5.36 3.45 Nil
12.14 5.47 5.83 4.64 Nil
4.21 1.09 Nil
21.84 18.14 4.06 Nil
11.14 6.12 Nil
16.84 5.20 4.14 5.01 2.04
13.10 8.12 1.10 9.76
12.62 Nil Nil
5.06 3.12 Nil
11.84 4.76 5.13 4.34 Nil
9.24 4.57 5.67 Nil
11.47 Nil
1.86 6.74 6.27 Nil
2.37 1.95 1.72 1.84
Nil
12.10 5.87 1.63
16.54 11.89
Nil Nil
4.25 5.22 Nil
12.81 2.67 2.96 4.47 2.14
Conc of VOCs 103.44 μg/m3
83.03 μg/m3
99.83 μg/m3
78.95 μg/m3
53.70μg/m3
82.55μg/m3
2) Benzo-a-Pyrene <0.5 ng/m3
<0.5 ng/m3
<0.5 ng/m3
<0.5 ng/m3
<0.5 ng/m3
<0.5 ng/m3
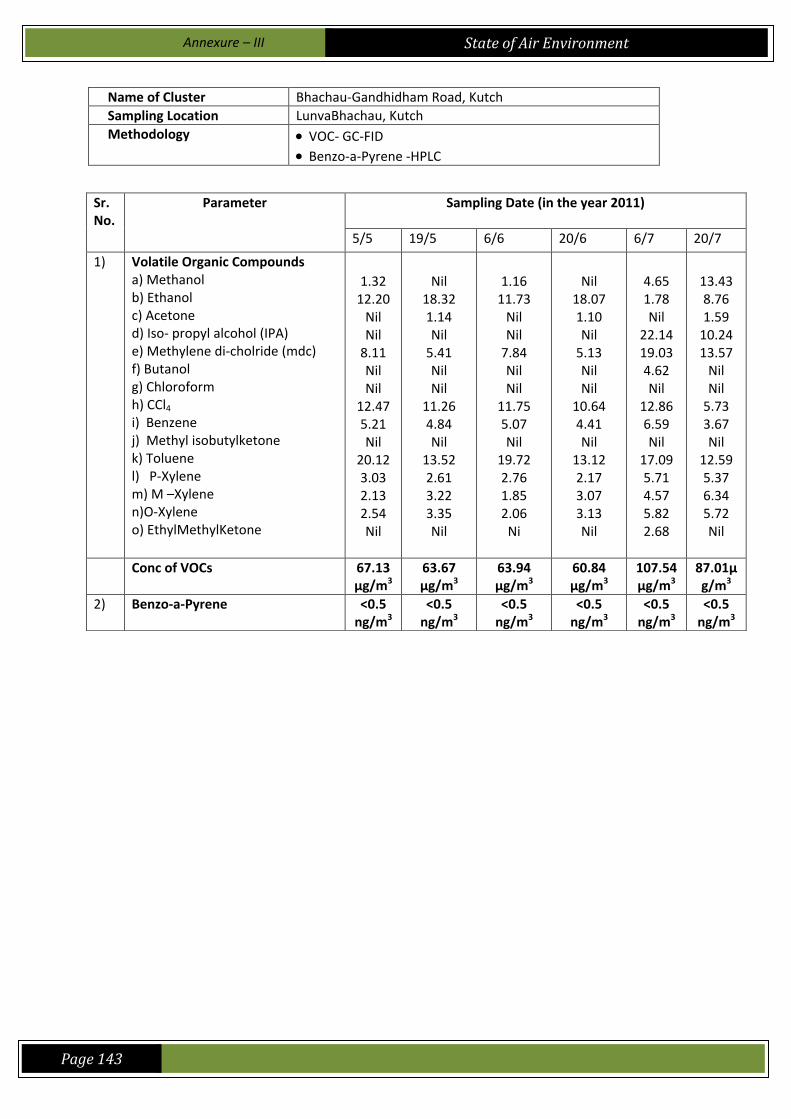
Annexure – III
State of Air Environment
Page 143
Name of Cluster Bhachau-Gandhidham Road, Kutch Sampling Location LunvaBhachau, Kutch Methodology VOC- GC-FID
Benzo-a-Pyrene -HPLC
Sr. No.
Parameter Sampling Date (in the year 2011)
5/5 19/5 6/6 20/6 6/7 20/7
1) Volatile Organic Compounds a) Methanol b) Ethanol c) Acetone d) Iso- propyl alcohol (IPA) e) Methylene di-cholride (mdc) f) Butanol g) Chloroform h) CCl4 i) Benzene j) Methyl isobutylketone k) Toluene l) P-Xylene m) M –Xylene n)O-Xylene o) EthylMethylKetone
1.32
12.20 Nil Nil
8.11 Nil Nil
12.47 5.21 Nil
20.12 3.03 2.13 2.54 Nil
Nil
18.32 1.14 Nil
5.41 Nil Nil
11.26 4.84 Nil
13.52 2.61 3.22 3.35 Nil
1.16
11.73 Nil Nil
7.84 Nil Nil
11.75 5.07 Nil
19.72 2.76 1.85 2.06
Ni
Nil
18.07 1.10 Nil
5.13 Nil Nil
10.64 4.41 Nil
13.12 2.17 3.07 3.13 Nil
4.65 1.78 Nil
22.14 19.03 4.62 Nil
12.86 6.59 Nil
17.09 5.71 4.57 5.82 2.68
13.43 8.76 1.59
10.24 13.57
Nil Nil
5.73 3.67 Nil
12.59 5.37 6.34 5.72 Nil
Conc of VOCs 67.13 μg/m3
63.67 μg/m3
63.94 μg/m3
60.84 μg/m3
107.54μg/m3
87.01μg/m3
2) Benzo-a-Pyrene <0.5 ng/m3
<0.5 ng/m3
<0.5 ng/m3
<0.5 ng/m3
<0.5 ng/m3
<0.5 ng/m3

Annexure – III
State of Air Environment
Page 144
Name of Cluster Bhachau-Gandhidham Road, Kutch Sampling Location LunvaBhachau, Kutch Methodology VOC- GC-FID
Benzo-a-Pyrene -HPLC
Sr. No.
Parameter Sampling Date (in the year 2011)
5/5 18/5 6/6 20/6 4/7 18/7
1) Volatile Organic Compounds a) Methanol b) Ethanol c) Acetone d) Iso- propyl alcohol (IPA) e) Methylene di-cholride (mdc) f) Butanol g) Chloroform h) CCl4 i) Benzene j) Methyl isobutylketone k) Toluene l) P-Xylene m) M –Xylene n)O-Xylene o) EthylMethylKetone
1.32
12.20 Nil Nil
8.11 Nil Nil
12.47 5.21 Nil
20.12 3.03 2.13 2.54 Nil
13.21 8.23 1.25
10.34 13.11
Nil Nil
5.36 3.45 Nil
12.14 5.47 5.83 4.64 Nil
1.16
11.73 Nil Nil
7.84 Nil Nil
11.75 5.07 Nil
19.72 2.76 1.85 2.06 Nil
Nil
18.07 1.10 Nil
5.13 Nil Nil
10.64 4.41 Nil
13.12 2.17 3.07 3.13 Nil
1.68
12.27 Nil Nil
8.13 Nil Nil
12.10 5.73 Nil
20.34 3.04 2.07 2.81 Nil
Nil
17.23 1.76 Nil
5.31 Nil Nil
11.78 5.07 Nil
13.69 2.63 3.74 3.61 Nil
Conc of VOCs 67.13 μg/m3
83.03 μg/m3
63.94μg/m3
60.84 μg/m3
68.17μg/m3
64.82 μg/m3
2) Benzo-a-Pyrene <0.5 ng/m3
<0.5 ng/m3
<0.5 ng/m3
<0.5 ng/m3
<0.5 ng/m3
<0.5 ng/m3
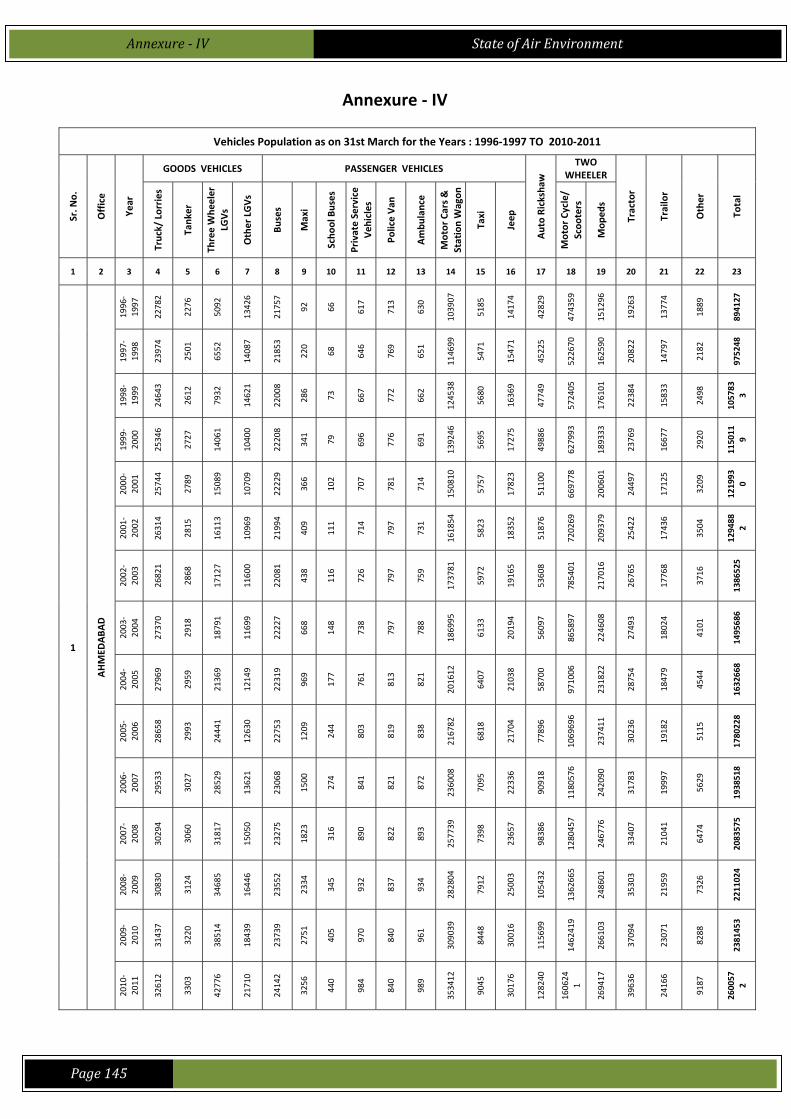
Annexure IV State of Air Environment
Page 145
Annexure ‐ IV
Vehicles Population as on 31st March for the Years : 1996‐1997 TO 2010‐2011
Sr. N
o.
Office
Year
GOODS VEHICLES PASSENGER VEHICLES
Auto Rickshaw
TWO WHEELER
Tractor
Trailor
Other
Total
Truck/ Lorries
Tank
er
Three Whe
eler
LGVs
Other LGVs
Buses
Maxi
Scho
ol Buses
Private Service
Veh
icles
Police Van
Ambu
lance
Motor Cars &
Station Wagon
Taxi
Jeep
Motor Cycle/
Scoo
ters
Mop
eds
1 2 3 4 5 6 7 8 9 10 11 12 13 14 15 16 17 18 19 20 21 22 23
1
AHMED
ABA
D
1996
‐1997
22782
2276
5092
13426
21757
92
66
617
713
630
103907
5185
14174
42829
474359
151296
19263
13774
1889
894127
1997
‐1998
23974
2501
6552
14087
21853
220
68
646
769
651
114699
5471
15471
45225
522670
162590
20822
14797
2182
975248
1998
‐1999
24643
2612
7932
14621
22008
286
73
667
772
662
124538
5680
16369
47749
572405
176101
22384
15833
2498
105783
3
1999
‐2000
25346
2727
14061
10400
22208
341
79
696
776
691
139246
5695
17275
49886
627993
189333
23769
16677
2920
115011
9
2000
‐2001
25744
2789
15089
10709
22229
366
102
707
781
714
150810
5757
17823
51100
669778
200601
24497
17125
3209
121993
0
2001
‐2002
26314
2815
16113
10969
21994
409
111
714
797
731
161854
5823
18352
51876
720269
209379
25422
17436
3504
129488
2
2002
‐2003
26821
2868
17127
11600
22081
438
116
726
797
759
173781
5972
19165
53608
785401
217016
26765
17768
3716
1386525
2003
‐2004
27370
2918
18791
11699
22227
668
148
738
797
788
186995
6133
20194
56097
865897
224608
27493
18024
4101
1495686
2004
‐2005
27969
2959
21369
12149
22319
969
177
761
813
821
201612
6407
21038
58700
971006
231822
28754
18479
4544
1632668
2005
‐2006
28658
2993
24441
12630
22753
1209
244
803
819
838
216782
6818
21704
77896
1069696
237411
30236
19182
5115
1780228
2006
‐2007
29533
3027
28529
13621
23068
1500
274
841
821
872
236008
7095
22336
90918
1180576
242090
31783
19997
5629
1938518
2007
‐2008
30294
3060
31817
15050
23275
1823
316
890
822
893
257739
7398
23657
98386
1280457
246776
33407
21041
6474
2083575
2008
‐2009
30830
3124
34685
16446
23552
2334
345
932
837
934
282804
7912
25003
105432
1362665
248601
35303
21959
7326
2211024
2009
‐2010
31437
3220
38514
18439
23739
2751
405
970
840
961
309039
8448
30016
115699
1462419
266103
37094
23071
8288
2381453
2010
‐2011
32612
3303
42776
21710
24142
3256
440
984
840
989
353412
9045
30176
128240
160624
1
269417
39636
24166
9187
260057
2
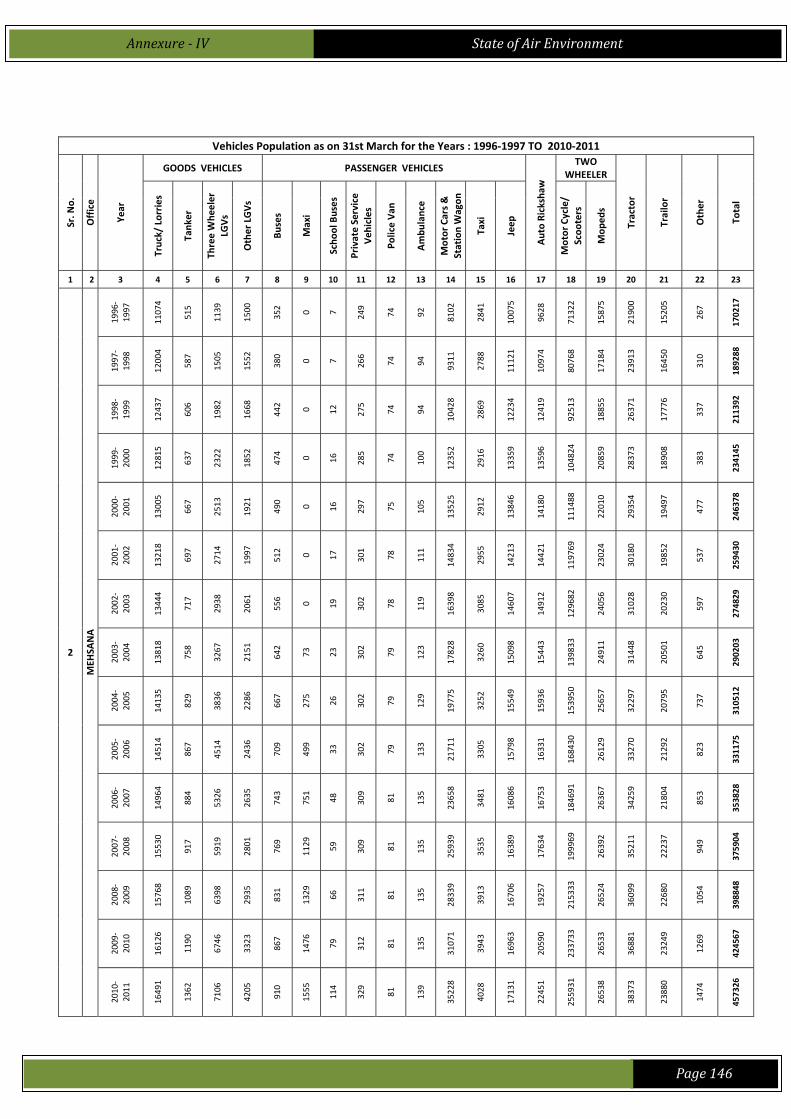
Annexure IV State of Air Environment
Page 146
Vehicles Population as on 31st March for the Years : 1996‐1997 TO 2010‐2011
Sr. N
o.
Office
Year
GOODS VEHICLES PASSENGER VEHICLES
Auto Rickshaw
TWO WHEELER
Tractor
Trailor
Other
Total
Truck/ Lorries
Tank
er
Three Whe
eler
LGVs
Other LGVs
Buses
Maxi
Scho
ol Buses
Private Service
Veh
icles
Police Van
Ambu
lance
Motor Cars &
Station Wagon
Taxi
Jeep
Motor Cycle/
Scoo
ters
Mop
eds
1 2 3 4 5 6 7 8 9 10 11 12 13 14 15 16 17 18 19 20 21 22 23
2
MEH
SANA
1996
‐1997
11074
515
1139
1500
352 0 7 249
74
92
8102
2841
10075
9628
71322
15875
21900
15205
267
170217
1997
‐1998
12004
587
1505
1552
380 0 7 266
74
94
9311
2788
11121
10974
80768
17184
23913
16450
310
189288
1998
‐1999
12437
606
1982
1668
442 0 12
275
74
94
10428
2869
12234
12419
92513
18855
26371
17776
337
211392
1999
‐2000
12815
637
2322
1852
474 0 16
285
74
100
12352
2916
13359
13596
104824
20859
28373
18908
383
234145
2000
‐2001
13005
667
2513
1921
490 0 16
297
75
105
13525
2912
13846
14180
111488
22010
29354
19497
477
246378
2001
‐2002
13218
697
2714
1997
512 0 17
301
78
111
14834
2955
14213
14421
119769
23024
30180
19852
537
259430
2002
‐2003
13444
717
2938
2061
556 0 19
302
78
119
16398
3085
14607
14912
129682
24056
31028
20230
597
274829
2003
‐2004
13818
758
3267
2151
642
73
23
302
79
123
17828
3260
15098
15443
139833
24911
31448
20501
645
290203
2004
‐2005
14135
829
3836
2286
667
275
26
302
79
129
19775
3252
15549
15936
153950
25657
32297
20795
737
310512
2005
‐2006
14514
867
4514
2436
709
499
33
302
79
133
21711
3305
15798
16331
168430
26129
33270
21292
823
331175
2006
‐2007
14964
884
5326
2635
743
751
48
309
81
135
23658
3481
16086
16753
184691
26367
34259
21804
853
353828
2007
‐2008
15530
917
5919
2801
769
1129
59
309
81
135
25939
3535
16389
17634
199969
26392
35211
22237
949
375904
2008
‐2009
15768
1089
6398
2935
831
1329
66
311
81
135
28339
3913
16706
19257
215333
26524
36099
22680
1054
398848
2009
‐2010
16126
1190
6746
3323
867
1476
79
312
81
135
31071
3943
16963
20590
233733
26533
36881
23249
1269
424567
2010
‐2011
16491
1362
7106
4205
910
1555
114
329
81
139
35228
4028
17131
22451
255931
26538
38373
23880
1474
457326
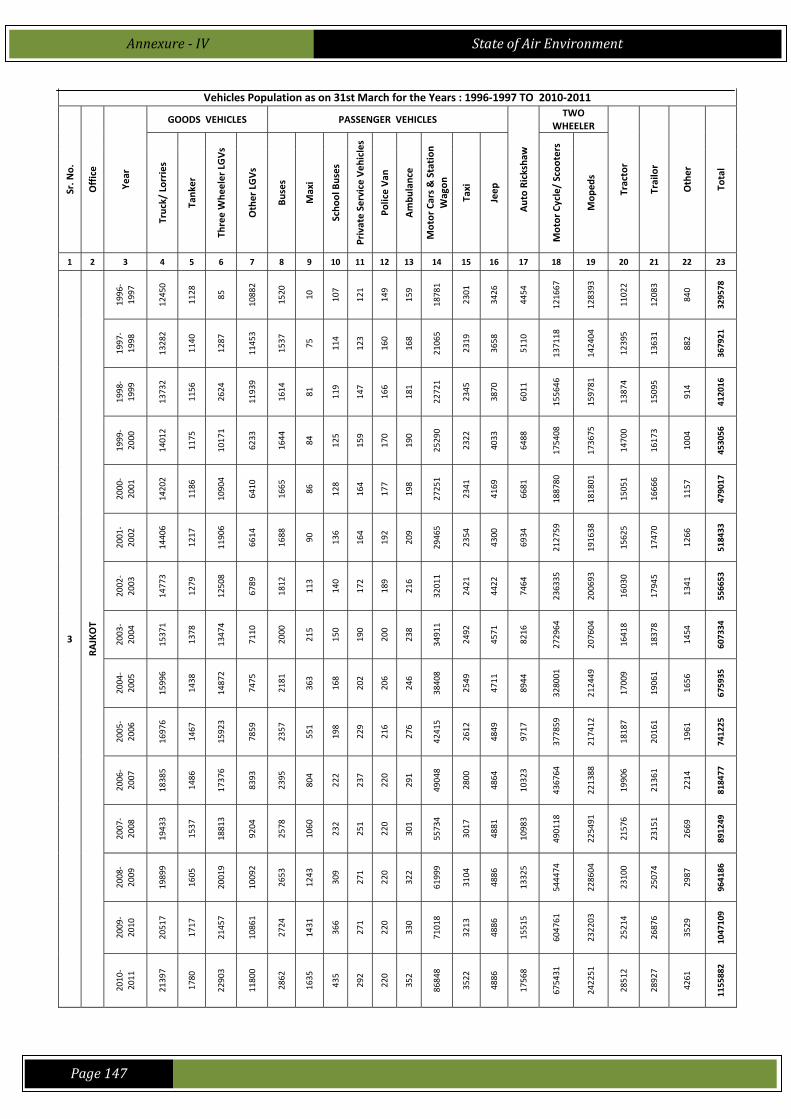
Annexure IV State of Air Environment
Page 147
Vehicles Population as on 31st March for the Years : 1996‐1997 TO 2010‐2011
Sr. N
o.
Office
Year
GOODS VEHICLES PASSENGER VEHICLES
Auto Rickshaw
TWO WHEELER
Tractor
Trailor
Other
Total
Truck/ Lorries
Tank
er
Three Whe
eler LGVs
Other LGVs
Buses
Maxi
Scho
ol Buses
Private Service Veh
icles
Police Van
Ambu
lance
Motor Cars & Station
Wagon
Taxi
Jeep
Motor Cycle/ Scoo
ters
Mop
eds
1 2 3 4 5 6 7 8 9 10 11 12 13 14 15 16 17 18 19 20 21 22 23
3
RAJKOT
1996
‐1997
12450
1128
85
10882
1520
10
107
121
149
159
18781
2301
3426
4454
121667
128393
11022
12083
840
329578
1997
‐1998
13282
1140
1287
11453
1537
75
114
123
160
168
21065
2319
3658
5110
137118
142404
12395
13631
882
367921
1998
‐1999
13732
1156
2624
11939
1614
81
119
147
166
181
22721
2345
3870
6011
155646
159781
13874
15095
914
412016
1999
‐2000
14012
1175
10171
6233
1644
84
125
159
170
190
25290
2322
4033
6488
175408
173675
14700
16173
1004
453056
2000
‐2001
14202
1186
10904
6410
1665
86
128
164
177
198
27251
2341
4169
6681
188780
181801
15051
16666
1157
479017
2001
‐2002
14406
1217
11906
6614
1688
90
136
164
192
209
29465
2354
4300
6934
212759
191638
15625
17470
1266
518433
2002
‐2003
14773
1279
12508
6789
1812
113
140
172
189
216
32011
2421
4422
7464
236335
200693
16030
17945
1341
556653
2003
‐2004
15371
1378
13474
7110
2000
215
150
190
200
238
34911
2492
4571
8216
272964
207604
16418
18378
1454
607334
2004
‐2005
15996
1438
14872
7475
2181
363
168
202
206
246
38408
2549
4711
8944
328001
212449
17009
19061
1656
675935
2005
‐2006
16976
1467
15923
7859
2357
551
198
229
216
276
42415
2612
4849
9717
377859
217412
18187
20161
1961
741225
2006
‐2007
18385
1486
17376
8393
2395
804
222
237
220
291
49048
2800
4864
10323
436764
221388
19906
21361
2214
818477
2007
‐2008
19433
1537
18813
9204
2578
1060
232
251
220
301
55734
3017
4881
10983
490118
225491
21576
23151
2669
891249
2008
‐2009
19899
1605
20019
10092
2653
1243
309
271
220
322
61999
3104
4886
13325
544474
228604
23100
25074
2987
964186
2009
‐2010
20517
1717
21457
10861
2724
1431
366
271
220
330
71018
3213
4886
15515
604761
232203
25214
26876
3529
1047109
2010
‐2011
21397
1780
22903
11800
2862
1635
435
292
220
352
86848
3522
4886
17568
675431
242251
28512
28927
4261
1155882
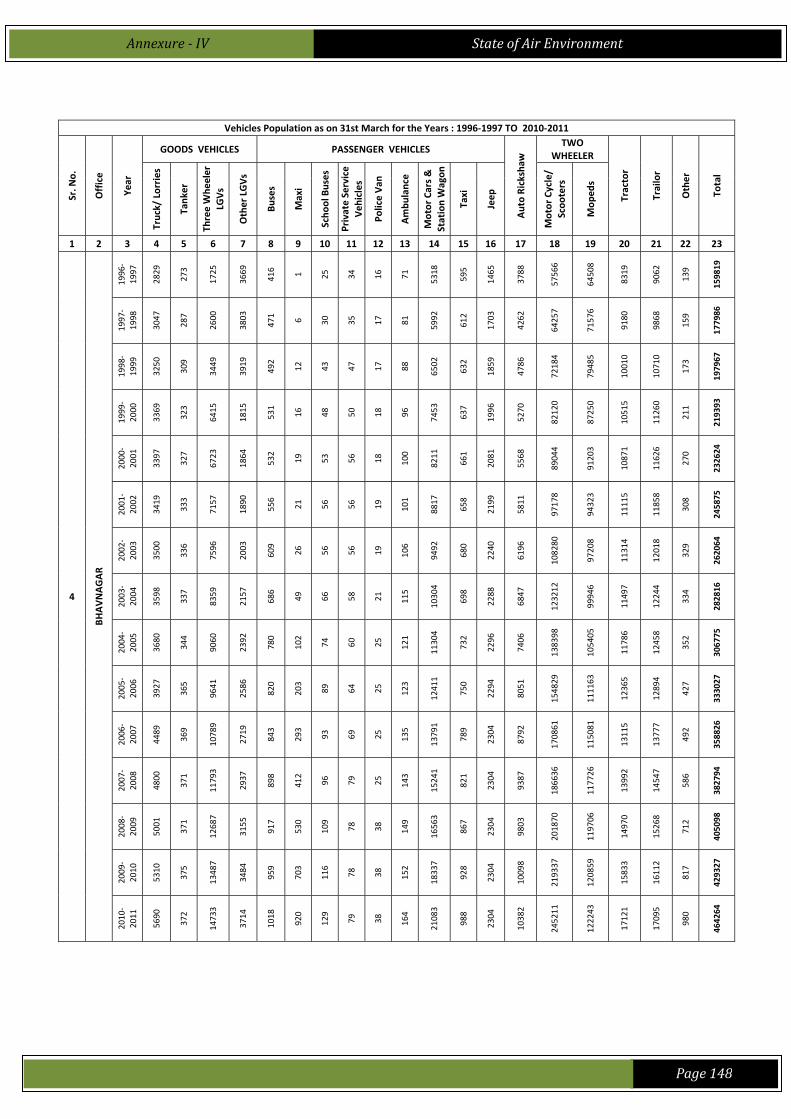
Annexure IV State of Air Environment
Page 148
Vehicles Population as on 31st March for the Years : 1996‐1997 TO 2010‐2011
Sr. N
o.
Office
Year
GOODS VEHICLES PASSENGER VEHICLES
Auto Rickshaw
TWO WHEELER
Tractor
Trailor
Other
Total
Truck/ Lorries
Tank
er
Three Whe
eler
LGVs
Other LGVs
Buses
Maxi
Scho
ol Buses
Private Service
Veh
icles
Police Van
Ambu
lance
Motor Cars &
Station Wagon
Taxi
Jeep
Motor Cycle/
Scoo
ters
Mop
eds
1 2 3 4 5 6 7 8 9 10 11 12 13 14 15 16 17 18 19 20 21 22 23
4
BHAVNAGAR
1996
‐1997
2829
273
1725
3669
416 1 25
34
16
71
5318
595
1465
3788
57566
64508
8319
9062
139
159819
1997
‐1998
3047
287
2600
3803
471 6 30
35
17
81
5992
612
1703
4262
64257
71576
9180
9868
159
177986
1998
‐1999
3250
309
3449
3919
492
12
43
47
17
88
6502
632
1859
4786
72184
79485
10010
10710
173
197967
1999
‐2000
3369
323
6415
1815
531
16
48
50
18
96
7453
637
1996
5270
82120
87250
10515
11260
211
219393
2000
‐2001
3397
327
6723
1864
532
19
53
56
18
100
8211
661
2081
5568
89044
91203
10871
11626
270
232624
2001
‐2002
3419
333
7157
1890
556
21
56
56
19
101
8817
658
2199
5811
97178
94323
11115
11858
308
245875
2002
‐2003
3500
336
7596
2003
609
26
56
56
19
106
9492
680
2240
6196
108280
97208
11314
12018
329
262064
2003
‐2004
3598
337
8359
2157
686
49
66
58
21
115
10304
698
2288
6847
123212
99946
11497
12244
334
282816
2004
‐2005
3680
344
9060
2392
780
102
74
60
25
121
11304
732
2296
7406
138398
105405
11786
12458
352
306775
2005
‐2006
3927
365
9641
2586
820
203
89
64
25
123
12411
750
2294
8051
154829
111163
12365
12894
427
333027
2006
‐2007
4489
369
10789
2719
843
293
93
69
25
135
13791
789
2304
8792
170861
115081
13115
13777
492
358826
2007
‐2008
4800
371
11793
2937
898
412
96
79
25
143
15241
821
2304
9387
186636
117726
13992
14547
586
382794
2008
‐2009
5001
371
12687
3155
917
530
109
78
38
149
16563
867
2304
9803
201870
119706
14970
15268
712
405098
2009
‐2010
5310
375
13487
3484
959
703
116
78
38
152
18337
928
2304
10098
219337
120859
15833
16112
817
429327
2010
‐2011
5690
372
14733
3714
1018
920
129
79
38
164
21083
988
2304
10382
245211
122243
17121
17095
980
464264
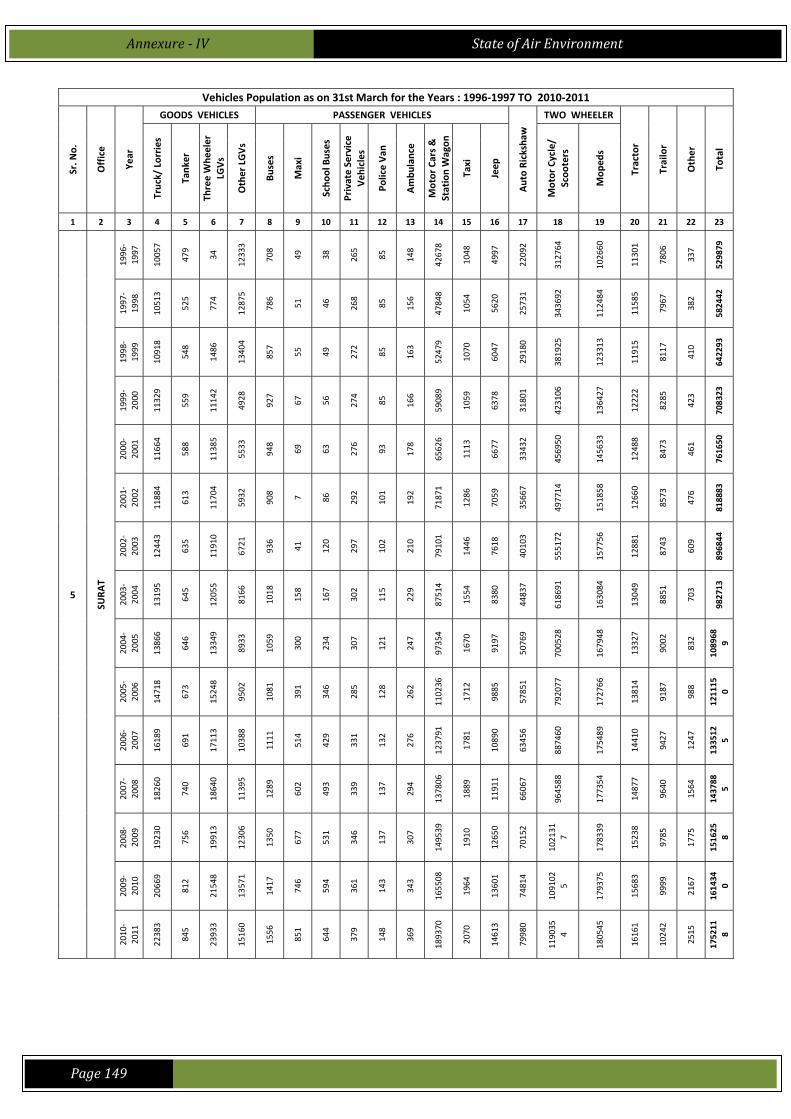
Annexure IV State of Air Environment
Page 149
Vehicles Population as on 31st March for the Years : 1996‐1997 TO 2010‐2011
Sr. N
o.
Office
Year
GOODS VEHICLES PASSENGER VEHICLES
Auto Rickshaw
TWO WHEELER
Tractor
Trailor
Other
Total
Truck/ Lorries
Tank
er
Three Whe
eler
LGVs
Other LGVs
Buses
Maxi
Scho
ol Buses
Private Service
Veh
icles
Police Van
Ambu
lance
Motor Cars &
Station Wagon
Taxi
Jeep
Motor Cycle/
Scoo
ters
Mop
eds
1 2 3 4 5 6 7 8 9 10 11 12 13 14 15 16 17 18 19 20 21 22 23
5
SURA
T
1996
‐1997
10057
479
34
12333
708
49
38
265
85
148
42678
1048
4997
22092
312764
102660
11301
7806
337
529879
1997
‐1998
10513
525
774
12875
786
51
46
268
85
156
47848
1054
5620
25731
343692
112484
11585
7967
382
582442
1998
‐1999
10918
548
1486
13404
857
55
49
272
85
163
52479
1070
6047
29180
381925
123313
11915
8117
410
642293
1999
‐2000
11329
559
11142
4928
927
67
56
274
85
166
59089
1059
6378
31801
423106
136427
12222
8285
423
708323
2000
‐2001
11664
588
11385
5533
948
69
63
276
93
178
65626
1113
6677
33432
456950
145633
12488
8473
461
761650
2001
‐2002
11884
613
11704
5932
908 7 86
292
101
192
71871
1286
7059
35667
497714
151858
12660
8573
476
818883
2002
‐2003
12443
635
11910
6721
936
41
120
297
102
210
79101
1446
7618
40103
555172
157756
12881
8743
609
896844
2003
‐2004
13195
645
12055
8166
1018
158
167
302
115
229
87514
1554
8380
44837
618691
163084
13049
8851
703
982713
2004
‐2005
13866
646
13349
8933
1059
300
234
307
121
247
97354
1670
9197
50769
700528
167948
13327
9002
832
108968
9
2005
‐2006
14718
673
15248
9502
1081
391
346
285
128
262
110236
1712
9885
57851
792077
172766
13814
9187
988
121115
0
2006
‐2007
16189
691
17113
10388
1111
514
429
331
132
276
123791
1781
10890
63456
887460
175489
14410
9427
1247
133512
5
2007
‐2008
18260
740
18640
11395
1289
602
493
339
137
294
137806
1889
11911
66067
964588
177354
14877
9640
1564
143788
5
2008
‐2009
19230
756
19913
12306
1350
677
531
346
137
307
149539
1910
12650
70152
102131
7
178339
15238
9785
1775
151625
8
2009
‐2010
20669
812
21548
13571
1417
746
594
361
143
343
165508
1964
13601
74814
109102
5
179375
15683
9999
2167
161434
0
2010
‐2011
22383
845
23933
15160
1556
851
644
379
148
369
189370
2070
14613
79980
119035
4
180545
16161
10242
2515
175211
8
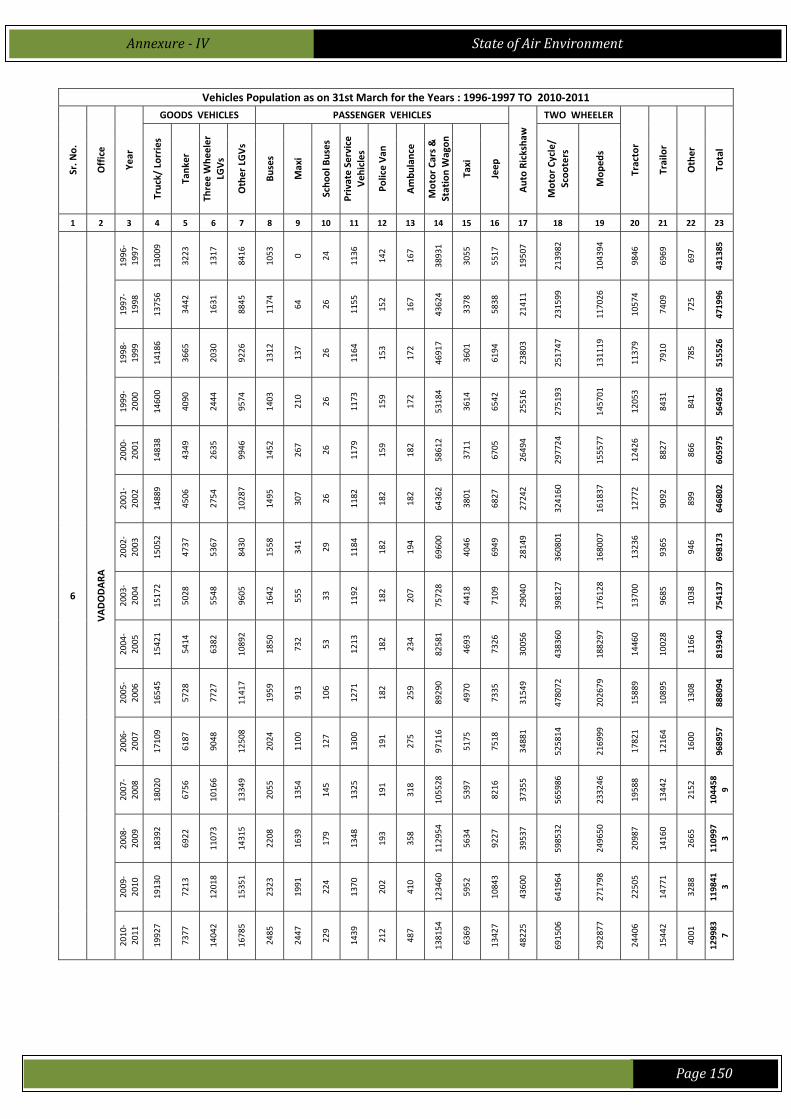
Annexure IV State of Air Environment
Page 150
Vehicles Population as on 31st March for the Years : 1996‐1997 TO 2010‐2011
Sr. N
o.
Office
Year
GOODS VEHICLES PASSENGER VEHICLES
Auto Rickshaw
TWO WHEELER
Tractor
Trailor
Other
Total
Truck/ Lorries
Tank
er
Three Whe
eler
LGVs
Other LGVs
Buses
Maxi
Scho
ol Buses
Private Service
Veh
icles
Police Van
Ambu
lance
Motor Cars &
Station Wagon
Taxi
Jeep
Motor Cycle/
Scoo
ters
Mop
eds
1 2 3 4 5 6 7 8 9 10 11 12 13 14 15 16 17 18 19 20 21 22 23
6
VADODARA
1996
‐1997
13009
3223
1317
8416
1053
0 24
1136
142
167
38931
3055
5517
19507
213982
104394
9846
6969
697
431385
1997
‐1998
13756
3442
1631
8845
1174
64
26
1155
152
167
43624
3378
5838
21411
231599
117026
10574
7409
725
471996
1998
‐1999
14186
3665
2030
9226
1312
137
26
1164
153
172
46917
3601
6194
23803
251747
131119
11379
7910
785
515526
1999
‐2000
14600
4090
2444
9574
1403
210
26
1173
159
172
53184
3614
6542
25516
275193
145701
12053
8431
841
564926
2000
‐2001
14838
4349
2635
9946
1452
267
26
1179
159
182
58612
3711
6705
26494
297724
155577
12426
8827
866
605975
2001
‐2002
14889
4506
2754
10287
1495
307
26
1182
182
182
64362
3801
6827
27242
324160
161837
12772
9092
899
646802
2002
‐2003
15052
4737
5367
8430
1558
341
29
1184
182
194
69600
4046
6949
28149
360801
168007
13236
9365
946
698173
2003
‐2004
15172
5028
5548
9605
1642
555
33
1192
182
207
75728
4418
7109
29040
398127
176128
13700
9685
1038
754137
2004
‐2005
15421
5414
6382
10892
1850
732
53
1213
182
234
82581
4693
7326
30056
438360
188297
14460
10028
1166
819340
2005
‐2006
16545
5728
7727
11417
1959
913
106
1271
182
259
89290
4970
7335
31549
478072
202679
15889
10895
1308
888094
2006
‐2007
17109
6187
9048
12508
2024
1100
127
1300
191
275
97116
5175
7518
34881
525814
216999
17821
12164
1600
968957
2007
‐2008
18020
6756
10166
13349
2055
1354
145
1325
191
318
105528
5397
8216
37355
565986
233246
19588
13442
2152
104458
9
2008
‐2009
18392
6922
11073
14315
2208
1639
179
1348
193
358
112954
5634
9227
39537
598532
249650
20987
14160
2665
110997
3
2009
‐2010
19130
7213
12018
15351
2323
1991
224
1370
202
410
123460
5952
10843
43600
641964
271798
22505
14771
3288
119841
3
2010
‐2011
19927
7377
14042
16785
2485
2447
229
1439
212
487
138154
6369
13427
48225
691506
292877
24406
15442
4001
129983
7

Annexure IV State of Air Environment
Page 151
Vehicles Population as on 31st March for the Years : 1996‐1997 TO 2010‐2011
Sr. N
o.
Office
Year
GOODS VEHICLES PASSENGER VEHICLES TWO WHEELER
Tractor
Trailor
Other
Total
Truck/ Lorries
Tank
er
Three Whe
eler
LGVs
Other LGVs
Buses
Maxi
Scho
ol Buses
Private Service
Veh
icles
Police Van
Ambu
lance
Motor Cars &
Station Wagon
Taxi
Jeep
Auto Rickshaw
Motor Cycle/
Scoo
ters
Mop
eds
1 2 3 4 5 6 7 8 9 10 11 12 13 14 15 16 17 18 19 20 21 22 23
7
NADIAD
1996
‐1997
11491
456
2808
7240
502 2 9 89
51
94
20103
2497
3933
21469
114483
46935
25202
15490
115
272969
1997
‐1998
12321
535
3229
7836
545 4 9 97
61
100
22175
2551
4740
24865
126699
50498
27006
16572
121
299964
1998
‐1999
12591
546
3696
8211
581 4 9 100
65
107
23731
2578
5340
28864
140957
54132
28956
17650
124
328242
1999
‐2000
13069
569
4215
8712
640 6 9 103
67
115
26207
2570
6023
32017
157209
58479
30858
18704
132
359704
2000
‐2001
13308
577
4592
9003
661
15
12
106
76
124
28097
2578
6636
34077
170109
61823
32863
19580
148
384385
2001
‐2002
13415
584
4974
9201
668
26
16
99
84
133
29939
2583
7073
34997
184165
64500
34659
20055
163
407334
2002
‐2003
13565
589
5406
9520
675
39
18
99
84
138
31901
2600
7566
37069
199574
67181
36248
20436
185
432893
2003
‐2004
13662
594
5819
9827
694
62
18
101
84
141
32879
2605
7858
38342
208348
68267
36844
20659
212
447016
2004
‐2005
13716
595
6396
10052
697
110
18
99
91
143
33764
2618
8144
39339
218989
69060
37648
20847
228
462554
2005
‐2006
13774
601
7238
10326
718
151
23
100
98
149
34739
2627
8365
40327
231326
69640
38862
21250
311
480625
2006
‐2007
13949
604
8030
10777
713
208
32
101
101
156
35975
2631
8541
41110
244792
70082
40222
21848
357
500229
2007
‐2008
14083
607
8562
11313
723
258
40
101
101
163
37233
2647
8767
42193
256556
70513
41885
22452
410
518607
2008
‐2009
14127
614
8927
11693
722
321
53
101
101
184
38447
2644
8888
43913
267694
70823
43192
22904
420
535768
2009
‐2010
14279
615
9452
12061
739
393
60
101
104
203
40549
2676
9059
46749
283150
71272
44363
23388
426
559639
2010
‐2011
14382
617
10028
12676
780
517
60
101
104
210
43572
2705
9194
50859
302628
72104
45994
23967
440
590938

Annexure IV State of Air Environment
Page 152
Vehicles Population as on 31st March for the Years : 1996‐1997 TO 2010‐2011
Sr. N
o.
Office
Year
GOODS VEHICLES PASSENGER VEHICLES TWO WHEELER
Tractor
Trailor
Other
Total
Truck/ Lorries
Tank
er
Three Whe
eler
LGVs
Other LGVs
Buses
Maxi
Scho
ol Buses
Private Service
Veh
icles
Police Van
Ambu
lance
Motor Cars &
Station Wagon
Taxi
Jeep
Auto Rickshaw
Motor Cycle/
Scoo
ters
Mop
eds
1 2 3 4 5 6 7 8 9 10 11 12 13 14 15 16 17 18 19 20 21 22
8
PALA
MPU
R
1996
‐1997
1248
168
220
1496
66
0 14
12
17
38
1439
574
3842
2982
17307
3622
13516
6496
14
53071
1997
‐1998
1369
172
284
1745
67
0 15
15
21
41
1623
528
4340
3306
19484
3969
15512
7357
18
59866
1998
‐1999
1474
174
385
2067
67
0 8 15
17
36
1817
512
4989
3780
23140
4562
18273
8459
20
69795
1999
‐2000
1635
179
479
2343
71
0 8 15
18
37
2227
504
5557
4177
27102
5273
20447
9408
22
79502
2000
‐2001
1709
180
531
2531
63
0 10
12
15
39
2789
482
5988
4466
29469
5837
21790
9947
32
85890
2001
‐2002
2028
185
610
2687
37
0 12
12
18
40
3266
477
6321
4643
32599
6364
23050
10361
38
92748
2002
‐2003
2448
185
693
2898
41
1 13
12
34
41
3796
489
6601
4922
36350
6889
24504
10753
53
100723
2003
‐2004
2689
185
929
3069
52
100
16
15
35
41
4395
558
7165
5224
40471
7449
25226
11042
60
108721
2004
‐2005
2863
185
1611
3069
63
147
34
18
47
41
5173
643
7962
5508
46589
7913
26961
11515
82
120424
2005
‐2006
3197
187
2178
3346
67
249
34
18
47
45
6032
700
8464
5935
54546
8633
29469
12418
108
135673
2006
‐2007
3541
187
2798
3593
74
364
34
18
47
46
6807
764
8944
6452
63372
9454
31751
12984
133
151363
2007
‐2008
3777
187
3224
3593
74
426
34
18
47
49
7941
777
9326
6878
71663
9454
33770
13641
171
165050
2008
‐2009
3922
187
3629
3593
74
490
34
18
47
49
8820
777
9886
7298
80626
9454
35303
14506
195
178908
2009
‐2010
4199
187
4169
3593
74
594
34
18
47
49
10382
777
10493
8132
92150
9454
36737
15679
215
196983
2010
‐2011
4511
187
4602
3593
76
610
34
18
47
49
12127
777
11104
8858
105931
9454
38819
17058
331
218186

Annexure IV State of Air Environment
Page 153
Vehicles Population as on 31st March for the Years : 1996‐1997 TO 2010‐2011
Sr. N
o.
Office
Year
GOODS VEHICLES PASSENGER VEHICLES
Auto Rickshaw
TWO WHEELER
Tractor
Trailor
Other
Total
Truck/ Lorries
Tank
er
Three Whe
eler LGVs
Other LGVs
Buses
Maxi
Scho
ol Buses
Private Service Veh
icles
Police Van
Ambu
lance
Motor Cars & Station
Wagon
Taxi
Jeep
Motor Cycle/ Scoo
ters
Mop
eds
1 2 3 4 5 6 7 8 9 10 11 12 13 14 15 16 17 18 19 20 21 22 23
9
HIM
ATN
AGAR
1996
‐1997
6527
55
44
1467
48
0 2 4 12
18
1749
896
4008
3655
38234
7143
10850
7311
18
82041
1997
‐1998
7648
55
44
1579
48
0 2 6 14
20
2029
901
4219
4421
43211
8510
12693
8425
18
93843
1998
‐1999
8277
58
50
1787
49
2 2 6 14
20
2378
902
4565
5054
50931
10967
14498
9539
19
109118
1999
‐2000
8895
58
52
1985
51
3 2 6 15
21
3101
915
5239
5650
61934
13207
16326
10399
19
127878
2000
‐2001
9128
61
52
2091
55
4 2 6 16
22
3596
937
5581
6020
70380
14370
17332
10866
20
140539
2001
‐2002
9331
61
62
2228
56
6 2 6 16
23
4204
954
6083
6313
78271
15653
18315
11178
20
152782
2002
‐2003
9652
63
214
2285
57
7 3 6 24
23
4949
961
6427
6839
88236
17014
19327
11439
22
167548
2003
‐2004
10152
63
470
2461
60
22
3 6 24
23
5740
963
6937
7573
100778
18325
20113
11650
23
185386
2004
‐2005
10652
63
912
2705
63
40
4 6 24
24
6874
964
7883
8254
120513
19369
21312
11928
39
211629
2005
‐2006
11399
63
1729
3081
66
98
4 6 24
26
8134
965
8551
9333
142652
20150
22924
12294
65
241564
2006
‐2007
12436
67
2463
3472
65
224 4 6 24
35
9854
970
8992
10288
160467
20411
24482
12826
126
267212
2007
‐2008
13223
74
2856
3947
71
303
20
8 24
39
11591
1000
9240
10797
177260
20466
25827
13192
208
290146
2008
‐2009
13680
78
3172
4462
74
383
31
8 24
44
13136
1006
9590
11474
192595
20643
27147
13642
288
311477
2009
‐2010
14167
82
3419
5124
78
508
40
8 40
46
15883
1012
9750
12445
213448
20653
28372
14107
398
339580
2010
‐2011
14879
89
3684
5808
93
624
47
8 40
51
20090
1024
10057
13768
241832
20704
30209
14652
482
378141
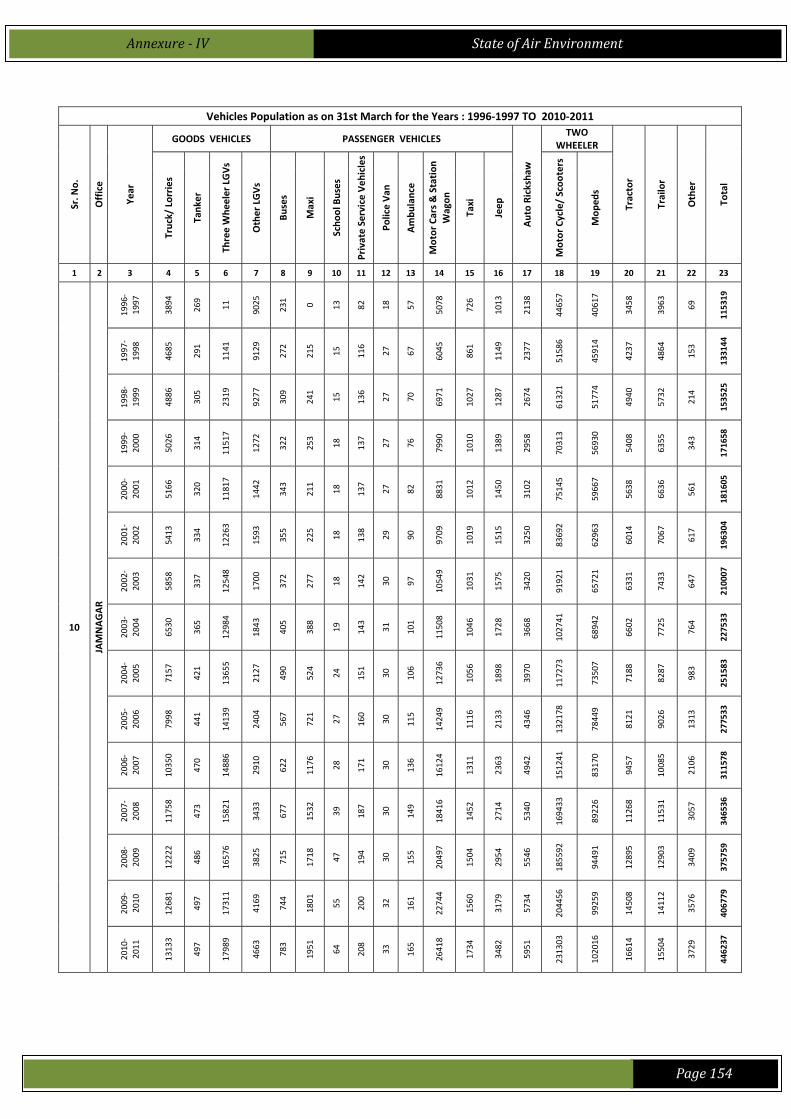
Annexure IV State of Air Environment
Page 154
Vehicles Population as on 31st March for the Years : 1996‐1997 TO 2010‐2011
Sr. N
o.
Office
Year
GOODS VEHICLES PASSENGER VEHICLES
Auto Rickshaw
TWO WHEELER
Tractor
Trailor
Other
Total
Truck/ Lorries
Tank
er
Three Whe
eler LGVs
Other LGVs
Buses
Maxi
Scho
ol Buses
Private Service Veh
icles
Police Van
Ambu
lance
Motor Cars & Station
Wagon
Taxi
Jeep
Motor Cycle/ Scoo
ters
Mop
eds
1 2 3 4 5 6 7 8 9 10 11 12 13 14 15 16 17 18 19 20 21 22 23
10
JAMNAGAR
1996
‐1997
3894
269
11
9025
231 0 13
82
18
57
5078
726
1013
2138
44657
40617
3458
3963
69
115319
1997
‐1998
4685
291
1141
9129
272
215
15
116
27
67
6045
861
1149
2377
51586
45914
4237
4864
153
133144
1998
‐1999
4886
305
2319
9277
309
241
15
136
27
70
6971
1027
1287
2674
61321
51774
4940
5732
214
153525
1999
‐2000
5026
314
11517
1272
322
253
18
137
27
76
7990
1010
1389
2958
70313
56930
5408
6355
343
171658
2000
‐2001
5166
320
11817
1442
343
211
18
137
27
82
8831
1012
1450
3102
75145
59667
5638
6636
561
181605
2001
‐2002
5413
334
12263
1593
355
225
18
138
29
90
9709
1019
1515
3250
83692
62963
6014
7067
617
196304
2002
‐2003
5858
337
12548
1700
372
277
18
142
30
97
10549
1031
1575
3420
91921
65721
6331
7433
647
210007
2003
‐2004
6530
365
12984
1843
405
388
19
143
31
101
11508
1046
1728
3668
102741
68942
6602
7725
764
227533
2004
‐2005
7157
421
13655
2127
490
524
24
151
30
106
12736
1056
1898
3970
117273
73507
7188
8287
983
251583
2005
‐2006
7998
441
14139
2404
567
721
27
160
30
115
14249
1116
2133
4346
132178
78449
8121
9026
1313
277533
2006
‐2007
10350
470
14886
2910
622
1176
28
171
30
136
16124
1311
2363
4942
151241
83170
9457
10085
2106
311578
2007
‐2008
11758
473
15821
3433
677
1532
39
187
30
149
18416
1452
2714
5340
169433
89226
11268
11531
3057
346536
2008
‐2009
12222
486
16576
3825
715
1718
47
194
30
155
20497
1504
2954
5546
185592
94491
12895
12903
3409
375759
2009
‐2010
12681
497
17311
4169
744
1801
55
200
32
161
22744
1560
3179
5734
204456
99259
14508
14112
3576
406779
2010
‐2011
13133
497
17989
4663
783
1951
64
208
33
165
26418
1734
3482
5951
231303
102016
16614
15504
3729
446237
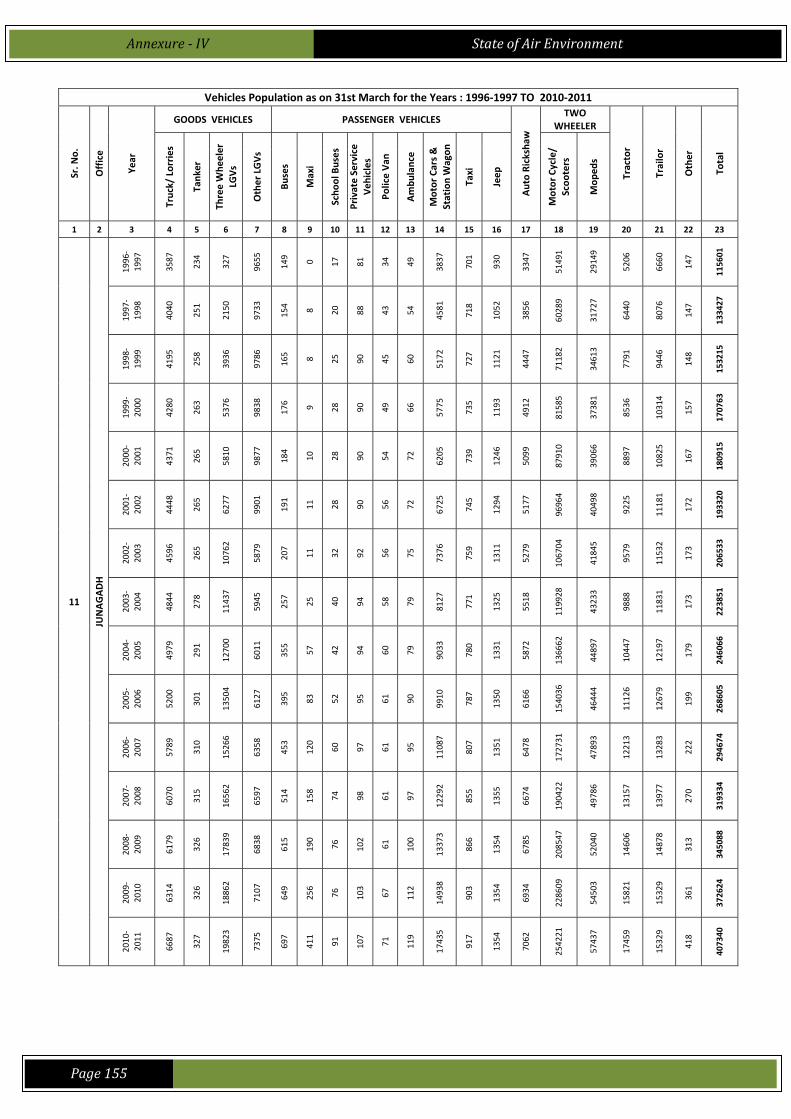
Annexure IV State of Air Environment
Page 155
Vehicles Population as on 31st March for the Years : 1996‐1997 TO 2010‐2011
Sr. N
o.
Office
Year
GOODS VEHICLES PASSENGER VEHICLES
Auto Rickshaw
TWO WHEELER
Tractor
Trailor
Other
Total
Truck/ Lorries
Tank
er
Three Whe
eler
LGVs
Other LGVs
Buses
Maxi
Scho
ol Buses
Private Service
Veh
icles
Police Van
Ambu
lance
Motor Cars &
Station Wagon
Taxi
Jeep
Motor Cycle/
Scoo
ters
Mop
eds
1 2 3 4 5 6 7 8 9 10 11 12 13 14 15 16 17 18 19 20 21 22 23
11
JUNAGADH
1996
‐1997
3587
234
327
9655
149 0 17
81
34
49
3837
701
930
3347
51491
29149
5206
6660
147
115601
1997
‐1998
4040
251
2150
9733
154 8 20
88
43
54
4581
718
1052
3856
60289
31727
6440
8076
147
133427
1998
‐1999
4195
258
3936
9786
165 8 25
90
45
60
5172
727
1121
4447
71182
34613
7791
9446
148
153215
1999
‐2000
4280
263
5376
9838
176 9 28
90
49
66
5775
735
1193
4912
81585
37381
8536
10314
157
170763
2000
‐2001
4371
265
5810
9877
184
10
28
90
54
72
6205
739
1246
5099
87910
39066
8897
10825
167
180915
2001
‐2002
4448
265
6277
9901
191
11
28
90
56
72
6725
745
1294
5177
96964
40498
9225
11181
172
193320
2002
‐2003
4596
265
10762
5879
207
11
32
92
56
75
7376
759
1311
5279
106704
41845
9579
11532
173
206533
2003
‐2004
4844
278
11437
5945
257
25
40
94
58
79
8127
771
1325
5518
119928
43233
9888
11831
173
223851
2004
‐2005
4979
291
12700
6011
355
57
42
94
60
79
9033
780
1331
5872
136662
44897
10447
12197
179
246066
2005
‐2006
5200
301
13504
6127
395
83
52
95
61
90
9910
787
1350
6166
154036
46444
11126
12679
199
268605
2006
‐2007
5789
310
15266
6358
453
120
60
97
61
95
11087
807
1351
6478
172731
47893
12213
13283
222
294674
2007
‐2008
6070
315
16562
6597
514
158
74
98
61
97
12292
855
1355
6674
190422
49786
13157
13977
270
319334
2008
‐2009
6179
326
17839
6838
615
190
76
102
61
100
13373
866
1354
6785
208547
52040
14606
14878
313
345088
2009
‐2010
6314
326
18862
7107
649
256
76
103
67
112
14938
903
1354
6934
228609
54503
15821
15329
361
372624
2010
‐2011
6687
327
19823
7375
697
411
91
107
71
119
17435
917
1354
7062
254221
57437
17459
15329
418
407340
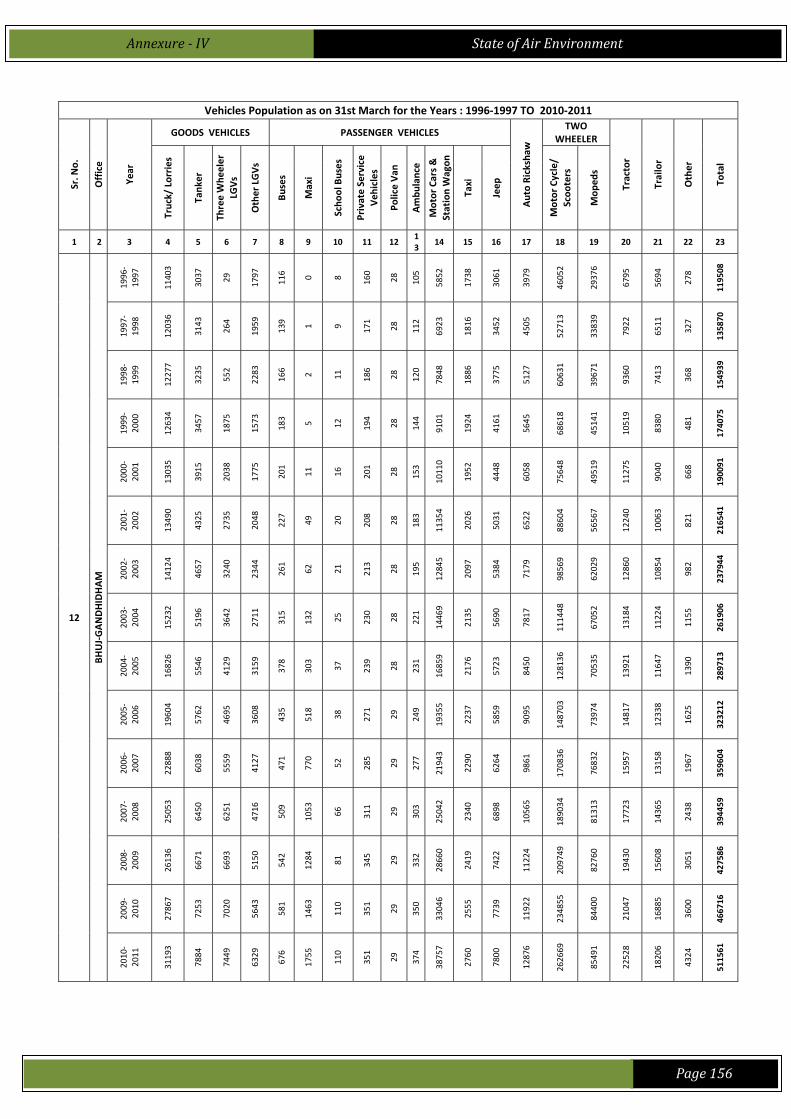
Annexure IV State of Air Environment
Page 156
Vehicles Population as on 31st March for the Years : 1996‐1997 TO 2010‐2011
Sr. N
o.
Office
Year
GOODS VEHICLES PASSENGER VEHICLES
Auto Rickshaw
TWO WHEELER
Tractor
Trailor
Other
Total
Truck/ Lorries
Tank
er
Three Whe
eler
LGVs
Other LGVs
Buses
Maxi
Scho
ol Buses
Private Service
Veh
icles
Police Van
Ambu
lance
Motor Cars &
Station Wagon
Taxi
Jeep
Motor Cycle/
Scoo
ters
Mop
eds
1 2 3 4 5 6 7 8 9 10 11 12 13
14 15 16 17 18 19 20 21 22 23
12
BHUJ‐GANDHIDHAM
1996
‐1997
11403
3037
29
1797
116 0 8 160
28
105
5852
1738
3061
3979
46052
29376
6795
5694
278
119508
1997
‐1998
12036
3143
264
1959
139 1 9 171
28
112
6923
1816
3452
4505
52713
33839
7922
6511
327
135870
1998
‐1999
12277
3235
552
2283
166 2 11
186
28
120
7848
1886
3775
5127
60631
39671
9360
7413
368
154939
1999
‐2000
12634
3457
1875
1573
183 5 12
194
28
144
9101
1924
4161
5645
68618
45141
10519
8380
481
174075
2000
‐2001
13035
3915
2038
1775
201
11
16
201
28
153
10110
1952
4448
6058
75648
49519
11275
9040
668
190091
2001
‐2002
13490
4325
2735
2048
227
49
20
208
28
183
11354
2026
5031
6522
88604
56567
12240
10063
821
216541
2002
‐2003
14124
4657
3240
2344
261
62
21
213
28
195
12845
2097
5384
7179
98569
62029
12860
10854
982
237944
2003
‐2004
15232
5196
3642
2711
315
132
25
230
28
221
14469
2135
5690
7817
111448
67052
13184
11224
1155
261906
2004
‐2005
16826
5546
4129
3159
378
303
37
239
28
231
16859
2176
5723
8450
128136
70535
13921
11647
1390
289713
2005
‐2006
19604
5762
4695
3608
435
518
38
271
29
249
19355
2237
5859
9095
148703
73974
14817
12338
1625
323212
2006
‐2007
22888
6038
5559
4127
471
770
52
285
29
277
21943
2290
6264
9861
170836
76832
15957
13158
1967
359604
2007
‐2008
25053
6450
6251
4716
509
1053
66
311
29
303
25042
2340
6898
10565
189034
81313
17723
14365
2438
394459
2008
‐2009
26136
6671
6693
5150
542
1284
81
345
29
332
28660
2419
7422
11224
209749
82760
19430
15608
3051
427586
2009
‐2010
27867
7253
7020
5643
581
1463
110
351
29
350
33046
2555
7739
11922
234855
84400
21047
16885
3600
466716
2010
‐2011
31193
7884
7449
6329
676
1755
110
351
29
374
38757
2760
7800
12876
262669
85491
22528
18206
4324
511561

Annexure IV State of Air Environment
Page 157
Vehicles Population as on 31st March for the Years : 1996‐1997 TO 2010‐2011
Sr. N
o.
Office
Year
GOODS VEHICLES PASSENGER VEHICLES
Auto Rickshaw
TWO WHEELER
Tractor
Trailor
Other
Total
Truck/ Lorries
Tank
er
Three Whe
eler
LGVs
Other LGVs
Buses
Maxi
Scho
ol Buses
Private Service
Veh
icles
Police Van
Ambu
lance
Motor Cars &
Station Wagon
Taxi
Jeep
Motor Cycle/
Scoo
ters
Mop
eds
1 2 3 4 5 6 7 8 9 10 11 12 13 14 15 16 17 18 19 20 21 22 23
13
SURE
NDRA
NAGAR
1996
‐1997
942
55
1
1435
55
0 2 24
11
22
1117
318
411
333
16736
13420
7213
5945
16
48056
1997
‐1998
1051
56
412
1526
58
5 2 25
12
23
1403
339
495
515
20121
16093
8630
6997
18
57781
1998
‐1999
1128
59
938
1625
60
8 2 25
12
23
1672
349
584
671
24649
19432
10678
8210
19
70144
1999
‐2000
1165
61
1470
1763
61
6 2 25
12
24
2028
346
664
825
28854
22431
11806
9162
35
80740
2000
‐2001
1177
62
1765
1838
60
5 2 25
14
25
2327
356
714
930
32152
23936
12508
9623
60
87579
2001
‐2002
1204
61
2290
1923
63
6 2 25
13
26
2728
360
770
1021
37145
25415
13582
10128
67
96829
2002
‐2003
1239
61
2643
1995
71
5 2 26
13
31
3151
368
825
1175
42864
26556
14617
10550
71
106263
2003
‐2004
1288
61
3121
2065
109 5 2 26
13
35
3571
394
895
1396
49437
27485
15247
10952
72
116174
2004
‐2005
1404
61
3713
2213
151
33
2 26
13
35
4090
417
941
1587
57586
28177
16113
11300
90
127952
2005
‐2006
1462
61
4286
2392
175
63
2 26
13
37
4729
426
974
1784
67287
28635
17216
11811
106
141485
2006
‐2007
1586
61
4895
2669
185
102 2 26
13
44
5618
428
983
2162
78609
29041
18503
12414
154
157495
2007
‐2008
1738
61
5594
2948
209
153 8 26
13
44
6394
432
983
2315
87343
29443
19845
13230
250
171029
2008
‐2009
1839
61
6287
3100
224
194
11
26
13
45
7115
433
983
2493
96153
29756
21498
14351
350
184932
2009
‐2010
1879
61
7007
3306
226
244
11
26
13
45
7962
433
983
2775
107166
29995
22374
15078
378
199962
2010
‐2011
2071
61
7382
3580
229
282
11
26
13
45
9068
490
993
3406
119130
30134
23909
15508
397
216735
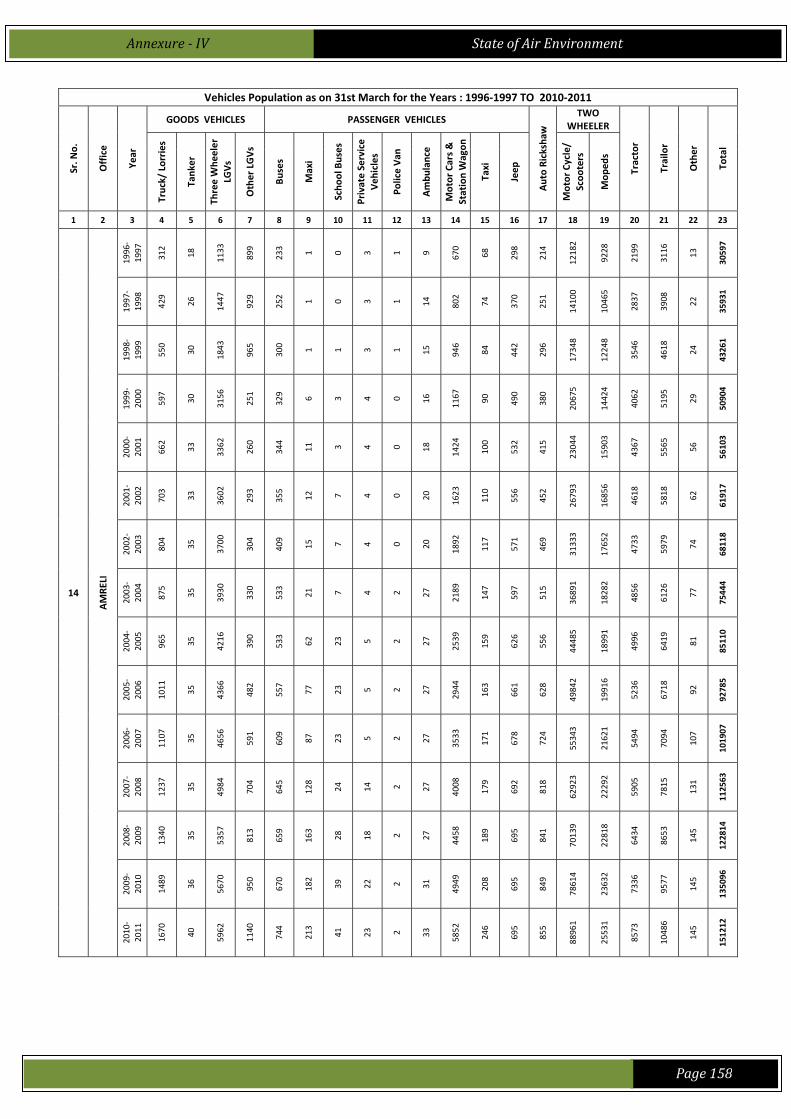
Annexure IV State of Air Environment
Page 158
Vehicles Population as on 31st March for the Years : 1996‐1997 TO 2010‐2011
Sr. N
o.
Office
Year
GOODS VEHICLES PASSENGER VEHICLES
Auto Rickshaw
TWO WHEELER
Tractor
Trailor
Other
Total
Truck/ Lorries
Tank
er
Three Whe
eler
LGVs
Other LGVs
Buses
Maxi
Scho
ol Buses
Private Service
Veh
icles
Police Van
Ambu
lance
Motor Cars &
Station Wagon
Taxi
Jeep
Motor Cycle/
Scoo
ters
Mop
eds
1 2 3 4 5 6 7 8 9 10 11 12 13 14 15 16 17 18 19 20 21 22 23
14
AMRE
LI
1996
‐1997
312
18
1133
899
233 1 0 3 1 9 670
68
298
214
12182
9228
2199
3116
13
30597
1997
‐1998
429
26
1447
929
252 1 0 3 1 14
802
74
370
251
14100
10465
2837
3908
22
35931
1998
‐1999
550
30
1843
965
300 1 1 3 1 15
946
84
442
296
17348
12248
3546
4618
24
43261
1999
‐2000
597
30
3156
251
329 6 3 4 0 16
1167
90
490
380
20675
14424
4062
5195
29
50904
2000
‐2001
662
33
3362
260
344
11
3 4 0 18
1424
100
532
415
23044
15903
4367
5565
56
56103
2001
‐2002
703
33
3602
293
355
12
7 4 0 20
1623
110
556
452
26793
16856
4618
5818
62
61917
2002
‐2003
804
35
3700
304
409
15
7 4 0 20
1892
117
571
469
31333
17652
4733
5979
74
68118
2003
‐2004
875
35
3930
330
533
21
7 4 2 27
2189
147
597
515
36891
18282
4856
6126
77
75444
2004
‐2005
965
35
4216
390
533
62
23
5 2 27
2539
159
626
556
44485
18991
4996
6419
81
85110
2005
‐2006
1011
35
4366
482
557
77
23
5 2 27
2944
163
661
628
49842
19916
5236
6718
92
92785
2006
‐2007
1107
35
4656
591
609
87
23
5 2 27
3533
171
678
724
55343
21621
5494
7094
107
101907
2007
‐2008
1237
35
4984
704
645
128
24
14
2 27
4008
179
692
818
62923
22292
5905
7815
131
112563
2008
‐2009
1340
35
5357
813
659
163
28
18
2 27
4458
189
695
841
70139
22818
6434
8653
145
122814
2009
‐2010
1489
36
5670
950
670
182
39
22
2 31
4949
208
695
849
78614
23632
7336
9577
145
135096
2010
‐2011
1670
40
5962
1140
744
213
41
23
2 33
5852
246
695
855
88961
25531
8573
10486
145
151212

Annexure IV State of Air Environment
Page 159
Vehicles Population as on 31st March for the Years : 1996‐1997 TO 2010‐2011
Sr. N
o.
Office
Year
GOODS VEHICLES PASSENGER VEHICLES
Auto Rickshaw
TWO WHEELER
Tractor
Trailor
Other
Total
Truck/ Lorries
Tank
er
Three Whe
eler
LGVs
Other LGVs
Buses
Maxi
Scho
ol Buses
Private Service
Veh
icles
Police Van
Ambu
lance
Motor Cars &
Station Wagon
Taxi
Jeep
Motor Cycle/
Scoo
ters
Mop
eds
1 2 3 4 5 6 7 8 9 10 11 12 13 14 15 16 17 18 19 20 21 22 23
15
VALSAD
1996
‐1997
3725
304
353
7779
103 0 11
95
20
64
15841
5523
3267
11049
105119
44210
5407
4023
148
207041
1997
‐1998
3901
324
796
8335
104 3 12
95
26
71
16977
5299
3649
12517
116153
48068
5631
4202
184
226347
1998
‐1999
4112
333
1137
8707
110 5 12
98
26
94
18278
5158
3958
13858
129144
52252
5800
4399
212
247693
1999
‐2000
4381
364
2203
8481
134 6 15
99
30
103
20504
5298
4295
15034
143058
57514
5994
4583
260
272356
2000
‐2001
4526
381
2511
8721
133 8 19
104
32
109
21649
5380
4405
15804
150704
59467
6085
4684
327
285049
2001
‐2002
4550
391
2825
8847
132
11
25
104
34
112
22542
5409
4505
16793
160486
61336
6141
4760
372
299375
2002
‐2003
4616
408
3152
9070
59
18
28
105
34
115
23878
5480
4690
17997
172381
63320
6201
4854
471
316877
2003
‐2004
4849
405
3800
9300
68
55
40
102
36
117
25554
5533
4987
19336
186582
65014
6253
4933
563
337527
2004
‐2005
5240
401
4642
9599
66
86
54
107
36
117
27414
5559
5363
20822
204566
66468
6347
5004
668
362559
2005
‐2006
5805
406
5391
10027
72
109
64
110
37
128
29786
5561
5760
22150
224403
67893
6497
5126
866
390191
2006
‐2007
6705
389
6244
10440
95
123
86
115
37
130
32617
5576
6131
23574
248652
69312
6817
5343
1096
423482
2007
‐2008
7437
396
6614
11184
109
143
97
120
37
135
35742
5600
6541
24974
265829
73180
7109
5553
1221
452021
2008
‐2009
7881
391
6790
11949
109
163
109
124
37
139
38767
5609
6880
26551
280552
77022
7387
5699
1300
477459
2009
‐2010
8347
401
7023
12738
114
185
124
129
40
145
42543
5626
7090
28263
298036
80650
7555
5803
1391
506203
2010
‐2011
9049
409
7305
13738
115
224
151
140
41
157
48123
5633
7300
30083
319765
85766
7827
5938
1537
543301
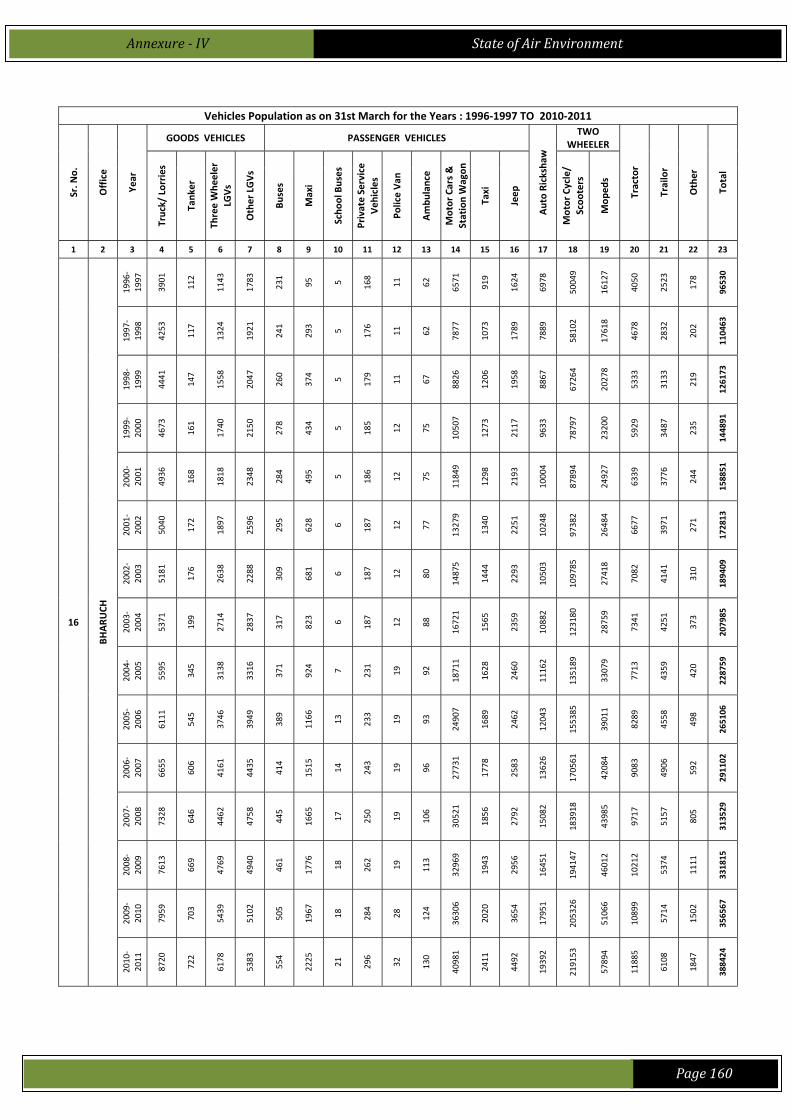
Annexure IV State of Air Environment
Page 160
Vehicles Population as on 31st March for the Years : 1996‐1997 TO 2010‐2011
Sr. N
o.
Office
Year
GOODS VEHICLES PASSENGER VEHICLES
Auto Rickshaw
TWO WHEELER
Tractor
Trailor
Other
Total
Truck/ Lorries
Tank
er
Three Whe
eler
LGVs
Other LGVs
Buses
Maxi
Scho
ol Buses
Private Service
Veh
icles
Police Van
Ambu
lance
Motor Cars &
Station Wagon
Taxi
Jeep
Motor Cycle/
Scoo
ters
Mop
eds
1 2 3 4 5 6 7 8 9 10 11 12 13 14 15 16 17 18 19 20 21 22 23
16
BHARU
CH
1996
‐1997
3901
112
1143
1783
231
95
5 168
11
62
6571
919
1624
6978
50049
16127
4050
2523
178
96530
1997
‐1998
4253
117
1324
1921
241
293 5 176
11
62
7877
1073
1789
7889
58102
17618
4678
2832
202
110463
1998
‐1999
4441
147
1558
2047
260
374 5 179
11
67
8826
1206
1958
8867
67264
20278
5333
3133
219
126173
1999
‐2000
4673
161
1740
2150
278
434 5 185
12
75
10507
1273
2117
9633
78797
23200
5929
3487
235
144891
2000
‐2001
4936
168
1818
2348
284
495 5 186
12
75
11849
1298
2193
10004
87894
24927
6339
3776
244
158851
2001
‐2002
5040
172
1897
2596
295
628 6 187
12
77
13279
1340
2251
10248
97382
26484
6677
3971
271
172813
2002
‐2003
5181
176
2638
2288
309
681 6 187
12
80
14875
1444
2293
10503
109785
27418
7082
4141
310
189409
2003
‐2004
5371
199
2714
2837
317
823 6 187
12
88
16721
1565
2359
10882
123180
28759
7341
4251
373
207985
2004
‐2005
5595
345
3138
3316
371
924 7 231
19
92
18711
1628
2460
11162
135189
33079
7713
4359
420
228759
2005
‐2006
6111
545
3746
3949
389
1166
13
233
19
93
24907
1689
2462
12043
155385
39011
8289
4558
498
265106
2006
‐2007
6655
606
4161
4435
414
1515
14
243
19
96
27731
1778
2583
13626
170561
42084
9083
4906
592
291102
2007
‐2008
7328
646
4462
4758
445
1665
17
250
19
106
30521
1856
2792
15082
183918
43985
9717
5157
805
313529
2008
‐2009
7613
669
4769
4940
461
1776
18
262
19
113
32969
1943
2956
16451
194147
46012
10212
5374
1111
331815
2009
‐2010
7959
703
5439
5102
505
1967
18
284
28
124
36306
2020
3654
17951
205326
51066
10899
5714
1502
356567
2010
‐2011
8720
722
6178
5383
554
2225
21
296
32
130
40981
2411
4492
19392
219153
57894
11885
6108
1847
388424
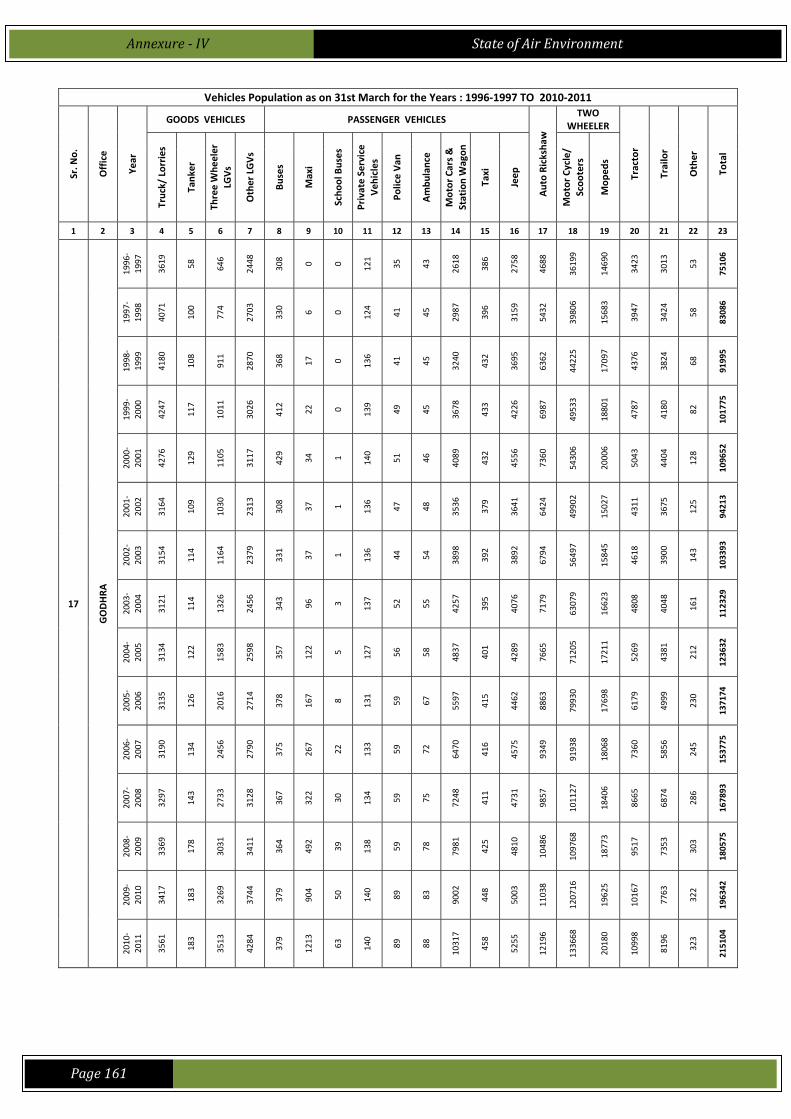
Annexure IV State of Air Environment
Page 161
Vehicles Population as on 31st March for the Years : 1996‐1997 TO 2010‐2011
Sr. N
o.
Office
Year
GOODS VEHICLES PASSENGER VEHICLES
Auto Rickshaw
TWO WHEELER
Tractor
Trailor
Other
Total
Truck/ Lorries
Tank
er
Three Whe
eler
LGVs
Other LGVs
Buses
Maxi
Scho
ol Buses
Private Service
Veh
icles
Police Van
Ambu
lance
Motor Cars &
Station Wagon
Taxi
Jeep
Motor Cycle/
Scoo
ters
Mop
eds
1 2 3 4 5 6 7 8 9 10 11 12 13 14 15 16 17 18 19 20 21 22 23
17
GODHRA
1996
‐1997
3619
58
646
2448
308 0 0 121
35
43
2618
386
2758
4688
36199
14690
3423
3013
53
75106
1997
‐1998
4071
100
774
2703
330 6 0 124
41
45
2987
396
3159
5432
39806
15683
3947
3424
58
83086
1998
‐1999
4180
108
911
2870
368
17
0 136
41
45
3240
432
3695
6362
44225
17097
4376
3824
68
91995
1999
‐2000
4247
117
1011
3026
412
22
0 139
49
45
3678
433
4226
6987
49533
18801
4787
4180
82
101775
2000
‐2001
4276
129
1105
3117
429
34
1 140
51
46
4089
432
4556
7360
54306
20006
5043
4404
128
109652
2001
‐2002
3164
109
1030
2313
308
37
1 136
47
48
3536
379
3641
6424
49902
15027
4311
3675
125
94213
2002
‐2003
3154
114
1164
2379
331
37
1 136
44
54
3898
392
3892
6794
56497
15845
4618
3900
143
103393
2003
‐2004
3121
114
1326
2456
343
96
3 137
52
55
4257
395
4076
7179
63079
16623
4808
4048
161
112329
2004
‐2005
3134
122
1583
2598
357
122 5 127
56
58
4837
401
4289
7665
71205
17211
5269
4381
212
123632
2005
‐2006
3135
126
2016
2714
378
167 8 131
59
67
5597
415
4462
8863
79930
17698
6179
4999
230
137174
2006
‐2007
3190
134
2456
2790
375
267
22
133
59
72
6470
416
4575
9349
91938
18068
7360
5856
245
153775
2007
‐2008
3297
143
2733
3128
367
322
30
134
59
75
7248
411
4731
9857
101127
18406
8665
6874
286
167893
2008
‐2009
3369
178
3031
3411
364
492
39
138
59
78
7981
425
4810
10486
109768
18773
9517
7353
303
180575
2009
‐2010
3417
183
3269
3744
379
904
50
140
89
83
9002
448
5003
11038
120716
19625
10167
7763
322
196342
2010
‐2011
3561
183
3513
4284
379
1213
63
140
89
88
10317
458
5255
12196
133668
20180
10998
8196
323
215104
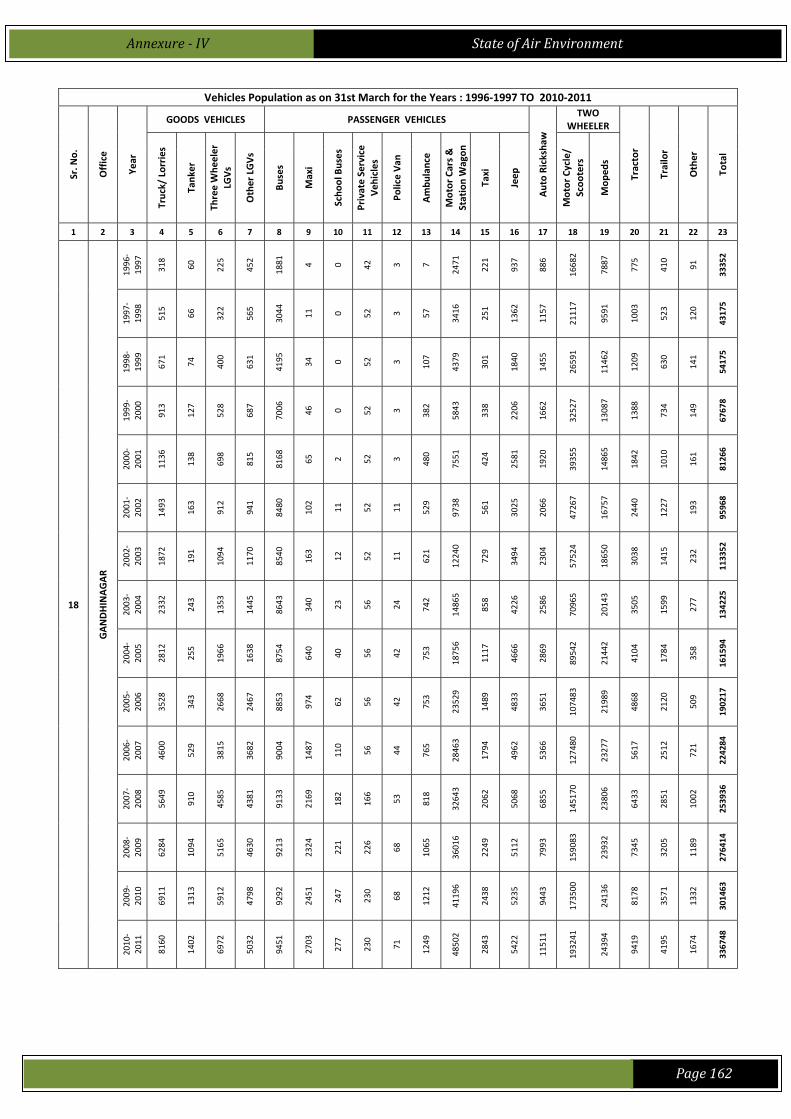
Annexure IV State of Air Environment
Page 162
Vehicles Population as on 31st March for the Years : 1996‐1997 TO 2010‐2011
Sr. N
o.
Office
Year
GOODS VEHICLES PASSENGER VEHICLES
Auto Rickshaw
TWO WHEELER
Tractor
Trailor
Other
Total
Truck/ Lorries
Tank
er
Three Whe
eler
LGVs
Other LGVs
Buses
Maxi
Scho
ol Buses
Private Service
Veh
icles
Police Van
Ambu
lance
Motor Cars &
Station Wagon
Taxi
Jeep
Motor Cycle/
Scoo
ters
Mop
eds
1 2 3 4 5 6 7 8 9 10 11 12 13 14 15 16 17 18 19 20 21 22 23
18
GANDHINAGAR
1996
‐1997
318
60
225
452
1881
4 0 42
3 7
2471
221
937
886
16682
7887
775
410
91
33352
1997
‐1998
515
66
322
565
3044
11
0 52
3 57
3416
251
1362
1157
21117
9591
1003
523
120
43175
1998
‐1999
671
74
400
631
4195
34
0 52
3 107
4379
301
1840
1455
26591
11462
1209
630
141
54175
1999
‐2000
913
127
528
687
7006
46
0 52
3 382
5843
338
2206
1662
32527
13087
1388
734
149
67678
2000
‐2001
1136
138
698
815
8168
65
2 52
3 480
7551
424
2581
1920
39355
14865
1842
1010
161
81266
2001
‐2002
1493
163
912
941
8480
102
11
52
11
529
9738
561
3025
2066
47267
16757
2440
1227
193
95968
2002
‐2003
1872
191
1094
1170
8540
163
12
52
11
621
12240
729
3494
2304
57524
18650
3038
1415
232
113352
2003
‐2004
2332
243
1353
1445
8643
340
23
56
24
742
14865
858
4226
2586
70965
20143
3505
1599
277
134225
2004
‐2005
2812
255
1966
1638
8754
640
40
56
42
753
18756
1117
4666
2869
89542
21442
4104
1784
358
161594
2005
‐2006
3528
343
2668
2467
8853
974
62
56
42
753
23529
1489
4833
3651
107483
21989
4868
2120
509
190217
2006
‐2007
4600
529
3815
3682
9004
1487
110
56
44
765
28463
1794
4962
5366
127480
23277
5617
2512
721
224284
2007
‐2008
5649
910
4585
4381
9133
2169
182
166
53
818
32643
2062
5068
6855
145170
23806
6433
2851
1002
253936
2008
‐2009
6284
1094
5165
4630
9213
2324
221
226
68
1065
36016
2249
5112
7993
159083
23932
7345
3205
1189
276414
2009
‐2010
6911
1313
5912
4798
9292
2451
247
230
68
1212
41196
2438
5235
9443
173500
24136
8178
3571
1332
301463
2010
‐2011
8160
1402
6972
5032
9451
2703
277
230
71
1249
48502
2843
5422
11511
193241
24394
9419
4195
1674
336748
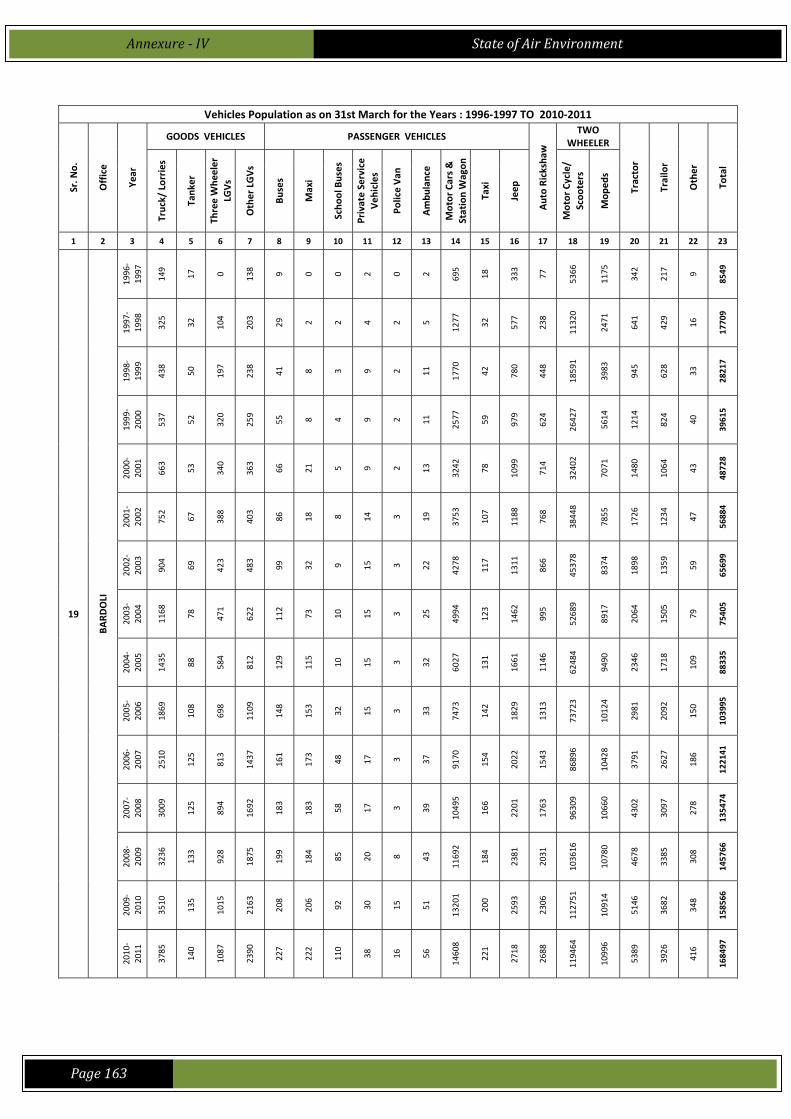
Annexure IV State of Air Environment
Page 163
Vehicles Population as on 31st March for the Years : 1996‐1997 TO 2010‐2011
Sr. N
o.
Office
Year
GOODS VEHICLES PASSENGER VEHICLES
Auto Rickshaw
TWO WHEELER
Tractor
Trailor
Other
Total
Truck/ Lorries
Tank
er
Three Whe
eler
LGVs
Other LGVs
Buses
Maxi
Scho
ol Buses
Private Service
Veh
icles
Police Van
Ambu
lance
Motor Cars &
Station Wagon
Taxi
Jeep
Motor Cycle/
Scoo
ters
Mop
eds
1 2 3 4 5 6 7 8 9 10 11 12 13 14 15 16 17 18 19 20 21 22 23
19
BARD
OLI
1996
‐1997
149
17
0 138 9 0 0 2 0 2 695
18
333
77
5366
1175
342
217 9
8549
1997
‐1998
325
32
104
203
29
2 2 4 2 5
1277
32
577
238
11320
2471
641
429
16
17709
1998
‐1999
438
50
197
238
41
8 3 9 2 11
1770
42
780
448
18591
3983
945
628
33
28217
1999
‐2000
537
52
320
259
55
8 4 9 2 11
2577
59
979
624
26427
5614
1214
824
40
39615
2000
‐2001
663
53
340
363
66
21
5 9 2 13
3242
78
1099
714
32402
7071
1480
1064
43
48728
2001
‐2002
752
67
388
403
86
18
8 14
3 19
3753
107
1188
768
38448
7855
1726
1234
47
56884
2002
‐2003
904
69
423
483
99
32
9 15
3 22
4278
117
1311
866
45378
8374
1898
1359
59
65699
2003
‐2004
1168
78
471
622
112
73
10
15
3 25
4994
123
1462
995
52689
8917
2064
1505
79
75405
2004
‐2005
1435
88
584
812
129
115
10
15
3 32
6027
131
1661
1146
62484
9490
2346
1718
109
88335
2005
‐2006
1869
108
698
1109
148
153
32
15
3 33
7473
142
1829
1313
73723
10124
2981
2092
150
103995
2006
‐2007
2510
125
813
1437
161
173
48
17
3 37
9170
154
2022
1543
86896
10428
3791
2627
186
122141
2007
‐2008
3009
125
894
1692
183
183
58
17
3 39
10495
166
2201
1763
96309
10660
4302
3097
278
135474
2008
‐2009
3236
133
928
1875
199
184
85
20
8 43
11692
184
2381
2031
103616
10780
4678
3385
308
145766
2009
‐2010
3510
135
1015
2163
208
206
92
30
15
51
13201
200
2593
2306
112751
10914
5146
3682
348
158566
2010
‐2011
3785
140
1087
2390
227
222
110
38
16
56
14608
221
2718
2688
119464
10996
5389
3926
416
168497

Annexure IV State of Air Environment
Page 164
Vehicles Population as on 31st March for the Years : 1996‐1997 TO 2010‐2011
Sr. N
o.
Office
Year
GOODS VEHICLES PASSENGER VEHICLES
Auto Rickshaw
TWO WHEELER
Tractor
Trailor
Other
Total
Truck/ Lorries
Tank
er
Three Whe
eler
LGVs
Other LGVs
Buses
Maxi
Scho
ol Buses
Private Service
Veh
icles
Police Van
Ambu
lance
Motor Cars &
Station Wagon
Taxi
Jeep
Motor Cycle/
Scoo
ters
Mop
eds
1 2 3 4 5 6 7 8 9 10 11 12 13 14 15 16 17 18 19 20 21 22 23
20
DAHOD
1996
‐1997
80
1 51
89
11
0 1 0 0 1 146 4 299
179
2119
690
295
259 3
4228
1997
‐1998
133 5 82
171
29
0 1 0 0 5 258
12
520
418
3918
1392
546
492 4
7986
1998
‐1999
143 6 129
229
53
0 1 0 0 7 396
19
753
622
6187
2198
794
733 4
12274
1999
‐2000
163 7 174
257
64
3 1 0 0 9 561
20
925
759
9263
3254
1007
935 9
17411
2000
‐2001
171 7 201
275
59
2 2 2 0 11
699
21
1054
841
11733
4135
1105
1056
12
21386
2001
‐2002
1270
32
397
1135
175
11
3 6 14
20
1760
133
2256
2022
24786
10619
2176
2082
34
48931
2002
‐2003
1307
32
448
1144
177
12
3 6 14
22
1880
132
2357
2131
28237
11024
2335
2217
37
53515
2003
‐2004
1384
31
515
1180
191
19
3 6 16
23
2043
128
2494
2234
31766
11303
2418
2279
39
58072
2004
‐2005
1416
31
743
1220
211
23
3 6 17
26
2237
127
2624
2439
36170
11501
2711
2491
44
64040
2005
‐2006
1464
32
1119
1290
228
60
3 7 18
27
2494
127
2750
2676
40803
11653
3135
2851
58
70795
2006
‐2007
1596
32
1431
1376
230
127 3 6 18
30
2791
130
2908
2952
47880
12068
3838
3483
72
80971
2007
‐2008
1624
32
1664
1496
230
173 3 8 18
30
3072
131
3038
3165
54472
12507
4484
4050
89
90286
2008
‐2009
1632
33
1811
1606
230
215 4 8 18
30
3371
128
3150
3289
61196
12998
4918
4332
114
99083
2009
‐2010
1656
33
2035
1810
234
307 4 8 23
32
3805
128
3288
3387
69487
13726
5215
4517
127
109822
2010
‐2011
1709
35
2264
2183
242
462 3 9 24
33
4326
130
3447
3598
80094
14074
5629
4747
156
123165
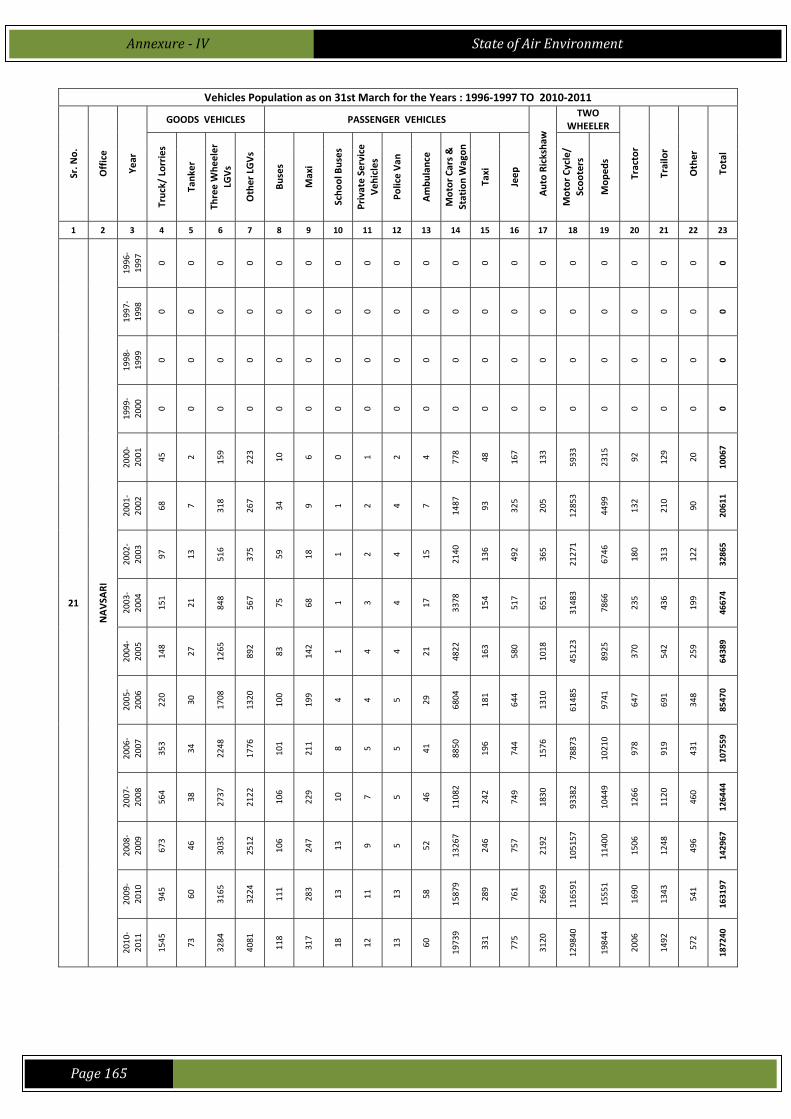
Annexure IV State of Air Environment
Page 165
Vehicles Population as on 31st March for the Years : 1996‐1997 TO 2010‐2011
Sr. N
o.
Office
Year
GOODS VEHICLES PASSENGER VEHICLES
Auto Rickshaw
TWO WHEELER
Tractor
Trailor
Other
Total
Truck/ Lorries
Tank
er
Three Whe
eler
LGVs
Other LGVs
Buses
Maxi
Scho
ol Buses
Private Service
Veh
icles
Police Van
Ambu
lance
Motor Cars &
Station Wagon
Taxi
Jeep
Motor Cycle/
Scoo
ters
Mop
eds
1 2 3 4 5 6 7 8 9 10 11 12 13 14 15 16 17 18 19 20 21 22 23
21
NAVSA
RI
1996
‐1997
0 0 0 0 0 0 0 0 0 0 0 0 0 0 0 0 0 0 0 0
1997
‐1998
0 0 0 0 0 0 0 0 0 0 0 0 0 0 0 0 0 0 0 0
1998
‐1999
0 0 0 0 0 0 0 0 0 0 0 0 0 0 0 0 0 0 0 0
1999
‐2000
0 0 0 0 0 0 0 0 0 0 0 0 0 0 0 0 0 0 0 0
2000
‐2001
45
2 159
223
10
6 0 1 2 4 778
48
167
133
5933
2315
92
129
20
10067
2001
‐2002
68
7 318
267
34
9 1 2 4 7
1487
93
325
205
12853
4499
132
210
90
20611
2002
‐2003
97
13
516
375
59
18
1 2 4 15
2140
136
492
365
21271
6746
180
313
122
32865
2003
‐2004
151
21
848
567
75
68
1 3 4 17
3378
154
517
651
31483
7866
235
436
199
46674
2004
‐2005
148
27
1265
892
83
142 1 4 4 21
4822
163
580
1018
45123
8925
370
542
259
64389
2005
‐2006
220
30
1708
1320
100
199 4 4 5 29
6804
181
644
1310
61485
9741
647
691
348
85470
2006
‐2007
353
34
2248
1776
101
211 8 5 5 41
8850
196
744
1576
78873
10210
978
919
431
107559
2007
‐2008
564
38
2737
2122
106
229
10
7 5 46
11082
242
749
1830
93382
10449
1266
1120
460
126444
2008
‐2009
673
46
3035
2512
106
247
13
9 5 52
13267
246
757
2192
105157
11400
1506
1248
496
142967
2009
‐2010
945
60
3165
3224
111
283
13
11
13
58
15879
289
761
2669
116591
15551
1690
1343
541
163197
2010
‐2011
1545
73
3284
4081
118
317
18
12
13
60
19739
331
775
3120
129840
19844
2006
1492
572
187240
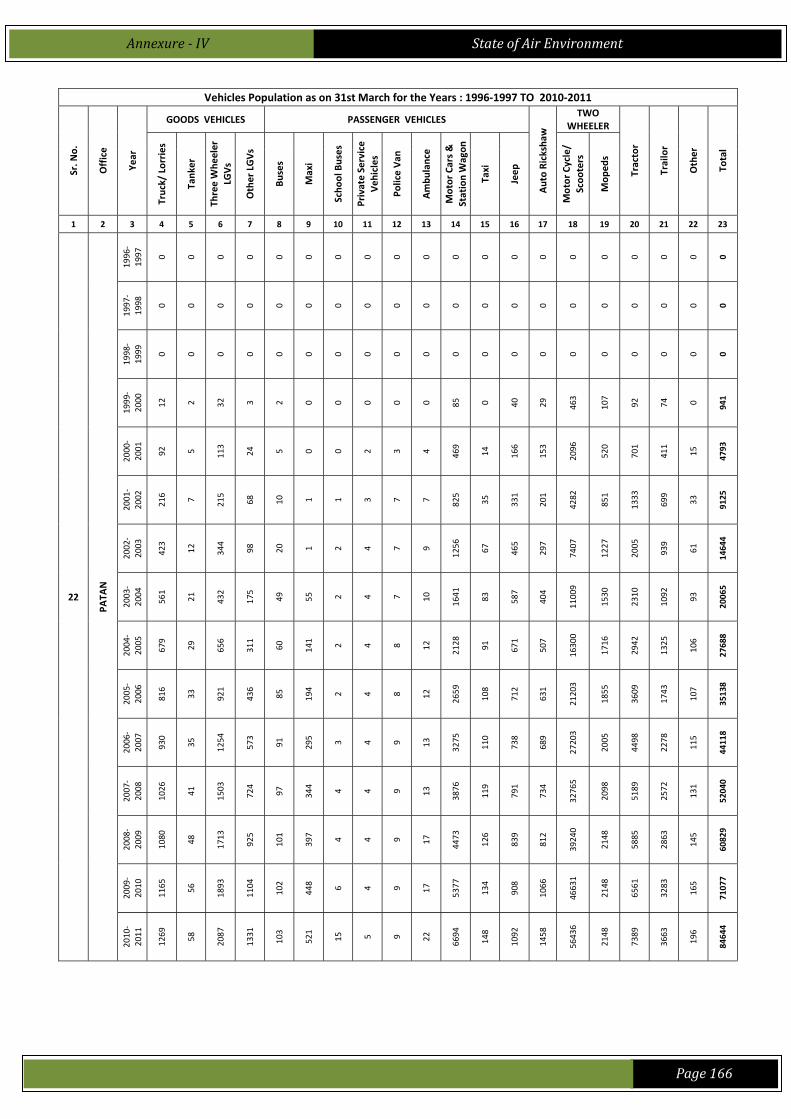
Annexure IV State of Air Environment
Page 166
Vehicles Population as on 31st March for the Years : 1996‐1997 TO 2010‐2011
Sr. N
o.
Office
Year
GOODS VEHICLES PASSENGER VEHICLES
Auto Rickshaw
TWO WHEELER
Tractor
Trailor
Other
Total
Truck/ Lorries
Tank
er
Three Whe
eler
LGVs
Other LGVs
Buses
Maxi
Scho
ol Buses
Private Service
Veh
icles
Police Van
Ambu
lance
Motor Cars &
Station Wagon
Taxi
Jeep
Motor Cycle/
Scoo
ters
Mop
eds
1 2 3 4 5 6 7 8 9 10 11 12 13 14 15 16 17 18 19 20 21 22 23
22
PATA
N
1996
‐1997
0 0 0 0 0 0 0 0 0 0 0 0 0 0 0 0 0 0 0 0
1997
‐1998
0 0 0 0 0 0 0 0 0 0 0 0 0 0 0 0 0 0 0 0
1998
‐1999
0 0 0 0 0 0 0 0 0 0 0 0 0 0 0 0 0 0 0 0
1999
‐2000
12
2 32
3 2 0 0 0 0 0 85
0 40
29
463
107
92
74
0 941
2000
‐2001
92
5 113
24
5 0 0 2 3 4 469
14
166
153
2096
520
701
411
15
4793
2001
‐2002
216 7 215
68
10
1 1 3 7 7 825
35
331
201
4282
851
1333
699
33
9125
2002
‐2003
423
12
344
98
20
1 2 4 7 9
1256
67
465
297
7407
1227
2005
939
61
14644
2003
‐2004
561
21
432
175
49
55
2 4 7 10
1641
83
587
404
11009
1530
2310
1092
93
20065
2004
‐2005
679
29
656
311
60
141 2 4 8 12
2128
91
671
507
16300
1716
2942
1325
106
27688
2005
‐2006
816
33
921
436
85
194 2 4 8 12
2659
108
712
631
21203
1855
3609
1743
107
35138
2006
‐2007
930
35
1254
573
91
295 3 4 9 13
3275
110
738
689
27203
2005
4498
2278
115
44118
2007
‐2008
1026
41
1503
724
97
344 4 4 9 13
3876
119
791
734
32765
2098
5189
2572
131
52040
2008
‐2009
1080
48
1713
925
101
397 4 4 9 17
4473
126
839
812
39240
2148
5885
2863
145
60829
2009
‐2010
1165
56
1893
1104
102
448 6 4 9 17
5377
134
908
1066
46631
2148
6561
3283
165
71077
2010
‐2011
1269
58
2087
1331
103
521
15
5 9 22
6694
148
1092
1458
56436
2148
7389
3663
196
84644

Annexure IV State of Air Environment
Page 167
Vehicles Population as on 31st March for the Years : 1996‐1997 TO 2010‐2011
Sr. N
o.
Office
Year
GOODS VEHICLES PASSENGER VEHICLES
Auto Rickshaw
TWO WHEELER
Tractor
Trailor
Other
Total
Truck/ Lorries
Tank
er
Three Whe
eler
LGVs
Other LGVs
Buses
Maxi
Scho
ol Buses
Private Service
Veh
icles
Police Van
Ambu
lance
Motor Cars &
Station Wagon
Taxi
Jeep
Motor Cycle/
Scoo
ters
Mop
eds
1 2 3 4 5 6 7 8 9 10 11 12 13 14 15 16 17 18 19 20 21 22 23
23
PORB
ANDER
1996
‐1997
0 0 0 0 0 0 0 0 0 0 0 0 0 0 0 0 0 0 0 0
1997
‐1998
0 0 0 0 0 0 0 0 0 0 0 0 0 0 0 0 0 0 0 0
1998
‐1999
0 0 0 0 0 0 0 0 0 0 0 0 0 0 0 0 0 0 0 0
1999
‐2000
24
0 50
2 0 0 0 0 0 0 63
1 0 59
413
155
45
36
31
879
2000
‐2001
75
0 134 2 0 0 0 0 0 2 318 2 0 175
1735
838
114
120
52
3567
2001
‐2002
160 0 185
165 0 0 2 0 1 2 555 9 1 254
4267
1945
170
186
67
7969
2002
‐2003
401 0 185
334 0 0 3 0 1 4 767
10
2 332
6840
2819
279
303
68
12348
2003
‐2004
539 0 352
334 1 1 5 0 1 5 987
31
17
507
9640
3412
341
344
82
16599
2004
‐2005
737 0 566
339 3 1 9 0 4 5
1310
38
28
594
13710
4054
433
423
94
22348
2005
‐2006
934 0 651
373 9 4 12
1 4 6
1723
52
33
691
17126
4816
583
511
136
27665
2006
‐2007
1357
0 764
439 9 11
14
1 4 9
2156
60
33
775
20895
5350
781
611
167
33436
2007
‐2008
1585
7 919
497
20
11
14
4 4 10
2634
89
33
857
25087
6080
1026
778
195
39850
2008
‐2009
1710
7
1066
499
25
25
14
4 4 10
3065
98
33
932
29632
6831
1382
1064
195
46596
2009
‐2010
1824
7
1216
499
29
28
14
4 4 12
3520
101
37
1023
34440
7952
1833
1396
210
54149
2010
‐2011
2146
7
1387
499
38
50
14
4 4 14
4204
107
37
1132
39847
9747
2249
1668
218
63372

Annexure IV State of Air Environment
Page 168
Vehicles Population as on 31st March for the Years : 1996‐1997 TO 2010‐2011
Sr. N
o.
Office
Year
GOODS VEHICLES PASSENGER VEHICLES
Auto Rickshaw
TWO WHEELER
Tractor
Trailor
Other
Total
Truck/ Lorries
Tank
er
Three Whe
eler
LGVs
Other LGVs
Buses
Maxi
Scho
ol Buses
Private Service
Veh
icles
Police Van
Ambu
lance
Motor Cars &
Station Wagon
Taxi
Jeep
Motor Cycle/
Scoo
ters
Mop
eds
1 2 3 4 5 6 7 8 9 10 11 12 13 14 15 16 17 18 19 20 21 22 23
24
RAJPIPLA
1996
‐1997
0 0 0 0 0 0 0 0 0 0 0 0 0 0 0 0 0 0 0 0
1997
‐1998
0 0 0 0 0 0 0 0 0 0 0 0 0 0 0 0 0 0 0 0
1998
‐1999
0 0 0 0 0 0 0 0 0 0 0 0 0 0 0 0 0 0 0 0
1999
‐2000
0 0 0 0 0 0 0 0 0 0 0 0 0 0 0 0 0 0 0 0
2000
‐2001
0 0 0 0 0 0 0 0 0 0 0 0 0 0 0 0 0 0 0 0
2001
‐2002
0 0 0 0 0 0 0 0 0 0 0 0 0 0 0 0 0 0 0 0
2002
‐2003
9 0 4 20
17
0 0 0 0 0 112 0 6 2 919
22
24
15
1
1151
2003
‐2004
27
0 21
53
17
3 0 0 2 1 234 0 22
18
2368
136
70
41
1
3014
2004
‐2005
36
0 48
123
39
13
0 0 2 1 328 3 55
64
4279
286
145
75
3
5500
2005
‐2006
51
0 102
191
107
34
0 0 2 1 491 4 110
119
6911
580
262
128 6
9099
2006
‐2007
64
1 165
263
130
43
2 0 2 1 691 7 143
226
10202
862
480
275
13
13570
2007
‐2008
99
1 210
292
120
51
7 0 2 1 883 9 177
323
12333
1199
685
383
15
16790
2008
‐2009
114 0 232
318
123
61
7 0 2 1
1017
10
215
349
13536
1399
800
441
28
18653
2009
‐2010
129
10
261
332
149
73
7 0 2 6
1173
14
269
402
15310
1789
923
511
37
21397
2010
‐2011
161
18
297
370
148
108
12
0 2 6
1427
18
357
496
18281
2138
1129
611
40
25619
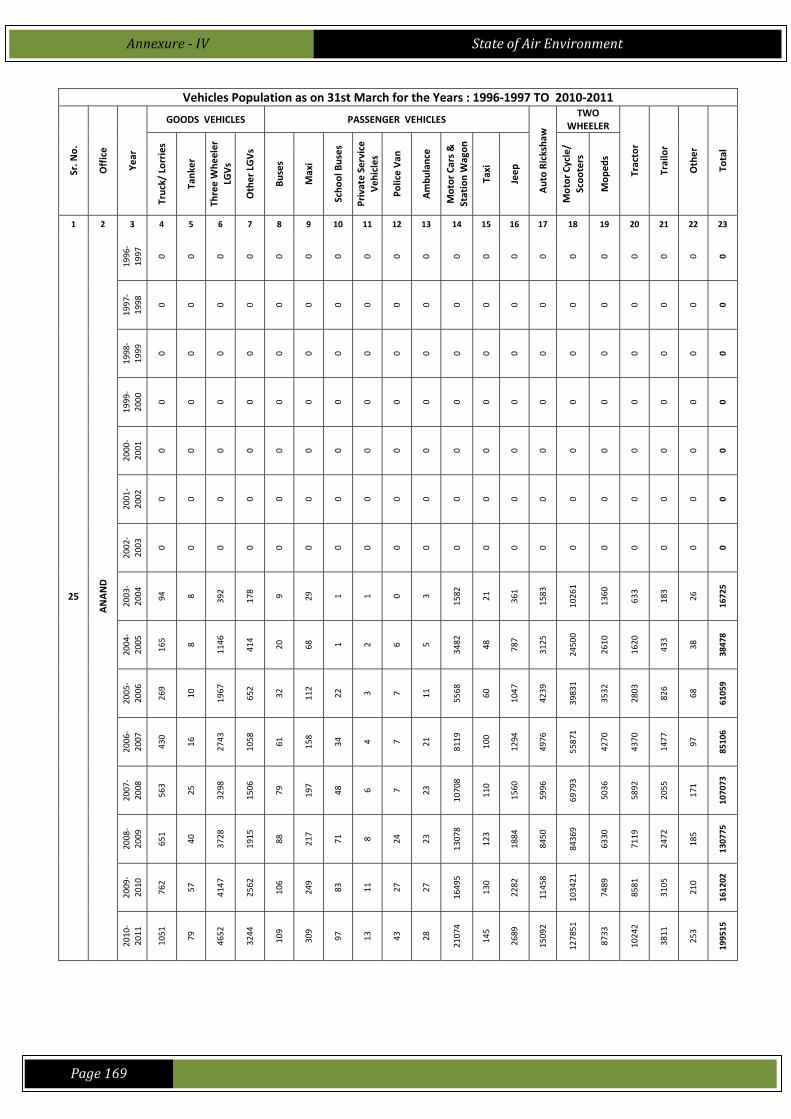
Annexure IV State of Air Environment
Page 169
Vehicles Population as on 31st March for the Years : 1996‐1997 TO 2010‐2011
Sr. N
o.
Office
Year
GOODS VEHICLES PASSENGER VEHICLES
Auto Rickshaw
TWO WHEELER
Tractor
Trailor
Other
Total
Truck/ Lorries
Tank
er
Three Whe
eler
LGVs
Other LGVs
Buses
Maxi
Scho
ol Buses
Private Service
Veh
icles
Police Van
Ambu
lance
Motor Cars &
Station Wagon
Taxi
Jeep
Motor Cycle/
Scoo
ters
Mop
eds
1 2 3 4 5 6 7 8 9 10 11 12 13 14 15 16 17 18 19 20 21 22 23
25
ANAND
1996
‐1997
0 0 0 0 0 0 0 0 0 0 0 0 0 0 0 0 0 0 0 0
1997
‐1998
0 0 0 0 0 0 0 0 0 0 0 0 0 0 0 0 0 0 0 0
1998
‐1999
0 0 0 0 0 0 0 0 0 0 0 0 0 0 0 0 0 0 0 0
1999
‐2000
0 0 0 0 0 0 0 0 0 0 0 0 0 0 0 0 0 0 0 0
2000
‐2001
0 0 0 0 0 0 0 0 0 0 0 0 0 0 0 0 0 0 0 0
2001
‐2002
0 0 0 0 0 0 0 0 0 0 0 0 0 0 0 0 0 0 0 0
2002
‐2003
0 0 0 0 0 0 0 0 0 0 0 0 0 0 0 0 0 0 0 0
2003
‐2004
94
8 392
178 9 29
1 1 0 3
1582
21
361
1583
10261
1360
633
183
26
16725
2004
‐2005
165 8
1146
414
20
68
1 2 6 5
3482
48
787
3125
24500
2610
1620
433
38
38478
2005
‐2006
269
10
1967
652
32
112
22
3 7 11
5568
60
1047
4239
39831
3532
2803
826
68
61059
2006
‐2007
430
16
2743
1058
61
158
34
4 7 21
8119
100
1294
4976
55871
4270
4370
1477
97
85106
2007
‐2008
563
25
3298
1506
79
197
48
6 7 23
10708
110
1560
5996
69793
5036
5892
2055
171
107073
2008
‐2009
651
40
3728
1915
88
217
71
8 24
23
13078
123
1884
8450
84369
6330
7119
2472
185
130775
2009
‐2010
762
57
4147
2562
106
249
83
11
27
27
16495
130
2282
11458
103421
7489
8581
3105
210
161202
2010
‐2011
1051
79
4652
3244
109
309
97
13
43
28
21074
145
2689
15092
127851
8733
10242
3811
253
199515
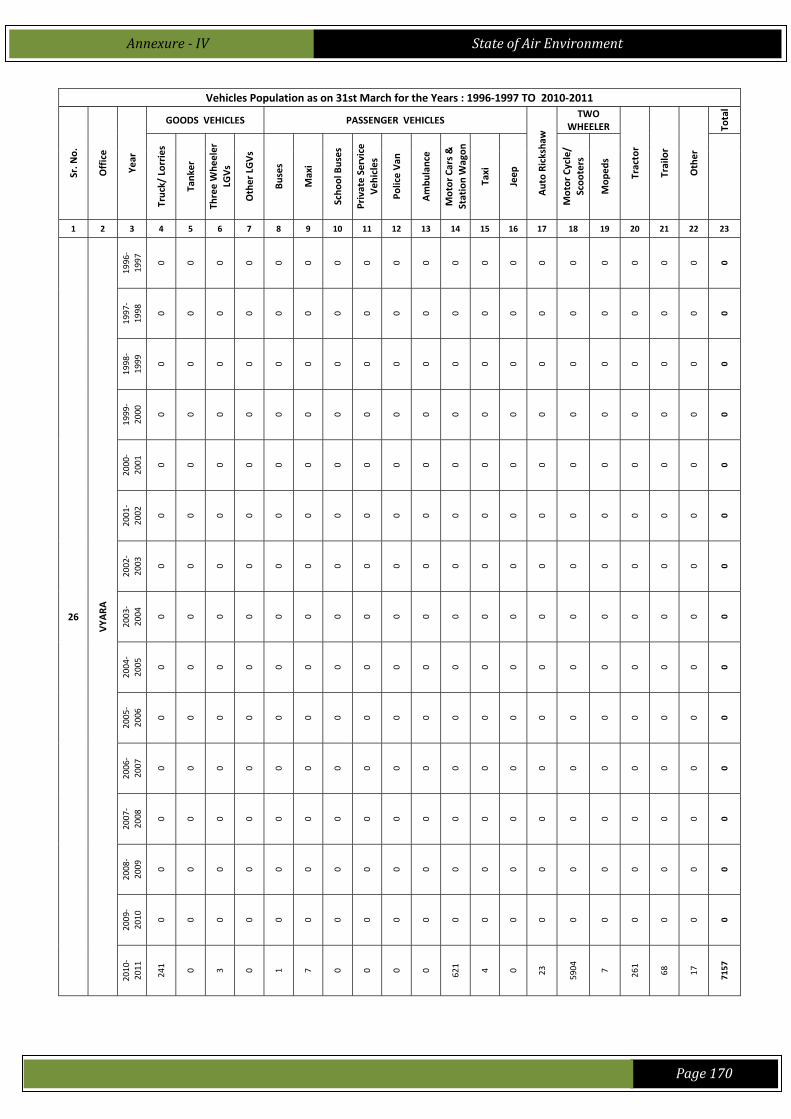
Annexure IV State of Air Environment
Page 170
Vehicles Population as on 31st March for the Years : 1996‐1997 TO 2010‐2011
Sr. N
o.
Office
Year
GOODS VEHICLES PASSENGER VEHICLES
Auto Rickshaw
TWO WHEELER
Tractor
Trailor
Other
Total
Truck/ Lorries
Tank
er
Three Whe
eler
LGVs
Other LGVs
Buses
Maxi
Scho
ol Buses
Private Service
Veh
icles
Police Van
Ambu
lance
Motor Cars &
Station Wagon
Taxi
Jeep
Motor Cycle/
Scoo
ters
Mop
eds
1 2 3 4 5 6 7 8 9 10 11 12 13 14 15 16 17 18 19 20 21 22 23
26
VYA
RA
1996
‐1997
0 0 0 0 0 0 0 0 0 0 0 0 0 0 0 0 0 0 0 0
1997
‐1998
0 0 0 0 0 0 0 0 0 0 0 0 0 0 0 0 0 0 0 0
1998
‐1999
0 0 0 0 0 0 0 0 0 0 0 0 0 0 0 0 0 0 0 0
1999
‐2000
0 0 0 0 0 0 0 0 0 0 0 0 0 0 0 0 0 0 0 0
2000
‐2001
0 0 0 0 0 0 0 0 0 0 0 0 0 0 0 0 0 0 0 0
2001
‐2002
0 0 0 0 0 0 0 0 0 0 0 0 0 0 0 0 0 0 0 0
2002
‐2003
0 0 0 0 0 0 0 0 0 0 0 0 0 0 0 0 0 0 0 0
2003
‐2004
0 0 0 0 0 0 0 0 0 0 0 0 0 0 0 0 0 0 0 0
2004
‐2005
0 0 0 0 0 0 0 0 0 0 0 0 0 0 0 0 0 0 0 0
2005
‐2006
0 0 0 0 0 0 0 0 0 0 0 0 0 0 0 0 0 0 0 0
2006
‐2007
0 0 0 0 0 0 0 0 0 0 0 0 0 0 0 0 0 0 0 0
2007
‐2008
0 0 0 0 0 0 0 0 0 0 0 0 0 0 0 0 0 0 0 0
2008
‐2009
0 0 0 0 0 0 0 0 0 0 0 0 0 0 0 0 0 0 0 0
2009
‐2010
0 0 0 0 0 0 0 0 0 0 0 0 0 0 0 0 0 0 0 0
2010
‐2011
241 0 3 0 1 7 0 0 0 0 621 4 0 23
5904
7 261
68
17
7157
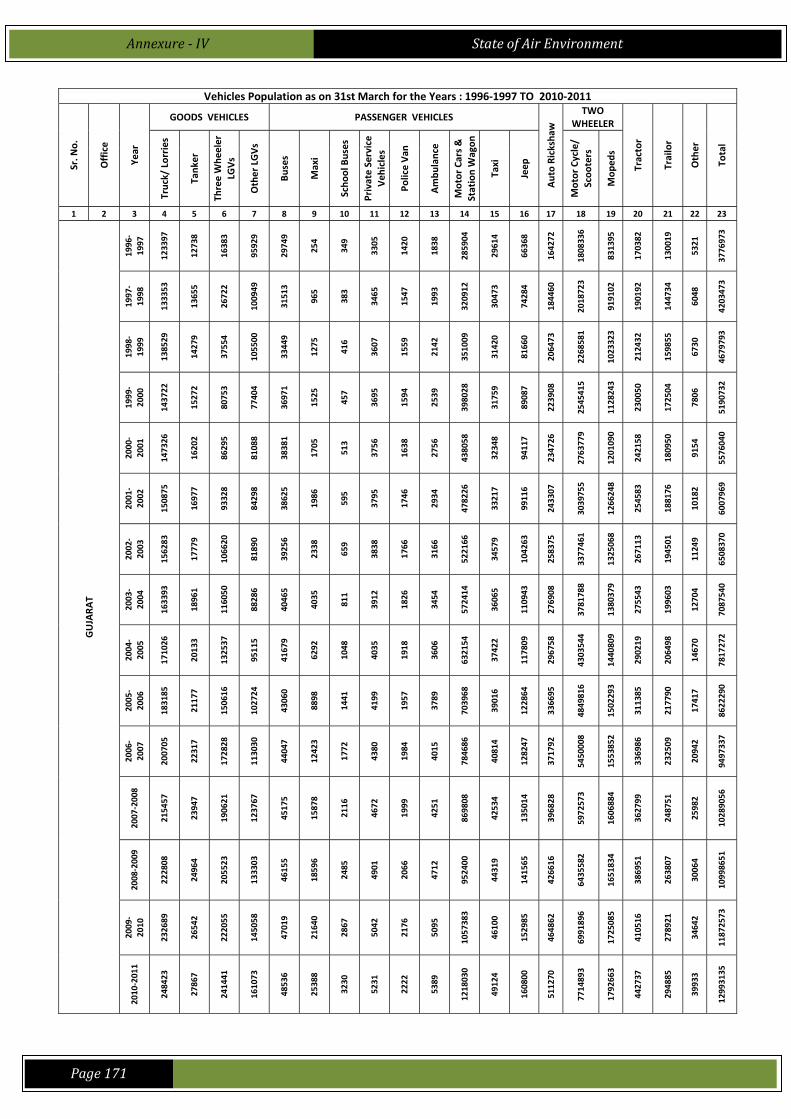
Annexure IV State of Air Environment
Page 171
Vehicles Population as on 31st March for the Years : 1996‐1997 TO 2010‐2011
Sr. N
o.
Office
Year
GOODS VEHICLES PASSENGER VEHICLES
Auto Rickshaw
TWO WHEELER
Tractor
Trailor
Other
Total
Truck/ Lorries
Tank
er
Three Whe
eler
LGVs
Other LGVs
Buses
Maxi
Scho
ol Buses
Private Service
Veh
icles
Police Van
Ambu
lance
Motor Cars &
Station Wagon
Taxi
Jeep
Motor Cycle/
Scoo
ters
Mop
eds
1 2 3 4 5 6 7 8 9 10 11 12 13 14 15 16 17 18 19 20 21 22 23
GUJARA
T
1996
‐1997
123397
12738
16383
95929
29749
254
349
3305
1420
1838
285904
29614
66368
164272
1808336
831395
170382
130019
5321
3776973
1997
‐1998
133353
13655
26722
100949
31513
965
383
3465
1547
1993
320912
30473
74284
184460
2018723
919102
190192
144734
6048
4203473
1998
‐1999
138529
14279
37554
105500
33449
1275
416
3607
1559
2142
351009
31420
81660
206473
2268581
1023323
212432
159855
6730
4679793
1999
‐2000
143722
15272
80753
77404
36971
1525
457
3695
1594
2539
398028
31759
89087
223908
2545415
1128243
230050
172504
7806
5190732
2000
‐2001
147326
16202
86295
81088
38381
1705
513
3756
1638
2756
438058
32348
94117
234726
2763779
1201090
242158
180950
9154
5576040
2001
‐2002
150875
16977
93328
84298
38625
1986
595
3795
1746
2934
478226
33217
99116
243307
3039755
1266248
254583
188176
10182
6007969
2002
‐2003
156283
17779
106620
81890
39256
2338
659
3838
1766
3166
522166
34579
104263
258375
3377461
1325068
267113
194501
11249
6508370
2003
‐2004
163393
18961
116050
88286
40465
4035
811
3912
1826
3454
572414
36065
110943
276908
3781788
1380379
275543
199603
12704
7087540
2004
‐2005
171026
20133
132537
95115
41679
6292
1048
4035
1918
3606
632154
37422
117809
296758
4303544
1440809
290219
206498
14670
7817272
2005
‐2006
183185
21177
150616
102724
43060
8898
1441
4199
1957
3789
703968
39016
122864
336695
4849816
1502293
311385
217790
17417
8622290
2006
‐2007
200705
22317
172828
113030
44047
12423
1772
4380
1984
4015
784686
40814
128247
371792
5450008
1553852
336986
232509
20942
9497337
2007
‐2008
215457
23947
190621
123767
45175
15878
2116
4672
1999
4251
869808
42534
135014
396828
5972573
1606884
362799
248751
25982
10289056
2008
‐2009
222808
24964
205523
133303
46155
18596
2485
4901
2066
4712
952400
44319
141565
426616
6435582
1651834
386951
263807
30064
10998651
2009
‐2010
232689
26542
222055
145058
47019
21640
2867
5042
2176
5095
1057383
46100
152985
464862
6991896
1725085
410516
278921
34642
11872573
2010
‐2011
248423
27867
241441
161073
48536
25388
3230
5231
2222
5389
1218030
49124
160800
511270
7714893
1792663
442737
294885
39933
12993135