Embed Size (px)
Citation preview
625
31Conservation Biology
Concept Outline
31.1 The new science of conservation biology isfocused on conserving biodiversity.
Overview of the Biodiversity Crisis. In prehistorictimes, humans decimated the faunas of many areas.Worldwide extinction rates are accelerating.Species Endemism and Hot Spots. Some geographicareas are particularly rich in species that occur nowhere else.What’s So Bad about Losing Biodiversity? Biodiversityis of considerable direct economic value, and provides keysupport to the biosphere.
31.2 Vulnerable species are more likely to becomeextinct.
Predicting Which Species Are Vulnerable to Extinction.Biologists carry out population viability analyses to assessdanger of extinction.Dependence upon Other Species. Extinction of onespecies can have a cascading effect throughout the foodweb, making other species vulnerable as well.Categories of Vulnerable Species. Declining populationsize, loss of genetic variation, and commercial value all tendto increase a species’ vulnerability.
31.3 Causes of endangerment usually reflect humanactivities.
Factors Responsible for Extinction. Most recordedextinctions can be attributed to a few causes.Habitat Loss. Without a place to live, species cannot survive.Case Study: OverexploitationCase Study: Introduced SpeciesCase Study: Disruption of Ecological RelationshipsCase Study: Loss of Genetic VariationCase Study: Habitat Loss and Fragmentation
31.4 Successful recovery plans will need to bemultidimensional.
Many Approaches Exist for Preserving EndangeredSpecies. Species recovery requires restoring degradedhabitats, breeding in captivity, maintaining populationdiversity, and maintaining keystone species.Conservation of Ecosystems. Maintaining largepreserves and focusing on the health of the entireecosystem may be the best means of preserving biodiversity.
Among the greatest challenges facing the biosphere isthe accelerating pace of species extinctions—not since
the Cretaceous have so many species become extinct in soshort a period of time (figure 31.1). This challenge has ledto the emergence in the last decade of the new discipline ofconservation biology. Conservation biology is an applieddiscipline that seeks to learn how to preserve species, com-munities, and ecosystems. It both studies the causes of de-clines in species richness and attempts to develop methodsto prevent such declines. In this chapter we will first exam-ine the biodiversity crisis and its importance. Then, we willassess the sorts of species which seem vulnerable to extinc-tion. Using case histories, we go on to identify and studyfive factors that have played key roles in many extinctions.We finish with a review of recovery efforts at the speciesand community level.
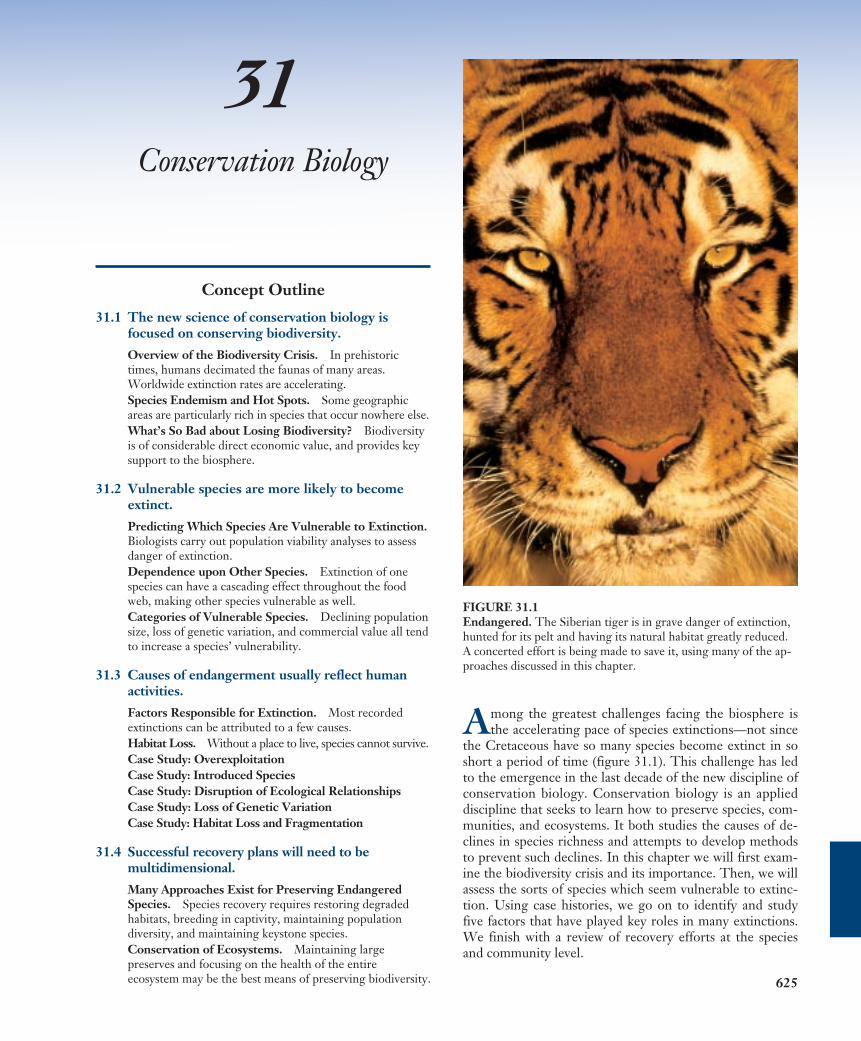
FIGURE 31.1 Endangered. The Siberian tiger is in grave danger of extinction,hunted for its pelt and having its natural habitat greatly reduced.A concerted effort is being made to save it, using many of the ap-proaches discussed in this chapter.
Similar results have followed the arrival of humansaround the globe. Forty thousand years ago, Australia wasoccupied by a wide variety of large animals, including mar-supials similar in size and ecology to hippos and leopards, akangaroo nine feet tall, and a 20-foot-long monitor lizard.These all disappeared, at approximately the same time ashumans arrived. Smaller islands have also been devastated.On Madagscar, at least 15 species of lemurs, including onethe size of a gorilla, a pygmy hippopotamus , and the flight-less elephant bird, Aepyornis, the largest bird to ever live(more than 3 meters tall and weighing 450 kilograms) allperished. On New Zealand, 30 species of birds went extinct,including all 13 species of moas, another group of large,flightless birds. Interestingly, one continent that seems tohave been spared these megafaunal extinctions is Africa. Sci-entists speculate that this lack of extinction in prehistoricAfrica may have resulted because much of human evolutionoccurred in Africa. Consequently, other African species hadbeen coevolving with humans for several million years andthus had evolved counteradaptations to human predation.
Extinctions in Historical Time
Historical extinction rates are best known for birds andmammals because these species are conspicuous—rela-tively large and well studied. Estimates of extinction ratesfor other species are much rougher. The data presented
626 Part VIII The Global Environment
Overview of theBiodiversity CrisisExtinction is a fact of life, as normal and nec-essary as species formation is to a stableworld ecosystem. Most species, probably all,go extinct eventually. More than 99% ofspecies known to science (most from the fos-sil record) are now extinct. However, currentrates are alarmingly high. Taking into ac-count the rapid and accelerating loss of habi-tat that is occurring at present, especially inthe tropics, it has been calculated that asmuch as 20% of the world’s biodiversity maybe lost during the next 30 years. In addition,many of these species may be lost before weare even aware of their extinction. Scientistsestimate that no more than 15% of theworld’s eukaryotic organisms have been dis-covered and given scientific names, and thisproportion probably is much lower for tropi-cal species.
These losses will not just affect poorlyknown groups. As many as 50,000 species ofthe world’s total of 250,000 species of plants,4000 of the world’s 20,000 species of butter-flies, and nearly 2000 of the world’s 9000 species of birdscould be lost during this short period of time. Consideringthat our species has been in existence for only 500,000years of the world’s 4.5-billion-year history, and that ourancestors developed agriculture only about 10,000 yearsago, this is an astonishing—and dubious—accomplishment.
Extinctions Due to Prehistoric Humans
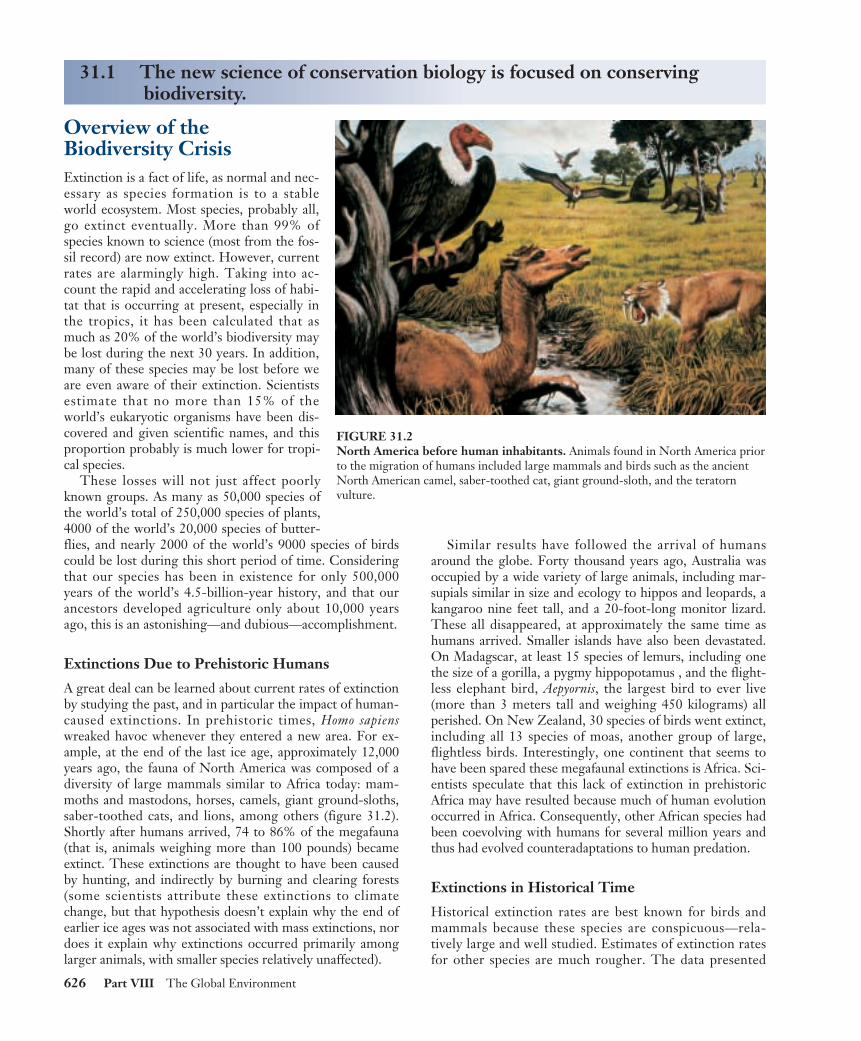
A great deal can be learned about current rates of extinctionby studying the past, and in particular the impact of human-caused extinctions. In prehistoric times, Homo sapienswreaked havoc whenever they entered a new area. For ex-ample, at the end of the last ice age, approximately 12,000years ago, the fauna of North America was composed of adiversity of large mammals similar to Africa today: mam-moths and mastodons, horses, camels, giant ground-sloths,saber-toothed cats, and lions, among others (figure 31.2).Shortly after humans arrived, 74 to 86% of the megafauna(that is, animals weighing more than 100 pounds) becameextinct. These extinctions are thought to have been causedby hunting, and indirectly by burning and clearing forests(some scientists attribute these extinctions to climatechange, but that hypothesis doesn’t explain why the end ofearlier ice ages was not associated with mass extinctions, nordoes it explain why extinctions occurred primarily amonglarger animals, with smaller species relatively unaffected).
31.1 The new science of conservation biology is focused on conservingbiodiversity.
FIGURE 31.2North America before human inhabitants. Animals found in North America priorto the migration of humans included large mammals and birds such as the ancientNorth American camel, saber-toothed cat, giant ground-sloth, and the teratornvulture.
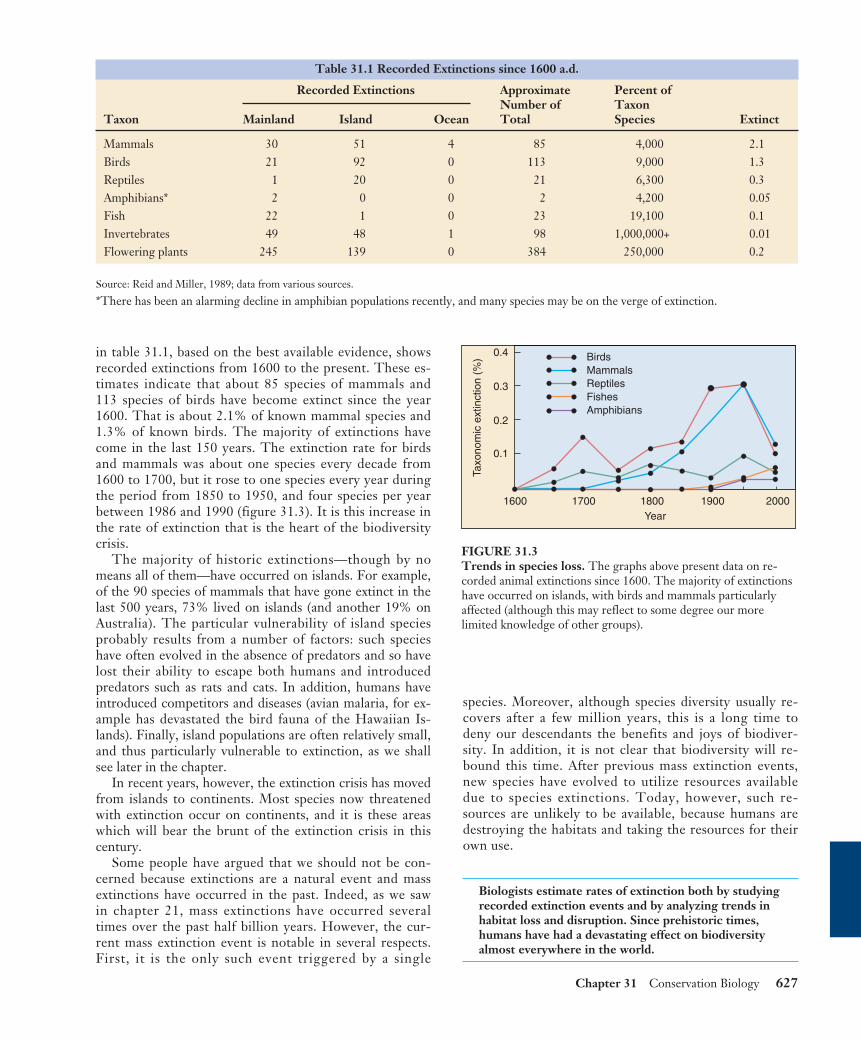
in table 31.1, based on the best available evidence, showsrecorded extinctions from 1600 to the present. These es-timates indicate that about 85 species of mammals and113 species of birds have become extinct since the year1600. That is about 2.1% of known mammal species and1.3% of known birds. The majority of extinctions havecome in the last 150 years. The extinction rate for birdsand mammals was about one species every decade from1600 to 1700, but it rose to one species every year duringthe period from 1850 to 1950, and four species per yearbetween 1986 and 1990 (figure 31.3). It is this increase inthe rate of extinction that is the heart of the biodiversitycrisis.
The majority of historic extinctions—though by nomeans all of them—have occurred on islands. For example,of the 90 species of mammals that have gone extinct in thelast 500 years, 73% lived on islands (and another 19% onAustralia). The particular vulnerability of island speciesprobably results from a number of factors: such specieshave often evolved in the absence of predators and so havelost their ability to escape both humans and introducedpredators such as rats and cats. In addition, humans haveintroduced competitors and diseases (avian malaria, for ex-ample has devastated the bird fauna of the Hawaiian Is-lands). Finally, island populations are often relatively small,and thus particularly vulnerable to extinction, as we shallsee later in the chapter.
In recent years, however, the extinction crisis has movedfrom islands to continents. Most species now threatenedwith extinction occur on continents, and it is these areaswhich will bear the brunt of the extinction crisis in thiscentury.
Some people have argued that we should not be con-cerned because extinctions are a natural event and massextinctions have occurred in the past. Indeed, as we sawin chapter 21, mass extinctions have occurred severaltimes over the past half billion years. However, the cur-rent mass extinction event is notable in several respects.First, it is the only such event triggered by a single
species. Moreover, although species diversity usually re-covers after a few million years, this is a long time todeny our descendants the benefits and joys of biodiver-sity. In addition, it is not clear that biodiversity will re-bound this time. After previous mass extinction events,new species have evolved to utilize resources availabledue to species extinctions. Today, however, such re-sources are unlikely to be available, because humans aredestroying the habitats and taking the resources for theirown use.
Biologists estimate rates of extinction both by studyingrecorded extinction events and by analyzing trends inhabitat loss and disruption. Since prehistoric times,humans have had a devastating effect on biodiversityalmost everywhere in the world.
Chapter 31 Conservation Biology 627
Table 31.1 Recorded Extinctions since 1600 a.d.
Recorded Extinctions Approximate Percent ofNumber of Taxon
Taxon Mainland Island Ocean Total Species Extinct
Mammals 30 51 4 85 4,000 2.1Birds 21 92 0 113 9,000 1.3Reptiles 1 20 0 21 6,300 0.3Amphibians* 2 0 0 2 4,200 0.05Fish 22 1 0 23 19,100 0.1Invertebrates 49 48 1 98 1,000,000+ 0.01Flowering plants 245 139 0 384 250,000 0.2
Source: Reid and Miller, 1989; data from various sources.
*There has been an alarming decline in amphibian populations recently, and many species may be on the verge of extinction.
0.4
0.3
0.2
0.1
1600 1700 1800Year
Taxo
nom
ic e
xtin
ctio
n (%
)
1900 2000
BirdsMammalsReptilesFishesAmphibians
FIGURE 31.3 Trends in species loss. The graphs above present data on re-corded animal extinctions since 1600. The majority of extinctionshave occurred on islands, with birds and mammals particularlyaffected (although this may reflect to some degree our morelimited knowledge of other groups).
Species Endemism and Hot Spots A species found naturally in only one geographic area andno place else is said to be endemic to that area. The areaover which an endemic species is found may be very large.The black cherry tree (Prunus serotina), for example, is en-demic to all of temperate North America. More typically,however, endemic species occupy restricted ranges. TheKomodo dragon (Varanus komodoensis) lives only on a fewsmall islands in the Indonesian archipelago, while theMauna Kea silversword (Argyroxiphium sandwicense) lives ina single volcano crater on the island of Hawaii.
Isolated geographical areas, such as oceanic islands,lakes, and mountain peaks, often have high percentages ofendemic species, often in significant danger of extinction.The number of endemic plant species varies greatly in theUnited States from one state to another. Thus, 379 plantspecies are found in Texas and nowhere else, whereas NewYork has only one endemic plant species. California, withits varied array of habitats, including deserts, mountains,seacoast, old growth forests, grasslands, and many others, ishome to more endemic species than any other state.
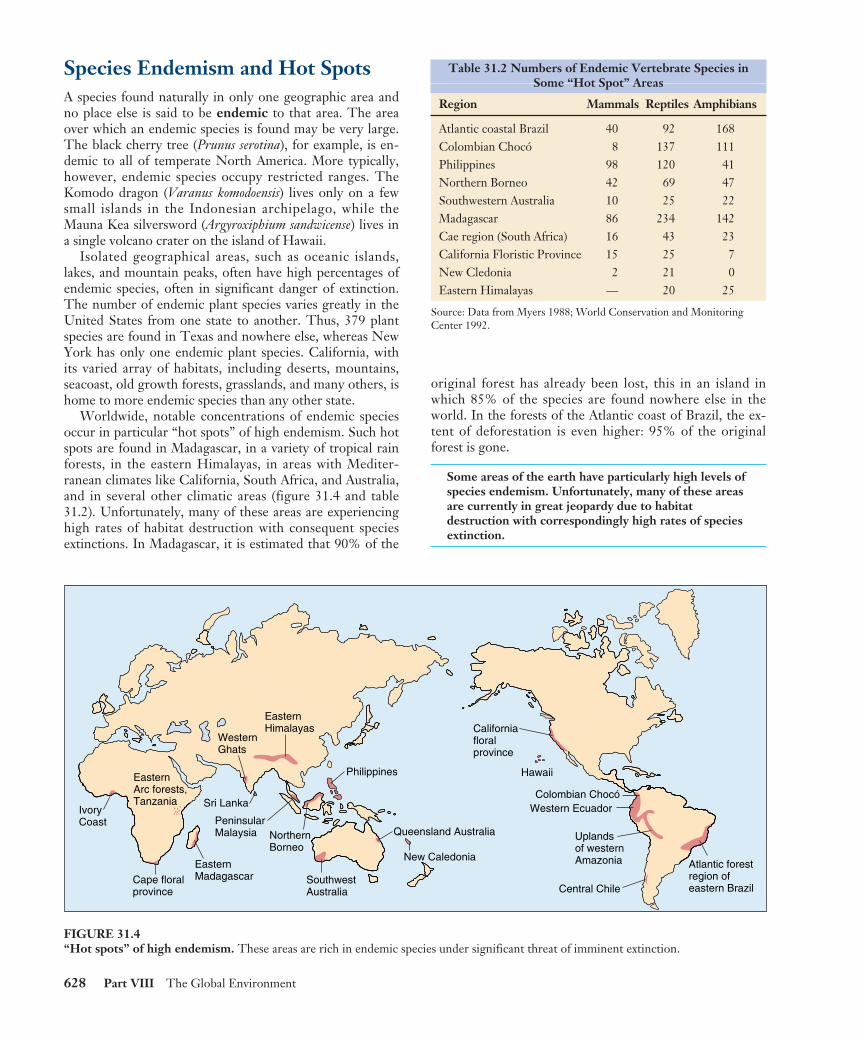
Worldwide, notable concentrations of endemic speciesoccur in particular “hot spots” of high endemism. Such hotspots are found in Madagascar, in a variety of tropical rainforests, in the eastern Himalayas, in areas with Mediter-ranean climates like California, South Africa, and Australia,and in several other climatic areas (figure 31.4 and table31.2). Unfortunately, many of these areas are experiencinghigh rates of habitat destruction with consequent speciesextinctions. In Madagascar, it is estimated that 90% of the
original forest has already been lost, this in an island inwhich 85% of the species are found nowhere else in theworld. In the forests of the Atlantic coast of Brazil, the ex-tent of deforestation is even higher: 95% of the originalforest is gone.
Some areas of the earth have particularly high levels ofspecies endemism. Unfortunately, many of these areasare currently in great jeopardy due to habitatdestruction with correspondingly high rates of speciesextinction.
628 Part VIII The Global Environment
Table 31.2 Numbers of Endemic Vertebrate Species inSome “Hot Spot” Areas
Region Mammals Reptiles Amphibians
Atlantic coastal Brazil 40 92 168Colombian Chocó 8 137 111Philippines 98 120 41Northern Borneo 42 69 47Southwestern Australia 10 25 22Madagascar 86 234 142Cae region (South Africa) 16 43 23California Floristic Province 15 25 7New Cledonia 2 21 0Eastern Himalayas — 20 25
Source: Data from Myers 1988; World Conservation and MonitoringCenter 1992.
Hawaii
Colombian ChocóWestern Ecuador
Uplandsof westernAmazonia
Californiafloralprovince
Atlantic forestregion ofeastern BrazilCentral Chile
EasternHimalayas
WesternGhats
EasternArc forests,Tanzania
IvoryCoast
Cape floralprovince
EasternMadagascar
Sri Lanka
Philippines
NorthernBorneo
SouthwestAustralia
PeninsularMalaysia Queensland Australia
New Caledonia
FIGURE 31.4“Hot spots” of high endemism. These areas are rich in endemic species under significant threat of imminent extinction.
What’s So Bad about LosingBiodiversity?What’s so bad about losing species? What is the value ofbiodiversity? Its value can be divided into three principalcomponents: (1) direct economic value of products we obtainfrom species of plants, animals, and other groups; (2) indi-rect economic value of benefits produced by species withoutour consuming them; and (3) ethical and aesthetic value.
Direct Economic Value
Many species have direct value, as sources of food, medi-cine, clothing, biomass (for energy and other purposes),and shelter. Most of the world’s food, for example, is de-rived from a small number of plants that were originallydomesticated from wild plants in tropical and semi-arid re-gions. In the future, wild strains of these species may beneeded for their genetic diversity if we are to improveyields, or find a way to breed resistance to new pests.
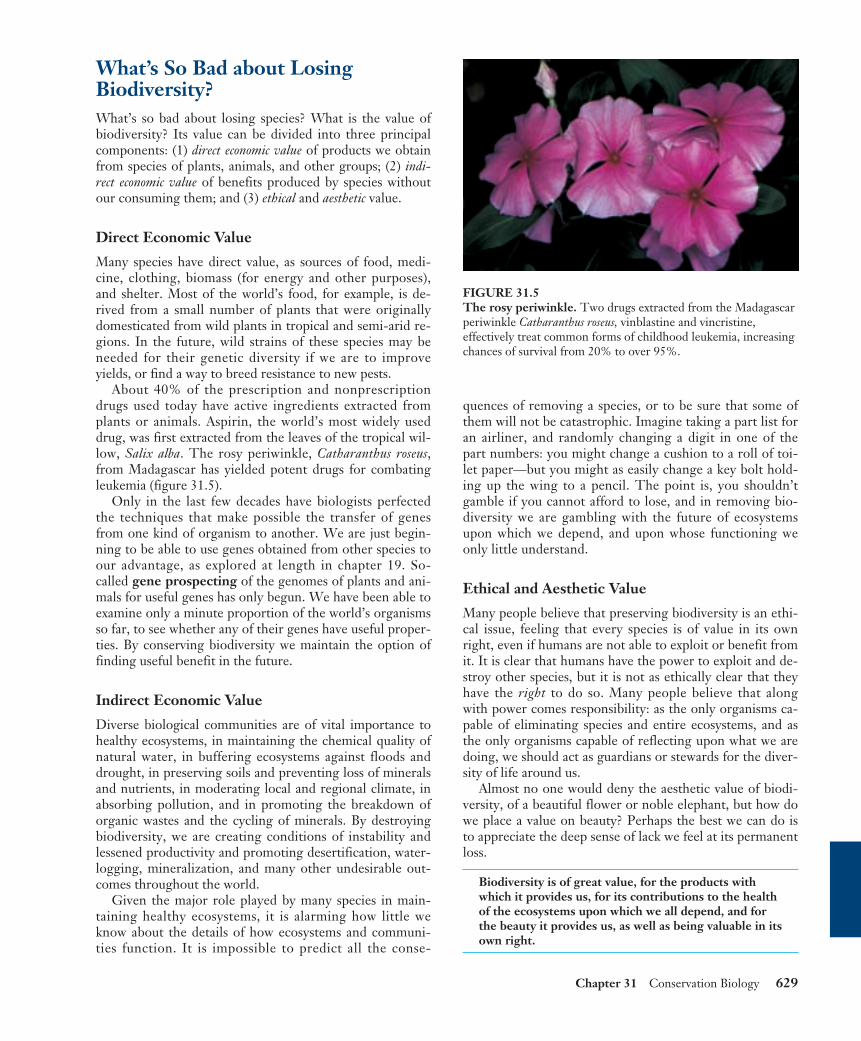
About 40% of the prescription and nonprescriptiondrugs used today have active ingredients extracted fromplants or animals. Aspirin, the world’s most widely useddrug, was first extracted from the leaves of the tropical wil-low, Salix alba. The rosy periwinkle, Catharanthus roseus,from Madagascar has yielded potent drugs for combatingleukemia (figure 31.5).
Only in the last few decades have biologists perfectedthe techniques that make possible the transfer of genesfrom one kind of organism to another. We are just begin-ning to be able to use genes obtained from other species toour advantage, as explored at length in chapter 19. So-called gene prospecting of the genomes of plants and ani-mals for useful genes has only begun. We have been able toexamine only a minute proportion of the world’s organismsso far, to see whether any of their genes have useful proper-ties. By conserving biodiversity we maintain the option offinding useful benefit in the future.
Indirect Economic Value
Diverse biological communities are of vital importance tohealthy ecosystems, in maintaining the chemical quality ofnatural water, in buffering ecosystems against floods anddrought, in preserving soils and preventing loss of mineralsand nutrients, in moderating local and regional climate, inabsorbing pollution, and in promoting the breakdown oforganic wastes and the cycling of minerals. By destroyingbiodiversity, we are creating conditions of instability andlessened productivity and promoting desertification, water-logging, mineralization, and many other undesirable out-comes throughout the world.
Given the major role played by many species in main-taining healthy ecosystems, it is alarming how little weknow about the details of how ecosystems and communi-ties function. It is impossible to predict all the conse-
quences of removing a species, or to be sure that some ofthem will not be catastrophic. Imagine taking a part list foran airliner, and randomly changing a digit in one of thepart numbers: you might change a cushion to a roll of toi-let paper—but you might as easily change a key bolt hold-ing up the wing to a pencil. The point is, you shouldn’tgamble if you cannot afford to lose, and in removing bio-diversity we are gambling with the future of ecosystemsupon which we depend, and upon whose functioning weonly little understand.
Ethical and Aesthetic Value
Many people believe that preserving biodiversity is an ethi-cal issue, feeling that every species is of value in its ownright, even if humans are not able to exploit or benefit fromit. It is clear that humans have the power to exploit and de-stroy other species, but it is not as ethically clear that theyhave the right to do so. Many people believe that alongwith power comes responsibility: as the only organisms ca-pable of eliminating species and entire ecosystems, and asthe only organisms capable of reflecting upon what we aredoing, we should act as guardians or stewards for the diver-sity of life around us.
Almost no one would deny the aesthetic value of biodi-versity, of a beautiful flower or noble elephant, but how dowe place a value on beauty? Perhaps the best we can do isto appreciate the deep sense of lack we feel at its permanentloss.
Biodiversity is of great value, for the products withwhich it provides us, for its contributions to the healthof the ecosystems upon which we all depend, and forthe beauty it provides us, as well as being valuable in itsown right.
Chapter 31 Conservation Biology 629
FIGURE 31.5 The rosy periwinkle. Two drugs extracted from the Madagascarperiwinkle Catharanthus roseus, vinblastine and vincristine,effectively treat common forms of childhood leukemia, increasingchances of survival from 20% to over 95%.
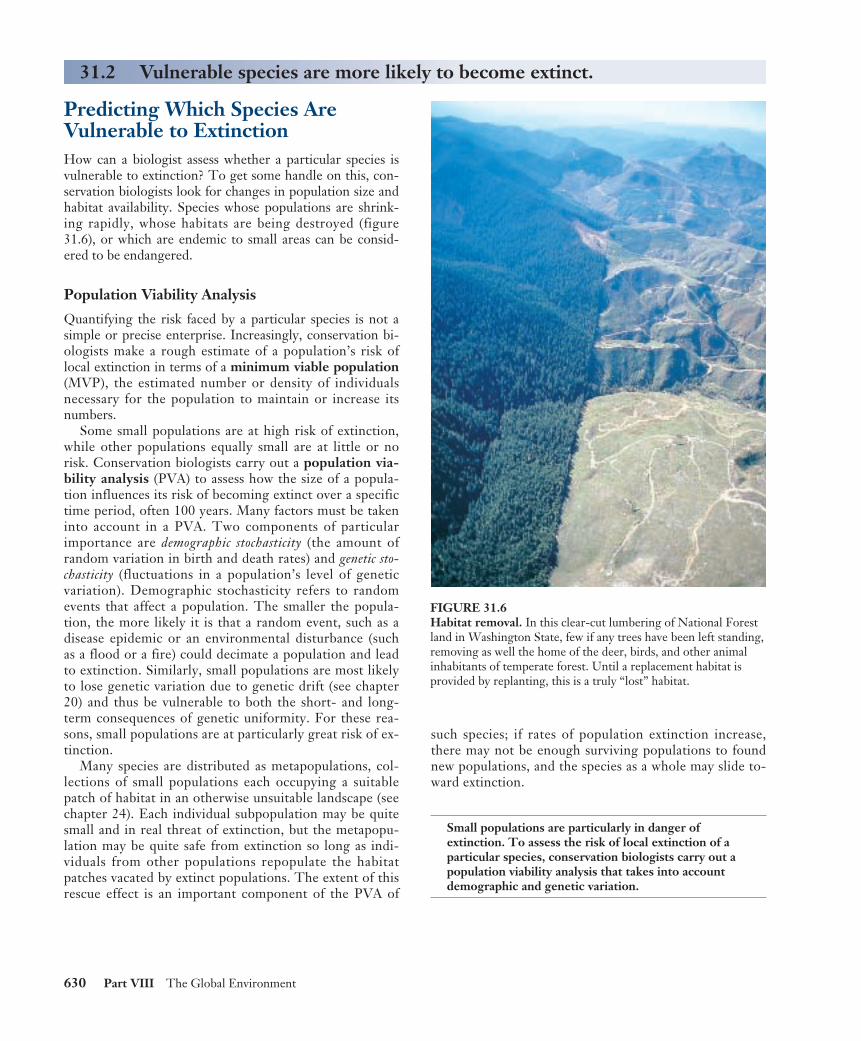
Predicting Which Species AreVulnerable to ExtinctionHow can a biologist assess whether a particular species isvulnerable to extinction? To get some handle on this, con-servation biologists look for changes in population size andhabitat availability. Species whose populations are shrink-ing rapidly, whose habitats are being destroyed (figure31.6), or which are endemic to small areas can be consid-ered to be endangered.
Population Viability Analysis
Quantifying the risk faced by a particular species is not asimple or precise enterprise. Increasingly, conservation bi-ologists make a rough estimate of a population’s risk oflocal extinction in terms of a minimum viable population(MVP), the estimated number or density of individualsnecessary for the population to maintain or increase itsnumbers.
Some small populations are at high risk of extinction,while other populations equally small are at little or norisk. Conservation biologists carry out a population via-bility analysis (PVA) to assess how the size of a popula-tion influences its risk of becoming extinct over a specifictime period, often 100 years. Many factors must be takeninto account in a PVA. Two components of particularimportance are demographic stochasticity (the amount ofrandom variation in birth and death rates) and genetic sto-chasticity (fluctuations in a population’s level of geneticvariation). Demographic stochasticity refers to randomevents that affect a population. The smaller the popula-tion, the more likely it is that a random event, such as adisease epidemic or an environmental disturbance (suchas a flood or a fire) could decimate a population and leadto extinction. Similarly, small populations are most likelyto lose genetic variation due to genetic drift (see chapter20) and thus be vulnerable to both the short- and long-term consequences of genetic uniformity. For these rea-sons, small populations are at particularly great risk of ex-tinction.
Many species are distributed as metapopulations, col-lections of small populations each occupying a suitablepatch of habitat in an otherwise unsuitable landscape (seechapter 24). Each individual subpopulation may be quitesmall and in real threat of extinction, but the metapopu-lation may be quite safe from extinction so long as indi-viduals from other populations repopulate the habitatpatches vacated by extinct populations. The extent of thisrescue effect is an important component of the PVA of
such species; if rates of population extinction increase,there may not be enough surviving populations to foundnew populations, and the species as a whole may slide to-ward extinction.
Small populations are particularly in danger ofextinction. To assess the risk of local extinction of aparticular species, conservation biologists carry out apopulation viability analysis that takes into accountdemographic and genetic variation.
630 Part VIII The Global Environment
31.2 Vulnerable species are more likely to become extinct.
FIGURE 31.6 Habitat removal. In this clear-cut lumbering of National Forestland in Washington State, few if any trees have been left standing,removing as well the home of the deer, birds, and other animalinhabitants of temperate forest. Until a replacement habitat isprovided by replanting, this is a truly “lost” habitat.
Dependence upon Other Species Species often become vulnerable to extinction when theirweb of ecological interactions becomes seriously disrupted.A recent case in point are the sea otters that live in the coldwaters off Alaska and the Aleutian Islands. A keystonespecies in the kelp forest ecosystem, the otter populationshave declined sharply in recent years. In a 500-mile stretchof coastline, otter numbers had dropped to an estimated6000 from 53,000 in the 1970s, a plunge of nearly 90%. In-vestigating this catastrophic decline, marine ecologists un-covered a chain of interactions among the species of theocean and kelp forest ecosystems, a falling domino chain oflethal effects.
The first in a series of events leading to the sea otter’sdecline seems to have been the heavy commercial harvest-ing of whales (see the case history later in this chapter).Without whales to keep their numbers in check, ocean zoo-plankton thrived, leading in turn to proliferation of aspecies of fish called pollock that feed on the now-abundantzooplankton. Given this ample food supply, the pollockproved to be very successful competitors of other northernPacific fish like herring and ocean perch, so that levels ofthese other fish fell steeply in the 1970s.
Now the falling chain of dominos begins to accelerate.The decline in the nutritious forage fish led to an ensuingcrash in Alaskan populations of Steller’s sea lions and har-bor seals, for which pollock did not provide sufficient nour-ishment. Numbers of these pinniped species have fallenprecipitously since the 1970s.
Pinnipeds are the major food of orcas, also called killerwhales. Faced with a food shortage, some orcas seem tohave turned to the next best thing: sea otters. In one baywhere the entrance from the sea was too narrow and shal-low for orcas to enter, only 12% of the sea otters have dis-appeared, while in a similar bay which orcas could entereasily, two-thirds of the otters disappeared in a year’s time.
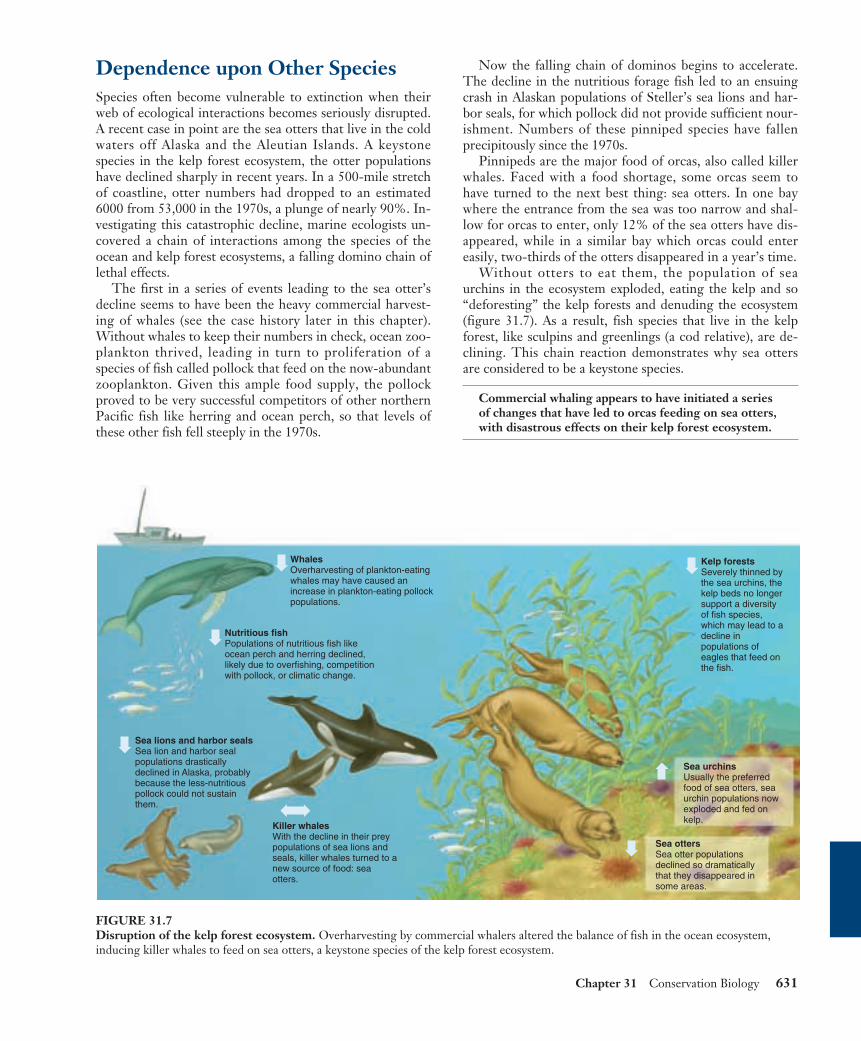
Without otters to eat them, the population of seaurchins in the ecosystem exploded, eating the kelp and so“deforesting” the kelp forests and denuding the ecosystem(figure 31.7). As a result, fish species that live in the kelpforest, like sculpins and greenlings (a cod relative), are de-clining. This chain reaction demonstrates why sea ottersare considered to be a keystone species.
Commercial whaling appears to have initiated a seriesof changes that have led to orcas feeding on sea otters,with disastrous effects on their kelp forest ecosystem.
Chapter 31 Conservation Biology 631
Nutritious fishPopulations of nutritious fish like ocean perch and herring declined, likely due to overfishing, competition with pollock, or climatic change.
Sea lions and harbor sealsSea lion and harbor seal populations drastically declined in Alaska, probably because the less-nutritious pollock could not sustain them.
Kelp forestsSeverely thinned by the sea urchins, the kelp beds no longer support a diversity of fish species, which may lead to a decline in populations of eagles that feed on the fish.
WhalesOverharvesting of plankton-eating whales may have caused an increase in plankton-eating pollock populations.
Killer whalesWith the decline in their prey populations of sea lions and seals, killer whales turned to a new source of food: sea otters.
Sea ottersSea otter populations declined so dramatically that they disappeared in some areas.
Sea urchinsUsually the preferred food of sea otters, sea urchin populations now exploded and fed on kelp.
FIGURE 31.7 Disruption of the kelp forest ecosystem. Overharvesting by commercial whalers altered the balance of fish in the ocean ecosystem,inducing killer whales to feed on sea otters, a keystone species of the kelp forest ecosystem.
Categories of Vulnerable SpeciesStudying past extinctions of species and using populationviability analyses of threatened ones, conservation biolo-gists have observed that some categories of species are par-ticularly vulnerable to extinction.
Local Endemic Distribution
Local endemic species typically occur at only one or a fewsites in a restricted geographical range, which makes themparticularly vulnerable to anything that harms the site, suchas destruction of habitat by human activity. Bird species onoceanic islands have often become extinct as humans affectthe island habitats. Many endemic fish species confined to asingle lake undergo similar fates.
Local endemic species often have small populationsizes, placing them at particular risk of extinction be-cause of their greater vulnerability to demographic andgenetic fluctuations. Indeed, population size by itselfseems to be one of the best predictors of the extinctionrisk of populations.
Local endemic species often have quite specializedniche requirements. Once a habitat is altered, it may nolonger be able to support a particular local endemic, whileremaining satisfactory for species with less particular re-quirements. For example, wetlands plants that requirevery specific and regular changes in water level may berapidly eliminated when human activity affects the hy-drology of an area.
Declining Population Size
Species in which population size is declining are often atgrave risk of extinction, particularly if the decline in num-bers of individuals is severe. Although there is no hard rule,population trends in nature tend to continue, so a popula-tion showing significant signs of decline should be consid-ered at risk of extinction unless the cause of the decline isidentified and corrected. Darwin makes this point veryclearly in On the Origin of Species:
“To admit that species generally become rare beforethey become extinct, to feel no surprise at the rarity of thespecies, and yet to marvel greatly when the species ceasesto exist, is much the same as to admit that sickness in theindividual is the forerunner of death—to feel no surprise atsickness, but when the sick man dies, to wonder and to sus-pect that he dies of some deed of violence.”
Although long-term trends toward smaller populationnumbers suggest that a species may be at risk in futureyears, abrupt recent declines in population numbers, partic-ularly when the population is small or locally endemic,fairly scream of risk of extinction. It is for this reason thatPVA is best carried out with data on population sizes gath-ered over a period of time.
Lack of Genetic Variability
Species with little genetic variability are generally at signifi-cantly greater risk of extinction than more variable species,simply because they have a more limited arsenal with whichto respond to the vagaries of environmental change.Species with extremely low genetic variability are particu-larly vulnerable when faced with a new disease, predator, orother environmental challenge. For example, the Africancheetah (Acinonyx jubatus) has almost no genetic variability.This lack of genetic variability is considered to be a signifi-cant contributing factor to a lack of disease resistance in thecheetah—diseases that are of little consequence to other catspecies can wipe out a colony of cheetahs (although envi-ronmental factors also seem to have played a key role in thecheetah’s decline).
Hunted or Harvested by People
Species that are hunted or harvested by people have histor-ically been at grave risk of extinction. Overharvesting ofnatural populations can rapidly reduce the population sizeof a species, even when that species is initially very abun-dant. A century ago the skies of North America were dark-ened by huge flocks of passenger pigeons; hunted as freeand tasty food, they were driven to extinction. The buffalothat used to migrate in enormous herds across the centralplains of North America only narrowly escaped the samefate, a few individuals preserved from this catastrophic ex-ercise in overhunting founding today’s modest herds.
The existence of a commercial market often leads tooverexploitation of a species. The international trade infurs, for example, has severely reduced the numbers ofchinchilla, vicuna, otter, and many wild cat species. Theharvesting of commercially valuable trees provides anothertelling example: almost all West Indies mahogany (Swiete-nia mahogani) have been logged from the Caribbean is-lands, and the extensive cedar forests of Lebanon, oncewidespread at high elevations in the Middle East, now sur-vive in only a few isolated groves.
A particularly telling example of overharvesting of a so-called commercial species is the commercial harvesting offish in the North Atlantic. Fishing fleets continued to har-vest large amounts of cod off Newfoundland during the1980s, even as the population numbers declined precipi-tously. By 1992 the cod population had dropped to lessthan 1% of their original numbers. The American andCanadian governments have closed the fishery, but no onecan predict if the fish populations will recover. The At-lantic bluefin tuna has experienced a 90% population de-cline in the last 10 years. The swordfish has declined evenfurther. In both cases, the drop has led to even more in-tense fishing of the remaining populations.
A variety of factors can make a species particularlyvulnerable to extinction.
632 Part VIII The Global Environment
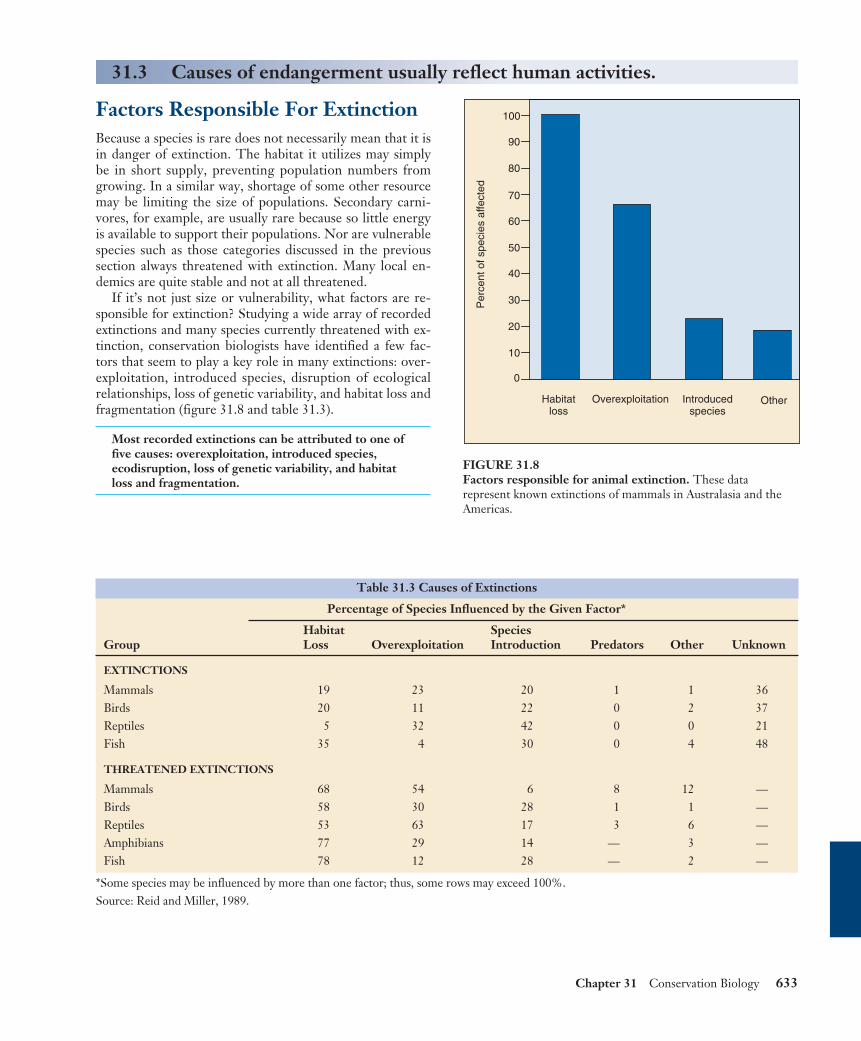
Factors Responsible For ExtinctionBecause a species is rare does not necessarily mean that it isin danger of extinction. The habitat it utilizes may simplybe in short supply, preventing population numbers fromgrowing. In a similar way, shortage of some other resourcemay be limiting the size of populations. Secondary carni-vores, for example, are usually rare because so little energyis available to support their populations. Nor are vulnerablespecies such as those categories discussed in the previoussection always threatened with extinction. Many local en-demics are quite stable and not at all threatened.
If it’s not just size or vulnerability, what factors are re-sponsible for extinction? Studying a wide array of recordedextinctions and many species currently threatened with ex-tinction, conservation biologists have identified a few fac-tors that seem to play a key role in many extinctions: over-exploitation, introduced species, disruption of ecologicalrelationships, loss of genetic variability, and habitat loss andfragmentation (figure 31.8 and table 31.3).
Most recorded extinctions can be attributed to one offive causes: overexploitation, introduced species,ecodisruption, loss of genetic variability, and habitatloss and fragmentation.
Chapter 31 Conservation Biology 633
31.3 Causes of endangerment usually reflect human activities.
Habitatloss
Overexploitation Introducedspecies
Other
Per
cent
of s
peci
es a
ffect
ed
0
10
20
30
40
50
60
70
80
90
100
FIGURE 31.8 Factors responsible for animal extinction. These datarepresent known extinctions of mammals in Australasia and theAmericas.
Table 31.3 Causes of Extinctions
Percentage of Species Influenced by the Given Factor*
Habitat Species Group Loss Overexploitation Introduction Predators Other Unknown
EXTINCTIONS
Mammals 19 23 20 1 1 36Birds 20 11 22 0 2 37Reptiles 5 32 42 0 0 21Fish 35 4 30 0 4 48
THREATENED EXTINCTIONS
Mammals 68 54 6 8 12 —Birds 58 30 28 1 1 —Reptiles 53 63 17 3 6 —Amphibians 77 29 14 — 3 —Fish 78 12 28 — 2 —
*Some species may be influenced by more than one factor; thus, some rows may exceed 100%.Source: Reid and Miller, 1989.
Habitat LossAs figure 31.8 and table 31.3 indicate, habitat loss is thesingle most important cause of extinction. Given thetremendous amounts of ongoing destruction of all types ofhabitat, from rain forest to ocean floor, this should come asno surprise. Natural habitats may be adversely affected byhuman influences in four ways: (1) destruction, (2) pollu-tion, (3) human disruption, and (4) habitat fragmentation.
Destruction
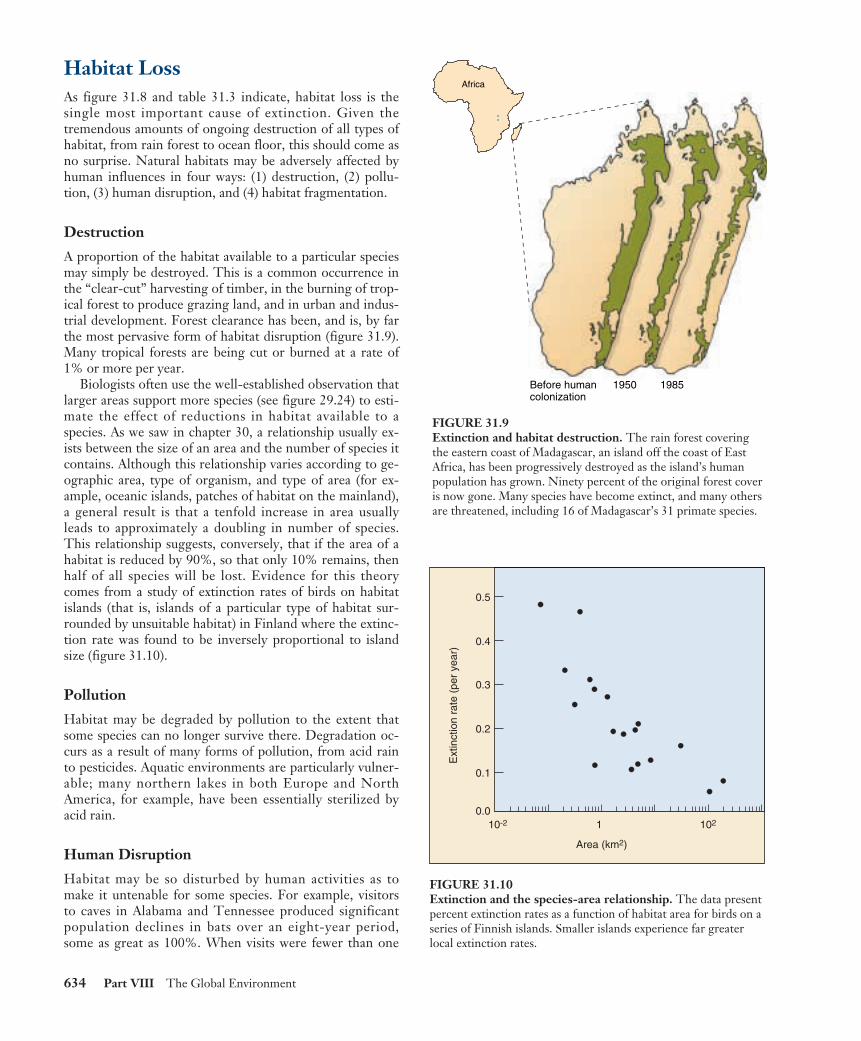
A proportion of the habitat available to a particular speciesmay simply be destroyed. This is a common occurrence inthe “clear-cut” harvesting of timber, in the burning of trop-ical forest to produce grazing land, and in urban and indus-trial development. Forest clearance has been, and is, by farthe most pervasive form of habitat disruption (figure 31.9).Many tropical forests are being cut or burned at a rate of1% or more per year.
Biologists often use the well-established observation thatlarger areas support more species (see figure 29.24) to esti-mate the effect of reductions in habitat available to aspecies. As we saw in chapter 30, a relationship usually ex-ists between the size of an area and the number of species itcontains. Although this relationship varies according to ge-ographic area, type of organism, and type of area (for ex-ample, oceanic islands, patches of habitat on the mainland),a general result is that a tenfold increase in area usuallyleads to approximately a doubling in number of species.This relationship suggests, conversely, that if the area of ahabitat is reduced by 90%, so that only 10% remains, thenhalf of all species will be lost. Evidence for this theorycomes from a study of extinction rates of birds on habitatislands (that is, islands of a particular type of habitat sur-rounded by unsuitable habitat) in Finland where the extinc-tion rate was found to be inversely proportional to islandsize (figure 31.10).
Pollution
Habitat may be degraded by pollution to the extent thatsome species can no longer survive there. Degradation oc-curs as a result of many forms of pollution, from acid rainto pesticides. Aquatic environments are particularly vulner-able; many northern lakes in both Europe and NorthAmerica, for example, have been essentially sterilized byacid rain.
Human Disruption
Habitat may be so disturbed by human activities as tomake it untenable for some species. For example, visitorsto caves in Alabama and Tennessee produced significantpopulation declines in bats over an eight-year period,some as great as 100%. When visits were fewer than one
634 Part VIII The Global Environment
Before humancolonization
1950
Africa
1985
FIGURE 31.9Extinction and habitat destruction. The rain forest coveringthe eastern coast of Madagascar, an island off the coast of EastAfrica, has been progressively destroyed as the island’s humanpopulation has grown. Ninety percent of the original forest coveris now gone. Many species have become extinct, and many othersare threatened, including 16 of Madagascar’s 31 primate species.
Ext
inct
ion
rate
(pe
r ye
ar)
0.5
0.4
0.3
0.2
0.1
0.010-2 1 102
Area (km2)
FIGURE 31.10 Extinction and the species-area relationship. The data presentpercent extinction rates as a function of habitat area for birds on aseries of Finnish islands. Smaller islands experience far greaterlocal extinction rates.
per month, less than 20% of bats were lost, but caves withmore than four visits per month suffered population de-clines of between 86 and 95%.
Habitat Fragmentation
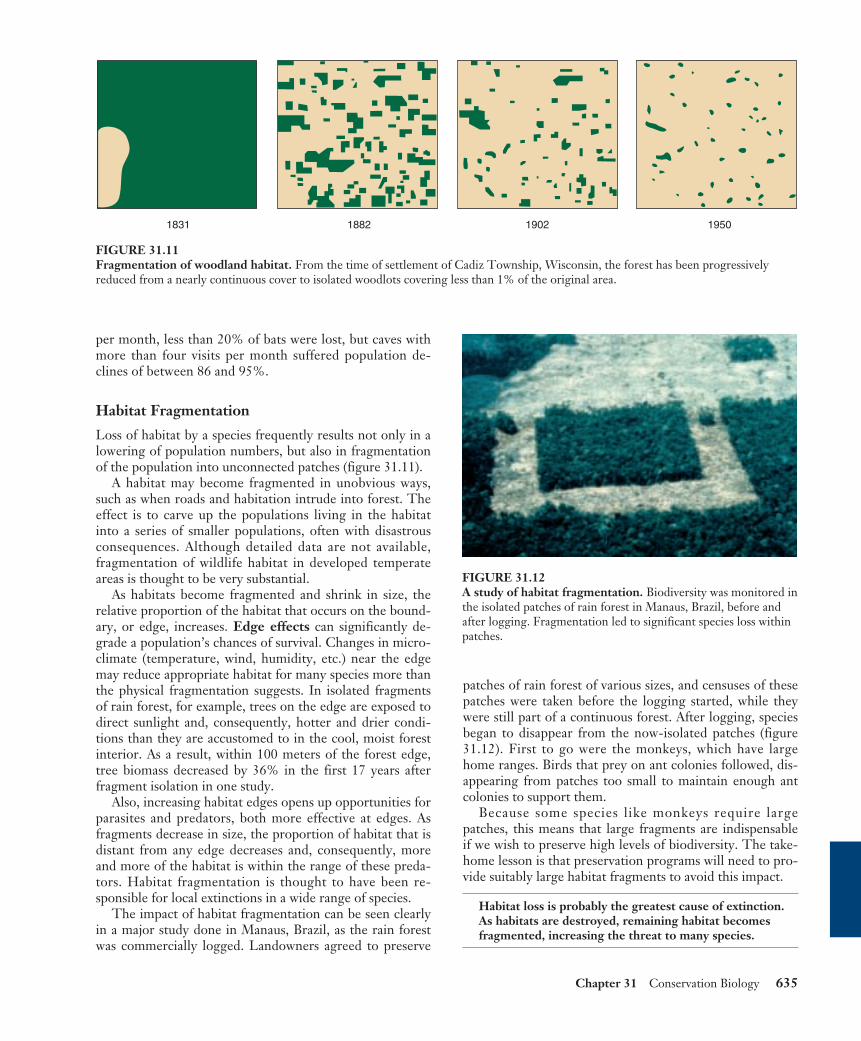
Loss of habitat by a species frequently results not only in alowering of population numbers, but also in fragmentationof the population into unconnected patches (figure 31.11).
A habitat may become fragmented in unobvious ways,such as when roads and habitation intrude into forest. Theeffect is to carve up the populations living in the habitatinto a series of smaller populations, often with disastrousconsequences. Although detailed data are not available,fragmentation of wildlife habitat in developed temperateareas is thought to be very substantial.
As habitats become fragmented and shrink in size, therelative proportion of the habitat that occurs on the bound-ary, or edge, increases. Edge effects can significantly de-grade a population’s chances of survival. Changes in micro-climate (temperature, wind, humidity, etc.) near the edgemay reduce appropriate habitat for many species more thanthe physical fragmentation suggests. In isolated fragmentsof rain forest, for example, trees on the edge are exposed todirect sunlight and, consequently, hotter and drier condi-tions than they are accustomed to in the cool, moist forestinterior. As a result, within 100 meters of the forest edge,tree biomass decreased by 36% in the first 17 years afterfragment isolation in one study.
Also, increasing habitat edges opens up opportunities forparasites and predators, both more effective at edges. Asfragments decrease in size, the proportion of habitat that isdistant from any edge decreases and, consequently, moreand more of the habitat is within the range of these preda-tors. Habitat fragmentation is thought to have been re-sponsible for local extinctions in a wide range of species.
The impact of habitat fragmentation can be seen clearlyin a major study done in Manaus, Brazil, as the rain forestwas commercially logged. Landowners agreed to preserve
patches of rain forest of various sizes, and censuses of thesepatches were taken before the logging started, while theywere still part of a continuous forest. After logging, speciesbegan to disappear from the now-isolated patches (figure31.12). First to go were the monkeys, which have largehome ranges. Birds that prey on ant colonies followed, dis-appearing from patches too small to maintain enough antcolonies to support them.
Because some species like monkeys require largepatches, this means that large fragments are indispensableif we wish to preserve high levels of biodiversity. The take-home lesson is that preservation programs will need to pro-vide suitably large habitat fragments to avoid this impact.
Habitat loss is probably the greatest cause of extinction.As habitats are destroyed, remaining habitat becomesfragmented, increasing the threat to many species.
Chapter 31 Conservation Biology 635
1831 1882 1902 1950
FIGURE 31.11 Fragmentation of woodland habitat. From the time of settlement of Cadiz Township, Wisconsin, the forest has been progressivelyreduced from a nearly continuous cover to isolated woodlots covering less than 1% of the original area.
FIGURE 31.12A study of habitat fragmentation. Biodiversity was monitored inthe isolated patches of rain forest in Manaus, Brazil, before andafter logging. Fragmentation led to significant species loss withinpatches.
Case Study: Overexploitation—WhalesWhales, the largest living animals, are rare in the world’soceans today, their numbers driven down by commercialwhaling. Commercial whaling began in the sixteenth cen-tury, and reached its apex in the nineteenth and earlytwentieth centuries. Before the advent of cheap high-grade oils manufactured from petroleum in the earlytwentieth century, oil made from whale blubber was animportant commercial product in the worldwide market-place. In addition, the fine lattice-like structure used bybaleen whales to filter-feed plankton from seawater(termed “baleen,” but sometimes called “whalebone”even though it is actually made of keratin, like finger-nails) was used in undergarments. Because a whale is sucha large animal, each individual captured is of significantcommercial value.
Right whales were the first to bear the brunt of commer-cial whaling. They were called right whales because theywere slow, easy to capture, and provided up to 150 barrelsof blubber oil and abundant whalebone, making them the“right” whale for a commercial whaler to hunt.
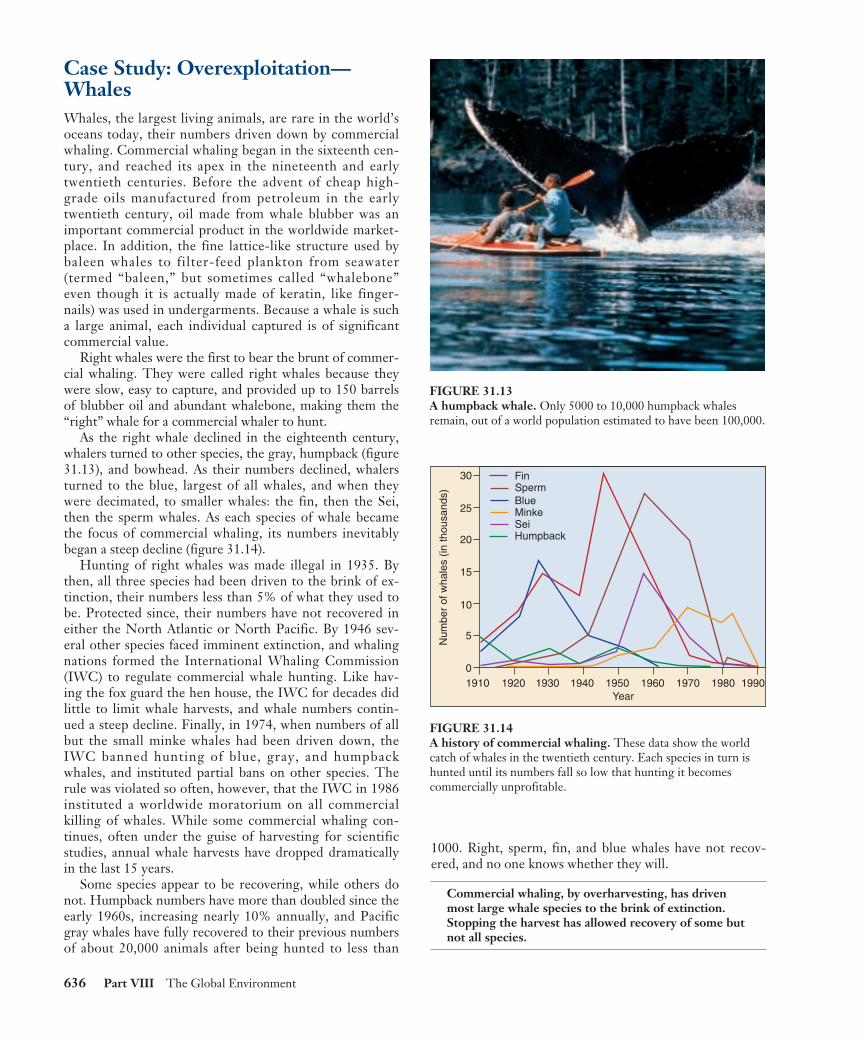
As the right whale declined in the eighteenth century,whalers turned to other species, the gray, humpback (figure31.13), and bowhead. As their numbers declined, whalersturned to the blue, largest of all whales, and when theywere decimated, to smaller whales: the fin, then the Sei,then the sperm whales. As each species of whale becamethe focus of commercial whaling, its numbers inevitablybegan a steep decline (figure 31.14).
Hunting of right whales was made illegal in 1935. Bythen, all three species had been driven to the brink of ex-tinction, their numbers less than 5% of what they used tobe. Protected since, their numbers have not recovered ineither the North Atlantic or North Pacific. By 1946 sev-eral other species faced imminent extinction, and whalingnations formed the International Whaling Commission(IWC) to regulate commercial whale hunting. Like hav-ing the fox guard the hen house, the IWC for decades didlittle to limit whale harvests, and whale numbers contin-ued a steep decline. Finally, in 1974, when numbers of allbut the small minke whales had been driven down, theIWC banned hunting of blue, gray, and humpbackwhales, and instituted partial bans on other species. Therule was violated so often, however, that the IWC in 1986instituted a worldwide moratorium on all commercialkilling of whales. While some commercial whaling con-tinues, often under the guise of harvesting for scientificstudies, annual whale harvests have dropped dramaticallyin the last 15 years.
Some species appear to be recovering, while others donot. Humpback numbers have more than doubled since theearly 1960s, increasing nearly 10% annually, and Pacificgray whales have fully recovered to their previous numbersof about 20,000 animals after being hunted to less than
1000. Right, sperm, fin, and blue whales have not recov-ered, and no one knows whether they will.
Commercial whaling, by overharvesting, has drivenmost large whale species to the brink of extinction.Stopping the harvest has allowed recovery of some butnot all species.
636 Part VIII The Global Environment
FIGURE 31.13 A humpback whale. Only 5000 to 10,000 humpback whalesremain, out of a world population estimated to have been 100,000.
1910 1920 1930 1940 1950 1960 1970 1980 19900
5
10
15
20
25
30
Num
ber
of w
hale
s (in
thou
sand
s)
FinSpermBlueMinkeSeiHumpback
Year
FIGURE 31.14 A history of commercial whaling. These data show the worldcatch of whales in the twentieth century. Each species in turn ishunted until its numbers fall so low that hunting it becomescommercially unprofitable.
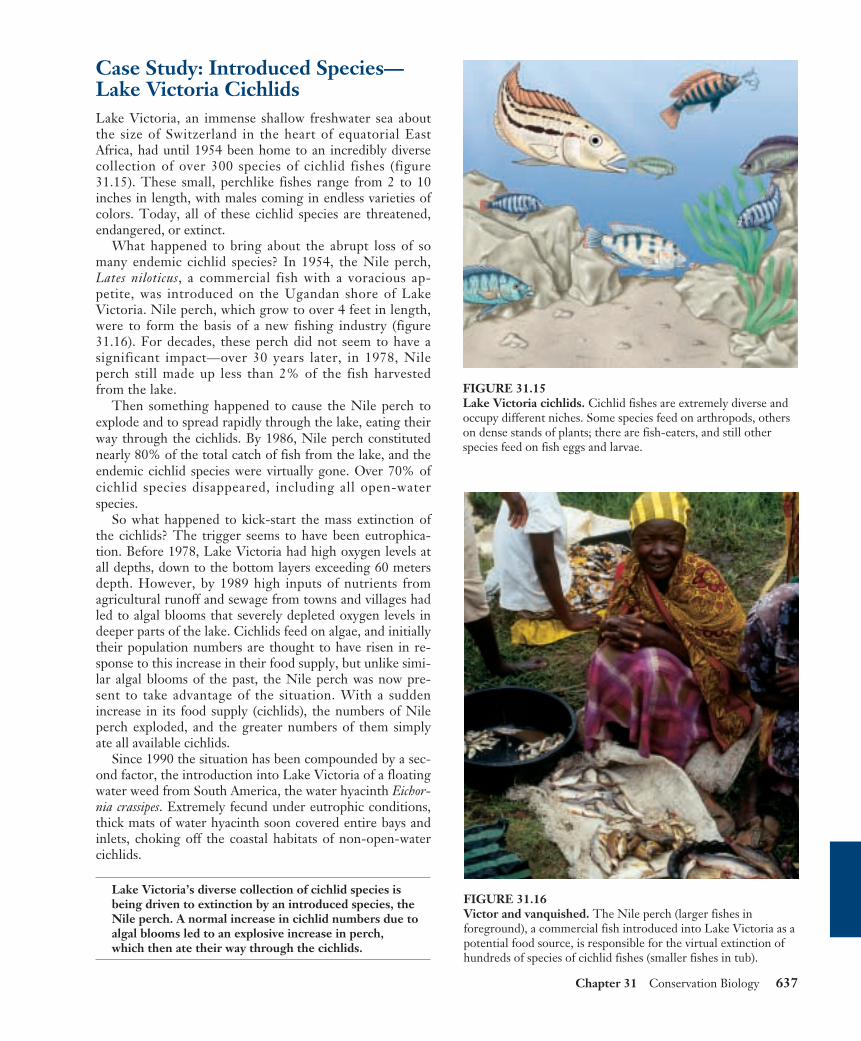
Case Study: Introduced Species—Lake Victoria CichlidsLake Victoria, an immense shallow freshwater sea aboutthe size of Switzerland in the heart of equatorial EastAfrica, had until 1954 been home to an incredibly diversecollection of over 300 species of cichlid fishes (figure31.15). These small, perchlike fishes range from 2 to 10inches in length, with males coming in endless varieties ofcolors. Today, all of these cichlid species are threatened,endangered, or extinct.
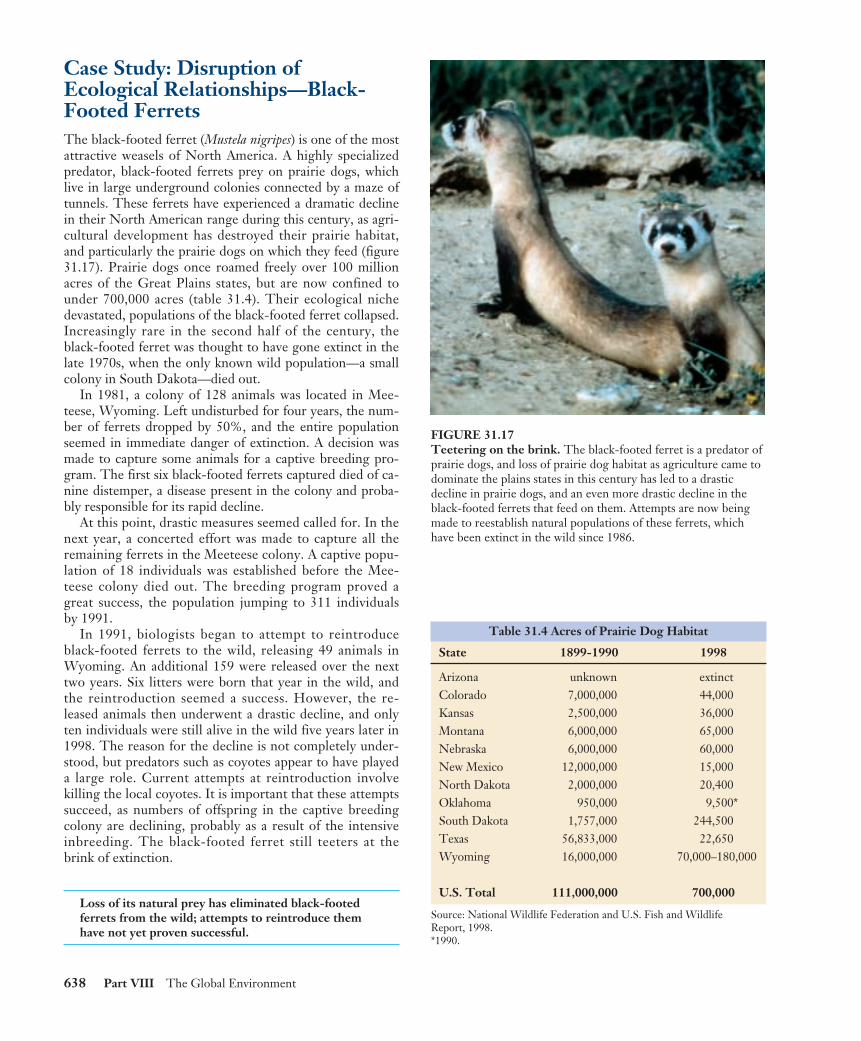
What happened to bring about the abrupt loss of somany endemic cichlid species? In 1954, the Nile perch,Lates niloticus, a commercial fish with a voracious ap-petite, was introduced on the Ugandan shore of LakeVictoria. Nile perch, which grow to over 4 feet in length,were to form the basis of a new fishing industry (figure31.16). For decades, these perch did not seem to have asignificant impact—over 30 years later, in 1978, Nileperch still made up less than 2% of the fish harvestedfrom the lake.
Then something happened to cause the Nile perch toexplode and to spread rapidly through the lake, eating theirway through the cichlids. By 1986, Nile perch constitutednearly 80% of the total catch of fish from the lake, and theendemic cichlid species were virtually gone. Over 70% ofcichlid species disappeared, including all open-waterspecies.
So what happened to kick-start the mass extinction ofthe cichlids? The trigger seems to have been eutrophica-tion. Before 1978, Lake Victoria had high oxygen levels atall depths, down to the bottom layers exceeding 60 metersdepth. However, by 1989 high inputs of nutrients fromagricultural runoff and sewage from towns and villages hadled to algal blooms that severely depleted oxygen levels indeeper parts of the lake. Cichlids feed on algae, and initiallytheir population numbers are thought to have risen in re-sponse to this increase in their food supply, but unlike simi-lar algal blooms of the past, the Nile perch was now pre-sent to take advantage of the situation. With a suddenincrease in its food supply (cichlids), the numbers of Nileperch exploded, and the greater numbers of them simplyate all available cichlids.
Since 1990 the situation has been compounded by a sec-ond factor, the introduction into Lake Victoria of a floatingwater weed from South America, the water hyacinth Eichor-nia crassipes. Extremely fecund under eutrophic conditions,thick mats of water hyacinth soon covered entire bays andinlets, choking off the coastal habitats of non-open-watercichlids.
Lake Victoria’s diverse collection of cichlid species isbeing driven to extinction by an introduced species, theNile perch. A normal increase in cichlid numbers due toalgal blooms led to an explosive increase in perch,which then ate their way through the cichlids.
Chapter 31 Conservation Biology 637
FIGURE 31.15 Lake Victoria cichlids. Cichlid fishes are extremely diverse andoccupy different niches. Some species feed on arthropods, otherson dense stands of plants; there are fish-eaters, and still otherspecies feed on fish eggs and larvae.
FIGURE 31.16 Victor and vanquished. The Nile perch (larger fishes inforeground), a commercial fish introduced into Lake Victoria as apotential food source, is responsible for the virtual extinction ofhundreds of species of cichlid fishes (smaller fishes in tub).
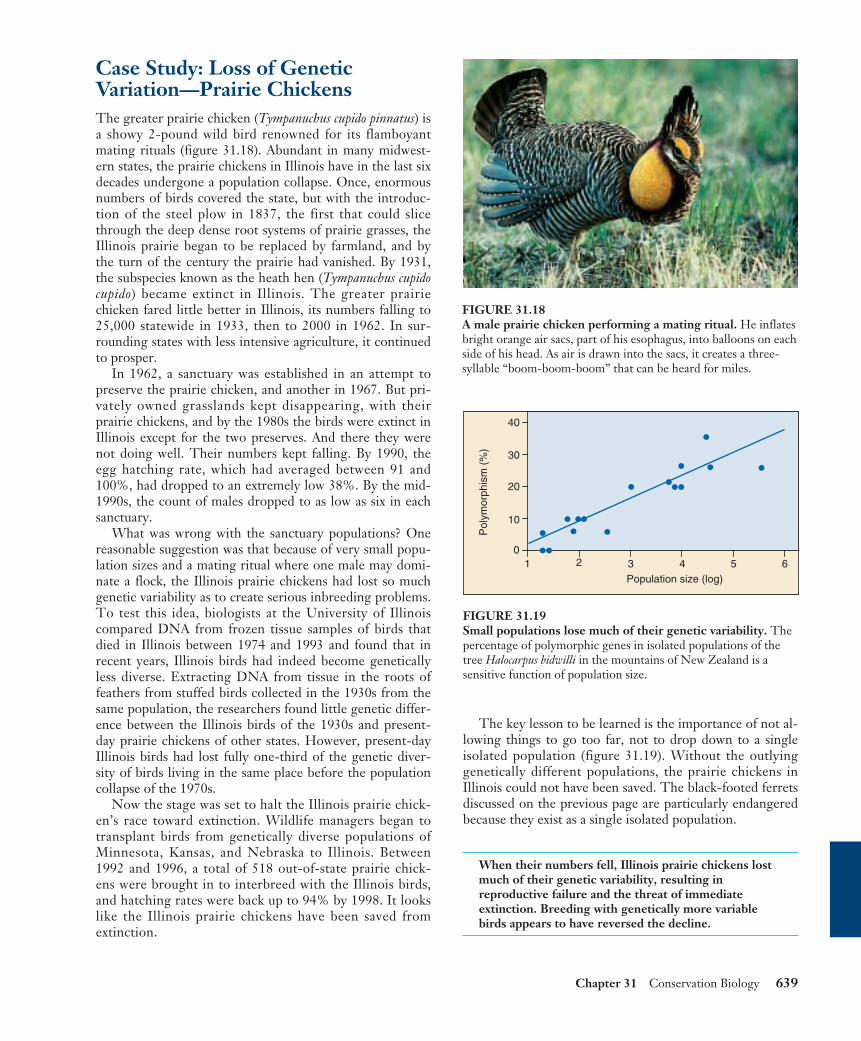
Case Study: Disruption ofEcological Relationships—Black-Footed FerretsThe black-footed ferret (Mustela nigripes) is one of the mostattractive weasels of North America. A highly specializedpredator, black-footed ferrets prey on prairie dogs, whichlive in large underground colonies connected by a maze oftunnels. These ferrets have experienced a dramatic declinein their North American range during this century, as agri-cultural development has destroyed their prairie habitat,and particularly the prairie dogs on which they feed (figure31.17). Prairie dogs once roamed freely over 100 millionacres of the Great Plains states, but are now confined tounder 700,000 acres (table 31.4). Their ecological nichedevastated, populations of the black-footed ferret collapsed.Increasingly rare in the second half of the century, theblack-footed ferret was thought to have gone extinct in thelate 1970s, when the only known wild population—a smallcolony in South Dakota—died out.
In 1981, a colony of 128 animals was located in Mee-teese, Wyoming. Left undisturbed for four years, the num-ber of ferrets dropped by 50%, and the entire populationseemed in immediate danger of extinction. A decision wasmade to capture some animals for a captive breeding pro-gram. The first six black-footed ferrets captured died of ca-nine distemper, a disease present in the colony and proba-bly responsible for its rapid decline.
At this point, drastic measures seemed called for. In thenext year, a concerted effort was made to capture all theremaining ferrets in the Meeteese colony. A captive popu-lation of 18 individuals was established before the Mee-teese colony died out. The breeding program proved agreat success, the population jumping to 311 individualsby 1991.
In 1991, biologists began to attempt to reintroduceblack-footed ferrets to the wild, releasing 49 animals inWyoming. An additional 159 were released over the nexttwo years. Six litters were born that year in the wild, andthe reintroduction seemed a success. However, the re-leased animals then underwent a drastic decline, and onlyten individuals were still alive in the wild five years later in1998. The reason for the decline is not completely under-stood, but predators such as coyotes appear to have playeda large role. Current attempts at reintroduction involvekilling the local coyotes. It is important that these attemptssucceed, as numbers of offspring in the captive breedingcolony are declining, probably as a result of the intensiveinbreeding. The black-footed ferret still teeters at thebrink of extinction.
Loss of its natural prey has eliminated black-footedferrets from the wild; attempts to reintroduce themhave not yet proven successful.
638 Part VIII The Global Environment
Table 31.4 Acres of Prairie Dog Habitat
State 1899-1990 1998
Arizona unknown extinctColorado 7,000,000 44,000Kansas 2,500,000 36,000Montana 6,000,000 65,000Nebraska 6,000,000 60,000New Mexico 12,000,000 15,000North Dakota 2,000,000 20,400Oklahoma 950,000 9,500*South Dakota 1,757,000 244,500Texas 56,833,000 22,650Wyoming 16,000,000 70,000–180,000
U.S. Total 111,000,000 700,000
Source: National Wildlife Federation and U.S. Fish and WildlifeReport, 1998.*1990.
FIGURE 31.17 Teetering on the brink. The black-footed ferret is a predator ofprairie dogs, and loss of prairie dog habitat as agriculture came todominate the plains states in this century has led to a drasticdecline in prairie dogs, and an even more drastic decline in theblack-footed ferrets that feed on them. Attempts are now beingmade to reestablish natural populations of these ferrets, whichhave been extinct in the wild since 1986.
Case Study: Loss of GeneticVariation—Prairie ChickensThe greater prairie chicken (Tympanuchus cupido pinnatus) isa showy 2-pound wild bird renowned for its flamboyantmating rituals (figure 31.18). Abundant in many midwest-ern states, the prairie chickens in Illinois have in the last sixdecades undergone a population collapse. Once, enormousnumbers of birds covered the state, but with the introduc-tion of the steel plow in 1837, the first that could slicethrough the deep dense root systems of prairie grasses, theIllinois prairie began to be replaced by farmland, and bythe turn of the century the prairie had vanished. By 1931,the subspecies known as the heath hen (Tympanuchus cupidocupido) became extinct in Illinois. The greater prairiechicken fared little better in Illinois, its numbers falling to25,000 statewide in 1933, then to 2000 in 1962. In sur-rounding states with less intensive agriculture, it continuedto prosper.
In 1962, a sanctuary was established in an attempt topreserve the prairie chicken, and another in 1967. But pri-vately owned grasslands kept disappearing, with theirprairie chickens, and by the 1980s the birds were extinct inIllinois except for the two preserves. And there they werenot doing well. Their numbers kept falling. By 1990, theegg hatching rate, which had averaged between 91 and100%, had dropped to an extremely low 38%. By the mid-1990s, the count of males dropped to as low as six in eachsanctuary.
What was wrong with the sanctuary populations? Onereasonable suggestion was that because of very small popu-lation sizes and a mating ritual where one male may domi-nate a flock, the Illinois prairie chickens had lost so muchgenetic variability as to create serious inbreeding problems.To test this idea, biologists at the University of Illinoiscompared DNA from frozen tissue samples of birds thatdied in Illinois between 1974 and 1993 and found that inrecent years, Illinois birds had indeed become geneticallyless diverse. Extracting DNA from tissue in the roots offeathers from stuffed birds collected in the 1930s from thesame population, the researchers found little genetic differ-ence between the Illinois birds of the 1930s and present-day prairie chickens of other states. However, present-dayIllinois birds had lost fully one-third of the genetic diver-sity of birds living in the same place before the populationcollapse of the 1970s.
Now the stage was set to halt the Illinois prairie chick-en’s race toward extinction. Wildlife managers began totransplant birds from genetically diverse populations ofMinnesota, Kansas, and Nebraska to Illinois. Between1992 and 1996, a total of 518 out-of-state prairie chick-ens were brought in to interbreed with the Illinois birds,and hatching rates were back up to 94% by 1998. It lookslike the Illinois prairie chickens have been saved fromextinction.
The key lesson to be learned is the importance of not al-lowing things to go too far, not to drop down to a singleisolated population (figure 31.19). Without the outlyinggenetically different populations, the prairie chickens inIllinois could not have been saved. The black-footed ferretsdiscussed on the previous page are particularly endangeredbecause they exist as a single isolated population.
When their numbers fell, Illinois prairie chickens lostmuch of their genetic variability, resulting inreproductive failure and the threat of immediateextinction. Breeding with genetically more variablebirds appears to have reversed the decline.
Chapter 31 Conservation Biology 639
FIGURE 31.18 A male prairie chicken performing a mating ritual. He inflatesbright orange air sacs, part of his esophagus, into balloons on eachside of his head. As air is drawn into the sacs, it creates a three-syllable “boom-boom-boom” that can be heard for miles.
Pol
ymor
phis
m (
%)
Population size (log)1 2 3 4 5 6
0
10
20
30
40
••• •
•••
• •••• • •
•
•
FIGURE 31.19 Small populations lose much of their genetic variability. Thepercentage of polymorphic genes in isolated populations of thetree Halocarpus bidwilli in the mountains of New Zealand is asensitive function of population size.
Case Study: Habitat Loss andFragmentation—SongbirdsEvery year since 1966, the U.S. Fish and Wildlife Servicehas organized thousands of amateur ornithologists and birdwatchers in an annual bird count called the Breeding BirdSurvey. In recent years, a shocking trend has emerged.While year-round residents that prosper around humans,like robins, starlings, and blackbirds, have increased theirnumbers and distribution over the last 30 years, forestsongbirds have declined severely. The decline has beengreatest among long-distance migrants such as thrushes,orioles, tanagers, catbirds, vireos, buntings, and warblers.These birds nest in northern forests in the summer, butspend their winters in South or Central America or theCaribbean Islands.
In many areas of the eastern United States, more thanthree-quarters of the neotropical migrant bird species havedeclined significantly. Rock Creek Park in Washington,D.C., for example, has lost 90 percent of its long distancemigrants in the last 20 years. Nationwide, American red-starts declined about 50% in the single decade of the 1970s.Studies of radar images from National Weather Servicestations in Texas and Louisiana indicate that only abouthalf as many birds fly over the Gulf of Mexico each springcompared to numbers in the 1960s. This suggests a loss ofabout half a billion birds in total, a devastating loss.
The culprit responsible for this widespread decline ap-pears to be habitat fragmentation and loss. Fragmentationof breeding habitat and nesting failures in the summernesting grounds of the United States and Canada have hada major negative impact on the breeding of woodland song-birds. Many of the most threatened species are adapted todeep woods and need an area of 25 acres or more per pairto breed and raise their young. As woodlands are broken upby roads and developments, it is becoming increasingly dif-ficult to find enough contiguous woods to nest successfully.
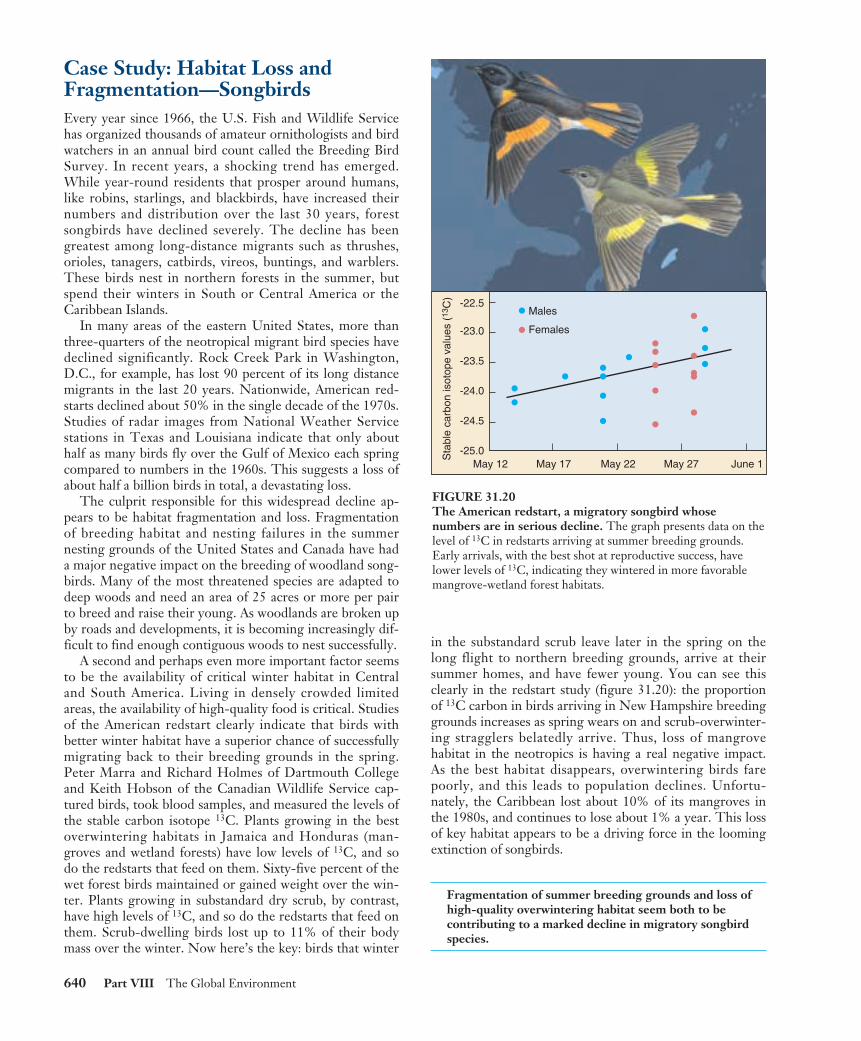
A second and perhaps even more important factor seemsto be the availability of critical winter habitat in Centraland South America. Living in densely crowded limitedareas, the availability of high-quality food is critical. Studiesof the American redstart clearly indicate that birds withbetter winter habitat have a superior chance of successfullymigrating back to their breeding grounds in the spring.Peter Marra and Richard Holmes of Dartmouth Collegeand Keith Hobson of the Canadian Wildlife Service cap-tured birds, took blood samples, and measured the levels ofthe stable carbon isotope 13C. Plants growing in the bestoverwintering habitats in Jamaica and Honduras (man-groves and wetland forests) have low levels of 13C, and sodo the redstarts that feed on them. Sixty-five percent of thewet forest birds maintained or gained weight over the win-ter. Plants growing in substandard dry scrub, by contrast,have high levels of 13C, and so do the redstarts that feed onthem. Scrub-dwelling birds lost up to 11% of their bodymass over the winter. Now here’s the key: birds that winter
in the substandard scrub leave later in the spring on thelong flight to northern breeding grounds, arrive at theirsummer homes, and have fewer young. You can see thisclearly in the redstart study (figure 31.20): the proportionof 13C carbon in birds arriving in New Hampshire breedinggrounds increases as spring wears on and scrub-overwinter-ing stragglers belatedly arrive. Thus, loss of mangrovehabitat in the neotropics is having a real negative impact.As the best habitat disappears, overwintering birds farepoorly, and this leads to population declines. Unfortu-nately, the Caribbean lost about 10% of its mangroves inthe 1980s, and continues to lose about 1% a year. This lossof key habitat appears to be a driving force in the loomingextinction of songbirds.
Fragmentation of summer breeding grounds and loss ofhigh-quality overwintering habitat seem both to becontributing to a marked decline in migratory songbirdspecies.
640 Part VIII The Global Environment
Sta
ble
carb
on is
otop
e va
lues
(13
C)
Males
Females
May 12 May 17 May 22 May 27 June 1
-22.5
-23.5
-23.0
-24.0
-24.5
-25.0
FIGURE 31.20 The American redstart, a migratory songbird whosenumbers are in serious decline. The graph presents data on thelevel of 13C in redstarts arriving at summer breeding grounds.Early arrivals, with the best shot at reproductive success, havelower levels of 13C, indicating they wintered in more favorablemangrove-wetland forest habitats.
Many Approaches Exist forPreserving Endangered SpeciesOnce you understand the reasons why a particular speciesis endangered, it becomes possible to think of designing arecovery plan. If the cause is commercial overharvesting,regulations can be designed to lessen the impact and pro-tect the threatened species. If the cause is habitat loss,plans can be instituted to restore lost habitat. Loss of ge-netic variability in isolated subpopulations can be coun-tered by transplanting individuals from genetically differ-ent populations. Populations in immediate danger ofextinction can be captured, introduced into a captivebreeding program, and later reintroduced to other suit-able habitat.
Of course, all of these solutions are extremely expensive.As Bruce Babbitt, Interior Secretary in the Clinton admin-istration, noted, it is much more economical to preventsuch “environmental trainwrecks” from occurring than it isto clean them up afterwards. Preserving ecosystems andmonitoring species before they are threatened is the mosteffective means of protecting the environment and prevent-ing extinctions.
Habitat Restoration
Conservation biology typically concerns itself with preserv-ing populations and species in danger of decline or extinc-tion. Conservation, however, requires that there be some-thing left to preserve, while in many situations,conservation is no longer an option. Species, and in somecases whole communities, have disappeared or have beenirretrievably modified. The clear-cutting of the temperateforests of Washington State leaves little behind to con-serve; nor does converting a piece of land into a wheat fieldor an asphalt parking lot. Redeeming these situations re-quires restoration rather than conservation.
Three quite different sorts of habitat restoration pro-grams might be undertaken, depending very much on thecause of the habitat loss.
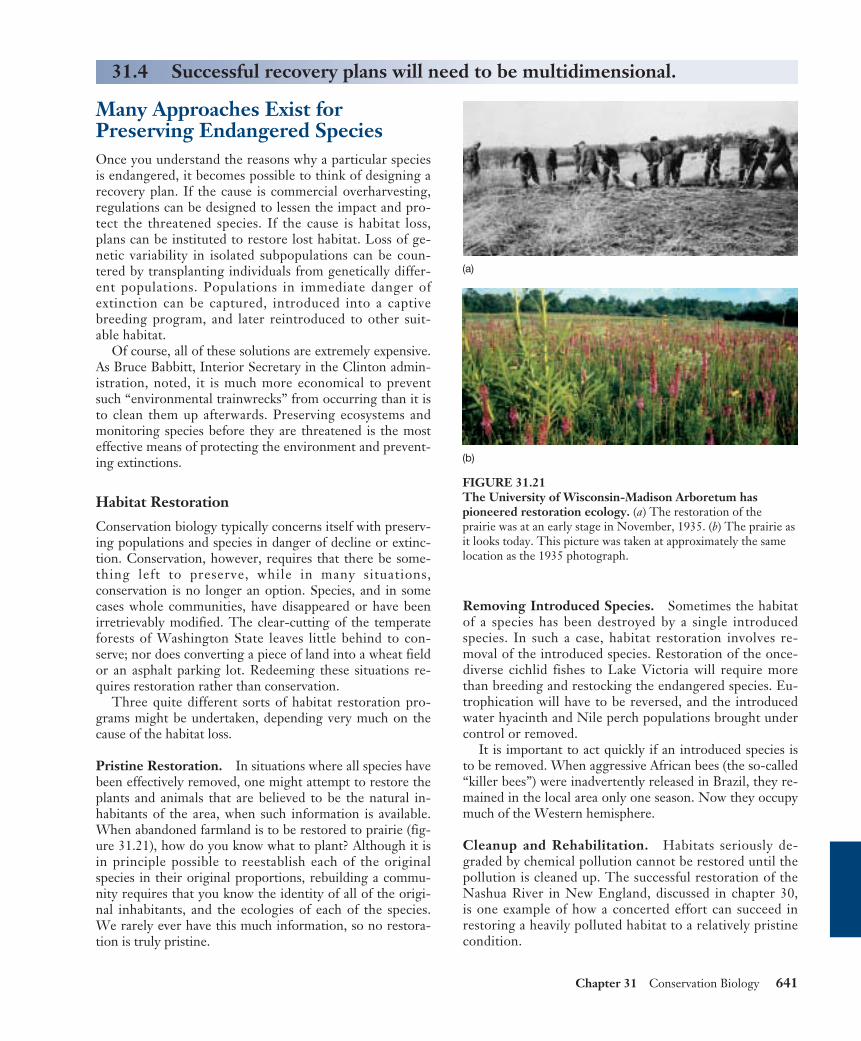
Pristine Restoration. In situations where all species havebeen effectively removed, one might attempt to restore theplants and animals that are believed to be the natural in-habitants of the area, when such information is available.When abandoned farmland is to be restored to prairie (fig-ure 31.21), how do you know what to plant? Although it isin principle possible to reestablish each of the originalspecies in their original proportions, rebuilding a commu-nity requires that you know the identity of all of the origi-nal inhabitants, and the ecologies of each of the species.We rarely ever have this much information, so no restora-tion is truly pristine.
Removing Introduced Species. Sometimes the habitatof a species has been destroyed by a single introducedspecies. In such a case, habitat restoration involves re-moval of the introduced species. Restoration of the once-diverse cichlid fishes to Lake Victoria will require morethan breeding and restocking the endangered species. Eu-trophication will have to be reversed, and the introducedwater hyacinth and Nile perch populations brought undercontrol or removed.
It is important to act quickly if an introduced species isto be removed. When aggressive African bees (the so-called“killer bees”) were inadvertently released in Brazil, they re-mained in the local area only one season. Now they occupymuch of the Western hemisphere.
Cleanup and Rehabilitation. Habitats seriously de-graded by chemical pollution cannot be restored until thepollution is cleaned up. The successful restoration of theNashua River in New England, discussed in chapter 30,is one example of how a concerted effort can succeed inrestoring a heavily polluted habitat to a relatively pristinecondition.
Chapter 31 Conservation Biology 641
31.4 Successful recovery plans will need to be multidimensional.
(a)
(b)
FIGURE 31.21The University of Wisconsin-Madison Arboretum haspioneered restoration ecology. (a) The restoration of theprairie was at an early stage in November, 1935. (b) The prairie asit looks today. This picture was taken at approximately the samelocation as the 1935 photograph.

Captive Propagation
Recovery programs, particularly those focused on one or afew species, often must involve direct intervention in nat-ural populations to avoid an immediate threat of extinction.Earlier we learned how introducing wild-caught individualsinto captive breeding programs is being used in an attemptto save ferret and prairie chicken populations in immediatedanger of disappearing. Several other such captive propaga-tion programs have had significant success.
Case History: The Peregrine Falcon. American popu-lations of birds of prey such as the peregrine falcon (Falcoperegrinus) began an abrupt decline shortly after WorldWar II. Of the approximately 350 breeding pairs east of theMississippi River in 1942, all had disappeared by 1960. Theculprit proved to be the chemical pesticide DDT(dichlorodiphenyltrichloroethane) and related organochlo-rine pesticides. Birds of prey are particularly vulnerable toDDT because they feed at the top of the food chain, whereDDT becomes concentrated. DDT interferes with the de-position of calcium in the bird’s eggshells, causing most ofthe eggs to break before they hatch.
The use of DDT was banned by federal law in 1972,causing levels in the eastern United States to fall quickly.There were no peregrine falcons left in the eastern UnitedStates to reestablish a natural population, however. Falconsfrom other parts of the country were used to establish acaptive breeding program at Cornell University in 1970,with the intent of reestablishing the peregrine falcon in theeastern United States by releasing offspring of these birdsBy the end of 1986, over 850 birds had been released in 13eastern states, producing an astonishingly strong recovery(figure 31.22).
Case History: The California Condor. Numbers ofthe California condor (Gymnogyps californianus), a largevulturelike bird with a wingspan of nearly 3 meters, havebeen declining gradually for the last 200 years. By 1985condor numbers had dropped so low the bird was on theverge of extinction. Six of the remaining 15 wild birdsdisappeared that year alone. The entire breeding popula-tion of the species consisted of the 6 birds remaining inthe wild, and an additional 21 birds in captivity. In a last-ditch attempt to save the condor from extinction, the re-maining birds were captured and placed in a captivebreeding population. The breeding program was set upin zoos, with the goal of releasing offspring on a large5300-ha ranch in prime condor habitat. Birds were iso-lated from human contact as much as possible, andclosely related individuals were prevented from breeding.By the end of 1999 the captive population of Californiacondors had reached over 110 individuals. Twenty-ninecaptive-reared condors have been released successfully inCalifornia at two sites in the mountains north of Los An-geles, after extensive prerelease training to avoid powerpoles and people, all of the released birds seem to be
doing well. Twenty additional birds released into theGrand Canyon have adapted well. Biologists are waitingto see if the released condors will breed in the wild andsuccessfully raise a new generation of wild condors.
Case History: Yellowstone Wolves. The ultimategoal of captive breeding programs is not simply to pre-serve interesting species, but rather to restore ecosystemsto a balanced functional state. Yellowstone Park has beenan ecosystem out of balance, due in large part to the sys-tematic extermination of the gray wolf (Canis lupus) in thepark early in this century. Without these predators tokeep their numbers in check, herds of elk and deer ex-panded rapidly, damaging vegetation so that the elkthemselves starve in times of scarcity. In an attempt torestore the park’s natural balance, two complete wolfpacks from Canada were released into the park in 1995and 1996. The wolves adapted well, breeding so success-fully that by 1998 the park contained nine free-rangingpacks, a total of 90 wolves.
While ranchers near the park have been unhappy aboutthe return of the wolves, little damage to livestock has beennoted, and the ecological equilibrium of Yellowstone Parkseems well on the way to recovery. Elk are congregating inlarger herds, and their populations are not growing asrapidly as in years past. Importantly, wolves are killing coy-otes and their pups, driving them out of some areas. Coy-otes, the top predators in the absence of wolves, are knownto attack cattle on surrounding ranches, so reintroductionof wolves to the park may actually benefit the cattle ranch-ers that are opposed to it.
642 Part VIII The Global Environment
19800
20
40
60
80
100
1982 1984
Year
Num
ber
of p
airs
of p
ereg
rines
1986 1988 1990
Pairs observed
Pairs nesting
Pairs producing offspring
FIGURE 31.22 Captive propagation. The peregrine falcon has beenreestablished in the eastern United States by releasing captive-bred birds over a period of 10 years.
Sustaining Genetic Diversity
One of the chief obstacles to a successful species recoveryprogram is that a species is generally in serious trouble bythe time a recovery program is instituted. When popula-tions become very small, much of their genetic diversity islost (see figure 31.19), as we have seen clearly in our exami-nation of the case histories of prairie chickens and black-footed ferrets. If a program is to have any chance of suc-cess, every effort must be made to sustain as much geneticdiversity as possible.
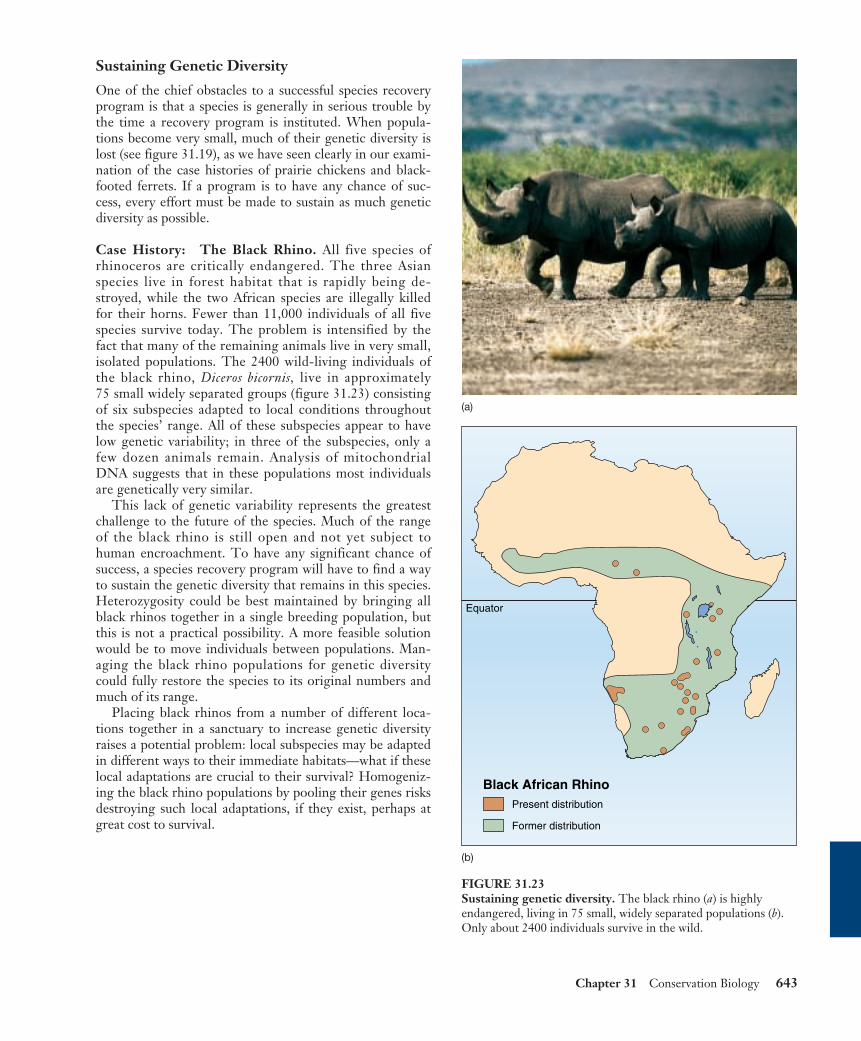
Case History: The Black Rhino. All five species ofrhinoceros are critically endangered. The three Asianspecies live in forest habitat that is rapidly being de-stroyed, while the two African species are illegally killedfor their horns. Fewer than 11,000 individuals of all fivespecies survive today. The problem is intensified by thefact that many of the remaining animals live in very small,isolated populations. The 2400 wild-living individuals ofthe black rhino, Diceros bicornis, live in approximately 75 small widely separated groups (figure 31.23) consistingof six subspecies adapted to local conditions throughoutthe species’ range. All of these subspecies appear to havelow genetic variability; in three of the subspecies, only afew dozen animals remain. Analysis of mitochondrialDNA suggests that in these populations most individualsare genetically very similar.
This lack of genetic variability represents the greatestchallenge to the future of the species. Much of the rangeof the black rhino is still open and not yet subject tohuman encroachment. To have any significant chance ofsuccess, a species recovery program will have to find a wayto sustain the genetic diversity that remains in this species.Heterozygosity could be best maintained by bringing allblack rhinos together in a single breeding population, butthis is not a practical possibility. A more feasible solutionwould be to move individuals between populations. Man-aging the black rhino populations for genetic diversitycould fully restore the species to its original numbers andmuch of its range.
Placing black rhinos from a number of different loca-tions together in a sanctuary to increase genetic diversityraises a potential problem: local subspecies may be adaptedin different ways to their immediate habitats—what if theselocal adaptations are crucial to their survival? Homogeniz-ing the black rhino populations by pooling their genes risksdestroying such local adaptations, if they exist, perhaps atgreat cost to survival.
Chapter 31 Conservation Biology 643
(a)
Black African RhinoPresent distribution
Equator
Former distribution
(b)
FIGURE 31.23 Sustaining genetic diversity. The black rhino (a) is highlyendangered, living in 75 small, widely separated populations (b).Only about 2400 individuals survive in the wild.
Preserving Keystone Species
Keystone species are species that exerta particularly strong influence on thestructure and functioning of a particu-lar ecosystem. The sea otters of figure31.7 are a keystone species of the kelpforest ecosystem, and their removal canhave disastrous consequences. There isno hard-and-fast line that allows us toclearly identify keystone species. It israther a qualitative concept, a state-ment that a species plays a particularlyimportant role in its community. Key-stone species are usually characterizedby measuring the strength of their im-pact on their community. Communityimportance measures the change insome quantitative aspect of the ecosys-tem (species richness, productivity, nu-trient cycling) per unit of change in theabundance of a species.
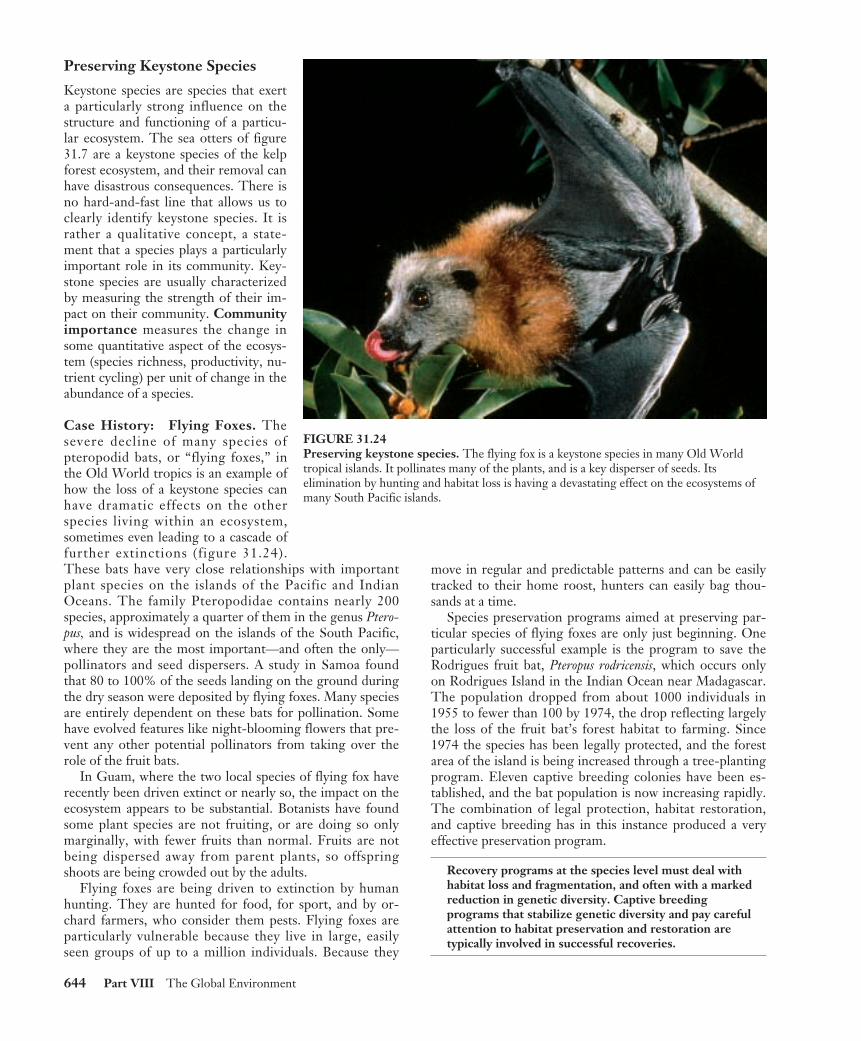
Case History: Flying Foxes. Thesevere decline of many species ofpteropodid bats, or “flying foxes,” inthe Old World tropics is an example ofhow the loss of a keystone species canhave dramatic effects on the otherspecies living within an ecosystem,sometimes even leading to a cascade offurther extinctions (figure 31.24).These bats have very close relationships with importantplant species on the islands of the Pacific and IndianOceans. The family Pteropodidae contains nearly 200species, approximately a quarter of them in the genus Ptero-pus, and is widespread on the islands of the South Pacific,where they are the most important—and often the only—pollinators and seed dispersers. A study in Samoa foundthat 80 to 100% of the seeds landing on the ground duringthe dry season were deposited by flying foxes. Many speciesare entirely dependent on these bats for pollination. Somehave evolved features like night-blooming flowers that pre-vent any other potential pollinators from taking over therole of the fruit bats.
In Guam, where the two local species of flying fox haverecently been driven extinct or nearly so, the impact on theecosystem appears to be substantial. Botanists have foundsome plant species are not fruiting, or are doing so onlymarginally, with fewer fruits than normal. Fruits are notbeing dispersed away from parent plants, so offspringshoots are being crowded out by the adults.
Flying foxes are being driven to extinction by humanhunting. They are hunted for food, for sport, and by or-chard farmers, who consider them pests. Flying foxes areparticularly vulnerable because they live in large, easilyseen groups of up to a million individuals. Because they
move in regular and predictable patterns and can be easilytracked to their home roost, hunters can easily bag thou-sands at a time.
Species preservation programs aimed at preserving par-ticular species of flying foxes are only just beginning. Oneparticularly successful example is the program to save theRodrigues fruit bat, Pteropus rodricensis, which occurs onlyon Rodrigues Island in the Indian Ocean near Madagascar.The population dropped from about 1000 individuals in1955 to fewer than 100 by 1974, the drop reflecting largelythe loss of the fruit bat’s forest habitat to farming. Since1974 the species has been legally protected, and the forestarea of the island is being increased through a tree-plantingprogram. Eleven captive breeding colonies have been es-tablished, and the bat population is now increasing rapidly.The combination of legal protection, habitat restoration,and captive breeding has in this instance produced a veryeffective preservation program.
Recovery programs at the species level must deal withhabitat loss and fragmentation, and often with a markedreduction in genetic diversity. Captive breedingprograms that stabilize genetic diversity and pay carefulattention to habitat preservation and restoration aretypically involved in successful recoveries.
644 Part VIII The Global Environment
FIGURE 31.24 Preserving keystone species. The flying fox is a keystone species in many Old Worldtropical islands. It pollinates many of the plants, and is a key disperser of seeds. Itselimination by hunting and habitat loss is having a devastating effect on the ecosystems ofmany South Pacific islands.
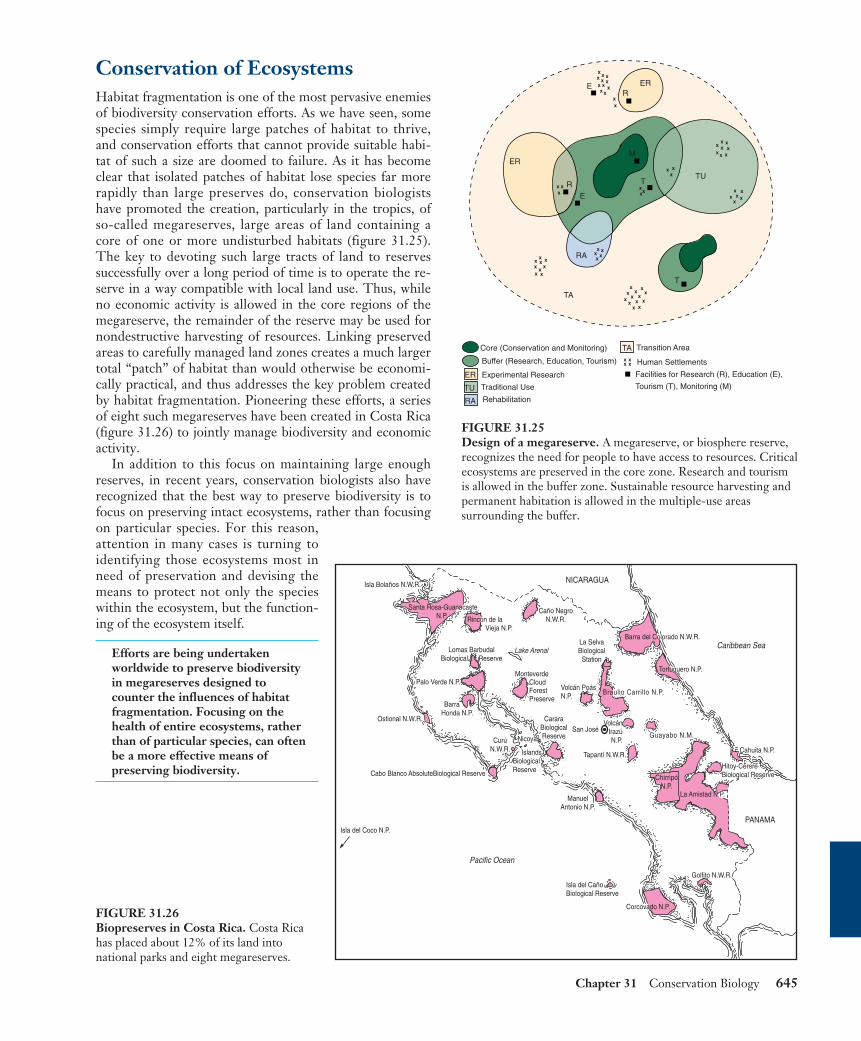
Conservation of EcosystemsHabitat fragmentation is one of the most pervasive enemiesof biodiversity conservation efforts. As we have seen, somespecies simply require large patches of habitat to thrive,and conservation efforts that cannot provide suitable habi-tat of such a size are doomed to failure. As it has becomeclear that isolated patches of habitat lose species far morerapidly than large preserves do, conservation biologistshave promoted the creation, particularly in the tropics, ofso-called megareserves, large areas of land containing acore of one or more undisturbed habitats (figure 31.25).The key to devoting such large tracts of land to reservessuccessfully over a long period of time is to operate the re-serve in a way compatible with local land use. Thus, whileno economic activity is allowed in the core regions of themegareserve, the remainder of the reserve may be used fornondestructive harvesting of resources. Linking preservedareas to carefully managed land zones creates a much largertotal “patch” of habitat than would otherwise be economi-cally practical, and thus addresses the key problem createdby habitat fragmentation. Pioneering these efforts, a seriesof eight such megareserves have been created in Costa Rica(figure 31.26) to jointly manage biodiversity and economicactivity.
In addition to this focus on maintaining large enoughreserves, in recent years, conservation biologists also haverecognized that the best way to preserve biodiversity is tofocus on preserving intact ecosystems, rather than focusingon particular species. For this reason,attention in many cases is turning toidentifying those ecosystems most inneed of preservation and devising themeans to protect not only the specieswithin the ecosystem, but the function-ing of the ecosystem itself.
Efforts are being undertakenworldwide to preserve biodiversityin megareserves designed tocounter the influences of habitatfragmentation. Focusing on thehealth of entire ecosystems, ratherthan of particular species, can oftenbe a more effective means ofpreserving biodiversity.
Chapter 31 Conservation Biology 645
xxx x
xxx
x x
xx
xx
xx
xx
xx xxx
x xx x
xx xxx
xxx
xxx x
xxx
x
xx x
xxx
xx
xx
xxxx
x xx xx
ER
ER
ER
TA
TA
RA
RA
TU
TU
RE
E
T
T
M
Core (Conservation and Monitoring)
Buffer (Research, Education, Tourism)
Experimental Research
Traditional Use
Rehabilitation
Transition Area
Human Settlements
Facilities for Research (R), Education (E),
Tourism (T), Monitoring (M)
xx x
x xx
R
FIGURE 31.25 Design of a megareserve. A megareserve, or biosphere reserve,recognizes the need for people to have access to resources. Criticalecosystems are preserved in the core zone. Research and tourismis allowed in the buffer zone. Sustainable resource harvesting andpermanent habitation is allowed in the multiple-use areassurrounding the buffer.
NICARAGUA
Caribbean Sea
PANAMA
Pacific Ocean
Isla Bolaños N.W.R.
Santa Rosa-GuanacasteN.P. Rincón de la
Vieja N.P.
Caño NegroN.W.R.
Lake Arenal
MonteverdeCloudForestPreserve
Lomas BarbudalBiological Reserve
Palo Verde N.P.
Barra Honda N.P.
Ostional N.W.R.
Cabo Blanco AbsoluteBiological Reserve
CurúN.W.R.
Nicoya
IslandsBiologicalReserve
CararaBiologicalReserve
Volcán PoásN.P.
San JoséVolcán
IrazúN.P.
Tapantí N.W.R.
ManuelAntonio N.P.
ChirripóN.P.
Guayabo N.M.
Braulio Carrillo N.P.
Barra del Colorado N.W.R.
Tortuguero N.P.
La Amistad N.P.
Cahuita N.P.
Isla del CañoBiological Reserve
Golfito N.W.R.
Corcovado N.P.
Isla del Coco N.P.
Hitoy-CerereBiological Reserve
La SelvaBiological
Station
FIGURE 31.26 Biopreserves in Costa Rica. Costa Ricahas placed about 12% of its land intonational parks and eight megareserves.
646 Part VIII The Global Environment
Chapter 31 Summary Questions Media Resources
31.1 The new science of conservation biology is focusing on conserving biodiversity.
• Early humans caused many extinctions when theyappeared in new areas, but rates of extinction haveincreased in modern times.
• Some areas are particularly rich in species diversityand particularly merit conservation attention.
1. Are some areas particularlyimportant for conservingbiodiversity? 2. Describe some of the indirecteconomic values of biodiversity.
• Interdependence among species in an ecosystem leadsto the possibility of cascading extinctions if removalof one species has major effects throughout the foodweb.
• Species are particularly vulnerable when they havelocalized distributions, are declining in populationsize, lack genetic variability, or are harvested orhunted by humans.
3. What factors contribute tothe extinction rate on aparticular piece of land? 4. How does a low geneticvariability contribute to aspecies’ greater risk ofextinction?
31.2 Vulnerable species are more likely to become extinct.
• Habitat loss is the single most important cause ofspecies extinction.
• As suggested by the species-area relationship, areduced habitat will support fewer numbers ofspecies.
• This reduction in habitat can occur in four differentways: a habitat can be completely removed ordestroyed, a habitat can become fragmented anddisjunct, a habitat can be degraded or altered, or ahabitat can become too frequently used by humans soas to disturb the species there.
5. How can problems resultingfrom lack of genetic diversitywithin a population be solved?6. How can extinction of akeystone species be particularlydisruptive to an ecosystem?
31.3 Causes of endangerment usually reflect human activities.
• Pristine restoration of a habitat may be attempted,but removing introduced species, rehabilitating thehabitat, and cleaning up the habitat may be morefeasible.
• Captive propagation, sustaining genetic variability,and preserving keystone species have been effective inpreserving biodiversity.
• Megareserves have been successfully designed inmany parts of the world to contain core areas ofundisturbed habitat surrounded by managed land.
7. Why is maintaining largepreserves particularly important?8. Is captive propagation alwaysan answer to speciesvulnerability?9. Why is it important toattempt to eradicate introducedspecies soon after they appear?
31.4 Successful recovery plans will need to be multidimensional.
www.mhhe.com/raven6e www.biocourse.com
• Biodiversity• Species• Extinction• Wetlands
• Deoxygenation ofLakes
• On ScienceArticle:What’s Killingthe Frogs?
• Book Review: The Endof the Game by Beard
• Book Review: Westwith the Nightby Markham
• Activity:Biomagnification
• On ScienceArticle:BiodiversityBehind Bars
• Extinction


