Embed Size (px)
Citation preview
FULL
DOI: 10.1002/adfm.200800381PAPER
Connective-Tissue Fibroblasts Established on MicropillarInterfaces are Pivotal for Epithelial-Tissue Morphogenesis**
By Eva Mussig, Thorsten Steinberg,* Simon Schulz, Joachim P. Spatz, Jens Ulmer, Niels Grabe, Annette Kohl,Gerda Komposch, and Pascal Tomakidi
This work is dedicated to Professor Norbert Fusenig in appreciation of his excellent leadership as head of the‘‘Department of Differentiation and Carcinogenesis’’ of the German Cancer Research Center
Polydimethylsiloxane (PDMS) pillar arrays are applied as a biomechanical microenvironment to establish gingival connective-
tissue fibroblasts (GCTFs) and to further analyze the pivotal role of GCTFs in epithelial-tissue morphogenesis. GCTFs are
known to exert successful adhesion and growth on fibronectin immobilized on pillar heads, over time, concomitant with the
increased gene expression of vimentin and collagen type-I. GCTF-populated pillar arrays clearly reveal that epithelial-tissue
morphogenesis of immortalized human gingival keratinocytes (IHGKs), co-cultured for 7 and 14 days, parallels the in vivo
phenotype more closely, when compared with GCTF-free control arrays. This in vivo-like phenotype is substantiated by higher
mRNA levels for keratin 1, involucrin and filaggrin differentiation markers. Furthermore, it is reflected by a tissue-specific
protein orientation of the aforementioned molecules, and also of the cell-to-cell contact forming desmoplakin and the basement
membrane constituents, laminin-5, laminin-1/10, and collagen type-IV. These experiments suggest that the in vivo-like
phenotype of the IHGK is governed by the GCTFs growing on the micropillar interfaces. Moreover, they form the basis
for the optimization or neogeneration of biomaterials by varying predefinedmicroenvironmetal parameters to achieve an in vivo-
like cell growth and differentiation, indispensable for tissue morphogenesis during regeneration.
[*] Dr. T. Steinberg, Dr. E. Mussig, A. Kohl, Prof. G. KomposchProf. P. TomakidiDepartment of Orthodontics and Dentofacial Orthopaedics,University of HeidelbergIm Neuenheimer Feld 400, 69120 Heidelberg (Germany)E-mail: [email protected]
S. Schulz, Prof. J. P. SpatzDepartment of Biophysical Chemistry, University of HeidelbergIm Neuenheimer Feld 253, 69120 Heidelberg (Germany)
S. Schulz, Prof. J. P. Spatz, Dr. J. UlmerMax Planck Institute for Metals ResearchHeisenbergstr. 3, D-70569 Stuttgart (Germany)
Dr. N. GrabeDepartment of Medical Informatics, University of HeidelbergIm Neuenheimer Feld 400, 69120 Heidelberg (Germany)
Dr. N. GrabeHamamatsu TIGA Center, BIOQUANT, University of HeidelbergIm Neuenheimer Feld 267, 69120 Heidelberg (Germany)
[**] E.M. and T.S. contributed equally to this manuscript. We are gratefulfor financial support provided by the Dietmar-Hopp-Stiftung, GmbH,St. Leon-Rot, Forderbereich Medizin (grant 12/2005 and grant 01/2008 to Thorsten Steinberg and Pascal Tomakidi). Additional financialsupport has been supplied by the Deutsche Gesellschaft fur Zahn-,Mund- und Kieferheilkunde (DGZMK) (grant 11/2006) and theMedical Faculty of the University of Heidelberg (Gerok position) toEvaMussig. This work has also been implemented in the ‘‘BIOQUANT’’Research Network of the University of Heidelberg, Germany.
Adv. Funct. Mater. 2008, 18, 2919–2929 � 2008 WILEY-VCH Verlag
1. Introduction
Combining material technologies with life sciences will be
the prerequisite for optimizing already-existing biomaterials or
even creating new materials for the use in regenerative
medicine. To achieve this goal, it will be of fundamental
importance to study the multiple interactions of cells of certain
tissues with their microenvironment. Understanding the
microenvironment and the deduction of defined microenvir-
onmental parameters in particular will be the key to learning
tissue-innate requirements, which in turn will lead to proper
cell growth and tissue morphogenesis. Hereby, the cells form
tissue themselves or assist in the morphogenesis of an adjacent
tissue by providing pivotal interdependencies, which also exist
in vivo. In this context, biomechanics, which describes the
interplay of mechanical forces between the extracellular
environment and a distinct cell type, appears to be an
important parameter. To detect the traction forces that cells
or biomolecules exert on their underlying substrates, micro-
arrays of elastic pillars or posts which are biofunctionalized
with extracellular-matrix constituents, such as fibronectin (FN)
for cell adhesion are currently widely used.[1–5] In addition, flat
or planar flexible substrates are also suitable tools to calculate
forces exerted by cells on their microenvironment.[6–10] In
distinction to elastic pillars, planar elastomeric surfaces are
GmbH & Co. KGaA, Weinheim 2919

FULLPAPER
E. Mussig et al. /Connective Tissue Fibroblasts
2920
more easily fabricated. However, one major disadvantage of
the latter substrates emerges from their limited resolution in
traction-force microscopy, which is described by the elastic
Green functions,[11] and results from the surface thickness.[7]
This disadvantage requires complex mathematical calculations
to invert the system of coupled integral equations given by
linear elasticity theory, which relate the substrate deformation
to the force.[12] Despite the mentioned drawbacks, such kinds
of substrate are popular, since they circumvent the complex
photolithography indispensable for the construction of the
elastomeric micropillar surfaces. Considering the previously
mentioned disadvantages of planar elastic substrates, we have
chosen pillar surfaces which have the advantage that no
complex calculations are necessary to obtain the forces, as each
pillar behaves like an elastic spring: the deflection is
proportional to the force.[6] Concerning the above-mentioned
interdependencies between cells of two tissues, the present
study demonstrates for the first time that the connective-tissue
fibroblasts established on FN-coated pillar microarrays are
pivotal for epithelial morphogenesis. This inclusion of
keratinocytes as a second cell type extends the current
applicability of pillars as tools for cell traction-force sensors
by showing that fibroblasts growing in a defined biomechanical
environment are capable of directing in trans the formation of
an epithelial tissue.
In vivo, the interdependencies of fibroblasts located in the
epithelium-underlying connective tissue (CT) with keratino-
cytes are indispensable for the maintenance of the epithelial-
tissue homeostasis.[13] This homeostasis which is characterized
by its cornerstone, the balance of proliferation and differentia-
tion, is orchestrated by the complex interplay of diffusible
molecules, also known as growth factors.[14] Due to loco
regional differences, the CT of skin epithelium is termed
dermis, while that of the oral cavity gingival epithelium is
termed lamina propria.[15] Contrasting its corresponding
epithelium, the CT is poorly populated by cells, while it
mainly consists of extracellular-matrix (ECM) molecules
including various collagens, FN and a variety of proteogly-
cans.[16] These CT matrix components which, as a base
substance, constitute the cells’ microenvironment are synthe-
sized by the cells themselves prior to secretion. Thus, CT
fibroblasts produce multiple collagens, among which collagen
type-I is the most abundant matrix molecule in the CT.
Moreover, fibroblasts can be characterized by their inter-
mediate filament (IF) vimentin, a feature that they share with
other cells of mesenchymal origin. The CT-epithelial junction
zone is defined by a group of highly organized ECMmolecules
forming the basement membrane (BM). BM constituents are
collagen type-IV, laminin-1/10, and laminin-5.[17] Squamous
epithelia of skin and oral-cavity gingiva consist of several cell
layers reflecting progressive stages of epithelial cell differ-
entiation. Proliferation of epithelial cells, that is, keratinocytes,
which are detectable by reliable proliferation markers, occurs
in the basal cell layers proximal to the BM, while early and
terminal differentiation are restricted to suprabasal and apical
epithelial layers. Biomarkers of early keratinocyte differentia-
www.afm-journal.de � 2008 WILEY-VCH Verlag GmbH
tion are keratins (K) K1 and K10, belonging to the family of IF
proteins, while terminal differentiation is specified through
involucrin and filaggrin.[18,19] Additional markers, such as
desmoplakin, indicate the presence of cell-to-cell contacts,
thereby featuring epithelial integrity. In total, the latter-
described molecules are hallmarks of epithelial homeostasis.
Therefore, we have used them as biomarkers to monitor
epithelial-tissue morphogenesis in response to GCTFs estab-
lished on FN-coated PDMS pillar microarrays.
In contrast to our approach of investigating epithelial
morphogenesis of keratinocytes based on fibroblasts estab-
lished in a defined traction-force-sensing microenvironment,
previous morphogenetic studies employed connective-tissue
cells incorporated in a collagen lattice.[20–22] Studies with an
emphasis on biomechanics described lattice contraction by oral
or dermal connective-tissue cells or in response to fibroblasts to
various growth factors,[23] but usually gave no approximation
of the fibroblast-exerted traction forces. In a recently published
paper, modeling of a spongy collagen lattice using the Euler
column buckling model yielded contractile forces of dermal
fibroblasts in a range from 10–41 nN. Unlike our strategy, this
study was based on a nonconfigurated microenvironment.[24]
Here, we performed studies on epithelial morphogenesis
by using fibroblasts grown on FN-coated pillars holding a
defined biomechanical elasticity module (Young’s modulus) of
2.5MPa. In this context, our interest was of dual nature. Firstly,
it was focused on the cell adhesion of GCTFs on pillar model
surfaces, combined with the calculation of traction forces and,
conversely, whether the calculated forces facilitate the cells’
ability to propagate and synthesize specific biomolecules.
Secondly, we were interested in the role of GCTFs growing
in such a defined microenvironment on the epithelial
morphogenesis of immortalized human gingival keratinocytes
(IHGKs). From the biological point of view, it should be
noted that in addition to morphological changes, epithelial
morphogenesis is reflected by the expression and distinct
topography of certain biomarkers that are genetically
determined through the keratinocyte differentiation program.
Among others, we therefore analyzed biomarkers assigned to
early and terminal differentiation at both the mRNA and
protein level.
In regenerative medicine and dentistry in particular,
strategies based on tissue engineering and modification of
biomaterials with biomolecules seem to be promising tools for
the management of lost periodontal tissues. In tissue
engineering, in addition to stem cells and signaling molecules,
scaffolds of extracellular-matrix molecules comprising col-
lagen, fibrin, hydroxyapatite or FN amount to hopeful
strategies to support the healing process.[25] In addition, FN
was also used as a biomodifier of titanium-based dental
implants in animal in vivo and in vitro studies employing cell
cultures.[26,27] Thus, covering the pillar heads with FN makes
the defined PDMS-microarrays used in our study more
bioconvenient for cells. In total, such conditions are suitable
for studying cell adhesion and growth and for determining cell-
derived traction forces. These conditions for this part will form
& Co. KGaA, Weinheim Adv. Funct. Mater. 2008, 18, 2919–2929
FULLPAPER
E. Mussig et al. /Connective Tissue Fibroblasts
the basis for optimization or neogeneration of biomaterials by
varying predefined environmental parameters to achieve an in
vivo-like cell growth and differentiation, indispensable for
tissue morphogenesis during regeneration.
2. Results and Discussion
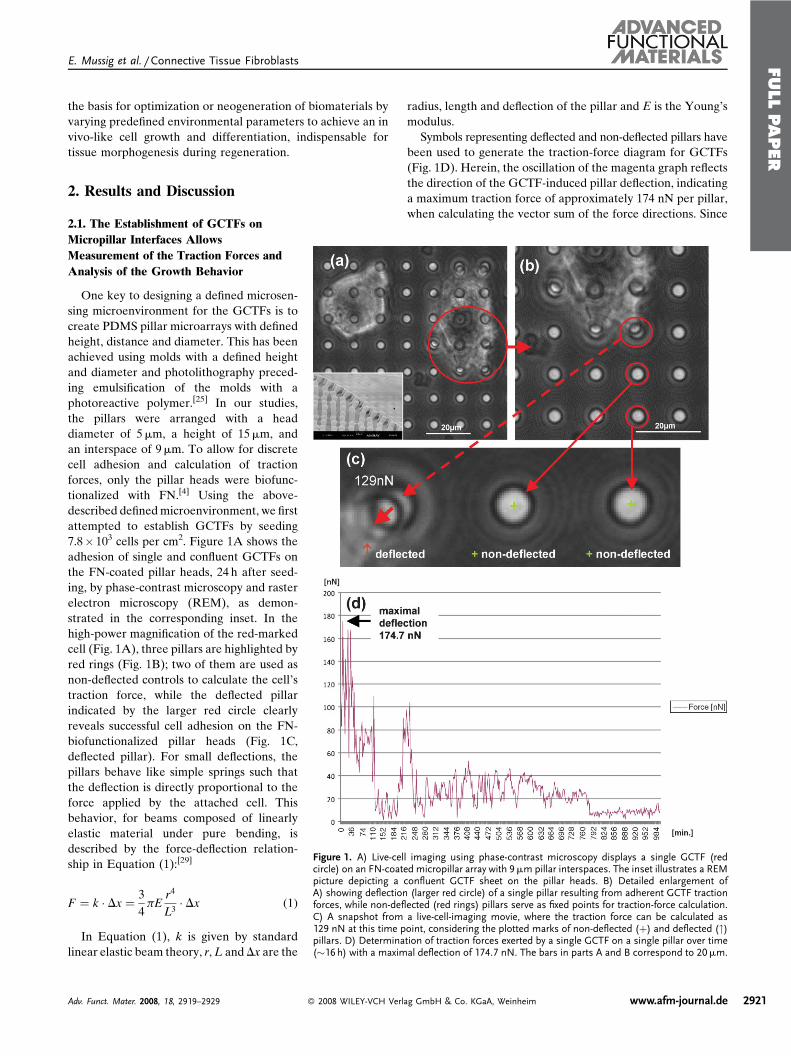
Figure 1. A) Live-cell imaging using phase-contrast microscopy displays a single GCTF (redcircle) on an FN-coated micropillar array with 9mm pillar interspaces. The inset illustrates a REMpicture depicting a confluent GCTF sheet on the pillar heads. B) Detailed enlargement ofA) showing deflection (larger red circle) of a single pillar resulting from adherent GCTF tractionforces, while non-deflected (red rings) pillars serve as fixed points for traction-force calculation.C) A snapshot from a live-cell-imaging movie, where the traction force can be calculated as129 nN at this time point, considering the plotted marks of non-deflected (þ) and deflected (")pillars. D) Determination of traction forces exerted by a single GCTF on a single pillar over time(�16 h) with a maximal deflection of 174.7 nN. The bars in parts A and B correspond to 20mm.
2.1. The Establishment of GCTFs on
Micropillar Interfaces Allows
Measurement of the Traction Forces and
Analysis of the Growth Behavior
One key to designing a defined microsen-
sing microenvironment for the GCTFs is to
create PDMS pillar microarrays with defined
height, distance and diameter. This has been
achieved using molds with a defined height
and diameter and photolithography preced-
ing emulsification of the molds with a
photoreactive polymer.[25] In our studies,
the pillars were arranged with a head
diameter of 5mm, a height of 15mm, and
an interspace of 9mm. To allow for discrete
cell adhesion and calculation of traction
forces, only the pillar heads were biofunc-
tionalized with FN.[4] Using the above-
described definedmicroenvironment, we first
attempted to establish GCTFs by seeding
7.8� 103 cells per cm2. Figure 1A shows the
adhesion of single and confluent GCTFs on
the FN-coated pillar heads, 24 h after seed-
ing, by phase-contrast microscopy and raster
electron microscopy (REM), as demon-
strated in the corresponding inset. In the
high-power magnification of the red-marked
cell (Fig. 1A), three pillars are highlighted by
red rings (Fig. 1B); two of them are used as
non-deflected controls to calculate the cell’s
traction force, while the deflected pillar
indicated by the larger red circle clearly
reveals successful cell adhesion on the FN-
biofunctionalized pillar heads (Fig. 1C,
deflected pillar). For small deflections, the
pillars behave like simple springs such that
the deflection is directly proportional to the
force applied by the attached cell. This
behavior, for beams composed of linearly
elastic material under pure bending, is
described by the force-deflection relation-
ship in Equation (1):[29]
F ¼ k � Dx ¼ 3
4pE
r4
L3� Dx (1)
In Equation (1), k is given by standard
linear elastic beam theory, r,L andDx are the
Adv. Funct. Mater. 2008, 18, 2919–2929 � 2008 WILEY-VCH Verl
radius, length and deflection of the pillar and E is the Young’s
modulus.
Symbols representing deflected and non-deflected pillars have
been used to generate the traction-force diagram for GCTFs
(Fig. 1D). Herein, the oscillation of the magenta graph reflects
the direction of the GCTF-induced pillar deflection, indicating
a maximum traction force of approximately 174 nN per pillar,
when calculating the vector sum of the force directions. Since
ag GmbH & Co. KGaA, Weinheim www.afm-journal.de 2921

FULLPAPER
E. Mussig et al. /Connective Tissue Fibroblasts
Figure 2. Microscopy techniques illustrate the growth behavior of GCTFs derived from co-cultures with IHGKs on FN-coated micropillar surfaces. A1) REM depicts the subconfluence ofGCTFs after a 7 day culture period, while B1) reveals a nearly confluent density after 14 days. IIFdemarcates an increased number of vimentin/collagen type-I positive cells after 14 days (B,D)culture period, compared with the situation after 7 days (A,C). Red propidium iodide (PI)counterstain demarcates the cell nuclei. E) Quantitative real-time PCR displays markedlyincreased gene-expression level for connective-tissue cell-specific vimentin (pink columns)and collagen type-I (blue columns) molecules at the later culture period of 14 days, comparedwith 7 days. The relative expression levels were analyzed using a modification of the DDCT equa-tion, which allows for differences in efficiencies (E¼ 10�1/slope) between the PCR reactions. [21]The data were calculated using the Gene Expression Macro software provided with the iCycler.The data were normalized to the CT of the glycerinaldehyd-3-phosphat-Dehydrogenase (GAPDH)non-modulated housekeeping gene. The data reflect the means (n¼ 3,� SD) of three indepen-dent experiments. The bars correspond to 100mm (A1, B1) and 20mm (A–D).
2922
we were further interested in the growth
behavior of the cells, GCTF-populated
pillar microarrays derived from co-cultures
with IHGKs were monitored at day 7 and
14, after careful removal of the epithelial
compartment. REM revealed that the cells
had reached a subconfluent density at
day 7 (Fig. 2A1), while they were nearly
confluent at day 14 (Fig. 2B1). These
differences in density were corroborated by
indirect immunofluorescence (IIF), demar-
cating more cells as positive for the
connective-tissue cell-specific vimentin
(Fig. 2(A–B)) and collagen type-I (Fig. 2
(C–D)) molecules at the later culture
period (Fig. 2B and Fig. 2D).
Interestingly, real-time polymerase
chain reaction (RT-PCR) of these mole-
cules demonstrates that the pillars on
which the GCTFs have grown close to
confluence exhibit approximately seven-
fold levels of mRNA transcription for both
genes, when compared to the subconfluent
pillar arrays (Fig. 2E, compare day 7 and
14). These results strongly suggest that
GCTFs can be successfully established in
the chosen defined microenvironment, and
that they are obviously capable of pro-
liferating on the pillar microarrays when
co-cultured with IHGKs. This assumption
is supported by the REM-inset in
Figure 1A which shows that the fibroblasts
can form a confluent tissue sheet on the
biofunctionalized pillar heads when grown
for periods extending 14 days. In this
context it appears noteworthy that the
higher cell densities observed at the later
time point of 14 days coincide with
an increased biosynthesis of molecules
that characterize the connective tissue
fibroblasts. Thus, the chosen regime may
be considered as suitable to form a gingival
connective-tissue equivalent under defined
biomechanical in vitro conditions, and
appears versatile to study the modulation
of tissue-innate morphogenesis or mor-
phogenesis of an epithelial tissue in trans
by prospectively varying certain microen-
vironmental parameters in terms of pillar
biomechanics or pillar biofunctionaliza-
tion. Conversely, the traction forces calcu-
lated above (see Fig. 1D) reflect a GCTF
innate force range that is obviously favor-
able for the observed biological behavior
described in our study.
www.afm-journal.de � 2008 WILEY-VCH Verlag GmbH & Co. KGaA, Weinheim Adv. Funct. Mater. 2008, 18, 2919–2929
FULLPAPER
E. Mussig et al. /Connective Tissue Fibroblasts
2.2. The Impact of GCTFs Established on Micropillar
Interfaces on Epithelial Morphogenesis
To explicitly study the role of GCTFs established on
biofunctionalized micropillar interfaces on epithelial morpho-
genesis of IHGKs, we generated co-cultures of these two
cell types and matched controls only comprising the kerati-
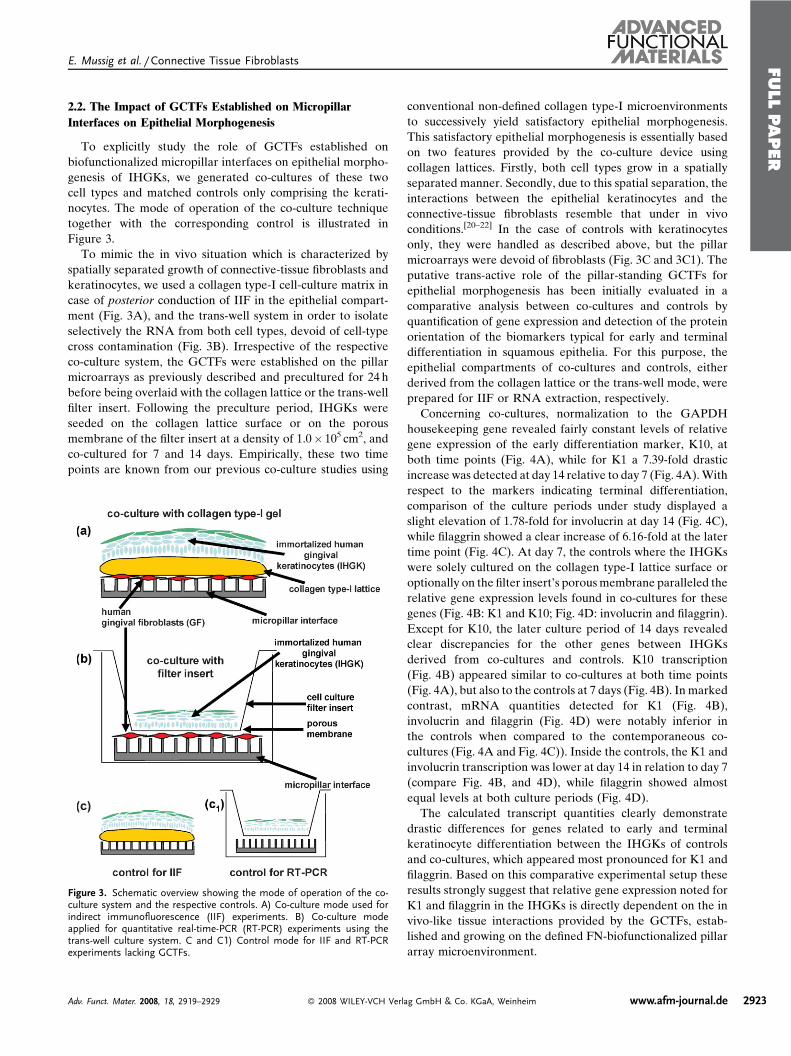
nocytes. The mode of operation of the co-culture technique
together with the corresponding control is illustrated in
Figure 3.
To mimic the in vivo situation which is characterized by
spatially separated growth of connective-tissue fibroblasts and
keratinocytes, we used a collagen type-I cell-culture matrix in
case of posterior conduction of IIF in the epithelial compart-
ment (Fig. 3A), and the trans-well system in order to isolate
selectively the RNA from both cell types, devoid of cell-type
cross contamination (Fig. 3B). Irrespective of the respective
co-culture system, the GCTFs were established on the pillar
microarrays as previously described and precultured for 24 h
before being overlaid with the collagen lattice or the trans-well
filter insert. Following the preculture period, IHGKs were
seeded on the collagen lattice surface or on the porous
membrane of the filter insert at a density of 1.0� 105 cm2, and
co-cultured for 7 and 14 days. Empirically, these two time
points are known from our previous co-culture studies using
Figure 3. Schematic overview showing the mode of operation of the co-culture system and the respective controls. A) Co-culture mode used forindirect immunofluorescence (IIF) experiments. B) Co-culture modeapplied for quantitative real-time-PCR (RT-PCR) experiments using thetrans-well culture system. C and C1) Control mode for IIF and RT-PCRexperiments lacking GCTFs.
Adv. Funct. Mater. 2008, 18, 2919–2929 � 2008 WILEY-VCH Verl
conventional non-defined collagen type-I microenvironments
to successively yield satisfactory epithelial morphogenesis.
This satisfactory epithelial morphogenesis is essentially based
on two features provided by the co-culture device using
collagen lattices. Firstly, both cell types grow in a spatially
separated manner. Secondly, due to this spatial separation, the
interactions between the epithelial keratinocytes and the
connective-tissue fibroblasts resemble that under in vivo
conditions.[20–22] In the case of controls with keratinocytes
only, they were handled as described above, but the pillar
microarrays were devoid of fibroblasts (Fig. 3C and 3C1). The
putative trans-active role of the pillar-standing GCTFs for
epithelial morphogenesis has been initially evaluated in a
comparative analysis between co-cultures and controls by
quantification of gene expression and detection of the protein
orientation of the biomarkers typical for early and terminal
differentiation in squamous epithelia. For this purpose, the
epithelial compartments of co-cultures and controls, either
derived from the collagen lattice or the trans-well mode, were
prepared for IIF or RNA extraction, respectively.
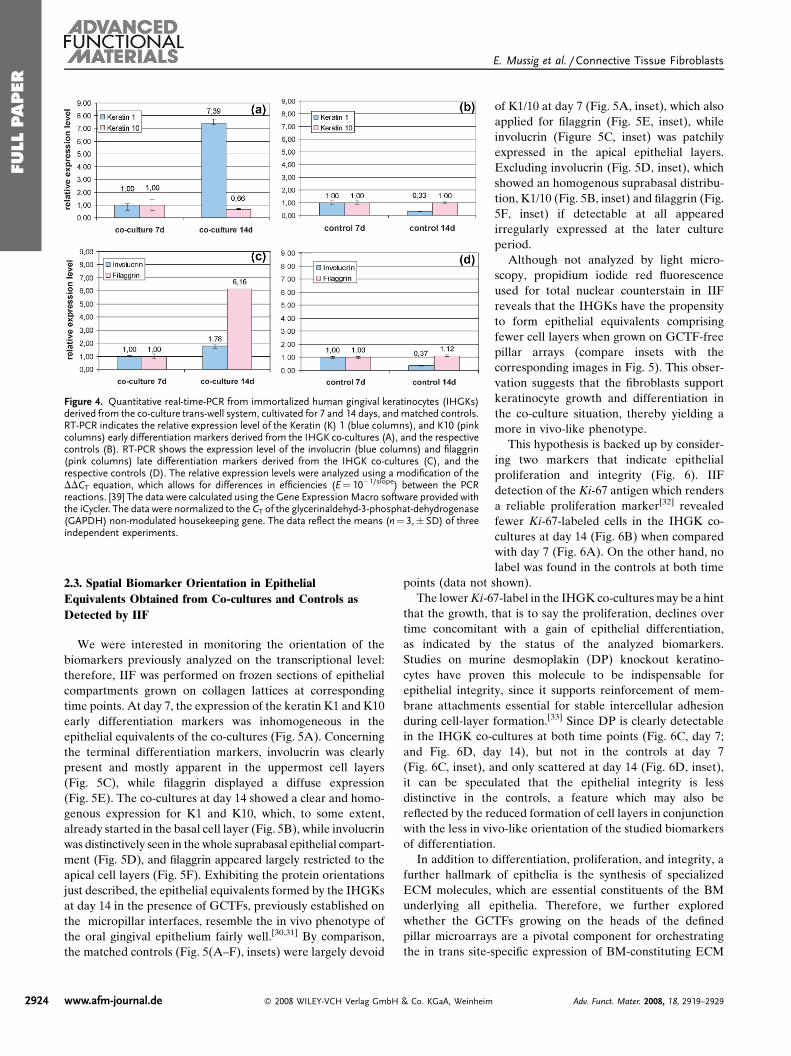
Concerning co-cultures, normalization to the GAPDH
housekeeping gene revealed fairly constant levels of relative
gene expression of the early differentiation marker, K10, at
both time points (Fig. 4A), while for K1 a 7.39-fold drastic
increase was detected at day 14 relative to day 7 (Fig. 4A).With
respect to the markers indicating terminal differentiation,
comparison of the culture periods under study displayed a
slight elevation of 1.78-fold for involucrin at day 14 (Fig. 4C),
while filaggrin showed a clear increase of 6.16-fold at the later
time point (Fig. 4C). At day 7, the controls where the IHGKs
were solely cultured on the collagen type-I lattice surface or
optionally on the filter insert’s porousmembrane paralleled the
relative gene expression levels found in co-cultures for these
genes (Fig. 4B: K1 and K10; Fig. 4D: involucrin and filaggrin).
Except for K10, the later culture period of 14 days revealed
clear discrepancies for the other genes between IHGKs
derived from co-cultures and controls. K10 transcription
(Fig. 4B) appeared similar to co-cultures at both time points
(Fig. 4A), but also to the controls at 7 days (Fig. 4B). In marked
contrast, mRNA quantities detected for K1 (Fig. 4B),
involucrin and filaggrin (Fig. 4D) were notably inferior in
the controls when compared to the contemporaneous co-
cultures (Fig. 4A and Fig. 4C)). Inside the controls, the K1 and
involucrin transcription was lower at day 14 in relation to day 7
(compare Fig. 4B, and 4D), while filaggrin showed almost
equal levels at both culture periods (Fig. 4D).
The calculated transcript quantities clearly demonstrate
drastic differences for genes related to early and terminal
keratinocyte differentiation between the IHGKs of controls
and co-cultures, which appeared most pronounced for K1 and
filaggrin. Based on this comparative experimental setup these
results strongly suggest that relative gene expression noted for
K1 and filaggrin in the IHGKs is directly dependent on the in
vivo-like tissue interactions provided by the GCTFs, estab-
lished and growing on the defined FN-biofunctionalized pillar
array microenvironment.
ag GmbH & Co. KGaA, Weinheim www.afm-journal.de 2923
FULLPAPER
E. Mussig et al. /Connective Tissue Fibroblasts
Figure 4. Quantitative real-time-PCR from immortalized human gingival keratinocytes (IHGKs)derived from the co-culture trans-well system, cultivated for 7 and 14 days, and matched controls.RT-PCR indicates the relative expression level of the Keratin (K) 1 (blue columns), and K10 (pinkcolumns) early differentiation markers derived from the IHGK co-cultures (A), and the respectivecontrols (B). RT-PCR shows the expression level of the involucrin (blue columns) and filaggrin(pink columns) late differentiation markers derived from the IHGK co-cultures (C), and therespective controls (D). The relative expression levels were analyzed using a modification of theDDCT equation, which allows for differences in efficiencies (E¼ 10�1/slope) between the PCRreactions. [39] The data were calculated using the Gene ExpressionMacro software provided withthe iCycler. The data were normalized to the CT of the glycerinaldehyd-3-phosphat-dehydrogenase(GAPDH) non-modulated housekeeping gene. The data reflect the means (n¼ 3,� SD) of threeindependent experiments.
2924
2.3. Spatial Biomarker Orientation in Epithelial
Equivalents Obtained from Co-cultures and Controls as
Detected by IIF
We were interested in monitoring the orientation of the
biomarkers previously analyzed on the transcriptional level:
therefore, IIF was performed on frozen sections of epithelial
compartments grown on collagen lattices at corresponding
time points. At day 7, the expression of the keratin K1 and K10
early differentiation markers was inhomogeneous in the
epithelial equivalents of the co-cultures (Fig. 5A). Concerning
the terminal differentiation markers, involucrin was clearly
present and mostly apparent in the uppermost cell layers
(Fig. 5C), while filaggrin displayed a diffuse expression
(Fig. 5E). The co-cultures at day 14 showed a clear and homo-
genous expression for K1 and K10, which, to some extent,
already started in the basal cell layer (Fig. 5B), while involucrin
was distinctively seen in thewhole suprabasal epithelial compart-
ment (Fig. 5D), and filaggrin appeared largely restricted to the
apical cell layers (Fig. 5F). Exhibiting the protein orientations
just described, the epithelial equivalents formed by the IHGKs
at day 14 in the presence of GCTFs, previously established on
the micropillar interfaces, resemble the in vivo phenotype of
the oral gingival epithelium fairly well.[30,31] By comparison,
the matched controls (Fig. 5(A–F), insets) were largely devoid
www.afm-journal.de � 2008 WILEY-VCH Verlag GmbH & Co. KGaA, Weinheim
of K1/10 at day 7 (Fig. 5A, inset), which also
applied for filaggrin (Fig. 5E, inset), while
involucrin (Figure 5C, inset) was patchily
expressed in the apical epithelial layers.
Excluding involucrin (Fig. 5D, inset), which
showed an homogenous suprabasal distribu-
tion, K1/10 (Fig. 5B, inset) and filaggrin (Fig.
5F, inset) if detectable at all appeared
irregularly expressed at the later culture
period.
Although not analyzed by light micro-
scopy, propidium iodide red fluorescence
used for total nuclear counterstain in IIF
reveals that the IHGKs have the propensity
to form epithelial equivalents comprising
fewer cell layers when grown on GCTF-free
pillar arrays (compare insets with the
corresponding images in Fig. 5). This obser-
vation suggests that the fibroblasts support
keratinocyte growth and differentiation in
the co-culture situation, thereby yielding a
more in vivo-like phenotype.
This hypothesis is backed up by consider-
ing two markers that indicate epithelial
proliferation and integrity (Fig. 6). IIF
detection of the Ki-67 antigen which renders
a reliable proliferation marker[32] revealed
fewer Ki-67-labeled cells in the IHGK co-
cultures at day 14 (Fig. 6B) when compared
with day 7 (Fig. 6A). On the other hand, no
label was found in the controls at both time
points (data not shown).
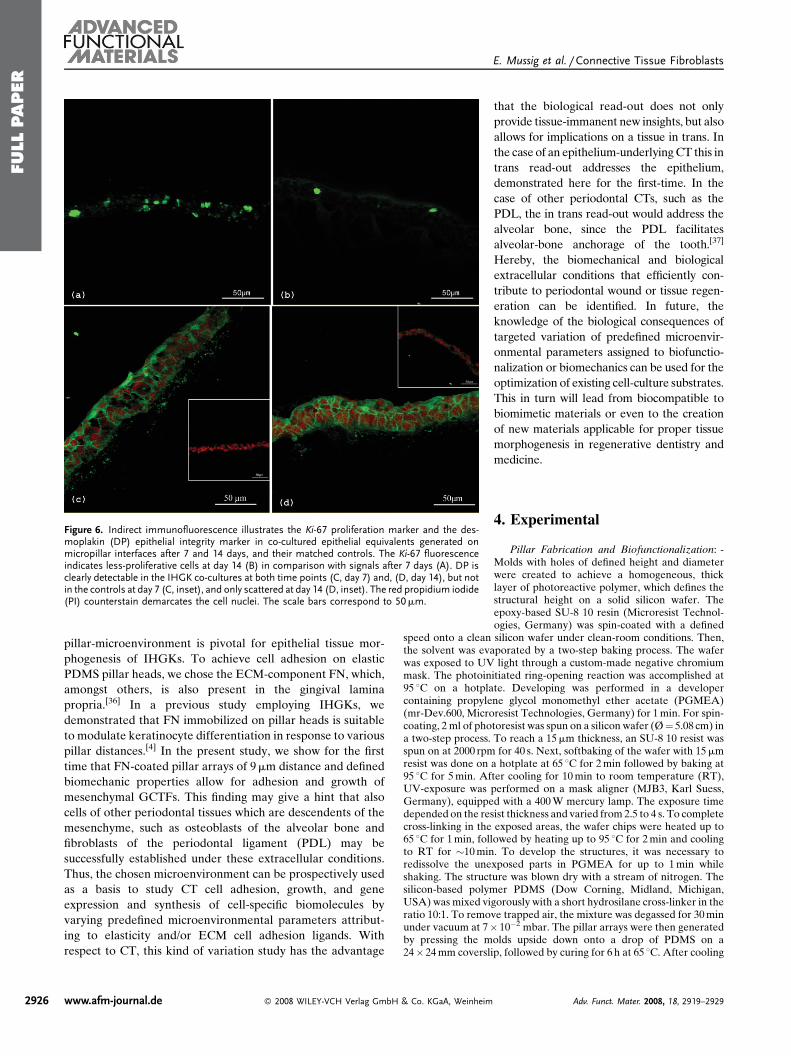
The lower Ki-67-label in the IHGK co-culturesmay be a hint
that the growth, that is to say the proliferation, declines over
time concomitant with a gain of epithelial differentiation,
as indicated by the status of the analyzed biomarkers.
Studies on murine desmoplakin (DP) knockout keratino-
cytes have proven this molecule to be indispensable for
epithelial integrity, since it supports reinforcement of mem-
brane attachments essential for stable intercellular adhesion
during cell-layer formation.[33] Since DP is clearly detectable
in the IHGK co-cultures at both time points (Fig. 6C, day 7;
and Fig. 6D, day 14), but not in the controls at day 7
(Fig. 6C, inset), and only scattered at day 14 (Fig. 6D, inset),
it can be speculated that the epithelial integrity is less
distinctive in the controls, a feature which may also be
reflected by the reduced formation of cell layers in conjunction
with the less in vivo-like orientation of the studied biomarkers
of differentiation.
In addition to differentiation, proliferation, and integrity, a
further hallmark of epithelia is the synthesis of specialized
ECM molecules, which are essential constituents of the BM
underlying all epithelia. Therefore, we further explored
whether the GCTFs growing on the heads of the defined
pillar microarrays are a pivotal component for orchestrating
the in trans site-specific expression of BM-constituting ECM
Adv. Funct. Mater. 2008, 18, 2919–2929

FULLPAPER
E. Mussig et al. /Connective Tissue Fibroblasts
Figure 5. Indirect immunofluorescence illustrates the early and late differentiation markers, K1/10, involucrin and filaggrin, in co-cultured epithelialequivalents generated on micropillar interfaces after 7 and 14 days, and their matched controls. A) After 7 days, expression of the keratin K1/10 earlydifferentiation markers was inhomogeneous, while at day 14 expression for K1 and K10 showed a clear and homogenous distribution that, to some extent,already started in the basal cell layer (B). At day 7, the involucrin terminal differentiation marker was clearly seen andmostly apparent in the uppermost celllayers (C), while filaggrin displayed diffuse expression (E). At the later time point, involucrin was distinctively seen in the suprabasal epithelial compartment(D), and filaggrin appeared to be largely restricted to the apical cell layers (F). The matched controls (A–F, insets) were largely devoid of a specificfluorescence signal or revealed irregular and patchy protein orientation at the later time point. The red propidium iodide (PI) counterstain demarcates thecell nuclei. The scale bars correspond to 50mm.
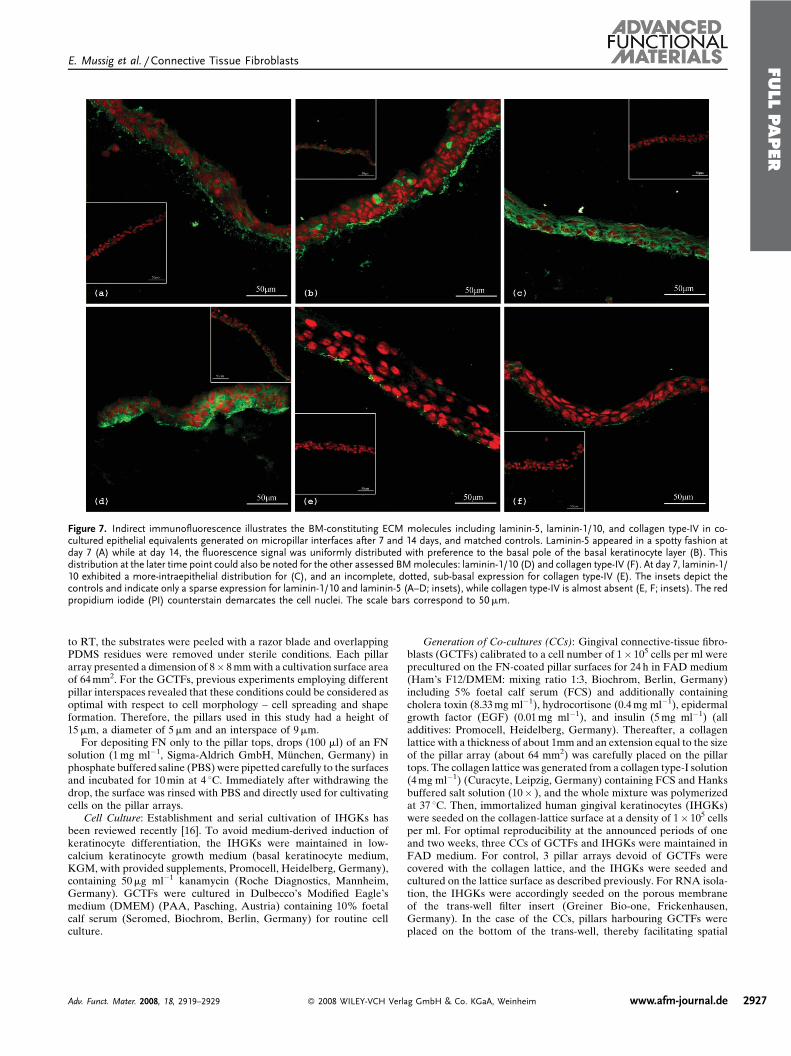
molecules including laminin-5, laminin-1/10, and collagen
type-IV in the epithelial equivalents. Regarding the above-
mentioned set of molecules, the heterotrimer laminin-5 which
constitutes the BM-anchoring filaments located in the BM-
lamina lucida and is essential for keratinocyte-BM-adhe-
sion,[34] appeared in a spotty fashion at day 7 (Fig. 7A). At day
14, the dots were uniformly distributed with preference to the
basal pole of the basal layer of keratinocytes (Fig. 7B).
Interestingly, this preference found in vitro reflects the site of
keratinocyte adhesion to the BM under in vivo conditions.[35]
By tendency, this subepithelial preference at the basal pole at
the later time point could also be noted for the other assessed
BM-molecules, laminin-1/10 (Fig. 7D) and collagen type-IV
(Fig. 7F). In analogy to laminin-5, the protein distribution of
the latter-mentioned BM-constituents at day 14 considerably
parallels that in vivo, while epithelia at 7 days exhibited a more
intraepithelial distribution for laminin-1/10 (Fig. 7C), and an
incomplete dotted sub-basal expression for collagen type-IV
(Fig. 7E). As indicated by the insets of Figure 7, control
epithelia at both observation periods showed only a sparse
expression in the case of laminin-5 (inlays to Fig. 7A and 7B),
Adv. Funct. Mater. 2008, 18, 2919–2929 � 2008 WILEY-VCH Verl
and laminin-1/10 (insets to Fig. 7C and 7D), respectively,
while collagen type-IV was nearly absent (insets to Fig. 7E
and 7F). With emphasis on the studied BM molecules, a very
crucial finding is the default of the controls to exhibit their
presence in an in vivo-likemanner, that is, at sub-basal cell sites.
This adds to the body of evidence that the epithelial
equivalents of the co-cultures resemble the in vivo phenotype
of a gingival epithelium more closely, when compared to
controls. Moreover, as already adumbrated by the gene
expression studies and the protein orientation of the
differentiation markers and DP as well, the patterns found
for the ECM/BM molecules additionally prove that the
fibroblast-harboring micropillar interfaces are the key compo-
nent for the observed molecular in trans-regulation of the
epithelial biomarkers.
3. Conclusions
An important implication of our study is that establishment
and growth of GCTFs in their defined traction-force-sensing
ag GmbH & Co. KGaA, Weinheim www.afm-journal.de 2925
FULLPAPER
E. Mussig et al. /Connective Tissue Fibroblasts
Figure 6. Indirect immunofluorescence illustrates the Ki-67 proliferation marker and the des-moplakin (DP) epithelial integrity marker in co-cultured epithelial equivalents generated onmicropillar interfaces after 7 and 14 days, and their matched controls. The Ki-67 fluorescenceindicates less-proliferative cells at day 14 (B) in comparison with signals after 7 days (A). DP isclearly detectable in the IHGK co-cultures at both time points (C, day 7) and, (D, day 14), but notin the controls at day 7 (C, inset), and only scattered at day 14 (D, inset). The red propidium iodide(PI) counterstain demarcates the cell nuclei. The scale bars correspond to 50mm.
2926
pillar-microenvironment is pivotal for epithelial tissue mor-
phogenesis of IHGKs. To achieve cell adhesion on elastic
PDMS pillar heads, we chose the ECM-component FN, which,
amongst others, is also present in the gingival lamina
propria.[36] In a previous study employing IHGKs, we
demonstrated that FN immobilized on pillar heads is suitable
to modulate keratinocyte differentiation in response to various
pillar distances.[4] In the present study, we show for the first
time that FN-coated pillar arrays of 9mm distance and defined
biomechanic properties allow for adhesion and growth of
mesenchymal GCTFs. This finding may give a hint that also
cells of other periodontal tissues which are descendents of the
mesenchyme, such as osteoblasts of the alveolar bone and
fibroblasts of the periodontal ligament (PDL) may be
successfully established under these extracellular conditions.
Thus, the chosen microenvironment can be prospectively used
as a basis to study CT cell adhesion, growth, and gene
expression and synthesis of cell-specific biomolecules by
varying predefined microenvironmental parameters attribut-
ing to elasticity and/or ECM cell adhesion ligands. With
respect to CT, this kind of variation study has the advantage
www.afm-journal.de � 2008 WILEY-VCH Verlag GmbH & Co. KGaA, Weinheim
that the biological read-out does not only
provide tissue-immanent new insights, but also
allows for implications on a tissue in trans. In
the case of an epithelium-underlyingCT this in
trans read-out addresses the epithelium,
demonstrated here for the first-time. In the
case of other periodontal CTs, such as the
PDL, the in trans read-out would address the
alveolar bone, since the PDL facilitates
alveolar-bone anchorage of the tooth.[37]
Hereby, the biomechanical and biological
extracellular conditions that efficiently con-
tribute to periodontal wound or tissue regen-
eration can be identified. In future, the
knowledge of the biological consequences of
targeted variation of predefined microenvir-
onmental parameters assigned to biofunctio-
nalization or biomechanics can be used for the
optimization of existing cell-culture substrates.
This in turn will lead from biocompatible to
biomimetic materials or even to the creation
of new materials applicable for proper tissue
morphogenesis in regenerative dentistry and
medicine.
4. Experimental
Pillar Fabrication and Biofunctionalization: -Molds with holes of defined height and diameterwere created to achieve a homogeneous, thicklayer of photoreactive polymer, which defines thestructural height on a solid silicon wafer. Theepoxy-based SU-8 10 resin (Microresist Technol-ogies, Germany) was spin-coated with a defined
speed onto a clean silicon wafer under clean-room conditions. Then,the solvent was evaporated by a two-step baking process. The waferwas exposed to UV light through a custom-made negative chromiummask. The photoinitiated ring-opening reaction was accomplished at95 8C on a hotplate. Developing was performed in a developercontaining propylene glycol monomethyl ether acetate (PGMEA)(mr-Dev.600, Microresist Technologies, Germany) for 1min. For spin-coating, 2 ml of photoresist was spun on a silicon wafer (ؼ 5.08 cm) ina two-step process. To reach a 15mm thickness, an SU-8 10 resist wasspun on at 2000 rpm for 40 s. Next, softbaking of the wafer with 15mmresist was done on a hotplate at 65 8C for 2min followed by baking at95 8C for 5min. After cooling for 10min to room temperature (RT),UV-exposure was performed on a mask aligner (MJB3, Karl Suess,Germany), equipped with a 400W mercury lamp. The exposure timedepended on the resist thickness and varied from 2.5 to 4 s. To completecross-linking in the exposed areas, the wafer chips were heated up to65 8C for 1min, followed by heating up to 95 8C for 2min and coolingto RT for �10min. To develop the structures, it was necessary toredissolve the unexposed parts in PGMEA for up to 1min whileshaking. The structure was blown dry with a stream of nitrogen. Thesilicon-based polymer PDMS (Dow Corning, Midland, Michigan,USA) was mixed vigorously with a short hydrosilane cross-linker in theratio 10:1. To remove trapped air, the mixture was degassed for 30minunder vacuum at 7� 10�2 mbar. The pillar arrays were then generatedby pressing the molds upside down onto a drop of PDMS on a24� 24mm coverslip, followed by curing for 6 h at 65 8C. After cooling
Adv. Funct. Mater. 2008, 18, 2919–2929
FULLPAPER
E. Mussig et al. /Connective Tissue Fibroblasts
Figure 7. Indirect immunofluorescence illustrates the BM-constituting ECM molecules including laminin-5, laminin-1/10, and collagen type-IV in co-cultured epithelial equivalents generated on micropillar interfaces after 7 and 14 days, and matched controls. Laminin-5 appeared in a spotty fashion atday 7 (A) while at day 14, the fluorescence signal was uniformly distributed with preference to the basal pole of the basal keratinocyte layer (B). Thisdistribution at the later time point could also be noted for the other assessed BMmolecules: laminin-1/10 (D) and collagen type-IV (F). At day 7, laminin-1/10 exhibited a more-intraepithelial distribution for (C), and an incomplete, dotted, sub-basal expression for collagen type-IV (E). The insets depict thecontrols and indicate only a sparse expression for laminin-1/10 and laminin-5 (A–D; insets), while collagen type-IV is almost absent (E, F; insets). The redpropidium iodide (PI) counterstain demarcates the cell nuclei. The scale bars correspond to 50mm.
to RT, the substrates were peeled with a razor blade and overlappingPDMS residues were removed under sterile conditions. Each pillararray presented a dimension of 8� 8mmwith a cultivation surface areaof 64mm2. For the GCTFs, previous experiments employing differentpillar interspaces revealed that these conditions could be considered asoptimal with respect to cell morphology – cell spreading and shapeformation. Therefore, the pillars used in this study had a height of15mm, a diameter of 5mm and an interspace of 9mm.
For depositing FN only to the pillar tops, drops (100 ml) of an FNsolution (1mg ml�1, Sigma-Aldrich GmbH, Munchen, Germany) inphosphate buffered saline (PBS) were pipetted carefully to the surfacesand incubated for 10min at 4 8C. Immediately after withdrawing thedrop, the surface was rinsed with PBS and directly used for cultivatingcells on the pillar arrays.
Cell Culture: Establishment and serial cultivation of IHGKs hasbeen reviewed recently [16]. To avoid medium-derived induction ofkeratinocyte differentiation, the IHGKs were maintained in low-calcium keratinocyte growth medium (basal keratinocyte medium,KGM, with provided supplements, Promocell, Heidelberg, Germany),containing 50mg ml�1 kanamycin (Roche Diagnostics, Mannheim,Germany). GCTFs were cultured in Dulbecco’s Modified Eagle’smedium (DMEM) (PAA, Pasching, Austria) containing 10% foetalcalf serum (Seromed, Biochrom, Berlin, Germany) for routine cellculture.
Adv. Funct. Mater. 2008, 18, 2919–2929 � 2008 WILEY-VCH Verl
Generation of Co-cultures (CCs): Gingival connective-tissue fibro-blasts (GCTFs) calibrated to a cell number of 1� 105 cells per ml wereprecultured on the FN-coated pillar surfaces for 24 h in FAD medium(Ham’s F12/DMEM: mixing ratio 1:3, Biochrom, Berlin, Germany)including 5% foetal calf serum (FCS) and additionally containingcholera toxin (8.33mg ml�1), hydrocortisone (0.4mg ml�1), epidermalgrowth factor (EGF) (0.01mg ml�1), and insulin (5mg ml�1) (alladditives: Promocell, Heidelberg, Germany). Thereafter, a collagenlattice with a thickness of about 1mm and an extension equal to the sizeof the pillar array (about 64 mm2) was carefully placed on the pillartops. The collagen lattice was generated from a collagen type-I solution(4mg ml�1) (Curacyte, Leipzig, Germany) containing FCS and Hanksbuffered salt solution (10� ), and the whole mixture was polymerizedat 37 8C. Then, immortalized human gingival keratinocytes (IHGKs)were seeded on the collagen-lattice surface at a density of 1� 105 cellsper ml. For optimal reproducibility at the announced periods of oneand two weeks, three CCs of GCTFs and IHGKs were maintained inFAD medium. For control, 3 pillar arrays devoid of GCTFs werecovered with the collagen lattice, and the IHGKs were seeded andcultured on the lattice surface as described previously. For RNA isola-tion, the IHGKs were accordingly seeded on the porous membraneof the trans-well filter insert (Greiner Bio-one, Frickenhausen,Germany). In the case of the CCs, pillars harbouring GCTFs wereplaced on the bottom of the trans-well, thereby facilitating spatial
ag GmbH & Co. KGaA, Weinheim www.afm-journal.de 2927
FULLPAPER
E. Mussig et al. /Connective Tissue Fibroblasts
2928
separation from the IHGKs. All of the cell-culture experiments wereconducted under standard cell-culture conditions: 37 8C, 97% humidityand 5% CO2.
Raster Electron Microscopy (REM): After the respective cultureperiods on the micropillar surfaces, GCTFs were fixed with 4%glutaraldehyde in PBS for 1 h and rinsed 3 times with PBS buffer. Then,the specimens were dehydrated by rinsing through graded ethanol/water mixtures (50%, 70%, 80%, 90% and 100%; each step for 10minat RT). Thereafter, ethanol was slowly exchanged by liquid CO2.Finally, the samples were dried using the critical point method [38] andthen sputtered with an thin layer of gold, of approximately 10 nmthickness.
Indirect Immunofluorescence (IIF): For IIF, the IHGK-epithelialequivalents derived from CCs and controls were carefully removedfrom the pillar surface, embedded in TissueTek (Sakura, Zoeterwoude,Netherlands), and frozen in liquid-nitrogen vapour. Then, 10mm offrozen sections of the CC and control specimens were mounted onadhesive slides (Histobond, Marienfeld, Germany), followed byfixation in ice-cold, 80% methanol and acetone (5min each).Thereafter, the frozen sections were incubated overnight with theprimary antibodies directed against keratin K1/10 (mouse monoclonal/mab, Acris, Hiddenhausen, Germany, working dilution (wd)¼ 1:50),involucrin (mab, Abcam, Cambridge, United Kingdom, wd¼ 1:200),filaggrin (mab, Biozol, Eching, Germany, wd¼ 1:100), laminin-5(rabbit, polyclonal, Progen, Heidelberg, Germany wd¼ 1:50), lami-nin-1/10 (rabbit, polyclonal, Progen, Heidelberg, Germany, wd¼ 1:50),collagen type-IV (mab, Progen, Heidelberg, Germany, wd¼ 1:10),Desmoplakin (mab, Santa Cruz Biotechnology, Heidelberg, Germany,wd¼ 1:10) and Ki-67 (mab MIB-1, Dako Deutschland GmbH,Hamburg, Germany wd¼ 1:10). Then, the slides were washed inPBS three times (5min each), followed by incubation with thesecondary fluorochrome-conjugated antibody (for K1/10, laminin-5,collagen type-IV, Desmoplakin and Ki-67: Alexa FluorTM 488,MoBiTec Gottingen, Germany; IgG (HþL) goat anti-mouse,wd¼ 1:50 and for Involucrin and Filaggrin wd¼ 1:100; for Laminin-1/10: Alexa FluorTM 488, MoBiTec Gottingen, Germany; IgG (HþL)goat anti-rabbit, wd¼ 1:50) for 1 h at room temperature. To allow fortotal nuclei counterstaining, propidium iodide (Sigma, Deisenhofen,Germany; wd¼ 1:1000) was added to the secondary antibody. All ofthe antibodies were adjusted to their final wd in PBS containing 0.01%TWEEN 20 (Sigma, Munich, Germany) and 12% bovine serumalbumin (BSA) (Serva, Heidelberg, Germany) (PBT). Finally, thefrozen sections were embedded in a mounting medium (Biomeda;Foster City; CA; United States) and studied by confocal laser scanningmicroscopy (CLSM, Leica TCS/NT, Leica, Bensheim, Germany).
IIF of GCTFs Established on Micropillar Interfaces: IIF of GCTFsestablished on FN-biofunctionalized micropillar interfaces wasperformed according to the operationmode described for the epithelialequivalents. Mabs directed against human vimentin (Acris,Hiddenhausen, Germany) and collagen type-I (Biodesign Interna-tional, Saco, Maine, United States) were adjusted to a final workingdilution of 1:20 in PBT, and secondary fluorochrome-conjugatedantibody (Alexa Fluor 4881, MoBiTec GmbH, Gottingen, Germany,wd¼ 1:50) was used. Generally, the specificity of the employed primaryantibodies was proven by only incubating the secondary antibody,which yielded no specific fluorescence signal.
RNA-Isolation and Quantitative Real-Time-PCR Analysis (qPCR)of Epithelial Equivalents and GCTFs: For qPCR, the epithelialequivalents of the co-cultures and controls, and the pillar arrays withGCTFs were maintained in the above-mentioned trans-well system.After the respective culture periods, the total RNA was isolatedselectively from both cell types using the RNeasy mini kit (Qiagen,Hilden,Germany) after a period of one and twoweeks. The specimens-derived RNA concentration and integrity was determined by using anautomated electrophoresis system (ExperionTM BioRad, Munchen,Germany). First-strand cDNA was synthesized from a 1mg total RNAaliquot in the reaction mixture, containing random hexamer primer,by performing the RevertAidTM reverse transcription protocol
www.afm-journal.de � 2008 WILEY-VCH Verlag GmbH
(Fermentas Inc., Hanover, MD, USA). The cDNA concentrationwas determined by fluorometry using a fluorescence dye (PicoGreen;Molecular Probes) and adjusted to 1ng ml�1. qPCR analysis wasperformed with the iCycler real-time PCR detection System (BioRadLaboratories, Philadelphia, PA, USA) according to the manufacturer’sinstructions. In the case of the IHGKs, commercially designed primerpairs were used (RT2 PCR Primer Set for Human KRT1, KRT10,Involucrin and Filaggrin, Superarray, Frederick, MD, USA). Thestandard temperature profile included initial denaturation for 15min at95 8C, followed by 40 cycles of denaturation at 94 8C for 40 s, annealing at55 8C (primer-dependent) for 30 s, and extension at 72 8C for 40 s. qPCRanalysis of the GCTFs was accomplished with self-designed primers(BeaconDesigner 5.0 Software, BioRadLaboratories, Philadelphia, PA,USA), for collagen type-I (forward: 50-CGGAGGAGAGTCAG-GAAGG-30; reverse 50-ACATCAAGACAAGAACGAGGTAG-30)nd vimentin (forward: 50-TTTTTCCAGCAAGTATCCAACC-30,reverse: 50-GTTTTCCAAAGATTTATTGAA-30, Thermo FisherScientific, Germany). The relative expression levels of each mRNAwere analyzed using amodification of theDDCT equation, which allowscounting for differences in efficiencies (E¼ 10�1/slope) between thePCR reactions [39]. The data were calculated using the GeneExpression Macro software provided with the iCycler. The data werenormalized to the CT of the glycerinaldehyd-3-phosphat-dehydrogen-ase (GAPDH) non-modulated housekeeping gene. The data presentedin Figure 2 and 4 reflect the means (n¼ 3,� SD) of three independentexperiments.
Measurement of Traction Forces: Phase-contrast live-cell imagingwas used to localize empty and GCTF-covered pillar tops. A regularspaced pillar representing the ideal non-deflected position served as acontrol pillar. The position of the center of the pillars was recordedover 18 h using a numerical aperture 20� objective for live-cell imaging(Delta-Vision Core1, Applied Precision, Issaquah, WA, USA). Forthe measurement, the micropillar deflection was determined usingimage-analysis software written in MATLAB 6.0 (Mathworks). Afterenhancing the contrast of the pictures the pillars were approximated toa Gaussian followed by a Gaussian smoothing to track the pillar’scentre of intensity. The distance between the real (cells attached topillar tops) and ideal (empty control pillar tops) position of the tops wasdetermined. The pillar stiffness was calculated to be 0.07N m�1 (pillardimensions: diameter¼ 5mm, height¼ 15mm); the forces acting on thepillar could be determined by Equation (1) [29]
For technical reasons the error of the resolution of the tractionforces was approximated to 5 nN. This limitation is due to the restrictedresolution of the image-acquisition system in phase-contrast micro-scopy.
Received: March 17, 2008Revised: May 21, 2008
Published online: September 22, 2008
[1] J. L. Tan, J. Tien, D. M. Pirone, D. S. Gray, K. Bhadriraju, C. S. Chen,
Proc. Natl. Acad. Sci. USA 2003, 100, 1484.
[2] C. A. Lemmon, N. J. Sniadecki, S. A. Ruiz, J. L. Tan, L. H. Romer,
C. S. Chen, Mech. Chem. Biosystems 2005, 2, 1.
[3] O. du Roure, A. Saez, A. Buguin, R. H. Austin, P. Chavrier, P.
Silberzan, B. Ladoux, Proc. Natl. Acad. Sci. USA 2005, 102, 2390.
[4] T. Steinberg, S. Schulz, J. P. Spatz, N. Grabe, E. Mussig, A. Kohl, G.
Komposch, P. Tomakidi, Nano Lett. 2007, 7, 287.
[5] C. Mohrdieck, A. Wanner, W. Roos, A. Roth, E. Sackmann, J. P.
Spatz, E. Arzt, Chem. Phys. Chem. 2005, 6, 1492.
[6] C. Barentin, Y. Sawada, J. P. Rieu, Eur. Biophys. J. 2006, 35, 328.
[7] R. Merkel, N. Kirchgessner, C. M. Cesa, B. Hoffmann, Biophysical J.
2007, 93, 3314.
[8] A. Katsumi, J. Milanini, W. B. Kiosses, M. A. del Pozo, R. Kaunas, S.
Chien, K. M. Hahn, M. A. Schwartz, J Cell Biol. 2002, 158, 153.
& Co. KGaA, Weinheim Adv. Funct. Mater. 2008, 18, 2919–2929

FULLPAPER
E. Mussig et al. /Connective Tissue Fibroblasts
[9] N. Wang, E. Ostuni, G. M. Whitesides, D. E. Ingber, Cell Motility
Cytoskeleton 2002, 52, 97.
[10] J. D. Kubicek, S. Brelsford, P. Ahluwalia, P. R. Leduc, Langmuir 2004,
20, 11552.
[11] L. D. Landau, E. M. Lifshitz, Theory of Elasticity, Pergamon Press,
Oxford 1986.
[12] M. Dembo, Y. L. Wang, Biophysical J. 1999, 76, 2307.
[13] K. Boehnke, N. Mirancea, A. Pavesio, N. E. Fusenig, P. Boukamp,
H. J. Stark, Eur. J. Cell Biol. 2007, 86, 731.
[14] S. Werner, H. Smola, Trends Cell Biol. 2001, 11, 143.
[15] P. M. Bartold, L. J. Walsh, A. S. Narayanan, Periodontol 2000, 2000,
24, 28.
[16] G. Embery, R. J. Waddington, R. C. Hall, K. S. Last, Periodontol 2000
2000, 24, 193.
[17] R. Nischt, C. Schmidt, N. Mirancea, A. Baranowsky, S. Mokkapati, N.
Smyth, E. C. Woenne, H. J. Stark, P. Boukamp, D. Breitkreutz, J.
Investigative Dermatology 2007, 127, 545.
[18] H. J. Stark, M. Baur, D. Breitkreutz, N. Mirancea, N. E. Fusenig, J.
Investigative Dermatology 1999, 112, 681.
[19] M. Roesch-Ely, T. Steinberg, F. X. Bosch, E. Mussig, N. Whitaker, T.
Wiest, A. Kohl, G. Komposch, P. Tomakidi, Differentiation 2006, 74,
622.
[20] P. Tomakidi, N. E. Fusenig, A. Kohl, G. Komposch, J. Periodontal Res.
1997, 32, 388.
[21] P. Tomakidi, D. Breitkreutz, N. E. Fusenig, J. Zoller, A. Kohl, G.
Komposch, Cell Tissue Res. 1998, 292, 355.
[22] D. B. Shannon, S. T. McKeown, F. T. Lundy, C. R. Irwin, Wound
Repair Regeneration 2006, 14, 172.
[23] B. A. Harley, T. M. Freyman, M. Q.Wong, L. J. Gibson, Biophysical J.
2007, 93, 2911.
Adv. Funct. Mater. 2008, 18, 2919–2929 � 2008 WILEY-VCH Verl
[24] W. Roos, J. Ulmer, S. Grater, T. Surrey, J. P. Spatz, Nano Lett. 2005, 5,
2630.
[25] T. Srisuwan, D. J. Tilkorn, J. L. Wilson, W. A. Morrison, H. M.
Messer, E. W. Thompson, K. M. Abberton, Periodontol 2000 2006,
41, 88.
[26] J.M. Park, J. Y. Koak, J. H. Jang, C. H.Han, S. K. Kim, S. J. Heo, Int. J.
Oral Maxillofacial Implants 2006, 21, 859.
[27] L. Scheideler, F. Rupp, H. P. Wendel, S. Sathe, J. Geis-Gerstorfer,
Dent Mater 2007, 23, 469.
[28] M. Feghali-Assaly, M. H. Sawaf, G. Serres, N. Forest, J. P. Ouhayoun,
J. Periodontal Res. 1994, 29, 185.
[29] A. Ganz, M. Lambert, A. Saez, P. Silberzan, A. Buguin, R. M. Mege,
B. Ladoux, Biol. Cell 2006, 98, 721.
[30] P. Ye, C. C. Chapple, R. K. Kumar, N. Hunter, J. Pathology 2000, 192,
58.
[31] S. A. Smith, B. A. Dale, J. Investigative Dermatology 1986, 86,
168.
[32] E. Endl, C. Hollmann, J. Gerdes, Methods Cell Biol. 2001, 63, 399.
[33] V. Vasioukhin, E. Bowers, C. Bauer, L. Degenstein, E. Fuchs, Nature
Cell Biol. 2001, 3, 1076.
[34] F. Spirito, S. Chavanas, C. Prost-Squarcioni, L. Pulkkinen, S. Fraitag, C.
Bodemer, J. P. Ortonne, G.Meneguzzi, J. Biol. Chem. 2001, 276, 18828.
[35] K. M. Haas, A. Berndt, K. J. Stiller, P. Hyckel, H. Kosmehl, J.
Histochemistry Cytochemistry 2001, 49, 1261.
[36] P. Walsh, L. Hakkinen, H. Pernu, M. Knuuttila, H. Larjava, J. Period-
ontal Res. 2007, 42, 144.
[37] A. Nanci, D. D. Bosshardt, Periodontol 2000 2006, 40, 11.
[38] W. Y. Yeong, C. K. Chua, K. F. Leong, M. Chandrasekaran, M. W.
Lee, J. Biomed. Mater. Res, Part B: Appl. Biomater. 2007, 82, 260.
[39] K. J. Livak, T. D. Schmittgen, Methods 2001, 25, 402.
ag GmbH & Co. KGaA, Weinheim www.afm-journal.de 2929


