Embed Size (px)
Citation preview

CONNECTING THE DOTS: TRANSPORT, POVERTY, AND SOCIAL INCLUSION - EVIDENCE FROM ARMENIADecember 2017Transport and ICT Global Prac�ceEUROPE
Pub
lic D
iscl
osur
e A
utho
rized
Pub
lic D
iscl
osur
e A
utho
rized
Pub
lic D
iscl
osur
e A
utho
rized
Pub
lic D
iscl
osur
e A
utho
rized


Connecting the Dots: Transport, Poverty, and Social Inclusion - Evidence from Armenia
December 2017
Transport and ICT Global Practice
EUROPE

Regional Vice President:Country Director:
Senior Global Practice Director: Practice Manager:
Task Team Leader(s):
Regional Vice President:Cyril Muller Country Director:Mercy Miyang Tembon Senior Global Practice Director:Jose Luis Irigoyen Practice Manager:Juan Gaviria Task Team Leader(s):Steven Farji Weiss
CURRENCY EQUIVALENTS
(Exchange Rate Effective November 1, 2017)
Currency Unit = Armenian Dram (AMD)
AMD 486,671 = US$1
US$ 0,00021 = AR$ 1
FISCAL YEARJanuary 1 - December 31
Standard Disclaimer:
This volume is a product of the staff of the International Bank for Reconstruction and Development/ The World Bank. The findings, interpretations, and conclusions expressed in this paper do not necessarily reflect the views of the Executive Directors of The World Bank or the governments they represent. The World Bank does not guarantee the accuracy of the data included in this work. The boundaries, colors, denominations, and other information shown on any map in this work do not imply any judgment on the part of The World Bank concerning the legal status of any territory or the endorsement or acceptance of such boundaries.
Copyright Statement:
The material in this publication is copyrighted. Copying and/or transmitting portions or all of this work without permission may be a violation of applicable law. The International Bank for Reconstruction and Development/ The World Bank encourages dissemination of its work and will normally grant permission to reproduce portions of the work promptly. For permission to photocopy or reprint any part of this work, please send a request with complete information to the Copyright Clearance Center, Inc., 222 Rosewood Drive, Danvers, MA 01923, USA, telephone 978-750-8400, fax 978-750-4470, http://www.copyright.com/.All other queries on rights and licenses, including subsidiary rights, should be addressed to the Office of the Publisher, The World Bank, 1818 H Street NW, Washington, DC 20433, USA, fax 202-522-2422, e-mail [email protected].

ADB Asian Development BankASA Analytical and Advisory Services CSC Community Score CardDMSP Defense Meteorological Satellite ProgramECA Europe and Central AsiaFGD Focus Group Discussion GDP Gross Domestic ProductGIS Geographic Information SystemGNSS Global Navigation Satellite SystemGNI Gross National IncomeGPS Global Positioning SystemGTZ German Agency for Technical Cooperation
(Deutsche Gesellschaft für Technische Zusammenarbeit)KII Key Informant InterviewICR Implementation Completion and Results ReportILCS Integrated Living Conditions SurveyIMF International Monetary FundIRI International Roughness IndexLRIP Lifeline Roads Improvement ProjectLRNIP Lifeline Roads Network Improvement ProjectMAI Market Accessibility IndexMCC Millennium Challenge CorporationM&E Monitoring and EvaluationMTAD Ministry of Territorial Administration and DevelopmentNOAA National Oceanic and Atmospheric AdministrationNGO Nongovernmental organizationNSSRA National Statistics Service of the Republic of ArmeniaNTL Nighttime LightSDG Sustainable Development GoalSMEs Small and Medium EnterprisesRAI Rural Accessibility IndexUNDP United Nations Development ProgramVIIRS Visible Infrared Imaging Radiometer SuiteWDR World Development Report
ACRONYMS

This report was prepared by a World Bank by a team led by Steven Farji Weiss (Economist) and comprising Rodrigo Archondo-Callao (Senior Road Engineer), Xavier Espinet Alegre (Transport Specialist), Kadeem Khan (Junior Professional Associate), Mathilde Lebrand (Economist), Nora Mirzoyan (Operations Consultant), and Irina Tevosyan (Senior Program Assistant). Special thanks go to the Study´s advisors Moritz Meyer (Economist), Christoph Aubrecht (Senior Projects Officer), Giorgia Demarchi (Social Scientist), Atsushi Iimi (Senior Transport Economist), Osman Kaan (Consultant), Carolina Monsalve (Senior economist), Carlos Rodriguez Castelan (Senior Economist), Benjamin P. Steward, (Geographer) and Tara Vishwanath (Lead Economist). The team would also like to thank Mercy Miyang Temblon (Country Director), Juan Gaviria (Practice Manager), Sylvie K. Bossoutrot (Country Manager), Laura Bailey (Lead Social Development Specialist), Carolina Sanchez-Paramo (Senior Director) and Sarah G. Michael (Program Leader) for their continued support and strategic guidance. Finally, the core team is also very thankful to Armenia-based consultants Aram Gevorgyan, Artak Piloyan, Eduard Davtyan, and Ada Babloyan for their data collection efforts, fieldwork, and analysis, which this study relied extensively on.
The team would also like to acknowledge the support and invaluable contributions made by representatives of the Government of the Republic of Armenia, specifically the Ministry of Transport, Communication and Information Technologies, the Ministry of Territorial Administration and Development, and the National Statistical Service of the Republic of Armenia, and the local communities surveyed as part of this report.
ACKNOWLEDGEMENTS

Executive Summary ....................................................................................................................................iIntroduction .................................................................................................................................................1Section 1: Country Context .......................................................................................................................3
Armenia: Evolution of Poverty, Economic, and Demographic Indicators ..................................................3Section 2: Conceptual Framework............................................................................................................7
Conceptualizing Household Welfare through a Transport Lens ...............................................................7Section 3: Literature Review on Rural Transport, Poverty, and Local Economic Activity ................12
Assessing the Effects of Transport Infrastructure Investments ..............................................................12
Impact Evaluation Approaches ...............................................................................................................14Using Satellite Imagery as a Proxy for Local Economic Activity .............................................................15
Section 4: Accessibility Analysis ............................................................................................................16A Snapshot of the Road Sector in Armenia ............................................................................................16Assessing Market and Service Accessibility as a Determinant of Welfare in Armenia ...........................18The Spatial Relationship between Poverty, Road Condition, and Accessibility ......................................25Interpretation of Findings ........................................................................................................................26
Section 5: Examining the Relationship between Transport, Poverty, and Local Economic Activity: Evidence from the LRIP................................................................................27
Overview of the LRIP and Prior Research ..............................................................................................27Characterizing the Area of Influence of the LRIP ...................................................................................29Source: MTAD database 2015. ..............................................................................................................31Qualitative Analysis: Assessing the Long-term Outcomes of the LRIP from a Social and Poverty Perspective ..........................................................................................31Methodology and Assessment Matrix .....................................................................................................32Sampling .................................................................................................................................................32Participant Profile .................................................................................................................................33Summary of Findings ...........................................................................................................................33Nighttime Lights Analysis: Exploiting Luminosity Data to Measure Local Economic Activity ..................39Description of Methodology and Specification Strategy .........................................................................41Structure of the Data ..............................................................................................................................42Evidence on Changes in NTL Per Capita ...............................................................................................42
Section 6: Lessons Learnt and Directions for Future Research..........................................................45Conclusions and Policy Recommendations ..........................................................................................48List of References ....................................................................................................................................51Annex I: Motivation for Selected Methodology for the LRIP Assessment ..........................................54Annex II: Description of Methodology for Conducting Countrywide Road Survey ...........................56Annex III: Methodology for Estimating the RAI .....................................................................................60Annex IV: Accessibility Analysis for Unbundled Health and Education Facilities .............................61Annex V: Methodology and Sampling for Qualitative Analysis ...........................................................64Annex VI: Revealed Priorities for Village Mayors in Surveyed Communities ....................................70Annex VII: Selected Indicators for the LRIP’s Project Communities ...................................................72
TABLE OF CONTENTS

Figure 1: RAI Map for Armenia 2017 and Distribution of Road Condition Category by Marz ....................... iiFigure 2: Distribution of Rural Population and Distance to Markets and Cities ........................................... iiiFigure 3: Average Travel Times to the Closest School ................................................................................ ivFigure 4: Unemployment Rate and Remittance Flows (Percentage of GDP) in Armenia ............................4Figure 5: Poverty in Armenia, 2004-2014 .....................................................................................................4Figure 6: Poverty Rate at the Marz Level (2015)..........................................................................................5Figure 7: Shared Prosperity: Annualized Consumption Growth (2004-2014) (%) for Armenia and ECA Countries ........................................................................................6Figure 8: Conceptualizing Poverty and Transport through the Asset-Based Approach ................................8Figure 9: Transmission Channels Linking Transport with Local Economic Activity ....................................10Figure 10: Distribution of Road Network by Condition Category ................................................................17Figure 11: Roads in Good and Very Good Condition per Inhabitant ..........................................................18Figure 12: Roads in Good and Very Good Condition per Area .................................................................18Figure 13: Population Distribution in Armenia ............................................................................................18Figure 14: RAI Map for Armenia and RAI by Marz 2017 ............................................................................19Figure 15: Travel Times to Yerevan, Gyumri, and Vanadzor Cities and Distribution of the Rural Population from the Point of Interest ..................................................20Figure 16: Average Travel Time to Towns with Population of over 15,000 and Distribution of Rural Population from the Point of Interest ..............................................21Figure 17: Average Travel Time to 30 Main Towns and Distribution of Rural Population from the Threshold ...................................................................................................................21Figure 18: Distribution of Rural Population and Distance to Markets and Cities ........................................22Figure 19: Average Travel Times to the Closest Health Facilities and Distribution of the Population within Time Thresholds ................................................................................22Figure 20: Average Travel Times to the Closest Health Facility, by Marz ...................................................23Figure 21: Average Travel Times to the Closest School .............................................................................23Figure 22: Average Travel Times to the Closest School by Marz ...............................................................24Figure 23: Percentage of Rural Population within Two Types of Service Facilities ....................................24Figure 24: Percentage of Population More than an Hour away from Large Town in Each Marz ................25Figure 25: Time Line—Interventions and Data ...........................................................................................27Figure 26: Map of the LRIP’s Project Roads and Demographic Distribution in Armenia ............................30Figure 27: Annual Population Change in Armenia and Project Communities (2005-2015) ........................30Figure 28: Average Distance in Minutes to Different Points of Interest LRIP Communities and Armenia (2015) ..............................................................................................................31Figure 29: GDP Per Capita, Poverty, and NTL Emission Per Capita in Armenia (2004-2012) ...................40Figure 30: Map of NTL Emission Per Capita 2004 .....................................................................................42Figure 31: Map of NTL Emissions Per Capita 2012 ...................................................................................42Figure 32: Trends in Luminosity Per Capita (2004-2012) ...........................................................................42Figure 33: Luminosity Per Capita Gap (Treatment Value-Control Value) (2004-2012) ..............................43Figure 34: Percentage Change in Luminosity Per Capita During Two Time Periods, 2004-2009 (pre-intervention) and 2010-2012 (post-intervention) ................................43Figure 35: Percentage Change in Luminosity Per Capita by Treatment Cluster (2010-2012) ...................44
LIST OF FIGURES

Table 1: Summary of Findings from LRIP Assessment ............................................................................... vi
Table 2: Armenia’s Selected Economic Indicators 2009-2017 ......................................................................3
Table 3: Methodologies Used, Data Source, and Outcomes ......................................................................11
Table 4: Summary of Evidence from Mathematica-MCC Impact Evaluation ..............................................28
Table 5: Summary of Household-Level Outcomes .....................................................................................38
Table A2.1: Road Condition Category and Suggested IRI Classification ...................................................56
Table A2.2: Road Survey Plan ....................................................................................................................56
Table A5.1: Marzes Selected for the Study.................................................................................................66
Table A5.2: Sample Categories ..................................................................................................................67
Table A5.3: List of Surveyed Communities .................................................................................................69
Table A6.1: Most Pressing Problems Faced by the Communities ..............................................................70
Table A7.1: Selected Indicators for the LRIP’s Project Communities (2015) ……..................................... 72
Box 1: Short- and Long-Term Impact of Rural Transport Interventions:
Evidence from World Bank-Financed Projects ...........................................................................................13
Box 2: A Tale of Two LRIP Communities (I): Lchashen, Gegharkunik ........................................................36
Box 3: A Tale of Two LRIP Communities (II): Panik, Shirak ........................................................................36
Box 4. Policy Recommendations to Compliment Road Rehabilitation Projects .........................................39
LIST OF TABLES AND BOXES

I
Introduction
The role of transport infrastructure in reducing poverty through better access to opportunities and services has been widely studied, but not clearly understood (Gannon and Liu 1997; Booth et.al. 2000). Shared prosperity and poverty reduction require making the transport network accessible to everyone, particularly the poor and bottom 40 percent.
This report examines the impact of rural connectivity on poverty, access to basic services, and income in Armenia, a country which has found itself in a low-growth, low-investment nexus, with stalled poverty reduction (World Bank 2017). It seeks to answer two questions:
• How do we characterize physical accessibility in Armenia and what are the main constraints for accessing markets and services?
• What have been the outcomes of the World Bank-financed transport investments in Armenia on household welfare and local economic development during 2009-2017?
Context During the 2000s, Armenia experienced significant poverty reduction, underpinned by robust economic growth of about 12 percent per year and well-targeted redistributive programs. However, the global financial crisis in 2009 halted these gains.
The government responded to the sharp economic contraction by increasing public spending on infrastructure, including transportation. One of the interventions to support the recovery and job creation plan was the World Bank-financed Lifeline Roads Improvement Project (LRIP), approved by the World Bank in 2009 and completed in 2013. The project rehabilitated rural roads in Armenia and was also geared toward generating short-term employment opportunities in rural communities.
The project rehabilitated 446 km of rural roads, created close to 40,000 temporary jobs, and reduced travel times and transport costs by an average of 58 percent and 25 percent, respectively. When the LRIP was completed, the Millennium Challenge Corporation (MCC)-Mathematica commissioned an impact evaluation to measure project-induced effects on welfare among other variables of interest.1 A key finding of this evaluation was that the project’s impacts on welfare were not conclusive.
The present research aims to fill the gaps by exploring household welfare outcomes in a longer evaluation window (2009-2017). In addition, this study examines other likely local economic development effects using the community as the unit of analysis.
Methodological Approaches and Data Sources
To answer the abovementioned two questions, the study has employed a combination of qualitative and quantitative approaches using primary data and secondary data sources, as follows.2
(a) Road survey, accessibility analysis, and poverty. To address the first research question, the study included the first countrywide survey of national, republican, and lifeline roads ever done in Armenia to (i) collect road quality data and (ii) examine trends in spatial development throughout Armenia using a lens of accessibility.
(b) Assessment of the longer-term outcomes of the LRIP. To address the second research question, the study included the following analyses:
1 The impact assessment used data from the Integrated Living Conditions Survey (ILCS), which is administered by the National Statistics Service of the Republic of Armenia (NSSRA).2 Annex I elaborates on the motivation and rationale for this study, including a description of the menu of methodolo-gies and approaches considered from the onset and the justification for discarding a follow-up impact evaluation.
EXECUTIVE SUMMARY

II
• Qualitative assessment. To assess longer-term welfare effects in selected project communities on the one hand and to understand these multifaceted processes on the other, deeper qualitative understanding and closer interaction with the villagers were needed. In this spirit, this assessment examines ex post views, perceptions, expectations, and livelihood outcomes of the beneficiaries for selected LRIP communities and comparator communities that did not benefit from road rehabilitation.
• Community-level data to analyze trends in project communities. The World Bank supported the consolidation of an extensive database for Armenia’s 913 communities. This database is administered by the Ministry of Territorial Administration and Development (MTAD). The data have been used to supplement the qualitative assessment’s findings.
• Nighttime light (NTL) analysis. NTLs have been shown to be highly correlated with electricity consumption and the presence of physical capital (Agnew et al. 2008; Alesina et al. 2004; Storeygard 2013), thereby serving as a proxy for economic activity. Since there is very scarce geo-referenced data on Armenia, the study relied on the geographic information system (GIS) database generated through the road survey that accompanied this study to locate project and control communities.
The methodological approaches were considered the most appropriate ones to answer the underlying questions, considering contextual, budget, and data limitations.
Key Findings from the Accessibility Analysis
Road condition data collected through the road survey suggest that Armenia has a relatively well-developed road network, serving all parts of the country. The percentage of paved roads, at 84 percent, is high compared to other developing countries and in line with most European countries. However, road quality is a matter of concern: close to 41 percent of roads are in good or very good condition, 19 percent are in fair condition, and 40 percent are in poor or very poor condition. Disparities are more acute when comparing the primary road network with feeder roads.
Figure 1: RAI Map for Armenia 2017 and Distribution of Road Condition Category by Marz
Source: Road Survey 2017 and World Bank’s calculations with road survey data 2017, WorldPop 2015.
Figure 1: RAI Map for Armenia 2017 and Distribution of Road Condition Category by Marz
Source: Road Survey 2017 and World Bank’s calculations with road survey data 2017, WorldPop 2015.
To provide a consistent basis for estimating the proportion of the rural population that has adequate access to the transport system, the study included the first update of the Rural Accessibility Index (RAI)3 in 14 years. The calculation shows that as many as 610,000 people or 34 percent of Armenia’s rural population (an RAI of 66 percent) do not have access to an all-weather road.
Subsequently, to illustrate the essential goal of transport and mobility, the ease with which households can access markets, education, and health facilities, another set of indicators was constructed. The estimate obtained for the Market Accessibility Index (MAI)4 suggests that close to 86 percent of the population is within 45 minutes of the largest 30 towns/cities and that almost all Armenians are within an hour of health and education services.
The high degree of accessibility to markets and services can be explained by the fact that almost all the points of interests, such as schools, health facilities, and administrative buildings, are located on the main street or road of the village. Hence, the results suggest that despite the relatively poor condition of rural roads in some marzes, most inhabitants have relatively good access to services and markets.5 However,
3 The RAI measures the proportion of the rural population within 2 km or a 25-minute walk to an all-weather road. An all-weather road in this context is considered as one in fair condition or better. 4 The MAI is defined as the travel time required for the population in a given area to reach a town, city, or any other high-density population center. 5 It is important to note that these estimates only apply to the seasons in which transitability of the roads is not affected by climatic conditions such as ice, snow, or potential landfalls. The road survey was conducted right after the winter, precisely to obtain an accurate estimate of the IRI, which provides a proxy for road condition. However, experience in Armenia demonstrates that accessibility is significantly curtailed in the winter months as snow removal efforts on the road network tend to be inadequate and at times not feasible.
0%
10%
20%
30%
40%
50%
60%
70%
80%
90%
100%
Very Good Good FairPoor Very poor
EXECUTIVE SUMMARY

III
To provide a consistent basis for estimating the proportion of the rural population that has adequate access to the transport system, the study included the first update of the Rural Accessibility Index (RAI)3 in 14 years. The calculation shows that as many as 610,000 people or 34 percent of Armenia’s rural population (an RAI of 66 percent) do not have access to an all-weather road.
Subsequently, to illustrate the essential goal of transport and mobility, the ease with which households can access markets, education, and health facilities, another set of indicators was constructed. The estimate obtained for the Market Accessibility Index (MAI)4 suggests that close to 86 percent of the population is within 45 minutes of the largest 30 towns/cities and that almost all Armenians are within an hour of health and education services.
The high degree of accessibility to markets and services can be explained by the fact that almost all the points of interests, such as schools, health facilities, and administrative buildings, are located on the main street or road of the village. Hence, the results suggest that despite the relatively poor condition of rural roads in some marzes, most inhabitants have relatively good access to services and markets.5 However, the analysis showed that (i) inter-village connectivity is cumbersome in some marzes and (ii) last-mile connectivity challenges still exist for a small proportion of the population (5 percent by World Bank estimates) who live more than hour away from a high-density population center.
Figure 2: Distribution of Rural Population and Distance to Markets and Cities
Source: World Bank’s calculations with road survey data 2017, WorldPop 2015.
3 The RAI measures the proportion of the rural population within 2 km or a 25-minute walk to an all-weather road. An all-weather road in this context is considered as one in fair condition or better. 4 The MAI is defined as the travel time required for the population in a given area to reach a town, city, or any other high-density population center. 5 It is important to note that these estimates only apply to the seasons in which transitability of the roads is not affected by climatic conditions such as ice, snow, or potential landfalls. The road survey was conducted right after the winter, precisely to obtain an accurate estimate of the IRI, which provides a proxy for road condition. However, experience in Armenia demonstrates that accessibility is significantly curtailed in the winter months as snow removal efforts on the road network tend to be inadequate and at times not feasible.
EXECUTIVE SUMMARY

IV
Figure 3: Average Travel Times to the Closest School
66.26
0.030.76
32.95
0-15 15-30 30-45 over 45
Source: World Bank’s calculations with road survey data 2017, WorldPop 2015, Ministry of Education.
Key Findings of the Medium- and Longer-Term Outcomes of the LRIP To validate the postulates emerging from the accessibility analysis, the study goes one scale down to the project level to capture effects other than the direct and quantifiable benefits associated with rural road projects. Drawing on the asset-based model developed by Bussolo and Lopez-Calva (2014), a comprehensive assessment was conducted to examine direct, intermediate, and broader welfare outcomes. This conceptual framework enables a discussion on the channels of transmission through which transport infrastructure facilitates the acquisition of different types of assets needed to escape poverty. In this analysis, the household is used as the primary unit of analysis, but consultations with selected small and medium enterprises (SMEs) were also held to unveil firm-level effects.
Household- and SME-Level Outcomes
The qualitative assessment took place in 10 project communities between April and May 2017, with the participation of 217 community beneficiaries and five beneficiary SMEs, and in five comparison communities. The assessment examined three broad groups of outcomes of interest between 2009 (right before civil works began) and 2017 (five to seven years after project completion): (a) those considered a direct outcome of rural roads rehabilitation, such as mobility patterns and use of transportation services; (b) intermediate outcomes such as access to services and markets; and (c) broader welfare outcomes such as poverty, asset ownership, land use, and agricultural productivity. The most important findings are summarized in the following paragraphs.
Direct outcomes - Mobility patterns and use of transportation systems. Following project completion, there were changes in travel intensity and increase of frequency of transport services offered, particularly access to taxi services. Better roads also facilitated a greater flow of goods produced outside the region and could potentially explain some changes in intrastate migration patterns.
Similarly, more transitable roads contributed to additional trips for social purposes. On the other hand, the rehabilitated road did not lead to any changes in other travel purposes, destinations, or uses of government/public facilities.
Intermediate outcomes - Accessibility to services and markets. Results from the focus group discussions (FGDs) showed that there was an improvement in access to medical and university education services. Accessing nearby cities and towns for employment, shopping, or social purposes became easier, faster, and safer. This allowed farmers and small businesses to bring their products to markets at a reduced cost and enhanced social networks among communities. Perhaps more importantly, the FGDs revealed an increase in preschool education and access to early child development centers. In most of the targeted communities without an operating kindergarten, there was an increase in preschool enrolment and intensity of attendance at kindergartens situated in neighboring communities.
EXECUTIVE SUMMARY

V
Broader welfare outcomes. In line with the results from the MCC-Mathematica Impact Assessment, the FGDs did not point to a strong evidence of impacts on income, consumption, savings, investment, or employment. As discussed earlier, the project was designed to create temporary employment opportunities. However, the number of people who participated in the rehabilitation works from the general population was small relative to the number of employed people in each community. Following the completion of works, few jobs were created out of on-project activities.
Asset ownership, land use, and agricultural productivity. The rehabilitated roads did not lead to any perceived incentive to invest in farming, particularly land cultivation. Analysis of changes in sizes of land under cultivation, number of livestock available, and shares of households producing agricultural products for sale did not show a significant difference between comparison and project communities. This finding supports the argument that improved physical connectivity brought about by better transport infrastructure is not an automatic game changer in the agricultural dynamics of a given region, but may support positive productivity improvements when combined with other reforms and complimentary interventions.
A noteworthy finding, however, was that while comparing communities with good and moderate roads to others, beneficiary households engaged in agriculture saw an increase in livestock holdings and changes in land-use patterns, as evidenced by an increase in the scale of cattle farming and a tendency to switch from land cultivation to cattle farming. However, these findings only apply to some of the communities chosen for the qualitative assessment in Gegharkunik and Syunik marzes.
Women and the elderly. Gender-based analysis reveals that women use the lifeline roads less frequently than men and travel purposes differ. Women use the roads mostly for household needs rather than for employment or economic purposes. Some female participants reported safety problems along the road, but more importantly within the communities due to poorly maintained sidewalks and inadequate lighting. In terms of reported outcomes for the elderly, while this segment reports an improvement in the access to medical facilities, there was no indicative tendency of increased number of visits for medical services.
SME-level outcomes. Interestingly, the most notable positive changes in terms of welfare were not observed at the household level, but rather at the enterprise level. Discussions were held with representatives from different business sectors, including retail (small food stores), restaurants, wood processing, milk production, bakery, beverage production, and strawberry farming. Analysis of official data demonstrates that in all SMEs selected in project communities, there was an increase in yearly turnover and number of registered workers in all the SMEs surveyed in the post-project period, while in all but one comparison community there was no change. While this finding may be explained by several intervening factors affecting overall demand for goods and services produced by the SMEs, the key informant interviews (KIIs) revealed that improved market access and lower transport costs were both decisive factors for the observed increase in SME profitability.
NTL Analysis: Assessing Community-Level Local Economic Development Outcomes
The next focus was on the community as the unit of analysis to empirically gauge the local economic impact of the LRIP. The preliminary results of the NTL analysis from 2004 to 2012—the years for which data are available—initially suggest that per capita luminosity in treatment communities grew by 98 percent while the national average was 114 percent. Control communities grew faster, with a 142 percent increase during the same period. Hence, viewing the change over the entire time series would suggest that treatment communities experienced the slowest growth; however, when the time series is divided into pre- (2004-2009) and post-intervention (2010-2012), it is noticed that treatment communities began to grow faster after 2010. Of more relevance for research purposes, from 2010 to 2012, the period immediately following LRIP intervention, luminosity per capita in treatment communities rose by 42 percent, slightly outpacing both the national average and the control group, which grew at 40 and 35.5 percent, respectively; this is noteworthy since treatment communities had been lagging in terms of NTL per capita in the pre-intervention period. While the results are promising, suggesting that project communities might have benefited from increased economic activity (as measured by electricity consumption), at least in the short term when the project was completed, the difference-in-difference estimator used to calculate the per capita luminosity gap was not statistically significant. Hence, it cannot be stated with sufficient confidence that the observed change in luminosity gap resulted from road rehabilitation.
EXECUTIVE SUMMARY

VI
Table 1: Summary of Findings from LRIP Assessment
Outcome Finding
Data Source/
Methodol-ogy
Intercommunity mobility All 10 surveyed villages reported improvement in daily/weekly trips to other villages FGD
Vehicular activity Reported in FGDs and KIIs with village mayors FGDs/KII
Availability of transport services Increase in availability of minibuses to go to district/marz center FGDs
Affordability of transport services No data to establish changes FGDs
Road safety No perceived changes FGDs
Vehicle driving speeds Increase reported by beneficiaries/lower travel times FGDs
Travel purposes No perceived changes though the consultations report an increase in the number of “social visits” FGDs
Increase in income/consumption/social mo-bility/poverty No change FGDs
Increase in employment (short term) Changes observed immediately after the project though consultations do not point to durable employment ICR/FGDs
Increase in employment (long term) No changes at the household level FGDs/KIIs
Skills development/labor market placement No changes FGDs
Social capital Increase as evidenced by more social visits FGDs
Asset ownership, land value, land prices No changes FGDs/MTAD database
Agricultural activity and productionIncrease in scale of cattle farming and some tendency of switchover from land cultivation to cattle farming. No changes in production
FGDs
Access to markets and expanded consump-tion base
Perceived expansion of markets available and costum-ers FGDs
HealthIncrease in potential access reported. Increase in utilization of preschool education and access to early childhood development centers
FGDsEducation/primary and secondary tertiary
Access to preschools/early childhood
Changes in availability of government, NGO, and extension services Only in some communities FGDs
Gender empowerment, employment No perceived change FGDs
Service utilization rates by the elderly No perceived change FGDs
Change in business investment and enter-prise environment
Improvement as measured by increase in business activities in the assessment period
KIIs with SMEs
Increased turnover, number of employees Improvement but highly variable in all surveyed SMEs KIIs with SMEs
Nighttime lights analysis
Increase in per capita luminosity gap of 6.5 percent against comparable communities and 2 percent against all rural communities. Increase in luminosity per capita in 21 of 25 communities, whereas four communities saw a decrease. Results are not statistically significant
NTL/DMSP and multiple sources for population data
EXECUTIVE SUMMARY

VII
Limitations of the Findings
This study attempts to shed light on the linkages between transport and poverty in Armenia. The research used a combination of qualitative and quantitative approaches. However, some limitations were faced. These include:
• Selection Bias: This is a potential concern in any evaluation or assessment (qualitative and quantitative) that makes use of control or comparison groups to represent the counterfactual. If the treatment and comparison groups are not identical, then observed differences in outcomes between the two groups may be due to factors other than the impact of the project. We cannot fully control for factors that are correlated with observed and unobserved local characteristics relevant for luminosity and electricity generation as opposed to better connectivity.
• Road Survey: The road survey used data collected through the RoadLabPro. While the application provides an indication of the underlying road parameters, it is not as accurate as more advanced road asset management equipment.
• MTAD Database: The community-level database has two limitations: (i) data is only available for the 2012-2015 period so the construction of a valid pre-project baseline was not possible, and (ii) the data is incomplete, varies significantly from one community to another, and is subject to measurement error.
• Qualitative Assessment: Qualitative approaches mainly focus on perceptions of outcomes and nature/contexts of changes with special emphasis on process rather than on outcomes. While the respondent base is broad and diverse ensuring that all participants were present at the time the LRIP project took place, the sample is not representative of the LRIP project for Armenia.
• Nighttime Lights Analysis: The nighttime lights analysis as presented in this draft report is subject to two important methodological limitations: (i) the control group of communities was initially identified in an impact evaluation conducted by MCC-Mathematica, which used the household as the unit of analysis to create a control group.6 This is an imperfect counterfactual as a matching exercise for the community is lacking. Hence, we cannot at this stage state with confidence that the control communities included in the NTL analysis were comparable at the baseline; and (ii) the analysis used DMSP satellite data which is only available until 2012 and hence no conclusive evidence can be made about the longer-term impacts of the LRIP projects on NTL.
Conclusions and Policy RecommendationsThis study has attempted to unveil the links between transport infrastructure and poverty in Armenia, first by constructing accessibility indices to identify spatial mismatches throughout the country and, second, by assessing the medium- and longer-term impacts of a World Bank-financed rural roads project. The study found that while the quality of rural roads in Armenia is better than in other countries in the region, there are regions in the country with as much as half of the roads in poor condition. While it is not yet known whether the correlation between better road infrastructure and lower poverty can be a result of agglomeration or other omitted factors, the findings do suggest that road quality may be negatively correlated with consumption-based poverty.
This study has also updated the RAI, which was first computed in Armenia in 2003, finding that in the 14-year period there was a non-trivial reduction in the proportion of rural dwellers with access to an all-weather road (from 80 percent to 66 percent), signaling the need to invest in road rehabilitation and maintenance. The market and service accessibility analysis showed that households in rural Armenia are not constrained in terms of “physical access” to market opportunities and services.
On the one hand, the discussions that took place as part of the qualitative assessment corroborate that rural roads are a structuring element in the daily mobility needs of the poor in rural Armenia.
6 While the selected comparable communities were chosen as part of a rigorous econometric analysis, which includ-ed propensity score matching methods to reweight the treatment and comparison road links such that they are more similar to each other on observable baseline characteristics, the unit of analysis for that study was the household.
EXECUTIVE SUMMARY

VIII
On the other hand, the study confirms that better rural roads are a necessary, but not sufficient, condition for improving welfare. Both the literature and the findings from the assessment suggest that the poor and very poor benefit primarily from the indirect impacts of road improvements.
These findings have implications for the way in which rural development strategies are designed and the actions, projects, and programs that they should include to tackle structural poverty problems that may go beyond enhanced accessibility and connectivity. These lessons pave the way for a more comprehensive and ambitious research agenda, not only in Armenia, but in the different countries and regions where the World Bank is financing rural roads infrastructure projects. While the study encountered data and methodological limitations, it gathered promising evidence of the positive impact that the LRIP had on communities. The processes and methodologies tested as part of this research provide some valuable lessons for development practitioners working on transport and poverty.
These lessons include the applicability of impact evaluation approaches for assessing transport project outcomes, an understanding of the theory of change linking transport interventions and other level outcomes, timing for data collection and evaluation window for different types of assessments, unbundling impacts of hard and soft infrastructure, and examining mobility patterns and how these can trigger economic changes.
This study contributes to the knowledge on transport and poverty by (a) providing the first comprehensive analysis on market accessibility and poverty in Armenia and the Europe and Central Asia (ECA) Region; (b) filling the gaps that had been left by prior impact studies on LRIP effects on household welfare; (c) employing remotely sensed open source data for the first time in rural roads projects to analyze the effect of a roads rehabilitation project on local economic development outcomes; and (d) drawing on the lessons learned from existing analytical work on transport and poverty to propose practical methodological considerations for future research on the subject. This study is unable to answer relevant questions about the impact of the LRIP in the absence of project-specific household and economic data to carry out an ex post impact evaluation. Future research in this area is hence crucial. It will be of relevance to develop a conceptual and empirical framework to sequence and coordinate transport projects with spatially differentiated priorities for regional and social development. Through the operationalization of such a framework, the development community will be better positioned to identify the series of policy reforms and programs best placed to enhance the welfare and local economic benefits of rural roads projects.
EXECUTIVE SUMMARY

1
1. In line with the World Bank’s overarching goals of eradicating extreme poverty by 2030 and raising the income growth of the bottom 40 percent of the welfare distribution, how can transport infrastructure and services provide development opportunities to the poorest? While economic growth lifted more than 660 million people out of poverty globally over the past 20 years, there are still 1 billion people who live in extreme poverty, of which half are in rural areas. About 14 percent of the Europe and Central Asia (ECA) Region’s population—more than 66 million people—live in poverty, including almost 19 million who live on less than US$ 2.50 a day, the extreme poverty line for the region. Although it is widely acknowledged that transport infrastructure and services can reduce poverty, there has been little systematic analysis or evidence on the causal chain through which rural roads affect the poor or the bottom 40 percent in the long term or which potential spillover economic effects a rural roads intervention targeting the most vulnerable populations may lead to at the community level.
2. Located at the crossroad of South Caucasus and Eurasia, Armenia is a landlocked and topographically challenged country, but a strategically important one for the macro-region. Since independence from the Soviet Union in 1991, the Republic of Armenia has been on a path of political and economic transition. While significant strides have been made in many respects, the Soviet legacy has presented challenges that have been difficult to overcome, particularly in regions outside of the capital city of Yerevan, which are home to over 60 percent of the Armenian population and 73 percent of the population under the poverty line (compared to 27 percent in Yerevan). Most households in rural areas of Armenia depend on subsistence agriculture and hence rely heavily on the network of tertiary roads (or lifeline roads7) to access social, economic, and employment opportunities. A well-connected transport network is critical for sustaining the livelihoods of the rural population, enabling economic activity in remote communities, and overall promoting shared prosperity.
3. In response to the global financial crisis in 2009, the Government of Armenia requested the World Bank’s financial support to rehabilitate part of the lifeline roads network with a US$ 76 million loan. The World Bank aided Armenia to fill this funding gap for the prioritized transport investments, while concomitantly supporting Armenia with small-scale infrastructure to generate increased employment through the Lifeline Roads Improvement Project (LRIP). Within eight months after the project became effective, about 150 km of lifeline roads were rehabilitated and by the end of the project, in 2013, 446 km had been intervened. Similarly, the project created about 40,000 person-months of temporary jobs, reduced travel times and transport costs by an average of 58 percent and 25 percent, respectively, and piloted a safe village program aimed at improving road safety.
4. The project included an impact assessment, which used data from the Integrated Living Conditions Survey (ILCS) that is administered by the National Statistics Service of the Republic of Armenia (NSSRA). The assessment aimed to unveil the relationship between the rural roads project and other measures of welfare. While comprehensive and ambitious, the impact evaluation could not find any conclusive empirical evidence of the LRIP’s welfare effects.
5. This study examines the impact of rural connectivity on poverty, access to basic services, and income in Armenia, a country which has found itself in a low-growth, low-investment nexus, with stalled poverty reduction. The report builds on existing analyses of rural transport, connectivity, poverty, and access, to improve knowledge of Armenia and develop innovative approaches to assess poverty and spatial disparities through the lens of accessibility and connectivity, and seeks to answer two key research questions:
• How do we characterize physical accessibility in Armenia and what are the main constraints for accessing markets and services?
• What have been the outcomes of World Bank-financed transport investments in Armenia on household welfare and local economic development?
6. This research uses a combination of qualitative and quantitative techniques to collect and analyze data on livelihood outcomes and economic activity at the community level. First, the qualitative analysis is based on beneficiary assessments8 carried out in 10 project communities across five marzes that benefited from the LRIP to examine household-level outcomes that might have materialized five to eight 7 Lifeline roads comprise the local roads and a portion of the republican roads, totaling around 4,000 km.8 Qualitative data collection mechanisms in this research included FGDs, in-depth interviews, direct observations, ladder of life exercise, and Community Score Cards (CSCs). More information is provided in Annex IV.
INTRODUCTION

2
years after the intervention was completed. Contrary to empirical research, qualitative methods may be used to gain an understanding of underlying reasons, opinions, and motivations that have resulted in specific outcomes and the extent to which the LRIP might have contributed. This assessment not only helps examine the impact of improving transport infrastructure, but also provides valuable information on how transportation investments can affect the livelihoods of women, exploring, for instance, whether there are differences in employment access and employment/production decisions by gender and changes in utilization of health and education services. Accordingly, the qualitative evaluation provides valuable policy advice to policy makers on how transport infrastructure and ancillary services can be tailored to the needs of the poorest and more vulnerable groups, and which complimentary interventions can be put in place to maximize the impact of rural roads projects.
7. Second, to address the challenge posed by the fact that traditional measures of gross domestic product (GDP) and employment are not available for project communities for the period before and after the intervention,9 the paper employs a rather novel indicator for calculating outcomes of rural transport interventions at the community level, namely, remotely sensing NTL density or luminosity. Since luminosity data capture human economic activity carried out during nighttime at considerably low levels of spatial disaggregation, an increasing number of studies have relied on this measure to approximate economic growth (Agnew et al. 2008; Alesina et al. 2004). The analysis compares the per capita luminosity levels of the project roads sample with those of a comparable sample with poor connectivity to define and hypothesize on the impact of road rehabilitation on economic activity at the community level. Comparative analysis and empirical estimation methodologies are used to understand and measure the potential impact of the LRIP. To the World Bank’s knowledge, this is the first rural roads intervention to use this methodology as an approximation of local economic development.
8. The questions surrounding poverty and transport are relatively new, although increasingly viewed as critical by low- and middle-income countries that are interested in investment “optimization” for maximum impact. By combining several analytical tools, innovative methods, and new data, and yielding results and reliable evidence, this study seeks to contribute to the body of knowledge on transport and poverty by filling a critical knowledge gap. Both the assessment of the LRIP and the accessibility analysis presented in this study should ultimately inform pro-poor actions, projects, and programs in rural transport, shedding light on how to prioritize feeder roads, thus enhancing livelihood improvements for the poor and bottom 40 percent in Armenia.
9. The rest of the report is structured as follows: Section 1 explains the evolution of selected social, economic, and demographic indicators for Armenia during the analysis period. Section 2 lays out the conceptual framework for operationalizing shared prosperity and poverty in rural transport operations. The framework understands shared prosperity as an effort to continuously expand the size of the pie and share it in such a way that the welfare of those with lower incomes expands more than the rest of the population, proportionally. This section presents transmission mechanisms linking rural transport operations to poverty and shared prosperity. Section 3 proposes a systematic but non-exhaustive collection of literature on rural road impact studies in low- and middle-income countries. While the evidence tends to demonstrate that transport infrastructure and services are strongly associated with a positive impact on poverty reduction for the rural areas served, the literature review acknowledges that the evidence is deeply contextual and cannot be extrapolated to all countries and interventions. Section 4 examines regional gaps in accessibility to markets and services which were computed with the use of the first GIS-based mapping platform of its kind in Armenia, and introduces the potential association between accessibility and poverty in Armenia. Section 5 characterizes key social and economic indicators in the project’s immediate area of influence to then summarize household-level outcomes obtained from a comprehensive qualitative analysis and community-level findings resulting from a nighttime lights analysis. Section 6 summarizes the lessons learnt and the directions for future research. The report concludes with policy implications from this research and directions for future analytical and operational work on transport and poverty in Armenia.
9 ILCS data for project and control communities is available for the years in which MCC carried out the impact evalua-tion (that is, 2007 and 2010/2011). However, the sampling frame used was only representative for the specific house-holds included in those survey years. The ILCS surveys did not include the same project communities and hence it was not possible to construct a panel to measure longer-term project outcomes. On the other hand, a community database is available for the 2012-2015 period and has been used to characterize project communities. It was not possible to obtain a baseline in the absence of pre-project data.
ITRODUCTION

3
Armenia: Evolution of Poverty, Economic, and Demographic Indicators10 10. Armenia is a lower-middle-income country with a gross national income (GNI) per capita (Atlas method) of US$ 3,760 in 2016. Armenia’s economy has grown by 3 percent per year on average since it gained independence in 1991, but the average masks large fluctuations. The country’s growth episode can be distinguished into five phases: (a) the period after independence (1991-1993) in which the economy contracted by half; (b) the transition phase (1999-2003) in which growth was driven by high productivity growth and rising exports; (c) the construction boom period (2003-2008), facilitated by the government’s campaign to actively encourage investments from Armenians living abroad into real estate in Armenia; (d) the period of a sharp economic contraction and post-crisis recovery (2009-2011), when the government responded to the collapse in economic activity by increasing public spending for the construction sector; and (e) the current phase, in which solid export growth and weak domestic demand, in combination with a recession in the Russian Federation, only allows for sluggish economic growth.
Table 2: Armenia’s Selected Economic Indicators 2009-2017Main Indicators 2009 2010 2011 2012 2013 2014 2015 2016
GDP (US$, billions) 8.6 9.4 10.0 10.6 11.12 11.61 10.53 10.75GDP (constant prices, annual % change) -14.1 2.1 4.7 7.1 3.3 3.6 3.0 3.2
Unemployment rate (% of the labor force) 18.7 19 18.4 17.3 16.2 17.6 17.034 16.759Poverty head count ratio at na-tional poverty lines (% of popula-tion)
34.1 35.8 35.0 32.4 32.0 30.0 29.8 n.a.
Rural poverty head count ratio at national poverty lines (% of population)
34.9 36.0 34.5 32.1 31.7 29.9 n.a. n.a.
Gini index 29.6 31.1 31.3 30.5 31.5 31.5 n.a. n.a.Source: International Monetary Fund (IMF) - World Economic Outlook Database. 2016.
11. During the 2000s, Armenia experienced significant poverty reduction, underpinned by robust economic growth of about 12 percent per year and well-targeted redistributive programs. However, the economic crisis in 2009 halted these gains in poverty reduction as growth slowed. In just two years, between 2009 and 2010, about a third of poverty reduction achieved in the preceding decade (1999 to 2008) was reversed. Poverty incidence rose from 27.6 percent in 2008 to 35.8 percent in 2010. Especially during the contraction of GDP in 2009 (minus 14.1 percent), the government’s counter-cyclical fiscal policy helped protect the poor and maintain jobs given that unemployment reached 19 percent between 2009 and 2010 and decreased to 16.2 percent between 2011 and 2013, mainly due to a decrease in labor force because of emigration. The Russian crisis of 2015 brought unemployment back to its peak in the aftermath of the global financial crisis, hovering at around 17 percent of the total active labor force by the end of 2015.
12. Emigration intensified after the crisis, but remittances slowed down. Over the last three years, emigration has intensified and led to demographic changes with implications for the labor market structure. Over the past 10 years, the population has decreased by 4.4 percent, while the share of the population under 16 years and above 65 years has increased. Such demographic changes have had a negative impact on growth, through a higher proportion of economic resources to be devoted to the young and the aging population and a negative effect on consumption. While growth in real GDP per capita strongly declined in 2009 because of the fall in the GDP, in the last three years it has slowed down mainly due to demographic changes. In addition, remittance flows precipitously declined in 2009 and started to decrease again because of the Russian crisis. The contraction of the Russian economy led to a fall of real
10 Data, analysis, and text produced by the World Bank’s Poverty Global Practice as part of Armenia’s Systematic Country Diagnostic 2017.
SECTION 1:COUNTRY CONTEXT

4
wages and job opportunities for migrants in Russia, which led to a decrease in remittance flows. Between 2014 and 2016, remittance flows fell from 19.7 percent of the GDP to 13.1 percent.
Figure 4: Unemployment Rate and Remittance Flows (Percentage of GDP) in Armenia
Source: International Monetary Fund (IMF) - World Economic Outlook Database. 2016.
13. The government responded to the sharp economic contraction by increasing public spending for the construction sector, including transportation. The World Bank provided support to small-scale infrastructure as a means of generating employment. One of the interventions to support the recovery and job creation plan was the LRIP, approved in 2009 and completed in 2013. The project targeted the rehabilitation of rural roads in Armenia and was also geared toward generating short-term employment opportunities in rural communities. This was done as a coping mechanism following the financial crisis to help farmers and small businesses more easily and safely access the markets at lower cost and to improve basic access to services. Despite this and other post-crisis measures to improve basic infrastructure services and create employment, poverty reduction has been modest and near stagnant since 2013, with moderate poverty only dropping to 29.8 percent, which is still above the pre-crisis level.
14. When analyzing poverty across three strata (rural, urban, and Yerevan), higher poverty rates are observed in secondary urban areas and rural areas over 2004-2015 (Figure 5). Since the financial crisis, poverty rates have declined across all three strata and indeed converged over time. Interestingly, only secondary urban areas managed to bring their poverty rate slightly below the pre-crisis level (34.4 percent in 2015 against 35.8 percent).
Figure 5: Poverty in Armenia, 2004-2014
Source: ILCS national data. All calculations are based on the upper national poverty line (2009 methodology).
because of emigration. The Russian crisis of 2015 brought unemployment back to its peak in the aftermath of the global financial crisis, hovering at around 17 percent of the total active labor force by the end of 2015.
12. Emigration intensified after the crisis, but remittances slowed down. Over the last three years, emigration has intensified and led to demographic changes with implications for the labor market structure. Over the past 10 years, the population has decreased by 4.4 percent, while the share of the population under 16 years and above 65 years has increased. Such demographic changes have had a negative impact on growth, through a higher proportion of economic resources to be devoted to the young and the aging population and a negative effect on consumption. While growth in real GDP per capita strongly declined in 2009 because of the fall in the GDP, in the last three years it has slowed down mainly due to demographic changes. In addition, remittance flows precipitously declined in 2009 and started to decrease again because of the Russian crisis. The contraction of the Russian economy led to a fall of real wages and job opportunities for migrants in Russia, which led to a decrease in remittance flows. Between 2014 and 2016, remittance flows fell from 19.7 percent of the GDP to 13.1 percent.
Figure 4: Unemployment Rate and Remittance Flows (Percentage of GDP) in Armenia
Source: International Monetary Fund (IMF) - World Economic Outlook Database. 2016.
13. The government responded to the sharp economic contraction by increasing public spending for the construction sector, including transportation. The World Bank provided support to small-scale infrastructure as a means of generating employment. One of the interventions to support the recovery and job creation plan was the LRIP, approved in 2009 and completed in 2013. The project targeted the rehabilitation of rural roads in Armenia and was also geared toward generating short-term employment opportunities in rural communities. This was done as a coping mechanism following the financial crisis to help farmers and small businesses more easily and safely access the markets at lower cost and to improve basic access to services. Despite this and other post-crisis measures to improve basic infrastructure services and create employment, poverty reduction has been modest and near stagnant since 2013, with moderate poverty only dropping to 29.8 percent, which is still above the pre-crisis level.
14. When analyzing poverty across three strata (rural, urban, and Yerevan), higher poverty rates are observed in secondary urban areas and rural areas over 2004-2015 (Figure 13). Since the financial crisis, poverty rates have declined across all three strata and indeed converged over time. Interestingly, only secondary urban areas managed to bring their poverty rate slightly below the pre-crisis level (34.4 percent in 2015 against 35.8 percent).
05
1015202530354045
2001 2003 2005 2007 2009 2011 2013 2015 2017
Unemployment Rate (Percent)
0
5
10
15
20
25
19951997199920012003200520072009201120132015
Remittance Flows (Percentage of GDP)
Figure 5: Poverty in Armenia, 2004-2014
Source: ILCS national data. All calculations are based on the upper national poverty line (2009 methodology).
Figure 6: Poverty Rate at the Marz Level (2015)
Source: ILCS national data. All calculations are based on the upper national poverty line (2009 methodology).
15. In addition to the temporal changes in poverty, spatially poverty rates differ significantly across marzes. Yerevan, Aragatsotn, Vayots Dzor, and Syunik all have poverty rates that are lower than 25 percent. The relatively low poverty rate of the capital city can be attributed to a large services sector. Syunik, the southernmost marz in Armenia, benefits from a thriving mining industry. Conversely, marzes in the northern and eastern parts of the country are the poorest. Poverty is particularly high in Shirak and Kotayk.
53.5
40.1
30.226.4 27.6
34.1 35.8 35 32.4 32 30 29.8
0
10
20
30
40
50
60
70
2004 2005 2006 2007 2008 2009 2010 2011 2012 2013 2014 2015rural areas other urban areas Yerevan national
SECTION 1

5
Figure 6: Poverty Rate at the Marz Level (2015)
Source: ILCS national data. All calculations are based on the upper national poverty line (2009 methodology).
15. In addition to the temporal changes in poverty, spatially poverty rates differ significantly across marzes. Yerevan, Aragatsotn, Vayots Dzor, and Syunik all have poverty rates that are lower than 25 percent. The relatively low poverty rate of the capital city can be attributed to a large services sector. Syunik, the southernmost marz in Armenia, benefits from a thriving mining industry. Conversely, marzes in the northern and eastern parts of the country are the poorest. Poverty is particularly high in Shirak and Kotayk.
16. The bottom 40 percent in Armenia shared in the period of economic growth that occurred before 2009, but have since enjoyed limited growth in consumption. Annualized consumption growth among the bottom 40 percent of the population distribution is considered to reflect the extent to which the group has shared in growth or prosperity. Before 2009, when the construction sector was booming and remittances grew sharply, Armenia’s bottom 40 percent enjoyed high growth rates of consumption. The 2009 contraction of the economy hit the bottom 40 percent hard; their consumption was reduced by 7.46 percent a year—a contraction worse than that seen for the total population.
17. Since 2009, the bottom 40 percent has averaged less than 1 percent of growth per year, making Armenia one of the worst performers among the lower- and upper-middle-income countries in ECA for which estimates are available. Except for Poland and the Slovak Republic, Armenia performed better than high-income ECA countries, which were significantly affected by the global economic crisis. Notably, it is only in the recent period that consumption growth among the rest of the population (“top 60 percent”) has exceeded that among the bottom 40 percent. Growth among this part of the population distribution has averaged just under 2 percent over the decade. Looking ahead, it is important to understand why consumption growth has been low for this group, given its relatively better human capital outcomes. Overall, this growth pattern of consumption left inequality, as measured by the Gini coefficient, virtually unchanged at 27.11
11 World Bank’s Systematic Country Diagnostic for Armenia 2017.
Figure 5: Poverty in Armenia, 2004-2014
Source: ILCS national data. All calculations are based on the upper national poverty line (2009 methodology).
Figure 6: Poverty Rate at the Marz Level (2015)
Source: ILCS national data. All calculations are based on the upper national poverty line (2009 methodology).
15. In addition to the temporal changes in poverty, spatially poverty rates differ significantly across marzes. Yerevan, Aragatsotn, Vayots Dzor, and Syunik all have poverty rates that are lower than 25 percent. The relatively low poverty rate of the capital city can be attributed to a large services sector. Syunik, the southernmost marz in Armenia, benefits from a thriving mining industry. Conversely, marzes in the northern and eastern parts of the country are the poorest. Poverty is particularly high in Shirak and Kotayk.
53.5
40.1
30.226.4 27.6
34.1 35.8 35 32.4 32 30 29.8
0
10
20
30
40
50
60
70
2004 2005 2006 2007 2008 2009 2010 2011 2012 2013 2014 2015rural areas other urban areas Yerevan national
16. The bottom 40 percent in Armenia shared in the period of economic growth that occurred before 2009, but have since enjoyed limited growth in consumption. Annualized consumption growth among the bottom 40 percent of the population distribution is considered to reflect the extent to which the group has shared in growth or prosperity. Before 2009, when the construction sector was booming and remittances grew sharply, Armenia’s bottom 40 percent enjoyed high growth rates of consumption. The 2009 contraction of the economy hit the bottom 40 percent hard; their consumption was reduced by 7.46 percent a year—a contraction worse than that seen for the total population.
17. Since 2009, the bottom 40 percent has averaged less than 1 percent of growth per year, making Armenia one of the worst performers among the lower- and upper-middle-income countries in ECA for which estimates are available. Except for Poland and the Slovak Republic, Armenia performed better than high-income ECA countries, which were significantly affected by the global economic crisis. Notably, it is only in the recent period that consumption growth among the rest of the population (“top 60 percent”) has exceeded that among the bottom 40 percent. Growth among this part of the population distribution has averaged just under 2 percent over the decade. Looking ahead, it is important to understand why consumption growth has been low for this group, given its relatively better human capital outcomes. Overall, this growth pattern of consumption left inequality, as measured by the Gini coefficient, virtually unchanged at 27.11
Figure 7: Shared Prosperity: Annualized Consumption Growth (2004-2014) (%) for Armenia and ECA Countries
Source: ECA Region harmonized consumption database (ECAPOV) (left panel). Global shared prosperity database (right panel).
Note: Shared prosperity measured by annualized consumption growth for the bottom 40 percent. This growth rate is compared with that of the total population.
11 World Bank’s Systematic Country Diagnostic for Armenia 2017.
3.34%
5.61%
1.49%
2.33%
1.61%
2.94%2.53%
2.42% 2.63%
2004-2015 2004-2009 2009-2015
Bottom 40 percent Top 60 percent All -8%
-6%
-4%
-2%
0%
2%
4%
6%
8%
10%
CZE
2007
-12
HRV
2009
-12 LT
U 20
07-1
2
POL 2
007-
12
SVN
2007
-12
KGZ
2009
-14
UKR
2009
-14
BGR
2007
-12
GEO
2009
-14
MKD
200
9-13
ROM
200
7-12
SRB
20
08-1
3
High income
Lowermiddleincome
Upper middle income
Bottom 40 All
SECTION 1

6
18. Despite positive consumption growth for all households and continued poverty reduction, a large share of the population continues to live below the poverty line or remains vulnerable to shocks. Pockets of poverty remain and sustainable poverty reduction is constrained by three dominant factors: (a) regional disparities between Yerevan, other urban areas, and rural areas remain high due to limited economic activity and lack of employment opportunities outside the capital city; (b) vulnerability to poverty persists and a large number of households are at risk of falling behind if aggregate or idiosyncratic shocks hit; and (c) nonmonetary measures of welfare highlight development gaps that link to inadequate housing conditions or inferior asset endowment.
19. Existing accessibility constraints to markets, services, and employment opportunities may be an important driver of poverty and the unbalanced growth observed in rural Armenia. The road network in the country is still constrained in both coverage and quality, and its condition is unsatisfactory in part due to lack of maintenance. Land connectivity obstacles are considered one of the main reasons for unequal development of the different regions of the country. Poor transport connectivity may affect the poor’s ability to find productive and durable employment, which in rural Armenia mostly consists of self-employment in agriculture (largely own-account and unpaid work). Raising the productive capacity of the working-age population and removing barriers to economic participation will be important to meet the human resource needs of a growing economy (World Bank 2017). Transport can serve a pervasive and crucial complementary role in meeting this goal.
Figure 7: Shared Prosperity: Annualized Consumption Growth (2004-2014) (%) for Armenia and ECA Countries
Source: ECA Region harmonized consumption database (ECAPOV) (left panel). Global shared prosperity database (right panel).
Note: Shared prosperity measured by annualized consumption growth for the bottom 40 percent. This growth rate is compared with that of the total population.
16. The bottom 40 percent in Armenia shared in the period of economic growth that occurred before 2009, but have since enjoyed limited growth in consumption. Annualized consumption growth among the bottom 40 percent of the population distribution is considered to reflect the extent to which the group has shared in growth or prosperity. Before 2009, when the construction sector was booming and remittances grew sharply, Armenia’s bottom 40 percent enjoyed high growth rates of consumption. The 2009 contraction of the economy hit the bottom 40 percent hard; their consumption was reduced by 7.46 percent a year—a contraction worse than that seen for the total population.
17. Since 2009, the bottom 40 percent has averaged less than 1 percent of growth per year, making Armenia one of the worst performers among the lower- and upper-middle-income countries in ECA for which estimates are available. Except for Poland and the Slovak Republic, Armenia performed better than high-income ECA countries, which were significantly affected by the global economic crisis. Notably, it is only in the recent period that consumption growth among the rest of the population (“top 60 percent”) has exceeded that among the bottom 40 percent. Growth among this part of the population distribution has averaged just under 2 percent over the decade. Looking ahead, it is important to understand why consumption growth has been low for this group, given its relatively better human capital outcomes. Overall, this growth pattern of consumption left inequality, as measured by the Gini coefficient, virtually unchanged at 27.11
Figure 7: Shared Prosperity: Annualized Consumption Growth (2004-2014) (%) for Armenia and ECA Countries
Source: ECA Region harmonized consumption database (ECAPOV) (left panel). Global shared prosperity database (right panel).
Note: Shared prosperity measured by annualized consumption growth for the bottom 40 percent. This growth rate is compared with that of the total population.
11 World Bank’s Systematic Country Diagnostic for Armenia 2017.
3.34%
5.61%
1.49%
2.33%
1.61%
2.94%2.53%
2.42% 2.63%
2004-2015 2004-2009 2009-2015
Bottom 40 percent Top 60 percent All -8%
-6%
-4%
-2%
0%
2%
4%
6%
8%
10%
CZE
2007
-12
HRV
2009
-12 LT
U 20
07-1
2
POL 2
007-
12
SVN
2007
-12
KGZ
2009
-14
UKR
2009
-14
BGR
2007
-12
GEO
2009
-14
MKD
200
9-13
ROM
200
7-12
SRB
20
08-1
3
High income
Lowermiddleincome
Upper middle income
Bottom 40 All
SECTION 1

7
20. Transport can play a transformative role in providing mobility and connectivity that eases one of the most binding constraints to economic development. Transport infrastructure improves access to social services including education and health, facilitates access to labor markets, and reduces geographic impediments to trade. For households that are chronically poor, functioning transport networks and affordable transport services make geographic remoteness less of a friction to income generation. For households that are currently disconnected from markets and basic services, improving transport can increase opportunities for additional income generation and further investment in human capital, which contributes to poor people’s ability to participate in inclusive economic growth.
21. Those objectives were already present in the World Bank’s 2011-2014 Transport Sector Strategy, which placed emphasis on incorporating poverty reduction and social equity into transport policy and planning analysis (including gender equity). They were also present in the urban transport strategy paper “Cities on the Move” (2002), which acknowledges how transport can contribute to poverty reduction both indirectly, through its impact on the city’s economy and hence on economic growth, and directly, through its impact on the daily needs of poor people. Moving forward, there is a need to devise a more systematic and comprehensive framework for better aligning transport-related outcomes with welfare outcomes in as much as this could help identify more integrated, win-win solutions that achieve a variety of social, economic, and environmental objectives of transport interventions and solutions.
22. This section presents a simple conceptual framework that can help us understand the multiple ways in which transport infrastructure projects affect household welfare on one hand and local economic development on the other. The framework conceptualizes, in a simple manner, the main transmission channels through which transportation infrastructure directly affects access and mobility, which in turn facilitate the very assets needed to improve a household’s income-generating capacity and hence maximize its welfare. The framework follows an asset-based approach that illustrates the dynamic decisions that households make when faced with increased physical access to the resources and services needed to maximize income and achieve an optimal consumption pattern.
Conceptualizing Household Welfare through a Transport Lens23. The “Asset Based Framework,” developed by Bussolo and Lopez-Calva (2014), illustrates how transport supports the accumulation, use, and return of assets12 and thereby influences the welfare of all households in a country. This framework suggests that in the short term the distribution of assets is a given, and variables such as the use of assets play a bigger role for household income growth (emphasizing the role of labor markets and firm activity). In the medium and long term, however, the level and distribution of assets and the returns from these assets, which reflect their productivity, will be the main drivers of income growth. The income and consumption possibilities of households are largely determined by the assets they possess, the intensity at which the assets are used, and the returns from the assets (Figure 8).
12 Assets include social and human capital as well as natural, physical, and financial capital.
SECTION 2:CONCEPTUAL FRAMEWORK

8
Figure 8: Conceptualizing Poverty and Transport through the Asset-Based Approach
Assets Intensity of Use Prices Transfers
Income generation capacity
Growth
A road corridor is a common property
asset. Transport
Infrastructure has direct and indirect
influence on the asset portfolio of poor/B40.
E.g. Transport enables human, physical,
social capital accumulation
Markets and Institutions
Reduction in transport costs have a feedback
effect in product and factor markets
E.g. Transport stimulates competition and decreases
distortions in prices –farmers receive higher
prices for their produce, consumers pay less,
employees earn higher wages
The state of transport infrastructure and
availability of public transport affects the returns to the use of
assets. E.g. Improving transport can reduce time spent in
low value added, high energy-consuming tasks thereby increasing
productive capacity
Adequate transport infrastructure and more affordable
transport services reduce transaction
costs for householdsE.g. Agents obtain cash transfers and remittances without spending extra time,
effort or money to acquire them
Transport has a direct claim on
households’ income generation capacity
in as much as it affects the capacity
to accumulate assets, use them intensively, and
obtain returns that are consistent with their productivity
Source: Adapted from Bussolo and Lopez-Calva 2014.
24. The asset-based framework helps us understand the transmission mechanisms through which improvements in mobility and accessibility can sustainably boost the incomes of the poor and bottom 40 percent. Improving transport infrastructures will have direct and indirect effects through the following channels:
• A consumption channel: Better transport infrastructure decreases the transport costs for final goods that are produced in other areas or abroad as well as for intermediate goods used for production. If lower transport costs are translated into lower final-user prices (for final consumers or producers), the production and consumption bundles are expected to improve.
• A trade channel: Lower transport costs and reduced delays when shipping to local, national, and international markets increase trade opportunities and can have positive effects on employment and wages.
• A labor market channel: Better transport can increase employment and the bundle of jobs from which to choose. It can reduce the travel time necessary to reach work places and give workers more opportunities. Workers have access to more job offers and firms have access to more potential workers. It improves the matching between workers and employers, and increases the quantity of labor and capital used efficiently.
• A human capital channel: Improving transport infrastructure improves access to basic services such as health and education services and helps individuals to own a better asset base.
• A land-use channel: Better infrastructure stimulates the rural economy by changing land-use patterns in a specific area. For farmers, more resistant or productive crops might be used. Land can also be reallocated from idle use to productive use, for other farmers, and for manufacturing or services firms.
SECTION 2

9
25. The magnitude and incidence for each of these channels depend on the nature of the transport project. Some channels are more relevant than others to understand the benefits of improved rural roads. In the short term, the most relevant channels are the consumption and human capital channels. However lower prices to increase households’ consumption bundles are observed if transport services also improve along the road projects. Better accessibility to basic services is a short-term benefit of improved roads whose benefits will have a long-term impact, too. However, such benefits also depend on the quality of transport services along these roads. In terms of jobs, short-term employment might increase directly during the construction and operations phases, while better trade connectivity would have mid-term benefits. Better connectivity may thus result in an increase in the demand for labor, which is the main and often the sole income-generating activity of the bottom 40 percent.
26. In the context of projects for rural roads, the other channels are expected to have lower effects. The national or international trade and labor market channels are more relevant for corridor, ports, and airport projects. Depending on the geographic reach and the labor market situation of the bottom 40 percent, increased trade is associated with economic growth that could open an additional source of income for the bottom 40 percent. The consumption and habitat channel may be activated more rapidly on an urban transport project. The construction of a metro line or a bus rapid transit may affect the spatial patterns of a given city influencing the job/housing balance to the benefit (or the detriment) of the poor. The introduction of a targeted transport subsidy shifts a household’s budget constraint outwards owing to a real reduction in the price of transport in relation to other goods and services. Hence, a lower fare for transport services unambiguously improves the household’s consumption possibilities allowing for (a) more trips and (b) more consumption of other goods.
27. Economic benefits from better access to transport networks and services are often locally concentrated but affect all groups of the income distribution.13 The asset-based framework helps us to understand the mechanisms through which a change in the economic structure affects each group of the population, and pay attention to the welfare of households in the bottom 40 percent of the welfare distribution. For instance, Ferreira (2010) argues that “growth, changes in poverty, and changes in inequality are simply different aggregations of information on the incidence of economic growth along the income distribution.” In this framework, the welfare gains from better access to transport networks and services differ between relatively poorer and richer households and have an intertemporal dimension. All households benefit from better access to markets and potentially lower prices and higher economic activity, even if the benefits might be uneven across households. For poor households, improved access to education and health services translates into further accumulation of human capital, which builds the foundation for higher incomes in the future. Higher returns to human capital are conditional on participating in the (labor) market and in the short term more likely to translate into higher incomes for relatively richer households that already own the right set of skills, such that transport enhances their productivity. However, in the longer term, the bottom of the welfare distribution catches up if transport allows them to improve their human capital endowment.
28. To test the theoretical postulates outlined earlier, this study develops an assessment matrix to capture short-, medium-, and long-term household-level outcomes that could be traced to the implementation of the LRIP and the transmission mechanisms that might explain these outcomes. In the absence of household-level data to trace longer-term impacts, the study relied on a series of largely qualitative research techniques to provide an initial approximation of how beneficiaries perceive the social and economic impacts of the project. Before assessing this further, it is important to understand how benefits translate at the community level, which is the main unit of focus for most of the quantitative analysis.
29. The next scale at which the potential poverty-reducing benefits of rural transport projects can be discerned is the community level. Through a reduction in transport costs, transport projects may result in increased commercial and industrial investments in communities near the rehabilitated roads. Reduced transportation costs might spur productive investment as investors take advantage of lower transaction costs and potentially generate employment as a result. The related outcomes that might be considered from rural roads projects are the number of industrial and commercial facilities at the community level that would benefit from a transport-induced effect (lower transactions costs) and a market-induced effect (higher demand for goods and services from local households through the processes outlined earlier).
13 A growing body of literature considers the network structure of transport. This approach argues that some commu-nities benefit from transport interventions because they change local connectivity whereby further away communities benefit from an improved global connectivity of the transport network.
SECTION 2

10
Higher concentration of industrial and commercial facilities and higher firm density may encourage other firms to relocate, resulting in scale economies and in the production of intermediate goods or differentiated products and agglomeration effects within and across industries. The combined impact could potentially lead to territorial development of lagging areas such as the ones usually targeted by rural roads projects. Transport is a necessary but not sufficient condition to develop these regions. Given the nature of the project, the focus remains on local benefits for communities. The transmission mechanisms linking transport and economic activity are illustrated in Figure 9.
Figure 9: Transmission Channels Linking Transport with Local Economic Activity
ImmediateResults
Road Construction/Rehabilitation Project
Reduction in Transport Cost Reduction in Time Savings
Short TermResults
Improvement in Access to Infrastructure
Increase in Vehicular Activity – Higher Mobility and Inter-regional Trips
Firm relocation/Increase in Industrial Activity
Higher Production and Transaction Levels (Commerce and Migration)
Medium TermResults
Labor Pooling/Agglomeration Economies/Local Spillovers
Increased Competitiveness and Economic Growth
Longer TermResults
Source: The World Bank’s elaboration.
30. Short-term benefits in transport infrastructure are expected to translate into long-term benefits for the economic activity through new entry of firms and increase in productive activity, either in agriculture or manufacturing. The determinants of the spatial distribution of the economic activity, industrial locations, have been studied (Fujita, Krugman, and Venables 2001). Infrastructure projects can have uneven spatial effects across communities. Such projects can raise the level of economic activity in the counties that they pass directly through, but draw the activity away from adjacent counties (Chandra and Thompson 2000). Lower transport costs can also have adverse effects on local communities. If firms that are initially located in a lagging region move to a more prosperous region or from the largely rural area to the city, then demand for local labor decreases, depressing wages and affecting household income. In the absence of local income-generating opportunities, individuals might choose to relocate, widening the demographic and income gap between the prosperous and lagging regions even further. Therefore, the direction and magnitude of local economy effects of transport projects is ultimately an empirical question.
31. Despite the positive impacts that transport infrastructure may bring to communities, these projects can have unintended consequences on the incentives to migrate, both at the top and bottom of the income distribution. For example, if rehabilitated roads made it easier for previously isolated inhabitants to permanently migrate in search of new opportunities in wealthier areas, this could change the socioeconomic composition of the communities. For those with access to vehicles or liquidity, improved transportation infrastructure is likely to induce outward migration, and these compositional changes could have a discernable impact on beneficiary communities through “brain drain” of the more skilled inhabitants or, conversely, through a net reduction in available agricultural labor force.
SECTION 2

11
32. This study focuses on the intermediate outcomes that could be traced to the implementation of the LRIP and the transmission mechanisms that might explain these outcomes. In the absence of household-level data to trace longer-term impacts, the study relied on a series of largely qualitative research techniques to provide an initial approximation of how beneficiaries perceive the social and economic impacts of the project; to collect data on differences of impacts of the project in low-income households and other vulnerable groups (women, elderly, and people with disabilities); to identify the opportunities that the project has brought to small and medium enterprises (SMEs) and the agricultural sector, particularly small-scale farmers, located in the area of influence; and to assess mobility, migration, social interaction, and other social behavior patterns and changes in them.
Table 3: Methodologies Used, Data Source, and Outcomes
Methodol-ogy Data Source Outcomes
Accessibility analysisRoad survey, geo-spatial (GIS)
Access to medical and university education services; access to nearby cities and towns for employment, shopping, or social purposes; access to preschool education and early child development centers
Qualitative assessment
Focus group dis-cussions (FGDs), key informant interviews (KIIs)
Intercommunity mobility; vehicular activity; availability and affordability of transport services; road safety; vehicle driving speeds; travel purposes; in-crease in income/consumption/social mobility/poverty; increase in employment (short term); increase in employment (long term); skills development/labor market placement; social capital; asset ownership, land value, land prices; agricultural activity and production; access to markets and expanded con-sumption base; health; education/primary and secondary tertiary; access to preschools/early childhood; increased turnover, number of employees; change in business investment and enterprise environment; changes in availability of government, NGO, and extension services; gender empowerment, employ-ment; service utilization rates by the elderly
Nighttime lights analy-sis (NTL)
Geo-referenced community level data base, DMSP
Luminosity per capita in rural communities
33. Having discussed the underlying theory of change that connects transport investments to poverty reduction and its transmission mechanisms, we now summarize evidence from the transport economics literature.
SECTION 2

12
Assessing the Effects of Transport Infrastructure Investments 34. Transport infrastructure is key to promoting growth and development. The broader objectives of policies can be to stimulate growth, to facilitate social inclusion, and to improve sustainability (Berg et al. 2017). Several approaches have been considered to look for the impact of transport investments. Infrastructure can be considered either a public good or a private good. At the macro level, the stock of infrastructure will enter countries’ production function at the macro level whereas it will affect prices and behaviors of workers and firms at the micro level. Overall, the literature points toward a positive effect of infrastructure development on income growth and distributive equity (Calderon and Serven 2014). Another paper relies on 88 countries spanning 40 years and estimates that the elasticity of output with respect to a synthetic infrastructure index (including roads, electricity, and telecommunications) ranges between 0.07 and 0.10 (Calderón, Moral-Benito, and Servén 2015). More recently, new research has focused on the impact of domestic infrastructure on firms’ opportunities, structural transformation, and a country’s participation in world markets. Different mechanisms have been studied. Infrastructure investment gives firms access to more and larger markets and has a pro-competitive effect by decreasing firms’ markups (Donaldson 2017; Donaldson and Hornbeck 2016). It affects economic development through the reallocation of resources away from subsistence agriculture and affects the location of economic activities across regions and between rural and urban zones (Gollin and Rogerson 2014). It also affects the areas that will benefit from integration with foreign markets (Cosar and Fajgelbaum 2016; Fajgelbaum and Redding 2014). Overall, most studies have focused on large highway or rail projects and their impact on economic aggregate outcomes. Much less has been done on rural roads projects and their impacts on access to opportunities and services for households.
35. Traditionally, the evaluation of rural roads projects has focused on user benefit analyses that compare indicators, such as the reduction in travel times or vehicle operating costs, before and after an intervention, the use of correlations, or the use of simulation models (Jacoby 2000). Looking at the wider economic benefits of transport, the literature has also focused on how poor transport can affect vulnerable groups through reduced trade, adverse labor market outcomes, poor education and health, and crime (Berg et al. 2017). Selected microeconomic studies have identified various impacts, such as connectivity, household income and expenditures (Khandker, Bakht, and Koolwal 2009; Khandker et al. 2009; Emran and Hou 2013), school attendance (Levy 2004), enrolment and school completion (Mu and van de Walle 2011), basic service availability (Broegaard 2011), and access to markets of inputs and outputs (Gannon and Liu 1997).
36. In Madagascar, lower transport costs have been shown to increase the income of remote households (Jacoby 2000). In rural China, better access to domestic and international markets have been found to improve per capita consumption and the livelihoods of the poor (Emran and Hou 2013). In Bangladesh, rural road investments have been found to reduce poverty through higher agricultural production, higher wages, lower input costs, and higher output prices (Khandker, Bakht, and Koolwal 2009). In Vietnam, the benefits from rural road improvements are greater in poor communities, where levels of initial market development are lower (Mu and van de Walle 2011). Interestingly, in line with economic geography models, road accessibility has an impact on population movements, by either reducing or increasing incentives to migrate (Fafchamps and Shilpi 2013; Castaing Gachassin 2013).
37. However, when considering differences across regions or households, several studies have pointed out that the distributional effects of infrastructure are not obvious. Factor mobility plays a big role in determining the distribution of economic benefits (Banerjee, Duflo, and Qian 2012). Indeed, increasing the access of rural regions to cities might cause productive capital and skilled labor to move from rural regions to cities over time. These rural areas might become absolute or relative losers compared to the cities or richer regions. China’s national trunk highway system has been shown to have led to a reduction in GDP growth among non-targeted peripheral counties (Faber 2014). It has also been argued that the expansion of motor road networks in the United States promoted large-scale suburbanization and left many cities without a viable economic model (Glaeser and Gottlieb 2009). ). In Vietnam, the benefits from rural road improvements are greater in poor communities, where levels of initial market development are lower (Mu and van de Walle 2011). Interestingly, in line with economic geography models, road accessibility has an impact on population movements, by either reducing or increasing incentives to migrate (Fafchamps and Shilpi 2013; Castaing Gachassin 2013).
SECTION 3:LITERATURE REVIEW ON RURAL TRANSPORT, POVERTY, ANDLOCAL ECONOMIC ACTIVITY

13
38. Several empirical methods have been developed to identify the causal effects of transport investments on economic outcomes. Recent papers have increasingly used the instrumental variables approach as an identification strategy. Instrumental variables such as the natural path instrumental variable to instrument for cost to market (Ali et al. 2017), the year in which a train was introduced in each district as a tool for accessing road infrastructure (Gibson and Rozelle 2003), or the construction of least-cost path spanning tree networks (Faber 2014) have been used, as have straight lines between important cities as instruments for the potentially endogenous location of infrastructure (Banerjee, Duflo, and Qian 2012) or exogenous variation based on historical maps of transport infrastructure (Baum-Snow et al. 2015). Using a quasi-experimental approach and a difference-in-differences estimator, a study in India found a link between an investment in roads and increased agricultural production and the use of fertilizers by small producers (Agarwal 2013). Another study in Sierra Leone used a regression discontinuity design by selecting the roads that were rehabilitated or improved. It concluded that the improvement of rural roads contributed to the reduction in local prices (Casuburi et al. 2013). Recent evidence from Indonesia (Gertler et al. 2015) exploits a two-stage budgeting process to construct an instrumental variable for road quality concluding that higher road network quality causes improvements in household consumption and income. More specifically, Gertler et al. 2015 find evidence of an occupational shift from agriculture into manufacturing and higher profits for those staying in agriculture. One caveat of interest for this paper is the existence of possible spatial sorting by households that can potentially bias results (Ali et al. 2017). Households sort themselves given some variables that might not be considered. This happens with migration, which is an issue for Armenia, particularly during the years of interest for this report.
39. Another approach that has been used to a lesser extent in the transport literature is qualitative studies which utilize semi-structured narrative interviews and participatory methods such as FGDs to arrive at simple historical, cross-sectional, and stratified comparisons between reported beneficiary outcomes and those of a comparison group. While these approaches, which use a simple “before-and-after” approach, may not pick up general trends over time, and the reported outcomes may not suffer from subjective bias, they nonetheless may be more successful in answering questions on specific preferences and behaviors of project beneficiaries in which quantitative studies would normally fall short. Simple comparisons were used to provide important qualitative insights on the effect of roads, particularly in the following studies: Hettige (2006), covering Indonesia, Sri Lanka, and the Philippines; Porter (1995) for Nigeria; and Levy et al. (1996) for Morocco. These qualitative assessments demonstrated that significant social benefits accrue to the poor from rural road investments, particularly in accessing outside services and market development.
Box 1: Short- and Long-Term Impact of Rural Transport Interventions: Evidence from World Bank-Financed Projects
The short-term impacts of transport interventions are relatively clear as transport costs and travel time can be reduced by improved road conditions. Similarly, rural transport interventions facilitate employment opportunities in the short term by potentially engaging the local workforce in construction and routine maintenance activities, as was the case with the Armenia LRIP, which created close to 40,000 jobs. Longer-term impacts such as increased profitability of firms, increased employment in the agriculture and non-agriculture sectors, and positive schooling and health outcomes are harder to discern. Where evidence is available, it tends to demonstrate that, in the long term, transport investments are pro-poor, meaning the gains are proportionately higher for the poor than for the nonpoor.
• For example, in both Vietnam and Bangladesh, the rehabilitation of rural roads projects resulted in the development of local markets and higher primary school completion rates.
• In the state of Tocantins, Brazil, a rural roads project led to increased school attendance, particularly among girls, and helped create agricultural jobs and increase household income in certain regions within the state of Tocantins.
• More recently and closer to the area of this study, the impact evaluation of the Secondary and Local Roads Project in Georgia found that the project had significant positive impacts on the households as well as on businesses located in the treatment settlements. Not only did most mobility and accessibility indicators improve, the data show that there was a significant decrease in crop production expenses for the whole sample as well as for the poor and bottom 40 groups of households in the treatment settlements as compared to the control settlements. Furthermore, the project also resulted in a significant decrease in crop production expenses owing to cheaper inputs and a positive change in non-agricultural income, though solely income from selling vehicles and savings.
SECTION 3

14
40. Although more and more studies are demonstrating some of the social and economic impacts of rural roads investments, evidence in the ECA Region is still very limited. The only existing evidence comes from Georgia and Armenia and three previous rural roads projects executed by each country’s road agencies with technical and financial support from the Millennium Challenge Corporation (MCC) and the World Bank. The results of these assessments, which are based on the use of quasi-experimental methods, did not reveal conclusive changes in the annual per capita income of beneficiary households, especially nonfarm income sources and health and education outcomes. The present analysis draws heavily on the existing knowledge provided by these regional studies, but also incorporates an innovative empirical design complemented by a qualitative design to unveil some of the longer-term outcomes for which traditional survey instruments cannot account.
Impact Evaluation Approaches41. When it comes to rigorous impact evaluations, examples of assessments of transport investments on poverty alleviation and other welfare measures are rare. Although multilateral lending in transport comprises 29 percent of all global assistance, only 0.4 percent of impact evaluations have had transport as a subject. The evaluations that are completed are typically carried out as part of a series of projects where the findings can be used in the design of follow-on projects. Clients are frequently unwilling to invest in monitoring and evaluation (M&E) in “one-off” projects, and since impact assessments are not a prerequisite for obtaining World Bank financing, clients do not have an incentive to allocate part of the loan/grant for M&E activities. Furthermore, executing agencies tend to lack the capacity and technical knowledge to conduct these assessments and validate the methodologies and results obtained. Hence, there tends to be little country ownership in the process, with most of the exercise usually carried out by a third party under World Bank supervision.
42. Moreover, most evaluated projects include multiple rural transport interventions, such as interventions on the market structure of the public transport sector or on the availability of transport services providers. The numerous confounding variables make it extremely difficult to directly tie transport investment to poverty alleviation. In addition, transport’s impact is often evaluated through intermediate results such as its impact on aggregate macroeconomic variables (productivity, investment, and employment) as well as other sectors (education, health, agriculture, and so on), but more rarely on poverty itself.
43. It is especially difficult to use randomization for impact evaluation methods on large infrastructure projects and urban transport projects. Transport projects, such as highways, railways, mass transit systems, ports, or airports, are not randomly placed. While rural roads projects usually compare sites that benefited from the intervention with comparable sites that did not benefit from the project (quasi-experimental methods such as propensity score matching, difference in differences, or regression discontinuity), these methods usually do not hold for larger infrastructure or urban transport projects due to the inability to properly identify a valid counterfactual. In the urban setting, a network, multivariate, multi-sectoral view is needed, greatly complicating any evaluation effort. As such, evaluators of corridor or urban transport projects are left only with ex ante tools to simulate impacts as opposed to estimating a causal impact of the road rehabilitation on outcomes of interest.
44. In some other cases, the sampling plans and data collection instruments used may impede the execution of a robust impact assessment. Household surveys conducted by the national statistics agencies are usually unreliable for two key reasons: (a) the data collected are usually not representative at the level of analysis needed for assessing the impact of a transport project and (b) the surveys do not collect project specific relevant information. Data quality from household surveys can also be a problem. Transport questions are typically just added on to an ongoing or existing survey and survey evaluators are not trained on these questions. The collected data are, therefore, unreliable. Even when household budget surveys are available for various years, they do not contain transport sections that are critical for analyzing the travel patterns of the poor and how these have evolved over time. Given these constraints, it has been rather difficult to find comprehensive evaluations that employ project-specific instruments and isolate project effects.
45. This study will assess the LRIP’s outcomes on both the community and the household over the short, medium, and long term. However, due to some of the methodological and data constraints outlined earlier, the possibility of carrying out an impact evaluation of the LRIP with a follow-up survey to quantitatively capture longer-term effects was not viable mostly due to sample representativeness of the instrument used for the baseline survey (ILCS). Thus, the quantitative analysis for this assessment drops the household as the unit of analysis to focus instead on the potential local economic impacts of rehabilitated rural roads at the community level, while the qualitative analysis examines household-level outcomes in a five-to-eight-year time frame.
SECTION 3

15
Using Satellite Imagery as a Proxy for Local Economic Activity46. Traditionally, economic activity is measured by conventional methods such as GDP or household-level income or expenditure. Unfortunately, these measures are not available in Armenia at the community level for the timespan of concern. Therefore, economic activity is proxied using an increasingly popular method, NTL density data. Two important advantages of the light data are that they have a high spatial resolution and are independent of countries’ statistical procedures. The consumption of most goods and different types of production after nightfall requires the use of light. NTL data capture both indoor and outdoor use of light and, consequently, the accompanying consumption and production patterns. Higher production, income, and consumption should translate into higher NTL usage per capita, which is captured in the NTL analysis (Corral et al. 2016). It is often difficult to assess the economic benefits of rehabilitative infrastructure projects; hence, this analysis employs an innovative approach by relying mainly on remotely sensed NTL data.
47. Growth in light at night measured by weather satellites has been shown to be a good proxy for income growth (Henderson 2012). Researchers have found positive correlations across countries between NTL data and several socioeconomic variables such as electricity consumption, degree of electrification, CO2 emissions, GDP, GDP per capita, urban population, total population, and the incidence of poverty (Ghosh et al. 2013; Huang et al. 2014; Addison and Stewart 2015). Some correlations are stronger than others. NTL data have been shown to be well correlated with GDP, electricity consumption, and the stock of physical capital (buildings, infrastructure, and vehicles). In particular, they are well correlated with buildings in rural areas (Akiyama 2012).
48. Authors of numerous recent studies have used luminosity data as a substitute for GDP, such as Storeygard (2013), who examined the impact of transport costs on urban economic activity, proxied by NTL data, in sub-Saharan Africa. Alesina et al. (2004) employed luminosity data and historic location data to build an index of ethnic income inequality. Agnew et al. (2008) analyzed intracity economic development defined as NTL usage to measure levels of violence and quality of life in Baghdad during the U.S. military operation. To evaluate the impact of transport projects, this method has been used to proxy subnational administrative units, such as districts in India, to evaluate the impact of the Country´s Golder Quadrilateral, as its system of highways is called (Alder 2017) and to proxy local activities for cities in China (Baum-Snow et al. 2015). In all cases, the authors take advantage of NTL data in situations where conventional measures of economic activity are not available in low levels of spatial disaggregation.
49. As with any measure, NTL data have several shortcomings. First, the light intensity is top-coded for very bright pixels, such that growth may be underestimated for dense city centers. This caveat is minimized for this study, the focus of which is on rural roads. However, changes in NTL intensity in rural communities are smaller relative to urban regions, making it more difficult to capture. A second caveat is that light emissions depend on the electricity network. Some authors have expressed concerns about using NTLs for growth inside regions or countries (Elvidge et al. 2014; Bickenbach et al. 2016). The relation between the two is unstable for India, Brazil, the United States, and Western Europe where regional data are of good quality (Bickenbach et al. 2016). Some of the correlations between GDP and NTLs may have been confounded by the efforts of some countries to install more efficient lighting. Controlling for the share of households with access to electricity is one solution (Alder 2017). The transport infrastructure itself also leads to light emissions (e.g., from traffic and street lights) that could potentially overstate income growth generated by the road (Alder 2017). Finally, it misses improvements in economic activity or welfare that do not result in increased use of light measured through satellite imagery. Despite the challenges, an increasing number of examples from the literature have shown that NTL analysis does in fact capture economic activity.
50. In the next section, we focus on accessibility as a key objective for an efficient transportation system—that is to enable people to access opportunities in their proximate lieu of residence (both urban or rural) in a reasonable travel time.
SECTION 3

16
51. Empirical evidence reviewed in the previous section demonstrates how transport connectivity is an essential part of the enabling environment for inclusive and sustained growth. In many developing countries, a clear majority of farmers are disconnected from local, regional, and global markets. In the context of transport infrastructure, “accessibility” refers to the ease with which a person can have access to opportunities (e.g., markets, employment, health services or education) for a given spatial distribution of options within both rural and urban settings, and with a given transportation infrastructure and public transport services. Substantively, lack of access is often closely correlated with poverty. Where poverty is predominantly a result of isolation from markets, services, and employment opportunities, it is not surprising to see a close correlation. Indeed, one of the Sustainable Development Goals (SDG 9) has identified the importance of resilient infrastructure in the promotion of inclusive and sustainable industrialization, for which Target 9.1 is to develop quality, reliable, sustainable and resilient infrastructure to support economic development and human well-being with a focus on affordable and equitable access for all. It is hence useful to construct an index to better understand the relationship between poverty incidence and market and service accessibility.
52. This section presents the results of the first countrywide road survey ever conducted in Armenia14 as a means of using a lens of accessibility to examine the trends in spatial development. Using existing spatial data that provide a snapshot of accessibility, population distribution, and service availability in the different districts of Armenia, the section develops indices of accessibility and connectivity for Armenia which could be used to inform future investments in the sector and elsewhere. At present, there is very scarce geo-referenced data of the road network on one hand, and population, demographic, economic, and service location indicators on the other. This exercise helped identify accessibility constraints, the adequacy in the spatial distribution of existing social services in the country, and areas where spatial mismatches exist to critically determine where resources could be directed in the future. Improved access to social services, infrastructure, and markets could then facilitate rural development and poverty alleviation.
A Snapshot of the Road Sector in Armenia
53. Armenia has a relatively well-developed road network, serving all areas of its economy, but road quality is still a matter of concern, particularly in rural areas. With an underdeveloped railway network, principally due to its difficult terrain, the road system is of vital importance for the development of the country. Most of the road network was built in the 1960s and 1970s. Most republican and local roads have deteriorated since independence. The roads linking villages to the main highways are often called “lifeline roads” in Armenia. They are vital for communities located dozens as well as hundreds of kilometers away from urban areas. With a significant part of them last rehabilitated in the Soviet era, the lifeline roads are in desperately poor conditions, effectively cutting off rural communities from the nearby towns and big cities. Most of freight and passenger transport is conducted by road. The classified road network is 7,700 km long with 1,400 km of interstate roads, 2,520 km of regional roads, and 3,780 km of local roads. Surface conditions of these roads vary from good to fair, and up to 84 percent of roads are paved. According to a countrywide road survey financed through this study,15 close to 41 percent of roads are in good or very 14The road survey was carried out between April and May of 2017 to avoid icy and snowy conditions and obtain a more accurate measure of the International Roughness Index (IRI). Because of inadequate snow-removal efforts in rural areas, accessibility is seriously curtailed in the winter. This issue figured prominently in the discussions with project beneficiaries and is documented in the qualitative assessment along with some policy recommendations.
15 The road survey was carried out in April-May 2017 and used the RoadLabPro application to georeferenced and road condition data of the entire road network of Armenia. The spring season was chosen to avoid icy and snowy conditions and obtain a more accurate measure of the IRI. While the application provides an indication of the under-
SECTION 4:ACCESSIBILITY ANALYSIS

17
good condition, 19 percent are in fair condition, and 40 percent are in poor or very poor condition, as measured by the International Roughness Index (IRI), which captures the quality of pavement condition.1616 Disparities are more acute between the primary road network and feeder roads, which link farmers to markets. While 83 percent of interstate roads are in good or very good condition evidencing the relative importance that the government places on the maintenance of the long-haul and inter-city networks, this figure is only 36 percent for secondary and tertiary roads. This compares favorably with other countries in the region such as Albania or Georgia where less than 20 percent of rural roads are in good condition, but still behind Macedonia and Serbia.
Figure 10: Distribution of Road Network by Condition Category
Source: Road Survey 2017.
54. While, in general, roads are in relatively good condition when compared to other countries with similar levels of income, at the province or marz level1717 there are significant disparities. The two marzes closest to Yerevan, Kotayk and Ararat, have the highest proportion of roads in good or very good condition with 92 percent and 87 percent, respectively. Conversely, Shirak and Syunik have the highest share of roads in poor or very poor condition for the country with 50 percent and 41 percent, respectively. The differences can be attributed partially to the different type of terrain in each of these marzes, and hence there is a need to make higher investments in maintenance activities. The next focus of the analysis is on indicators of road density for each of Armenia’s 10 marzes and Yerevan. Figure 11 shows that Armavir, Ararat, and Shirak have the lowest density of roads in good and very good condition per inhabitant, while Vayots Dzor and Syunik have the highest proportion of roads in good condition per capita. This is primarily explained by the fact that these two marzes are the least populated, but among the larger ones with an extensive road network. It would seem contradictory that Syunik, with its relatively low population, also has the highest proportion of roads in bad condition per inhabitant.
55. While informative for helping policy makers direct future investments in the road sector, using “proximity-based” measures such as road density and other indicators on availability of infrastructure does not provide the full picture of the adequacy of a road network for serving a given area or population group. To evaluate the true benefits of rural roads interventions, it is important to measure accessibility. That type of indicator offers the most comprehensive measure of transport impacts on access to employment and commercial opportunities, health, education, and other essential services of rural life, which are discussed in the following paragraphs.
lying road parameters, the measure is not as accurate as more advanced road asset management equipment. As follows, the results reported on road condition and the resulting speeds that were used for the accessibility analysis are approximate values. More information is included in Section 6. 16 Information on roughness ranges to establish road quality is presented in Section 6.17 Reported marz-level road condition indicators result specifically from the road segments for which the IRI could be tracked. Since RoadLabPro does not track IRI for intervals which are driven at less than 30 km/h, these are omitted from the analysis.
Most of freight and passenger transport is conducted by road. The classified road network is 7,700 km long with 1,400 km of interstate roads, 2,520 km of regional roads, and 3,780 km of local roads. Surface conditions of these roads vary from good to fair, and up to 84 percent of roads are paved. According to a countrywide road survey financed through this study,15 close to 41 percent of roads are in good or very good condition, 19 percent are in fair condition, and 40 percent are in poor or very poor condition, as measured by the International Roughness Index (IRI), which captures the quality of pavement condition.16 Disparities are more acute between the primary road network and feeder roads, which link farmers to markets. While 83 percent of interstate roads are in good or very good condition evidencing the relative importance that the government places on the maintenance of the long-haul and inter-city networks, this figure is only 36 percent for secondary and tertiary roads. This compares favorably with other countries in the region such as Albania or Georgia where less than 20 percent of rural roads are in good condition, but still behind Macedonia and Serbia.
Figure 10: Distribution of Road Network by Condition Category
Source: Road Survey 2017.
54. While, in general, roads are in relatively good condition when compared to other countries with similar levels of income, at the province or marz level17 there are significant disparities. The two marzes closest to Yerevan, Kotayk and Ararat, have the highest proportion of roads in good or very good condition with 92 percent and 87 percent, respectively. Conversely, Shirak and Syunik have the highest share of roads in poor or very poor condition for the country with 50 percent and 41 percent, respectively. The differences can be attributed partially to the different type of terrain in each of these marzes, and hence there is a need to make higher investments in maintenance activities. The next focus of the analysis is on indicators of road density for each of Armenia’s 10 marzes and Yerevan. Figure 11 shows that Armavir, Ararat, and Shirak have the lowest density of roads in good and very good condition per inhabitant, while Vayots Dzor and Syunik have the highest proportion of roads in good condition per capita. This is primarily explained by the fact that these two marzes are the least populated, but among
15 The road survey was carried out in April-May 2017 and used the RoadLabPro application to georeferenced and road condition data of the entire road network of Armenia. The spring season was chosen to avoid icy and snowy conditions and obtain a more accurate measure of the IRI. While the application provides an indication of the underlying road parameters, the measure is not as accurate as more advanced road asset management equipment. As follows, the results reported on road condition and the resulting speeds that were used for the accessibility analysis are approximate values. More information is included in Section 6. 16 Information on roughness ranges to establish road quality is presented in Section 6. 17 Reported marz-level road condition indicators result specifically from the road segments for which the IRI could be tracked. Since RoadLabPro does not track IRI for intervals which are driven at less than 30 km/h, these are omitted from the analysis.
11.6
29.519.0
23.0
7.0
Very good Good Fair
Poor Very poor
0%
20%
40%
60%
80%
100%
Very Good Good Fair
SECTION 4

18
Assessing Market and Service Accessibility as a Determinant of Welfare in Armenia56. Where poverty is predominantly a result of isolation from markets and services, it is not surprising to see a close correlation. It is hence useful to construct indices to better understand the spatial relationship between poverty incidence and market and service accessibility. Three indices are proposed: (a) Rural Accessibility Index (RAI), (b) Market Accessibility Index (MAI), and (c) Service Accessibility Index.
57. Before calculating the indices, it is important to first visualize the population distribution in the country in as much as this will shed light on the degree to which some regions may be more isolated than others. In Armenia’s population distribution map, high density can be seen around Yerevan where several large towns are located. High population density is also observed in and around Gyumri and Vanadzor, the country’s second- and third-largest cities, respectively. Armenia is more sparsely populated in the mountainous regions, west of Yerevan, and in the southern marzes of Vayots Dzor and Syunik.
Figure 13: Population Distribution in Armenia
Source: Landscan 2012 population data.Note: Depicts 913 communities; Yerevan is excluded.
Figure 12: Roads in Good and Very Good Condition per Area
Source: Road Survey 2017.
the larger ones with an extensive road network. It would seem contradictory that Syunik, with its relatively low population, also has the highest proportion of roads in bad condition per inhabitant.
Figure 11: Roads in Good and Very Good Condition per Inhabitant
Figure 12: Roads in Good and Very Good Condition per Area
Source: Road Survey 2017.
55. While informative for helping policy makers direct future investments in the road sector, using “proximity-based” measures such as road density and other indicators on availability of infrastructure does not provide the full picture of the adequacy of a road network for serving a given area or population group. To evaluate the true benefits of rural roads interventions, it is important to measure accessibility. That type of indicator offers the most comprehensive measure of transport impacts on access to employment and commercial opportunities, health, education, and other essential services of rural life, which are discussed in the following paragraphs.
Assessing Market and Service Accessibility as a Determinant of Welfare in Armenia
56. Where poverty is predominantly a result of isolation from markets and services, it is not surprising to see a close correlation. It is hence useful to construct indices to better understand the spatial relationship between poverty incidence and market and service accessibility. Three indices are proposed: (a) Rural Accessibility Index (RAI), (b) Market Accessibility Index (MAI), and (c) Service Accessibility Index. 57. Before calculating the indices, it is important to first visualize the population distribution in the country in as much as this will shed light on the degree to which some regions may be more isolated than others. In Armenia’s population distribution map, high density can be seen around Yerevan where several large towns are located. High population density is also observed in and around Gyumri and Vanadzor, the country’s second- and third-largest cities, respectively. Armenia is more sparsely populated in the mountainous regions, west of Yerevan, and in the southern marzes of Vayots Dzor and Syunik.
0
0.001
0.002
0.003
0.004
0.005
0.006
0.007
0
0.05
0.1
0.15
0.2
0.25
0.3
Figure 11: Roads in Good and Very Good Condition per Inhabitant
SECTION 4

19
Rural Accessibility Index
58. The RAI developed by Roberts et al. (2006) is one of the most important global development indicators in the transport sector and measures the proportion of people who have access to an all-season road within an approximate 2 km walking distance.
18 Given Armenia’s current road conditions, it is estimated that 66 percent of the rural population, or 1,190,000 people, are within 2 km of a road in good condition, while an additional 610,000 people do not have access to an all-weather road. The analysis demonstrated that Kotayk and Armavir Marz have the highest RAI and Gegharkunik Marz has the lowest RAI as illustrated in Figure 14.
Figure 14: RAI Map for Armenia and RAI by Marz 2017
59. This finding implies that there is a high degree of physical isolation for a nontrivial number of rural households in Armenia. The RAI provides a consistent basis for estimating the proportion of the rural population that has adequate access to the transport system (Roberts et al. 2006). While the country-wide RAI is high compared to other low- and middle-income countries, it is still lower than the 2003 estimate of 80 percent. This may be due to structural changes in the demographic distribution of Armenia and the way in which the RAI has been calculated for the selected period.
19 It is important to mention that the RAI by itself does not fully capture people’s access to opportunities and services. To this end, another set of indicators was constructed to illustrate the essential goal of transport and mobility, and the ease with which households can access markets, education, and health facilities.
Market Accessibility Index
60. Drawing on the methodology developed by Yoshida and Deichman (2009), an index is constructed to gauge connectivity-specific locations within the country in the larger cities in Armenia (Yerevan, Gyumri, and Vanadzor) and other smaller urban centers, while considering the population of the cities or other destinations of interest and the transportation facilities to reach them. In the absence of household surveys to measure countrywide access to urban centers, open source demographic data are used to assess the distribution of the population in Armenia (WorldPop
Source: World Bank’s calculations with road survey data 2017, WorldPop 2015.
Figure 14: RAI Map for Armenia and RAI by Marz 2017
Source: World Bank’s calculations with road survey data 2017, WorldPop 2015.
59. This finding implies that there is a high degree of physical isolation for a nontrivial number of rural households in Armenia. The RAI provides a consistent basis for estimating the proportion of the rural population that has adequate access to the transport system (Roberts et al. 2006). While the country-wide RAI is high compared to other low- and middle-income countries, it is still lower than the 2003 estimate of 80 percent. This may be due to structural changes in the demographic distribution of Armenia and the way in which the RAI has been calculated for the selected period.19 It is important to mention that the RAI by itself does not fully capture people’s access to opportunities and services. To this end, another set of indicators was constructed to illustrate the essential goal of transport and mobility, and the ease with which households can access markets, education, and health facilities.
Market Accessibility Index
60. Drawing on the methodology developed by Yoshida and Deichman (2009), an index is constructed to gauge connectivity-specific locations within the country in the larger cities in Armenia (Yerevan, Gyumri, and Vanadzor) and other smaller urban centers, while considering the population of the cities or other destinations of interest and the transportation facilities to reach them. In the absence of household
19 The 2003 RAI was based on household surveys that might not be representative at a lower level of desegregation, such as the community or the district. This new approach addresses this limitation by spatially combining (a) global population distribution data, (b) geo-referenced road alignment data, and (c) road condition data.
34.17
50.23
40.72
38.92
49.09
76.64
83.36
62.43
80.82
92.48
0 20 40 60 80 100
RAI, %
Armavir
Ararat
Shirak
Kotayk
Aragatsotn
Lori
Syunik
Tavush
18 Information on roughness ranges to establish road quality is presented in Section 6. Annex I contains additional information on how this indicator has been calculated.19 The 2003 RAI was based on household surveys that might not be representative at a lower level of desegregation, such as the community or the district. This new approach addresses this limitation by spatially combining (a) global population distribution data, (b) geo-referenced road alignment data, and (c) road condition data.
SECTION 4

20
2015) and linked to the data from the community database, which is available until 2015, and the geo-referenced database that was assembled through the 2017 road survey to derive the MAI.
20 For the purposes of this study, this index calculates total population in all the communities and towns of Armenia within a given threshold distance, inversely weighted by travel time from the origin. The index assumes that the benefit of access to an urban center increases with the population size of the center and declines with distance, travel time, or cost. The formula for constructing the accessibility index (Ii) is depicted as follows:
where, Sj is a size indicator at target j (e.g., population of large cities/towns), and Tij is the distance (or travel time) between origin i and target j. By varying α, the functional form of the impact of travel time on the potential accessibility can be changed. A high α implies that the influence of nearby cities diminishes very quickly, while a low α means that even cities and towns far away exert an influence on a location (Yoshida and Deichman 2009).21
61. The Geographic Information System (GIS) played a key role in constructing the MAI for Armenia. The index was calculated considering time intervals needed to reach the nearest town hall/city hall. A statistical analysis was performed using the zonal statistical tools and with the use of GIS. The actual speed values recorded during the road survey for each 100-m interval of the roads are used for calculations since they provide for more detailed and realistic assessment than using the constant speed values for each level of the roads.
62. Using the approach, the MAI was computed for the following:
• Time intervals needed to reach the nearest city hall of the three main cities in Armenia (Yerevan, Gyumri, and Vanadzor). These are cities with a population of over 50,000.
• Time intervals needed to reach the nearest city hall/town hall of the cities/towns with population over 15,000. There are 19 such towns in Armenia.
• Time intervals needed to reach the nearest city hall/town hall of the 30 largest cities/towns in Armenia (cities of approximately 10,000 people or more).
Figure 15: Travel Times to Yerevan, Gyumri, and Vanadzor Cities and Distribution of the Rural Population from the Point of Interest
Source: World Bank’s calculations with road survey data 2017, WorldPop 2015.
0.31 5.17
17.86
20.05
14.36
9.61
2.64
3.37
26.63
0-15
15-30
30-45
45-60
60-75
75-90
90-105
105-120
above 120
20 The MAI is defined as the travel time required for the population in a given area to reach a town, city, or any other high-density population center.21 The MAI as defined in this study is driven only by time and distance. It does not take into account important factors such as affordability, availability, and reliability of transport; availability of transport services on the supply side; and household income and purchasing power on the demand side.
SECTION 4

21
63. As can be seen from Figure 15, close to half of Armenia’s rural population lives in settlements situated within one hour of the country’s largest cities, indicating the economic reliance on the dominant cities and the country’s relatively compact size and dense demographic distribution. For over 25 percent of the population, a journey to the main cities takes over two hours, particularly in the southernmost marzes of Syunik and Vayots Dzor, where rural accessibility is unsurprisingly low compared to other marzes.
Figure 16: Average Travel Time to Towns with Population of over 15,000 and Distribution of Rural Population from the Point of Interest
Source: World Bank’s calculations with road survey data 2017, WorldPop 2015.
64. Figure 16: Average Travel Time to Towns with Population of over 15,000 and Distribution of Rural Population from the Point of Interest
65. shows that more than half of Armenia’s rural population is located within a 30-minute drive from a town of 15,000 people, demonstrating that the rural population is relatively well connected to the immediate towns where they are likely to sell their produce and buy inputs for production and consumer goods.
Figure 17: Average Travel Time to 30 Main Towns and Distribution of Rural Population from the Threshold
Source: World Bank’s calculations with road survey data 2017, WorldPop 2015.
66. Once again, the data suggest that close to 66 percent of the population is within 30 minutes of an intermediate city. While the isochrones maps tend to show that there are large areas with little accessibility, these are mostly inhabited by less than 1 percent of the population. Finally, Figure 18 depicts the MAI for the three population thresholds that have been computed.
49.82
17.27
10.57
3.754.23 2.711.44
3.31
6.90 0-15
15-30
30-45
45-60
60-75
75-90
90-105
105-120
above 120
60.95
5.54
0.32 0.24
6.88
20.67
0.291.423.69
0-15
15-30
30-45
45-60
60-75
75-90
90-105
105-120
above 120
SECTION 4

22
Figure 18: Distribution of Rural Population and Distance to Markets and Cities
Source: World Bank’s calculations with road survey data 2017, WorldPop 2015.
Service Accessibility Indicators
67. One final step of the analysis was to measure the average time it takes for the population to reach social services. To this end, the average travel time to health facilities
22 and schools 23 in the whole territory of Armenia was measured. The service accessibility maps and statistical analysis for each of the mentioned categories are presented in Figure 19.
Figure 19: Average Travel Times to the Closest Health Facilities and Distribution of the Population within Time Thresholds
56.30
42.17
1.45 0.08
0-15 15-30 30-45 over 45
Source: World Bank’s calculations with road survey data 2017, WorldPop 2015, Ministry of Healthcare.22 In this analysis, health facilities include hospitals, clinics, polyclinics, medical centers, and community ambulato-ries based on the data received from the National Institute of Health of the Ministry of Healthcare of Armenia and RoadLabPro geotags of the health facilities obtained during the field survey. Annex III provides additional maps and accessibility indicators unbundling different types of health facilities and calculating physicalaccess to universities.23 Education facilities include primary, secondary, and high schools based on the data received from the National Institute of Education of the Ministry of Education and Science of Armenia and RoadLabPro geotags of schools ob-tained during the field survey.
SECTION 4

23
Figure 20: Average Travel Times to the Closest Health Facility, by Marz
9.8
10.1
10.3
11.4
12.7
12.8
13.4
13.5
14.3
17.0
0.0 2.0 4.0 6.0 8.0 10.0 12.0 14.0 16.0 18.0
min
ShirakGegharkunikKotaykVayotz DzorLoriTavushArmavirAraratSyunikAragatsotn
Source: World Bank’s calculations with road survey data 2017, WorldPop 2015, Ministry of Health.
68. As shown in the figures above, geographic coverage of health facilities is almost universal in Armenia with at least one health post in almost every community. Shirak is the marz with the least health service availability, but even there, it takes on average 17 minutes to reach a primary health post.
Figure 21: Average Travel Times to the Closest School
Source: World Bank’s calculations with road survey data 2017, WorldPop 2015, Ministry of Education.
66.26
0.030.76
32.95
0-15 15-30 30-45 over 45
SECTION 4
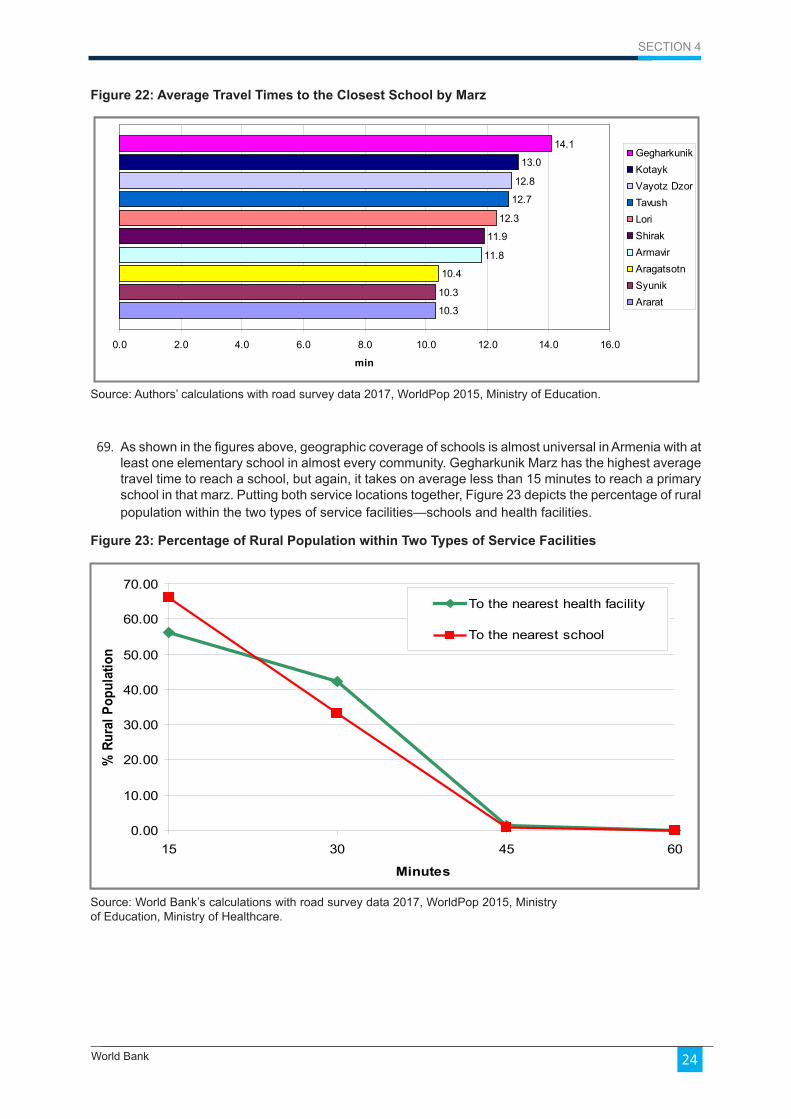
24
Figure 22: Average Travel Times to the Closest School by Marz
10.3
10.3
10.4
11.8
11.9
12.3
12.7
12.8
13.0
14.1
0.0 2.0 4.0 6.0 8.0 10.0 12.0 14.0 16.0
min
GegharkunikKotaykVayotz DzorTavushLoriShirakArmavirAragatsotnSyunikArarat
Source: Authors’ calculations with road survey data 2017, WorldPop 2015, Ministry of Education.
69. As shown in the figures above, geographic coverage of schools is almost universal in Armenia with at least one elementary school in almost every community. Gegharkunik Marz has the highest average travel time to reach a school, but again, it takes on average less than 15 minutes to reach a primary school in that marz. Putting both service locations together, Figure 23 depicts the percentage of rural population within the two types of service facilities—schools and health facilities.
Figure 23: Percentage of Rural Population within Two Types of Service Facilities
0.00
10.00
20.00
30.00
40.00
50.00
60.00
70.00
15 30 45 60
Minutes
% R
ural
Pop
ulat
ion
To the nearest health facility
To the nearest school
Source: World Bank’s calculations with road survey data 2017, WorldPop 2015, Ministry of Education, Ministry of Healthcare.
SECTION 4

25
The Spatial Relationship between Poverty, Road Condition, and Accessibility 70. We obtained, for the first time, geo-referenced data of the road network in Armenia and constructed accessibility indices. We take this analysis one step further and cross-reference the results with the most recent poverty data that the National Statistics Service of the Republic of Armenia (NSSRA) makes available through the ILCS, as a means of illustrating cross-regional differences between quality of road infrastructure, access, and poverty incidence in Armenia.
71. Using 2015 marz-level consumption poverty estimates and road data collected from the 2017 World Bank-financed road survey, we first explore the relationship between poverty and road quality. The marz-level analysis allows us to identify regions that are constrained by both poor-quality roads and high poverty. Shirak has the highest poverty rate as well as the highest proportion of roads in poor condition. Shirak is followed by Lori, which has the second-highest poverty rate among the marzes and the second-highest proportion of roads in poor quality. Both Shirak and Lori are quite populous and are noted for high poverty and low-quality roads. While the number of observations is low and there are some outliers, notably Kotayk, which has a high level of poverty incidence but a relatively high proportion of roads in good condition, this first approximation suggests that there may be a positive correlation between poverty rates and the proportion of roads in poor condition. We next develop a scatter plot of marz-level poverty and the RAI. The results show a significant amount of variation across marzes. While the correlation between the RAI and the poverty rate is not strong, the analysis suggests that there are marzes that exhibit high poverty and low rural accessibility, such as Gegharkunik, Tavush, and Lori. Further investigation is necessary to reveal the relationship between the RAI and poverty at lower levels of disaggregation, especially in districts and communities with higher poverty and lower rural accessibility. This preliminary analysis helps us identify the regions that could see substantial improvements through investments in rural transport infrastructure.
72. Next, we look at the relationship between market accessibility, defined in this example as percentage of the population located one hour from major towns, and poverty. The results show that there is considerable variation in market accessibility across marzes. Figure 24 shows that accessibility to towns of at least 15,000 people is lowest in Vayots Dzor, Lori, Tavush, and Gegharkunik. Notably, 100 percent of the population in Vayots Dzor lives more than one hour away from a town of 15,000 people and approximately 20 percent of the population lives more than two hours away. Vayots Dzor is the least populous marz in Armenia, accounting for 1.7 percent of the country’s population. On the other hand, 18 percent of all Armenians who live more than one hour away from a large town live in Vayots Dzor. Lori, Tavush, and Gegharkunik also have a sizeable share of the population that lives more than one hour away. In contrast, almost 100 percent of the population in Ararat, Kotayk, and Armavir can access a town of at least 15,000 in less than one hour. Most of the population in these marzes lives in or around the metropolitan areas of the capital Yerevan and large towns such as Abovyan and Vagharshapat.
Figure 24: Percentage of Population More than an Hour away from Large Town in Each Marz
Source: 2015 ILCS. World Bank’s calculations with road survey data 2017. WorldPop 2015.Note: Circles are sized by the number of people who live more than an hour away from a major town. Darker lines represent the median percentage of population more than one hour away from a large town and poverty rate.
SECTION 4

26
Interpretation of Findings73. The countrywide accessibility analysis provides some insight into the extent to which the rural poor are constrained in terms of physical access to opportunities. The results suggest that despite the relatively poor condition of rural roads in several regions of the country, most inhabitants have relatively good access to services and markets. This implies that while the quality of rural roads in Armenia is still a matter of concern, there does not seem to be a lack of market and service concentration as evidenced by a high degree of accessibility to high-density population centers, health posts, and schools.
74. The results presented in this section cannot be taken for year-round accessibility. As mentioned earlier, the road survey took place in spring when most of the road network was accessible. Accessibility can be seriously curtailed in winter, particularly in rural communities that depend on the lifeline road network, which does not get proper snow removal equipment. For instance, during winter, the roads in the north (Shirak and Lori Marzes) and in the south (Syunik) are closed for short periods due to insufficient snow cleaning machinery. Heavy snow and fog are common from the end of January to the beginning of February. The same applies to some mountainous regions such as Tavush and Syunik that are subject to landslides in the rainy seasons blocking access to some of the poorest communities.
75. An important take-way from this analysis is that while most of the population is within easy reach of markets and services, there is a small proportion of the population in Armenia (5 percent by our estimates) that may face significant barriers to access markets. If access to markets is difficult, farmers are unlikely to diversify their production to include cash crops, or even to grow net surpluses of subsistence staples. Remoteness is an aspect of poverty. Where communities are far from existing marketing centers, the dynamism of development is lessened considerably (ADB 2006). Securing last-mile connectivity by investing in rural transport infrastructure around these communities hence becomes a critical prerequisite for this segment of the population to access labor markets and information flows on one hand, and expand their consumption and production capacities on the other.
SECTION 4

27
76. The previous section characterized rural accessibility in Armenia. Georeferenced data generated for this study demonstrated that about one-sixth of the country’s roads are in bad or very bad condition and almost two-thirds of the population lacks access to an all-weather road. However, physical accessibility to opportunities does not seem to be a constraint. Over 94 percent of the population are within 45 minutes by road from the 30 largest cities, and schools and hospital facilities are widespread.
77. To validate some of the postulates that emerge from the accessibly analysis, the methodology used is to go one scale down to the project level and examine the LRIP to try to capture medium- and long-term effects other than the direct and quantifiable costs and benefits associated with this project. In this impact assessment, the following questions are addressed: (a) whether improved rural roads can stimulate local economies through increased private sector activity and (b) what are the long-term welfare and social impacts of rural roads projects on beneficiary households and on their access and use of social services and facilities.
Overview of the LRIP and Prior Research 78. The World Bank has been a leading supporter of the transport sector in Armenia, providing financing of close to US$ 250 million since 2009 for the rehabilitation of mainly tertiary and secondary roads in some of the most remote and poor areas of the country. In response to the global financial crisis in 2009, the Government of Armenia requested support from the World Bank on three fronts: (a) an SME credit line to support real sector activity; (b) budgetary support; and (c) urgent support for small-scale infrastructure to generate increased employment. The LRIP was part of this requested program and was set to reduce transport costs for rural communities, to generate short-term employment opportunities in rural communities as a coping mechanism following the financial crisis, to help farmers and small businesses access the markets easier and safer at a lower cost, and to improve basic access to services through the rehabilitation of roads. The LRIP attached great importance to creating direct employment for beneficiaries.
79. The LRIP roads were selected based on the following criteria: (a) having been identified as priorities in the MCC program, (b) being located in areas facing increasing unemployment, (c) having sufficient economic returns to justify the investment, and (d) showing readiness to be implemented rapidly. The project rehabilitated 446 km of rural roads, created close to 40,000 temporary jobs, reduced travel times and transport costs by an average of 58 percent and 25 percent, respectively, and piloted a safe village program aimed at improving road safety. Total financial assistance from the World Bank amounted to US$ 76 million, most of which was allocated to civil works and technical assistance to the Armenian Roads Department. In total, 89 road sections were rehabilitated under the program with an average length of 5 km, each rehabilitated in a period of six to eight months. The project was completed on December 31, 2013.
Figure 25: Time Line—Interventions and Data
Source: World Bank elaboration based on MCC-Mathematica Study (2014)
SECTION 5:EXAMINING THE RELATIONSHIP BETWEEN TRANSPORT, POVERTY, AND LOCAL ECONOMIC ACTIVITY: EVIDENCE FROM THE LRIP
Mathematica-MCC ImpactEvaluation Completed
Baseline: ILCS fielded baseline 2
17 Treatment Links rehabilitated
10 Treatment Links rehabilitated
ILCS Fielded Followup
2007 2009 2010 2011 2013
LRIP Project approved30 links
LRIP AF1 Project approved34 links
LRIP AF2 Project approved 25 links
Project Completed
LRIP Project Timeline
MCC-Mathematica IE Timeline

28
80. The LRIP included an impact evaluation,24 which used data from the ILCS, an annual, nationally representative household survey conducted by the NSSRA. The ILCS featured a larger sample of communities and a longer survey questionnaire from 2007 to 2011 to facilitate the originally designed LRIP evaluation.
81. The analysis compared the outcomes of communities served by the 27 road links that were initially built from 2007 to 2011 (treatment group) and the outcomes of communities served by the 29 other links that were in the initial plans, but were not ultimately rehabilitated (control group). The study included a sample of more than 50 communities and 2,300 households in each of the treatment and comparison groups, for a grand total of 109 communities (54 in treatment and 55 in comparison) and 4,888 households (2,328 in treatment and 2,560 in comparison). The study employed a difference-in-difference estimator to compare household-level outcomes in project communities against those of control communities.
82. Overall, the study found large impacts in several immediate and short-term outcomes but no evidence of impacts on medium- or longer-term outcome ( Table 4). The main findings are that there were no observed impacts on income and short-term employment within the time frame, but there was a significant and positive impact on poverty.
Table 4: Summary of Evidence from Mathematica-MCC Impact Evaluation
Outcomes in Program Logic Evidence Assessment
Immediate Improved road quality Strong evidence of large impacts (40 per-centage point increase in
favorability rating of regional roads)Reduced vehicle operating
costs
Strong indirect evidence of large impacts (19 percentage point
increase in approval for transportation ser-vices; 16 percentage point increase in use of roads for noncommercial purposes)
Reduced travel time
Nonpermanent employ-ment
linked to construction
No evidence
Short term Improved access to markets
and social infrastructure
Strong evidence of large impacts (20 per-centage point decrease
in market access difficulties)Increased vehicular activity
Strong evidence of large impacts (16 per-centage point increase in
use of roads for noncommercial purposes)
24 Fortson, Kenneth et al. Gonzalez, Randall, Blair Kathryn. “Evaluation of an MCC- and World Bank-Financed Rural Road Rehabilitation Project in Armenia.” Princeton: Mathematica Policy Research. Henceforth MCC-Mathe-matica Study 2014.
SECTION 5

29
Outcomes in Program Logic Evidence Assessment
Medium term Increased investment Limited evidence of small impacts (1.5 more sheep owned by
treatment households and US$ 30 in-crease in annual animalpurchases)
Increased employment No evidenceIncreased production Limited evidence that may be anomalous
(5 percentage point
increase in jam production, 18 kg increase in processed
vegetable production, but US$ 32 de-crease in egg sales)
Increased transactions No evidenceLong term Increased household
incomeNo evidence
Increased householdconsumption
No evidence
Reduced rural poverty Some evidence of increase in rural pov-erty; likely an anomaly dueto sample composition
Source: Mathematica-MCC (2014)
83. However, the very short time frame after the road rehabilitation (one or two years) and the analysis’ lack of statistical precision limit the relevance of the report’s medium- and long-term conclusions. Clear design limitations appear in the study. Systematic differences between communities from the treatment and the control groups, not explained by road rehabilitation, could affect the outcomes of the evaluation. In addition, insufficient pre-rehabilitation data does not allow to check for differences in pre-existing trends (e.g., for outcomes). For example, the global financial crisis took place during the treatment period and hit communities in a different way depending on their pre-crisis characteristics, which might affect the results of the previous evaluation and, indeed, of any prospective assessment which could not effectively control for this source of simultaneity bias.
84. The present research was motivated by these two studies and aims to fill the gaps it encountered by employing a combination of quantitative and qualitative empirical techniques that may trace outcomes in a longer evaluation window (2010-2017).
Characterizing the Area of Influence of the LRIP85. A brief characterization of the LRIP’s area of influence with some descriptive statistics reported in the community database produced by the Ministry of Territorial Administration and Development (MTAD) is detailed in the following paragraphs. The database, which is available for 2012 to 2015, covers all of Armenia’s 913 communities 25 and contains a rich set of indicators ranging from basic demographic information about the population in the communities of interest to economic, employment, land use, and service availability data. For this analysis, we provide a snapshot of some of the main indicators available for the 120 communities in nine of Armenia’s 10 marzes that are part of the LRIP area of influence and compare it with the average of all communities in Armenia for which data are available. Data that are available for 2015 are used the most. These communities together are home to 409,999 residents and 102,849 households. 25 Yerevan is the only agglomeration which is not included in the analysis, but other intermediate cities are included in the database. For this analysis, we exclude Gyumri, Armenia’s second-largest city, which is located in the area of influence, but has a different demographic profile than other communities in the sample.
SECTION 5

30
Figure 26: Map of the LRIP’s Project Roads and Demographic Distribution in Armenia
Source: NSSRA Census 2011, Road Survey, World Bank’s calculations.
86. Figure 26 summarizes selected demographic and social indicators as well as those related to service availability and condition of the settlement’s road network. As can be observed, the average number of households per community is 1,112 per community which is above the average of 642 households per settlement for Armenia. Migration trends in these communities are also in line with the average for the whole country. For instance, project communities have on average 39 labor migrants (seasonal) per 1,000 residents, while the average for Armenia is 46 per 1,000 residents. Other indicators such as retail points, vehicle ownership, and firm density also depict comparable values for both the project communities and all settlements in Armenia.
87. Demographic trends in project communities demonstrate a population decease since the mid-2000s. Though the MTAD database is only available for 2012 onwards, data from the MTAD database with marz-level population numbers from the ILCS and backcasted population estimates from 2004 to 2011 were combined. This calculation assumes that within-marz population shares of communities remain the same between 2004 and 2011 because it applies the annual marz-level rate of change from the ILCS to each community in the community database. According to the MTAD database, the population in project communities followed a similar trend with the country average and decreased by almost 5 percent from 2004 to 2015.
Figure 27: Annual Population Change in Armenia and Project Communities (2005-2015)
Source: MTAD database. World Bank staff calculations.Note: Data for Yerevan and Gyumri are not included. The population for 2004 to 2011 was backcasted by combining MTAD data with marz-level population numbers from the ILCS.
Figure 27: Annual Population Change in Armenia and Project Communities (2005-2015)
Source: MTAD database. World Bank staff calculations. Note: Data for Yerevan and Gyumri are not included. The population for 2004 to 2011 was backcasted by combining MTAD data with marz-level population numbers from the ILCS.
88. The employment structure and labor market outcomes in project communities are similar to those observed in the rest of rural Armenia. Close to four-fifths of the population are self-employed in the agricultural sector, while only 16 percent of the population is employed in manufacturing or the service sectors. Unemployment, at 13 percent, was lower in LRIP communities than the national average of 18 percent for the year for which data were available. In relation to transport-related parameters, the community-level data again shows similar figures for project communities and the rest of the country. With 145 and 141 cars per 1,000 population in project communities and in Armenia, respectively, vehicle ownership is in line with other countries in the region (155 in Georgia, 124 in Albania, and 155 in former Yugoslav Republic of Macedonia). When looking at average condition of intercommunal roads, the indicators show that, while similar in project communities and all of Armenia, both intra-communal roads and community highway roads in general rank low. However, in close connection to the findings from the accessibility analysis, the community-level data suggest that all communities are relatively close to different points of interest, as illustrated by Figure 28.
-8.5
-6.5
-4.5
-2.5
-0.5
1.5
3.5
2005 2006 2007 2008 2009 2010 2011 2012 2013 2014 2015
All Communities Project Communities
SECTION 5

31
88. The employment structure and labor market outcomes in project communities are similar to those observed in the rest of rural Armenia. Close to four-fifths of the population are self-employed in the agricultural sector, while only 16 percent of the population is employed in manufacturing or the service sectors. Unemployment, at 13 percent, was lower in LRIP communities than the national average of 18 percent for the year for which data were available. In relation to transport-related parameters, the community-level data again shows similar figures for project communities and the rest of the country. With 145 and 141 cars per 1,000 population in project communities and in Armenia, respectively, vehicle ownership is in line with other countries in the region (155 in Georgia, 124 in Albania, and 155 in former Yugoslav Republic of Macedonia). When looking at average condition of intercommunal roads, the indicators show that, while similar in project communities and all of Armenia, both intra-communal roads and community highway roads in general rank low. However, in close connection to the findings from the accessibility analysis, the community-level data suggest that all communities are relatively close to different points of interest, as illustrated by Figure 28.
Figure 28: Average Distance in Minutes to Different Points of Interest LRIP Communities and Armenia (2015)
Source: MTAD database 2015.
Qualitative Analysis: Assessing the Long-term Outcomes of the LRIP from a Social and Poverty Perspective
89. After having characterized the LRIP’s area of influence with the use of recent community-level data, focus is on the project’s assessment and to try to validate the hypothesis that the LRIP might have resulted in positive welfare outcomes for beneficiary households in the 2009-2017 period. It is acknowledged that qualitative methods can achieve greater insight into the outcomes of the project that only take some time to materialize. Qualitative methods help gain greater insights into the outcomes of the project as well as a deeper understanding of underlying reasons, perceptions, and motivations that had resulted in specific outcomes and the extent to which the LRIP might have contributed to poverty alleviation, equity, and access to social services. In this regard, a qualitative approach can help unveil the impacts that might have been hard to measure or to observe only through quantitative data collection.
90. The qualitative assessment was conducted between April and June 2017 to retrospectively assess views, perceptions, expectations, and livelihood outcomes on different aspects of the beneficiaries for the LRIP’s selected project communities, which benefited from the LRIP materializing five to eight years after the intervention was completed. It helped examine not only the impact of improving the infrastructure, but also provided valuable information on how transportation investments can affect the livelihoods of women, exploring, for instance, whether there are differences in employment access and employment/production decisions by gender and changes in utilization of health and education services.
0.02.04.06.08.0
10.012.014.016.0
Preschool
Healthcare institution
PharmacyRetailer Shops/supermarkets
Retailer Market/trade Fairs
LRIP Communities
Armenia (Exc.Yerevan and Gyumri)
SECTION 5

32
Methodology and Assessment Matrix91. The qualitative research emphasized qualitative data collection mechanisms such as FGDs, in-depth interviews and key informant interviews (KIIs), direct observations, Community Score Cards (CSCs) with local authority leadership and beneficiary population and observational research, as well as desk reviews for secondary data generation and community profile development across 10 project and five comparison communities across five regions (Gegharkunik, Kotayk, Shirak, Syunik, and Tavush). The data collection was used by 30 FGDs with beneficiaries of treatment communities along with CSCs
26 and 30 semi-structured KIIs with representatives of other direct and indirect beneficiary entities and target groups both in project and in comparator communities. The assessment also included semi-structured interviews with nine SMEs located in project and comparator communities in different lines of business.
92. Drawing on the conceptual framework presented at the beginning of this study, by which transport infrastructure is seen as a means to accumulate the assets needed for a sustainable livelihood (Booth et. al 2000; Bussolo and Lopez-Calva 2014), an assessment matrix was developed to examine three sets of outcomes materializing through the transmission channels set out in the conceptual framework (e.g., consumption, human development, social, and land channels): (a) immediate outcomes related mostly to improvements in mobility and transport conditions; (b) intermediate outcomes associated with physical access to services and markets; and (c) broader welfare outcomes which are by definition indirect and relate to a household’s capacity to acquire and use assets, which in turn determine its income-generating capacity as illustrated by the asset-based model. Focus groups included men, women, and the elderly.
Sampling 93. When selecting the communities of interest for the qualitative analysis, three sets of indicators were used: (a) demographics (small and large communities), (b) income levels (relatively well-off versus poorer communities), and (c) proximity to large cities (far versus closer communities to Yerevan and other intermediate cities). The criteria considered were the proximity to the project sections and the communities in influence, population size, poverty, and economic activities, among others.
94. A multistage typological sample strategy was used to design the sample. In the first stage of selection, among the nine marzes of Armenia covered under the three components of LRIP, five were selected, considering the length of roads rehabilitated and the beneficiary population count across the marzes. The top five marzes, based on mentioned criteria and selected for the study, are presented in Table A5.1.
95. In the second stage, a selection of project communities was conducted. Two main criteria were used to stratify project communities within each region of Armenia to guarantee some degree of heterogeneity of information:
• Classification of community.27 Using different sources of statistical data to classify communities within each marz based on their size (as small/large communities) and income levels (relatively well-off versus poorer communities).28
• Proximity to large cities. Far versus closer communities to the regional center.
26 Among criteria for assessment in scorecards the following were used: state of the road, safety of the road, quality of maintenance activities. There were also some statements for assessment related to subjective perceptions of project outcomes. Basic criteria are the same for all target groups. However, there are some specific criteria used only in a defined set of tools. More details on the methodological approach for this assessment are presented in Annex II.27 Community is an urban or rural settlement based on the classification used by MTAD. In road section definitions,most of the communities are villages.28 For this purpose, different sources of data were used, such as sizes of population available at NSS, proximity to large cities available on online maps, income levels of communities available from other surveys conducted by a consultant with community-level identifiers possessed by the consultant.
SECTION 5

33
96. In the third stage, five comparable communities were selected from the list of control communities included in the MCC-Mathematica study. As Mathematica’s sampling list was elaborated in 2013, some of the control communities have been included in other road rehabilitation projects and were identified as non-eligible for study purposes. Therefore, for each marz, one comparator community from the MCC-Mathematica study was selected and one reserve community, not covered under any road rehabilitation project, served as a standby in case of ineligibility of a community from the 2013 list for counterfactual purposes.29 The resulting list of communities is included in Annex V.
Participant Profile 97. Occupational Profile. Groups were diverse in employment status of participants (people engaged in agriculture, service, industry, unemployed, and so on). The KIIs in 10 project communities and in five comparator communities represented the following fields:
• Transport service providers and managers in the capital or a city near the project road (six in total);
• Community leaders or other community administration representatives (10 in project communities and five in comparator communities); and
• SMEs (nine in total in both comparator and project communities).
98. The most popular sectors of nonagricultural occupation among participants are different state-based institutions, such as community services (24.3 percent of total) and education (10.7 percent of total). Majority of participants (87 percent) were married and the average number of children under 18 was one per household.
99. Sample composition and household dynamics. The list of KIIs from transport service and SME sectors was prepared before the fieldwork in each region, based on information collected through observations and discussions with heads of communities. A total of 217 men and women participated in FGDs (of whom 105 or 48.4 percent were women, and 34.1 percent were labor migrants or a member of a family with a labor migrant), and 15 heads of communities, nine representatives of SMEs, and six representatives of transport service providers were interviewed.
100. Age and educational profile. The average number of participants per group was seven (at least six people participated in discussions and the maximum number of participants was 10). The average age of participants was 51 years; most of them had general secondary and secondary vocational education. Though around 73 percent of participants were actively involved in farming, around 65 percent had nonagricultural paid jobs.
Summary of Findings101. In this section, the main findings of the FGDs and KIIs30 are grouped in the three sets of household-level outcomes that can be traced to the road project we identified in the assessment matrix. Next, we explored if the project might have had a different impact on women, looking at gender-based differences and impacts on the elderly, who constitute up to 14 percent of the population in beneficiary communities. Since most of these results are perception-based and cannot be extrapolated to other contexts, they must be interpreted with some caution.
29 More details on sampling and methodology are presented in Annex V.30 The focus of the study was to capture the perception of road use and impacts from road rehabilitation by different segments of LRIP beneficiaries. However, other policy aspects requiring special attention were identified during the consultations with local village leaders and project beneficiaries. These included lack of adequate irrigation systems, absence of kindergartens, and poorly maintained intra-communal roads. The full list of revealed priorities is included in Annex V.
SECTION 5

34
102. The FGDs and KIIs confirmed that after rehabilitation works were completed there were changes in travel intensity, increase of transport services offered, and increase in frequency and available public transport services, particularly taxi services. Better roads also facilitated a greater flow of goods
produced outside the region and some changes in intrastate migration patterns. Similarly, more transitable roads might have contributed to additional social trips as people reported more visits to relatives in neighboring communities, who are living outside the village, and women were more frequently visiting their parents. This type of social travel may build up social capital, which is a common component of livelihood strategies. Owing to road rehabilitation activities, all beneficiary groups felt more mobile and integrated into regional decision making processes as they could afford regular travel to neighboring communities and the marz center administration and other respective bodies. On the other hand, the rehabilitated road did not lead to any other
changes in travel purposes, destinations, or use of public facilities. This finding is consistent with the project’s ex post economic analysis, which showed that traffic on LRIP increased by 5.6 percent from 2008 to 2013.
103. Analysis of the main population trends for treatment and control communities reveal two main tendencies: first, a decrease in the current population size in all regions, except Kotayk communities (which are all situated close to the capital city, Yerevan, and are more urbanized settlements with population occupied in state sector); and second, an increase in the number of long-term labor migrants.
104. Population declines are usually explained by external migration rates, which are very high across Armenia. Reported tendencies are the same for both project and comparison communities, which would normally suggest that the road rehabilitation project did not trigger outgoing migration and seasonal work abroad for the rural population. Some cross-checks of the situation in communities based on the current state of the roads also did not find any significant difference: in communities with good, bad, and very bad roads there was an increase in the number of outgoing labor migrants. This same tendency was observed during the FGD sessions, which showed that there was an increasing number of seasonal migrants in the villages and changes in income sources from agricultural production to remittances received from migrants outside Armenia. Migration and remittances are still viewed as one of major indicators of household welfare.
105. While gathering data on the number and types of transport services available for communities, it became clear that in six out of 10 project communities, positive changes in number and types of transport services available were observed, while in the remaining five comparison communities, no changes were reported. There were also differences in changes of frequency of public transport available, as evidenced by improvements in frequency of public transport serving seven out of 10 communities. Nevertheless, in the four comparison communities surveyed, there was no reported improvement in the transport frequency indicator. Hence, the positive change at least in these communities can be attributed to improved roads resulting from the LRIP. Finally, some project communities reported a fall in the fares paid for taxi services, though there is little data to validate whether public transport became more affordable following road rehabilitation. Though there was a decrease in costs for car repairs and travel times, there was no change in unit fees for public transport. This could be explained by a net reduction in the number of passengers due in part to outgoing migration, old transport means being used, and an increase in fuel prices.
Direct Outcomes—Mobility Patterns and Use of Transportation Services
“During the winter or when there are seasonal maintenance costs, this business is not profit-able at all... For example, if one day it snows a lot, in one night one mini-bus uses all the fuel it was supposed to use in an entire day... It’s very hard to plan the costs.”
— KII, Transport Department, Syunik
Source: Testimonies from project beneficiaries.
“Thanks to the road project, taxi prices decreased and people are able to call a taxi here. There is no taxi in our village, but there are many in Khashta-rak. Some people there drive their personal cars as taxi. If before it cost us 1,500 drams, now it is only 1,000.”
— FGD, Lusahovit Mixed 60+
“Now, it is easier to travel. If before drivers had to worry about car repairs and the wheels, now they don’t. This is about the health of people, their com-fort… The most important thing for us now is that one travels comfortably and is calm and relaxed.”
Source: Testimonies from project beneficiaries.
SECTION 5

35
106. One aspect where more effort could be directed, according to the FGDs, is winter maintenance. According to villagers in some of the regions most affected by heavy snow, such as Shirak, Tavush, and Syunik, at times the roads become completely blocked for days and even weeks and this significantly curtails their access to services and ability to undertake more intra-municipal trips.
107. The findings suggest that the status of both intra-communal and lifeline roads are a key determinant of road usage and people’s mobility. The better the link of a community to a rehabilitated road and the better the condition of intra-community roads, the more often people use the rehabilitated section. If intra-community roads are in poor condition or the rehabilitated road does not reach the community directly, people’s mobility, and hence their access to opportunities, could be hindered. In sum, the most important conclusion emerging from the FGD is that the beneficiary population identifies the lifeline roads as a structuring element in their daily mobility needs as it provides the main access to opportunities, but does not see a causal link between transport conditions and rural livelihoods.
Intermediate Outcomes—Access to Services, Markets, and Opportunities
108. Results from the FGDs showed that the project improved access to medical and university education services. Respondents reported that ambulances with qualified medical personnel and equipment could access communities faster and more reliably in the advent of an emergency. Perhaps more importantly, the FGDs revealed an increase in preschool education and access to early child development centers: in most of the targeted communities without an operating kindergarten there was an increase in preschool enrolment and intensity of attendance at kindergartens situated in neighboring communities and FGD participants attribute them to improved accessibility to nearby villages where these facilities are located.
109. Despite the changes in road use, transport, and mobility patterns outlined above, the FGDs and KIIs did not point to any changes in access to job opportunities and employment in off-farm sectors. In all 10 studied communities, respondents did not perceive having a lifeline road in bad condition as an obstacle to finding a job outside the community. While the rehabilitated road and improved travel conditions increased trips and in some cases even increased tourism, as the case of Lchashen in the Gegharkunik Marz illustrates (Box 2), in most of the surveyed communities the project did lead to a significant change in its overall access to off-farm employment opportunities. Unemployment was identified as one of the main challenges for both project and comparison communities. FGD participants said that they were eager to do any type of non-farming jobs, but that there were no employment opportunities in the rural area. This is explained by the very high original unemployment rate and relatively small number of off-farm jobs created by the private sector.
Before 2000, there was a kindergarten in our village. Now there isn’t. Neither is there music nor other clubs for chil-dren… Right now, several children are taken to Goris for high school, music, sports.”
— FGD, Hartashen, Women
“There is no kindergarten. We can take children to Khasht-arak. Some children attend karate classes there as well.”
— FGD, Lusahovit, Women
“We are now able to visit our relatives outside the com-munity more often. Yes, weddings, christenings, other do-mestic visits or simply to see anyone.”
— FGD, Nor Kyank, Women
Source: Testimonies from project beneficiaries.
SECTION 5

36
110. In the surveyed communities, temporary employment opportunities created by the project were not perceived as an outcome which could generate multiplier effects for the community. A small number of people from the local population participated in rehabilitation works and the opportunities were only temporary. No jobs were created out of on-project activities. Those who were recruited for the LRIP project did report acquiring skills or knowledge particularly in construction work technologies, but there was no structured learning attached to the public works activities. Box 3 describes the case of a community in the Shirak Marz. The consultations revealed that road investments would have been more sustainable had they been accompanied by skills training for construction workers and additional maintenance activities.
Box 2: A Tale of Two LRIP Communities (I): Lchashen, Gegharkunik
Context: Lchashen, a major village in Armenia’s Gegharkunik Province, dates back to the 3rd millennium BC. The village’s 13th-century church, Urartian Iron Age fortress, and Bronze Age cemetery could help attract tourism. Traditionally, the village’s inhabitants were mainly employed in nonagricultural jobs at nearby factories, which were closed after the collapse of the Soviet Union.
Outcomes: The rehabilitated road crosses the village, but only 1.7 km of the road has been rehabilitated within the LRIP. Nevertheless, both the local administration and the population are satisfied with the road section, arguing that before the project there was no asphalt lining at all and that the population was forced to travel through mud and stone holes, with accessibility being completely curtailed during inclement weather. Though road rehabilitation took place in 2009, quality and maintenance are considered adequate and the road is highly transitable. FGD participants outlined several positive changes along with improved travel times, including frequency and availability of transport services, access to social services (mostly health), increase in intercommunity mobility, and an increase in tourism. Owing to the project, the community is better connected to large cities such as Sevan. As a result, Lchashen has gained more visibility in the development projects designed by the marz administration. Cultural life in the community also improved largely due to the project because the municipal budget was allocated to other development projects. For example, in the post-project period the community established a large park with playgrounds for children and a cultural center with a number of dance and sport clubs for children and the elderly. Though both the village head and the FGD participants agreed that there are limited employment opportunities and did not see any increase in employment opportunities following the project, there was, however, an increase in the number of employees at a local milk production company (from five to 15) and in milk production in general. The owner of the company reported an increase in turnover of more than 200 percent, which was partially explained by the fall in transport costs and vehicle maintenance.
Supporting factors: Other complex development initiatives have been implemented in the community in parallel with road rehabilitation, including improvement of irrigation, watering of pastures, and deployment of new agricultural equipment. Another factor in Lchashen’s success is the participation of the beneficiary population in the preparatory stage of the LRIP in post-project road maintenance activities. Women have also been largely involved in road maintenance activities, regularly cleaning the road on a voluntary basis. The administration prohibited transportation of heavy vehicles and farming equipment on the rehabilitated section, using an alternative road to prevent deterioration of the road assets.
Box 3: A Tale of Two LRIP Communities (II): Panik, Shirak
Context: Panik is a small village in Shirak Marz. The village was affected by the earthquake of 1988. Agricultural activities are mainly centered on land cultivation. According to the village mayor, remittances are the predominant source of income for the population because the small amount of arable land is not enough to ensure adequate income. Low-income groups make up about 25-30 percent of the population. Though there is a school and a kindergarten in the community, cultural life is poor and links to cultural centers, the marz center, and the capital city are inadequate. The community was well known for its production of pears, but because of the lack of irrigation, it was never possible to scale up production and expand marketability of this good.
Outcomes: The rehabilitated road goes directly through the village, but according to both the village mayor and the population, the road is in bad shape. According to the mayor, this is a result of little investment and little participation by the community in maintenance activities. There were four FGD participants who participated in road rehabilitation works, but they complained about the scarce training that they received at the onset of the project. One of the key grievances was that the project did not enable them to obtain other job opportunities following the reconstruction. As such, they recommended that these projects should include a strategy to ensure labor market insertion following the short period of public works.
SECTION 5

37
Broader Welfare Outcomes for Households
111. Besides changes in road use, transport, and mobility patterns outlined above, open questions carried out as part of the FGDs and KIIs did not point to a strong evidence of impact on income, consumption, savings, investment, or employment. A noteworthy finding, however, was that while comparing communities with good and moderate roads with others (including comparison communities with roads in poor conditions), beneficiary households engaged in agriculture saw an increase in livestock holdings and changes in land-use patterns, as evidenced by an increase in the scale of cattle farming and some tendency for switchover from land cultivation to cattle farming. However, these findings only apply to some of the communities chosen for the qualitative assessment in the Gegharkunik and Syunik Marzes. According to FGD participants, this switchover happens because crop production is less profitable in comparison to cattle breeding. Factors such as high costs for inputs, seeds and seedlings, fertilizers, equipment, and so on, reduction of prices for sale of produce, high risk of seasonal disasters, inability to pay for agricultural credits, and increased access for milk processing companies to the communities were defined by respondents to explain the increase of animal breeding. Hence, animal husbandry and cattle breeding are the fields where the beneficiary population are more likely to invest savings received from reduction of costs related to road use and to increase scale of produce.
112. Following road construction, there was no additional incentive to invest in farming, particularly land cultivation, as it was not perceived by the rural population as a profitable source of income. Analysis of changes in sizes of land under cultivation and shares of households producing agricultural products for sale do not show a significant difference between comparison and project communities.
SME-level outcomes
113. The most notable positive changes in terms of welfare were not observed at the household level, but rather at the enterprise level. Discussions were held with representatives from different business sectors, including retail (small food stores), restaurants, wood processing, milk production, bakery, beverage production, and strawberry farming. Analysis of some official data received during the interviews show that in all SMEs selected in project communities there was an increase in yearly turnover, while in the five comparison communities where FGDs and KIIs took place, either the increase was very small (around 2-5 percent) or there was some reduction in yearly turnover. The same tendency was revealed for a number of registered workers at the SME. In project communities, there was an increase in the number of workers in the post-project period, while in all but one comparison community there was no change. This finding may be explained by several intervening factors occurring in the period of analysis. However, the qualitative research revealed that improved market access and lower transport costs were both decisive factors for the observed increase in SME profitability.
Impact on Vulnerable Groups: Women and the Elderly
114. Gender-based analysis of the data revealed that women used the road less frequently than men. Though analysis of gender-based differences does not reveal any change in women’s relationships with government bodies, the main purposes of travel for women were more related to daily household needs than to income-generating activities. Women complained about lack of workplaces, especially for young women with higher education. Most young wives were unemployed and, therefore, they were the ones using the roads less than
“We’re breeding cattle to produce more milk be-cause our main produce purchaser is the Tamara ice-cream factory. After the road rehabilitation pro-ject, everyone can transport his produce safely… Often their cisterns come to the village and take about 2-3 tons of milk. This is more profitable for our village… Another conveyance company from Marianna factory also sends a car here to take the milk produce every day at 7:30.”
—(Zar, KII VM)
Source: Testimonies from project beneficiaries.
“Now there is more milk production. While before there were only three cows, now on average there are five cows. This is because more milk processing companies purchase our milk due to the repaired road.”
— (FG, Zar, Women)
“We’ve established a union of cattle breeders. If there is more irrigation, the cows give more milk. If there is more milk, the cost of milk production goes down. People gain more profits. Therefore, they start buying more livestock.”
— (Lchashen, Women)
Source: Testimonies from project beneficiaries.
SECTION 5

38
others. No female drivers were found in any of the villages. In several communities, participants said that there were two to three young women who could drive, but it was not the norm for most rural inhabitants. Usually, women are dependent on men when it comes to the use of household’s personal cars. For shopping, medical services, and so on, women prefer using public transport or taxis where available. Female participants suffered more from unsafe roads as they relied on non-motorized transport for their daily mobility needs. Among positive changes for women, some male and female participants mentioned more access to shopping facilities and some primary consumption services. Another important change is reported in intercommunity mobility. More intensive and regular mobility between communities is reported among women. FGD participants said that in comparison to the pre-project period, women were more intensively visiting their parents/relatives out of the community. As already mentioned, in all targeted communities without an operating kindergarten
31 there was an increase of preschool enrolment and intensity of attedance at kindergartens situated in neighboring communities and regional centers. In most of the cases, due to clean and convenient roads, women were more eager to take the children to kindergartens situated in the neighborhood. In many cases, women began traveling more often to regional centers to take children for sports. However, women reported that walking with children was unsafe given the poor condition of sidewalks on both lifeline and intra-community roads.
115. Road rehabilitation could have improved the elderly’s access to medical care. However, the discussions revealed that this population group did not more frequently visit medical services. The elderly agreed that access to health centers improved, but they did not increase the use of these services due to other issues such as unaffordable health care. The elderly benefited from the project less than others because they are not mobile and rarely travel. In most of the cases, old respondents could not name direct economic outcomes from the project for themselves or their households. The elderly did not perceive the road as a socioeconomic resource to be used. For them, the road was something trivial, which had little in common with their everyday life.
116. The outcomes emerging from the qualitative research are summarized in Table 5.3219
31 Communities of Zar and Akunk in Kotayk Marz, Hartashen in Syunik Marz, and Lusahovit in Tavush Marz.32 Annex VI presents the outcomes in two similar villages that benefited from road rehabilitation; one experiencing success and the other one experiencing an unsuccessful outcome.
“Costs have fallen thanks to the rehabilitated road… Technically, the cars operate for a longer period of time. We’ve reached a turnover of ARM 12 million in the past three years by slowly cutting costs. We’ve opened an office in Yerevan. Sav-ings were made from reduced costs for car repair, fuel, and electricity. As a result of having an office in Yerevan, we don’t have to send produce several times a day, but collect it once and send it by car to the Yerevan office where we’ve got new freezers... While calculating costs for cars we’ve had before rehabilitation and now, the difference is huge—around million drams per month. Due to the road rehabilitation, I’ve got new investments and innova-tions. My business plan was presented to the prime minister and approved. Now we’re going to enlarge our activity… We have no challenges. Let us use the money we’ve saved and we’ll create economics and establish workplaces for people here.”
— KII, Gegarkunik, Lchashen, milk processing company) livestock (Lchashen, Women)
Source: Testimonies from project beneficiaries.
SECTION 5

39
Table 5: Summary of Household-Level Outcomes
117. It is important to note that qualitative approaches mainly focus on perceptions of outcomes and nature/contexts of changes with special emphasis on process rather than on outcomes. While the respondent base was broad and diverse, ensuring that all participants were present at the time the LRIP took place, the sample was not representative for the LRIP for Armenia. Similarly, the assessment was retrospective with no baseline data to make difference-in-difference analysis, which are more common in empirical analyses. Notwithstanding this limitation, the qualitative analysis suggests that the project was successful in improving mobility and accessibility, but less so in facilitating other high-level welfare and economic outcomes. The main take-way from the discussions was that for road rehabilitation projects to enhance household welfare and local economic development, it is critical to design and implement in parallel a sensible development plan that addresses the service and infrastructure gaps that are present within the community as well as the labor market and credit barriers that poor households need to overcome to escape poverty.
Nighttime Lights Analysis: Exploiting Luminosity Data to Measure Local Economic Activity118. The qualitative findings lend support to a hypothesis made in this paper: that service and market accessibility, while relevant, do not constitute the largest constraint for a sustainable livelihood of the rural population. In this line of reasoning, the role of increased mobility and accessibility will be limited if other necessary conditions that low-income households need to escape poverty are not met. Now we turn to the analysis of the LRIP to unveil community-level impacts and by exploring NTL analysis.
119. As mentioned before, the LRIP aimed to improve the market-exchange mechanisms and economic activity in rural communities by rehabilitating roads to reduce transports costs and improve access to services. Traditionally, economic activity is measured by conventional methods such as GDP or household-level income or expenditure. Unfortunately, these measures were not available in Armenia at the community level for the time span of concern. Therefore, economic activity is proxied using an increasingly popular method, NTL emission data. The consumption of most goods and different types of
SECTION 5

40
production after nightfall requires the use of light. NTL data2033 captures both indoor and outdoor use of light, and consequently the accompanying consumption and production patterns. Moreover, NTLs have been shown to be highly correlated with electricity consumption and the presence of physical capital. In Armenia, communities with improved road conditions should benefit from increased economic activity, which, in turn, should boost production, income, and consumption. These patterns, in turn, should translate into higher NTL usage per capita, which is captured in the NTL analysis (Corral et al. 2016). It is often difficult to assess the economic benefits of rehabilitative infrastructure projects; hence, this analysis employs an innovative approach by relying mainly on remotely-sensed NTL data.
120. As with any measure, the NTL data has shortcomings because it misses improvements in economic activity or welfare that do not result in increased use of light measured through satellite imagery. Examples of this nature can be agricultural production at a small scale or household light consumption in secluded areas. In addition, changes in NTL intensity in rural communities are smaller relative to urban regions making it more difficult to capture. However, despite the challenges, an increasing number of examples from the literature have shown that NTL analysis does in fact capture economic activity.
121. Numerous recent studies have used luminosity data as a substitute for GDP. Stoneygard (2013) examines the impact of transport costs on urban economic activity proxied by NTL data, in sub-Saharan Africa, while Alesina, La Ferrara, and National Bureau of Economic Research (2004) employ luminosity data and historic location data to build an index of ethnic income inequality. Additionally, Agnew et al. (2008) analyze intracity economic development defined as NTL usage to measure levels of violence and quality of life in Baghdad during the U.S. military operation. In all cases, the authors take advantage of NTL data in situations where conventional measures of economic activity are not available in low levels of spatial disaggregation.
122. In the case of Armenia, Figure 29 shows a positive relationship between NTL per capita and GDP per capita (2011 PPP). From 2004 to 2012, there is a 0.77 correlation between NTL per capita and GDP per capita. Over time, there is a negative relationship between NTL per capita and poverty with a correlation coefficient of -0.38, thus indicating a stronger relationship between NTL and GDP than NTL and poverty at the national level. Notably, the effect of the global financial crisis in 2008 is reflected with a reduction of GDP per capita and NTL per capita and an increase in poverty. Though Armenia’s NTL per capita rose steadily, the percentage of Armenia’s population with access to electricity remained close to 100 percent from 2004 to 2012, the same period during which the country’s population decreased slightly. Hence, the continued upward trend in NTL per capita may be due to increased presence of physical capital and greater electricity consumption rather than population growth or increased access to electricity.
Figure 29: GDP Per Capita, Poverty, and NTL Emission Per Capita in Armenia (2004-2012)
33 Night light intensity is represented in visible pixels with relative values ranging from 0 to 63, rather than absolute values in watts per m2.
Figure 29: GDP Per Capita, Poverty, and NTL Emission Per Capita in Armenia (2004-2012)
Source: World Bank (World Development Indicators [WDI]); Defense Meteorological Satellite Program (DMSP) NTLs; Armenia ILCS; World Bank Staff Calculations.
Description of Methodology and Specification Strategy
123. In this empirical assessment, we use the community as the main unit of analysis. Excluding the districts of Yerevan, there are 913 communities in Armenia which are classified into urban and rural settlements. Treatment communities were identified as communities with roads that were rehabilitated under the LRIP. The LRIP project roads were rehabilitated between 2009 and 2010. Thus, changes in luminosity can be seen from 2010 onwards in our treatment group, which initially contains all the project roads and communities that benefited from the LRIP. Due to NTL cross-spillage, communities within 5 km of Yerevan, the country’s largest and brightest city, were omitted from the treatment group. Communities which border bright areas in neighboring countries were also omitted from the treatment group. The resulting number of treatment communities was 151, of which 135 were rural and 16 were urban.34
124. An impact evaluation conducted by MCC-Mathematica initially identified the control group of communities. This study used the road segment as the unit of analysis and included the following three approaches:
• It included all road links that were considered for rehabilitation but not implemented;
• It dropped one road link with ex ante projected economic rate of return most dissimilar to the rehabilitated roads; and
• The propensity score model used in the Mathematica-MCC impact evaluation, which weighted treatment and comparison to be similar on observable baseline characteristics obtained through the ILCS data that was collected in preselected project communities before (2007-2008) and after the project (2011).
34 Using NTL data comes with certain limitations, one of which is the issue of cross-spillage from very bright areas into neighboring areas. Yerevan is the largest and brightest city in Armenia, and thus communities that are closest to Yerevan are prone to the effects of NTL cross-spillage. In addition to eliminating the effects of cross-spillage from communities that were within 5 km of the capital, all control communities within 2 km of the treatment communities were removed from the sample. Treatment communities were not as bright as Yerevan, and thus we determined that a minimum distance of 2 km would be appropriate.
0
0.01
0.02
0.03
0.04
0.05
0.06
0
1000
2000
3000
4000
5000
6000
7000
8000
2004 2005 2006 2007 2008 2009 2010 2011 2012
GDP Per Capita NTL Per Capita
0
10
20
30
40
50
60
0
0.01
0.02
0.03
0.04
0.05
0.06
2004 2005 2006 2007 2008 2009 2010 2011 2012
NTL Per Capita Poverty
Source: World Bank (World Development Indicators [WDI]); Defense Meteorological Satellite Program (DMSP) NTLs; Armenia ILCS; World Bank Staff Calculations.
SECTION 5

41
Description of Methodology and Specification Strategy123. In this empirical assessment, we use the community as the main unit of analysis. Excluding the districts of Yerevan, there are 913 communities in Armenia which are classified into urban and rural settlements. Treatment communities were identified as communities with roads that were rehabilitated under the LRIP. The LRIP project roads were rehabilitated between 2009 and 2010. Thus, changes in luminosity can be seen from 2010 onwards in our treatment group, which initially contains all the project roads and communities that benefited from the LRIP. Due to NTL cross-spillage, communities within 5 km of Yerevan, the country’s largest and brightest city, were omitted from the treatment group. Communities which border bright areas in neighboring countries were also omitted from the treatment group. The resulting number of treatment communities was 151, of which 135 were rural and 16 were urban.3421
124. An impact evaluation conducted by MCC-Mathematica initially identified the control group of communities. This study used the road segment as the unit of analysis and included the following three approaches:
• It included all road links that were considered for rehabilitation but not implemented;
• It dropped one road link with ex ante projected economic rate of return most dissimilar to the rehabilitated roads; and
• The propensity score model used in the Mathematica-MCC impact evaluation, which weighted treatment and comparison to be similar on observable baseline characteristics obtained through the ILCS data that was collected in preselected project communities before (2007-2008) and after the project (2011).
125. Just as in the treatment group, all control communities within 5 km of Yerevan and those which border bright areas in neighboring countries were eliminated to reduce cross-spillage. Additionally, all control communities which were within 2 km of a treatment community were removed to ensure that communities in the control group were not affected by luminosity cross-spillage from treatment communities. The resulting number of control communities was 74, of which 71 were rural and three were urban.
126. Since the level of light emission is positively correlated with the number of people in a given area, it is important to control for the population. Otherwise, the increase in light emissions might result from more people moving into a location and not through increased economic activity in per capita terms. Unfortunately, population information at the community level is not available in Armenia for the time span of the NTL analysis (2000-2015).
127. However, the MTAD’s community database does include population figures for almost all communities in its scope between 2012 and 2015. Combining this information with marz-level population numbers from the Armenian Household’s ILCS allows for back-casting until 2004. This process assumes that within-marz population shares of communities remain the same between 2011 and 2004 as it applies the annual marz-level rate of change from the ILCS to each community in the community database.
128. One additional challenge is the missing information for certain communities between 2012 and 2015 in the community database. If a community has one or two years of unavailable data, the missing observations are simply filled in by taking the trend from the years with the information. If three of the four available years are missing, the marz-level trend of that community is imputed to project the population. The database does not have any communities in which population figures are missing for all years. Using the community-level population data, the per capita luminosity is calculated by dividing the total luminosity in each community by the population. The per capita luminosity is used to observe trends over time between the treatment and control groups.
34 Using NTL data comes with certain limitations, one of which is the issue of cross-spillage from very bright areas into neighboring areas. Yerevan is the largest and brightest city in Armenia, and thus communities that are closest to Yerevan are prone to the effects of NTL cross-spillage. In addition to eliminating the effects of cross-spillage from communities that were within 5 km of the capital, all control communities within 2 km of the treatment communities were removed from the sample. Treatment communities were not as bright as Yerevan, and thus we determined that a minimum distance of 2 km would be appropriate.
SECTION 5

42
Structure of the Data 129. The remotely sensed NTL data used for the analysis is open source data, acquired from the National Oceanic and Atmospheric Administration’s Defense Meteorological Satellite Program (DMSP). The DMSP NTL data are available for 1992 to 2012. The luminosity data for each year from 2004 and 2012 was downloaded as raster data and imported into the ArcMap software. Using the zonal statistics tool in ArcMap, the total luminosity of each community in Armenia was extracted. It is important to note that the DMSP satellite data are not calibrated over time, making yearly comparisons difficult. Hence the inter-calibration technique was employed to make the data more comparable (Addison and Stewart 2015).
Evidence on Changes in NTL Per Capita 130. As previously established, there is a positive relationship between NTL emission per capita and GDP per capita at the country level. Hence, it is expected that a positive relationship exists between NTL per capita and economic outcomes at the community level. Figure 30 and Figure 31 show that most communities experienced some growth in NTL per capita between 2004 and 2012.
Figure 30: Map of NTL EmissionPer Capita 2004
131. It is hypothesized that the intervention of the LRIP allowed for increased economic growth and welfare outcomes in treated communities. From 2004 to 2012, treatment and control communities followed the general trend of the country’s average per capita luminosity, correlated at 0.99 and 0.98, respectively, over a specific time period. Nevertheless, after the intervention in 2010, there was a sharp divergence between treatment and control groups as treatment groups grew much faster in terms of luminosity per capita.
Figure 32: Trends in Luminosity Per Capita (2004-2012)
Source: DMSP NTL, MTAD, ILCS multiple years, World Bank’s calculations.Note: The post-intervention period is shaded in blue; this analysis does not include any of the districts in the city of Yerevan.
Figure 31: Map of NTL Emissions Per Capita 2012
Source: DMSP NTL, MTAD.Note: Yerevan is excluded.
Figure 30: Map of NTL Emission Per Capita 2004 Figure 31: Map of NTL Emissions Per Capita 2012
Source: DMSP NTL, MTAD. Note: Yerevan is excluded.
131. It is hypothesized that the intervention of the LRIP allowed for increased economic growth and welfare outcomes in treated communities. From 2004 to 2012, treatment and control communities followed the general trend of the country’s average per capita luminosity, correlated at 0.99 and 0.98, respectively, over a specific time period. Nevertheless, after the intervention in 2010, there was a sharp divergence between treatment and control groups as treatment groups grew much faster in terms of luminosity per capita.
Figure 32: Trends in Luminosity Per Capita (2004-2012)
Source: DMSP NTL, MTAD, ILCS multiple years, World Bank’s calculations. Note: The post-intervention period is shaded in blue; this analysis does not include any of the districts in the city of Yerevan. Figure 33: Luminosity Per Capita Gap (Treatment Value-Control Value) (2004-2012)
Source: DMSP NTL, MTAD, ILCS multiple years, World Bank’s calculations.
132. From 2004 to 2012, per capita luminosity in treatment communities grew by 98 percent while the national average was 114 percent. Control communities grew much faster with a 142 percent increase during the same time period. Hence, viewing the change over the entire time period would suggest that treatment communities experienced the slowest growth. However, the time period is considered as two parts: pre (2004-2009) and post (2010-2012) interventions. It is noticed that treatment communities began to grow faster after 2010. From 2010 to 2012, the period immediately following LRIP intervention, luminosity per capita in treatment communities rose by 42 percent, slightly outpacing both the national average and the control group, which grew at 40 percent and 35.5 percent, respectively. This is noteworthy because treatment communities had been lagging in terms of NTL per capita in the pre-intervention period.
0.015
0.025
0.035
0.045
0.055
2004 2005 2006 2007 2008 2009 2010 2011 2012
Treat NTLpc Control NTLpc Armenia Avg
0
0.002
0.004
0.006
0.008
0.01
0.012
0.014
2004 2005 2006 2007 2008 2009 2010 2011 2012
Difference in Treatment and Control Group (Treatment values - Control values)
SECTION 5

43
Figure 33: Luminosity Per Capita Gap (Treatment Value-Control Value) (2004-2012)
Source: DMSP NTL, MTAD, ILCS multiple years, World Bank’s calculations.
132. From 2004 to 2012, per capita luminosity in treatment communities grew by 98 percent while the national average was 114 percent. Control communities grew much faster with a 142 percent increase during the same time period. Hence, viewing the change over the entire time period would suggest that treatment communities experienced the slowest growth. However, the time period is considered as two parts: pre (2004-2009) and post (2010-2012) interventions. It is noticed that treatment communities began to grow faster after 2010. From 2010 to 2012, the period immediately following LRIP intervention, luminosity per capita in treatment communities rose by 42 percent, slightly outpacing both the national average and the control group, which grew at 40 percent and 35.5 percent, respectively. This is noteworthy because treatment communities had been lagging in terms of NTL per capita in the pre-intervention period.
Figure 34: Percentage Change in Luminosity Per Capita During Two Time Periods, 2004-2009 (pre-intervention) and 2010-2012 (post-intervention)
Source: DMSP NTL, MTAD, ILCS multiple years, World Bank’s calculations.Note: This analysis does not include any of the districts in the city of Yerevan.
Figure 32: Trends in Luminosity Per Capita (2004-2012)
Source: DMSP NTL, MTAD, ILCS multiple years, World Bank’s calculations. Note: The post-intervention period is shaded in blue; this analysis does not include any of the districts in the city of Yerevan. Figure 33: Luminosity Per Capita Gap (Treatment Value-Control Value) (2004-2012)
Source: DMSP NTL, MTAD, ILCS multiple years, World Bank’s calculations.
132. From 2004 to 2012, per capita luminosity in treatment communities grew by 98 percent while the national average was 114 percent. Control communities grew much faster with a 142 percent increase during the same time period. Hence, viewing the change over the entire time period would suggest that treatment communities experienced the slowest growth. However, the time period is considered as two parts: pre (2004-2009) and post (2010-2012) interventions. It is noticed that treatment communities began to grow faster after 2010. From 2010 to 2012, the period immediately following LRIP intervention, luminosity per capita in treatment communities rose by 42 percent, slightly outpacing both the national average and the control group, which grew at 40 percent and 35.5 percent, respectively. This is noteworthy because treatment communities had been lagging in terms of NTL per capita in the pre-intervention period.
0.015
0.025
0.035
0.045
0.055
2004 2005 2006 2007 2008 2009 2010 2011 2012
Treat NTLpc Control NTLpc Armenia Avg
0
0.002
0.004
0.006
0.008
0.01
0.012
0.014
2004 2005 2006 2007 2008 2009 2010 2011 2012
Difference in Treatment and Control Group (Treatment values - Control values)
Figure 34: Percentage Change in Luminosity Per Capita During Two Time Periods, 2004-2009 (pre-intervention) and 2010-2012 (post-intervention)
Source: DMSP NTL, MTAD, ILCS multiple years, World Bank’s calculations. Note: This analysis does not include any of the districts in the city of Yerevan.
133. To investigate where the LRIP may have been the most effective in stimulating increased economic activity, the treatment communities are classified into 25 treatment clusters based on proximity and their change in luminosity per capita analyzed. Not surprisingly, changes in NTL per capita were not uniformly distributed across the different treatment clusters from 2010-2012. Of the 25 communities, 21 increased in luminosity per capita since 2010, whereas four saw a decrease. Clusters in the country’s east, particularly in Tavush and Gegharkunik Marzes, saw the slowest growth, whereas clusters in the country’s northern and western regions grew substantially. It would be important to investigate the reasons why some treatment clusters grew much faster than others. Perhaps, in some parts of the country improving connectivity alone will not lead to significant economic growth.
35.5629.87
18.71
42.41 40.3535.50
0.005.00
10.0015.0020.0025.0030.0035.0040.0045.00
Control NTLpc Armenia Avg Treat NTLpc Treat NTLpc Armenia Avg Control NTLpc
2004 to 2009 2010 to 2012
SECTION 5

44
133. To investigate where the LRIP may have been the most effective in stimulating increased economic activity, the treatment communities are classified into 25 treatment clusters based on proximity and their change in luminosity per capita analyzed. Not surprisingly, changes in NTL per capita were not uniformly distributed across the different treatment clusters from 2010-2012. Of the 25 communities, 21 increased in luminosity per capita since 2010, whereas four saw a decrease. Clusters in the country’s east, particularly in Tavush and Gegharkunik Marzes, saw the slowest growth, whereas clusters in the country’s northern and western regions grew substantially. It would be important to investigate the reasons why some treatment clusters grew much faster than others. Perhaps, in some parts of the country improving connectivity alone will not lead to significant economic growth.
Figure 35: Percentage Change in Luminosity Per Capita by Treatment Cluster (2010-2012)
Source: DMSP NTL, Road Survey 2017, World Bank’s calculations.Note: NTL per capita is the total NTL emission in a community divided by the community’s population.
134. From observing the luminosity per capita trend from 2008 onward, it is possible that the LRIP allowed most treatment communities to recover faster from the global economic crisis as there was a sharper increase in luminosity per capita in the treatment group after the intervention, albeit with significant variation across the country. Unfortunately, due to the lack of DMSP data after 2012, the possible effects of the rehabilitated roads on NTLs can only be observed in the short term.
135. While some previous results are promising, suggesting that project communities might have benefited from increased economic activity, at least in the short term when the project was completed, the difference-in-difference estimator used to calculate the per capita luminosity gap was not statistically significant. A regression with the NTL variable, a dummy for the years after the construction of the roads (treatment), and a dummy for the treated communities was estimated. The difference-in-difference estimator was given by the coefficient in front of the interaction variable between the time dummy and the community dummy. Several specifications were tested but none gave a significant result for the difference-in-difference estimator. Hence, we cannot state with confidence that the observed increase in luminosity per capita in project communities resulted from road rehabilitation. Several issues due to the time frame, the choice of control communities, and the relevance of NTL data for rural roads prevent us from reaching a conclusive result. However, this and other analyses explored in this report teach us important lessons to conceptualize, design, and execute evaluations of transport projects, which are the topics to which we now turn.
SECTION 5

45
136. The methodological approaches selected for this study were considered the most appropriate ones to answer the underlying questions when considering contextual, budget, and data limitations. The data-gathering process was subjected to thorough technical supervision and review by the project teams and World Bank experts from different areas. While the study encountered data and methodological limitations, it succeeded in gathering promising evidence on the positive impact of the LRIP on communities, at least for some of the intermediate outcomes that facilitate economic and welfare gains for low-income and disadvantaged groups. While the study was less successful in revealing welfare impacts and changes in local economic activity, the processes and methodologies tested as part of this research provide some valuable lessons for development practitioners working on transport and poverty. This section summarizes these lessons as a means of sharing knowledge with and providing practical guidance to governments, development organizations, and policy makers alike on the planning, design, and execution of assessments on transport and poverty. It puts forward some recommendations on how to approach similar assessments in the future.
Choice of rigorous impact evaluation over other approaches to assess project outcomes
137. This study was, in part, motivated by the MCC-Mathematica Impact Evaluation. The methodology and data collection process was robust and well sequenced. However, this study faced one of the caveats that other impact assessments on transport have encountered, namely that road projects are not randomly placed. The problem of endogenous placement is a concern in any evaluation or assessment (qualitative and quantitative) that makes use of a control or comparison group to represent a counterfactual. If the treatment and comparison groups are not identical, then observed differences in outcomes between the two groups may be due to factors other than the impact of the project.
138. In the case of the LRIP, the selection of road segments, and hence project communities which would benefit, was not random, but rather associated with technical and social considerations (e.g., quality of the road, expected economic return, unemployment level, etc.). The control group of communities identified for the NTL analysis was chosen from the MCC-Mathematica assessment, which used the household as the unit of analysis to create a control group. This was an imperfect counterfactual as a matching exercise for the community was lacking for the pre-project period. Hence, in cases where selection bias is apparent, it is important to first determine whether an impact assessment is the most effective and feasible approach for responding to a given research question and whether there is available data from pre- and post-project periods that can be used to validate the hypothesis.
Understanding of the theory of change linking transport interventions and other level outcomes
139. As we saw in Section 2, a road investment can have multiple and ambiguous impacts on the local economy and household welfare. A theory of change is necessary, but remains challenging to fully validate through an evaluation. We relied on the asset-based framework to explicitly model the major mechanisms through which a road improvement could be expected to alleviate poverty. The qualitative assessments discussed the underlying processes linking poverty and transport, focusing on how the LRIP project facilitated the acquisition of assets which support a household’s income-generation capacity and better use of its assets. The World Bank is already making a great effort to entrench this thinking in the results framework that accompanies investment projects and, as such, is supporting client countries strengthen their monitoring and evaluation frameworks. This thinking could be better reflected in future empirical work by explicitly illustrating the results chain, explaining the links between the interventions and desired (or undesired) outcomes, along with underlying assumptions.
140. Previous evaluations of the LRIP and other rural roads projects that attempted to capture impacts on agricultural incomes could have been strengthened by a focus on intermediate outcomes. Unfortunately, and related to the point we just discussed, the mechanisms through which incomes were expected to rise were not explicit in the project designs. In the case of the LRIP, the direct impacts that were identified in the project appraisal document, namely upgrading roads and creating short-term employment, were linked to
SECTION 6:LESSONS LEARNT AND DIRECTIONS FOR FUTURE RESEARCH

46
the operation and hence easy to measure. Since the project was conceived as an emergency operation with a short-term implementation horizon, it did not comprise a theory of change that could guide future research. Hence, the longer-term outcomes that would be measured beyond the project’s closing were not evident. When broader welfare outcomes are more challenging to measure, project assessments could instead focus on tracking intermediate outcomes such as accessibility improvements at different points in time. A more targeted approach may be more useful to provide statistically more robust results, rather than exploring all higher-level outcome (i.e. What the impact of a road investment on income or poverty is?). An accumulation of partial equilibrium analysis for each chain could hopefully reveal the result framework. While this study did not benefit from baseline data to measure pre-project accessibility levels, it nonetheless presents a novel methodology to identify the spatial mismatches by constructing accessibility indicators, which also provide an initial approximation of how low-income groups in specific regions of the country may lack access to services and opportunities.
Timing for data collection and evaluation window
141. Since the mechanisms through which a road may influence broader economic and social outcomes differ across contexts and projects, it is hard to predict when the second-order impacts are likely to materialize. Evidence from the transport economics literature cited in this study suggests that it is unrealistic to expect immediate impacts on welfare and social inclusion, and that at least a few years are required for those changes to ensue. The qualitative assessment of the LRIP took place five years after project closing, which would be a reasonable window for welfare outcomes to materialize. However, most impact assessments of roads projects that rely on surveys collect end-line data immediately following project closing, which is always imperfect timing. The issue is more challenging when evaluations are retrospective and use secondary data.
142. For instance, for the nighttime lights analysis, we relied exclusively on the DMSP dataset that was only available until 2012 and hence could not provide conclusive evidence of the longer-term impacts of the project at the community level. In these cases, it was critical to have a good understanding, not only of the nature of the data, but also its frequency, in as much as this will determine the data’s relevance and efficiency in measuring a given outcome. To give another example, the MTAD database would have been a good source to track community level outcomes. However, this database had two limitations: (a) data are only available for the 2012-2015 period so the construction of a valid pre-project baseline was not possible and (ii) whether the data are incomplete varies significantly from one community to another and is subject to measurement error. While the community data was used for describing socio-economic attributes of both LRIP and control communities, it was not possible to track and compare some indicators across communities. That said, through the capacity-building activities that accompanied this study, the World Bank (a) strengthened the monitoring and evaluation systems of the MTAD and (b) created awareness on the importance of collecting and administering community-level data. The existence of this rich dataset provides a window of opportunity for other World Bank projects such as the Lifeline Roads Network Improvement Project (LRNIP)—approved in 2015—and projects in other sectors that have a subnational scope to carry out more comprehensive impact assessments with the community as the unit of analysis.
Unbundling impacts of hard and soft infrastructure
143. Infrastructure consists of hard and soft components that must work together to ensure proper functioning. As follows, a project assessment cannot omit the rules and regulations that govern the use and functioning of physical infrastructure. While the overwhelming majority of the literature has focused on the impact of hard transport infrastructure, particularly rural roads and corridors, on welfare and growth, the hard or visible components must be combined with the soft infrastructure, which includes policies and regulations both within and outside the transport sector that may be conducive to poverty reduction. The primary and secondary evidence presented in the study suggests that the LRIP (a) created short-term employment in construction, (b) improved connections and physical accessibility to markets and other economic facilities, and (c) increased people’s mobility. However, less is known about the organization of the transport sector and the mechanisms to set fares for inter-municipal travel, the regulations and laws that enable transport service providers to compete freely, or other laws and regulations that determine the enabling policy environment for transport investments to have pro-poor, socially inclusive outcomes. While the soft aspects of transport are largely omitted in this research due to data and resource limitations, future research should investigate how policies and regulations interact with infrastructure in support of inclusive growth and poverty reduction.
SECTION 6

47
144. From a research perspective, future assessments could assess how the market for transportation is structured and what is the likelihood that cost savings will be passed on to consumers of transportation services. This and previous assessments of the LRIP project were not able to tell much about the likely economic benefits for consumers of transportation services. As we saw, a sizable share of rural dwellers, particularly women, do not own vehicles and hence are captive users of public transport. The full potential economic benefits of the LRIP project would not be realized unless beneficiaries have the physical and monetary means to access transport services. It then becomes critical to understand the “softer aspects of infrastructure,” particularly the structure of the transportation market, which will have a definitive impact on the prices that people pay to commute outside their villages as well as the price that farmers pay to transport their produce. Moving forward, project assessments could attempt to estimate the level of savings that are effectively transferred to road users and consumers of transport services. This, in turn, may be affected by improved transport infrastructure, but equally so by the underlying market structure in passenger and freight transport.
Examining mobility patterns and how these can trigger economic changes
145. The direct parameters that link road improvements and economic benefits are the reduction in vehicle operating costs and travel times, which are classified as impacts within the transport sector. These quantifiable and verifiable impacts may well lead to a change in consumer behavior manifested in greater or more productive usage of the road. Unfortunately, impact assessments of rural roads often take the household or firms as the unit of analysis without measuring road outcomes from the perspective of road users, specifically consumers of transportation services (freight and passengers).
146. While this study has investigated changes in travel patterns and usage of the LRIP roads through the consultations that were held as part of the qualitative assessment, there has not been to date any systematic effort to quantitatively assess changes in transport patterns resulting from the road. The lack of this data presents challenges for reporting the impacts of road investments, particularly on immediate and intermediate outcomes. Hence, moving forward it would be important to address these gaps and estimate effects on intermediate outcomes for both passengers and freight users.
147. These lessons learnt and the proposed research agenda try to address some of the constraints that this and other assessments of road projects in Armenia and elsewhere have encountered. The recommendations include using the road users as the primary unit of analysis and focusing more on intermediate outcomes that are tractable and less on welfare and economy-wide impacts which may not be captured in data-scarce environments and imperfect evaluation windows. Future analyses could rely on different qualitative and quantitative instruments from primary review as well as desk review of existing transportation economics literature on the country and other secondary sources. Collection of data on transport service users, as well as among communities surrounding the road, would help better understand how consumers perceive the market dynamics. This research proposal could be piloted for ongoing and future projects. An assessment could emphasize that integrating poverty dimensions into transport initiatives need not be a cumbersome and resource-intensive exercise. Some of these methodological approaches differ from rigorous impact evaluation, but the hope is that they can nonetheless provide valuable evidence of project impact at a reasonable cost and within a shorter time frame after the project closes.
SECTION 6

48
148. This study has investigated the link between transport infrastructure and poverty in Armenia, first, by constructing accessibility indices to identify spatial mismatches throughout the country, and, second, by assessing the medium- and longer-term impacts of a World Bank-financed rural roads project. The literature review, as well as the analyses and findings of this research, suggest that transport infrastructure is an important enabling condition for welfare in rural communities of Armenia. The FGDs that took place as part of a comprehensive qualitative assessment corroborate that rural roads are a structuring element in the daily mobility needs of the poor in rural Armenia; farmers need roads to sustainably market their products, the unemployed need roads to find off-farm jobs, children and teachers need roads to travel to school, and the elderly need roads to visit health centers. Similarly, roads can trigger market exchange mechanisms and local economic growth in rural communities. Lower transport costs and improved accessibility resulting from road improvements may stimulate investment in tourism and real estate development (Corral et al. 2016), trigger changes in cropping or land use, and lead to agglomeration effects within and across industries (World Bank 2009). Overall, this research is consistent with the transport economic literature, which concludes that there is an unequivocal correlation between the quality of road infrastructure of a region and the level of poverty and local economic growth.
149. The countrywide accessibility analysis showed that the network in Armenia still presents significant deficiencies as demonstrated by the road survey included in this study. It also showed that there are significant investments still to be made in transport roads infrastructure to take Armenia closer to the rural accessibility level of more advanced countries in Europe. That said, most households in rural Armenia do not seem to be constrained in terms of physical access to market opportunities and services. The marz-level analysis examining the relationship between accessibility and poverty suggested a negative —though not strong—correlation between accessibility and poverty. Future research should elaborate these parameters further by examining how factors other than time and distance determine friction in accessing markets and opportunities. These factors include affordability, availability, and reliability of transport services on the supply side and household income and purchasing power on the demand side. Indeed, the results from the qualitative assessment of the LRIP showed that the project beneficiaries face structural barriers to accessing opportunities and markets, and hence, transport interventions, while necessary, may not suffice to overcome these barriers.
150. So, what does the evidence presented in this research tell us about the relationship between transport and poverty? Rural roads can undoubtedly benefit impoverished communities and poor households, but they do not necessarily alter structural poverty. Some researchers suggest improved access to transport raises living standards across social classes. Others have pointed out that the benefits are unequally distributed as the more affluent typically benefit most from the opportunities provided by road investments. Analyses from many countries presented in the literature review confirm that roads can reduce overall poverty and provide economic opportunities, but eliminating poverty and increasing equity need to be addressed in parallel with any road investments. Empirical evidence also shows that infrastructure investments have the greatest impact in the presence of other, supportive actions. For instance, rural roads, irrigation systems, and rural electrification programs are more successful at reducing poverty when there are also strong programs in education or health (ADB 2012).
151. A key message from the discussions held with project beneficiaries and locals is that rural transport infrastructure works best when aligned with a whole set of complimentary interventions and policy measures that can trigger a larger economic and social response. It follows that rural transport can better address poverty and inequality gaps when packaged with other infrastructure projects, social interventions, and productive investments that address the needs of the rural population and that may have a municipal or regional scale. This was one of the main findings of the FGDs and KIIs in which beneficiaries understood the intrinsic value of a road in enhancing connectivity, but see other complimentary investments, policies, and programs equally or more important to acquiring the assets needed to sustainably escape poverty.
152. At the same time, this study has confirmed that better rural roads are a necessary but not a sufficient condition for escaping poverty. There is little evidence from Armenia suggesting that rural roads have had a direct impact in terms of reducing poverty in the population groups in the sampled communities that
CONCLUSIONS AND POLICY RECOMMENDATIONS

49
self-identified as being poor. Both the literature and the findings from the assessment suggest that the poor and very poor benefit primarily through the indirect impacts of road improvements, of better access to state services and improved provision of services to the village, and of opportunities in alternative livelihood income streams where the preconditions for their development are right. This has implications for the way in which rural development strategies can effectively tackle the structural poverty problems that may go beyond the enhanced accessibility and connectivity that a road may bring, including the nature and distribution of land ownership, the existence of labor market rigidities, and the gendered norms of access to social and income-generating opportunities, to name a few.
153. The poor require genuinely integrated programs of support right through the cycles of production, transportation, and sale. For the poor to travel for productive purposes, the provision of transport services must be linked to some livelihood and income diversification activity that builds on or supplements their existing subsistence activities (ADB 2006). In order to increase mid-term and long-term outcomes from road projects, it is crucial to plan road rehabilitation in concert with other social interventions, addressing the main needs of the beneficiary population in targeted communities, such as irrigation infrastructure, training and information campaigns among the general population, improving overall functioning of agricultural value chains, facilitating agricultural credits, etc. Hence, piloting a multi-sectoral program addressing different development constraints and anchoring transport interventions with other complementary policies could yield more beneficial outcomes (see Box 4).
154. These are just some of the recommendations obtained from the FGDs that accompanied this research. In this spirit, future transport investments should be framed as part of more holistic approaches to enhance broader economic benefits of place-based policies and induce changes in the location of activity and in productivity. A multi-sectoral approach to transport infrastructure projects could make a region more attractive for investment and economic activity. Ensuring that transport interventions include agricultural and private sector development at the project level on one hand, and are also “packaged” within infrastructure programs tied to complimentary policy reforms on the other, could be more effective in attracting private investment, transforming economic opportunities, and promoting shared prosperity than isolated rural roads projects.
155. The methodology, results, and lessons learnt presented in this report pave the way for a more
Box 4. Policy Recommendations to Compliment Road Rehabilitation Projects
The World Bank has been a key supporter of the road sector in Armenia by financing four rural roads projects throughout the country in the past decade. As this research demonstrates, projects such as the LRIP have had a high degree of success in terms of addressing the rural population’s mobility constraints. Moving forward, addressing road sector needs could benefit from a multi-sectoral view to deal with the constraints that cannot be captured in standard road projects.
Adopting a network approach for road sector development in Armenia would be useful to endorse a network approach to developing links between the lifeline and national roads on the one hand, and between urban and rural areas to enhance connectivity and inclusion on the other. The Lifeline Roads Network Improvement Project (LRNIP), approved in 2013, includes an innovative multi-criteria analysis that went beyond the traditional cost-benefit analysis, incorporating demographic and poverty parameters for prioritizing the roads under the program. This type of analysis could be enhanced with accessibility and connectivity analyses to prioritize systems of roads (lifeline, republican, and national) that connect rural communities to services and markets, rather than just segments of roads.
Packaging rural roads projects with other investments as part of integrated infrastructure development program. It is critical to plan and implement road rehabilitation projects in parallel with other infrastructure projects, social interventions, and productive investments that address the needs of rural population. KIIs with village leaders demonstrated that rural transport infrastructure should be accompanied by other programs to improve agricultural productivity and secure access to cheaper inputs. An integrated infrastructure development approach encompassing infrastructure improvements, such as roads, drinking water supply and sanitation, upgrading of public spaces and street network and pedestrian pathways, public transportation stops, lighting, and waste collection, and other interventions have fostered local economic development through unveiling the potential of region’s economic, social, and cultural assets.
CONCLUSIONS AND POLICY RECOMMENDATIONS

50
comprehensive and ambitious research agenda, not only in Armenia, but in the different countries and regions where the World Bank is financing rural roads infrastructure projects. This study contributes to the knowledge on transport and poverty by (a) providing the very first comprehensive analysis on market accessibility and poverty in Armenia and the ECA Region; (b) by filling the gaps that had been left by prior impact studies on LRIP effects on household welfare, uncovering household-level trends that cannot be properly captured with standard econometric techniques; (c) by employing remotely sensed open source data for the first time in a rural roads projects to analyze the effect of a roads rehabilitation project on local economic development outcomes; and (d) by drawing on the lesson learnt from this and previous assessments on transport and poverty to propose practical methodological considerations for future research on the subject This study is not able to answer all relevant questions about the impact of the LRIP. So, future research in this area is crucial. It will be relevant to develop a conceptual and empirical framework to sequence and coordinate transport projects with spatially differentiated priorities for regional and social development. Through the operationalization of such a framework, the development community will be better positioned to identify the series of policy reforms and programs best placed to enhance the welfare and local economic benefits of rural roads projects.
Incorporating gender-sensitive infrastructure. Despite transport infrastructure being highly gendered, planners and policy makers have overlooked the intra-household division of labor relating to transport (ODI 2001). The discussions held with beneficiaries revealed that women’s travel within the village by foot is more frequent than that outside the immediate village area, and when traveling outside they are captive users of public transport. Hence, besides rehabilitating and maintaining lifeline roads, investing in non-motorized transport, upgrading sidewalks to motorable roads, and prioritizing other gender-sensitive interventions will address some of the specific constraints that women reported facing in rural Armenia.
Emphasis on participatory planning. The FGD revealed that while public consultations took place particularly in the context of the time of project preparation, the beneficiary population and their representatives did not participate actively in the decision-making process around the needs of the community or both technical and nontechnical aspects related to road construction. As the case study of Lchashen illustrated, the beneficiary population participated in project design from the onset and even after the project had been concluded through routine maintenance. However, adequate needs assessments were generally absent throughout implementation and unawareness of beneficiary population could partially explain why FGD respondents in most of the surveyed communities perceived impacts of the project as minimal. However, maximizing the participatory component by involving the main stakeholders and beneficiaries is being done as part of the ongoing World Bank-financed LRNIP, yielding positive results while creating ownership. Stressing the involvement of SME representatives as main beneficiaries in projects and using their collaboration with the community administration is of relevance in project design of newer operations.
Linking road construction to job creation and skills development initiatives. One of the key findings of the qualitative research is that civil works that took place created short-term opportunities in construction, but did not include a skills development or training component. This is mostly because the project was designed as an emergency operation aimed primarily at creating employment and improving rural connectivity. However, future transport programs with a routine maintenance component could deliver a specific training component to focus on vocation and entrepreneurial skills development for workers engaged in civil works. This model, sometimes known as “public works plus” or “workfare programs,” has yielded positive welfare results by developing locally based, job-driven approaches to increase earnings and advance employment outcomes.
CONCLUSIONS AND POLICY RECOMMENDATIONS

51
Addison, Douglas, and Benjamin Stewart. 2015. “Nighttime Lights Revisited the Use of Nighttime Lights Data as a Proxy for Economic Variables.”
ADB (Asian Development Bank). 2006. When Do Rural Roads Benefit the Poor and How? Manila: ADB.
Agarwal, S. 2013. “Do Rural Roads Create Pathways out of Poverty?” Working Paper. University of California, Santa Cruz.
Agnew, J., T. W. Gillespie, J. Gonzalez, and B. Min. 2008. “Baghdad Nights: Evaluating the US Military ‘Surge’ Using Nighttime Light Signatures.” Environment and Planning A, 40 (10): 2285-2295.
Akiyama, Y. 2012. “Analysis of Light Intensity Data by the DMSP/Ols Satellite Image Using Existing Spatial Data for Monitoring Human Activity In Japan.” ISPRS Annals of the Photogrammetry, Remote Sensing and Spatial Information Sciences.
Alder, Simon. 2017. “Chinese Roads in India: The Effect of Transport Infrastructure on Economic Development”.
Ali, Rubaba, A. Federico Barra, Claudia Berg, Richard Damania, John Nash, and Jason Russ. 2017. “Evaluating Transport Infrastructure Projects in Low Data Environments: An Application to Nigeria.” The Journal of Development Studies, April, 1-20. doi:10.1080/00220388.2017.1308488.
Alesina, A., E. La Ferrara, and National Bureau of Economic Research. 2004. Ethnic Diversity and Economic Performance. Cambridge, MA: National Bureau of Economic Research.
Banerjee, Abhijit, Esther Duflo, and Nancy Qian. 2012. “On the Road: Access to Transportation Infrastructure and Economic Growth in China.” Cambridge, MA. doi:10.3386/w17897.
Baum-Snow, Nathaniel, Loren Brandt, J. Vernon Henderson, Matthew A. Turner, and Qinghua Zhang. 2015. “Roads, Railroads and Decentralization of Chinese Cities.” Working Paper, March: 1-50. doi:10.1162/REST.
Berg, Claudia, Uwe Deichmann, Yishen Liu, and Harris Selod. 2017. “Transport Policies and Development.” The Journal of Development Studies 53 (4). Taylor and Francis: 465-80. doi:10.1080/00220388.2016.1199857.
Booth, D; Hanmer L; Lovell E. 2000. Poverty and Transport. London: Overseas Development Institute.
Bickenbach, Frank, Eckhardt Bode, Peter Nunnenkamp, and Mareike Söder. 2016. “Night Lights and Regional GDP.” Review of World Economics 152 (2). Springer Berlin Heidelberg: 425-47. doi:10.1007/s10290-016-0246-0.
Broegaard, E., Freeman, T. and Schwensen C., 2011. “Experience from a phased mixed-methods approach to impact evaluation of Danida support to rural transport infrastructure in Nicaragua”. Journal of Development Effectiveness (3) 1, 9-27.
Bussolo, Luis F. Lopez-Calva. 2014.Shared Prosperity: Paving the Way in Europe and Central Asia. Washington, DC: World Bank.
Calderón, César, Enrique Moral-Benito, and Luis Servén. 2015. “Is Infrastructure Capital Productive? A Dynamic Heterogeneous Approach.” Journal of Applied Econometrics 30 (2): 177-98. doi:10.1002/jae.2373.
Calderon, Cesar, and Luis Serven. 2014. “Infrastructure, Growth, and Inequality : An Overview.” Policy Research Working Paper Series, September. The World Bank.
Casaburi, Lorenzo and Glennerster, Rachel and Suri, Tavneet, 2013. “Rural Roads and Intermediated Trade: Regression Discontinuity Evidence from Sierra Leone”, Boston.
Cantril, H. 1965. The Pattern of Human Concerns. New Brunswick, NJ: Rutgers University Press.
Chandra, Amitabh and Eric Thompson, 2000. Does Public Infrastructure Affect Economic Activity? Evidence from the Rural Interstate Highway System. Boston: 2000.
Corral, Leonardo et.al. 2016. The Impact of Coastal Infrastructure Improvements on Economic Growth: Evidence from Barbados. Interamerican Development Bank: Washinton, DC.
Cosar, A. Kerem, and Pablo D. Fajgelbaum. 2016. “Internal Geography, International Trade, and Regional Specialization.” American Economic Journal: Microeconomics 8 (1): 24-56.
Donaldson, Dave. 2017. “Railroads of the Raj: Estimating the Impact of Transportation Infrastructure.” American Economic Review (Forthcoming).
Donaldson, Dave, and Richard Hornbeck. 2016. “Railroads and American Economic Growth: A Market Access Approach.” The Quarterly Journal of Economics 131 (2). Cambridge University Press, New York: 799-858.
LIST OF REFERENCES

52
Elvidge, Christopher, Feng-Chi Hsu, Kimberly Baugh, and Tilottama Ghosh. 2014. “National Trends in Satellite-Observed Lighting: 1992–2012.”
Emran, M. Shahe, and Zhaoyang Hou. 2013. “Access to Markets and Rural Poverty: Evidence from Household Consumption in China.” Review of Economics and Statistics 95 (2). The MIT Press: 682-97. doi:10.1162/REST_a_00354.
Faber, Benjamin. 2014. “Trade Integration, Market Size, and Industrialization: Evidence from China’s National Trunk Highway System.” The Review of Economic Studies 81 (3). University of Chicago, Chicago: 1046-70. doi:10.1093/restud/rdu010.
Fajgelbaum, Pablo, and Stephen J. Redding. 2014. “External Integration, Structural Transformation and Economic Development: Evidence From Argentina.” CEP Discussion Papers. Centre for Economic Performance, LSE.
Ferreira, Francisco. 2010. “Distributions in Motion: Economic Growth, Inequality, and Poverty Dynamics.” Washington, DC: World Bank.
Fortson, Kenneth et al. Gonzalez, Randall, Blair Kathryn. “Evaluation of an MCC- and World Bank-Financed Rural Road Rehabilitation Project in Armenia.” Princeton: Mathematica Policy Research.
Fujita, Masahisa, Paul Krugman, and Anthony J. Venables. 2001. “The Spatial Economy: Cities, Regions, and International Trade.” Boston: MIT.
Gannon, Colin and Zhi Liu. 1997. “Poverty and Transport.” Discussion Paper TWU-30, World Bank, Washington, DC.
Gertler, Paul J., Marco Gonzalez-Navarro, Tadeja Gracner, and Alexander D. Rothenberg. 2015. “Road Quality, Local Economic Activity, and Welfare: Evidence from Indonesia’s Highways.” Working Paper.
Gibson, John and Scott Rozelle. 2003. “Poverty and Access to Roads in Papua New Guinea.” Economic Development and Cultural Change. 51 (1): 159-185.
Ghosh, Tilottama, Sharolyn J. Anderson, Christopher D. Elvidge, and Paul C. Sutton. 2013. “Using Nighttime Satellite Imagery as a Proxy Measure of Human Well-Being.” Sustainability 5 (12). MDPI, Open Access Journal: 1-32.
Glaeser, Edward L. and Joshua D. Gottlieb. 2009. “The Wealth of Cities: Agglomeration Economies and Spatial Equilibrium in the United States.” Journal of Economic Literature 47 (4): 983-1028. doi:10.1257/jel.47.4.983.
Gollin, Douglas and Richard Rogerson. 2014. “Productivity, Transport Costs and Subsistence Agriculture.” Journal of Development Economics 107 (March): 38-48. doi:10.1016/j.jdeveco.2013.10.007.
Hettige, Hemamala. 2006. When Do Rural Roads Benefit the Poor and How? An In-Depth Analysis Based on Case Studies. Manila: Asian Development Bank.
Hine, John et al. 2015. “Systematic Review on Rural Roads Impacts.” Working Paper. U.K. Department of International Development.
Henderson, J. Vernon, Adam Storeygard, and David N Weil. 2012. “Measuring Economic Growth from Outer Space.” American Economic Review 102 (2): 994-1028. doi:10.1257/aer.102.2.994.
Huang, Qingxu, Xi Yang, Bin Gao, Yang Yang, and Yuanyuan Zhao. 2014. “Application of DMSP/OLS Nighttime Light Images: A Meta-Analysis and a Systematic Literature Review.” Remote Sensing 6 (8). Multidisciplinary Digital Publishing Institute: 6844-66. doi:10.3390/rs6086844.
Jacoby, Hanan G. 2000. “Access to Markets and the Benefits of Rural Roads.” Economic Journal 110: 713-737.
Khandker, Shahidur R., Zaid Bakht, and Gayatri B. Koolwal. 2009. “The Poverty Impact of Rural Roads: Evidence from Bangladesh.” Economic Development and Cultural Change 57 (4). The University of Chicago Press: 685-722. doi:10.1086/598765.
Kling, Jeffrey R., Jeffrey B. Liebman, and Lawrence F. Katz. 2007. “Experimental Analysis of Neighborhood Effects.” Econometrica 75:1.
Levy, H., Claudine Voyadzis, and Claudine Volonte. 1996. “Kingdom of Morocco Impact Evaluation Report: Socioeconomic Influence of Rural Roads.” Report No. 15808-MOR. Washington, DC: World Bank.
Mu, Ren, and Dominique van de Walle. 2011. “Rural Roads and Local Market Development in Vietnam.” Journal of Development Studies 47 (5). Routledge : 709-34. doi:10.1080/00220381003599436.
Narayan, Deepa, and Patti Petesch. 2005. Moving Out of Poverty: Understanding Freedom, Democracy, and Growth from the Bottom Up: Methodology Guide. Washington, DC: Poverty Reduction Group, Poverty
LIST OF REFERENCES

53
Reduction and Economic Management Network, World Bank.
Narayan, Deepa and Patti Petesch. Eds. 2005. Moving Out of Poverty: Cross-Disciplinary Perspectives on Mobility. World Bank and Oxford University Press.
Narayan-Parker, Deepa. 1993. “Participatory Evaluation: Tools for Managing Change in Water and Sanitation.” Technical Paper 207, World Bank, Washington DC.
Nobuo, Yoshida, and Deichman Uwe. 2009. Measurement of Accessibility and Its Applications. Journal of Infrastructure Development I(I): I-16.
Petesch, Patti, and Giorgia Demarchi. 2015. Gender Mobility and Middle Class in Europe and Central Asia: Insights from Qualitative Research. World Bank.
Porter, Gina. 1995. “The Impact of Road Construction on Women’s Trade in Rural Nigeria.” Journal of Transport Geography 3 (1): 3–14.
Roberts, Peter, Shyam KC, and Cordula Rastogi. 2006. Rural Access Index: A Key Development Indicator. Washington, DC: World Bank. 2006.
Storeygard, Adam. 2013. “Farther on Down the Road: Transport Costs, Trade and Urban Growth in Sub-Saharan Africa.” Policy Research Working Paper No. 6444, World Bank, Washington, DC.
Tadevosyan, Gohar. 2013. Participatory Research: Methodology, Methods, and Tools. Yerevan: Yerevan State University.
World Bank. 2009. Project Appraisal Document: Lifeline Roads Improvement Project. Washington, DC.
———. 2014. Project Appraisal Document: Lifeline Roads Improvement Project. Washington, DC.
———. 2009. The World Development Report: Reshaping Economic Geography
———. 2017. Armenia: Systematic Country Diagnostic. Washington, DC.
World Pop 2017. Geo-Data Institute. http://www.worldpop.org.uk/. London, UK.
1. At the concept stage, the study originally entailed the formulation of an empirical design for updating the impact evaluation of the LRIP and carrying out, in FY18, a follow-up survey to capture longer-term
LIST OF REFERENCES

54
effects. It followed a “deep dive” mission that took place in November 2016, with the objective of:
• Identifying relevant data sources needed for the impact evaluation exercise and accessibility analysis;
• Assessing data availability and reaching an agreement on how to secure access to the needed data from the NSSRA;
• Identifying local consultants and research firms that could participate in the implementation of the activity; and
• Garnering support and endorsement from all relevant government counterparts.
2. After the mission, the task team presented the strategy to measure these effects, which consisted of using ILCS 2007 and 2010-2011 surveys as the baseline and midline, respectively, of the impact evaluation and a follow-up survey in FY18 that would serve as the end line for the evaluation. While the task team acknowledged that this strategy could provide some valuable evidence about the longer-term effects of the project, there is one key structural problem with the sampling used in the MCC-Mathematica study that will undermine the explanatory power of any future evaluation; instead of having households drawn independently from many different communities, they are drawn just from 56 road projects. This means that rather than being representative of the whole project, any evaluation using this sampling frame—and the results obtained therein—will apply only to the specific households that are included in the sample for the relevant year. In other words, the impact evaluation would not be able to establish a causal and generalizable relationship between the road rehabilitation and the variables of interest. Added to this, since the MCC-Mathematica study used a crosswalk of households in each year rather than a panel, any effect will lack statistical precision. Since some key outcomes, such as annual household income, are highly variable, a panel of households would be more appropriate to precisely estimate these impacts. Future follow-up surveys will not be able to solve these structural problems. Hence, with the use of past ILCS data, nothing empirically conclusive could be stated about the project.
3. Added to this, because of the prevailing Law of Confidentiality of the Republic of Armenia, third parties may not have access to the community-level data that are collected through the ILCS. Because the nature of the intervention is geographic and any household-level data to be evaluated would have to be matched with the project and control communities, using the ILCS as a data source for the evaluation was deemed impractical.
4. Given the abovementioned constraints, the task team proposed three alternatives for moving forward with Component 1, which management endorsed. These are:
• Conducting a qualitative assessment. To assess longer-term welfare effects, the study emphasizes qualitative data collection mechanisms such as FGDs, in-depth interviews, direct observations, and Community Score Cards. As a result, this impact assessment examines ex ante and ex post views, perceptions, expectations, and livelihood outcomes of different aspects of the beneficiaries for selected LRIP communities and comparator communities that did not benefit from road rehabilitation. The team hired the firm Media Model to complete the qualitative assessment that includes FGDs and discussions in 10 project communities. The firm recommended that the fieldwork should not start before the beginning of April due to the inclement winter that the country faced in 2017 and the parliamentary elections held on April 2. The firm presented the results from a first pilot assessment and the team used the mission to further refine the methodology and instruments. The team participated in the training of facilitators and moderators, and the fieldwork was officially launched during the mission. The results of this qualitative assessment are summarized in this report and the full document is available in the project files.
ANNEX I:MOTIVATION FOR SELECTED METHODOLOGY FOR THE LRIP ASSESSMENT

55
• Using community-level data to analyze trends in project communities. The World Bank made good use of an extensive database with over 600 indicators for all project communities administered by the MTAD, which contains data for 2012-2015. The database is quite rich and provides valuable statistics on some community-level indicators such as employment, agricultural activity, and social service availability. However, the database showed significant problems in terms of consistency and coding, and hence needed to be curated, processed, harmonized, and consolidated so that it could become a useful research tool for the government and other intended users. As part of the ASA, the World Bank supported the MTAD to improve the community-level data platform for available years. The team refined the data architecture for this database, produced guidance material, a coding structure, and a data dictionary that could be used by the MTAD for future activities, and provided capacity building to key ministry staff in charge of feeding and managing the database. Some of these data were used in this report to provide a detailed analysis of trends in project communities. The full data set will be made available in the World Bank data hub and all future uses of the database will be governed by a Memorandum of Understanding on data sharing that was signed with the MTAD in May. This documentation, along with the full database, is available in the project files.
• Nighttime lights data. Due to the constraints with the use of ILCS data outlined earlier, the quantitative analysis of this impact evaluation drops the household as the unit of analysis to focus instead on the potential local economic impacts of rehabilitated rural roads at the community level. Since pre-project community-level data are not available, the quantitative analysis instead examines geo-coded NTL data in project and non-project communities as a proxy measure for economic activity. Much research has suggested that NTL can be used as a proxy for a number of variables, including urbanization, density, and economic growth. Tracking light intensity data in project communities for multiple years can render valuable information about spatial development and land use. The analysis followed a sensible specification strategy by which two comparable sets of communities were identified using observable attributes.
ANNEX I

56
ANNEX I
1. This technical note presents the results of a countrywide road survey (national, republican, and lifeline roads) as a means of using a lens of accessibility to examine the trends in spatial development in Armenia. Using existing spatial data that provide a snapshot of accessibility, population distribution, and service availability in the different districts of Armenia, the technical note develops indices of accessibility and connectivity for Armenia that could be used to inform future investments in the sector and elsewhere. At present, there are very scarce geo-referenced data of the road network, on the one hand, and population, demographic, economic, and service location indicators, on the other. To fill this gap, the World Bank financed a countrywide road survey to obtain geo-referenced data of the entire road network of Armenia lasting three months from the end of March to early May 2017. With the use of the RoadLabPro3522 application, this activity consisted of collecting road, surface type, category, and road condition data and geo-tagged information of service and market location.
Data Issues and Assumptions
2. The road condition data were determined based on the IRI value of the road according to the following matrix:
Table A2.1: Road Condition Category and Suggested IRI Classification
Condition Minimum Roughness Maximum RoughnessCategory (IRI) (IRI)Very good 1.0 2.0
Good 2.0 4.0Fair 4.0 6.0Poor 6.0 10.0
Very poor 10.0 16.0
3. As a result of calculations, the shares of the total length of each condition type of the surveyed roads are presented in Table A2.2.
Table A2.2: Road Survey Plan
No. Date Days Route Length (km)
Team 1
1 13.03.2017 to 16.03.2017 4
Yerevan - Metsamor - Vagharshapat - Armavir - Mys-nikyan -Dalarik - Karakert - Baghramyan - v. Armavir - Nalbandyan - Argavand - Jrarat - Arazap - Margara - Apaga - Yerevan
590
217.03.2017; 20.03.2017 to 21.03.2017
3Yerevan - Ashtarak - Byurakan - Tegher - Aghdzk - Ujan - Kosh - Aruch - Nerkin Bazmaberd - Ashnak - Arteni - Talin - Talin - Mastara - Yerevan
410
35 The RoadLabPro smartphone application was created by the World Bank in 2016 and is designed as a data col-The RoadLabPro smartphone application was created by the World Bank in 2016 and is designed as a data col-lection tool with accelerometers to evaluate road conditions, map road networks, detect major road bumps, and re-port road safety hazards. The road survey used data collected through the RoadLabPro, which is used to measure road quality. While the application provides an indication of the underlying road parameters, the measure is not as accurate as more advanced road asset management equipment. As follows, the results reported on road condition and the resulting speeds that were used for the accessibility analysis are approximate values.
ANNEX II:DESCRIPTION OF METHODOLOGY FOR CONDUCTING COUNTRYWIDE ROAD SURVEY

57
No. Date Days Route Length (km)
3 22.03.2017 to 24.03.2017 3
Yerevan - Ashtarak - Karbi - Parpi - Ushi - Artashavan - Vardenut - Hartavan - Aragats - Tsaghkashen - Kuchak - Yeghipatrush - Aparan - Melikgyux - Alagyaz - Tsakh-kahovit -Yerevan
395
4 27.03.2017 to 28.03.2017 2
Artik - Poqr Mantash - Panik - Horom - Gusanagyugh - Shirakavan - Aghin - Jrarpi - Anipemza - Norashen - Karaberd - Maralik - Artik
296
5
29.03.2017 to 31.03.2017; 03.04.2017 to 05.04.2017
5
Gyumri - Azatan - Arevik - Yerazgavors - Akhurik - Haykavan - Byurakn - Amasia - Berdashen - Shaghik - Ardenis - Aghvorik - Ghazanchi - Mets Sepasar - Ashotsk - Musaelyan - Arpeni - Keti – Gyumri
377
6 10.04.2017 to 13.04.2017 4
Vanadzor - Darpas - Arjut - Spitak - Arevashog - Goga-ran - Shirakamaut - Mets Parni - Hartagyugh - Jrashen - Lernantsq - Halavar - Vanadzor
172
714.04.2017; 17.04.2017 to 20.04.2017
5
Vanadzor - Bazum - Gyalladara - Kurtan - Koghes - Agarak - Lejan - Privolnoe - Saratovka - Tasgir - Goga-van - Metsavan - Paghaghpyur - Dashtadem - Katna-rat - Urasar - Vanadzor
386
8 21.04.2017 1 Vanadzor - Margahovit - Fioletovo - Gugark - Debet - Marts - Lorut - Atan - Vanadzor 178
9 24.04.2017 to 27.04.2017 4
Dzoragyugh - Tumanyana - Alaverdi - Odzun - Mghart - Madan - Jiliza - Haghpat - Akhtala - Shamlugh - Shnogh - Teghut - Chochkan - Alaverdi
349
10 02.05.2017 1 Dilijan - Teghut - Hagharcin - Hovk - Gosh - Kahacha-rdzan -Dilijan 110
11 03.05.2017 to 05.05.2017 3
Ijevan - Getahovit - Lusadzor - Azatamut - Sevkar - Voskepar - Voskevan - Koti - Barekamavan - Jujevan - Noyemberyan - Koghb - Haghtanaka -Ayrum - Ptgha-van - Bagratashen - Debetavan - Ijevan
274
12 08.05.2017 to 12.05.2017 5
Ijevan - Aygehovit - Vazashen - Verin Tsaghkavan - Paravakar - Chinchin - Nerkin Karmiraghbyur - Ay-gepar - Verin Karmiraghbyu - Choratan - Aygehovit - Chinari - Berd - Navur -Itsakar - Ijevan
243
Total 40 3,780Team 2
1 13.03.2017 1Yerevan - Abovyan - Mayakovski - Kaputan - Zo-vashen - Sevakerd - Zar - Kotayk - Aramus - Kamaris - Gegashen - Zovk - Dzoragyux - Yerevan
159
2 14.03.2017 to 15.03.2017 2
Yerevan - Zovuni - Kanakeravan - Mrgashen - Yegh-vard - Arinj - Balahovit - Arzni - Byureghavan - Zoravan - Argel - Aragyugh - Charentsavan - Solak - Hrazdan - Tsakgadzor - Hanqavan -Yerevan
452
3
16.03.2017 to 17.03.2017; 20.03.2017 to 23.03.2017
6
Yerevan - Sevan - Tsovagyux - Shorzha - Chambarak - Dprabak - Jil - Pambak - Geghamasar - Mets Masrik - Sotk - Vardenis -Tsovak - Lchavan - Vardenik - Martuni - Lichk - Vardenyats Pass - Yeranos - Gavar - Tsovaz-ard - Lchashen - Yerevan
1187
4 27.03.2017 1
Yerevan - Geghanist - Ghukasavan - Khachpar - Arbat - Hayanist - Hovtashat - Darbnik - Darakert -Norabats - Sis - Sayat-Nova - Marmarashen - Nor Kharberd - Ayntap - Yerevan
131
ANNEX II

58
ANNEX II
No. Date Days Route Length (km)
5 28.03.2017 to 29.03.2017 2
Yerevan - Arevabuyr - Mkhchyan - Araksavan - Bagh-ramyan - Aygezard - Narek -Dvin - Verin Artashat - Mrganush - Lanjazat - Bazmashen - Arevshat - Byura-van - Jrashat -Yerevan
155
630.03.2017 to 31.03.2017; 03.04.2017
3
Yerevan - Tapereakan - Lusarat - Nor Kyanq - Ay-gevan - Vedi - Urtsadzor - Shaghap - Zangakatun - Tigranashen - Yeraskh - Armash - Ararat - Noyakert - Yeghegnavan - Yerevan
316
7 06.04.2017 1Yeghegnadzor - Arpi - Aghavnadzor - Areni - Rind - Chiva - Yelpin - Khachik - Gnishik - Agarakadzor - Yeghegnadzor
142
8 07.04.2017 1Yeghegnadzor - Getap -Shatin - Hors - Karaglux - Getikvank - Herher - Malishk - Vernashen - Gladzor - Yegeghnadzor
154
9 10.04.2017 to 11.04.2017 2
Yeghegnadzor - Zedea - Azatek - Por - Zaritap - Mar-tiros - Khndzorut - Sers - Bardzruni - Gomk -Kapuyt - Artavan - Saravan - Jermuk
179
10 12.04.2017 to 13.04.2017 2
Sisian - Gorayk - Spandaryan - Tsghuk - Ishkhanasar - Shaki - Angeghakot - Salvard - Mutsk - Brnakot - Ashotavan - Arevis – Sisian
289
11 14.04.2017 1 Sisian - Tolors - Akhlatyan - Torunik - Dastakert - Nzh-deh -Sisian 88
12 17.04.2017 1 Sisian - Uyts - Aghitu - Vorotan - Shamb - Darbas - Shenatagh – Sisian 94
13 18.04.2017 to 21.04.2017 4
Goris - Harzhis - Shinuhayr - Tatev - Tandzatap - Svarants - Khot - Khoznavar - Knatsakh - Vaghuhas - Tegh - Kornidzor - Kndzoresk - Hartashen - Karahunj -Vorotan - Goris
393
14 26.04.207 1Kapan - Bardzravan - Shurnukh - Nor Arachadzor - David Bek - Artsvanik - Chapni - Yegheg - Kaghnut - Kapan
61
15 27.04.207 1Kapan - Achanan - Nerkin Khotanan - Verin Khotanan - Aghvani - Khashuni - Tavrus - Antarashat - Vanek - Dzorastan - Arachadzor - Kapan
96
16 28.04.207 1 Kapan - Sznak - Ditsmayri - Uzhanis - Agarak - Kh-drants - Yeghvard - Gomaran - Geghanush - Kapan 65
17 01.05.207 1Kapan - Andokavan - Kavchut - Nerkin Giratagh - Verin Giratagh - Geghi - Kard - Kyurut - Kirs - Nor Astghab-erd - Adjabaj - Kapan
71
18
02.05.2017 to 05.05.2017; 08.05.2017 to 09.05.2017
6
Kapan - Shikahogh - Tsav - Nerkin Hand - Nrnadzor - Shvanidzor - Alvank - Meghri - Agarak - Karchevan - Vahravar - Lehvaz - Vardanidzor - Lick - Tashtun - Vank - Kajaran - Katnarat - Pkhrut - Lernadzor - Dzagedzor - Kapan
258
19 10.05.2017 to 12.05.2017 3 Within Yerevan City 216
Total 40 4,506Source: Armenia Road Survey 2017
4. The results of this survey are graphically represented in the following map and further elaborated in the study.

59
Figure A2.1: Road Network Condition
Source: Armenia Road Survey 2017
1. For this research, two types of indicators were constructed: the RAI and the market and service accessibility indicator. The service availability indicator is an extension of the latter.
ANNEX II

60
ANNEX II
RAI
2. The RAI developed by Roberts et al. (2006) is one of the most important global development indicators in the transport sector and measures the proportion of people who have access to an all-season road within an approximate 2 km walking distance.
3. The new method uses spatial data and techniques. High-resolution population distribution data have been developed by the international research community. The WorldPop database3623 has the highest resolution (100) and it helps better understand the distribution of the population and construct gridded population mapping. Digitized road network data, including road conditions, are also often available at road agencies or can be collected through the use of information and communications technologies as was the case with the present work. By spatially combining all these available data, the RAI is virtually computed, which ensures sustainability of the index.
4. This new method is also operationally relevant. It allows computing accessibility at the very local level, which can be used for strategic prioritization of investment and road asset management. The new RAI is found to be related to poverty as well as agricultural productivity. It is also related to access to market and social facilities, such as schools, hospital, and banks. Thus, the new RAI will help client countries and other stakeholders improve their planning, implementation, and monitoring capabilities in rural road investments.
5. In the case of the RAI for Armenia presented in this research, the WorldPop 2015raster image for population was used to determine the distribution of the population in the country, which was subsequently combined with the 2015 MTAD database. Once the estimate was obtained for 2015, the data were combined with road condition data collected through a smartphone application. The road condition (IRI) was obtained every 100 m of road and with those the average IRI was calculated by each road segment (defined as a road link going from intersection point to intersection point). Subsequently, a specialized tool for RAI calculation was used under the ArcMap GIS software. To define the lowest administrative division for the country, the 913 communities of Armenia are used to calculate the RAI. Those communities include 957 settlements (small towns and villages), but exclude the three main cities in the country (Yerevan, Vanadzor, and Gyumri). Out of those communities, 48 were excluded from the calculation of the RAI as they were defined as urban by the MTAD database.
36 WorldPop provides detailed and open access population distribution data sets based on contemporary and spa-WorldPop provides detailed and open access population distribution data sets based on contemporary and spa-tially detailed population census data. WorldPop works with statistics agencies, the Ministry of Health, and other organizations to construct databases of the most spatially detailed and recent population census data available and match these to corresponding administrative boundaries (www.worldpop.org.uk).
ANNEX III:METHODOLOGY FOR ESTIMATING THE RAI

61
1. This annex expands the accessibility analysis presented in Section 4, defining access to different types of health facilities and to universities. In line with the results presented in the report, the unbundled service accessibility analysis suggests that health facilities are within easy reach of the Armenian population. Universities, on the other hand, are scarce in Armenia and present only in seven cities, and hence at over 45 minutes away for 13 percent of the country’s population.
Figure A4.1: Isochrone Map on Average Travel Time to the Closest Polyclinic and Distribution of the Population Within that Threshold
Source: World Bank’s calculations with road survey data 2017, WorldPop 2015, Ministry of Healthcare.
Table A4.1: Distribution of Rural Population and Average Travel Time to the Closest Polyclinic
Time Intervals (min.) Number of Settlements Total Population (2013) % Population0-15 625 2,774,148 91.98215-30 202 169,591 5.62330-45 73 48,791 1.618over 45 60 23,440 0.777
TOTAL 960 3,015,970 100
ANNEX IV :ACCESSIBILITY ANALYSIS FOR UNBUNDLED HEALTHAND EDUCATION FACILITIES
75
Annex IV: Accessibility Analysis for Unbundled Health and Education Facilities
1. This annex expands the accessibility analysis presented in Section 4, defining access to different types of health facilities and to universities. In line with the results presented in the report, the unbundled service accessibility analysis suggests that health facilities are within easy reach of the Armenian population. Universities, on the other hand, are scarce in Armenia and present only in seven cities, and hence at over 45 minutes away for 13 percent of the country’s population.
Figure A4.1: Isochrone Map on Average Travel Time to the Closest Polyclinic and Distribution of the Population Within that Threshold
Source: World Bank’s calculations with road survey data 2017, WorldPop 2015, Ministry of Healthcare. Table A4.1: Distribution of Rural Population and Average Travel Time to the Closest Polyclinic
Time Intervals (min.) Number of Settlements Total Population (2013) % Population 0-15 625 2,774,148 91.98215-30 202 169,591 5.62330-45 73 48,791 1.618over 45 60 23,440 0.777
TOTAL 960 3,015,970 100
84.19
12.78
1.98 1.05
0-15 15-30 30-45 over 45

62
Figure A4.2: Isochrone Map on Average Travel Time to the Closest Healthcare Centre and Distribution of the Population within that threshold
Source: World Bank’s calculations with road survey data 2017, WorldPop 2015, Ministry of Healthcare.
Table A4.2: Distribution of Rural Population and Average Travel Time to the Closest Healthcare Centre
Time Intervals (min.) Number of Settlements Total Population (2013) % Population
0-15 625 2,774,148 91.98215-30 202 169,591 5.62330-45 73 48,791 1.618over 45 60 23,440 0.777
TOTAL 960 3,015,970 100
Figure A4.3 Isochrone Map on Average Travel Times to the Closest Hospital, Medical Center and Special Medical Institution
Figure A4.2: Isochrone Map on Average Travel Time to the Closest Healthcare Centre and Distribution of the Population within that threshold
Source: World Bank’s calculations with road survey data 2017, WorldPop 2015, Ministry of Healthcare.
Table A4.2: Distribution of Rural Population and Average Travel Time to the Closest Healthcare Centre
Time Intervals (min.) Number of Settlements Total Population (2013) % Population 0-15 625 2,774,148 91.98215-30 202 169,591 5.62330-45 73 48,791 1.618over 45 60 23,440 0.777
TOTAL 960 3,015,970 100
91.98
5.62
1.62 0.78
0-15 15-30 30-45 over 45
Figure A4.3 Isochrone Map on Average Travel Times to the Closest Hospital, Medical Center and Special Medical Institution
Source: World Bank’s calculations with road survey data 2017, WorldPop 2015, Ministry of Healthcare.
Table A4.3 Distribution of Rural Population and Average Travel Time to the Closest Hospital, Medical Center and Special Medical Institution
Time Intervals (min.) Number of Settlements Total Population (2013) % Population 0-15 621 2,838,356 94.11115-30 264 158,166 5.24430-45 63 16,924 0.561over 45 12 2,524 0.084
TOTAL 960 3,015,970 100
94.11
5.24
0.56 0.08
0-15 15-30 30-45 over 45
Source: World Bank’s calculations with road survey data 2017, WorldPop 2015, Ministry of Healthcare.
ANNEX IV

63
Table A4.3 Distribution of Rural Population and Average Travel Time to the Closest Hospital, Medical Center and Special Medical Institution
Time Intervals (min.) Number of Settlements Total Population (2013) % Population0-15 621 2,838,356 94.11115-30 264 158,166 5.24430-45 63 16,924 0.561over 45 12 2,524 0.084
TOTAL 960 3,015,970 100
Figure A4.4 Isochrone Map on Average Travel Time to the Closest University
Source: World Bank’s calculations with road survey data 2017, WorldPop 2015, Ministry of Education.
Table A4.4 Distribution of Rural Population and Average Travel Time to the Closest University
Time Intervals (min.) Number of Settlements Total Population (2013) % pop
0-15 154 1,824,867 60.5115-30 202 416,429 13.81
30-45 198 406,675 13.48over 45 406 367,999 12.20
TOTAL 960 3,015,970 100
Figure A4.5: Average Travel Times to the Closest School by Marz
Source: World Bank’s calculations with road survey data 2017, WorldPop 2015, Ministry of Education.
Figure A4.4 Isochrone Map on Average Travel Time to the Closest University
Source: World Bank’s calculations with road survey data 2017, WorldPop 2015, Ministry of Education. Table A4.4 Distribution of Rural Population and Average Travel Time to the Closest University
Time Intervals (min.) Number of Settlements Total Population (2013) % pop
0-15 154 1,824,867 60.5115-30 202 416,429 13.8130-45 198 406,675 13.48over 45 406 367,999 12.20
TOTAL 960 3,015,970 100
60.5113.81
13.48
12.20
0-15 15-30 30-45 over 45
Figure A4.5: Average Travel Times to the Closest School by Marz
Source: World Bank’s calculations with road survey data 2017, WorldPop 2015, Ministry of Education.
10.3
10.3
10.411.8
11.9
12.3
12.7
12.8
13.0
14.1
0.0 2.0 4.0 6.0 8.0 10.0 12.0 14.0 16.0
min
GegharkunikKotaykVayotz DzorTavushLoriShirakArmavirAragatsotnSyunikArarat
ANNEX IV

64
1. Aim and objectives. The overall aim of the study is to assess mid- and longer-term impacts of the LRIP through qualitative evaluation of ex post views, perceptions, expectations, welfare, and livelihood outcomes of the beneficiaries for selected LRIP communities (or “treatment communities”) and comparator communities (or “control communities”) that did not benefit from road rehabilitation.
2. Hence, this assessment was ex post evaluation (since the project was closed in 2013) focusing on a series of welfare outcomes of the beneficiaries (users of the roads and those living nearby) trying to evaluate the impacts of the project from a longer-term perspective. The main objectives of the evaluation were as follows:
• To describe the profile of the beneficiary population and selected comparator communities that did not benefit from the LRIP;
• To provide insights on how beneficiaries perceive the social and economic impacts of the project;
• To collect evidence on differences of impacts of the project in low-income households and other vulnerable groups (women, elderly, and people with disabilities);
• To identify the opportunities that the project has brought to SMEs and the agricultural sector, particularly small-scale farmers, located in the area of influence; and
• To assess mobility, migration, social interaction, and other social behavior patterns and changes in them.
3. Assessment strategy. To achieve study objectives, a more detailed assessment matrix has been elaborated to design the study (see Section 6). The matrix comprised three sets of outcomes: short-term, midterm, and long-term. Short-term outcomes had already been evaluated during the LRIP M&E activity and were not targeted by the study. Midterm outcomes refer to four main short-term outcome objectives set out in the M&E plan of the LRIP: changes in mobility, transport services, employment, and road/community safety. Long-term outcomes expected from the project are defined as broader transitions of social, economic, and cultural contexts of life in project communities, such as poverty reduction, social inclusion, and gender empowerment.
4. As already defined, the evaluation mainly used qualitative indicators to assess the contexts and lived experiences of project beneficiaries, their real-life stories, and motivations. Therefore, the study methodology emphasized qualitative data collection methods, particularly FGDs, KIIs, direct observations, and CSC exercises. The qualitative approach allowed gaining of greater insights into the outcomes of the project; an understanding of underlying reasons, perceptions, and motivations that had resulted in specific outcomes; and the extent to which the LRIP might have contributed to poverty alleviation, equity, and access to social services. The qualitative approach also unveiled impacts that might have been hard to measure or observe during quantitative studies.
5. For the impact evaluation, the study used comparator and retrospective analyses, including comparison of project communities to comparison communities. The comparison communities were selected based on purposeful matching of project and nontreatment groups. The evaluation did not have a statistically strong component, but it is designed as a quasi-experimental qualitative impact evaluation. For retrospective analysis, a number of tools, such as retrospective questions and visual techniques, were used. Responses to retrospective questions were compared among control and treatment groups to test their bias (including recall bias).37
37 To strengthen the posttest, secondary data from previous surveys for the impact evaluation of the LRIP were used to estimate mid- and end-term conditions of the targets; particularly, two main evaluations were emphasized: “Rural Roads Rehabilitation Project Qualitative Process Analysis Final Report” conducted by Socioscope Societal Research and Consultancy Center NGO for MCA-Armenia in 2010 and “Evaluation of an MCC- and World Bank-Financed Rural Road Rehabilitation Project in Armenia” conducted by Mathematica Policy Research in 2013.
ANNEX V :METHODOLOGY AND SAMPLING FOR QUALITATIVE ANALYSIS

65
6. Data collection tools. The data collection consisted of 30 FGDs with representatives of the treatment population and 30 KIIs with representatives of other direct and indirect beneficiary entities and target groups in both project and comparator communities. Data triangulation was conducted among data sources (secondary statistical data collected from the local authorities, official statistical databases, and interview data from the general population and other key informants), data collection methods (focus groups and semi-structured interviews), and data collection teams (different teams worked with different target groups in different regions). Triangulation included comparing main findings and reconciling and integrating them. If different estimates were obtained, the data were reviewed to understand why differences occur. In some cases, teams returned to the field to investigate further.
7. The following three sets of study instruments were elaborated by the consultant and pretested before the fieldwork:
• FGD guides with “ladder of life” exercise
• KII semi-structured protocols
• CSCs
8. The CSC exercise was elaborated as a chart for the respondents to fill. CSCs were incorporated into FGD and KII tools as a last module to be discussed and filled. For FGDs where there were many participants, the moderators tried to make sure that everyone had a chance to vote and scores were aggregated at the end. A five-point scale was used to estimate the main criteria. Among criteria for assessment in scorecards the following were used: state of the road, safety of the road, and quality of maintenance activities. There were also some statements for the assessment related to subjective perceptions of project outcomes. Basic criteria were used for all target groups, but there were some specific criteria used only in a defined set of tools (e.g., only for the Transport Service Managers Interview Protocol).38
9. Among main topical domains, individual and group interviewing instruments covered the following set of issues:
• Basic demographic and economic description of community population, including perceived trend;
• Mobility, interaction, and transport patterns and needs, including (a) quality and transit conditions in the local region, (b) reliability and road safety, (c) accessibility improvements, (d) patterns of mobility behavior within and between communities, and (e) availability and affordability of existing intermunicipal public transport services;
• Modalities of participation of citizens in the implementation and M&E of the project, including the existing institutional channels that allow citizen participation;
• Perception of social impacts, such as (a) timing of the impact (short-, medium-, and long-term); (b) type of impact (access to property, access to economic activities, access to services, empowerment, and gender empowerment); and (c) type of social groups affected (impacts differentials—socioeconomic, gender, and age);
• Migration patterns and changes, including internal and external migration and labor and educational migration;
• Perception of economic impacts, such as access to markets, social services, financial services, and employment; land use changes/crop specialization; changes in production patterns, nonagricultural activity, and enhanced trade/local market development; changes in household income sources; and poverty and human development outcomes; and
• Social risks, constraints and needs, such as opposition from certain groups, capture of benefits, lack of interest in participating, corruption, and so on.
10. All modules of the guideline contain tables with retrospective questions concerning the changes within the community and comparison of 2009 and 2017 periods.39
38 For more detail see Methodological Note Document and Instruments of the Study.39 For study Instruments see pre-test report of the study.
ANNEX V

66
ANNEX V
11. Three types of KII protocols were elaborated for the following targets:
• Representative of the community administration office (community leaders);
• Owners/directors/presidents of SMEs and NGOs; and
• Representatives of public transport implementing and managing entities.
12. For the elderly and for women, a separate module of questions was elaborated to address gender empowerment and group-specific outcomes.40 To pretest the instruments, sampling, and recruitment scheme a pilot study was conducted in the community of Akunk of the Kotayk Marz from March 18 to March 24, 2017 (including the training and reporting).41
13. Five FGD teams (a moderator and an assistant/notetaker in each) worked simultaneously in different locations. The distribution of the teams across selected marzes was determined by the geographical location of selected communities. In general, each FGD team completed a total of six FGDs. This model enabled the research team with additional time management opportunities, allowing contingency planning. Male facilitators conducted FGDs with male population and female moderators worked with female groups. Female notetakers worked in all types of focus groups. Mixed groups were facilitated either by male or female moderators. Appointments for KIIs proceeded simultaneously. Two main interviewers collected the data.
14. The teams ensured that all participants provided their view or at least had the chance to talk. During the training of moderators, special attention was paid to:
• Stimulate discussion;
• Structure the discussion on improvements resulting from the project, but skip “forced” or leading questions, to generate observation bias; and
• Stimulate broader capture of longer-term effects that are not easy to discern and to focus on processes rather than end results.
15. Audio recording and note-taking in Armenian were completed during the FGDs and KIIs. The notes included mapping of the participants around the table, nonverbal behavior, and other reactions. The transcription in Armenian and storing of the data (audio record files) proceeded simultaneously with the fieldwork. Short wrap-ups in English were elaborated and submitted on a regular basis to the World Bank team. Short reports or wrap-ups contained a breakdown of participants by basic characteristics, comments on atmosphere/tone of each discussion, key issues emerging, and a summary of key conclusions and what was special/different/telling about each FGD.
16. Study sample. A multistage typological sample strategy has been used to design the sample. In the first stage of selection, among nine marzes (regions/provinces) of Armenia, covered under three components of the LRIP, five marzes were selected, considering the length of roads rehabilitated and the beneficiary population count across the marzes. The top five marzes with the largest length of road rehabilitated under the LRIP and the largest numbers of the beneficiary population from nine Armenian marzes were selected for the study (see Table A5.1).
Table A5.1: Marzes Selected for the Study
Marz Number of Direct Beneficiary Popu-lation (Number)a
Length of Rehabilitated Roads under the LRIP (km)
Tavush 82,786 75.70
Shirak 539,054 72.50
Syunik 119,126 61.06
Kotayk 139,117 52.20
Gegharkunik 215,394 50.60
Note: a. These numbers are calculated based on ICR Data for Armenia: Lifeline Roads Improvement Project (Credit 4549-AM) and Additional Financing—Lifeline Roads Improvement Project (Loan 7751-40 For more details on study instruments, see Methodological Note of the Study.41 For more details on the pilot, see Pilot Report of the Study.

67
AM) and Second Additional Financing (Loan 7936-AM) document: indicator “beneficiary population.” Main beneficiary population of the project is defined as rural community target groups living along the project roads that directly benefit from (a) the creation of employment for the rural population and (b) better access to social services and economic markets.
17. In the second stage, a selection of project communities was conducted. Two main criteria were used to stratify project communities within each region of Armenia to guarantee some degree of heterogeneity of information:
•Status of the com munity.42 Using different sources of statistical data to classify communities within each marz based on their size (as small/large communities) and income levels (relatively well-off versus poorer communities43 )
•Proximity to large cities. Far versus closer communities to regional center
18. With these criteria, communities within each marz were located into one of four “cells.”
Table A5.2: Sample Categories
Status of Community Proximity to Large CitiesC. Close (0–35 km from the
marz center)D. Far (35 km and more from the marz
center)A. Rural, small/poor AC ADB. Rural, large/not poor BC BD
Source: Qualitative Assessment.
19. Several communities were located in each cell. With this stratification, around four cells for each region were obtained. Nevertheless, not all cells were populated and there were cells with a low number of communities. To guarantee focus of the study and some degree of representativeness, only cells with a “sufficient” number of communities were selected.
20. Selection of communities was performed from each cell, depending on their logistics, transportation costs, and possibilities of recruitment. Sample verification was performed through phone calls to community heads to cross-check whether the community is situated close/on the roads rehabilitated during the project. Besides, some communities targeted during the MCA-funded evaluation study in 2010 were also included in the final list of selected communities.
21. The number of finally selected project communities is 10: two per marz, each fitting criteria types defined earlier.
22. At the third stage of sample design, a selection of five comparison communities was performed using official statistical data to make a statistical matching with main project communities in each of the five marzes. We included five comparison communities to be selected from the list of control communities that had been included in the MCC-Mathematica Impact Evaluation of the LRIP Project. As Mathematica’s sampling list was elaborated in 2013, some of control communities have been included in other road rehabilitation projects and were identified as ineligible for study purposes. Therefore, for each marz, one comparator community from the Mathematica study was selected and one reserve community, not covered under any road rehabilitation project, was selected as a standby in case of ineligibility of the community from the 2013 list for counterfactual purposes.
23. In each project community, three FGDs were conducted with the following categories of population:
• Women ages 30-50• Men ages 30-50• Men/women ages 60 and above
42 A community is an urban or rural settlement. In road section definitions, most of communities are villages.43 For this purpose, diff erent sources of data were used, such as sizes of population available at the NSSRA, prox-For this purpose, different sources of data were used, such as sizes of population available at the NSSRA, prox-imity to large cities available on online maps, and income levels of communities available from other surveys conducted by the consultant with community-level identifiers possessed by the consultant.
ANNEX V

68
ANNEX V
24. The criteria for recruitment of participants were the following:
• Age• Gender• No less than seven years of residence in the community• Location of the household with respect to the road: half of the participants should be located
“close” to the road, whereas the other half will be located “far” from the road• Several participants to be seasonal migrants or members of their families
25. To recruit the participants in cooperation with the village mayor’s office, a list of 25-30 participants fitting the recruitment criteria was created. To reduce possible bias, village mayors did not participate in the final selection of respondents from the list. About 15-20 people were selected and contacted for gaining cooperation with the team. About 6-10 of them participated in actual FGDs while the others were kept for the reserve list.
26. Groups were diverse in employment status of participants (people engaged in agriculture, service, industry, unemployed, and so on). A total of 30 FGDs were conducted in treatment communities.
27. A total of 30 KIIs in 10 project communities and in five comparator communities were conducted with representatives of the following fields:
• Transport service providers and managers in the capital or a city near the project road (six in total);
• Community leaders or other community administration representatives (10 in project community and five in comparator community); and
• SMEs (nine in total in both comparator and project communities).
28. Key informants were selected based on objective information collected at community administration and short recruitment quests. The list of key informants from transport service and SME sectors was prepared before the fieldwork in each of the regions based on information collected through observations and discussions with heads of communities and other people at the communities and regional center in places during first field trips of the team to the region. The final selection of candidates for KIIs was conducted and approved by the World Bank team to launch the fieldwork in each of the regions.
29. Sample implementation and shifts. A sample of comparison communities was verified before the fieldwork in the region to fit the requirements set by the design. Four of five control communities from the initial sample were replaced by other communities as they all had rehabilitated roads and could not be used for comparison purposes. The replacement in each case was conducted after the KII with representatives of transport and road departments of regional administration offices (marzpetaran) and observations of the team in place. Based on their expertise, some options for comparison were elaborated and discussed with the World Bank team before final approval. In the comparison community of Tufashen in the Shirak Marz, there were no SMEs identified except a small food store; therefore, a decision was made to interview the representative of Panik road maintenance company who was in charge of roads in the region, including in Tufashen.
30. The final sample of the study covered a total of 60 group discussions and interviews in 15 communities of five marzes of Armenia (see Table A5.3).

69
Table A5.3: List of Surveyed Communities
Region CommunityCommu-
nity Sample Status
Number of FGDs
Number of KII Community
Administration
Number of KIIs with
SMEs
Number of KIIs with Transport
DepartmentsGegharkunik Gagarin Project 3 1
11Gegharkunik Lchashen Project 3 1
Gegharkunik Lchap Comparison 0 1 1Kotayk Zar Project 3 1
11Kotayk Akunk Project 3 1
Kotayk Kasakh Comparison 0 1 1Shirak Panik Project 3 1
12Shirak Nor Kyank Project 3 1
Shirak Tufashen Comparison 0 1 0Syunik Brnakot Project 3 1
11Syunik Hartashen Project 3 1
Syunik Darbas Comparison 0 1 1Tavush Lusahovit Project 3 1
11Tavush Artsvaberd Project 3 1
Tavush Aknaghbyur Comparison 0 1 1
Total 1510 project and 5 com-parison
30 15 9 6
Total 30 FGDs and 30 KIIs
31. A total of 30 FGDs were implemented with 217 persons from project communities, of whom 105 (48.4 percent of all participants) were women and 74 (or 34.1 percent) were labor migrants or members of a family with labor migrants. The average number of participants per FGD is seven (at least six people participated in discussions; the maximum number of participants is 10). The average age of participants is 51 years (youngest was 30 years and oldest 88 years); most of them have general secondary and secondary vocational education. Though around 73 percent of participants are actively involved in farming, around 65 percent of participants have other nonagricultural paid jobs. The most popular sectors of nonagricultural occupation among participants are different state-based institutions, such as community services (24.3 percent of total) and education (10.7 percent of total). The majority of participants (87 percent) are married. The average number of children under 18 is around one. The most popular transport means used by the participants are private cars (51.2 percent of total) and public transport (33.6 percent of total). Among those using own transport means, the largest share are men under 55, while women under 55 and the elderly (ages 60+) are main users of public transport. Around 60 percent of all participants use the rehabilitated road section on a daily basis.
32. Fieldwork implementation. The fieldwork team contacted local authorities in selected communities to ask for their support for the study and to organize the sessions in any appropriate community building (such as local mayors’ office, medical center, cultural center, and so on). The World Bank representative joined the team during several FGDs in the field. The local authorities did not interfere with the discussion and did not influence the participants and their views. A total of 60 short reports in English were elaborated and submitted for each of the conducted interviews/sessions, and 60 full transcripts were elaborated and submitted in Armenian.
ANNEX V

70
1. One focus of the qualitative assessment was to capture the perception of road use and impacts from road rehabilitation by different segments of LRIP beneficiaries. Among other policy aspects requiring special attention was the identification of the priorities or top constraints, other than transport, that surveyed communities faced. A careful examination44 of these priorities in all the villages in the sample are presented below. Overall, the following 19 priorities have been mentioned by respondents in study communities.
Table A6.1: Most Pressing Problems Faced by the Communities
Identified Priorities Number Percentage of Total Re-sponses
Lack of irrigation 10 16.1Absence and bad conditions of kindergarten or school 8 12.9Intracommunity road/street, secondary (intercommunity) road rehabilitation
6 9.7
Obtaining workplace, settling unemployment, and lack of em-ployment
5 8.1
Construction/rehabilitation of cultural center 5 8.1Road quality 4 6.5Lack of agricultural equipment 4 6.5Lack of drinking water 3 4.8Organizing entertainment/leisure for the youth 3 4.8Lack of market for selling the produce 3 4.8Development/rehabilitation of sports facility (hall, stadium, and so on)
2 3.2
Lack of playground for children 2 3.2Lack of electricity 1 1.6Lack of sewage 1 1.6Lack of gas 1 1.6Lack of greenhouses 1 1.6Garbage collection 1 1.6Lack of social support programs 1 1.6Development of agriculture/farming, “matching farmers to the land”
1 1.6
Total 62 100.0
Linking these responses to those of FGDs, some of the most pressing service and infrastructural needs of the communities that benefited from the project and those that did not can be discerned, as follows:
44 An open-ended question on identifying up to five top important problems which were faced by the community was used during the KIIs with the heads of all 15 study communities. Village mayors were asked to rank the most signifi-cant problems. The analysis of distribution of all given options to this question in multiple response aggregation was processed. Thus, 62 responses were given by 15 community leaders. Collected verbatim quotations were entered in a database and a coding scheme was developed to close-up the responses for making a quantitative analysis.
ANNEX VI:REVEALED PRIORITIES FOR VILLAGE MAYORS IN SURVEYED COMMUNITIES

71
• Rehabilitating intra and intercommunal roads. Road quality is still a pressing concern in some marzes (Gegharkunik and Shirak) as well as the five control communities, where local dwellers identified poor quality of the roads, lack of maintenance of rehabilitated roads, and lack of links from the community to main road section. Since intra-communal roads are in such a bad condition, high vehicle maintenance costs might have eclipsed the initial gains from the LRIP in terms of lower vehicle operating costs, which might have been the impact of road rehabilitation projects. At the same time, it is important to have some objective measurement on the road quality to proceed.
• Improving irrigation systems. Overall, in the five study communities, lack of irrigation was considered as the most significant priority for community development. Moreover, the problem was emphasized in all studied regions (Gegharkunik, Kotayk, Shirak, and Tavush Marzes).
• Generating employment. Lack of off-farm employment opportunities figured prominently in all the discussions. FGD respondents stressed that they were all eager to work in different jobs independent of the sector, but the lack of employment opportunities in the rural area prevented them from moving out of subsistence farming or graduating from existing social safety nets. Some of the participants recalled stories about factories and processing companies that had been active and effectively working in their regions during the Soviet period, while in independent Armenian those facilities are not being used because of lack of investments.
• High household debt. Another critical problem faced by FGD participants in all 10 project communities is the credit burden faced by households not only for acquiring assets (livestock) and for purchasing machinery and inputs for agricultural production, but also for current expenditure and payment of university and health bills. The difficulty arises when agricultural credits are being used for the purchase of seeds, seedlings, fertilizers, but there is no possibility of predicting either ideocratic or covariate risks which affect yields. Hence, respondents mentioned that households in rural areas must take on additional loans to service their debts, hence impoverishing them further.
ANNEX VI

72
Table A7.1 summarizes selected demographic and social indicators as well as those related to service availability and condition of the settlement’s road network. As can be observed, the average number of households per community is 1,112 per community which is above the average of 642 households per settlement for Armenia. Migration trends in these communities are also in line with the average for the whole country. For instance, project communities have on average 49 labor migrants (seasonal) per 1,000 residents, while the average for Armenia is 46 per 1,000 residents. Other indicators such as retail points, vehicle ownership, and firm density also depict comparable values for both the project communities and all settlements in Armenia.
Table A7.1: Selected Indicators for the LRIP’s Project Communities (2015)
Indicator Project Com-munities
Armenia (excluding Yerevan and Gyumri)
Demographics, Vehicle Ownership, and Firm DensityAverage number of households 857 639Average number of residents 3,417 2,371Number of retail points per 1,000 residents 1.8 1.8Number of labor migrants per 1,000 residents 49 46Number of vehicles owned by community per 1,000 residents 140 141
Number of enterprises operating per 1,000 residents 5.0 6.0Service Availability (Education and Health)
Number of secondary schools operating (per 10,000 residents) 2.6 3.6
Number of primary schools operating (per 10,000 resi-dents) 1.5 1.5
Number of high schools operating (per 10,000 resi-dents) 0.4 0.4
Operating hospitals (per 10,000 residents) (urban only) 0.6 0.6Rural health points operating (per 10,000 residents) (rural only) 0.6 0.4
Rural medical ambulatories and primary health centers operating (per 10,000 residents) (rural only) 1.9 1.9
Other health care institutions operating (per 10,000 residents) 0.2 0.2
Dental and medical care institutions operating (per 10,000 residents) 1.6 1.7
Land ValueAverage market price for 1 ha of agricultural land agri-cultural lands (Armenian drams) 2,884,625 2,502,955
Average market price for 1 ha of agricultural land arable lands (Armenian drams) 3,879,396 2,745,284
Average market price for 1 ha of agricultural land or-chards (Armenian drams) 3,374,167 2,215,478
Road Conditions
ANNEX VII:SELECTED INDICATORS FOR THELRIP’S PROJECT COMMUNITIES

73
Indicator Project Com-munities
Armenia (excluding Yerevan and Gyumri)
Average length of intercommunal road network (urban only) (km) 71.2 60.6
Average length of asphalt intercommunal road network (urban only) (km) 35.3 36.8
Average condition of intercommunal roads (1-very bad to 5-excellent) (km) 2.9 3.1
Average condition of intercommunal roads (1-has a surface to 4-doesn’t have a surface) 1.9 2.2
Average condition of community highway road (1-has a surface to 4-doesn’t have a surface) 1.6 1.9
Average condition of community tertiary roads (1-has a surface to 4-doesn’t have a surface) 2.9 2.9
Service Accessibility (Education, Health, Water, Other Facilities [in %])a
Insufficient access to drinking water 65 59Insufficient access to health services 79 75Insufficient access to public education, conditions 54 52Community does not have a sewage pipeline 85 82Community does not have a centralized gas supply 25 37Community does not have a post office/long-distance communication hub 18 30
Community does not have a centralized water supply 48 47
Source: MTAD database 2015.
Note: a. Service accessibility is calculated through a community-level ranking that combines perceptions of community governors on access and quality of services with an objective measure of service availability.
ANNEX VII


9 Grigor Lusavorich Street, Yerevan 0015
+37410 520992


