Embed Size (px)
Citation preview

Volume 43 Number 1 | Journal of Research on Technology in Education | 53Copyright © 2010, ISTE (International Society for Technology in Education), 800.336.5191
(U.S. & Canada) or 541.302.3777 (Int’l), [email protected], www.iste.org. All rights reserved.
Connecting Instructional Technology Professional Development to Teacher and Student Outcomes JRTE | Vol. 43, No. 1, pp. 53–74 | ©2010 ISTE | www.iste.org
Connecting Instructional Technology Professional Development to Teacher and Student Outcomes
Wendy Martin and Scott Strother Education Development Center, Inc.1
Monica BeglaueMINTS National Center
Lauren Bates, Timothy Reitzes, and Katherine McMillan CulpEducation Development Center, Inc.
Abstract
This article presents findings from an evaluation of an instructional-technol-ogy professional development (PD) program that uses many practices advo-cated by PD experts. In this multiphase evaluation, evaluators examined the program, determined whether variations in program implementation had an impact on teacher outcomes, and then looked at whether variations in program implementation and teacher outcomes had an impact on student achievement. We found that greater PD fidelity was associated with higher-quality lesson plans and higher student achievement. This evaluation suggests that instructional-technology PD that is closely aligned to a program’s core conceptual foundations can lead to positive teacher and student outcomes. (Keywords: professional development, technology integration, fidelity)
High-quality professional development (PD) is central to any education improvement effort, particularly those that seek to integrate technol-ogy in support of classroom instruction. Successful implementation
of education technologies depends upon extensive, high-quality teacher PD and ongoing support (Lemke & Fadel, 2006; O’Dwyer, Russell, & Bebell, 2004; Penuel, 2006). Although the education community has a generally shared un-derstanding about what constitutes high-quality PD (long duration, follow-up support, active engagement in relevant activities, access to new technologies, collaboration and community building among participants, shared under-standing of student achievement), understanding how to measure impact has been a challenge (Desimone, 2009; Lawless & Pellegrino, 2007; Penuel, Fish-man, Yamaguchi, & Gallagher, 2007; Porter, Garet, Desimone, Yoon, & Birman 2000; Yoon, Duncan, Lee, Scarloss, & Shapley, 2007). This lack of consensus has resulted in a paucity of systematic empirical evidence that can support the
1 The University of Missouri contracted Education Development Center, Inc., to conduct an external evaluation of the eMINTS program, which is the focus of this study.

54 | Journal of Research on Technology in Education | Volume 43 Number 1
Martin et al.
Copyright © 2010, ISTE (International Society for Technology in Education), 800.336.5191(U.S. & Canada) or 541.302.3777 (Int’l), [email protected], www.iste.org. All rights reserved.
connection between PD practices and outcomes, such as teacher knowledge and student achievement. Perhaps one reason for this is that student out-comes are at least one step removed from a teacher’s PD. At the theoretical level, researchers propose multistage processes from teacher PD to student outcomes (Desimone, 2009; Fukkink & Long, 2007; Lawless & Pellegrino, 2007; NICHD Early Child Care Research Network, 2002; Yoon et al., 2007). Each model shows a stepwise progression toward student outcomes, where PD changes teacher knowledge and skills, leading to improved classroom instruction and, finally, enhanced student achievement. The impact is medi-ated by teacher learning and application; thus, changes at the student level are the hardest to find.
Recently, however, educational researchers have been making an effort to develop frameworks for a more systematic approach to research on PD to establish a consistent body of evidence (Desimone, 2009). Some research-ers have focused their efforts specifically on investigating effective imple-mentation of instructional-technology PD (Lawless & Pellegrino, 2007). In their review, Lawless and Pellegrino recommend a three-phase approach to designing evaluations that look at the quality and effectiveness of these experiences. The first phase involves an examination of the PD design to develop a systematic understanding of its particular characteristics. The second phase looks at the relationship between program characteristics and teacher outcomes. The third phase looks at teacher change and student ef-fects. In this way, the logical progression of potential impact can be studied, allowing for “an examination of how variation among key characteristics at one level affects variation in important outcomes at the next level” (Lawless & Pellegrino, 2007, p. 602). In this article, we use this framework as a way to organize and present our evaluation findings.
Historically, the lack of obvious alignment between technology PD (which has traditionally focused on software and other electronic resources) and the highly specified content areas teachers need to cover to prepare students for state assessments has made it difficult for research to show connections between technology PD and student outcomes. However, PD that makes an explicit connection between technology and specific types of instruction that have been shown to be effective can establish a viable chain of reasoning in which technology use can be linked to changes in student learning (Penuel, 2006; Ravitz, 2009; Ringstaff & Kelley, 2002). Teachers who have successfully integrated technology in the classroom have reported experiencing PD that helps them to understand how technologies can connect to curriculum and standards and provides a sound pedagogical approach (Penuel, 2006). Research on high-quality PD has emphasized the importance of exposing teachers to explicit models of how student learning unfolds within particular content areas, so that instruction can be informed by an understanding of the learning it is intended to support (Garet, Por-ter, Desimone, Birman, & Yoon, 2001; Kennedy, 1999). This is consistent

Volume 43 Number 1 | Journal of Research on Technology in Education | 55
Connecting Technology Professional Development to Outcomes
Copyright © 2010, ISTE (International Society for Technology in Education), 800.336.5191(U.S. & Canada) or 541.302.3777 (Int’l), [email protected], www.iste.org. All rights reserved.
with research on school improvement initiatives, which identifies quality of instruction as the missing component in many views of school change and stresses its key role in improving student learning (Cohen & Hill, 2001; Peu-rach, Glazer, & Gates, 2004; Raudenbush, 2005). By examining how the PD emphasizes specific instructional approaches and their possible impact—first on teachers, then on students—this article is designed to highlight the connections between program characteristics and outcomes.
Description of the ProgramThe program that is the focus of this study, eMINTS (enhancing Missouri’s Instructional Networked Teaching Strategies; http://www.emints.org), was begun in 1999 by educators at the University of Missouri, Columbia, to pro-vide PD to teachers in the state. It is part of a suite of PD programs created to help educators, administrators, and technology specialists understand how to integrate technology into an instructional approach that employs inquiry-based learning, alternative assessment, collaboration, and commu-nity building among teachers and students. The program has since expanded to other states and another country. eMINTS PD has two delivery formats:
1. Comprehensive professional development (Comp PD): a two-year program consisting of 250 hours of PD and support, including 10–12 classroom visits each year
2. Supplemental professional development (eMINTS4ALL): a two-year program developed for teachers in the grades above and below Comp PD teachers or in content areas complementary to those where the Comp PD is implemented, consisting of 90 hours of PD, including 8–9 classroom visits per year
Program development was informed by contemporary research and theorizing (see, for example, Hall & Resnick, 1998; Louis & Kruse, 1995; Sandholtz, Ringstaff, & Dwyer, 1990). It utilizes PD features that empirical studies have shown to be effective, such as having a reform approach (Penuel et al., 2007; Yoon et al., 2007), being sponsored by a university (Penuel et al., 2007), introducing new technologies for teaching and learning (Lawless & Pelegrino, 2007), and having a clear vision of student achievement (Adel-man, Donnelly, Dove, Tiffany-Morales, Wayne, & Zucker, 2002; Sparks, 2002). The program incorporates four of the five main features of PD that Desimone (2009) contends are part of effective PD: utilizing active learning, having coherence between the PD and the teachers’ knowledge and beliefs, having adequate duration, and using collective participation among teachers in a department, school, or grade. The International Society for Technology Education (ISTE) has also conducted two alignment reviews on eMINTS to determine the extent of program content alignment with the National Edu-cational Technology Standards for Teachers (NETS•T). Below we elaborate on how the program aligns with research about effective PD.

56 | Journal of Research on Technology in Education | Volume 43 Number 1
Martin et al.
Copyright © 2010, ISTE (International Society for Technology in Education), 800.336.5191(U.S. & Canada) or 541.302.3777 (Int’l), [email protected], www.iste.org. All rights reserved.
Active LearningAs formulated by Desimone (2009), “active learning” includes observ-ing expert teachers provide instruction, being observed while teaching, engaging in interactive feedback or discussion, reviewing student work in a content area covered by the PD, and leading discussions. Teachers in eMINTS participate in active learning activities during both years of PD. During year one, teachers visit a peer teacher’s classroom to observe instruc-tion. A special “collaborative session” is reserved for participants to discuss technology implementation ideas. Active learning events increase during the second year: There are four collaborative sessions as well as another peer observation visit. Participants also present a lesson plan to peers for review. Additionally, teachers get hands-on practice using new technologies—such as computer software, interactive white boards, and digital cameras—before they use them in their classrooms.
CoherenceDesimone (2009) also argues that effective PD aims for coherence between a teacher’s beliefs and knowledge and the learning that takes place during PD; coherence between the PD and education policies or reform efforts relevant to the teacher is also important. eMINTS is aligned with both kinds of coherence. Teachers either volunteer to participate and thus self-select into a program coherent with their beliefs, or participate in the program as part of a school-based effort. In the latter case, teachers typically participate with other teachers in their school and, in some cases, with all of their fellow grade-level teachers. Teachers cannot participate without at least one other teacher from their school and approval from their school and district.
The instructional specialists also help connect PD to classroom instruc-tion. They visit each participant’s classroom 8–12 times per academic year to observe participants giving lessons and to provide feedback, guide participants through reflective practice, model instruction, provide techni-cal support, and assist with lesson planning. Several studies have found the combination of coaching with PD to be an especially effective means of changing teacher practices (Dickinson, Darrow, & Tinubu, 2009; Koh & Neuman, 2009; Neuman & Cunningham, 2009; Sheridan, Edwards, Marvin, & Knoche, 2009). Perhaps most important for coherence, the instructional specialist responds to participant requests for support and tailors visits to the teacher’s interests as well as the requirements of the school or grade.
DurationParticipants complete two years of PD, including 90 (eMINTS4ALL) or 250 (COMP PD) contact hours with an instructional specialist. The program’s hours far exceed Yoon et al.’s (2007) finding that programs with a minimum of 14 hours of PD led to positive and significant effects on student achieve-ment, with an average effect size of .54. Other recent programs with signifi-

Volume 43 Number 1 | Journal of Research on Technology in Education | 57
Connecting Technology Professional Development to Outcomes
Copyright © 2010, ISTE (International Society for Technology in Education), 800.336.5191(U.S. & Canada) or 541.302.3777 (Int’l), [email protected], www.iste.org. All rights reserved.
cant student outcomes included 21 hours of PD plus three coaching visits (Davidson, Fields, & Yang, 2009) and 44 hours of satellite broadcast PD (Jackson, Larzelere, St. Clair, Corr, Fichter, & Egertson, 2006).
Collective ParticipationCollective participation includes participation of teachers from the same grade, school, or department (Desimone, 2009). As mentioned above, the program can be a collective PD experience for teachers at a particular school. Additionally, many of the PD sessions explicitly encourage the devel-opment of a community via team-building activities. The program also has online discussion and e-mail lists. Each class of participants remains togeth-er with the same instructional specialist for at least one year of PD sessions.
Reform Approach Although there is evidence that content-focused PD that targets specific subject areas leads to improved student outcomes (Desimone, 2009), other research finds that a reform or reform-like approach can also be effective (Penuel et al., 2007; Yoon et al., 2007). As eMINTS is offered to teachers of any subject area and grades K–12, it does not have a content-area focus. In-stead it takes the reform approach, which, according to Penuel et al. (2007), includes PD designed with “proximity to practice” in mind: The PD is about “helping teachers to prepare for their classroom practice [which] yields results directly translatable to practice” (p. 928). The bulk of the program’s PD sessions are designed to link technology and new pedagogy directly to application in the classroom. For example, a number of PD sessions give participants time to create and develop lesson plans for use in classrooms, based on the program’s instructional model.
University SponsorshipPenuel et al. (2007) found that university-based PD providers were associ-ated with more favorable teacher outcomes than school-based PD provid-ers for the same program. eMINTS was developed by a team of education specialists at the University of Missouri, Columbia. The university-based program team has been able to draw upon university resources to support ongoing program development and improvement.
New Technologies for Teaching and LearningLawless and Pellegrino (2007) argue that introducing teachers to new technologies for teaching and learning can support a change in teaching practices. The PD program in this article not only demonstrates how to use technology, but also teaches participants how the technologies can support instructional goals. Facilitators provide ongoing, site-based technical sup-port and feedback to teachers for two years as they integrate these technolo-gies in their lesson plans and classrooms.

58 | Journal of Research on Technology in Education | Volume 43 Number 1
Martin et al.
Copyright © 2010, ISTE (International Society for Technology in Education), 800.336.5191(U.S. & Canada) or 541.302.3777 (Int’l), [email protected], www.iste.org. All rights reserved.
Clearly Articulated Vision of Student AchievementA number of studies (Adelman et al., 2002; Sparks, 2002) argue that PD must clearly articulate expectations for student achievement to change stu-dent outcomes. eMINTS introduces teachers to standards-based curriculum and instruction; all lesson plans developed by participants must address state learning standards. The PD also includes a session reviewing how inquiry-based lessons can prepare students for state assessments. Furthermore, the program aligns closely with ISTE’s National Educational Technology Stan-dards for Students (NETS•S).
Evaluation QuestionsIn 2006, eMINTS was being scaled up to different states. To ensure that it could maintain a high level of program quality as it scaled up, the program staff recognized the need to build a better understanding of program fidelity and its relationship to the program’s impact on teachers and students. They commissioned this evaluation to look at these relationships over two years. The questions that guided the evaluation were the following:
• What is the relationship between PD fidelity and the quality (defined as alignment with core program concepts) of the lesson plans produced by participating teachers?
• What are the relationships between the various activities during instruc-tional specialists’ classroom visits and the quality of lesson plans teachers produce?
• What are the relationships between PD fidelity and the various classroom visit activities?
• What is the relationship of PD fidelity, lesson-plan quality, and classroom visit activities to the achievement of students in the classrooms of par-ticipating teachers? Do the relationships persist a year after teachers have completed the program?
MethodsThis evaluation took a three-phase approach to understanding the program’s potential impact on participants and their students. We first examined the program’s core components and created an instrument to assess how faithfully it was implemented across sites. We then looked at teacher understanding of the program concepts and how variations in PD fidelity were associated with this outcome. Finally, we examined how variations in PD fidelity and teacher understanding were associated with student outcomes over two years.
This study was a program evaluation, and not an academic research study, which had implications for the study design and methods that we could use. Two important limitations of this study design include:
The evaluators did not design the program implementation. The pro-gram’s staff and its funders—the Missouri Department of Elementary

Volume 43 Number 1 | Journal of Research on Technology in Education | 59
Connecting Technology Professional Development to Outcomes
Copyright © 2010, ISTE (International Society for Technology in Education), 800.336.5191(U.S. & Canada) or 541.302.3777 (Int’l), [email protected], www.iste.org. All rights reserved.
and Secondary Education (DESE) and individual schools and districts—made the implementation decisions. Districts involved in the student achievement component of the study had to apply to the state to receive the program, as Missouri’s DESE provided funding and only a limited num-ber were accepted. Thus the sample may not be fully representative of all schools, because evaluators could use only districts that had capacity for, were eligible for, applied for, and received the program. However, there is reason to believe that there was not a strong selection bias among the teach-ers who participated in the program. First, in most of the districts, partici-pating schools sent all or nearly all teachers in specific grades to attend the PD, not only their “best” or most interested teachers. In addition, eMINTS commissioned a study by an external evaluator to determine whether there was evidence of a pattern of selection bias among eMINTS participants (Bickford, 2004). Using the analysis methods specified by Bifulco (2002), the study found there was no evidence of a selection bias.
Funding limitations prevented us from conducting enough observations of participant classrooms to use that technique to collect teacher outcome data. Instead, evaluators used the quality of the lesson plans that teachers submit-ted with their final program portfolios as a teacher outcome measure. This does not reflect student experience as well as classroom instruction would, but it was the best option given the limitations of the study. However, teachers were required to submit samples of student work (such as PowerPoint presen-tations, photos of student displays, student-made movies) in their portfolios as evidence that they had done the lessons in their classrooms. Although the evaluators did not rate the student artifacts, they included only lesson plans accompanied by student work samples in this study.
ParticipantsWe collected three levels of data: PD level, teacher level, and student level. Observers conducted 50 total observations of 31 different instructional specialists as they facilitated four-hour PD sessions. We calculated PD fidelity scores from these and matched those to 269 teachers in the corre-sponding PD sessions.
We attempted to collect three pieces of data for each teacher: lesson plans, classroom visit information, and PD fidelity data. With assistance from program staff, we collected at least one piece of teacher data for 296 teachers from 71 schools in 10 total districts in Year 1 of the study. We obtained class-room visit data for 272 teachers, PD fidelity data for 269 teachers, and lesson plans from 180 teachers. Teachers mainly taught elementary or middle grades (N = 287), with 9 teachers teaching at the high-school level.
We collected teachers’ corresponding students’ standardized test scores for the school years 2005-2006 (to be used as a control), 2006–2007 (Year 1), and 2007–2008 (Year 2). For analysis, however, we used only students from grades 3–5. We selected these grades because they had the highest number

60 | Journal of Research on Technology in Education | Volume 43 Number 1
Martin et al.
Copyright © 2010, ISTE (International Society for Technology in Education), 800.336.5191(U.S. & Canada) or 541.302.3777 (Int’l), [email protected], www.iste.org. All rights reserved.
of students, and data in each grade spanned 9–10 of the districts. Other grades had fewer students matched to teachers and spanned 5 districts at most. Thus 2,004 third to fifth grade students’ scores were used from Year 1, and 1,689 were used from Year 2 (see Table 1). These students matched to 148 teachers and 141 teachers, respectively. PD fidelity and teacher data were matched by teacher to each student.
PD FidelityThe program developers wanted to understand whether teachers who expe-rienced PD sessions more closely aligned to the core concepts of the pro-gram had better outcomes for themselves and their students. To determine this, it was important to understand what those core program concepts were. The evaluators worked with program staff to articulate what a faithful imple-mentation of the program would be, to define PD fidelity, and to measure it. The resulting framework identified the concepts that served as the founda-tion of the program:
• Modeling instruction: Instructional specialists who lead the PD sessions model the instructional techniques that are presented in the sessions.
• Community building: Instructional specialists engage participants in activities that support collaborative learning and community building.
• Technology utilization: Instructional specialists use technology to support their instruction, and participants use technology to work on projects during PD sessions.
• Connection to practice: In discussions and project work, instructional specialists and participants make connections between the PD-session content and participants’ instructional practice.
• Inquiry-based learning (IBL): Instructional specialists discuss how to integrate IBL into instruction. Participants engage in IBL techniques, such as formulating research questions, planning research, gathering data, analyzing data, and presenting findings.
Having defined the core program concepts, evaluators created a PD fidel-ity protocol to be used during a four-hour PD session that had five to eight individual items representing aspects of each concept. Each item had to:
Table 1. Number of Students Matched to Participating Teachers
Grade
Assessment
Year 1 Year 2
CA MA CA MA
3 769 773 608 608
4 660 662 608 608
5 569 569 473 473
Total 1,998 2,004 1,689 1,689
Notes: CA = Communication Arts assessment, MA = Mathematics assessment

Volume 43 Number 1 | Journal of Research on Technology in Education | 61
Connecting Technology Professional Development to Outcomes
Copyright © 2010, ISTE (International Society for Technology in Education), 800.336.5191(U.S. & Canada) or 541.302.3777 (Int’l), [email protected], www.iste.org. All rights reserved.
• represent an observable or verifiable behavior, activity, or procedure • be logically discrete from other items • be specific to the program model • be behaviors, activities, or procedures that would be expected to occur in
any of the program sessions, regardless of the specific content
The protocol was designed so that every 15 minutes of a four-hour PD session, an observer would record whether the behaviors or activities de-scribed in each item occurred during a two-minute period. This provided a number of data points for each PD session and allowed us to see whether certain things were happening and how often.
An expert panel with deep knowledge of the program curriculum and implementation model reviewed the instrument and provided feedback to establish the content validity. Practice observations and postobservation analyses informed further refinement. Six observers were then trained dur-ing a one-day session and afterwards achieved 88% inter-rater reliability on the instrument (Martin, Strother, Weatherholt, & Dechaume, 2008).
After collecting the PD observation data, evaluators also conducted a reli-ability analysis on the items in each concept, hereafter called fidelity factor. Thirteen of 44 items were removed due to low variability (item occurring more than 85% or less than 15% of the time). We then ran a reliability analy-sis on the remaining items in each category (see Table 2).
The reliability analysis determined that four of the five factors were statistically reliable (.6 or higher). Modeling instruction did not have high internal reliability, perhaps because it comprised only four items once items with low variation were removed. We still included this factor in later analy-ses because the items that compose modeling instruction are relevant and have content validity.
The items in each factor were averaged to form a composite score for each factor. We computed an overall fidelity measure by averaging the five composite scores.
Classroom Visit ActivitiesAn important element of eMINTS is the regular visits that instructional specialists make to teacher classrooms over a two-year period. Instructional specialists recorded the length of each visit and how much time was spent on each of the following activities:
Table 2. Reliability of Fidelity Factors
Fidelity Factor Cronbach’s Alpha
Modeling Instruction .405
Community Building .707
Technology Utilization .600
Connection to Practice .689
Inquiry-Based Learning .784

62 | Journal of Research on Technology in Education | Volume 43 Number 1
Martin et al.
Copyright © 2010, ISTE (International Society for Technology in Education), 800.336.5191(U.S. & Canada) or 541.302.3777 (Int’l), [email protected], www.iste.org. All rights reserved.
• Modeling instruction: activities such as modeling IBL technique or co-teaching a lesson
• Lesson planning: helping review or plan lessons • Technology assistance: troubleshooting and modeling • Reflective practice: reviewing goals for teaching • Problem solving: answering questions or specific issues with program
implementation
Twenty-six instructional specialists recorded what they did during 2,195 classroom visits to 272 teachers.
Teacher Lesson Plan QualityeMINTS’s theory assumes that program participation will improve par-ticipants’ understanding of its core concepts. To determine how well par-ticipants understood the core program concepts (and because classroom observations were not possible, as mentioned above), evaluators analyzed the lesson plans that teachers created for their final program portfolios. We included in this study only lesson plans that had accompanying student work samples as evidence that lessons were implemented in the classroom. For the purposes of this evaluation, we defined a “quality lesson plan” as one that reflects a thorough understanding of the core program concepts.
All teachers used a standard lesson-plan template provided by the program. This included the specific areas teachers were required to cover, so there was no variation in lesson-plan format. Similar to the process used to develop the PD observation instrument, evaluators worked with program staff to create the lesson-plan quality rubric. The rubric used a 3-point scale (high, medium, low) with a total of 21 items. The expert panel reviewed the rubric for content validity, and evaluators made revisions based on their feedback. We weighted each item evenly and created a total score to represent overall lesson-plan quality. We trained three evaluators, who achieved sufficient inter-rater reli-ability, with Cohen’s Kappa2 values ranging from 0.51 to 0.79 across six trials. Evaluators scored lesson plans from 180 teachers.
Student-Level Demographic and State Standardized Test Data The program’s theory assumes that if participants understand the program con-cepts, they will integrate those ideas into their instruction, resulting in a positive impact on student achievement. To be able to determine whether there were relationships among PD fidelity, classroom visit activities, teacher lesson plan quality, and student achievement, evaluators obtained from the state depart-ment of education three years of standardized test data in communication arts and mathematics: 2005–2006 (control), 2006–2007 (Year 1), and 2007–2008 (Year 2). Analyzing multiple years of student data in relation to program data would enable us to see if any program effects persisted over time. We 2 Cohen’s Kappa coefficient is a statistical measure of inter-rater agreement that takes into account the likelihood of chance agreements and thus is a more valid measure than percent agreement calculations.
Volume 43 Number 1 | Journal of Research on Technology in Education | 63
Connecting Technology Professional Development to Outcomes
Copyright © 2010, ISTE (International Society for Technology in Education), 800.336.5191(U.S. & Canada) or 541.302.3777 (Int’l), [email protected], www.iste.org. All rights reserved.
matched student assessment scores by teacher to PD fidelity, classroom visit, and lesson plan quality data. We collected student demographic informa-tion, including race, gender, and free or reduced-price lunch status (FRL). FRL is based on family income and is used as a measure for students’ socio-economic status.
Findings
Relationship between PD Fidelity and Lesson Plan QualityThe first set of analyses focused on the connection between PD experienced by participants and the quality of the lesson plans teachers produced for their portfolios. We ran correlations between overall PD fidelity scores and lesson plans. We found a significant correlation between overall PD fidelity scores and the quality of the lesson plans teachers created, r(151) = .302, p < .001.
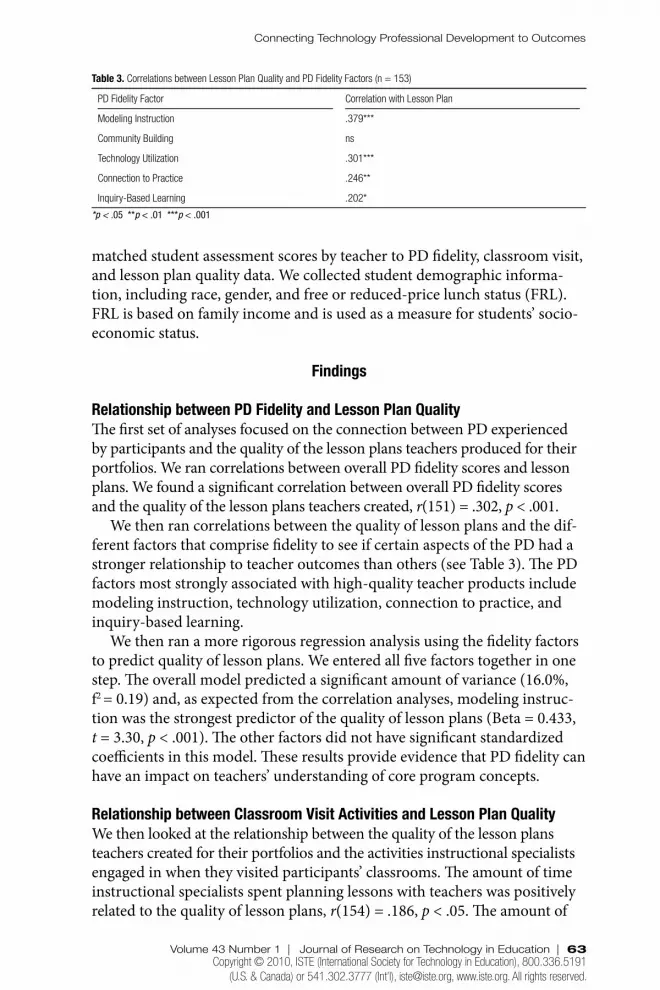
We then ran correlations between the quality of lesson plans and the dif-ferent factors that comprise fidelity to see if certain aspects of the PD had a stronger relationship to teacher outcomes than others (see Table 3). The PD factors most strongly associated with high-quality teacher products include modeling instruction, technology utilization, connection to practice, and inquiry-based learning.
We then ran a more rigorous regression analysis using the fidelity factors to predict quality of lesson plans. We entered all five factors together in one step. The overall model predicted a significant amount of variance (16.0%, f2 = 0.19) and, as expected from the correlation analyses, modeling instruc-tion was the strongest predictor of the quality of lesson plans (Beta = 0.433, t = 3.30, p < .001). The other factors did not have significant standardized coefficients in this model. These results provide evidence that PD fidelity can have an impact on teachers’ understanding of core program concepts.
Relationship between Classroom Visit Activities and Lesson Plan Quality We then looked at the relationship between the quality of the lesson plans teachers created for their portfolios and the activities instructional specialists engaged in when they visited participants’ classrooms. The amount of time instructional specialists spent planning lessons with teachers was positively related to the quality of lesson plans, r(154) = .186, p < .05. The amount of
Table 3. Correlations between Lesson Plan Quality and PD Fidelity Factors (n = 153)
PD Fidelity Factor Correlation with Lesson Plan
Modeling Instruction .379***
Community Building ns
Technology Utilization .301***
Connection to Practice .246**
Inquiry-Based Learning .202*
*p < .05 **p < .01 ***p < .001

64 | Journal of Research on Technology in Education | Volume 43 Number 1
Martin et al.
Copyright © 2010, ISTE (International Society for Technology in Education), 800.336.5191(U.S. & Canada) or 541.302.3777 (Int’l), [email protected], www.iste.org. All rights reserved.
time spent solving program implementation problems was negatively related to the quality of lesson plans, r(154) = -.181, p < .05.
Relationship between PD Fidelity and Classroom Visit Activities We next examined the relationship between overall PD fidelity and the classroom visit activities. There were no significant correlations. We then ran analyses separately for each program (COMP PD and eMINTS4ALL) because of the different expectations for the number of classroom visits. This analysis found a negative correlation between time spent modeling instruc-tion during classroom visits and PD fidelity for both programs (COMP PD: r(193) = -.160, p < .05; eMINTS4ALL: see Table 4). For eMINTS4ALL participants, there were also strong negative correlations between PD fidel-ity and time spent with technology assistance, whereas there were positive correlations between PD fidelity and time spent lesson planning, in reflec-tive practice, and problem solving during classroom visits. There were no other significant correlations for COMP PD participants. These findings suggest that teachers who experience higher-quality PD in the less compre-hensive program spend more time with instructional specialists on reflective practice, problem solving, and lesson planning, rather than on technology assistance or modeling instruction.
We next examined the relationship between PD fidelity, classroom visit activities, lesson plan quality, and student outcomes on the state standard-ized achievement tests. We ran analyses using student scores in communica-tion arts (CA) and mathematics (MA) separately for grades 3–5, controlling for demographic information and prior test scores when appropriate.
Relationship between Lesson Plan Quality and Student AchievementThe first analysis we conducted with student data looked at the relationship between student achievement and lesson plan quality. We ran correlations for each grade, looking at the relationship of students’ 2006–2007 CA and MA tests to the lesson plan quality scores. Students’ performance in grade 3 was positively correlated to having a higher-quality lesson plan (CA: r(694) = .124, p < .01; MA: r(697) = .162, p < .001). To further explore this relationship, we performed regression analyses, controlling for covariates, to analyze the impact of lesson plan quality on test scores. The first step of the regression controlled
Table 4. Correlations between Classroom Visits and PD Fidelity for eMINTS4ALL Participants (n = 74)
Classroom Visit Activities Correlation with Overall PD Fidelity
Modeling Instruction -.552**
Lesson Planning .339*
Technology Assistance -.332*
Reflective Practice .653**
Problem Solving .463**
*p < .01 **p < .001

Volume 43 Number 1 | Journal of Research on Technology in Education | 65
Connecting Technology Professional Development to Outcomes
Copyright © 2010, ISTE (International Society for Technology in Education), 800.336.5191(U.S. & Canada) or 541.302.3777 (Int’l), [email protected], www.iste.org. All rights reserved.
for the largest covariate: students’ 2005–2006 test scores. Step 2 added the other covariates to the regression (race, gender, FRL), and step 3 added the lesson plan quality score. Lesson plan quality explained a significant amount of variance in third-grade students’ scores on both CA (1.29%, f2 = .015, Beta = .114, t = 3.18, p < .01) and MA (2.57%, f2 = .029, Beta = .161, t = 4.47, p < .001).
We then looked at the students that participants had the following year and found that the patterns persisted. In the third grade, higher-quality lesson plans were again related to higher student achievement (CA: r(606) = .110, p < .01; MA: r(606) = .086 p < .05). Regressions showed that lesson plan scores continued to be a significant predictor of student achievement in third grade on both CA (1%, f2 = .012, Beta = .101, t = 2.62, p< .01) and MA (.70%, f2 = .008, Beta = .085, t = 2.18, p < .05).
Relationship between Student Achievement and PD FidelityWe ran correlations to detect any relationships between student achievement and overall PD fidelity scores and found a number of positive relationships. Higher PD fidelity was associated with higher student achievement in grade 3 (MA) and grades 4 and 5 (CA and MA). We found similar relationships with the 2007–2008 student data. We found no negative correlations (see Table 5).
We then performed regression analyses that controlled for all covari-ates. The results showed similar positive associations between test scores and PD fidelity in grades 4 and 5 for students in Year 1 (see Table 6, page 66), but there were no parallel results for Year 2, except third grade MA (N = 606), though results were marginal, with PD fidelity predicting 0.5% of the variance (f2 = .0056, Beta = .073, t = 1.83, p < .07). The regression trends may have continued into Year 2 had there been a higher number of matched students, as the 2006–2007 test was used as a covariate.
The positive results above prompted further analyses to understand which PD fidelity factors were most associated with positive student outcomes. In the analysis of 2006–2007 test data, we found that all of the factors were re-lated to higher test scores (see Table 7, page 66). Therefore, it was difficult to determine whether certain aspects of the program appeared more important than others. The analysis of the 2007–2008 data shows patterns similar to the
Table 5. Relationship between PD Fidelity and Student Achievement on the 2006–2007 and 2007–2008 Tests Grade
Test
Overall PD Fidelity
N Year 1 N Year 2
3 CA 669 ns 606 ns
3 MA 672 .106** 606 .103*
4 CA 546 .173*** 520 .113**
4 MA 548 .186*** 520 .096*
5 CA 549 .309*** 432 .131**
5 MA 549 .282*** 432 .097*
*p < .05 **p < .01 ***p < .001

66 | Journal of Research on Technology in Education | Volume 43 Number 1
Martin et al.
Copyright © 2010, ISTE (International Society for Technology in Education), 800.336.5191(U.S. & Canada) or 541.302.3777 (Int’l), [email protected], www.iste.org. All rights reserved.
previous year, but certain factors have stronger relationships with student outcomes—and, in some cases, with certain grade levels—than others (see Table 8). Technology utilization has the most consistent relationship with student achievement across all grades, whereas community building has a strong relationship with achievement in third grade, modeling instruction in fourth grade, and inquiry-based learning in fifth grade.
We did not run regressions on individual aspects of PD fidelity because of the covariance and concern with alpha inflation.
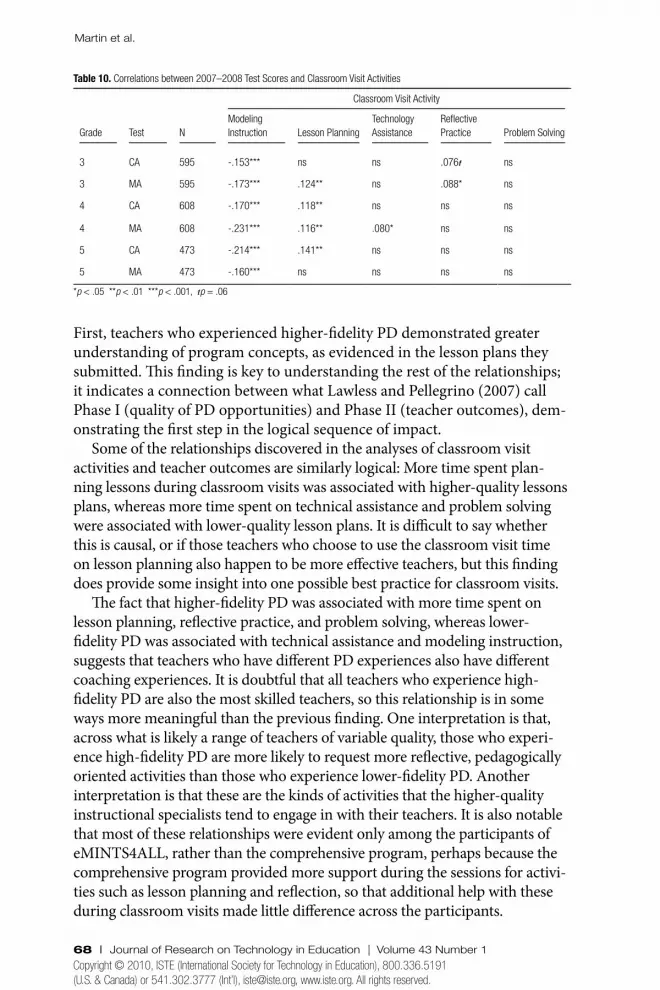
Relationship between Student Achievement and Classroom Visit ActivitiesWe conducted an analysis to detect any relationships between the activities instructional specialists engaged in with teachers during their classroom visits and student outcomes. When we ran correlations on the 2006–2007 test data, we found there was a significant positive relationship between the amount of time that instructional specialists spent engaged in lesson planning and student achievement in grades 4 and 5, and a significant negative relationship between the amount of time they spent modeling instruction and student achievement in grades 3, 4, and 5 (see Table 9). Those same relationships persisted into the second year of the study, even though the instructional specialists were no longer visiting the teachers in question (see Table 10, page 68). Time spent in reflective practice was also
Table 7. Correlations between 2006–2007 Student Test Scores and PD Fidelity Factors
Grade Test N PD Fidelity Factors
MI CB TU CP IBL
3 CA 669 ns ns .072ŧ ns ns
3 MA 672 .101** .075 ŧ .159*** ns ns
4 CA 546 .123** .131** .192*** .120** .135**
4 MA 548 .165*** .132** .187*** .131** .115**
5 CA 549 .212*** .200*** .322*** .236*** .322***
5 MA 549 .164*** .198*** .314*** .198*** .300***
Note: MI=Modeling Instruction, CB=Community Building, TU=Technology Utilization, CP=Connection to Practice, IBL=Inquiry-Based Learning
*p < .05 **p < .01 ***p < .001, ŧp = .06
Table 6. Amount of Variance in 2006–2007 Students’ Test Data Explained by PD Fidelity, after Controlling for Covariates
Grade MAP Test N Variance Explained by PD Fidelity f2 Beta t p
3* CA 669 ns*
3* MA 672 ns*
4 CA 512 0.32% .0081 .062 2.10 p < .05
4 MA 513 ns
5 CA 521 1.69% .054 .145 5.23 p < .001
5 MA 521 0.69% .022 .093 3.34 p < .001
*Analyses were run without the 2006 MAP scores in the model because second grade students do not take the tests.

Volume 43 Number 1 | Journal of Research on Technology in Education | 67
Connecting Technology Professional Development to Outcomes
Copyright © 2010, ISTE (International Society for Technology in Education), 800.336.5191(U.S. & Canada) or 541.302.3777 (Int’l), [email protected], www.iste.org. All rights reserved.
positively related to student outcomes in both years, but for different grade levels.
We did not run regressions on individual aspects of classroom visits be-cause of the mixed results, covariance, and concern with alpha inflation.
DiscussionThis evaluation took a three-phase approach to understand how variations in implementation of an instructional-technology PD program were as-sociated with teacher and student outcomes. The two components of the program we examined were the PD sessions and the classroom visits. In the case of the PD sessions, the program developers had a definite concep-tion of what constituted a high-quality implementation, and they expected that higher-fidelity implementation of the PD sessions would lead to better teacher and student outcomes. In the case of the classroom visits, the pro-gram staff and the evaluators were curious to see whether certain activities had stronger associations with teacher and student outcomes than others, though program staff suspected that more time spent in technical assistance would lead to negative outcomes.
Our analyses confirmed many of the suspicions evaluators and program staff had about PD fidelity’s relationship to teacher and student outcomes.
Table 8. Correlations between 2007–2008 Student Test Scores and PD Fidelity Factors
Grade Test N PD Fidelity Factors
MI CB TU CP IBL
3 CA 606 .088* .085* ns ns ns
3 MA 606 ns .075 ŧ .112** ns ns
4 CA 520 .079 ŧ ns .166*** .079 ŧ ns
4 MA 520 .090* ns .185*** ns ns
5 CA 432 ns ns .184*** ns .180***
5 MA 432 ns ns .124** ns .128**
Note: MI=Modeling Instruction, CB=Community Building, TU=Technology Utilization, CP=Connection to Practice, IBL=Inquiry-Based Learning
*p < .05 **p < .01 ***p < .001, ŧp < .075
Table 9. Correlations between 2006–2007 Test Scores and Classroom Visit Activities
Classroom Visit Activity
Grade
Test
N
Modeling Instruction
Lesson Planning
Technology Assistance
Reflective Practice
Problem Solving
3 CA 769 ns ns ns ns ns
3 MA 773 -.107** ns ns .089* ns
4 CA 660 -.111** .119** ns ns ns
4 MA 662 -.133*** .114** ns ns ns
5 CA 569 -.188*** .131** ns .097* ns
5 MA 569 -.212*** .167*** ns .104* ns
*p < .05 **p < .01 ***p < .001
68 | Journal of Research on Technology in Education | Volume 43 Number 1
Martin et al.
Copyright © 2010, ISTE (International Society for Technology in Education), 800.336.5191(U.S. & Canada) or 541.302.3777 (Int’l), [email protected], www.iste.org. All rights reserved.
First, teachers who experienced higher-fidelity PD demonstrated greater understanding of program concepts, as evidenced in the lesson plans they submitted. This finding is key to understanding the rest of the relationships; it indicates a connection between what Lawless and Pellegrino (2007) call Phase I (quality of PD opportunities) and Phase II (teacher outcomes), dem-onstrating the first step in the logical sequence of impact.
Some of the relationships discovered in the analyses of classroom visit activities and teacher outcomes are similarly logical: More time spent plan-ning lessons during classroom visits was associated with higher-quality lessons plans, whereas more time spent on technical assistance and problem solving were associated with lower-quality lesson plans. It is difficult to say whether this is causal, or if those teachers who choose to use the classroom visit time on lesson planning also happen to be more effective teachers, but this finding does provide some insight into one possible best practice for classroom visits.
The fact that higher-fidelity PD was associated with more time spent on lesson planning, reflective practice, and problem solving, whereas lower-fidelity PD was associated with technical assistance and modeling instruction, suggests that teachers who have different PD experiences also have different coaching experiences. It is doubtful that all teachers who experience high-fidelity PD are also the most skilled teachers, so this relationship is in some ways more meaningful than the previous finding. One interpretation is that, across what is likely a range of teachers of variable quality, those who experi-ence high-fidelity PD are more likely to request more reflective, pedagogically oriented activities than those who experience lower-fidelity PD. Another interpretation is that these are the kinds of activities that the higher-quality instructional specialists tend to engage in with their teachers. It is also notable that most of these relationships were evident only among the participants of eMINTS4ALL, rather than the comprehensive program, perhaps because the comprehensive program provided more support during the sessions for activi-ties such as lesson planning and reflection, so that additional help with these during classroom visits made little difference across the participants.
Table 10. Correlations between 2007–2008 Test Scores and Classroom Visit Activities
Classroom Visit Activity
Grade Test
N
Modeling Instruction
Lesson Planning
Technology Assistance
Reflective Practice
Problem Solving
3 CA 595 -.153*** ns ns .076ŧ ns
3 MA 595 -.173*** .124** ns .088* ns
4 CA 608 -.170*** .118** ns ns ns
4 MA 608 -.231*** .116** .080* ns ns
5 CA 473 -.214*** .141** ns ns ns
5 MA 473 -.160*** ns ns ns ns
*p < .05 **p < .01 ***p < .001, ŧp = .06

Volume 43 Number 1 | Journal of Research on Technology in Education | 69
Connecting Technology Professional Development to Outcomes
Copyright © 2010, ISTE (International Society for Technology in Education), 800.336.5191(U.S. & Canada) or 541.302.3777 (Int’l), [email protected], www.iste.org. All rights reserved.
When we examined the next stage of the logical sequence of impact, Law-less and Pellegrino’s Phase III—teacher change over time and student achieve-ment—we found persistent relationships over two years. Though our lack of data about teachers’ classroom instruction prevents us from reporting on teacher change, two years of test data from students in program participants’ classrooms allow us to report on connections between student outcomes and the program and teacher outcomes. One striking aspect of the find-ings is the consistency across the years. For example, lesson plan quality was significantly associated with higher student achievement in third grade over both years. This finding completes the chain of reasoning that suggests that high-quality PD leads to improved teacher knowledge, which can then lead to higher student achievement. Although one could argue that teach-ers who produce high-quality lesson plans may just be better teachers, and therefore have higher-achieving students, there is no reason to assume that more effective teachers would experience higher-fidelity PD. An even more suggestive finding is the consistency of the associations between PD fidel-ity and student achievement. PD fidelity was associated with higher student achievement in third grade MA and fourth and fifth grade MA and CA; regressions in both years showed that fidelity was a significant predictor of student achievement in the fourth and fifth grade. It is noteworthy that these relationships exist even in the grades with no strong correlations between lesson plan quality and student achievement. This suggests that high-fidelity PD may be having an impact on teachers and their instruction that is not adequately captured in their lesson plans.
Our analysis of how the specific factors comprised by PD fidelity relate to student achievement also revealed interesting findings. In the analysis of the 2007 assessment data, it appeared that a range of factors was associated with student achievement, but in the analysis of 2008 data, certain factors stood out. One interesting finding was that different fidelity factors seem to have stronger relationships with achievement in different grades. For example, higher third grade achievement was associated with teachers who experi-enced higher levels of community building in their PD sessions, whereas higher fifth grade scores are associated with teachers who experienced higher levels of inquiry-based learning in their PD sessions. These findings suggest that different instructional practices presented in the PD may be ef-fective for students of different ages.
Our analysis also showed that, of all the fidelity factors, technology utilization seems to have the strongest relationship across all the grades. This finding is somewhat surprising, considering that some research has indicated that there is nothing in particular about technology that should necessarily improve math and communication arts achievement (Campu-zano, Dynarski, Agodini, & Rall, 2009). One possible explanation for this finding is that the eMINTS approach to technology integration focuses on using technology not for its own sake, but to enhance specific instructional

70 | Journal of Research on Technology in Education | Volume 43 Number 1
Martin et al.
Copyright © 2010, ISTE (International Society for Technology in Education), 800.336.5191(U.S. & Canada) or 541.302.3777 (Int’l), [email protected], www.iste.org. All rights reserved.
units that the teachers work on as part of the PD and coaching sessions. Teachers of the grades we examined in this study (third to fifth) usually teach a general curriculum, which, in this age of high-stakes standard-ized testing, probably means a great deal of instruction in the subjects that are tested—math and communication arts. Therefore, it is likely that the technology-infused lessons that teachers developed would have addressed these content areas.
It is important to keep the findings in perspective by noting the limita-tions of this study. The first limitation is the small effect size. Certainly no single finding stands on its own as showing a substantial impact. How-ever, the consistency of the significant positive relationships, especially considering how difficult it often is to find any impact of a PD program on teacher and student outcomes, does suggest that this PD program has some impact.
Another important limitation of the study is that a limited amount of data was collected from the PD sessions. Although observers conducted obser-vations for four hours, they observed instructional specialists only once or twice. In our analyses, this limited data had to represent the fidelity of the overall PD experienced by teachers. Although practical realities of time and staffing made it impossible for this study to include more PD session obser-vations, future studies would be more robust if evaluators observed more PD sessions per instructional specialist and averaged the scores for each item across sessions.
Further, we were unable to observe the participant teachers engaging in classroom instruction, so this study could not account for one very impor-tant piece of the logical process from PD to student impact. The lesson plans provided information about how well teachers understood the concepts pre-sented in the PD, and because we included only lesson plans from portfolios that also contained student samples, we know that these lessons were used in the classroom. However, it was impossible for us to know which, if any, spe-cific strategies from the PD teachers integrated into their instruction. This kind of data would provide an essential link in the chain of understanding how such a program affects change and would particularly help make two of this study’s findings clearer.
First, we found that there was a relationship between lesson planning dur-ing classroom visits and student achievement, but we know little about what these lesson-planning sessions entailed and how that process actually affected classroom teaching. Asking instructional specialists to record more details about the specific strategies that were discussed in these sessions, and then visiting the classrooms when those lessons were implemented, would provide a much better understanding of how lesson planning during coaching ses-sions might be connected to improved student learning. In addition, class-room observations could also help to clarify our finding about the association between technology utilization and student achievement. Descriptions of how

Volume 43 Number 1 | Journal of Research on Technology in Education | 71
Connecting Technology Professional Development to Outcomes
Copyright © 2010, ISTE (International Society for Technology in Education), 800.336.5191(U.S. & Canada) or 541.302.3777 (Int’l), [email protected], www.iste.org. All rights reserved.
the technology is used and what other nontechnical strategies are used dur-ing instruction in those key content areas might make it easier to determine whether it is the overall quality of the teacher or the specific strategies as-sociated with the PD that makes the difference.
Despite those limitations, this study does provide evidence suggesting that quality instructional-technology PD can have a positive impact on teachers and students. The program at the center of this study was designed in accordance with many of the PD practices advocated by experts in the field, and the PD sessions link technology use to specific instructional practices such as IBL and community building, which research suggests are essential for successful technology integration. The consistency in the findings of a positive, logical sequence of program impact over two years in-dicates that when teachers experience technology PD that is informed by the research and implemented with fidelity, they gain a better understanding of the core concepts, which may in turn lead to small but significant improve-ments in student achievement.
Along with potentially contributing to the body of knowledge about instructional-technology PD, this study can also have practical implications for PD designers and school districts. Designers of PD programs should integrate what research suggests are the key components of high-quality PD when creating programs that seek to positively affect student learning, the ultimate goal of all professional development.
However, PD designers should also understand that high-quality pro-grams take a considerable amount of time to evolve to the point where effects can be measured. Programs such as eMINTS Comprehensive Pro-fessional Development took years to create, evaluate, and refine, and even then the measurable effects, although consistent, are still modest. Designers must build in mechanisms to ensure program fidelity and ongoing itera-tive program improvement through a systematic formative and summative evaluation process. The expense associated with the creation, refinement, and maintenance of PD programs that incorporate the elements noted in the article should not be underestimated.
School district administrators looking to contract PD services should also be familiar with the specific characteristics that research indicates are essential to high-quality PD and understand that, for PD to have an impact on students, it must first have an impact on teachers. PD that adheres to the recommended practices is often time and labor intensive, but research consistently shows that factors such as a long duration, ongoing coaching and support, and a close con-nection to practice are essential for PD to have an impact. Because technology PD in particular is still so often perceived as one-shot workshops focused on specific software, hardware, or resources, this study provides a counterpoint that shows how instructional-technology PD, integrated into a comprehensive PD program, may lead to effective technology integration that can have positive outcomes for students.

72 | Journal of Research on Technology in Education | Volume 43 Number 1
Martin et al.
Copyright © 2010, ISTE (International Society for Technology in Education), 800.336.5191(U.S. & Canada) or 541.302.3777 (Int’l), [email protected], www.iste.org. All rights reserved.
Author NotesWendy Martin, PhD, is a senior research associate at the Education Development Center, Inc’s Center for Children and Technology (EDC/CCT). Currently she is the project manager for Pos-sible Worlds, one of the National Research and Development Centers in Instructional Technology, which is housed at EDC. This Center is conducting research on how digital games can support middle school science and literacy learning. She was also the project director of the evaluation of eMINTS, a technology professional development program, and co-project director of the New Mexico Reading First evaluation. Correspondence regarding this article should be addressed to Wendy Martin, 96 Morton Street, New York, NY 10014. E-mail: [email protected]
Scott Strother is a researcher at Education Development Center, Inc. He has worked on a number of project evaluations, including the Intel Teaching Thinking with Technology program, the eM-INTS technology professional development program, and the New Mexico Reading First Program. Correspondence regarding this article should be addressed to Scott Strother, 96 Morton Street, New York, NY 10014. E-mail: [email protected]
Monica Beglau, PhD, is the executive director of the eMINTS National Center at the University of Missouri in Columbia, Missouri, where she provides leadership to a staff engaged in delivering profes-sional development support to educators across the United States and Australia. Her experience in education includes positions as executive director of the Partnerships for Educational Renewal at the University of Missouri and at the University of Wyoming. She served as an elementary principal and special education teacher in Cheyenne, Wyoming. Correspondence regarding this article should be ad-dressed to Monica Beglau, 325 Clark Hall, Columbia, MO 65211. E-mail: [email protected]
Lauren Bates is a researcher at Education Development Center, Inc. She has worked on the New Mexico Reading First evaluation team, conducted policy research on adolescent literacy for the Regional Educational Laboratory for the Northeast and Islands (REL-NEI), and was project manager on a large randomized, controlled trial to examine the impact of PBS media in pre-school classrooms for the Ready to Learn Initiative. Correspondence regarding this article should be addressed to Lauren Bates, 96 Morton Street, New York, NY 10014. E-mail: [email protected]
Tim Reitzes is a researcher at Education Development Center, Inc., working on the development of interactive science games for Possible Worlds and an interactive history game called Mission America. Correspondence regarding this article should be addressed to Timothy Reitzes, 96 Mor-ton Street, New York, NY 10014. E-mail: [email protected]
Katherine McMillan Culp is a senior research scientist at Education Development Center, Inc. She is the co-principal investigator of Possible Worlds. The Possible Worlds team is developing games for the Nintendo DS that will support middle grades science learning, and conducting a series of research studies to better understand how games can be structured to support conceptual learning and engagement with complex scientific concepts. She is also the director of research for REL-NEI. Correspondence regarding this article should be addressed to Katherine McMillan Culp, 96 Morton Street, New York, NY 10014. E-mail: [email protected]
ReferencesAdelman, N., Donnelly, M. B., Dove, T., Tiffany-Morales, J., Wayne, A., & Zucker, A. (2002).
The integrated studies of educational technology: Professional development and teachers’ use of technology. Arlington, VA: SRI International.
Bickford, A. (2004). An examination into selection bias in FY02 eMINTS schools. eMINTS National Center Technical Report. Retrieved March 4, 2010, from http://www.emints.org/evaluation/reports/index.shtml
Volume 43 Number 1 | Journal of Research on Technology in Education | 73
Connecting Technology Professional Development to Outcomes
Copyright © 2010, ISTE (International Society for Technology in Education), 800.336.5191(U.S. & Canada) or 541.302.3777 (Int’l), [email protected], www.iste.org. All rights reserved.
Bifulco, R. (2002). Addressing self-selection bias in quasi-experimental evaluations of whole-school reform: A comparison of models. Evaluation Review, 26(5), 545–572.
Campuzano, L., Dynarski, M., Agodini, R., & Rall, K. (2009). Effectiveness of reading and mathematics software products: Findings from two student cohorts (NCEE 2009-4041). Jessup, MD: National Center for Education Evaluation and Regional Assistance.
Cohen, D., & Hill, H. (2001). Learning policy: When state education reform works. New Haven: Yale University Press.
Davidson, M. R., Fields, M. K., & Yang, J. (2009). A randomized trial study of a preschool literacy curriculum: The importance of implementation. Journal of Research on Educational Effectiveness, 2(3), 177–208.
Desimone, L. M. (2009). Improving impact studies of teachers’ professional development: Toward better conceptualizations and measures. Educational Researcher, 38(3), 181–199.
Dickinson, D. K., Darrow, C. L., & Tinubu, T. A. (2009). Patterns of teacher-child conversations in Head Start classrooms: Implications for an empirically grounded approach to professional development. Early Education and Development, 19(3), 396–429.
Fukkink, R. G., & Long, A. (2007). Does training matter? A meta-analysis and review of caregiver training studies. Early Childhood Research Quarterly, 22(3), 294–311.
Garet, M. S., Porter, A. C., Desimone, L., Birman, B. F., & Yoon, K. S. (2001). What makes professional development effective? Results from a national sample of teachers. American Educational Research Journal, 38(4), 915–945.
Hall, M. W., & Resnick, L. B. (1998). Learning organizations for sustainable education reform. Daedalus, 127(4), 89–118.
Jackson, B., Larzelere, R., St. Clair, L., Corr, M., Fichter, C., & Egertson, H. (2006). The impact of HeadsUp! Reading on early childhood educators’ literacy practices and preschool children’s literacy skills. Early Childhood Research Quarterly, 21(2), 213–226.
Kennedy, M. (1999). Form and substance in mathematics and science professional development. National Institute for Science Education Brief, 3(2). Retrieved November 4, 2009, from http://mspnet.mspnet.org/index.cfm/8653
Koh, S., & Neuman, S. B. (2009). The impact of professional development in family child care: A practice-based approach. Early Education and Development, 20(3), 537–562.
Lawless, K. A., & Pellegrino, J. W. (2007). Professional development in integrating technology into teaching and learning: Knowns, unknowns, and ways to pursue better questions and answers. Review of Educational Research, 77(4), 575–614.
Lemke, C., & Fadel, C. (2006). Technology in schools: What the research says. Culver City, CA: Metiri Group for Cisco Systems.
Louis, K. S., & Kruse, S. D. (1995). Professionalism and community: Perspectives on reforming urban schools. Thousand Oaks, CA: Corwin Press.
Martin, W., Strother, S. Weatherholt, T., & Dechaume, M. (2008). eMINTS program evaluation report: An investigation of program fidelity and its impact on teacher mastery and student achievement. New York, NY: EDC, Center for Children and Technology.
Neuman, S. B., & Cunningham, L. (2009). The impact of professional development and coaching on early language and literacy instructional practices. American Educational Research Journal, 46(2), 532–566.
National Institute of Child Health and Human Development Early Child Care Research Network. (2002). Child-care structure → process → outcome: Direct and indirect effects of child-care quality on young children’s development. Psychological Science, 13(3), 199–206.
O’Dwyer, L. M., Russell, M., & Bebell, D. J. (2004). Identifying teacher, school, and district characteristics associated with elementary teachers’ use of technology: A multilevel perspective. Education Policy Analysis Archives, 12(48). Retrieved November 14, 2009, from http://epaa.asu.edu/epaa/v12n48/
Penuel, W. R. (2006). Implementation and effects of one-to-one computing initiatives: A research synthesis. Journal of Research on Technology in Education 38(3), 329–348.

74 | Journal of Research on Technology in Education | Volume 43 Number 1
Martin et al.
Copyright © 2010, ISTE (International Society for Technology in Education), 800.336.5191(U.S. & Canada) or 541.302.3777 (Int’l), [email protected], www.iste.org. All rights reserved.
Penuel, W. R., Fishman, B. J., Yamaguchi, R., & Gallagher, L. P. (2007). What makes professional development effective? Strategies that foster curriculum implementation. American Educational Research Journal, 44(4), 921–958.
Peurach, D., Glazer, J., & Gates, K. (2004). Supporting instructional improvement: Teacher learning in comprehensive school reform. Washington, DC: National Clearinghouse on Comprehensive School Reform.
Porter, A. C., Garet, M., Desimone, L., Yoon, K. S., & Birman, B. (2000). Does professional development change teaching practice? Results from a three-year study. Washington, DC: U.S. Department of Education.
Raudenbush, S. W. (2005). Learning from attempts to improve schooling: The contribution of methodological diversity. Educational Researcher, 34(5), 14–24.
Ravitz, J. (2009). Introduction: Summarizing findings and looking ahead to a new generation of PBL research. Interdisciplinary Journal of Problem-Based Learning, 3(1), 4–11.
Ringstaff, C., & Kelley, L. (2002). The learning return on our educational technology investment: A review of findings from research. San Francisco: WestEd.
Sandholtz, J. H., Ringstaff, C., & Dwyer, D. (1990). Teaching in high-tech environments: Classroom management revisited. Cupertino, CA: Apple Computer, Inc.
Sheridan, S. M., Edwards, C. P., Marvin, C. A., & Knoche, L. L. (2009). Professional development in early childhood programs: Process issues and research needs. Early Education and Development, 20(2), 377–401.
Sparks, D. (2002). Designing powerful professional development for teachers and principals. Oxford, OH: National Staff Development Council.
Yoon, K. S., Duncan, T., Lee, S. W.-Y., Scarloss, B., & Shapley, K. L. (2007). Reviewing the evidence on how teacher professional development affects student achievement (Issues and Answers Report, REL 2007 No. 033). Washington, DC: U.S. Department of Education, Institute of Education Sciences, National Center for Education Evaluation and Regional Assistance, Regional Education Laboratory Southwest.


