Embed Size (px)
Citation preview
Confidential – do not copy or circulate
Version 1 1
CONFIDENTIAL UNTIL PUBLISHED
Evidence Review Group Report commissioned by the NIHR HTA Programme on behalf of NICE
Reslizumab for treating asthma with elevated blood eosinophils inadequately controlled by inhaled corticosteroids
Produced by Southampton Health Technology Assessments Centre
Authors Keith Cooper, Senior Research Fellow, SHTAC
Petra Harris, Research Fellow, SHTAC
Micah Rose, Research Fellow, SHTAC
Maria Chorozoglou, Senior Research Fellow, SHTAC
Karen Pickett, Research Fellow, SHTAC
Geoff Frampton, Senior Research Fellow, SHTAC
Correspondence to Dr Geoff Frampton
Southampton Health Technology Assessments Centre
University of Southampton
First Floor, Epsilon House
Enterprise Road, Southampton Science park
Southampton SO16 7NS
www.southampton.ac.uk/shtac
Date completed 11th October 2016.
This version of the report includes corrections made by the ERG following the company’s factual
inaccuracy check. These are indicated as underlined italicised text.
Confidential – do not copy or circulate
Version 1 2
Source of funding: This report was commissioned by the NIHR HTA Programme as project
number 15/121/14
Declared competing interests of the authors None
Acknowledgements We would like to thank Professor Anoop Chauhan (Consultant and Professor in Respiratory
Medicine and Director of Research, Portsmouth Hospitals NHS Trust) for providing clinical
advice to the ERG and for commenting on a draft of the report; and Professor Tim Harrison
(Clinical Associate Professor and Honorary Consultant, Faculty of Medicine & Health Sciences,
University of Nottingham and Nottingham City Hospital) and Professor Dr Tom Wilkinson
(Consultant and Professor in Respiratory Medicine, University of Southampton and
Southampton University Hospital NHS Foundation Trust) for commenting on a draft of the
report.
We also thank Professor Joanne Lord, Director, SHTAC, for acting as internal editor for the draft
report.
Rider on responsibility for report The views expressed in this report are those of the authors and not necessarily those of the
NIHR HTA Programme. Any errors are the responsibility of the authors.
This report should be referenced as follows: Cooper K, Harris P, Rose M, Chorozoglou M, Pickett K, Frampton G. Reslizumab for treating
asthma with elevated blood eosinophils inadequately controlled by inhaled corticosteroids: A
Single Technology Appraisal. Southampton Health Technology Assessments Centre (SHTAC).
2016.
Contributions of authors Keith Cooper (Senior Research Fellow) critically appraised the health economic systematic
review, critically appraised the economic evaluation and drafted the report. Petra Harris
(Research Fellow) critically appraised the clinical effectiveness systematic review and drafted
the report. Micah Rose (Research Fellow) critically appraised the health economic systematic
Confidential – do not copy or circulate
Version 1 3
review, critically appraised the economic evaluation and drafted the report. Maria Chorozoglou
(Senior Research Fellow) critically appraised the economic evaluation and drafted the report.
Karen Pickett (Research Fellow) critically appraised the clinical effectiveness systematic review
and drafted the report. Geoff Frampton (Senior Research Fellow) critically appraised the clinical
effectiveness systematic review, drafted the report, project managed the review and is the
project guarantor.
Word count: 55,862 (including tables)
XXXXXXXXXXXXXXXXXXXXXXXXXXXXXXXXXXXXXXXXXXXXXXXXXX XXXXXXXXXXXXXXXXXXXXXXXXXXXXXXXXXXXXXXXXXXXXXXXXXX.
Confidential – do not copy or circulate
Version 1 4
TABLE OF CONTENTS
1 Introduction to the ERG Report ..........................................................................................23 2 BACKGROUND .................................................................................................................23
2.1 Summary & critique of the company’s description of the underlying health problem....23 2.2 Summary & critique of the company’s overview of current service provision ...............25 2.3 Summary & critique of the company’s definition of the decision problem ....................29
3 CLINICAL EFFECTIVENESS .............................................................................................34 3.1 Summary & critique of the company’s approach to systematic review.........................34 3.2 Overall summary statement of the company’s approach .............................................73 3.3 Direct treatment comparison results: reslizumab versus placebo ................................74 3.4 Indirect treatment comparison results: reslizumab versus omalizumab .......................96 3.5 Summary of clinical effectiveness evidence .............................................................. 110
4 COST EFFECTIVENESS ................................................................................................. 114 4.1 Overview of the company’s economic evaluation ...................................................... 114 4.2 Company’s review of published economic evaluations .............................................. 114 4.3 Critical appraisal of the company’s submitted economic evaluation .......................... 119 4.4 Additional work undertaken by the ERG .................................................................... 164 4.5 Conclusions on cost effectiveness ............................................................................ 169
5 Innovation ........................................................................................................................ 170 6 DISCUSSION .................................................................................................................. 171
6.1 Summary of clinical effectiveness issues .................................................................. 171 6.2 Summary of cost effectiveness issues ...................................................................... 172
7 REFERENCES ................................................................................................................ 173
LIST OF TABLES
Table 1 Asthma treatment stepwise approach...........................................................................25 Table 2 GINA definition of asthma severity ...............................................................................27 Table 3 Technology being appraised (CS Table 2) ...................................................................31 Table 4 Overview of reslizumab RCTs included in the CS ........................................................41 Table 5 Baseline characteristics of the reslizumab trials included in the CS ..............................48 Table 6 Company and ERG assessments of trial quality ...........................................................53 Table 7 Analysis populations in the trials of reslizumab .............................................................59 Table 8 Overview of statistical approaches in the trials of reslizumab .......................................60 Table 9 Outcomes included in meta-analyses ...........................................................................64 Table 10 Quality assessment (CRD criteria) of CS review ........................................................73 Table 11 ACQ score: mean change from baseline at 16±1 weeks ............................................75 Table 12 Direct comparison meta-analysis: ACQ score change over 16±1 weeks ....................75 Table 13 Rate of clinical asthma exacerbations over 52 weeks .................................................77 Table 14 Exacerbations requiring systemic corticosteroids for ≥3 days over 52 weeks .............77 Table 15 Exacerbations requiring oral corticosteroids for ≥3 days over 52 weeks .....................78 Table 16 Exacerbations requiring hospitalisation and/or emergency room visit over 52 weeks .78 Table 17 Kaplan-Meier probability of not experiencing a clinical asthma exacerbation by week 52..............................................................................................................................................78 Table 18 Clinically significant exacerbations .............................................................................79 Table 19 Direct comparison meta-analysis: clinically significant exacerbations .........................80 Table 20 Patients hospitalised due to exacerbations up to 52 weeks ........................................80 Table 21 Direct comparison meta-analysis: patients hospitalised due to exacerbations up to 52 weeks .......................................................................................................................................81 Table 22 FEV1: mean change from baseline (L) at 16±1 weeks ...............................................81
Confidential – do not copy or circulate
Version 1 5
Table 23 FEV1: mean change from baseline (L) at 52 weeks ...................................................82 Table 24 Direct comparison meta-analysis: FEV1 change over 16 and 52 weeks .....................82 Table 25 % predicted FEV1: mean change from baseline at 16±1 weeks .................................83 Table 26 % predicted FEV1: mean change from baseline at 52 weeks .....................................84 Table 27 FVC: mean change from baseline (L) at 16±1 weeks .................................................84 Table 28 FVC: mean change from baseline (L) at 52 weeks .....................................................84 Table 29 FEF25-75%: mean change from baseline (L/s) at 16 weeks ...........................................85 Table 30 Adverse events affecting ≥5% of patients in reslizumab trials (safety analysis set) .....87 Table 31 Adverse events occurring in ≥5% of patients in either treatment group (safety analysis set) ............................................................................................................................................88 Table 32 Discontinuations due to adverse events up to 16±1 and 52 weeks .............................89 Table 33 Direct comparison meta-analysis: Discontinuation due to adverse events up to 16±1 and 52 weeks ............................................................................................................................89 Table 34 Serious adverse events up to 16±1 and 52 weeks......................................................90 Table 35 Direct comparison meta-analysis: serious adverse events up to 16±1 and 52 weeks .90 Table 36 AQLQ score: mean change from baseline at 16 weeks ..............................................91 Table 37 AQLQ score: mean change from baseline at 52 weeks ..............................................91 Table 38 Direct comparison meta-analysis: AQLQ score changes over 16 and 52 weeks ........92 Table 39 ASUI score: mean change from baseline at 16 weeks ................................................93 Table 40 SABA use: mean changes from baseline (puffs/day) at 16±1 weeks ..........................94 Table 41 Blood eosinophils: mean or median changes from baseline at 16±1 weeks................94 Table 42 Blood eosinophils: mean or median changes from baseline at 52 weeks ...................95 Table 43 Trials included in the ITC for ACQ score change at 16±1 weeks ................................97 Table 44 ITC results for ACQ score change at 16 weeks ..........................................................98 Table 45 Trials included in the ITC for clinically significant exacerbations .................................99 Table 46 ITC fixed-effects model results for clinically significant exacerbations ...................... 100 Table 47 Trials included in the ITC for patients hospitalised due to exacerbations up to 52 weeks ..................................................................................................................................... 101 Table 48 ITC results for patients hospitalised due to exacerbations up to 52 weeks ............... 102 Table 49 Trials included in the ITC for FEV1 change at 16±4 weeks ....................................... 102 Table 50 ITC results for FEV1 change at 16±4 weeks ............................................................. 103 Table 51 Trials included in the ITC for FEV1 change at 52 weeks........................................... 104 Table 52 ITC results for FEV1 change at 52 weeks ................................................................ 104 Table 53 Trials included in the ITC for discontinuations due to adverse events up to 16 weeks ............................................................................................................................................... 104 Table 54 ITC results for discontinuations due to adverse events up to 16 weeks .................... 105 Table 55 Trials included in the ITC for discontinuations due to adverse events up to 52±4 weeks ............................................................................................................................................... 105 Table 56 ITC results for discontinuations due to adverse events up to 52±4 weeks ................ 106 Table 57 Trials included in the ITC for serious adverse events up to 16 weeks ....................... 106 Table 58 ITC results for serious adverse events up to 16 weeks ............................................. 107 Table 59 Trials included in the ITC for serious adverse events up to 52±4 weeks ................... 107 Table 60 ITC results for serious adverse events up to 52±4 weeks ......................................... 108 Table 61 Trials included in the ITC for AQLQ score change at 16±4 weeks ............................ 108 Table 62 ITC results for AQLQ score change at 16±4 weeks .................................................. 109 Table 63 Trials included in the ITC for AQLQ score change at 52±4 weeks ............................ 109 Table 64 ITC results for AQLQ score change at 52±4 weeks .................................................. 110 Table 65 Inclusion and exclusion criteria for the systematic reviews of cost-effectiveness and HRQoL studies........................................................................................................................ 115 Table 66 Summary of included cost-effectiveness studies ...................................................... 118 Table 67 NICE reference case requirements .......................................................................... 120
Confidential – do not copy or circulate
Version 1 6
Table 68 Mean annual rates of exacerbations in placebo arms (studies 3082 and 3083) ........ 127 Table 69 Transition probabilities for the BSC arm ................................................................... 128 Table 70 Transition probabilities 0-16 weeks: reslizumab arm ................................................ 130 Table 71 Transition probabilities (0-16 weeks) directly obtained from the number of transitions at consecutive monthly assessments in studies 3082 and 3083 .................................................. 131 Table 72 Response rates of the reslizumab-treated population, .............................................. 131 Table 73 Transition probabilities 16-52 weeks: reslizumab arm .............................................. 132 Table 74 Transition probabilities (16-52 weeks) directly obtained from the number of transitions (visits) ..................................................................................................................................... 132 Table 75 Transition probabilities post-52 weeks: reslizumab arm ............................................ 133 Table 76 Transition probabilities (post-52 weeks) directly obtained from the number of transitions (visits) .................................................................................................................... 133 Table 77 Transition probabilities for the omalizumab arm 0-16 weeks .................................... 135 Table 78 Transition probabilities for the omalizumab arm (16 to 52 weeks) ............................ 136 Table 79 Transition probabilities for the omalizumab arm (post-52 weeks) ............................. 137 Table 80 Summary of utility values for the company cost-effectiveness model (CS Table 115, p. 201) ........................................................................................................................................ 141 Table 81 Health utilities reported in Lloyd and colleagues59 .................................................... 145 Table 82 Utility scores used in the NICE STA of mepolizumab ............................................... 146 Table 83 Omalizumab administration cost differences between the CS and other NICE technology appraisals ............................................................................................................. 149 Table 84 Unit costs associated with the technology in the economic model ............................ 150 Table 85 Comparison of live health state definitions in Willson et al and the CS model (CS Table 119, p.209) .............................................................................................................................. 151 Table 86 NHS Reference and PSSRU unit costs used in the model ....................................... 152 Table 87 NHS Reference Costs used to calculate health state costs71 .................................... 152 Table 88 Inpatient health state costs for exacerbations (CS Table 117, p. 205 206) ............... 153 Table 89 Health state costs, adapted from CS Table 120 (p. 211) (values in parentheses are CiC data submitted by the company) ...................................................................................... 154 Table 90. Clinical outcomes from the company model for patients having experienced 2≥ exacerbations in the 3082 and 3083 trials (multiplier=1) ......................................................... 157 Table 91 Deterministic base case cost effectiveness results for patients with a history of ≥3 exacerbations ......................................................................................................................... 158 Table 92 Deterministic base case cost effectiveness results for patients with persistent allergic eosinophilic asthma and a history of ≥ 3 exacerbations (CS Table 125, page 219) ................. 159 Table 93 Scenario analyses .................................................................................................... 162 Table 94 Mean PSA results (from revised company model) .................................................... 163 Table 95 ERG analyses for patients with changes to exacerbation multiplier .......................... 165 Table 96 Utility values used in the CS base case and the ERG utility scenarios ..................... 166 Table 97 ERG analyses with changes to the utility values ....................................................... 166 Table 98 Health state costs, adapted from CS Table 120 ....................................................... 167 Table 99 ERG analyses with changes to the health state cost values ..................................... 167 Table 100 ERG analyses with changes to the monitoring duration for omalizumab ................. 167 Table 101 ERG preferred base case analyses ........................................................................ 168
LIST OF FIGURES
Figure 1 PRISMA diagram for the systematic review of clinical evidence ..................................38 Figure 2 ITC network diagram ...................................................................................................70 Figure 3 Forest plot for the change from baseline in ACQ at 16±1 weeks .................................76 Figure 4 Forest plot for the change from baseline in FEV1 at 16±1 weeks .................................83
Confidential – do not copy or circulate
Version 1 7
Figure 5 Flow diagram for the review of cost-effectiveness, HRQoL and healthcare resource use evidence ................................................................................................................................. 117 Figure 6 Schematic of company’s model structure .................................................................. 121 Figure 7 Stepwise management of adults from SIGN/BTS guidelines ..................................... 124 Figure 8 Weight distribution in kg – adult patients at GINA Step 4/5 enrolled in trials 3082 and 3083 ........................................................................................................................................ 148 Figure 9 Tornado diagram: deterministic sensitivity of resilzumab vs BSC .............................. 160 Figure 10 Tornado diagram: deterministic sensitivity of resilzumab vs omalizumab (from company’s revised model) ...................................................................................................... 161 XXXXXXXXXXXXXXXXXXXXXXXXXXXXXXXXXXXXXXXXXXXXXXXXXXXXXXXXXXXXXXXXXXXXXXXXXXXXXXXXXXXXXXXXXXXXXXXXXXXXXXXXXXXXXXXXXXXXXXXX ......... 164
Confidential – do not copy or circulate
Version 1 8
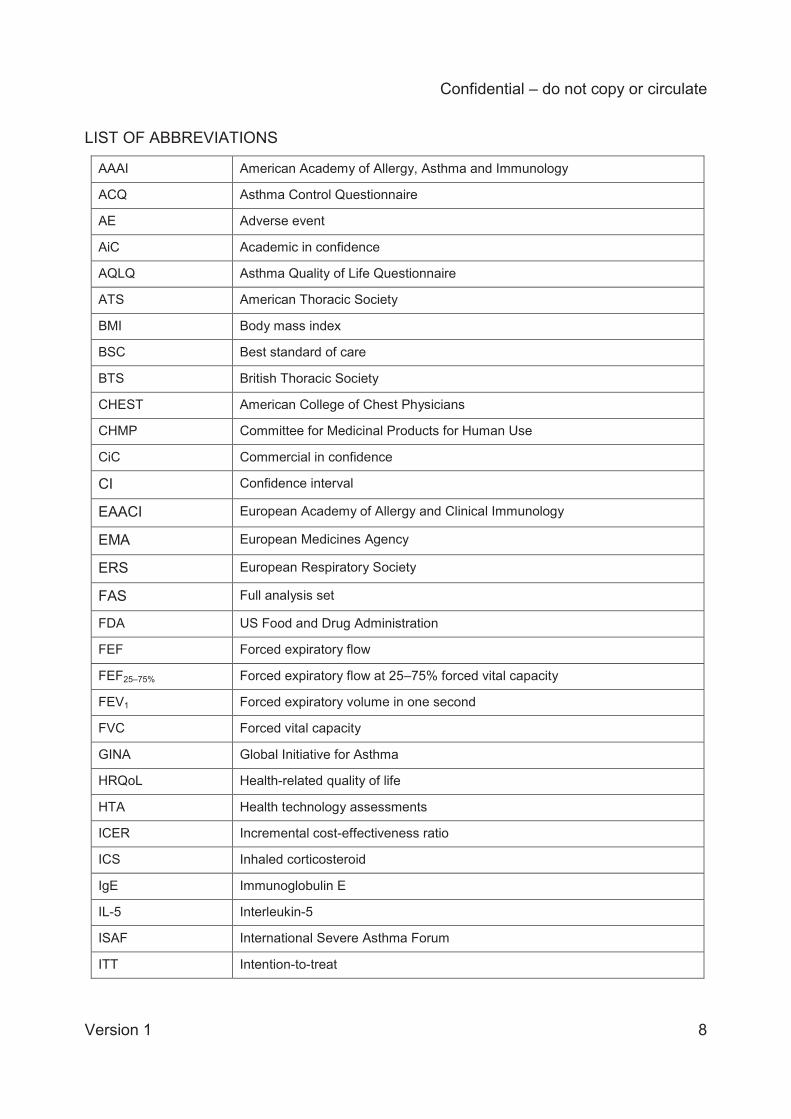
LIST OF ABBREVIATIONS
AAAI American Academy of Allergy, Asthma and Immunology
ACQ Asthma Control Questionnaire
AE Adverse event
AiC Academic in confidence
AQLQ Asthma Quality of Life Questionnaire
ATS American Thoracic Society
BMI Body mass index
BSC Best standard of care
BTS British Thoracic Society
CHEST American College of Chest Physicians
CHMP Committee for Medicinal Products for Human Use
CiC Commercial in confidence
CI Confidence interval
EAACI European Academy of Allergy and Clinical Immunology
EMA European Medicines Agency
ERS European Respiratory Society
FAS Full analysis set
FDA US Food and Drug Administration
FEF Forced expiratory flow
FEF25–75% Forced expiratory flow at 25–75% forced vital capacity
FEV1 Forced expiratory volume in one second
FVC Forced vital capacity
GINA Global Initiative for Asthma
HRQoL Health-related quality of life
HTA Health technology assessments
ICER Incremental cost-effectiveness ratio
ICS Inhaled corticosteroid
IgE Immunoglobulin E
IL-5 Interleukin-5
ISAF International Severe Asthma Forum
ITT Intention-to-treat
Confidential – do not copy or circulate
Version 1 9
LABA Long-acting beta-agonist
LTRA Leukotriene receptor antagonist
OCS Oral corticosteroid
PAS Patient access scheme
PASLU Patient Access Schemes Liaison Unit
QALY Quality-adjusted life year
QoL Quality of life
RCT Randomised controlled trial
SABA Short-acting beta-agonist
SAE Serious adverse event
SAS Safety analysis set
SD Standard deviation
SE Standard error
SIGN Scottish Intercollegiate Guidelines Network
SMC Scottish Medicines Consortium
SmPC Summary of Product Characteristics
SGRP St George’s Respiratory Questionnaire
Confidential – do not copy or circulate
Version 1 10
SUMMARY Scope of the company submission The company’s submission (CS) generally reflects the scope of the appraisal issued by the
National Institute for Health and Care Excellence (NICE). The scope considers adults with
asthma with elevated blood eosinophils inadequately controlled by inhaled corticosteroids. The
scope does not define elevated blood eosinophils. The company included patients with ≥400
eosinophils per μL which clinical experts advising the ERG agreed is reasonable. The
company’s pivotal clinical trials of effectiveness evidence included people aged from 12 years
upwards; however, as the mean age in the trials exceeded 40 years the trial populations do not
appear to conflict with the scope (for specific analyses in the economic model the company
utilised an adults-only subgroup and individual patient data from the trials). The NICE scope
does not specify patients’ exacerbation history, but the company’s economic analysis requires
that patients should have had a specified number of asthma exacerbations in the preceding 12
months. The intervention (reslizumab), comparators (omalizumab and best standard of care;
BSC), and the outcomes assessed by the company are consistent with the NICE scope. A key
assumption is made by the company that placebo in trials of both reslizumab and omalizumab is
equivalent to BSC.
Summary of submitted clinical effectiveness evidence The company conducted a systematic review to identify randomised controlled trials (RCTs) of
reslizumab and omalizumab. Overall, the literature searches for clinical effectiveness evidence
conducted by the company were appropriate, although searches were five months out of date.
The ERG did not identify any additional potentially relevant studies of reslizumab but we did
identify one potentially relevant study of omalizumab, which had been published since the date
of the company’s search. The company’s searches identified five RCTs of reslisumab versus
placebo and 16 RCTs of omalizumab versus various comparators, which were primarily placebo
or BSC. The company stated that one of the reslizumab trials (Res-5-0010) was excluded from
further consideration and the CS does not report any demographic details or quality assessment
for this trial. However, the company subsequently included this trial in a number of outcome
analyses.
The CS presents clinical effectiveness evidence in three main sections: results of the relevant
clinical trials of reslizumab versus placebo; a direct comparison meta-analysis of the results of
Confidential – do not copy or circulate
Version 1 11
these trials; and an indirect treatment comparison (ITC) comparing reslizumab against
omalizumab via the common comparator of placebo. In practice, the comparator in the
omalizumab trials was not always placebo but sometimes described as BSC, optimised asthma
therapy, or a control group, but the CS does not discuss this and assumes all comparators were
equivalent to BSC.
Characteristics of the reslizumab trials
Two of the reslizumab trials (referred to as 3082 and 3083) were identical, 52-week trials, with
clinically significant exacerbation rates as their primary outcome. These trials randomised 489
and 464 patients respectively and are referred to in this report as the company’s pivotal trials.
The remaining trials had durations of 16 weeks (trials 3081, 3084) or 15 weeks (trial Res-5-
0010) and randomised totals of 106 patients (Res-5-0010), 315 patients (trial 3081) and 496
patients (trial 3084). In each trial the intervention group received 3.0 mg/kg reslizumab
administered every 4 weeks in accordance with the summary of product characteristics (SmPC).
Trials 3081, 3084 and Res-5-0010 differed slightly in their inclusion criteria compared to the
pivotal clinical trials; in particular, unlike the other trials, trial 3084 did not require patients to
have ≥400 eosinophils per μL at baseline. The primary outcomes were changes in FEV1 (trials
3081, 3084) and changes in asthma control assessed using ACQ scores (Res-5-0010). The five
reslizumab trials were all double-blind and all were sponsored by the company or (Res-5-0010)
by one of its subsidiaries.
Outcomes
The company analysed seven outcomes which are relevant to the NICE scope: asthma control,
based on Asthma Control Questionnaire (ACQ) scores; rates of clinically significant
exacerbations; the proportion of patients hospitalised due to exacerbations; lung function
(forced expiratory volume in 1 second: FEV1); discontinuations due to adverse events;
frequency of serious adverse events; and health-related quality of life (HRQoL), assessed using
Asthma Quality of Life Questionnaire (AQLQ) scores. Asthma control, lung function and HRQoL
were analysed as changes from baseline to 16 and/or 52 weeks (depending upon data
availability) whilst exacerbation rates were standardised to person-years to account for trial
differences in assessment times. These seven outcomes were analysed both in the direct
comparison meta-analysis of reslizumab versus placebo and the indirect treatment comparison
Confidential – do not copy or circulate
Version 1 12
of reslizumab versus omalizumab. The company used a standard frequentist approach to
analyse all outcomes except exacerbations, which were modelled using a Bayesian approach.
We consider this to be reasonable, as the frequentist approach offers simplicity and
transparency whilst the exacerbation rate data are well suited to Bayesian analysis.
The CS presents some further outcomes which are relevant to the NICE scope but which were
not meta-analysed by the company: lung function (% predicted FEV1, FVC, FEF25-75%); and
HRQoL (Asthma Symptom Utility Index; ASUI). The CS also presents two additional outcomes
which are not specified in the NICE scope: changes in short-acting beta agonist (SABA) use
and blood eosinophil counts. These outcomes are presented and discussed in the current report
as supporting information.
Results of the direct comparison meta-analysis of reslizumab versus placebo
Improvement in asthma control at 16±1 weeks (5 trials), indicated by a decrease in ACQ score,
occurred in both reslizumab and placebo groups. The difference in the mean change was
statistically significantly larger in patients randomised to reslizumab than those randomised to
placebo, and both fixed-effects and random-effects models gave the same result (mean
difference –0.24; 95% CI –0.32 to –0.17). All patients in both groups had scores >2 at baseline
indicating poorly controlled asthma, but the CS does not discuss whether the observed changes
in ACQ scores would have altered this classification. Insufficient data were available to meta-
analyse ACQ scores at 52 weeks.
The rate of clinically significant exacerbations, standardised to person-years (3 trials), was
statistically significantly lower in the reslizumab group than the placebo group with a fixed-
effects model (hazard ratio 0.44; 95% credible interval 0.35 to 0.56) but not with a random-
effects model (0.43; 95% credible interval 0.17 to 1.10). Fixed and random effects models for
the rate of exacerbations indicated that the Bayesian analysis probability of reslizumab
performing better than placebo was 100% and 97%, respectively.
For the proportion of patients hospitalised due to exacerbations up to 52 weeks (2 trials), both
fixed-effects and random-effects models gave identical results, showing no significant difference
between the reslizumab and placebo groups (odds ratio 0.73; 95% CI 0.36 to 1.47); however,
hospitalisation events were rare in the trials.
Confidential – do not copy or circulate
Version 1 13
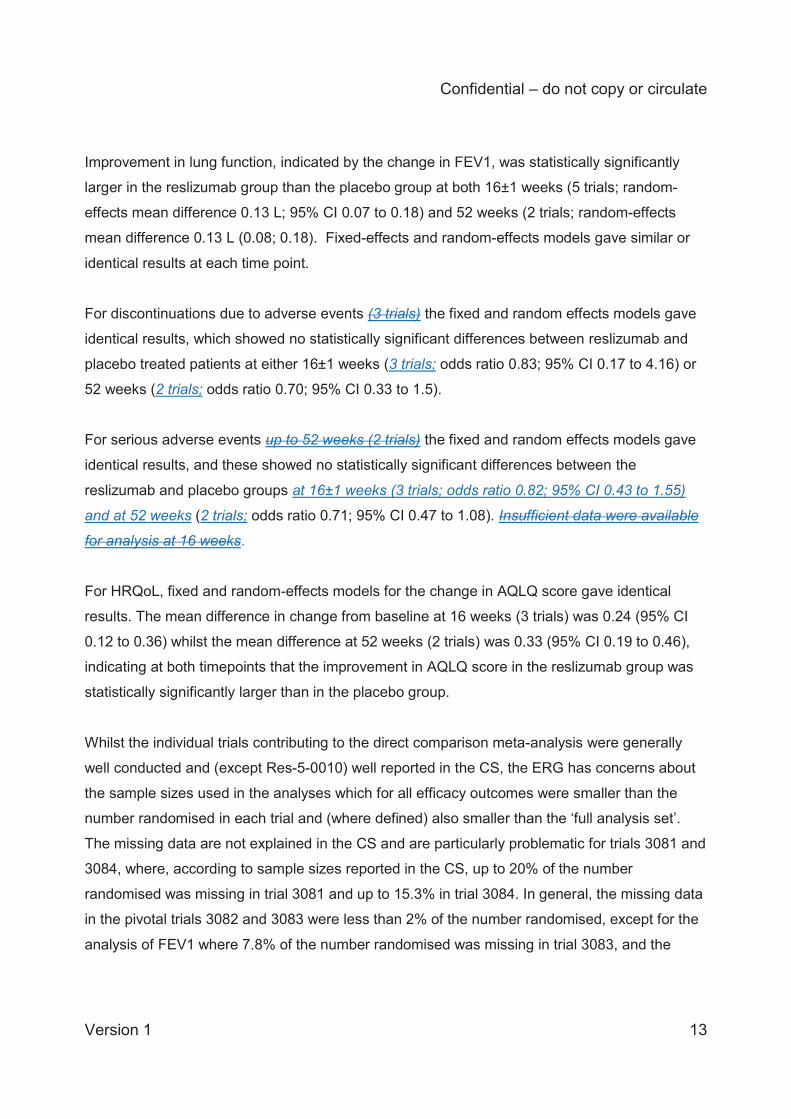
Improvement in lung function, indicated by the change in FEV1, was statistically significantly
larger in the reslizumab group than the placebo group at both 16±1 weeks (5 trials; random-
effects mean difference 0.13 L; 95% CI 0.07 to 0.18) and 52 weeks (2 trials; random-effects
mean difference 0.13 L (0.08; 0.18). Fixed-effects and random-effects models gave similar or
identical results at each time point.
For discontinuations due to adverse events (3 trials) the fixed and random effects models gave
identical results, which showed no statistically significant differences between reslizumab and
placebo treated patients at either 16±1 weeks (3 trials; odds ratio 0.83; 95% CI 0.17 to 4.16) or
52 weeks (2 trials; odds ratio 0.70; 95% CI 0.33 to 1.5).
For serious adverse events up to 52 weeks (2 trials) the fixed and random effects models gave
identical results, and these showed no statistically significant differences between the
reslizumab and placebo groups at 16±1 weeks (3 trials; odds ratio 0.82; 95% CI 0.43 to 1.55)
and at 52 weeks (2 trials; odds ratio 0.71; 95% CI 0.47 to 1.08). Insufficient data were available
for analysis at 16 weeks.
For HRQoL, fixed and random-effects models for the change in AQLQ score gave identical
results. The mean difference in change from baseline at 16 weeks (3 trials) was 0.24 (95% CI
0.12 to 0.36) whilst the mean difference at 52 weeks (2 trials) was 0.33 (95% CI 0.19 to 0.46),
indicating at both timepoints that the improvement in AQLQ score in the reslizumab group was
statistically significantly larger than in the placebo group.
Whilst the individual trials contributing to the direct comparison meta-analysis were generally
well conducted and (except Res-5-0010) well reported in the CS, the ERG has concerns about
the sample sizes used in the analyses which for all efficacy outcomes were smaller than the
number randomised in each trial and (where defined) also smaller than the ‘full analysis set’.
The missing data are not explained in the CS and are particularly problematic for trials 3081 and
3084, where, according to sample sizes reported in the CS, up to 20% of the number
randomised was missing in trial 3081 and up to 15.3% in trial 3084. In general, the missing data
in the pivotal trials 3082 and 3083 were less than 2% of the number randomised, except for the
analysis of FEV1 where 7.8% of the number randomised was missing in trial 3083, and the
Confidential – do not copy or circulate
Version 1 14
analysis of AQLQ where up to 6.9% of the number randomised was missing in trial 3082 and up
to 8.2% in trial 3083.
Results of the trials included in the CS show that for the asthma control, lung function and
HRQoL outcomes, improvements from baseline occurred in the placebo group as well as in the
reslizumab group, suggestive of a placebo effect. This is not unexpected, as placebo effects are
well-known in trials of asthma medications. However, the company does not discuss whether
this has any implications for their assumption that BSC and placebo are equivalent.
Results of the indirect treatment comparison of reslizumab versus omalizumab
The company’s indirect treatment comparison (ITC) is based on an assumption that effects of
omalizumab are comparable in patients irrespective of their blood eosinophil levels. This
assumption is necessary because only patients in the reslizumab trials had elevated blood
eosinophil levels.
The ITC is based on a simple network, comprising only trials of reslizumab versus placebo
(maximum 5) and trials of omalizumab versus placebo or BSC (maximum 16). In practice, the
company included some omalizumab trials which referred to optimised asthma therapy or a
control group as their comparator rather than BSC, but the ITC Report provided by the company
does not mention or discuss this. Although in theory 16 omalizumab trials were potentially
available for the ITC, the maximum number included for any given outcome, was four, reflecting
that most of the omalizumab trials did not report all of the outcomes of interest. The analytical
approach for the ITC was similar to that for the direct comparison meta-analysis (which, as
noted above, we consider reasonable): exacerbation rates were analysed with a Bayesian
approach and all other outcomes were analysed with a frequentist approach.
The ITC results for change in asthma control at 16±1 weeks are based on five reslizumab and
two omalizumab trials. One of the omalizumab trials was open-label and the company
conducted a sensitivity analysis excluding this trial (i.e. leaving only one omalizumab trial in the
analysis). When both omalizumab trials were included in the ITC, the mean difference in the
change in ACQ score at 16 weeks for reslizumab compared to omalizumab was 0.30 (95% CI
0.10 to 0.55) with a fixed-effects model and 0.15 (95% CI –0.31 to 0.61) with a random-effects
Confidential – do not copy or circulate
Version 1 15
model. Excluding the open-label omalizumab trial gave a fixed-effects mean difference of –0.24
(95% CI –0.68 to 0.19). The company concluded that, based on the random-effects model,
reslizumab is comparable to omalizumab in terms of change from baseline in ACQ score at
16±1 weeks. Insufficient data were available for analysis at 52 weeks.
ITC results for rates of clinically significant exacerbations, standardised to person-years, are
based on three reslizumab and three omalizumab trials. The company used the deviance
information criterion (DIC), which was marginally smaller for fixed-effects than the random-
effects model (78.06 versus 78.81), to justify presenting only prioritising results of a fixed-effects
analysis for this outcome (random-effects results are presented separately in ITC Report
Appendix 12). The ERG disagrees with this approach, because such a small difference in the
DIC is not informative, and also because a random-effects model is arguably more plausible. As
one of the omalizumab trials was open-label, the company conducted a sensitivity analysis
omitting this trial. The fixed-effects ITC hazard ratio favoured reslizumab over omalizumab in
terms of having a lower rate of clinically significant exacerbations (0.80; 95% CI 0.44 to 1.44)
and this effect was strengthened in the sensitivity analysis limited to double-blind studies (0.54;
95% CI 0.26 to 1.12). The Bayesian probability that reslizumab will perform better than
omalizumab was 77% in the full analysis and 95% in the analysis limited to double-blinded trials.
However, in the random-effects analysis (which included the open-label trial) the median hazard
ratio comparing reslizumab against omalizumab for clinically significant exacerbations was
considerably smaller (0.18; 95% CrI 0.18 to 2.82).However, the robustness of these results is
unclear given that no random-effects analysis is available for comparison.
The ITC analysis of patients hospitalised due to exacerbations could only be conducted for 52
weeks due to a lack of data at 16 weeks. Two reslizumab and two omalizumab trials were
included, both of which were open-label. Odds ratios for fixed-effects and random-effects
analyses were identical (0.71; 95% CI 0.26 to 1.89) and indicate no difference between
reslizumab and omalizumab in the proportions of patients hospitalised due to exacerbations.
Limitations are the open-label nature of the omalizumab studies, and relatively low rates of
hospitalisation events. Also, the ITC Report presents the percentage of patients hospitalised
due to exacerbations in each arm of the four trials and this shows that the BSC arms of the
omalizumab trials had higher hospitalisation rates than the placebo arms of the reslizumab
trials.
Confidential – do not copy or circulate
Version 1 16
The ITC results for changes in lung function (FEV1) at 16±4 weeks are based on five
reslizumab trials and three omalizumab trials. Two of the omalizumab trials were open-label and
the company conducted a sensitivity analysis excluding these, i.e. leaving only one omalizumab
trial in the analysis. The analysis of all trials gave a fixed-effects mean difference in the change
from baseline of 0.00 L (95% CI –0.07 to 0.08) and the random-effects analysis gave a mean
difference of 0.01 L (95% CI –0.13 to 0.01), whilst the analysis excluding open-label trials gave
a fixed-effects mean difference of –0.13 L (95% CI –0.3 to 0.04). The results indicate a lack of
clinically significant or statistically significant differences between reslizumab and omalizumab in
the FEV1 change from baseline to 16±4 weeks.
ITC analysis of changes in lung function at 52 weeks was based on two reslizumab trials and
only one omalizumab trial. The fixed-effects analysis mean difference in FEV1 change from
baseline was –0.19 L (95% CI –0.25 to –0.13), indicating that, over 52 weeks, FEV1 was
improved statistically significantly more by omalizumab than by reslizumab. However, the
company’s ITC Report comments that the difference (0.19 L) was less than that considered to
be clinically important (0.2 L).
ITC analysis of discontinuations due to adverse events up to 16 weeks was based on three
reslizumab and two omalizumab trials. The odds ratios for fixed-effects and random-effects
analyses were identical (1.13; 95% CI 0.17 to 7.62) and indicate no significant difference
between reslizumab and omalizumab in the odds of experiencing discontinuations due to
adverse events up to 16 weeks.
ITC analysis of discontinuations due to adverse events up to 52±4 weeks was based on two
reslizumab trials and one omalizumab trial. The fixed-effects estimate of the odds ratio (0.48;
95% CI 0.16 to 1.43) indicates no difference between reslizumab and omalizumab in the odds of
experiencing discontinuation due to adverse events up to 52±4 weeks.
ITC analysis of serious adverse events up to 16 weeks was based on three reslizumab trials
and four omalizumab trials. The fixed-effects and random-effects odds ratios were identical
(1.04; 95% CI 0.4 to 2.68) and indicate no difference between reslizumab and omalizumab in
the odds of experiencing serious adverse events up to 16 weeks.
Confidential – do not copy or circulate
Version 1 17
ITC analysis of serious adverse events up to 52±4 weeks was based on two reslizumab trials
and two omalizumab trials. The company conducted a sensitivity analysis excluding one open-
label omalizumab trial, i.e. leaving only one omalizumab trial in the analysis. The fixed-effects
and random-effects odds ratios for the full analysis on all trials were identical (0.71; 95% CI 0.4
to 1.24) and indicate no difference between reslizumab and omalizumab in the odds of
experiencing serious adverse events up to 52±4 weeks. The fixed-effects odds ratio for the
analysis excluding the open-label trial (0.80; 95% CI 0.43, 1.48) also indicates no difference.
ITC analysis of changes in HRQoL (AQLQ scores) at 16±4 weeks were based on four
reslizumab trials and one omalizumab trial. The fixed-effects mean difference in the change
from baseline (–0.56; 95% CI –0.92 to –0.20) statistically significantly favours omalizumab over
reslizumab, although the ITC Report does not mention this.
ITC analysis of changes in AQLQ scores at 52±4 weeks were based on two reslizumab trials
and one omalizumab trial. The fixed-effects mean difference in the change from baseline (0.10;
0=95% CI –0.11 to 0.31) indicates no significant difference in the change in AQLQ score
between the reslizumab and omalizumab groups.
As noted below (Commentary on the robustness of the submitted evidence) the ERG has
serious concerns about the methodological quality of the company’s ITC and these should be
borne in mind when interpreting the above results.
Results of the ITC do not directly inform the company’s economic analysis. In the economic
analysis section of the CS it is stated that rate ratios for exacerbations as employed in the
company’s economic analysis were derived from the ITC (which is referred to as an NMA –
network meta-analysis). However, this information is not given in the company’s ITC Report.
Summary of submitted cost effectiveness evidence A systematic search was conducted by the company to identify economic evaluations of
pharmacological interventions for adults with severe eosinophilic asthma. The review excluded
RCTs and non-UK economic evaluations. The company identified five relevant studies, four
comparing omalizumab to BSC and one comparing mepolizumab to BSC.
Confidential – do not copy or circulate
Version 1 18
The company’s de novo cost effectiveness analysis used a Markov model to estimate the cost
effectiveness of reslizumab compared to BSC and omalizumab. The model adopted a time
horizon of 60 years and a cycle length of four weeks. The model consisted of six mutually
exclusive health states: controlled asthma, uncontrolled asthma, moderate exacerbation, severe
exacerbation, asthma-related death, and all-cause mortality. Patients in the model receiving
reslizumab and omalizumab were assessed at 16 weeks, and those classed as non-responders
were assumed to discontinue treatment. Patients were also assessed at 52 weeks and each
year thereafter, discontinuing treatment if they remained in either an exacerbation or
uncontrolled state continuously for one year. As recommended by NICE, a discount of 3.5%
was used for both costs and health outcomes. The analyses were conducted from the
perspective of the NHS and PSS.
Patients transitioned between health states in the model according to transition probabilities. For
the reslizumab and BSC treatment arms, the transition probabilities were computed using
patient-level data from the pivotal reslizumab trials (3082 and 3083). The sample used to
estimate the transition probabilities was the subgroup of adult patients (aged 18 years or older),
at step 4 or 5 in the GINA pathway, who had experienced at least 2 exacerbations in the
preceding year. The company adjusted the exacerbation probabilities estimated from the 2
exacerbation subgroup to reflect the rate of BSC exacerbations observed in the year before
randomisation in the subgroup of interest ( 3 exacerbations in the base case analysis). For the
omalizumab treatment arm, rates of exacerbation after 16 weeks were based on an analysis for
responders in the INNOVATE trial. The source of the exacerbation rate for omalizumab prior to
16 weeks was unclear in the CS. Rates of asthma control and response to treatment for
omalizumab were assumed equal to those for reslizumab.
The company conducted a systematic review for costs and HRQoL. The company used HRQoL
data from studies by Willson and colleagues and Lloyd and colleagues. These studies were for
patients with asthma at GINA steps 4 and 5 and reported EQ-5D data using the UK tariff.
Reslizumab is administered via intravenous administration and the recommended dose of
reslizumab, based on patient weight, is 3.0 mg/kg given once every 4 weeks. Resilizumab is
anticipated to have a confidential patient access scheme. Omalizumab is currently provided on
the NHS with a confidential patient access scheme.
Confidential – do not copy or circulate
Version 1 19
Results of the economic model are presented as the incremental cost per quality adjusted life
year (QALY). The patient population eligible for treatment differs between omalizumab and
reslizumab and so the company presents two analyses for reslizumab versus BSC and for
reslizumab versus omalizumab. The results of the cost effectiveness analyses at the list price
for omalizumab and the PAS price for resilizumab showed an incremental cost effectiveness
ratio (ICER) of £24,907 per QALY for reslizumab compared to BSC and omalizumab is
extendedly dominated by BSC.
The company performed a range of deterministic and probabilistic sensitivity analyses to assess
model uncertainty. The ICER remained below £30,000 per QALY in all deterministic sensitivity
analyses, with the exception of reducing the time horizon to five years. The analyses are most
sensitive to the rate of exacerbations for the BSC arm. The company provided analyses for
subgroups according to the number of exacerbations experienced in the previous year, by
calibrating the transition probabilities to the exacerbation health states using an ‘exacerbation
multiplier’. The ICER varied between £33,774 per QALY for patients who had experienced ≥2
exacerbations in the preceding year and £20,006 per QALY for patients who had experienced
≥4 exacerbations.
The probabilistic sensitivity analysis (PSA) estimated a XXX and XXX probability that
reslizumab is cost effective at a willingness to pay threshold of £20,000 and £30,000 per QALY
gained, respectively. Commentary on the robustness of submitted evidence Strengths
Clinical effectiveness
The company conducted a systematic review for relevant trials and appears to have identified
all relevant evidence for reslizumab and the majority of evidence for omalizumab. The included
trials of reslizumab are of generally good quality and the company provided a quality
assessment for four out of the five trials. We largely agree with the company’s assessments of
trial quality (apart from some issues around missing data, particularly in the trials 3081 and
Confidential – do not copy or circulate
Version 1 20
3084). The company provided clinical study reports and publications in support of the CS. The
CS and the company’s ITC report are generally well structured with clear tabulation of trial
characteristics and results.
Economic analysis
A systematic review was conducted to identify cost-effectiveness, HRQoL and cost studies and
values from this review were utilised in the model. The model structure is based on a published
model in severe asthma and is representative of the clinical pathway for patients with severe
asthma. The trials used for the effectiveness evidence are of generally good quality.
Weaknesses and areas of uncertainty
Clinical effectiveness
The main limitation of the clinical trials is that their duration (15 to 52 weeks) is relatively short
given that asthma is a chronic condition. In one of the trials (3084), 80% of the population had
blood eosinophils <400 per μL which differs from the inclusion criterion for the other trials (blood
eosinophils ≥400 per μL).
The company (despite a request for clarification from the ERG via NICE) is unclear about the
relevance of the trial Res-5-0010: this trial was identified in the systematic review, then excluded
by the company, then subsequently included in some outcome analyses. For the AQLQ
outcome assessed at 16 weeks this trial was excluded from the direct comparison but included
in the ITC.
Although the trials involved approaches to account for missing data, such as sensitivity
analyses, the reported sample sizes for the analysed outcomes do not concur with the number
randomised and reasons for missing data are not explained. There are also inconsistencies in
the sample sizes reported in the CS for the individual clinical trials and the direct comparison
meta-analysis.
Confidential – do not copy or circulate
Version 1 21
The ERG has a number of concerns about the company’s ITC:
The ‘feasibility’ process for selecting trials for inclusion is poorly described in the ITC
report. For the AQLQ outcome assessed at 16±4 weeks the trial Res-5-0010 is included
in the ITC of reslizumab versus omalizumab but excluded from the direct comparison of
reslizumab versus placebo, without any explanation.
The company’s process for selecting trials based on their definitions of clinically
significant exacerbations appears inconsistent, meaning that several omalizumab trials
may have been unnecessarily excluded from analysis.
The company has not considered any possible differences between placebo, BSC,
optimised asthma therapy and control groups in the omalizumab trials and it is therefore
unclear whether these different arms are adequately homogeneous to serve as a
common comparator in the ITC.
The company’s trials provide evidence for placebo effects but the CS does not consider
whether this has any implications for the assumption that placebo is equivalent to BSC.
The CS selectively presents only fixed-effects model results for the analysis of clinically
significant exacerbation rates when a random-effects analysis should at least have been
presented for comparison.
The reported sample sizes for the reslizumab trials analysed in the ITC are different to
those for the same trials when analysed for the same outcomes in the direct comparison;
furthermore, for some outcomes sample sizes are markedly smaller than the number
randomised and (where defined) smaller than the ‘full analysis set’.
[Note added after final submission of this ERG report to NICE: The company clarified
during the factual inaccuracy check process that sample sizes for the ITC analyses were
the same as those for their direct comparison meta-analysis but were reported
incorrectly in the ITC Report (the ERG cannot corroborate this). The company also
clarified that trial Res-5-0010 was not included in the AQLQ ITC analysis, although the
ITC Report states that it was. These discrepancies do not materially affect the
conclusions of this report, since other uncertainties in the results of the ITC analysis
remain].
Overall, based on these limitations we advise that the ITC results should be viewed with caution
since they could be at high risk of bias.
Economic analysis
Confidential – do not copy or circulate
Version 1 22
The systematic review of economic studies, HRQoL and resources has limiting exclusion
criteria: all RCTs were ineligible for inclusion; HRQoL and costs may only come from
observational studies; economic evaluations may only be UK models; and if a study reported on
mixed adult and juvenile populations or mixed severity populations they were excluded.
The model structure is not directly comparable to other technology appraisals (omalizumab and
mepolizumab)
The model applies an exacerbation multiplier to increase the rate of exacerbations, to a similar
level as seen in the year preceding the trial. It is not clear if applying this multiplier is
appropriate.
The definitions of exacerbations were not consistent between the HRQoL studies and the
definition used in the model, which is likely to lead to an overestimate in the severity of the
exacerbation utility values.
Summary of additional work undertaken by the ERG The ERG conducted the following additional analyses to investigate changes to the model
results:
Changes to the exacerbation rate for BSC to reflect the observed exacerbation rate in
the reslizumab clinical trials;
Alternative utility values for the exacerbation health states;
Alternative health state costs ;
shorter monitoring duration for omalizumab.
An alternative base case analysis for reslizumab compared to BSC and omalizumab,
consisting of a combination of the analyses above.
Changing the exacerbation rate for BSC to reflect the actual exacerbation rate in the clinical
trials has a significant impact on the model results and increases the ICER for reslizumab vs
BSC to £50,878 per QALY. The other analyses have a smaller impact on the model results. The
ERG’s alternative base case comparison for reslizumab compared to BSC produces an ICER of
£57,356 per QALY. In comparison to reslizumab, omalizumab remains extendedly dominated.
Confidential – do not copy or circulate
Version 1 23
1 Introduction to the ERG Report This report is a critique of the company’s submission (CS) to NICE from Teva UK Limited on the
clinical effectiveness and cost effectiveness of reslizumab (brand name CINQAERO) for the
treatment of adults with asthma who have elevated blood eosinophils and whose asthma is
inadequately controlled by inhaled corticosteroids (ICS). Reslizumab plus best standard of care
(BSC) is compared against BSC alone and also against omalizumab plus BSC. In this report the
Evidence Review Group (ERG) identifies the strengths and weakness of the CS. Clinical
experts were consulted to advise the ERG and to help inform this review.
Clarification on some aspects of the CS was requested from the manufacturer by the ERG via
NICE on 10/08/2016. A response from the company via NICE was received by the ERG on
30/08/2016 and this can be seen in the NICE committee papers for this appraisal.
2 BACKGROUND The CS provides an appropriate description of severe asthma, highlighting the heterogeneity of
the disease.
2.1 Summary & critique of the company’s description of the underlying health problem
Asthma is a chronic inflammatory disease associated with airway inflammation, variable airflow
obstruction and airway hyper-responsiveness and affects around 5.4 million people in the UK (1
in 11 children and 1 in 12 adults). The UK has some of the highest asthma rates in Europe. The
disease accounts for high numbers of consultations in primary care, out-of-hours services and
hospital emergency departments. The CS cites figures from 2011-2012 for hospital admissions
and 2000-2005 for asthma mortality rates in the UK. More up-to-date figures report that there
were 60,636 hospital admissions for asthma in England in 2013-2014, and 138,140 bed days
and 80,990 finished consultant episodes in 2015.1 Asthma was responsible for 1216 deaths in
2014, with a mean number of three deaths per day from the disease.2 Asthma costs the NHS an
estimated £1 billion a year, with the burden being driven by severe cases.3
Confidential – do not copy or circulate
Version 1 24
Asthma is characterised by variable and recurring symptoms. An asthma ‘exacerbation’ or
‘attack’ refers to people with asthma experiencing a worsening of their symptoms and airway
function, with an increase in breathlessness, wheezing, chest tightness, sputum production
and/or cough. Asthma exacerbations can have a considerable negative impact on patients’
health-related quality of life (HRQoL), affecting activities such as work, exercise and travel, as
well as reducing their sense of wellbeing due to fear of having further symptoms or
exacerbations.4
Most patients manage their asthma by following guidance from physicians based on a stepwise
approach to treatment as recommended by the British Thoracic Society (BTS) and the Scottish
Intercollegiate Guideline Network (SIGN).5 The BTS/SIGN treatment approach is very similar to
the stepwise approach recommended by the Global Initiative for Asthma (GINA)6 (Table 1). As
explained further below (section 2.2), patients should start treatment at the step most
appropriate to the initial severity of their disease and maintain asthma control by stepping up
treatment when control is poor and stepping down when control is good.
Eosinophilic asthma is a phenotype of severe asthma that is associated with elevated levels of
eosinophils (a type of white blood cell) in tissues and sputum, and may be accompanied by
eosinophilic nasal polyps. Eosinophils play a role in airway inflammation, and increased
concentrations of eosinophils (referred to as eosinophilia) are associated with increased
frequency of exacerbations and poor disease control.7 The population of patients who have
asthma with elevated blood eosinophils is equivalent to patients who are at Step 4 and or Step 5
of the BTS/SIGN and GINA treatment pathways (Table 1), and these patients meet GINA
classification criteria for having severe asthma (Table 2).
Despite best therapeutic attempts, for a small subgroup of around 5-10% of patients with severe
eosinophilic asthma, the disease remains inadequately controlled at Steps 4 and 5. A small
proportion of these patients on best standard of care (BSC) who have severe persistent IgE-
mediated asthma may be eligible for treatment with omalizumab; however, for the majority of
patients whose asthma is not controlled at Steps 4 and 5 treatment options are limited, and
consist currently of further increasing the dose of inhaled corticosteroids (ICS) or adding oral
corticosteroids (OCS). Long-term use of ICS is associated with well-known adverse effects,
including, among others, reduced bone mineral density5 and diminished corticosteroid
sensitivity.8
Confidential – do not copy or circulate
Version 1 25
Reslizumab, used in addition to BSC, is a potential new treatment option for patients whose
severe eosinophilic asthma is not controlled at Steps 4 and 5, particularly those who are not
eligible to receive omalizumab.
2.2 Summary & critique of the company’s overview of current service provision
The CS provides an overview of the clinical pathway of care, which is primarily based on the
BTS/SIGN guidelines.5 The care pathway described in the CS is relevant and appropriate to the
decision problem in the NICE scope. The stepwise approach recommends that when control of
the condition is poor, treatment doses should be increased and/or other controller medications
should be added, and that treatment should be stepped down when control is good or improved
(see Table 1). As pointed out in the CS, there are no specific guidelines available for the
management of people with severe eosinophilic asthma inadequately controlled by ICS. The CS
points out, though, that this population falls within the European Respiratory Society/American
Thoracic Society (ERS/ATS) Task Force and GINA guidelines’ definitions of severe asthma.9
The ERG agrees with this. The GINA definition of asthma severity is shown in Table 2. The
GINA guidelines (Table 1) offer a similar stepwise treatment approach to that specified in the
BTS/SIGN guidelines. The CS states that the population of interest in this appraisal would
receive the same management approaches as set out in the last two steps of the GINA and
BTS/SIGN guidelines (i.e. steps 4 and/or 5), which are used to treat severe asthma (as defined
in Table 2).
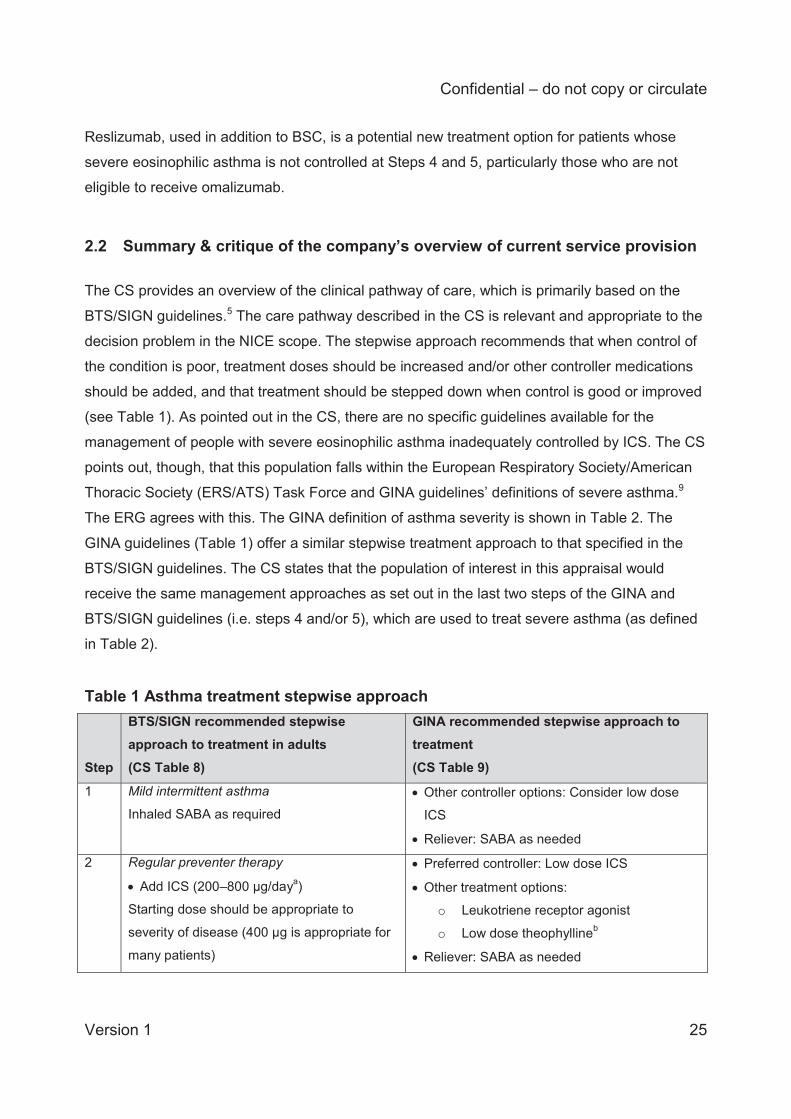
Table 1 Asthma treatment stepwise approach Step
BTS/SIGN recommended stepwise approach to treatment in adults (CS Table 8)
GINA recommended stepwise approach to treatment (CS Table 9)
1
Mild intermittent asthma
Inhaled SABA as required Other controller options: Consider low dose
ICS
Reliever: SABA as needed
2
Regular preventer therapy
Add ICS (200–800 μg/daya)
Starting dose should be appropriate to
severity of disease (400 μg is appropriate for
many patients)
Preferred controller: Low dose ICS
Other treatment options:
o Leukotriene receptor agonist
o Low dose theophyllineb
Reliever: SABA as needed
Confidential – do not copy or circulate
Version 1 26
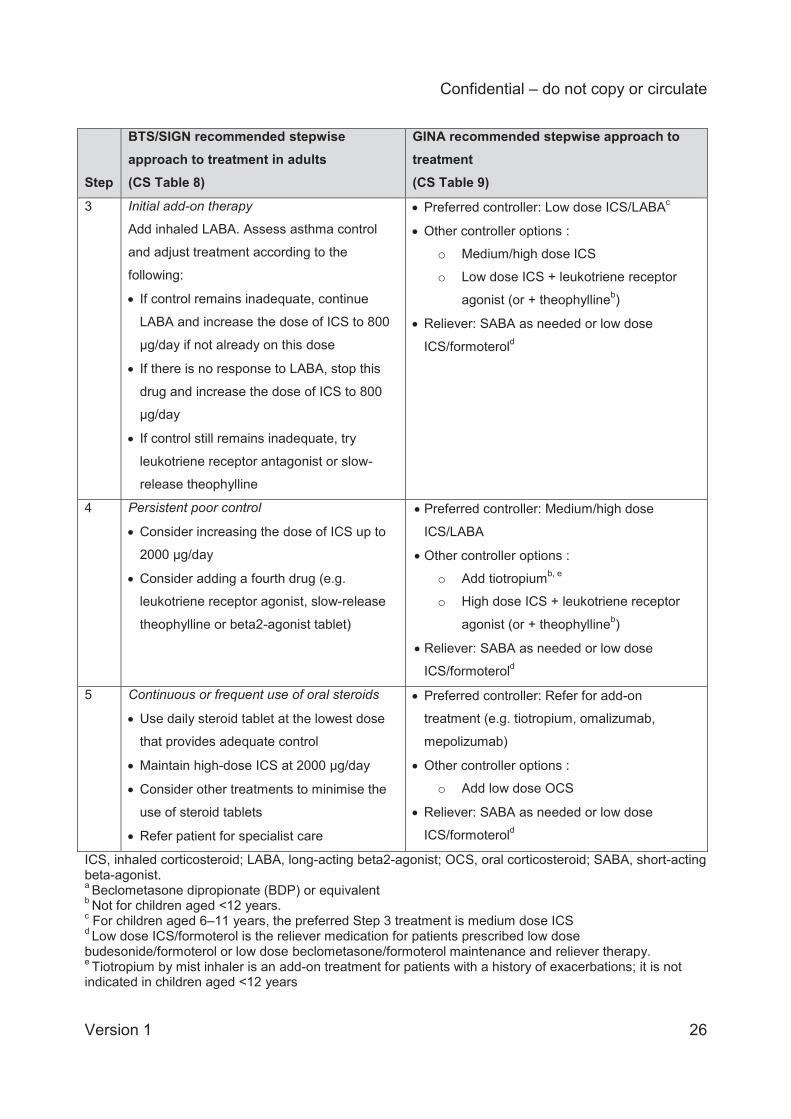
Step
BTS/SIGN recommended stepwise approach to treatment in adults (CS Table 8)
GINA recommended stepwise approach to treatment (CS Table 9)
3
Initial add-on therapy
Add inhaled LABA. Assess asthma control
and adjust treatment according to the
following:
If control remains inadequate, continue
LABA and increase the dose of ICS to 800
μg/day if not already on this dose
If there is no response to LABA, stop this
drug and increase the dose of ICS to 800
μg/day
If control still remains inadequate, try
leukotriene receptor antagonist or slow-
release theophylline
Preferred controller: Low dose ICS/LABAc
Other controller options :
o Medium/high dose ICS
o Low dose ICS + leukotriene receptor
agonist (or + theophyllineb)
Reliever: SABA as needed or low dose
ICS/formoterold
4
Persistent poor control
Consider increasing the dose of ICS up to
2000 μg/day
Consider adding a fourth drug (e.g.
leukotriene receptor agonist, slow-release
theophylline or beta2-agonist tablet)
Preferred controller: Medium/high dose
ICS/LABA
Other controller options :
o Add tiotropiumb, e
o High dose ICS + leukotriene receptor
agonist (or + theophyllineb)
Reliever: SABA as needed or low dose
ICS/formoterold
5
Continuous or frequent use of oral steroids
Use daily steroid tablet at the lowest dose
that provides adequate control
Maintain high-dose ICS at 2000 μg/day
Consider other treatments to minimise the
use of steroid tablets
Refer patient for specialist care
Preferred controller: Refer for add-on
treatment (e.g. tiotropium, omalizumab,
mepolizumab)
Other controller options :
o Add low dose OCS
Reliever: SABA as needed or low dose
ICS/formoterold
ICS, inhaled corticosteroid; LABA, long-acting beta2-agonist; OCS, oral corticosteroid; SABA, short-acting beta-agonist. a Beclometasone dipropionate (BDP) or equivalent b Not for children aged <12 years. c For children aged 6–11 years, the preferred Step 3 treatment is medium dose ICS d Low dose ICS/formoterol is the reliever medication for patients prescribed low dose budesonide/formoterol or low dose beclometasone/formoterol maintenance and reliever therapy. e Tiotropium by mist inhaler is an add-on treatment for patients with a history of exacerbations; it is not indicated in children aged <12 years
Confidential – do not copy or circulate
Version 1 27
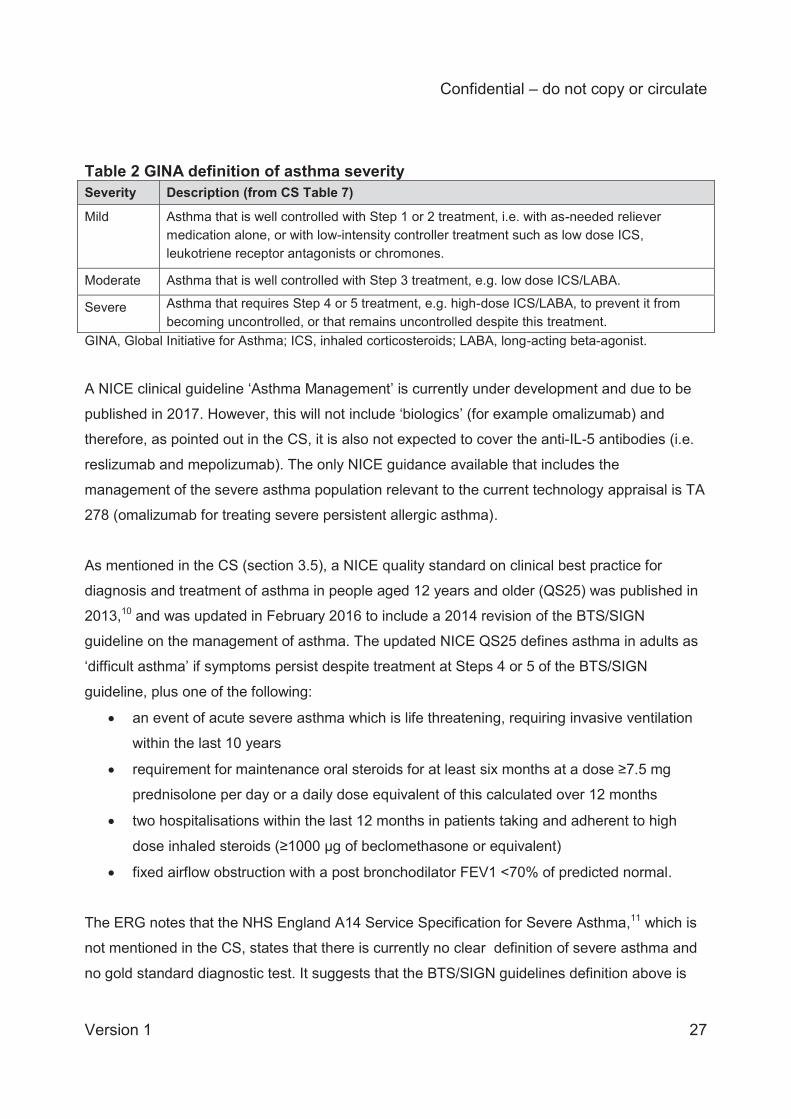
Table 2 GINA definition of asthma severity Severity Description (from CS Table 7)
Mild
Asthma that is well controlled with Step 1 or 2 treatment, i.e. with as-needed reliever medication alone, or with low-intensity controller treatment such as low dose ICS, leukotriene receptor antagonists or chromones.
Moderate Asthma that is well controlled with Step 3 treatment, e.g. low dose ICS/LABA.
Severe Asthma that requires Step 4 or 5 treatment, e.g. high-dose ICS/LABA, to prevent it from becoming uncontrolled, or that remains uncontrolled despite this treatment.
GINA, Global Initiative for Asthma; ICS, inhaled corticosteroids; LABA, long-acting beta-agonist.
A NICE clinical guideline ‘Asthma Management’ is currently under development and due to be
published in 2017. However, this will not include ‘biologics’ (for example omalizumab) and
therefore, as pointed out in the CS, it is also not expected to cover the anti-IL-5 antibodies (i.e.
reslizumab and mepolizumab). The only NICE guidance available that includes the
management of the severe asthma population relevant to the current technology appraisal is TA
278 (omalizumab for treating severe persistent allergic asthma).
As mentioned in the CS (section 3.5), a NICE quality standard on clinical best practice for
diagnosis and treatment of asthma in people aged 12 years and older (QS25) was published in
2013,10 and was updated in February 2016 to include a 2014 revision of the BTS/SIGN
guideline on the management of asthma. The updated NICE QS25 defines asthma in adults as
‘difficult asthma’ if symptoms persist despite treatment at Steps 4 or 5 of the BTS/SIGN
guideline, plus one of the following:
an event of acute severe asthma which is life threatening, requiring invasive ventilation
within the last 10 years
requirement for maintenance oral steroids for at least six months at a dose ≥7.5 mg
prednisolone per day or a daily dose equivalent of this calculated over 12 months
two hospitalisations within the last 12 months in patients taking and adherent to high
dose inhaled steroids (≥1000 μg of beclomethasone or equivalent)
fixed airflow obstruction with a post bronchodilator FEV1 <70% of predicted normal.
The ERG notes that the NHS England A14 Service Specification for Severe Asthma,11 which is
not mentioned in the CS, states that there is currently no clear definition of severe asthma and
no gold standard diagnostic test. It suggests that the BTS/SIGN guidelines definition above is
Confidential – do not copy or circulate
Version 1 28
too general, and mentions an up-to-date definition proposed by the European Respiratory and
American Thoracic Societies. Clinical expert advice received by the ERG suggests that the
indications for severe asthma management are still in development.
According to the NHS England A14 Service Specification for Severe Asthma,11 patients
suspected of having severe asthma would be referred to receive a multidisciplinary assessment
at a specialist severe asthma centre. Such a centre should be run by at least two consultant
respiratory physicians with an interest in severe asthma. Multi-disciplinary assessment of the
patient involves review by a physiotherapist, asthma nurse specialist, health psychologist,
dietician, and allergist, and is conducted over two day-case visits. Pre-planned investigations
include measures of airway inflammation and airways hyper-reactivity, which are only available
at specialist centres. Once patients have received a diagnosis, the treatment decision and initial
assessment of efficacy are carried out at the specialist centre. Treatment decisions include the
patient’s suitability for bronchial thermoplasty, omalizumab, or novel biological therapies as they
become available. If trials of these drugs are successful at the specialist centre, then the drugs
may be used outside of the specialist centre in the longer-term. The majority (approximately
70%) of patients with severe, difficult to control asthma will receive long-term follow up at a
specialist centre, with an initial 3-month follow-up consultation and then reviews every six
months if clinically stable. Referrals to specialist centres originate primarily from respiratory
physicians in secondary care (but may also arise from primary care or after an episode in an
intensive care unit).
The CS acknowledges (CS Table 6 and CS section 2.4.2) that patients will initially receive
reslizumab and ongoing monitoring in specialist centres. The CS, however, does not clearly
draw out the implications of this for patients and the NHS. Clinical expert advice to the ERG
suggests that treatment in a specialist centre would incur extra costs for the NHS and patients.
There are currently five such centres, with more specialist centres due to be rolled out in the
future. However, according to clinical expert advice received by the ERG, the national
commissioning structure is still in development.
Treatment options
As stated in the CS, there are limited treatment options for patients with severe asthma which
remains inadequately controlled with medium to high dose ICS in combination with other
controller medications. Continuing to increase ICS dose or adding OCS are options, but as high-
Confidential – do not copy or circulate
Version 1 29
dose and long-term use of corticosteroids are associated with a range of adverse effects, the
BTS/SIGN guidelines state that ICS and OCS should be used at the lowest doses at which
asthma control is maintained and other treatments should be considered to minimise the use of
steroid tablets.
For patients with severe persistent allergic (IgE-mediated) asthma (≥6 years) who need
continuous or frequent treatment with oral corticosteroid (OCS) (defined as ≥4 in the previous
year), NICE recommends the anti-IgE monoclonal antibody omalizumab as an add-on
treatment option to optimised standard therapy (MTA, TA278).12 The treatment recommendation
is dependent on the manufacturer making omalizumab available with the discount agreed in the
patient access scheme (PAS).12 As explained in the CS, omalizumab does not target the
eosinophilic (IL-5-mediated) phenotype and so is unsuitable for patients with severe eosinophilic
asthma, unless these patients also have IgE-mediated asthma. According to the final NICE
scope, omalizumab is suitable for people with severe persistent allergic IgE-mediated asthma
with elevated blood eosinophils.12
The anti-IL-5 monoclonal antibody mepolizumab is licensed as an add-on treatment for severe
refractory eosinophilic asthma in adults and is currently being apprised by NICE.
2.3 Summary & critique of the company’s definition of the decision problem
Population The patient population in the CS decision problem appears consistent with the NICE scope,
which refers to ‘adults with asthma with elevated blood eosinophils inadequately controlled by
inhaled corticosteroids’. This is an appropriate population for the NHS, as these patients
currently have limited treatment options. The NICE scope does not define ‘elevated blood
eosinophils’, but according to clinical expert advice to the ERG, although there are difficulties in
specifying the degree of severity of eosinophilia, the threshold for elevated blood eosinophils of
≥400 cells/μL employed by the company (consistent with the pivotal clinical trials of reslizumab)
is reasonable.
Confidential – do not copy or circulate
Version 1 30
The CS states that the population is those aged 18 years or older. We note that the clinical
trials included in the company’s review of clinical effectiveness included patients who were
aged 12 years and older. However, the mean age of patients in all the included trials was above
40 years.
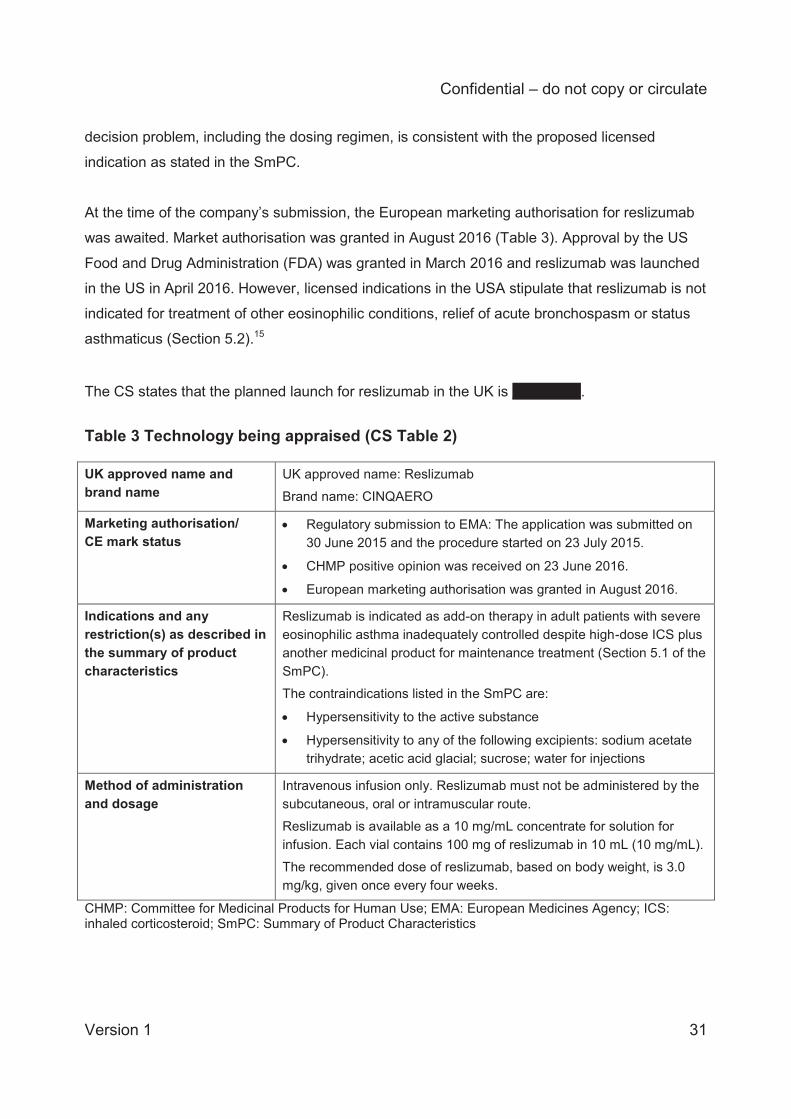
Intervention Reslizumab is intended to be used in addition to best standard of care (BSC). The indication,
restrictions and marketing status of reslizumab are summarised by the company (CS Table 2)
and are reproduced here in Table 3.
Reslizumab is a humanised monoclonal anti-IL-5 antibody (IgG4/ĸ) ‘indicated as add-on therapy
in adult patients with severe eosinophilic asthma inadequately controlled despite high-dose ICS
plus another medicinal product for maintenance treatment’.13 IL-5 is a pro-inflammatory cytokine
which plays a key role in the differentiation, maturation, recruitment and activation of
eosinophils. Reslizumab binds to human IL-5, blocking its biological function; consequently,
survival and activity of eosinophils are reduced (Summary of Product Characteristics [SmPC]).13
Given that high levels of eosinophils in sputum and bronchial biopsies are associated with poor
asthma control,14 blocking IL-5 function can reduce the frequency and severity of asthma
exacerbations.
The CS states that it is anticipated that reslizumab will be initiated and monitored in specialist
centres; reslizumab should be prescribed by physicians experienced in the diagnosis and
treatment of the licensed indication and administered intravenously by a healthcare
professional; and patients should be observed over the duration of the infusion and for an
appropriate period of time afterwards.
According to the SmPC, reslizumab is only indicated for intravenous infusion and should be
administered in a healthcare setting by a healthcare professional prepared to manage
anaphylaxis. The recommended dosage regimen is 3 mg/kg once every 4 weeks by intravenous
infusion over 20-50 minutes, with the solution being available in 100 mg/10 mL (10 mg/mL)
single-use vials. If a planned reslizumab infusion is missed, dosing should resume as soon as
possible on the indicated dose and regimen. A double dose must not be administered to make
up for a missed dose. The ERG agrees that the description of reslizumab in the company’s
Confidential – do not copy or circulate
Version 1 31
decision problem, including the dosing regimen, is consistent with the proposed licensed
indication as stated in the SmPC.
At the time of the company’s submission, the European marketing authorisation for reslizumab
was awaited. Market authorisation was granted in August 2016 (Table 3). Approval by the US
Food and Drug Administration (FDA) was granted in March 2016 and reslizumab was launched
in the US in April 2016. However, licensed indications in the USA stipulate that reslizumab is not
indicated for treatment of other eosinophilic conditions, relief of acute bronchospasm or status
asthmaticus (Section 5.2).15
The CS states that the planned launch for reslizumab in the UK is XXXXXXX.
Table 3 Technology being appraised (CS Table 2) UK approved name and brand name
UK approved name: Reslizumab Brand name: CINQAERO
Marketing authorisation/ CE mark status
Regulatory submission to EMA: The application was submitted on 30 June 2015 and the procedure started on 23 July 2015.
CHMP positive opinion was received on 23 June 2016.
European marketing authorisation was granted in August 2016.
Indications and any restriction(s) as described in the summary of product characteristics
Reslizumab is indicated as add-on therapy in adult patients with severe eosinophilic asthma inadequately controlled despite high-dose ICS plus another medicinal product for maintenance treatment (Section 5.1 of the SmPC). The contraindications listed in the SmPC are:
Hypersensitivity to the active substance
Hypersensitivity to any of the following excipients: sodium acetate trihydrate; acetic acid glacial; sucrose; water for injections
Method of administration and dosage
Intravenous infusion only. Reslizumab must not be administered by the subcutaneous, oral or intramuscular route. Reslizumab is available as a 10 mg/mL concentrate for solution for infusion. Each vial contains 100 mg of reslizumab in 10 mL (10 mg/mL). The recommended dose of reslizumab, based on body weight, is 3.0 mg/kg, given once every four weeks.
CHMP: Committee for Medicinal Products for Human Use; EMA: European Medicines Agency; ICS: inhaled corticosteroid; SmPC: Summary of Product Characteristics
Confidential – do not copy or circulate
Version 1 32
Comparators
The comparators for reslizumab as add-on to BSC that are considered in the current submission
are:
BSC alone (for patients with an eosinophilic phenotype of asthma who are not eligible for
omalizumab)
Omalizumab + BSC (for patients in the ‘overlap’ population – i.e. those with IgE-
mediated asthma who also have elevated blood eosinophils)
BSC (placebo arm) in the CS is referred to as high dose ICS in combination with other controller
medications, with or without OCS. In addition, the BTS/SIGN guidelines are cited stating that
BSC relies on the use of a Personal Asthma Action Plan, the avoidance of
environmental/dietary triggers and the use of recommended medications. To clarify medication
use in the placebo arm of the pivotal trials RCT 3082 and 3083, the company provided tables of
medication use for patients in the placebo arm (clarification request A4, Tables 1 to 3).
Outcomes The outcomes reported in the CS are clinically meaningful and are consistent with the NICE
scope, although four outcomes specified in the scope are not reported in the CS as they were
either not reported in the reslizumab trials (use of OCS, patient and clinician evaluation of
response, time to discontinuation) or were very rare events (mortality – only one death occurred
across the five included trials). Two additional outcomes not specified in the NICE scope are
presented in the CS: changes in use of short-acting beta agonists (SABA) and changes in blood
concentrations of eosinophils.
The CS states that the reason data on OCS use were not available is that the dose of OCS in
two of the pivotal studies (3082 and 3083) had to remain stable throughout the trial and
therefore this was not reported as an outcome; whilst in the remaining three trials OCS use was
not allowed. However, clinical experts advising the ERG mentioned that OCS use is potentially
an important factor, as, in addition to their impact on adverse events, oral steroids are a
significant cost driver in this population.
The NICE scope mentions “incidence of clinically significant exacerbations, including those
which require unscheduled contact with healthcare professionals or hospitalisation,” but does
Confidential – do not copy or circulate
Version 1 33
not define clinically significant exacerbations. The CS decision problem refers to “clinical asthma
exacerbations” which were reported in the reslizumab trials and implies that the definition of
these is consistent with the NICE scope. We agree that the company’s definition of
exacerbations in reslizumab trials is consistent with the scope.
Economic analysis The cost effectiveness of treatments is expressed in the CS in terms of the incremental cost per
quality adjusted life year (QALY) gained (as specified in the final NICE scope). Base case
analyses used a 60-year (lifetime) time horizon and 3.5% annual discounting of costs and
outcomes. The economic analysis was consistent with the NICE reference case and costs were
considered from an NHS and Personal and Social Services (PSS) perspective.
Other relevant factors In the company’s economic analysis, the CS states that, based on the advice of (an unspecified
number of) clinical experts, adult patients at GINA Steps 4 or 5 (Table 1) who had experienced
≥3 asthma exacerbations in the preceding year were considered to be the most appropriate
subgroup for the base case analysis. This is because these patients would benefit the most
from treatment with reslizumab. That is, they were patients with severe eosinophilic asthma and
a history of exacerbations. The ERG notes that the majority of the patients in the pivotal clinical
trials did not experience ≥3 asthma exacerbations in the preceding year, and so the economic
model includes only a subgroup of patients in these trials.
Two further subgroups with lower and higher exacerbation rates were included in scenario
analyses:
• Adult patients at GINA Steps 4 or 5 who had experienced ≥2 exacerbations
• Adult patients at GINA Steps 4 or 5 who had experienced ≥4 exacerbations
These subgroups were not specified in the NICE scope. However, the scenarios offer insight
into the cost-effectiveness of reslizumab when the exacerbation threshold for including patients
in the analysis is lowered.
Equality issues
Confidential – do not copy or circulate
Version 1 34
The CS states that ‘no issues related to equality were identified in the NICE scope’ (CS section
3.8). However, the ERG notes that it might be difficult for patients to attend a specialist severe
asthma centre on a four-weekly basis, as there are currently only five centres in England and,
according to a clinical expert consulted by the ERG, these have waiting lists of up to 12 months.
Patient access scheme
The CS states that a ‘simple’ PAS has been submitted to PASLU and the Department of Health
and is currently under review’ (CS section 2.3.1). The suggested anticipated reslizumab list
price is £499.99 (100 mg vial) or £124.99 (25 mg vial), while the anticipated PAS price will be
£XXX (100 mg vial) or £XX (25 mg vial) (CS Table 6).
3 CLINICAL EFFECTIVENESS
3.1 Summary & critique of the company’s approach to systematic review The company conducted two systematic reviews, one for evidence on the clinical effectiveness
of reslizumab and omalizumab, and the other for HRQoL, resource use, and economic
evidence. A full description and critique of the company’s systematic review of HRQoL, resource
use and economic evidence is provided within the Cost Effectiveness section of this report, in
section 4.2.
The systematic review of clinical effectiveness evidence is described in section 4.1 of the CS
and the search strategy is provided in CS Appendix 2. The systematic review was used to
identify evidence both for the intervention (reslizumab) and for the comparator (omalizumab)
and therefore it informed the company’s direct comparison meta-analysis of reslizumab trials as
well as their indirect treatment comparison (ITC) of reslizumab against omalizumab. The ITC
analysis was provided by the company in a separate report prepared by an external agency
(Amaris)16 (hereafter referred to as the ITC Report) and this includes duplicate descriptions of
the systematic review methods (ITC Report section 2.1) and the search strategy (ITC Report
Appendix 2).
3.1.1 Description of the company’s search strategy
Confidential – do not copy or circulate
Version 1 35
The company has clearly specified the bibliographic sources searched and the dates of the
searches, providing sufficient details to enable reproduction of the searches. We consider that
the searches were comprehensive and well-designed. They included a combination of MeSH or
EMTREE and free text terms, which is appropriate, and used a range of terms that cover the
disease area, interventions, and study types of interest. An exception to this is that the EU trade
name of reslizumab (Cinqaero) was not used among the intervention search terms, while the
US trade name (Cinquil) was. We do not believe that this is likely to have impacted on whether
the searches found all relevant evidence. The searches were restricted to the English language,
which is reasonable. No date restrictions were placed on the searches.
The company searched an appropriate range of databases: MEDLINE, Embase and the
Cochrane Library. Hand searches for conference abstracts in databases not indexed by
Embase were also carried out, covering the European Respiratory Society (ERS), American
Thoracic Society (ATS), British Thoracic Society (BTS), American College of Chest Physicians
(CHEST) and the American Academy of Allergy, Asthma and Immunology (AAAI).
Clinicaltrials.gov and HTA submissions were also searched. Additionally, a range of relevant
websites were searched, including those of organisations that hold relevant conferences. We
consider that the company has searched a wide range of and sufficient number of relevant
sources for evidence.
A minor criticism of the clinical effectiveness searches is that they were five months out-of-date
when received by the ERG, having been conducted in February 2016. We did not re-run the
searches using the company’s search strategy, but carried out simple searches on MEDLINE
and Embase to identify if any further reslizumab and omalizumab studies had been published
since February 2016. We used the following search terms:
Reslizumab or Cinquil or Cinqaero
(Omalizumab or Xolair or rhuMAb-E25) and asthma
We limited the searches to the English language and references published in 2016. For the
omalizumab searches we additionally limited them to randomised controlled trials, phase 2
clinical trials and phase 3 clinical trials, to reduce the number of results.
Our searches did not find any additional studies of reslizumab, so it is likely that the CS includes
all relevant reslizumab studies. Our searches for recently published omalizumab studies
identified one potentially relevant RCT,17 published online on 18th February 2016 (this was
Confidential – do not copy or circulate
Version 1 36
published after the company’s database searches for clinical effectiveness evidence, which
were conducted on 2nd February 2016). This was an RCT of omalizumab versus placebo in
Chinese patients with moderate to severe allergic asthma and a serum total IgE level of 30-700
IU/mL but it did not report whether any patients had elevated blood eosinophils. The %
predicted FEV1, ACQ and AQLQ were among the outcomes measured. We also identified a
conference abstract, published in April 2016, that appears to report findings from this trial.18 No
other potentially relevant omalizumab studies were identified. It therefore appears that although
the searches used to inform the systematic review in the CS were moderately out-of-date, they
are likely to have captured all relevant reslizumab and almost all relevant omalizumab trials.
The company did not explicitly mention in the CS whether or not they had searched for ongoing
studies of reslizumab and did not specify any specific trials databases searched other than
Clinicaltrials.gov. The CS states (section 4.14) that there are “no completed or ongoing
company-sponsored studies from which new evidence for reslizumab in patients with asthma
and elevated blood eosinophils will become available in the next 12 months” (CS p. 176). It is
unclear therefore if there are any trials not sponsored by the company that may complete within
the next 12 months. The ERG searched clinicaltrials.gov for ongoing studies of reslizumab. The
ongoing studies were checked by one reviewer. No relevant ongoing studies were identified.
3.1.2 Statement of the inclusion/exclusion criteria used in the study selection
The CS provides a clear overview of the inclusion and exclusion criteria for the systematic
review of clinical effectiveness evidence (CS Table 11). The criteria appear to be in line with the
marketing authorisation, the final NICE scope and the company’s decision problem. While only
RCTs were identified in searches, a company-sponsored single-cohort study amalgamating
patients from three of the RCTs was included in the CS to provide evidence on reslizumab
safety.
The setting (involving specialist severe asthma centres in England) was not specified as an
inclusion criterion; this is reasonable given that the setting is implicit from the population
eligibility criterion (severe asthma). The company excluded publications in non-English
languages. The rationale for this is not explained in the CS and the potential for language bias
is not discussed.
Confidential – do not copy or circulate
Version 1 37
The CS provides a PRISMA diagram indicating the numbers of references included and
excluded at each stage of the systematic review (CS Figure 1). This is reproduced in Figure 1.
The total number of publications included in the systematic review was 21. This refers to trials of
reslizumab and also trials of omalizumab, but only publications reporting the RCTs of
reslizumab are mentioned in the list of relevant trials (CS Table 12). Information about the
omalizumab trials is given in the separate ITC Report,16 although there is no indication of this in
the CS.
The CS (section 2.3, and Table 5 within CS Appendix 2) lists the authors and titles of 191
references which were excluded at the full-text screening step, but does not provide publication
sources. The company provided this information in an Excel spreadsheet in response to a
request from the ERG via NICE (clarification A8). Fifteen of these 191 references were excluded
as the company was unable to retrieve them for full-text review of the inclusion criteria.
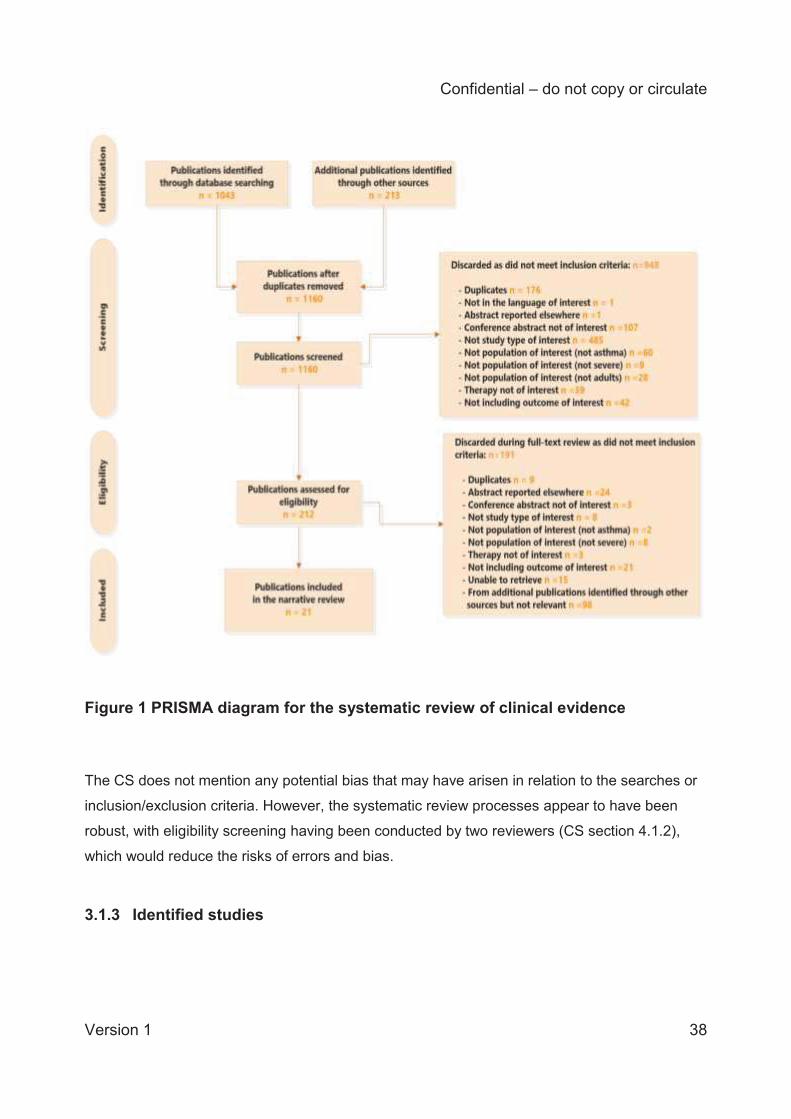
Confidential – do not copy or circulate
Version 1 38
Figure 1 PRISMA diagram for the systematic review of clinical evidence
The CS does not mention any potential bias that may have arisen in relation to the searches or
inclusion/exclusion criteria. However, the systematic review processes appear to have been
robust, with eligibility screening having been conducted by two reviewers (CS section 4.1.2),
which would reduce the risks of errors and bias.
3.1.3 Identified studies
Confidential – do not copy or circulate
Version 1 39
Of the 21 RCTs identified by the company in their systematic review of clinical effectiveness,
five were trials of reslizumab versus placebo (both in addition to BSC), and 16 were trials of
omalizumab versus BSC (reported separately in the ITC Report16).
Four of the five reslizumab RCTs were phase III trials and one (Res-5-0010) was a phase II trial:
trials 3082 and 3083, both reported by Castro et al.19
trial 3081 reported by Bjermer et al.20
trial 3084 reported by Corren et al.21
Res-5-0010 reported by Castro et al.22
Trials 3082 and 3083 were identical 12-month, randomised, double-blind, placebo-controlled
trials evaluating the efficacy and safety of reslizumab (3.0 mg/kg) in the reduction of clinical
asthma exacerbations in patients aged 12-75 years with eosinophilic asthma.19 These trials are
presented first in the CS and are referred to in this report as the company’s pivotal trials. The
two pivotal trials had longer duration than the three other three trials and they also used a
different definition of asthma exacerbations compared to the three other trials.
Trial 3081 was a 16-week randomised, double-blind, placebo-controlled, three-arm trial (0.3
mg/kg, 3.0 mg/kg and placebo), evaluating the efficacy and safety of reslizumab as treatment
for patients aged 12-75 years with eosinophilic asthma.20 The trial arm with less than the dose
applied for in the licence (i.e. 0.3 mg/kg) is not relevant to this submission and is not discussed
further in this report.
Trial 3084 was a 16-week, randomised, double-blind, placebo-controlled trial evaluating the
effect of reslizumab (3.0 mg/kg) in patients aged 18-75 years with moderate to severe
eosinophilic asthma that was poorly controlled with inhaled corticosteroids.21 This RCT is
presented separately to the other three company-sponsored RCTs in the CS ‘due to different
eligibility criteria’. Mean blood eosinophils at baseline ranged between 277–281 cells/μL for the
treatment groups, with an overall range of 0–1584 cells/μL. As such, this trial included some
patients with blood eosinophil counts <400 cells/μL, unlike the four other trials which had ≥400
cells/μL.
Trial Res-5-0010 was a 15-week randomised, double-blind placebo-controlled trial evaluating
the efficacy and safety of reslizumab (3.0 mg/kg) in patients aged 18-75 years with poorly
Confidential – do not copy or circulate
Version 1 40
controlled eosinophilic asthma.22 Although this RCT met the company’s inclusion criteria, it was
excluded from further discussion in the CS as it was a ‘phase II proof of concept study that
informed the phase III clinical programme’. No details of the trial (i.e. baseline characteristics of
the population, methods) or the company’s critique of it are given in the CS. Despite performing
no quality assessment of the RCT or presenting any trial information, the company included
data from this trial in their direct comparison meta-analysis and ITC. In response to a request
from the ERG via NICE, the company provided a quality assessment for Res-5-0010
(clarification A9). An overview of the five RCTs is presented in (Table 4). Given that details of
Res-5-0010 are not provided in the CS, we have obtained these from the trial publication.22
All the included RCTs were multi-centre trials, but none included UK patients. All five RCTs
were sponsored by the company.
The CS also provides pooled adverse events (AE) data based on all five trials (3082, 3083,
3081, 3084 and Res-5-0010). This was used during the application for EU marketing
authorisation for the evaluation of safety evidence. In this cohort (named ‘Cohort 3’ in CS
section 4.12.3.1), 1861 out of the 1870 patients randomised received at least one dose of study
drug (safety analysis set) (see section 3.1.6 below for analysis population definitions), but only
79% of these patients (1463/1861) had eosinophil counts ≥400 cells/μL at screening or
baseline. While a total of 1131 patients were treated with reslizumab, 103 of these patients were
treated with the lower dose of 0.3 mg/kg reslizumab (730 patients were treated with placebo).
These data are not considered in detail in the current report since longer-term adverse events
data are now available from an open-label extension study (see section 3.1.3.4).
No details of crossovers or dropouts were reported in the reslizumab trials. However, dropouts
were reported in the CONSORT diagrams for each trial (CS Figures 3, 4, 35 & XX). Note that
the CONSORT flow chart for trial 3084 (CS Figure 35) contains an error, which the company
explained in their clarification response (clarification A2). Despite being randomised, fifteen
participants are not accounted for in the diagram due to site terminations in the USA. Data for
these participants were deemed invalid by the company and therefore excluded from CS Figure
35.
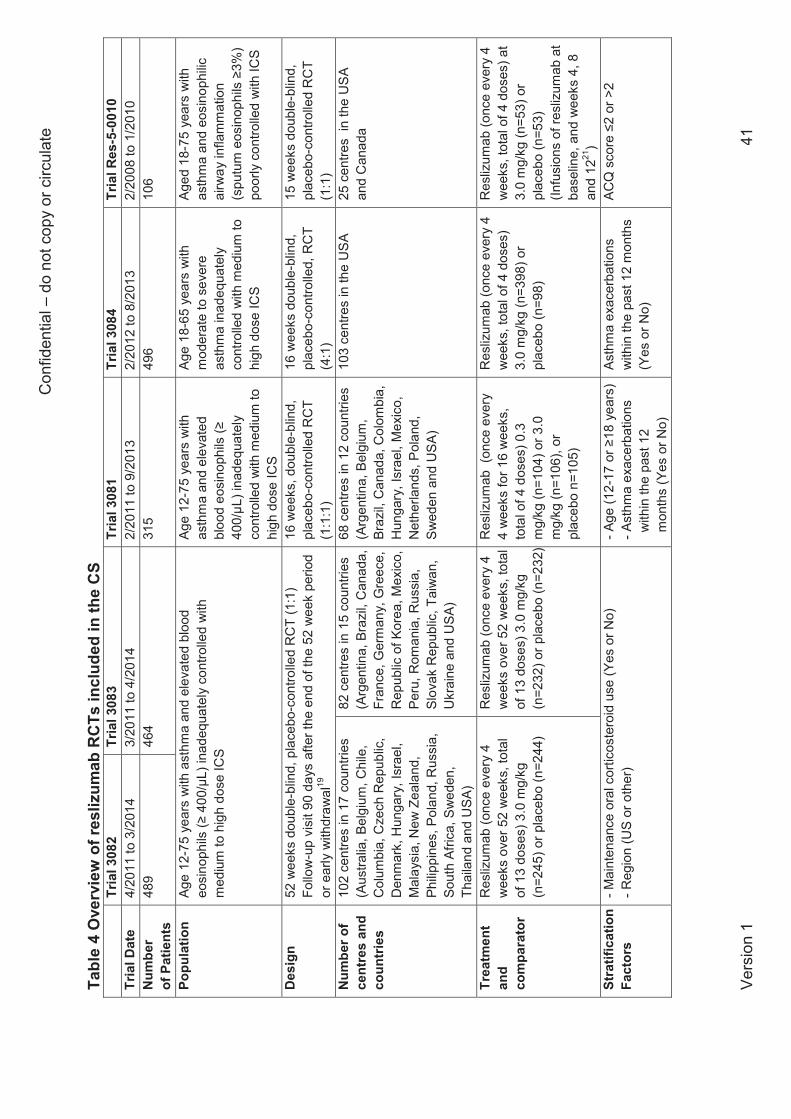
Con
fiden
tial –
do
not c
opy
or c
ircul
ate
Vers
ion
1 41
Tabl
e 4
Ove
rvie
w o
f res
lizum
ab R
CTs
incl
uded
in th
e C
S
Tr
ial 3
082
Tr
ial 3
083
Tr
ial 3
081
Tr
ial 3
084
Tr
ial R
es-5
-001
0
Tria
l Dat
e
4/20
11 to
3/2
014
3/20
11 to
4/2
014
2/20
11 to
9/2
013
2/20
12 to
8/2
013
2/
2008
to 1
/201
0 N
umbe
r of
Pat
ient
s 48
9
464
31
5
496
10
6
Popu
latio
n
Age
12-7
5 ye
ars
with
ast
hma
and
elev
ated
blo
od
eosi
noph
ils (≥
400
/μL)
inad
equa
tely
con
trolle
d w
ith
med
ium
to h
igh
dose
ICS
Age
12-7
5 ye
ars
with
as
thm
a an
d el
evat
ed
bloo
d eo
sino
phils
(≥
400/μL
) ina
dequ
atel
y co
ntro
lled
with
med
ium
to
high
dos
e IC
S
Age
18-6
5 ye
ars
with
m
oder
ate
to s
ever
e as
thm
a in
adeq
uate
ly
cont
rolle
d w
ith m
ediu
m to
hi
gh d
ose
ICS
Aged
18-
75 y
ears
with
as
thm
a an
d eo
sino
philic
ai
rway
infla
mm
atio
n (s
putu
m e
osin
ophi
ls ≥
3%)
poor
ly c
ontro
lled
with
ICS
Des
ign
52 w
eeks
dou
ble-
blin
d, p
lace
bo-c
ontro
lled
RC
T (1
:1)
Follo
w-u
p vi
sit 9
0 da
ys a
fter t
he e
nd o
f the
52
wee
k pe
riod
or e
arly
with
draw
al19
16 w
eeks
, dou
ble-
blin
d,
plac
ebo -
cont
rolle
d R
CT
(1:1
:1)
16 w
eeks
dou
ble-
blin
d,
plac
ebo -
cont
rolle
d, R
CT
(4:1
)
15 w
eeks
dou
ble-
blin
d,
plac
ebo -
cont
rolle
d R
CT
(1:1
) N
umbe
r of
cent
res
and
coun
trie
s
102
cent
res
in 1
7 co
untri
es
(Aus
tralia
, Bel
gium
, Chi
le,
Col
umbi
a, C
zech
Rep
ublic
, D
enm
ark,
Hun
gary
, Isr
ael,
Mal
aysi
a, N
ew Z
eala
nd,
Philip
pine
s, P
olan
d, R
ussi
a,
Sout
h Af
rica,
Sw
eden
, Th
aila
nd a
nd U
SA)
82 c
entre
s in
15
coun
tries
(A
rgen
tina,
Bra
zil,
Can
ada,
Fr
ance
, Ger
man
y, G
reec
e,
Rep
ublic
of K
orea
, Mex
ico,
Pe
ru, R
oman
ia, R
ussi
a,
Slov
ak R
epub
lic, T
aiw
an,
Ukr
aine
and
USA
)
68 c
entre
s in
12
coun
tries
(A
rgen
tina,
Bel
gium
, Br
azil,
Can
ada,
Col
ombi
a,
Hun
gary
, Isr
ael,
Mex
ico,
N
ethe
rland
s, P
olan
d,
Swed
en a
nd U
SA)
103
cent
res
in th
e U
SA
25 c
entre
s in
the
USA
an
d C
anad
a
Trea
tmen
t an
d co
mpa
rato
r
Res
lizum
ab (o
nce
ever
y 4
wee
ks o
ver 5
2 w
eeks
, tot
al
of 1
3 do
ses)
3.0
mg/
kg
(n=2
45) o
r pla
cebo
(n=2
44)
Res
lizum
ab (o
nce
ever
y 4
wee
ks o
ver 5
2 w
eeks
, tot
al
of 1
3 do
ses)
3.0
mg/
kg
(n=2
32) o
r pla
cebo
(n=2
32)
Res
lizum
ab (
once
eve
ry
4 w
eeks
for 1
6 w
eeks
, to
tal o
f 4 d
oses
) 0.3
m
g/kg
(n=1
04) o
r 3.0
m
g/kg
(n=1
06),
or
plac
ebo
n=10
5)
Res
lizum
ab (o
nce
ever
y 4
wee
ks, t
otal
of 4
dos
es)
3.0
mg/
kg (n
=398
) or
plac
ebo
(n=9
8)
Res
lizum
ab (o
nce
ever
y 4
wee
ks, t
otal
of 4
dos
es) a
t 3.
0 m
g/kg
(n=5
3) o
r pl
aceb
o (n
=53)
(In
fusi
ons
of re
sliz
umab
at
base
line,
and
wee
ks 4
, 8
and
1221
) St
ratif
icat
ion
Fact
ors
- Mai
nten
ance
ora
l cor
ticos
tero
id u
se (Y
es o
r No)
- R
egio
n (U
S or
oth
er)
- Age
(12-
17 o
r ≥18
yea
rs)
- Ast
hma
exac
erba
tions
w
ithin
the
past
12
m
onth
s (Y
es o
r No)
Asth
ma
exac
erba
tions
w
ithin
the
past
12
mon
ths
(Yes
or N
o)
AC
Q s
core
≤2
or >
2
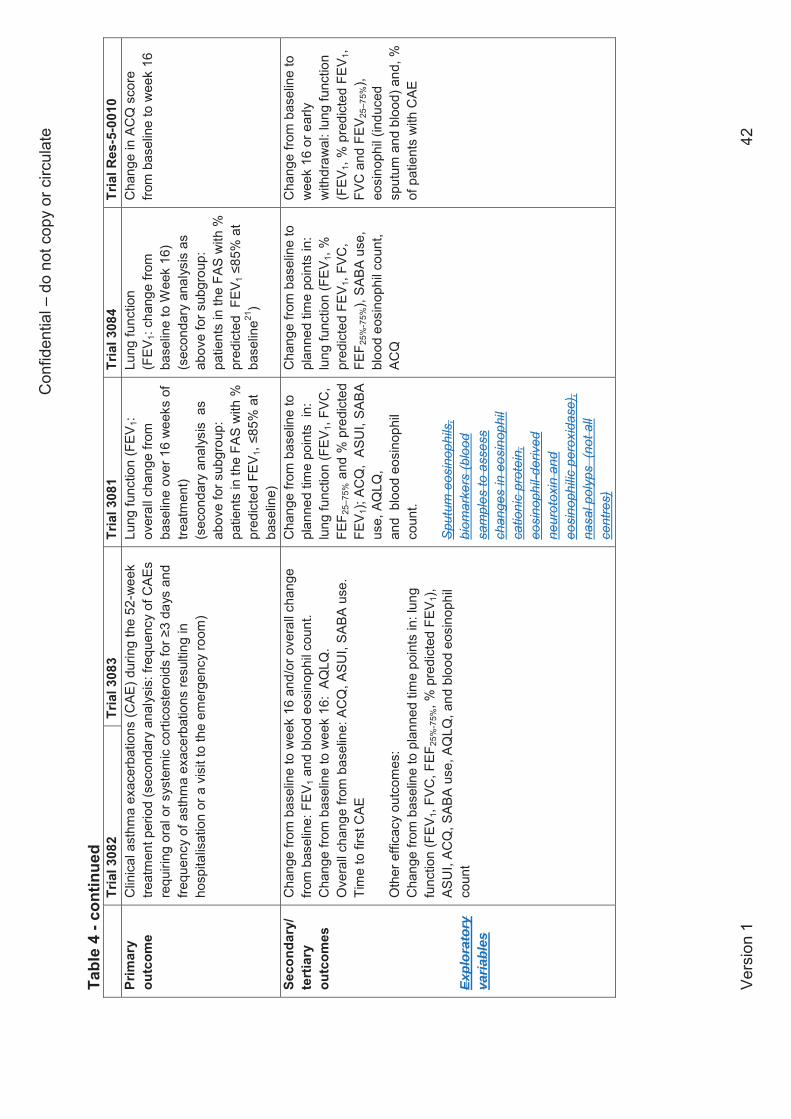
Con
fiden
tial –
do
not c
opy
or c
ircul
ate
Vers
ion
1 42
Tabl
e 4
- con
tinue
d
Tria
l 308
2
Tria
l 308
3
Tria
l 308
1
Tria
l 308
4
Tria
l Res
-5-0
010
Pr
imar
y ou
tcom
e
Clin
ical
ast
hma
exac
erba
tions
(CAE
) dur
ing
the
52-w
eek
treat
men
t per
iod
(sec
onda
ry a
naly
sis:
freq
uenc
y of
CAE
s re
quiri
ng o
ral o
r sys
tem
ic c
ortic
oste
roid
s fo
r ≥3
days
and
fre
quen
cy o
f ast
hma
exac
erba
tions
resu
lting
in
hosp
italis
atio
n or
a v
isit
to th
e em
erge
ncy
room
)
Lung
func
tion
(FEV
1: ov
eral
l cha
nge
from
ba
selin
e ov
er 1
6 w
eeks
of
treat
men
t) (s
econ
dary
ana
lysi
s a
s ab
ove
for s
ubgr
oup:
pa
tient
s in
the
FAS
with
%
pred
icte
d FE
V 1, ≤
85%
at
base
line)
Lung
func
tion
(FEV
1: ch
ange
from
ba
selin
e to
Wee
k 16
) (s
econ
dary
ana
lysi
s as
ab
ove
for s
ubgr
oup:
pa
tient
s in
the
FAS
with
%
pred
icte
d F
EV1 ≤
85%
at
base
line21
)
Cha
nge
in A
CQ
sco
re
from
bas
elin
e to
wee
k 16
Seco
ndar
y/
tert
iary
ou
tcom
es
Expl
orat
ory
varia
bles
Cha
nge
from
bas
elin
e to
wee
k 16
and
/or o
vera
ll ch
ange
fro
m b
asel
ine:
FEV
1 and
blo
od e
osin
ophi
l cou
nt.
Cha
nge
from
bas
elin
e to
wee
k 16
: AQ
LQ.
Ove
rall
chan
ge fr
om b
asel
ine:
AC
Q, A
SUI,
SABA
use
. Ti
me
to fi
rst C
AE
Oth
er e
ffica
cy o
utco
mes
: C
hang
e fro
m b
asel
ine
to p
lann
ed ti
me
poin
ts in
: lun
g fu
nctio
n (F
EV1,
FVC
, FEF
25%
-75%
, % p
redi
cted
FEV
1),
ASU
I, AC
Q, S
ABA
use,
AQ
LQ, a
nd b
lood
eos
inop
hil
coun
t
Cha
nge
from
bas
elin
e to
pl
anne
d tim
e po
ints
in:
lu
ng fu
nctio
n (F
EV1,
FVC
, FE
F 25–
75%
and
% p
redi
cted
FE
V 1);
ACQ
, AS
UI,
SABA
us
e, A
QLQ
,
and
blo
od e
osin
ophi
l co
unt .
Spu
tum
eos
inop
hils
, bi
omar
kers
(blo
od
sam
ples
to a
sses
s ch
ange
s in
eos
inop
hil
catio
nic
prot
ein,
eo
sino
phil-
deriv
ed
neur
otox
in a
nd
eosi
noph
ilic
pero
xida
se),
nasa
l pol
yps
(not
all
cent
res)
Cha
nge
from
bas
elin
e to
pl
anne
d tim
e po
ints
in:
lung
func
tion
(FEV
1, %
pr
edic
ted
FEV 1
, FVC
, FE
F 25%
-75%
), SA
BA u
se,
bloo
d eo
sino
phil
coun
t, AC
Q
Cha
nge
from
bas
elin
e to
w
eek
16 o
r ear
ly
with
draw
al: l
ung
func
tion
(FEV
1, %
pre
dict
ed F
EV1,
FV
C a
nd F
EV25
–75%
), eo
sino
phil
(indu
ced
sput
um a
nd b
lood
) and
, %
of p
atie
nts
with
CAE
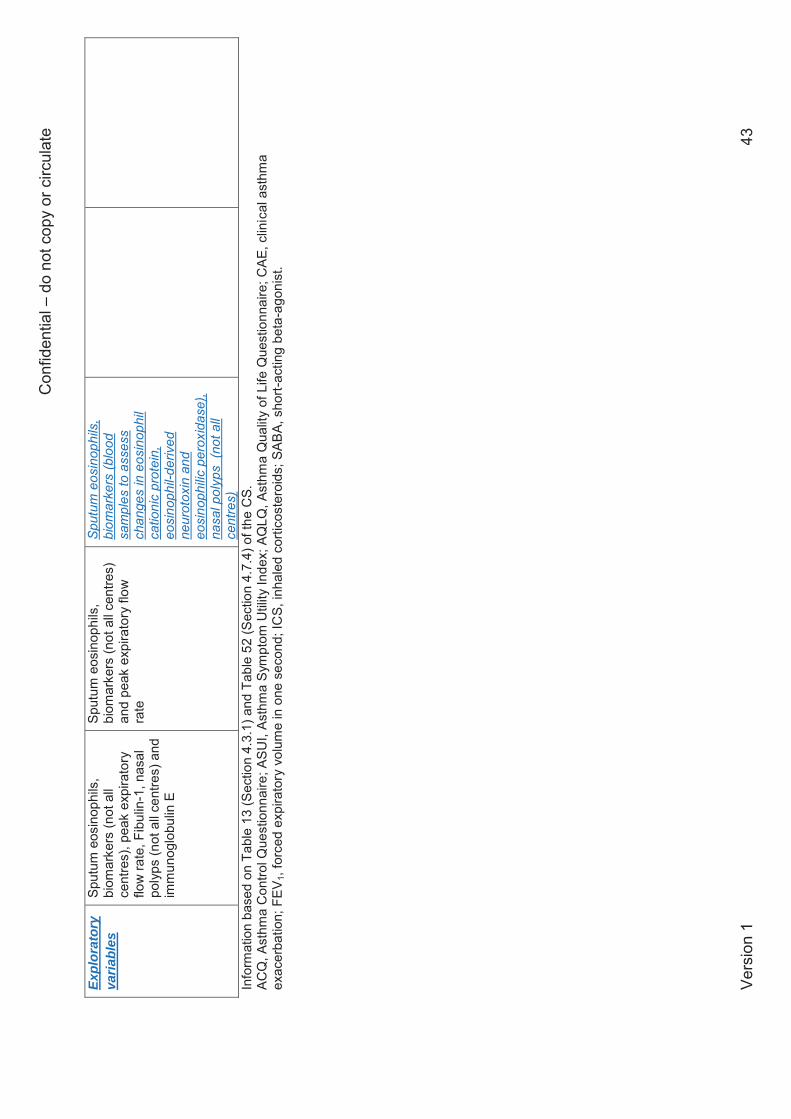
Con
fiden
tial –
do
not c
opy
or c
ircul
ate
Vers
ion
1 43
Info
rmat
ion
base
d on
Tab
le 1
3 (S
ectio
n 4.
3.1)
and
Tab
le 5
2 (S
ectio
n 4.
7.4)
of t
he C
S.
ACQ
, Ast
hma
Con
trol Q
uest
ionn
aire
; ASU
I, As
thm
a Sy
mpt
om U
tility
Inde
x; A
QLQ
, Ast
hma
Qua
lity
of L
ife Q
uest
ionn
aire
; CAE
, clin
ical
ast
hma
exac
erba
tion;
FEV
1, fo
rced
exp
irato
ry v
olum
e in
one
sec
ond;
ICS,
inha
led
corti
cost
eroi
ds; S
ABA,
sho
rt-ac
ting
beta
-ago
nist
. Ex
plor
ator
y va
riabl
es
Sput
um e
osin
ophi
ls,
biom
arke
rs (n
ot a
ll ce
ntre
s), p
eak
expi
rato
ry
flow
rate
, Fib
ulin
-1, n
asal
po
lyps
(not
all
cent
res)
and
im
mun
oglo
bulin
E
Sput
um e
osin
ophi
ls,
biom
arke
rs (n
ot a
ll ce
ntre
s)
and
peak
exp
irato
ry fl
ow
rate
Spu
tum
eos
inop
hils
, bi
omar
kers
(blo
od
sam
ples
to a
sses
s ch
ange
s in
eos
inop
hil
catio
nic
prot
ein,
eo
sino
phil-
deriv
ed
neur
otox
in a
nd
eosi
noph
ilic
pero
xida
se),
nasa
l pol
yps
(not
all
cent
res)
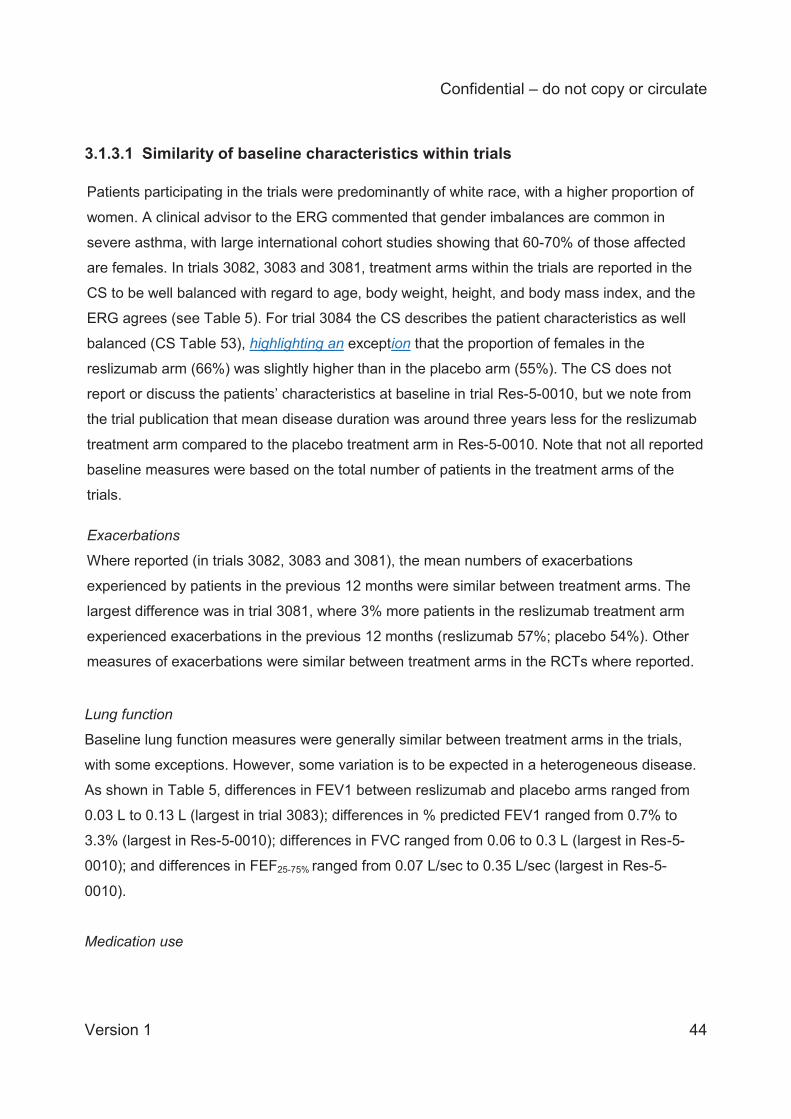
Confidential – do not copy or circulate
Version 1 44
3.1.3.1 Similarity of baseline characteristics within trials Patients participating in the trials were predominantly of white race, with a higher proportion of
women. A clinical advisor to the ERG commented that gender imbalances are common in
severe asthma, with large international cohort studies showing that 60-70% of those affected
are females. In trials 3082, 3083 and 3081, treatment arms within the trials are reported in the
CS to be well balanced with regard to age, body weight, height, and body mass index, and the
ERG agrees (see Table 5). For trial 3084 the CS describes the patient characteristics as well
balanced (CS Table 53), highlighting an exception that the proportion of females in the
reslizumab arm (66%) was slightly higher than in the placebo arm (55%). The CS does not
report or discuss the patients’ characteristics at baseline in trial Res-5-0010, but we note from
the trial publication that mean disease duration was around three years less for the reslizumab
treatment arm compared to the placebo treatment arm in Res-5-0010. Note that not all reported
baseline measures were based on the total number of patients in the treatment arms of the
trials. Exacerbations
Where reported (in trials 3082, 3083 and 3081), the mean numbers of exacerbations
experienced by patients in the previous 12 months were similar between treatment arms. The
largest difference was in trial 3081, where 3% more patients in the reslizumab treatment arm
experienced exacerbations in the previous 12 months (reslizumab 57%; placebo 54%). Other
measures of exacerbations were similar between treatment arms in the RCTs where reported.
Lung function
Baseline lung function measures were generally similar between treatment arms in the trials,
with some exceptions. However, some variation is to be expected in a heterogeneous disease.
As shown in Table 5, differences in FEV1 between reslizumab and placebo arms ranged from
0.03 L to 0.13 L (largest in trial 3083); differences in % predicted FEV1 ranged from 0.7% to
3.3% (largest in Res-5-0010); differences in FVC ranged from 0.06 to 0.3 L (largest in Res-5-
0010); and differences in FEF25-75% ranged from 0.07 L/sec to 0.35 L/sec (largest in Res-5-
0010).
Medication use
Confidential – do not copy or circulate
Version 1 45
The mean daily dose of ICS varied between the treatment arms (not reported in trial 3084). It
was lower in the reslizumab arm in trial 3082 (reslizumab 824.1 μg; placebo 847.7 μg) but lower
in the placebo arms of trial 3081 (reslizumab 856.0 μg; placebo 756.9 μg) and trial 3083
(reslizumab 813.5 μg vs 756.9 μg placebo). Trial Res-5-0010 only reported that patients’ ICS
use was equivalent to ≥440 mg of fluticasone twice daily. There were no imbalances in OCS
use between treatment arms in the two trials which reported it (see Table 5).
Three trials reported the mean proportion of patients using SABA in the past 3 days, and in two
of these the proportion was higher in the placebo arm: trial 3082 (reslizumab 69%; placebo
77%), and trial 3081 (reslizumab 78%; placebo 81%). Clinical experts advising the ERG
suggested that these differences in ICS and SABA use would not be clinically important.
3.1.3.2 Similarity of baseline characteristics across trials The CS describes patient demographics at baseline as being generally similar across trials
3082, 3083 and 3081, but does not compare these with the baseline characteristics of trial 3084
(CS Table 53). The CS does not report or discuss any baseline characteristics of trial Res-5-
0010 and so we have consulted the trial publication for information (where reported). The ERG
agrees that in many respects the baseline characteristics of the five trials are similar. However,
there are some differences which we have summarised here. Note that not all baseline
characteristics were reported in all of the trials (these discrepancies are indicated by asterisks
in Table 5).
Time since diagnosis
The trials differed in patients’ mean years since diagnosis, which ranged from 18.5 years (trial
3083) to 26.0 years (trial 3084).
Blood eosinophils
Mean blood eosinophil count was considerably lower in trial 3084 compared to the other trials
(mean 280 cells/μL instead of ≥400 cells/μL), as would be expected from a study that recruited
patients with moderate to severe eosinophilic asthma that was poorly controlled with ICSs.
OCS use
Confidential – do not copy or circulate
Version 1 46
There were considerable differences in OCS use. One study did not allow OCS use (trial 3081,
two failed to report this outcome (trials 3084 and Res-5-0010), and for the two remaining trials
this ranged from 12% (trial 8083) to 19% (trial 3082) of the trial population. SABA use was
similar for the three trials which reported it (trials 3082, 3083 and 3081), while mean daily SABA
puffs varied from 2.0 (trial 3084) to 2.8 (trial 3083).
Exacerbations
Three trials reported the number and proportion of patients who had exacerbations in the
previous 12 months. The proportion was markedly lower in trial 3081 (range 54% to 57% across
the two arms) than in trials 3082 and 3083 (range 99% to 100% across the arms). Patients
were required to have had ≥1 asthma exacerbation in the 12 months prior to screening to be
eligible for trials 3082 and 3083, but 99% and 99.5% of patients respectively met this criterion.
Asthma control
ACQ scores at baseline ranged from 2.47 (trial 3081) to 2.8 (Res-5-0010), indicating that the
patients had a similar degree of asthma control across all five trials (on the ACQ scale 0=totally
controlled and 6=severely uncontrolled). The ACQ has an accepted cut-point where ≥1.5 is
indicative of uncontrolled asthma23 (see section 3.1.5). Based on this cut-point, patients in all
the trials would be classed as having uncontrolled asthma at baseline.
HRQoL
AQLQ scores at baseline ranged from 4.16 (trial 3082) to 4.37 (trial 3081), indicating that
patients had a similar degree of impairment in HRQol across the trials (on the AQLQ scale
1=severely impaired and 7 =not impaired). Scores on the ASUI ranged from 0.61 (trial 3082) to
0.67 (trial 3081), indicating patients had a similar degree of symptom problems across the trials
(on the ASUI scale 0=greatest symptom problems, 1=least symptom problems). Note that
baseline AQLQ and ASUI were not reported in trials 3084 or Res-5-0010.
Lung function
Baseline lung function was reported in five trials and varied slightly across the trials. FEV1 was
slightly worse in trial 3082 (1.9 L) than in the other four trials (range 2.00 L to 2.20 L) and %
predicted FEV1 showed a similar pattern, being slightly lower in trial 3082 (63.6% and 65.0% in
the two arms) than in the other four trials (range 66.1% to 71.1%). Baseline FVC was more
Confidential – do not copy or circulate
Version 1 47
variable (range 2.96 L to 3.43 L), with some differences within trials being as large as those
between trials.
Sex, race
As shown in Table 5, there were more female than male patients in all of the RCTs, ranging
from 55% (Res-5-0010) to 66% (trials 3082 and 3084). Patients were predominantly white in all
the trials that reported race, ranging from 65% (trial 3084) to 85% (trial 3081).
Other characteristics
Where reported, the trials were similar in terms of patients’ mean age (range 43.6 years in trial
3081 to 47.0 years in trial 3083), mean weight (range 74.3 kg in trial 3083 to 76.9 kg in trial
3082) and mean height (range 165.0 cm in trial 3082 to 168.7 cm in trial 3084).
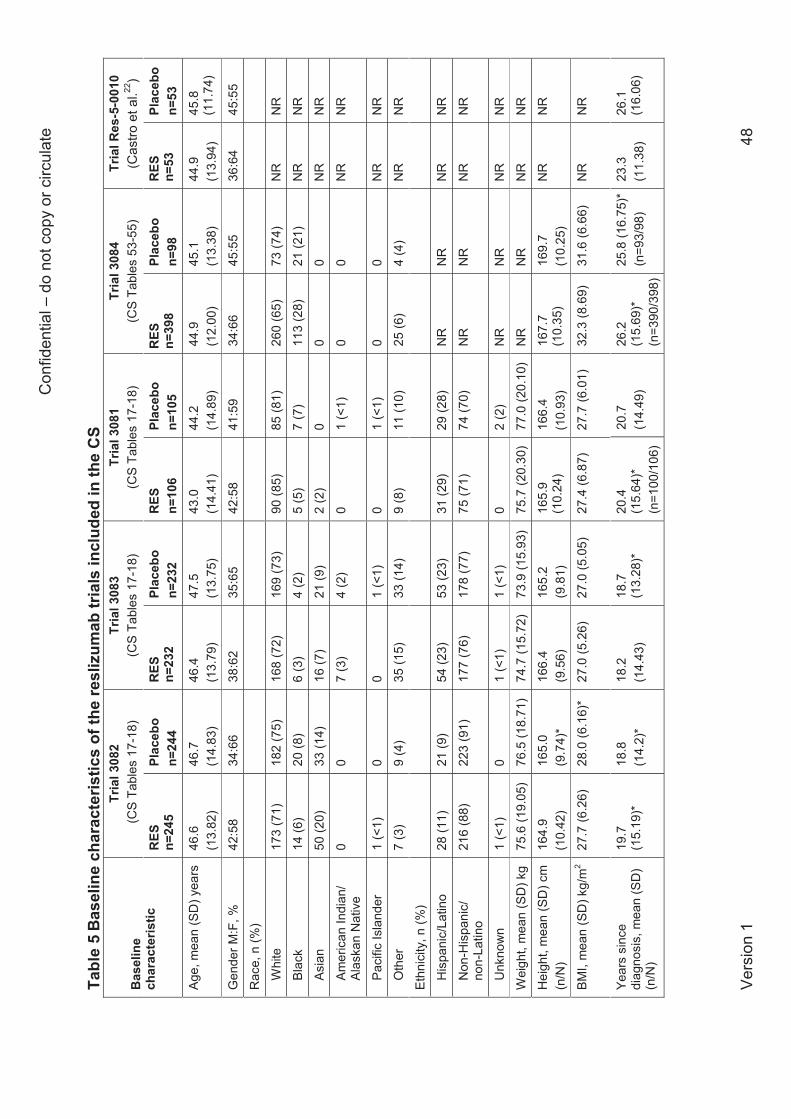
Con
fiden
tial –
do
not c
opy
or c
ircul
ate
Vers
ion
1 48
Tabl
e 5
Base
line
char
acte
ristic
s of
the
resl
izum
ab tr
ials
incl
uded
in th
e C
S
Bas
elin
e ch
arac
teris
tic
Tria
l 308
2 (C
S Ta
bles
17-
18)
Tria
l 308
3 (C
S Ta
bles
17-
18)
Tria
l 308
1 (C
S Ta
bles
17-
18)
Tria
l 308
4 (C
S Ta
bles
53-
55)
Tria
l Res
-5-0
010
(C
astro
et a
l.22)
RES
n=
245
Plac
ebo
n=24
4 R
ES
n=23
2 Pl
aceb
o n=
232
RES
n=
106
Plac
ebo
n=10
5 R
ES
n=39
8 Pl
aceb
o n=
98
RES
n=
53
Plac
ebo
n=53
Age,
mea
n (S
D) y
ears
46
.6
(13.
82)
46.7
(1
4.83
) 46
.4
(13.
79)
47.5
(1
3.75
) 43
.0
(14.
41)
44.2
(1
4.89
) 44
.9
(12.
00)
45.1
(1
3.38
) 44
.9
(13.
94)
45.8
(1
1.74
)
Gen
der M
:F, %
42
:58
34:6
6 38
:62
35:6
5 42
:58
41:5
9 34
:66
45:5
5 36
:64
45:5
5
Rac
e, n
(%)
Whi
te
173
(71)
18
2 (7
5)
168
(72)
16
9 (7
3)
90 (8
5)
85 (8
1)
260
(65)
73
(74)
N
R
N
R
Blac
k 14
(6)
20 (8
) 6
(3)
4 (2
) 5
(5)
7 (7
) 11
3 (2
8)
21 (2
1)
NR
NR
Asia
n 50
(20)
33
(14)
16
(7)
21 (9
) 2
(2)
0 0
0 N
R
N
R
Amer
ican
Indi
an/
Alas
kan
Nat
ive
0 0
7 (3
) 4
(2)
0 1
(<1)
0
0 N
R
N
R
Paci
fic Is
land
er
1 (<
1)
0 0
1 (<
1)
0 1
(<1)
0
0 N
R
N
R
Oth
er
7 (3
) 9
(4)
35 (1
5)
33 (1
4)
9 (8
) 11
(10)
25
(6)
4
(4)
NR
NR
Ethn
icity
, n (%
)
His
pani
c/La
tino
28 (1
1)
21 (9
) 54
(23)
53
(23)
31
(29)
29
(28)
N
R
NR
N
R
N
R
Non
-His
pani
c/
non-
Latin
o 21
6 (8
8)
223
(91)
17
7 (7
6)
178
(77)
75
(71)
74
(70)
N
R
NR
N
R
N
R
Unk
now
n 1
(<1)
0
1 (<
1)
1 (<
1)
0 2
(2)
NR
N
R
NR
NR
Wei
ght,
mea
n (S
D) k
g 75
.6 (1
9.05
) 76
.5 (1
8.71
) 74
.7 (1
5.72
) 73
.9 (1
5.93
) 75
.7 (2
0.30
) 77
.0 (2
0.10
) N
R
NR
N
R
NR
Hei
ght,
mea
n (S
D) c
m
(n/N
) 16
4.9
(10.
42)
165.
0 (9
.74)
* 16
6.4
(9.5
6)
165.
2 (9
.81)
16
5.9
(10.
24)
166.
4 (1
0.93
) 16
7.7
(10.
35)
16
9.7
(10.
25)
NR
N
R
BMI,
mea
n (S
D) k
g/m
2 27
.7 (6
.26)
28
.0 (6
.16)
*
27.0
(5.2
6)
27.0
(5.0
5)
27.4
(6.8
7)
27.7
(6.0
1)
32.3
(8.6
9)
31
.6 (6
.66)
N
R
NR
Year
s si
nce
diag
nosi
s, m
ean
(SD
) (n
/N)
19.7
(1
5.19
)*
18.8
(1
4.2)
*
18.2
(1
4.43
) 18
.7
(13.
28)*
20
.4
(15.
64)*
(n
=100
/106
)
20.7
(1
4.49
) 26
.2
(15.
69)*
(n
=390
/398
)
25.8
(16.
75)*
(n
=93/
98)
23.3
(1
1.38
) 26
.1
(16.
06)
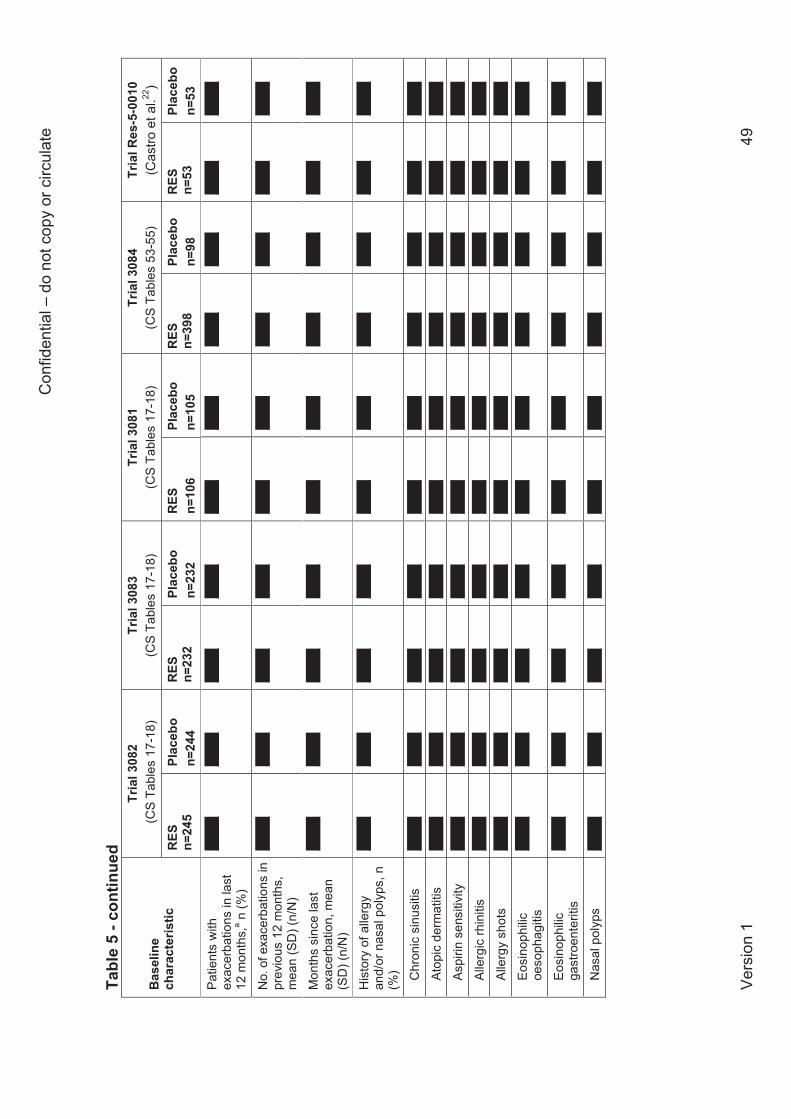
Con
fiden
tial –
do
not c
opy
or c
ircul
ate
Vers
ion
1 49
Tabl
e 5
- con
tinue
d
Bas
elin
e ch
arac
teris
tic
Tria
l 308
2 (C
S Ta
bles
17-
18)
Tria
l 308
3 (C
S Ta
bles
17-
18)
Tria
l 308
1 (C
S Ta
bles
17-
18)
Tria
l 308
4 (C
S Ta
bles
53-
55)
Tria
l Res
-5-0
010
(C
astro
et a
l.22)
RES
n=
245
Plac
ebo
n=24
4 R
ES
n=23
2 Pl
aceb
o n=
232
RES
n=
106
Plac
ebo
n=10
5 R
ES
n=39
8 Pl
aceb
o n=
98
RES
n=
53
Plac
ebo
n=53
Patie
nts
with
ex
acer
batio
ns in
last
12
mon
ths,
a n (%
)
XXXX
XX
XX
XXXX
XX
XX
XXXX
XX
XX
XXXX
XX
XX
XXXX
XX
XX
No.
of e
xace
rbat
ions
in
prev
ious
12
mon
ths,
m
ean
(SD
) (n/
N)
XXXX
XX
XX
XXXX
XX
XX
XXXX
XX
XX
XXXX
XX
XX
XXXX
XX
XX
Mon
ths
sinc
e la
st
exac
erba
tion,
mea
n (S
D) (
n/N
)
XXXX
XX
XX
XXXX
XX
XX
XXXX
XX
XX
XXXX
XX
XX
XXXX
XX
XX
His
tory
of a
llerg
y an
d/or
nas
al p
olyp
s, n
(%
)
XXXX
XX
XX
XXXX
XX
XX
XXXX
XX
XX
XXXX
XX
XX
XXXX
XX
XX
Chr
onic
sin
usiti
s XX
XX
XXXX
XX
XX
XXXX
XX
XX
XXXX
XX
XX
XXXX
XX
XX
XXXX
Atop
ic d
erm
atiti
s XX
XX
XXXX
XX
XX
XXXX
XX
XX
XXXX
XX
XX
XXXX
XX
XX
XXXX
Aspi
rin s
ensi
tivity
XX
XX
XXXX
XX
XX
XXXX
XX
XX
XXXX
XX
XX
XXXX
XX
XX
XXXX
Alle
rgic
rhin
itis
XXXX
XX
XX
XXXX
XX
XX
XXXX
XX
XX
XXXX
XX
XX
XXXX
XX
XX
Alle
rgy
shot
s XX
XX
XXXX
XX
XX
XXXX
XX
XX
XXXX
XX
XX
XXXX
XX
XX
XXXX
Eosi
noph
ilic
oeso
phag
itis
XXXX
XX
XX
XXXX
XX
XX
XXXX
XX
XX
XXXX
XX
XX
XXXX
XX
XX
Eosi
noph
ilic
gast
roen
terit
is
XXXX
XX
XX
XXXX
XX
XX
XXXX
XX
XX
XXXX
XX
XX
XXXX
XX
XX
Nas
al p
olyp
s XX
XX
XXXX
XX
XX
XXXX
XX
XX
XXXX
XX
XX
XXXX
XX
XX
XXXX
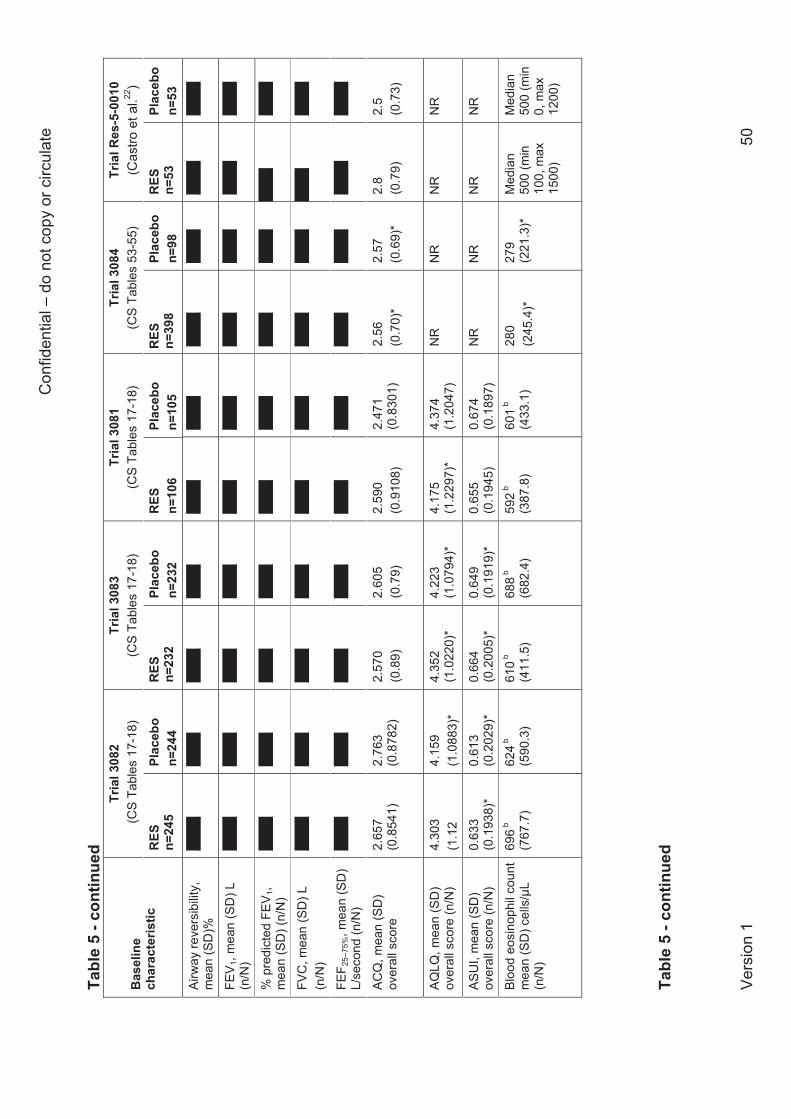
Con
fiden
tial –
do
not c
opy
or c
ircul
ate
Vers
ion
1 50
Tabl
e 5
- con
tinue
d
Bas
elin
e ch
arac
teris
tic
Tria
l 308
2 (C
S Ta
bles
17-
18)
Tria
l 308
3 (C
S Ta
bles
17-
18)
Tria
l 308
1 (C
S Ta
bles
17-
18)
Tria
l 308
4 (C
S Ta
bles
53-
55)
Tria
l Res
-5-0
010
(C
astro
et a
l.22)
RES
n=
245
Plac
ebo
n=24
4 R
ES
n=23
2 Pl
aceb
o n=
232
RES
n=
106
Plac
ebo
n=10
5 R
ES
n=39
8 Pl
aceb
o n=
98
RES
n=
53
Plac
ebo
n=53
Airw
ay re
vers
ibilit
y,
mea
n (S
D)%
XX
XX
XXXX
XX
XX
XXXX
XX
XX
XXXX
XX
XX
XXXX
XX
XX
XXXX
FEV 1
, mea
n (S
D) L
(n
/N)
XXXX
XX
XX
XXXX
XX
XX
XXXX
XX
XX
XXXX
XX
XX
XXXX
XX
XX
% p
redi
cted
FEV
1, m
ean
(SD
) (n/
N)
XXXX
XX
XX
XXXX
XX
XX
XXXX
XX
XX
XXXX
XX
XX
XXXX
XX
XX
FVC
, mea
n (S
D) L
(n
/N)
XXXX
XX
XX
XXXX
XX
XX
XXXX
XX
XX
XXXX
XX
XX
XXXX
XX
XX
FEF 2
5–75
%, m
ean
(SD
) L/
seco
nd (n
/N)
XXXX
XX
XX
XXXX
XX
XX
XXXX
XX
XX
XXXX
XX
XX
XXXX
XX
XX
ACQ
, mea
n (S
D)
over
all s
core
2.
657
(0.8
541)
2.
763
(0.8
782)
2.
570
(0.8
9)
2.60
5 (0
.79)
2.
590
(0.9
108)
2.
471
(0.8
301)
2.
56
(0.7
0)*
2.57
(0
.69)
*
2.8
(0.7
9)
2.5
(0
.73)
AQLQ
, mea
n (S
D)
over
all s
core
(n/N
) 4.
303
(1.1
2 4.
159
(1.0
883)
* 4.
352
(1.0
220)
* 4.
223
(1.0
794)
* 4.
175
(1.2
297)
*
4.37
4 (1
.204
7)
NR
N
R
NR
N
R
ASU
I, m
ean
(SD
) ov
eral
l sco
re (n
/N)
0.63
3 (0
.193
8)*
0.61
3 (0
.202
9)*
0.66
4 (0
.200
5)*
0.64
9 (0
.191
9)*
0.65
5 (0
.194
5)
0.67
4 (0
.189
7)
NR
N
R
NR
N
R
Bloo
d eo
sino
phil
coun
t
mea
n (S
D) c
ells
/μL
(n/N
)
696 b
(7
67.7
)
624 b
(5
90.3
) 61
0 b
(411
.5)
688 b
(6
82.4
)
592 b
(3
87.8
)
601 b
(4
33.1
)
280
(245
.4)*
27
9 (2
21.3
)*
Med
ian
500
(min
10
0, m
ax
1500
)
Med
ian
500
(min
0,
max
12
00)
Ta
ble
5 - c
ontin
ued
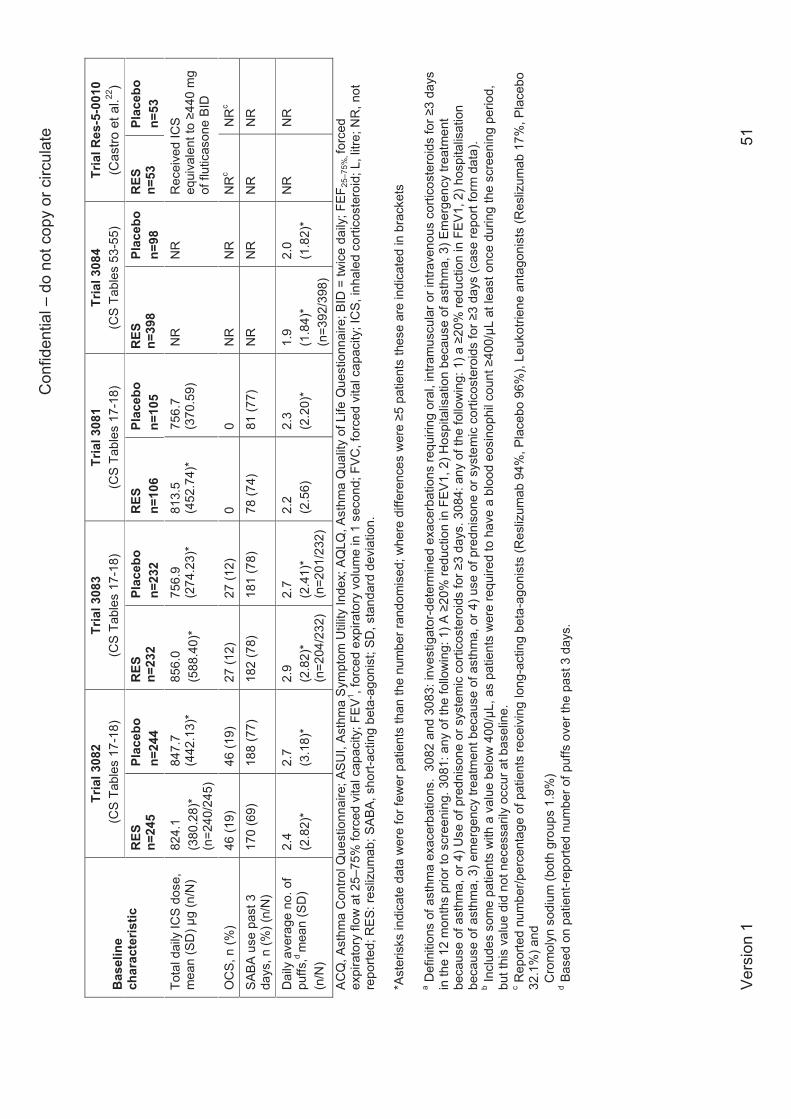
Con
fiden
tial –
do
not c
opy
or c
ircul
ate
Vers
ion
1 51
Bas
elin
e ch
arac
teris
tic
Tria
l 308
2 (C
S Ta
bles
17-
18)
Tria
l 308
3 (C
S Ta
bles
17-
18)
Tria
l 308
1 (C
S Ta
bles
17-
18)
Tria
l 308
4 (C
S Ta
bles
53-
55)
Tria
l Res
-5-0
010
( C
astro
et a
l.22)
RES
n=
245
Plac
ebo
n=24
4 R
ES
n=23
2 Pl
aceb
o n=
232
RES
n=
106
Plac
ebo
n=10
5 R
ES
n=39
8 Pl
aceb
o n=
98
RES
n=
53
Plac
ebo
n=53
Tota
l dai
ly IC
S do
se,
mea
n (S
D) μ
g (n
/N)
824.
1 (3
80.2
8)*
(n=2
40/2
45)
847.
7 (4
42.1
3)*
856.
0 (5
88.4
0)*
756.
9 (2
74.2
3)*
813.
5 (4
52.7
4)*
756.
7 (3
70.5
9)
NR
N
R
Rec
eive
d IC
S eq
uiva
lent
to ≥
440
mg
of fl
utic
ason
e BI
D
OC
S, n
(%)
46 (1
9)
46 (1
9)
27 (1
2)
27 (1
2)
0 0
NR
N
R
NR
c N
Rc
SABA
use
pas
t 3
days
, n (%
) (n/
N)
170
(69)
18
8 (7
7)
182
(78)
18
1 (7
8)
78 (7
4)
81 (7
7)
NR
N
R
NR
N
R
Dai
ly a
vera
ge n
o. o
f pu
ffs,d
mea
n (S
D)
(n/N
)
2.4
(2.8
2)*
2.7
(3.1
8)*
2.
9 (2
.82)
* (n
=204
/232
)
2.7
(2.4
1)*
(n=2
01/2
32)
2.2
(2.5
6)
2.3
(2.2
0)*
1.
9 (1
.84)
* (n
=392
/398
)
2.0
(1.8
2)*
N
R
NR
ACQ
, Ast
hma
Con
trol Q
uest
ionn
aire
; ASU
I, As
thm
a Sy
mpt
om U
tility
Inde
x; A
QLQ
, Ast
hma
Qua
lity
of L
ife Q
uest
ionn
aire
; BID
= tw
ice
daily
; FEF
25–7
5%, fo
rced
ex
pira
tory
flow
at 2
5–75
% fo
rced
vita
l cap
acity
; FEV
1 , for
ced
expi
rato
ry v
olum
e in
1 s
econ
d; F
VC, f
orce
d vi
tal c
apac
ity; I
CS,
inha
led
corti
cost
eroi
d; L
, litr
e; N
R, n
ot
repo
rted;
RES
: res
lizum
ab; S
ABA,
sho
rt-ac
ting
beta
-ago
nist
; SD
, sta
ndar
d de
viat
ion.
*A
ster
isks
indi
cate
dat
a w
ere
for f
ewer
pat
ient
s th
an th
e nu
mbe
r ran
dom
ised
; whe
re d
iffer
ence
s w
ere ≥5
pat
ient
s th
ese
are
indi
cate
d in
bra
cket
s a D
efin
ition
s of
ast
hma
exac
erba
tions
. 30
82 a
nd 3
083:
inve
stig
ator
-det
erm
ined
exa
cerb
atio
ns re
quiri
ng o
ral,
intra
mus
cula
r or i
ntra
veno
us c
ortic
oste
roid
s fo
r ≥3
days
in
the
12 m
onth
s pr
ior t
o sc
reen
ing.
308
1: a
ny o
f the
follo
win
g: 1
) A ≥
20%
redu
ctio
n in
FE
V1,
2) H
ospi
talis
atio
n be
caus
e of
ast
hma,
3) E
mer
genc
y tre
atm
ent
beca
use
of a
sthm
a, o
r 4) U
se o
f pre
dnis
one
or s
yste
mic
cor
ticos
tero
ids
for ≥
3 da
ys. 3
084:
any
of t
he fo
llow
ing:
1) a
≥20
% re
duct
ion
in F
EV1,
2) h
ospi
talis
atio
n be
caus
e of
ast
hma,
3) e
mer
genc
y tre
atm
ent b
ecau
se o
f ast
hma,
or 4
) use
of p
redn
ison
e or
sys
tem
ic c
ortic
oste
roid
s fo
r ≥3
days
(cas
e re
port
form
dat
a).
b Incl
udes
som
e pa
tient
s w
ith a
val
ue b
elow
400
/μL,
as
patie
nts
wer
e re
quire
d to
hav
e a
bloo
d eo
sino
phil
coun
t ≥40
0/μL
at l
east
onc
e du
ring
the
scre
enin
g pe
riod,
bu
t thi
s va
lue
did
not n
eces
saril
y oc
cur a
t bas
elin
e.
c Rep
orte
d nu
mbe
r/per
cent
age
of p
atie
nts
rece
ivin
g lo
ng-a
ctin
g be
ta-a
goni
sts
(Res
lizum
ab 9
4%, P
lace
bo 9
6%),
Leuk
otrie
ne a
ntag
onis
ts (R
esliz
umab
17%
, Pla
cebo
32
.1%
) and
C
rom
olyn
sod
ium
(bot
h gr
oups
1.9
%)
d Bas
ed o
n pa
tient
-repo
rted
num
ber o
f puf
fs o
ver t
he p
ast 3
day
s.
Confidential – do not copy or circulate
Version 1 52
3.1.3.3 Ongoing trials
The CS states (section 4.14) that there are “no completed or ongoing company-sponsored
studies from which new evidence for reslizumab in patients with asthma and elevated blood
eosinophils will become available in the next 12 months”, but it does not mention any trials not
sponsored by the company that may complete within the next 12 months. As mentioned above
(section 3.1.1), the ERG did not identify any relevant ongoing studies of reslizumab. In response
to a query from the ERG via NICE, the company provided a list of relevant ongoing studies,
regardless of the evidence becoming available in the next 12 months (clarification A13).
3.1.3.4 Non-randomised studies
The CS cites one open-label extension study, 3085, for supporting evidence on safety. Patients
entered study 3085 after participating in trials 3082, 3083 and 3081 (CS Table 87). The data
from study 3085 reported in the CS are from a clinical study report, with some data marked AiC.
A total of XXXX patients were enrolled, with XXXXXXXXXXX receiving at least one dose of
reslizumab. XXXXXXXXX percent of patients XXXXXXX received reslizumab for the first time,
having received placebo in the preceding studies. A total of XXXXXXX patients completed the
study (i.e. the 104-week treatment period and the 90-day follow-up period); the main reason for
withdrawal XXXXX was XXXXXXXXXXXXXXXXXXXXXXXXXXXXXXXXXXXXXXXXXXXXX.
3.1.4 Description and critique of the approach to validity assessment The CS provides a quality assessment for four of the included RCTs (3082, 3083, 3018 and
3014) using standard criteria as recommended by NICE (CS section 4.6; CS Table 19 and CS
Appendix 3). However, the CS does not report quality assessment for the fifth RCT which was
included in the submission (Res-5-0010) and therefore the ERG requested this information from
the company via NICE (clarification A9). The ERG’s critique of the company’s quality
assessment for these five RCTs is shown in Table 6.
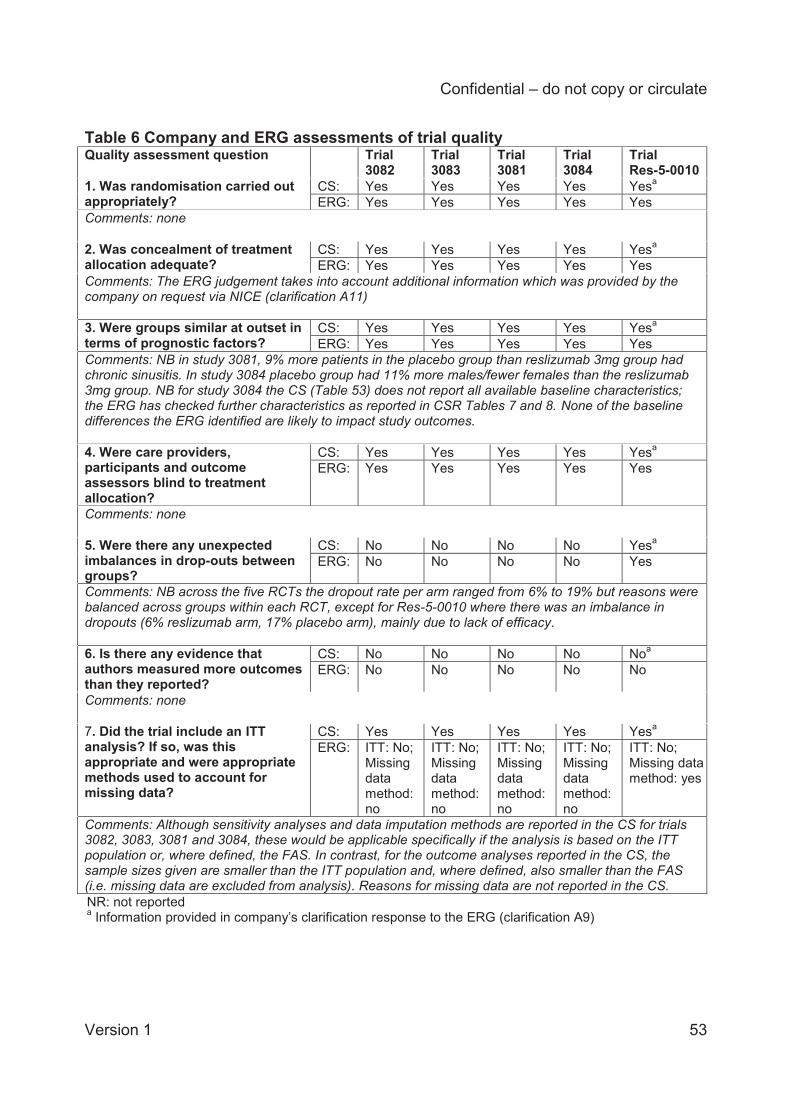
Confidential – do not copy or circulate
Version 1 53
Table 6 Company and ERG assessments of trial quality Quality assessment question Trial
3082 Trial 3083
Trial 3081
Trial 3084
Trial Res-5-0010
1. Was randomisation carried out appropriately?
CS: Yes Yes Yes Yes Yesa ERG: Yes Yes Yes Yes Yes
Comments: none 2. Was concealment of treatment allocation adequate?
CS: Yes Yes Yes Yes Yesa ERG: Yes Yes Yes Yes Yes
Comments: The ERG judgement takes into account additional information which was provided by the company on request via NICE (clarification A11) 3. Were groups similar at outset in terms of prognostic factors?
CS: Yes Yes Yes Yes Yesa ERG: Yes Yes Yes Yes Yes
Comments: NB in study 3081, 9% more patients in the placebo group than reslizumab 3mg group had chronic sinusitis. In study 3084 placebo group had 11% more males/fewer females than the reslizumab 3mg group. NB for study 3084 the CS (Table 53) does not report all available baseline characteristics; the ERG has checked further characteristics as reported in CSR Tables 7 and 8. None of the baseline differences the ERG identified are likely to impact study outcomes. 4. Were care providers, participants and outcome assessors blind to treatment allocation?
CS: Yes Yes Yes Yes Yesa ERG: Yes Yes Yes Yes Yes
Comments: none 5. Were there any unexpected imbalances in drop-outs between groups?
CS: No No No No Yesa ERG: No No No No Yes
Comments: NB across the five RCTs the dropout rate per arm ranged from 6% to 19% but reasons were balanced across groups within each RCT, except for Res-5-0010 where there was an imbalance in dropouts (6% reslizumab arm, 17% placebo arm), mainly due to lack of efficacy. 6. Is there any evidence that authors measured more outcomes than they reported?
CS: No No No No Noa ERG: No No No No No
Comments: none 7. Did the trial include an ITT analysis? If so, was this appropriate and were appropriate methods used to account for missing data?
CS: Yes Yes Yes Yes Yesa ERG: ITT: No;
Missing data method: no
ITT: No; Missing data method: no
ITT: No; Missing data method: no
ITT: No; Missing data method: no
ITT: No; Missing data method: yes
Comments: Although sensitivity analyses and data imputation methods are reported in the CS for trials 3082, 3083, 3081 and 3084, these would be applicable specifically if the analysis is based on the ITT population or, where defined, the FAS. In contrast, for the outcome analyses reported in the CS, the sample sizes given are smaller than the ITT population and, where defined, also smaller than the FAS (i.e. missing data are excluded from analysis). Reasons for missing data are not reported in the CS. NR: not reported a Information provided in company’s clarification response to the ERG (clarification A9)
Confidential – do not copy or circulate
Version 1 54
Overall, we agree with the company’s assessments of the trial quality, with the exception that
we considered that in all trials analysis population was not an ITT population, since for most of
the outcomes analysed in the CS the sample sizes reported are smaller than the number
randomised and, where defined, also smaller than the FAS. In addition to the quality assessments of reslizumab RCTs reported in the CS, the ITC Report16
provided by the company includes a summary of the company’s quality assessments for the five
reslizumab RCTs and 16 omalizumab RCTs that were identified as potentially relevant for the
ITC analysis (ITC Report Appendix 10), meaning that quality assessment for the reslizumab
RCTs is duplicated. The quality assessment for the reslizumab RCTs in the ITC Report is nearly
identical to that provided in the CS, but there is a discrepancy for the question about ITT
analyses: this was answered “no” for RCTs 3082, 3083, 3018 and 3984 in ITC Report but was
answered “yes” for these RCTs the CS. As shown in Table 6, we concur with the company’s
judgement provided in the CS version ITC Report.
Another discrepancy which came to light after the ERG had received the company’s quality
assessment of RCT Res-5-0010 (clarification A9) is that the company’s answer to the question
about imbalances in dropouts was “no” in the ITC Report but “yes” in the clarification response.
As shown in Table 6, we concur with the company’s judgement provided in the clarification
response.
In addition to the quality assessment of the RCTs, the company conducted a quality
assessment for the non-randomised (single arm) open label extension study 3085 which was
primarily a study of reslizumab safety. The quality assessment for study 3085 (CS Appendix 5)
was based on a checklist but the CS does not identify the source.
Confidential – do not copy or circulate
Version 1 55
3.1.5 Description and critique of the company’s outcome selection The outcomes specified in the CS are asthma control, rates of clinically significant asthma
exacerbations, lung function, adverse events, and HRQoL. These are consistent with the
NICE scope. However, the company has not reported patient and clinician evaluation of
response, mortality, or time to discontinuation, which are specified as outcomes in the NICE
scope, and the CS does not explain why these outcomes are missing. We have checked the
clinical study reports for trials 3082, 3083, 3081 and 3084 and the publication for Res-5-0010
and confirm that none of the included trials reported patient and clinician evaluation of
response or time to discontinuation. Across the five trials only one death occurred, and this
was in the placebo arm of trial 3082.
In addition to the outcomes listed in the NICE scope, the CS reports use of short-acting beta
agonists (SABA) and also blood eosinophil concentrations which provide supporting clinical
information on medication use and the degree of eosinophilic inflammation respectively.
In summary, the outcomes presented in the CS are appropriate for the evaluation of severe
eosinophilic asthma and, where available, are consistent with the NICE scope:
Asthma control
Asthma control was assessed using the change from baseline in the Asthma Control
Questionnaire (ACQ) score in five trials (3082, 3083, 3011, 3084, Res-5-0010). The ACQ is
a validated and widely used instrument which has seven questions, each with a possible
score ranging from 0–6. The total score is the mean of all responses which gives a score
ranging from 0 (totally controlled asthma) to 6 (severely uncontrolled asthma). Six of the
questions are self-assessments; one is the result of the patient’s % predicted FEV1
measurement. The minimum clinically important difference for the ACQ is regarded as a
change of score ≥0.5.23 The seven-question version of the ACQ is considered useful in
discriminating between ‘well-controlled’ and ‘not well-controlled’ asthma. Juniper and
colleagues23 demonstrated that to be confident that a patient has well-controlled asthma, the
optimal cut-point on the ACQ is 0.75 (negative predictive value=0.85); whilst to be confident
that the patient has inadequately controlled asthma, the optimal cut-point on the ACQ is 1.50
(positive predictive value=0.88).
Confidential – do not copy or circulate
Version 1 56
In addition to analysing changes in ACQ scores, the CS also reports an ‘ACQ responder
analysis’, referring to the proportion of patients in the reslizumab and placebo groups who
achieved a change in ACQ score of at least 0.5.
Exacerbations
The NICE scope specifies “Incidence of clinically significant exacerbations, including those
which require unscheduled contact with healthcare professionals or hospitalisation”.
Exacerbations were reported by trials 3082, 3083, 3081 and Res-5-0010. Trials 3082 and
3083 use the term “clinical asthma exacerbations” (CAE) which appears consistent with the
NICE scope. The definitions reported in the trials are as follows:
Trials 3082 and 3083: An exacerbation event was defined as a clinical asthma exacerbation
(CAE) if the patient met either or both of the following criteria:
(1) Use of systemic (oral, intravenous or muscular), or an increase in the use of inhaled,
corticosteroid treatment for ≥3 days. For patients already being treated with systemic or
inhaled corticosteroids, the dose of corticosteroids needed to be increased ≥2 fold for at
least 3 days.
(2) Asthma-related emergency treatment including at least one of the following:
An unscheduled visit to the physician’s office for nebuliser treatment or other urgent
treatment to prevent worsening of asthma symptoms.
A visit to the emergency room for asthma-related treatment.
An asthma-related hospitalisation.
The above criteria had to be corroborated with at least one other measurement to indicate
worsening in the clinical signs and symptoms of asthma, as follows:
Decrease in FEV1 by ≥20% from baseline;
Decrease in PEFR by ≥30% from baseline on two consecutive days; or
Worsening of symptoms or other clinical signs per physician evaluation of the event.
The investigator recorded essential elements of a CAE (i.e. the type of medical intervention
and/or a decrease in lung function) in the electronic case report form; asthma worsening
events recorded in the form are referred to as investigator-determined CAEs.
Trial Res-05-0010: A clinical asthma exacerbation was defined as (1) a 20% or more
decrease from baseline in FEV1; or (2) worsening of asthma requiring emergency treatment,
hospital admission, or three or more days of oral corticosteroid treatment. Patients with
exacerbations were treated according to the investigator’s discretion.
Confidential – do not copy or circulate
Version 1 57
Trial 3081: Asthma exacerbations or events of worsening asthma were not used as a
measure of efficacy in trial 3081; instead these events were recorded as an adverse event
and coded as an asthma exacerbation, defined by one of the following: 1) a ≥20% reduction
in FEV1, 2) hospitalisation because of asthma, 3) emergency treatment because of asthma,
or 4) use of prednisone or systemic corticosteroids for ≥3 days. However, the company has
not included trial 3081 in any analyses of exacerbations.
Lung function
The CS reports analyses of changes from baseline in the following lung function outcomes
measured by spirometry:
FEV1 (trials 3082, 3083, 3011, 3084, Res-5-0010): The volume of air expelled in the first
second of a forced expiration.
% predicted FEV1 (trials 3082, 3083, 3011, 3084, Res-5-0010): The ratio of the volume
of air expired in the first second of a forced expiration to the patient’s predicted FEV.
FVC (trials 3082, 3083, 3011, 3084, Res-5-0010): The volume of air that can be forcibly
blown out after full inspiration.
FEF25–75% (trials 3081, 3084): The forced expiratory flow at 25–75% of the FVC.
PEFR (trials 3082, 3083, 3081): The greatest rate of airflow that can be obtained during
a forced exhalation.
Expert advice to the ERG suggests that FEF25–75% can be quite variable and is not routinely
used in clinical practice; however, we have included this outcome in the present report for
completeness. The CS only reports PEFR for small subgroups of patients and for this reason
we have not included PEFR in the present report.
HRQoL
Three reslizumab trials used the change from baseline in the Asthma Quality of Life
Questionnaire24 (AQLQ) score as their primary measure of HRQoL (trials 3082, 3083, 3081).
The AQLQ is a validated and widely-used instrument which has 32 questions in 4 domains
(symptoms, activity limitation, emotional function, and environmental stimuli). Patients were
asked to recall their experiences during the last 2 weeks. The AQLQ score ranges from
1 indicating severe impairment to 7 indicating no impairment. The minimum clinically
important difference for AQLQ change is considered to be ≥0.5.25 A clinical expert advising
the ERG commented that whilst the AQLQ is validated and widely used for assessing
Confidential – do not copy or circulate
Version 1 58
HRQoL in patients with asthma, it has not been specifically validated in patients with severe
asthma.
In addition to analysing changes in AQLQ scores, the CS also reports an ‘AQLQ responder
analysis’, referring to the proportion of patients in the reslizumab and placebo groups who
achieved a change in AQLQ score of at least 0.5.
The same trials also reported scores for the Asthma Symptoms Utility Index (ASUI), another
validated and widely used instrument, although the company did not include these in any
analyses. The ASUI has 11 items to assess the frequency and severity of asthma symptoms
and side effects, weighted by patient preferences. The ASUI score ranges from 0 to 1, with
lower scores indicating greater asthma symptom problems.
SABA use
SABA use was assessed in trials 3082, 3083, 3081 and 3084. Patients were asked to recall
whether SABAs were used within 3 days of the scheduled visit and, if so, how many puffs
were used.
Blood eosinophil counts
Blood eosinophil counts were assessed in trials 3082, 3083, 3011, 3084 and Res-5-0010).
This was measured using a standard complete blood count with differential blood test.
3.1.6 Description and critique of the company’s approach to trial statistics Analysis populations in the clinical trials
The company’s assessment of trial quality (CS Table 19) states that trials 3082, 3083, 3081
and 3084 employed an intent-to-treat (ITT) analysis (i.e. in which all randomised patients
were analysed), although the CS when referring to these trials does not explicitly mention
ITT but instead refers to the ‘randomised set’. Other populations in the trials as referred to in
the CS are:
‘full analysis set’ (FAS): defined as the number of trial participants who were treated
with at least one dose of study drug (trials 3082, 3083, 3081)
‘safety analysis set’ (SAS): defined the same as the FAS
The relationship between the analysis populations in each trial is summarised in Table 7.
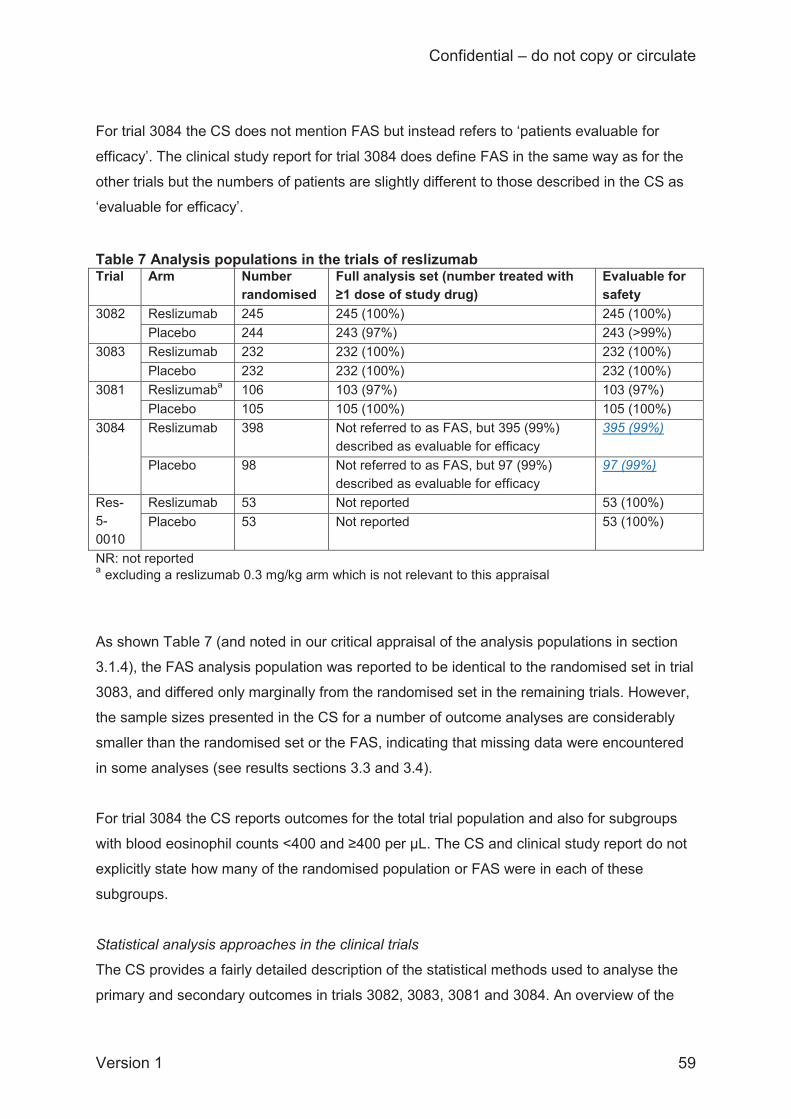
Confidential – do not copy or circulate
Version 1 59
For trial 3084 the CS does not mention FAS but instead refers to ‘patients evaluable for
efficacy’. The clinical study report for trial 3084 does define FAS in the same way as for the
other trials but the numbers of patients are slightly different to those described in the CS as
‘evaluable for efficacy’.
Table 7 Analysis populations in the trials of reslizumab Trial Arm Number
randomised Full analysis set (number treated with ≥1 dose of study drug)
Evaluable for safety
3082 Reslizumab 245 245 (100%) 245 (100%) Placebo 244 243 (97%) 243 (>99%)
3083 Reslizumab 232 232 (100%) 232 (100%) Placebo 232 232 (100%) 232 (100%)
3081 Reslizumaba 106 103 (97%) 103 (97%) Placebo 105 105 (100%) 105 (100%)
3084 Reslizumab 398 Not referred to as FAS, but 395 (99%) described as evaluable for efficacy
395 (99%)
Placebo 98 Not referred to as FAS, but 97 (99%) described as evaluable for efficacy
97 (99%)
Res-5-0010
Reslizumab 53 Not reported 53 (100%) Placebo 53 Not reported 53 (100%)
NR: not reported a excluding a reslizumab 0.3 mg/kg arm which is not relevant to this appraisal
As shown Table 7 (and noted in our critical appraisal of the analysis populations in section
3.1.4), the FAS analysis population was reported to be identical to the randomised set in trial
3083, and differed only marginally from the randomised set in the remaining trials. However,
the sample sizes presented in the CS for a number of outcome analyses are considerably
smaller than the randomised set or the FAS, indicating that missing data were encountered
in some analyses (see results sections 3.3 and 3.4).
For trial 3084 the CS reports outcomes for the total trial population and also for subgroups
with blood eosinophil counts <400 and ≥400 per μL. The CS and clinical study report do not
explicitly state how many of the randomised population or FAS were in each of these
subgroups.
Statistical analysis approaches in the clinical trials
The CS provides a fairly detailed description of the statistical methods used to analyse the
primary and secondary outcomes in trials 3082, 3083, 3081 and 3084. An overview of the
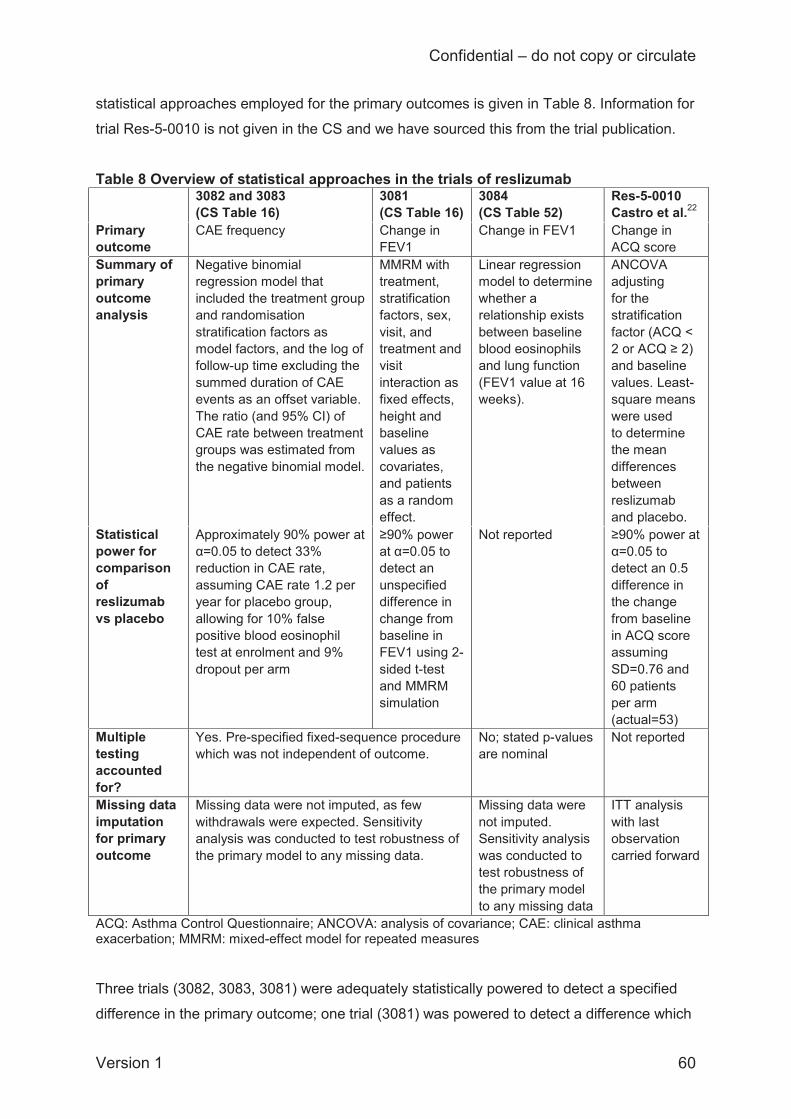
Confidential – do not copy or circulate
Version 1 60
statistical approaches employed for the primary outcomes is given in Table 8. Information for
trial Res-5-0010 is not given in the CS and we have sourced this from the trial publication.
Table 8 Overview of statistical approaches in the trials of reslizumab 3082 and 3083
(CS Table 16) 3081 (CS Table 16)
3084 (CS Table 52)
Res-5-0010 Castro et al.22
Primary outcome
CAE frequency Change in FEV1
Change in FEV1 Change in ACQ score
Summary of primary outcome analysis
Negative binomial regression model that included the treatment group and randomisation stratification factors as model factors, and the log of follow-up time excluding the summed duration of CAE events as an offset variable. The ratio (and 95% CI) of CAE rate between treatment groups was estimated from the negative binomial model.
MMRM with treatment, stratification factors, sex, visit, and treatment and visit interaction as fixed effects, height and baseline values as covariates, and patients as a random effect.
Linear regression model to determine whether a relationship exists between baseline blood eosinophils and lung function (FEV1 value at 16 weeks).
ANCOVA adjusting for the stratification factor (ACQ < 2 or ACQ ≥ 2) and baseline values. Least-square means were used to determine the mean differences between reslizumab and placebo.
Statistical power for comparison of reslizumab vs placebo
Approximately 90% power at α=0.05 to detect 33% reduction in CAE rate, assuming CAE rate 1.2 per year for placebo group, allowing for 10% false positive blood eosinophil test at enrolment and 9% dropout per arm
≥90% power at α=0.05 to detect an unspecified difference in change from baseline in FEV1 using 2-sided t-test and MMRM simulation
Not reported ≥90% power at α=0.05 to detect an 0.5 difference in the change from baseline in ACQ score assuming SD=0.76 and 60 patients per arm (actual=53)
Multiple testing accounted for?
Yes. Pre-specified fixed-sequence procedure which was not independent of outcome.
No; stated p-values are nominal
Not reported
Missing data imputation for primary outcome
Missing data were not imputed, as few withdrawals were expected. Sensitivity analysis was conducted to test robustness of the primary model to any missing data.
Missing data were not imputed. Sensitivity analysis was conducted to test robustness of the primary model to any missing data
ITT analysis with last observation carried forward
ACQ: Asthma Control Questionnaire; ANCOVA: analysis of covariance; CAE: clinical asthma exacerbation; MMRM: mixed-effect model for repeated measures Three trials (3082, 3083, 3081) were adequately statistically powered to detect a specified
difference in the primary outcome; one trial (3081) was powered to detect a difference which
Confidential – do not copy or circulate
Version 1 61
was not specified; and the remaining trial (3084) did not report statistical power. Three trials
adjusted for multiple testing, one did not adjust for multiple testing (3084), and another did
not report this (Res-5-0010). The multiple testing adjustment employed in trials 3082, 3083
and 3081 was based on a fixed-sequence procedure that would be appropriate provided that
the most important outcomes are pre-specified as being highest in the order of testing. We
note that the specified order of outcome testing (which the CS states is reported in CS Table
13) implicitly ranks asthma control as being of lower importance than lung function and
HRQoL in this adjustment approach for multiple testing, although it is not discussed in the
CS as to how this should influence the interpretation of statistical significance for each
outcome. Four trials (3083, 3082, 3081, 3084) employed sensitivity analyses to assess
whether missing data would affect analysis conclusions, whilst Res-5-0010 used a last-
observation-carried-forward approach but did not state explicitly to which outcomes and for
how many missing data values this was applied.
Although the statistical analysis approaches appear generally reasonable, the company
appears to have over-tested some outcomes by employing two different analysis methods in
trials 3082, 3083 and 3081 when one analysis would have sufficed. Notably, the CS reports
that changes from baseline were analysed “over” 16 (or 52) weeks, and also that they were
analysed “to” 16 (or 52) weeks. In response to an ERG query to the company via NICE
(clarification A1), the company explained that the “change over” 16 (or 52) weeks can be
viewed as the weighted average across the entire period whereas the “change to” 16 (or 52)
weeks is the estimate for that specific time-point at week 16 (or 52). The company has not
explained why two different measures of change from baseline were needed and not
explained which is the preferred analysis, and the methods for analysing the changes from
baseline are not reported consistently across all outcomes in the CS. In trial 3084 the
change “at” 16 (or 52) weeks is reported and we assume this means the change which the
company has referred to as “to” 16 (or 52) weeks in their clarification response. Having
results from two analyses of the same outcome increases the possibility of selective
reporting of results and also increases the number of multiple comparisons being tested.
Reporting of analyses
Results of the statistical analyses are generally reported clearly in the CS, including the
number and proportion of patients where appropriate; point estimates (mean or least
squares mean, or median); variance estimates (SD, SE or 95% confidence interval; CI); and
effect estimates (hazard ratio, rate ratio or mean difference). Clinically significant differences
are reported for the FEV1, ACQ and AQLQ outcomes and these are discussed when
interpreting analysis results for these outcomes.
Confidential – do not copy or circulate
Version 1 62
There are some problems with the reporting of analyses, however:
For binary outcomes the company states in the CS and the ITC Report16 that results
are mean differences when they are actually odds ratios.
The CS does not explain why, for the majority of the analyses, there are missing
data.
It is unclear from both the CS and clinical study reports whether the ACQ responder
analysis was pre-specified or post-hoc.
3.1.7 Description and critique of the company’s approach to the evidence synthesis
The CS presents a well-structured evidence synthesis comprising three main parts. These
are: a description of the clinical evidence from the five individual RCTs of reslizumab versus
placebo (CS section 4.7); a direct comparison meta-analysis in which the results for
specified outcomes were pooled across the reslizumab versus placebo RCTs (CS section
4.9); and an indirect treatment comparison (ITC) which estimated pooled outcomes for
reslizumab compared to omalizumab based on indirect evidence from combining the
reslizumab versus placebo and omalizumab versus placebo RCTs, using placebo (and/or
BSC) as a common comparator. The ITC is not reported in the CS but was provided as a
separate ITC Report.16 The clinical effectiveness evidence reported in the CS and the ITC
Report is generally presented clearly using tables and graphs and is summarised narratively
using concise textual description. We note that results of direct comparison meta-analyses
are provided in duplicate, being given in the CS (section 4.9) with the same results also
provided in the ITC Report (section 3.2).
3.1.7.1 Description and critique of the direct comparison meta-analysis The company conducted what the CS describes as direct comparison meta-analysis of
“reslizumab versus BSC” (CS page 49 section 4.9), where “BSC” refers to the placebo arm
of relevant reslizumab RCTs. The ERG believes that the comparison should be more
accurately described as reslizumab + BSC versus placebo + BSC. All RCTs included in the
meta-analysis evaluated reslizumab 3.0 mg/kg versus placebo, with both arms including
BSC. As noted in the CS (section 4.9.1.1), BSC relies on the use of a Personal Asthma
Action Plan, the avoidance of environmental or dietary triggers, and the use of
Confidential – do not copy or circulate
Version 1 63
recommended medications (key components of the Personal Asthma Action Plan are
provided in CS Appendix 4).
Identification of outcomes and studies
The CS reports a ‘feasibility assessment’ for each outcome in order to determine which of
the RCTs should be included in the direct comparison meta-analysis (Table 10 within CS
Appendix 4). The ‘feasibility assessment’ is merely a list of how many RCTs report each
outcome. However, the ERG notes that the ‘feasibility assessment’ provided is for the ITC
instead of the direct comparison meta-analysis and is therefore uninformative.
No clear process is reported for assessing eligibility of the five identified reslizumab RCTs for
inclusion in the direct comparison meta-analysis. The CS does present the demographic
characteristics of four of the trials19-21 (CS Tables 17, 18 & 53) and provides quality
assessment for these four trials (CS Table 19), but this information is not used to inform
study selection for the meta-analysis (CS section 4.9.1.2). Demographic information and
quality assessment for the fifth RCT22 is not provided in the CS. The CS points out that “if
trials differ in terms of study design or the trial populations are different in terms of prognostic
factors, it can lead to heterogeneity between studies” and it lists nine potential treatment
effect modifiers which it states “were assessed across the trials included in the meta-
analysis” (CS section 4.9.1.2); however, these effect modifiers were not analysed in the
submission.
Outcomes included in direct comparison meta-analysis
Seven outcomes were included in direct comparison meta-analysis (
Table 9). Although the process for deciding why these seven outcomes should be analysed
is not clearly explained, they appear to be the outcomes which had the most data available.
The company conducted their meta-analyses for two follow-up assessment times: 16 ± 4
weeks and 52 ± 4 weeks. In response to a clarification request submitted by the ERG via
NICE (clarification A12), the company explained that time points were found to vary among
the RCTs and an assessment time ±4 weeks was “chosen based on expert opinion”.
However, of the five RCTs included in direct comparison meta-analysis, only one trial did not
report outcomes at 16 and/or 52 weeks: in the RCT by Castro and colleagues22 the outcome
assessment was at 15 instead of 16 weeks.
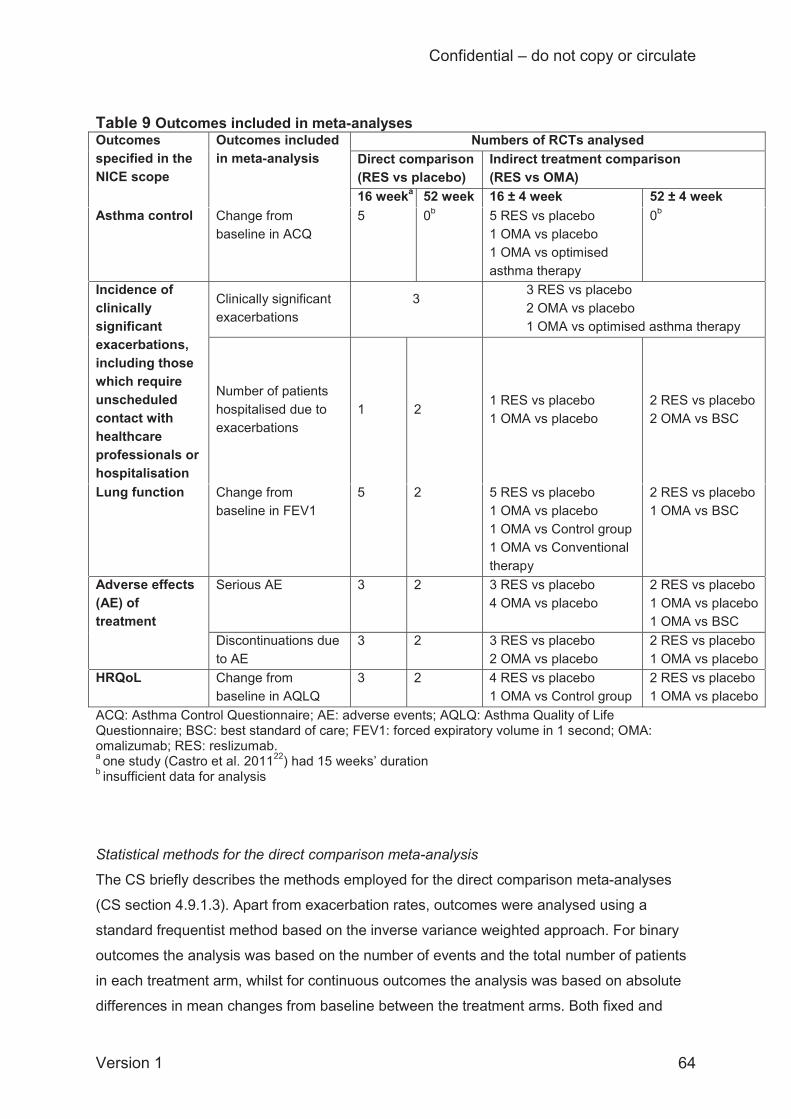
Confidential – do not copy or circulate
Version 1 64
Table 9 Outcomes included in meta-analyses Outcomes specified in the NICE scope
Outcomes included in meta-analysis
Numbers of RCTs analysed Direct comparison (RES vs placebo)
Indirect treatment comparison (RES vs OMA)
16 weeka 52 week 16 ± 4 week 52 ± 4 week Asthma control Change from
baseline in ACQ 5 0b 5 RES vs placebo
1 OMA vs placebo 1 OMA vs optimised asthma therapy
0b
Incidence of clinically significant exacerbations, including those which require unscheduled contact with healthcare professionals or hospitalisation
Clinically significant exacerbations
3
3 RES vs placebo 2 OMA vs placebo 1 OMA vs optimised asthma therapy
Number of patients hospitalised due to exacerbations
1 2 1 RES vs placebo 1 OMA vs placebo
2 RES vs placebo 2 OMA vs BSC
Lung function Change from baseline in FEV1
5 2 5 RES vs placebo 1 OMA vs placebo 1 OMA vs Control group 1 OMA vs Conventional therapy
2 RES vs placebo 1 OMA vs BSC
Adverse effects (AE) of treatment
Serious AE 3 2 3 RES vs placebo 4 OMA vs placebo
2 RES vs placebo 1 OMA vs placebo 1 OMA vs BSC
Discontinuations due to AE
3 2 3 RES vs placebo 2 OMA vs placebo
2 RES vs placebo 1 OMA vs placebo
HRQoL Change from baseline in AQLQ
3 2 4 RES vs placebo 1 OMA vs Control group
2 RES vs placebo 1 OMA vs placebo
ACQ: Asthma Control Questionnaire; AE: adverse events; AQLQ: Asthma Quality of Life Questionnaire; BSC: best standard of care; FEV1: forced expiratory volume in 1 second; OMA: omalizumab; RES: reslizumab. a one study (Castro et al. 201122) had 15 weeks’ duration
b insufficient data for analysis
Statistical methods for the direct comparison meta-analysis
The CS briefly describes the methods employed for the direct comparison meta-analyses
(CS section 4.9.1.3). Apart from exacerbation rates, outcomes were analysed using a
standard frequentist method based on the inverse variance weighted approach. For binary
outcomes the analysis was based on the number of events and the total number of patients
in each treatment arm, whilst for continuous outcomes the analysis was based on absolute
differences in mean changes from baseline between the treatment arms. Both fixed and
Confidential – do not copy or circulate
Version 1 65
random effects were estimated. In the random-effects model the between-study variance
was estimated using a standard weighted least squares method. For binary outcomes, zero
events in one or more study arms would preclude the inverse variance approach and in such
cases a Mantel-Haenszel analysis was used instead. The ERG agrees that the frequentist
analytical approach employed by the company was appropriate.
Rates of exacerbations were based on time-standardised counts based on person-years so
as to account for the different follow-up times in the RCTs and were analysed using a
Bayesian framework in WinBUGS. The exacerbation rates were modelled using a Poisson
likelihood and log link, where the number of person-years at risk was used rather than the
number of patients at risk. The analysis employed non-informative priors and both fixed and
random effects were estimated. Model fit was estimated using the deviance information
criterion (DIC). The ERG cautions against selecting fixed or random effects models based
solely on the DIC since model plausibility is arguably more important than model fit.26
However, the CS states that, in cases where a random-effects model was selected based on
the DIC, the results of the fixed-effects model were reported as a sensitivity analysis.
Overall, the Bayesian analysis of exacerbation rates conforms to the NICE DSU guidance on
generalised linear modelling for meta-analysis27 and the ERG agrees that the approach
employed by the company was appropriate.
The ERG agrees that the Bayesian analysis of exacerbation rates and frequentist analysis of
all other outcomes is reasonable. Frequentist and Bayesian approaches have different pros
and cons. The frequentist approach is simple, transparent, and easily reproducible, whilst
the Bayesian approach is more complex and less easy to reproduce but well suited to
analysing the exacerbation rates data, consistent with NICE DSU guidance.27 We have no
reason to believe that the company’s choice of Bayesian versus frequentist analysis
approaches would have led to any bias in outcomes.
Missing variance estimates for the frequentist and Bayesian meta-analyses were imputed,
as described in the CS (page 136) and the ERG agrees that the company’s imputation
approach for these parameters was appropriate. In cases where standard deviation data
were missing for the mean difference in the change from baseline, the SD was imputed
using the mean value of SDs from the arms of the other studies, although the CS does not
state which studies provided the imputation sources. An algorithm for obtaining missing
standard errors is presented and, for the analysis of exacerbations, also an algorithm for
calculating events when only rates were reported. The CS notes which trials these
imputations were applied to (e.g. CS Tables 57 & 61).
Confidential – do not copy or circulate
Version 1 66
Missing outcomes data for the individual trials were expected to be few and were dealt with
by imputation and sensitivity analysis techniques (see section 3.1.6; Table 8). However, the
input data reported in the CS for the company’s direct comparison of reslizumab against
placebo (results section 3.3) suggest that missing data occurred for the majority of outcomes
and were not included in the meta-analysis. Reasons for the missing observations are not
explained in the CS.
Statistical heterogeneity in the meta-analyses was estimated using Cochan’s Q and the I2
statistic, with heterogeneity being suspected if Cochran’s Q was signficant at a 10% level or
if I2 was greater than 50% (CS page 139). This is a standard and appropriate approach for
assessing statistical heterogeneity. However, the CS points out that the Cochran’s Q test is
limited in its reliability to detect heterogeneity when fewer than five studies are included in a
direct comparison meta-analysis. In cases where significant heterogeneity was detected by
either of the statistics, forest plots are provided in the CS to illustrate the possible sources of
heterogeneity.
Summary of the ERG’s critique of the direct comparison meta-analysis
The company’s approach for the direct comparison meta-analysis of the effectiveness of
reslizumab compared to placebo is generally appropriate. However, there are several
limitations:
The company provides limited information about the comparability of the trials
included in meta-analyses (CS section 4.9.1.2), although we have highlighted in
section 3.1.3.2 where there are notable differences between the trials.
The company’s ‘feasibility assessment’ does not clearly explain why some trials are
included in the meta-analysis but not others, particularly in relation to trial Res-5-
0010 which the CS inconsistently implies is both relevant and not relevant (the ERG
requested clarification on this via NICE but the company’s response (clarification A9)
repeated what is already stated in the CS).
For most of the outcomes analysed the sample sizes for each trial included in the
meta analysis are smaller than the numbers randomised and (where defined) the
FAS (section 3.3); no explanation for these missing data is provided in the CS.
Results of the direct meta-analysis of reslizumab versus placebo do not directly
inform the company’s economic analysis (section 4).
Confidential – do not copy or circulate
Version 1 67
3.1.7.2 Description and critique of the indirect treatment comparison No head-to-head comparisons of reslizumab against omalizumab were identified by the
company and therefore an ITC was conducted to compare reslizumab against omalizumab,
using the placebo and/or BSC arm of each RCT as the common comparator. The ITC is not
reported in the CS but was provided by the company as a separate report16 which hereafter
we refer to as the ITC Report.
Assumption underpinning the ITC
As stated in the ITC Report (section 4), omalizumab is indicated in allergic (IgE-mediated)
asthma and can only be a relevant comparator to reslizumab for a small overlap population
of patients presenting with both allergic and eosinophilic phenotypes of severe asthma.
However, detailed information about eosinophil counts at baseline was only available in
reslizumab RCTs, not omalizumab RCTs, with one exception. The EXTRA trial of
omalizumab versus placebo28 included a subgroup of patients with both IgE-mediated and
eosinophilic asthma (N=414). The company points out, however (ITC Report section 2.3.1),
that the subgroup in EXTRA had blood eosinophil concentrations ≥260 per μL, which is not
comparable with the definition of elevated blood eosinophils in the reslizumab RCTs (≥400
per μL). The company therefore excluded this subgroup. In order to facilitate the ITC, an
important assumption is made that omalizumab has the same treatment effect in the overlap
population of patients with both IgE-mediated and eosinophilic asthma as in the overall IgE-
mediated asthma population (ITC Report section 2.3.1).
Identification of outcomes and studies
The ITC is based on the 21 RCTs identified in the company’s systematic review of clinical
effectiveness (i.e. five reslizumab RCTs and 16 omalizumab RCTs). Overall, the approach
employed by the company for the ITC was very similar to that described above for the direct
comparison meta-analyses. The ITC analysis began with a ‘feasibility assessment’ (ITC
Report Appendix 4) to ascertain which of the 21 identified RCTs should be included in ITC
analyses for each outcome. However, the ‘feasibility assessment’ is merely a list of how
many RCTs could potentially provide information for each outcome for each of two specified
assessment times, 16 ± 4 weeks and 52 ± 4 weeks, and it does not identify or critique the
individual RCTs involved nor mention how many of the trials for each outcome were on each
drug. Although some criteria relating to trial heterogeneity are mentioned in the ITC Report,
such as demographic characteristics (ITC Report section 3.1.2), blinding (ITC Report Table
6) and other aspects of RCT quality (ITC Report Appendix 10), these are not discussed
systematically in relation to whether the RCTs were adequately comparable and of sufficient
Confidential – do not copy or circulate
Version 1 68
quality to be included in meta-analyses. Exceptions (explained further below) are that limited
sensitivity analyses were conducted to explore the impact of blinded versus open-label
RCTs for some outcomes; and, for the exacerbations outcome, RCTs were classified
according to how they defined exacerbations and this influenced their eligibility for analysis.
The CS and ITC report do not mention the outcome assessment times for the individual
omalizumab trials and the company’s specification of 16 ± 4 weeks and 52 ± 4 weeks is
unnecessarily imprecise for some analyses. To improve precision, the ERG has added more
accurate outcome assessment timing information in our summary of the ITC results (section
3.4).
The ‘feasibility assessment’ (ITC Report Appendix 4) lists 22 outcomes, of which seven were
selected without explanation for inclusion in ITC analyses. These seven outcomes are the
same as were included in the direct comparison meta-analysis (
Table 9).
As would be expected, the reslizumab versus placebo RCTs which were included in the
direct comparison meta-analysis were also included in the ITC, with one exception: for the
AQLQ outcome assessed at 16 ± 4 weeks, the ITC included four reslizumab versus placebo
RCTs whereas the direct comparison meta-analysis had included three (
Table 9). The difference is accounted for by the RCT by Castro and colleagues (Res-5-
0010)22 being included in the ITC but not the direct comparison meta-analysis for this
outcome, but the CS does not explain this discrepancy.
The CS does not provide a rationale for excluding any specific outcomes from the ITC, apart
from %predicted FEV1. The ITC Report (section 3.4.1) states that the change from baseline
in FEV1 was selected as an endpoint in preference to the change in %predicted FEV1 since,
according to the feasibility assessment at 16 ± 4 weeks, FEV1 was reported in more studies
(n=8) than %predicted FEV1 (n=6). According to a clinical expert advising the ERG, this is
reasonable, since FEV1 and %predicted FEV1 would likely show similar effects. However,
another expert commented that the % FEV1 is less influenced by variation in trial participant
characteristics such as age and sex.
Statistical methods for the ITC
The statistical analysis approach is summarised in the ITC Report (section 2.2). Methods for
the extraction of data from the RCTs and the imputation of missing values were the same as
Confidential – do not copy or circulate
Version 1 69
those reported for the direct comparison meta-analysis (see section 3.1.7.1). The analysis
models were also the same as those employed for the direct comparison meta-analysis: a
Bayesian framework was employed for analysing time-standardised counts of clinically
significant exacerbations, whilst a standard frequentist approach based on the inverse
variance weighted method was employed for analysing all other outcomes. In the frequentist
analysis the fixed-effect estimate was accepted unless statistical heterogeneity was
significant (based on Cochran’s Q and/or the I2 statistic), otherwise the random-effects
estimate was used. In the Bayesian analysis the DIC was used to decide whether the fixed-
effects or random-effects model had the best fit, based on the same criteria as applied in
direct comparison meta-analysis (section 3.1.7.1). The ERG cautions against selecting fixed
or random effects models based solely on the DIC since model plausibility is arguably more
important than model fit.26
The ITC Report states that direct pairwise comparisons were first conducted in order to
assess the heterogeneity between studies and to generate results to be used for the indirect
comparisons. The ITC reports results of direct comparisons both for the reslizumab versus
placebo trials (i.e. duplicating the direct comparison meta-analysis results already given in
the CS) and for the omalizumab versus placebo trials. We have summarised the direct
comparison results for omalizumab versus placebo in the ITC results section of this report
(section 3.4).
Frequentist indirect comparisons were based on the method of Bucher and colleagues29
which is a standard approach for combining normally-distributed effect estimates.
Continuous outcomes were assumed to be normally distributed and were not transformed.
For odds ratios obtained from binary outcomes, a natural logarithm transformation was
applied. For each indirect comparison the 95% CI was calculated and a standard two-sided
t-test was performed; p-values <0.05 were interpreted to mean that reslizumab performed
better than omalizumab.
The Bayesian analysis of exacerbation rates was performed with WinBUGS using the
Markov Chain Monte Carlo simulation method. Three chains were simulated and their
convergence was assessed using an accepted method (examination of history and Gelman-
Rubin plots). The same numbers of iterations were used for both burn-in and monitoring of
parameters: 20,000 for the fixed-effects model, and 100,000 for the random-effects model
(ITC Report section 2.2.5.3). Although limited information about the methods is provided, the
approach is consistent with NICE DSU guidance for meta-analysis and the ERG agrees that
the methods were generally appropriate.
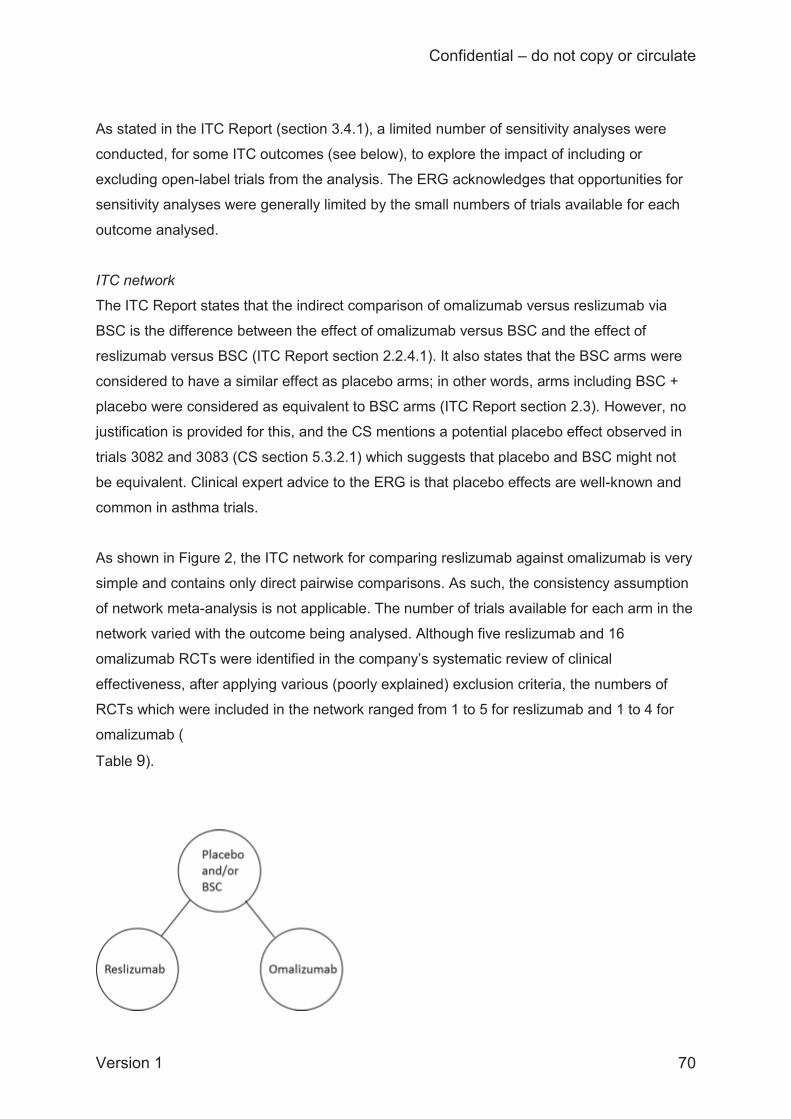
Confidential – do not copy or circulate
Version 1 70
As stated in the ITC Report (section 3.4.1), a limited number of sensitivity analyses were
conducted, for some ITC outcomes (see below), to explore the impact of including or
excluding open-label trials from the analysis. The ERG acknowledges that opportunities for
sensitivity analyses were generally limited by the small numbers of trials available for each
outcome analysed.
ITC network
The ITC Report states that the indirect comparison of omalizumab versus reslizumab via
BSC is the difference between the effect of omalizumab versus BSC and the effect of
reslizumab versus BSC (ITC Report section 2.2.4.1). It also states that the BSC arms were
considered to have a similar effect as placebo arms; in other words, arms including BSC +
placebo were considered as equivalent to BSC arms (ITC Report section 2.3). However, no
justification is provided for this, and the CS mentions a potential placebo effect observed in
trials 3082 and 3083 (CS section 5.3.2.1) which suggests that placebo and BSC might not
be equivalent. Clinical expert advice to the ERG is that placebo effects are well-known and
common in asthma trials.
As shown in Figure 2, the ITC network for comparing reslizumab against omalizumab is very
simple and contains only direct pairwise comparisons. As such, the consistency assumption
of network meta-analysis is not applicable. The number of trials available for each arm in the
network varied with the outcome being analysed. Although five reslizumab and 16
omalizumab RCTs were identified in the company’s systematic review of clinical
effectiveness, after applying various (poorly explained) exclusion criteria, the numbers of
RCTs which were included in the network ranged from 1 to 5 for reslizumab and 1 to 4 for
omalizumab (
Table 9).
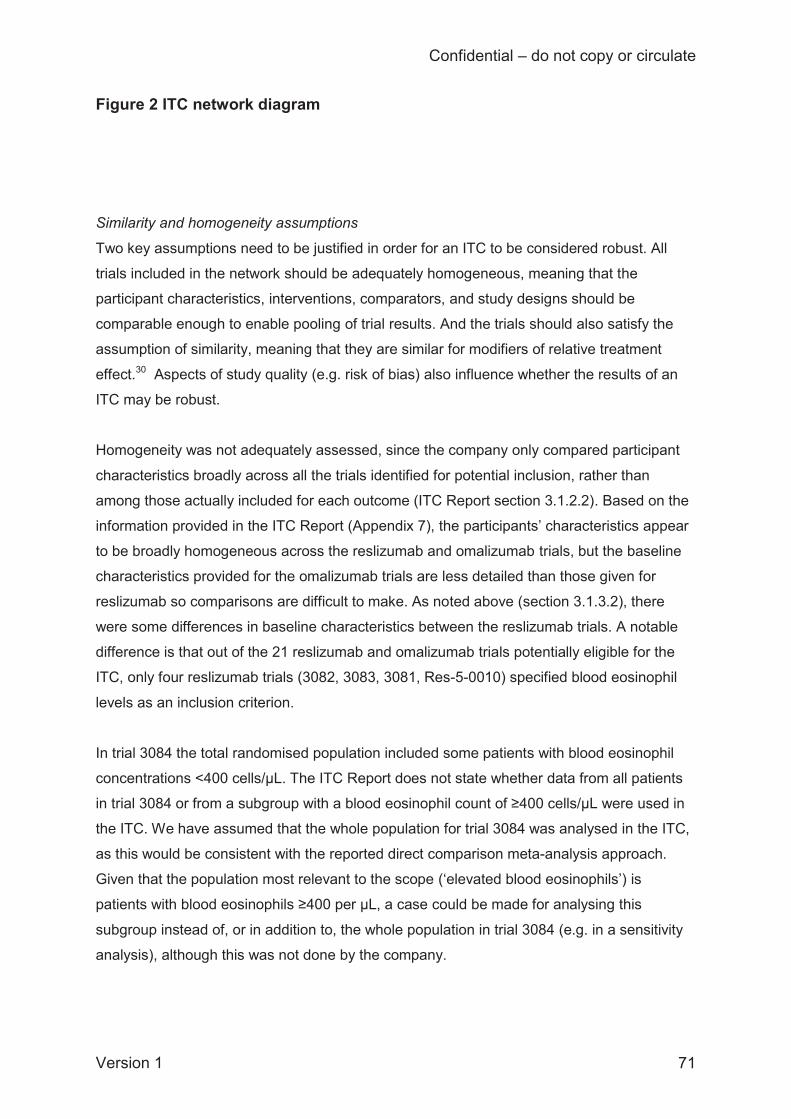
Confidential – do not copy or circulate
Version 1 71
Figure 2 ITC network diagram
Similarity and homogeneity assumptions
Two key assumptions need to be justified in order for an ITC to be considered robust. All
trials included in the network should be adequately homogeneous, meaning that the
participant characteristics, interventions, comparators, and study designs should be
comparable enough to enable pooling of trial results. And the trials should also satisfy the
assumption of similarity, meaning that they are similar for modifiers of relative treatment
effect.30 Aspects of study quality (e.g. risk of bias) also influence whether the results of an
ITC may be robust.
Homogeneity was not adequately assessed, since the company only compared participant
characteristics broadly across all the trials identified for potential inclusion, rather than
among those actually included for each outcome (ITC Report section 3.1.2.2). Based on the
information provided in the ITC Report (Appendix 7), the participants’ characteristics appear
to be broadly homogeneous across the reslizumab and omalizumab trials, but the baseline
characteristics provided for the omalizumab trials are less detailed than those given for
reslizumab so comparisons are difficult to make. As noted above (section 3.1.3.2), there
were some differences in baseline characteristics between the reslizumab trials. A notable
difference is that out of the 21 reslizumab and omalizumab trials potentially eligible for the
ITC, only four reslizumab trials (3082, 3083, 3081, Res-5-0010) specified blood eosinophil
levels as an inclusion criterion.
In trial 3084 the total randomised population included some patients with blood eosinophil
concentrations <400 cells/μL. The ITC Report does not state whether data from all patients
in trial 3084 or from a subgroup with a blood eosinophil count of ≥400 cells/μL were used in
the ITC. We have assumed that the whole population for trial 3084 was analysed in the ITC,
as this would be consistent with the reported direct comparison meta-analysis approach.
Given that the population most relevant to the scope (‘elevated blood eosinophils’) is
patients with blood eosinophils ≥400 per μL, a case could be made for analysing this
subgroup instead of, or in addition to, the whole population in trial 3084 (e.g. in a sensitivity
analysis), although this was not done by the company.
Confidential – do not copy or circulate
Version 1 72
The assumption of similarity is not mentioned in the ITC Report. The summaries of trial
characteristics provided (ITC Report Appendix 9 and CS Table 18) show that participants
were generally similar at baseline across the reslizumab and omalizumab trials included in
the indirect comparison, apart from in the number of exacerbations they had experienced in
the previous year. Participants in the omalizumab trials had on average more asthma
exacerbations in the previous year than those in the reslizumab trials: the range of means
was, respectively, 1.9 to 5.48 exacerbations per year (reported in 4 RCTs) and 1.9 to 2.1
exacerbations per year (reported in 3 RCTs). This difference suggests that populations in the
omalizumab RCTs may have had more severe asthma at baseline than those in the
reslizumab RCTs.
The company conducted a quality assessment of the RCTs (ITC Report Appendix 10) but
this did not inform trial eligibility decisions for the ITC. However, sensitivity analyses were
conducted to explore the impact of excluding open-label omalizumab RCTs where sufficient
trials were available. It is not stated in the ITC Report whether sensitivity analyses were
planned a priori or were post-hoc. Ideally, a priori analyses should have been performed to
reduce the possibility of bias that could result from over-fitting meta-analyses to the study
results once they are known.
Summary of the ERG’s critique of the ITC
Overall, the analysis approach employed for the ITC was appropriate and is clearly reported.
However, there are several limitations to the evidence that was included in the ITC:
The process for determining eligibility of RCTs for analysis is unclear, so it is unclear
whether any additional outcomes relevant to the NICE scope were omitted from the
ITC
An assumption is made that placebo arms of trials are equivalent to BSC arms, but
no justification is provided; a potential placebo effect was identified which suggests
this assumption may not be appropriate;
No discussion is provided as to whether different BSC arms in the trials are
equivalent to BSC in current NHS practice (e.g. where the comparator assumed to be
BSC was described as “optimised asthma therapy” in the EXALT trial or a “control
group” in the QUALITX trial);
The definitions of clinically significant exacerbations appear to have been applied
inconsistently, meaning that some omalizumab trials may have been inappropriately
excluded from the ITC;
Confidential – do not copy or circulate
Version 1 73
Based on the history of exacerbations, participants in the omalizumab trials appear to
have had more severe asthma at baseline than those in the reslizumab trials;
These limitations suggest that results of the ITC may not be reliable. The company
acknowledges that the ITC had limitations and, given that the ITC did not yield statistically
significant results, the ITC Report states that the results should be interpreted with caution
(ITC Report section 4).
Validity of the indirect comparison results
The CS and ITC Report do not discuss whether similar indirect comparisons have been
published and did not compare their findings to any related existing indirect comparisons
(e.g. as employed in the NICE STA of mepolizumab). However, we are unaware of any other
ITC or other types of network meta-analysis that have included both reslizumab and
omalizumab.
3.1.7.3 Role of the clinical effectiveness synthesis in informing the company’s economic analysis
The results from the company’s direct comparison of reslizumab against placebo and the
ITC of reslizumab against omalizumab do not directly inform the company’s economic
analysis. The CS states in the economic analysis section (CS section 5.3.2.3) that “the
impact of omalizumab on the number of exacerbations was estimated based on the relative
rate of exacerbations obtained from an NMA at 52 weeks versus BSC (estimate of
0.82)”.This statement refers to the ITC report.16 However, the ITC Report does not present
any direct comparison results for omalizumab versus BSC and does not provide a rate ratio
of exacerbations of 0.82 from any analysis.
3.2 Overall summary statement of the company’s approach Overall, the company’s approach to the clinical effectiveness assessment was reasonable,
being based on standard systematic review methods which are generally well reported. A
summary of our critique of the company’s approach is given in Table 10, according to the
standard CDR criteria. Table 10 Quality assessment (CRD criteria) of CS review CRD Quality Item: score Yes/ No/ Uncertain with comments 1. Are any inclusion/exclusion criteria reported relating to the primary studies which address
Yes. Note that searches were restricted to RCTs. The CS does not discuss whether any relevant non-
Confidential – do not copy or circulate
Version 1 74
the review question? randomised studies might have been missed. 2. Is there evidence of a substantial effort to search for all relevant research? i.e. all studies identified
Yes. The ERG did not find any additional studies apart from a trial of omalizumab which had been published after the date of the company’s searches.
3. Is the validity of included studies adequately assessed?
Partly. Yes for trials 3082, 3083, 3081 and 3084. No for Res-5-0010, although a separate quality assessment for this trial was provided to the ERG on request.
4. Is sufficient detail of the individual studies presented?
Partly. Yes for trials 3082, 3083, 3081 and 3084. No for Res-5-0010, and the ERG has had to obtain information on this trial from the trial publication.
5. Are the primary studies summarised appropriately?
Partly. Yes for trials 3082, 3083, 3081 and 3084. Only the results of Res-5-0010 are summarised in the CS, not methods. Note that whilst the summary of primary trials is appropriate, reasons for missing outcomes in the company’s direct meta-analysis of reslizumab versus placebo are not explained.
3.3 Direct treatment comparison results: reslizumab versus placebo The CS presents extensive results from the trials which compared reslizumab against
placebo. Below we have summarised the results from these trials and also the results of the
company’s direct comparison meta-analyses where available, for outcomes which are
relevant to the NICE scope. Additional supporting information for outcomes not specified in
the NICE scope is provided in section 3.3.6 for completeness.
3.3.1 Asthma control (ACQ scores) Five RCTs reported changes in ACQ scores over 16 weeks (Table 11). The sample sizes
stated in the CS for this outcome are smaller than both the number randomised and (where
defined) the FAS for all the trials except Res-5-0010 (for analysis population definitions see
Table 7). Reasons for the missing data are not explained in the CS. For trials 3082 and 3083
the discrepancy is small (<2% of the number randomised) but in trials 3081 and 3084 the
proportion of missing data compared to the number randomised is considerable, ranging
from 13.8% (55/398) in the reslizumab arm of trial 3084 to 20% (21/105) in the placebo arm
of trial 3081.
Improved asthma control is indicated by a decrease in ACQ scores, and the scores
consistently decreased to a greater extent in the reslizumab group then the placebo group.
The differences statistically favour reslizumab over placebo for asthma control, although the
results for trial Res-5-0010 border on statistical non-significance, with the confidence
intervals only narrowly excluding zero. Note that the results for trial 3084 (which are of
Confidential – do not copy or circulate
Version 1 75
borderline statistical significance) are for the total population, which included some patients
with baseline blood eosinophil levels <400 per μL. When a subgroup of patients with blood
eosinophil levels ≥400 per μL was analysed in this trial (reslizumab n=77, placebo n=19), the
mean difference was not statistically significant: ─0.49 (95% CI ─1.01, 0.03); p=0.0643 (CS
Table 55).
Table 11 ACQ score: mean change from baseline at 16±1 weeks Trial Reslizumab Placebo Mean difference (95% CI) Source
3082a ─0.94b (n=242) ─0.68b (n=241) ─0.27 (─0.40, ─0.13); p=0.0001 CS Table 25
3083a ─0.86b (n=230) ─0.66b (n=228) ─0.20 (─0.33, ─0.07); p=0.0032 CS Table 35
3081c ─0.94b (n=91) ─0.58b (n=84) ─0.35 (─0.63, 0.08); p=0.0129 CS Table 47
3084c d ─0.91 (n=343) ─0.70 (n=83) ─0.20 (─0.39, ─0.004); p=0.0457 CS Table 55
Res-5-0010e ─0.7 (n=53) ─0.3 (n=53) ─0.38 (─0.76, 0.01); p=0.054 Castro et al.22 a change calculated as weighted average across 16 weeks b least squares mean c change calculated at week 16 d data are for total population with baseline eosinophils <400 per μL and ≥400 per μL e change calculated at week 15 The CS reports results of direct comparison meta-analysis of the ACQ scores at 16±1
weeks, but the input data reported in the CS for meta-analysis (CS Table 61) differ in some
respects from those given in the CS tables reporting the individual trial results. For trials
3082 and 3083, the CS presents mean differences only for the analysis based on a weighted
average across 16 weeks (Table 11) whereas the meta-analysis used values from an
analysis at week 16 (CS Table 61). For trial 3081, the input data for the meta-analysis (CS
Table 61) do not concur with ACQ results reported elsewhere in the CS for this trial (CS
Table 47). However, we believe that the magnitude and direction of these inconsistencies
would be unlikely to introduce bias in favour of reslizumab for this outcome.
Results of the direct comparison meta-analysis of ACQ scores are given in Table 12 and the
forest plot is shown in Figure 3. A statistically significantly greater decrease in the ACQ
mean score in the reslizumab group indicates that this group achieved a larger improvement
in asthma control than the placebo group. There was no difference between the random-
and fixed- effect models, and heterogeneity between the studies was low (I2=24%).
Meta-analysis of ACQ scores at 52 weeks was not feasible due to lack of data.
Table 12 Direct comparison meta-analysis: ACQ score change over 16±1 weeks
Confidential – do not copy or circulate
Version 1 76
Difference between means, reslizumab versus placebo (95% CI)
Source
Fixed-effects model –0.24 (–0.32; –0.17) CS
Table 62 Random-effects model –0.24 (–0.32; –0.17)
P-value of the Cochran test 0.2639
I2 24% Abbreviations: ACQ, Asthma Control Questionnaire; CI, confidence interval. A negative change from baseline indicates that reslizumab is better than placebo
FE, fixed effects; RE, random effects Figure 3 Forest plot for the change from baseline in ACQ at 16±1 weeks The CS does not discuss these changes in ACQ scores in relation to the ACQ score cut-
points for uncontrolled asthma (score ≥1.5) and well controlled asthma (score ≤0.75).
ACQ responder analysis results are presented in the CS for trial 3082 (week 52; CS section
4.7.1.5), trial 3083 (weeks 16 and 52; CS section 4.7.2.5) and trial 3081 (week 4; CS section
4.7.3.7). In each case the proportion of responders was XXXXXXXXXXXXXXXXXX in the
reslizumab-treated than the placebo group. However, the analysis is limited as it was not
controlled for multiple testing and we are unclear whether it was planned or post-hoc. The
CS presents graphs showing the proportions of responders at 4-weekly intervals (CS
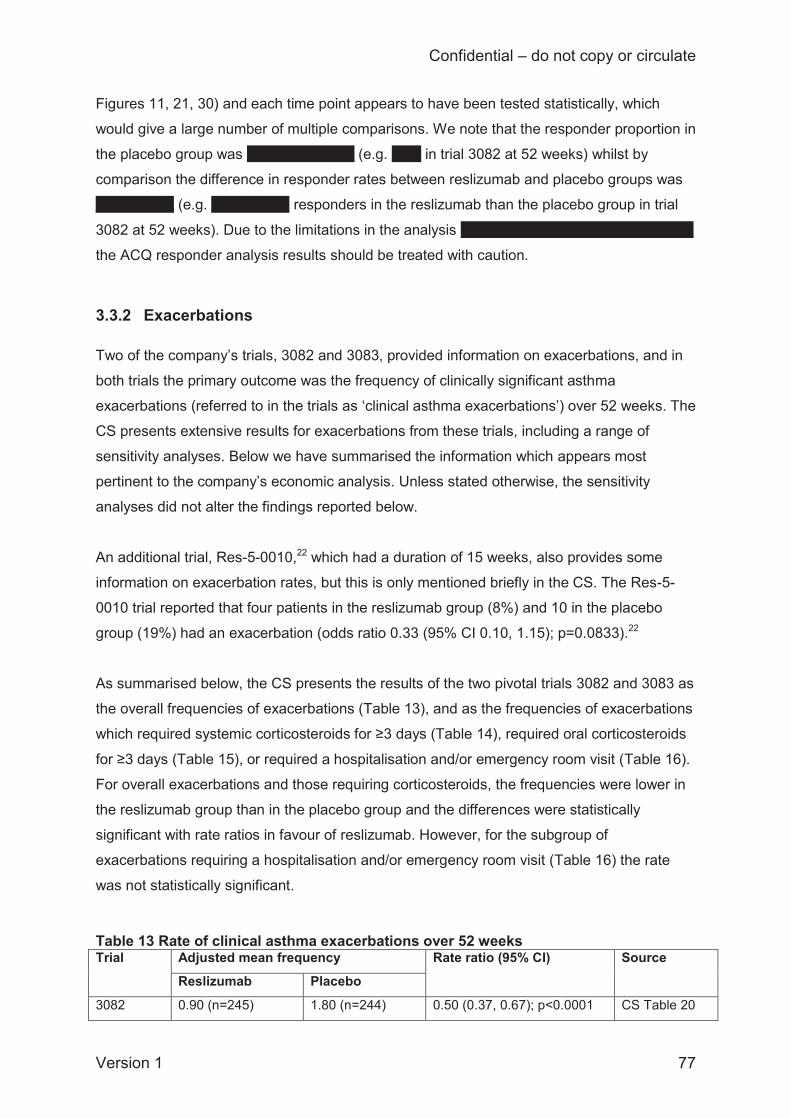
Confidential – do not copy or circulate
Version 1 77
Figures 11, 21, 30) and each time point appears to have been tested statistically, which
would give a large number of multiple comparisons. We note that the responder proportion in
the placebo group was XXXXXXXXXXX (e.g. XXX in trial 3082 at 52 weeks) whilst by
comparison the difference in responder rates between reslizumab and placebo groups was
XXXXXXXX (e.g. XXXXXXXX responders in the reslizumab than the placebo group in trial
3082 at 52 weeks). Due to the limitations in the analysis XXXXXXXXXXXXXXXXXX XX XXX
the ACQ responder analysis results should be treated with caution.
3.3.2 Exacerbations Two of the company’s trials, 3082 and 3083, provided information on exacerbations, and in
both trials the primary outcome was the frequency of clinically significant asthma
exacerbations (referred to in the trials as ‘clinical asthma exacerbations’) over 52 weeks. The
CS presents extensive results for exacerbations from these trials, including a range of
sensitivity analyses. Below we have summarised the information which appears most
pertinent to the company’s economic analysis. Unless stated otherwise, the sensitivity
analyses did not alter the findings reported below.
An additional trial, Res-5-0010,22 which had a duration of 15 weeks, also provides some
information on exacerbation rates, but this is only mentioned briefly in the CS. The Res-5-
0010 trial reported that four patients in the reslizumab group (8%) and 10 in the placebo
group (19%) had an exacerbation (odds ratio 0.33 (95% CI 0.10, 1.15); p=0.0833).22
As summarised below, the CS presents the results of the two pivotal trials 3082 and 3083 as
the overall frequencies of exacerbations (Table 13), and as the frequencies of exacerbations
which required systemic corticosteroids for ≥3 days (Table 14), required oral corticosteroids
for ≥3 days (Table 15), or required a hospitalisation and/or emergency room visit (Table 16).
For overall exacerbations and those requiring corticosteroids, the frequencies were lower in
the reslizumab group than in the placebo group and the differences were statistically
significant with rate ratios in favour of reslizumab. However, for the subgroup of
exacerbations requiring a hospitalisation and/or emergency room visit (Table 16) the rate
was not statistically significant. Table 13 Rate of clinical asthma exacerbations over 52 weeks Trial Adjusted mean frequency Rate ratio (95% CI) Source
Reslizumab Placebo
3082 0.90 (n=245) 1.80 (n=244) 0.50 (0.37, 0.67); p<0.0001 CS Table 20
Confidential – do not copy or circulate
Version 1 78
3083 0.86 (n=232) 2.11 (n=232) 0.41 (0.28, 0.59); p<0.0001 CS Table 30
Table 14 Exacerbations requiring systemic corticosteroids for ≥3 days over 52 weeks Trial Adjusted mean frequency Rate ratio (95% CI) Source
Reslizumab Placebo 3082 0.72 (n=245) 1.60 (n=244) 0.45 (0.33, 0.62); p<0.0001 CS Table 22
3083 XXXXXXXXXXXX XXXXXXXXXXXX XXXXXXXXXXXXXXXXXXX
XXXXXXXX
CS Table 32
Table 15 Exacerbations requiring oral corticosteroids for ≥3 days over 52 weeks Trial Adjusted mean frequency Rate ratio (95% CI) Source
Reslizumab Placebo
3082 0.70 (n=245) 1.59 (n=244) 0.44 (0.32, 0.61); p<0.0001 CS Table 22
3083 XXXXXXXXXXXX XXXXXXXXXXXX XXXXXXXXXXXXXXXXXXX
XXXXXXXX
CS Table 32
Table 16 Exacerbations requiring hospitalisation and/or emergency room visit over 52 weeks Trial Adjusted mean frequency Rate ratio (95% CI) Source
Reslizumab Placebo
3082 0.14 (n=245) 0.21 (n=244) 0.66 (0.32, 1.36); p=0.2572 CS Table 22
3083 XXXXXXXXXXXX XXXXXXXXXXXX XXXXXXXXXXXXXXXXXXX
XXXXXXXX
CS Table 32
The results from each of the pivotal trials presented in the CS also include an analysis of the
probability of patients not experiencing a clinically significant asthma exacerbation by week
52, based on a Kaplan-Meier analysis (Table 17). Kaplan-Meier curves are provided by the
company (CS Figures 12 & 22). In both trials patients in the reslizumab group were less
likely to experience a clinically significant exacerbation, with the hazard ratios being
statistically significant, favouring reslizumab over placebo (Table 17). Table 17 Kaplan-Meier probability of not experiencing a clinical asthma exacerbation by week 52 Trial Reslizumab Placebo Hazard ratio (95% CI) Source
3082 61.3% (95% CI 54.7%,
67.2%)
(n=245)
44.2% (95% CI 37.7%,
50.5%)
(n=244)
0.58 (0.44, 0.75);
p<0.0001
CS Table
26
Confidential – do not copy or circulate
Version 1 79
3083 73.2% (95% CI 66.8%,
78.6%)
(n=232)
51.9% (95% CI 45.0%,
58.3%)
(n=232)
0.49 (0.35, 0.67);
p<0.0001
CS Table
36
As specified in the CS, analysis of differences between the reslizumab and placebo groups
in the median time to the first clinically significant exacerbation was specified as a secondary
outcome in both of the pivotal trials. However, the CS points out that the median time to a
first clinically significant exacerbation could not be calculated for the reslizumab group in
either trial, as fewer than 50% of patients in the reslizumab groups experienced clinically
significant exacerbations. Direct comparison meta-analysis of exacerbations
The company conducted two meta-analyses of exacerbation rates. These were for the
overall rate of clinically significant exacerbations, and for the numbers of patients
hospitalised due to clinically significant exacerbations (CS section 4.9.2.6).
Input data for the meta-analysis of overall exacerbation rate are given in Table 18 and the
results of the meta-analysis are given in Table 19. As explained in the methods (ERG report
section 3.1.7), this analysis employed a Bayesian framework which modelled the number of
person-years at risk of clinically significant exacerbations (an approach recommended by
NICE27). The sample sizes stated in the CS for this outcome (Table 18) are smaller than
both the number randomised and the FAS for trials 3082 and 3083 (for analysis population
definitions see Table 7). Reasons for these missing data are not explained in the CS;
however, the discrepancy is small (0.8% to 2.1% of the number randomised).
Table 18 Clinically significant exacerbations Study, Follow up
Reslizumab versus placebo
Treatment arm N Exacerbation rate
Number of exacerbations
Person-years
Res-05-0010, over 15 weeks
Reslizumab 53 NR 4 15.29
Placebo 53 NR 10 15.29
3082, over 52 weeks
Reslizumab 243 0.90 47 243.00
Placebo 241 1.80 94 241.00
3083, over 52 weeks
Reslizumab 230 0.86 45 230.00
Placebo 227 2.11 110 227.00
Confidential – do not copy or circulate
Version 1 80
NR: not reported. Source: CS Table 67
The fixed-effects model but not the random-effects model indicate that clinically significant
exacerbations were statistically significantly less likely in the reslizumab group, with a
Bayesian probability of 100% from the fixed-effects analysis that reslizumab always performs
better than placebo (Table 19). The CS states that despite the small number of trials
included in the analysis and the credibility interval associated with the random-effects model
including 1, reslizumab was still associated with a probability of performing better than
placebo of 97%.
Table 19 Direct comparison meta-analysis: clinically significant exacerbations Median hazard ratio (95% CI) Probability DIC Source
Fixed-effects model 0.44 (0.35 to 0.56) 100% 78.06 CS Table 68 Random-effects model 0.43 (0.17 to 1.10) 97% 78.81
CI, confidence interval; DIC, deviance information criterion. A hazard ratio <1 means that reslizumab is better than its comparator. Probability is the Bayesian probability that a treatment performs better than its comparator. If Probability=100%, reslizumab always performs better than placebo. Direct comparison of the patients hospitalised due to exacerbations was conducted for a 15
week period based on results from the trial Res-5-0010 and for a 52 week period based on
the results from the two pivotal company trials 3082 and 3083.
The RES-5-0010 trial had 53 patients in each group. Results over 15 weeks identified only
one hospitalisation event in the reslizumab group (1.9%) and zero in the placebo group (0%)
(CS Table 69).
Input data for the direct comparison meta-analysis of patients hospitalised due to
exacerbations over 52 weeks are given in Table 20 and the results of the meta-analysis are
given in Table 21. The sample sizes stated in the CS for this outcome (Table 20) are smaller
than both the randomised population and FAS for trials 3082 and 3083 (for analysis
population definitions see Table 7). Reasons for these missing data are not explained in the
CS; however, the discrepancy is small (0.8% to 2.1% of the number randomised).
Table 20 Patients hospitalised due to exacerbations up to 52 weeks Trial Reslizumab versus placebo Source
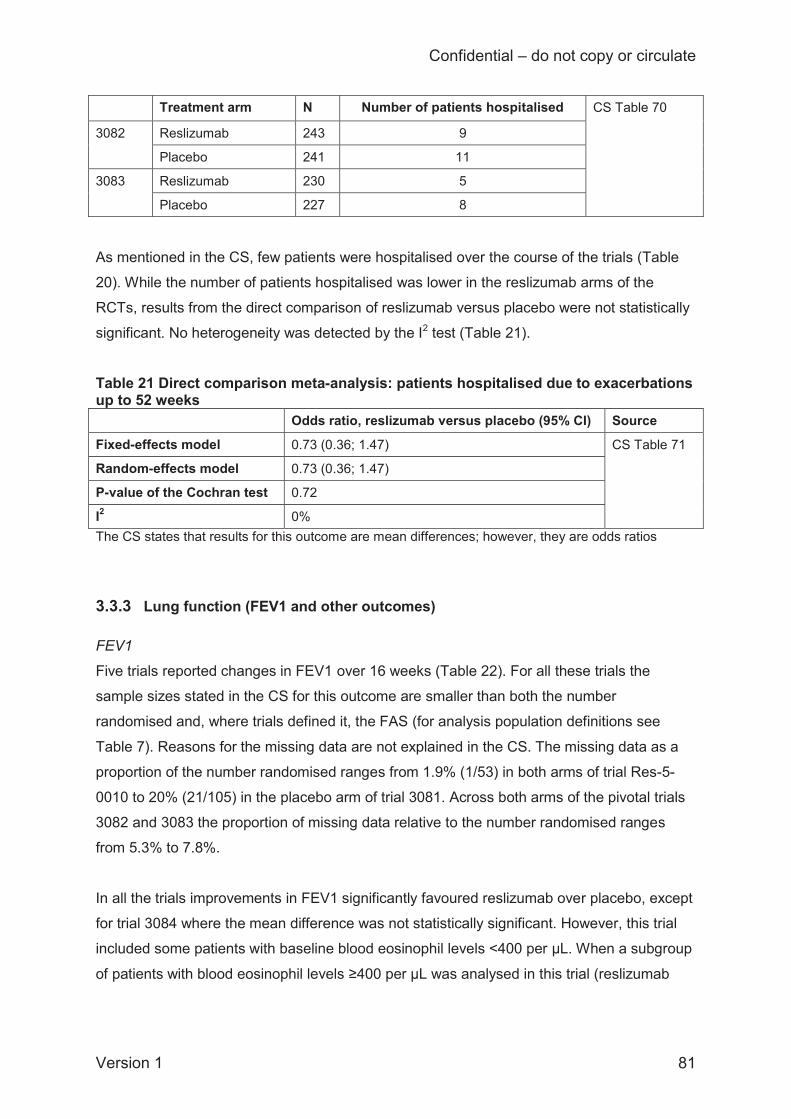
Confidential – do not copy or circulate
Version 1 81
Treatment arm N Number of patients hospitalised CS Table 70
3082 Reslizumab 243 9
Placebo 241 11
3083 Reslizumab 230 5
Placebo 227 8
As mentioned in the CS, few patients were hospitalised over the course of the trials (Table
20). While the number of patients hospitalised was lower in the reslizumab arms of the
RCTs, results from the direct comparison of reslizumab versus placebo were not statistically
significant. No heterogeneity was detected by the I2 test (Table 21).
Table 21 Direct comparison meta-analysis: patients hospitalised due to exacerbations up to 52 weeks Odds ratio, reslizumab versus placebo (95% CI) Source
Fixed-effects model 0.73 (0.36; 1.47) CS Table 71
Random-effects model 0.73 (0.36; 1.47)
P-value of the Cochran test 0.72
I2 0% The CS states that results for this outcome are mean differences; however, they are odds ratios
3.3.3 Lung function (FEV1 and other outcomes) FEV1
Five trials reported changes in FEV1 over 16 weeks (Table 22). For all these trials the
sample sizes stated in the CS for this outcome are smaller than both the number
randomised and, where trials defined it, the FAS (for analysis population definitions see
Table 7). Reasons for the missing data are not explained in the CS. The missing data as a
proportion of the number randomised ranges from 1.9% (1/53) in both arms of trial Res-5-
0010 to 20% (21/105) in the placebo arm of trial 3081. Across both arms of the pivotal trials
3082 and 3083 the proportion of missing data relative to the number randomised ranges
from 5.3% to 7.8%.
In all the trials improvements in FEV1 significantly favoured reslizumab over placebo, except
for trial 3084 where the mean difference was not statistically significant. However, this trial
included some patients with baseline blood eosinophil levels <400 per μL. When a subgroup
of patients with blood eosinophil levels ≥400 per μL was analysed in this trial (reslizumab
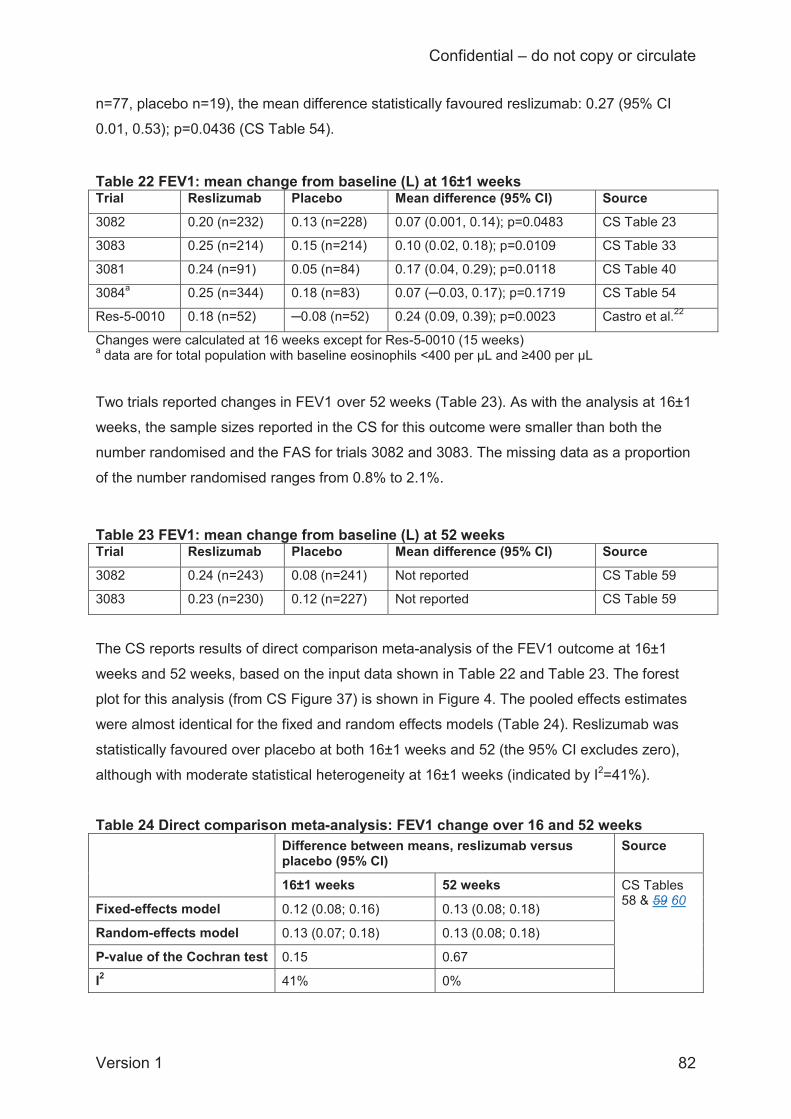
Confidential – do not copy or circulate
Version 1 82
n=77, placebo n=19), the mean difference statistically favoured reslizumab: 0.27 (95% CI
0.01, 0.53); p=0.0436 (CS Table 54).
Table 22 FEV1: mean change from baseline (L) at 16±1 weeks Trial Reslizumab Placebo Mean difference (95% CI) Source
3082 0.20 (n=232) 0.13 (n=228) 0.07 (0.001, 0.14); p=0.0483 CS Table 23
3083 0.25 (n=214) 0.15 (n=214) 0.10 (0.02, 0.18); p=0.0109 CS Table 33
3081 0.24 (n=91) 0.05 (n=84) 0.17 (0.04, 0.29); p=0.0118 CS Table 40
3084a 0.25 (n=344) 0.18 (n=83) 0.07 (─0.03, 0.17); p=0.1719 CS Table 54
Res-5-0010 0.18 (n=52) ─0.08 (n=52) 0.24 (0.09, 0.39); p=0.0023 Castro et al.22
Changes were calculated at 16 weeks except for Res-5-0010 (15 weeks) a data are for total population with baseline eosinophils <400 per μL and ≥400 per μL Two trials reported changes in FEV1 over 52 weeks (Table 23). As with the analysis at 16±1
weeks, the sample sizes reported in the CS for this outcome were smaller than both the
number randomised and the FAS for trials 3082 and 3083. The missing data as a proportion
of the number randomised ranges from 0.8% to 2.1%. Table 23 FEV1: mean change from baseline (L) at 52 weeks Trial Reslizumab Placebo Mean difference (95% CI) Source
3082 0.24 (n=243) 0.08 (n=241) Not reported CS Table 59
3083 0.23 (n=230) 0.12 (n=227) Not reported CS Table 59
The CS reports results of direct comparison meta-analysis of the FEV1 outcome at 16±1
weeks and 52 weeks, based on the input data shown in Table 22 and Table 23. The forest
plot for this analysis (from CS Figure 37) is shown in Figure 4. The pooled effects estimates
were almost identical for the fixed and random effects models (Table 24). Reslizumab was
statistically favoured over placebo at both 16±1 weeks and 52 (the 95% CI excludes zero),
although with moderate statistical heterogeneity at 16±1 weeks (indicated by I2=41%).
Table 24 Direct comparison meta-analysis: FEV1 change over 16 and 52 weeks Difference between means, reslizumab versus
placebo (95% CI) Source
16±1 weeks 52 weeks CS Tables 58 & 59 60 Fixed-effects model 0.12 (0.08; 0.16) 0.13 (0.08; 0.18)
Random-effects model 0.13 (0.07; 0.18) 0.13 (0.08; 0.18)
P-value of the Cochran test 0.15 0.67
I2 41% 0%
Confidential – do not copy or circulate
Version 1 83
CI, confidence interval; FEV1, forced expiratory volume in one second.
FE, fixed effects; RE, random effects
Figure 4 Forest plot for the change from baseline in FEV1 at 16±1 weeks Other lung function outcomes
The company did not meta-analyse any other lung function outcomes. However, the CS
presents trial results for changes in the % predicted FEV1 (indicative of age-normal forced
expiratory flow in one second), FVC (forced vital capacity), and FEF25-75% (average expiratory
flow rate at the middle part of forced expiration). We have summarised these outcomes
briefly below as they provide additional clinical information (the NICE scope does not specify
a focus on, or exclusion, of specific lung function outcomes). For all three of these outcomes
the sample sizes reported in the CS are smaller than the number randomised, but the CS
does not explain the missing data.
Information on the % predicted FEV1 change from baseline was available at 16±1 weeks
from five trials (Table 25) and at 52 weeks from two trials (Table 26), although the mean
difference at 16±1 weeks was not reported for two of the trials, and there were some
differences between the trials in the way the results were calculated. The improvement in %
predicted FEV1 consistently favoured reslizumab over placebo, both at the 16±1 week and
52 week assessments. However, according to clinical experts these changes are small and
not clinically meaningful.
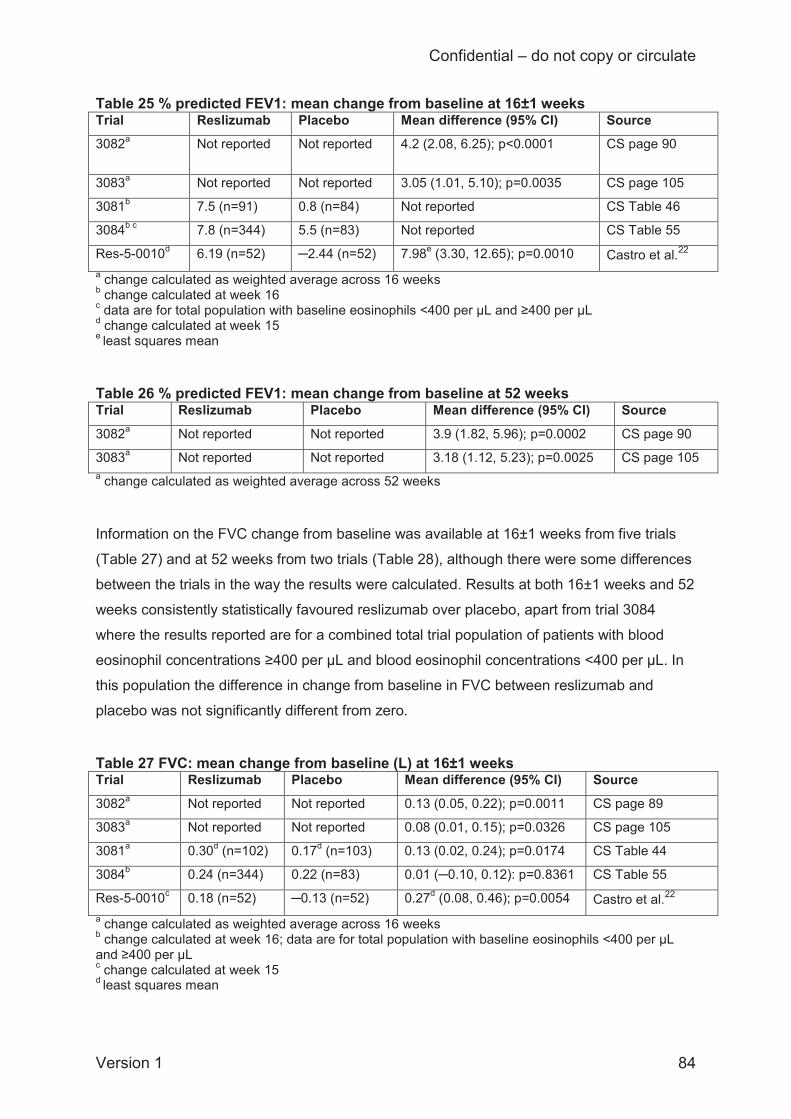
Confidential – do not copy or circulate
Version 1 84
Table 25 % predicted FEV1: mean change from baseline at 16±1 weeks Trial Reslizumab Placebo Mean difference (95% CI) Source 3082a Not reported Not reported 4.2 (2.08, 6.25); p<0.0001
CS page 90
3083a Not reported Not reported 3.05 (1.01, 5.10); p=0.0035 CS page 105
3081b 7.5 (n=91) 0.8 (n=84) Not reported CS Table 46
3084b c 7.8 (n=344) 5.5 (n=83) Not reported CS Table 55
Res-5-0010d 6.19 (n=52) ─2.44 (n=52) 7.98e (3.30, 12.65); p=0.0010 Castro et al.22 a change calculated as weighted average across 16 weeks b change calculated at week 16 c data are for total population with baseline eosinophils <400 per μL and ≥400 per μL d change calculated at week 15 e least squares mean Table 26 % predicted FEV1: mean change from baseline at 52 weeks Trial Reslizumab Placebo Mean difference (95% CI) Source
3082a Not reported Not reported 3.9 (1.82, 5.96); p=0.0002 CS page 90
3083a Not reported Not reported 3.18 (1.12, 5.23); p=0.0025 CS page 105 a change calculated as weighted average across 52 weeks Information on the FVC change from baseline was available at 16±1 weeks from five trials
(Table 27) and at 52 weeks from two trials (Table 28), although there were some differences
between the trials in the way the results were calculated. Results at both 16±1 weeks and 52
weeks consistently statistically favoured reslizumab over placebo, apart from trial 3084
where the results reported are for a combined total trial population of patients with blood
eosinophil concentrations ≥400 per μL and blood eosinophil concentrations <400 per μL. In
this population the difference in change from baseline in FVC between reslizumab and
placebo was not significantly different from zero. Table 27 FVC: mean change from baseline (L) at 16±1 weeks Trial Reslizumab Placebo Mean difference (95% CI) Source
3082a Not reported Not reported 0.13 (0.05, 0.22); p=0.0011 CS page 89
3083a Not reported Not reported 0.08 (0.01, 0.15); p=0.0326 CS page 105
3081a 0.30d (n=102) 0.17d (n=103) 0.13 (0.02, 0.24); p=0.0174 CS Table 44
3084b 0.24 (n=344) 0.22 (n=83) 0.01 (─0.10, 0.12): p=0.8361 CS Table 55
Res-5-0010c 0.18 (n=52) ─0.13 (n=52) 0.27d (0.08, 0.46); p=0.0054 Castro et al.22 a change calculated as weighted average across 16 weeks b change calculated at week 16; data are for total population with baseline eosinophils <400 per μL and ≥400 per μL c change calculated at week 15 d least squares mean
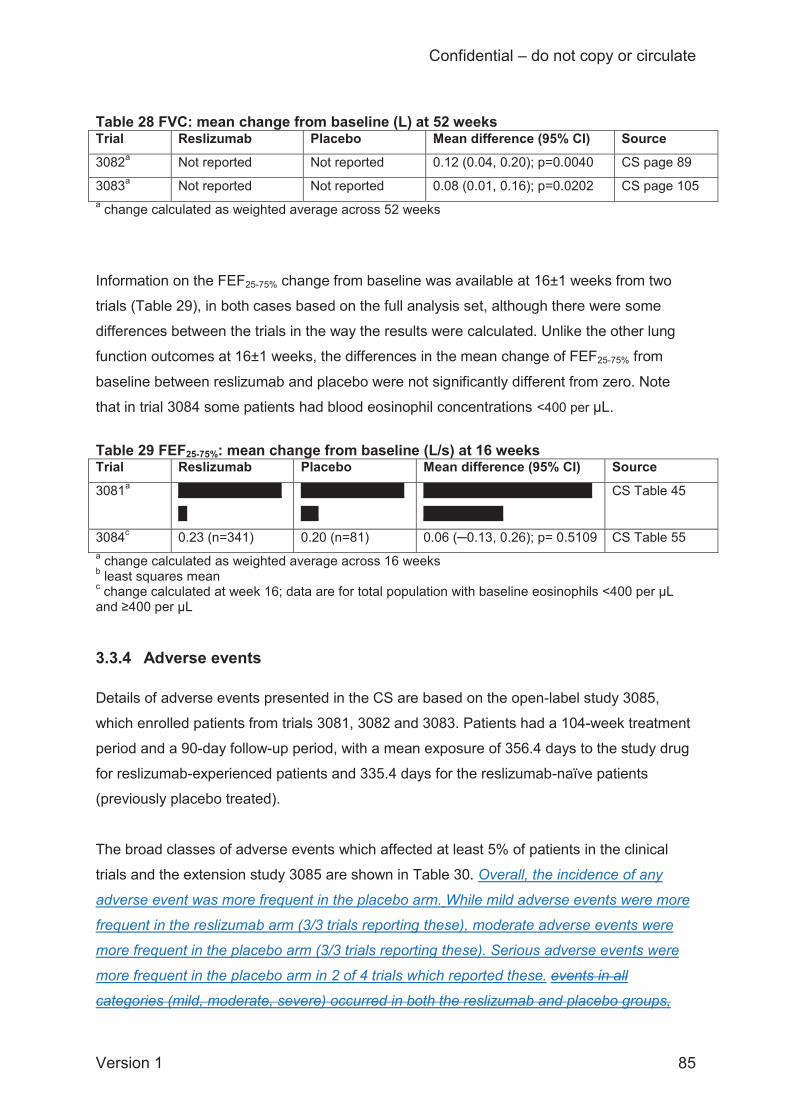
Confidential – do not copy or circulate
Version 1 85
Table 28 FVC: mean change from baseline (L) at 52 weeks Trial Reslizumab Placebo Mean difference (95% CI) Source 3082a Not reported Not reported 0.12 (0.04, 0.20); p=0.0040 CS page 89
3083a Not reported Not reported 0.08 (0.01, 0.16); p=0.0202 CS page 105 a change calculated as weighted average across 52 weeks Information on the FEF25-75% change from baseline was available at 16±1 weeks from two
trials (Table 29), in both cases based on the full analysis set, although there were some
differences between the trials in the way the results were calculated. Unlike the other lung
function outcomes at 16±1 weeks, the differences in the mean change of FEF25-75% from
baseline between reslizumab and placebo were not significantly different from zero. Note
that in trial 3084 some patients had blood eosinophil concentrations <400 per μL.
Table 29 FEF25-75%: mean change from baseline (L/s) at 16 weeks Trial Reslizumab Placebo Mean difference (95% CI) Source
3081a XXXXXXXXXXXX
X
XXXXXXXXXXXX
XX
XXXXXXXXXXXXXXXXXXX
XXXXXXXXX
CS Table 45
3084c 0.23 (n=341) 0.20 (n=81) 0.06 (─0.13, 0.26); p= 0.5109 CS Table 55 a change calculated as weighted average across 16 weeks b least squares mean c change calculated at week 16; data are for total population with baseline eosinophils <400 per μL and ≥400 per μL
3.3.4 Adverse events Details of adverse events presented in the CS are based on the open-label study 3085,
which enrolled patients from trials 3081, 3082 and 3083. Patients had a 104-week treatment
period and a 90-day follow-up period, with a mean exposure of 356.4 days to the study drug
for reslizumab-experienced patients and 335.4 days for the reslizumab-naïve patients
(previously placebo treated).
The broad classes of adverse events which affected at least 5% of patients in the clinical
trials and the extension study 3085 are shown in Table 30. Overall, the incidence of any
adverse event was more frequent in the placebo arm. While mild adverse events were more
frequent in the reslizumab arm (3/3 trials reporting these), moderate adverse events were
more frequent in the placebo arm (3/3 trials reporting these). Serious adverse events were
more frequent in the placebo arm in 2 of 4 trials which reported these. events in all
categories (mild, moderate, severe) occurred in both the reslizumab and placebo groups,
Confidential – do not copy or circulate
Version 1 86
with a tendency for most categories to be slightly more frequent in the reslizumab group.
Events classed as treatment-related were broadly similar in frequency in the reslizumab and
placebo groups. Only one death occurred during the randomised trials, in the placebo group
of trial 3082.
The types of adverse event that affected at least 5% of patients in either treatment group are
shown for the clinical trials and the extension study 3085 in Table 31. Blank cells in the table
indicate where data were not reported in the CS, and the pattern of data availability might be
suggestive of selective reporting of certain adverse events, e.g. sinusitis and upper
respiratory tract infection were relatively frequent in trial 3082 but not reported for trial 3083.
Overall, where reported, the individual types of adverse events occurred in similar
frequencies in the reslizumab and placebo groups and the only cases where a particular
type of adverse event was markedly more frequent in the reslizumab group than the placebo
group were for upper respiratory infection in trial 3082 (16% versus 13%) and headache,
both in trial 3083 (14% versus 7%) and trial 3081 (11% versus 6%).
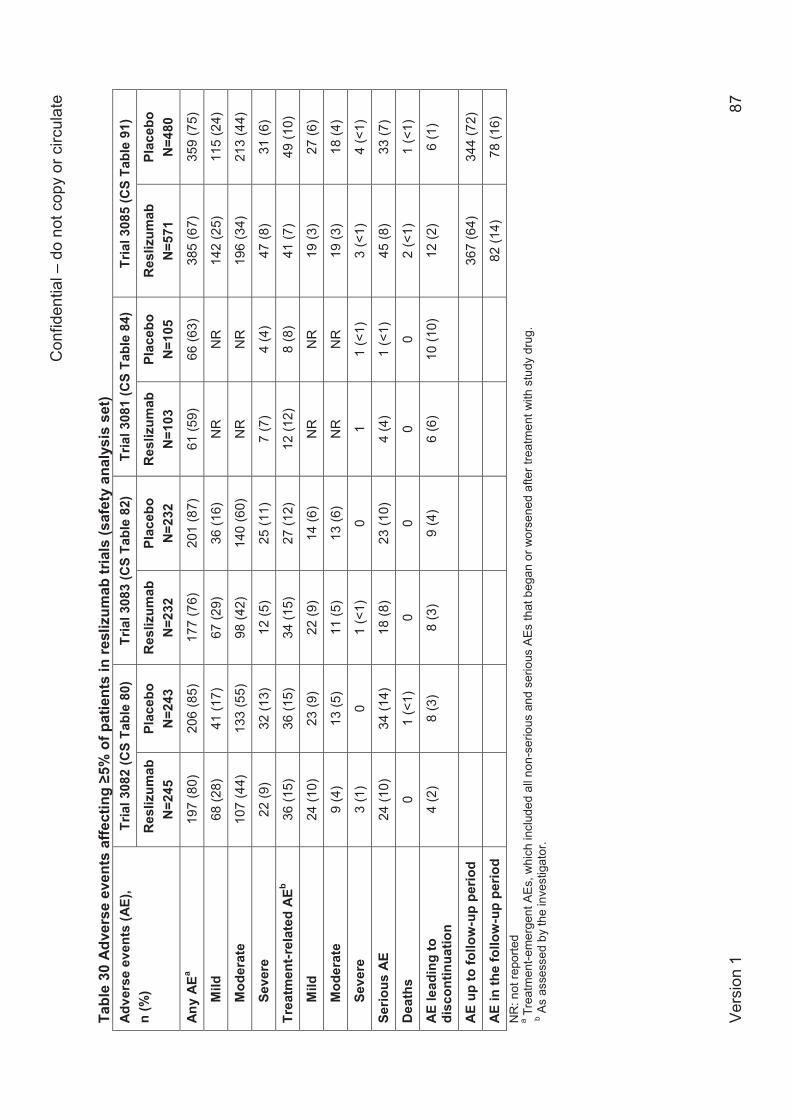
Con
fiden
tial –
do
not c
opy
or c
ircul
ate
Vers
ion
1 87
Tabl
e 30
Adv
erse
eve
nts
affe
ctin
g ≥5
% o
f pat
ient
s in
resl
izum
ab tr
ials
(saf
ety
anal
ysis
set
) Ad
vers
e ev
ents
(AE)
, n
(%)
Tria
l 308
2 (C
S Ta
ble
80)
Tria
l 308
3 (C
S Ta
ble
82)
Tria
l 308
1 (C
S Ta
ble
84)
Tria
l 308
5 (C
S Ta
ble
91)
Res
lizum
ab
N=2
45
Plac
ebo
N=2
43
Res
lizum
ab
N=2
32
Plac
ebo
N=2
32
Res
lizum
ab
N=1
03
Plac
ebo
N=1
05
Res
lizum
ab
N=5
71
Plac
ebo
N=4
80
Any
AEa
197
(80)
20
6 (8
5)
177
(76)
20
1 (8
7)
61 (5
9)
66 (6
3)
385
(67)
35
9 (7
5)
Mild
68
(28)
41
(17)
67
(29)
36
(16)
N
R
NR
14
2 (2
5)
115
(24)
Mod
erat
e 10
7 (4
4)
133
(55)
98
(42)
14
0 (6
0)
NR
N
R
196
(34)
21
3 (4
4)
Seve
re
22 (9
) 32
(13)
12
(5)
25 (1
1)
7 (7
) 4
(4)
47 (8
) 31
(6)
Trea
tmen
t-rel
ated
AEb
36 (1
5)
36 (1
5)
34 (1
5)
27 (1
2)
12 (1
2)
8 (8
) 41
(7)
49 (1
0)
Mild
24
(10)
23
(9)
22 (9
) 14
(6)
NR
N
R
19 (3
) 27
(6)
Mod
erat
e 9
(4)
13 (5
) 11
(5)
13 (6
) N
R
NR
19
(3)
18 (4
)
Seve
re
3 (1
) 0
1 (<
1)
0 1
1 (<
1)
3 (<
1)
4 (<
1)
Serio
us A
E 24
(10)
34
(14)
18
(8)
23 (1
0)
4 (4
) 1
(<1)
45
(8)
33 (7
)
Dea
ths
0 1
(<1)
0
0 0
0 2
(<1)
1
(<1)
AE le
adin
g to
di
scon
tinua
tion
4 (2
) 8
(3)
8 (3
) 9
(4)
6 (6
) 10
(10)
12
(2)
6 (1
)
AE u
p to
follo
w-u
p pe
riod
367
(64)
34
4 (7
2)
AE in
the
follo
w-u
p pe
riod
82 (1
4)
78 (1
6)
NR
: not
repo
rted
a Tre
atm
ent-e
mer
gent
AEs
, whi
ch in
clud
ed a
ll no
n-se
rious
and
ser
ious
AEs
that
beg
an o
r wor
sene
d af
ter t
reat
men
t with
stu
dy d
rug.
b
As
asse
ssed
by
the
inve
stig
ator
.
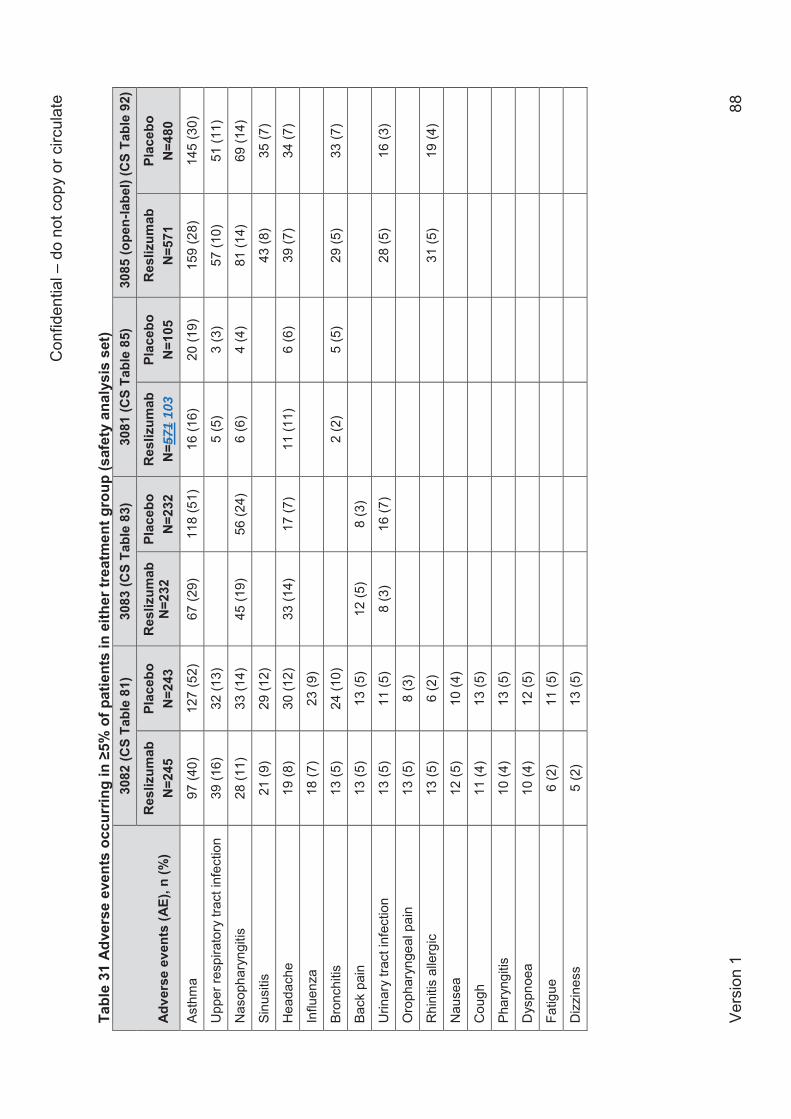
Con
fiden
tial –
do
not c
opy
or c
ircul
ate
Vers
ion
1 88
Tabl
e 31
Adv
erse
eve
nts
occu
rrin
g in
≥5%
of p
atie
nts
in e
ither
trea
tmen
t gro
up (s
afet
y an
alys
is s
et)
Adve
rse
even
ts (A
E), n
(%)
3082
(CS
Tabl
e 81
) 30
83 (C
S Ta
ble
83)
3081
(CS
Tabl
e 85
) 30
85 (o
pen-
labe
l) (C
S Ta
ble
92)
Res
lizum
ab
N=2
45
Plac
ebo
N=2
43
Res
lizum
ab
N=2
32
Plac
ebo
N=2
32
Res
lizum
ab
N=5
71 1
03
Plac
ebo
N=1
05
Res
lizum
ab
N=5
71
Plac
ebo
N=4
80
Asth
ma
97 (4
0)
127
(52)
67
(29)
11
8 (5
1)
16 (1
6)
20 (1
9)
159
(28)
14
5 (3
0)
Upp
er re
spira
tory
trac
t inf
ectio
n 39
(16)
32
(13)
5
(5)
3 (3
) 57
(10)
51
(11)
Nas
opha
ryng
itis
28 (1
1)
33 (1
4)
45 (1
9)
56 (2
4)
6 (6
) 4
(4)
81 (1
4)
69 (1
4)
Sinu
sitis
21
(9)
29 (1
2)
43 (8
) 35
(7)
Hea
dach
e 19
(8)
30 (1
2)
33 (1
4)
17 (7
) 11
(11)
6
(6)
39 (7
) 34
(7)
Influ
enza
18
(7)
23 (9
)
Bron
chiti
s 13
(5)
24 (1
0)
2 (2
) 5
(5)
29 (5
) 33
(7)
Back
pai
n 13
(5)
13 (5
) 12
(5)
8 (3
)
Urin
ary
tract
infe
ctio
n 13
(5)
11 (5
) 8
(3)
16 (7
)
28
(5)
16 (3
)
Oro
phar
ynge
al p
ain
13 (5
) 8
(3)
Rhi
nitis
alle
rgic
13
(5)
6 (2
)
31
(5)
19 (4
)
Nau
sea
12 (5
) 10
(4)
Cou
gh
11 (4
) 13
(5)
Phar
yngi
tis
10 (4
) 13
(5)
Dys
pnoe
a 10
(4)
12 (5
)
Fatig
ue
6 (2
) 11
(5)
Diz
zine
ss
5 (2
) 13
(5)
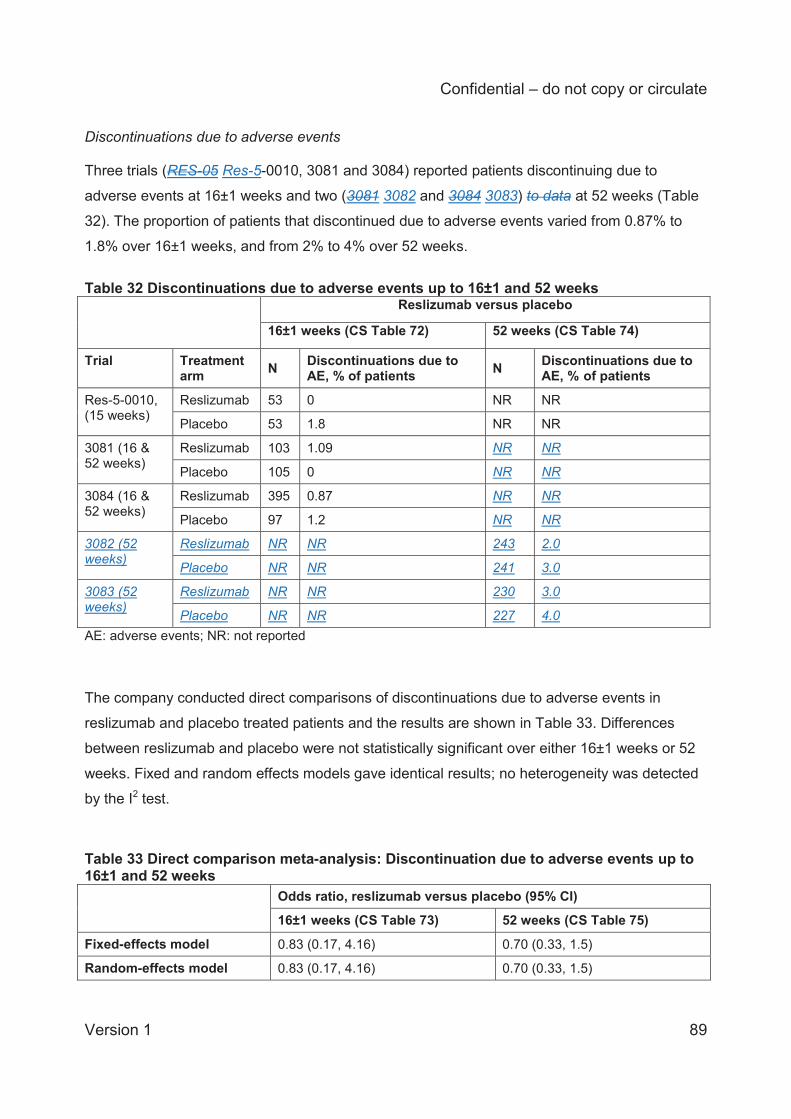
Confidential – do not copy or circulate
Version 1 89
Discontinuations due to adverse events Three trials (RES-05 Res-5-0010, 3081 and 3084) reported patients discontinuing due to
adverse events at 16±1 weeks and two (3081 3082 and 3084 3083) to data at 52 weeks (Table
32). The proportion of patients that discontinued due to adverse events varied from 0.87% to
1.8% over 16±1 weeks, and from 2% to 4% over 52 weeks.
Table 32 Discontinuations due to adverse events up to 16±1 and 52 weeks Reslizumab versus placebo
16±1 weeks (CS Table 72) 52 weeks (CS Table 74)
Trial Treatment arm N Discontinuations due to
AE, % of patients N Discontinuations due to AE, % of patients
Res-5-0010, (15 weeks)
Reslizumab 53 0 NR NR
Placebo 53 1.8 NR NR
3081 (16 & 52 weeks)
Reslizumab 103 1.09 NR NR
Placebo 105 0 NR NR
3084 (16 & 52 weeks)
Reslizumab 395 0.87 NR NR
Placebo 97 1.2 NR NR
3082 (52 weeks)
Reslizumab NR NR 243 2.0
Placebo NR NR 241 3.0
3083 (52 weeks)
Reslizumab NR NR 230 3.0
Placebo NR NR 227 4.0 AE: adverse events; NR: not reported
The company conducted direct comparisons of discontinuations due to adverse events in
reslizumab and placebo treated patients and the results are shown in Table 33. Differences
between reslizumab and placebo were not statistically significant over either 16±1 weeks or 52
weeks. Fixed and random effects models gave identical results; no heterogeneity was detected
by the I2 test.
Table 33 Direct comparison meta-analysis: Discontinuation due to adverse events up to 16±1 and 52 weeks Odds ratio, reslizumab versus placebo (95% CI)
16±1 weeks (CS Table 73) 52 weeks (CS Table 75)
Fixed-effects model 0.83 (0.17, 4.16) 0.70 (0.33, 1.5)
Random-effects model 0.83 (0.17, 4.16) 0.70 (0.33, 1.5)
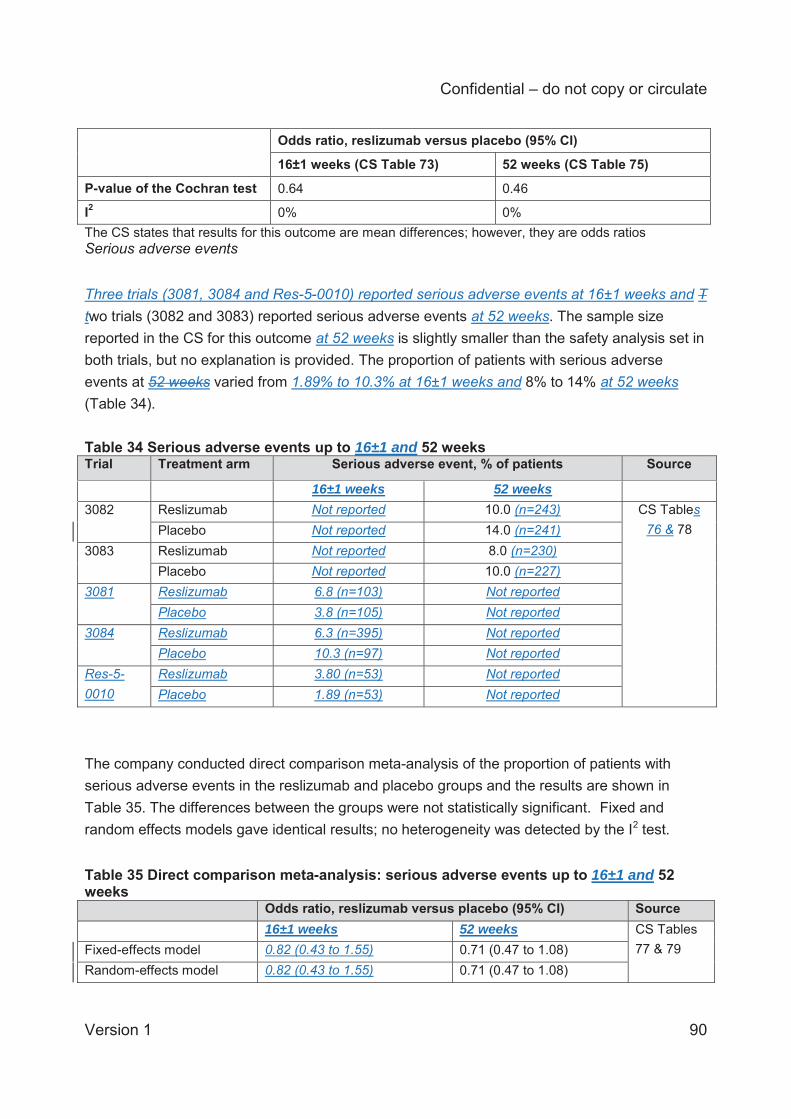
Confidential – do not copy or circulate
Version 1 90
Odds ratio, reslizumab versus placebo (95% CI)
16±1 weeks (CS Table 73) 52 weeks (CS Table 75)
P-value of the Cochran test 0.64 0.46
I2 0% 0% The CS states that results for this outcome are mean differences; however, they are odds ratios Serious adverse events Three trials (3081, 3084 and Res-5-0010) reported serious adverse events at 16±1 weeks and T two trials (3082 and 3083) reported serious adverse events at 52 weeks. The sample size reported in the CS for this outcome at 52 weeks is slightly smaller than the safety analysis set in both trials, but no explanation is provided. The proportion of patients with serious adverse events at 52 weeks varied from 1.89% to 10.3% at 16±1 weeks and 8% to 14% at 52 weeks (Table 34). Table 34 Serious adverse events up to 16±1 and 52 weeks Trial Treatment arm Serious adverse event, % of patients Source
16±1 weeks 52 weeks 3082 Reslizumab Not reported 10.0 (n=243) CS Tables
76 & 78 Placebo Not reported 14.0 (n=241) 3083 Reslizumab Not reported 8.0 (n=230)
Placebo Not reported 10.0 (n=227) 3081 Reslizumab 6.8 (n=103) Not reported
Placebo 3.8 (n=105) Not reported 3084 Reslizumab 6.3 (n=395) Not reported
Placebo 10.3 (n=97) Not reported Res-5-0010
Reslizumab 3.80 (n=53) Not reported Placebo 1.89 (n=53) Not reported
The company conducted direct comparison meta-analysis of the proportion of patients with serious adverse events in the reslizumab and placebo groups and the results are shown in Table 35. The differences between the groups were not statistically significant. Fixed and random effects models gave identical results; no heterogeneity was detected by the I2 test. Table 35 Direct comparison meta-analysis: serious adverse events up to 16±1 and 52 weeks Odds ratio, reslizumab versus placebo (95% CI) Source 16±1 weeks 52 weeks CS Tables
77 & 79 Fixed-effects model 0.82 (0.43 to 1.55) 0.71 (0.47 to 1.08) Random-effects model 0.82 (0.43 to 1.55) 0.71 (0.47 to 1.08)
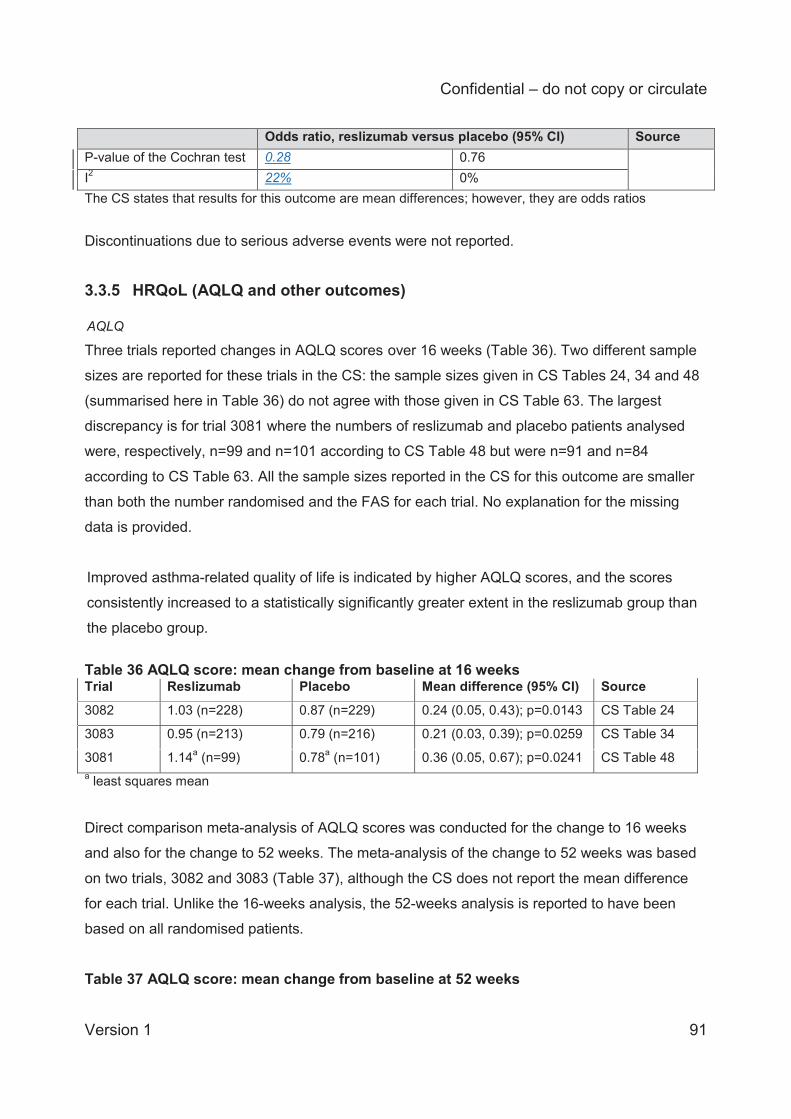
Confidential – do not copy or circulate
Version 1 91
Odds ratio, reslizumab versus placebo (95% CI) Source P-value of the Cochran test 0.28 0.76 I2 22% 0% The CS states that results for this outcome are mean differences; however, they are odds ratios Discontinuations due to serious adverse events were not reported.
3.3.5 HRQoL (AQLQ and other outcomes) AQLQ
Three trials reported changes in AQLQ scores over 16 weeks (Table 36). Two different sample
sizes are reported for these trials in the CS: the sample sizes given in CS Tables 24, 34 and 48
(summarised here in Table 36) do not agree with those given in CS Table 63. The largest
discrepancy is for trial 3081 where the numbers of reslizumab and placebo patients analysed
were, respectively, n=99 and n=101 according to CS Table 48 but were n=91 and n=84
according to CS Table 63. All the sample sizes reported in the CS for this outcome are smaller
than both the number randomised and the FAS for each trial. No explanation for the missing
data is provided.
Improved asthma-related quality of life is indicated by higher AQLQ scores, and the scores
consistently increased to a statistically significantly greater extent in the reslizumab group than
the placebo group.
Table 36 AQLQ score: mean change from baseline at 16 weeks Trial Reslizumab Placebo Mean difference (95% CI) Source
3082 1.03 (n=228) 0.87 (n=229) 0.24 (0.05, 0.43); p=0.0143 CS Table 24
3083 0.95 (n=213) 0.79 (n=216) 0.21 (0.03, 0.39); p=0.0259 CS Table 34
3081 1.14a (n=99) 0.78a (n=101) 0.36 (0.05, 0.67); p=0.0241 CS Table 48 a least squares mean Direct comparison meta-analysis of AQLQ scores was conducted for the change to 16 weeks
and also for the change to 52 weeks. The meta-analysis of the change to 52 weeks was based
on two trials, 3082 and 3083 (Table 37), although the CS does not report the mean difference
for each trial. Unlike the 16-weeks analysis, the 52-weeks analysis is reported to have been
based on all randomised patients.
Table 37 AQLQ score: mean change from baseline at 52 weeks
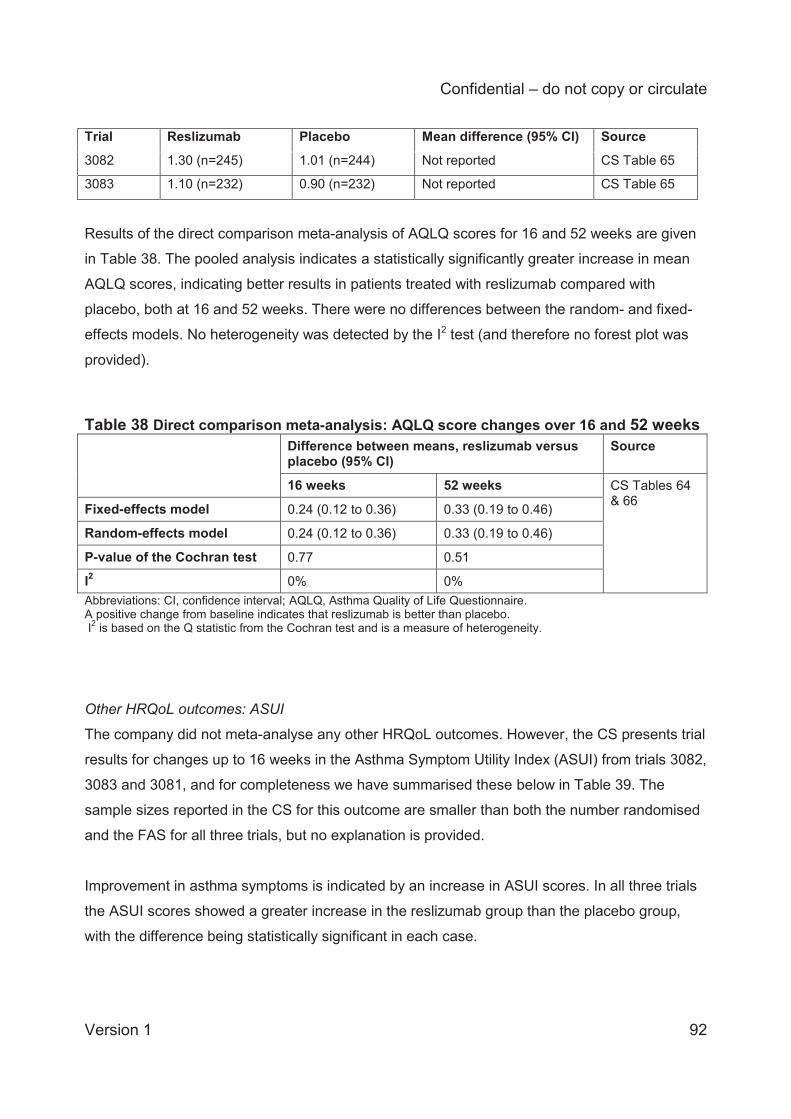
Confidential – do not copy or circulate
Version 1 92
Trial Reslizumab Placebo Mean difference (95% CI) Source
3082 1.30 (n=245) 1.01 (n=244) Not reported CS Table 65
3083 1.10 (n=232) 0.90 (n=232) Not reported CS Table 65
Results of the direct comparison meta-analysis of AQLQ scores for 16 and 52 weeks are given
in Table 38. The pooled analysis indicates a statistically significantly greater increase in mean
AQLQ scores, indicating better results in patients treated with reslizumab compared with
placebo, both at 16 and 52 weeks. There were no differences between the random- and fixed-
effects models. No heterogeneity was detected by the I2 test (and therefore no forest plot was
provided).
Table 38 Direct comparison meta-analysis: AQLQ score changes over 16 and 52 weeks Difference between means, reslizumab versus
placebo (95% CI) Source
16 weeks 52 weeks CS Tables 64 & 66 Fixed-effects model 0.24 (0.12 to 0.36) 0.33 (0.19 to 0.46)
Random-effects model 0.24 (0.12 to 0.36) 0.33 (0.19 to 0.46)
P-value of the Cochran test 0.77 0.51
I2 0% 0% Abbreviations: CI, confidence interval; AQLQ, Asthma Quality of Life Questionnaire. A positive change from baseline indicates that reslizumab is better than placebo. I2 is based on the Q statistic from the Cochran test and is a measure of heterogeneity. Other HRQoL outcomes: ASUI
The company did not meta-analyse any other HRQoL outcomes. However, the CS presents trial
results for changes up to 16 weeks in the Asthma Symptom Utility Index (ASUI) from trials 3082,
3083 and 3081, and for completeness we have summarised these below in Table 39. The
sample sizes reported in the CS for this outcome are smaller than both the number randomised
and the FAS for all three trials, but no explanation is provided.
Improvement in asthma symptoms is indicated by an increase in ASUI scores. In all three trials
the ASUI scores showed a greater increase in the reslizumab group than the placebo group,
with the difference being statistically significant in each case.
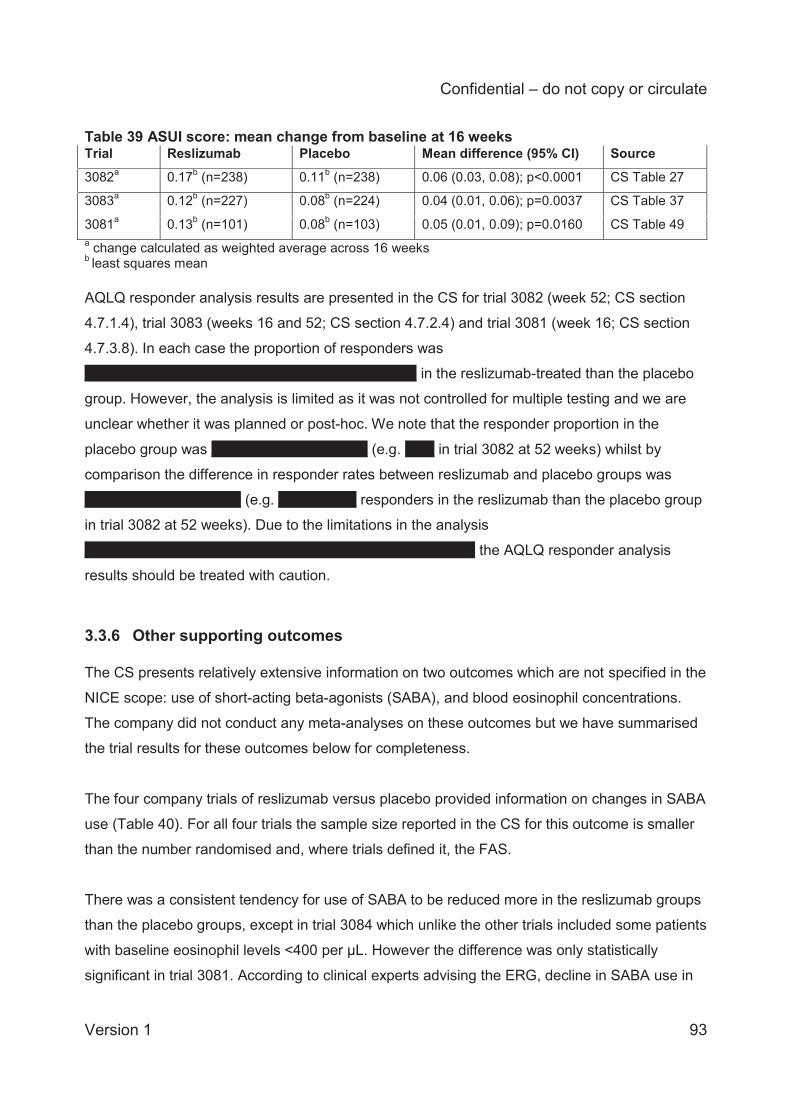
Confidential – do not copy or circulate
Version 1 93
Table 39 ASUI score: mean change from baseline at 16 weeks Trial Reslizumab Placebo Mean difference (95% CI) Source 3082a 0.17b (n=238) 0.11b (n=238) 0.06 (0.03, 0.08); p<0.0001 CS Table 27
3083a 0.12b (n=227) 0.08b (n=224) 0.04 (0.01, 0.06); p=0.0037 CS Table 37
3081a 0.13b (n=101) 0.08b (n=103) 0.05 (0.01, 0.09); p=0.0160 CS Table 49 a change calculated as weighted average across 16 weeks b least squares mean AQLQ responder analysis results are presented in the CS for trial 3082 (week 52; CS section
4.7.1.4), trial 3083 (weeks 16 and 52; CS section 4.7.2.4) and trial 3081 (week 16; CS section
4.7.3.8). In each case the proportion of responders was
XXXXXXXXXXXXXXXXXXXXXXXXXXXXXXXXXX in the reslizumab-treated than the placebo
group. However, the analysis is limited as it was not controlled for multiple testing and we are
unclear whether it was planned or post-hoc. We note that the responder proportion in the
placebo group was XXXXXXXXXXXXXXXX (e.g. XXX in trial 3082 at 52 weeks) whilst by
comparison the difference in responder rates between reslizumab and placebo groups was
XXXXXXXXXXXXXXXX (e.g. XXXXXXXX responders in the reslizumab than the placebo group
in trial 3082 at 52 weeks). Due to the limitations in the analysis
XXXXXXXXXXXXXXXXXXXXXXXXXXXXXXXXXXXXXXXX the AQLQ responder analysis
results should be treated with caution.
3.3.6 Other supporting outcomes The CS presents relatively extensive information on two outcomes which are not specified in the
NICE scope: use of short-acting beta-agonists (SABA), and blood eosinophil concentrations.
The company did not conduct any meta-analyses on these outcomes but we have summarised
the trial results for these outcomes below for completeness.
The four company trials of reslizumab versus placebo provided information on changes in SABA
use (Table 40). For all four trials the sample size reported in the CS for this outcome is smaller
than the number randomised and, where trials defined it, the FAS.
There was a consistent tendency for use of SABA to be reduced more in the reslizumab groups
than the placebo groups, except in trial 3084 which unlike the other trials included some patients
with baseline eosinophil levels <400 per μL. However the difference was only statistically
significant in trial 3081. According to clinical experts advising the ERG, decline in SABA use in
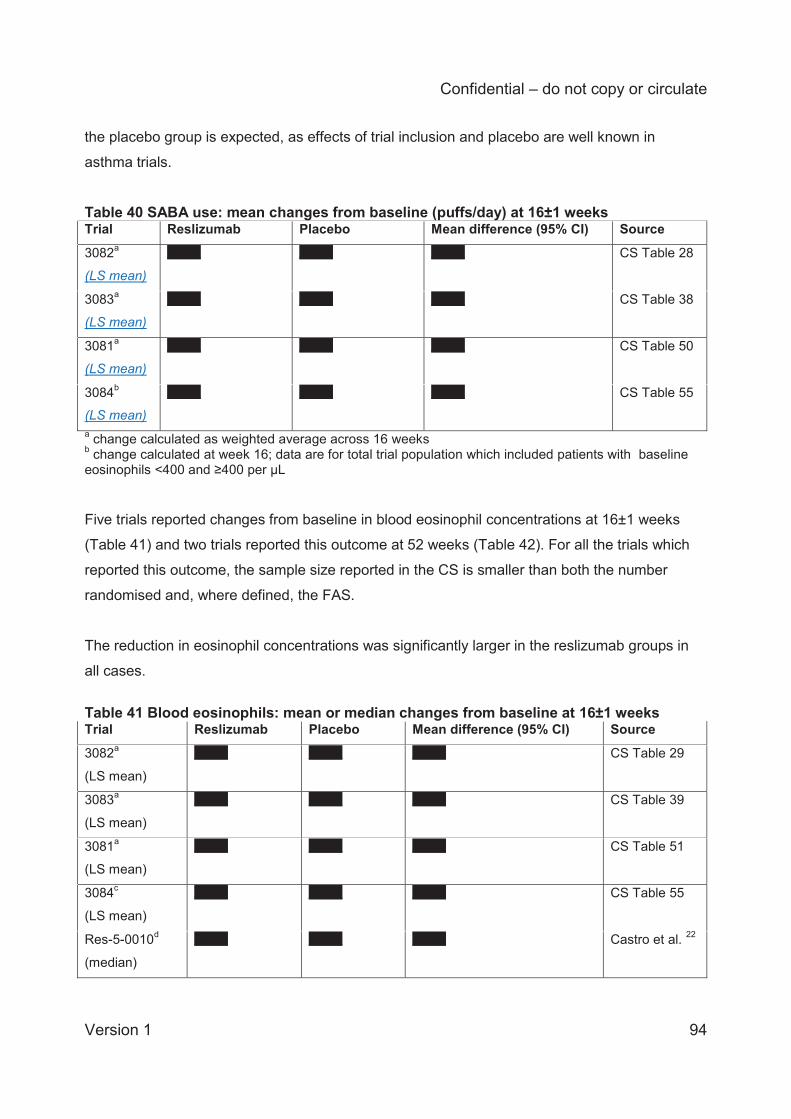
Confidential – do not copy or circulate
Version 1 94
the placebo group is expected, as effects of trial inclusion and placebo are well known in
asthma trials.
Table 40 SABA use: mean changes from baseline (puffs/day) at 16±1 weeks Trial Reslizumab Placebo Mean difference (95% CI) Source
3082a
(LS mean)
XXXX XXXX XXXX CS Table 28
3083a
(LS mean)
XXXX XXXX XXXX CS Table 38
3081a
(LS mean)
XXXX XXXX XXXX CS Table 50
3084b
(LS mean)
XXXX XXXX XXXX CS Table 55
a change calculated as weighted average across 16 weeks b change calculated at week 16; data are for total trial population which included patients with baseline eosinophils <400 and ≥400 per μL Five trials reported changes from baseline in blood eosinophil concentrations at 16±1 weeks
(Table 41) and two trials reported this outcome at 52 weeks (Table 42). For all the trials which
reported this outcome, the sample size reported in the CS is smaller than both the number
randomised and, where defined, the FAS.
The reduction in eosinophil concentrations was significantly larger in the reslizumab groups in
all cases.
Table 41 Blood eosinophils: mean or median changes from baseline at 16±1 weeks Trial Reslizumab Placebo Mean difference (95% CI) Source
3082a
(LS mean)
XXXX XXXX XXXX CS Table 29
3083a
(LS mean)
XXXX XXXX XXXX CS Table 39
3081a
(LS mean)
XXXX XXXX XXXX CS Table 51
3084c
(LS mean)
XXXX XXXX XXXX CS Table 55
Res-5-0010d
(median)
XXXX XXXX XXXX Castro et al. 22
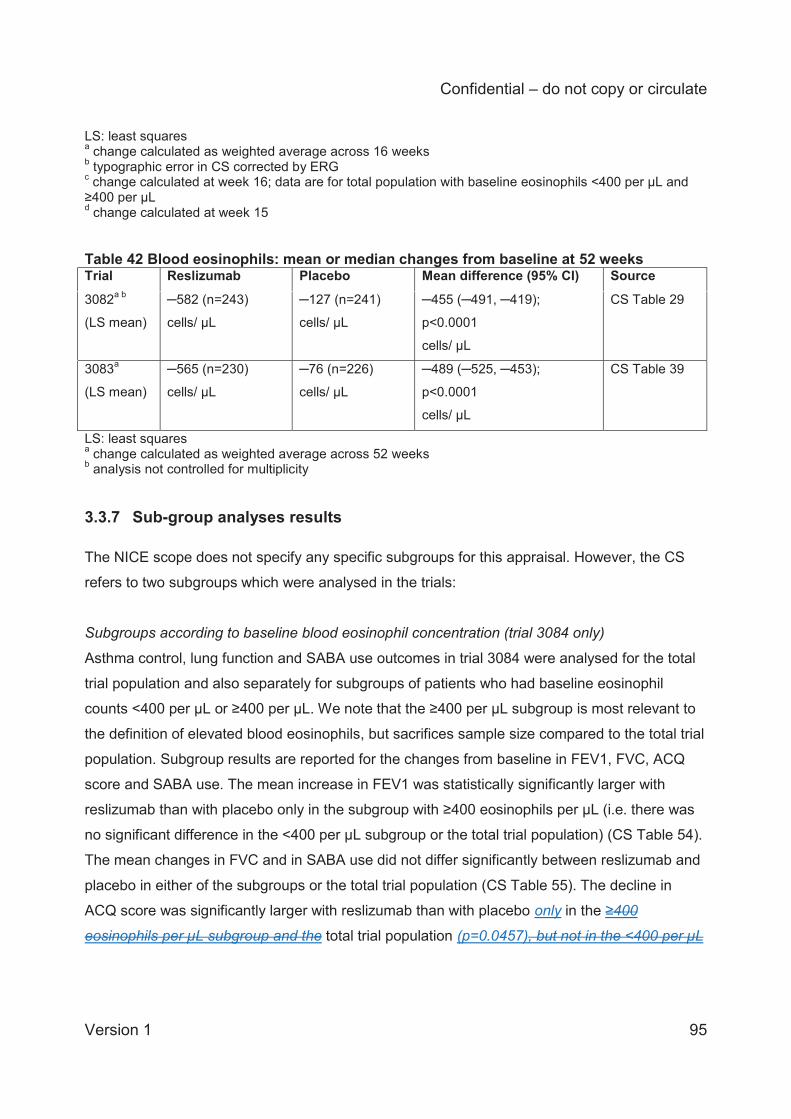
Confidential – do not copy or circulate
Version 1 95
LS: least squares a change calculated as weighted average across 16 weeks b typographic error in CS corrected by ERG c change calculated at week 16; data are for total population with baseline eosinophils <400 per μL and ≥400 per μL d change calculated at week 15 Table 42 Blood eosinophils: mean or median changes from baseline at 52 weeks Trial Reslizumab Placebo Mean difference (95% CI) Source
3082a b
(LS mean)
─582 (n=243)
cells/ μL
─127 (n=241)
cells/ μL
─455 (─491, ─419);
p<0.0001
cells/ μL
CS Table 29
3083a
(LS mean)
─565 (n=230)
cells/ μL
─76 (n=226)
cells/ μL
─489 (─525, ─453);
p<0.0001
cells/ μL
CS Table 39
LS: least squares a change calculated as weighted average across 52 weeks b analysis not controlled for multiplicity
3.3.7 Sub-group analyses results The NICE scope does not specify any specific subgroups for this appraisal. However, the CS
refers to two subgroups which were analysed in the trials:
Subgroups according to baseline blood eosinophil concentration (trial 3084 only)
Asthma control, lung function and SABA use outcomes in trial 3084 were analysed for the total
trial population and also separately for subgroups of patients who had baseline eosinophil
counts <400 per μL or ≥400 per μL. We note that the ≥400 per μL subgroup is most relevant to
the definition of elevated blood eosinophils, but sacrifices sample size compared to the total trial
population. Subgroup results are reported for the changes from baseline in FEV1, FVC, ACQ
score and SABA use. The mean increase in FEV1 was statistically significantly larger with
reslizumab than with placebo only in the subgroup with ≥400 eosinophils per μL (i.e. there was
no significant difference in the <400 per μL subgroup or the total trial population) (CS Table 54).
The mean changes in FVC and in SABA use did not differ significantly between reslizumab and
placebo in either of the subgroups or the total trial population (CS Table 55). The decline in
ACQ score was significantly larger with reslizumab than with placebo only in the ≥400
eosinophils per μL subgroup and the total trial population (p=0.0457), but not in the <400 per μL
Confidential – do not copy or circulate
Version 1 96
subgroup (CS Table 55). A limitation of these findings, however, according to the trial
publication,21 is that the trial was not powered statistically for these subgroup analyses.
‘FEV1 analysis set’ (trials 3082, 3083, 3081)
This refers to analysis of the change from baseline in FEV1 in a subset of patients who had a %
predicted FEV1 at baseline of ≤85%, i.e. patients with more severe asthma. In trial 3082 the
company conducted analyses “to” 16 weeks and “over” 16 weeks (for interpretation see section
3.1.6) and these gave different results (CS section 4.7.1.3): the first analysis gave a non-
significant difference in the change from baseline of 0.07 L between reslizumab and placebo
(p=0.0834), whilst the second analysis gave a statistically significant difference of 0.14 L
(p<0.0001). In trial 3083 the same two analyses were conducted and both gave statistically
significant differences favouring reslizumab over placebo (CS section 4.7.2.3): the difference in
mean change “to” 16 weeks was 0.13 L (p=0.0040)whist the difference in change “over” 16
weeks was 0.11 L (p=0.0033). In trial 3081 only an analysis “over” 16 weeks is reported and this
statistically significantly favoured reslizumab compared to placebo (CS section 4.7.3.2), with the
difference in change from baseline being 0.17 L p=0.0066) (CS Table 43). As stated in the CS,
a limitation of these findings is that the trials were not powered statistically for these subgroup
analyses.
The CS (section 4.8) also mentions a subgroup analysis of CAE rates in adult patients at GINA
steps 4 and 5 (i.e. excluding young people aged <18) which classified patients according to
whether or not they were on oral corticosteroids at baseline. The data source appears to be
from several pooled trials but this is not explicitly stated and the subgroup sizes are not reported
in the CS. This analysis is not discussed in the current report.
3.4 Indirect treatment comparison results: reslizumab versus omalizumab The CS reports an indirect treatment comparison (ITC) for seven outcomes. These are one lung
function outcome (change in FEV1), one asthma control outcome (change in ACQ score), one
HRQoL outcome (change in AQLQ score), two exacerbations outcomes (frequency of clinically
significant exacerbations, and patient hospitalisations due to exacerbations), and two adverse
events outcomes (discontinuations due to adverse events, and serious adverse events)
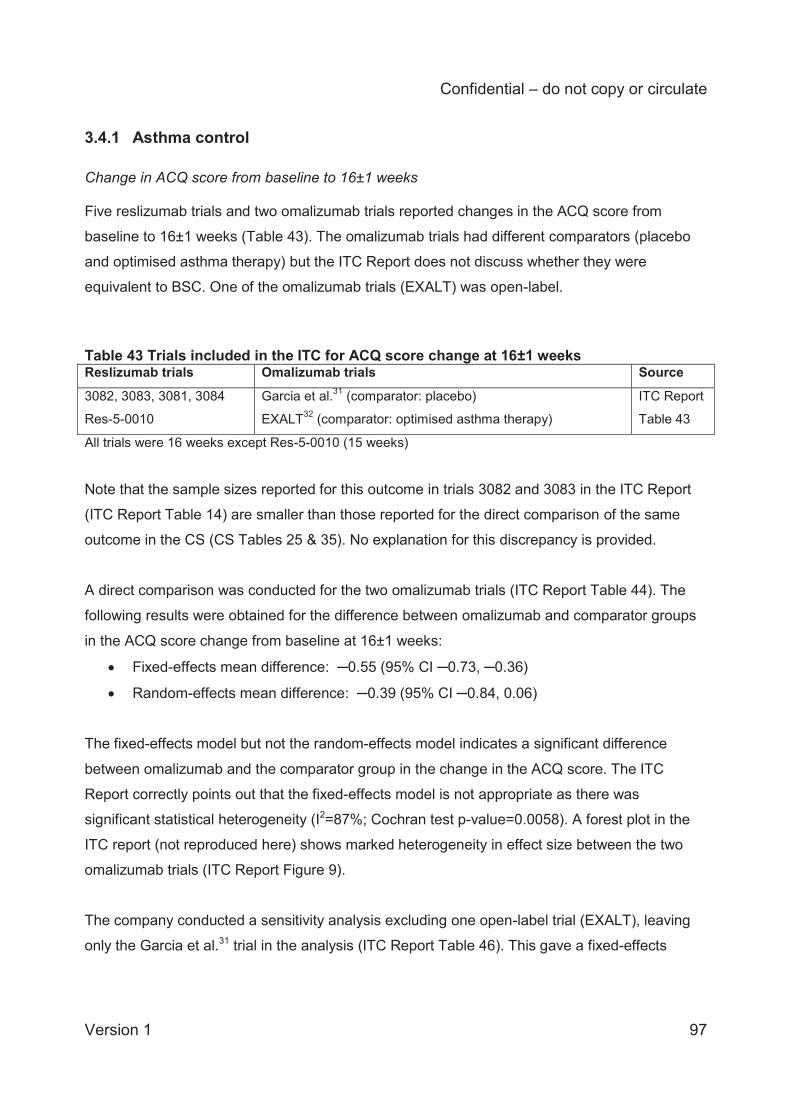
Confidential – do not copy or circulate
Version 1 97
3.4.1 Asthma control Change in ACQ score from baseline to 16±1 weeks Five reslizumab trials and two omalizumab trials reported changes in the ACQ score from
baseline to 16±1 weeks (Table 43). The omalizumab trials had different comparators (placebo
and optimised asthma therapy) but the ITC Report does not discuss whether they were
equivalent to BSC. One of the omalizumab trials (EXALT) was open-label.
Table 43 Trials included in the ITC for ACQ score change at 16±1 weeks Reslizumab trials Omalizumab trials Source
3082, 3083, 3081, 3084
Res-5-0010
Garcia et al.31 (comparator: placebo)
EXALT32 (comparator: optimised asthma therapy)
ITC Report
Table 43
All trials were 16 weeks except Res-5-0010 (15 weeks) Note that the sample sizes reported for this outcome in trials 3082 and 3083 in the ITC Report
(ITC Report Table 14) are smaller than those reported for the direct comparison of the same
outcome in the CS (CS Tables 25 & 35). No explanation for this discrepancy is provided.
A direct comparison was conducted for the two omalizumab trials (ITC Report Table 44). The
following results were obtained for the difference between omalizumab and comparator groups
in the ACQ score change from baseline at 16±1 weeks:
Fixed-effects mean difference: ─0.55 (95% CI ─0.73, ─0.36)
Random-effects mean difference: ─0.39 (95% CI ─0.84, 0.06)
The fixed-effects model but not the random-effects model indicates a significant difference
between omalizumab and the comparator group in the change in the ACQ score. The ITC
Report correctly points out that the fixed-effects model is not appropriate as there was
significant statistical heterogeneity (I2=87%; Cochran test p-value=0.0058). A forest plot in the
ITC report (not reproduced here) shows marked heterogeneity in effect size between the two
omalizumab trials (ITC Report Figure 9).
The company conducted a sensitivity analysis excluding one open-label trial (EXALT), leaving
only the Garcia et al.31 trial in the analysis (ITC Report Table 46). This gave a fixed-effects
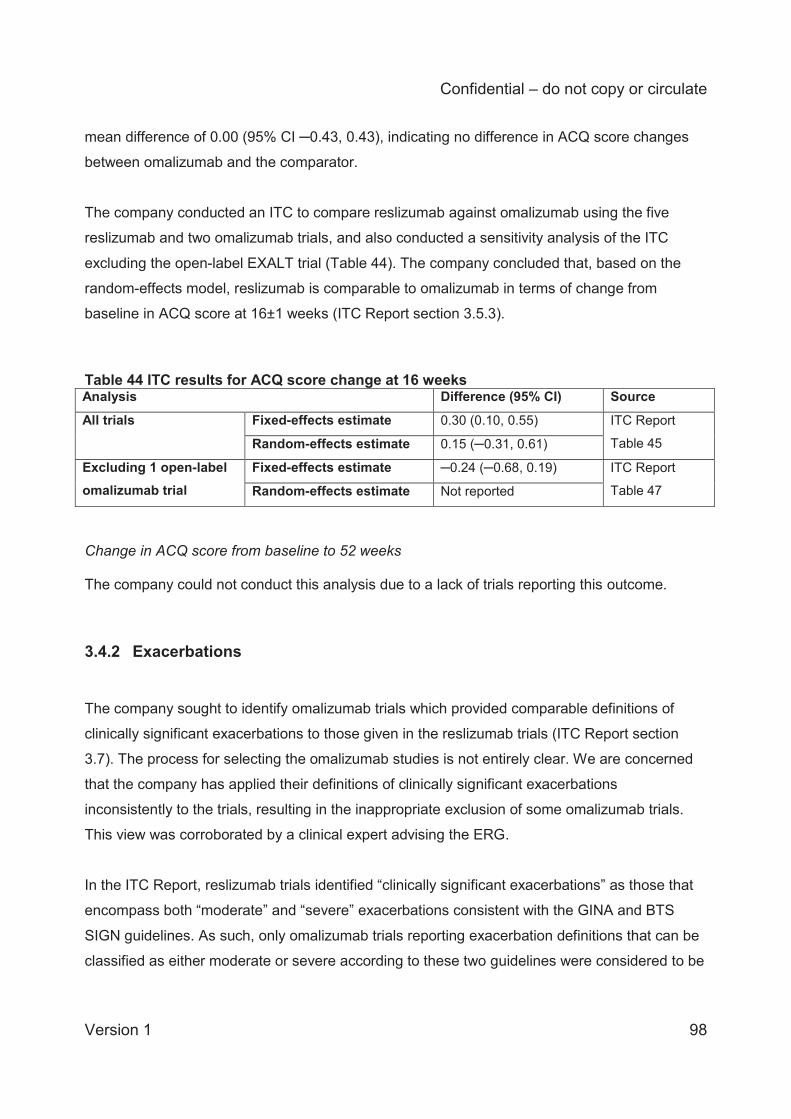
Confidential – do not copy or circulate
Version 1 98
mean difference of 0.00 (95% CI ─0.43, 0.43), indicating no difference in ACQ score changes
between omalizumab and the comparator.
The company conducted an ITC to compare reslizumab against omalizumab using the five
reslizumab and two omalizumab trials, and also conducted a sensitivity analysis of the ITC
excluding the open-label EXALT trial (Table 44). The company concluded that, based on the
random-effects model, reslizumab is comparable to omalizumab in terms of change from
baseline in ACQ score at 16±1 weeks (ITC Report section 3.5.3).
Table 44 ITC results for ACQ score change at 16 weeks Analysis Difference (95% CI) Source All trials Fixed-effects estimate 0.30 (0.10, 0.55) ITC Report
Table 45 Random-effects estimate 0.15 (─0.31, 0.61) Excluding 1 open-label omalizumab trial
Fixed-effects estimate ─0.24 (─0.68, 0.19) ITC Report
Table 47 Random-effects estimate Not reported
Change in ACQ score from baseline to 52 weeks The company could not conduct this analysis due to a lack of trials reporting this outcome.
3.4.2 Exacerbations The company sought to identify omalizumab trials which provided comparable definitions of
clinically significant exacerbations to those given in the reslizumab trials (ITC Report section
3.7). The process for selecting the omalizumab studies is not entirely clear. We are concerned
that the company has applied their definitions of clinically significant exacerbations
inconsistently to the trials, resulting in the inappropriate exclusion of some omalizumab trials.
This view was corroborated by a clinical expert advising the ERG.
In the ITC Report, reslizumab trials identified “clinically significant exacerbations” as those that
encompass both “moderate” and “severe” exacerbations consistent with the GINA and BTS
SIGN guidelines. As such, only omalizumab trials reporting exacerbation definitions that can be
classified as either moderate or severe according to these two guidelines were considered to be
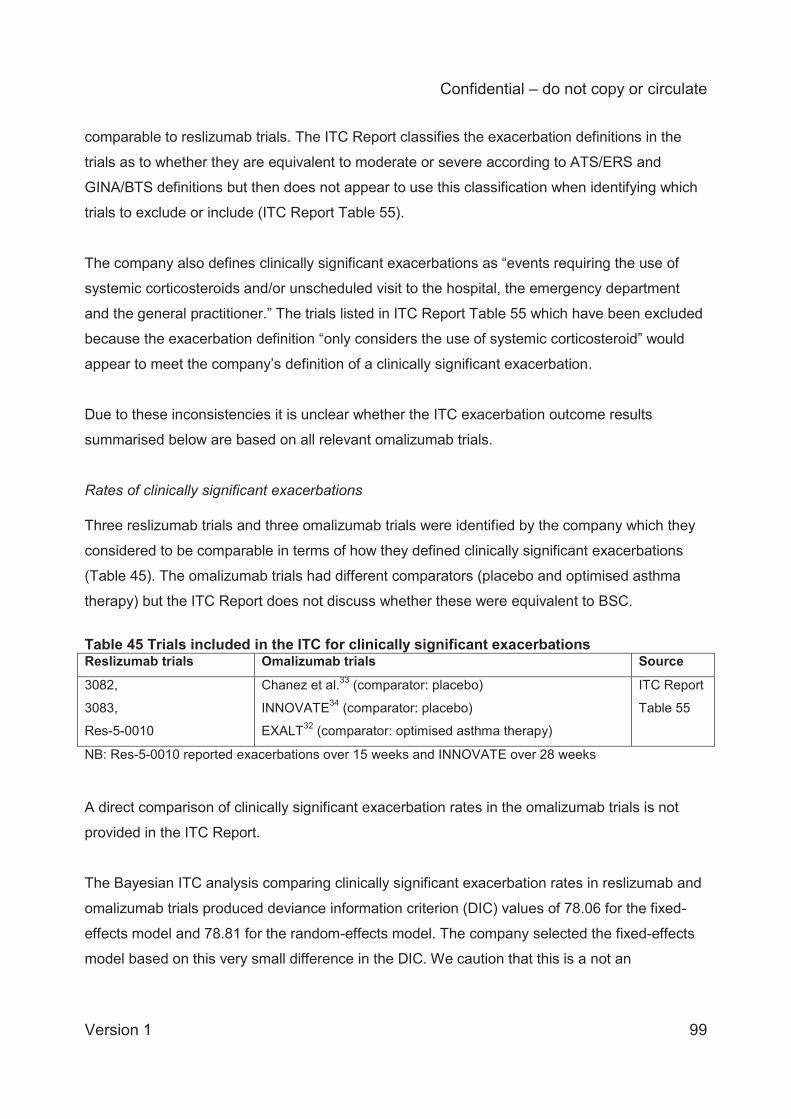
Confidential – do not copy or circulate
Version 1 99
comparable to reslizumab trials. The ITC Report classifies the exacerbation definitions in the
trials as to whether they are equivalent to moderate or severe according to ATS/ERS and
GINA/BTS definitions but then does not appear to use this classification when identifying which
trials to exclude or include (ITC Report Table 55).
The company also defines clinically significant exacerbations as “events requiring the use of
systemic corticosteroids and/or unscheduled visit to the hospital, the emergency department
and the general practitioner.” The trials listed in ITC Report Table 55 which have been excluded
because the exacerbation definition “only considers the use of systemic corticosteroid” would
appear to meet the company’s definition of a clinically significant exacerbation.
Due to these inconsistencies it is unclear whether the ITC exacerbation outcome results
summarised below are based on all relevant omalizumab trials.
Rates of clinically significant exacerbations Three reslizumab trials and three omalizumab trials were identified by the company which they
considered to be comparable in terms of how they defined clinically significant exacerbations
(Table 45). The omalizumab trials had different comparators (placebo and optimised asthma
therapy) but the ITC Report does not discuss whether these were equivalent to BSC.
Table 45 Trials included in the ITC for clinically significant exacerbations Reslizumab trials Omalizumab trials Source
3082,
3083,
Res-5-0010
Chanez et al.33 (comparator: placebo)
INNOVATE34 (comparator: placebo)
EXALT32 (comparator: optimised asthma therapy)
ITC Report
Table 55
NB: Res-5-0010 reported exacerbations over 15 weeks and INNOVATE over 28 weeks A direct comparison of clinically significant exacerbation rates in the omalizumab trials is not
provided in the ITC Report.
The Bayesian ITC analysis comparing clinically significant exacerbation rates in reslizumab and
omalizumab trials produced deviance information criterion (DIC) values of 78.06 for the fixed-
effects model and 78.81 for the random-effects model. The company selected the fixed-effects
model based on this very small difference in the DIC. We caution that this is a not an
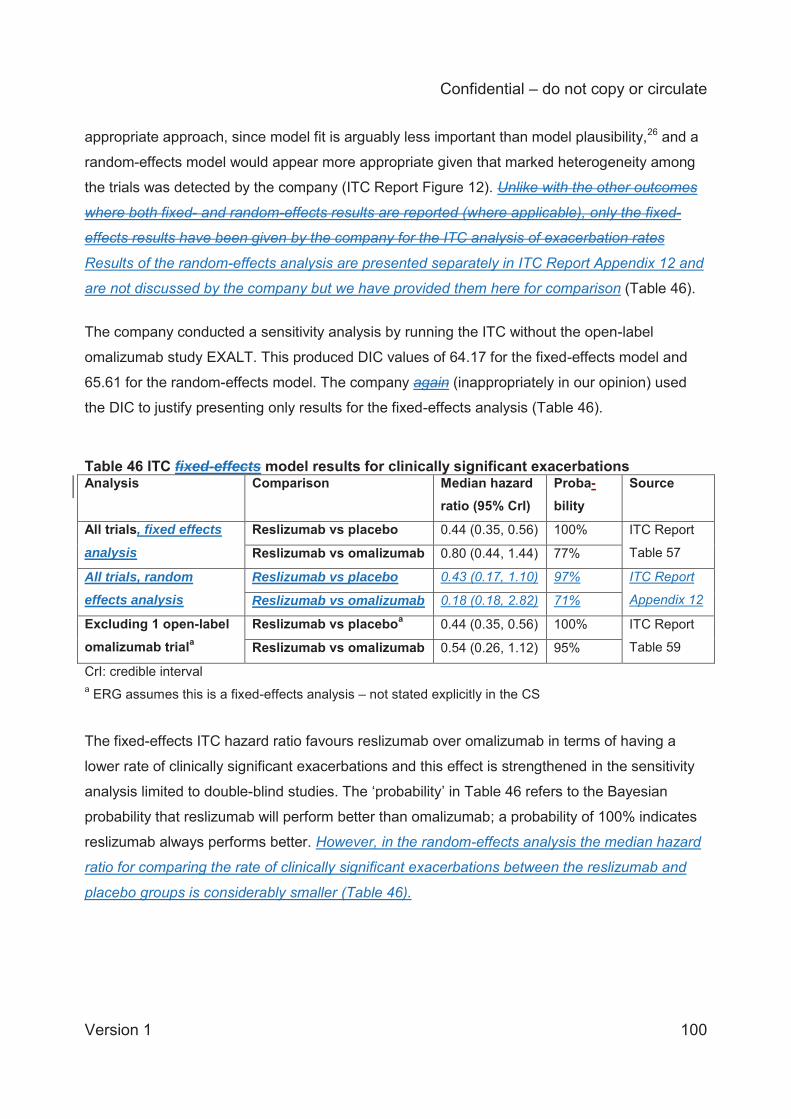
Confidential – do not copy or circulate
Version 1 100
appropriate approach, since model fit is arguably less important than model plausibility,26 and a
random-effects model would appear more appropriate given that marked heterogeneity among
the trials was detected by the company (ITC Report Figure 12). Unlike with the other outcomes
where both fixed- and random-effects results are reported (where applicable), only the fixed-
effects results have been given by the company for the ITC analysis of exacerbation rates
Results of the random-effects analysis are presented separately in ITC Report Appendix 12 and
are not discussed by the company but we have provided them here for comparison (Table 46).
The company conducted a sensitivity analysis by running the ITC without the open-label
omalizumab study EXALT. This produced DIC values of 64.17 for the fixed-effects model and
65.61 for the random-effects model. The company again (inappropriately in our opinion) used
the DIC to justify presenting only results for the fixed-effects analysis (Table 46).
Table 46 ITC fixed-effects model results for clinically significant exacerbations Analysis Comparison Median hazard
ratio (95% CrI) Proba-bility
Source
All trials, fixed effects
analysis Reslizumab vs placebo 0.44 (0.35, 0.56) 100% ITC Report
Table 57 Reslizumab vs omalizumab 0.80 (0.44, 1.44) 77%
All trials, random effects analysis
Reslizumab vs placebo 0.43 (0.17, 1.10) 97% ITC Report
Appendix 12 Reslizumab vs omalizumab 0.18 (0.18, 2.82) 71%
Excluding 1 open-label omalizumab triala
Reslizumab vs placeboa 0.44 (0.35, 0.56) 100% ITC Report
Table 59 Reslizumab vs omalizumab 0.54 (0.26, 1.12) 95%
CrI: credible interval a ERG assumes this is a fixed-effects analysis – not stated explicitly in the CS
The fixed-effects ITC hazard ratio favours reslizumab over omalizumab in terms of having a
lower rate of clinically significant exacerbations and this effect is strengthened in the sensitivity
analysis limited to double-blind studies. The ‘probability’ in Table 46 refers to the Bayesian
probability that reslizumab will perform better than omalizumab; a probability of 100% indicates
reslizumab always performs better. However, in the random-effects analysis the median hazard
ratio for comparing the rate of clinically significant exacerbations between the reslizumab and
placebo groups is considerably smaller (Table 46).
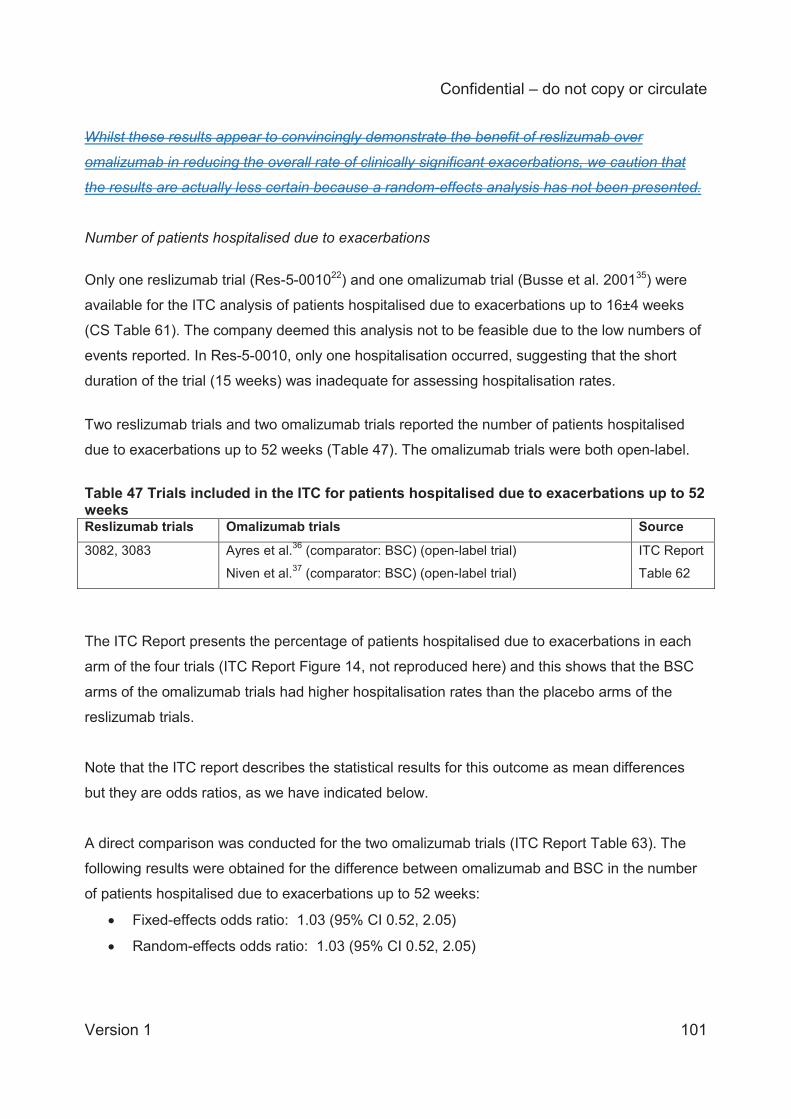
Confidential – do not copy or circulate
Version 1 101
Whilst these results appear to convincingly demonstrate the benefit of reslizumab over
omalizumab in reducing the overall rate of clinically significant exacerbations, we caution that
the results are actually less certain because a random-effects analysis has not been presented.
Number of patients hospitalised due to exacerbations
Only one reslizumab trial (Res-5-001022) and one omalizumab trial (Busse et al. 200135) were
available for the ITC analysis of patients hospitalised due to exacerbations up to 16±4 weeks
(CS Table 61). The company deemed this analysis not to be feasible due to the low numbers of
events reported. In Res-5-0010, only one hospitalisation occurred, suggesting that the short
duration of the trial (15 weeks) was inadequate for assessing hospitalisation rates.
Two reslizumab trials and two omalizumab trials reported the number of patients hospitalised
due to exacerbations up to 52 weeks (Table 47). The omalizumab trials were both open-label.
Table 47 Trials included in the ITC for patients hospitalised due to exacerbations up to 52 weeks Reslizumab trials Omalizumab trials Source
3082, 3083
Ayres et al.36 (comparator: BSC) (open-label trial)
Niven et al.37 (comparator: BSC) (open-label trial)
ITC Report
Table 62
The ITC Report presents the percentage of patients hospitalised due to exacerbations in each
arm of the four trials (ITC Report Figure 14, not reproduced here) and this shows that the BSC
arms of the omalizumab trials had higher hospitalisation rates than the placebo arms of the
reslizumab trials.
Note that the ITC report describes the statistical results for this outcome as mean differences
but they are odds ratios, as we have indicated below.
A direct comparison was conducted for the two omalizumab trials (ITC Report Table 63). The
following results were obtained for the difference between omalizumab and BSC in the number
of patients hospitalised due to exacerbations up to 52 weeks:
Fixed-effects odds ratio: 1.03 (95% CI 0.52, 2.05)
Random-effects odds ratio: 1.03 (95% CI 0.52, 2.05)
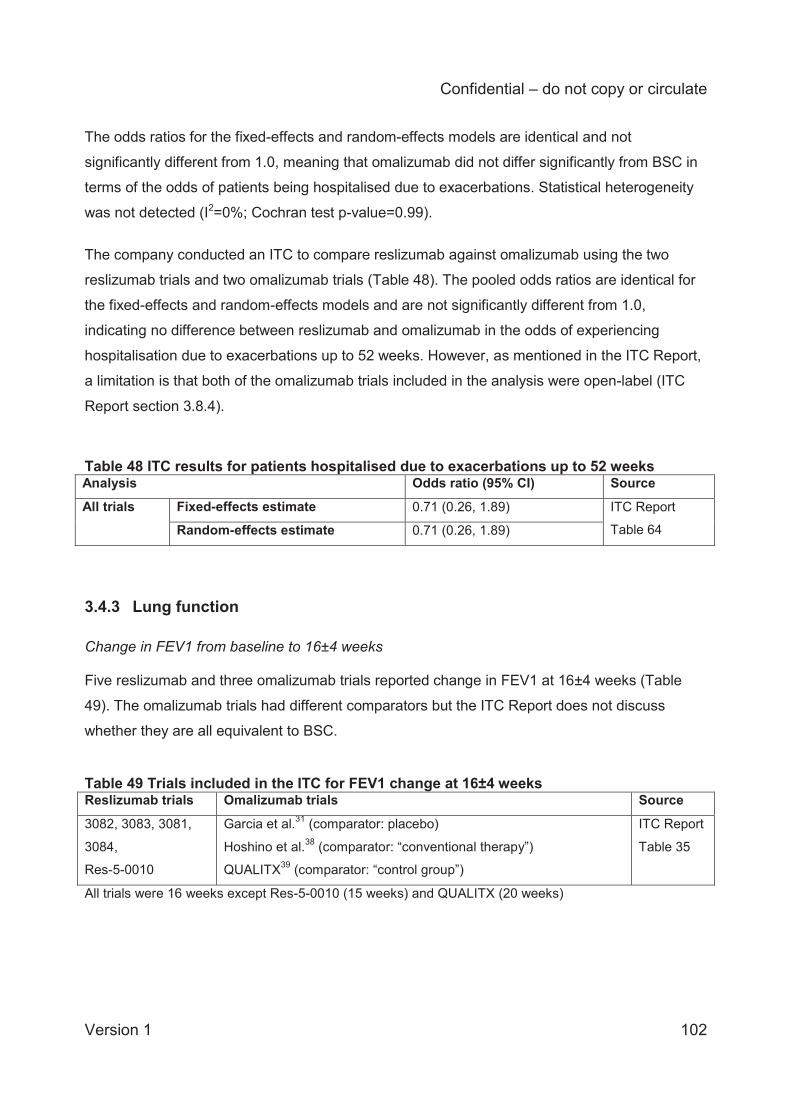
Confidential – do not copy or circulate
Version 1 102
The odds ratios for the fixed-effects and random-effects models are identical and not
significantly different from 1.0, meaning that omalizumab did not differ significantly from BSC in
terms of the odds of patients being hospitalised due to exacerbations. Statistical heterogeneity
was not detected (I2=0%; Cochran test p-value=0.99). The company conducted an ITC to compare reslizumab against omalizumab using the two
reslizumab trials and two omalizumab trials (Table 48). The pooled odds ratios are identical for
the fixed-effects and random-effects models and are not significantly different from 1.0,
indicating no difference between reslizumab and omalizumab in the odds of experiencing
hospitalisation due to exacerbations up to 52 weeks. However, as mentioned in the ITC Report,
a limitation is that both of the omalizumab trials included in the analysis were open-label (ITC
Report section 3.8.4).
Table 48 ITC results for patients hospitalised due to exacerbations up to 52 weeks Analysis Odds ratio (95% CI) Source All trials Fixed-effects estimate 0.71 (0.26, 1.89) ITC Report
Table 64 Random-effects estimate 0.71 (0.26, 1.89)
3.4.3 Lung function Change in FEV1 from baseline to 16±4 weeks Five reslizumab and three omalizumab trials reported change in FEV1 at 16±4 weeks (Table
49). The omalizumab trials had different comparators but the ITC Report does not discuss
whether they are all equivalent to BSC.
Table 49 Trials included in the ITC for FEV1 change at 16±4 weeks Reslizumab trials Omalizumab trials Source
3082, 3083, 3081,
3084,
Res-5-0010
Garcia et al.31 (comparator: placebo)
Hoshino et al.38 (comparator: “conventional therapy”)
QUALITX39 (comparator: “control group”)
ITC Report
Table 35
All trials were 16 weeks except Res-5-0010 (15 weeks) and QUALITX (20 weeks)
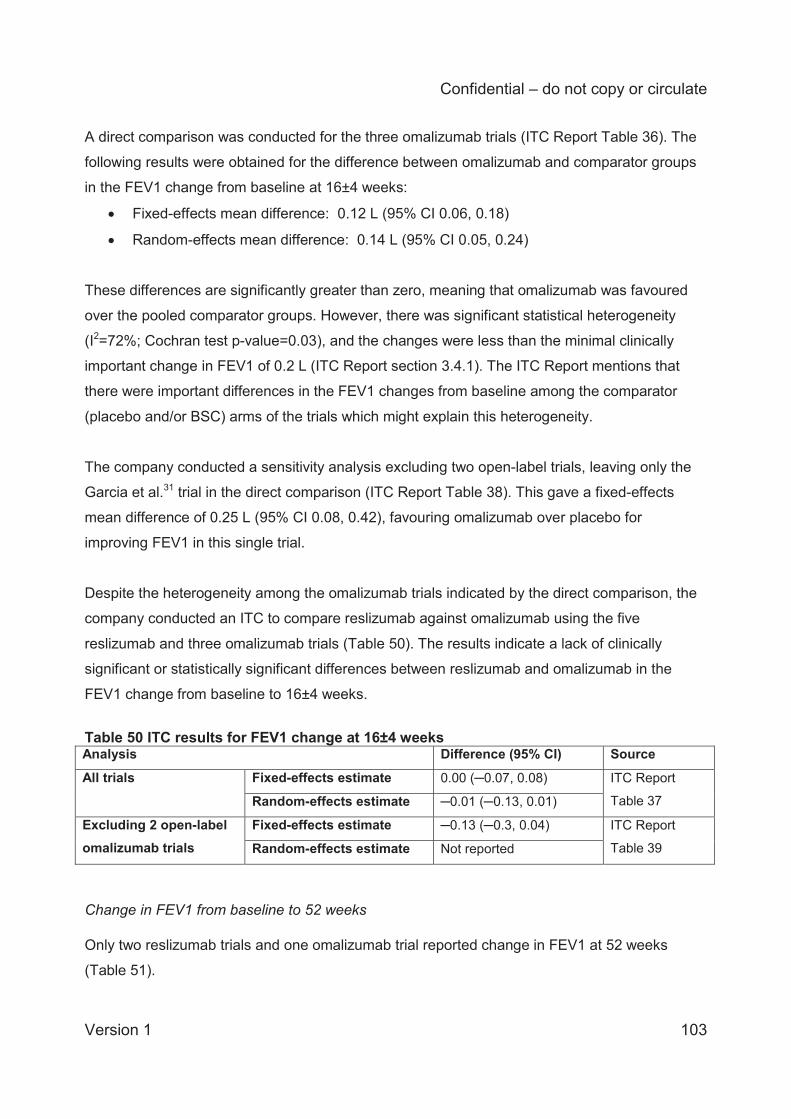
Confidential – do not copy or circulate
Version 1 103
A direct comparison was conducted for the three omalizumab trials (ITC Report Table 36). The
following results were obtained for the difference between omalizumab and comparator groups
in the FEV1 change from baseline at 16±4 weeks:
Fixed-effects mean difference: 0.12 L (95% CI 0.06, 0.18)
Random-effects mean difference: 0.14 L (95% CI 0.05, 0.24)
These differences are significantly greater than zero, meaning that omalizumab was favoured
over the pooled comparator groups. However, there was significant statistical heterogeneity
(I2=72%; Cochran test p-value=0.03), and the changes were less than the minimal clinically
important change in FEV1 of 0.2 L (ITC Report section 3.4.1). The ITC Report mentions that
there were important differences in the FEV1 changes from baseline among the comparator
(placebo and/or BSC) arms of the trials which might explain this heterogeneity.
The company conducted a sensitivity analysis excluding two open-label trials, leaving only the
Garcia et al.31 trial in the direct comparison (ITC Report Table 38). This gave a fixed-effects
mean difference of 0.25 L (95% CI 0.08, 0.42), favouring omalizumab over placebo for
improving FEV1 in this single trial.
Despite the heterogeneity among the omalizumab trials indicated by the direct comparison, the
company conducted an ITC to compare reslizumab against omalizumab using the five
reslizumab and three omalizumab trials (Table 50). The results indicate a lack of clinically
significant or statistically significant differences between reslizumab and omalizumab in the
FEV1 change from baseline to 16±4 weeks.
Table 50 ITC results for FEV1 change at 16±4 weeks Analysis Difference (95% CI) Source All trials Fixed-effects estimate 0.00 (─0.07, 0.08) ITC Report
Table 37 Random-effects estimate ─0.01 (─0.13, 0.01) Excluding 2 open-label omalizumab trials
Fixed-effects estimate ─0.13 (─0.3, 0.04) ITC Report
Table 39 Random-effects estimate Not reported
Change in FEV1 from baseline to 52 weeks Only two reslizumab trials and one omalizumab trial reported change in FEV1 at 52 weeks
(Table 51).
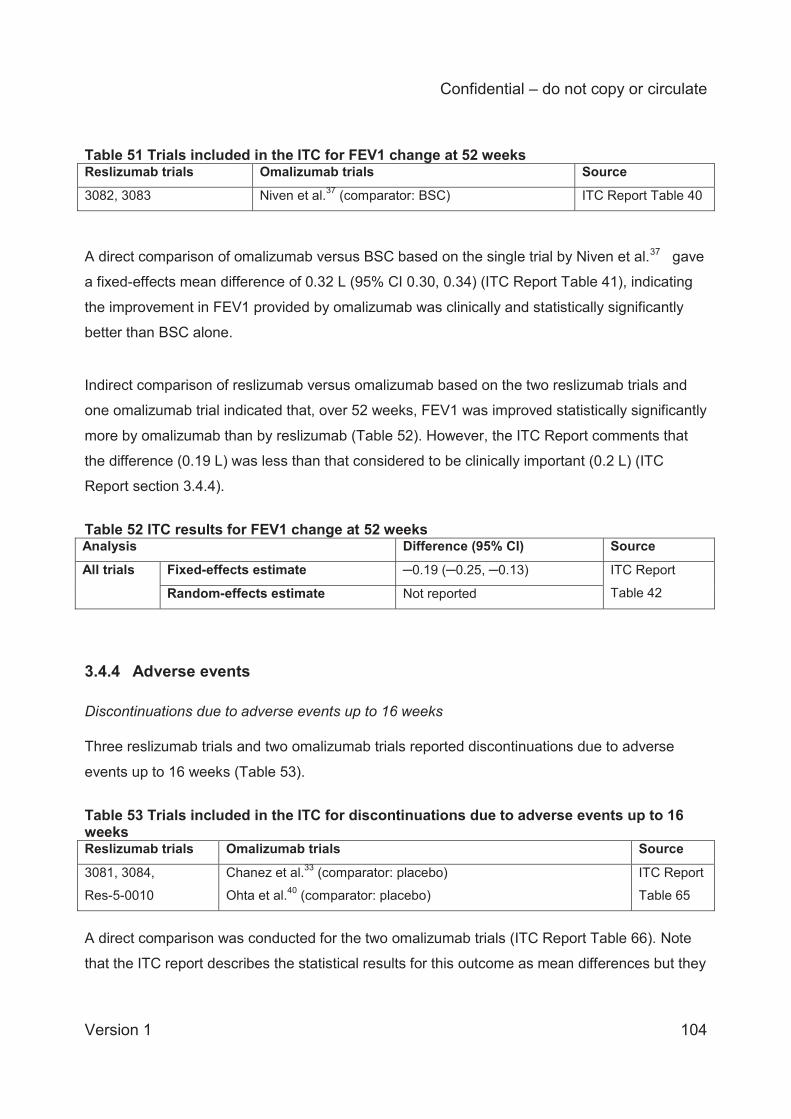
Confidential – do not copy or circulate
Version 1 104
Table 51 Trials included in the ITC for FEV1 change at 52 weeks Reslizumab trials Omalizumab trials Source 3082, 3083 Niven et al.37 (comparator: BSC) ITC Report Table 40
A direct comparison of omalizumab versus BSC based on the single trial by Niven et al.37 gave
a fixed-effects mean difference of 0.32 L (95% CI 0.30, 0.34) (ITC Report Table 41), indicating
the improvement in FEV1 provided by omalizumab was clinically and statistically significantly
better than BSC alone.
Indirect comparison of reslizumab versus omalizumab based on the two reslizumab trials and
one omalizumab trial indicated that, over 52 weeks, FEV1 was improved statistically significantly
more by omalizumab than by reslizumab (Table 52). However, the ITC Report comments that
the difference (0.19 L) was less than that considered to be clinically important (0.2 L) (ITC
Report section 3.4.4).
Table 52 ITC results for FEV1 change at 52 weeks Analysis Difference (95% CI) Source All trials Fixed-effects estimate ─0.19 (─0.25, ─0.13) ITC Report
Table 42 Random-effects estimate Not reported
3.4.4 Adverse events Discontinuations due to adverse events up to 16 weeks Three reslizumab trials and two omalizumab trials reported discontinuations due to adverse
events up to 16 weeks (Table 53).
Table 53 Trials included in the ITC for discontinuations due to adverse events up to 16 weeks Reslizumab trials Omalizumab trials Source
3081, 3084,
Res-5-0010
Chanez et al.33 (comparator: placebo)
Ohta et al.40 (comparator: placebo)
ITC Report
Table 65
A direct comparison was conducted for the two omalizumab trials (ITC Report Table 66). Note
that the ITC report describes the statistical results for this outcome as mean differences but they
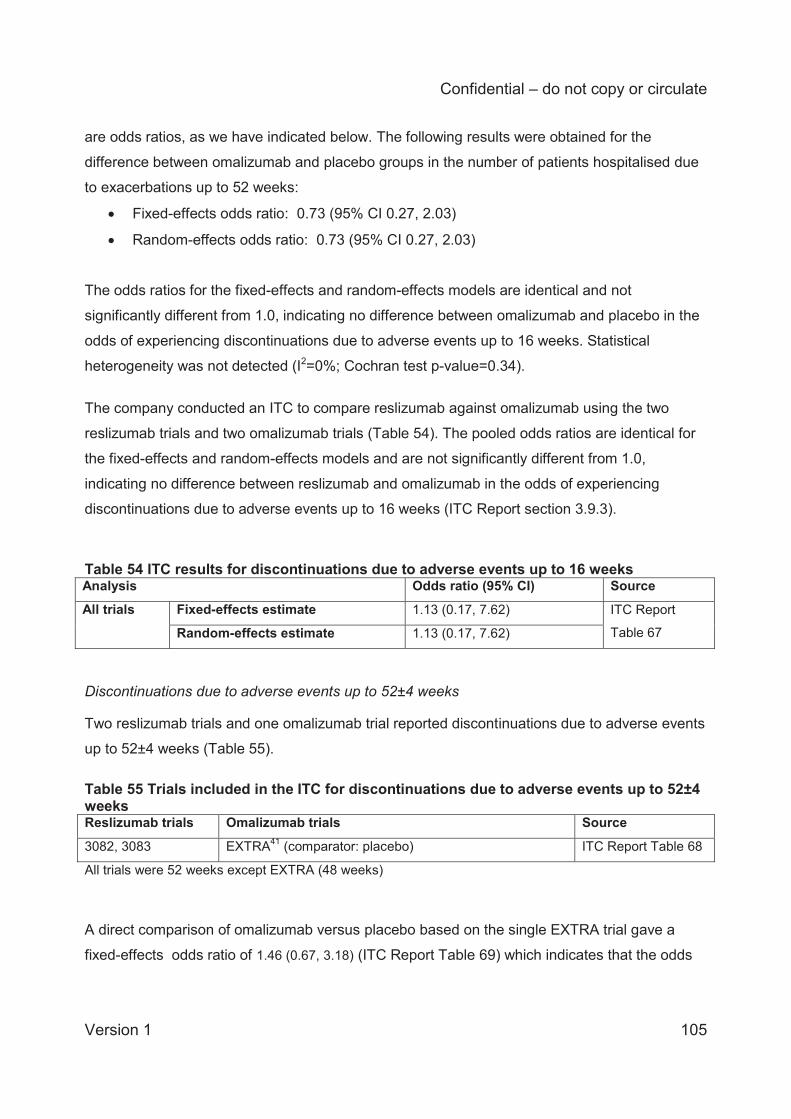
Confidential – do not copy or circulate
Version 1 105
are odds ratios, as we have indicated below. The following results were obtained for the
difference between omalizumab and placebo groups in the number of patients hospitalised due
to exacerbations up to 52 weeks:
Fixed-effects odds ratio: 0.73 (95% CI 0.27, 2.03)
Random-effects odds ratio: 0.73 (95% CI 0.27, 2.03)
The odds ratios for the fixed-effects and random-effects models are identical and not
significantly different from 1.0, indicating no difference between omalizumab and placebo in the
odds of experiencing discontinuations due to adverse events up to 16 weeks. Statistical
heterogeneity was not detected (I2=0%; Cochran test p-value=0.34). The company conducted an ITC to compare reslizumab against omalizumab using the two
reslizumab trials and two omalizumab trials (Table 54). The pooled odds ratios are identical for
the fixed-effects and random-effects models and are not significantly different from 1.0,
indicating no difference between reslizumab and omalizumab in the odds of experiencing
discontinuations due to adverse events up to 16 weeks (ITC Report section 3.9.3).
Table 54 ITC results for discontinuations due to adverse events up to 16 weeks Analysis Odds ratio (95% CI) Source All trials Fixed-effects estimate 1.13 (0.17, 7.62) ITC Report
Table 67 Random-effects estimate 1.13 (0.17, 7.62) Discontinuations due to adverse events up to 52±4 weeks Two reslizumab trials and one omalizumab trial reported discontinuations due to adverse events
up to 52±4 weeks (Table 55). Table 55 Trials included in the ITC for discontinuations due to adverse events up to 52±4 weeks Reslizumab trials Omalizumab trials Source
3082, 3083 EXTRA41 (comparator: placebo) ITC Report Table 68
All trials were 52 weeks except EXTRA (48 weeks)
A direct comparison of omalizumab versus placebo based on the single EXTRA trial gave a
fixed-effects odds ratio of 1.46 (0.67, 3.18) (ITC Report Table 69) which indicates that the odds
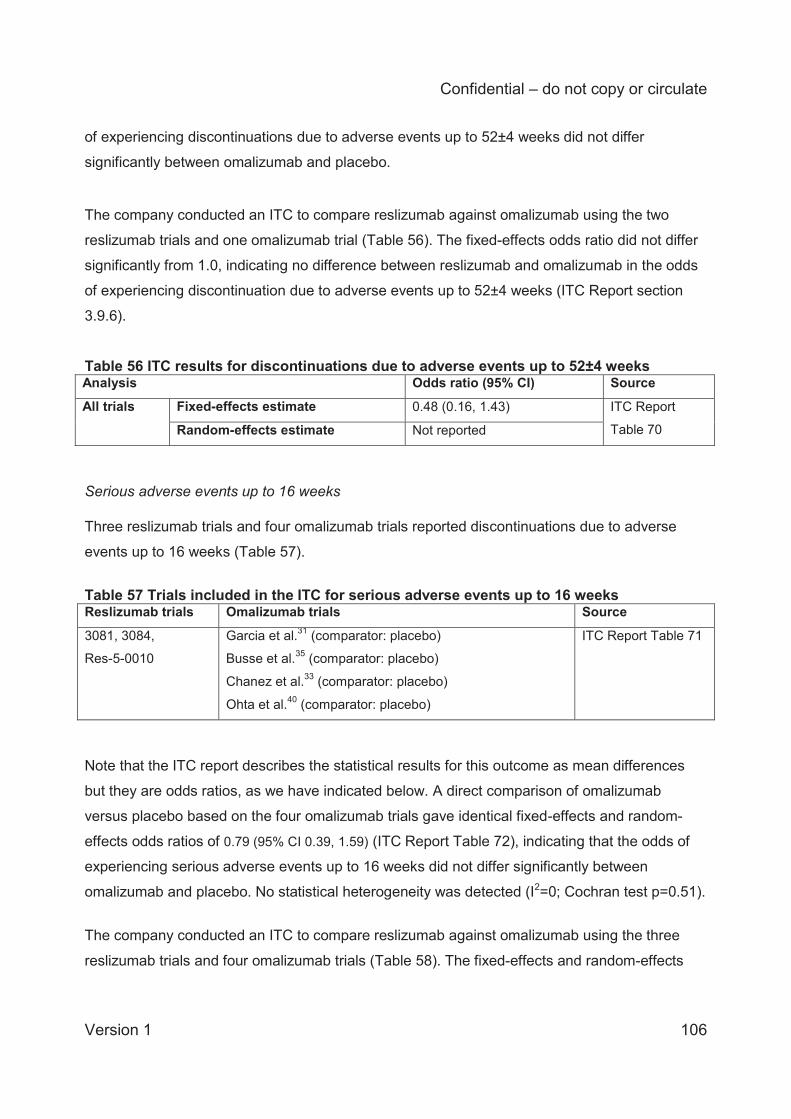
Confidential – do not copy or circulate
Version 1 106
of experiencing discontinuations due to adverse events up to 52±4 weeks did not differ
significantly between omalizumab and placebo.
The company conducted an ITC to compare reslizumab against omalizumab using the two
reslizumab trials and one omalizumab trial (Table 56). The fixed-effects odds ratio did not differ
significantly from 1.0, indicating no difference between reslizumab and omalizumab in the odds
of experiencing discontinuation due to adverse events up to 52±4 weeks (ITC Report section
3.9.6).
Table 56 ITC results for discontinuations due to adverse events up to 52±4 weeks Analysis Odds ratio (95% CI) Source All trials Fixed-effects estimate 0.48 (0.16, 1.43) ITC Report
Table 70 Random-effects estimate Not reported Serious adverse events up to 16 weeks Three reslizumab trials and four omalizumab trials reported discontinuations due to adverse
events up to 16 weeks (Table 57).
Table 57 Trials included in the ITC for serious adverse events up to 16 weeks Reslizumab trials Omalizumab trials Source
3081, 3084,
Res-5-0010
Garcia et al.31 (comparator: placebo)
Busse et al.35 (comparator: placebo)
Chanez et al.33 (comparator: placebo)
Ohta et al.40 (comparator: placebo)
ITC Report Table 71
Note that the ITC report describes the statistical results for this outcome as mean differences
but they are odds ratios, as we have indicated below. A direct comparison of omalizumab
versus placebo based on the four omalizumab trials gave identical fixed-effects and random-
effects odds ratios of 0.79 (95% CI 0.39, 1.59) (ITC Report Table 72), indicating that the odds of
experiencing serious adverse events up to 16 weeks did not differ significantly between
omalizumab and placebo. No statistical heterogeneity was detected (I2=0; Cochran test p=0.51).
The company conducted an ITC to compare reslizumab against omalizumab using the three
reslizumab trials and four omalizumab trials (Table 58). The fixed-effects and random-effects
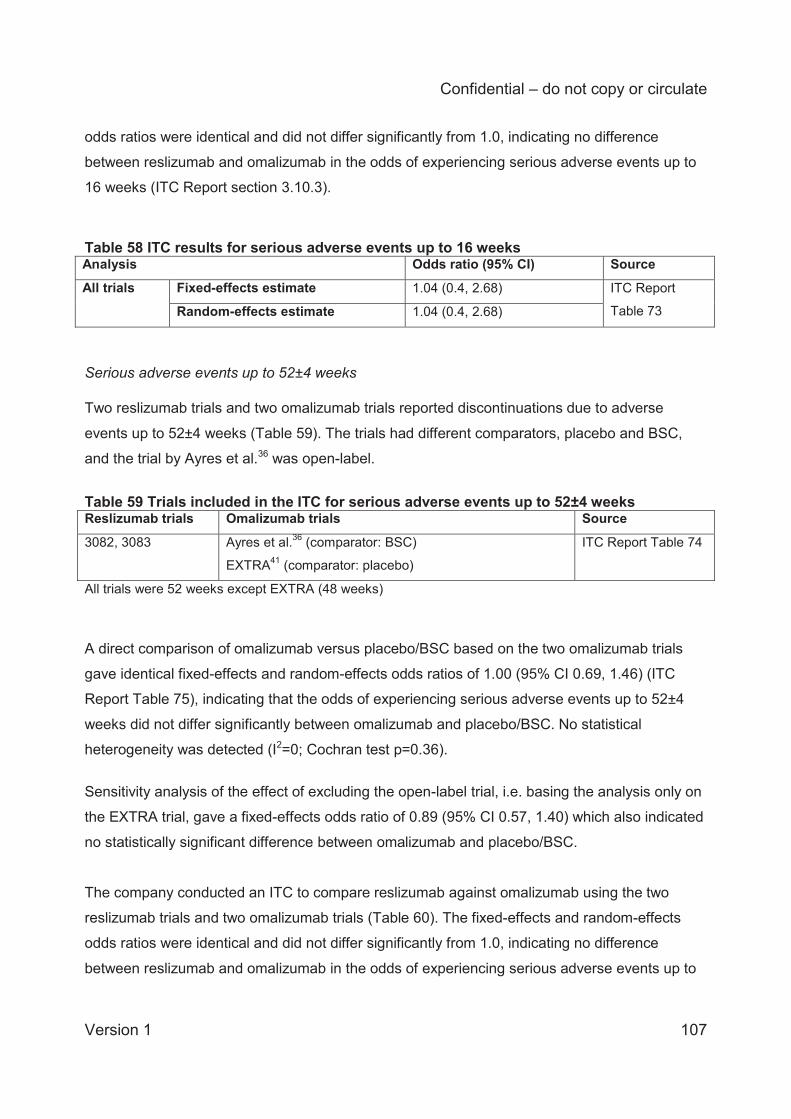
Confidential – do not copy or circulate
Version 1 107
odds ratios were identical and did not differ significantly from 1.0, indicating no difference
between reslizumab and omalizumab in the odds of experiencing serious adverse events up to
16 weeks (ITC Report section 3.10.3).
Table 58 ITC results for serious adverse events up to 16 weeks Analysis Odds ratio (95% CI) Source All trials Fixed-effects estimate 1.04 (0.4, 2.68) ITC Report
Table 73 Random-effects estimate 1.04 (0.4, 2.68) Serious adverse events up to 52±4 weeks Two reslizumab trials and two omalizumab trials reported discontinuations due to adverse
events up to 52±4 weeks (Table 59). The trials had different comparators, placebo and BSC,
and the trial by Ayres et al.36 was open-label.
Table 59 Trials included in the ITC for serious adverse events up to 52±4 weeks Reslizumab trials Omalizumab trials Source
3082, 3083 Ayres et al.36 (comparator: BSC)
EXTRA41 (comparator: placebo)
ITC Report Table 74
All trials were 52 weeks except EXTRA (48 weeks)
A direct comparison of omalizumab versus placebo/BSC based on the two omalizumab trials
gave identical fixed-effects and random-effects odds ratios of 1.00 (95% CI 0.69, 1.46) (ITC
Report Table 75), indicating that the odds of experiencing serious adverse events up to 52±4
weeks did not differ significantly between omalizumab and placebo/BSC. No statistical
heterogeneity was detected (I2=0; Cochran test p=0.36).
Sensitivity analysis of the effect of excluding the open-label trial, i.e. basing the analysis only on
the EXTRA trial, gave a fixed-effects odds ratio of 0.89 (95% CI 0.57, 1.40) which also indicated
no statistically significant difference between omalizumab and placebo/BSC.
The company conducted an ITC to compare reslizumab against omalizumab using the two
reslizumab trials and two omalizumab trials (Table 60). The fixed-effects and random-effects
odds ratios were identical and did not differ significantly from 1.0, indicating no difference
between reslizumab and omalizumab in the odds of experiencing serious adverse events up to
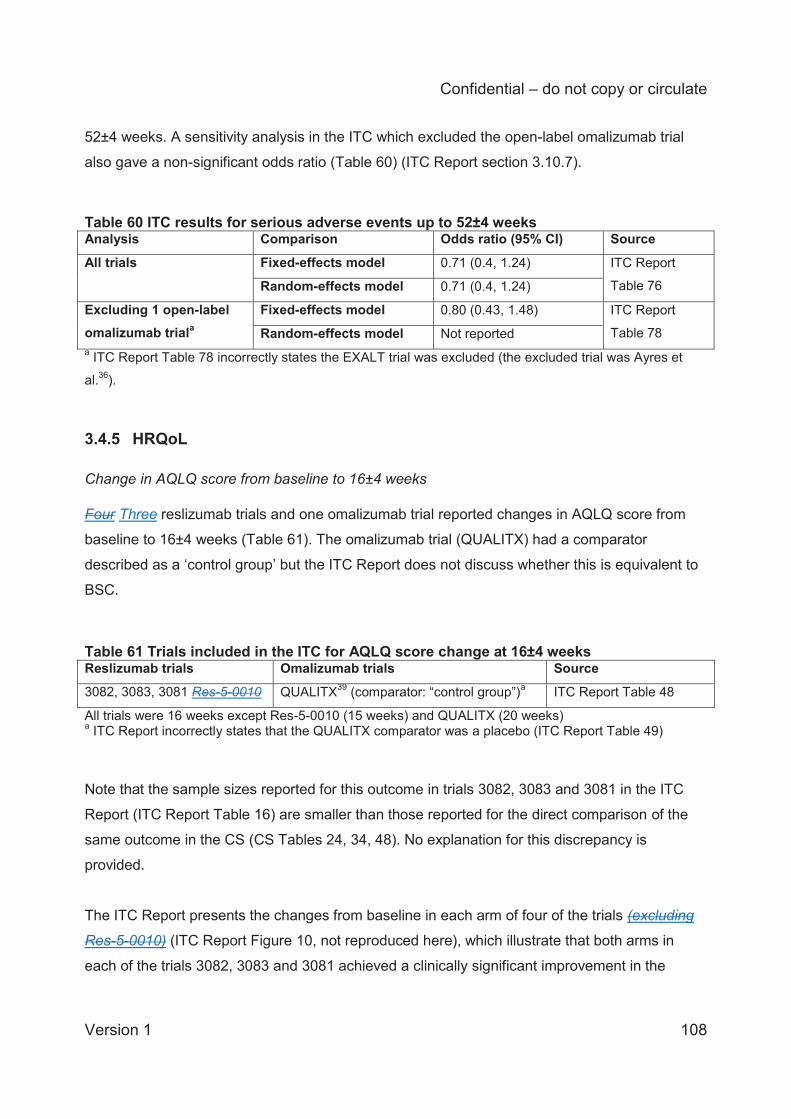
Confidential – do not copy or circulate
Version 1 108
52±4 weeks. A sensitivity analysis in the ITC which excluded the open-label omalizumab trial
also gave a non-significant odds ratio (Table 60) (ITC Report section 3.10.7).
Table 60 ITC results for serious adverse events up to 52±4 weeks Analysis Comparison Odds ratio (95% CI) Source All trials Fixed-effects model 0.71 (0.4, 1.24) ITC Report
Table 76 Random-effects model 0.71 (0.4, 1.24)
Excluding 1 open-label omalizumab triala
Fixed-effects model 0.80 (0.43, 1.48) ITC Report
Table 78 Random-effects model Not reported a ITC Report Table 78 incorrectly states the EXALT trial was excluded (the excluded trial was Ayres et
al.36).
3.4.5 HRQoL Change in AQLQ score from baseline to 16±4 weeks Four Three reslizumab trials and one omalizumab trial reported changes in AQLQ score from
baseline to 16±4 weeks (Table 61). The omalizumab trial (QUALITX) had a comparator
described as a ‘control group’ but the ITC Report does not discuss whether this is equivalent to
BSC.
Table 61 Trials included in the ITC for AQLQ score change at 16±4 weeks Reslizumab trials Omalizumab trials Source 3082, 3083, 3081 Res-5-0010 QUALITX39 (comparator: “control group”)a ITC Report Table 48
All trials were 16 weeks except Res-5-0010 (15 weeks) and QUALITX (20 weeks) a ITC Report incorrectly states that the QUALITX comparator was a placebo (ITC Report Table 49)
Note that the sample sizes reported for this outcome in trials 3082, 3083 and 3081 in the ITC
Report (ITC Report Table 16) are smaller than those reported for the direct comparison of the
same outcome in the CS (CS Tables 24, 34, 48). No explanation for this discrepancy is
provided.
The ITC Report presents the changes from baseline in each arm of four of the trials (excluding
Res-5-0010) (ITC Report Figure 10, not reproduced here), which illustrate that both arms in
each of the trials 3082, 3083 and 3081 achieved a clinically significant improvement in the
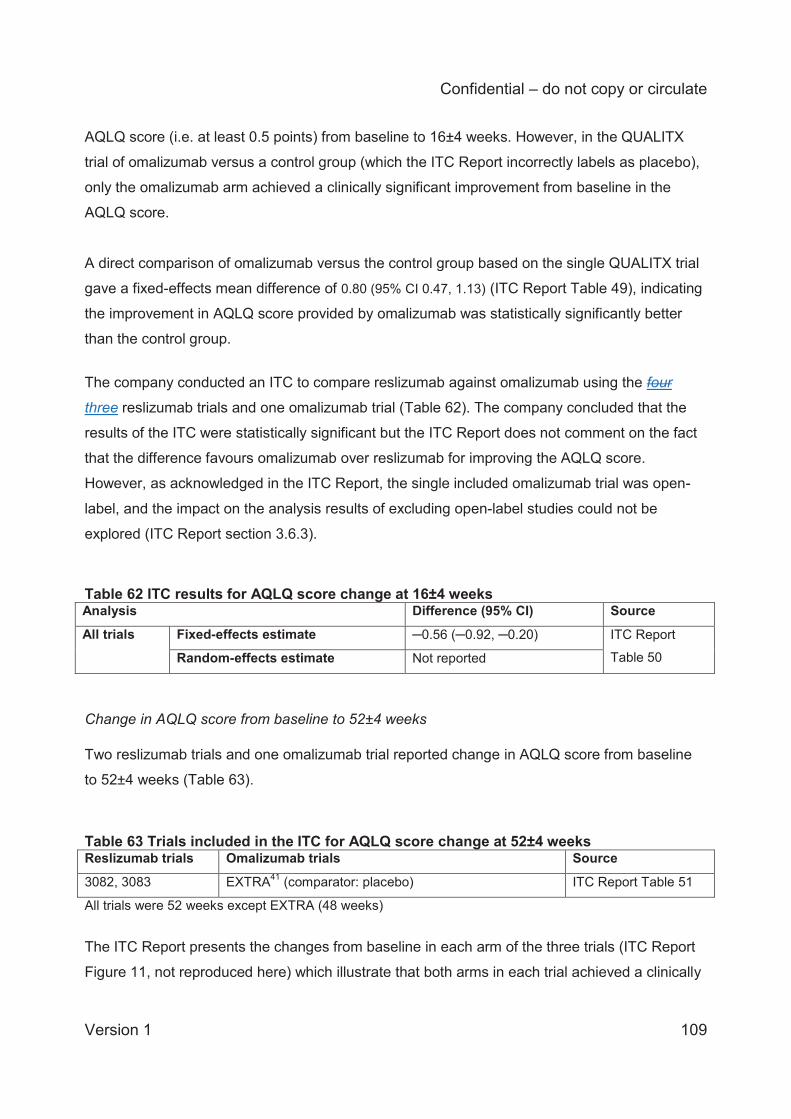
Confidential – do not copy or circulate
Version 1 109
AQLQ score (i.e. at least 0.5 points) from baseline to 16±4 weeks. However, in the QUALITX
trial of omalizumab versus a control group (which the ITC Report incorrectly labels as placebo),
only the omalizumab arm achieved a clinically significant improvement from baseline in the
AQLQ score.
A direct comparison of omalizumab versus the control group based on the single QUALITX trial
gave a fixed-effects mean difference of 0.80 (95% CI 0.47, 1.13) (ITC Report Table 49), indicating
the improvement in AQLQ score provided by omalizumab was statistically significantly better
than the control group.
The company conducted an ITC to compare reslizumab against omalizumab using the four
three reslizumab trials and one omalizumab trial (Table 62). The company concluded that the
results of the ITC were statistically significant but the ITC Report does not comment on the fact
that the difference favours omalizumab over reslizumab for improving the AQLQ score.
However, as acknowledged in the ITC Report, the single included omalizumab trial was open-
label, and the impact on the analysis results of excluding open-label studies could not be
explored (ITC Report section 3.6.3).
Table 62 ITC results for AQLQ score change at 16±4 weeks Analysis Difference (95% CI) Source All trials Fixed-effects estimate ─0.56 (─0.92, ─0.20) ITC Report
Table 50 Random-effects estimate Not reported Change in AQLQ score from baseline to 52±4 weeks Two reslizumab trials and one omalizumab trial reported change in AQLQ score from baseline
to 52±4 weeks (Table 63).
Table 63 Trials included in the ITC for AQLQ score change at 52±4 weeks Reslizumab trials Omalizumab trials Source
3082, 3083 EXTRA41 (comparator: placebo) ITC Report Table 51
All trials were 52 weeks except EXTRA (48 weeks)
The ITC Report presents the changes from baseline in each arm of the three trials (ITC Report
Figure 11, not reproduced here) which illustrate that both arms in each trial achieved a clinically
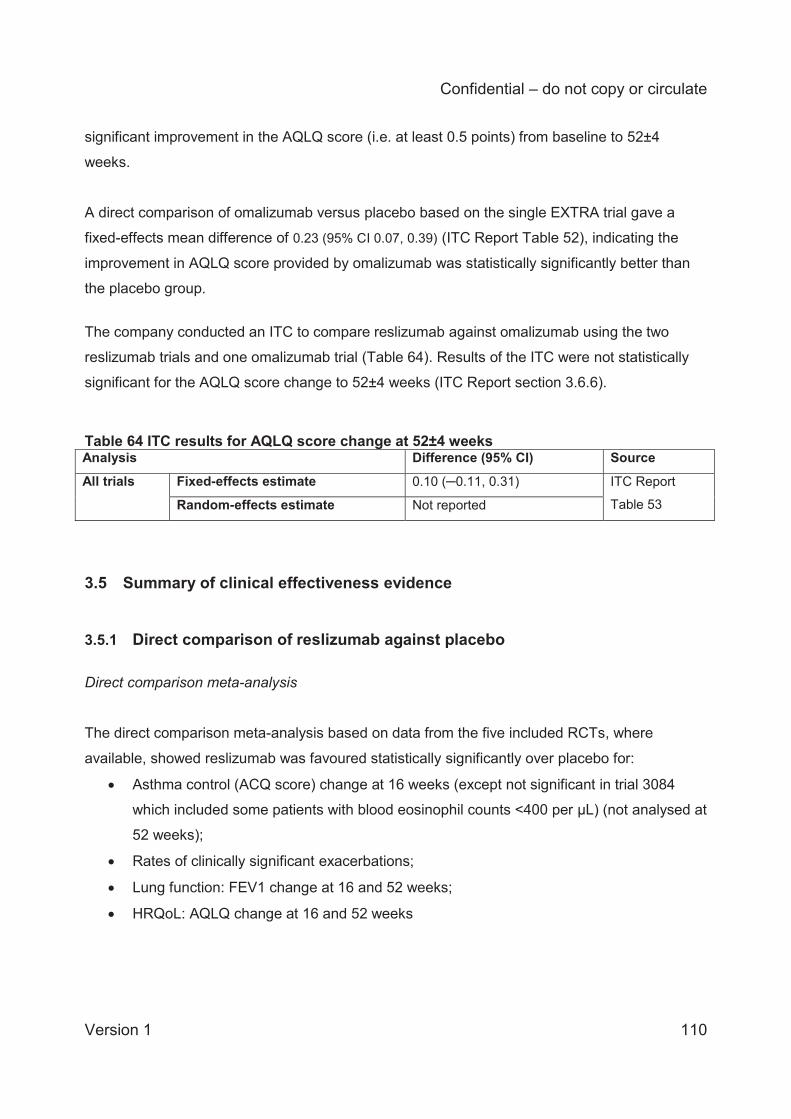
Confidential – do not copy or circulate
Version 1 110
significant improvement in the AQLQ score (i.e. at least 0.5 points) from baseline to 52±4
weeks.
A direct comparison of omalizumab versus placebo based on the single EXTRA trial gave a
fixed-effects mean difference of 0.23 (95% CI 0.07, 0.39) (ITC Report Table 52), indicating the
improvement in AQLQ score provided by omalizumab was statistically significantly better than
the placebo group.
The company conducted an ITC to compare reslizumab against omalizumab using the two
reslizumab trials and one omalizumab trial (Table 64). Results of the ITC were not statistically
significant for the AQLQ score change to 52±4 weeks (ITC Report section 3.6.6).
Table 64 ITC results for AQLQ score change at 52±4 weeks Analysis Difference (95% CI) Source All trials Fixed-effects estimate 0.10 (─0.11, 0.31) ITC Report
Table 53 Random-effects estimate Not reported
3.5 Summary of clinical effectiveness evidence
3.5.1 Direct comparison of reslizumab against placebo
Direct comparison meta-analysis
The direct comparison meta-analysis based on data from the five included RCTs, where
available, showed reslizumab was favoured statistically significantly over placebo for:
Asthma control (ACQ score) change at 16 weeks (except not significant in trial 3084
which included some patients with blood eosinophil counts <400 per μL) (not analysed at
52 weeks);
Rates of clinically significant exacerbations;
Lung function: FEV1 change at 16 and 52 weeks;
HRQoL: AQLQ change at 16 and 52 weeks
Confidential – do not copy or circulate
Version 1 111
The direct comparison meta-analysis showed that reslizumab was not significantly different to
placebo for:
Rates of exacerbations requiring hospital and/or emergency room visits
Rates of discontinuation due to adverse events up to 16 and 52 weeks
Serious adverse events up to 52 weeks (16 weeks not analysed)
Direct comparison outcomes not meta-analysed
For outcomes which were reported in the CS but not meta-analysed, consistent results across
the individual trials suggested that reslizumab was favoured over placebo for:
Rates of clinically significant exacerbations requiring systemic corticosteroids over ≥3
days;
Rates of clinically significant exacerbations requiring oral corticosteroids over ≥3 days;
The probability of experiencing a CSE over 52 weeks;
Lung function: %predicted FEV1 change at 16 and 52 weeks;
Lung function: FVC change at 16 and 52 weeks (except not significant in trial 3084);
HRQoL: ASUI score change at 16 weeks (52 weeks not analysed);
Blood eosinophil concentrations at 16 and 52 weeks.
SABA use was decreased more in reslizumab than placebo patients in most trials but only in
one trial was the difference statistically significant.
For outcomes which were reported in the CS but not meta-analysed, consistent results across
the individual trials suggested that reslizumab was not significantly different to placebo for:
The proportion of patients requiring hospitalisation due to exacerbations (although the
number of events was relatively low);
Lung function: FEF25-75% change at 16 weeks (not analysed at 52 weeks).
Reslizumab appears to have a relatively good safety profile. Adverse events based on the open-
label study 3085 showed that generally, placebo-treated patients had a slightly higher proportion
of adverse events than reslizumab-treated patients, or the proportions in both groups were
similar. Separate data for patients with continuous reslizumab treatment and those previously
treatment naïve were not reported and it is unclear if this may have had an impact on the long-
Confidential – do not copy or circulate
Version 1 112
term adverse event rates of reslizumab. Only one death occurred among the five trials (in the
placebo group of trial 3082).
3.5.2 ITC of reslizumab against omalizumab
Asthma control (change in ACQ score) did not differ between reslizumab and omalizumab, and
a sensitivity analysis including only double-blind omalizumab trials gave the same result.
The rate of CSE was significantly lower for reslizumab than omalizumab, and a sensitivity
analysis including only double-blind omalizumab trials gave the same result. However, this was
based only on a fixed-effects analysis whereas a random-effects model would have been more
appropriate.
The frequency of hospitalisations due to exacerbations (not analysed at 16 weeks) did not differ
between reslizumab and omalizumab at 52 weeks. However, only open-label omalizumab trials
were available.
Lung function, assessed by change in FEV1, did not differ between reslizumab and omalizumab
at 16 weeks but at 52 weeks was statistically significantly (and almost clinically significantly)
better in omalizumab treated than reslizumab treated patients.
Both the rate of discontinuations due to adverse events and the frequency of serious adverse
did not differ significantly between reslizumab and omalizumab treated patients.
HRQoL as assessed by the change in AQLQ, statistically favoured omalizumab over reslizumab
at 16 weeks, but did not differ between reslizumab and omalizumab at 52 weeks.
3.5.3 Strengths and limitations of the clinical effectiveness evidence
Strengths
The CS and ITC report are generally well structured and clearly presented.
All relevant studies appear to have been located by the company.
Confidential – do not copy or circulate
Version 1 113
With the exception of trial Res-5-0010, the included trials are described clearly and in
detail.
The included trials are of generally high quality.
Limitations
The trials had relatively short duration (52 weeks) considering the chronic nature of
severe asthma; trial Res-5-0010 had a duration of only 15 weeks.
Not all available lung function and AQLQ HRQoL outcomes were included in the direct
comparison meta-analysis and ITC and there is lack of clarity in the CS and ITC report
over the rationale for selecting some outcomes: feasibility assessments were incorrectly
reported and poorly explained. In particular, inconsistent application of definitions of
clinically significant exacerbations may have resulted in some omalizumab trials being
excluded unnecessarily from the ITC.
The ITC analysis for change in AQLQ at 16 weeks included a reslizumab trial (Res-5-
0010) which was not included in the direct comparison meta-analysis for the same
outcome, and the reason for this is unclear.
For most outcomes the sample sizes are smaller than the number of patients
randomised and, wehre defined, also smaller than the FAS; no explanation is provided in
the CS for missing data.
The company has conducted more statistical tests than necessary which might increase
the risk of type I errors. It is unclear why two different analyses for changes from
baseline were conducted; the company does not specify which is the preferred analysis;
and the analyses are not consistently reported across all outcomes.
Trial 3084 included patients with a wider range of baseline blood eosinophil counts than
in the other trials. The trial publication indicates 80% of the trial population had blood
eosinophils <400 per μL. A subgroup of patients with counts ≥400 per μL would be most
consistent with the other trials but at the expense of sample size. Sensitivity analyses to
check the impact of the different patient subgroups in this trial were not conducted.
Due to lack of relevant trials, the ITC is based on an assumption that the effectiveness of
omalizumab in patients with elevated blood eosinophils is the same as that in patients
with IgE-mediated asthma; however, the evidence for or against this is not discussed.
For the ITC the company has assumed that placebo is comparable to BSC but no
explanation is provided. Some of the omalizumab trials included in the ITC had
Confidential – do not copy or circulate
Version 1 114
comparator groups which were not described as placebo or BSC but the company has
not mentioned or discussed this.
The company did not adequately assess the homogeneity of trials before including them
in the ITC; the ERG agrees that for many variables the trials appear broadly
homogeneous, but we note differences in exacerbation history which suggest that
patients in omalizumab trials had more severe asthma than those in reslizumab trials.
In the ITC analysis of exacerbation rates the company inappropriately used only a fixed-
effects analysis; the results for this outcome might not reflect true effects.
The results of the ITC do not directly inform the company’s health economic analysis.
4 COST EFFECTIVENESS
4.1 Overview of the company’s economic evaluation The company’s submission to NICE includes:
i) a review of published economic evaluations of pharmacological interventions for severe
eosinophilic asthma.
ii) a report of an economic evaluation undertaken for the NICE STA process. The cost
effectiveness of reslizumab is compared with best standard of care and to omalizumab
for patients with severe eosinophilic asthma.
4.2 Company’s review of published economic evaluations
A systematic search of the literature was conducted by the manufacturer to identify economic
evaluations, outcomes, and data related to the treatment of asthma patients. This search
included components designed to identify HRQoL and cost data in addition to full economic
evaluations published as of April 4, 2016 (the search date was not explicitly stated). MEDLINE,
MEDLINE In-process, Embase, and EconLit were searched to identify information resources
published after 2006. No justification for the choice of a cut-off date of 2006 was provided. No
searches were conducted using the NHS Economic Evaluation Database or the HTA database,
two databases commonly used for cost-effectiveness evidence searches. In addition to
excluding randomised controlled trials, studies that did not present UK-based economic
evaluations were excluded. This exclusion was not listed in the CS, but was provided in a
supplementary report describing the systematic review of economic evidence,42 which hereafter
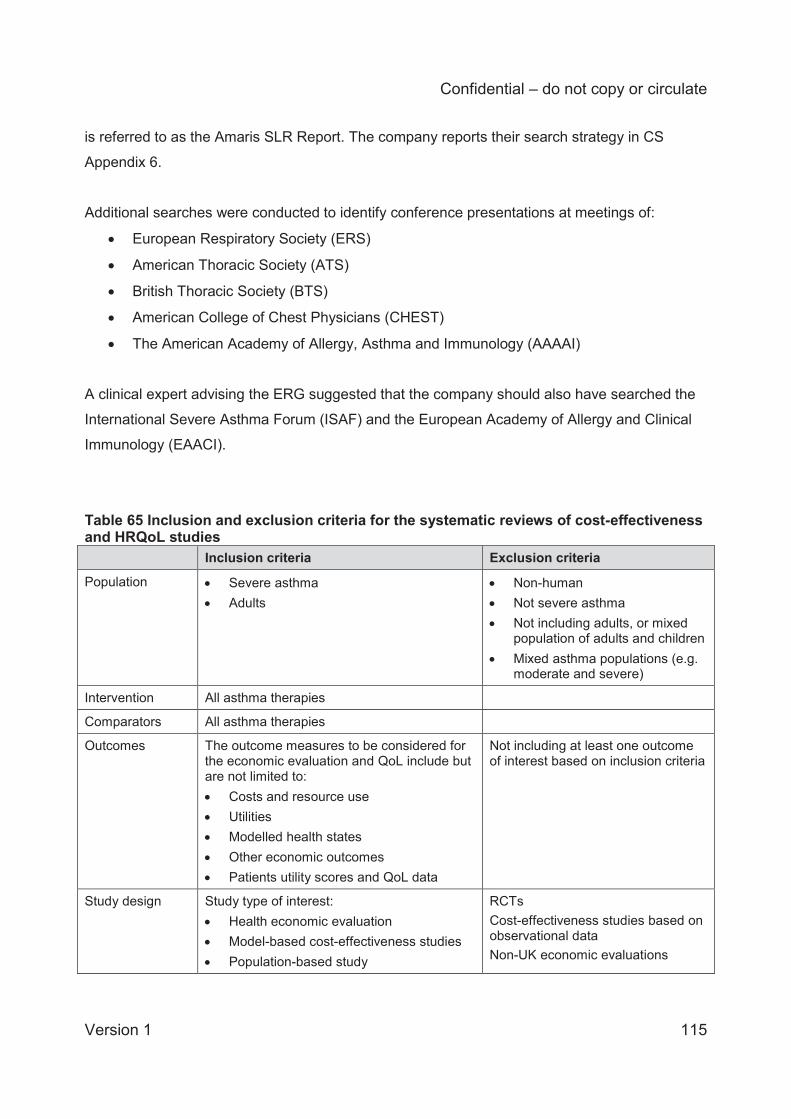
Confidential – do not copy or circulate
Version 1 115
is referred to as the Amaris SLR Report. The company reports their search strategy in CS
Appendix 6.
Additional searches were conducted to identify conference presentations at meetings of:
European Respiratory Society (ERS)
American Thoracic Society (ATS)
British Thoracic Society (BTS)
American College of Chest Physicians (CHEST)
The American Academy of Allergy, Asthma and Immunology (AAAAI)
A clinical expert advising the ERG suggested that the company should also have searched the
International Severe Asthma Forum (ISAF) and the European Academy of Allergy and Clinical
Immunology (EAACI).
Table 65 Inclusion and exclusion criteria for the systematic reviews of cost-effectiveness and HRQoL studies Inclusion criteria Exclusion criteria
Population Severe asthma Adults
Non-human Not severe asthma Not including adults, or mixed
population of adults and children Mixed asthma populations (e.g.
moderate and severe)
Intervention All asthma therapies
Comparators All asthma therapies
Outcomes The outcome measures to be considered for the economic evaluation and QoL include but are not limited to: Costs and resource use Utilities Modelled health states Other economic outcomes Patients utility scores and QoL data
Not including at least one outcome of interest based on inclusion criteria
Study design Study type of interest: Health economic evaluation Model-based cost-effectiveness studies Population-based study
RCTs Cost-effectiveness studies based on observational data Non-UK economic evaluations
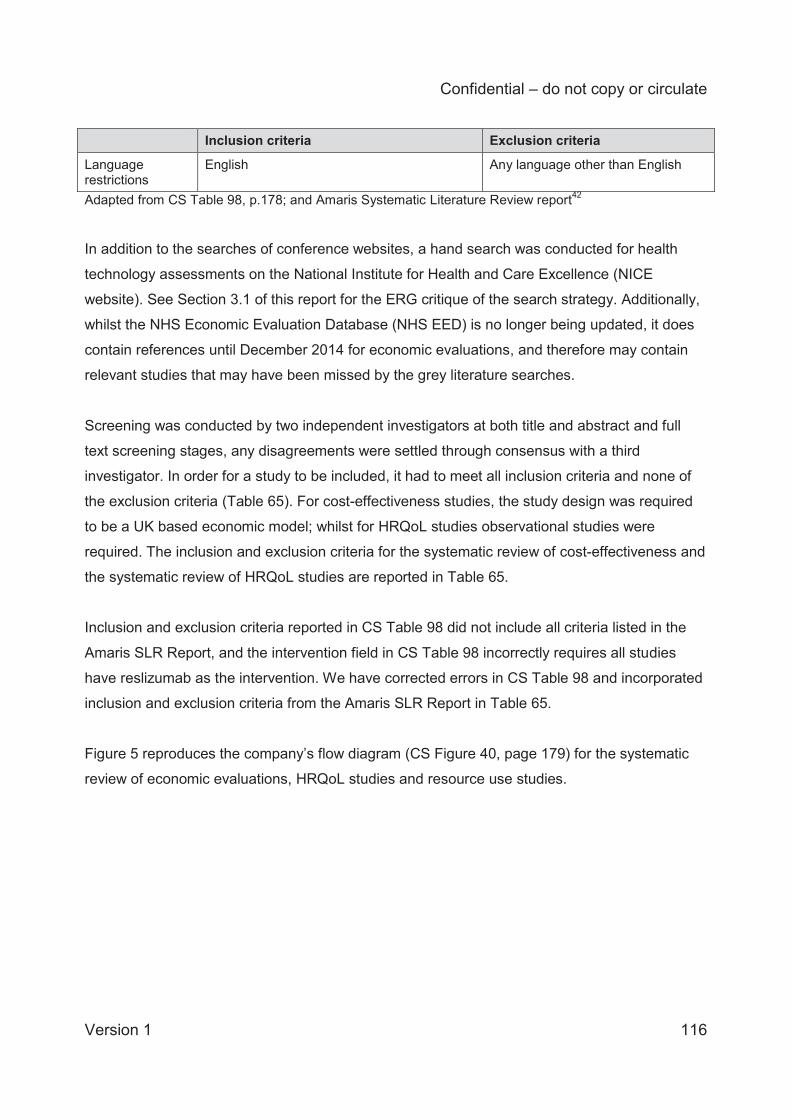
Confidential – do not copy or circulate
Version 1 116
Inclusion criteria Exclusion criteria
Language restrictions
English Any language other than English
Adapted from CS Table 98, p.178; and Amaris Systematic Literature Review report42
In addition to the searches of conference websites, a hand search was conducted for health
technology assessments on the National Institute for Health and Care Excellence (NICE
website). See Section 3.1 of this report for the ERG critique of the search strategy. Additionally,
whilst the NHS Economic Evaluation Database (NHS EED) is no longer being updated, it does
contain references until December 2014 for economic evaluations, and therefore may contain
relevant studies that may have been missed by the grey literature searches.
Screening was conducted by two independent investigators at both title and abstract and full
text screening stages, any disagreements were settled through consensus with a third
investigator. In order for a study to be included, it had to meet all inclusion criteria and none of
the exclusion criteria (Table 65). For cost-effectiveness studies, the study design was required
to be a UK based economic model; whilst for HRQoL studies observational studies were
required. The inclusion and exclusion criteria for the systematic review of cost-effectiveness and
the systematic review of HRQoL studies are reported in Table 65.
Inclusion and exclusion criteria reported in CS Table 98 did not include all criteria listed in the
Amaris SLR Report, and the intervention field in CS Table 98 incorrectly requires all studies
have reslizumab as the intervention. We have corrected errors in CS Table 98 and incorporated
inclusion and exclusion criteria from the Amaris SLR Report in Table 65.
Figure 5 reproduces the company’s flow diagram (CS Figure 40, page 179) for the systematic
review of economic evaluations, HRQoL studies and resource use studies.
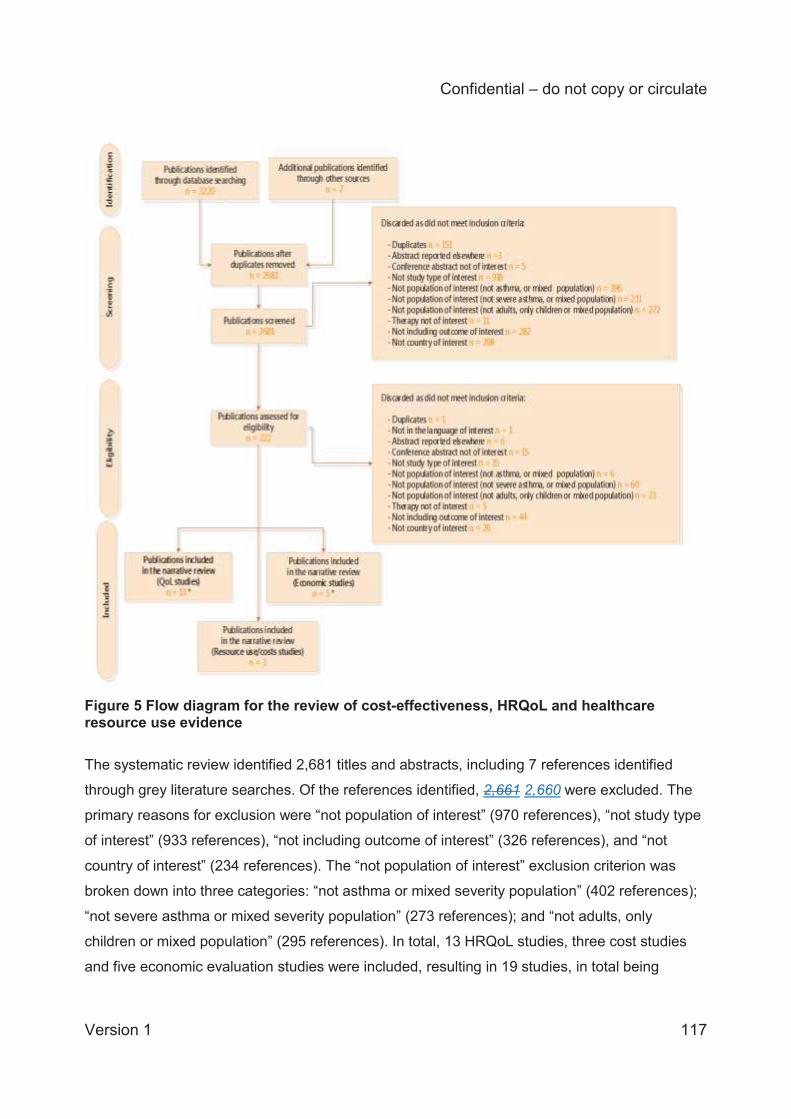
Confidential – do not copy or circulate
Version 1 117
Figure 5 Flow diagram for the review of cost-effectiveness, HRQoL and healthcare resource use evidence
The systematic review identified 2,681 titles and abstracts, including 7 references identified
through grey literature searches. Of the references identified, 2,661 2,660 were excluded. The
primary reasons for exclusion were “not population of interest” (970 references), “not study type
of interest” (933 references), “not including outcome of interest” (326 references), and “not
country of interest” (234 references). The “not population of interest” exclusion criterion was
broken down into three categories: “not asthma or mixed severity population” (402 references);
“not severe asthma or mixed severity population” (273 references); and “not adults, only
children or mixed population” (295 references). In total, 13 HRQoL studies, three cost studies
and five economic evaluation studies were included, resulting in 19 studies, in total being
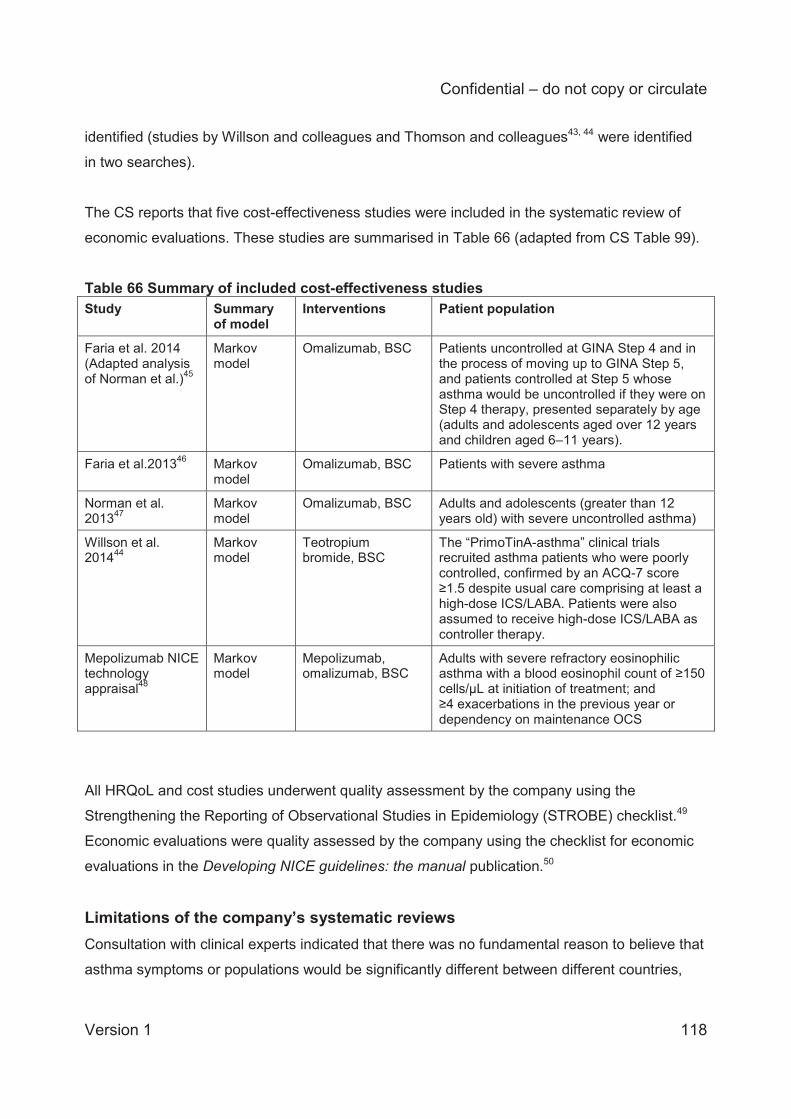
Confidential – do not copy or circulate
Version 1 118
identified (studies by Willson and colleagues and Thomson and colleagues43, 44 were identified
in two searches).
The CS reports that five cost-effectiveness studies were included in the systematic review of
economic evaluations. These studies are summarised in Table 66 (adapted from CS Table 99).
Table 66 Summary of included cost-effectiveness studies Study Summary
of model Interventions Patient population
Faria et al. 2014 (Adapted analysis of Norman et al.)45
Markov model
Omalizumab, BSC Patients uncontrolled at GINA Step 4 and in the process of moving up to GINA Step 5, and patients controlled at Step 5 whose asthma would be uncontrolled if they were on Step 4 therapy, presented separately by age (adults and adolescents aged over 12 years and children aged 6–11 years).
Faria et al.201346 Markov model
Omalizumab, BSC Patients with severe asthma
Norman et al. 201347
Markov model
Omalizumab, BSC Adults and adolescents (greater than 12 years old) with severe uncontrolled asthma)
Willson et al. 201444
Markov model
Teotropium bromide, BSC
The “PrimoTinA-asthma” clinical trials recruited asthma patients who were poorly controlled, confirmed by an ACQ-7 score ≥1.5 despite usual care comprising at least a high-dose ICS/LABA. Patients were also assumed to receive high-dose ICS/LABA as controller therapy.
Mepolizumab NICE technology appraisal48
Markov model
Mepolizumab, omalizumab, BSC
Adults with severe refractory eosinophilic asthma with a blood eosinophil count of ≥150 cells/μL at initiation of treatment; and ≥4 exacerbations in the previous year or dependency on maintenance OCS
All HRQoL and cost studies underwent quality assessment by the company using the
Strengthening the Reporting of Observational Studies in Epidemiology (STROBE) checklist.49
Economic evaluations were quality assessed by the company using the checklist for economic
evaluations in the Developing NICE guidelines: the manual publication.50
Limitations of the company’s systematic reviews Consultation with clinical experts indicated that there was no fundamental reason to believe that
asthma symptoms or populations would be significantly different between different countries,
Confidential – do not copy or circulate
Version 1 119
which weakens any justification for limiting economic evaluations to the UK. We ran some
targeted searches to identify whether some studies may have been missed due to the
company’s exclusion criteria. In the CRD NHS EED and HTA databases we used the search
term “severe asthma,” and imposed no limitations on mixed populations, country of origin, or
study design (non-UK models and RCTs were allowed). We limited studies to those published in
the last 15 years with adult populations. This search identified four economic evaluations not
identified by the company’s searches: Brown and colleagues,51 Dewilde and colleagues,52
Gerzeli and colleagues,53 and Morishima and colleagues.54 Brown and colleagues, Dewilde and
colleagues, and Morishima and colleagues were omalizumab economic evaluations in patients
with severe asthma.51, 52, 54 Gerzeli and colleagues evaluated the cost-effectiveness of
beclomethasone/formoterol versus fluticasone propionate/salmeterol in patients with moderate
to severe asthma.
In addition to the limitations of the company’s systematic reviews noted above, the systematic
reviews of HRQoL and resource use/cost studies did not include RCTs, which had the effect of
excluding the pivotal reslizumab RCTs from consideration in the HRQoL review.19
It is unclear whether any of the mixed population studies contained data on relevant subgroups,
so it is possible that relevant data and analyses were excluded from consideration. Given that
there were hundreds of studies excluded for this reason, it was not feasible for the ERG to
assess the relevance of these studies. It is also unclear why economic evaluations and HRQoL
data from outside the UK were not considered relevant. It is understandable to omit resource
use and cost data as these data are often healthcare system dependent, but HRQoL data are
often applicable across countries and economic models are frequently adaptable to multiple
settings.
4.3 Critical appraisal of the company’s submitted economic evaluation The following sections outline the ERG critical appraisal of the company’s submitted economic
evaluation.
4.3.1 NICE reference case
We have used the NICE reference case requirements to critically appraise the company’s
submitted economic evaluation, as shown in Table 67.
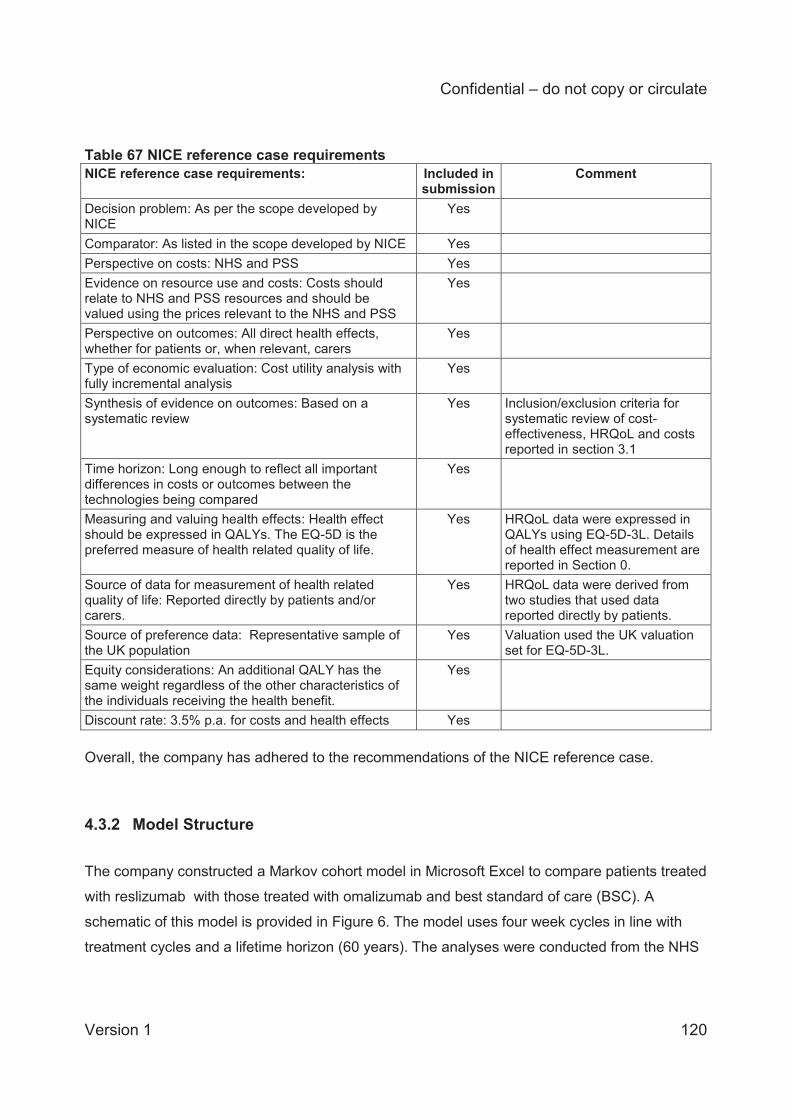
Confidential – do not copy or circulate
Version 1 120
Table 67 NICE reference case requirements NICE reference case requirements:
Included in submission
Comment
Decision problem: As per the scope developed by NICE
Yes
Comparator: As listed in the scope developed by NICE Yes Perspective on costs: NHS and PSS Yes Evidence on resource use and costs: Costs should relate to NHS and PSS resources and should be valued using the prices relevant to the NHS and PSS
Yes
Perspective on outcomes: All direct health effects, whether for patients or, when relevant, carers
Yes
Type of economic evaluation: Cost utility analysis with fully incremental analysis
Yes
Synthesis of evidence on outcomes: Based on a systematic review
Yes Inclusion/exclusion criteria for systematic review of cost-effectiveness, HRQoL and costs reported in section 3.1
Time horizon: Long enough to reflect all important differences in costs or outcomes between the technologies being compared
Yes
Measuring and valuing health effects: Health effect should be expressed in QALYs. The EQ-5D is the preferred measure of health related quality of life.
Yes HRQoL data were expressed in QALYs using EQ-5D-3L. Details of health effect measurement are reported in Section 0.
Source of data for measurement of health related quality of life: Reported directly by patients and/or carers.
Yes HRQoL data were derived from two studies that used data reported directly by patients.
Source of preference data: Representative sample of the UK population
Yes Valuation used the UK valuation set for EQ-5D-3L.
Equity considerations: An additional QALY has the same weight regardless of the other characteristics of the individuals receiving the health benefit.
Yes
Discount rate: 3.5% p.a. for costs and health effects Yes Overall, the company has adhered to the recommendations of the NICE reference case.
4.3.2 Model Structure
The company constructed a Markov cohort model in Microsoft Excel to compare patients treated
with reslizumab with those treated with omalizumab and best standard of care (BSC). A
schematic of this model is provided in Figure 6. The model uses four week cycles in line with
treatment cycles and a lifetime horizon (60 years). The analyses were conducted from the NHS
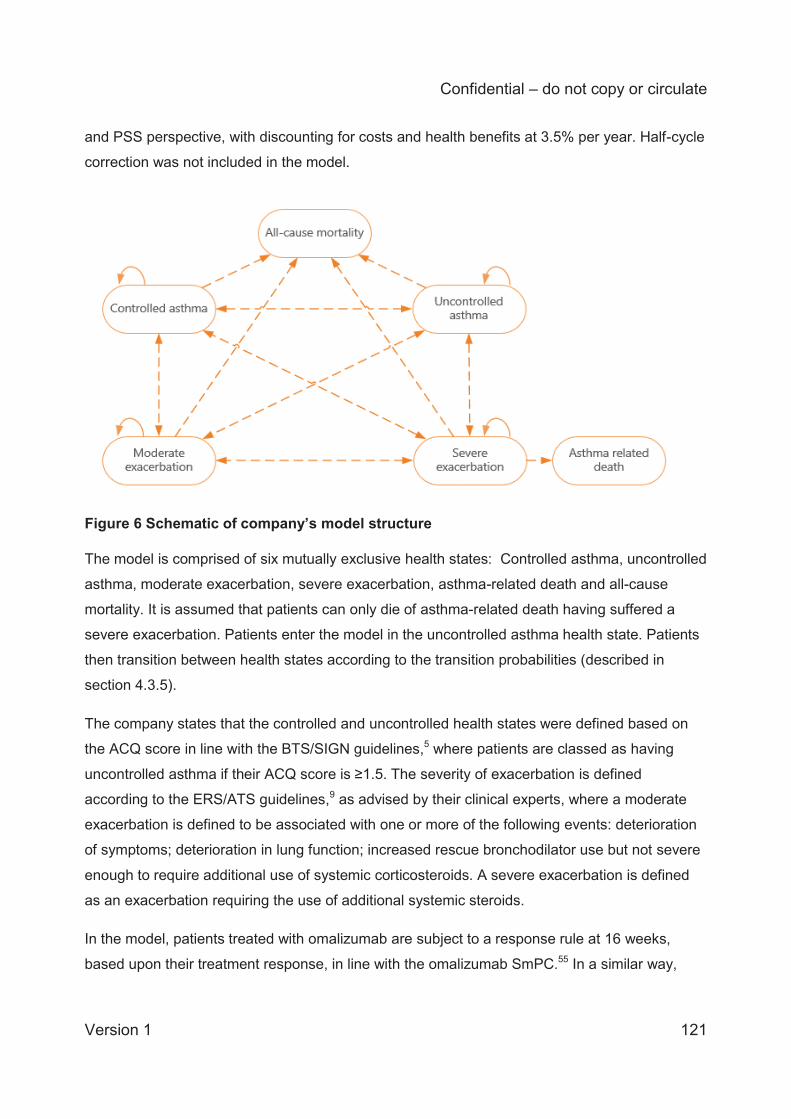
Confidential – do not copy or circulate
Version 1 121
and PSS perspective, with discounting for costs and health benefits at 3.5% per year. Half-cycle
correction was not included in the model.
Figure 6 Schematic of company’s model structure The model is comprised of six mutually exclusive health states: Controlled asthma, uncontrolled
asthma, moderate exacerbation, severe exacerbation, asthma-related death and all-cause
mortality. It is assumed that patients can only die of asthma-related death having suffered a
severe exacerbation. Patients enter the model in the uncontrolled asthma health state. Patients
then transition between health states according to the transition probabilities (described in
section 4.3.5).
The company states that the controlled and uncontrolled health states were defined based on
the ACQ score in line with the BTS/SIGN guidelines,5 where patients are classed as having
uncontrolled asthma if their ACQ score is ≥1.5. The severity of exacerbation is defined
according to the ERS/ATS guidelines,9 as advised by their clinical experts, where a moderate
exacerbation is defined to be associated with one or more of the following events: deterioration
of symptoms; deterioration in lung function; increased rescue bronchodilator use but not severe
enough to require additional use of systemic corticosteroids. A severe exacerbation is defined
as an exacerbation requiring the use of additional systemic steroids.
In the model, patients treated with omalizumab are subject to a response rule at 16 weeks,
based upon their treatment response, in line with the omalizumab SmPC.55 In a similar way,
Confidential – do not copy or circulate
Version 1 122
patients treated with reslizumab are assessed for response at XXXXXXXX and the company
states that this time-point was chosen because it represents the time by which improvements in
asthma impairment can be measured in most patients based on the results of the Phase 3 trials.
The assessment of treatment response is calculated using
‘XXXXXXXXXXXXXXXXXXXXXXXXXXXXXXXXXXXXXXXXXXXXXXXXXXXXXXXXXXXXXXX
XXXXXXXXXXXXXXXXXXXXXXXXXXXXXXXXXXXXXXXXXXXXXXXXXXXXXXXXXXXXXXX
XXXXXXXXXXXXXXXXXXXXXXXXXXXXXXXXXXXXXXXXXXXXXXXXXXXXXXXXXXXXXXX
XXXXXXX.
‘XXXXXXXXXXXXXXXXXXXXXXXXXXXXXXXXXXXXXXXXXXXXXXXXXXXXXXXXXXXXXXX
XXXXXXXXXXXXXXXXXXXXXXXXXXXXXXXXXXXXXXXXXXXXXXXXXXXXXXXXXXXXXXX
XXXXXXXXXXXXXXXXXXXXXXXXXXXXXXXXXXXXXXXXXXXXXXXXXXXXX
In the model, patients identified as non-responders transfer to the BSC treatment arm and then
observe the BSC transition probabilities and costs for the remainder of the time horizon. Other
patients (responders and those with an undetermined response status) are assumed to continue
treatment beyond 16 weeks. In the model, patients are assumed to be assessed every year in
line with the reslizumab SmPC. Patients who remain in the uncontrolled or exacerbation health
states for one year will discontinue treatment. The company states that this assumption was
validated by a panel of UK clinical experts. Patients treated with omalizumab follow the same
discontinuation rules.
The company does not provide a rationale for the choice of model structure. The ERG considers
the company’s model structure to be appropriate. We note that it differs from the structure used
in previous technology appraisals for omalizumab12 and mepolizumab.56 Further, other previous
published models for severe asthma have used slightly different model structures. The
technology appraisal for omalizumab uses states for ‘day to day asthma symptoms’ (on either
omalizumab or standard therapy), rather than uncontrolled and controlled health states. The
technology appraisal for mepolizumab was based on a treatment model with health states for
on-treatment pre-assessment, on-treatment post-assessment and off-treatment and death.
4.3.3 Population
The population defined in the NICE scope is adults with asthma and elevated blood eosinophils
inadequately controlled by inhaled corticosteroids. This population is considered equivalent to
Confidential – do not copy or circulate
Version 1 123
patients at Steps 4 and 5 of the BTS/SIGN and GINA treatment pathway (Figure 7).5 Patient
characteristics in the different arms of the pivotal trials used in this assessment were considered
similar and well balanced, with a mean age from 43.0 years (trial 3081) to 47.5 years (trial 3083)
and with more females enrolled in each trial than males (see section 3.1.3.2). The patient
population considered for the company base case analysis was adult patients with asthma and
elevated blood eosinophils aged 46.8 years with 63% females, at GINA Steps 4 and 5, who had
experienced at least three exacerbations in the preceding year. It is not clear from the NICE
scope how “elevated blood eosinophils” is defined in clinical practice, and the scope does not
specify the number of exacerbations experienced in the preceding year. However, a clinical
expert advising the ERG agreed that the threshold of 400 cells/μL for elevated blood
eosinophils, and the distinction of ≥3 exacerbations employed by the company are reasonable.
We also note that the second Appraisal Consultation Document for mepolizumab (June 2016)
stated that the committee concluded for that appraisal that a blood eosinophil count of 300
cells/μL (ACD2 4.4, page 28) and ≥4 exacerbations in the previous year (ACD2 4.5, page 28)
were appropriate criteria to define the population of interest. For comparison, the marketing
authorisation for mepolizumab (“severe refractory eosinophilc asthma in adults”) is different to
the marketing authorisation for reslizumab (“adult patients with severe eosinophilic asthma
inadequately controlled despite high-dose ICS plus another medicinal product for maintenance
treatment”).
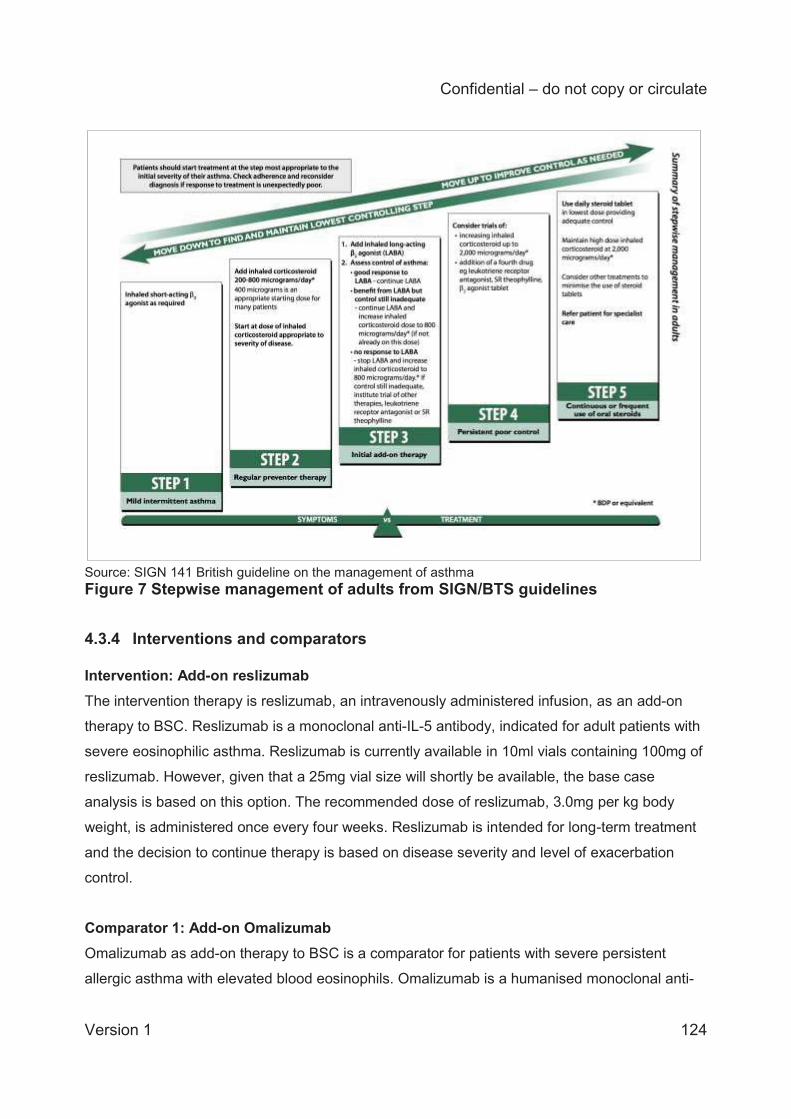
Confidential – do not copy or circulate
Version 1 124
Source: SIGN 141 British guideline on the management of asthma Figure 7 Stepwise management of adults from SIGN/BTS guidelines
4.3.4 Interventions and comparators Intervention: Add-on reslizumab The intervention therapy is reslizumab, an intravenously administered infusion, as an add-on
therapy to BSC. Reslizumab is a monoclonal anti-IL-5 antibody, indicated for adult patients with
severe eosinophilic asthma. Reslizumab is currently available in 10ml vials containing 100mg of
reslizumab. However, given that a 25mg vial size will shortly be available, the base case
analysis is based on this option. The recommended dose of reslizumab, 3.0mg per kg body
weight, is administered once every four weeks. Reslizumab is intended for long-term treatment
and the decision to continue therapy is based on disease severity and level of exacerbation
control.
Comparator 1: Add-on Omalizumab Omalizumab as add-on therapy to BSC is a comparator for patients with severe persistent
allergic asthma with elevated blood eosinophils. Omalizumab is a humanised monoclonal anti-
Confidential – do not copy or circulate
Version 1 125
lgE antibody, recommended by NICE (TA278) as an option for treating severe persistent
confirmed allergic lgE-mediated asthma in people who need continuous or frequent treatment
with oral corticosteroids (defined as 4 or more courses in the previous year). The add-on
omalizumab considered in this submission is available in a 75mg pre-filled syringe, administered
every four weeks.
Comparator 2: Best standard of care (BSC) alone BSC is defined in the CS as being based on the use of a Personal Asthma Action Plan, the
avoidance of environmental/dietary triggers and the use of recommended medications
(described in section 2.3). The CS states that their definition matches the BTS/SIGN guidelines.
In the company model, BSC was given the same effect as the placebo arms from the pivotal
trials.
The anti-IL-5 monoclonal antibody mepolizumab is licensed as an add-on treatment for severe
refractory eosinophilic asthma in adults, but is not considered as a comparator in the NICE
scope for this assessment.
4.3.5 Clinical effectiveness parameters
For each treatment arm, the company estimated sets of probabilities for transitions between the
six health states in their model: “controlled asthma”, uncontrolled asthma”, “moderate
exacerbations” and “severe exacerbations”, and the two mortality states “asthma related
mortality” and “all-cause mortality”.
As noted above, for the two active treatment arms (reslizumab and omalizumab) the model
included assessments for response at week 16, at week 52, and at each year thereafter, and
patients categorised as non-responders at these times were assumed to stop treatment and
transfer to the BSC arm. The model therefore included three sets of transition probabilities for
reslizumab and for omalizumab, covering the three periods of time: 0 to 16 weeks, 16-52 weeks
and post 52 weeks. Thus, the model included 7 transition matrices in total: one for BSC and
three each for reslizumab and omalizumab.
Confidential – do not copy or circulate
Version 1 126
The company conducted a systematic literature review and direct and indirect meta-analyses to
identify and summarise evidence of the efficacy and safety of reslizumab versus BSC and
versus omalizumab, as described in section 3 above. However, they used data from separate
arms of studies 3082 and 3083 to estimate the transition matrices for BSC and reslizumab,
rather than using comparative relative risk estimates from their meta-analysis. The company
reports that transition probabilities for omalizumab were estimated using relative rates of
exacerbations compared with BSC from their ITC report (see section 3.1.7.3) for 0-16 weeks,
and from the omalizumab HTA 45 for post-16 weeks.
Each transition matrix was estimated using a four stage process:
1) the conditional probabilities of transitions between the three mutually exclusive states of
controlled asthma, uncontrolled asthma and exacerbation (pooling together moderate and
severe) were estimated;
2) the exacerbation probabilities were adjusted using a multiplier based on the observed rates
of exacerbations in the year before baseline in studies 3082 and 3083, in an attempt to
reflect rates of exacerbations expected in clinical practice;
3) the exacerbations were then divided into ‘moderate’ and ‘severe’ categories, based on an
estimate of the percentage of exacerbations that were severe in studies 3082 and 3083;
and
4) the probabilities of non-fatal transitions were adjusted for asthma-related mortality following
hospitalisation (estimated by a clinical expert) due to severe exacerbations57 and for all-
cause mortality.
The sources and methods of calculation for each set of transition probabilities are described in
more detail below.
4.3.5.1 BSC treatment arm For the BSC arm, transition probabilities were computed using patient level data from the
placebo arms of trials 3082 and 3083. Within these studies, the patients were classified in one
of three mutually-exclusive health states at each study visit: controlled asthma, uncontrolled
asthma and exacerbation (including both moderate and severe exacerbations). The sample
used to estimate the transition probabilities was the subgroup of adult patients (aged 18 years
or older), at steps 4 or 5 in the GINA pathway, who had experienced at least 2 exacerbations in
the preceding year (n=159). The company stated that they used this subgroup as the size of the
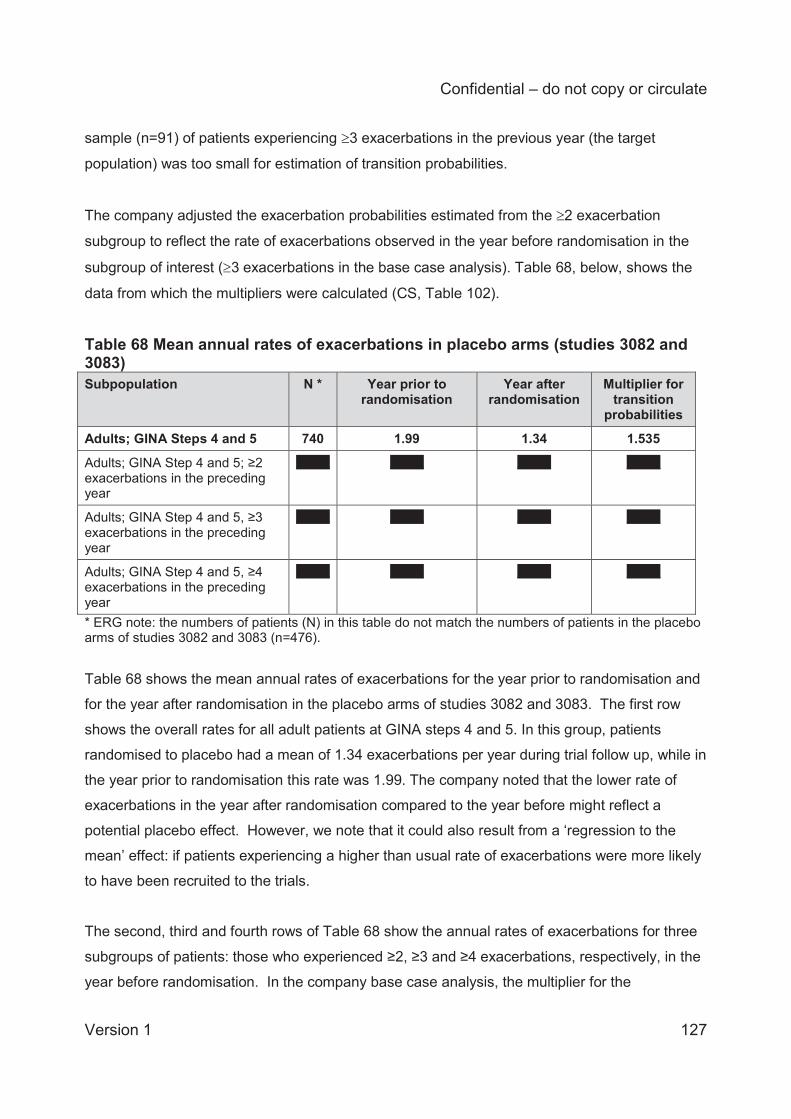
Confidential – do not copy or circulate
Version 1 127
sample (n=91) of patients experiencing 3 exacerbations in the previous year (the target
population) was too small for estimation of transition probabilities.
The company adjusted the exacerbation probabilities estimated from the 2 exacerbation
subgroup to reflect the rate of exacerbations observed in the year before randomisation in the
subgroup of interest ( 3 exacerbations in the base case analysis). Table 68, below, shows the
data from which the multipliers were calculated (CS, Table 102).
Table 68 Mean annual rates of exacerbations in placebo arms (studies 3082 and 3083) Subpopulation N * Year prior to
randomisation Year after
randomisation Multiplier for
transition probabilities
Adults; GINA Steps 4 and 5 740 1.99 1.34 1.535
Adults; GINA Step 4 and 5; ≥2 exacerbations in the preceding year
XXXX XXXX XXXX XXXX
Adults; GINA Step 4 and 5, ≥3 exacerbations in the preceding year
XXXX XXXX XXXX XXXX
Adults; GINA Step 4 and 5, ≥4 exacerbations in the preceding year
XXXX XXXX XXXX XXXX
* ERG note: the numbers of patients (N) in this table do not match the numbers of patients in the placebo arms of studies 3082 and 3083 (n=476).
Table 68 shows the mean annual rates of exacerbations for the year prior to randomisation and
for the year after randomisation in the placebo arms of studies 3082 and 3083. The first row
shows the overall rates for all adult patients at GINA steps 4 and 5. In this group, patients
randomised to placebo had a mean of 1.34 exacerbations per year during trial follow up, while in
the year prior to randomisation this rate was 1.99. The company noted that the lower rate of
exacerbations in the year after randomisation compared to the year before might reflect a
potential placebo effect. However, we note that it could also result from a ‘regression to the
mean’ effect: if patients experiencing a higher than usual rate of exacerbations were more likely
to have been recruited to the trials.
The second, third and fourth rows of Table 68 show the annual rates of exacerbations for three
subgroups of patients: those who experienced ≥2, ≥3 and ≥4 exacerbations, respectively, in the
year before randomisation. In the company base case analysis, the multiplier for the
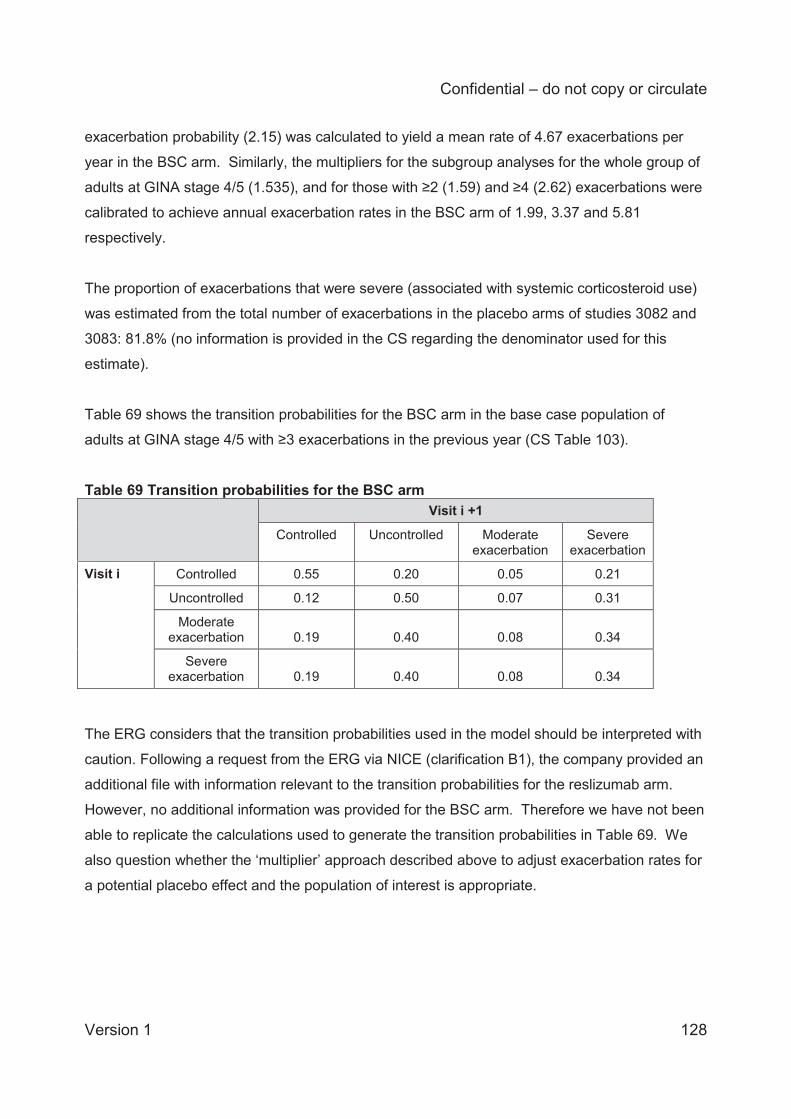
Confidential – do not copy or circulate
Version 1 128
exacerbation probability (2.15) was calculated to yield a mean rate of 4.67 exacerbations per
year in the BSC arm. Similarly, the multipliers for the subgroup analyses for the whole group of
adults at GINA stage 4/5 (1.535), and for those with ≥2 (1.59) and ≥4 (2.62) exacerbations were
calibrated to achieve annual exacerbation rates in the BSC arm of 1.99, 3.37 and 5.81
respectively.
The proportion of exacerbations that were severe (associated with systemic corticosteroid use)
was estimated from the total number of exacerbations in the placebo arms of studies 3082 and
3083: 81.8% (no information is provided in the CS regarding the denominator used for this
estimate).
Table 69 shows the transition probabilities for the BSC arm in the base case population of
adults at GINA stage 4/5 with ≥3 exacerbations in the previous year (CS Table 103).
Table 69 Transition probabilities for the BSC arm Visit i +1
Controlled Uncontrolled Moderate exacerbation
Severe exacerbation
Visit i Controlled 0.55 0.20 0.05 0.21
Uncontrolled 0.12 0.50 0.07 0.31
Moderate exacerbation 0.19 0.40 0.08 0.34
Severe exacerbation 0.19 0.40 0.08 0.34
The ERG considers that the transition probabilities used in the model should be interpreted with
caution. Following a request from the ERG via NICE (clarification B1), the company provided an
additional file with information relevant to the transition probabilities for the reslizumab arm.
However, no additional information was provided for the BSC arm. Therefore we have not been
able to replicate the calculations used to generate the transition probabilities in Table 69. We
also question whether the ‘multiplier’ approach described above to adjust exacerbation rates for
a potential placebo effect and the population of interest is appropriate.
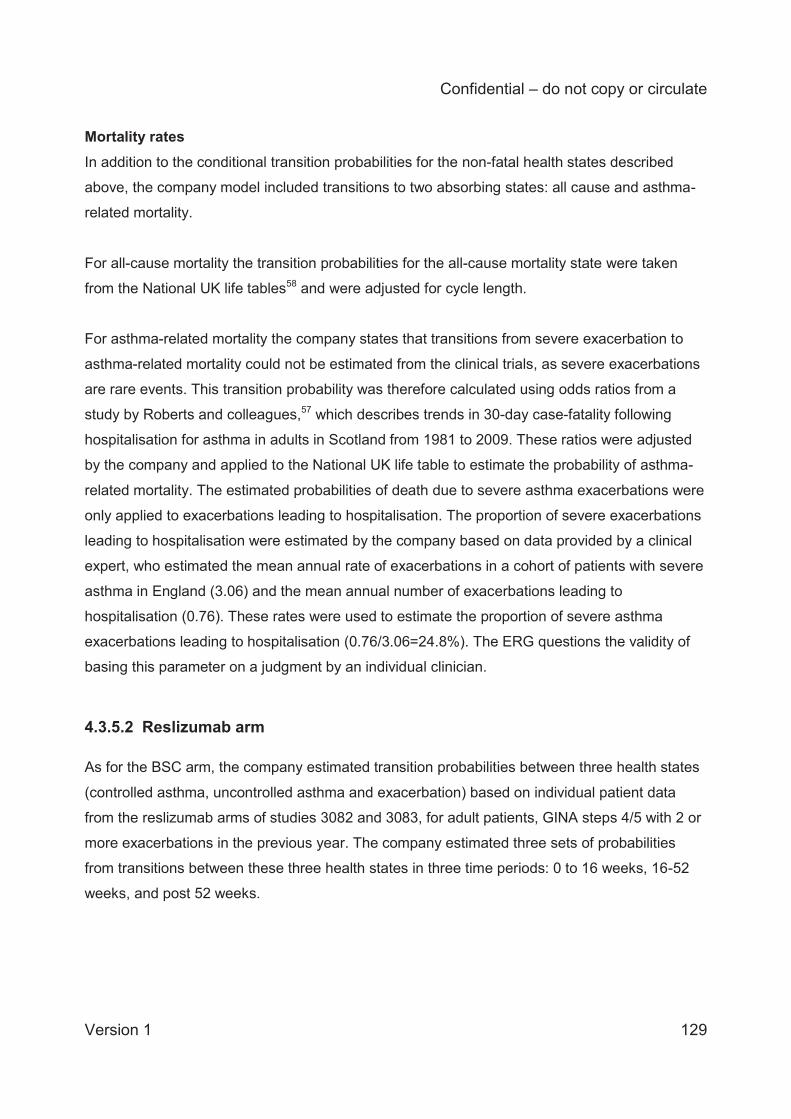
Confidential – do not copy or circulate
Version 1 129
Mortality rates
In addition to the conditional transition probabilities for the non-fatal health states described
above, the company model included transitions to two absorbing states: all cause and asthma-
related mortality.
For all-cause mortality the transition probabilities for the all-cause mortality state were taken
from the National UK life tables58 and were adjusted for cycle length.
For asthma-related mortality the company states that transitions from severe exacerbation to
asthma-related mortality could not be estimated from the clinical trials, as severe exacerbations
are rare events. This transition probability was therefore calculated using odds ratios from a
study by Roberts and colleagues,57 which describes trends in 30-day case-fatality following
hospitalisation for asthma in adults in Scotland from 1981 to 2009. These ratios were adjusted
by the company and applied to the National UK life table to estimate the probability of asthma-
related mortality. The estimated probabilities of death due to severe asthma exacerbations were
only applied to exacerbations leading to hospitalisation. The proportion of severe exacerbations
leading to hospitalisation were estimated by the company based on data provided by a clinical
expert, who estimated the mean annual rate of exacerbations in a cohort of patients with severe
asthma in England (3.06) and the mean annual number of exacerbations leading to
hospitalisation (0.76). These rates were used to estimate the proportion of severe asthma
exacerbations leading to hospitalisation (0.76/3.06=24.8%). The ERG questions the validity of
basing this parameter on a judgment by an individual clinician.
4.3.5.2 Reslizumab arm As for the BSC arm, the company estimated transition probabilities between three health states
(controlled asthma, uncontrolled asthma and exacerbation) based on individual patient data
from the reslizumab arms of studies 3082 and 3083, for adult patients, GINA steps 4/5 with 2 or
more exacerbations in the previous year. The company estimated three sets of probabilities
from transitions between these three health states in three time periods: 0 to 16 weeks, 16-52
weeks, and post 52 weeks.
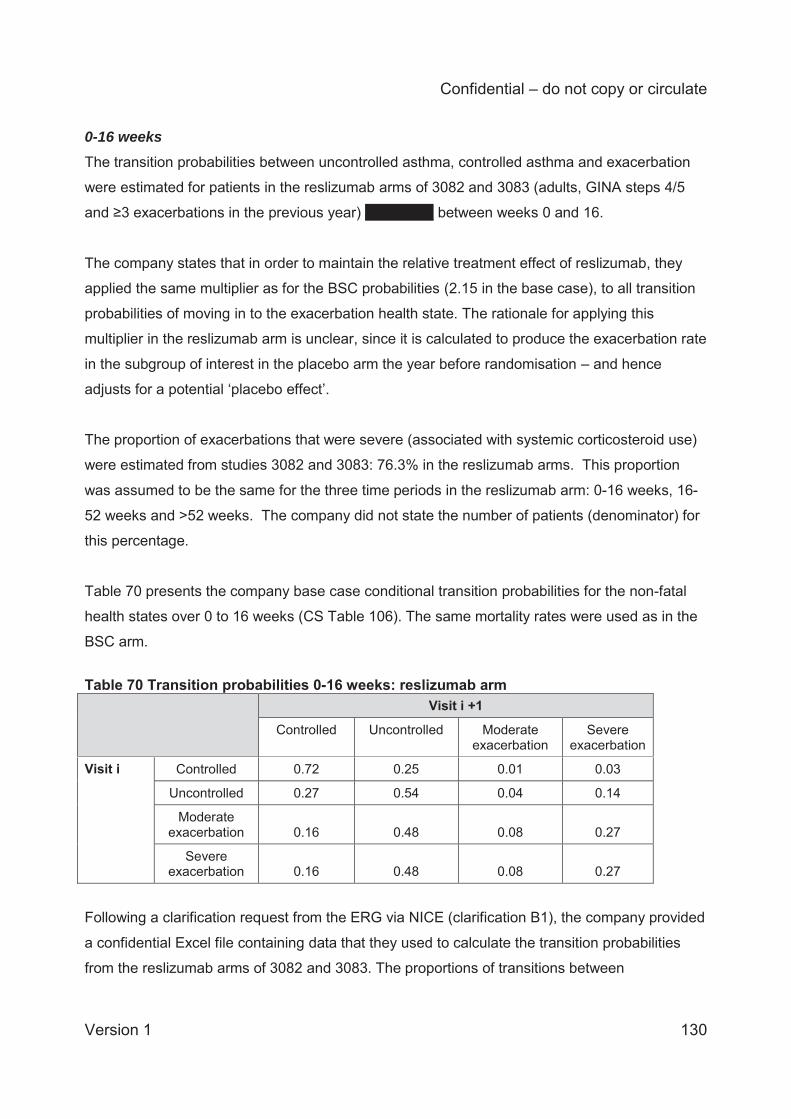
Confidential – do not copy or circulate
Version 1 130
0-16 weeks The transition probabilities between uncontrolled asthma, controlled asthma and exacerbation
were estimated for patients in the reslizumab arms of 3082 and 3083 (adults, GINA steps 4/5
and ≥3 exacerbations in the previous year) XXXXXXX between weeks 0 and 16.
The company states that in order to maintain the relative treatment effect of reslizumab, they
applied the same multiplier as for the BSC probabilities (2.15 in the base case), to all transition
probabilities of moving in to the exacerbation health state. The rationale for applying this
multiplier in the reslizumab arm is unclear, since it is calculated to produce the exacerbation rate
in the subgroup of interest in the placebo arm the year before randomisation – and hence
adjusts for a potential ‘placebo effect’.
The proportion of exacerbations that were severe (associated with systemic corticosteroid use)
were estimated from studies 3082 and 3083: 76.3% in the reslizumab arms. This proportion
was assumed to be the same for the three time periods in the reslizumab arm: 0-16 weeks, 16-
52 weeks and >52 weeks. The company did not state the number of patients (denominator) for
this percentage.
Table 70 presents the company base case conditional transition probabilities for the non-fatal
health states over 0 to 16 weeks (CS Table 106). The same mortality rates were used as in the
BSC arm.
Table 70 Transition probabilities 0-16 weeks: reslizumab arm Visit i +1
Controlled Uncontrolled Moderate exacerbation
Severe exacerbation
Visit i Controlled 0.72 0.25 0.01 0.03
Uncontrolled 0.27 0.54 0.04 0.14
Moderate exacerbation 0.16 0.48 0.08 0.27
Severe exacerbation 0.16 0.48 0.08 0.27
Following a clarification request from the ERG via NICE (clarification B1), the company provided
a confidential Excel file containing data that they used to calculate the transition probabilities
from the reslizumab arms of 3082 and 3083. The proportions of transitions between
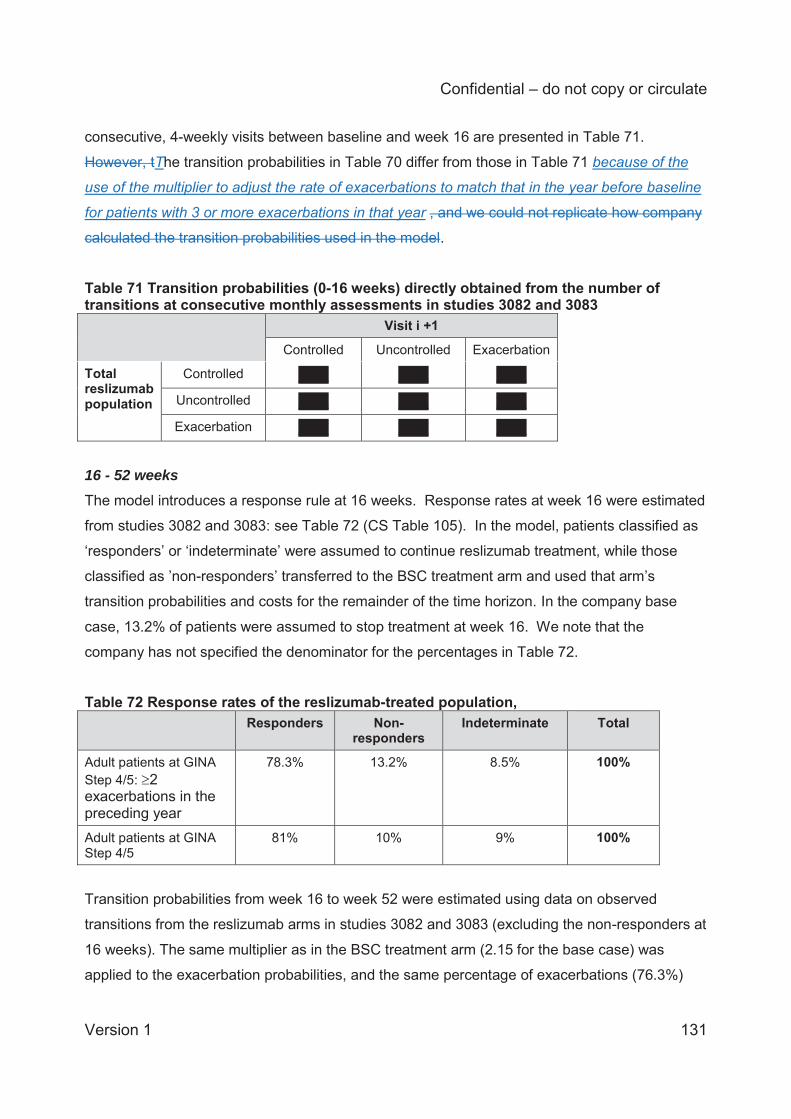
Confidential – do not copy or circulate
Version 1 131
consecutive, 4-weekly visits between baseline and week 16 are presented in Table 71.
However, tThe transition probabilities in Table 70 differ from those in Table 71 because of the
use of the multiplier to adjust the rate of exacerbations to match that in the year before baseline
for patients with 3 or more exacerbations in that year , and we could not replicate how company
calculated the transition probabilities used in the model.
Table 71 Transition probabilities (0-16 weeks) directly obtained from the number of transitions at consecutive monthly assessments in studies 3082 and 3083 Visit i +1
Controlled Uncontrolled Exacerbation
Total reslizumab population
Controlled XXXX XXXX XXXX
Uncontrolled XXXX XXXX XXXX
Exacerbation XXXX XXXX XXXX
16 - 52 weeks The model introduces a response rule at 16 weeks. Response rates at week 16 were estimated
from studies 3082 and 3083: see Table 72 (CS Table 105). In the model, patients classified as
‘responders’ or ‘indeterminate’ were assumed to continue reslizumab treatment, while those
classified as ’non-responders’ transferred to the BSC treatment arm and used that arm’s
transition probabilities and costs for the remainder of the time horizon. In the company base
case, 13.2% of patients were assumed to stop treatment at week 16. We note that the
company has not specified the denominator for the percentages in Table 72.
Table 72 Response rates of the reslizumab-treated population, Responders Non-
responders Indeterminate Total
Adult patients at GINA Step 4/5: 2 exacerbations in the preceding year
78.3% 13.2% 8.5% 100%
Adult patients at GINA Step 4/5
81% 10% 9% 100%
Transition probabilities from week 16 to week 52 were estimated using data on observed
transitions from the reslizumab arms in studies 3082 and 3083 (excluding the non-responders at
16 weeks). The same multiplier as in the BSC treatment arm (2.15 for the base case) was
applied to the exacerbation probabilities, and the same percentage of exacerbations (76.3%)
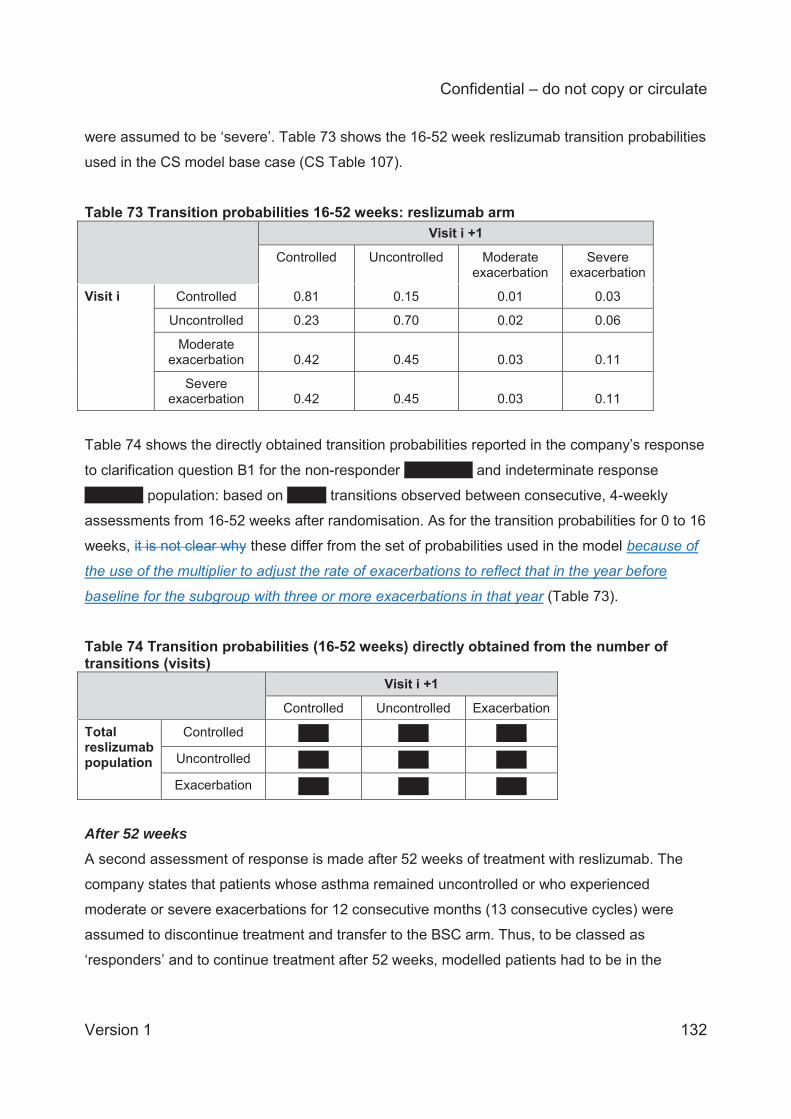
Confidential – do not copy or circulate
Version 1 132
were assumed to be ‘severe’. Table 73 shows the 16-52 week reslizumab transition probabilities
used in the CS model base case (CS Table 107).
Table 73 Transition probabilities 16-52 weeks: reslizumab arm Visit i +1
Controlled Uncontrolled Moderate exacerbation
Severe exacerbation
Visit i Controlled 0.81 0.15 0.01 0.03
Uncontrolled 0.23 0.70 0.02 0.06
Moderate exacerbation 0.42 0.45 0.03 0.11
Severe exacerbation 0.42 0.45 0.03 0.11
Table 74 shows the directly obtained transition probabilities reported in the company’s response
to clarification question B1 for the non-responder XXXXXXX and indeterminate response
XXXXXX population: based on XXXX transitions observed between consecutive, 4-weekly
assessments from 16-52 weeks after randomisation. As for the transition probabilities for 0 to 16
weeks, it is not clear why these differ from the set of probabilities used in the model because of
the use of the multiplier to adjust the rate of exacerbations to reflect that in the year before
baseline for the subgroup with three or more exacerbations in that year (Table 73).
Table 74 Transition probabilities (16-52 weeks) directly obtained from the number of transitions (visits) Visit i +1
Controlled Uncontrolled Exacerbation
Total reslizumab population
Controlled XXXX XXXX XXXX
Uncontrolled XXXX XXXX XXXX
Exacerbation XXXX XXXX XXXX
After 52 weeks A second assessment of response is made after 52 weeks of treatment with reslizumab. The
company states that patients whose asthma remained uncontrolled or who experienced
moderate or severe exacerbations for 12 consecutive months (13 consecutive cycles) were
assumed to discontinue treatment and transfer to the BSC arm. Thus, to be classed as
‘responders’ and to continue treatment after 52 weeks, modelled patients had to be in the
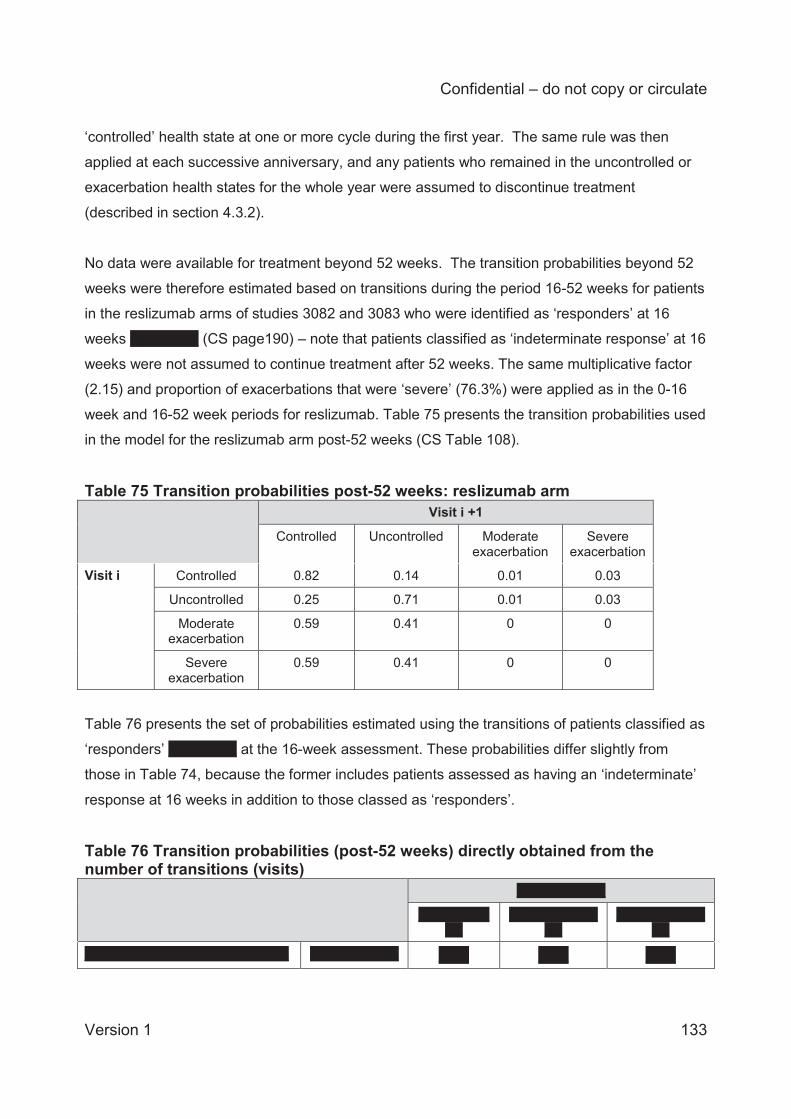
Confidential – do not copy or circulate
Version 1 133
‘controlled’ health state at one or more cycle during the first year. The same rule was then
applied at each successive anniversary, and any patients who remained in the uncontrolled or
exacerbation health states for the whole year were assumed to discontinue treatment
(described in section 4.3.2).
No data were available for treatment beyond 52 weeks. The transition probabilities beyond 52
weeks were therefore estimated based on transitions during the period 16-52 weeks for patients
in the reslizumab arms of studies 3082 and 3083 who were identified as ‘responders’ at 16
weeks XXXXXXX (CS page190) – note that patients classified as ‘indeterminate response’ at 16
weeks were not assumed to continue treatment after 52 weeks. The same multiplicative factor
(2.15) and proportion of exacerbations that were ‘severe’ (76.3%) were applied as in the 0-16
week and 16-52 week periods for reslizumab. Table 75 presents the transition probabilities used
in the model for the reslizumab arm post-52 weeks (CS Table 108).
Table 75 Transition probabilities post-52 weeks: reslizumab arm Visit i +1
Controlled Uncontrolled Moderate exacerbation
Severe exacerbation
Visit i Controlled 0.82 0.14 0.01 0.03
Uncontrolled 0.25 0.71 0.01 0.03
Moderate exacerbation
0.59 0.41 0 0
Severe exacerbation
0.59 0.41 0 0
Table 76 presents the set of probabilities estimated using the transitions of patients classified as
‘responders’ XXXXXXX at the 16-week assessment. These probabilities differ slightly from
those in Table 74, because the former includes patients assessed as having an ‘indeterminate’
response at 16 weeks in addition to those classed as ‘responders’.
Table 76 Transition probabilities (post-52 weeks) directly obtained from the number of transitions (visits) XXXXXXXXXX
XXXXXXXXXX
XXXXXXXXXXXX
XXXXXXXXXXXX
XXXXXXXXXXXXXXXXXXXXXXX XXXXXXXXXX XXXX XXXX XXXX
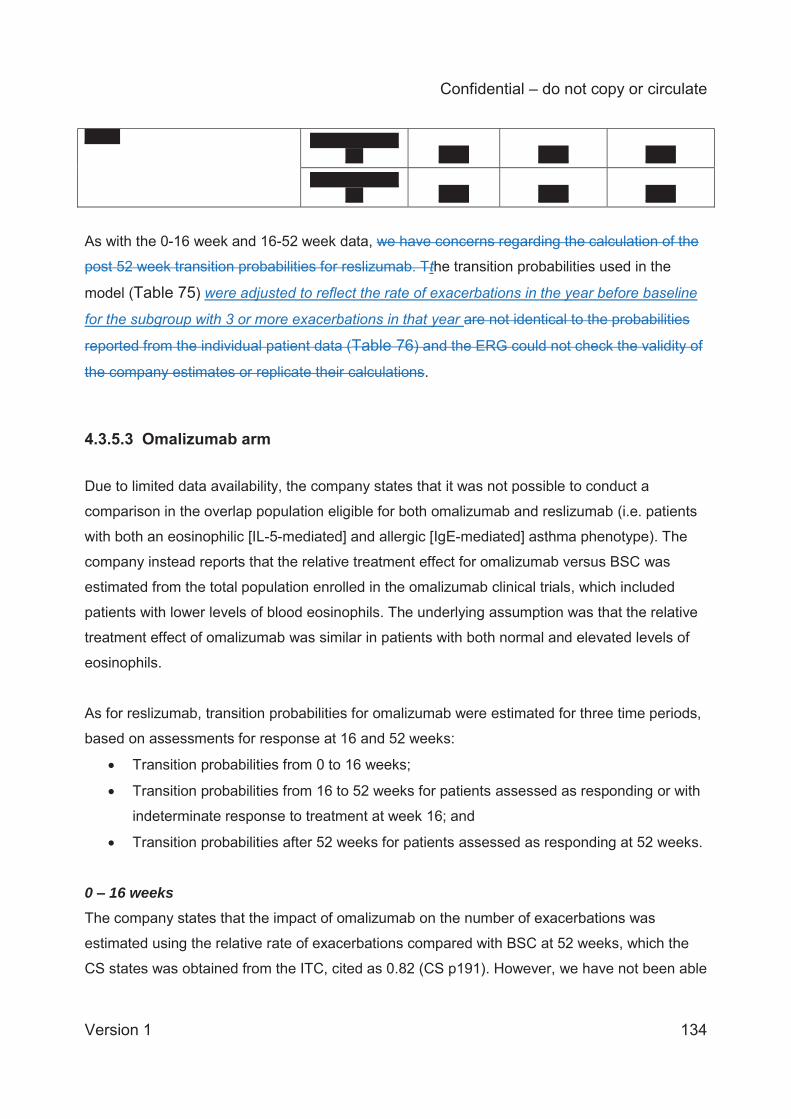
Confidential – do not copy or circulate
Version 1 134
XXXX XXXXXXXXXXXX XXXX XXXX XXXX
XXXXXXXXXXXX XXXX XXXX XXXX
As with the 0-16 week and 16-52 week data, we have concerns regarding the calculation of the
post 52 week transition probabilities for reslizumab. Tthe transition probabilities used in the
model (Table 75) were adjusted to reflect the rate of exacerbations in the year before baseline
for the subgroup with 3 or more exacerbations in that year are not identical to the probabilities
reported from the individual patient data (Table 76) and the ERG could not check the validity of
the company estimates or replicate their calculations.
4.3.5.3 Omalizumab arm
Due to limited data availability, the company states that it was not possible to conduct a
comparison in the overlap population eligible for both omalizumab and reslizumab (i.e. patients
with both an eosinophilic [IL-5-mediated] and allergic [IgE-mediated] asthma phenotype). The
company instead reports that the relative treatment effect for omalizumab versus BSC was
estimated from the total population enrolled in the omalizumab clinical trials, which included
patients with lower levels of blood eosinophils. The underlying assumption was that the relative
treatment effect of omalizumab was similar in patients with both normal and elevated levels of
eosinophils.
As for reslizumab, transition probabilities for omalizumab were estimated for three time periods,
based on assessments for response at 16 and 52 weeks:
Transition probabilities from 0 to 16 weeks;
Transition probabilities from 16 to 52 weeks for patients assessed as responding or with
indeterminate response to treatment at week 16; and
Transition probabilities after 52 weeks for patients assessed as responding at 52 weeks.
0 – 16 weeks The company states that the impact of omalizumab on the number of exacerbations was
estimated using the relative rate of exacerbations compared with BSC at 52 weeks, which the
CS states was obtained from the ITC, cited as 0.82 (CS p191). However, we have not been able
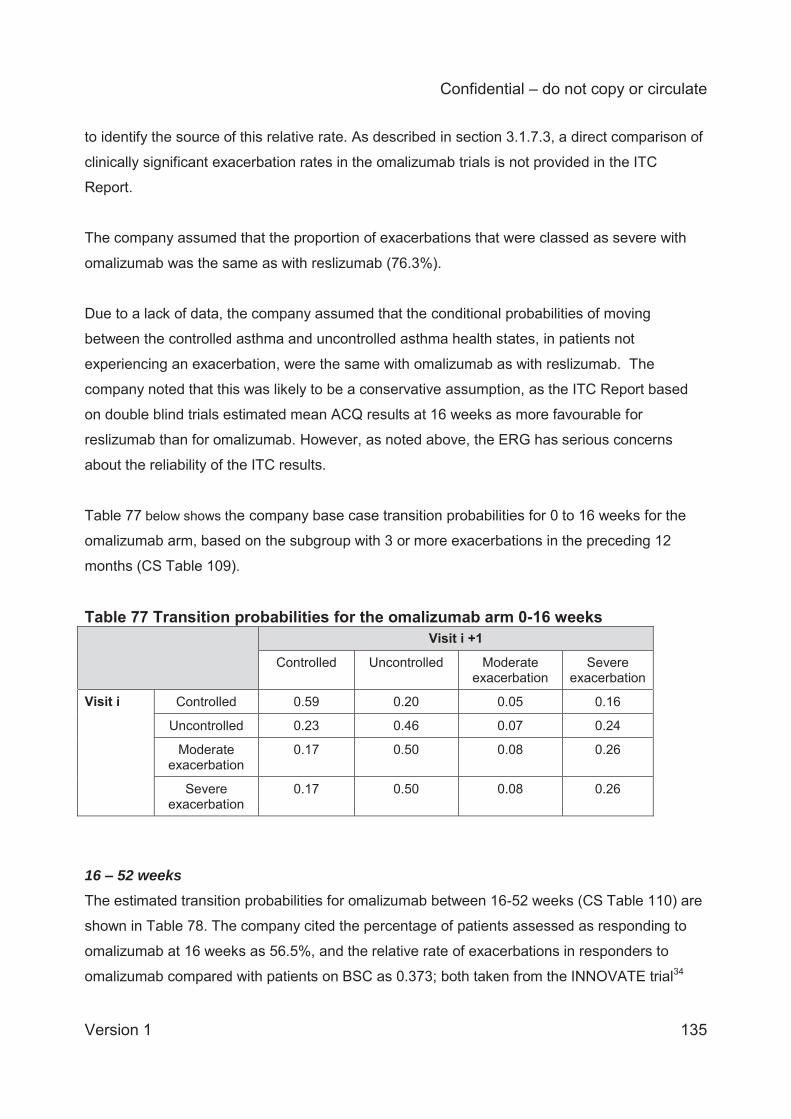
Confidential – do not copy or circulate
Version 1 135
to identify the source of this relative rate. As described in section 3.1.7.3, a direct comparison of
clinically significant exacerbation rates in the omalizumab trials is not provided in the ITC
Report.
The company assumed that the proportion of exacerbations that were classed as severe with
omalizumab was the same as with reslizumab (76.3%).
Due to a lack of data, the company assumed that the conditional probabilities of moving
between the controlled asthma and uncontrolled asthma health states, in patients not
experiencing an exacerbation, were the same with omalizumab as with reslizumab. The
company noted that this was likely to be a conservative assumption, as the ITC Report based
on double blind trials estimated mean ACQ results at 16 weeks as more favourable for
reslizumab than for omalizumab. However, as noted above, the ERG has serious concerns
about the reliability of the ITC results.
Table 77 below shows the company base case transition probabilities for 0 to 16 weeks for the
omalizumab arm, based on the subgroup with 3 or more exacerbations in the preceding 12
months (CS Table 109).
Table 77 Transition probabilities for the omalizumab arm 0-16 weeks Visit i +1
Controlled Uncontrolled Moderate exacerbation
Severe exacerbation
Visit i Controlled 0.59 0.20 0.05 0.16
Uncontrolled 0.23 0.46 0.07 0.24
Moderate exacerbation
0.17 0.50 0.08 0.26
Severe exacerbation
0.17 0.50 0.08 0.26
16 – 52 weeks The estimated transition probabilities for omalizumab between 16-52 weeks (CS Table 110) are
shown in Table 78. The company cited the percentage of patients assessed as responding to
omalizumab at 16 weeks as 56.5%, and the relative rate of exacerbations in responders to
omalizumab compared with patients on BSC as 0.373; both taken from the INNOVATE trial34
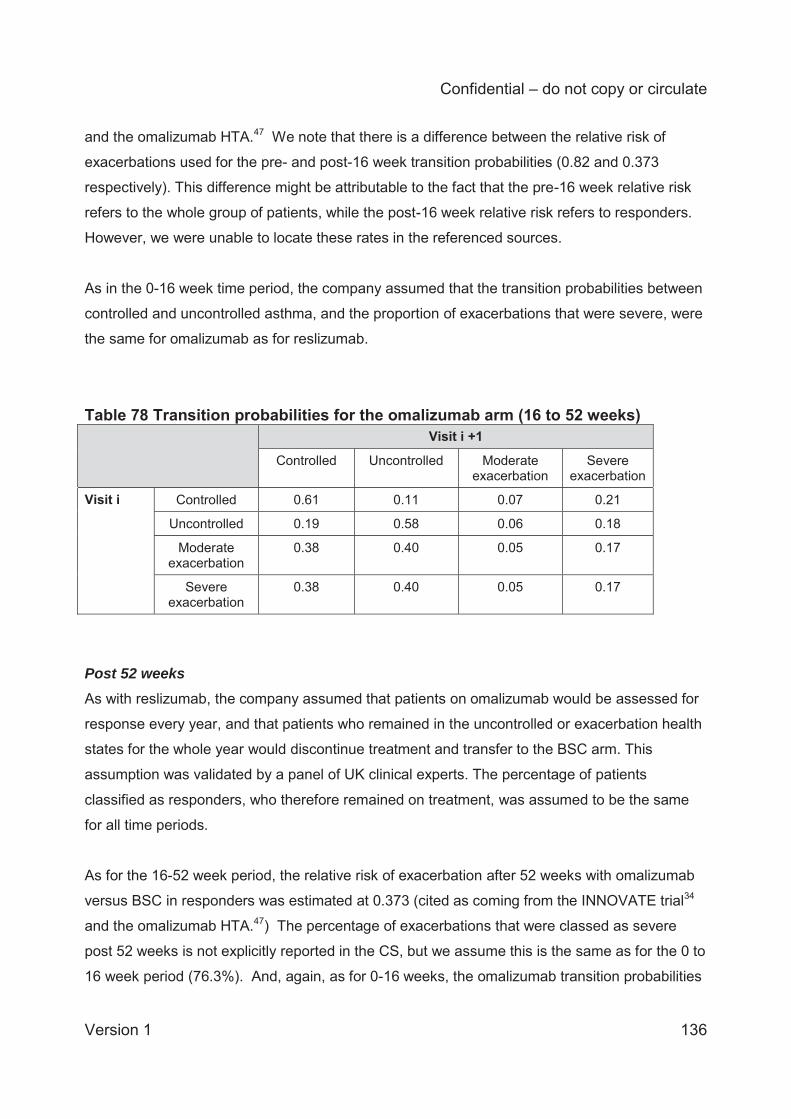
Confidential – do not copy or circulate
Version 1 136
and the omalizumab HTA.47 We note that there is a difference between the relative risk of
exacerbations used for the pre- and post-16 week transition probabilities (0.82 and 0.373
respectively). This difference might be attributable to the fact that the pre-16 week relative risk
refers to the whole group of patients, while the post-16 week relative risk refers to responders.
However, we were unable to locate these rates in the referenced sources.
As in the 0-16 week time period, the company assumed that the transition probabilities between
controlled and uncontrolled asthma, and the proportion of exacerbations that were severe, were
the same for omalizumab as for reslizumab.
Table 78 Transition probabilities for the omalizumab arm (16 to 52 weeks) Visit i +1
Controlled Uncontrolled Moderate exacerbation
Severe exacerbation
Visit i Controlled 0.61 0.11 0.07 0.21
Uncontrolled 0.19 0.58 0.06 0.18
Moderate exacerbation
0.38 0.40 0.05 0.17
Severe exacerbation
0.38 0.40 0.05 0.17
Post 52 weeks As with reslizumab, the company assumed that patients on omalizumab would be assessed for
response every year, and that patients who remained in the uncontrolled or exacerbation health
states for the whole year would discontinue treatment and transfer to the BSC arm. This
assumption was validated by a panel of UK clinical experts. The percentage of patients
classified as responders, who therefore remained on treatment, was assumed to be the same
for all time periods.
As for the 16-52 week period, the relative risk of exacerbation after 52 weeks with omalizumab
versus BSC in responders was estimated at 0.373 (cited as coming from the INNOVATE trial34
and the omalizumab HTA.47) The percentage of exacerbations that were classed as severe
post 52 weeks is not explicitly reported in the CS, but we assume this is the same as for the 0 to
16 week period (76.3%). And, again, as for 0-16 weeks, the omalizumab transition probabilities
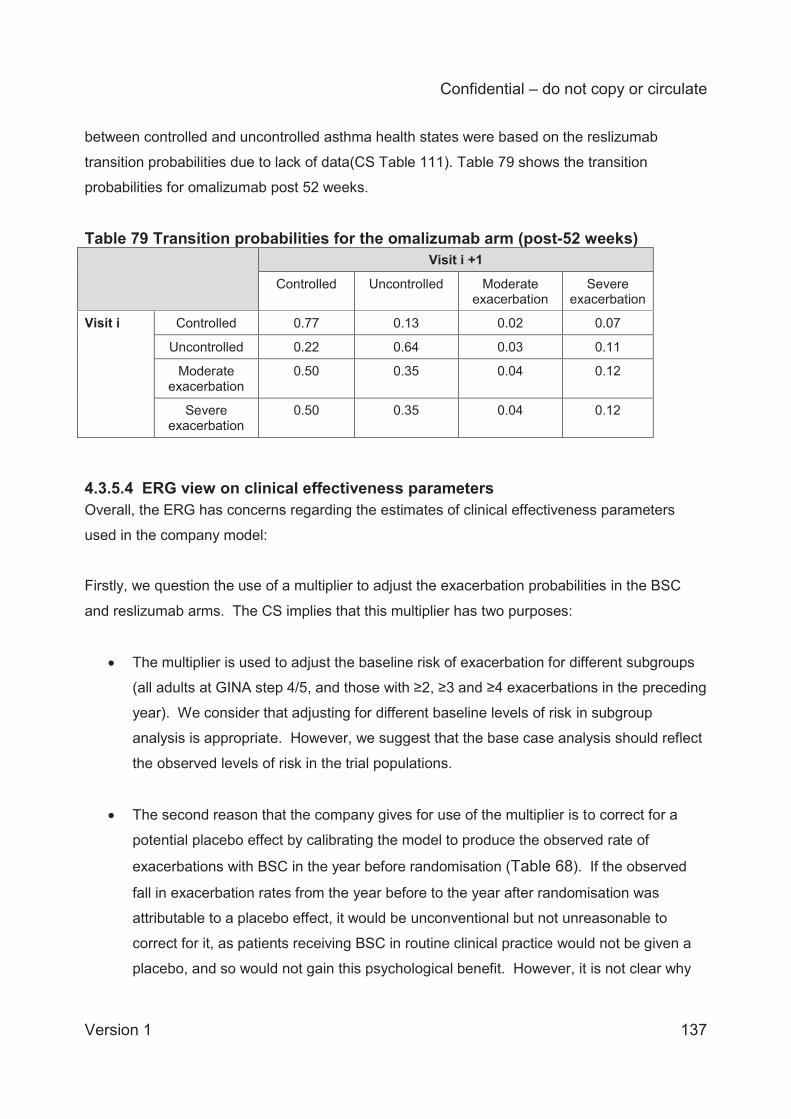
Confidential – do not copy or circulate
Version 1 137
between controlled and uncontrolled asthma health states were based on the reslizumab
transition probabilities due to lack of data(CS Table 111). Table 79 shows the transition
probabilities for omalizumab post 52 weeks.
Table 79 Transition probabilities for the omalizumab arm (post-52 weeks) Visit i +1
Controlled Uncontrolled Moderate exacerbation
Severe exacerbation
Visit i Controlled 0.77 0.13 0.02 0.07
Uncontrolled 0.22 0.64 0.03 0.11
Moderate exacerbation
0.50 0.35 0.04 0.12
Severe exacerbation
0.50 0.35 0.04 0.12
4.3.5.4 ERG view on clinical effectiveness parameters Overall, the ERG has concerns regarding the estimates of clinical effectiveness parameters
used in the company model:
Firstly, we question the use of a multiplier to adjust the exacerbation probabilities in the BSC
and reslizumab arms. The CS implies that this multiplier has two purposes:
The multiplier is used to adjust the baseline risk of exacerbation for different subgroups
(all adults at GINA step 4/5, and those with ≥2, ≥3 and ≥4 exacerbations in the preceding
year). We consider that adjusting for different baseline levels of risk in subgroup
analysis is appropriate. However, we suggest that the base case analysis should reflect
the observed levels of risk in the trial populations.
The second reason that the company gives for use of the multiplier is to correct for a
potential placebo effect by calibrating the model to produce the observed rate of
exacerbations with BSC in the year before randomisation (Table 68). If the observed
fall in exacerbation rates from the year before to the year after randomisation was
attributable to a placebo effect, it would be unconventional but not unreasonable to
correct for it, as patients receiving BSC in routine clinical practice would not be given a
placebo, and so would not gain this psychological benefit. However, it is not clear why
Confidential – do not copy or circulate
Version 1 138
the adjustment for a potential placebo effect should also be applied to the reslizumab
arm, since in clinical practice these patients would know that they were receiving
treatment, and hence might gain a psychological benefit from treatment in addition to the
direct effects of the active treatment.
The company argue that the multiplier has to be applied to the exacerbation rates in the
reslizumab arm to retain the relative treatment effects estimated from the clinical trials.
However, it would be more appropriate to do this directly by modelling the BSC arm
using an absolute risk estimate, and to adjust this for the reslizumab arm by multiplying
by the relative risk. This would retain randomisation, and provide more a meaningful
reflection of uncertainties over the absolute and relative risks in the probabilistic
sensitivity analysis. The company have used this more conventional approach for the
omalizumab arm of their model.
Furthermore, it is not clear that the lower rate of exacerbations in the year after
randomisation compared with the year before is attributable to a placebo effect. It also
might result (at least partly) from a ‘regression to the mean’ effect. This would occur if
patients were more likely to be recruited into the trials at times when they were
experiencing, due to chance, higher rates of exacerbations than they would usually. If
so, one would expect exacerbation rates to fall naturally over time, as patients revert to a
more typical pattern of disease. It is therefore unclear whether there is a need to adjust
the trial results to the observed exacerbation rates in the year before study entry.
We also have concerns over the lack of clarity over the calculations used to estimate the
transition probabilities. In response to a clarification question, the company did supply data
underlying the transition calculations for the reslizumab arm, but we could not replicate the
probabilities used in the model from these data, and but no data were provided to justify the
calculations for the BSC arm.
The company’s estimates of transition probabilities for the BSC arm were based on patients
experiencing 2 exacerbations, instead of their target population for the base case model of 3
exacerbations. This was justified due to the small sample size (n=91) in the latter group.
However, we note that the company based their estimates of transition probabilities for the
reslizumab arm on similar samples of just over 100 patients. Direct estimation of transitions for
Confidential – do not copy or circulate
Version 1 139
the populations of interest, with uncertainty reflected in the PSA, would have been more
appropriate.
The company’s assessment of response at 16 weeks was based on an algorithm used to
predict the result of the 52-week assessment. However, no information was provided regarding
the coefficients of the prediction model, measures of model fit, or it’s predictive validity in an
external dataset.
For the transition probabilities used in the omalizumab arm, we were not able to check the
relative risks of exacerbation used in the model: 0.82 for patients treated before the response
assessment at 16 weeks, due to lack of clarity of the source cited in the CS.
Another concern over the clinical effectiveness parameters arises from the lack of evidence
relating to the effectiveness of reslizumab beyond 52 weeks, and the underlying assumption
that effects observed up to 52 weeks will persist up to 60 years duration. This is a strong
assumption.
4.3.6 HRQoL
4.3.6.1 Systematic review of HRQoL studies A systematic review was conducted by the company to identify HRQoL values. We report the
details of that systematic review in Section 4.2 with inclusion and exclusion criteria given in
Table 65. CS Section 5.4.3 provides details of the 13 HRQoL studies identified through the
systematic review of HRQoL. However, the primary study used for HRQoL was Willson and
colleagues,44 a study that was identified through the cost-effectiveness review and not identified
in the HRQoL review. Willson and colleagues contains directly measured EuroQoL-5
dimensions (EQ-5D) data from people with severe asthma, that it was missed is a shortcoming
of the HRQoL search. The one other study that was used for utility values, Lloyd and
colleagues,59 was identified through the systematic review of HRQoL studies and is also
referenced in Willson and colleagues. No justification was provided for the choice of HRQoL
studies used in the model.
Confidential – do not copy or circulate
Version 1 140
The systematic review of HRQoL studies did not report any quality assessment. Willson and
colleagues was quality assessed for the systematic review of cost-effectiveness studies (CS
Appendix 7).
ERG searches for additional HRQoL data The ERG ran some searches to identify quality of life data that may have been missed due to
the exclusion criteria on the company systematic review. These searches consisted of the
searches for studies in the NHS EED and HTA databases (see Section 4.2), as well as
searches using the Ovid platform (MEDLINE, Embase, MEDLINE in process). The searches on
the Ovid platform contained the following search terms: severe asthma, QALY*, EuroQoL*, EQ-
5D*, AQLQ, and SGRQ—asterisks represent wildcards that can take any value after the
preceding term. No date limitations were applied. None of the studies identified by the ERG
were included in the company’s systematic review of HRQoL. These searches identified the four
cost-utility analyses identified in Section 4.2: Brown and colleagues,51 Dewilde and colleagues,52
Gerzeli and colleagues,53 and Morishima and colleagues;54 and one study by Szende and
colleagues60 that was referenced in Morishima and colleagues.54 The next several paragraphs
identify the methods used to measure utility in the five studies identified through the ERG’s
additional searches.
Brown and colleagues and Dewilde and colleagues51, 52 used treatment-based utilities derived
from mapped instruments in trials and exacerbation utilities from Lloyd and colleagues.59
Gerzeli and colleagues used utility scores for health states for successful control, sub-optimal
control, outpatient managed exacerbation and inpatient managed exacerbation.53 These health
states are very comparable to those used in the CS. The utility scores for these health states
were synthesized from five cited studies61-65 All these studies,except Edelen and colleagues63
used EQ-5D. The health state values in Gerzeli and colleagues were as follows: Successful
control: 0.85; Suboptimal control: 0.77; Outpatient managed exacerbation: 0.66; Inpatient
managed exacerbation: 0.59.
Morishima and colleagues54 used utility scores derived from a study by Szende and
colleagues60 which used three questionnaires (EQ-5D, SF-36, and SGRQ; and a direct time
trade-off exercise) to measure HRQoL in patients with varying levels of asthma control. The
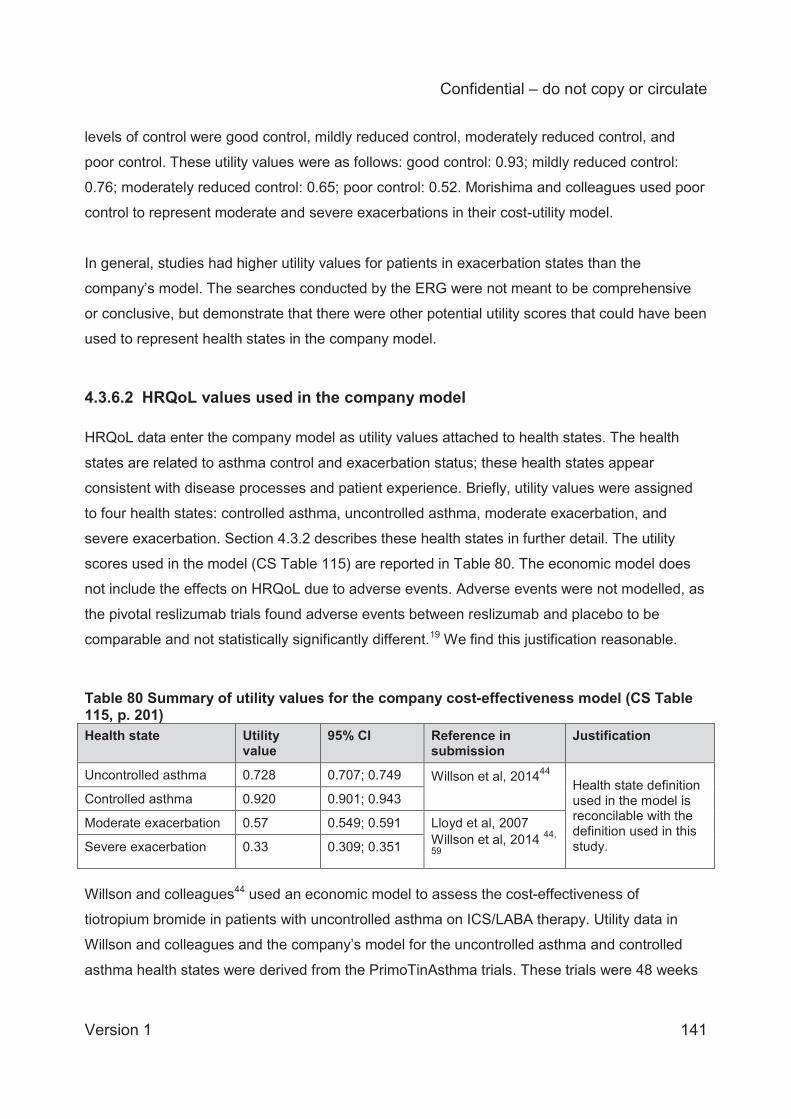
Confidential – do not copy or circulate
Version 1 141
levels of control were good control, mildly reduced control, moderately reduced control, and
poor control. These utility values were as follows: good control: 0.93; mildly reduced control:
0.76; moderately reduced control: 0.65; poor control: 0.52. Morishima and colleagues used poor
control to represent moderate and severe exacerbations in their cost-utility model.
In general, studies had higher utility values for patients in exacerbation states than the
company’s model. The searches conducted by the ERG were not meant to be comprehensive
or conclusive, but demonstrate that there were other potential utility scores that could have been
used to represent health states in the company model.
4.3.6.2 HRQoL values used in the company model HRQoL data enter the company model as utility values attached to health states. The health
states are related to asthma control and exacerbation status; these health states appear
consistent with disease processes and patient experience. Briefly, utility values were assigned
to four health states: controlled asthma, uncontrolled asthma, moderate exacerbation, and
severe exacerbation. Section 4.3.2 describes these health states in further detail. The utility
scores used in the model (CS Table 115) are reported in Table 80. The economic model does
not include the effects on HRQoL due to adverse events. Adverse events were not modelled, as
the pivotal reslizumab trials found adverse events between reslizumab and placebo to be
comparable and not statistically significantly different.19 We find this justification reasonable.
Table 80 Summary of utility values for the company cost-effectiveness model (CS Table 115, p. 201) Health state Utility
value 95% CI Reference in
submission Justification
Uncontrolled asthma 0.728 0.707; 0.749 Willson et al, 201444 Health state definition used in the model is reconcilable with the definition used in this study.
Controlled asthma 0.920 0.901; 0.943
Moderate exacerbation 0.57 0.549; 0.591 Lloyd et al, 2007 Willson et al, 2014 44,
59 Severe exacerbation 0.33 0.309; 0.351
Willson and colleagues44 used an economic model to assess the cost-effectiveness of
tiotropium bromide in patients with uncontrolled asthma on ICS/LABA therapy. Utility data in
Willson and colleagues and the company’s model for the uncontrolled asthma and controlled
asthma health states were derived from the PrimoTinAsthma trials. These trials were 48 weeks
Confidential – do not copy or circulate
Version 1 142
long, with 912 patients at GINA steps 4 and 5. The trial population appears similar to
reslizumab’s treatment indication and appears appropriate. Utility scores were derived from EQ-
5D data collected in patients and valued using the United Kingdom tariff. The methods used to
derive utility scores in Willson and colleagues are appropriate, and consistent with preferred
methods in the NICE Reference Case.12
Lloyd and colleagues59 was a four-week observational study that measured the HRQoL impacts
of exacerbations in 112 patients with BTS level 4 and 5 asthma. EQ-5D questionnaires were
used to collect HRQoL data from patients, and valued using the UK tariff. The utility scores in
the model were for moderate exacerbations (22 patients), defined as exacerbations that did not
require hospitalisation but required oral steroids; and severe exacerbations (5 patients), defined
as exacerbations that required hospitalisation. HRQoL data were collected at baseline (when no
patients were experiencing exacerbations) and at four weeks. HRQoL data were not measured
during exacerbations, so it is unclear how much effect recall bias may have on the results. Lloyd
and colleagues did not report the length of time that patients experienced exacerbations, but did
report the time period between assessments (4 weeks). In the related NICE STA of
mepolizumab this time between assessments was used to assume the duration of
exacerbations, but was criticised by the Appraisal Committee.48 Similar to the mepolizumab
model, the reslizumab CS applies the decreased utility across four weeks.48 When calculating
health state costs, the CS assumes that a cycle in the moderate exacerbation health state
consists of one week of moderate exacerbation costs and three weeks of uncontrolled asthma
costs. Severe asthma consists of two weeks of exacerbation costs and two weeks of
uncontrolled asthma. It is unclear why the assumptions on HRQoL are different from the
assumptions on resource use. In the NICE MTA of omalizumab TA278,47 the mean length of
exacerbations was two weeks. For further detail on health state cost calculation, see Section
4.3.7.2.
The specific utility values used in the company’s model are all reported in Willson and
colleagues (Table 2, p. 451, in Willson and colleagues).44 The utility scores for controlled and
uncontrolled asthma were derived from Willson and colleagues whilst the utility scores for
moderate and severe exacerbations were derived from Lloyd and colleagues.44, 59 We checked
that the utility scores reported in the CS agree with those reported in Wilson and colleagues and
Lloyd and colleagues. There appears to be a minor error in the reporting of the utility score for
controlled asthma. The CS states that the ‘Controlled asthma’ health state utility was estimated
Confidential – do not copy or circulate
Version 1 143
as a weighted average of the controlled and partly controlled health state utilities from Willson
and colleagues.44
The weighting was derived from the pivotal reslizumab trials (3082 and 3083). Controlled
asthma was defined as having an ACQ <1.5, which includes patients with partially controlled
asthma (ACQ between 1 and 1.5) and controlled asthma (ACQ <1). Experts we consulted
indicated that the controlled threshold should be an ACQ of 0.75. This would indicate that
quality of life may be overestimated in the controlled health state of the model.
In the pivotal clinical trials 49% of the assessments with an ACQ<1.5 had scores between 1 and
1.5. When we calculated the utility score using these weightings, we obtained 0.9223, whilst the
CS reports a utility score of 0.920 for the controlled asthma health state. The confidence
intervals reported in the CS for the weighted average are correct. We have tested the effects of
the corrected point estimate, and it does not make a meaningful difference to the results.
Additionally, the value used in the probabilistic sensitivity analysis in the model is different from
those listed above. The mean controlled utility value in the probabilistic model is 0.937, which
corresponds to the value for fully controlled asthma in Willson and colleagues.44
4.3.6.3 Methodological discrepancies across studies in exacerbation definitions and utility score calculation
There are some differences in the definitions of exacerbations between Lloyd and colleagues,59
Willson and colleagues,44 and the CS. Lloyd and colleagues and Willson and colleagues define
severe exacerbations as requiring hospitalisation. In the CS, only 24.84% of patients with a
severe exacerbation are hospitalised. This indicates that the severity of exacerbation in the CS
is overestimated. We conducted a sensitivity analysis (section 4.4) using a weighted average of
utility scores for the severe exacerbation state. In our analysis, 24.84% of the utility score is
derived from the utility score for severe exacerbations (0.33) whilst the remaining weight is
derived from the utility score for moderate exacerbations (0.57), resulting in an overall utility
score of 0.510 for severe exacerbations.
The utility sources chosen appear to be appropriate, but it should be noted that the exacerbation
data for moderate exacerbations in Lloyd and colleagues are based on 22 patients and the
severe exacerbation data are based on 5 patients. These data are derived from EQ-5D and are
Confidential – do not copy or circulate
Version 1 144
appropriate, but data from the pivotal trials from patients with exacerbations may be more robust
due to the larger sample size of patients with exacerbations (224 patients according to CS Table
20), but these data would be need to be mapped from AQLQ. A sensitivity analysis was
conducted by the company that used mapped utility scores from AQLQ but only included
mapped utilities for the controlled and uncontrolled asthma health states. The ERG suggests it
would have been more appropriate to explore all utility values using data from the pivotal
reslizumab trials. The NICE Decision Support Unit recommends in Technical Support Document
12 that wherever possible utility scores should all be derived from the same study for the CS;66
this would only be possible by mapping from AQLQ from the pivotal reslizumab trials. Whilst the
ERG requested full details of the AQLQ and mapped EQ-5D utilities, none were provided by the
company. The pivotal trials did not utilize EQ-5D. We note that the Appraisal Committee for the
NICE STA of mepolizumab was critical of the use of mapped utilities from St. George’s
Respiratory Questionnaire (SGRQ) and indicated that they preferred the EQ-5D utility scores
measured directly from the trial where the mapped algorithm for SGRQ were derived.48
However, the lack of robustness in the exacerbation utility values in Lloyd and colleagues
makes using other data a legitimate and potentially preferable methodological option.
In addition to HRQoL data used in the model, the company’s systematic review of economic
evaluations identified studies that provided HRQoL: Norman and colleagues, and two studies by
Faria and colleagues (derived from TA278).47
There were several differences in utility measurement methods between the model in Norman
and colleagues and the CS model.47 In Norman and colleagues the primary source of utility
data for patients with severe asthma in the omalizumab technology appraisal was data from the
EXALT trial taken from the Novartis CS, but this trial was not identified through systematic
searches and the data extractions for economic evaluations and quality of life studies do not
report original sources47 The EXALT trial measured utility by treatment status, not by asthma
control. Utility data from Lloyd and colleagues was used in Norman and colleagues, and is also
used in the CS model to define utility for exacerbation health states.59
However, Norman and colleagues used disutilities that are applied to treatment states to
incorporate the effect of exacerbations on HRQoL, whilst the CS uses the absolute value
reported in Lloyd and colleagues.59 These disutilities are calculated from Lloyd and colleagues
using a difference from baseline approach, whilst the CS (and Willson and colleagues) use
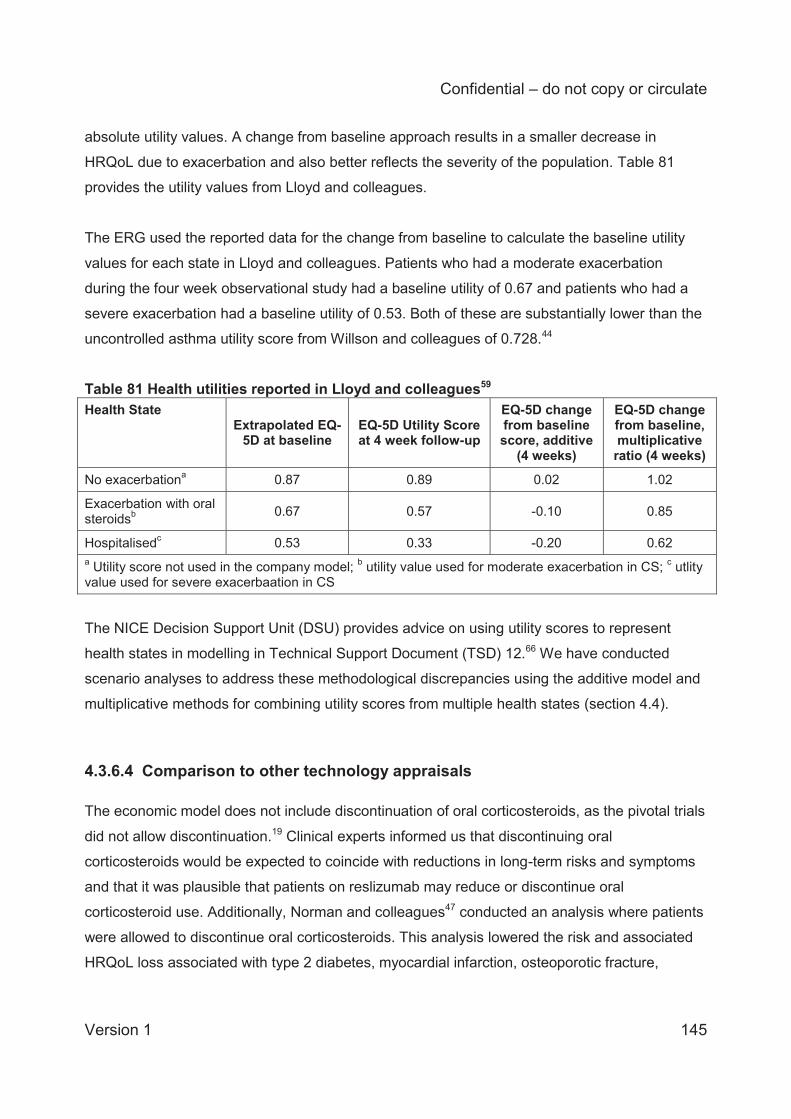
Confidential – do not copy or circulate
Version 1 145
absolute utility values. A change from baseline approach results in a smaller decrease in
HRQoL due to exacerbation and also better reflects the severity of the population. Table 81
provides the utility values from Lloyd and colleagues.
The ERG used the reported data for the change from baseline to calculate the baseline utility
values for each state in Lloyd and colleagues. Patients who had a moderate exacerbation
during the four week observational study had a baseline utility of 0.67 and patients who had a
severe exacerbation had a baseline utility of 0.53. Both of these are substantially lower than the
uncontrolled asthma utility score from Willson and colleagues of 0.728.44
Table 81 Health utilities reported in Lloyd and colleagues59 Health State
Extrapolated EQ-5D at baseline
EQ-5D Utility Score at 4 week follow-up
EQ-5D change from baseline score, additive
(4 weeks)
EQ-5D change from baseline, multiplicative ratio (4 weeks)
No exacerbationa 0.87 0.89 0.02 1.02
Exacerbation with oral steroidsb 0.67 0.57 -0.10 0.85
Hospitalisedc 0.53 0.33 -0.20 0.62 a Utility score not used in the company model; b utility value used for moderate exacerbation in CS; c utlity value used for severe exacerbaation in CS
The NICE Decision Support Unit (DSU) provides advice on using utility scores to represent
health states in modelling in Technical Support Document (TSD) 12.66 We have conducted
scenario analyses to address these methodological discrepancies using the additive model and
multiplicative methods for combining utility scores from multiple health states (section 4.4).
4.3.6.4 Comparison to other technology appraisals The economic model does not include discontinuation of oral corticosteroids, as the pivotal trials
did not allow discontinuation.19 Clinical experts informed us that discontinuing oral
corticosteroids would be expected to coincide with reductions in long-term risks and symptoms
and that it was plausible that patients on reslizumab may reduce or discontinue oral
corticosteroid use. Additionally, Norman and colleagues47 conducted an analysis where patients
were allowed to discontinue oral corticosteroids. This analysis lowered the risk and associated
HRQoL loss associated with type 2 diabetes, myocardial infarction, osteoporotic fracture,
Confidential – do not copy or circulate
Version 1 146
glaucoma, ulcer, cataracts and stroke. The model may underestimate some benefits for both
reslizumab and omalizumab by not allowing patients to discontinue oral corticosteroids. The
effect of reducing oral steroid use was considered in the NICE STA of mepolizumab.67 The
Appraisal Committee concluded that there could be significant benefits to patients and carers
from reduction of oral corticosteroid use.67
One of the clinical comparators for reslizumab is mepolizumab, although it is not included in the
NICE scope for the current technology appraisal. Utility scores in the NICE STA of mepolizumab
were mapped from SGRQ values to EQ-5D, and exacerbation disutilities were derived from
Lloyd and colleagues and applied using the absolute change from baseline values.48 The utility
scores used in the NICE STA of mepolizumab (Table 55 in the mepolizumab ERG report) are
shown in Table 82.
The NICE Appraisal Committee was critical of the use of mapped utilities in the NICE STA of
mepolizumab.67 In the company’s model for reslizumab, unlike in the mepolizumab STA, there
were no EQ-5D scores directly available from the pivotal trials, and the exacerbation disutilities
used in Norman and colleagues and the NICE STA of mepolizumab are from poor quality
data.47, 48 The ERG considers that mapped utilities may have provided more robust estimates for
utility scores, and for the disutility associated with exacerbations. NICE Technical Support
Document 12 also supports deriving utility scores from one source if at all possible to give the
most internally consistent measurements.66
Table 82 Utility scores used in the NICE STA of mepolizumab ITT population Glaxo Smith Kline Per
Protocol, excluding stable maintenance OCS
GSK Per Protocol
EQ 5D SGRQmapped
EQ 5D SGRQmapped
EQ 5D SGRQmapped
Mepolizumab:
before CA
0.802 0.796 0.829 0.793 0.827 0.777
SoC treatment† 0.794 0.738 0.797 0.682 0.785 0.708
Mepolizumab:
after CA
0.824 0.806 0.834 0.805 0.837 0.795
CA = continuation assessment †Regardless of whether patients had prior mepolizumab
Confidential – do not copy or circulate
Version 1 147
The utility scores from the NICE MTA of omalizumab and the NICE STA of mepolizumab are not
directly comparable to the utility scores from the reslizumab CS as patients’ utility is associated
with their treatment status rather than their asthma control status.47,48 The utility scores from
these appraisals are lower than the controlled asthma utility score in the CS. However, because
the health states in the omalizumab and mepolizumab models are based on treatment, they
include patients with controlled and uncontrolled asthma in a single state.
4.3.6.5 Summary of health related quality of life The utility values used in the model appear to have been broadly derived from appropriate
sources, although the data on exacerbations should be viewed with caution due to the very
small sample of relevant patients in Lloyd and colleagues.59 There appear to be some small
errors in the calculation of controlled asthma patient utility, but these made little difference to
model results. The searches conducted for HRQoL data do not appear to have been
comprehensive or sensitive enough. The primary HRQoL study was not derived from the
systematic review of quality of life studies, but rather from the systematic review of economic
evaluations.
We conducted searches that identified further HRQoL studies that used EQ-5D. All of the
studies identified had higher utility scores than the company model for states comparable to
severe exacerbations. The methods used for incorporating exacerbation utility are not
consistent with previous NICE appraisals in severe asthma and are inconsistent with
recommended methods from the NICE DSU.66 All alternative methods for calculating utility
scores for exacerbations result in less impact to HRQoL from exacerbations and, because of
this, we find it likely that the disutility of exacerbations is overestimated in the CS.
4.3.7 Resource use and costs The CS model contains resource use and cost data for the following categories: drugs (including
administration), nurse and general practitioner visits, specialist visits, emergency medicine, and
hospitalisation. Adverse events were not modelled, as the pivotal reslizumab trials found
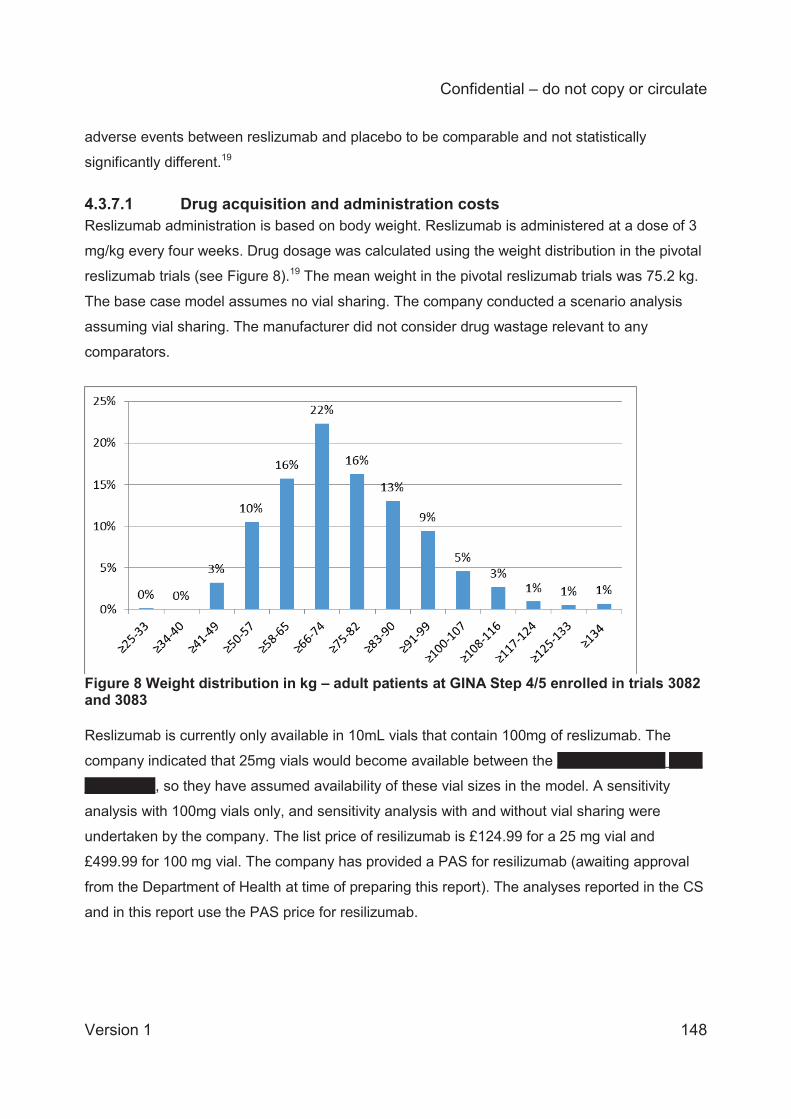
Confidential – do not copy or circulate
Version 1 148
adverse events between reslizumab and placebo to be comparable and not statistically
significantly different.19
4.3.7.1 Drug acquisition and administration costs Reslizumab administration is based on body weight. Reslizumab is administered at a dose of 3
mg/kg every four weeks. Drug dosage was calculated using the weight distribution in the pivotal
reslizumab trials (see Figure 8).19 The mean weight in the pivotal reslizumab trials was 75.2 kg.
The base case model assumes no vial sharing. The company conducted a scenario analysis
assuming vial sharing. The manufacturer did not consider drug wastage relevant to any
comparators.
Figure 8 Weight distribution in kg – adult patients at GINA Step 4/5 enrolled in trials 3082 and 3083 Reslizumab is currently only available in 10mL vials that contain 100mg of reslizumab. The
company indicated that 25mg vials would become available between the XXXX XXXX XXXX XXXX
XXXX XXXX, so they have assumed availability of these vial sizes in the model. A sensitivity
analysis with 100mg vials only, and sensitivity analysis with and without vial sharing were
undertaken by the company. The list price of resilizumab is £124.99 for a 25 mg vial and
£499.99 for 100 mg vial. The company has provided a PAS for resilizumab (awaiting approval
from the Department of Health at time of preparing this report). The analyses reported in the CS
and in this report use the PAS price for resilizumab.
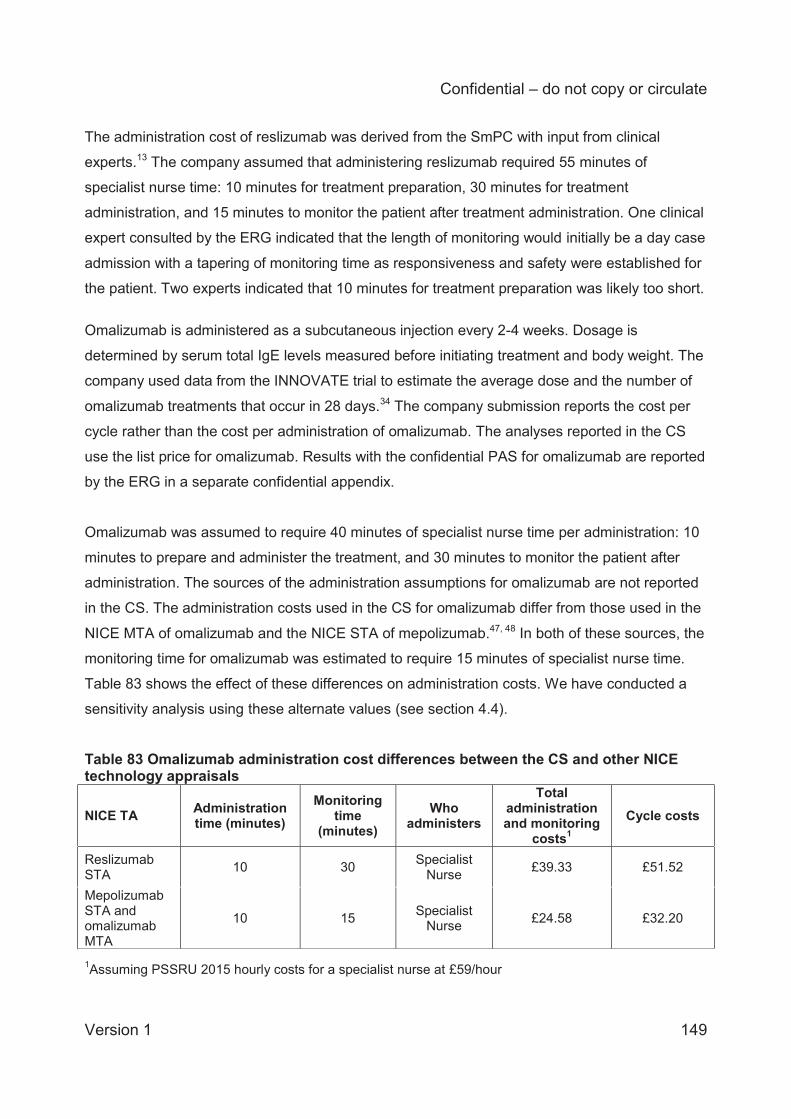
Confidential – do not copy or circulate
Version 1 149
The administration cost of reslizumab was derived from the SmPC with input from clinical
experts.13 The company assumed that administering reslizumab required 55 minutes of
specialist nurse time: 10 minutes for treatment preparation, 30 minutes for treatment
administration, and 15 minutes to monitor the patient after treatment administration. One clinical
expert consulted by the ERG indicated that the length of monitoring would initially be a day case
admission with a tapering of monitoring time as responsiveness and safety were established for
the patient. Two experts indicated that 10 minutes for treatment preparation was likely too short.
Omalizumab is administered as a subcutaneous injection every 2-4 weeks. Dosage is
determined by serum total IgE levels measured before initiating treatment and body weight. The
company used data from the INNOVATE trial to estimate the average dose and the number of
omalizumab treatments that occur in 28 days.34 The company submission reports the cost per
cycle rather than the cost per administration of omalizumab. The analyses reported in the CS
use the list price for omalizumab. Results with the confidential PAS for omalizumab are reported
by the ERG in a separate confidential appendix.
Omalizumab was assumed to require 40 minutes of specialist nurse time per administration: 10
minutes to prepare and administer the treatment, and 30 minutes to monitor the patient after
administration. The sources of the administration assumptions for omalizumab are not reported
in the CS. The administration costs used in the CS for omalizumab differ from those used in the
NICE MTA of omalizumab and the NICE STA of mepolizumab.47, 48 In both of these sources, the
monitoring time for omalizumab was estimated to require 15 minutes of specialist nurse time.
Table 83 shows the effect of these differences on administration costs. We have conducted a
sensitivity analysis using these alternate values (see section 4.4).
Table 83 Omalizumab administration cost differences between the CS and other NICE technology appraisals
NICE TA Administration time (minutes)
Monitoring time
(minutes) Who
administers
Total administration and monitoring
costs1 Cycle costs
Reslizumab STA 10 30 Specialist
Nurse £39.33 £51.52
Mepolizumab STA and omalizumab MTA
10 15 Specialist Nurse £24.58 £32.20
1Assuming PSSRU 2015 hourly costs for a specialist nurse at £59/hour
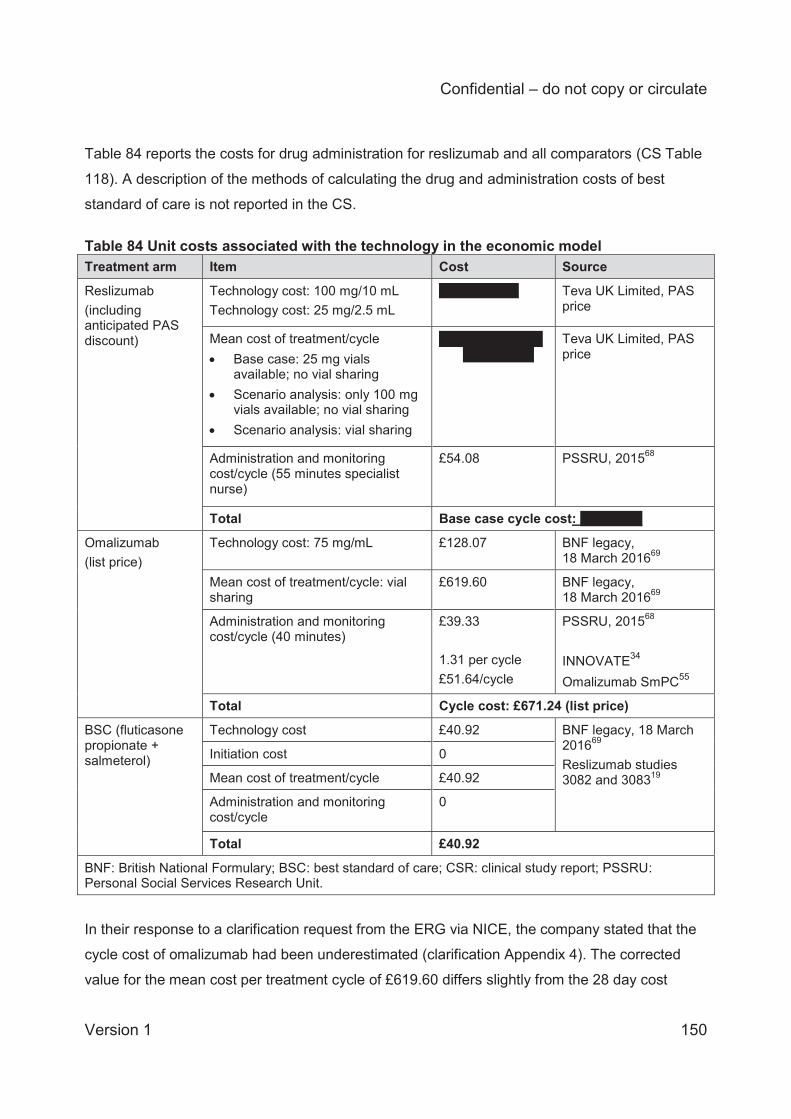
Confidential – do not copy or circulate
Version 1 150
Table 84 reports the costs for drug administration for reslizumab and all comparators (CS Table
118). A description of the methods of calculating the drug and administration costs of best
standard of care is not reported in the CS.
Table 84 Unit costs associated with the technology in the economic model Treatment arm Item Cost Source
Reslizumab (including anticipated PAS discount)
Technology cost: 100 mg/10 mL Technology cost: 25 mg/2.5 mL
XXXXXXXXX Teva UK Limited, PAS price
Mean cost of treatment/cycle Base case: 25 mg vials
available; no vial sharing Scenario analysis: only 100 mg
vials available; no vial sharing Scenario analysis: vial sharing
XXXXXXXXXXXXXXXXX
Teva UK Limited, PAS price
Administration and monitoring cost/cycle (55 minutes specialist nurse)
£54.08
PSSRU, 201568
Total Base case cycle cost: XXXXXXX
Omalizumab (list price)
Technology cost: 75 mg/mL £128.07 BNF legacy, 18 March 201669
Mean cost of treatment/cycle: vial sharing
£619.60 BNF legacy, 18 March 201669
Administration and monitoring cost/cycle (40 minutes)
£39.33 1.31 per cycle £51.64/cycle
PSSRU, 201568 INNOVATE34 Omalizumab SmPC55
Total Cycle cost: £671.24 (list price)
BSC (fluticasone propionate + salmeterol)
Technology cost £40.92 BNF legacy, 18 March 201669 Reslizumab studies 3082 and 308319
Initiation cost 0
Mean cost of treatment/cycle £40.92
Administration and monitoring cost/cycle
0
Total £40.92
BNF: British National Formulary; BSC: best standard of care; CSR: clinical study report; PSSRU: Personal Social Services Research Unit.
In their response to a clarification request from the ERG via NICE, the company stated that the
cycle cost of omalizumab had been underestimated (clarification Appendix 4). The corrected
value for the mean cost per treatment cycle of £619.60 differs slightly from the 28 day cost
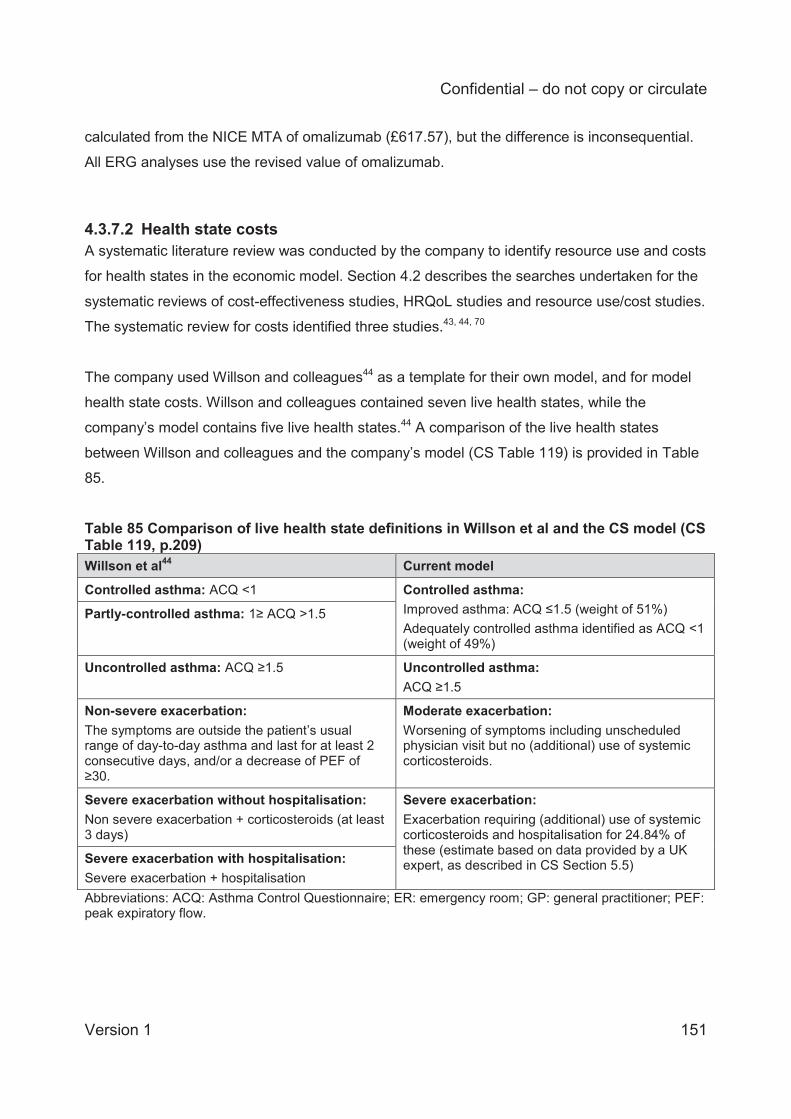
Confidential – do not copy or circulate
Version 1 151
calculated from the NICE MTA of omalizumab (£617.57), but the difference is inconsequential.
All ERG analyses use the revised value of omalizumab.
4.3.7.2 Health state costs A systematic literature review was conducted by the company to identify resource use and costs
for health states in the economic model. Section 4.2 describes the searches undertaken for the
systematic reviews of cost-effectiveness studies, HRQoL studies and resource use/cost studies.
The systematic review for costs identified three studies.43, 44, 70
The company used Willson and colleagues44 as a template for their own model, and for model
health state costs. Willson and colleagues contained seven live health states, while the
company’s model contains five live health states.44 A comparison of the live health states
between Willson and colleagues and the company’s model (CS Table 119) is provided in Table
85.
Table 85 Comparison of live health state definitions in Willson et al and the CS model (CS Table 119, p.209) Willson et al44 Current model
Controlled asthma: ACQ <1 Controlled asthma: Improved asthma: ACQ ≤1.5 (weight of 51%) Adequately controlled asthma identified as ACQ <1 (weight of 49%)
Partly-controlled asthma: 1≥ ACQ >1.5
Uncontrolled asthma: ACQ ≥1.5 Uncontrolled asthma: ACQ ≥1.5
Non-severe exacerbation: The symptoms are outside the patient’s usual range of day-to-day asthma and last for at least 2 consecutive days, and/or a decrease of PEF of ≥30.
Moderate exacerbation: Worsening of symptoms including unscheduled physician visit but no (additional) use of systemic corticosteroids.
Severe exacerbation without hospitalisation: Non severe exacerbation + corticosteroids (at least 3 days)
Severe exacerbation: Exacerbation requiring (additional) use of systemic corticosteroids and hospitalisation for 24.84% of these (estimate based on data provided by a UK expert, as described in CS Section 5.5) Severe exacerbation with hospitalisation:
Severe exacerbation + hospitalisation Abbreviations: ACQ: Asthma Control Questionnaire; ER: emergency room; GP: general practitioner; PEF: peak expiratory flow.
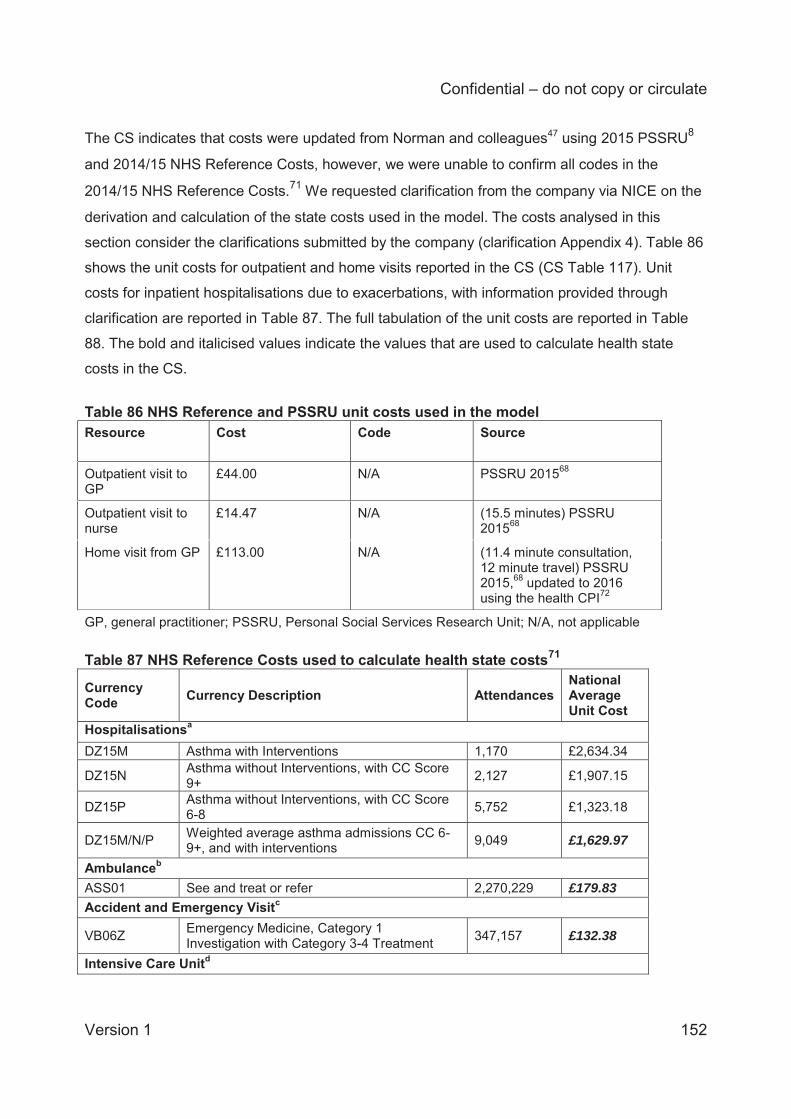
Confidential – do not copy or circulate
Version 1 152
The CS indicates that costs were updated from Norman and colleagues47 using 2015 PSSRU8
and 2014/15 NHS Reference Costs, however, we were unable to confirm all codes in the
2014/15 NHS Reference Costs.71 We requested clarification from the company via NICE on the
derivation and calculation of the state costs used in the model. The costs analysed in this
section consider the clarifications submitted by the company (clarification Appendix 4). Table 86
shows the unit costs for outpatient and home visits reported in the CS (CS Table 117). Unit
costs for inpatient hospitalisations due to exacerbations, with information provided through
clarification are reported in Table 87. The full tabulation of the unit costs are reported in Table
88. The bold and italicised values indicate the values that are used to calculate health state
costs in the CS.
Table 86 NHS Reference and PSSRU unit costs used in the model Resource Cost Code Source
Outpatient visit to GP
£44.00 N/A PSSRU 201568
Outpatient visit to nurse
£14.47 N/A (15.5 minutes) PSSRU 201568
Home visit from GP £113.00 N/A (11.4 minute consultation, 12 minute travel) PSSRU 2015,68 updated to 2016 using the health CPI72
GP, general practitioner; PSSRU, Personal Social Services Research Unit; N/A, not applicable Table 87 NHS Reference Costs used to calculate health state costs71
Currency Code Currency Description Attendances
National Average Unit Cost
Hospitalisationsa DZ15M Asthma with Interventions 1,170 £2,634.34
DZ15N Asthma without Interventions, with CC Score 9+ 2,127 £1,907.15
DZ15P Asthma without Interventions, with CC Score 6-8 5,752 £1,323.18
DZ15M/N/P Weighted average asthma admissions CC 6-9+, and with interventions 9,049 £1,629.97
Ambulanceb ASS01 See and treat or refer 2,270,229 £179.83 Accident and Emergency Visitc
VB06Z Emergency Medicine, Category 1 Investigation with Category 3-4 Treatment 347,157 £132.38
Intensive Care Unitd
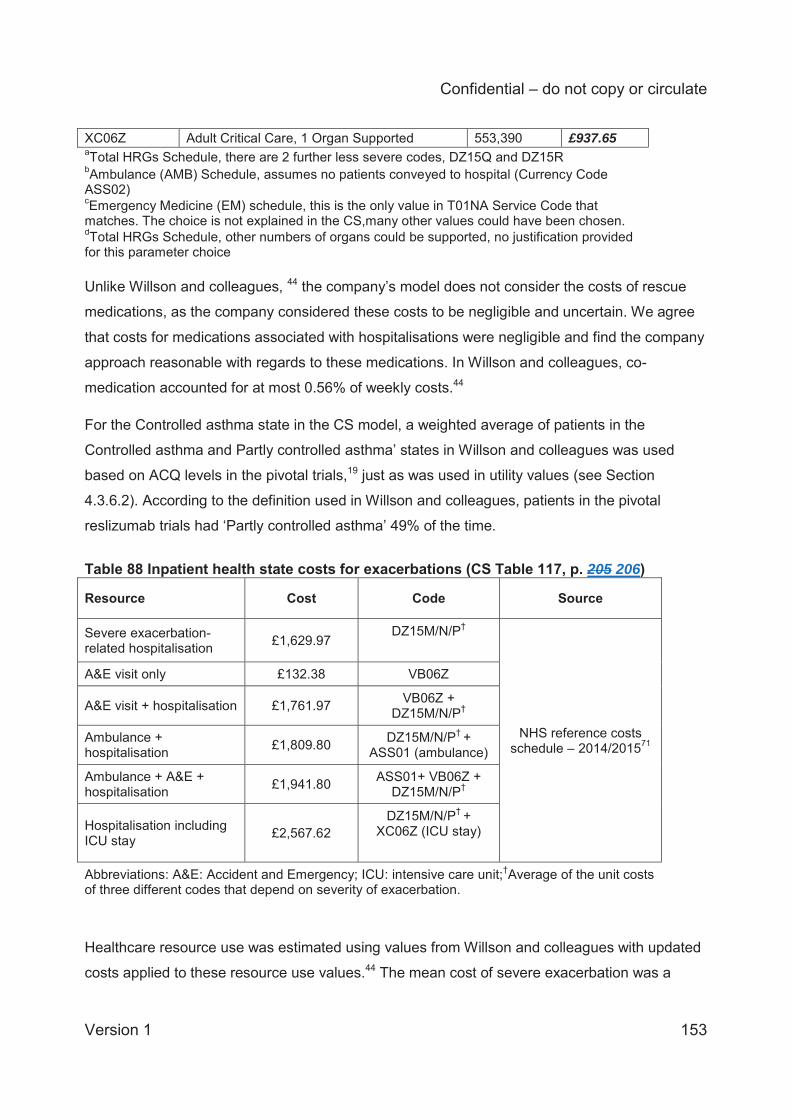
Confidential – do not copy or circulate
Version 1 153
XC06Z Adult Critical Care, 1 Organ Supported 553,390 £937.65 aTotal HRGs Schedule, there are 2 further less severe codes, DZ15Q and DZ15R bAmbulance (AMB) Schedule, assumes no patients conveyed to hospital (Currency Code ASS02) cEmergency Medicine (EM) schedule, this is the only value in T01NA Service Code that matches. The choice is not explained in the CS,many other values could have been chosen. dTotal HRGs Schedule, other numbers of organs could be supported, no justification provided for this parameter choice Unlike Willson and colleagues, 44 the company’s model does not consider the costs of rescue
medications, as the company considered these costs to be negligible and uncertain. We agree
that costs for medications associated with hospitalisations were negligible and find the company
approach reasonable with regards to these medications. In Willson and colleagues, co-
medication accounted for at most 0.56% of weekly costs.44
For the Controlled asthma state in the CS model, a weighted average of patients in the
Controlled asthma and Partly controlled asthma’ states in Willson and colleagues was used
based on ACQ levels in the pivotal trials,19 just as was used in utility values (see Section
4.3.6.2). According to the definition used in Willson and colleagues, patients in the pivotal
reslizumab trials had ‘Partly controlled asthma’ 49% of the time. Table 88 Inpatient health state costs for exacerbations (CS Table 117, p. 205 206)
Resource Cost Code Source
Severe exacerbation-related hospitalisation £1,629.97
DZ15M/N/P†
NHS reference costs schedule – 2014/201571
A&E visit only £132.38 VB06Z
A&E visit + hospitalisation £1,761.97 VB06Z + DZ15M/N/P†
Ambulance + hospitalisation £1,809.80 DZ15M/N/P† +
ASS01 (ambulance)
Ambulance + A&E + hospitalisation £1,941.80 ASS01+ VB06Z +
DZ15M/N/P†
Hospitalisation including ICU stay £2,567.62
DZ15M/N/P† + XC06Z (ICU stay)
Abbreviations: A&E: Accident and Emergency; ICU: intensive care unit;†Average of the unit costs of three different codes that depend on severity of exacerbation. Healthcare resource use was estimated using values from Willson and colleagues with updated
costs applied to these resource use values.44 The mean cost of severe exacerbation was a
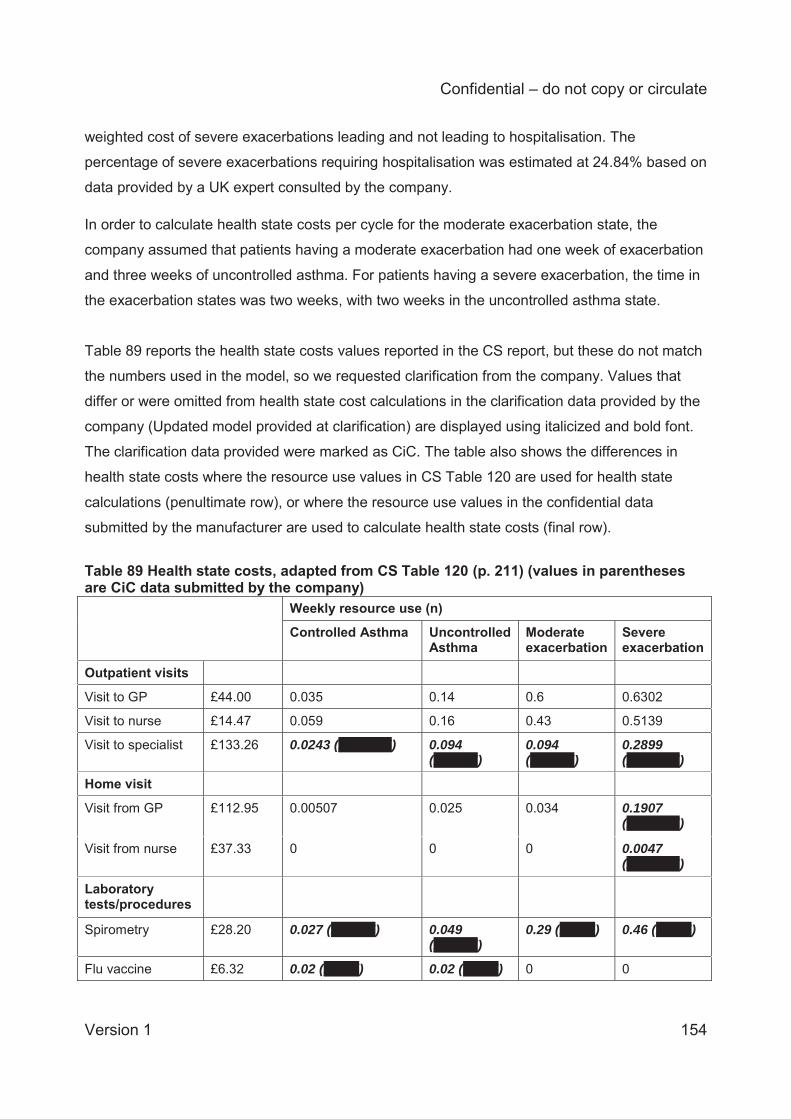
Confidential – do not copy or circulate
Version 1 154
weighted cost of severe exacerbations leading and not leading to hospitalisation. The
percentage of severe exacerbations requiring hospitalisation was estimated at 24.84% based on
data provided by a UK expert consulted by the company.
In order to calculate health state costs per cycle for the moderate exacerbation state, the
company assumed that patients having a moderate exacerbation had one week of exacerbation
and three weeks of uncontrolled asthma. For patients having a severe exacerbation, the time in
the exacerbation states was two weeks, with two weeks in the uncontrolled asthma state.
Table 89 reports the health state costs values reported in the CS report, but these do not match
the numbers used in the model, so we requested clarification from the company. Values that
differ or were omitted from health state cost calculations in the clarification data provided by the
company (Updated model provided at clarification) are displayed using italicized and bold font.
The clarification data provided were marked as CiC. The table also shows the differences in
health state costs where the resource use values in CS Table 120 are used for health state
calculations (penultimate row), or where the resource use values in the confidential data
submitted by the manufacturer are used to calculate health state costs (final row). Table 89 Health state costs, adapted from CS Table 120 (p. 211) (values in parentheses are CiC data submitted by the company)
Weekly resource use (n)
Controlled Asthma Uncontrolled Asthma
Moderate exacerbation
Severe exacerbation
Outpatient visits
Visit to GP £44.00 0.035 0.14 0.6 0.6302
Visit to nurse £14.47 0.059 0.16 0.43 0.5139
Visit to specialist £133.26 0.0243 (XXXXXX) 0.094 (XXXXX)
0.094 (XXXXX)
0.2899 (XXXXXX)
Home visit
Visit from GP £112.95 0.00507 0.025 0.034 0.1907 (XXXXXX)
Visit from nurse £37.33 0 0 0 0.0047 (XXXXXX)
Laboratory tests/procedures
Spirometry £28.20 0.027 (XXXXX) 0.049 (XXXXX)
0.29 (XXXX) 0.46 (XXXX)
Flu vaccine £6.32 0.02 (XXXX) 0.02 (XXXX) 0 0
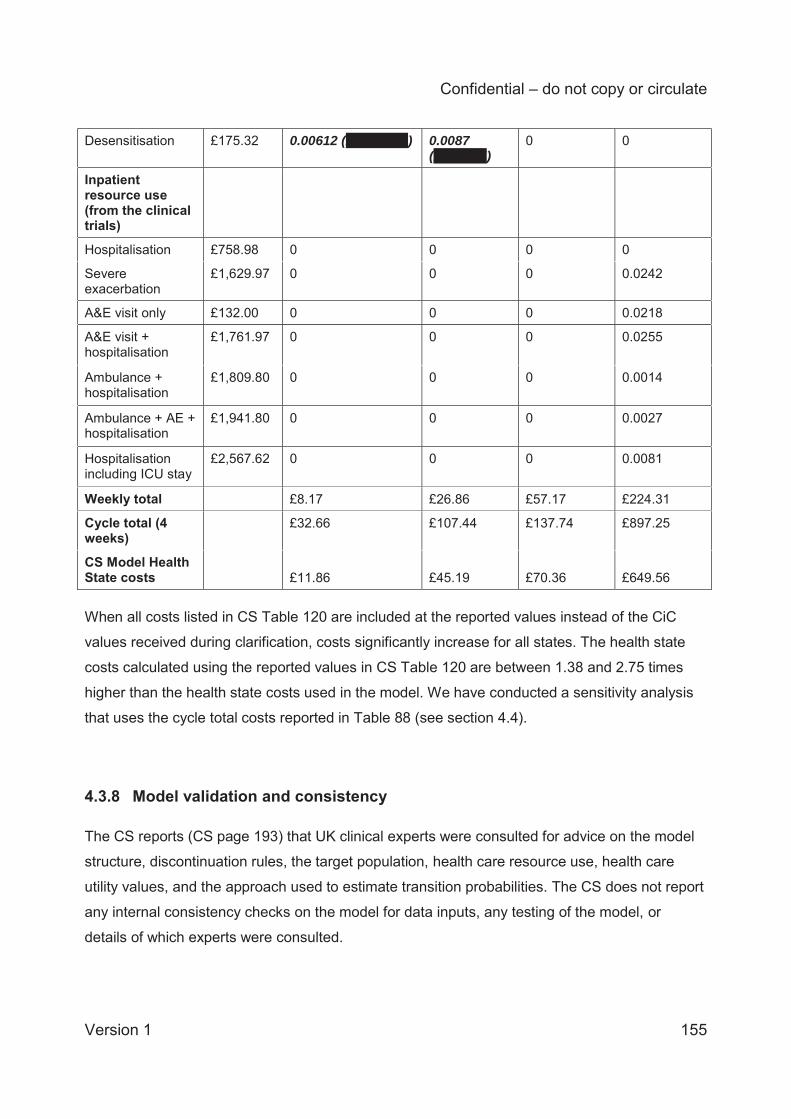
Confidential – do not copy or circulate
Version 1 155
Desensitisation £175.32 0.00612 (XXXXXXX) 0.0087 (XXXXXX)
0 0
Inpatient resource use (from the clinical trials)
Hospitalisation £758.98 0 0 0 0
Severe exacerbation
£1,629.97 0 0 0 0.0242
A&E visit only £132.00 0 0 0 0.0218
A&E visit + hospitalisation
£1,761.97 0 0 0 0.0255
Ambulance + hospitalisation
£1,809.80 0 0 0 0.0014
Ambulance + AE + hospitalisation
£1,941.80 0 0 0 0.0027
Hospitalisation including ICU stay
£2,567.62 0 0 0 0.0081
Weekly total £8.17 £26.86 £57.17 £224.31
Cycle total (4 weeks)
£32.66 £107.44 £137.74 £897.25
CS Model Health State costs £11.86 £45.19 £70.36 £649.56 When all costs listed in CS Table 120 are included at the reported values instead of the CiC
values received during clarification, costs significantly increase for all states. The health state
costs calculated using the reported values in CS Table 120 are between 1.38 and 2.75 times
higher than the health state costs used in the model. We have conducted a sensitivity analysis
that uses the cycle total costs reported in Table 88 (see section 4.4).
4.3.8 Model validation and consistency The CS reports (CS page 193) that UK clinical experts were consulted for advice on the model
structure, discontinuation rules, the target population, health care resource use, health care
utility values, and the approach used to estimate transition probabilities. The CS does not report
any internal consistency checks on the model for data inputs, any testing of the model, or
details of which experts were consulted.
Confidential – do not copy or circulate
Version 1 156
The economic model is coded in Microsoft Excel and is fully executable. Parts of the model are
coded in visual basic macros which hinders transparency. We have not undertaken a
comprehensive check of all cells in the model; rather, internal consistency checks have been
performed and random checking of the model has been done for some of the key equations in
the model. We have performed a detailed checking of all model inputs reported in the CS (white
box testing); changing the parameter values produced intuitive results (black box testing) and
from random checking the ‘wiring’ of the model appears to be accurate. The ERG was able to
replicate the results presented in the CS and the deterministic sensitivity analyses, as reported
in CS Figure 52 and CS Figure 53. We view the model as a reasonable approach to modelling
the cost effectiveness of severe eosinophiliic asthma.
The company provided a revised model to NICE because they had discovered errors in the PSA
and in the costing of omalizumab. The company stated that for the PSA: XXXXXXXXXXXXXXXXXXXXXXXXXXXXXXXXXXXXXXXXXXXX XXXXXXXXXXXX
XXXXXXXXXXXXXXXXXXXXXXXXXXXXXXXXXXXXXXXXXXXXXXXXXXXXXXXXXXXXXXX
XXXXXXXXXXXXXXXXXXXXXXXXXXXXXXXXXXXXXXXXXXXXXXXXXXXXXXXXXXXXX
The following errors were identified by the company and corrected in the revised model for the
omalizumab treatment arm as reported below:
XXXXXXXXXXXXXXXXXXXXXXXXXXX
XXXXXXXXXXXXXXXXXXXXXXXXXXXXXXXXXXXXXXXXXXXXXXXXXXXXXXXXXX
XXXXXXXXXXXXXXXXXXXXXXXXXXXXXXXXXXXXXXXXXXXXXXXXXXXXXXXX
XXXXXXXXXXXXXXXXXXXXXXXXXXXXXXXXXXXXXXXXXXXXXXXXXXXXXXXXXX
XXXXXXXXXXXXXXXXXXXXXXXXXXXXXXXXXXXXXXXXXXXXXXXXXXXXXXXXXXXX
XXXX
XXXXXXXXXXXXXXXXXXXXXXXXXXXXXXXXXXXXXXXXXXXXXXXXXXXXXXXXXXXX
XXXXXXXXXXXXXXXXXXXXXXXXXXXXXXXXXXXXXXXXXXXXXXXXXXXXXXXXXXXX
XXXXXXXXXXXXXXXXXXXXXXXXXXXXXXXXXXXXXXXXXXXXXXXXXXXXXXXXXXXX
XXXXXXXXXXXXXXXXXXXXXXXXXXXXXXXXXXXXXXXXXXXXXXXXXXXXXXXXXX
XXXXXXXXXXXXXXXXXXXXXXXXXXXXXXXXXXXXXXXXXXXXXXXXXXXXXXXXXXXXXXX
XXXXXXXXXXXXXXXXXXXXXXXXXXXXXXXXXXXXXXXXXXXXXXXXXXXXXXXXXXXXXXX
XXXXXXXXXXXXXXXXXXXXXXXXXXXXXXXXXXXXXXXXXXXXXXXXXXXXXXXX
XXXXXXXXXXXXXXXXXXXXXXXXXXXXXXXXXXXXXXXXXXXXXXXXXXXXXX
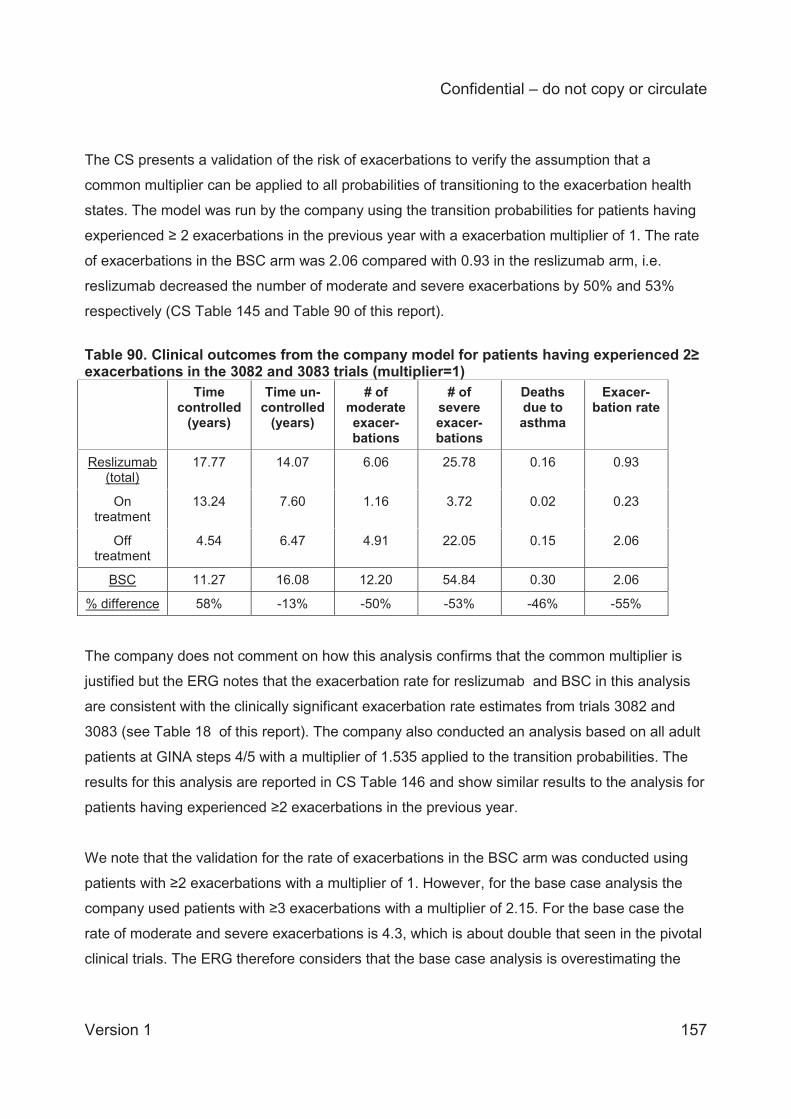
Confidential – do not copy or circulate
Version 1 157
The CS presents a validation of the risk of exacerbations to verify the assumption that a
common multiplier can be applied to all probabilities of transitioning to the exacerbation health
states. The model was run by the company using the transition probabilities for patients having
experienced ≥ 2 exacerbations in the previous year with a exacerbation multiplier of 1. The rate
of exacerbations in the BSC arm was 2.06 compared with 0.93 in the reslizumab arm, i.e.
reslizumab decreased the number of moderate and severe exacerbations by 50% and 53%
respectively (CS Table 145 and Table 90 of this report).
Table 90. Clinical outcomes from the company model for patients having experienced 2≥ exacerbations in the 3082 and 3083 trials (multiplier=1) Time
controlled (years)
Time un-controlled
(years)
# of moderate exacer-bations
# of severe exacer-bations
Deaths due to asthma
Exacer-bation rate
Reslizumab (total)
17.77 14.07 6.06 25.78 0.16 0.93
On treatment
13.24 7.60 1.16 3.72 0.02 0.23
Off treatment
4.54 6.47 4.91 22.05 0.15 2.06
BSC 11.27 16.08 12.20 54.84 0.30 2.06
% difference 58% -13% -50% -53% -46% -55%
The company does not comment on how this analysis confirms that the common multiplier is
justified but the ERG notes that the exacerbation rate for reslizumab and BSC in this analysis
are consistent with the clinically significant exacerbation rate estimates from trials 3082 and
3083 (see Table 18 of this report). The company also conducted an analysis based on all adult
patients at GINA steps 4/5 with a multiplier of 1.535 applied to the transition probabilities. The
results for this analysis are reported in CS Table 146 and show similar results to the analysis for
patients having experienced ≥2 exacerbations in the previous year.
We note that the validation for the rate of exacerbations in the BSC arm was conducted using
patients with ≥2 exacerbations with a multiplier of 1. However, for the base case analysis the
company used patients with ≥3 exacerbations with a multiplier of 2.15. For the base case the
rate of moderate and severe exacerbations is 4.3, which is about double that seen in the pivotal
clinical trials. The ERG therefore considers that the base case analysis is overestimating the
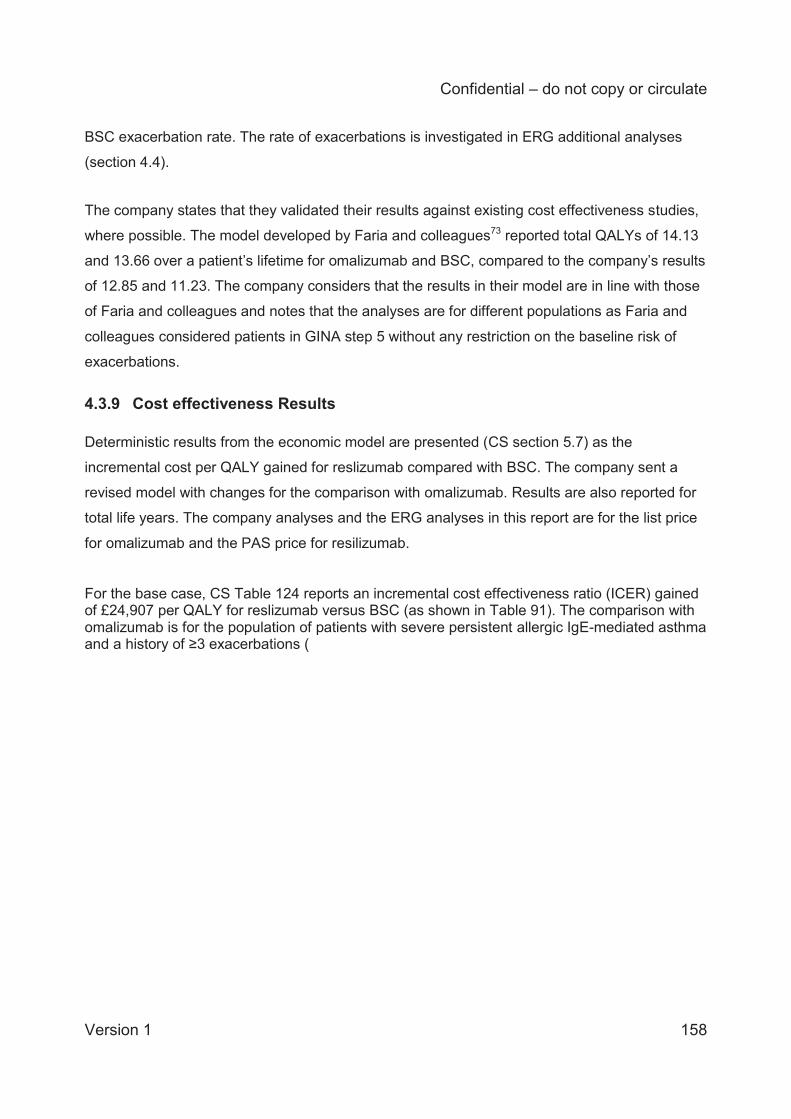
Confidential – do not copy or circulate
Version 1 158
BSC exacerbation rate. The rate of exacerbations is investigated in ERG additional analyses
(section 4.4).
The company states that they validated their results against existing cost effectiveness studies,
where possible. The model developed by Faria and colleagues73 reported total QALYs of 14.13
and 13.66 over a patient’s lifetime for omalizumab and BSC, compared to the company’s results
of 12.85 and 11.23. The company considers that the results in their model are in line with those
of Faria and colleagues and notes that the analyses are for different populations as Faria and
colleagues considered patients in GINA step 5 without any restriction on the baseline risk of
exacerbations.
4.3.9 Cost effectiveness Results Deterministic results from the economic model are presented (CS section 5.7) as the
incremental cost per QALY gained for reslizumab compared with BSC. The company sent a
revised model with changes for the comparison with omalizumab. Results are also reported for
total life years. The company analyses and the ERG analyses in this report are for the list price
for omalizumab and the PAS price for resilizumab.
For the base case, CS Table 124 reports an incremental cost effectiveness ratio (ICER) gained of £24,907 per QALY for reslizumab versus BSC (as shown in Table 91). The comparison with omalizumab is for the population of patients with severe persistent allergic IgE-mediated asthma and a history of ≥3 exacerbations (
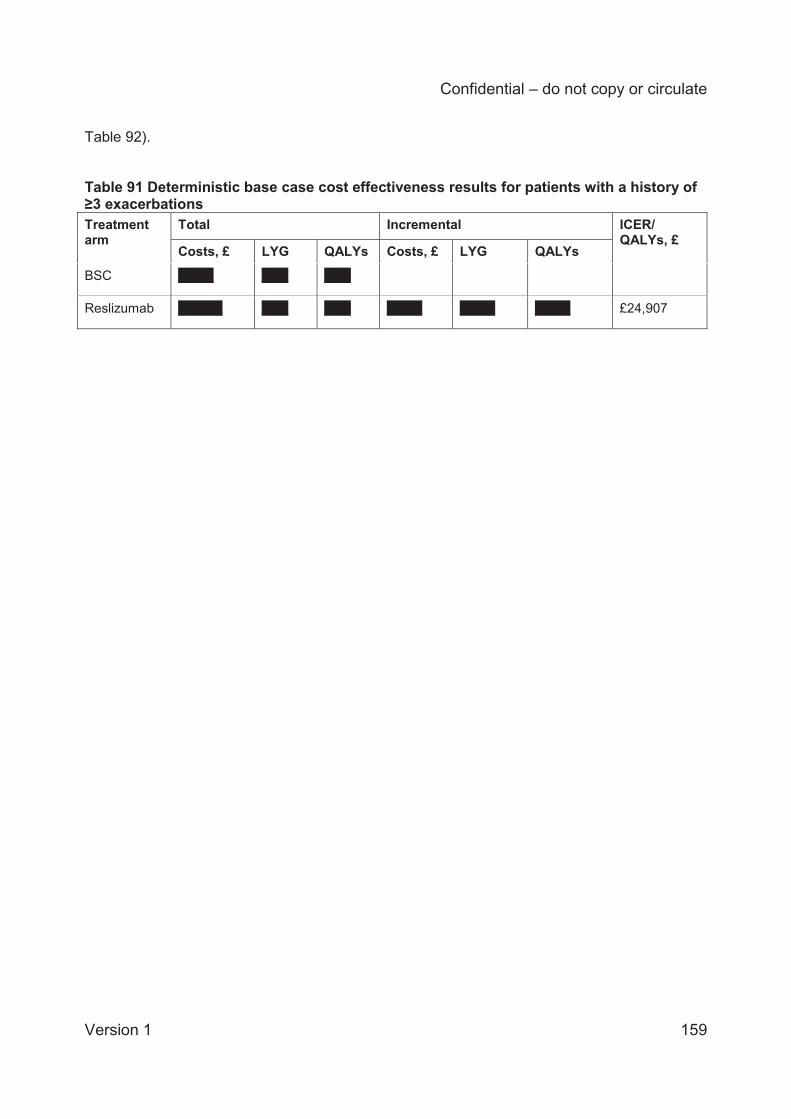
Confidential – do not copy or circulate
Version 1 159
Table 92).
Table 91 Deterministic base case cost effectiveness results for patients with a history of ≥3 exacerbations Treatment arm
Total Incremental ICER/ QALYs, £
Costs, £ LYG QALYs Costs, £ LYG QALYs
BSC XXXX XXX XXX
Reslizumab XXXXX XXX XXX XXXX XXXX XXXX £24,907
Confidential – do not copy or circulate
Version 1 160
Table 92 Deterministic base case cost effectiveness results for patients with persistent allergic eosinophilic asthma and a history of ≥ 3 exacerbations (CS Table 125, page 219) Treatment arm
Total Incremental ICER/ QALYs, £ increment
ICER/ QALYs, £ vs BSC Costs, £ LY QALYs Costs, £ LYG QALYs
BSC XXXXXXX XXXXX XXXXX
Omalizumab XXXXXXXX
XXXXX XXXXX XXXXXXX
XXXX
XXXX Extendedly dominateda
£33,254
Reslizumab XXXXXXXX
XXXXX XXXXX XXXXXXX
XXXX
XXXX £24,907 £24,907
a An extendedly dominated intervention has an ICER higher than that of the next most effective intervention.
The CS summarises the results of the PSA stating, at a threshold willingness to pay of £20,000
and £30,000 per QALY gained (in the revised model), that there is a XXX and XXX probability of
reslizumab being cost-effective respectively.
The CS states that the results show that reslizumab is a cost effective add-on therapy to BSC
for adult patients with severe eosinophilic asthma who are uncontrolled despite high-dose ICS.
4.3.10 Assessment of uncertainty The company conducted deterministic sensitivity analyses for 50 input parameters. These
included time horizon, discount rate, health state costs, utilities, patient age, exacerbation rate,
relative risk of exacerbations and mortality risk (CS Table 135). The company varied the
parameters using the 95% confidence intervals as upper and lower values. Where these were
not available (or where the variability was thought to be greater than in the study source),
parameters were varied by +/-20%.
Tornado diagrams are presented of the deterministic sensitivity analyses for reslizumab vs BSC
in CS Figure 52 (reproduced in Figure 9 and Figure 10 of this report). The tornado diagram for
reslizumab vs omalizumab was from the revised model submitted by the company.
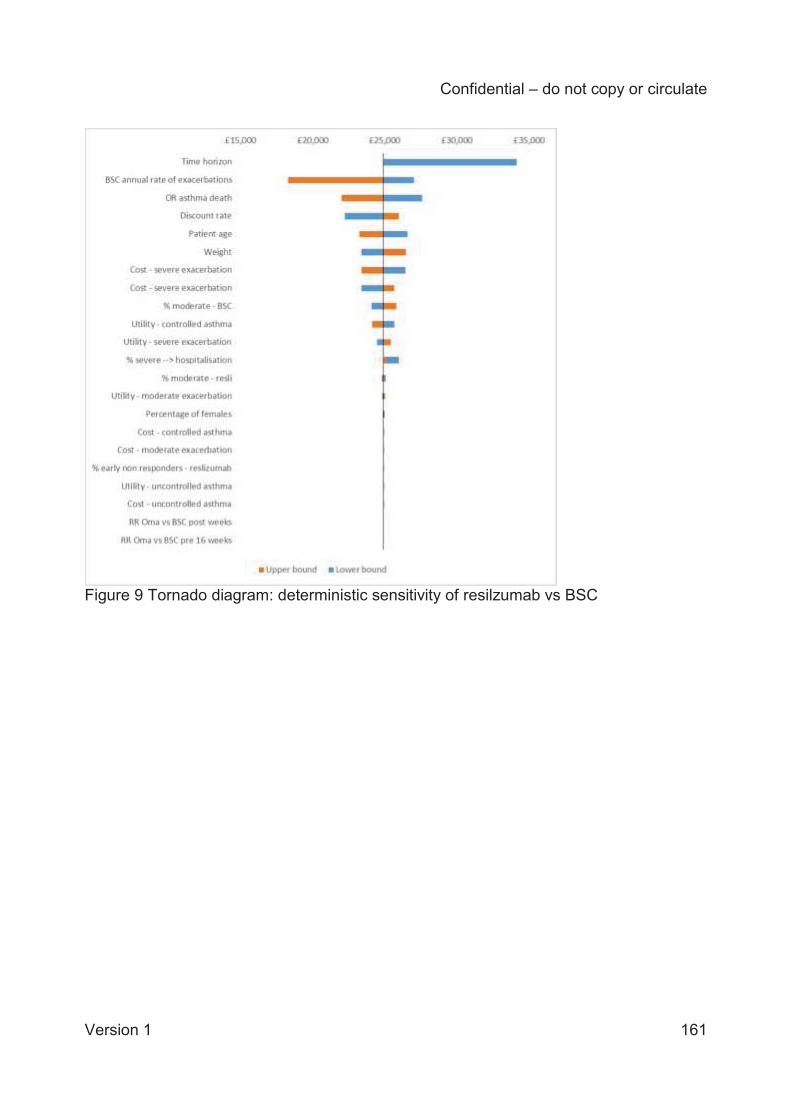
Confidential – do not copy or circulate
Version 1 161
Figure 9 Tornado diagram: deterministic sensitivity of resilzumab vs BSC
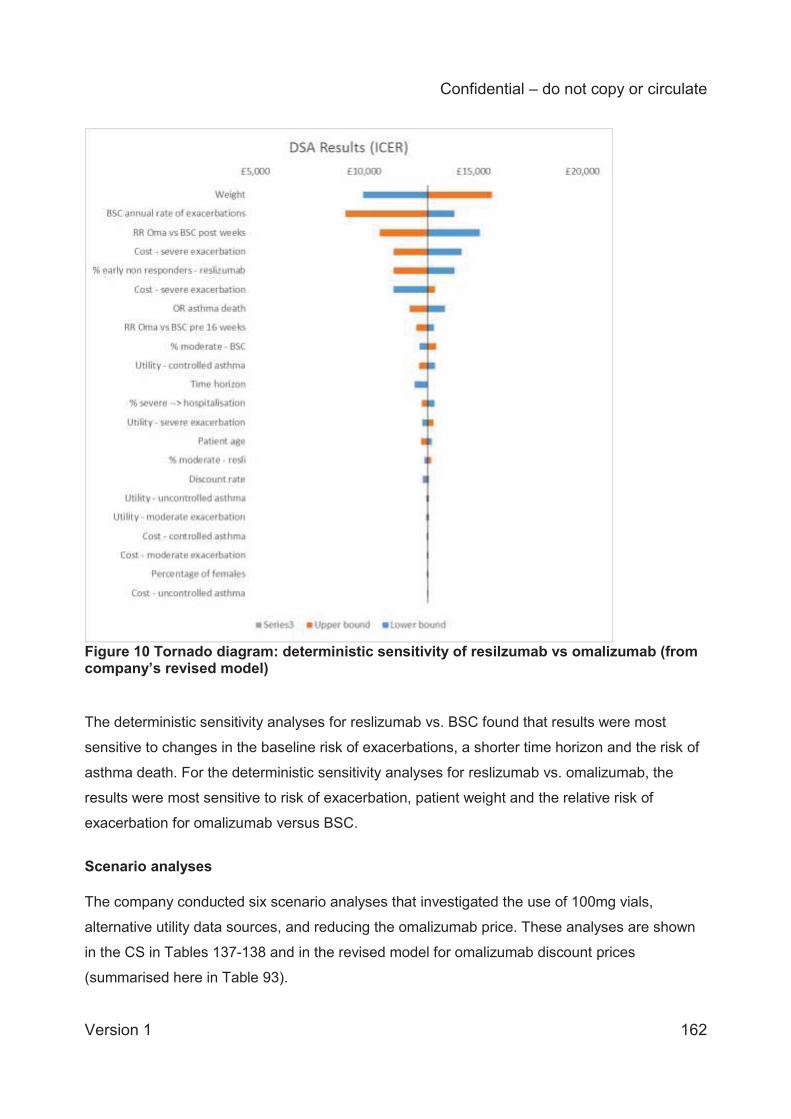
Confidential – do not copy or circulate
Version 1 162
Figure 10 Tornado diagram: deterministic sensitivity of resilzumab vs omalizumab (from company’s revised model) The deterministic sensitivity analyses for reslizumab vs. BSC found that results were most
sensitive to changes in the baseline risk of exacerbations, a shorter time horizon and the risk of
asthma death. For the deterministic sensitivity analyses for reslizumab vs. omalizumab, the
results were most sensitive to risk of exacerbation, patient weight and the relative risk of
exacerbation for omalizumab versus BSC.
Scenario analyses The company conducted six scenario analyses that investigated the use of 100mg vials,
alternative utility data sources, and reducing the omalizumab price. These analyses are shown
in the CS in Tables 137-138 and in the revised model for omalizumab discount prices
(summarised here in Table 93).
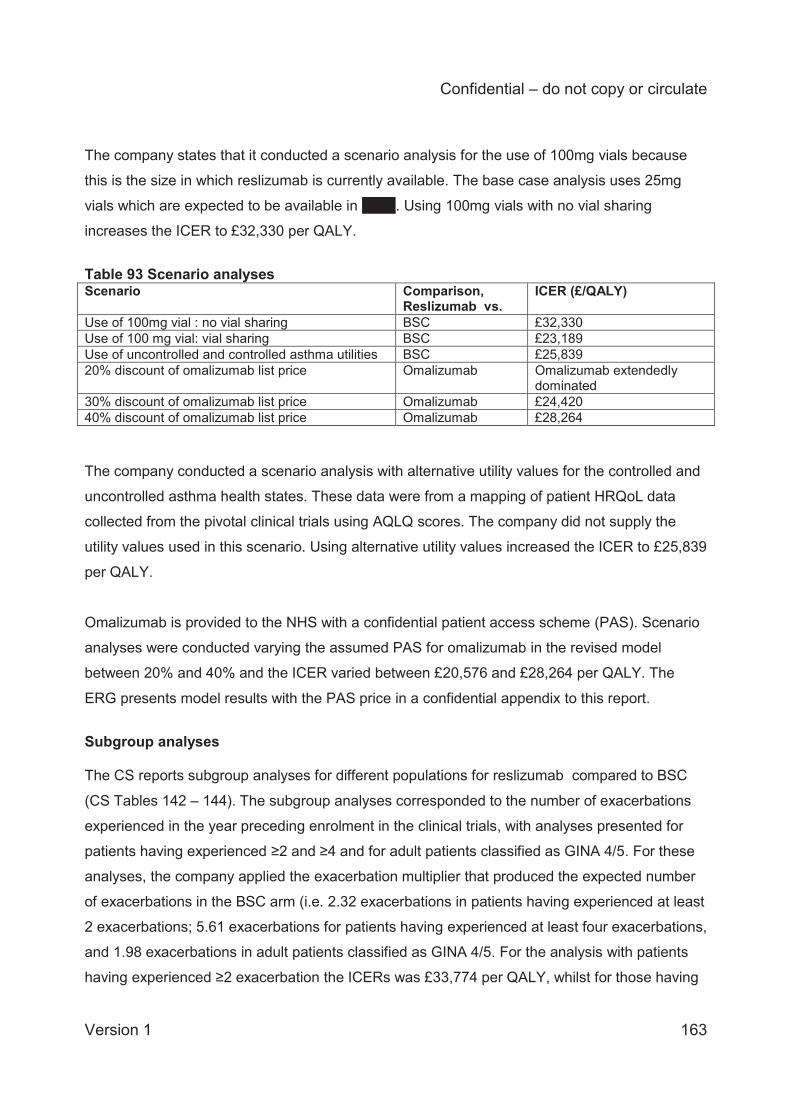
Confidential – do not copy or circulate
Version 1 163
The company states that it conducted a scenario analysis for the use of 100mg vials because
this is the size in which reslizumab is currently available. The base case analysis uses 25mg
vials which are expected to be available in XXXX. Using 100mg vials with no vial sharing
increases the ICER to £32,330 per QALY.
Table 93 Scenario analyses Scenario Comparison,
Reslizumab vs. ICER (£/QALY)
Use of 100mg vial : no vial sharing BSC £32,330 Use of 100 mg vial: vial sharing BSC £23,189 Use of uncontrolled and controlled asthma utilities BSC £25,839 20% discount of omalizumab list price Omalizumab Omalizumab extendedly
dominated 30% discount of omalizumab list price Omalizumab £24,420 40% discount of omalizumab list price Omalizumab £28,264 The company conducted a scenario analysis with alternative utility values for the controlled and
uncontrolled asthma health states. These data were from a mapping of patient HRQoL data
collected from the pivotal clinical trials using AQLQ scores. The company did not supply the
utility values used in this scenario. Using alternative utility values increased the ICER to £25,839
per QALY.
Omalizumab is provided to the NHS with a confidential patient access scheme (PAS). Scenario
analyses were conducted varying the assumed PAS for omalizumab in the revised model
between 20% and 40% and the ICER varied between £20,576 and £28,264 per QALY. The
ERG presents model results with the PAS price in a confidential appendix to this report. Subgroup analyses The CS reports subgroup analyses for different populations for reslizumab compared to BSC
(CS Tables 142 – 144). The subgroup analyses corresponded to the number of exacerbations
experienced in the year preceding enrolment in the clinical trials, with analyses presented for
patients having experienced ≥2 and ≥4 and for adult patients classified as GINA 4/5. For these
analyses, the company applied the exacerbation multiplier that produced the expected number
of exacerbations in the BSC arm (i.e. 2.32 exacerbations in patients having experienced at least
2 exacerbations; 5.61 exacerbations for patients having experienced at least four exacerbations,
and 1.98 exacerbations in adult patients classified as GINA 4/5. For the analysis with patients
having experienced ≥2 exacerbation the ICERs was £33,774 per QALY, whilst for those having
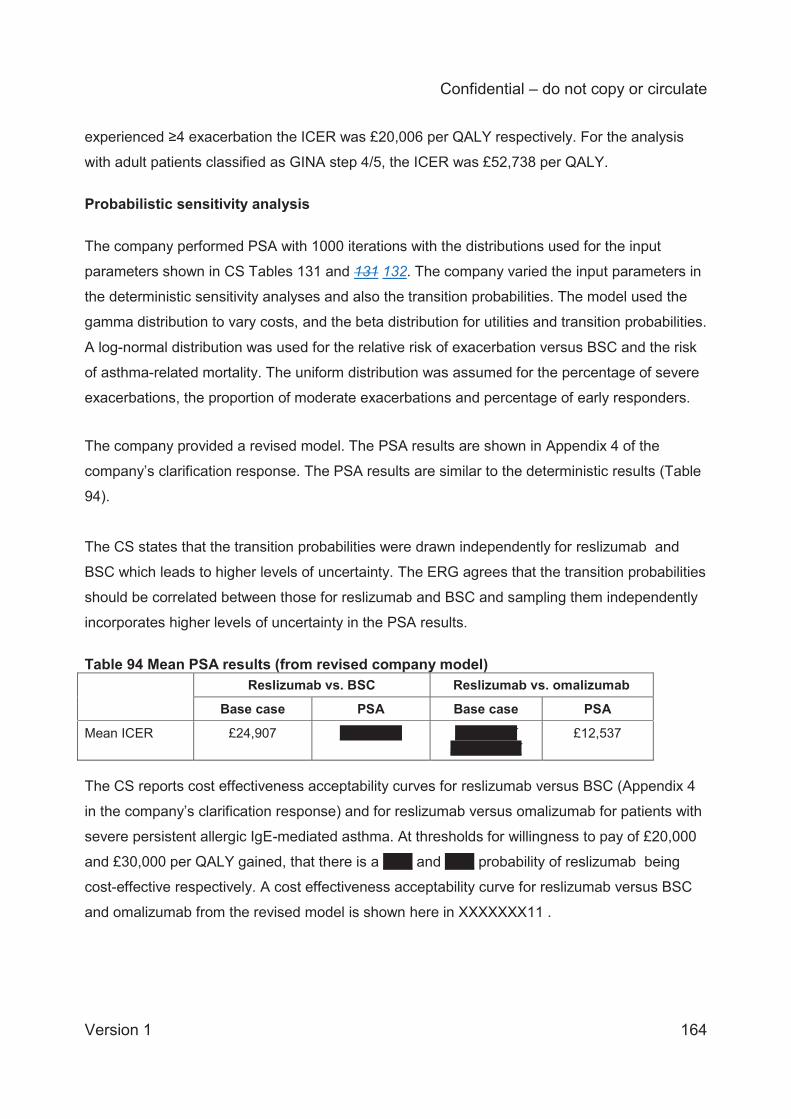
Confidential – do not copy or circulate
Version 1 164
experienced ≥4 exacerbation the ICER was £20,006 per QALY respectively. For the analysis
with adult patients classified as GINA step 4/5, the ICER was £52,738 per QALY.
Probabilistic sensitivity analysis
The company performed PSA with 1000 iterations with the distributions used for the input
parameters shown in CS Tables 131 and 131 132. The company varied the input parameters in
the deterministic sensitivity analyses and also the transition probabilities. The model used the
gamma distribution to vary costs, and the beta distribution for utilities and transition probabilities.
A log-normal distribution was used for the relative risk of exacerbation versus BSC and the risk
of asthma-related mortality. The uniform distribution was assumed for the percentage of severe
exacerbations, the proportion of moderate exacerbations and percentage of early responders.
The company provided a revised model. The PSA results are shown in Appendix 4 of the
company’s clarification response. The PSA results are similar to the deterministic results (Table
94).
The CS states that the transition probabilities were drawn independently for reslizumab and
BSC which leads to higher levels of uncertainty. The ERG agrees that the transition probabilities
should be correlated between those for reslizumab and BSC and sampling them independently
incorporates higher levels of uncertainty in the PSA results.
Table 94 Mean PSA results (from revised company model) Reslizumab vs. BSC Reslizumab vs. omalizumab
Base case PSA Base case PSA
Mean ICER £24,907 XXXXXXX XXXXXXX XXXXXXXX
£12,537
The CS reports cost effectiveness acceptability curves for reslizumab versus BSC (Appendix 4
in the company’s clarification response) and for reslizumab versus omalizumab for patients with
severe persistent allergic IgE-mediated asthma. At thresholds for willingness to pay of £20,000
and £30,000 per QALY gained, that there is a XXX and XXX probability of reslizumab being
cost-effective respectively. A cost effectiveness acceptability curve for reslizumab versus BSC
and omalizumab from the revised model is shown here in XXXXXXX11 .
Confidential – do not copy or circulate
Version 1 165
XXXXXXX11XXXXXXXXXXXXXXXXXXXXXXXXXXXXXXXXXXXXXXXXXXXXXXXXXXXXXXXXXXXXXXXXXXXXXXXXXXXXXXXXXXXXXXXXXXXXXXXXXXXXXXXXXXXXXX
4.4 Additional work undertaken by the ERG This section details the ERG’s further exploration of the issues and uncertainties raised in the
review and critique of the company’s cost effectiveness analyses. This consists of additional
sensitivity analyses for the exacerbation rate of BSC, utilities and the cost of exacerbation, using
the company’s revised model. The results are shown comparing reslizumab to omalizumab and
to BSC; the comparison against omalizumab is for patients with severe persistent allergic IgE-
mediated eosinophilic asthma.
The company base case results used transition probabilities from the population with patients
who had more than ≥ 2 exacerbations in the previous year with an exacerbation multiplier of
2.15, to reflect the rates of exacerbation. Unless stated otherwise, this set of transition
probabilities has been used in the ERG analyses.
i) Exacerbation rate of BSC
As discussed in section 4.3.8 of this report, we observed that the base case analysis
overestimates the BSC exacerbation rate. We considered that the exacerbation multiplier
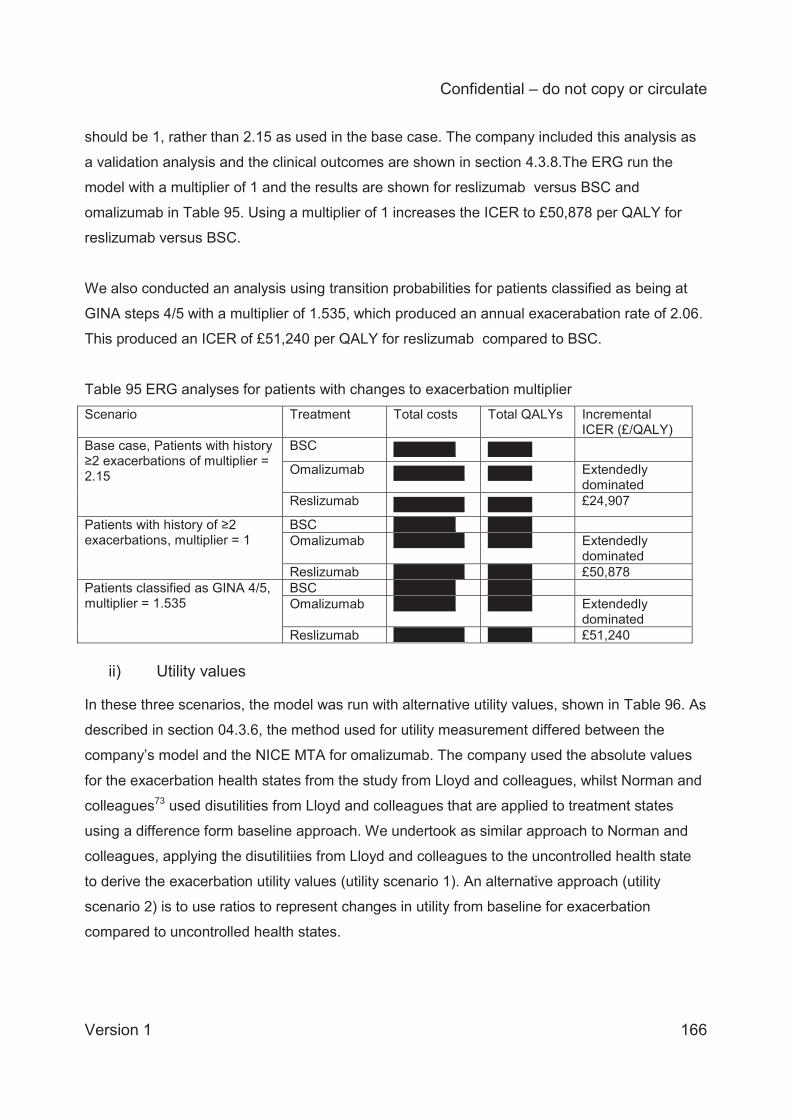
Confidential – do not copy or circulate
Version 1 166
should be 1, rather than 2.15 as used in the base case. The company included this analysis as
a validation analysis and the clinical outcomes are shown in section 4.3.8.The ERG run the
model with a multiplier of 1 and the results are shown for reslizumab versus BSC and
omalizumab in Table 95. Using a multiplier of 1 increases the ICER to £50,878 per QALY for
reslizumab versus BSC.
We also conducted an analysis using transition probabilities for patients classified as being at
GINA steps 4/5 with a multiplier of 1.535, which produced an annual exacerabation rate of 2.06.
This produced an ICER of £51,240 per QALY for reslizumab compared to BSC.
Table 95 ERG analyses for patients with changes to exacerbation multiplier Scenario Treatment Total costs Total QALYs Incremental
ICER (£/QALY) Base case, Patients with history ≥2 exacerbations of multiplier = 2.15
BSC XXXXXXX XXXXX
Omalizumab XXXXXXXX XXXXX Extendedly dominated
Reslizumab XXXXXXXX XXXXX £24,907
Patients with history of ≥2 exacerbations, multiplier = 1
BSC XXXXXXX XXXXX Omalizumab XXXXXXXX XXXXX Extendedly
dominated Reslizumab XXXXXXXX XXXXX £50,878
Patients classified as GINA 4/5, multiplier = 1.535
BSC XXXXXXX XXXXX Omalizumab XXXXXXX XXXXX Extendedly
dominated Reslizumab XXXXXXXX XXXXX £51,240
ii) Utility values
In these three scenarios, the model was run with alternative utility values, shown in Table 96. As
described in section 04.3.6, the method used for utility measurement differed between the
company’s model and the NICE MTA for omalizumab. The company used the absolute values
for the exacerbation health states from the study from Lloyd and colleagues, whilst Norman and
colleagues73 used disutilities from Lloyd and colleagues that are applied to treatment states
using a difference form baseline approach. We undertook as similar approach to Norman and
colleagues, applying the disutilitiies from Lloyd and colleagues to the uncontrolled health state
to derive the exacerbation utility values (utility scenario 1). An alternative approach (utility
scenario 2) is to use ratios to represent changes in utility from baseline for exacerbation
compared to uncontrolled health states.
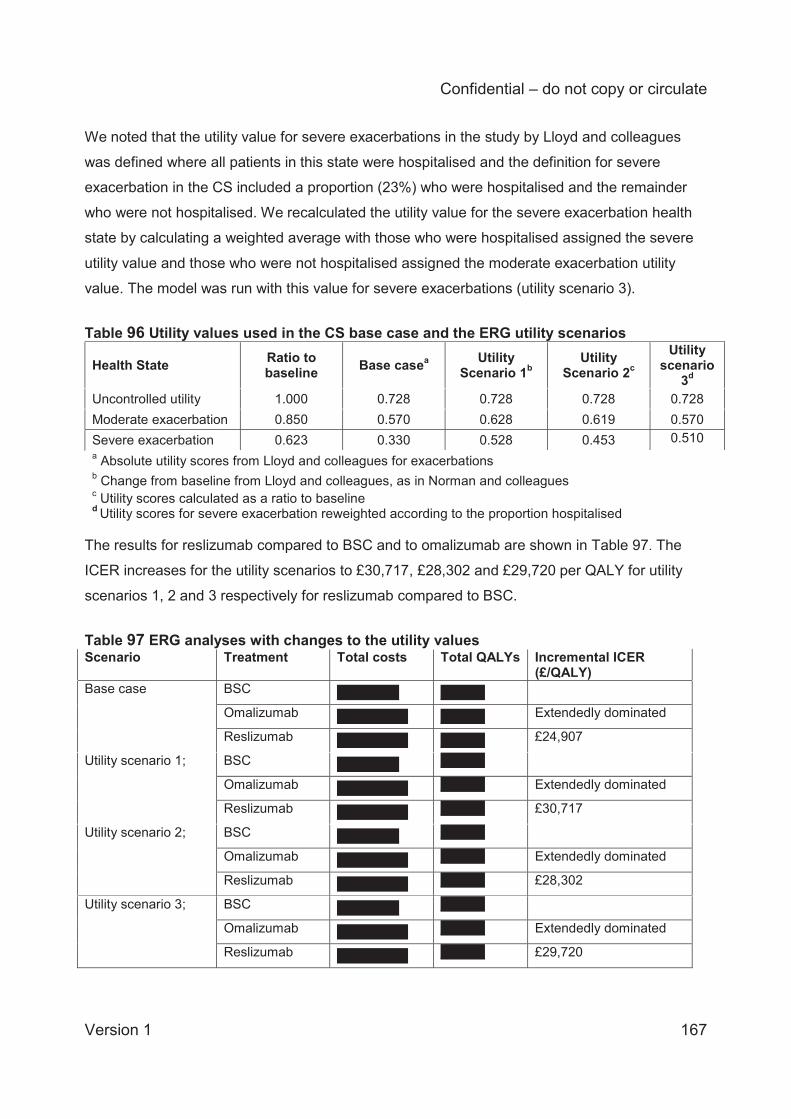
Confidential – do not copy or circulate
Version 1 167
We noted that the utility value for severe exacerbations in the study by Lloyd and colleagues
was defined where all patients in this state were hospitalised and the definition for severe
exacerbation in the CS included a proportion (23%) who were hospitalised and the remainder
who were not hospitalised. We recalculated the utility value for the severe exacerbation health
state by calculating a weighted average with those who were hospitalised assigned the severe
utility value and those who were not hospitalised assigned the moderate exacerbation utility
value. The model was run with this value for severe exacerbations (utility scenario 3).
Table 96 Utility values used in the CS base case and the ERG utility scenarios
Health State Ratio to baseline Base casea Utility
Scenario 1b Utility
Scenario 2c Utility
scenario 3d
Uncontrolled utility 1.000 0.728 0.728 0.728 0.728 Moderate exacerbation 0.850 0.570 0.628 0.619 0.570 Severe exacerbation 0.623 0.330 0.528 0.453 0.510 a Absolute utility scores from Lloyd and colleagues for exacerbations
b Change from baseline from Lloyd and colleagues, as in Norman and colleagues
c Utility scores calculated as a ratio to baseline d Utility scores for severe exacerbation reweighted according to the proportion hospitalised
The results for reslizumab compared to BSC and to omalizumab are shown in Table 97. The
ICER increases for the utility scenarios to £30,717, £28,302 and £29,720 per QALY for utility
scenarios 1, 2 and 3 respectively for reslizumab compared to BSC.
Table 97 ERG analyses with changes to the utility values Scenario Treatment Total costs Total QALYs Incremental ICER
(£/QALY) Base case BSC XXXXXXX XXXXX
Omalizumab XXXXXXXX XXXXX Extendedly dominated
Reslizumab XXXXXXXX XXXXX £24,907
Utility scenario 1; BSC XXXXXXX XXXXX
Omalizumab XXXXXXXX XXXXX Extendedly dominated
Reslizumab XXXXXXXX XXXXX £30,717
Utility scenario 2; BSC XXXXXXX XXXXX
Omalizumab XXXXXXXX XXXXX Extendedly dominated
Reslizumab XXXXXXXX XXXXX £28,302
Utility scenario 3; BSC XXXXXXX XXXXX Omalizumab XXXXXXXX XXXXX Extendedly dominated Reslizumab XXXXXXXX XXXXX £29,720
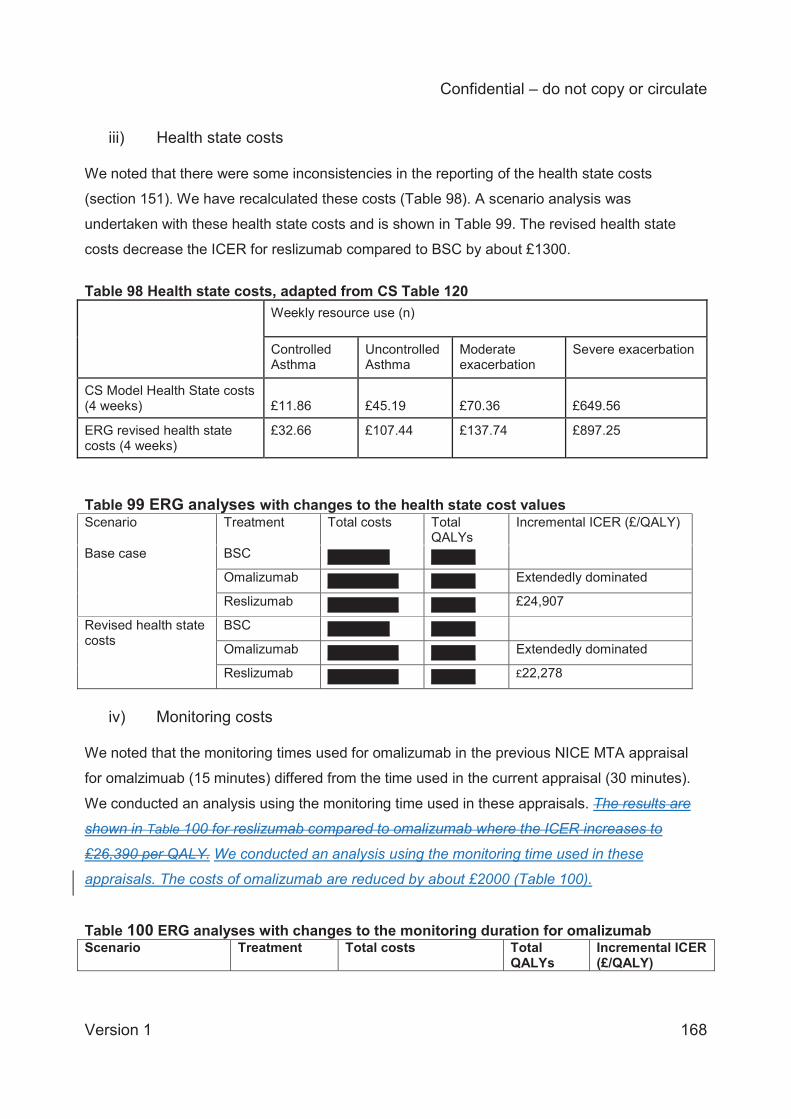
Confidential – do not copy or circulate
Version 1 168
iii) Health state costs We noted that there were some inconsistencies in the reporting of the health state costs
(section 151). We have recalculated these costs (Table 98). A scenario analysis was
undertaken with these health state costs and is shown in Table 99. The revised health state
costs decrease the ICER for reslizumab compared to BSC by about £1300.
Table 98 Health state costs, adapted from CS Table 120 Weekly resource use (n)
Controlled Asthma
Uncontrolled Asthma
Moderate exacerbation
Severe exacerbation
CS Model Health State costs (4 weeks) £11.86 £45.19 £70.36 £649.56
ERG revised health state costs (4 weeks)
£32.66 £107.44 £137.74 £897.25
Table 99 ERG analyses with changes to the health state cost values Scenario Treatment Total costs Total
QALYs Incremental ICER (£/QALY)
Base case BSC XXXXXXX XXXXX
Omalizumab XXXXXXXX XXXXX Extendedly dominated
Reslizumab XXXXXXXX XXXXX £24,907
Revised health state costs
BSC XXXXXXX XXXXX
Omalizumab XXXXXXXX XXXXX Extendedly dominated
Reslizumab XXXXXXXX XXXXX £22,278
iv) Monitoring costs
We noted that the monitoring times used for omalizumab in the previous NICE MTA appraisal
for omalzimuab (15 minutes) differed from the time used in the current appraisal (30 minutes).
We conducted an analysis using the monitoring time used in these appraisals. The results are
shown in Table 100 for reslizumab compared to omalizumab where the ICER increases to
£26,390 per QALY. We conducted an analysis using the monitoring time used in these
appraisals. The costs of omalizumab are reduced by about £2000 (Table 100).
Table 100 ERG analyses with changes to the monitoring duration for omalizumab Scenario Treatment Total costs Total
QALYs Incremental ICER (£/QALY)
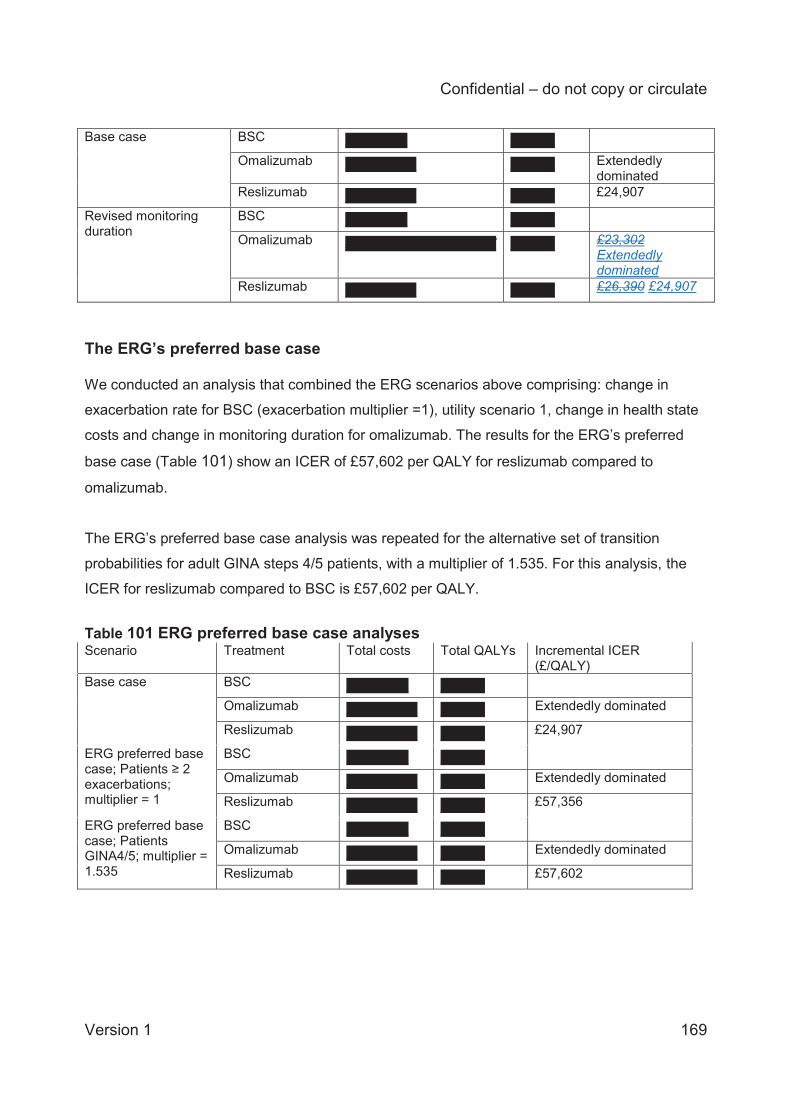
Confidential – do not copy or circulate
Version 1 169
Base case BSC XXXXXXX XXXXX Omalizumab XXXXXXXX XXXXX Extendedly
dominated Reslizumab XXXXXXXX XXXXX £24,907
Revised monitoring duration
BSC XXXXXXX XXXXX
Omalizumab XXXXXXXXXXXXXXXXX XXXXX £23,302 Extendedly dominated
Reslizumab XXXXXXXX XXXXX £26,390 £24,907
The ERG’s preferred base case We conducted an analysis that combined the ERG scenarios above comprising: change in
exacerbation rate for BSC (exacerbation multiplier =1), utility scenario 1, change in health state
costs and change in monitoring duration for omalizumab. The results for the ERG’s preferred
base case (Table 101) show an ICER of £57,602 per QALY for reslizumab compared to
omalizumab.
The ERG’s preferred base case analysis was repeated for the alternative set of transition
probabilities for adult GINA steps 4/5 patients, with a multiplier of 1.535. For this analysis, the
ICER for reslizumab compared to BSC is £57,602 per QALY.
Table 101 ERG preferred base case analyses Scenario Treatment Total costs Total QALYs Incremental ICER
(£/QALY) Base case BSC XXXXXXX XXXXX
Omalizumab XXXXXXXX XXXXX Extendedly dominated
Reslizumab XXXXXXXX XXXXX £24,907
ERG preferred base case; Patients ≥ 2 exacerbations; multiplier = 1
BSC XXXXXXX XXXXX Omalizumab XXXXXXXX XXXXX Extendedly dominated
Reslizumab XXXXXXXX XXXXX £57,356 ERG preferred base case; Patients GINA4/5; multiplier = 1.535
BSC XXXXXXX XXXXX
Omalizumab XXXXXXXX XXXXX Extendedly dominated
Reslizumab XXXXXXXX XXXXX £57,602
Confidential – do not copy or circulate
Version 1 170
4.5 Conclusions on cost effectiveness The company adapted a model structure published by Willson and colleagues that compared
tiotropium bromide to BSC in patients with severe asthma.44 The company does not provide a
rationale for the choice of model structure, but the ERG considers the model structure to be
appropriate for the decision problem. The structure of the model is different from the models
used for technology appraisals of omalizumab and mepolizumab, and other published models.44,
47, 48 The differences in model structure make comparison of the model results difficult.
The company used methods that are consistent with NICE methodological guidelines. The
population, intervention and comparators used in the economic evaluation are broadly
consistent with the NICE scope. What was considered as part of BSC was not well defined in
the scope or in the model; in practice, BSC could incorporate a number of treatments and it is
unclear if different treatments in the asthma care pathway may be more effective than others.
The core clinical evidence for reslizumab was derived from several large, good quality trials,19
that compared reslizumab to BSC. The model uses transition probabilities according to the
transitions observed in the trial, however the ERG had concerns over the explanation of the
derivation of the transition probabilities and the rationale for choosing to use the subgroup of
patients with more than 2 previous exacerbations. Further the ERG questions whether it is
appropriate to calibrate the model to increase the number of exacerbations, to a similar level as
seen in the year preceding the trial.
The results in the CS and in this report are presented for the list price for omalizumab and the
confidential PAS price for resilizumab. The CS base case analysis comparing reslizumab to
BSC had an ICER of £24,907 per QALY. The base case ICER for reslizumab compared to
omalizumab and BSC in patients with persistent allergic eosinophilic asthma and a history of ≥3
exacerbations was also £24,907 per QALY, as omalizumab was extendedly dominated (a
combination of BSC and reslizumab would be more cost-effective than offering omalizumab).
The ICER for omalizumab compared to BSC is £33,254 per QALY, which is more than the ICER
for reslizumab compared to BSC. The company’s PSA indicated that at a threshold of £20,000
per QALY there would be a XXX probability that reslizumab is cost-effective and at £30,000 per
QALY this probability increases to XXX. In addition to PSA, a wide variety of one-way
deterministic sensitivity analyses were conducted.
Confidential – do not copy or circulate
Version 1 171
Generally, sensitivity analyses showed that results were most sensitive to assumptions about
exacerbations. The number of exacerbations in trial subgroups was positively correlated with
reslizumab cost-effectiveness.
The ERG has some concerns about choices of parameters, and conducted analyses evaluating
lower rates of exacerbations in the BSC arm, alternative methods of calculating exacerbation
utility scores, different cost for administration of omalizumab, and different health state costs
based on the values reported in the CS rather than the values used in the model.
The ERG’s alternative base case analysis for the comparison for reslizumab compared to BSC
produces an ICER of £57,356 per QALY. In comparison to reslizumab, omalizumab remains
extendedly dominated.
5 Innovation The company claims (CS section 2.5) that reslizumab is an innovative therapy, since:
(1) There are currently very few treatment options for patients with severe (BTS/SIGN and GINA
Step 4/5) asthma with elevated eosinophils who are not eligible for omalizumab treatment and
remain inadequately controlled on best standard of care (BSC), other than continuing to
increase the ICS dose or adding OCS.
(2) No other biologic therapies with the same mode of action as reslizumab (i.e. high-affinity
binding to IL-5 to reduce eosinophil maturation, survival and activity are currently available).
The ERG agrees that these are reasonable claims, although we note, as the company
mentions, that the anti-IL-5 monoclonal antibody mepolizumab is licensed as an add-on
treatment for severe refractory eosinophilic asthma in adults, but is not currently recommended
by NICE (appraisal ongoing).
Confidential – do not copy or circulate
Version 1 172
6 DISCUSSION
6.1 Summary of clinical effectiveness issues The CS and the ITC Report, although generally well structured, contain numerous
inconsistencies, many of which may be typographical errors. This makes the submission difficult
to follow and appraise accurately. Sample sizes reported for the trials are inconsistent both
within the CS and between the CS and that ICS Report, and for most of the outcomes analysed
the reported sample sizes suggest that an ITT analysis was not followed. Feasibility
assessments for the inclusion or exclusion of trials for both the direct comparison meta-analysis
and ITC are not clearly explained, and the CS presents a confusing picture as to whether trial
Res-5-0010 is relevant or not. The company makes a key assumption that placebo and BSC are
equivalent without providing any justification for this and without mentioning whether the
assumption is robust to placebo effects. The ITC Report also fails to mention that not all
omalizumab trials had a placebo or BSC comparator and it is unclear whether ‘optimised
asthma control’ or ‘control group’ arms in omalizumab trials are equivalent to BSC.
The ERG has a number of further concerns about the company’s ITC. For the AQLQ outcome
assessed at 16±4 weeks the trial Res-5-0010 is included in the ITC of reslizumab versus
omalizumab but excluded from the direct comparison of reslizumab versus placebo, without any
explanation. Second, the The company’s process for selecting trials based on their definitions of
clinically significant exacerbations appears inconsistent, meaning that several omalizumab trials
may have been unnecessarily excluded from analysis. The ITC Report selectively presents only
fixed-effects model results for the analysis of clinically significant exacerbation rates when a
random-effects analysis should at least have been presented for comparison.
[Note added after final submission of this ERG report to NICE: The company clarified during the
factual inaccuracy check process that sample sizes for the ITC analyses were the same as
those for their direct comparison meta-analysis but were reported incorrectly in the ITC Report
(the ERG cannot corroborate this). The company also clarified that trial Res-5-0010 was not
included in the AQLQ ITC analysis, although the ITC Report states that it was. These
discrepancies do not materially affect the conclusions of this report, since other uncertainties in
the results of the ITC analysis remain].
Confidential – do not copy or circulate
Version 1 173
6.2 Summary of cost effectiveness issues
The CS includes evidence on the cost-effectiveness of reslizumab compared to BSC and
omalizumab for severe asthma. The model structure adopted for the economic evaluation is
generally appropriate and consistent with the clinical disease pathway. The model uses
transition probabilities according to the transitions observed in the pivotal clinical trials, however
the ERG had concerns over the explanation of the derivation of the transition probabilities and
the rationale for choosing to use the subgroup of patients with more than 2 previous
exacerbations. Further the ERG questions whether it is appropriate to calibrate the model to
increase the number of exacerbations, to a similar level as seen in the year preceding the trial.
The CS and this report present all results at the list price for omalizumab and the confidential
PAS price for resilizumab. The model results suggest that reslizumab has a cost effectiveness
versus BSC of £24,907 per QALY (omalizumab was extendedly dominated by BSC). The
company conducted deterministic sensitivity analyses for the input parameters that found that
the results were most sensitive to changes in the baseline risk of exacerbation, a shorter time
horizon and the risk of asthma death.
The company’s probabilistic sensitivity analyses showed there is a probability of XXX and XXX
that reslizumab is cost effective at a willingness to pay threshold of £20,000 and £30,000
respectively.
The ERG conducted sensitivity analyses evaluating lower rates of exacerbations in the BSC
arm, alternative methods of calculating exacerbation utility scores, different costs for the
administration of omalizumab, and different health state costs based on the values reported in
the CS rather than the values used in the model. The ERG’s alternative base case analysis for
the reslizumab compared to BSC produces an ICER of £57,356 per QALY.
A possible limitation of the economic analysis is that there was no evidence available from the
trials or other data sources on a likely effect of reslizumab on oral steroid use. Use of oral
corticosteroids is one of the outcome measures indicated for consideration in the NICE scope.
Clinical experts advising the ERG noted that this is potentially an important factor, as, in addition
Confidential – do not copy or circulate
Version 1 174
to their impact on adverse events, oral steroids are a significant cost driver in populations with
severe asthma. Whilst exacerbations are clearly of key importance, they do not fully capture the
potential cost-effectiveness of the intervention without including reductions in day-to-day
symptoms and steroid requirements.
7 REFERENCES 1. NIHR Horizon Scanning Centre. Reslizumab for eosinophilic asthma 2015. Available from:
http://www.hsric.nihr.ac.uk/topics/reslizumab-for-eosinophilic-asthma/.
2. Asthma UK. Asthma facts and statistics 2016. Available from:
https://www.asthma.org.uk/about/media/facts-and-statistics/
3. Asthma UK. Living on a knife edge. 2004.
4. European Respiratory Society (ERS). Assessing asthma quality of life: its role in clinical
practice 2005.
5. British Thoracic Society and Scottish Intercollegiate Guidelines Network. SIGN 141. British
Guideline on the Management of Asthma 2014. Available from: https://www.brit-
thoracic.org.uk/guidelines-and-quality-standards/asthma-guideline.
6. Global Initiative for Asthma. Global strategy for asthma management and prevention (2016
update). Available from: http://ginasthma.org/
7. Novelli F, Lenzini G, Latorre M, Seccia V, Bartoli ML, Malagrinò L, et al. Influence of
obesity and nasal polyps on severe asthma. European Respiratory Journal. 2013;42(Suppl
57).
8. Chang PJ, Bhavsar PK, Michaeloudes C, Khorasani N, Chung KF. Corticosteroid
insensitivity of chemokine expression in airway smooth muscle of patients with severe
asthma. J Allergy Clin Immunol. 2012;130(4):877-85.e5.
9. Chung KF, Wenzel SE, Brozek JL, Bush A, Castro M, Sterk PJ, et al. International
ERS/ATS guidelines on definition, evaluation and treatment of severe asthma. Eur Respir
J. 2014;43(2):343-73.
10. National Institute for Health and Care Excellence. Asthma Quality Standard (QS25) 2013.
Available from: https://www.nice.org.uk/guidance/qs25
Confidential – do not copy or circulate
Version 1 175
11. NHS England. A14/S/b 2013/14 NHS Standard contract for respiratory severe asthma
(adult);2013.
12. National Institute for Health and Care Excellence. Omalizumab for treating severe
persistent allergic asthma. NICE technology appraisal guidance [TA278] 2013. Available
from: https://www.nice.org.uk/guidance/ta278.
13. European Medicines Agency. Reslizumab Summary of Product Characteristics 2016.
14. de Groot J, ten Brinke A, Bel E. Management of the patient with eosinophilic asthma: a
new era begins. ERJ Open Res. 2015;1(00024-2015):1-11.
15. U.S. Food and Drug Administration. Cinqair (reslizumab) printed labelling (Application No.:
761033) 2016. Available from:
http://www.accessdata.fda.gov/drugsatfda_docs/nda/2016/761033Orig1s000Lbl.pdf.
16. Amaris. Indirect treatment comparison in the treatment of eosinophilic asthma. Confidential
study report. 2016.
17. Li J, Kang J, Wang C, Yang J, Wang L, Kottakis I, et al. Omalizumab improves quality of
life and asthma control in Chinese patients with moderate to severe asthma: A randomized
phase III study. Allergy Asthma Immunol Res. 2016;8(4):319-28.
18. Li J, Kang J, Wang C, Yang J, Humphries M, Greenberg S, et al. Omalizumab improves
asthma symptoms, asthma control, and health-related quality of life in Chinese patients
with moderate-to-severe asthma. Chest. 2016;149(4_S):A6.
19. Castro M, Zangrilli J, Wechsler M, Bateman E, Brusselle G, Bardin P, et al. Reslizumab for
inadequately controlled asthma with elevated blood eosinophil counts: results from two
multicentre, parallel, double-blind, randomised, placebo-controlled, phase 3 trials. Lancet
Respir Med. 2015;3:355-66.
20. Bjermer L, Lemiere C, Maspero J, Weiss S, Zangrilli J, Germinaro M. Reslizumab for
Inadequately Controlled Asthma with Elevated Blood Eosinophil Levels: a Randomized
Phase 3 Study. Chest. 2016.
21. Corren J, Weinstein S, Janka L, Zangrilli J, Garin M. Phase 3 Study of Reslizumab in
Patients with Poorly Controlled Asthma: Effects Across a Broad Range of Eosinophil
Counts. Chest. 2016.
Confidential – do not copy or circulate
Version 1 176
22. Castro M, Mathur S, Hargreave F, Boulet L-P, Xie F, Young J, et al. Reslizumab for poorly
controlled, eosinophilic asthma. A randomized, placebo-controlled study. Am J Respir Crit
Care Med. 2011;184:1126-32.
23. Juniper E, Bousquet J, Abetz L, Bateman E, Committee TG. Identifying ‘well-controlled’
and ‘not well-controlled’ asthma using the Asthma Control Questionnaire. Respir Med.
2006;100(4):616-21.
24. Juniper EF, Guyatt GH, Epstein RS, Ferrie PJ, Jaeschke R, Hiller TK. Evaluation of
impairment of health related quality of life in asthma: development of a questionnaire for
use in clinical trials. Thorax. 1992;47(2):76-83.
25. Jones P. Interpreting thresholds for a clinically significant change in health status in
asthma and COPD. Eur Respir J. 2002;19:398-404.
26. Jansen J, Trikalinos T, Cappelleri J, Daw J, Andes S, Eldessouki R, et al. Indirect
treatment comparison / network meta-analysis study questionnaire to assess relevance
and credibility to inform health care decision making: An ISPOR-AMCP-NPC Good
Practice Task Force report. Value Health. 2014;17:157-73.
27. Dias S, Welton N, Sutton A, Ades A. NICE DSU Technical Document 2: A generalised
linear modelling framework for pairwise and network meta-analysis of randomised
controlled trials. Decision Support Unit, ScHARR, University of Sheffield; 2014.
28. Hanania N, Wenzel S, Rosen K, Hsieh H-J, Mosesova S, Choy D, et al. Exploring the
effects of omalizumab in allergic asthma. Am J Respir Crit Care Med. 2013;187(8):804-11.
29. Bucher H, Guyatt G, Griffith L, Walter S. The results of direct and indirect treatment
comarisons in meta-analysis of randomised controlled trials. J Clin Epidemiol.
1997;50(6):683-91.
30. Song F, Loke Y, Walsh T, Glenny A-M, Eastwood A, Altman D. Methodological problems
in the use of indirect comparisons for evaluating healthcare interventions: survey of
published systematic reviews. BMJ. 2009;338(b1147):1-7.
31. Garcia G, Magnan A, Chiron R, Contin-Bordes C, Berger P, Taillé C, et al. A proof-of-
concept, randomized, controlled trial of omalizumab in patients with severe, difficult-to-
control, nonatopic asthma. Chest. 2013;144(2):411-9.
Confidential – do not copy or circulate
Version 1 177
32. Bousquet J, Siergiejko Z, Świebocka E, Humbert M, Rabe K, Smith N, et al. Persistency of
response to omalizumab therapy in severe allergic (IgE-mediated) asthma. Allergy.
2011;66:671-8.
33. Chanez P, Contin-Bordes C, Garcia G, Verkindre C, Didier A, de Blay F, et al.
Omalizumab-induced decrease of FcƐRI expression in patients with severe allergic
asthma. Respir Med. 2010;104:1608-17.
34. Humbert M, Beasley R, Ayres J, Slavin R, Hebert J, Bousquet J, et al. Benefits of
omalizumab as add-on therapy in patients with severe persistent asthma who are
inadequately controlled despite best available therapy (GINA 2002 step 4 treatment):
INNOVATE. Allergy. 2005;60(3):309-16.
35. Busse W, Corren J, Lanier B, McAlary M, Fowler-Taylor A, Cioppa G, et al. Omalizumab,
anti-IgE recombinant humanized monoclonal antibody, for the treatment of severe allergic
asthma. J Allergy Clin Immunol. 2001;108(2):184-90.
36. Ayres J, Higgins B, Chilvers E, Ayre G, Blogg M, Fox H. Efficacy and tolerability of anti-
immunoglobulin E therapy with omalizumab in patients with poorly controlled (moderate-to-
severe) allergic asthma. Allergy. 2004;59:701-8.
37. Niven R, Chung K, Panahloo Z, Blogg M, Ayre G. Effectiveness of omalizumab in patients
with inadequately controlled severe persistent allergic asthma: an open-label study. Respir
Med. 2008;102:1371-8.
38. Hoshino M, Ohtawa J. Effects of adding omalizumab, an anti-immunoglobulin E antibody,
on airway wall thickening in asthma. Respiration. 2012;83:520-8.
39. Rubin A, Souza-Machado A, Andradre-Lima M, Ferreira F, Honda A, Matozo T. Effect of
omalizumab as add-on therapy on asthma-related quality of life in severe allergic asthma:
a Brazilian study (QUALITX). J Asthma. 2012;49:288-93.
40. Ohta K, Miyamoto T, Amagasaki T, Yamamoto M. Efficacy and safety of omalizumab in an
Asian population with moderate-to-severe persistent asthma. Respirology. 2009;14:1156-
65.
41. Hanania N, Alpan O, Hamilos D, Condemi J, Reyes-Rivera I, Zhu J, et al. Omalizumab in
severe allergic asthma inadequately controlled with standard therapy. Ann Intern Med.
2011;154:573-82.
Confidential – do not copy or circulate
Version 1 178
42. Amaris. Systematic literature review of quality of life, resource use and economic evidence
in severe asthma. Confidential study report. 2016.
43. Thomson NC, Chaudhuri R, Heaney LG, Bucknall C, Niven RM, Brightling CE, et al.
Clinical outcomes and inflammatory biomarkers in current smokers and exsmokers with
severe asthma. J Allergy Clin Immunol. 2013;131(4):1008-16.
44. Willson J, Bateman ED, Pavord I, Lloyd A, Krivasi T, Esser D. Cost effectiveness of
tiotropium in patients with asthma poorly controlled on inhaled glucocorticosteroids and
long-acting beta-agonists. Appl Health Econ Health Policy. 2014;12(4):447-59.
45. Faria R, McKenna C, Palmer S. Optimizing the position and use of omalizumab for severe
persistent allergic asthma using cost-effectiveness analysis. Value Health. 2014;17(8):772-
82.
46. Faria R, McKenna C. Integrating the Long-Term Health Burden of Oral Corticosteroids in
the Cost-Effectiveness of Omalizumab. Value in Health. 2013;16(7):A373.
47. Norman G, Faria R, Paton F, Llewellyn A, Fox D, Palmer S, et al. Omalizumab for the
treatment of severe persistent allergic asthma: a systematic review and economic
evaluation. Health Technol Assess. 2013;17(52):1-342.
48. Stevenson M, Bermejo I, Cooper K, Harnan S, Sanderson J, Clowes M, et al.
Mepolizumab for treating severe eosinophilic asthma: A Single Technology Appraisal.
Sheffield: School of Health and Related Research (ScHARR), The University of Sheffield,
2016.
49. von Elm E, Altman D, Egger M, Pocock S, Gøtzsche P, Vandenbroucke J. The
Strengthening the Reporting of Observational Studies in Epidemiology (STROBE)
Statement: Guidelines for Reporting Observational Studies. Ann Intern Med.
2007;147:573-7.
50. National Institute for Health and Care Excellence. Developing NICE guidelines: the
manual. 2014.
51. Brown R, Turk F, Dale P, Bousquet J. Cost-effectiveness of omalizumab in patients with
severe persistent allergic asthma. Allergy. 2007;62(2):149-53.
52. Dewilde S, Turk F, Tambour M, Sandstrom T. The economic value of anti-IgE in severe
persistent, IgE-mediated (allergic) asthma patients: adaptation of INNOVATE to Sweden.
Current Medical Research and Opinion. 2006;22(9):1765-76.
Confidential – do not copy or circulate
Version 1 179
53. Gerzeli S, Rognoni C, Quaglini S, Cavallo MC, Cremonesi G, Papi A. Cost-effectiveness
and cost-utility of beclomethasone/formoterol versus fluticasone propionate/salmeterol in
patients with moderate to severe asthma. Clinical Drug Investigation. 2012;32(4):253-65.
54. Morishima T, Ikai H, Imanaka Y. Cost-effectiveness analysis of omalizumab for the
treatment of severe asthma in Japan and the value of responder prediction methods based
on a multinational trial. Value in Health Regional Issues. 2013;2(1):29-36.
55. European Medicines Agency. Omalizumab Summary of Product Characteristics (SmPC).
2016.
56. National Institute for Health and Care Excellence. Single Technology Appraisal.
Mepolizumab for treating severe eosinophilic asthma [ID798]. Committee papers. 2016.
57. Roberts NJ, Lewsey JD, Gillies M, Briggs AH, Belozeroff V, Globe DR, et al. Time trends in
30 day case-fatality following hospitalisation for asthma in adults in Scotland: a
retrospective cohort study from 1981 to 2009. Respir Med. 2013;107(8):1172-7.
58. Office for National Statistics. National life tables, United Kingdom. Release date 23
September 2015.
59. Lloyd A, Price D, Brown R. The impact of asthma exacerbations on health-related quality
of life in moderate to severe asthma patients in the UK. Prim Care Respir J. 2007;16(1):22-
7.
60. Szende A, Svensson K, Stahl E, Meszaros A, Berta GY. Psychometric and Utility-Based
Measures of Health Status of Asthmatic Patients with Different Disease Control Level.
Pharmacoeconomics. 2004;22(8):537-47.
61. Allegra L, Cremonesi G, Girbino G, Ingrassia E, Marsico S, Nicolini G, et al. Real-life
prospective study on asthma control in Italy: cross-sectional phase results. Respir Med.
2012;106(2):205-14.
62. Briggs AH, Bousquet J, Wallace MV, Busse WW, Clark TJ, Pedersen SE, et al. Cost-
effectiveness of asthma control: an economic appraisal of the GOAL study. Allergy.
2006;61(5):531-6.
63. Edelen MO, Burnam MA, Watkins KE, Escarce JJ, Huskamp H, Goldman HH, et al.
Obtaining utility estimates of the health value of commonly prescribed treatments for
asthma and depression. Med Decis Making. 2008;28(5):732-50.
Confidential – do not copy or circulate
Version 1 180
64. Price D, Berg J, Lindgren P. An economic evaluation of NIOX MINO airway inflammation
monitor in the United Kingdom. Allergy. 2009;64(3):431-8.
65. Steuten L, Palmer S, Vrijhoef B, van Merode F, Spreeuwenberg C, Severens H. Cost-utility
of a disease management program for patients with asthma. Int J Technol Assess Health
Care. 2007;23(2):184-91.
66. Ara R, Wailoo A. NICE DSU Technical Support Document 12: The Use of Health State
Utility Values in Decision Models. NICE Decision Support Unit, 2011.
67. National Institute for Health and Care Excellence. Appraisal consultation document:
Mepolizumab for treating severe refractory eosinophilic asthma. 2016.
68. Curtis L. Unit Costs of Health and Social Care 2015. Available at:
http://www.pssru.ac.uk/project-pages/unit-costs/2015/index.php?file=full. Personal Social
Services Research Unit, 2015.
69. Joint Formulary Committee. British National Formulary 70: London: British Medical
Association and Royal Pharmaceutical Society of Great Britain; 2015.
70. O'Neill C, Gamble J, Lindsay J, Heaney L. The Impact of Nonadherence to Inhaled Long-
Acting b2-Adrenoceptor Agonist/Corticosteroid Combination Therapy on Healthcare Costs
in Difficult-to-Control Asthma. Pharm Med. 2011;25(6):379-85.
71. Department of Health. NHS reference costs 2014-15. Available at:
https://www.gov.uk/government/uploads/system/uploads/attachment_data/file/480791/201
4-15_National_Schedules.xlsx. Department of Health, England, UK, 2015.
72. Statista. Consumer price index (CPI) of health annually in the UK from 2003-2015.
Available at: http://www.statista.com/statistics/286386/health-consumer-price-index-cpi-
annual-average-in-the-united-kingdom-uk/. 2015.
73. Norman G, Faria R, Paton F, Llewellyn A, Fox D, Palmer S, et al. Omalizumab for the
treatment of severe persistent allergic asthma: a systematic review and economic
evaluation. Technology Assessment Report for NICE. CRD/CHE Technology Assessment
Group, University of York, UK, 2012.
CONFIDENTIAL UNTIL PUBLISHED
Reslizumab for treating asthma with elevated blood
eosinophils inadequately controlled by inhaled corticosteroids Cover sheet for the ERG Report indicating the ERG’s amendments
made in response to the company’s factual inaccuracy check Produced by Southampton Health Technology Assessments Centre
Date completed 11th October 2016.
XXXXXXXXXXXXXXXXXXXXXXXXXXXXXXXXXXXXXXXXXXXXXXXXXX The following amendments have been made to the ERG report and are indicated within the
report by underlined italicised text.
Page 11. The words “in this report” have been added to clarify that the ERG report refers to trials 3082 and 3083 as being the company’s pivotal trials. This amendment addresses Issue 2 raised by the company (that the ERG’s and company’s references to ‘pivotal’ trials are slightly different). The ERG refers to these two trials as ‘pivotal’ given that they had longer duration than the other trials and were the key trials which informed the company’s economic analysis. Page 13. Changes in the second and third paragraphs have been made to clarify the number of trials which provided results for discontinuations due to adverse events and serious adverse events at 52 weeks (Issue 4 raised by the company). Results for serious adverse events at 16±1 weeks which were omitted from this summary have been added in the third paragraph (Issue 5 raised by the company). Page 15. The second paragraph has been amended to clarify that the company reported a random-effects analysis for this outcome (Issue 6 raised by the company). This analysis was inadvertently missed by the ERG as it is given separately in an appendix and not discussed by the company in their submission. Page 19. Third paragraph: missing CIC marking of probability values has been provided (Issue 7 raised by the company).
Page 21. The first bullet point has been amended to correct a company error wherein the company stated incorrectly that trial Res-5-0010 was included in the AQLQ outcome ITC analysis (Issue 1 raised by the company – not an ERG error). The fifth bullet point has been deleted, to remove an incorrect ERG statement that the company did not present a random-effects analysis for clinically significant exacerbations (Issue 6 raised by the company). A new final bullet point has been added to explain that, after the ERG report submission, the company acknowledged errors in the sample sizes reported for their ITC analysis (Issue 8 raised by the company – not an ERG error). Page 40. Text has been amended to correct ‘phase II’ to read ‘phase III’ (Issue 10 raised by the company). Pages 42-43. Table 4 has been amended so that exploratory variables are separated from secondary and tertiary variables in the Table (Issue 11 raised by the company). However this does not influence interpretation since the company does not define secondary, tertiary or exploratory variables. Page 44. Text has been amended in the first paragraph to clarify that the company was aware of an imbalance in the proportion of females in the reslizumab arm of trial 3084 (Issue 12 raised by the company). Page 49. Missing exacerbation proportions for trial 3084 have been added in Table 5 (Issue 13 raised by the company). Page 54. A correction has been made to the cross-reference at the end of the second paragraph (Issue 14 raised by the company). Page 59. Missing safety analysis sample sizes for trial 3084 have been added in Table 7 (Issue 15 raised by the company). Page 62. A correction has been made to a cross-reference in the final paragraph (Issue 16 raised by the company). Page 68. The third full paragraph has been deleted to correct a company error wherein the company stated incorrectly that trial Res-5-0010 was included in the AQLQ outcome ITC analysis (Issue 1 raised by the company – not an ERG error). Page 82. In Table 24 the cited data source has been corrected from CS Table 59 to CS Table 60 (Issue 16 raised by the company). Page 85. The final paragraph has been amended to provide a more precise description of the pattern of adverse events (Issue 17 raised by the company). Page 88. An incorrect sample size value in Table 31 has been corrected (Issue 18 raised by the company).
Page 89. Text has been amended in the first paragraph to clarify the number of trials which reported discontinuations due to adverse events at 52 weeks (Issue 4 raised by the company). Table 32 has been amended to clarify that the 52-week results for serious adverse events are from trials 3082 and 3083 (Issue 5 raised by the company). Pages 90-91. Table 34 and the paragraph above it, and Table 35, have been amended to provide missing results for three trials which reported serious adverse events up to 16±1 weeks (Issue 5 raised by the company). Page 94. Table 40 has been amended to clarify that the means are least-squares means (Issue 20 raised by the company). To ensure consistency, standard means in the final row of the table have been replaced with least-squares means Pages 95-96. Text at the end of page 95 and at the start of page 96 has been amended to clarify that the statistically significant change in ACQ score was in the total trial population, not in the subgroup analyses (Issue 21 raised by the company). Pages 100-101. Table 46 and text in the first, second and third paragraphs on page 100 have been amended to clarify that the company reported a random-effects analysis for this outcome (Issue 6 raised by the company). This analysis was inadvertently missed by the ERG as it is given separately in an appendix and not discussed by the company in their submission. Page 108. Table 61, and the text in the first and third paragraphs in section 3.4.5, have been amended to correct a company error wherein the company stated incorrectly that trial Res-5-0010 was included in the AQLQ outcome ITC analysis (Issue 1 raised by the company – not an ERG error). Page 109. Text in the third paragraph has been amended to correct a company error wherein the company stated incorrectly that trial Res-5-0010 was included in the AQLQ outcome ITC analysis (Issue 1 raised by the company – not an ERG error). Page 113. ‘AQLQ’ has been replaced with ‘HRQoL’ in the second bullet point (ERG typographic error). The third bullet point has been amended to correct a company error wherein the company stated incorrectly that trial Res-5-0010 was included in the AQLQ outcome ITC analysis (Issue 1 raised by the company – not an ERG error). Page 114. The second bullet point has been deleted, to remove an incorrect ERG statement that the company did not present a random-effects analysis for clinically significant exacerbations (Issue 6 raised by the company). Page 117. The number of excluded references has been corrected (Issue 22 raised by the company).
Page 131, 132, 134 and 138. An explanation has been added for why transition probabilities used in the model differed from the probabilities estimated directly from the clinical trials (Issue 23 raised by the company). Page 153. A cross-reference in the caption of Table 88 has been corrected (Issue 16 raised by the company). Page 159. First paragraph: missing CIC marking of probability values has been provided (Issue 7 raised by the company). Page 163. A cross-reference in the first full paragraph has been corrected (Issue 16 raised by the company). An ICER in Table 94 has been corrected from XXXXXXX to XXXXXXX (Issue 24 raised by the company). In the last paragraph, missing CIC marking of probability values has been provided (Issue 7 raised by the company). Page 164. Figure 11 has been marked as CIC (Issue 7 raised by the company). Pages 167-168. In the Revised monitoring duration rows of Table 100 the total cost of reslizumab has been corrected from XXXXXXXX to XXXXXXXX; the corresponding ICER value has been updated to ‘Extendedly dominated’; and the ICER value for reslizumab has been corrected from £26,390 to £24,907 (Issue 25 raised by the company). Page 169. Fourth paragraph: missing CIC marking of probability values has been provided (Issue 7 raised by the company). Page 171. Text in the second paragraph has been deleted to correct a company error wherein the company stated incorrectly that trial Res-5-0010 was included in the AQLQ outcome ITC analysis (Issue 1 raised by the company – not an ERG error). Text at the end of the second paragraph has been deleted, to remove an incorrect ERG statement that the company did not present a random-effects analysis for clinically significant exacerbations (Issue 6 raised by the company). A new final paragraph has been added to explain that, after the ERG report submission, the company acknowledged errors in the sample sizes reported for their ITC analysis (Issue 8 raised by the company – not an ERG error). Page 172. Reference to ERG concerns over derivation of transition probabilities from the trial data has been removed (Issue 23 raised by the company). Third paragraph: missing CIC marking of probability values has been provided (Issue 7 raised by the company).
Nat
iona
l Ins
titut
e fo
r Hea
lth a
nd C
are
Exce
llenc
e C
entr
e fo
r Hea
lth T
echn
olog
y Ev
alua
tion
Pr
o-fo
rma
Res
pons
e
ER
G re
port
Res
lizum
ab fo
r tre
atin
g eo
sino
phili
c as
thm
a in
adeq
uate
ly c
ontr
olle
d on
inha
led
corti
cost
eroi
ds [I
D87
2]
You
are
aske
d to
che
ck th
e ER
G re
port
from
Sou
tham
pton
Hea
lth T
echn
olog
y As
sess
men
t Cen
tre to
ens
ure
ther
e ar
e no
fact
ual
inac
cura
cies
con
tain
ed w
ithin
it.
If yo
u do
iden
tify
any
fact
ual i
nacc
urac
ies
you
mus
t inf
orm
NIC
E by
5pm
, 29th
Sep
tem
ber 2
016
usin
g th
e be
low
pro
form
a co
mm
ents
tabl
e. A
ll fa
ctua
l erro
rs w
ill be
hig
hlig
hted
in a
repo
rt an
d pr
esen
ted
to th
e Ap
prai
sal C
omm
ittee
and
will
subs
eque
ntly
be
publ
ishe
d on
the
NIC
E w
ebsi
te w
ith th
e Ev
alua
tion
repo
rt.
The
prof
orm
a do
cum
ent s
houl
d ac
t as
a m
etho
d of
det
ailin
g an
y in
accu
raci
es fo
und
and
how
and
why
they
sho
uld
be c
orre
cted
.
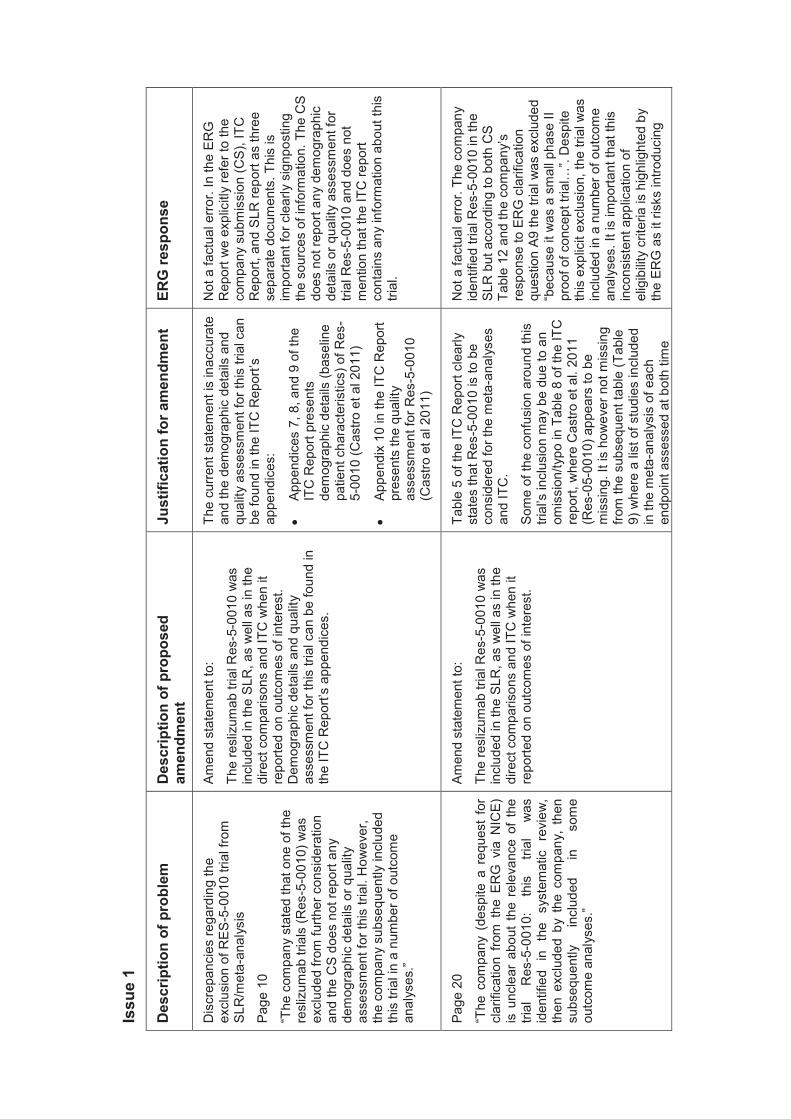
Issu
e 1
Des
crip
tion
of p
robl
em
Des
crip
tion
of p
ropo
sed
amen
dmen
t Ju
stifi
catio
n fo
r am
endm
ent
ERG
resp
onse
Dis
crep
anci
es re
gard
ing
the
excl
usio
n of
RES
-5-0
010
trial
from
SL
R/m
eta -
anal
ysis
Page
10
“The
com
pany
sta
ted
that
one
of t
he
resl
izum
ab tr
ials
(Res
-5-0
010)
was
ex
clud
ed fr
om fu
rther
con
side
ratio
n an
d th
e C
S do
es n
ot re
port
any
dem
ogra
phic
det
ails
or q
ualit
y as
sess
men
t for
this
tria
l. H
owev
er,
the
com
pany
sub
sequ
ently
incl
uded
th
is tr
ial i
n a
num
ber o
f out
com
e an
alys
es.”
Amen
d st
atem
ent t
o:
The
resl
izum
ab tr
ial R
es-5
-001
0 w
as
incl
uded
in th
e SL
R, a
s w
ell a
s in
the
dire
ct c
ompa
rison
s an
d IT
C w
hen
it re
porte
d on
out
com
es o
f int
eres
t. D
emog
raph
ic d
etai
ls a
nd q
ualit
y as
sess
men
t for
this
tria
l can
be
foun
d in
th
e IT
C R
epor
t’s a
ppen
dice
s.
The
curre
nt s
tate
men
t is
inac
cura
te
and
the
dem
ogra
phic
det
ails
and
qu
ality
ass
essm
ent f
or th
is tr
ial c
an
be fo
und
in th
e IT
C R
epor
t’s
appe
ndic
es:
Ap
pend
ices
7, 8
, and
9 o
f the
IT
C R
epor
t pre
sent
s de
mog
raph
ic d
etai
ls (b
asel
ine
patie
nt c
hara
cter
istic
s) o
f Res
-5-
0010
(Cas
tro e
t al 2
011)
Ap
pend
ix 1
0 in
the
ITC
Rep
ort
pres
ents
the
qual
ity
asse
ssm
ent f
or R
es-5
- 001
0 (C
astro
et a
l 201
1)
Not
a fa
ctua
l erro
r. In
the
ERG
R
epor
t we
expl
icitl
y re
fer t
o th
e co
mpa
ny s
ubm
issi
on (C
S), I
TC
Rep
ort,
and
SLR
repo
rt as
thre
e se
para
te d
ocum
ents
. Thi
s is
im
porta
nt fo
r cle
arly
sig
npos
ting
the
sour
ces
of in
form
atio
n. T
he C
S do
es n
ot re
port
any
dem
ogra
phic
de
tails
or q
ualit
y as
sess
men
t for
tri
al R
es-5
-001
0 an
d do
es n
ot
men
tion
that
the
ITC
repo
rt co
ntai
ns a
ny in
form
atio
n ab
out t
his
trial
.
Page
20
“The
com
pany
(de
spite
a r
eque
st f
or
clar
ifica
tion
from
the
ER
G v
ia N
ICE)
is
unc
lear
abo
ut t
he r
elev
ance
of
the
trial
R
es-5
-001
0:
this
tri
al
was
id
entif
ied
in
the
syst
emat
ic
revi
ew,
then
exc
lude
d by
the
com
pany
, th
en
subs
eque
ntly
in
clud
ed
in
som
e ou
tcom
e an
alys
es.”
Amen
d st
atem
ent t
o:
The
resl
izum
ab tr
ial R
es-5
-001
0 w
as
incl
uded
in th
e SL
R, a
s w
ell a
s in
the
dire
ct c
ompa
rison
s an
d IT
C w
hen
it re
porte
d on
out
com
es o
f int
eres
t.
Tabl
e 5
of th
e IT
C R
epor
t cle
arly
st
ates
that
Res
-5-0
010
is to
be
cons
ider
ed fo
r the
met
a-an
alys
es
and
ITC
.
Som
e of
the
conf
usio
n ar
ound
this
tri
al’s
incl
usio
n m
ay b
e du
e to
an
omis
sion
/typo
in T
able
8 o
f the
ITC
re
port,
whe
re C
astro
et a
l. 20
11
(Res
-05-
0010
) app
ears
to b
e m
issi
ng. I
t is
how
ever
not
mis
sing
fro
m th
e su
bseq
uent
tabl
e (T
able
9)
whe
re a
l ist
of s
tudi
es in
clud
ed
in th
e m
eta -
anal
ysis
of e
ach
endp
oint
ass
esse
d at
bot
h tim
e
Not
a fa
ctua
l erro
r. Th
e co
mpa
ny
iden
tifie
d tri
al R
es-5
-001
0 in
the
SLR
but
acc
ordi
ng to
bot
h C
S Ta
ble
12 a
nd th
e co
mpa
ny’s
re
spon
se to
ER
G c
larif
icat
ion
ques
tion
A9 th
e tri
al w
as e
xclu
ded
“bec
ause
it w
as a
sm
all p
hase
II
proo
f of c
once
pt tr
ial…
”. D
espi
te
this
exp
licit
excl
usio
n, th
e tri
al w
as
incl
uded
in a
num
ber o
f out
com
e an
alys
es. I
t is
impo
rtant
that
this
in
cons
iste
nt a
pplic
atio
n of
el
igib
ility
crite
ria is
hig
hlig
hted
by
the
ERG
as
it ris
ks in
trodu
cing
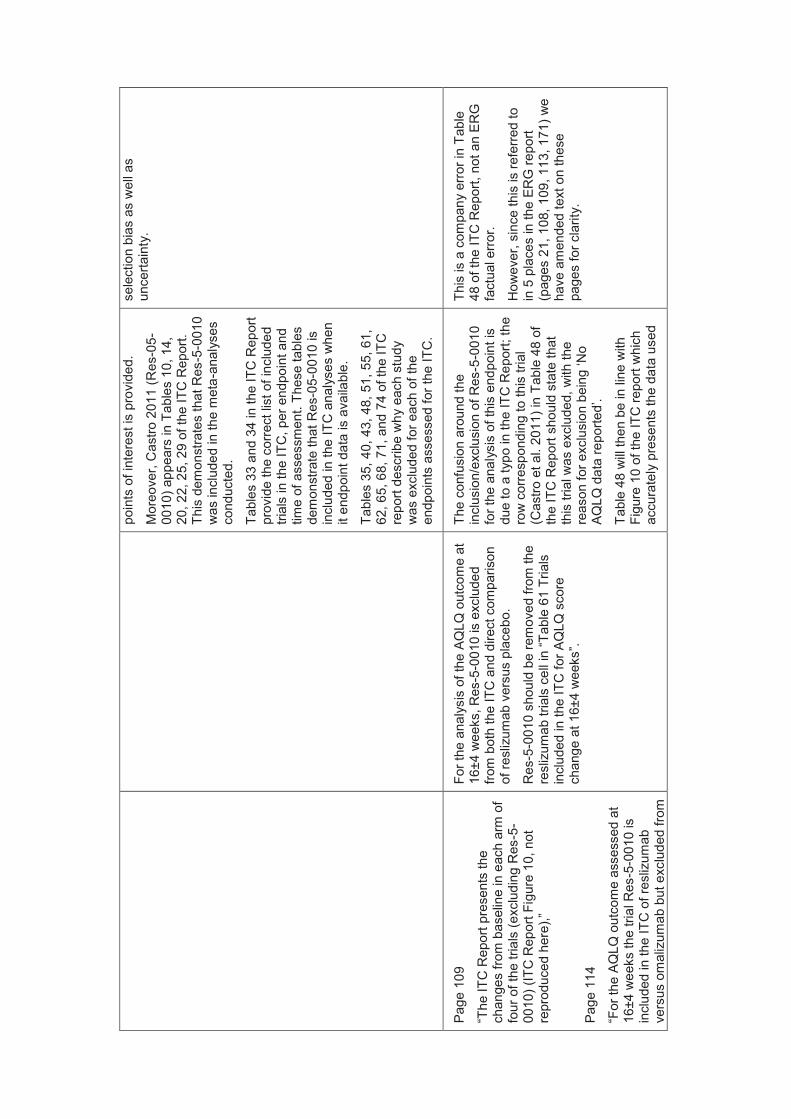
poin
ts o
f int
eres
t is
prov
ided
.
Mor
eove
r, C
astro
201
1 ( R
es-0
5-00
10) a
ppea
rs in
Tab
les
10, 1
4,
20, 2
2, 2
5, 2
9 of
the
ITC
Rep
ort.
This
dem
onst
rate
s th
at R
es-5
-001
0 w
as in
clud
ed in
the
met
a -an
alys
es
cond
ucte
d.
Tabl
es 3
3 an
d 34
in th
e IT
C R
epor
t pr
ovid
e th
e co
rrect
list
of i
nclu
ded
trial
s in
the
ITC
, per
end
poin
t and
tim
e of
ass
essm
ent.
Thes
e ta
bles
de
mon
stra
te th
at R
es-0
5-00
10 is
in
clud
ed in
the
ITC
ana
lyse
s w
hen
it en
dpoi
nt d
ata
is a
vaila
ble.
Tabl
es 3
5, 4
0, 4
3, 4
8, 5
1, 5
5, 6
1,
62, 6
5, 6
8, 7
1, a
nd 7
4 of
the
ITC
re
port
desc
ribe
why
eac
h st
udy
was
exc
lude
d fo
r eac
h of
the
endp
oint
s as
sess
ed fo
r the
ITC
.
sele
ctio
n bi
as a
s w
ell a
s un
certa
inty
.
Page
109
“The
ITC
Rep
ort p
rese
nts
the
chan
ges
from
bas
elin
e in
eac
h ar
m o
f fo
ur o
f the
tria
ls (e
xclu
ding
Res
-5-
0010
) (IT
C R
epor
t Fig
ure
10, n
ot
repr
oduc
ed h
ere)
,”
Page
114
“For
the
AQ
LQ o
utco
me
asse
ssed
at
16±4
wee
ks th
e tri
al R
es-5
-001
0 is
in
clud
ed in
the
ITC
of r
esliz
umab
ve
rsus
om
aliz
umab
but
exc
lude
d fro
m
For t
he a
naly
sis
of th
e AQ
LQ o
utco
me
at
16±4
wee
ks, R
es-5
-001
0 is
exc
lude
d fro
m b
oth
the
ITC
and
dire
ct c
ompa
rison
of
resl
izum
ab v
ersu
s pl
aceb
o.
Res
-5-0
010
shou
ld b
e re
mov
ed fr
om th
e re
sliz
umab
tria
ls c
ell i
n “T
able
61
Tria
ls
incl
uded
in th
e IT
C fo
r AQ
LQ s
core
ch
ange
at 1
6±4
wee
ks”.
The
conf
usio
n ar
ound
the
incl
usio
n/ex
clus
ion
of R
es-5
-001
0 fo
r the
ana
lysi
s of
this
end
poin
t is
due
to a
typo
in th
e IT
C R
epor
t; th
e ro
w c
orre
spon
ding
to th
is tr
ial
(Cas
tro e
t al.
2011
) in
Tabl
e 48
of
the
ITC
Rep
ort s
houl
d st
ate
that
th
is tr
ial w
as e
xclu
ded,
with
the
reas
on fo
r exc
lusi
on b
eing
‘No
AQ
LQ d
ata
repo
rted’
.
Tabl
e 48
will
then
be
in li
ne w
ith
Figu
re 1
0 of
the
ITC
repo
rt w
hich
ac
cura
tely
pre
sent
s th
e da
ta u
sed
This
is a
com
pany
erro
r in
Tabl
e 48
of t
he IT
C R
epor
t, no
t an
ERG
fa
ctua
l erro
r.
How
ever
, sin
ce th
is is
refe
rred
to
in 5
pla
ces
in th
e ER
G re
port
(pag
es 2
1, 1
08, 1
09, 1
13, 1
71) w
e ha
ve a
men
ded
text
on
thes
e pa
ges
for c
larit
y.
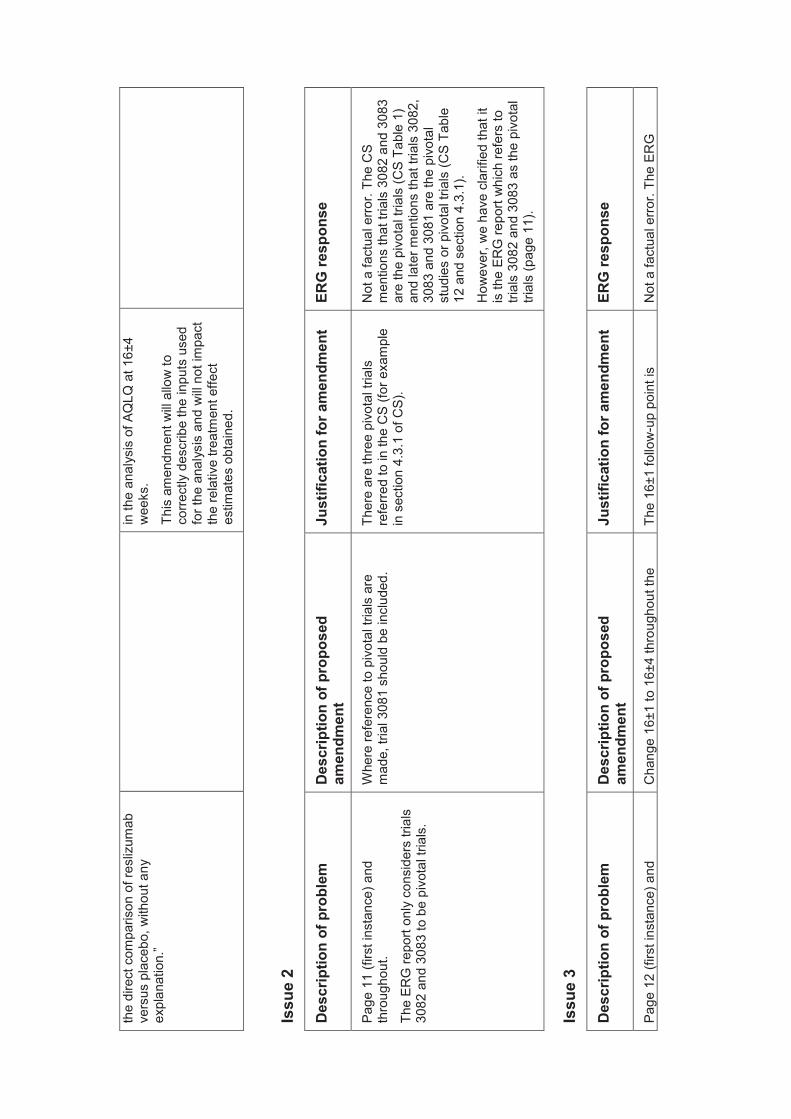
the
dire
ct c
ompa
rison
of r
esliz
umab
ve
rsus
pla
cebo
, with
out a
ny
expl
anat
ion.
”
in th
e an
alys
is o
f AQ
LQ a
t 16±
4 w
eeks
.
This
am
endm
ent w
ill al
low
to
corre
ctly
des
crib
e th
e in
puts
use
d fo
r the
ana
lysi
s an
d w
ill no
t im
pact
th
e re
lativ
e tre
atm
ent e
ffect
es
timat
es o
btai
ned.
Issu
e 2
Des
crip
tion
of p
robl
em
Des
crip
tion
of p
ropo
sed
amen
dmen
t Ju
stifi
catio
n fo
r am
endm
ent
ERG
resp
onse
Page
11
(firs
t ins
tanc
e) a
nd
thro
ugho
ut.
The
ERG
repo
rt on
ly c
onsi
ders
tria
ls
3082
and
308
3 to
be
pivo
tal t
rials
.
Whe
re re
fere
nce
to p
ivot
al tr
ials
are
m
ade,
tria
l 308
1 sh
ould
be
incl
uded
. Th
ere
are
thre
e pi
vota
l tria
ls
refe
rred
to in
the
CS
(for e
xam
ple
in s
ectio
n 4.
3.1
of C
S).
Not
a fa
ctua
l erro
r. Th
e C
S m
entio
ns th
at tr
ials
308
2 an
d 30
83
are
the
pivo
tal t
rials
(CS
Tabl
e 1)
an
d la
ter m
entio
ns th
at tr
ials
308
2,
3083
and
308
1 ar
e th
e pi
vota
l st
udie
s or
piv
otal
tria
ls (C
S Ta
ble
12 a
nd s
ectio
n 4.
3.1)
.
How
ever
, we
have
cla
rifie
d th
at it
is
the
ERG
repo
rt w
hich
refe
rs to
tri
als
3082
and
308
3 as
the
pivo
tal
trial
s (p
age
11).
Issu
e 3
Des
crip
tion
of p
robl
em
Des
crip
tion
of p
ropo
sed
amen
dmen
t Ju
stifi
catio
n fo
r am
endm
ent
ERG
resp
onse
Page
12
(firs
t ins
tanc
e) a
nd
Cha
nge
16±1
to 1
6±4
thro
ugho
ut th
e Th
e 16
±1 fo
llow
-up
poin
t is
Not
a fa
ctua
l erro
r. Th
e ER
G
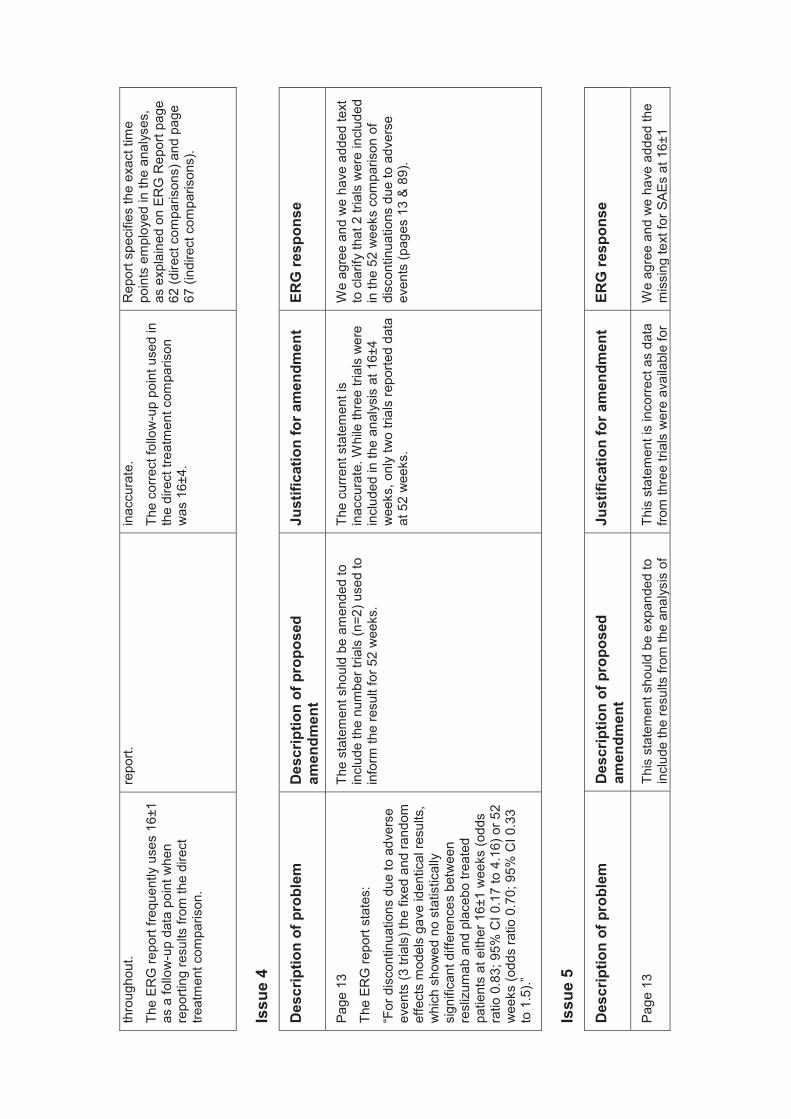
thro
ugho
ut.
The
ERG
repo
rt fre
quen
tly u
ses
16±1
as
a fo
llow
-up
data
poi
nt w
hen
repo
rting
resu
lts fr
om th
e di
rect
tre
atm
ent c
ompa
rison
.
repo
rt.
inac
cura
te.
The
corre
ct fo
llow
-up
poin
t use
d in
th
e di
rect
trea
tmen
t com
paris
on
was
16±
4.
Rep
ort s
peci
fies
the
exac
t tim
e po
ints
em
ploy
ed in
the
anal
yses
, as
exp
lain
ed o
n ER
G R
epor
t pag
e 62
(dire
ct c
ompa
rison
s) a
nd p
age
67 (i
ndire
ct c
ompa
rison
s).
Issu
e 4
Des
crip
tion
of p
robl
em
Des
crip
tion
of p
ropo
sed
amen
dmen
t Ju
stifi
catio
n fo
r am
endm
ent
ERG
resp
onse
Page
13
The
ERG
repo
rt st
ates
:
“For
dis
cont
inua
tions
due
to a
dver
se
even
ts (3
tria
ls) t
he fi
xed
and
rand
om
effe
cts
mod
els
gave
iden
tical
resu
lts,
whi
ch s
how
ed n
o st
atis
tical
ly
sign
ifica
nt d
iffer
ence
s be
twee
n re
sliz
umab
and
pla
cebo
trea
ted
patie
nts
at e
ither
16±
1 w
eeks
(odd
s ra
tio 0
.83;
95%
CI 0
.17
to 4
.16)
or 5
2 w
eeks
(odd
s ra
tio 0
.70;
95%
CI 0
.33
to 1
.5). ”
The
stat
emen
t sho
uld
be a
men
ded
to
incl
ude
the
num
ber t
rials
(n=2
) use
d to
in
form
the
resu
lt fo
r 52
wee
ks.
The
curre
nt s
tate
men
t is
inac
cura
te. W
hile
thre
e tri
als
wer
e in
clud
ed in
the
anal
ysis
at 1
6±4
wee
ks, o
nly
two
trial
s re
porte
d da
ta
at 5
2 w
eeks
.
We
agre
e an
d w
e ha
ve a
dded
text
to
cla
rify
that
2 tr
ials
wer
e in
clud
ed
in th
e 52
wee
ks c
ompa
rison
of
disc
ontin
uatio
ns d
ue to
adv
erse
ev
ents
(pag
es 1
3 &
89).
Issu
e 5
Des
crip
tion
of p
robl
em
Des
crip
tion
of p
ropo
sed
amen
dmen
t Ju
stifi
catio
n fo
r am
endm
ent
ERG
resp
onse
Page
13
This
sta
tem
ent s
houl
d be
exp
ande
d to
in
clud
e th
e re
sults
from
the
anal
ysis
of
This
sta
tem
ent i
s in
corre
ct a
s da
ta
from
thre
e tri
als
wer
e av
aila
ble
for
We
agre
e an
d w
e ha
ve a
dded
the
mis
sing
text
for S
AEs
at 1
6±1
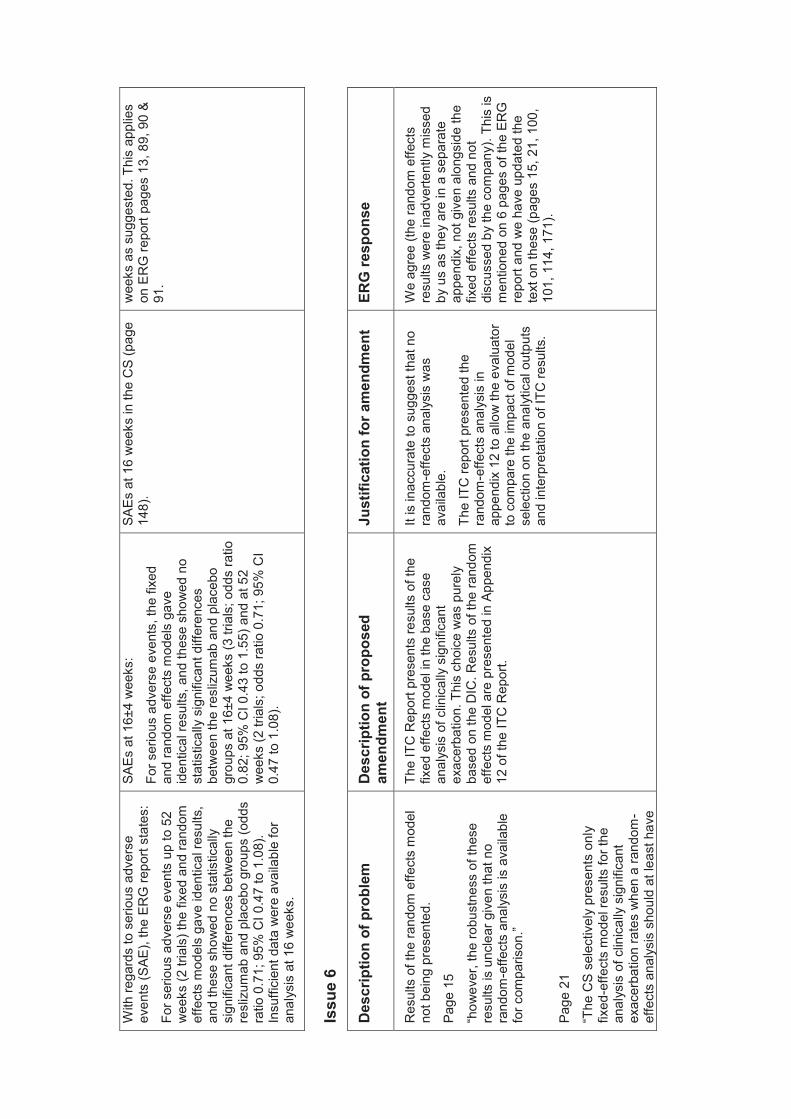
With
rega
rds
to s
erio
us a
dver
se
even
ts (S
AE),
the
ERG
repo
rt st
ates
:
For s
erio
us a
dver
se e
vent
s up
to 5
2 w
eeks
(2 tr
ials
) the
fixe
d an
d ra
ndom
ef
fect
s m
odel
s ga
ve id
entic
al re
sults
, an
d th
ese
show
ed n
o st
atis
tical
ly
sign
ifica
nt d
iffer
ence
s be
twee
n th
e re
sliz
umab
and
pla
cebo
gro
ups
(odd
s ra
tio 0
.71;
95%
CI 0
.47
to 1
.08)
. In
suffi
cien
t dat
a w
ere
avai
labl
e fo
r an
alys
is a
t 16
wee
ks.
SAEs
at 1
6±4
wee
ks:
For s
erio
us a
dver
s e e
vent
s, th
e fix
ed
and
rand
om e
ffect
s m
odel
s ga
ve
iden
tical
resu
lts, a
nd th
ese
show
ed n
o st
atis
tical
ly s
igni
fican
t diff
eren
ces
betw
een
the
resl
izum
ab a
nd p
lace
bo
grou
ps a
t 16±
4 w
eeks
(3 tr
ials
; odd
s ra
tio
0.82
; 95%
CI 0
.43
to 1
.55)
and
at 5
2 w
eeks
(2 tr
ials
; odd
s ra
tio 0
.71;
95%
CI
0.47
to 1
.08)
.
SAEs
at 1
6 w
eeks
in th
e C
S (p
age
148)
.
wee
ks a
s su
gges
ted.
Thi
s ap
plie
s on
ER
G re
port
page
s 13
, 89,
90
& 91
.
Issu
e 6
Des
crip
tion
of p
robl
em
Des
crip
tion
of p
ropo
sed
amen
dmen
t Ju
stifi
catio
n fo
r am
endm
ent
ERG
resp
onse
Res
ults
of t
he ra
ndom
effe
cts
mod
el
not b
eing
pre
sent
ed.
Page
15
“how
ever
, the
robu
stne
ss o
f the
se
resu
lts is
unc
lear
giv
en th
at n
o ra
ndom
-effe
cts
anal
ysis
is a
vaila
ble
for c
ompa
rison
. ”
Page
21
“The
CS
sele
ctiv
ely
pres
ents
onl
y fix
ed-e
ffect
s m
odel
resu
lts fo
r the
an
alys
is o
f clin
ical
ly s
igni
fican
t ex
acer
batio
n ra
tes
whe
n a
rand
om-
effe
cts
anal
ysis
sho
uld
at le
ast h
ave
The
ITC
Rep
ort p
rese
nts
resu
lts o
f the
fix
ed e
ffect
s m
odel
in th
e ba
se c
ase
anal
ysis
of c
linic
ally
sig
nific
ant
exac
erba
tion.
Thi
s ch
oice
was
pur
ely
base
d on
the
DIC
. Res
ults
of t
he ra
ndom
ef
fect
s m
odel
are
pre
sent
ed in
App
endi
x 12
of t
he IT
C R
epor
t.
It is
inac
cura
te to
sug
gest
that
no
rand
om-e
ffect
s an
alys
is w
as
avai
labl
e.
The
ITC
repo
rt pr
esen
ted
the
rand
om-e
ffect
s an
alys
is in
ap
pend
ix 1
2 to
allo
w th
e ev
alua
tor
to c
ompa
re th
e im
pact
of m
odel
se
lect
ion
on th
e an
alyt
ical
out
puts
an
d in
terp
reta
tion
of IT
C re
sults
.
We
agre
e (th
e ra
ndom
effe
cts
resu
lts w
ere
inad
verte
ntly
mis
sed
by u
s as
they
are
in a
sep
arat
e ap
pend
ix, n
ot g
iven
alo
ngsi
de th
e fix
ed e
ffect
s re
sults
and
not
di
scus
sed
by th
e co
mpa
ny).
This
is
men
tion e
d on
6 p
ages
of t
he E
RG
re
port
and
we
have
upd
ated
the
text
on
thes
e (p
ages
15,
21,
100
, 10
1, 1
14, 1
71).
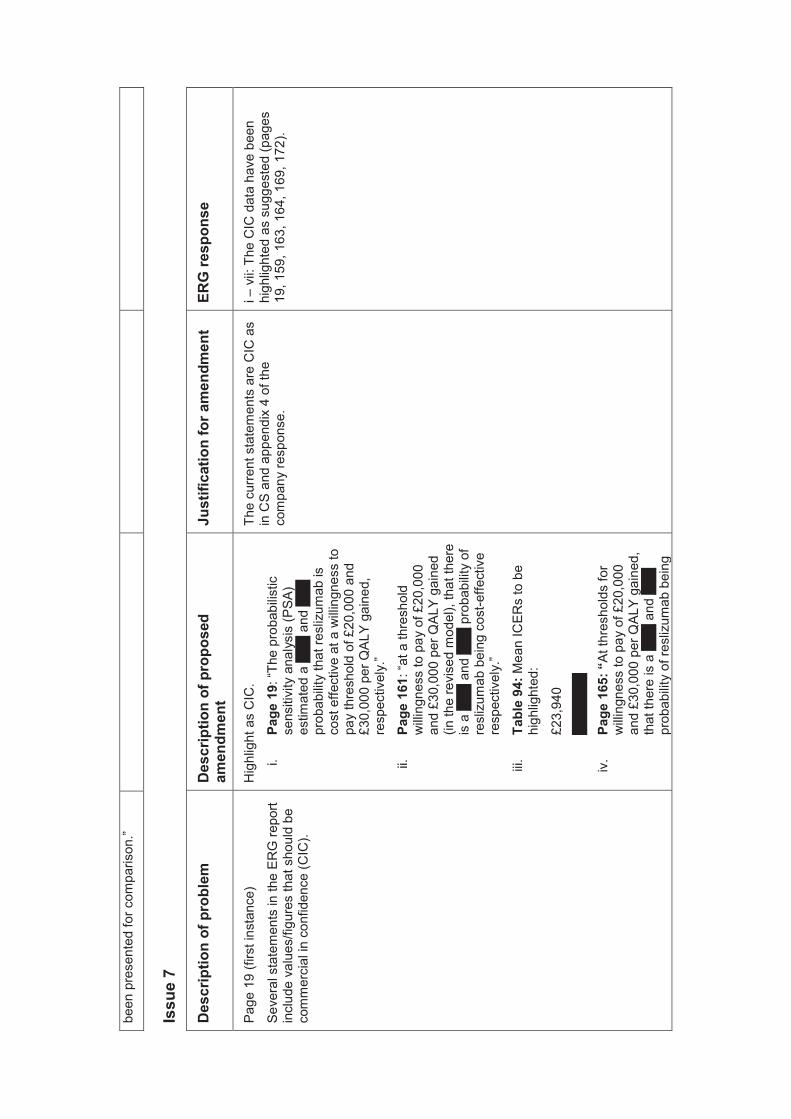
been
pre
sent
ed fo
r com
paris
on.”
Issu
e 7
Des
crip
tion
of p
robl
em
Des
crip
tion
of p
ropo
sed
amen
dmen
t Ju
stifi
catio
n fo
r am
endm
ent
ERG
resp
onse
Page
19
(firs
t ins
tanc
e)
Seve
ral s
tate
men
ts in
the
ERG
repo
rt in
clud
e va
lues
/figu
res
that
sho
uld
be
com
mer
cial
in c
onfid
ence
(CIC
).
Hig
hlig
ht a
s C
IC.
i. Pa
ge 1
9: “T
he p
roba
bilis
tic
sens
itivi
ty a
naly
sis
(PSA
) es
timat
ed a
XXX
and
XXX
pr
obab
ility
that
resl
izum
ab is
co
st e
ffect
ive
at a
willi
ngne
ss to
pa
y th
resh
old
of £
20,0
00 a
nd
£30,
000
per Q
ALY
gain
ed,
resp
ectiv
ely.
”
ii.
Page
161
: “at
a th
resh
old
willi
ngne
ss to
pay
of £
20,0
00
and
£30,
000
per Q
ALY
gain
ed
(in th
e re
vise
d m
odel
), th
at th
ere
is a
XXX
and
XXX
pro
babi
lity
of
resl
izum
ab b
eing
cos
t-effe
ctiv
e re
spec
tivel
y.”
iii.
Tabl
e 94
: Mea
n IC
ERs
to b
e hi
ghlig
hted
:
£23,
940
XXXX
XXX
iv.
Page
165
: “At
thre
shol
ds fo
r w
illing
ness
to p
ay o
f £20
,000
an
d £3
0,00
0 pe
r QAL
Y ga
ined
, th
at th
ere
is a
XXX
and
XXX
pr
obab
ility
of re
sliz
umab
bei
ng
The
curre
nt s
tate
men
ts a
re C
IC a
s in
CS
and
appe
ndix
4 o
f the
co
mpa
ny re
spon
se.
i – v
ii: T
he C
IC d
ata
have
bee
n hi
ghlig
hted
as
sugg
este
d (p
ages
19
, 159
, 163
, 164
, 169
, 172
).
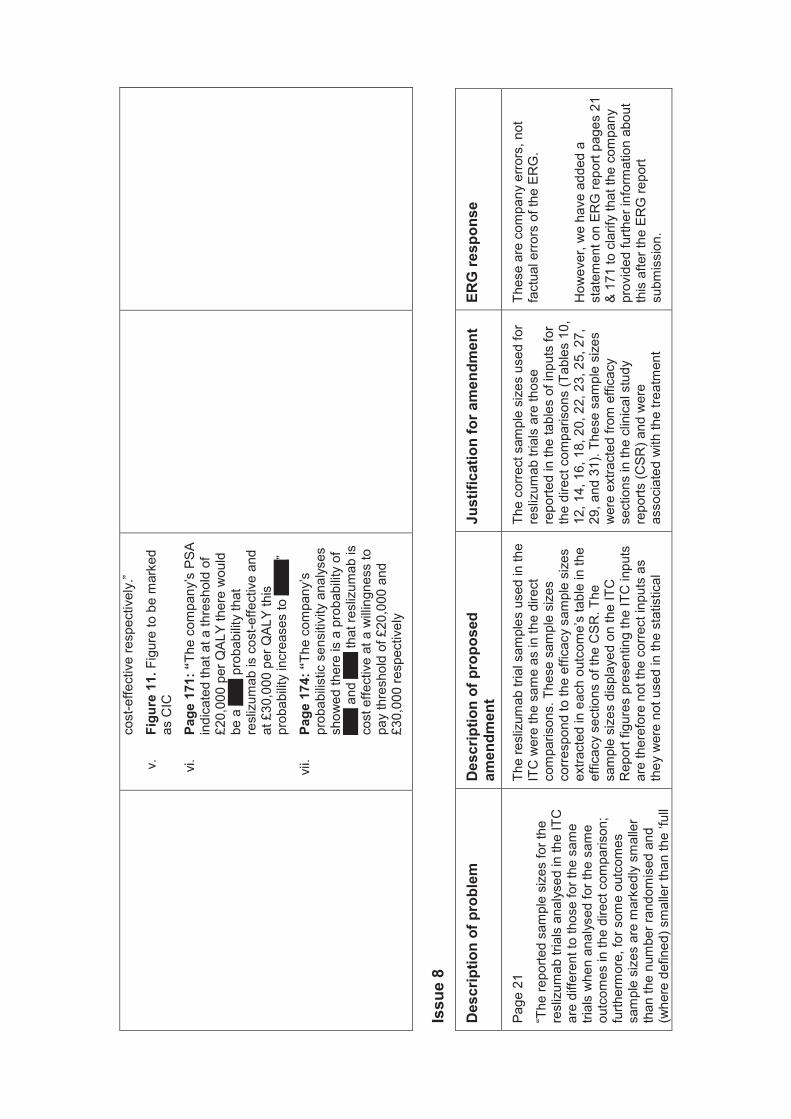
cost
-effe
ctiv
e re
spec
tivel
y.”
v.
Figu
re 1
1. F
igur
e to
be
mar
ked
as C
IC
vi.
Page
171
: “Th
e co
mpa
ny’s
PS
A in
dica
ted
that
at a
thre
shol
d of
£2
0,00
0 pe
r QAL
Y th
ere
wou
ld
be a
XXX
pro
babi
lity
that
re
sliz
umab
is c
ost-e
ffect
ive
and
at £
30,0
00 p
er Q
ALY
this
pr
obab
ility
incr
ease
s to
XXX
X”
vii.
Page
174
: “Th
e co
mpa
ny’s
pr
obab
ilistic
sen
sitiv
ity a
naly
ses
show
ed th
ere
is a
pro
babi
lity
of
XXX
and
XXX
that
resl
izum
ab is
co
st e
ffect
ive
at a
willi
ngne
ss to
pa
y th
resh
old
of £
20,0
00 a
nd
£30,
000
resp
ectiv
ely
Issu
e 8
Des
crip
tion
of p
robl
em
Des
crip
tion
of p
ropo
sed
amen
dmen
t Ju
stifi
catio
n fo
r am
endm
ent
ERG
resp
onse
Page
21
“The
repo
rted
sam
ple
size
s fo
r the
re
sliz
umab
tria
ls a
naly
sed
in th
e IT
C
are
diffe
rent
to th
ose
for t
he s
ame
trial
s w
hen
anal
ysed
for t
he s
ame
outc
omes
in th
e di
rect
com
paris
on;
furth
erm
ore,
for s
ome
outc
omes
sa
mpl
e si
zes
are
mar
kedl
y sm
alle
r th
an th
e nu
mbe
r ran
dom
ised
and
(w
here
def
ined
) sm
alle
r tha
n th
e ‘fu
ll
The
resl
izum
ab tr
ial s
ampl
es u
sed
in th
e IT
C w
ere
the
sam
e as
in th
e di
rect
co
mpa
rison
s. T
hese
sam
ple
size
s co
rresp
ond
to th
e ef
ficac
y sa
mpl
e si
zes
extra
cted
in e
ach
outc
ome’
s ta
ble
in th
e ef
ficac
y se
ctio
ns o
f the
CSR
. The
sa
mpl
e si
zes
disp
laye
d on
the
ITC
R
epor
t fig
ures
pre
sent
ing
the
ITC
inpu
ts
are
ther
efor
e no
t the
cor
rect
inpu
ts a
s th
ey w
ere
not u
sed
in th
e st
atis
tical
The
corre
ct s
ampl
e si
zes
used
for
resl
izum
ab tr
ial s
are
thos
e re
porte
d in
the
tabl
es o
f inp
uts
for
the
dire
ct c
ompa
rison
s (T
able
s 10
, 12
, 14,
16,
18,
20,
22,
23,
25,
27,
29
, and
31)
. The
se s
ampl
e si
zes
wer
e ex
tract
ed fr
om e
ffica
cy
sect
ions
in th
e cl
inic
al s
tudy
re
ports
(CSR
) and
wer
e as
soci
ated
with
the
t reat
men
t
Thes
e ar
e co
mpa
ny e
rrors
, not
fa
ctua
l erro
rs o
f the
ER
G.
How
ever
, we
have
add
ed a
st
atem
ent o
n ER
G re
port
page
s 21
&
171
to c
larif
y th
at th
e co
mpa
ny
prov
ided
furth
er in
form
atio
n ab
out
this
afte
r the
ER
G re
port
subm
issi
on.
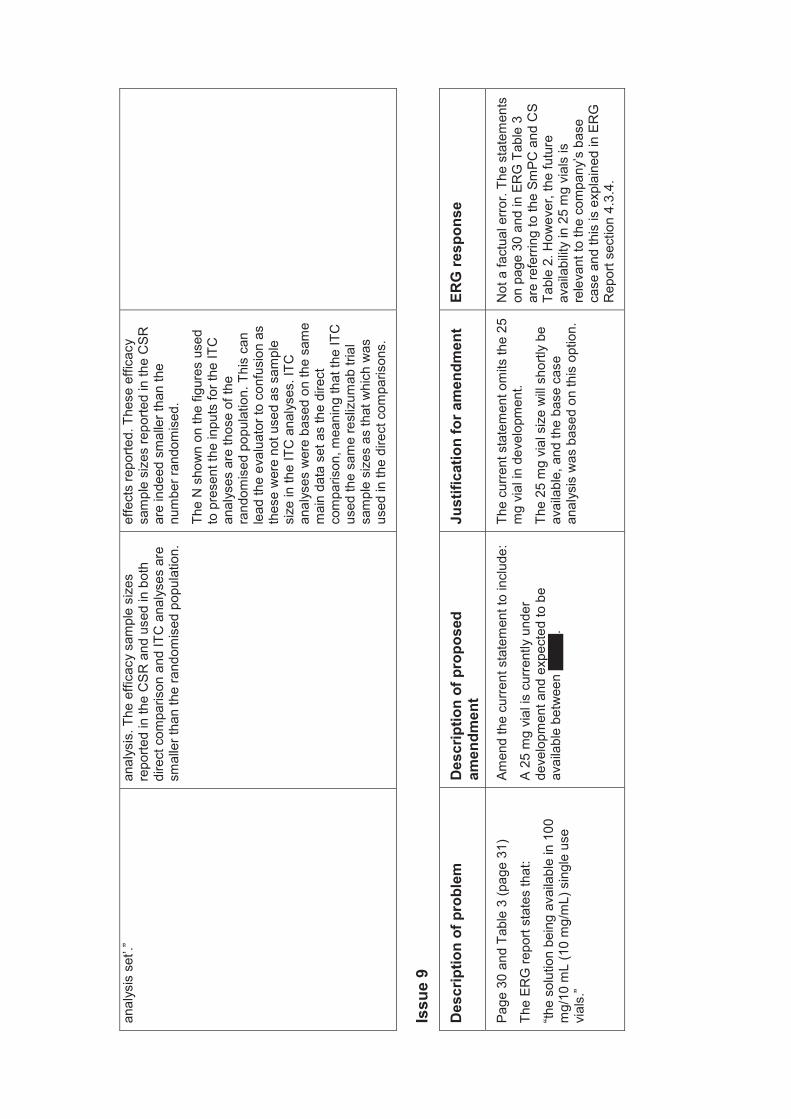
anal
ysis
set
’.”
anal
ysis
. The
effi
cacy
sam
ple
size
s re
porte
d in
the
CSR
and
use
d in
bot
h di
rect
com
paris
on a
nd IT
C a
naly
ses
are
smal
ler t
han
the
rand
omis
ed p
opul
atio
n.
effe
cts
repo
rted.
The
se e
ffica
cy
sam
ple
size
s re
porte
d in
the
CSR
ar
e in
deed
sm
alle
r tha
n th
e nu
mbe
r ran
dom
ised
.
The
N s
how
n on
the
figur
es u
sed
to p
rese
nt th
e in
puts
for t
he IT
C
anal
yses
are
thos
e of
the
rand
omis
ed p
opul
atio
n. T
his
can
lead
the
eval
uato
r to
conf
usio
n as
th
ese
wer
e no
t use
d as
sam
ple
size
in th
e IT
C a
naly
ses.
ITC
an
alys
es w
ere
base
d on
the
sam
e m
ain
data
set
as
the
dire
ct
com
paris
on, m
eani
ng th
at th
e IT
C
used
the
sam
e re
sliz
umab
tria
l sa
mpl
e si
zes
as th
at w
hich
was
us
ed in
the
dire
ct c
ompa
rison
s.
Issu
e 9
Des
crip
tion
of p
robl
em
Des
crip
tion
of p
ropo
sed
amen
dmen
t Ju
stifi
catio
n fo
r am
endm
ent
ERG
resp
onse
Page
30
and
Tabl
e 3
(pag
e 31
)
The
ERG
repo
rt st
ates
that
:
“the
solu
tion
bein
g av
aila
ble
in 1
00
mg/
10 m
L (1
0 m
g/m
L) s
ingl
e us
e vi
als.
”
Amen
d th
e cu
rrent
sta
tem
ent t
o in
clud
e:
A 25
mg
vial
is c
urre
ntly
und
er
deve
lopm
ent a
nd e
xpec
ted
to b
e av
aila
ble
betw
een
XX
XX
.
The
curre
nt s
tate
men
t om
its th
e 25
m
g vi
al in
dev
elop
men
t.
The
25 m
g vi
al s
ize
will
shor
tly b
e av
aila
ble,
and
the
base
cas
e an
alys
is w
as b
ased
on
this
opt
ion.
Not
a fa
ctua
l erro
r. Th
e st
atem
ents
on
pag
e 30
and
in E
RG
Tab
le 3
ar
e re
ferri
ng to
the
SmPC
and
CS
Tabl
e 2 .
How
ever
, the
futu
re
avai
labi
lity
in 2
5 m
g vi
als
is
rele
vant
to th
e co
mpa
ny’s
bas
e ca
se a
nd th
is is
exp
lain
ed in
ER
G
Rep
ort s
ectio
n 4.
3.4.
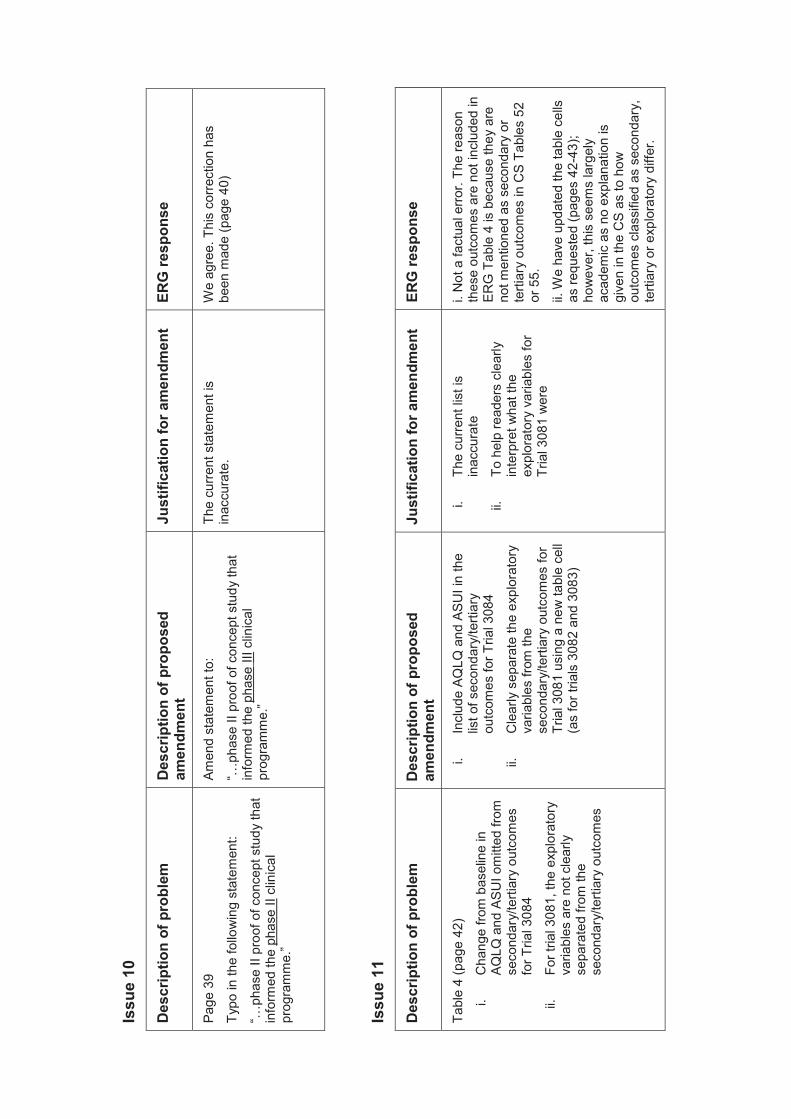
Issu
e 10
Des
crip
tion
of p
robl
em
Des
crip
tion
of p
ropo
sed
amen
dmen
t Ju
stifi
catio
n fo
r am
endm
ent
ERG
resp
onse
Page
39
Typo
in th
e fo
llow
ing
stat
emen
t:
“…ph
ase
II pr
oof o
f con
cept
stu
dy th
at
info
rmed
the
phas
e II
clin
ical
pr
ogra
mm
e.”
Amen
d st
atem
ent t
o:
“…ph
ase
II pr
oof o
f con
cept
stu
dy th
at
info
rmed
the
phas
e III
clin
ical
pr
ogra
mm
e.”
The
curre
nt s
tate
men
t is
inac
cura
te.
We
agre
e. T
his
corre
ctio
n ha
s be
en m
ade
(pag
e 40
)
Issu
e 11
Des
crip
tion
of p
robl
em
Des
crip
tion
of p
ropo
sed
amen
dmen
t Ju
stifi
catio
n fo
r am
endm
ent
ERG
resp
onse
Tabl
e 4
(pag
e 42
)
i. C
hang
e fro
m b
asel
ine
in
AQLQ
and
ASU
I om
itted
from
se
cond
ary/
terti
ary
outc
omes
fo
r Tria
l 308
4
ii.
For t
rial 3
081,
the
expl
orat
ory
varia
bles
are
not
cle
arly
se
para
ted
from
the
seco
ndar
y/te
rtiar
y ou
tcom
es
i. In
clud
e AQ
LQ a
nd A
SUI i
n th
e lis
t of s
econ
dary
/terti
ary
outc
omes
for T
rial 3
084
ii.
Cle
arly
sep
arat
e th
e ex
plor
ator
y va
riabl
es fr
om th
e se
cond
ary/
terti
ary
outc
omes
for
Tria
l 308
1 us
ing
a ne
w ta
ble
cell
(as
for t
rials
308
2 an
d 30
83)
i. Th
e cu
rrent
list
is
inac
cura
te
ii.
To h
elp
read
ers
clea
rly
inte
rpre
t wha
t the
ex
plor
ator
y va
riabl
es fo
r Tr
ial 3
081
wer
e
i. N
ot a
fact
ual e
rror.
The
reas
on
thes
e ou
tcom
es a
re n
ot in
clud
ed in
ER
G T
able
4 is
bec
ause
they
are
no
t men
tione
d as
sec
onda
ry o
r te
rtiar
y ou
tcom
es in
CS
Tabl
es 5
2 or
55.
ii. W
e ha
ve u
pdat
ed th
e ta
ble
cells
as
requ
este
d (p
ages
42-
43);
how
ever
, thi
s se
ems
larg
ely
acad
emic
as
no e
xpla
natio
n is
gi
ven
in th
e C
S as
to h
ow
outc
omes
cla
ssifi
ed a
s se
cond
ary,
te
rtiar
y or
exp
lora
tory
diff
er.
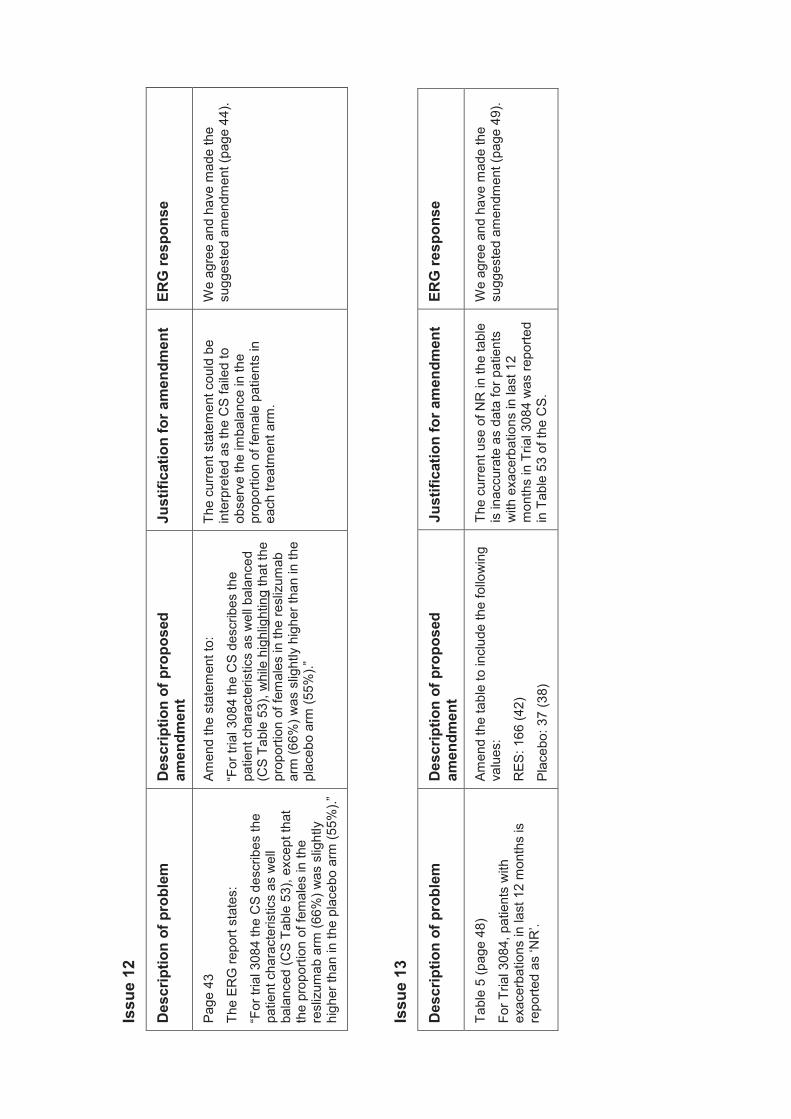
Issu
e 12
Des
crip
tion
of p
robl
em
Des
crip
tion
of p
ropo
sed
amen
dmen
t Ju
stifi
catio
n fo
r am
endm
ent
ERG
resp
onse
Page
43
The
ERG
repo
rt st
ates
:
“For
tria
l 308
4 th
e C
S de
scrib
es th
e pa
tient
cha
ract
eris
tics
as w
ell
bala
nced
(CS
Tabl
e 53
), ex
cept
that
th
e pr
opor
ti on
of fe
mal
es in
the
resl
izum
ab a
rm (6
6%) w
as s
light
ly
high
er th
an in
the
plac
ebo
arm
(55%
).”
Amen
d th
e st
atem
ent t
o:
“For
tria
l 308
4 th
e C
S de
scrib
es th
e pa
tient
cha
ract
eris
tics
as w
ell b
alan
ced
(CS
Tabl
e 53
) , w
hile
hig
hlig
htin
g th
at th
e pr
opor
tion
of fe
mal
es in
the
resl
izum
ab
arm
(66%
) was
slig
htly
hig
her t
han
in th
e pl
aceb
o ar
m (5
5%).”
The
curre
nt s
tate
men
t cou
ld b
e in
terp
rete
d as
the
CS
faile
d to
ob
serv
e th
e im
bala
nce
in th
e pr
opor
tion
of fe
mal
e pa
tient
s in
ea
ch tr
eatm
ent a
rm.
We
agre
e an
d ha
ve m
ade
the
sugg
este
d am
endm
ent (
page
44)
.
Issu
e 13
Des
crip
tion
of p
robl
em
Des
crip
tion
of p
ropo
sed
amen
dmen
t Ju
stifi
catio
n fo
r am
endm
ent
ERG
resp
onse
Tabl
e 5
(pag
e 48
)
For T
rial 3
084,
pat
ient
s w
ith
exac
erba
tions
in la
st 1
2 m
onth
s is
re
porte
d as
‘NR
’.
Amen
d th
e ta
ble
to in
clud
e th
e fo
llow
ing
valu
es:
RES
: 166
(42)
Plac
ebo:
37
(38)
The
curre
nt u
se o
f NR
in th
e ta
ble
is in
accu
rate
as
data
for p
atie
nts
with
exa
cerb
atio
ns in
last
12
mon
ths
in T
rial 3
084
was
repo
rted
in T
able
53
of th
e C
S.
We
agre
e an
d ha
ve m
ade
the
sugg
este
d am
endm
ent (
page
49)
.
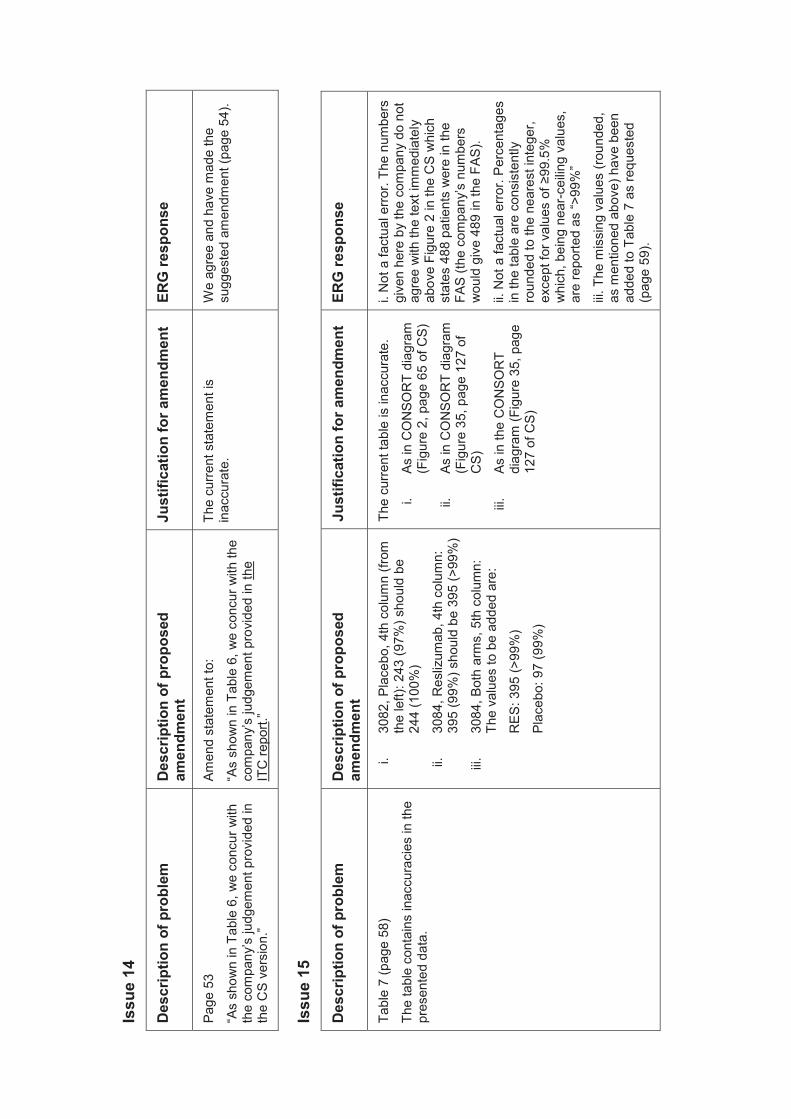
Issu
e 14
Des
crip
tion
of p
robl
em
Des
crip
tion
of p
ropo
sed
amen
dmen
t Ju
stifi
catio
n fo
r am
endm
ent
ERG
resp
onse
Page
53
“As
show
n in
Tab
le 6
, we
conc
ur w
ith
the
com
pany
’s ju
dgem
ent p
rovi
ded
in
the
CS
vers
ion.
”
Amen
d st
atem
ent t
o:
“As
show
n in
Tab
le 6
, we
conc
ur w
ith th
e co
mpa
ny’s
judg
emen
t pro
vide
d in
the
ITC
repo
rt.”
The
curre
nt s
tate
men
t is
inac
cura
te.
We
agre
e an
d ha
ve m
ade
the
sugg
este
d am
endm
ent (
page
54)
.
Issu
e 15
Des
crip
tion
of p
robl
em
Des
crip
tion
of p
ropo
sed
amen
dmen
t Ju
stifi
catio
n fo
r am
endm
ent
ERG
resp
onse
Tabl
e 7
(pag
e 58
)
The
tabl
e co
ntai
ns in
accu
raci
es in
the
pres
ente
d da
ta.
i. 30
82, P
lace
bo, 4
th c
olum
n (fr
om
the
left)
: 243
(97%
) sho
uld
be
244
(100
%)
ii.
3084
, Res
lizum
ab, 4
th c
olum
n:
395
(99%
) sho
uld
be 3
95 (>
99%
)
iii.
3084
, Bot
h ar
ms,
5th
col
umn:
Th
e va
lues
to b
e ad
ded
are:
RES
: 395
(>99
%)
Plac
ebo:
97
(99%
)
The
curre
nt ta
ble
is in
accu
rate
.
i. As
in C
ON
SOR
T di
agra
m
(Fig
ure
2, p
age
65 o
f CS)
ii.
As in
CO
NSO
RT
diag
ram
(F
igur
e 35
, pag
e 12
7 of
C
S)
iii.
As in
the
CO
NSO
RT
diag
ram
(Fig
ure
35, p
age
127
of C
S)
i. N
ot a
fact
ual e
rror.
The
num
bers
gi
ven
here
by
the
com
pany
do
not
agre
e w
ith th
e te
xt im
med
iate
ly
abov
e Fi
gure
2 in
the
CS
whi
ch
stat
es 4
88 p
atie
nts
wer
e in
the
FAS
(the
com
pany
’s n
umbe
rs
wou
ld g
ive
489
in th
e FA
S).
ii. N
ot a
fact
ual e
rror.
Perc
enta
ges
in th
e ta
ble
are
cons
iste
ntly
ro
unde
d to
the
near
est i
nteg
er,
exce
pt fo
r val
ues
of ≥
99.5
%
whi
ch, b
eing
nea
r-cei
ling
valu
es,
are
repo
rted
as “>
99%
”
iii. T
he m
issi
ng v
alue
s (ro
unde
d,
as m
entio
ned
abov
e) h
ave
been
ad
ded
to T
able
7 a
s re
ques
ted
(pag
e 5 9
).
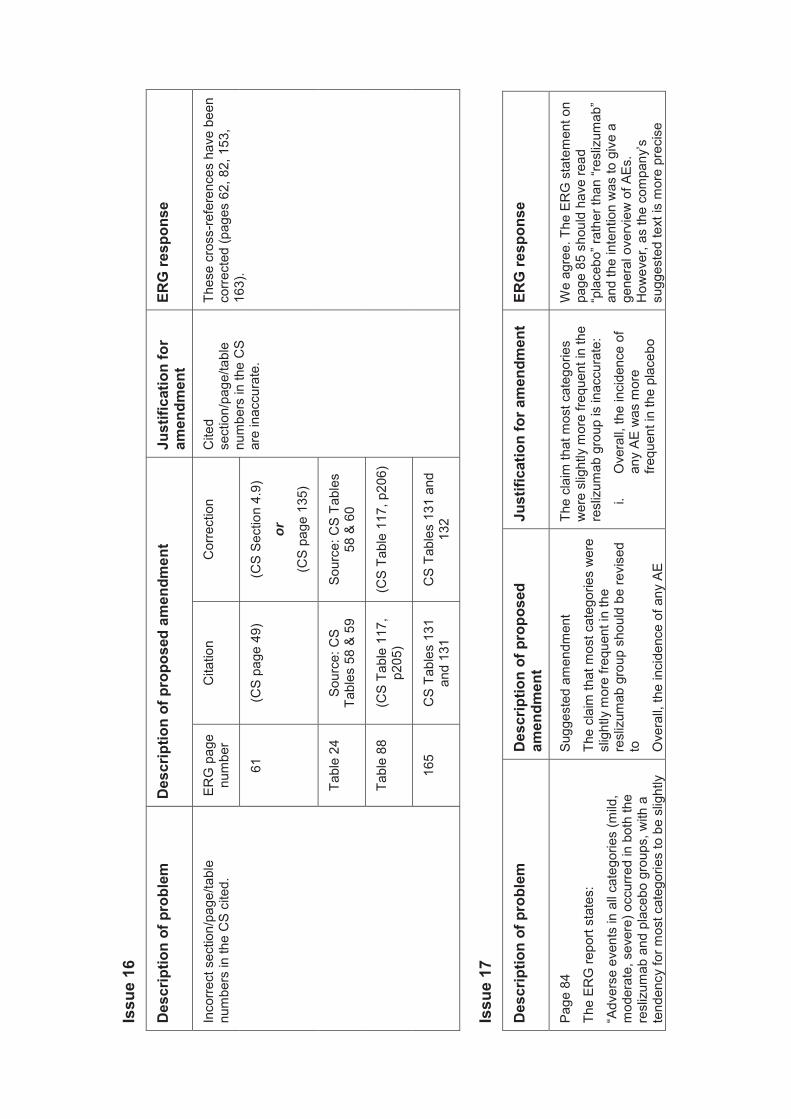
Issu
e 16
Des
crip
tion
of p
robl
em
Des
crip
tion
of p
ropo
sed
amen
dmen
t Ju
stifi
catio
n fo
r am
endm
ent
ERG
resp
onse
Inco
rrect
sec
tion/
page
/tabl
e nu
mbe
rs in
the
CS
cite
d.
ERG
pag
e nu
mbe
r C
itatio
n C
orre
ctio
n C
ited
sect
ion /
page
/tabl
e nu
mbe
rs in
the
CS
are
inac
cura
te.
Thes
e cr
oss-
refe
renc
es h
ave
been
co
rrect
ed (p
ages
62,
82,
153
, 16
3).
61
(CS
page
49)
(C
S Se
ctio
n 4.
9)
or
(CS
page
135
)
Tabl
e 24
So
urce
: CS
Tabl
es 5
8 &
59
Sour
ce: C
S Ta
bles
58
& 6
0
Tabl
e 88
(C
S Ta
ble
117,
p2
05)
(CS
Tabl
e 11
7, p
206)
165
CS
Tabl
es 1
31
and
131
CS
Tabl
es 1
31 a
nd
132
Issu
e 17
Des
crip
tion
of p
robl
em
Des
crip
tion
of p
ropo
sed
amen
dmen
t Ju
stifi
catio
n fo
r am
endm
ent
ERG
resp
onse
Page
84
The
ERG
repo
rt st
ates
:
“Adv
erse
eve
nts
in a
ll ca
tego
ries
(mild
, m
oder
ate,
sev
ere)
occ
urre
d in
bot
h th
e re
sliz
umab
and
pla
cebo
gro
ups,
with
a
tend
ency
for m
ost c
ateg
orie
s to
be
slig
htly
Sugg
este
d am
endm
ent
The
clai
m th
at m
ost c
ateg
orie
s w
ere
slig
htly
mor
e fre
quen
t in
the
resl
izum
ab g
roup
sho
uld
be re
vise
d to
Ove
rall,
the
inci
denc
e of
any
AE
The
clai
m th
at m
ost c
ateg
orie
s w
ere
slig
htly
mor
e fre
quen
t in
the
resl
izum
ab g
roup
is in
accu
rate
:
i. O
vera
ll, th
e in
cide
nce
of
any
AE w
as m
ore
frequ
ent i
n th
e pl
aceb
o
We
agre
e. T
he E
RG
sta
tem
ent o
n pa
ge 8
5 sh
ould
hav
e re
ad
“pla
cebo
” rat
her t
han
“res
lizum
ab”
and
the
inte
ntio
n w
as to
giv
e a
gene
ral o
verv
iew
of A
Es.
How
ever
, as
the
com
pany
’s
sugg
este
d te
xt is
mor
e pr
ecis
e
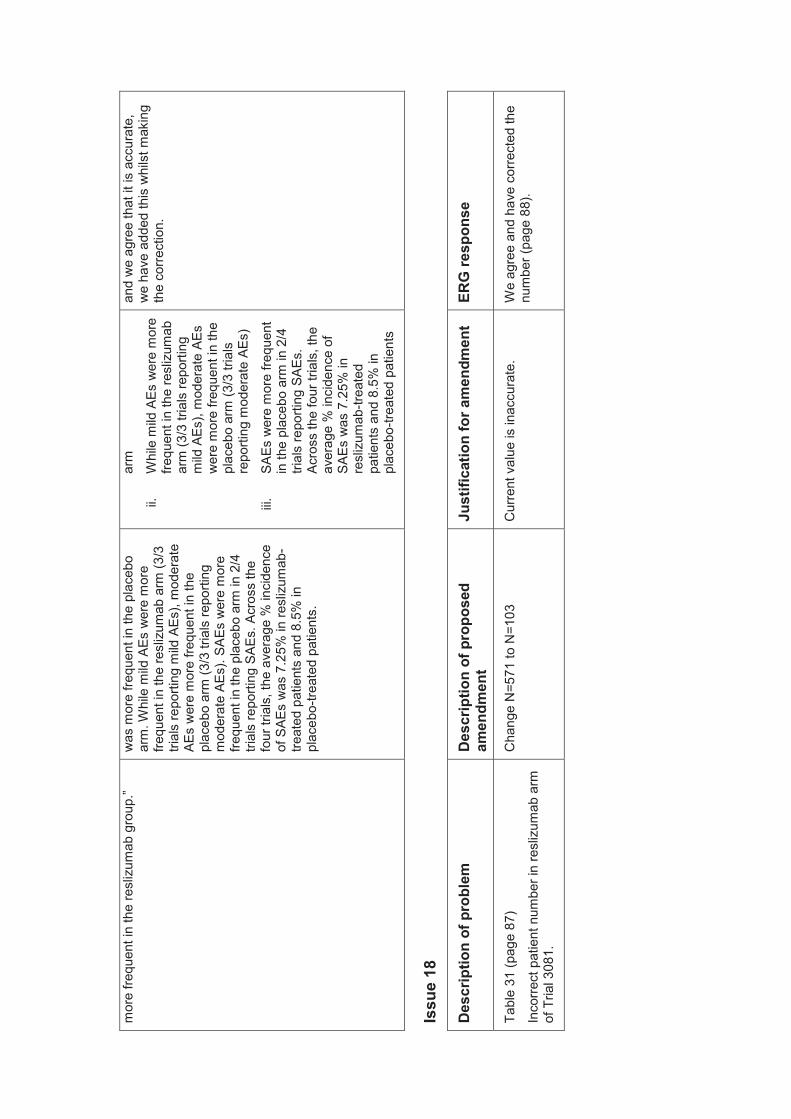
mor
e fre
quen
t in
the
resl
izum
ab g
roup
.”
was
mor
e fre
quen
t in
the
plac
ebo
arm
. Whi
le m
ild A
Es w
ere
mor
e fre
quen
t in
the
resl
izum
ab a
rm (3
/3
trial
s re
porti
ng m
ild A
Es),
mod
erat
e AE
s w
ere
mor
e fre
quen
t in
the
plac
ebo
arm
(3/3
tria
ls re
porti
ng
mod
erat
e AE
s). S
AEs
wer
e m
ore
frequ
ent i
n th
e pl
aceb
o ar
m in
2/4
tri
als
repo
rting
SAE
s. A
cros
s th
e fo
ur tr
ials
, the
ave
rage
% in
cide
nce
of S
AEs
was
7.2
5% in
resl
izum
ab-
treat
ed p
atie
nts
and
8.5%
in
plac
ebo -
treat
ed p
atie
nts.
arm
ii.
Whi
le m
ild A
Es w
ere
mor
e fre
quen
t in
the
resl
izum
ab
arm
(3/3
tria
ls re
porti
ng
mild
AEs
), m
oder
ate
AEs
wer
e m
ore
frequ
ent i
n th
e pl
aceb
o ar
m (3
/3 tr
ials
re
porti
ng m
oder
ate
AEs)
iii.
SAEs
wer
e m
ore
frequ
ent
in th
e pl
aceb
o ar
m in
2/4
tri
als
repo
rting
SAE
s.
Acro
ss th
e fo
ur tr
ials
, the
av
erag
e %
inci
denc
e of
SA
Es w
as 7
.25%
in
resl
izum
ab-tr
eate
d pa
tient
s an
d 8.
5% in
pl
aceb
o-tre
ated
pat
ient
s
and
we
agre
e th
at it
is a
ccur
ate,
w
e ha
ve a
dded
this
whi
lst m
akin
g th
e co
rrect
ion.
Issu
e 18
Des
crip
tion
of p
robl
em
Des
crip
tion
of p
ropo
sed
amen
dmen
t Ju
stifi
catio
n fo
r am
endm
ent
ERG
resp
onse
Tabl
e 31
(pag
e 87
)
Inco
rrect
pat
ient
num
ber i
n re
sliz
umab
arm
of
Tria
l 308
1.
Cha
nge
N=5
71 to
N=1
03
Cur
rent
val
ue is
inac
cura
te.
We
agre
e an
d ha
ve c
orre
cted
the
num
ber (
page
88)
.
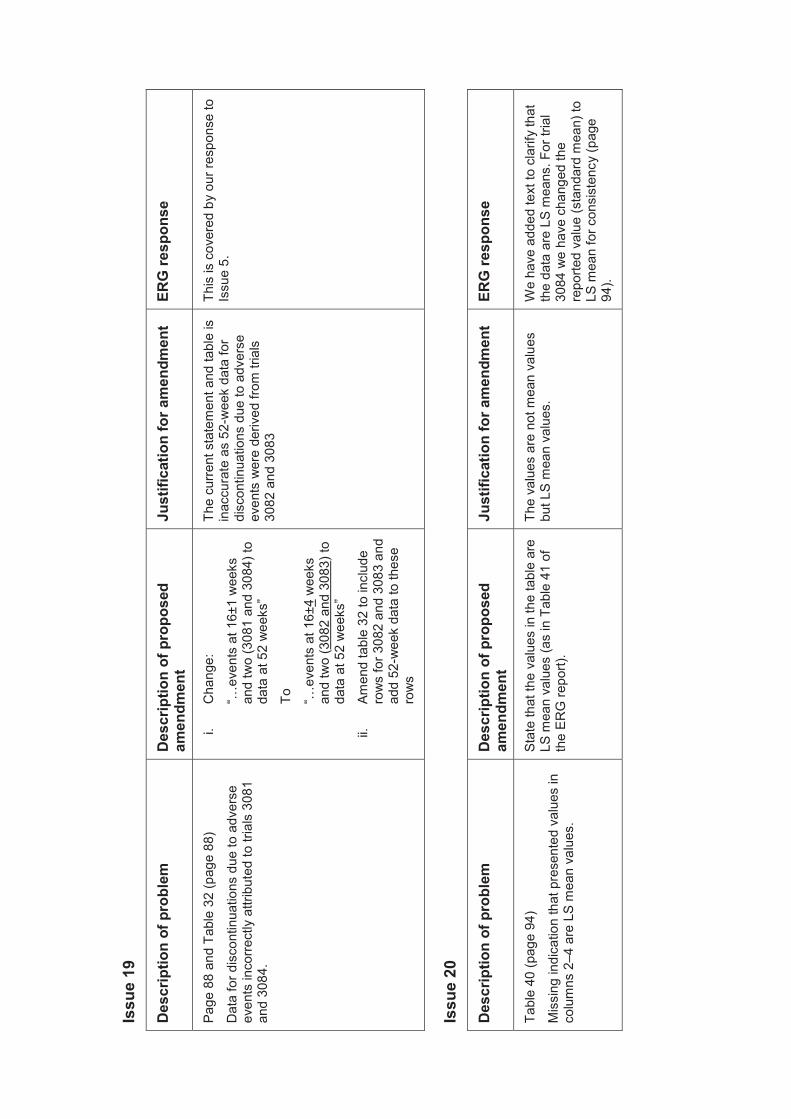
Issu
e 19
Des
crip
tion
of p
robl
em
Des
crip
tion
of p
ropo
sed
amen
dmen
t Ju
stifi
catio
n fo
r am
endm
ent
ERG
resp
onse
Page
88
and
Tabl
e 32
(pag
e 88
)
Dat
a fo
r dis
cont
inua
tions
due
to a
dver
se
even
ts in
corre
ctly
attr
ibut
ed to
tria
ls 3
081
and
3084
.
i. C
hang
e:
“…ev
ents
at 1
6±1
wee
ks
and
two
(308
1 an
d 30
84) t
o da
ta a
t 52
wee
ks”
To
“…ev
ents
at 1
6±4
wee
ks
and
two
(308
2 an
d 30
83) t
o da
ta a
t 52
wee
ks”
ii.
Amen
d ta
ble
32 to
incl
ude
row
s fo
r 308
2 an
d 30
83 a
nd
add
52-w
eek
data
to th
ese
row
s
The
curre
nt s
tate
men
t and
tabl
e is
in
accu
rate
as
52-w
eek
data
for
disc
ontin
uatio
ns d
ue to
adv
erse
ev
ents
wer
e de
rived
from
tria
ls
3082
and
308
3
This
is c
over
ed b
y ou
r res
pons
e to
Is
sue
5.
Issu
e 20
Des
crip
tion
of p
robl
em
Des
crip
tion
of p
ropo
sed
amen
dmen
t Ju
stifi
catio
n fo
r am
endm
ent
ERG
resp
onse
Tabl
e 40
(pag
e 94
)
Mis
sing
indi
catio
n th
at p
rese
nted
val
ues
in
colu
mns
2–4
are
LS
mea
n va
lues
.
Stat
e th
at th
e va
lues
in th
e ta
ble
are
LS m
ean
valu
es (a
s in
Tab
le 4
1 of
th
e ER
G re
port)
.
The
valu
es a
re n
ot m
ean
valu
es
but L
S m
ean
valu
es.
We
have
add
ed te
xt to
cla
rify
that
th
e da
ta a
re L
S m
eans
. For
tria
l 30
84 w
e ha
ve c
hang
ed th
e re
porte
d va
lue
(sta
ndar
d m
ean)
to
LS m
ean
for c
onsi
sten
cy (p
age
94).
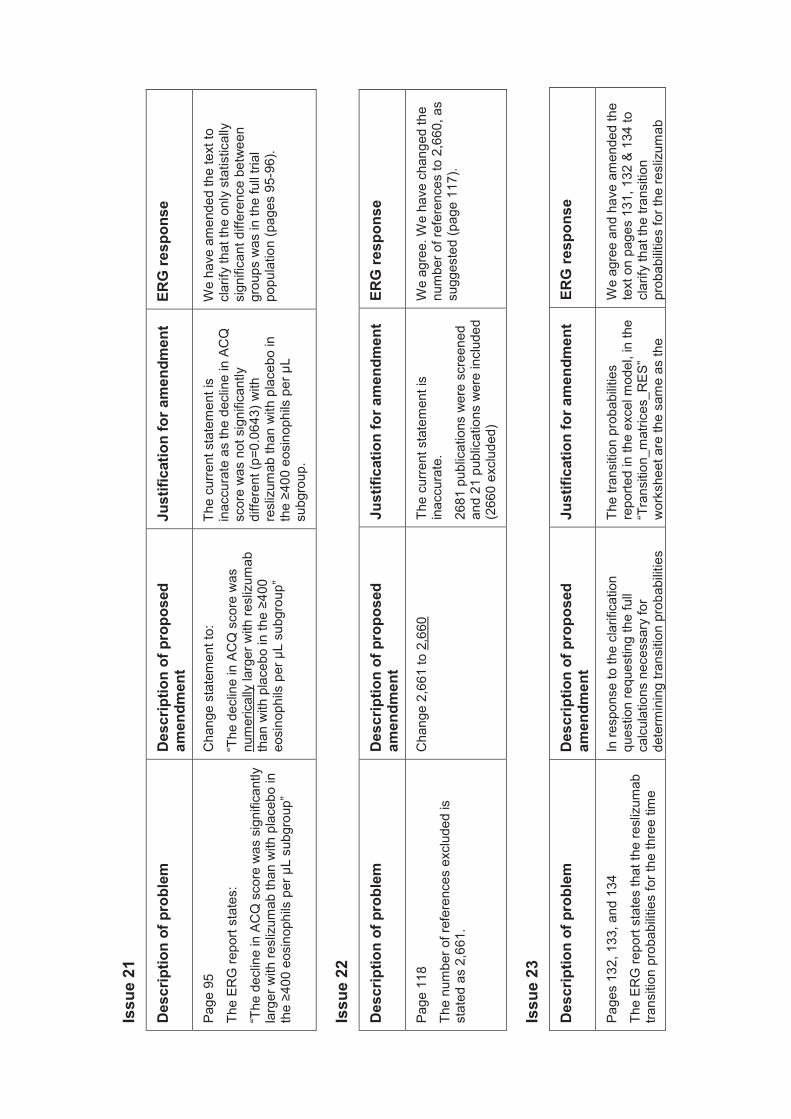
Issu
e 21
Des
crip
tion
of p
robl
em
Des
crip
tion
of p
ropo
sed
amen
dmen
t Ju
stifi
catio
n fo
r am
endm
ent
ERG
resp
onse
Page
95
The
ERG
repo
rt st
ates
:
“The
dec
line
in A
CQ
sco
re w
as s
igni
fican
tly
larg
er w
ith re
sliz
umab
than
with
pla
cebo
in
the ≥4
00 e
osin
ophi
ls p
er μ
L su
bgro
up”
Cha
nge
stat
emen
t to:
“The
dec
line
in A
CQ
sco
re w
as
num
eric
ally
larg
er w
ith re
sliz
umab
th
an w
ith p
lace
bo in
the ≥4
00
eosi
noph
ils p
er μ
L su
bgro
up”
The
curre
nt s
tate
men
t is
inac
cura
te a
s th
e de
clin
e in
AC
Q
scor
e w
as n
ot s
igni
fican
tly
diffe
rent
(p=0
.064
3) w
ith
resl
izum
ab th
an w
ith p
lace
bo in
th
e ≥ 4
00 e
osin
ophi
ls p
er μ
L su
bgro
up.
We
have
am
ende
d th
e te
xt to
cl
arify
that
the
only
sta
tistic
ally
si
gnifi
cant
diff
eren
ce b
etw
een
grou
ps w
as in
the
full
trial
po
pula
tion
( pag
es 9
5-96
).
Issu
e 22
Des
crip
tion
of p
robl
em
Des
crip
tion
of p
ropo
sed
amen
dmen
t Ju
stifi
catio
n fo
r am
endm
ent
ERG
resp
onse
Page
118
The
num
ber o
f ref
eren
ces
excl
uded
is
stat
ed a
s 2,
661.
Cha
nge
2,66
1 to
2,6
60
The
curre
nt s
tate
men
t is
inac
cura
te.
2681
pub
licat
ions
wer
e sc
reen
ed
and
21 p
ublic
atio
ns w
ere
incl
uded
(2
660
excl
uded
)
We
agre
e. W
e ha
ve c
hang
ed th
e nu
mbe
r of r
efer
ence
s to
2,6
60, a
s su
gges
ted
(pag
e 11
7).
Issu
e 23
Des
crip
tion
of p
robl
em
Des
crip
tion
of p
ropo
sed
amen
dmen
t Ju
stifi
catio
n fo
r am
endm
ent
ERG
resp
onse
Page
s 13
2, 1
33, a
nd 1
34
The
ERG
repo
rt st
ates
that
the
resl
izum
ab
trans
ition
pro
babi
litie
s fo
r the
thre
e tim
e
In re
spon
se to
the
clar
ifica
tion
ques
tion
requ
estin
g th
e fu
ll ca
lcul
atio
ns n
eces
sary
for
dete
rmin
ing
trans
ition
pro
babi
litie
s
The
trans
ition
pro
babi
litie
s re
porte
d in
the
exce
l mod
el, i
n th
e “T
rans
ition
_mat
rices
_RE
S”
wor
kshe
et a
re th
e sa
me
as th
e
We
agre
e an
d ha
ve a
men
ded
the
text
on
page
s 13
1, 1
32 &
134
to
clar
ify th
at th
e tra
nsiti
on
prob
abilit
ies
for t
he re
sliz
umab
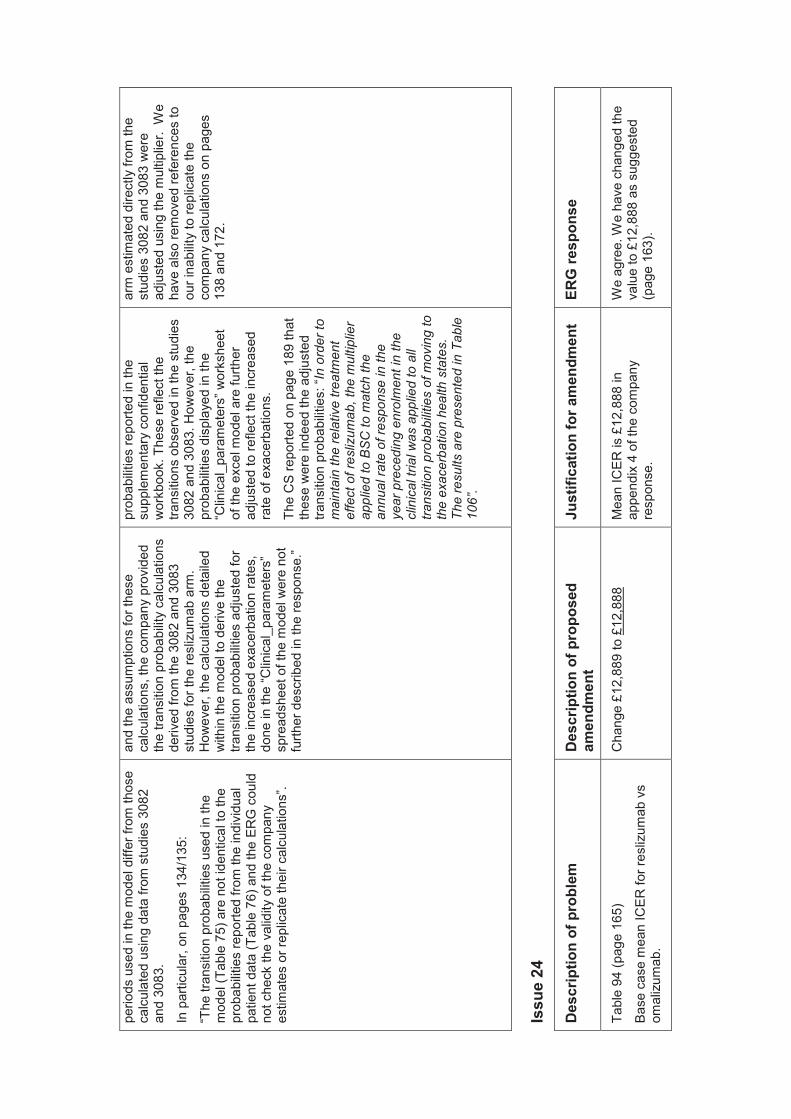
perio
ds u
sed
in th
e m
odel
diff
er fr
om th
ose
calc
ulat
ed u
sing
dat
a fro
m s
tudi
es 3
082
and
3083
.
In p
artic
ular
, on
page
s 13
4/13
5:
“The
tran
sitio
n pr
obab
ilitie
s us
ed in
the
mod
el (T
able
75)
are
not
iden
tical
to th
e pr
obab
ilitie
s re
porte
d fro
m th
e in
divi
dual
pa
tient
dat
a (T
able
76)
and
the
ERG
cou
ld
not c
heck
the
valid
ity o
f the
com
pany
es
timat
es o
r rep
licat
e th
eir c
alcu
latio
ns”.
and
the
assu
mpt
ions
for t
hese
ca
lcul
atio
ns, t
he c
ompa
ny p
rovi
ded
the
trans
ition
pro
babi
lity
calc
ulat
ions
de
rived
from
the
3082
and
308
3 st
udie
s fo
r the
resl
izum
ab a
rm.
How
ever
, the
cal
cula
tions
det
aile
d w
ithin
the
mod
el to
der
ive
the
trans
ition
pro
babi
litie
s ad
just
ed fo
r th
e in
crea
sed
exac
erba
tion
rate
s,
done
in th
e “C
linic
al_p
aram
eter
s”
spre
adsh
eet o
f the
mod
el w
ere
not
furth
er d
escr
ibed
in th
e re
spon
se.”
prob
abilit
ies
repo
rted
in th
e su
pple
men
tary
con
fiden
tial
wor
kboo
k. T
hese
refle
ct th
e tra
nsiti
ons
obse
rved
in th
e st
udie
s 30
82 a
nd 3
083.
How
ever
, the
pr
obab
ilitie
s di
spla
yed
in th
e “C
linic
al_p
aram
eter
s” w
orks
heet
of
the
exce
l mod
el a
re fu
rther
ad
just
ed to
refle
ct th
e in
crea
sed
rate
of e
xace
rbat
ions
.
The
CS
repo
rted
on p
age
189
that
th
ese
wer
e in
deed
the
adju
sted
tra
nsiti
on p
roba
bilit
ies :
“In
orde
r to
mai
ntai
n th
e re
lativ
e tre
atm
ent
effe
ct o
f res
lizum
ab, t
he m
ultip
lier
appl
ied
to B
SC
to m
atch
the
annu
al ra
te o
f res
pons
e in
the
yea r
pre
cedi
ng e
nrol
men
t in
the
clin
ical
tria
l was
app
lied
to a
ll tra
nsiti
on p
roba
bilit
ies
of m
ovin
g to
th
e ex
acer
batio
n he
alth
sta
tes.
Th
e re
sults
are
pre
sent
ed in
Tab
le
106”.
arm
est
imat
ed d
irect
ly fr
om th
e st
udie
s 30
82 a
nd 3
083
wer
e ad
just
ed u
sing
the
mul
tiplie
r. W
e ha
ve a
lso
rem
oved
refe
renc
es to
ou
r ina
bilit
y to
repl
icat
e th
e co
mpa
ny c
alcu
latio
ns o
n pa
ges
138
and
172.
Issu
e 24
Des
crip
tion
of p
robl
em
Des
crip
tion
of p
ropo
sed
amen
dmen
t Ju
stifi
catio
n fo
r am
endm
ent
ERG
resp
onse
Tabl
e 94
(pag
e 16
5)
Base
cas
e m
ean
ICER
for r
esliz
umab
vs
omal
izum
ab.
Cha
nge
£12,
889
to £
12,8
88
Mea
n IC
ER is
£12
,888
in
appe
ndix
4 o
f the
com
pany
re
spon
se.
We
agre
e. W
e ha
ve c
hang
ed th
e va
lue
to £
12,8
88 a
s su
gges
ted
(pag
e 16
3 ).
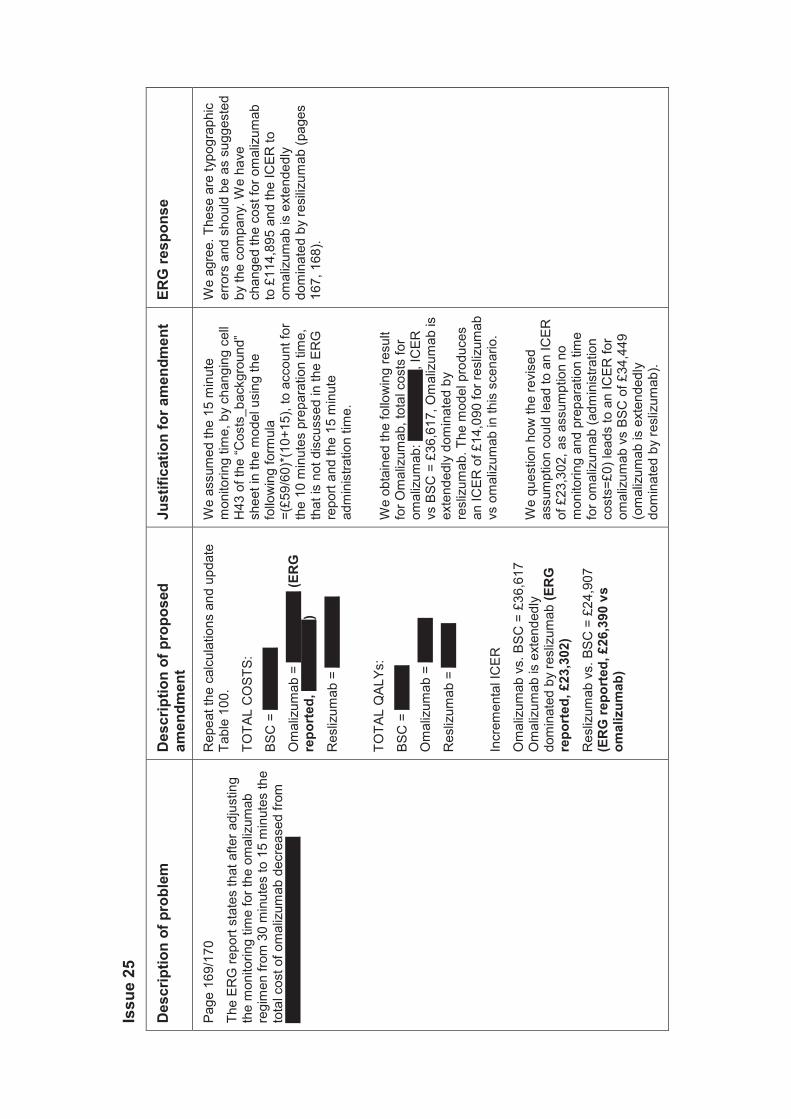
Issu
e 25
Des
crip
tion
of p
robl
em
Des
crip
tion
of p
ropo
sed
amen
dmen
t Ju
stifi
catio
n fo
r am
endm
ent
ERG
resp
onse
Page
169
/170
The
ERG
repo
rt st
ates
that
afte
r adj
ustin
g th
e m
onito
ring
time
for t
he o
mal
izum
ab
regi
men
from
30
min
utes
to 1
5 m
inut
es th
e to
tal c
ost o
f om
aliz
umab
dec
reas
ed fr
om
XXXX
XXXX
XXXX
XXXX
XXXX
X
Rep
eat t
he c
alcu
latio
ns a
nd u
pdat
e Ta
ble
100.
TOTA
L C
OST
S:
BSC
= X
XXXX
XX
Om
aliz
umab
= X
XXXX
XXX
(ER
G
repo
rted
, XXX
XXXX
X)
Res
lizum
ab =
XXX
XXXX
X
TOTA
L Q
ALYs
:
BSC
= X
XXXX
Om
aliz
umab
= X
XXXX
Res
lizum
ab =
XXX
XX
Incr
emen
tal I
CER
Om
aliz
umab
vs.
BSC
= £
36,6
17
Om
aliz
umab
is e
xten
dedl
y do
min
ated
by
resl
izum
ab (E
RG
re
port
ed, £
23,3
02)
Res
lizum
ab v
s. B
SC =
£24
,907
(E
RG
repo
rted
, £26
,390
vs
omal
izum
ab)
We
assu
med
the
15 m
inut
e m
onito
ring
time,
by
chan
ging
cel
l H
43 o
f the
“Cos
ts_b
ackg
roun
d”
shee
t in
the
mod
el u
sing
the
follo
win
g fo
rmul
a =(
£59/
60)*
(10+
15),
to a
ccou
nt fo
r th
e 10
min
utes
pre
para
tion
time,
th
at is
not
dis
cuss
ed in
the
ERG
re
port
and
the
15 m
inut
e ad
min
istra
tion
time.
We
obta
ined
the
follo
win
g re
sult
for O
mal
izum
ab, t
otal
cos
ts fo
r om
aliz
umab
: XXX
XXXX
X, IC
ER
vs B
SC =
£36
,617
, Om
aliz
umab
is
exte
nded
ly d
omin
ated
by
resl
izum
ab. T
he m
odel
pro
duce
s an
ICER
of £
14,0
90 fo
r res
lizum
ab
vs o
mal
izum
ab in
this
sce
nario
.
We
ques
tion
how
the
revi
sed
assu
mpt
ion
coul
d le
ad to
an
ICER
of
£23
,302
, as
assu
mpt
ion
no
mon
itorin
g an
d pr
epar
atio
n tim
e fo
r om
aliz
umab
(adm
inis
tratio
n co
sts=
£0) l
eads
to a
n IC
ER fo
r om
aliz
umab
vs
BSC
of £
34,4
49
(om
aliz
umab
is e
xten
dedl
y do
min
ated
by
resl
izum
ab).
We
agre
e. T
hese
are
typo
grap
hic
erro
rs a
nd s
houl
d be
as
sugg
este
d by
the
com
pany
. We
have
ch
ange
d th
e co
st fo
r om
aliz
umab
to
£11
4,89
5 an
d th
e IC
ER to
om
aliz
umab
is e
xten
dedl
y do
min
ated
by
resi
lizu m
ab (p
ages
16
7, 1
68).


