Embed Size (px)
Citation preview
ISSN 1023�1935, Russian Journal of Electrochemistry, 2014, Vol. 50, No. 3, pp. 208–222. © Pleiades Publishing, Ltd., 2014.Original Russian Text © Yu.G. Chirkov, V.I. Rostokin, 2014, published in Elektrokhimiya, 2014, Vol. 50, No. 3, pp. 235–250.
208
1. PROBLEM STATEMENT
Electrochemical capacitors or simply supercapaci�tors that employ the electric double layer rechargingprocesses can provide the specific capacitance of anorder of magnitude of 100 F/g and the energy of50 kJ/kg [1]. These supercapacitors are subdividedinto electric double layer capacitors (EDLC),pseudocapacitors (PsC), and hybrid capacitors (HC)[2]. The present study is focused only on EDLC, incontrast to earlier studies [3, 4] which considered theeffect of side reactions and faradaic processes.
An EDLC consists of two polarized porous elec�trodes (two active layers) immersed into either aque�ous or nonaqueous electrolyte solution [5]. To obtainhigh EDLC characteristics, active layers with the highspecific surface area of an order of magnitude of sev�eral hundred or several thousands of m2/g (highly dis�perse activated carbons and tissues) are used [6–8].Nowadays, carbon as an active electrode material isused in the majority of commercial systems (nearly95% of the market [9]).
One of the central problems of EDLC investiga�tions is the elucidation of the relationship between itsoverall characteristics and parameters of the activelayer porous structure. According to IUPAC [10], the
pores in active layers are characterized as follows:micropores (with diameters below 2 nm), mesopores(from 2 to 50 nm), and macropores (over 50 nm).
The relationship between overall characteristicsand the structure of porous electrodes was discussed inreviews [11–14] and numerous papers. The leadingrole of not only micropores in active layers (they deter�mine the high EDLC capacity and energy) but alsomacropores was revealed. The contribution of the lat�ter is negligible but they provide the transport of ionsto the charged surfaces and can enhance the EDLCpower.
The final conclusion that stems from these studiesis as follows. Acknowledging a certain role of mesopo�res and understanding that not the whole microporesurface found by well�known adsorption methods(BET, etc.) may be accessible for charging of the dou�ble layers in it, it should be assumed that for the opti�mal functioning of EDLC active layers made of acti�vated carbon materials, the balance should beobserved between contributions of micro andmacropores in the size distribution of pores, i.e., theiraverage sizes should be correctly chosen.
The analysis of functioning of EDLC active layerscan be carried out either by impedance (transmissionlines) methods proposed by de Levie [15, 16] or bysolving systems of equations describing physical pro�
Computer Simulation of Active Layers in the Electric Double Layer Supercapacitor: Optimization of Active Layer Charging Modes
and Structure, Calculation of Overall CharacteristicsYu. G. Chirkova, z and V. I. Rostokinb
a Frumkin Institute of Physical Chemistry and Electrochemistry, Russian Academy of Sciences, Leninskii pr. 31, Moscow, 119071 Russia
b National Research Nuclear University (Moscow Engineering Physics Institute), Kashirskoe sh. 31, Moscow, 115409 Russia
Received December 7, 2012
Abstract—The structure and functioning modes of active layers in an electric double layer capacitor (EDLC)with an aqueous electrolyte are simulated by means of a computer. A model of active layers prepared fromactivated carbon materials is proposed, percolation estimates are performed and effective ionic conductivitiesare calculated. The polarization of active layers includes a sequence of two charging processes: first, galvano�static and then potentiostatic. The proposed program of calculations involves mutual matching and optimi�zation of seven parameters characterizing the active layer and conditions of charging processes. According tocalculations, galvanostatic polarization of wide pores in the EDLC biporous active layer up to the limitingpotential followed by potentiostatic polarization of fine pores allows the capacity Csp = 246 F/g and the energyWsp = 107 kJ/kg to be obtained in fractions of second.
Keywords: computer simulation, electric double layer supercapacitor, galvanostatic and potentiostatic charg�ing modes, active layer with biporous structure, activated carbon, aqueous electrolyte
DOI: 10.1134/S1023193514030033
z Corresponding author: [email protected] (Yu.G. Chirkov).
RUSSIAN JOURNAL OF ELECTROCHEMISTRY Vol. 50 No. 3 2014
COMPUTER SIMULATION OF ACTIVE LAYERS 209
cesses in EDLC active layers [17, 18]. In the presentstudy, the second way is taken.
This study is aimed at computer simulation of thestructure and functioning of EDLC active layers madeof highly disperse activated carbon by subjecting themfirst to galvanostatic and then to potentiostatic charg�ing and also at the development of a method for calcu�lating overall characteristics, namely, the specificcapacitance and the energy.
2. THE CENTRAL PROBLEM OF EDLC
Carbon materials find the progressively wider prac�tical application. Activated carbons are synthesized bycarbonization of organic substances or fossil carbons(synthesis of a product with the high carbon content).The next stage is the activation process during whichthe porosity develops further and micropores becomemore accessible [20].
For an EDLC, it is important to combinemicropores with meso and macropores. In the furtherconsideration, to avoid unnecessary complications ofthe EDLC model, we assume that mesopores areabsent and we have only micro and macropores.
The galvanostatic mode of EDLC charging wouldseem capable of quickly providing the high values ofspecific capacitance and energy. Actually, this is asso�ciated with complications. In [21], the parameter τwas introduced. It means the characteristic time ofcharging of the surface of a porous structure and takesthe form
τ = SCsL2/κ, (1)
where S (cm–1) is the specific surface to be charged;Cs (F/cm2) is the specific capacitance of the electric dou�ble layer, L (cm) is the active layer thickness, κ (S cm–1)is the effective specific conductivity of ions in theactive layer.
The surface area S is inversely proportional to thepore size (radius or diameter) ρ
S ~ 1/ρ. (2)
Hence, if the radius of wide pores ρ2 much exceeds theradius of fine pores ρ1, then, according to definition (1),the characteristic time for charging the wide pores τ2turns out to be far smaller than the characteristic timeit takes to charge the fine pores τ1. Thus, we have theinequality
τ2 � τ1. (3)
It means that at galvanostatic charging, the wide poresare first to be polarized and only after this, the polar�ization of finer pores is possible. However, the charg�ing process can be carried out only up to a certainmoment. The potential Е of the surface being chargedin the active layer cannot exceed a certain limit Е*.Thus, in aqueous electrolyte solutions at polarizationof activated carbon, the potential deviates from its ini�tial value Е* – Е0 ~ 1 V.
The presence of wide pores in active layers is aresult of using technologies for synthesizing activatedcarbons. The wide pores open access to finest poresand, seemingly, should enhance the EDLC character�istics. But the same wide pores that are polarized soquickly become an obstacle to charging micropores inthe galvanostatic mode. The high overall characteris�tics cannot be reached. This is the central problem forEDLC.
Supercapacitors can be charged by means of apotentiostat by setting the limiting potential value Е*.However, in this case, their charging is a relatively longprocess. The time of active layer charging t* can beassessed by solving the following equation:
(4)
Let us assume that the active layer consists of a uni�form ultradisperse material containing microporeswith the radius of an order of magnitude of 1 nm.Here, Е(0, t*) is the potential at the back surface of theactive layer. Assume that Е0 = 0.5 V and Е* = 1.5 V;τ = SCsL
2/κ is the aforementioned characteristic timeof charging.
Assume S = 1.359 × 107 cm–1, Cs = 2 × 10⁻⁵ F/cm2,κ = 0.11 S cm–1 [21]. Furthermore, assume that theincreasing potential in the active layer reaches Е(0, t*) =0.999 Е*. Table 1 shows the results of calculations oft*. It is evident that the charging of active layers withthe thickness L ~ 0.1–1 cm takes several tens of min�utes rather than several seconds.
Thus, taken separately, neither galvanostatic norpotentiostatic modes of EDLC charging allow specificcapacitance of several hundred of F/g to be reached inseveral seconds or even several fractions of second.
The central problem of EDLC can be solved bydividing the charging process into two stages: first, inthe galvanostatic mode, the surface of wide pores ischarged up to the maximum permissible value Е* andthen the charging is continued in the potentiostaticmode by establishing the potential Е = Е*. However,several questions arise and the present study is toanswer them.
First, for a given average radius of fine pores ρ1, wemust find the optimal average radius of wide pores ρ2.
( )( )
( )
∞
=
−= − −
π +
⎧ ⎫π +⎪ ⎪⎛ ⎞× − = η⎨ ⎬⎜ ⎟ τ⎝ ⎠⎪ ⎪⎩ ⎭
∑* * *
* *
0
0
2
14(0, )2 1
2 1exp .
2
m
m
E t E E Em
m t E
Table 1. Dependence of EDLC charging time t* (potentio�static conditions) on the active layer thickness L
L, cm t*, s
0.01 0.675
0.1 67.5
1 6.75 × 10³
210
RUSSIAN JOURNAL OF ELECTROCHEMISTRY Vol. 50 No. 3 2014
CHIRKOV, ROSTOKIN
Furthermore, the optimal ratio of the highly disperseactive layer part g should be specified.
Second, in the first stage of charging (galvano�static), the correct choice of the following two param�eters is important: the active layer thickness L and thecharging current (galvanostatic charging) I.
Third, the galvanostatic process (its time is desig�nated as tgal) should proceed much quicker as com�pared with the potentiostatic process (its time is desig�nated as tpot). The condition tgal � tpot should beobserved.
Fourth, the optimal time consumed in polarizationof fine pores under potentiostatic conditions should bedetermined, because the flow of ions to fine poresweakens and vanishes at the infinite charging time.
Fifth, it is desirable to know what values of capaci�tance and energy can be realized when using the two�step process of EDLC charging.
Thus, the program of calculations implies themutual matching and optimization of seven parame�ters: ρ1, ρ2, g, L, I, tgal, tpot. Now we embark on realiza�tion of this calculation program.
Yet another note. This study is carried out withinthe framework of computer�assisted simulations.Computer simulations are a separate and well�devel�oped field which has its own principles, approaches,apparatus, requires good physical and mathematicaleducation, the knowledge of high�level computer lan�guages, etc. In essence, its goal is to supplement exper�imental studies and even plan the latter.
3. COMPUTER MODELOF ACTIVE LAYER STRUCTURE
Active layers represent the most important compo�nent of many types of electrochemical devices: fuelcells, electrolyzers, electrosynthetic cells, lithium�ion
batteries, supercapacitors, etc. To obtain high overallcurrents or work out a sufficient amount of the targetproduct, it is first of all necessary to optimize the chan�nels in the active layer for the continuous delivery ofions and electrons to the catalyst surface.
The program of computer simulations of active lay�ers in electrochemical technology of one or anothertype consists of a sequence of successive steps:
(1) development of a computer model of the activelayer structure;
(2) investigation of percolation properties of thiscomputer model;
(3) determination of effective coefficients of theactive layer (these coefficients are involved in equa�tions describing the processes in the active layer);
(4) calculation of the major overall characteristicsof the active layer;
(5) if required, optimization of functioning of theactive layer under study.
The ultimate goal of studying the biporous activelayer of EDLC is to calculate the overall characteristicsof the assumed active layer structure, namely, thecharging time and the specific values of capacitanceand energy.
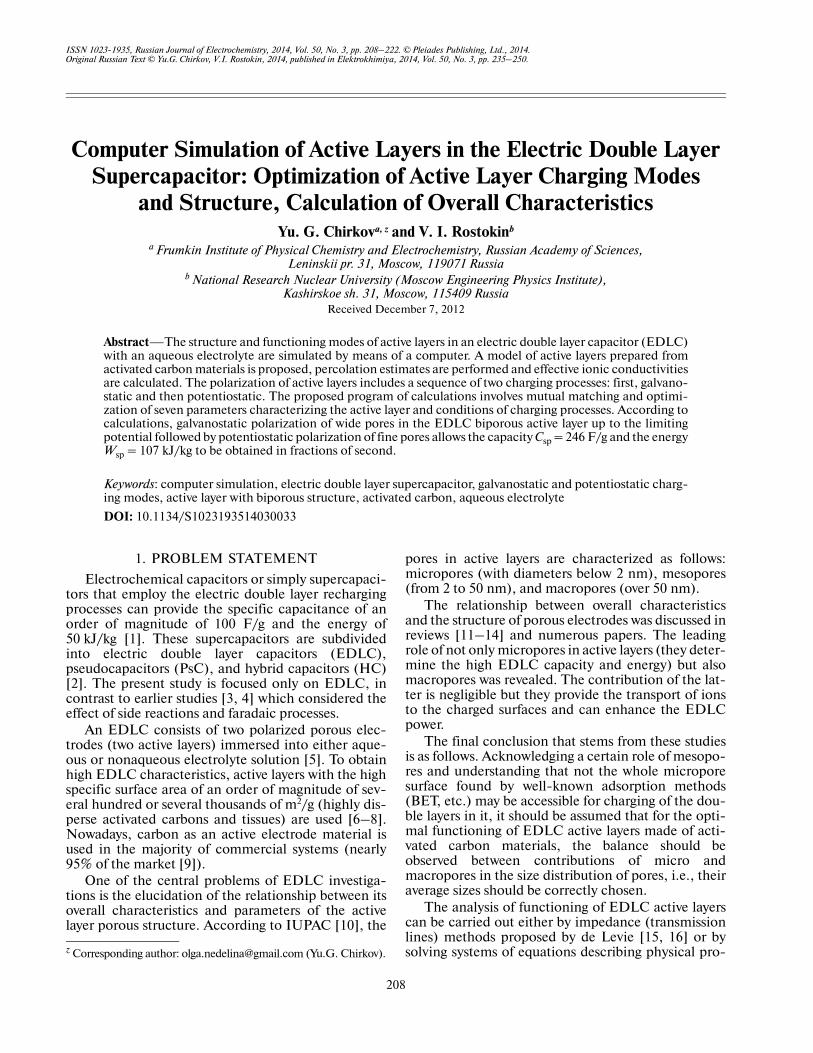
Figure 1 shows the model of an EDLC biporousactive layer. Here, the electrolyte�filled coarse pores�voids are randomly mixed with agglomerates ofnumerous fine carbon particles on the surface of whichthe charge should generally be adsorbed.
Below, the electrolyte�filled voids and electrolyte�wetted agglomerates of fine carbon particles are calledthe “grains”, i.e., electrolyte grains and carbon grains,respectively. Assume that these grains and equal�sizedand shaped as cubes with edge D. In this model, thefine carbon particles which partly occupy the volumeof carbon grains are also represented as microcubeswith equal edge d. Thus, to describe the structure ofthe EDLC active layer, we have assumed the biporousmodel of equal�sized grains of two types. Figure 1illustrates this model. It is evident, that the followingrelationship is observed:
g + gi = 1, (5)
where g is the volume concentration (fraction) ofporous carbon grains (the main parameter), gi is thevolume concentration (fraction) of electrolyte grains.
The three�dimensional model of the EDLC activelayer is chosen to be a model cube with dimensions of
Ns × Ns × Ns = The model cube should have mac�roscopic dimensions. This means that as in real cases,the active layer thickness L much exceed the size ofindividual grains D. The following inequality shouldbe observed:
D � L. (6)
The point is that as was shown in [22], the percola�tion characteristics of the porous medium become sta�ble and undergo no changes upon the attainment of
Ns3.
Fig. 1. Illustration of a model the active layer structure fora biporous EDLC (model of equal�sized cubic grains oftwo types). Black cubes are porous carbon grains, lightcubes are electrolyte grains: g = 0.5.
RUSSIAN JOURNAL OF ELECTROCHEMISTRY Vol. 50 No. 3 2014
COMPUTER SIMULATION OF ACTIVE LAYERS 211
sufficiently large values of parameter Ns. This can beachieved by assuming Ns = 100. In the further consid�eration, the model cube under study accommodates100 × 100 × 100 = 106, i.e., a million of grains of bothtypes.
4. PERCOLATION CHARACTERISTICSOF THE ACTIVE LAYER
The second stage of computer simulations consistsof percolation estimates.
In the active layer, two percolation clusters shouldbe distinguished [23], ionic (electrolyte grains) andelectronic (carbon grains) clusters. Each of these clus�ters represents a combination of interconnected grainsof one or another type. Percolation clusters uniformlytranspierce the total active layer thickness.
Percolation clusters are formed when the percola�tion threshold is reached, in other words, when thevolume concentrations of the corresponding grainsreach their critical values, i.e., g*** or In thecubic lattice of sites [23] under consideration, the per�colation threshold, as was demonstrated in [24], isequal to
g*** = = [(1 + 21/2)1/3 + (1 – 21/2)1/3]/2 = 0.298. (7)
Thus, for functioning of the active layer, at least thefollowing two conditions should be fulfilled:
g ≥ 0.30, gi ≥ 0.30. (8)
Conditions (5) and (8) mean that the fraction of car�bon grains should be localized in the interval
0.3 ≤ g ≤ 0.7, (9)
if we assume that ions enter the active layer mainly viaelectrolyte grains and electrons enter it via carbongrains.
Now, a significant note should be made. As wasshown in [25], the true percolation clusters appear atneither g*** = 0.298 nor = 0.298 but at the higherconcentrations, i.e., g ≥ 0.35 and gi ≥ 0.35. At the lowervalues, the clusters are only being developed andoccupy a small part of the model cube volume. Hence,it is reasonable to consider the narrower interval ofpermissible concentrations g and gi
g ≥ 0.35, gi ≥ 0.35. (10)
Thus, the working interval of carbon grains in theactive layer is limited by inequalities
0.35 ≤ g ≤ 0.65. (11)
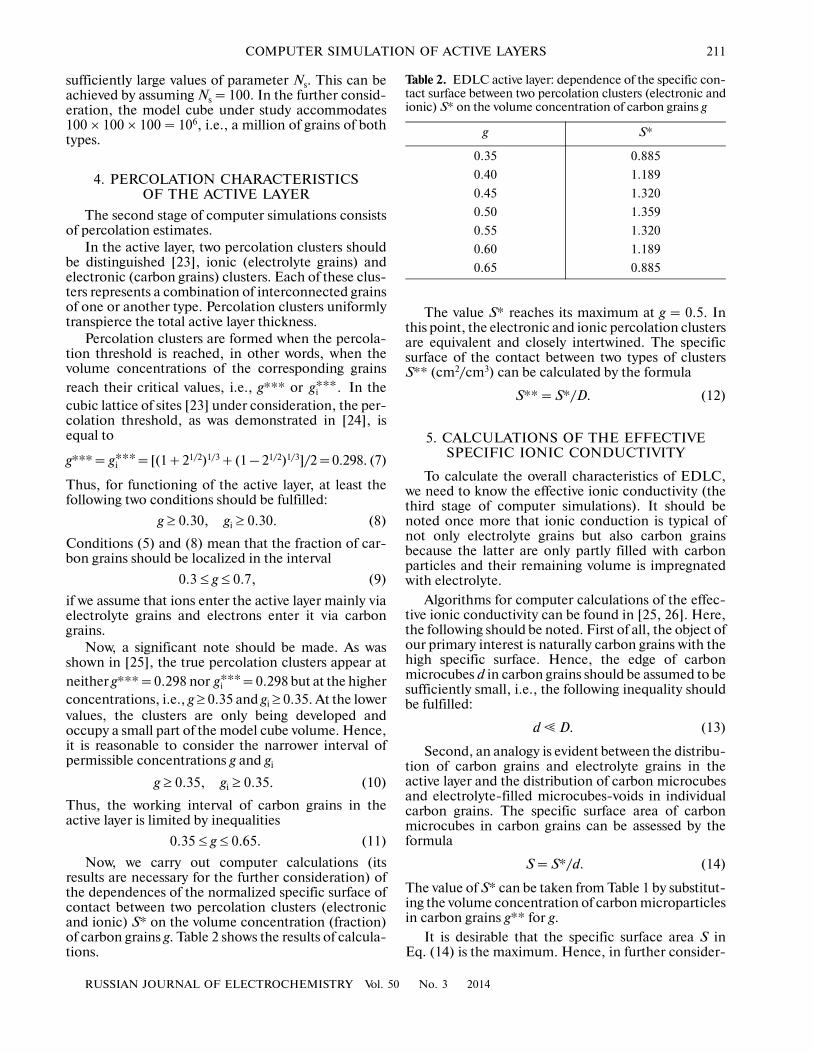
Now, we carry out computer calculations (itsresults are necessary for the further consideration) ofthe dependences of the normalized specific surface ofcontact between two percolation clusters (electronicand ionic) S* on the volume concentration (fraction)of carbon grains g. Table 2 shows the results of calcula�tions.
gi***.
gi***
gi***
The value S* reaches its maximum at g = 0.5. Inthis point, the electronic and ionic percolation clustersare equivalent and closely intertwined. The specificsurface of the contact between two types of clustersS** (cm2/cm3) can be calculated by the formula
S** = S*/D. (12)
5. CALCULATIONS OF THE EFFECTIVE SPECIFIC IONIC CONDUCTIVITY
To calculate the overall characteristics of EDLC,we need to know the effective ionic conductivity (thethird stage of computer simulations). It should benoted once more that ionic conduction is typical ofnot only electrolyte grains but also carbon grainsbecause the latter are only partly filled with carbonparticles and their remaining volume is impregnatedwith electrolyte.
Algorithms for computer calculations of the effec�tive ionic conductivity can be found in [25, 26]. Here,the following should be noted. First of all, the object ofour primary interest is naturally carbon grains with thehigh specific surface. Hence, the edge of carbonmicrocubes d in carbon grains should be assumed to besufficiently small, i.e., the following inequality shouldbe fulfilled:
d � D. (13)
Second, an analogy is evident between the distribu�tion of carbon grains and electrolyte grains in theactive layer and the distribution of carbon microcubesand electrolyte�filled microcubes�voids in individualcarbon grains. The specific surface area of carbonmicrocubes in carbon grains can be assessed by theformula
S = S*/d. (14)
The value of S* can be taken from Table 1 by substitut�ing the volume concentration of carbon microparticlesin carbon grains g** for g.
It is desirable that the specific surface area S inEq. (14) is the maximum. Hence, in further consider�
Table 2. EDLC active layer: dependence of the specific con�tact surface between two percolation clusters (electronic andionic) S* on the volume concentration of carbon grains g
g S*
0.35 0.885
0.40 1.189
0.45 1.320
0.50 1.359
0.55 1.320
0.60 1.189
0.65 0.885
212
RUSSIAN JOURNAL OF ELECTROCHEMISTRY Vol. 50 No. 3 2014
CHIRKOV, ROSTOKIN
ation we assume that g** = 0.5 and in Eq. (14) S* =1.359 (data of Table 1).
Table 3 shows the results of calculations of thedependence of the effective ionic conductivity κ* onthe concentration of carbon particles (carbonmicrocubes) g** [21]. The conductivity κ* quicklydrops with the increase in g**. Note that for the opti�mal concentration g** = 0.5, the effective specificconductivity is shown to be κ* = 0.11.
What remains is to estimate the dependence of theeffective specific ionic conductivity κ** of the activelayer on the concentration of carbon grains g. Theactive layer consists of a mixture of electrolyte grainswith the conditional conductivity equal to 1 and alsoof carbon grains with the conditional conductivity κ*(Table 3). Table 4 shows the results of calculations.
In was assumed that g** = 0.5 [21]. It is obviousthat for g = 1.0 (the active layer consists only of carbongrains), κ** = 0.11. Ultimately, the effective value ofthe specific ionic conductivity of the active layer κ canbe determined by the obvious formula
κ = κ0κ**, (15)
where κ0 is the specific ionic conductivity of the elec�trolyte chosen.
6. GALVANOSTATIC CHARGING
The fourth stage of computer simulations of theEDLC active layer consists of calculations of overallcharacteristics. We divide the charging processes intotwo steps: first of all we charge galvanostatically thesurface of wide pores to reach the limiting value Е* andthen we continue the charging of fine pores under poten�tiostatic conditions by fixing the potential at Е = Е*.
The galvanostatic mode was studied in detail in[21] for various versions of the active layer structure.There, the overall EDLC characteristics were calcu�lated by approximate formulas. It was assumed thatthe charges that enter into the active layer volume areuniformly distributed throughout the active layerthickness. This is why the potential value in the activelayer is virtually uniformly distributed throughout itsthickness in all moments.
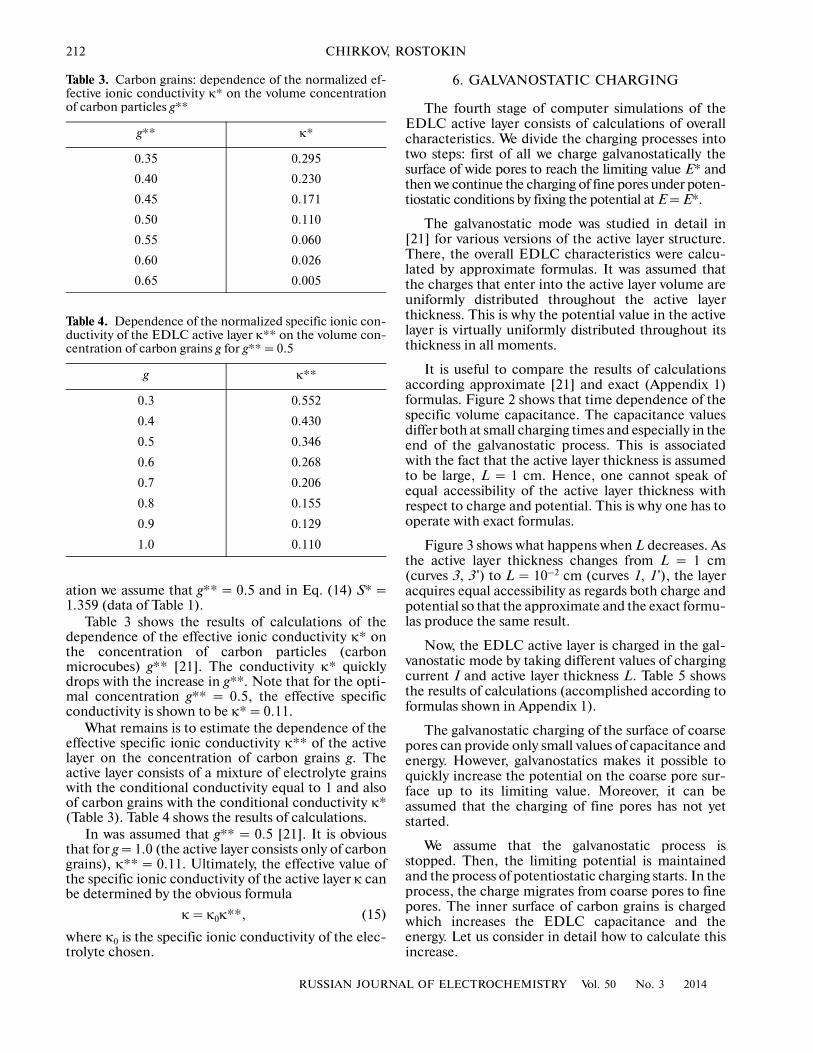
It is useful to compare the results of calculationsaccording approximate [21] and exact (Appendix 1)formulas. Figure 2 shows that time dependence of thespecific volume capacitance. The capacitance valuesdiffer both at small charging times and especially in theend of the galvanostatic process. This is associatedwith the fact that the active layer thickness is assumedto be large, L = 1 cm. Hence, one cannot speak ofequal accessibility of the active layer thickness withrespect to charge and potential. This is why one has tooperate with exact formulas.
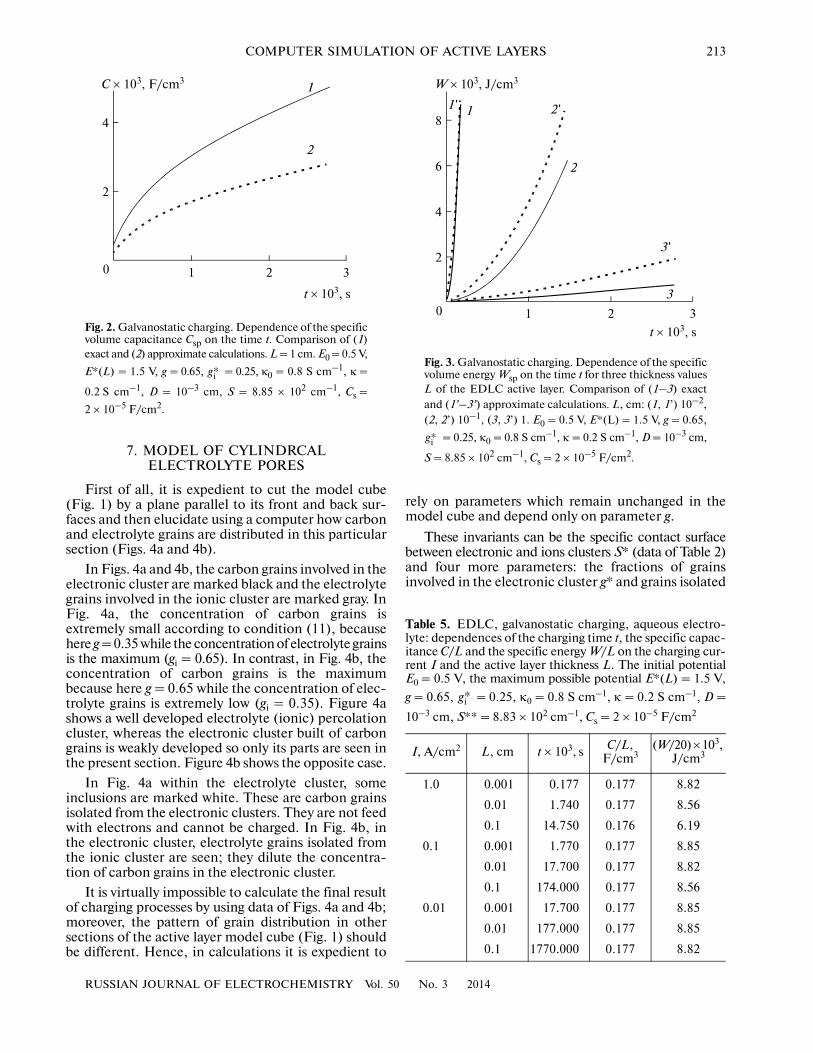
Figure 3 shows what happens when L decreases. Asthe active layer thickness changes from L = 1 cm(curves 3, 3 ') to L = 10–2 cm (curves 1, 1 '), the layeracquires equal accessibility as regards both charge andpotential so that the approximate and the exact formu�las produce the same result.
Now, the EDLC active layer is charged in the gal�vanostatic mode by taking different values of chargingcurrent I and active layer thickness L. Table 5 showsthe results of calculations (accomplished according toformulas shown in Appendix 1).
The galvanostatic charging of the surface of coarsepores can provide only small values of capacitance andenergy. However, galvanostatics makes it possible toquickly increase the potential on the coarse pore sur�face up to its limiting value. Moreover, it can beassumed that the charging of fine pores has not yetstarted.
We assume that the galvanostatic process isstopped. Then, the limiting potential is maintainedand the process of potentiostatic charging starts. In theprocess, the charge migrates from coarse pores to finepores. The inner surface of carbon grains is chargedwhich increases the EDLC capacitance and theenergy. Let us consider in detail how to calculate thisincrease.
Table 3. Carbon grains: dependence of the normalized ef�fective ionic conductivity κ* on the volume concentrationof carbon particles g**
g** κ*
0.35 0.295
0.40 0.230
0.45 0.171
0.50 0.110
0.55 0.060
0.60 0.026
0.65 0.005
Table 4. Dependence of the normalized specific ionic con�ductivity of the EDLC active layer κ** on the volume con�centration of carbon grains g for g** = 0.5
g κ**
0.3 0.552
0.4 0.430
0.5 0.346
0.6 0.268
0.7 0.206
0.8 0.155
0.9 0.129
1.0 0.110
RUSSIAN JOURNAL OF ELECTROCHEMISTRY Vol. 50 No. 3 2014
COMPUTER SIMULATION OF ACTIVE LAYERS 213
7. MODEL OF CYLINDRCALELECTROLYTE PORES
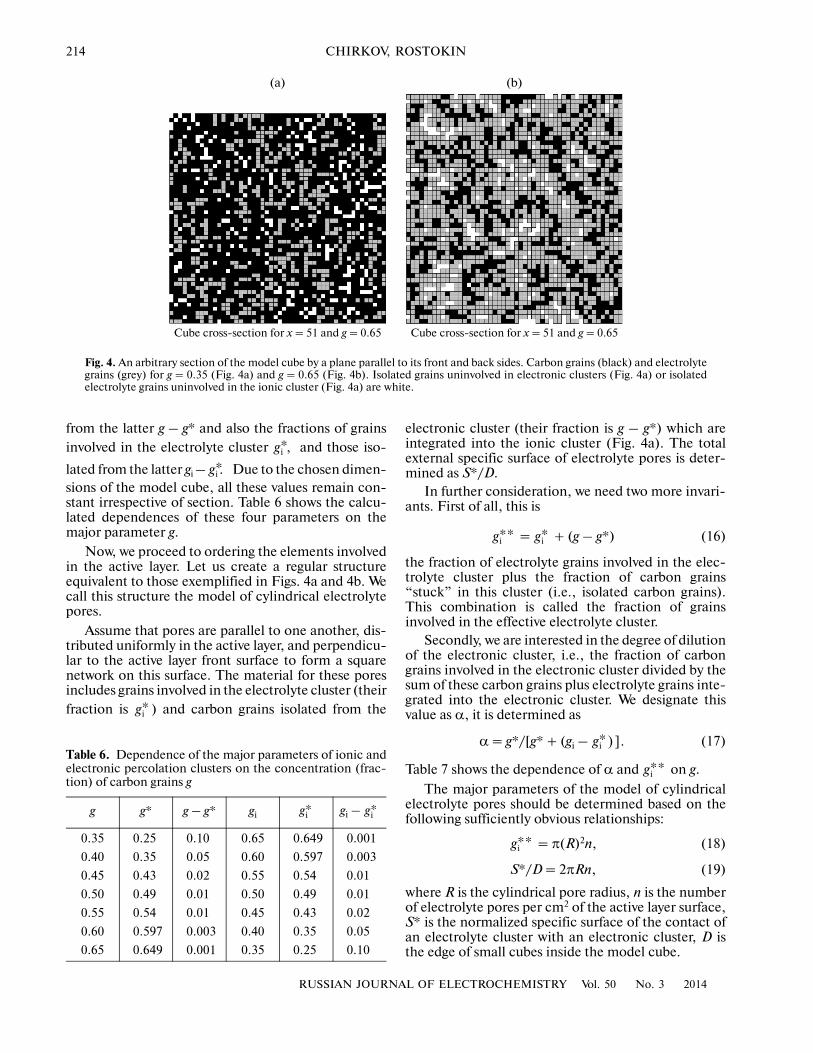
First of all, it is expedient to cut the model cube(Fig. 1) by a plane parallel to its front and back sur�faces and then elucidate using a computer how carbonand electrolyte grains are distributed in this particularsection (Figs. 4a and 4b).
In Figs. 4a and 4b, the carbon grains involved in theelectronic cluster are marked black and the electrolytegrains involved in the ionic cluster are marked gray. InFig. 4a, the concentration of carbon grains isextremely small according to condition (11), becausehere g = 0.35 while the concentration of electrolyte grainsis the maximum (gi = 0.65). In contrast, in Fig. 4b, theconcentration of carbon grains is the maximumbecause here g = 0.65 while the concentration of elec�trolyte grains is extremely low (gi = 0.35). Figure 4ashows a well developed electrolyte (ionic) percolationcluster, whereas the electronic cluster built of carbongrains is weakly developed so only its parts are seen inthe present section. Figure 4b shows the opposite case.
In Fig. 4a within the electrolyte cluster, someinclusions are marked white. These are carbon grainsisolated from the electronic clusters. They are not feedwith electrons and cannot be charged. In Fig. 4b, inthe electronic cluster, electrolyte grains isolated fromthe ionic cluster are seen; they dilute the concentra�tion of carbon grains in the electronic cluster.
It is virtually impossible to calculate the final resultof charging processes by using data of Figs. 4a and 4b;moreover, the pattern of grain distribution in othersections of the active layer model cube (Fig. 1) shouldbe different. Hence, in calculations it is expedient to
rely on parameters which remain unchanged in themodel cube and depend only on parameter g.
These invariants can be the specific contact surfacebetween electronic and ions clusters S* (data of Table 2)and four more parameters: the fractions of grainsinvolved in the electronic cluster g* and grains isolated
Table 5. EDLC, galvanostatic charging, aqueous electro�lyte: dependences of the charging time t, the specific capac�itance C/L and the specific energy W/L on the charging cur�rent I and the active layer thickness L. The initial potentialE0 = 0.5 V, the maximum possible potential E*(L) = 1.5 V,
g = 0.65, = 0.25, κ0 = 0.8 S cm–1, κ = 0.2 S cm–1, D =
10–3 cm, S** = 8.83 × 102 cm–1, Cs = 2 × 10⁻⁵ F/cm2
I, A/cm2 L, cm t × 103, s C/L, F/cm3
(W/20) × 103, J/cm3
1.0 0.001 0.177 0.177 8.82
0.01 1.740 0.177 8.56
0.1 14.750 0.176 6.19
0.1 0.001 1.770 0.177 8.85
0.01 17.700 0.177 8.82
0.1 174.000 0.177 8.56
0.01 0.001 17.700 0.177 8.85
0.01 177.000 0.177 8.85
0.1 1770.000 0.177 8.82
gi*
6
4
0 321
1
2
2
82 '
3 '
1 '
3
t × 103, s
W × 103, J/cm3
Fig. 3. Galvanostatic charging. Dependence of the specificvolume energy Wsp on the time t for three thickness valuesL of the EDLC active layer. Comparison of (1–3) exactand (1’–3’) approximate calculations. L, cm: (1, 1’) 10–2,(2, 2’) 10–1, (3, 3’) 1. E0 = 0.5 V, E*(L) = 1.5 V, g = 0.65,
= 0.25, κ0 = 0.8 S cm–1, κ = 0.2 S cm–1, D = 10–3 cm,
S = 8.85 × 102 cm–1, Cs = 2 × 10⁻⁵ F/cm2.
gi*
4
2
0 321
C × 103, F/cm31
2
t × 103, s
Fig. 2. Galvanostatic charging. Dependence of the specificvolume capacitance Csp on the time t. Comparison of (1)exact and (2) approximate calculations. L = 1 cm. E0 = 0.5 V,
Е*(L) = 1.5 V, g = 0.65, = 0.25, κ0 = 0.8 S cm–1, κ =
0.2 S cm–1, D = 10–3 cm, S = 8.85 × 102 cm–1, Cs =
2 × 10⁻⁵ F/cm2.
gi*
214
RUSSIAN JOURNAL OF ELECTROCHEMISTRY Vol. 50 No. 3 2014
CHIRKOV, ROSTOKIN
from the latter g – g* and also the fractions of grainsinvolved in the electrolyte cluster and those iso�
lated from the latter gi – Due to the chosen dimen�sions of the model cube, all these values remain con�stant irrespective of section. Table 6 shows the calcu�lated dependences of these four parameters on themajor parameter g.
Now, we proceed to ordering the elements involvedin the active layer. Let us create a regular structureequivalent to those exemplified in Figs. 4a and 4b. Wecall this structure the model of cylindrical electrolytepores.
Assume that pores are parallel to one another, dis�tributed uniformly in the active layer, and perpendicu�lar to the active layer front surface to form a squarenetwork on this surface. The material for these poresincludes grains involved in the electrolyte cluster (theirfraction is ) and carbon grains isolated from the
gi*,
gi*.
gi*
electronic cluster (their fraction is g – g*) which areintegrated into the ionic cluster (Fig. 4a). The totalexternal specific surface of electrolyte pores is deter�mined as S*/D.
In further consideration, we need two more invari�ants. First of all, this is
= + (g – g*) (16)
the fraction of electrolyte grains involved in the elec�trolyte cluster plus the fraction of carbon grains“stuck” in this cluster (i.e., isolated carbon grains).This combination is called the fraction of grainsinvolved in the effective electrolyte cluster.
Secondly, we are interested in the degree of dilutionof the electronic cluster, i.e., the fraction of carbongrains involved in the electronic cluster divided by thesum of these carbon grains plus electrolyte grains inte�grated into the electronic cluster. We designate thisvalue as α, it is determined as
α = g*/[g* + (gi – (17)
Table 7 shows the dependence of α and on g.
The major parameters of the model of cylindricalelectrolyte pores should be determined based on thefollowing sufficiently obvious relationships:
= π(R)2n, (18)
S*/D = 2πRn, (19)
where R is the cylindrical pore radius, n is the numberof electrolyte pores per cm2 of the active layer surface,S* is the normalized specific surface of the contact ofan electrolyte cluster with an electronic cluster, D isthe edge of small cubes inside the model cube.
gi** gi*
gi* ) ].
gi**
gi**
(а) (b)
Cube cross�section for x = 51 and g = 0.65 Cube cross�section for x = 51 and g = 0.65
Fig. 4. An arbitrary section of the model cube by a plane parallel to its front and back sides. Carbon grains (black) and electrolytegrains (grey) for g = 0.35 (Fig. 4a) and g = 0.65 (Fig. 4b). Isolated grains uninvolved in electronic clusters (Fig. 4a) or isolatedelectrolyte grains uninvolved in the ionic cluster (Fig. 4a) are white.
Table 6. Dependence of the major parameters of ionic andelectronic percolation clusters on the concentration (frac�tion) of carbon grains g
g g* g – g* gi gi –
0.35 0.25 0.10 0.65 0.649 0.001
0.40 0.35 0.05 0.60 0.597 0.003
0.45 0.43 0.02 0.55 0.54 0.01
0.50 0.49 0.01 0.50 0.49 0.01
0.55 0.54 0.01 0.45 0.43 0.02
0.60 0.597 0.003 0.40 0.35 0.05
0.65 0.649 0.001 0.35 0.25 0.10
gi* gi*
RUSSIAN JOURNAL OF ELECTROCHEMISTRY Vol. 50 No. 3 2014
COMPUTER SIMULATION OF ACTIVE LAYERS 215
It follows from the system of equations (18) and(19) that
R/D = 2 /S*, (20)
nD2 = (S*/2)2/π (21)
l/D = 1/2Dn1/2 = (π /S*, (22)
R/l = 2( π)1/2, (23)
where l is the half�distance between the neighboringcylindrical pores. Table 8 demonstrates all parametersof the model of cylindrical electrolyte pores.
8. PARAMETERS OF HIGHLYDISPERSE LAYERS
Now we embark on the second stage of charging ofa biporous EDLC, i.e., to potentiostatic conditions. Inthe model proposed, it is the highly disperse layer adja�cent to each electrolyte pore and bounded by twocylindrical surfaces with the polar radii r1 = R and r2 = lthat is charged. This layer is formed by not only carbongrains but also electrolyte grains isolated from theelectrolyte cluster. The formulas that describe themigration of ions to carbon grains surrounding cylin�drical electrolyte pores can be found in Appendix 2.The carbon medium that surrounds electrolyte pores isassumed to be homogeneous and characterized byeffective parameters κ*** and S***. Let us determinethese parameters.
Assume that the concentration of carbon grains inthe active layer is g = 0.65. Then, the mixture of carbongrains and isolated electrolyte grains in the highly dis�perse layer corresponds to g + (gi – = 0.65 + 0.10 =0.75 (see data in Table 6). The fraction of carbongrains in the mixture is g = 0.65/0.75 = 13/15 = 0.87.Using the data in Table 4, we find that the concentra�tion of 0.87 corresponds to the conductivity κ** =0.135. Hence, κ*** = 0.8 × 0.135 = 0.108 S cm–1,where κ0 = 0.8 S cm–1 is the aqueous electrolyte con�ductivity. The specific surface of carbon in the mixtureof carbon grains and isolated electrolyte grains isS*** = 1.359 × 107 × 0.87 = 1.18 × 107 cm–1. Table 9shows the same estimates for the other g values.
9. OVERALL CHARACTERISTICSOF THE EDLC ACTIVE LAYER
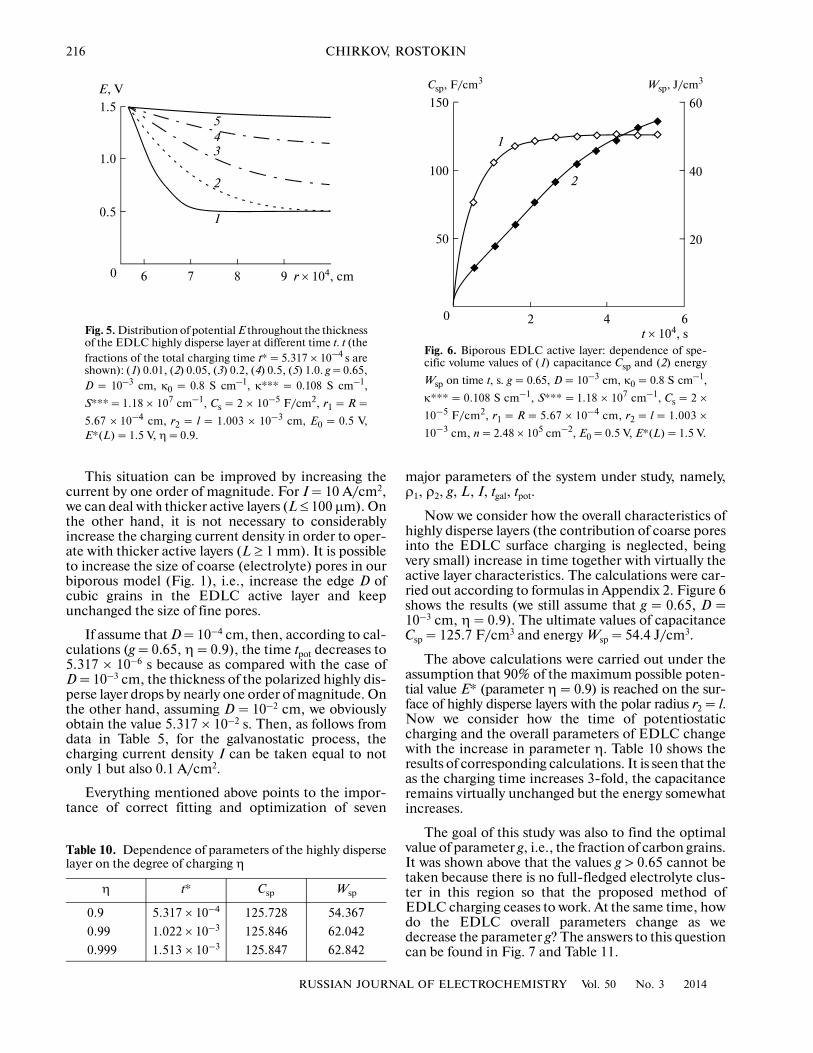
Now, we calculate the overall characteristics of theEDLC active layer. First of all, we find the potentialdistribution along the thickness of the highly disperselayer in different moments (Fig. 5). Assume that g =0.65, the grain size D = 10–3 cm, and the potential onthe back side of the highly disperse layer (at polarradius r = l) reaches 90% of the maximum possiblevalue (η = 0.9).
gi**
gi**,
gi** )1/2
gi**/
gi*)
The potential is fixed at the front side of the highlydisperse layer (Е* = 1.5 V) but quickly increases fromthe value Е0 at its back side. The charging time is smalltpot = 5.317 × 10⁻⁴ s. Let us compare this time with thetimes of galvanostatic charging tgal shown in Table 5.The inequality
tgal � tpot (24)
should be fulfilled.Data in Table 5 suggest that inequality (24) is true
only for certain combinations of values of the twomain parameters, namely, the current I and the activelayer thickness L. If, for example, we take the currentI = 1 A/cm2 (Table 5, lines 2–3), then, strictly speak�ing, the inequality (24) is fulfilled only for thin activelayers with L ≤ 10 μm.
Table 7. Dependences of the degree of dilution of the car�bon material in the electronic cluster α and the fraction ofgrains involved in the effective electrolyte cluster on the
fraction of carbon grains in the model cube
g α
0.35 0.996 0.749
0.40 0.992 0.647
0.45 0.977 0.542
0.50 0.974 0.500
0.55 0.964 0.440
0.60 0.923 0.353
0.65 0.866 0.251
gi**
gi**
Table 8. Parameters of the model of cylindrical electrolytepores
g R/D nD2 l/D R/l
0.35 1.693 0.083 1.733 1.024
0.40 1.088 0.174 1.199 1.102
0.45 0.821 0.256 0.989 1.204
0.50 0.736 0.294 0.922 1.253
0.55 0.667 0.315 0.891 1.336
0.60 0.594 0.319 0.886 1.492
0.65 0.567 0.248 1.003 1.769
Table 9. Highly disperse layer: dependences of the effectiveionic conductivity κ*** and the specific surface S*** on thefraction of carbon grains in the active layer g
g κ***, S cm–1 S***, cm–1
0.65 0.108 1.18 × 10⁷
0.55 0.092 1.31 × 10⁷
0.45 0.0896 1.33 × 10⁷
0.35 0.088 1.355 × 10⁷
216
RUSSIAN JOURNAL OF ELECTROCHEMISTRY Vol. 50 No. 3 2014
CHIRKOV, ROSTOKIN
This situation can be improved by increasing thecurrent by one order of magnitude. For I = 10 A/cm2,we can deal with thicker active layers (L ≤ 100 μm). Onthe other hand, it is not necessary to considerablyincrease the charging current density in order to oper�ate with thicker active layers (L ≥ 1 mm). It is possibleto increase the size of coarse (electrolyte) pores in ourbiporous model (Fig. 1), i.e., increase the edge D ofcubic grains in the EDLC active layer and keepunchanged the size of fine pores.
If assume that D = 10–4 cm, then, according to cal�culations (g = 0.65, η = 0.9), the time tpot decreases to5.317 × 10–6 s because as compared with the case ofD = 10–3 cm, the thickness of the polarized highly dis�perse layer drops by nearly one order of magnitude. Onthe other hand, assuming D = 10–2 cm, we obviouslyobtain the value 5.317 × 10⁻² s. Then, as follows fromdata in Table 5, for the galvanostatic process, thecharging current density I can be taken equal to notonly 1 but also 0.1 A/cm2.
Everything mentioned above points to the impor�tance of correct fitting and optimization of seven
major parameters of the system under study, namely,ρ1, ρ2, g, L, I, tgal, tpot.
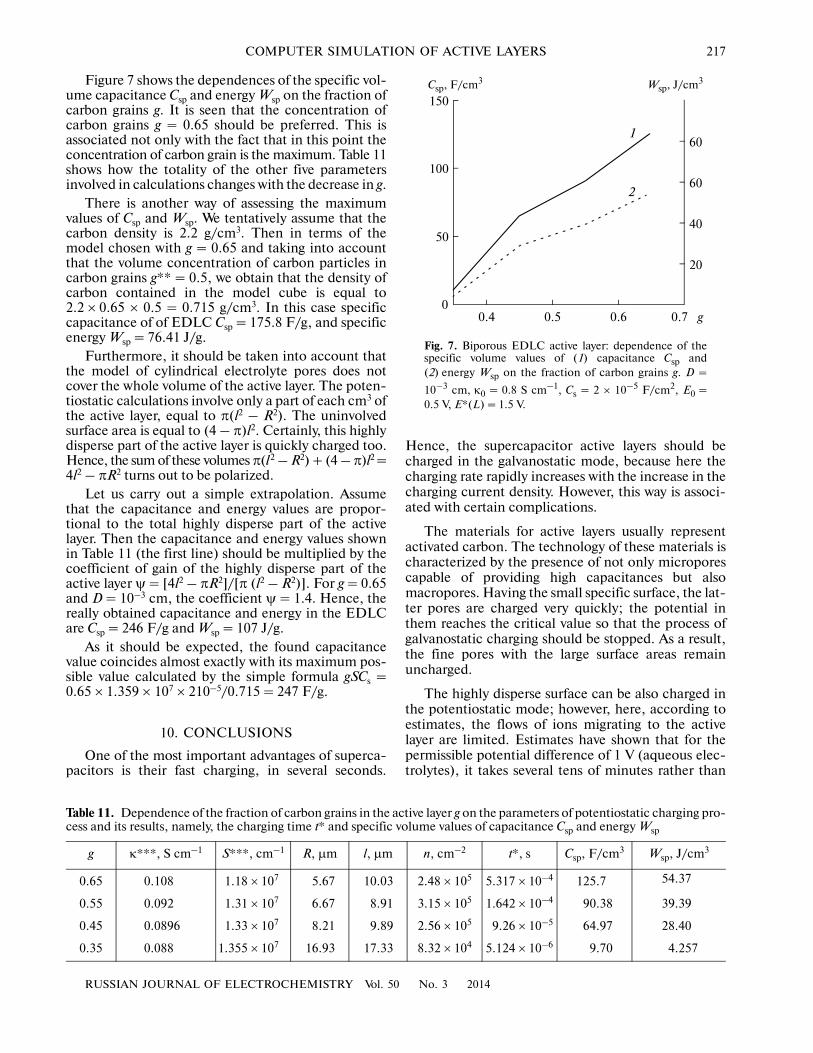
Now we consider how the overall characteristics ofhighly disperse layers (the contribution of coarse poresinto the EDLC surface charging is neglected, beingvery small) increase in time together with virtually theactive layer characteristics. The calculations were car�ried out according to formulas in Appendix 2. Figure 6shows the results (we still assume that g = 0.65, D =10–3 cm, η = 0.9). The ultimate values of capacitanceCsp = 125.7 F/cm3 and energy Wsp = 54.4 J/cm3.
The above calculations were carried out under theassumption that 90% of the maximum possible poten�tial value Е* (parameter η = 0.9) is reached on the sur�face of highly disperse layers with the polar radius r2 = l.Now we consider how the time of potentiostaticcharging and the overall parameters of EDLC changewith the increase in parameter η. Table 10 shows theresults of corresponding calculations. It is seen that theas the charging time increases 3�fold, the capacitanceremains virtually unchanged but the energy somewhatincreases.
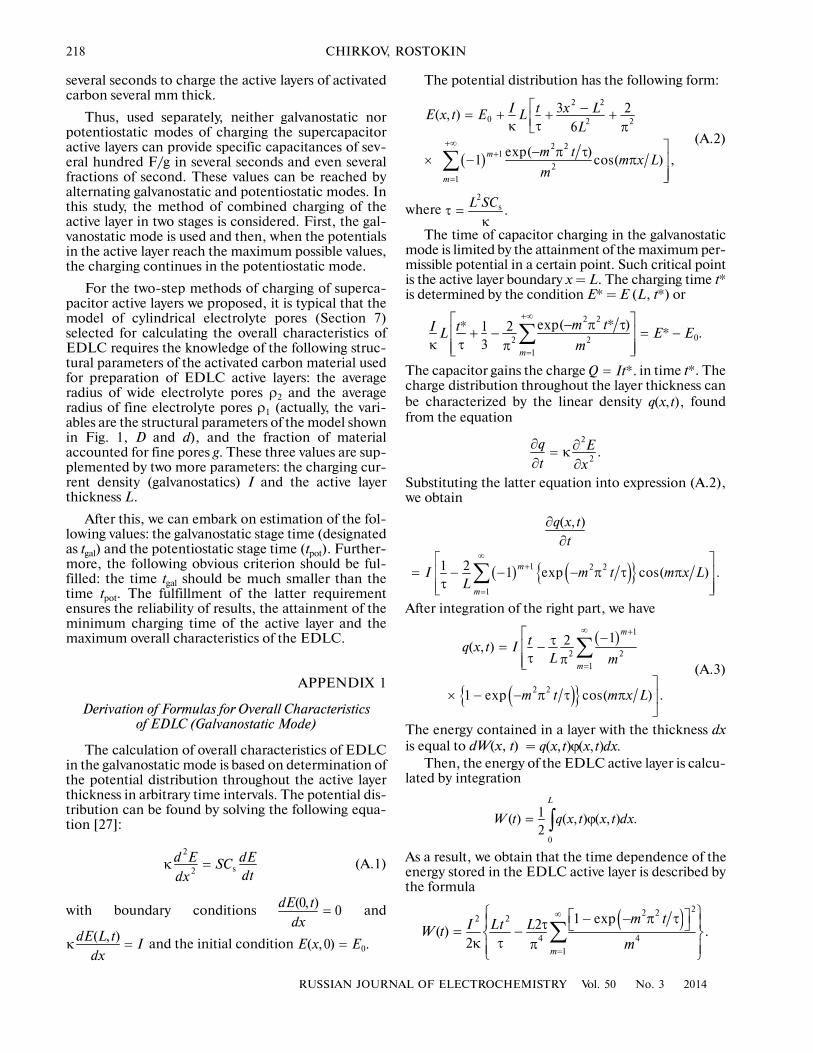
The goal of this study was also to find the optimalvalue of parameter g, i.e., the fraction of carbon grains.It was shown above that the values g > 0.65 cannot betaken because there is no full�fledged electrolyte clus�ter in this region so that the proposed method ofEDLC charging ceases to work. At the same time, howdo the EDLC overall parameters change as wedecrease the parameter g? The answers to this questioncan be found in Fig. 7 and Table 11.
1.5
0.5
0 96
E, V
1
2
r × 104, cm7 8
345
1.0
Fig. 5. Distribution of potential Е throughout the thicknessof the EDLC highly disperse layer at different time t. t (thefractions of the total charging time t* = 5.317 × 10⁻⁴ s areshown): (1) 0.01, (2) 0.05, (3) 0.2, (4) 0.5, (5) 1.0. g = 0.65,D = 10–3 cm, κ0 = 0.8 S cm–1, κ*** = 0.108 S cm–1,
S*** = 1.18 × 107 cm–1, Сs = 2 × 10⁻⁵ F/cm2, r1 = R =
5.67 × 10⁻⁴ cm, r2 = l = 1.003 × 10⁻³ cm, E0 = 0.5 V,Е*(L) = 1.5 V, η = 0.9.
150
100
50
0 642
60
40
20
t × 104, s
Csp, F/cm3 Wsp, J/cm3
1
2
Fig. 6. Biporous EDLC active layer: dependence of spe�cific volume values of (1) capacitance Csp and (2) energy
Wsp on time t, s. g = 0.65, D = 10–3 cm, κ0 = 0.8 S cm–1,
κ*** = 0.108 S cm–1, S*** = 1.18 × 107 cm–1, Сs = 2 ×
10–5 F/cm2, r1 = R = 5.67 × 10⁻⁴ cm, r2 = l = 1.003 ×
10–3 cm, n = 2.48 × 105 cm–2, E0 = 0.5 V, Е*(L) = 1.5 V.
Table 10. Dependence of parameters of the highly disperselayer on the degree of charging η
η t* Csp Wsp
0.9 5.317 × 10⁻⁴ 125.728 54.367
0.99 1.022 × 10⁻³ 125.846 62.042
0.999 1.513 × 10⁻³ 125.847 62.842
RUSSIAN JOURNAL OF ELECTROCHEMISTRY Vol. 50 No. 3 2014
COMPUTER SIMULATION OF ACTIVE LAYERS 217
Figure 7 shows the dependences of the specific vol�ume capacitance Csp and energy Wsp on the fraction ofcarbon grains g. It is seen that the concentration ofcarbon grains g = 0.65 should be preferred. This isassociated not only with the fact that in this point theconcentration of carbon grain is the maximum. Table 11shows how the totality of the other five parametersinvolved in calculations changes with the decrease in g.
There is another way of assessing the maximumvalues of Csp and Wsp. We tentatively assume that thecarbon density is 2.2 g/cm3. Then in terms of themodel chosen with g = 0.65 and taking into accountthat the volume concentration of carbon particles incarbon grains g** = 0.5, we obtain that the density ofcarbon contained in the model cube is equal to2.2 × 0.65 × 0.5 = 0.715 g/cm3. In this case specificcapacitance of of EDLC Csp = 175.8 F/g, and specificenergy Wsp = 76.41 J/g.
Furthermore, it should be taken into account thatthe model of cylindrical electrolyte pores does notcover the whole volume of the active layer. The poten�tiostatic calculations involve only a part of each cm3 ofthe active layer, equal to π(l2 – R2). The uninvolvedsurface area is equal to (4 – π)l2. Certainly, this highlydisperse part of the active layer is quickly charged too.Hence, the sum of these volumes π(l2 – R2) + (4 – π)l2 =4l2 – πR2 turns out to be polarized.
Let us carry out a simple extrapolation. Assumethat the capacitance and energy values are propor�tional to the total highly disperse part of the activelayer. Then the capacitance and energy values shownin Table 11 (the first line) should be multiplied by thecoefficient of gain of the highly disperse part of theactive layer ψ = [4l2 – πR2]/[π (l2 – R2)]. For g = 0.65and D = 10–3 cm, the coefficient ψ = 1.4. Hence, thereally obtained capacitance and energy in the EDLCare Csp = 246 F/g and Wsp = 107 J/g.
As it should be expected, the found capacitancevalue coincides almost exactly with its maximum pos�sible value calculated by the simple formula gSCs =0.65 × 1.359 × 107 × 210–5/0.715 = 247 F/g.
10. CONCLUSIONS
One of the most important advantages of superca�pacitors is their fast charging, in several seconds.
Hence, the supercapacitor active layers should becharged in the galvanostatic mode, because here thecharging rate rapidly increases with the increase in thecharging current density. However, this way is associ�ated with certain complications.
The materials for active layers usually representactivated carbon. The technology of these materials ischaracterized by the presence of not only microporescapable of providing high capacitances but alsomacropores. Having the small specific surface, the lat�ter pores are charged very quickly; the potential inthem reaches the critical value so that the process ofgalvanostatic charging should be stopped. As a result,the fine pores with the large surface areas remainuncharged.
The highly disperse surface can be also charged inthe potentiostatic mode; however, here, according toestimates, the flows of ions migrating to the activelayer are limited. Estimates have shown that for thepermissible potential difference of 1 V (aqueous elec�trolytes), it takes several tens of minutes rather than
150
100
50
00.70.50.4
60
40
20
g
Csp, F/cm3 Wsp, J/cm3
1
2
60
0.6
Fig. 7. Biporous EDLC active layer: dependence of thespecific volume values of (1) capacitance Csp and(2) energy Wsp on the fraction of carbon grains g. D =
10⎯3 cm, κ0 = 0.8 S cm–1, Сs = 2 × 10⁻⁵ F/cm2, E0 =0.5 V, Е*(L) = 1.5 V.
Table 11. Dependence of the fraction of carbon grains in the active layer g on the parameters of potentiostatic charging pro�cess and its results, namely, the charging time t* and specific volume values of capacitance Csp and energy Wsp
g κ***, S cm–1 S***, cm–1 R, μm l, μm n, cm–2 t*, s Csp, F/cm3 Wsp, J/cm3
0.65 0.108 1.18 × 10⁷ 5.67 10.03 2.48 × 10⁵ 5.317 × 10⁻⁴ 125.7 54.37
0.55 0.092 1.31 × 10⁷ 6.67 8.91 3.15 × 10⁵ 1.642 × 10⁻⁴ 90.38 39.39
0.45 0.0896 1.33 × 10⁷ 8.21 9.89 2.56 × 10⁵ 9.26 × 10⁻⁵ 64.97 28.40
0.35 0.088 1.355 × 10⁷ 16.93 17.33 8.32 × 10⁴ 5.124 × 10⁻⁶ 9.70 4.257
218
RUSSIAN JOURNAL OF ELECTROCHEMISTRY Vol. 50 No. 3 2014
CHIRKOV, ROSTOKIN
several seconds to charge the active layers of activatedcarbon several mm thick.
Thus, used separately, neither galvanostatic norpotentiostatic modes of charging the supercapacitoractive layers can provide specific capacitances of sev�eral hundred F/g in several seconds and even severalfractions of second. These values can be reached byalternating galvanostatic and potentiostatic modes. Inthis study, the method of combined charging of theactive layer in two stages is considered. First, the gal�vanostatic mode is used and then, when the potentialsin the active layer reach the maximum possible values,the charging continues in the potentiostatic mode.
For the two�step methods of charging of superca�pacitor active layers we proposed, it is typical that themodel of cylindrical electrolyte pores (Section 7)selected for calculating the overall characteristics ofEDLC requires the knowledge of the following struc�tural parameters of the activated carbon material usedfor preparation of EDLC active layers: the averageradius of wide electrolyte pores ρ2 and the averageradius of fine electrolyte pores ρ1 (actually, the vari�ables are the structural parameters of the model shownin Fig. 1, D and d), and the fraction of materialaccounted for fine pores g. These three values are sup�plemented by two more parameters: the charging cur�rent density (galvanostatics) I and the active layerthickness L.
After this, we can embark on estimation of the fol�lowing values: the galvanostatic stage time (designatedas tgal) and the potentiostatic stage time (tpot). Further�more, the following obvious criterion should be ful�filled: the time tgal should be much smaller than thetime tpot. The fulfillment of the latter requirementensures the reliability of results, the attainment of theminimum charging time of the active layer and themaximum overall characteristics of the EDLC.
APPENDIX 1
Derivation of Formulas for Overall Characteristics of EDLC (Galvanostatic Mode)
The calculation of overall characteristics of EDLCin the galvanostatic mode is based on determination ofthe potential distribution throughout the active layerthickness in arbitrary time intervals. The potential dis�tribution can be found by solving the following equa�tion [27]:
(A.1)
with boundary conditions and
and the initial condition
s
2
2d E dESC
dtdxκ =
(0, )0
dE tdx
=
( , )dE L tI
dxκ = 0( ,0) .E x E=
The potential distribution has the following form:
(A.2)
where
The time of capacitor charging in the galvanostaticmode is limited by the attainment of the maximum per�missible potential in a certain point. Such critical pointis the active layer boundary x = L. The charging time t*is determined by the condition Е* = Е (L, t*) or
The capacitor gains the charge in time t*. Thecharge distribution throughout the layer thickness canbe characterized by the linear density foundfrom the equation
Substituting the latter equation into expression (A.2),we obtain
After integration of the right part, we have
(A.3)
The energy contained in a layer with the thickness dxis equal to dW(x, t) =
Then, the energy of the EDLC active layer is calcu�lated by integration
As a result, we obtain that the time dependence of theenergy stored in the EDLC active layer is described bythe formula
( )
2 2
0 2 2
2 21
2
1
3 2( , )6
exp( )1 cos( ) ,m
m
I t x LE x t E LL
m tm x L
m
+∞
+
=
⎡ −= + + +⎢κ τ π⎣
⎤− π τ× − π ⎥
⎥⎦∑
s2
.L SC
τ =
κ
** *2 2
02 2
1
exp( )1 2 .3
m
m tI tL E Em
+∞
=
⎡ ⎤− π τ+ − = −⎢ ⎥
κ τ π⎢ ⎥⎣ ⎦∑
Q It= *.
( , ),q x t
2
2.
q Et x
∂ ∂= κ
∂ ∂
( ) ( ){ }∞
+
=
∂
∂
⎡ ⎤= − − − π τ π⎢ ⎥
τ⎢ ⎥⎣ ⎦∑
1 2 2
1
( , )
1 2 1 exp cos( ) .m
m
q x tt
I m t m x LL
( )
( ){ }
∞ +
=
⎡ −τ= −⎢τ π⎢⎣
⎤× − − π τ π ⎥
⎦
∑1
2 2
1
2 2
12( , )
1 exp cos( ) .
m
m
tq x t IL m
m t m x L
( , ) ( , ) .q x t x t dxϕ
0
1( ) ( , ) ( , ) .2
L
W t q x t x t dx= ϕ∫
( ) 22 22 2
4 4
1
1 exp2( ) .2
m
m tI Lt LW tm
∞
=
⎧ ⎫⎡ ⎤− − π τ⎪ ⎪τ ⎣ ⎦= −⎨ ⎬κ τ π⎪ ⎪⎩ ⎭
∑
RUSSIAN JOURNAL OF ELECTROCHEMISTRY Vol. 50 No. 3 2014
COMPUTER SIMULATION OF ACTIVE LAYERS 219
The specific volume energy is
(A.4)
The specific volume power is
(A.5)
The capacitance is calculated according to the for�mula
The capacitance at is
APPENDIX 2
Derivation of Formulas for Overall Characteristicsof EDLC (Potentiostatic Mode)
I. The potential distribution near an electrolytepore is found by solving the equation
with boundary conditions
and initial condition E(r, 0) = E0.
( )
sp
22 22 2
2 4 4
1
( )
1 exp2 .2
m
W tW
L
m tI tm
∞
=
=
⎧ ⎫⎡ ⎤− − π τ⎪ ⎪τ ⎣ ⎦= −⎨ ⎬κ τ π⎪ ⎪⎩ ⎭
∑
( ) ( )∞
=
⎧⎪ τ= = +⎨τ π τ⎪⎩
⎡ ⎤ ⎫− − π τ ⎪⎣ ⎦× − π τ ⎬⎪⎭
∑
sp
2
2
2 2
2 2
2
1
2( )
1 expexp .
m
dW I tP tdt k
m tm t
m
( )2 2
22 22
4 4
1
( )( ) ,
2 ( ) 1 exp2
m
Q t tC tW t m ttL
m
∞
=
κ= =⎧ ⎫⎡ ⎤− − π τ⎪ ⎪τ ⎣ ⎦−⎨ ⎬τ π⎪ ⎪⎩ ⎭
∑
( )sp
2
22 22
2
4 4
1
( )( ) .
1 exp2
m
C t tC tL m ttL
m
∞
=
κ= =⎧ ⎫⎡ ⎤− − π τ⎪ ⎪τ ⎣ ⎦−⎨ ⎬τ π⎪ ⎪⎩ ⎭
∑
t → ∞
s
sp s
2
2
2 2 22
( ) .
L SCtC t SCt L LL
κκ κτ κ→ = = =⎧ ⎫⎨ ⎬τ⎩ ⎭
s
2
2
1 2 2
( , ) ( , ) ( , )1 ,
, 0 ,
E r t E r t E r tSC
r r tr
r r r t r l
⎧ ⎫∂ ∂ ∂κ + =⎨ ⎬
∂ ∂∂⎩ ⎭< < < < +∞ =
*1 2( , ) , ( , ) 0EE r t E r tr
∂= =
∂
This solution has the form
(B.2)
where J(r) and N(r) are the Bessel function of the 1stand 2nd orders, respectively [28, 29],
and µm are positive roots of the following equation:
(B.3)
Actually, the process of potentiostatic chargingshould be carried out not in the infinite time when thepotential becomes constant throughout the thicknessof the highly disperse layer between two cylindricalsurfaces but in the finite time t* corresponding to themoment when the potential on the back cylindricalsurface (r = r2) reaches a value Е(r2, t*) = ηE* (whereparameter η is confined in interval ) lowerthan Е* albeit quite acceptable.
The dependence of the real charging time t* onparameter η can be found by solving the followingequation:
(B.4)
II. The charge accumulated in supercapacitormicropores.
Charges enter the micropores through the walls ofa macropore. The current that flows though walls ofan individual cylindrical macropore (with the radiusr1 = R) is
( )
[ ]
∞
=
−μ τ
= + −
⎛ ⎞μ μ⎜ ⎟⎝ ⎠× π
⎡ ⎛ ⎞⎤μ − μ⎜ ⎟⎢ ⎥⎣ ⎝ ⎠⎦⎧ ⎛ ⎞ ⎛ ⎞⎫× μ μ − μ μ⎨ ⎬⎜ ⎟ ⎜ ⎟⎩ ⎝ ⎠ ⎝ ⎠⎭
∑
* *
2
0
11 0
22
21 10 1
2
1 0 1 02 2
( , )
( )
( )
( ) ( ) ,m
m m
mm m
tm m m m
E r t E E E
rJ J
r
rJ J
r
r re J N N Jr r
s2
2 ,SC r
τ =
κ
1 10 1 0 1
2 2
( ) ( ) 0.m m m mr r
J N N Jr r
⎛ ⎞ ⎛ ⎞μ μ − μ μ =⎜ ⎟ ⎜ ⎟⎝ ⎠ ⎝ ⎠
0.9 1≤ η ≤
( )
[ ]
∞
−μ τ
=
η = − −
⎛ ⎞μ μ⎜ ⎟⎝ ⎠×
μ⎡ ⎛ ⎞⎤μ − μ⎜ ⎟⎢ ⎥⎣ ⎝ ⎠⎦
∑
* * *
2
0
11 0
*22
21 10 1
2
( )2 .
( )
m
m mt
mmm m
E E E E
rJ J
re
rJ J
r
( )*
1
2
1 1
21
1 0 2121 1
0 12
( ) 2
( ) 22 .
( )
m
r r
tm
mm m
EI t r Lr
Jr E E e
rrJ J
r
=
∞
−μ τ
=
⎛ ⎞∂= π −κ⎜ ⎟∂⎝ ⎠
μ= π κ −⎛ ⎞μ − μ⎜ ⎟⎝ ⎠
∑
220
RUSSIAN JOURNAL OF ELECTROCHEMISTRY Vol. 50 No. 3 2014
CHIRKOV, ROSTOKIN
The total current that flows from all (n) macroporesinto the carbon medium (through the surface of cylin�ders of the unit length L = 1) is
(B.5)
Assume that charging of a supercapacitor proceedsin time t* up to the moment where the potential at r = r2
turns out to be where In time t ≤ t*, the following charge is accumulated
on the supercapacitor:
(B.6)
III. The energy of a supercapacitor is calculated bythe formula
where q(r, t) is the charge density. The charge densityis proportional to the specific capacitance and the
potential in the point under consideration. Thedependence of the charge density on coordinates andtime is
where
Taking into account equality (B.5), we rewrite theexpression for energy as follows:
As a result of integration with due regard to the orthog�onality of the eigenfunctions Rm(r) in the segment
, we obtain
(B.7)
IV. Specific capacitance due to diffusion of ions into carbon grains
(B.8)
LIST OF PARAMETERS CHARACTERIZING THE ACTIVE LAYER OF A BIPOROUS
CARBON EDLC
Parameters of Carbon Grains and Electrolyte Grains
D is the length of edges of cubic grains (carbon andelectrolyte) in the active layer
d = 1 nm is the length of edges of cubic carbon par�ticles in carbon grains
S = S*/d = 1.359 × 107 cm–1 is the specific surfaceof carbon particles in carbon grains
g** = 0.5 is the volume concentration of carbonparticles in carbon grains
Cs = 2 × 10⁻⁵ F/cm2 is the specific capacitance ofthe electric double layer on the carbon material
Parameters of the Active Layer
Ns = 100 is the number of grains on model cubeedges (the model cube volume is 106, i.e., one millionof grains of two types)
L (cm) is the active layer thicknessx is the coordinate in the active�layer (0 ≤ x ≤ L)х* = х/L is the normalized coordinate in the active
layer (0 ≤ х* ≤ 1)Е (x, t) (V) is the potential in the active layer
( )*
2
1 0
21
221 1
0 12
( ) 4
( ).
( )
mtm
mm m
I t nI n E E
Je
rJ J
r
∞
−μ τ
=
= = πκ −
μ×⎛ ⎞μ − μ⎜ ⎟⎝ ⎠
∑
2( , ) ,E r t E= η* * 0.9 1.≤ η ≤
( )
∞−μ τ
=
= = π −
μ −×
μ − μ μ
∫
∑
s *
2
22 0
0
21
2 2 20 1 2 11
( ) ( ) 4
( ) 1 .( ) ( )
m
t
tm
m m mm
Q t I t dt n r SC E E
J eJ r r J
( )2
1
01( ) ( , ) ( , ) 2 ,2
r
r
W t q r t E r t E rdr= − π∫
∞
=
= − = −
⎧ ⎫⎪ ⎪× − π −μ τ⎨ ⎬⎪ ⎪⎩ ⎭
∑
s s *0 0
2
1
( , ) ( ( , ) ) ( )
1 ( )exp( ) ,m m m
m
q r t SC E r t E SC E E
B R r t
[ ]
1 0 1 02 2
11 0
22
210 1
2
( ) ( ) ( ) ,
( )
.
( )
m mm m m
mm
m
mm
r rR r J N N J
r r
rJ J
rB
rJ J
r
⎧ ⎛ ⎞ ⎛ ⎞⎫μ μ= μ − μ⎨ ⎬⎜ ⎟ ⎜ ⎟⎩ ⎝ ⎠ ⎝ ⎠⎭
⎛ ⎞μμ ⎜ ⎟⎝ ⎠=
⎡ ⎛ ⎞⎤μ − μ⎜ ⎟⎢ ⎥⎣ ⎝ ⎠⎦
( )∞
=
−=
⎧ ⎫⎪ ⎪⎡ ⎤× − π − −μ τ π⎨ ⎬⎣ ⎦⎪ ⎪⎩ ⎭
∑∫
s *
2
1
20
2
2
1
( )( )
2
1 ( ) 1 exp 2 .
r
m m m
mr
SC E EW t
B R r t rdr
1 2r r r≤ ≤
[ ]
[ ] [ ]s*
2 2 22 22 12 1
0 2 2 2 22 0 1 2 11
( ) exp( 2 ) 2 exp( ) 1( ) ( ) 1 4 .2 ( ) ( )
m m m
mm mm
J t tr rW t n E E SC
r J r r J
∞
=
⎫μ − μ τ − −μ τ⎧ ⎪= π − − +⎨ ⎬
μμ − μ⎩ ⎪⎭∑
( )[ ]
[ ] [ ]
∞
=
∞
=
⎡ ⎤− −μ τμπ ⎢ ⎥μμ − μ⎢ ⎥⎣ ⎦= =
⎧ ⎫μ⎪ ⎪− μ τ − −μ τ− +⎨ ⎬
μμ − μ⎪ ⎪⎩ ⎭
∑
∑
s
sp
222
2 12 22 22
0 1 2 11
2 2 2211
2 2 2 22 0 1 2 11
1 exp( )( )4
( ) ( )( ).
2 ( ) ( ) exp( 2 ) 2 exp( )1 4
( ) ( )
mm
mm mm
m m m
mm mm
tJn r SC
J r r JQ tC
W t J t tr
r J r r J
RUSSIAN JOURNAL OF ELECTROCHEMISTRY Vol. 50 No. 3 2014
COMPUTER SIMULATION OF ACTIVE LAYERS 221
Е (x, t = 0) = Е0 (V) is the initial potential of theactive layer
Е* (V) is the maximum possible potential in theactive layer
t is the charging timet* = t/τ is the normalized charging timeа =SCs = 272 F/cm3 is the characteristic specific
capacitance of carbon grainsρ2 is the average radius of wide pores in the active
layerρ1 is the average radius of fine pores in the active
layerCsp (F/cm3) is the specific volume capacitance of
the active layerWsp (J/cm3) is the specific volume energy of the
active layer
Characteristics of the Aqueous Electrolyte Conductivity
κ0 = 0.8 S cm–1 (30% H2SO4 + water) [30] is thespecific conductivity of ions in electrolyte
κ** is the normalized effective specific conductiv�ity of ions in the active layer
κ = κ0κ** (S cm–1) is the effective specific conduc�tivity of ions in the active layer
κ*** (S cm–1) is the effective ionic conductivity ofthe highly disperse layer
Parameters of Percolation Clusters
g is the volume concentration (fraction) of carbongrains in the active layer
g* is the ratio of grains within an electronic clusterg – g* is the ratio of grains uninvolved in the elec�
tronic clustergi is volume concentration (fraction) of electrolyte
grains in the active layer
is the ratio of grains involved in the ionic cluster
gi – is the ratio of grains uninvolved in the ioniccluster
= + (g – g*) is the concentration of grainscharacterizing the effective ionic cluster
α = g*/[g* + (gi – )] is the degree of dilution ofcarbon grains in the highly disperse layer
g*** = 0.298 is the percolation threshold for theelectronic cluster
= 0.298 is the percolation threshold for theionic cluster
S* = S/D is the normalized specific surface of thecontact between electronic and ionic clusters
S**= S/D (cm–1) is the specific surface of the con�tact between electronic and ionic clusters
gi*
gi*
gi** gi*
gi*
gi***
Parameters of Galvanostatic Charging
I (A/cm2) is the charging current densitytgal is the time of galvanostatic processτ = SCsL
2/κ is the characteristic charging timeC (F/cm2) is the specific capacitance of the active
layerС/L (F/cm3) is the specific volume capacitance of
the active layerW (J/cm2) is the specific energy of the active layerW/L (J/cm3) is the specific volume energy of the
active layer
Parameters of the Model of Cylindrical Electrolyte Pores
R is the radius of cylindrical poresn is the number of cylindrical electrolyte pores per
cm2 of the active layer surfacel is the half�distance between neighboring cylindri�
cal pores
Parameters of the Potentiostatic Charging Mode
tpot is the time of potentiostatic processr1 = R is the polar radius of the front surface of the
highly disperse layerr2 = l is the polar radius of the back surface of the
highly disperse layerS*** (cm–1) is the specific surface of carbon in the
highly disperse layerη is the degree of charging of the highly disperse
layerψ = [4l2 – πR2]/[π (l2 – R2)] is the coefficient of
gain of the highly disperse part of the active layer
REFERENCES
1. Conway, B.E., J. Electrochem. Soc., 1991, vol. 138,p. 1539.
2. Vol’fkovich, Yu.M. and Serdyuk, T.M., Russ. J. Electro�chem., 2002, vol. 38, p. 935.
3. Pillay, B. and Newman, J., J. Electrochem. Soc., 1996,vol. 143, p. 1806.
4. Lin, C., Ritter, J.A., Popov, B.N., and White, R.E.,J. Electrochem. Soc., 1999, vol. 146, p. 3168.
5. Vol’fkovich, Yu.M., Mazin, V.M., and Urisson, N.A.,Russ. J. Electrochem., 1998, vol. 34, p. 740.
6. Fialkov, A.S., Russ. J. Electrochem., 2000, vol. 36,p. 345.
7. New Carbon Based Materials for Electrochemical EnergyStorage Systems: Batteries, Supercapacitors and FuelCells, Barsukov, I.V., Johnson, C.S., Doninger, J.E.,and Barsukov, V.Z., Eds., Dordrecht: Springer, 2006.
8. Rychagov, A.Yu., Extended Abstract of Cand. Sci.(Chem.) Dissertation, Moscow, 2008.
9. Simon, P. and Gogotsi, Y., Phil. Trans. R. Soc. A, 2010,vol. 368, p. 3457.
222
RUSSIAN JOURNAL OF ELECTROCHEMISTRY Vol. 50 No. 3 2014
CHIRKOV, ROSTOKIN
10. Sing, K.S.W., Everett, D.H., Haul, R.A.W., Moscou, L.,Pierotti, R.A., Rouquerol, J., and Siemieniewska, T.,Pure Appl. Chem., 1985, vol. 57, p. 603.
11. Frackowiak, E. and Beguin, F., Carbon, 2001, vol. 39,p. 937.
12. Halper, M.S. and Ellenbogen, J.C., in MITRE Nano�systems Group 1 (March), 2006, p. 1.
13. Pandolfo, A.G. and Holltenkamp, A.F., J. PowerSources, 2006, vol. 157, p. 11.
14. Wang, G., Zhang, L., and Zhang, J., Chem. Soc. Rev.,2012, vol. 41, p. 797.
15. de Levie, R., Electrochim. Acta, 1963, vol. 8, p. 751.16. de Levie, R., Electrochim. Acta, 1964, vol. 9, p. 1231.17. Posey, F.A. and Morozumi, T., J. Electrochem. Soc.,
1966, vol. 113, p. 176.18. Chizmadzhev, Yu.A., Markin, V.S., Tarasevich, M.R.,
and Chirkov, Yu.G., Makrokinetika protsessov vporistykh sredakh (Toplivnye elementy) (Macrokineticsof Processes in Porous Media (Fuel Cells)), Moscow,1971.
19. Fenelonov, V.B., Poristyi uglerod (Porous Carbon),Novosibirsk, 1995.
20. Karnaukhov, A.P., Adsorbtsiya. Tekstura dispersnykh iporistykh materialov (Adsorption. Texture of Disperseand Porous Materials), Novosibirsk, 1999.
21. Chirkov, Yu.G. and Rostokin, V.I., Russ. J. Electro�chem., 2014, vol. 50.
22. Chirkov, Yu.G. and Rostokin, V.I., Russ. J. Electro�chem., 2003, vol. 39, p. 622.
23. Tarasevich, Yu.Yu., Perkolyatsiya: teoriya, prilozheniya,algoritmy (Percolation: Theory, Applications, Algo�rithms), Moscow: Editorial URSS, 2001.
24. Chirkov, Yu.G., Russ. J. Electrochem., 1999, vol. 35,p. 1281.
25. Chirkov, Yu.G., Rostokin, V.I., and Skundin, A.M.,Russ. J. Electrochem., 2011, vol. 47, p. 71.
26. Chirkov, Yu.G. and Rostokin, V.I., Russ. J. Electro�chem., 2006, vol. 42, p. 715.
27. Daniel’�Bek, V.S., Zh. Fiz. Khim., 1948, vol. 22, p. 697.28. Tikhonov, A.N. and Samarskii, A.A., Uravneniya
matematicheskoi fiziki (Equations of MathematicalPhysics), Moscow: MGU, Nauka, 2004.
29. Goryunov, A.F., Uravneniya matematicheskoi fiziki vprimerakh i zadachakh (Equations of MathematicalPhysics in Examples and Problems), Moscow: MIFI,2008.
30. Darling, H.E., J. Chem. Eng. Data, 1964, vol. 9, p. 421.
Translated by T. Safonova