Embed Size (px)
Citation preview

Review
Compositional MRI techniques for evaluation of cartilage degenerationin osteoarthritis
A. Guermazi y z *, H. Alizai x k, M.D. Crema y z ¶, S. Trattnig #, R.R. Regatte k,F.W. Roemer y z yy
y Department of Radiology, Boston University School of Medicine, Boston, MA, USA
z Department of Research, Aspetar Orthopaedic and Sports Medicine Hospital, Doha, Qatar
x Department of Radiology, University of Texas Health Science Center at San Antonio, San Antonio, TX, USA
k Department of Radiology, New York University Langone Medical Center, New York, NY, USA
¶ Department of Radiology, Hospital do Coraç~ao and Teleimagem, S~ao Paulo, Brazil
# Department of Biomedical Imaging and Image Guided Therapy, Medical University of Vienna, Vienna, Austria
yy Department of Radiology, University of Erlangen, Erlangen, Germany
a r t i c l e i n f o
Article history:
Received 11 November 2014
Accepted 25 May 2015
Keywords:
Cartilage
Compositional imaging
MRI
Osteoarthritis
s u m m a r y
Osteoarthritis (OA), a leading cause of disability, affects 27 million people in the United States and its
prevalence is rising along with the rise in obesity. So far, biomechanical or behavioral interventions as
well as attempts to develop disease-modifying OA drugs have been unsuccessful. This may be partly due
to antiquated imaging outcome measures such as radiography, which are still endorsed by regulatory
agencies such as the United States Food and Drug Administration (FDA) for use in clinical trials.
Morphological magnetic resonance imaging (MRI) allows unparalleled multi-feature assessment of the
OA joint. Furthermore, advanced MRI techniques also enable evaluation of the biochemical or ultra-
structural composition of articular cartilage relevant to OA research. These compositional MRI techniques
have the potential to supplement clinical MRI sequences in identifying cartilage degeneration at an
earlier stage than is possible today using morphologic sequences only. The purpose of this narrative
review is to describe compositional MRI techniques for cartilage evaluation, which include T2 mapping,
T2* Mapping, T1 rho, dGEMRIC, gagCEST, sodium imaging and diffusion weighted imaging (DWI). We
also reviewed relevant clinical studies that have utilized these techniques for the study of OA. The
different techniques are complementary. Some focus on isotropy or the collagen network (e.g., T2
mapping) and others are more specific in regard to tissue composition, e.g., gagCEST or dGEMRIC that
convey information on the GAG concentration. The application and feasibility of these techniques is also
discussed, as they will play an important role in implementation in larger clinical trials and eventually
clinical practice.
© 2015 Osteoarthritis Research Society International. Published by Elsevier Ltd. All rights reserved.
Introduction
Osteoarthritis (OA) is one of the most prevalent musculoskeletal
conditions, affecting up to 27 million people in the United States
with a further increase in prevalence to be expected in the future
due to an aging population and the obesity pandemic1,2. One of the
hallmark features of OA from a structural perspective is cartilage
degradation, which has a progressive, irreversible course and is
closely interrelated with pathology of other joint tissues, including
the subchondral bone, meniscus, synovium and others3.
The structural diagnosis of OA is based on the presence of a
definite osteophyte on an anterior-posterior radiograph. Joint space
narrowing (JSN) is considered to be a surrogate for cartilage loss
although it is well established that meniscal damage and particu-
larly extrusion contribute to JSN4,5. Although radiography is not
sensitive to progression of cartilage loss, JSN on radiographs is
recommended by regulatory agencies including the United States
* Address correspondence and reprint requests to: A. Guermazi, Quantitative
Imaging Center (QIC), Boston University School of Medicine, Section Chief,
Musculoskeletal Imaging, Boston Medical Center, 820 Harrison Avenue, FGH
Building, 3rd Floor, Boston, MA 02118, USA. Tel: 1-617-414-3893; Fax: 1-617-638-
6616.
E-mail address: [email protected] (A. Guermazi).
http://dx.doi.org/10.1016/j.joca.2015.05.026
1063-4584/© 2015 Osteoarthritis Research Society International. Published by Elsevier Ltd. All rights reserved.
Osteoarthritis and Cartilage xxx (2015) 1e15
Please cite this article in press as: Guermazi A, et al., Compositional MRI techniques for evaluation of cartilage degeneration in osteoarthritis,Osteoarthritis and Cartilage (2015), http://dx.doi.org/10.1016/j.joca.2015.05.026
Food and Drug Administration (FDA) as the primary imaging
endpoint to establish the effectiveness of disease-modifying OA
drugs3,6e8.
Magnetic resonance imaging (MRI) allows direct visualization of
all tissues involved in the OA disease process including articular
cartilage. In addition to qualitative or quantitative morphologic
assessment, MRI-based techniques have been developed that allow
characterization and quantification of the biochemical composition
of cartilage. These include relaxometry measurements (T2, T2*,
T1rho mapping and T1), sodium imaging, delayed gadolinium-
enhanced MRI of cartilage (dGEMRIC), glycosaminoglycan specific
chemical exchange saturation transfer (gagCEST), diffusion
weighted imaging (DWI), and diffusion tensor imaging (DTI). These
compositional MRI techniques may have the potential to serve as
quantitative, reproducible, non-invasive and objective endpoints
for OA research, particularly in early and pre-radiographic stages of
the disease.
The purpose of this review article is to describe the currently
available MRI-based compositional cartilage imaging techniques,
and to provide an update on the application of these techniques in
OA research. This study is a non-systematic, narrative review based
on a comprehensive literature search in PubMed and Medline,
completed in May 2014, using the search terms “osteoarthritis” and
“magnetic resonance imaging” (or MRI). This search strategy yiel-
ded 3027 results. Additional keywords including “compositional
MRI”, “T2”, “T2*”, “T1rho”, “T1”, “sodium imaging”, “gagCEST”,
“dGEMRIC”, “DWI” and “DTI”, were used to narrow the search. The
authors screened the resulting abstracts and finally 91 articles
published in English were included for this review.
Basic principles of compositional MRI techniques and
application of compositional MRI techniques in OA research
Articular cartilage is responsible for resistance to compressive
forces, distribution of load, and together with synovial fluid,
frictionless movement of the articular joint components9. It
consists of approximately 70e80% fluid and 20e30% solid extra-
cellular matrix (ECM) with a sparse distribution (about 2%) of
chondrocytes10. Chondrocytes are presumed to be responsible for
any homeostatic and repair processes that modulate the
composition of the fluid-like macromolecular network of carti-
lage11. The ECM is made up of a network of collagen fibrils and
proteoglycan molecules. Collagen, a fibrillar macromolecule, is by
far the most abundant macromolecule, accounting for about 20%
of cartilage volume by weight11. Physiologically, the collagen
network is highly organized and serves as the tissue's structural
framework and its principal source of tensile and shear
strength11. Although the collagen network becomes disrupted in
OA and there is a net loss in total collagen content, its concen-
tration is not appreciably affected in disease states12e14. A pro-
teoglycan unit includes a protein core and covalently attached
glycosaminoglycans (GAGs)9. The negatively charged GAGs
contribute to the majority of the fixed charge density in the ECM
and are neutralized by mobile cations, usually sodium (23Na)
being the most abundant physiologically9.
Initial histological and biochemical changes of cartilage degen-
eration involve disruption of the collagen network, decrease in
proteoglycan content and increase in permeability to water15.
Compositional MRI techniques enable detection of these
biochemical changes in the cartilage ECM before morphological
change occurs16. Because of well-documented importance of
collagen and GAG to the functional and structural integrity of
cartilage, efforts toward developing MRI techniques to interrogate
cartilage macromolecules have focused on collagen and GAG11.
Spinespin relaxation (T2) mapping
T2 relaxation time is the rate constant of proton dephasing in
the transverse plane after a radio frequency (RF) pulse. Articular
cartilage T2 reflects the water content, collagen content and
collagen fiber orientation in the ECM, with longer T2 values
thought to represent cartilage degeneration17e22. Multi-echo, spin-
echo, and fast spin echo -based sequences are most often used for
T2 relaxation time measurements. Calculation of T2 relaxation
values from cartilage regions of interest is usually performed by
mono exponential curve fitting of the signal intensity of each echo-
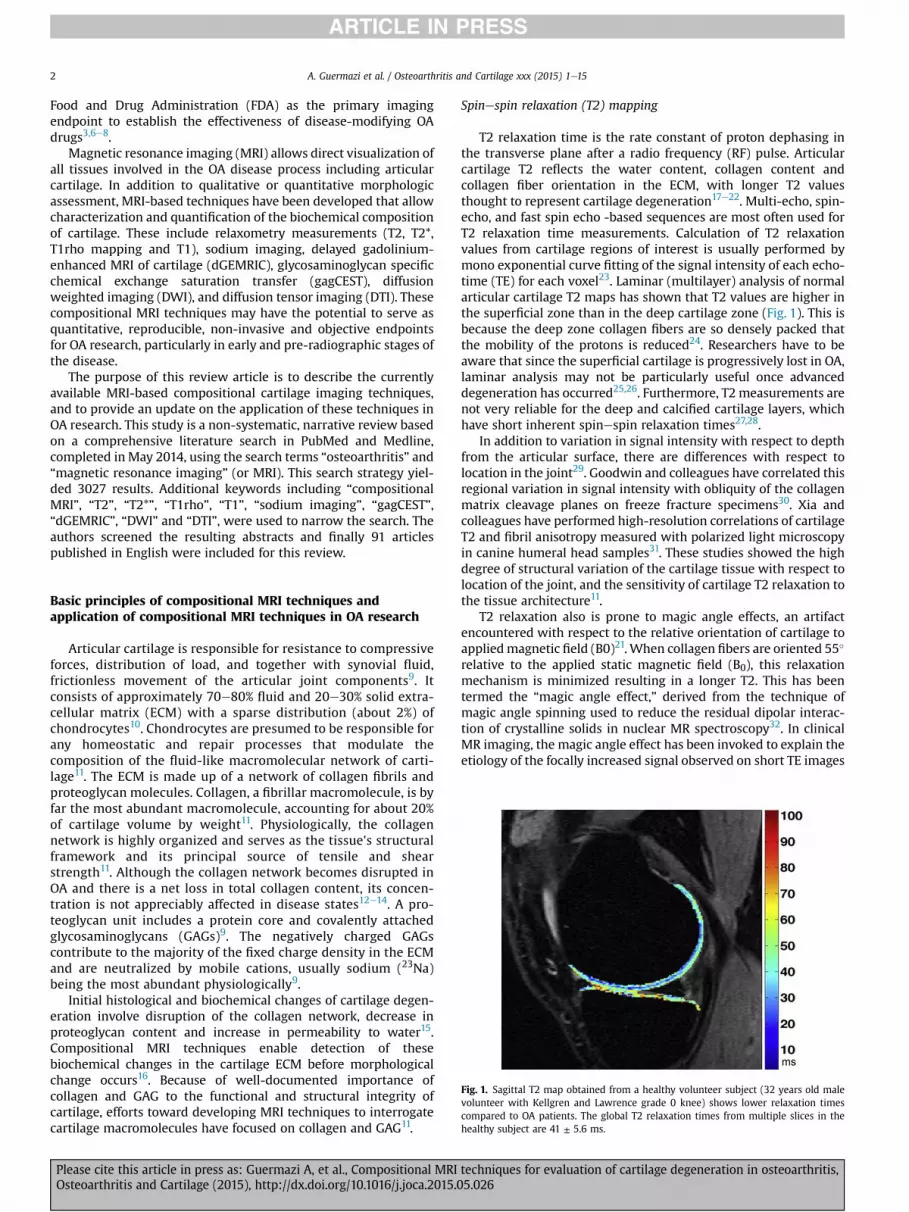
time (TE) for each voxel23. Laminar (multilayer) analysis of normal
articular cartilage T2 maps has shown that T2 values are higher in
the superficial zone than in the deep cartilage zone (Fig. 1). This is
because the deep zone collagen fibers are so densely packed that
the mobility of the protons is reduced24. Researchers have to be
aware that since the superficial cartilage is progressively lost in OA,
laminar analysis may not be particularly useful once advanced
degeneration has occurred25,26. Furthermore, T2 measurements are
not very reliable for the deep and calcified cartilage layers, which
have short inherent spinespin relaxation times27,28.
In addition to variation in signal intensity with respect to depth
from the articular surface, there are differences with respect to
location in the joint29. Goodwin and colleagues have correlated this
regional variation in signal intensity with obliquity of the collagen
matrix cleavage planes on freeze fracture specimens30. Xia and
colleagues have performed high-resolution correlations of cartilage
T2 and fibril anisotropy measured with polarized light microscopy
in canine humeral head samples31. These studies showed the high
degree of structural variation of the cartilage tissue with respect to
location of the joint, and the sensitivity of cartilage T2 relaxation to
the tissue architecture11.
T2 relaxation also is prone to magic angle effects, an artifact
encountered with respect to the relative orientation of cartilage to
appliedmagnetic field (B0)21. When collagen fibers are oriented 55�
relative to the applied static magnetic field (B0), this relaxation
mechanism is minimized resulting in a longer T2. This has been
termed the “magic angle effect,” derived from the technique of
magic angle spinning used to reduce the residual dipolar interac-
tion of crystalline solids in nuclear MR spectroscopy32. In clinical
MR imaging, the magic angle effect has been invoked to explain the
etiology of the focally increased signal observed on short TE images
Fig. 1. Sagittal T2 map obtained from a healthy volunteer subject (32 years old male
volunteer with Kellgren and Lawrence grade 0 knee) shows lower relaxation times
compared to OA patients. The global T2 relaxation times from multiple slices in the
healthy subject are 41 ± 5.6 ms.
A. Guermazi et al. / Osteoarthritis and Cartilage xxx (2015) 1e152
Please cite this article in press as: Guermazi A, et al., Compositional MRI techniques for evaluation of cartilage degeneration in osteoarthritis,Osteoarthritis and Cartilage (2015), http://dx.doi.org/10.1016/j.joca.2015.05.026

of cartilage with curved articular surfaces, such as the femoral
condyle33 and talar dome34. Because increased T2 is associated
with cartilage damage, artifact from the magic angle effect is a
potential source of diagnostic error21.
The T2 mapping pulse sequence is available on most of the
vendor platforms, which means it could be widely applicable.
Reproducibility35 and validity of T2 quantification17,18 have been
well documented.
Numerous clinical studies have used T2 mapping of cartilage
demonstrating its ability to show evidence of cartilage degener-
ation even in morphologically normal knees on conventional MRI
as well as in OA-affected cartilage (i.e., with radiographic JSN)18,
but studies to evaluate the association of cartilage T2 measure-
ments with symptoms are sparse. One study assessed cartilage T2
values in a matched cohort with and without knee pain; it found
elevated T2 values in subjects with knee pain36. Another study
involving persons with and without radiographic knee OA showed
positive correlation with higher T2 values in the medial
compartment cartilage and higher degree of knee pain18. On the
other hand the association of T2 values with risk factors for OA
including age, gender, obesity, and malalignment has been
extensively studied. Mosher et al. demonstrated an association of
elevated T2 values in superficial cartilage layers with age, sug-
gesting that initial degenerative changes may occur at the articular
surface with aging37. A study comparing differences in T2 values
between healthy men and women found no differences between
genders38. A study of 267 subjects from the Osteoarthritis Initia-
tive found higher knee cartilage T2 values in obese subjects
compared to those with normal weight39. Serebrakian and col-
leagues found a decrease in body mass index of 10% or more to be
associated with slower progression of cartilage T2 values over
4 years in the knees of subjects with risk factors for OA40. While
commonly increased T2 values are associated with cartilage
degeneration, a study reporting no significant change in T2 values
with cartilage degeneration relative to normal cartilage does exist
in the literature41.
Longitudinal studies of the effect of knee malalignment on
cartilage T2 values are lacking. One cross-sectional study, how-
ever, compared the knees of 12 subjects with varus and 12 with
valgus malalignment, and found an association of increased
cartilage T2 with varus malalignment in the medial compart-
ment42. The association of physical activity with cartilage degen-
eration remains controversial and only a few studies have assessed
the relationship using T2 mapping. Acute loading of the knee after
physical exercise results in decreased T2 values in the weight
bearing femur and tibia, likely secondary to water mobility43,44.
Studies examining long-term effects of physical activity have
found higher levels of exercise to be associated with higher
cartilage T2 values45,46. In a longitudinal study that assessed ac-
tivity based on a physical activity scale for the elderly (PASE),
increased cartilage T2 value progression was seen in those with
high levels of physical activity as well as those with very low
physical activity levels. This suggests that sedentary lifestyle and
high-loading both effect cartilage integrity47. Using arthroscopy as
the reference, one recent study suggested that the addition of a T2
mapping sequence to a routine MRI protocol at 3.0 T improved
sensitivity in the detection of cartilage lesions within the knee
joint with only a small reduction in specificity48. A long-term
follow-up study, up to maximum of 11 years, by Potter and col-
leagues showed patients with acute traumatic anterior cruciate
ligament disruption sustained a chondral injury at the time of
initial impact with subsequent longitudinal chondral degradation
in compartments unaffected by the initial “bone bruise”, a process
that is accelerated at 5e7 years' follow-up49.
T2* mapping
Compared with other biochemically sensitive MRI techniques,
T2* mapping has unique features including speed of imaging, high
image resolution, and the ability to carry out isotropic three-
dimensional (3D) cartilage evaluation. It is also easy to imple-
ment on clinical MRI systems, as pulse sequences and inline pro-
cessing software for generating quantitative T2* maps are
available commercially. In addition, there is no need for contrast
media administration or special hardware50. Reproducibility
studies for T2* have demonstrated good inter- and intra-observer
reproducibility51e53.
T2* relaxation is unique for gradient echo (GRE) imaging
because it requires a de-phasing effect that is eliminated in spin-
echo MRI. GRE sequences are more time-efficient than spin-echo
sequences, but are also more prone to local field inhomogeneities
and susceptibility54. In common with T2 mapping, T2* mapping
enables assessment of water content, collagen fiber network, and
zonal variation reflecting biochemical composition of cartilage. As
for T2 measurements, a decrease in T2* is noted toward the deep
cartilage zones in normal cartilage and the T2* values are higher in
diseased cartilage55e58. Despite these similarities, there are signif-
icant differences between the two imaging modalities that have led
to diverging T2 and T2* values in various grades of cartilage
degeneration52,56,59. T2 mapping spin-echo sequences utilize echo
times of ~ 10e100ms. Therefore, T2mapping techniques capture T2
relaxation, which to a large extent is related to bulk water, while
they are rather insensitive to T2 signals that decay more rapidly (T2
relaxation < 10 ms)60,61. T2* mapping, in contrast, includes shorter
echo times and as such reflects a wider range of T2 relaxation
occurring in cartilage tissue. Notably, because of the absent 180�
refocusing pulse, T2* relaxation is less sensitive to stimulated
echoes and magnetization transfer62,63.
Ultrashort echo-time enhanced T2* (UTE-T2*) mapping of
cartilage is a new technique with the potential to visualize deep
cartilage characteristics better than standard T2 mapping64. Pre-
vious spectroscopic approaches to measuring cartilage UTE-T2*
have determined that UTE-T2* values in deep tissue are short,
perhaps as short as 1 ms in calcified cartilage, and increase toward
the articular surface65,66. UTE-T2* mapping of human articular
cartilage explants has been shown to be more robust in deep
cartilage than the standard T2 mapping, and UTE-T2* values have
been shown to increase with increasing collagen matrix degener-
ation64. Williams et al. demonstrated clinical feasibility of in vivo 3D
UTE-T2* mapping at 3 T using a standard clinical MRI scanner and
knee coil. In asymptomatic subjects, UTE T2* values were shown to
be higher in superficial cartilage compared to deep cartilage in
central weight-bearingmedial femoral condyle and tibial plateau59.
Other recent studies demonstrated reduction in T2* values with
degeneration of articular cartilage in the knee and hip joints67e69.
This decrease in T2* values has also been shown to correlate with
morphological cartilage damage56. However, one study showed the
opposite result, i.e., higher T2* values with patients who have
symptomatic arthrosis of the ankle secondary to cavovarus feet
compared to asymptomatic patients or those without the pathol-
ogy70. More scientific evidence is needed to definitively determine
the meaning and clinical significance of T2* values and their cor-
relation with cartilage degeneration.
T1rho imaging
T1rho is spin-lattice relaxation in the rotating frame and is
similar to T2 relaxation except that there is an additional RF pulse
applied after the magnetization is tipped into transverse plane. The
A. Guermazi et al. / Osteoarthritis and Cartilage xxx (2015) 1e15 3
Please cite this article in press as: Guermazi A, et al., Compositional MRI techniques for evaluation of cartilage degeneration in osteoarthritis,Osteoarthritis and Cartilage (2015), http://dx.doi.org/10.1016/j.joca.2015.05.026

magnetization becomes aligned or “spin-locked” with the applied
RF field. The signal decay is exponential with a time constant,
T1rho, and is typically calculated frommultiple images by changing
the duration of the spin-locking pulse. In liquids, T1, T2, and T1rho
relaxation times may be similar, but in tissue these values are
typically different (T2 < T1rho < T1). The measurements of T1rho
probe molecular fluctuations in the kHz range because of the
dependence on the RF-generated magnetic field (B1), whereas T2
probes fluctuations in theMHz range because of the dependence on
the static magnetic field (B0)11,71. T1rho values may reflect non-
specific changes in the cartilage ECM and proteoglycan con-
tent72,73. In vitro studies have demonstrated that depletion of pro-
teoglycan results in increased T1rho values, suggesting that T1rho
estimates proteoglycan content74. Specifically T1rho probes the
slow motion interactions between motion-restricted water mole-
cules and their local macromolecular environment. As with T2 and
T2*, there is a depth-wise distribution of T1rho values, with the
highest values seen at the articular surface74. This technique re-
quires neither contrast agent injection nor special RF hardware but
does need an MR scanner that is capable of a customized pulse
sequence specific to this application.
Regatte et al. have suggested that T1rho relaxation mapping is a
sensitive imaging marker for quantitative monitoring of macro-
molecules in early OA75. Normal articular cartilage from a healthy
volunteer shows shorter T1rho values compared to cartilage
affected by OA (Fig. 2). Also, T1rho relaxation time has been shown
to be longer in cartilage with advanced degeneration than in
cartilage with intermediate degeneration76. Although T1rho value
changes are correlated with proteoglycan loss in vitro77, other
studies have suggested that T1rho values may not be specific to any
one inherent tissue parameter78. There is evidence that other fac-
tors, including collagen fiber orientation and the concentration of
other macromolecules, also contribute to changes in T1rho
values79. T1rho imaging has been suggested to be more sensitive
than T2 mapping for differentiating between normal cartilage and
early-stage OA80 (Fig. 3). A recent study by Wang et al. compared
parallel changes of quantitative T2 and T1rho, mapping of human
cartilage and suggested that T1rho mapping seem to be more
sensitive in detecting early stages of cartilage degeneration than
quantitative T281. A study by Thuillier et al. showed that the T1rho
technique was able to differentiate subjects with patellofemoral
pain from controls, but T2 values were not82. However, studies by Li
et al. have shown that T2 and T1rho values show different spatial
distributions and may provide complementary information83. A
few studies have examined the associations between T1rho values
and OA risk factors. A study by Wang et al. suggested some degree
of association between knee alignment and subregional T1rho
values of femorotibial cartilage in patients with clinical OA84. They
found significantly higher T1rho values in the medial femoral
cartilage subregion in the varus group than in any other cartilage
subregions in the valgus group.
A study by Stahl et al. found that physically active subjects with
focal cartilage morphological abnormalities have elevated T1rho
values of cartilage compared to thosewithout such abnormalities80.
Souza et al. observed significant elevations in T1rho values of the
adjacent compartment (medial tibia) and medial meniscus in
subjects with medial femoral cartilage lesions85. A study by Zarins
et al. correlated meniscal damage with cartilage degeneration, us-
ing both T2 and T1rho measurements86. Bolbos et al. demonstrated
injury related changes in cartilage and meniscal biochemical
composition using T1rho mapping in patients with acute ACL in-
juries87. The T1rho mapping technique has been shown to non-
invasively detect cartilage pathology in knees with injured ACL88.
Li et al. have shown that T1rho can detect the changes in the
cartilage matrix in ACL-reconstructed knees as early as 1 year after
reconstruction89.
Delayed gadolinium-enhanced MRI of cartilage (dGEMRIC)
dGEMRIC is a T1 relaxation-time measurement technique, that
uses the negative ionic charge of gadopentetate dimeglumine
(Gd-DTPA2�) to map the fixed charge density of cartilage GAGs90,91.
Gd-DTPA2� is repelled by the negatively charged GAGs and there-
fore distributed in inverse proportion to the local proteoglycan
concentration. Gd-DTPA2� accumulates in areas of lowGAG content
and cartilage will consequently have a shorter T1 relaxation time in
these regions.
The ability to measure spatial variations in cartilage GAG con-
centration in vitrowith dGEMRIC has been validated biochemically
and histologically using both bovine and human cartilage92e95. The
feasibility of using dGEMRIC in vivo was demonstrated, and the
interpretation of the MR images as representing GAG distribution
was supported by literature evidence. Excellent correlation be-
tween in vivo images of patients scheduled for total knee replace-
ment surgery and ex vivo images of the same joint after surgery95.
Similarly, when Gd(DTPA)2� was injected intravenously into pa-
tients 2 h before total joint replacement surgery, with subsequent
post-excision MRI and histology, the distribution of Gd(DTPA)2� in
the cartilage after excision compared well with histologic re-
sults79,96. Thus it was demonstrated that in vivo spatial variations in
cartilage T1 values in the presence of Gd(DTPA)2�, under suitable
conditions, can be interpreted as variations in tissue GAG concen-
tration91. However, whether one should use ionic or non-ionic
contrast for dGEMRIC remains to be a matter of discussion. In one
study, spatial variations in in vivo T1 values were observed
following penetration of an ionic contrast agent but not of a
nonionic contrast agent, indicating that T1 variations depend on
the tissue charge93. However, a more recent study97 showed the
differences between ionic and non-ionic contrast agents for
dGEMRICwere not as clear as the aforementioned study93 and even
concluded that the use of non-ionic contrast enables better
discrimination of the health status of cartilage97.
dGEMRIC images are typically obtained after 90-min delay
following injection of gadolinium contrast agent to allow diffusion
and contrast equilibration within the cartilage. However, the
different time delays may be required from joint to joint and even
between compartments within the same joint due to different
Fig. 2. Sagittal T1r map obtained from a healthy volunteer subject (32 years old male
volunteer with Kellgren and Lawrence grade 0 knee) shows lower relaxation times
compared to OA patients. The T1r relaxation times in the healthy subject are
52 ± 3.5 ms.
A. Guermazi et al. / Osteoarthritis and Cartilage xxx (2015) 1e154
Please cite this article in press as: Guermazi A, et al., Compositional MRI techniques for evaluation of cartilage degeneration in osteoarthritis,Osteoarthritis and Cartilage (2015), http://dx.doi.org/10.1016/j.joca.2015.05.026
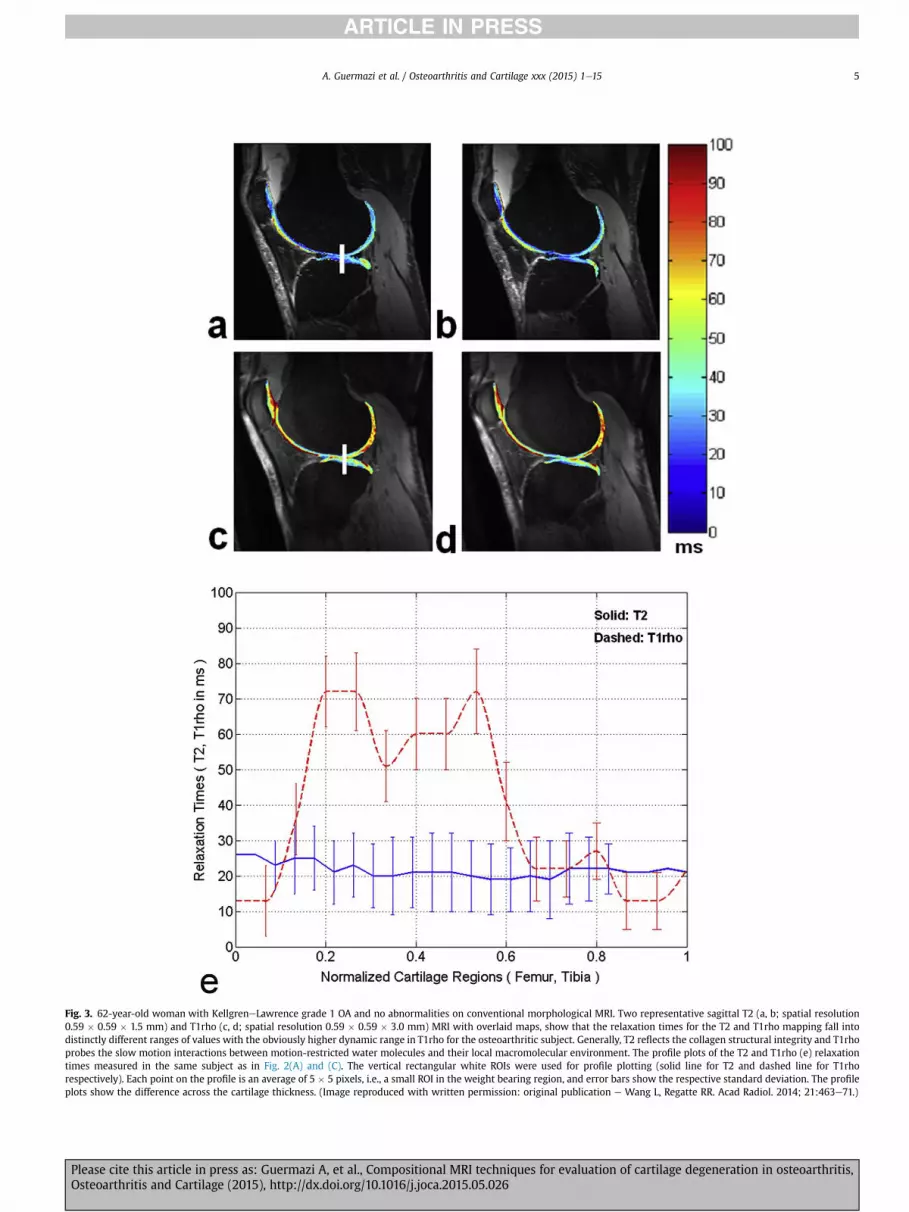
Fig. 3. 62-year-old woman with KellgreneLawrence grade 1 OA and no abnormalities on conventional morphological MRI. Two representative sagittal T2 (a, b; spatial resolution
0.59 � 0.59 � 1.5 mm) and T1rho (c, d; spatial resolution 0.59 � 0.59 � 3.0 mm) MRI with overlaid maps, show that the relaxation times for the T2 and T1rho mapping fall into
distinctly different ranges of values with the obviously higher dynamic range in T1rho for the osteoarthritic subject. Generally, T2 reflects the collagen structural integrity and T1rho
probes the slow motion interactions between motion-restricted water molecules and their local macromolecular environment. The profile plots of the T2 and T1rho (e) relaxation
times measured in the same subject as in Fig. 2(A) and (C). The vertical rectangular white ROIs were used for profile plotting (solid line for T2 and dashed line for T1rho
respectively). Each point on the profile is an average of 5 � 5 pixels, i.e., a small ROI in the weight bearing region, and error bars show the respective standard deviation. The profile
plots show the difference across the cartilage thickness. (Image reproduced with written permission: original publication e Wang L, Regatte RR. Acad Radiol. 2014; 21:463e71.)
A. Guermazi et al. / Osteoarthritis and Cartilage xxx (2015) 1e15 5
Please cite this article in press as: Guermazi A, et al., Compositional MRI techniques for evaluation of cartilage degeneration in osteoarthritis,Osteoarthritis and Cartilage (2015), http://dx.doi.org/10.1016/j.joca.2015.05.026
cartilage thicknesses. Challenges in applying dGEMRIC in clinical
studies include the lack of standardization of patient physical ac-
tivity required before MR examination and potential side effects of
gadolinium, which is usually applied in a double dose91. On the
other hand there is long-standing experience with dGEMRIC and it
is probably one of the best-understood compositional
methodologies98e103.
dGEMRIC is sensitive to cartilage proteoglycan content and may
predict the development of OA100. Generally, normal healthy
cartilage demonstrates high dGEMRIC values (Fig. 4) which de-
creases with increasing degree of cartilage degeneration. It was
recently demonstrated that T1Gd values in medial tibiofemoral
compartments decrease as the radiographic KellgreneLawrence
grade increases103 (Figs. 5e7). Prescribed immobilization after
injury, of only 6 weeks, has been shown to result in biochemical
changes in the cartilage measureable by dGEMRIC with a mean
decrease seen in T1 relaxation time (T1Gd) seen at 4 months, which
persisted for up to a year99. In a longitudinal study, Owman et al.
found that low baseline T1Gd using dGEMRIC in medial and lateral
femoral cartilage was associated with a higher grade of JSN after 11
years, and also with development of osteophytes98. A study by
Crema et al. found high-grade medial meniscal damage to be
associated with low T1Gd times in the medial tibiofemoral
compartment102. Lattanzi et al. recently demonstrated that
dGEMRIC was accurate in detecting, at the hip, cartilage damage
due to femoroacetabular impingement104. In an earlier study, Kim
et al. also showed that dGEMRIC index was significantly different in
subgroups with mild, moderate, and severe grades of hip
dysplasia105, which suggests the ability of dGEMRIC to detect
varying cartilage degeneration among these groups. In a study of
111 obese adults, dGEMRIC showed that weight loss over the course
of a year resulted in increased cartilage proteoglycan content106. A
recently published study evaluated articular cartilage using
dGEMRIC after viscosupplementation with hyaluronic acid in pa-
tients with early knee OA107. The study found no change in the
structural composition of cartilage after 14 weeks, even though
symptomatic improvement was reported. However, another recent
study showed that a decrease in T1Gd values over time predicted an
increase in cartilage thickness in the same tibiofemoral compart-
ment after 2 years, mainly in middle-aged women with no radio-
graphic OA or early radiographic OA101. The authors suggested that
such an association might occur in the early stages of degeneration
when swelling of cartilage (with increased thickness) is seen.
Sodium (23Na) imaging
The nucleus of the sodium ion 23Na possesses a quadrupolar
moment that interacts with the electric field gradients of the sur-
roundings, leading to complex relaxation processes in biological
tissues that can result in biexponential T1 and T2 relaxation
times108. Sodium concentration is known to be correlated directly
with the proteoglycan concentration in cartilage109,110. In healthy
cartilage, the average sodium concentration is generally in the
range 200e300 mmol/L, which is around 260e400 times lower
than the in vivowater proton concentration108. The combination of
all these factors results in a sodium MRI signal that is approxi-
mately 3000e4500 times lower than the proton signal in cartilage.
The low sodium concentration in cartilage combined with the low
MR receptivity of sodium nuclear spins and their very short
transverse relaxation time makes the detection of sodium signal
very challenging and results in images with low signal to noise
ratio, low resolution (2e4 mm isotropic) and long acquisition times
(15e30 min)108. Due to the aforementioned low resolution of so-
dium images, partial volume effects from surrounding tissues, such
as subchondral edema or synovial fluid (sodium concentration of
140e150 mmol/L compared to cartilage sodium concentration
~250e300 mmol/L) can influence the accuracy of quantitative so-
diumMRI results. Tominimize the contamination of cartilage signal
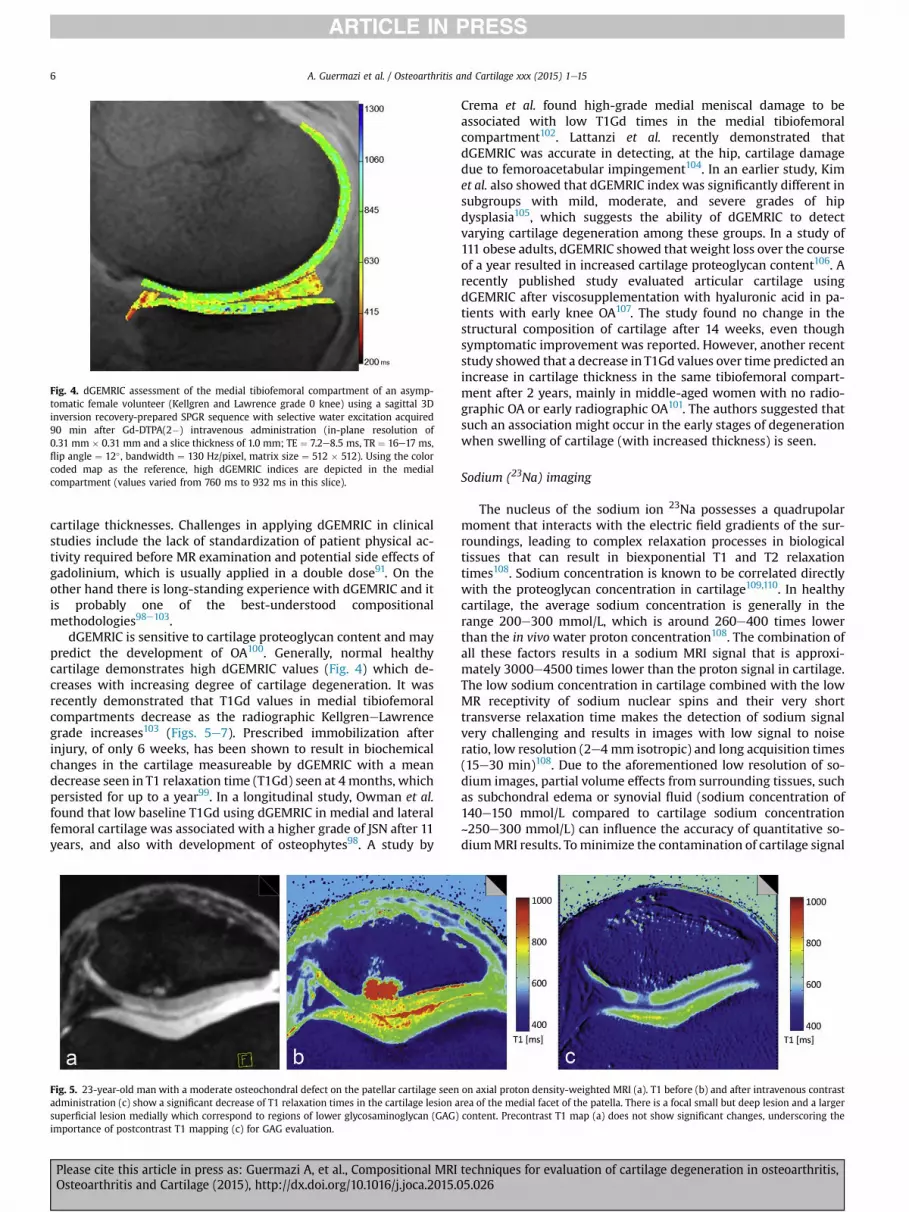
Fig. 4. dGEMRIC assessment of the medial tibiofemoral compartment of an asymp-
tomatic female volunteer (Kellgren and Lawrence grade 0 knee) using a sagittal 3D
inversion recovery-prepared SPGR sequence with selective water excitation acquired
90 min after Gd-DTPA(2�) intravenous administration (in-plane resolution of
0.31 mm � 0.31 mm and a slice thickness of 1.0 mm; TE ¼ 7.2e8.5 ms, TR ¼ 16e17 ms,
flip angle ¼ 12� , bandwidth ¼ 130 Hz/pixel, matrix size ¼ 512 � 512). Using the color
coded map as the reference, high dGEMRIC indices are depicted in the medial
compartment (values varied from 760 ms to 932 ms in this slice).
Fig. 5. 23-year-old man with a moderate osteochondral defect on the patellar cartilage seen on axial proton density-weighted MRI (a). T1 before (b) and after intravenous contrast
administration (c) show a significant decrease of T1 relaxation times in the cartilage lesion area of the medial facet of the patella. There is a focal small but deep lesion and a larger
superficial lesion medially which correspond to regions of lower glycosaminoglycan (GAG) content. Precontrast T1 map (a) does not show significant changes, underscoring the
importance of postcontrast T1 mapping (c) for GAG evaluation.
A. Guermazi et al. / Osteoarthritis and Cartilage xxx (2015) 1e156
Please cite this article in press as: Guermazi A, et al., Compositional MRI techniques for evaluation of cartilage degeneration in osteoarthritis,Osteoarthritis and Cartilage (2015), http://dx.doi.org/10.1016/j.joca.2015.05.026

from synovial fluid or joint effusion, various techniques can be
employed such as inversion recovery preparation based fluid sup-
pression (based on T1 differences), double-echo subcontracting
methods (based on T2* differences) compared to the reference
standard triple-quantum filtering (based on T2 differences). In or-
der to correct the within-voxel contamination, we need to measure
the voxel-wise water content mapping. From the hardware point of
view, sodium MRI requires the use of high magnetic field (e.g., 3 T
and 7 T) with high magnetic field gradients and special RF coils and
broadband hardware108,111,112.
Sodium imaging correlates with the fixed charge density and
GAG content in cartilage113 and therefore may also be used in early
detection of OA. Clinical studies using sodium MRI, however, are
limited. A feasibility study by Wheaton et al.109 used sodium im-
aging to compare the cartilage of healthy subjects with subjects
with symptoms of early OA. They found a highermean fixed-charge
density in the healthy individuals. The symptomatic subjects had
focal regions of decreased fixed charge density, with mean values
ranging from �108 to �144 mmol/L, indicative of proteoglycan
loss109 (Fig. 8). Madelin et al. reported the reproducibility and
repeatability of sodium quantification in cartilage in vivo using
intraday and interday acquisitions at 3 T and 7 T, with a radial 3D
sequence, with and without fluid suppression112. No significant
intermagnet, intersequence, intraday, or interday differences were
observed in the coefficients of variation. A recently described so-
dium quantification technique using inversion recovery wide-band
uniform rate and smooth truncation (IR-WURST) gave values that
were closer to those reported in the literature for healthy cartilage
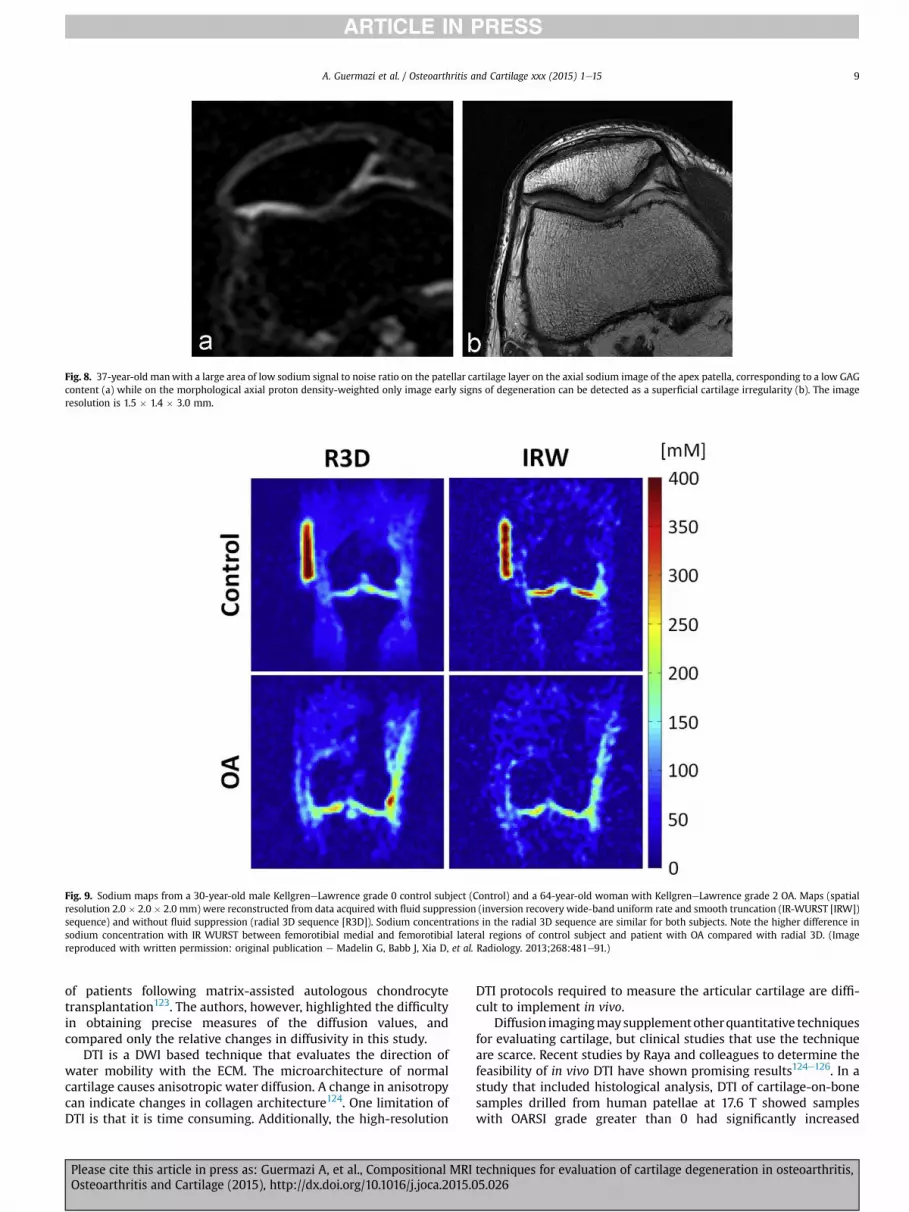
(220e310 mM) than the values from radial 3D112. A recent study111
also reported that the sodium concentration in both healthy and OA
knees at 7 T imaging with fluid suppressed sodiumMRI can be used
for detection of OA (Kellgren and Lawrence grade 1e4 knees in
symptomatic patients fulfilling the criteria by the American College
of Rheumatology) with 82% sensitivity, 74% specificity and 78%
accuracy (Fig. 9). Findings of these studies suggest quantitative
sodium MR imaging of articular cartilage in vivo may be a useful
biomarker for detecting clinical and radiographic OA.
DWI and DTI
Intra- and extracellular barriers determine the molecular mo-
tion of water. Diffusion MRI techniques are sensitive to the
restriction of motion of water molecules bound within a macro-
molecular environment. These methods use paired magnetic field
gradient pulses to probe the motion of nuclei in the direction of the
applied magnetic field gradient114. The two pulses are of equal
duration and amplitude and are separated by a time delay (D). The
net effect of the paired gradient pulses is to dephase magnetisation
from nuclei which have undergone diffusion during the time delay,
resulting in measurable signal attenuation16.
Typically, a diffusion-sensitive MRI sequence comprises a
number of diffusion gradient pulses applied along multiple axes as
well as imaging gradients for spatial localization of the signal. It
then becomes convenient to summarize the combined influence of
the gradients through calculation of the b-factor115. The sb-factor
determines the overall diffusion weighting of a sequence in the
same way that the echo time characterizes the degree of T2
weighting. Acquisition of images with multiple b-factors thus al-
lows the diffusion coefficient to be mapped on a pixel-by-pixel
basis16.
When measuring the diffusion coefficient of water molecules in
physiological systems, there is significant interaction between the
water molecules and their surrounding environment during the
timescale of the experiment, and the parameter measured is the
apparent diffusion coefficient (ADC)16. Consequently, measuring
the ADC of water molecules within the cartilage ECM can be used to
infer cartilage tissue structure and architecture, with increased
diffusivity linked to structural degradation of the ECM116,117.
The two most popular DWI techniques are the diffusion-
weighted turbo spin echo (DW-TSE) and the diffusion-weighted
echo planar imaging (DW-EPI) sequences. The most useful
sequence for DWI of themusculoskeletal system is the reversed fast
imaging with steady precession with diffusion weighting (DW-
FISP), which allows the acquisition of high resolution images in as
little as a few seconds per slice, due to the short repetition times
used118. Quantitative in vivo diffusion imaging of cartilage using
diffusion-weighted double echo steady state free precession (SSFP)
has also been described119. This technique provides diffusion
quantification independent of the relaxation time.
Studies have shown Diffusion-weighted imaging (DWI) can be
potentially used for evaluating cartilage degeneration in vivo120 and
monitoring its repair following surgery121,122. A recent longitudinal
study demonstrated the ability of DWI to differentiate between
healthy and repaired cartilage at different time points after surgery
Fig. 6. 62-year-old woman with advanced OA in the medial femorotibial compartment. Sagittal proton density-weighted MRI (a) shows marked thinning of cartilage at the weight-
bearing central medial femur adjacent to the medial meniscus (large white arrows). Note the large intrachondral osteophyte of the anterior part of the weight-bearing medial femur
(small white arrows). Diffuse cartilage damage is also shown at the anterior medial femur (arrowhead). The tibial cartilage appears morphologically normal. The corresponding
dGEMRIC image (b) shows a decrease in the dGEMRIC index particularly in the weight bearing areas at the central and posterior tibia (large white arrows) as well as in the su-
perficial zones of the central medial femoral cartilage (small white arrows) representing low GAG concentration.
A. Guermazi et al. / Osteoarthritis and Cartilage xxx (2015) 1e15 7
Please cite this article in press as: Guermazi A, et al., Compositional MRI techniques for evaluation of cartilage degeneration in osteoarthritis,Osteoarthritis and Cartilage (2015), http://dx.doi.org/10.1016/j.joca.2015.05.026

Fig. 7. 68-year-old man with KellgreneLawrence grade 1 OA. Two representative dGEMRIC-T1 maps from T1 values (spatial resolution 0.7 � 0.7 � 1.5 mm) obtained before (a, b)
and after contrast agent injection (c, d). The color bar scale at the right indicates the T1 values in ms. The profile plots (e) show the variations in T1 relaxation times of cartilage
regions along the vertical lines in Fig. 5(A) and (C) with T1 mapping before and after contrast agent injection. The T1 relaxation times varied in a different range OR in different
ranges before and after contrast agent injection with the range obviously much higher before contrast agent injection. The error bars show the standard deviations of values of 5 � 5
pixels centered on each point along the vertical line within the cartilage regions. The average dGEMRIC-T1 value was sharply decreased after intravenous administration of Gd
contrast agent (1244.134 ms vs. 643.227 ms, P < 0.05), depending upon the degree of cartilage degeneration. (Image reproduced with written permission: original publication e
Wang L, Regatte RR. Acad Radiol. 2014;21:463e71.)
A. Guermazi et al. / Osteoarthritis and Cartilage xxx (2015) 1e158
Please cite this article in press as: Guermazi A, et al., Compositional MRI techniques for evaluation of cartilage degeneration in osteoarthritis,Osteoarthritis and Cartilage (2015), http://dx.doi.org/10.1016/j.joca.2015.05.026
of patients following matrix-assisted autologous chondrocyte
transplantation123. The authors, however, highlighted the difficulty
in obtaining precise measures of the diffusion values, and
compared only the relative changes in diffusivity in this study.
DTI is a DWI based technique that evaluates the direction of
water mobility with the ECM. The microarchitecture of normal
cartilage causes anisotropic water diffusion. A change in anisotropy
can indicate changes in collagen architecture124. One limitation of
DTI is that it is time consuming. Additionally, the high-resolution
DTI protocols required to measure the articular cartilage are diffi-
cult to implement in vivo.
Diffusion imagingmaysupplementotherquantitative techniques
for evaluating cartilage, but clinical studies that use the technique
are scarce. Recent studies by Raya and colleagues to determine the
feasibility of in vivo DTI have shown promising results124e126. In a
study that included histological analysis, DTI of cartilage-on-bone
samples drilled from human patellae at 17.6 T showed samples
with OARSI grade greater than 0 had significantly increased
Fig. 8. 37-year-old manwith a large area of low sodium signal to noise ratio on the patellar cartilage layer on the axial sodium image of the apex patella, corresponding to a low GAG
content (a) while on the morphological axial proton density-weighted only image early signs of degeneration can be detected as a superficial cartilage irregularity (b). The image
resolution is 1.5 � 1.4 � 3.0 mm.
Fig. 9. Sodium maps from a 30-year-old male KellgreneLawrence grade 0 control subject (Control) and a 64-year-old woman with KellgreneLawrence grade 2 OA. Maps (spatial
resolution 2.0 � 2.0 � 2.0 mm) were reconstructed from data acquired with fluid suppression (inversion recovery wide-band uniform rate and smooth truncation (IR-WURST [IRW])
sequence) and without fluid suppression (radial 3D sequence [R3D]). Sodium concentrations in the radial 3D sequence are similar for both subjects. Note the higher difference in
sodium concentration with IR WURST between femorotibial medial and femorotibial lateral regions of control subject and patient with OA compared with radial 3D. (Image
reproduced with written permission: original publication e Madelin G, Babb J, Xia D, et al. Radiology. 2013;268:481e91.)
A. Guermazi et al. / Osteoarthritis and Cartilage xxx (2015) 1e15 9
Please cite this article in press as: Guermazi A, et al., Compositional MRI techniques for evaluation of cartilage degeneration in osteoarthritis,Osteoarthritis and Cartilage (2015), http://dx.doi.org/10.1016/j.joca.2015.05.026

longitudinal, transverse and mean diffusivity in the superficial
cartilage growing deeper into cartilage with increasing OARSI
grade124. Moreover, samples with an OARSI grade greater than
0 showed significantly decreased fractional anisotropy in the deep
cartilage, suggesting that changes in the collagen architecture may
occur early in cartilage degradation124. In vivo DTI of articular carti-
lage of the knee at 7 T could differentiate knees with and without
radiographic knee OA and showed excellent reproducibility125.
Magnetization Transfer Contrast (MTC)-based techniques including
gagCEST
Water in the ECM is found in two physical states, either asso-
ciated with macromolecules or in a free state. Water associated
with macromolecules has short T2 relaxation times, and, thus, a
broad resonance peak. Off-resonance RF pulses can therefore be
applied prior to imaging to saturate the water associated with
macromolecules. This saturation is exchanged to the free water
causing a loss of image signal intensity. The magnetization ex-
change can occur by either dipolar coupling or chemical exchange.
MTC can therefore estimate cartilage macromolecular concentra-
tion (predominantly collagen) by measurement of this effect by
acquiring images with and without the off-resonance pulse.
Moreover, ex-vivo studies of animal cartilage tissues showed MT
ratio is dependent on the amount of free water content/volume and
collagen concentration and that MT ratio is depth-dependent and is
relatively higher in radial zone compared to the superficial zone127.
Yao and colleagues reported the insensitivity of MT ratio mea-
surements to early cartilage degeneration, suggesting that the
dependence of the MT ratio on multiple factors makes variation in
MT ratios difficult to interpret128.
GAG chemical exchange saturation transfer imaging (gagCEST)
is an MTC-based technique in which off-resonance RF saturation
pulses are applied at frequencies specific to chemically exchange-
able protons residing on the hydroxyl groups of cartilage GAGs129.
With gagCEST MRI, transfer of magnetization is studied in mobile
macromolecules instead of semisolids, in contrast toMTC. Thus, the
measurements are GAG-molecule specific and avoid the practical
limitations of dGEMRIC and 23Na imaging. Limitations of gagCEST
include that an ultra-high field MR system is required, the
increased energy deposition due to long saturation RF pulses, and
complex post-processing. A recent study with gagCEST using 3 T
MRI, found the technique to be comparable to dGEMRIC and T2
mapping for detecting normal and damaged cartilage130.
Clinical studies examining the potential role of gagCEST in
assessment of OA related cartilage degeneration are lacking.
Feasibility studies using in vivo gagCEST have shown gagCEST MRI
to be sensitive to GAG levels in the cartilage (Fig. 10)129. In addition,
the method allows one to clearly demarcate glycosaminoglycan
measurements from cartilage and synovial fluid regions131. A recent
study by Rehnitz et al. prospectively compared gagCEST with
dGEMRIC and T2130. The authors of this study reported that gagC-
EST was non-inferior in distinguishing healthy from damaged
cartilage when compared to dGEMRIC and T2 mapping. Further
studies are needed to establish the potential value of this technique
in assessment of OA related cartilage degeneration.
Summary and outlook
Advanced MRI techniques enable evaluation of the biochemical
or ultrastructural composition of articular cartilage relevant to OA
research. Compositional MRI techniques have the potential to
supplement clinical MRI sequences in identifying cartilage degen-
eration at an earlier stage than is possible today using morphologic
sequences only. To date, however, the relevance of these techniques
to clinical or structural outcomes is unclear and there is a lack of
studies focusing on responsiveness. Although the different tech-
niques are complementary with some focusing on isotropy or the
collagen network (e.g., T2 mapping) others are more specific in
regard to tissue composition, e.g., gagCEST or dGEMRIC that convey
information on the GAG concentration. In addition to the different
tissue components that are targeted by the different techniques,
applicability and feasibility will play an important role in the
implementation of the different techniques. Some techniques such
as T2 mapping and dGEMRIC are easily applied at standard clinical
platforms, while others such as T1rho, gagCEST or sodium imaging
require either ultra high field systems or other dedicated hardware
or software.
Compositional MRI techniques are likely to enhance our un-
derstanding of early disease, thanks to their capability to detect
ultrastructural tissue alterations that are not conceivable by visual
assessment. These techniques may potentially be applied to
monitor response to conservative, pharmacologic or surgical
treatment approaches in order to show either delayed onset or
slowing of progression of disease, or improvement of already
established tissue damage. Once joint damage has progressed to
stages beyond focal or ultrastructural pathology, compositional
MRI will likely only play a secondary role in joint assessment. At
present it seems paramount to engage in study endeavors that
focus on early disease and disease onset to develop and evaluate
interventional approaches in stages of potential reversibility132. In
addition, the role of compositional MRI in pre-treatment stratifi-
cation needs to be elucidated further to characterize patients or
joints that are likely to benefit most from a given established
intervention105.
Although the particular strengths and weaknesses of the
different compositional MRI techniques still need to be determined,
they seem to offer much in terms of predicting structural and
clinical outcomes, taking into account feasibility of application,
reliability and responsiveness of the different techniques available
today.
Fig. 10. 45-year-old woman with a normal femoral cartilage layer on standard MRI
(not shown). The sagittal gagCEST MRI shows lower gagCEST asymmetries (by means
of MTRasym values) in the weight-bearing zone (blue, arrow) compared to other non-
weight-bearing cartilage regions of the femoral condyle, correlating with a lower
GAG content as an early sign of focal cartilage degeneration. Blue area represents
gagCEST MTR asymmetry value of �6, which correspond to the low GAG region. Red
area corresponds to the MTRasym values of þ13, which is high in GAG content. Light
green area shows intermediate MTRasym values, which correspond to the intermediate
GAG content. The gagCEST does not provide absolute GAG quantification. The scale
goes from negative to positive since this is a technical property of gagCEST.
A. Guermazi et al. / Osteoarthritis and Cartilage xxx (2015) 1e1510
Please cite this article in press as: Guermazi A, et al., Compositional MRI techniques for evaluation of cartilage degeneration in osteoarthritis,Osteoarthritis and Cartilage (2015), http://dx.doi.org/10.1016/j.joca.2015.05.026
Author contributions
(a) Conception and design, acquisition of data, analysis and
interpretation of data: All authors
(b) Drafting the article or revising it critically for important in-
tellectual content: All authors
(c) Final approval of the version to be published: All authors
(d) Literature search: All authors
(e) Statistical expertise: N/A
(f) Guarantor of the integrity of the study: AG (guermazi@bu.
edu)
Conflict of interest statement
A Guermazi is a shareholder of BICL, LLC and consultant to
MerckSerono, TissueGene, Genzyme and OrthoTrophix. H Alizai has
no conflict of interest. MD Crema is a shareholder of BICL, LLC.
S Trattnig has no conflict of interest. RR Regatte has no conflict of
interest. FW Roemer is a shareholder of BICL, LLC.
Acknowledgment
We thank S Pavol, MD, and D Hayashi, MD PhD, for their tech-
nical assistance with preparation of the revised manuscript and
figures.
References
1. Lawrence RC, Felson DT, Helmick CG, Arnold LM, Choi H,
Deyo RA, et al. Estimates of the prevalence of arthritis and
other rheumatic conditions in the United States. Part II.
Arthritis Rheum 2008;58:26e35.
2. Bliddal H, Leeds AR, Christensen R. Osteoarthritis, obesity and
weight loss: evidence, hypotheses and horizons e a scoping
review. Obes Rev 2014;15:578e86.
3. Tonge DP, Pearson MJ, Jones SW. The hallmarks of osteoar-
thritis and the potential to develop personalised disease-
modifying pharmacological therapeutics. Osteoarthritis
Cartilage 2014;22:609e21.
4. Crema MD, Nevitt MC, Guermazi A, Felson DT, Wang K,
Lynch JA, et al. Progression of cartilage damage and meniscal
pathology over 30 months is associated with an increase in
radiographic tibiofemoral joint space narrowing in persons
with knee OA e the MOST study. Osteoarthritis Cartilage
2014;22:1743e7.
5. Hunter DJ, Zhang YQ, Tu X, Lavalley M, Niu JB, Amin S, et al.
Change in joint space width: hyaline articular cartilage loss or
alteration in meniscus? Arthritis Rheum 2006;54:2488e95.
6. Bijlsma JW, Berenbaum F, Lafeber FP. Osteoarthritis: an up-
date with relevance for clinical practice. Lancet 2011;377:
2115e26.
7. Boegard TL, Rudling O, Petersson IF, Jonsson K. Joint space
width of the tibiofemoral and of the patellofemoral joint in
chronic knee pain with or without radiographic osteoar-
thritis: a 2-year follow-up. Osteoarthritis Cartilage 2003;11:
370e6.
8. Guermazi A, Roemer FW, Felson DT, Brandt KD. Motion for
debate: osteoarthritis clinical trials have not identified effi-
cacious therapies because traditional imaging outcome
measures are inadequate. Arthritis Rheum 2013;65:2748e58.
9. Huber M, Trattnig S, Lintner F. Anatomy, biochemistry, and
physiology of articular cartilage. Invest Radiol 2000;35:
573e80.
10. Buckwalter JA, Hunziker E, Rosenberg L, Coutts RD, Adams M,
Eyre D. Articular cartilage: composition and structure. In:
Woo SLY, Buckwalter JA, Eds. Injury and Repair of the
Musculoskeletal Soft Tissues. Park Ridge, Ill: American Acad-
emy of Orthopaedic Surgeons; 1988:405e25.
11. Burstein D, Gray M, Mosher T, Dardzinski B. Composition and
structure in osteoarthritis. Radiol Clin North Am 2009;47:
675e86.
12. Billinghurst RC, Dahlberg L, Ionescu M, Reiner A, Bourne R,
Rorabeck C, et al. Enhanced cleavage of type II collagen by
collagenases in osteoarthritic articular cartilage. J Clin Invest
1997;99:1534e45.
13. Buckwalter JA, Martin J. Degenerative joint disease. Clin
Symp 1995;47:1e32.
14. Maroudas AI. Balance between swelling pressure and
collagen tension in normal and degenerate cartilage. Nature
1976;260:808e9.
15. Buckwalter JA, Mankin HJ. Articular cartilage: degeneration
and osteoarthritis, repair, regeneration, and transplantation.
Instr Course Lect 1998;47:487e504.
16. Binks DA, Hodgson RJ, Ries ME, Foster RJ, Smye SW,
McGonagle D, et al. Quantitative parametric MRI of articular
cartilage: a review of progress and open challenges. Br J
Radiol 2013;86:20120163.
17. Nissi MJ, Rieppo J, Toyras J, Laasanen MS, Kiviranta I,
Jurvelin JS, et al. T(2) relaxation time mapping reveals age-
and species-related diversity of collagen network architec-
ture in articular cartilage. Osteoarthritis Cartilage 2006;14:
1265e71.
18. Dunn TC, Lu Y, Jin H, Ries MD, Majumdar S. T2 relaxation time
of cartilage at MR imaging: comparison with severity of knee
osteoarthritis. Radiology 2004;232:592e8.
19. Joseph GB, Baum T, Alizai H, Carballido-Gamio J, Nardo L,
Virayavanich W, et al. Baseline mean and heterogeneity of
MR cartilage T2 are associated with morphologic degenera-
tion of cartilage, meniscus, and bone marrow over 3
yearsedata from the Osteoarthritis Initiative. Osteoarthritis
Cartilage 2012;20:727e35.
20. Prasad AP, Nardo L, Schooler J, Joseph GB, Link TM. T(1)rho
and T(2) relaxation times predict progression of knee oste-
oarthritis. Osteoarthritis Cartilage 2013;21:69e76.
21. Mosher TJ, Smith H, Dardzinski BJ, Schmithorst VJ, Smith MB.
MR imaging and T2 mapping of femoral cartilage: in vivo
determination of the magic angle effect. AJR Am J Roentgenol
2001;177:665e9.
22. Liess C, Lusse S, Karger N, Heller M, Gluer CC. Detection of
changes in cartilage water content using MRI T2-mapping
in vivo. Osteoarthritis Cartilage 2002;10:907e13.
23. Baum T, Joseph GB, Karampinos DC, Jungmann PM, Link TM,
Bauer JS. Cartilage and meniscal T2 relaxation time as non-
invasive biomarker for knee osteoarthritis and cartilage
repair procedures. Osteoarthritis Cartilage 2013;21:1474e84.
24. Carballido-Gamio J, Blumenkrantz G, Lynch JA, Link TM,
Majumdar S. Longitudinal analysis of MRI T(2) knee cartilage
laminar organization in a subset of patients from the osteo-
arthritis initiative. Magn Reson Med 2010;63:465e72.
25. Jungmann PM, Kraus MS, Nardo L, Liebl H, Alizai H,
Joseph GB, et al. T2 relaxation time measurements are limited
in monitoring progression, once advanced cartilage defects at
the knee occur: longitudinal data from the osteoarthritis
initiative. J Magn Reson Imaging 2013;38:1415e24.
26. Hovis KK, Alizai H, Tham SC, Souza RB, Nevitt MC,
McCulloch CE, et al. Non-traumatic anterior cruciate ligament
abnormalities and their relationship to osteoarthritis using
morphological grading and cartilage T2 relaxation times:
data from the Osteoarthritis Initiative (OAI). Skeletal Radiol
2012;41:1435e43.
A. Guermazi et al. / Osteoarthritis and Cartilage xxx (2015) 1e15 11
Please cite this article in press as: Guermazi A, et al., Compositional MRI techniques for evaluation of cartilage degeneration in osteoarthritis,Osteoarthritis and Cartilage (2015), http://dx.doi.org/10.1016/j.joca.2015.05.026
27. Bae WC, Du J, Bydder GM, Chung CB. Conventional and ul-
trashort time-to-echo magnetic resonance imaging of artic-
ular cartilage, meniscus, and intervertebral disk. Top Magn
Reson Imaging 2010;21:275e89.
28. Bae WC, Dwek JR, Znamirowski R, Statum SM, Hermida JC,
D'Lima DD, et al. Ultrashort echo time MR imaging of osteo-
chondral junction of the knee at 3 T: identification of
anatomic structures contributing to signal intensity. Radi-
ology 2010;254:837e45.
29. Goodwin DW. Visualization of the macroscopic structure of
hyaline cartilage with MR imaging. Semin Musculoskelet
Radiol 2001;5:305e12.
30. Goodwin DW, Wadghiri YZ, Zhu H, Vinton CJ, Smith ED,
Dunn JF. Macroscopic structure of articular cartilage of the
tibial plateau: influence of a characteristic matrix architec-
ture on MRI appearance. AJR Am J Roentgenol 2004;182:
311e8.
31. Xia Y, Moody JB, Alhadlaq H, Burton-Wurster N, Lust G.
Characteristics of topographical heterogeneity of articular
cartilage over the joint structure of a humeral head. Osteo-
arthritis Cartilage 2002;10:370e80.
32. Xia Y. Magic-angle effect in magnetic resonance imaging of
articular cartilage: a review. Invest Radiol 2000;35:602e21.
33. Wacker FK, Bolze X, Felsenberg D, Wolf KJ. Orientation-
dependent changes in MR signal intensity of articular carti-
lage: a manifestation of the “magic angle” effect. Skeletal
Radiol 1998;27:306e10.
34. Erickson SJ, Prost RW, Timins ME. The “magic angle” effect:
background physics and clinical relevance [editorial]. Radi-
ology 1993;188:23e5.
35. Mosher TJ, Zhang Z, Reddy R, Boudhar S, Milestone BN,
Morrison WB, et al. Knee articular cartilage damage in oste-
oarthritis: analysis of MR image biomarker reproducibility in
ACRIN-PA 4001 multicenter trial. Radiology 2011;258:
832e42.
36. Baum T, Joseph GB, Arulanandan A, Nardo L,
Virayavanich W, Carballido-Gamio J, et al. Association of
magnetic resonance imaging-based knee cartilage T2 mea-
surements and focal knee lesions with knee pain: data from
the Osteoarthritis Initiative. Arthritis Care Res (Hoboken)
2012;64:248e55.
37. Mosher TJ, Liu Y, Yang QX, Yao J, Smith R, Dardzinski BJ, et al.
Age dependency of cartilage magnetic resonance imaging T2
relaxation times in asymptomatic women. Arthritis Rheum
2004;50:2820e8.
38. Mosher TJ, Collins CM, Smith HE, Moser LE, Sivarajah RT,
Dardzinski BJ, et al. Effect of gender on in vivo cartilage
magnetic resonance imaging T2 mapping. J Magn Reson Im-
aging 2004;19:323e8.
39. Baum T, Joseph GB, Nardo L, Virayavanich W, Arulanandan A,
Alizai H, et al. Correlation of magnetic resonance imaging-
based knee cartilage T2 measurements and focal knee le-
sions with body mass index: thirty-six-month followup data
from a longitudinal, observational multicenter study.
Arthritis Care Res (Hoboken) 2013;65:23e33.
40. Serebrakian AT, Poulos T, Liebl H, Joseph GB, Lai A, Nevitt MC,
et al. Weight loss over 48 months is associated with reduced
progression of cartilage T2 relaxation time values: data from
the osteoarthritis initiative. J Magn Reson Imaging 2015;41:
1272e80.
41. Hirose J, Nishioka H, Nakamura E, Oniki Y, Yamashita Y,
Mizuta H. T1rho and T2 mapping of the proximal tibiofibular
joint in relation to aging and cartilage degeneration. Eur J
Radiol 2012;81:2776e82.
42. Friedrich KM, Shepard T, Chang G, Wang L, Babb JS,
Schweitzer M, et al. Does joint alignment affect the T2 values
of cartilage in patients with knee osteoarthritis? Eur Radiol
2010;20:1532e8.
43. Mosher TJ, Smith HE, Collins C, Liu Y, Hancy J, Dardzinski BJ,
et al. Change in knee cartilage T2 at MR imaging after
running: a feasibility study. Radiology 2005;234:245e9.
44. Mosher TJ, Liu Y, Torok CM. Functional cartilage MRI T2
mapping: evaluating the effect of age and training on knee
cartilage response to running. Osteoarthritis Cartilage
2010;18:358e64.
45. Hovis KK, Stehling C, Souza RB, Haughom BD, Baum T,
Nevitt M, et al. Physical activity is associated with magnetic
resonance imaging-based knee cartilage T2 measurements in
asymptomatic subjects with and those without osteoarthritis
risk factors. Arthritis Rheum 2011;63:2248e56.
46. Stehling C, Liebl H, Krug R, Lane NE, Nevitt MC, Lynch J, et al.
Patellar cartilage: T2 values and morphologic abnormalities
at 3.0-T MR imaging in relation to physical activity in
asymptomatic subjects from the osteoarthritis initiative.
Radiology 2010;254:509e20.
47. Lin W, Alizai H, Joseph GB, Srikhum W, Nevitt MC, Lynch JA,
et al. Physical activity in relation to knee cartilage T2 pro-
gression measured with 3 T MRI over a period of 4 years: data
from the Osteoarthritis Initiative. Osteoarthritis Cartilage
2013;21:1558e66.
48. Kijowski R, Blankenbaker DG, Munoz Del Rio A, Baer GS,
Graf BK. Evaluation of the articular cartilage of the knee joint:
value of adding a T2 mapping sequence to a routine MR
imaging protocol. Radiology 2013;267:503e13.
49. Potter HG, Jain SK, Ma Y, Black BR, Fung S, Lyman S. Cartilage
injury after acute, isolated anterior cruciate ligament tear:
immediate and longitudinal effect with clinical/MRI follow-
up. Am J Sports Med 2012;40:276e85.
50. Hesper T, Hosalkar HS, Bittersohl D, Welsch GH, Krauspe R,
Zilkens C, et al. T2* mapping for articular cartilage assess-
ment: principles, current applications and future prospects.
Skeletal Radiol 2014;43:1429e45.
51. Andreisek G, Weiger M. T2* mapping of articular cartilage:
current status of research and first clinical applications.
Invest Radiol 2014;49:57e62.
52. Newbould RD, Miller SR, Toms LD, Swann P, Tielbeek JA,
Gold GE, et al. T2* measurement of the knee articular cartilage
in osteoarthritis at 3T. JMagnReson Imaging 2012;35:1422e9.
53. Welsch GH, Apprich S, Zbyn S, Mamisch TC, Mlynarik V,
Scheffler K, et al. Biochemical (T2, T2* and magnetisation
transfer ratio) MRI of knee cartilage: feasibility at ultra-high
field (7T) compared with high field (3T) strength. Eur
Radiol 2011;21:1136e43.
54. Crema MD, Roemer FW, Marra MD, Burstein D, Gold GE,
Eckstein F, et al. Articular cartilage in the knee: current MR
imaging techniques and applications in clinical practice and
research. Radiographics 2011;31:37e61.
55. Qian Y, Williams AA, Chu CR, Boada FE. Multicomponent T2*
mapping of knee cartilage: technical feasibility ex vivo. Magn
Reson Med 2010;64:1426e31.
56. Bittersohl B, Miese FR, Hosalkar HS, Mamisch TC, Antoch G,
Krauspe R, et al. T2* mapping of acetabular and femoral hip
joint cartilage at 3 T: a prospective controlled study. Invest
Radiol 2012;47:392e7.
57. Bittersohl B, Miese FR, Hosalkar HS, Herten M, Antoch G,
Krauspe R, et al. T2* mapping of hip joint cartilage in various
histological grades of degeneration. Osteoarthritis Cartilage
2012;20:653e60.
A. Guermazi et al. / Osteoarthritis and Cartilage xxx (2015) 1e1512
Please cite this article in press as: Guermazi A, et al., Compositional MRI techniques for evaluation of cartilage degeneration in osteoarthritis,Osteoarthritis and Cartilage (2015), http://dx.doi.org/10.1016/j.joca.2015.05.026

58. Marik W, Apprich S, Welsch GH, Mamisch TC, Trattnig S.
Biochemical evaluation of articular cartilage in patients with
osteochondrosis dissecans by means of quantitative T2- and
T2-mapping at 3T MRI: a feasibility study. Eur J Radiol
2012;81:923e7.
59. Williams A, Qian Y, Chu CR. UTE-T2* mapping of human
articular cartilage in vivo: a repeatability assessment. Oste-
oarthritis Cartilage 2011;19:84e8.
60. Gatehouse PD, Bydder GM. Magnetic resonance imaging
of short T2 components in tissue. Clin Radiol 2003;58:
1e19.
61. Lattanzio PJ, Marshall KW, Damyanovich AZ, Peemoeller H.
Macromolecule and water magnetization exchange modeling
in articular cartilage. Magn Reson Med 2000;44:840e51.
62. Maier CF, Tan SG, Hariharan H, Potter HG. T2 quantitation of
articular cartilage at 1.5 T. J Magn Reson Imaging 2003;17:
358e64.
63. Mamisch TC, Hughes T, Mosher TJ, Mueller C, Trattnig S,
Boesch C, et al. T2 star relaxation times for assessment of
articular cartilage at 3 T: a feasibility study. Skeletal Radiol
2012;41:287e92.
64. Williams A, Qian Y, Bear D, Chu CR. Assessing degeneration of
human articular cartilage with ultra-short echo time (UTE)
T2* mapping. Osteoarthritis Cartilage 2010;18:539e46.
65. Du J, Takahashi AM, Chung CB. Ultrashort TE spectroscopic
imaging (UTESI): application to the imaging of short T2
relaxation tissues in the musculoskeletal system. J Magn
Reson Imaging 2009;29:412e21.
66. Gold GE, Thedens DR, Pauly JM, Fechner KP, Bergman G,
Beaulieu CF, et al. MR imaging of articular cartilage of the
knee: new methods using ultrashort TEs. AJR Am J Roent-
genol 1998;170:1223e6.
67. Pauli C, Bae WC, Lee M, Lotz M, Bydder GM, D'Lima DL, et al.
Ultrashort-echo time MR imaging of the patella with
bicomponent analysis: correlation with histopathologic and
polarized light microscopic findings. Radiology 2012;264:
484e93.
68. Bittersohl B, Hosalkar HS, Hughes T, Kim YJ, Werlen S,
Siebenrock KA, et al. Feasibility of T2* mapping for the eval-
uation of hip joint cartilage at 1.5T using a three-dimensional
(3D), gradient-echo (GRE) sequence: a prospective study.
Magn Reson Med 2009;62:896e901.
69. Miese FR, Zilkens C, Holstein A, Bittersohl B, Kropil P,
Mamisch TC, et al. Assessment of early cartilage degeneration
after slipped capital femoral epiphysis using T2 and T2*
mapping. Acta Radiol 2011;52:106e10.
70. Krause FG, Klammer G, Benneker LM, Werlen S, Mamisch TC,
Weber M. Biochemical T2* MR quantification of ankle
arthrosis in pes cavovarus. J Orthop Res 2010;28:1562e8.
71. Wang L, Regatte RR. J Magn Reson Imaging 2014 Jun 17,
http://dx.doi.org/10.1002/jmri.24677 [Epub ahead of print].
72. Duvvuri U, Charagundla SR, Kudchodkar SB, Kaufman JH,
Kneeland JB, Rizi R, et al. Human knee: in vivo T1(rho)-
weighted MR imaging at 1.5 Tepreliminary experience.
Radiology 2001;220:822e6.
73. Keenan KE, Besier TF, Pauly JM, Han E, Rosenberg J, Smith RL,
et al. Prediction of glycosaminoglycan content in human
cartilage by age, T1rho and T2 MRI. Osteoarthritis Cartilage
2011;19:171e9.
74. Akella SV, Regatte RR, Gougoutas AJ, Borthakur A,
Shapiro EM, Kneeland JB, et al. Proteoglycan-induced changes
in T1rho-relaxation of articular cartilage at 4T. Magn Reson
Med 2001;46:419e23.
75. Regatte RR, Akella SV, Lonner JH, Kneeland JB, Reddy R. T1rho
relaxation mapping in human osteoarthritis (OA) cartilage:
comparison of T1rho with T2. J Magn Reson Imaging
2006;23:547e53.
76. Koskinen SK, Yla-Outinen H, Aho HJ, Komu ME. Magnetiza-
tion transfer and spin lock MR imaging of patellar cartilage
degeneration at 0.1 T. Acta Radiol 1997;38:1071e5.
77. Duvvuri U, Kudchodkar S, Reddy R, Leigh JS. T(1rho) relaxa-
tion can assess longitudinal proteoglycan loss from articular
cartilage in vitro. Osteoarthritis Cartilage 2002;10:838e44.
78. Menezes NM, Gray ML, Hartke JR, Burstein D. T2 and T1rho
MRI in articular cartilage systems. Magn Reson Med 2004;51:
503e9.
79. Mlynarik V, Trattnig S, Huber M, Zembsch A, Imhof H. The
role of relaxation times in monitoring proteoglycan depletion
in articular cartilage. J Magn Reson Imaging 1999;10:
497e502.
80. Stahl R, Luke A, Li X, Carballido-Gamio J, Ma CB, Majumdar S,
et al. T1rho, T2 and focal knee cartilage abnormalities in
physically active and sedentary healthy subjects versus early
OA patientsea 3.0-Tesla MRI study. Eur Radiol 2009;19:
132e43.
81. Wang L, Regatte RR. Quantitative mapping of human carti-
lage at 3.0T: parallel changes in T(2), T(1)rho, and dGEMRIC.
Acad Radiol 2014;21:463e71.
82. Thuillier DU, Souza RB, Wu S, Luke A, Li X, Feeley BT. T1rho
imaging demonstrates early changes in the lateral patella in
patients with patellofemoral pain and maltracking. Am J
Sports Med 2013;41:1813e8.
83. Li X, Pai A, Blumenkrantz G, Carballido-Gamio J, Link T, Ma B,
et al. Spatial distribution and relationship of T1rho and T2
relaxation times in knee cartilage with osteoarthritis. Magn
Reson Med 2009;61:1310e8.
84. Wang L, Vieira RL, Rybak LD, Babb JS, Chang G,
Krasnokutsky S, et al. Relationship between knee alignment
and T1rho values of articular cartilage and menisci in patients
with knee osteoarthritis. Eur J Radiol 2013;82:1946e52.
85. Souza RB, Feeley BT, Zarins ZA, Link TM, Li X, Majumdar S.
T1rho MRI relaxation in knee OA subjects with varying sizes
of cartilage lesions. Knee 2013;20:113e9.
86. Zarins ZA, Bolbos RI, Pialat JB, Link TM, Li X, Souza RB, et al.
Cartilage and meniscus assessment using T1rho and T2
measurements in healthy subjects and patients with osteo-
arthritis. Osteoarthritis Cartilage 2010;18:1408e16.
87. Bolbos RI, Link TM, Ma CB, Majumdar S, Li X. T1rho relaxation
time of the meniscus and its relationship with T1rho of
adjacent cartilage in knees with acute ACL injuries at 3 T.
Osteoarthritis Cartilage 2009;17:12e8.
88. Nishioka H, Hirose J, Nakamura E, Okamoto N, Karasugi T,
Taniwaki T, et al. Detecting ICRS grade 1 cartilage lesions in
anterior cruciate ligament injury using T1r and T2 mapping.
Eur J Radiol 2013;82:1499e505.
89. Li X, Kuo D, Theologis A, Carballido-Gamio J, Stehling C,
Link TM, et al. Cartilage in anterior cruciate Liga-
menteReconstructed Knees: MR imaging T1r and T2dInitial
experience with 1-year follow-up. Radiology 2011;258:
505e14.
90. Bashir A, Gray ML, Burstein D. Gd-DTPA2- as a measure of
cartilage degradation. Magn Reson Med 1996;36:665e73.
91. Burstein D, Velyvis J, Scott KT, Stock KW, Kim YJ, Jaramillo D,
et al. Protocol issues for delayed Gd(DTPA)(2-)-enhanced MRI
(dGEMRIC) for clinical evaluation of articular cartilage. Magn
Reson Med 2001;45:36e41.
92. Bashir A, Gray ML, Burstein D. Gd-DTPA2e as a measure of
cartilage degradation [published erratum appears in Magn
Reson Med 1996;36:964]. Magn Reson Med 1996;36:
665e73.
A. Guermazi et al. / Osteoarthritis and Cartilage xxx (2015) 1e15 13
Please cite this article in press as: Guermazi A, et al., Compositional MRI techniques for evaluation of cartilage degeneration in osteoarthritis,Osteoarthritis and Cartilage (2015), http://dx.doi.org/10.1016/j.joca.2015.05.026
93. Bashir A, Gray ML, Boutin RD, Burstein D. Glycosaminoglycan
in articular cartilage: in vivo assessment with delayed
Gd(DTPA)(2e)denhanced MR imaging. Radiology 1997;205:
551e8.
94. Allen RG, Burstein D, Gray ML. Monitoring glycosamino-
glycan replenishment in cartilage explants with gadolinium-
enhanced magnetic resonance imaging. J Orthop Res
1999;17:430e6.
95. Bashir A, Gray ML, Hartke J, Burstein D. Nondestructive im-
aging of human cartilage glycosaminoglycan concentration
by MRI. Magn Reson Med 1999;41:857e65.
96. Trattnig S, Mlynarik V, Breitenseher M, Huber M, Zembsch A,
Rand T, et al. MRI visualization of proteoglycan depletion in
articular cartilage via intravenous administration of Gd-
DTPA. Magn Reson Imaging 1999;17:577e83.
97. Li W, Scheidegger R, Wu Y, Edelman RR, Farley M,
Krishnan N, et al. Delayed contrast-enhanced MRI of carti-
lage: comparison of nonionic and ionic contrast agents. Magn
Reson Med 2010;64:1267e73.
98. Owman H, Ericsson YB, Englund M, Tiderius CJ, Tjornstrand J,
Roos EM, et al. Association between delayed gadolinium-
enhanced MRI of cartilage (dGEMRIC) and joint space nar-
rowing and osteophytes: a cohort study in patients with
partial meniscectomy with 11 years of follow-up. Osteoar-
thritis Cartilage 2014;22:1537e41.
99. Owman H, Tiderius CJ, Ericsson YB, Dahlberg LE. Long-term
effect of removal of knee joint loading on cartilage quality
evaluated by delayed gadolinium-enhanced magnetic reso-
nance imaging of cartilage. Osteoarthritis Cartilage 2014;22:
928e32.
100. Owman H, Tiderius CJ, Neuman P, Nyquist F, Dahlberg LE.
Association between findings on delayed gadolinium-
enhanced magnetic resonance imaging of cartilage and
future knee osteoarthritis. Arthritis Rheum 2008;58:
1727e30.
101. Crema MD, Hunter DJ, Burstein D, Roemer FW, Li L,
Eckstein F, et al. Association of changes in delayed
gadolinium-enhanced MRI of cartilage (dGEMRIC) with
changes in cartilage thickness in the medial tibiofemoral
compartment of the knee: a 2 year follow-up study using 3.0
T MRI. Ann Rheum Dis 2014;73:1935e41.
102. Crema MD, Hunter DJ, Burstein D, Roemer FW, Li L,
Krishnan N, et al. Delayed gadolinium-enhanced magnetic
resonance imaging of medial tibiofemoral cartilage and its
relationship with meniscal pathology: a longitudinal study
using 3.0T magnetic resonance imaging. Arthritis Rheum
2014;66:1517e24.
103. Crema MDHD, Burstein D, Roemer FW, Krishnan N, Hellio Le
Graverand MP, Guermazi A. The relationship between the
Kellgren-Lawrence grade of radiographic knee osteoarthritis
and delayed gadolinium-enhanced MRI of medial tibiofe-
moral cartilage (dGEMRIC): a 1-year follow-up study. Oste-
oarthritis Cartilage 2013;21.
104. Lattanzi R, Petchprapa C, Ascani D, Babb JS, Chu D,
Davidovitch RI, et al. Detection of cartilage damage in femo-
roacetabular impingement with standardized dGEMRIC at 3
T. Osteoarthritis Cartilage 2014;22:447e56.
105. Kim YJ, Jaramillo D, Millis MB, Gray ML, Burstein D. Assess-
ment of early osteoarthritis in hip dysplasia with delayed
gadolinium-enhanced magnetic resonance imaging of carti-
lage. J Bone Joint Surg Am 2003;85-A:1987e92.
106. Anandacoomarasamy A, Leibman S, Smith G, Caterson I,
Giuffre B, Fransen M, et al. Weight loss in obese people has
structure-modifying effects on medial but not on lateral knee
articular cartilage. Ann Rheum Dis 2012;71:26e32.
107. van Tiel J, ReijmanM, Bos PK, Hermans J, van Buul GM, Bron EE,
et al. Delayed gadolinium-enhanced MRI of cartilage (dGEM-
RIC) shows no change in cartilage structural composition after
viscosupplementation in patients with early-stage knee oste-
oarthritis. PLoS One 2013;8:e79785.
108. Madelin G, Regatte RR. Biomedical applications of sodium
MRI in vivo. J Magn Reson Imaging 2013;38:511e29.
109. Wheaton AJ, Borthakur A, Shapiro EM, Regatte RR, Akella SV,
Kneeland JB, et al. Proteoglycan loss in human knee cartilage:
quantitation with sodium MR imaging e feasibility study.
Radiology 2004;231:900e5.
110. Madelin G, Jerscow A, Regatte RR. Sodium relaxation times
in the knee joint in vivo at 7T. NMR Biomed 2012;25:
530e7.
111. Madelin G, Babb J, Xia D, Chang G, Krasnokutsky S,
Abramson SB, et al. Articular cartilage: evaluation with fluid-
suppressed 7.0-T sodium MR imaging in subjects with and
subjects without osteoarthritis. Radiology 2013;268:481e91.
112. Madelin G, Babb JS, Xia D, Chang G, Jerschow A, Regatte RR.
Reproducibility and repeatability of quantitative sodium
magnetic resonance imaging in vivo in articular cartilage at 3
T and 7 T. Magn Reson Med 2012;68:841e9.
113. Lesperance LM, Gray ML, Burstein D. Determination of fixed
charge density in cartilage using nuclear magnetic resonance.
J Orthop Res 1992;10:1e13.
114. Freeman R. Magnetic Resonance in Chemistry and Medicine.
Oxford, UK: Oxford University Press; 2003.
115. Mattiello J, Basser PJ, Lebihan D. Analytical expressions for
the b-matrix in NMR diffusion imaging and spectroscopy.
J Magn Reson Ser A 1994;108:131e41.
116. Burstein D, Gray ML, Hartman AL, Gipe R, Foy BD. Diffusion of
small solutes in cartilage as measured by nuclear magnetic
resonance (NMR) spectroscopy and imaging. J Orthop Res
1993;11:465e78 [PubMed].
117. Mlyn�arik V, Sulzbacher I, Bitt�sanský M, Fuiko R, Trattnig S.
Investigation of apparent diffusion constant as an indicator of
early degenerative disease in articular cartilage. J Magn Reson
Imaging 2003;17:440e4.
118. Deoni SC, Peters TM, Rutt BK. Quantitative diffusion imaging
with steady-state free precession. Magn Reson Med 2004;51:
428e33.
119. Bieri O, Ganter C, Scheffler K. Quantitative in vivo diffusion
imaging of cartilage using double echo steady-state free
precession. Magn Reson Med 2012;68:720e9.
120. Miller KL, Hargreaves BA, Gold GE, Pauly JM. Steady-state
diffusion-weighted imaging of in vivo knee cartilage. Magn
Reson Med 2004;51:394e8.
121. Trattnig S, Domayer S, Welsch G, Mosher T, Eckstein F. MR
imaging of cartilage and its repair in the kneeda review. Eur
Radiol 2009;19:1582e94.
122. Mamisch TC, Menzel MI, Welsch GH, Bittersohl B,
Salomonowitz E, Szomolanyi P, et al. Steady-state diffusion
imaging for MR in-vivo evaluation of reparative cartilage
after matrix-associated autologous chondrocyte trans-
plantation at 3 tesladpreliminary results. Eur J Radiol
2008;65:72e9.
123. Friedrich KM, Mamisch TC, Plank C, Langs G, Marlovits S,
Salomonowitz E, et al. Diffusion-weighted imaging for
the follow-up of patients after matrix-associated autolo-
gous chondrocyte transplantation. Eur J Radiol 2010;73:
622e8.
A. Guermazi et al. / Osteoarthritis and Cartilage xxx (2015) 1e1514
Please cite this article in press as: Guermazi A, et al., Compositional MRI techniques for evaluation of cartilage degeneration in osteoarthritis,Osteoarthritis and Cartilage (2015), http://dx.doi.org/10.1016/j.joca.2015.05.026

124. Raya JG, Melkus G, Adam-Neumair S, Dietrich O, Mützel E,
Reiser MF, et al. Diffusion-tensor imaging of human articular
cartilage specimens with early signs of cartilage damage.
Radiology 2013;266:831e41.
125. Raya JG, Dettmann E, Notohamiprodjo M, Krasnokutsky S,
Abramson S, Glaser C. Feasibility of in vivo diffusion tensor
imaging of articular cartilage with coverage of all cartilage
regions. Eur Radiol 2014;24:1700e6.
126. Raya JG, Horng A, Dietrich O, Krasnokutsky S, Beltran LS,
Storey P, et al. Articular cartilage: in vivo diffusion-tensor
imaging. Radiology 2012;262:550e9.
127. Regatte RR, Akella SV, Reddy R. Depth-dependent proton
magnetization transfer in articular cartilage. J Magn Reson
Imaging 2005;22:318e23.
128. Yao WW, Qu N, Lu ZH, Yang SX. The application of T1 and T2relaxation time and magnetization transfer ratios to the early
diagnosis of patellar cartilage osteoarthritis. Skeletal Radiol
2009;38:1055e62.
129. Ling W, Regatte RR, Navon G, Jerschow A. Assessment of
glycosaminoglycan concentration in vivo by chemical
exchange-dependent saturation transfer (gagCEST). Proc Natl
Acad Sci USA 2008;105:2266e70.
130. Rehnitz C, Kupfer J, Streich NA, Burkholder I, Schmitt B,
Lauer L, et al. Comparison of biochemical cartilage imaging
techniques at 3 T MRI. Osteoarthritis Cartilage 2014;22:
1732e42.
131. Lee JS, Parasoglou P, Xia D, Jerschow A, Regatte RR. Uniform
magnetization transfer in chemical exchange saturation
transfer magnetic resonance imaging. Sci Rep 2013;3:1707.
132. Liebl H, Joseph G, Nevitt MC, Singh N, Heilmeier U, Subburaj K,
et al. Early T2 changes predict onset of radiographic knee
osteoarthritis: data from the osteoarthritis initiative. Ann
Rheum Dis 2014 Mar 10, http://dx.doi.org/10.1136/annr-
heumdis-2013-204157. pii: annrheumdis-2013e204157
[Epub ahead of print].
A. Guermazi et al. / Osteoarthritis and Cartilage xxx (2015) 1e15 15
Please cite this article in press as: Guermazi A, et al., Compositional MRI techniques for evaluation of cartilage degeneration in osteoarthritis,Osteoarthritis and Cartilage (2015), http://dx.doi.org/10.1016/j.joca.2015.05.026


